weekly market watch - credit libanais€¦ · ernst & young published its “middle east hotel...
TRANSCRIPT
ISSUE NO. 394 DECEMBER 23RD 2013 – DECEMBER 27TH 2013
ECONOMIC RESEARCH UNIT
WEEKLY MARKET WATCH

TTAABBLL EE
OOFF CC
OONN
TTEENN
TTSS
LLEEBBAANNOONN NEWS
ECONOMIC INSIGHTS
> Ernst & Young Estimates Occupancy Rate in Beirut’s Hospitality Sector at 51% Up to November 2013 1
> Occupancy Rate in Beirut’s Hospitality Sector Reaches 43.2% in November 2013 According to STR Global 2
> Budget Deficit Widens by 31.45% Y-O-Y Up to the Month of October 2013 3
> Lebanon’s Balance of Trade Deficit Widens to $15.62 Billion During the First Eleven Months of 2013 4
> Customs Collections Reach $2.66 Billion in the First Eleven Months of 2013 5
> The Central Administration of Statistics Estimated Inflation at 0.6% in November 2013 6
MONETARY PERFORMANCE > Monetary Aggregates 7 > Money Markets 7
FIXED INCOME
> Fixed Income 8 LEBANESE EQUITIES
> Lebanese Equities & Credit Libanais Indices 9
Lebanon's Economic & Financial Sector Indicators 11 Lebanon's Ratings 12
ERNST & YOUNG ESTIMATES
OCCUPANCY RATE IN BEIRUT’S
HOSPITALITY SECTOR AT 51% UP TO
NOVEMBER 2013 Ernst & Young published its “Middle East
Hotel Benchmark Survey” report on the
performance of 4 & 5 stars hotels in the
Middle East region for the month of
November 2013 in which it reported a 9
percentage points annual increase in the
average occupancy rate within Beirut
hotels to 47.0%, up from 38.0% in
November 2012.
OCCUPANCY RATE IN BEIRUT’S
HOSPITALITY SECTOR REACHES 43.2% IN NOVEMBER 2013 ACCORDING TO
STR GLOBAL
According to STR Global’s report on the
performance of the hospitality sector in
the Middle East/Africa region, Beirut
reported a double-digit annual increase
(22.3%) in hotels’ occupancy rate to
43.2% during the month of November
2013. BUDGET DEFICIT WIDENS BY 31.45%
Y-O-Y UP TO THE MONTH OF OCTOBER
2013
Lebanon’s fiscal deficit (budgetary &
treasury) widened to around $3.52 billion
during the first ten months of the year
2013, up from nearly $2.68 billion during
that same period last year.
LEBANON’S BALANCE OF TRADE DEFICIT
WIDENS TO $15.62 BILLION DURING
THE FIRST ELEVEN MONTHS OF 2013
On the current account side of the
balance of payment, Lebanon’s balance of
trade deficit widened by $309 million
year-on-year to around $15.62 billion as
at the end of November 2013, and this
according to statistics published by
Lebanon’s Higher Customs Council.
Weekly Market Watch
ECONOMIC RESEARCH UNIT - SOFIL CENTER, BEIRUT LEBANON - TEL: 01-200028/9 FAX: 01-326786
Weekly Market Watch
ECONOMIC RESEARCH UNIT - SOFIL CENTER, BEIRUT LEBANON - TEL: 01-200028/9 FAX: 01-326786
SSYYNN
OOPP SS
II SS OO
FF TTEERRMM
SS
"BDL" Banque Du Liban "ABL" Association of Banks in Lebanon "MOF" The Lebanese Ministry of
Finance "BOP" Balance of Payment "IMF" The International Monetary Fund "Moody's" Moody's Investors Service "BSE" Beirut Stock Exchange "GDRs" Global Depositary Receipts "M1" Currency in Circulation + Demand
Deposits in LBP "M2" M1 + Other Deposits in LBP "M3" M2 + Deposits in Foreign Currencies "M4" M3+ Treasury Bills Held By Non Banking System, Including Accrued
Interests "CPI" Consumer Price Index "PPI" Producer Price Index "CLASI" Credit Libanais Aggregate Stock Index "CLFI" Credit Libanais Financial Sector Stock Index
"CLCI" Credit Libanais Construction Sector Stock Index “EIU” Economist Intelligence Unit "P/E" Price to Earnings Multiple "P/BV" Price to Book Multiple "YTD" Year To Date "YTD Price Performance" Yield to Date Price Appreciation
"Forex" Foreign Exchange "LBP" The Lebanese Pound "USD" The United States Dollar "Yen" The Japanese Yen "GBP" The British Pound/ Sterling Pound "CHF" The Swiss Franc "Y-O-Y" Year-On-Year "GDP" Gross Domestic Product "MENA" Middle East and North Africa
"FOMC" Federal Open Market Committee
“LE” Livre Egyptienne – Egyptian Pound
“SAR” Saudi Arabian Riyal “AED” United Arab Emirates Dirham “BD” Bahraini Dinar

LLEEBBAANN
OONN
NNEEWW
SS
ERNST & YOUNG ESTIMATES OCCUPANCY RATE IN BEIRUT’S HOSPITALITY SECTOR AT 51% UP TO
NOVEMBER 2013
Ernst & Young published its “Middle East Hotel Benchmark Survey” report on the performance of 4 & 5 stars hotels in the Middle East region for the month of November 2013 in which it reported a 9 percentage points annual increase in the average occupancy rate within Beirut hotels to 47.0%, up from 38.0% in November 2012. On the other hand, the average room rate shed 1.9% y-o-y to $169, while the average room’s yield rose to $80 up from $67 in the same month last year.
On a cumulative basis, the hospitality benchmark for Lebanon shows a 3 percentage points annual contraction in the occupancy rate at 4 & 5 stars hotels in Beirut during the first eleven months of the year 2013 to 51% as at end of November, recording as such the 3rd lowest occupancy rate among covered Middle Eastern (MEA) capitals. The average room’s rate within 4 & 5 stars hotels in Beirut shed 17.0% y-o-y to $168 with the average rooms’ yield dropping markedly by 22.4% to $86. Abu Dhabi outperformed the region in terms of the average occupancy rate in the hospitality sector, with the latter standing at 76% up to the month of November 2013, followed by Muscat-Oman (67%) and Doha-Qatar (65%). Kuwait, on the other hand, recorded the highest average rooms’ rate in the region, which stood at $293 in the first eleven months of the year 2013, followed by Doha-Qatar ($253), Riyadh-Saudi Arabia ($219), and Muscat-Oman ($209).
Weekly Market Watch
SOURCE: ERNST & YOUNG, CREDIT LIBANAIS ECONOMIC RESEARCH UNIT 1
0% 20% 40% 60% 80% 100%
Abu Dhabi
Muscat
Doha
Amman
Riyadh
Kuwait
Beirut
Manama
Cairo
76%
67%
65%
62%
57%
56%
51%
42%
22%
Hotels' Occupancy Rate in the Middle East Region Up To November 2013
Source: Ernst & Young, Credit Libanais Economic Research Unit0 50 100 150 200 250 300
Kuwait
Doha
Riyadh
Muscat
Abu Dhabi
Manama
Beirut
Amman
Cairo
293
253
219
209
207
205
168
156
86
Average Rooms' Rate in the Middle East Region Up To November 2013 (USD)
Source: Ernst & Young, Credit Libanais Economic Research Unit
Country - Capital 2012 2013
Bahrain - Manama 37.0 42.0 5.0 208 205 -1.4% 78 87 11.5%Egypt - Cairo City 38.0 22.0 -16.0 86 86 -0.4% 33 19 -42.4%Jordan - Amman 71.0 62.0 -9.0 150 156 3.5% 107 97 -9.6%Kuwait - Kuwait C ity 54.0 56.0 2.0 296 293 -0.9% 160 164 2.8%
Lebanon - Beirut 54.0 51.0 -3.0 202 168 -17.0% 111 86 -22.4%Oman - Muscat 66.0 67.0 1.0 204 209 2.8% 136 141 4.3%Qatar - Doha 65.0 65.0 0.0 262 253 -3.4% 171 164 -4.0%Saudi Arabia - Riyadh 57.0 57.0 0.0 226 219 -3.4% 129 126 -3.0%United Arab Emirates - Abu Dhabi 75.0 76.0 1.0 195 207 6.5% 147 159 8.1%
Middle East Hotel Benchmark Survey up to November
Hotels' Occupancy Rates Average Room Rates (USD) Room Yields (USD)
% Change
% Change in % Pts 2012
Source: Ernst & Young - Middle East Hotel Benchmark Survey, Credit Libanais Economic Research Unit
2013
% Change 2012 2013
November-2012 November-2013 Change
Hotel Occupancy Rate (%) 38.0 47.0 9 pctg pointAverage Room Rate (USD) 172 169 -1.9%Rooms Yield (USD) 67 80 20.2%Soruce: Ernst & Young, Credit Libanais Economic Research Unit
Performance of Beirut's Hospitality Sector During the Month of

LLEEBBAANN
OONN
NNEEWW
SS
OCCUPANCY RATE IN BEIRUT’S HOSPITALITY SECTOR REACHES 43.2% IN NOVEMBER 2013 ACCORDING
TO STR GLOBAL
According to STR Global’s report on the performance of the hospitality sector in the Middle East/Africa region, Beirut reported a double-digit annual increase (22.3%) in hotels’ occupancy rate to 43.2% during the month of November 2013. Concurrently, revenue per available room (revPAR) for Beirut’s hospitality sector rose by 19.2% to reach $64.36 as at end of November. On a wider scale, the Middle East/Africa region suffered a 1.7% annual drop in hotels’ average occupancy rate to 64.6% in November 2013, yet reported a 4.9% increase in revenue per available room (revPAR) to $116.78, and some 6.8% rise in the average daily rate (ADR) to $180.88.
Weekly Market Watch
SOURCE: STR GLOBAL, CREDIT LIBANAIS ECONOMIC RESEARCH UNIT 2
0.00
50.00
100.00
150.00
200.00
250.00
116.78
220.30
96.53
67.56
24.05
64.36
$
RevPAR in the MEA/Africa Region in November2013
Source: STR Global, Deloitte, Credit Libanais Economic Research Unit
0.00
50.00
100.00
150.00
200.00
250.00
300.00
180.88
257.15
197.50
96.98
58.08
$
ADR in the MEA/Africa Region in November 2013
Source: STR Global, Deloitte, Credit Libanais Economic Research Unit
City/RegionOccupancy
(%)Occupancy
(% Change)revPAR (USD)
revPAR %Change
ADR (USD)ADR % Change
Middle East/ Africa 64.6 -1.7 116.78 4.9 180.88 6.8
UAE 85.7 4.6 220.30 12.2 257.15 7.3
Saudi Arabia 48.9 -4.4 96.53 -7.6 197.50 -3.3
South Africa 69.7 2.9 67.56 12.8 96.98 9.5
Egypt 41.4 -35.0 24.05 -41.2 58.08 -9.6
Beirut 43.2 22.3 64.36 19.2 n.a. n.a.Source: STR Global, Deloitte, Credit Libanais Economic Research Unit
Middle East/Africa Hotel Performance During the Month of November 2013
0.0
10.0
20.0
30.0
40.0
50.0
60.0
70.0
80.0
90.0
64.6
85.7
48.9
69.7
41.4 43.2%
Hotel Occupancy Rate in the MEA/Africa Region in November 2013
Source: STR Global, Deloitte, Credit Libanais Economic Research Unit
LLEEBBAANN
OONN
NNEEWW
SS
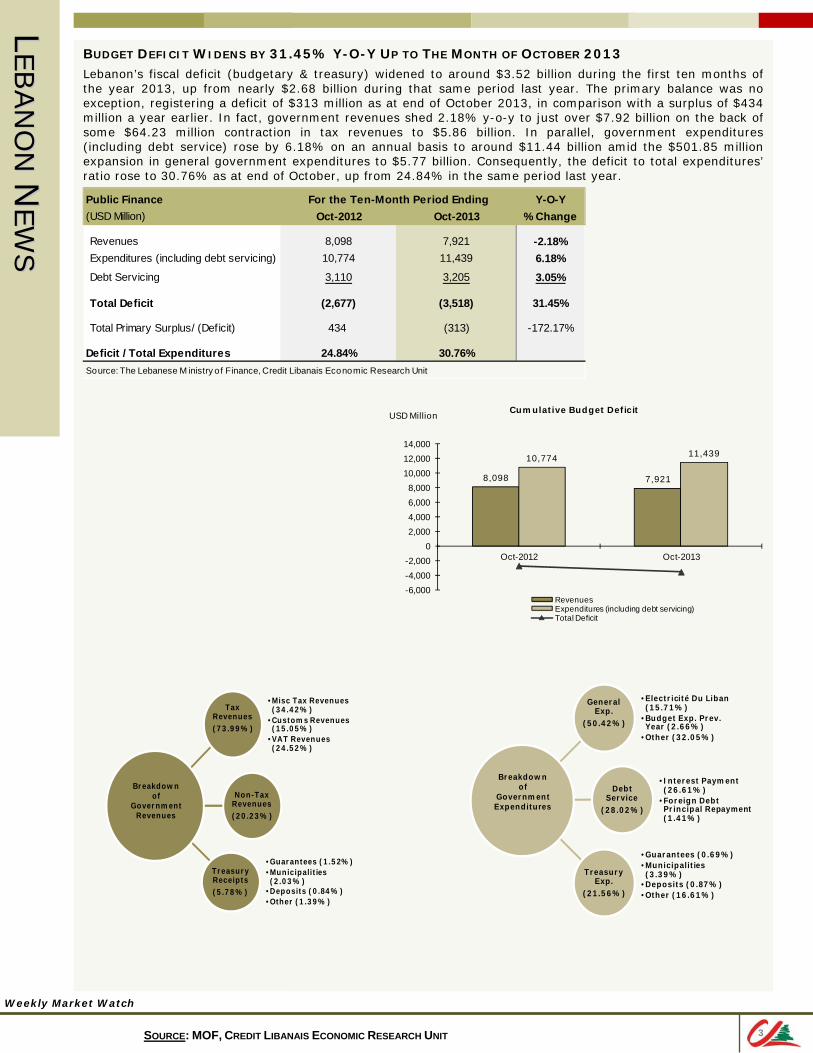
BUDGET DEFICIT WIDENS BY 31.45% Y-O-Y UP TO THE MONTH OF OCTOBER 2013
Lebanon’s fiscal deficit (budgetary & treasury) widened to around $3.52 billion during the first ten months of the year 2013, up from nearly $2.68 billion during that same period last year. The primary balance was no exception, registering a deficit of $313 million as at end of October 2013, in comparison with a surplus of $434 million a year earlier. In fact, government revenues shed 2.18% y-o-y to just over $7.92 billion on the back of some $64.23 million contraction in tax revenues to $5.86 billion. In parallel, government expenditures (including debt service) rose by 6.18% on an annual basis to around $11.44 billion amid the $501.85 million expansion in general government expenditures to $5.77 billion. Consequently, the deficit to total expenditures’ ratio rose to 30.76% as at end of October, up from 24.84% in the same period last year.
Weekly Market Watch
SOURCE: MOF, CREDIT LIBANAIS ECONOMIC RESEARCH UNIT 3
Tax Revenues(73.99%)
•Misc Tax Revenues (34.42%)
•Customs Revenues (15.05%)
•VAT Revenues (24.52%)
Non-Tax Revenues(20.23%)
Treasury Receipts(5.78%)
•Guarantees (1.52%)•Municipalities (2.03%)
•Deposits (0.84%)•Other (1.39%)
Breakdownof
Government Revenues
General Exp.
(50.42%)
•Electricité Du Liban (15.71%)
•Budget Exp. Prev. Year (2.66%)
•Other (32.05%)
Debt Service
(28.02%)
•Interest Payment (26.61%)
•Foreign Debt Principal Repayment (1.41%)
Treasury Exp.
(21.56%)
•Guarantees (0.69%)•Municipalities (3.39%)
•Deposits (0.87%)•Other (16.61%)
Breakdownof
Government Expenditures
Public Finance Y-O-Y(USD Million) Oct-2012 Oct-2013 % Change
Revenues 8,098 7,921 -2.18%Expenditures (including debt servicing) 10,774 11,439 6.18%Debt Servicing 3,110 3,205 3.05%
Total Deficit (2,677) (3,518) 31.45%
Total Primary Surplus/ (Deficit) 434 (313) -172.17%
Deficit / Total Expenditures 24.84% 30.76%Source: The Lebanese M inistry o f Finance, Credit Libanais Economic Research Unit
For the Ten-Month Period Ending
8,098 7,921
10,774 11,439
-6,000-4,000-2,000
02,0004,0006,0008,000
10,00012,00014,000
Oct-2012 Oct-2013
USD Million Cumulative Budget Deficit
RevenuesExpenditures (including debt servicing)Total Deficit

LLEEBBAANN
OONN
NNEEWW
SS
LEBANON’S BALANCE OF TRADE DEFICIT WIDENS TO $15.62 BILLION DURING THE FIRST ELEVEN MONTHS
OF 2013
On the current account side of the balance of payment, Lebanon’s balance of trade deficit widened by $309 million year-on-year to around $15.62 billion as at the end of November 2013, and this according to statistics published by Lebanon’s Higher Customs Council. Said increase in the deficit was buoyed by some $288 million drop in exports to around $3.82 billion, which outweighed the $21 million y-o-y rise in imports to around $19.43 billion. China topped the list of countries exporting to Lebanon, with its exports’ bill reaching $2.06 billion (10.60% of Lebanon’s imports) up to November 2013. Crisis-stricken Syria, on the other hand, continues to lead the list of countries importing from Lebanon, with its imports’ invoice aggregating to $492 million (12.90% of Lebanon’s exports). This is further elaborated in the tables below: Exports of “pearls, precious or semi-precious stones” accounted alone for 19.55% ($746 million) of total Lebanese exports, followed by “base metals & articles of base metal” ($497 million <13.03%>) and “machinery & mechanical appliances” ($469 million <12.29%>). On the other hand, “mineral products” constituted the lion’s share of imported goods ($4,667 million <24.02%>), trailed, and by far, by “machinery & mechanical appliances” ($2,386 million <12.28%>), “chemical products” ($1,786 million <9.19%>), and “transport equipments” ($1,589 million <8.18%>).
Weekly Market Watch
SOURCE: HIGHER CUSTOMS COUNCIL, CREDIT LIBANAIS ECONOMIC RESEARCH UNIT 4
ProductValue
($ Million)% ofTotal
Pearls, Precious or Semi-Precious Stones
746 19.55%
Base Metals & Articles of Base Metal
497 13.03%
Machinery & Mechanical 469 12.29%Chemical Products 428 11.22%Others 1,675 43.91%
Total Exports 3,815 100%Source: Higher Customs Council, Credit Libanais Economic Research Unit
Breakdown of Exports by Product During the First Eleven Months of 2013
ProductValue
($ Million)% ofTotal
Mineral Products 4,667 24.02%
Machinery & Mechanical Appliances
2,386 12.28%
Chemical Products 1,786 9.19%Transport Equipment 1,589 8.18%Others 9,004 46.34%
Total Imports 19,432 100%Source: Higher Customs Council, Credit Libanais Economic Research Unit
Breakdown of Imports by Product During the First Eleven Months of 2013
Balance of Trade Y-O-Y
(US$ Million) Nov-2012 Nov-2013 % Change
Exports 4,103 3,815 -7.02%
Imports 19,411 19,432 0.11%
Trade Deficit (15,308) (15,617) 2.02%Source: Higher Customs Council, Credit Libanais Economic Research Unit
For the Eleven-Month Period Ending
China 2,060 10.60%
Italy 1,588 8.17%
USA 1,419 7.30%
France 1,384 7.12%
Germany 1,145 5.89%
Source: Higher Customs Council, Credit Libanais Economic Research Unit
Major Import Sources (in USD Million)
-20,000
-16,000
-12,000
-8,000
-4,000
0
4,000
8,000
12,000
16,000
20,000
24,000
Up to November 2012 Up to November 2013
USD Million
Cumulative Balance of Trade Deficit
Exports Imports Deficit
Source: Higher Customs Council, Credit Libanais Economic Research Unit
Syria 492 12.90%
Iraq 372 9.75%
Saudi Arabia 324 8.49%
UAE 309 8.10%
Turkey 171 4.48%
Source: Higher Customs Council, Credit Libanais Economic Research Unit
Major Export Destinations (in USD Million)

LLEEBBAANN
OONN
NNEEWW
SS
CUSTOMS COLLECTIONS REACH $2.66 BILLION IN THE FIRST ELEVEN MONTHS OF 2013
Figures released by the Lebanese Customs unveil a 3.99% annual contraction in customs collections to just over $2.66 billion by the end of November 2013 down from $2.78 billion in the same period in 2012. Said drop is mainly attributed to the 3.86% contraction in VAT revenues to $1.29 billion, coupled with some 4.12% y-o-y decline in custom revenues to nearly $1.38 billion.
The Port of Beirut amassed the lion’s share (85.21% <$2.27 billion>) of total customs receipts, trailed, and by far, by the Beirut International Airport (9.40% <$250.47 million>) and the Tripoli Port (3.54% <$94.15 million>). The average customs tariff rate remained flat at 7% on a monthly basis, yet notched slightly lower on a yearly basis when compared to the 8% rate registered in November 2012.
Weekly Market Watch
SOURCE: HIGHER CUSTOMS COUNCIL, CREDIT LIBANAIS ECONOMIC RESEARCH UNIT 5
Port of Beirut
85.21%BIA
9.40%
Tripoli Port3.54%
Others1.85%
Breakdown of Customs Collections per Custom Offices Up To November 2013
Source: Lebanese Customs, Credit Libanais Economic Research
Port of Beirut 2,269.26
Beirut International Airport ("BIA") 250.47
Tripoli Port 94.15
Others 50.13
Total 2,664.01
Breakdown of Custom Collections Up to November 2013 ($ Million)
Source: Lebanese Customs, Credit Libanais Economic Research Unit
0
500
1,000
1,500
2,000
2,500
3,000
3,500
Up to November 2009
Up to November 2010
Up to November 2011
Up to November 2012
Up to November 2013
1,679 1,7791,387 1,434 1,375
1,2501,371
1,380 1,341 1,289
Custom Revenues VAT Revenues
2,9293,150
2,767 2,775 2,664
Breakdown of Aggregate Customs Collections
USD Million
Source: Lebanese Customs, Credit Libanais Economic Research Unit
in USD Million Up to November 2012
Up to November 2013
% Change
Custom Revenues 1,434 1,375 -4.12%
VAT Revenues 1,341 1,289 -3.86%
Custom Collections 2,775 2,664 -3.99%Source: Lebanese Customs, Credit Libanais Economic Research Unit

LLEEBBAANN
OONN
NNEEWW
SS
THE CENTRAL ADMINISTRATION OF STATISTICS ESTIMATED INFLATION AT 0.6% IN NOVEMBER 2013
According to the Central Administration of Statistics (CAS), Lebanon’s annual inflation, as captured by the change in the consumer price index (CPI), has reached 0.6% during the month of November 2013. More specifically, November’s CPI stood at 130.4, up from 129.6 a year before. Said rise was mainly fueled by the 2.0% annual appreciation in the price of food & non-alcoholic beverages, the index’s largest component, coupled with a 7.0% rally in education costs and a 12.0% increase in the price of alcoholic beverages & tobacco. On a monthly basis, Lebanon’s CPI recorded a shy 0.1% increase on the back of the 4.5% rise in the prices of food & non-alcoholic beverages, and the 1.4% hike in health care costs. The following section captures the fluctuation in Lebanon’s consumer basket’s key constituents on a monthly and annual basis:
Weekly Market Watch
SOURCE: CENTRAL ADMINISTRATION OF STATISTICS, CREDIT LIBANAIS ECONOMIC RESEARCH UNIT 6
-12.0%
-7.0%
-2.0%
3.0%
8.0%
13.0%
Food &
Non-A
lcoholic
Bev
erag
es
Alc
oholic
Bev
erag
es &
Tobacc
o
Clo
thin
g &
Footw
ear
Housi
ng
Wate
r, E
lect
rici
ty, G
as &
Oth
er Fu
els
Furn
ishin
gs,
House
hol
d E
quip
men
t &
Routine
House
hold
Main
tenan
ce
Health
Tra
nsp
ort
atio
n
Com
munic
atio
n
Recr
eation
, A
muse
ment
, and C
ulture
Educa
tion
Rest
aura
nt &
Hote
ls
Mis
cella
neou
s G
oods
& S
erv
ices
2.0%
12.0%
-7.8%
0.0%
-1.2%
1.9% 1.9%
-4.1%
0.0%
4.0%
7.0%5.8%
2.5%
0.0%
4.5%
0.2%0.0% 0.2% 0.0%
1.4%
-0.9%
0.0% 0.1% 0.0% 0.2% 0.3%
Y-O-Y and Monthly Price Volatility in November 2013
Y-O-Y Monthly
Monthly (Oct.2013 - Nov.2013)
Annually(Nov.2012 - Nov.2013)
Weight
Food & Non-Alcoholic Beverages 0.0% 2.0% 19.9%Alcoholic Beverages & Tobacco 4.5% 12.0% 2.1%Clothing & Footwear 0.2% -7.8% 6.2%Housing 0.0% 0.0% 16.2%Water, Electricity, Gas & Other Fuels 0.2% -1.2% 9.5%Furnishings, Household Equipment & Routine Household Maintenance
0.0% 1.9% 3.9%
Health 1.4% 1.9% 6.8%Transportation -0.9% -4.1% 12.3%Communication 0.0% 0.0% 4.8%Recreation, Amusement, and Culture 0.1% 4.0% 3.7%Education 0.0% 7.0% 7.7%Restaurant & Hotels 0.2% 5.8% 2.7%Miscellaneous Goods & Services 0.3% 2.5% 4.2%
Consumer Price Index 0.1% 0.6% 100.0%
Price Volatility
Source: Central Administration o f Statistics, Credit Liabanais Economic Research Unit

MONETARY AGGREGATES
On the monetary front, the overall money supply, “M4”, added $330.94 million week-on-week to around $116.17 billion during the week of December 12, 2013, and this despite the $3.32 million weekly drop in the non-banking sector treasury bills’ portfolio. On the other hand, Lebanese-pound denominated deposits and currency in circulation, “M1”, fell by $82.52 million to $4.70 billion, on the back of some $67 million decrease in money in circulation, and a $15.26 million drop in demand deposits. In parallel, local currency term deposits, “M2”, edged slightly lower by $4.15 million week-on-week, yet registered a 5.15% year-on-year increase to just over $45.07 billion. Consequently, private sector term and saving deposits denominated in LBP (“M2- M1”) firmed at around $40.37 billion, with deposits denominated in foreign currencies (“M3–M2”) edging slightly higher to around $64.94 billion. MONEY MARKETS
The December 19th Treasury bill auction raised around LBP 185.87 billion ($123.29 million), up from LBP 159.89 billion ($106.06 million) in the previous auction. Subscriptions were majority (51.22%) concentrated in the six-month to maturity bills, followed by the three-month (37.39%), and five-year (11.39%) tenure bills. The weighted average yield on Lebanese Pound Treasury bills fell to 4.98% during the auction of December 19 down from 5.41% during the latest auction of same maturities held on the 5th of December 2013. This drop is attributed to the contraction in the participation rate in the higher-yielding five-year bills to 11.39% in the current auction compared to 28.57% in that of December 5. The yields on the three-month, six-month, and five-year tenure T-bills remained unchanged at 4.44%, 4.99%, and 6.75% respectively.
Weekly Market Watch
SOURCE: BDL, REUTERS, ALMUSTAQBAL NEWSPAPER, CREDIT LIBANAIS ECONOMIC RESEARCH UNIT 7
MMOO
NNEETTAARRYY PP
EERRFF OO
RRMM
AANN
CCEE
Lebanese Treasury Bills 3 Months 6 Months 12 Months 24 Months 36 Months 60 Months 84 Months 96 Months 120 Months 144 Months
Treasury Yield 4.44% 4.99% 5.35% 5.84% 6.50% 6.75% 7.50% 7.80% 8.24% 8.74%
3 Months6 Months
12 Months24 Months
36 Months
60 Months
84 Months96 Months
120 Months144 Months
0.00%
1.00%
2.00%
3.00%
4.00%
5.00%
6.00%
7.00%
8.00%
9.00%
10.00%
0 2 4 6 8 10 12
On The Run Yield Curve
M oney SupplyUSD M illion
M 1 4,782 4,700 -1.73%M 2 45,076 45,072 -0.01%M 3 109,677 110,011 0.30%M 4 115,836 116,167 0.29%
M 2-M 1 40,293 40,372 0.19%
M 3-M 2 64,601 64,939 0.52%Source: Banque Du Liban, Credit Libanais Economic Research Unit
December 5, 2013 December 12, 2013 % Change
6,000
26,000
46,000
66,000
86,000
December 5, 2013 December 12, 2013
115,836 116,167109,677 110,011
Money Supply - USD Million -
M4 M3
Source: BDL, Credit Libanais Economic Research Unit
Lebanese Treasury Bills
Yield (%) Face Value ( in billio ns o f
LB P )
% of Total Face Value
Lebanese Treasury Bills
Yield (%) Face Value ( in billio ns o f
LB P )
% of Total Face Value
12 Months 5.35% 23.171 14.49% 3 Months 4.44% 69.500 37.39%
24 Months 5.84% 11.000 6.88% 6 Months 4.99% 95.195 51.22%36 Months 6.50% 125.719 78.63% 60 Months 6.75% 21.172 11.39%
Total 159.890 100.00% Total 185.867 100.00%Source: Reuters, Credit Libanais Economic Research Unit
December 12, 2013 Auction December 19, 2013 Auction
FFII XX
EEDD
II NNCCOO
MMEE
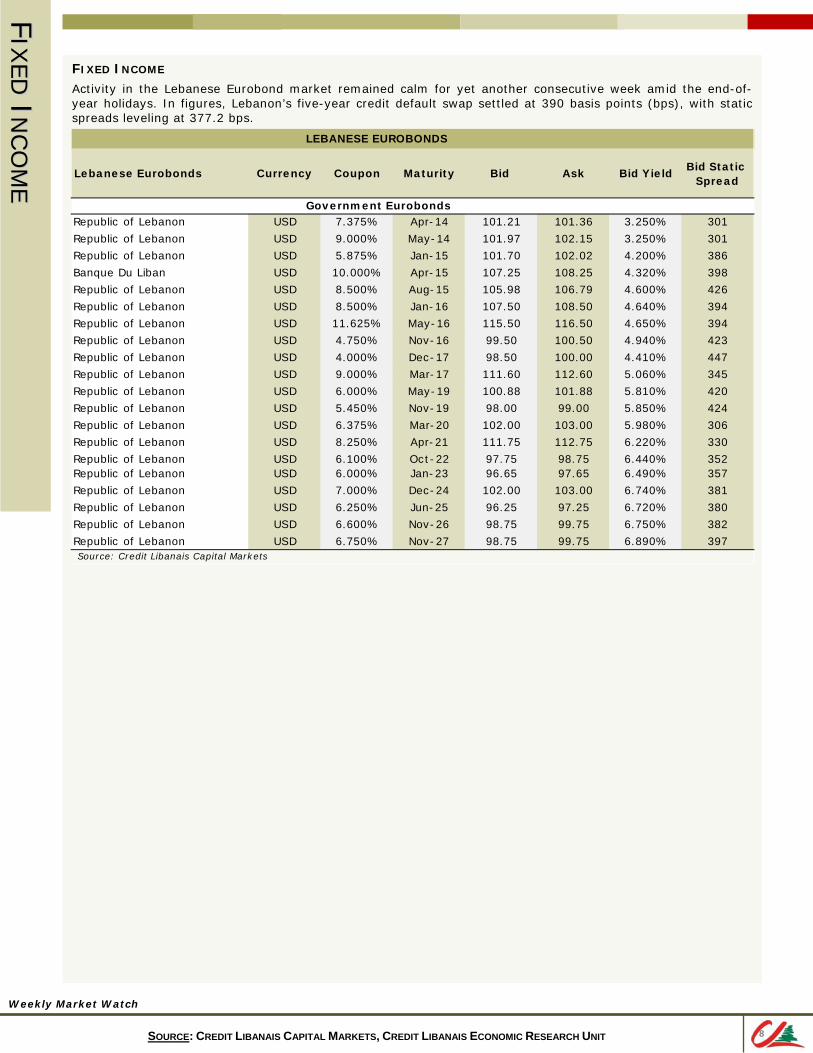
FIXED INCOME
Activity in the Lebanese Eurobond market remained calm for yet another consecutive week amid the end-of-year holidays. In figures, Lebanon’s five-year credit default swap settled at 390 basis points (bps), with static spreads leveling at 377.2 bps.
Weekly Market Watch
SOURCE: CREDIT LIBANAIS CAPITAL MARKETS, CREDIT LIBANAIS ECONOMIC RESEARCH UNIT 8
Lebanese Eurobonds Currency Coupon Maturity Bid Ask Bid YieldBid Static
Spread
Republic of Lebanon USD 7.375% Apr-14 101.21 101.36 3.250% 301
Republic of Lebanon USD 9.000% May-14 101.97 102.15 3.250% 301
Republic of Lebanon USD 5.875% Jan-15 101.70 102.02 4.200% 386
Banque Du Liban USD 10.000% Apr-15 107.25 108.25 4.320% 398
Republic of Lebanon USD 8.500% Aug-15 105.98 106.79 4.600% 426
Republic of Lebanon USD 8.500% Jan-16 107.50 108.50 4.640% 394
Republic of Lebanon USD 11.625% May-16 115.50 116.50 4.650% 394
Republic of Lebanon USD 4.750% Nov-16 99.50 100.50 4.940% 423
Republic of Lebanon USD 4.000% Dec-17 98.50 100.00 4.410% 447
Republic of Lebanon USD 9.000% Mar-17 111.60 112.60 5.060% 345
Republic of Lebanon USD 6.000% May-19 100.88 101.88 5.810% 420
Republic of Lebanon USD 5.450% Nov-19 98.00 99.00 5.850% 424
Republic of Lebanon USD 6.375% Mar-20 102.00 103.00 5.980% 306
Republic of Lebanon USD 8.250% Apr-21 111.75 112.75 6.220% 330
Republic of Lebanon USD 6.100% Oct-22 97.75 98.75 6.440% 352Republic of Lebanon USD 6.000% Jan-23 96.65 97.65 6.490% 357
Republic of Lebanon USD 7.000% Dec-24 102.00 103.00 6.740% 381
Republic of Lebanon USD 6.250% Jun-25 96.25 97.25 6.720% 380
Republic of Lebanon USD 6.600% Nov-26 98.75 99.75 6.750% 382
Republic of Lebanon USD 6.750% Nov-27 98.75 99.75 6.890% 397Source: Credit Libanais Capital Markets
LEBANESE EUROBONDS
Government Eurobonds
LLEEBBAANN
EESSEE EE
QQUU
II TTII EE
SS
Weekly Market Watch
SOURCE: BSE, CREDIT LIBANAIS ECONOMIC RESEARCH UNIT 9
LEBANESE EQUITIES
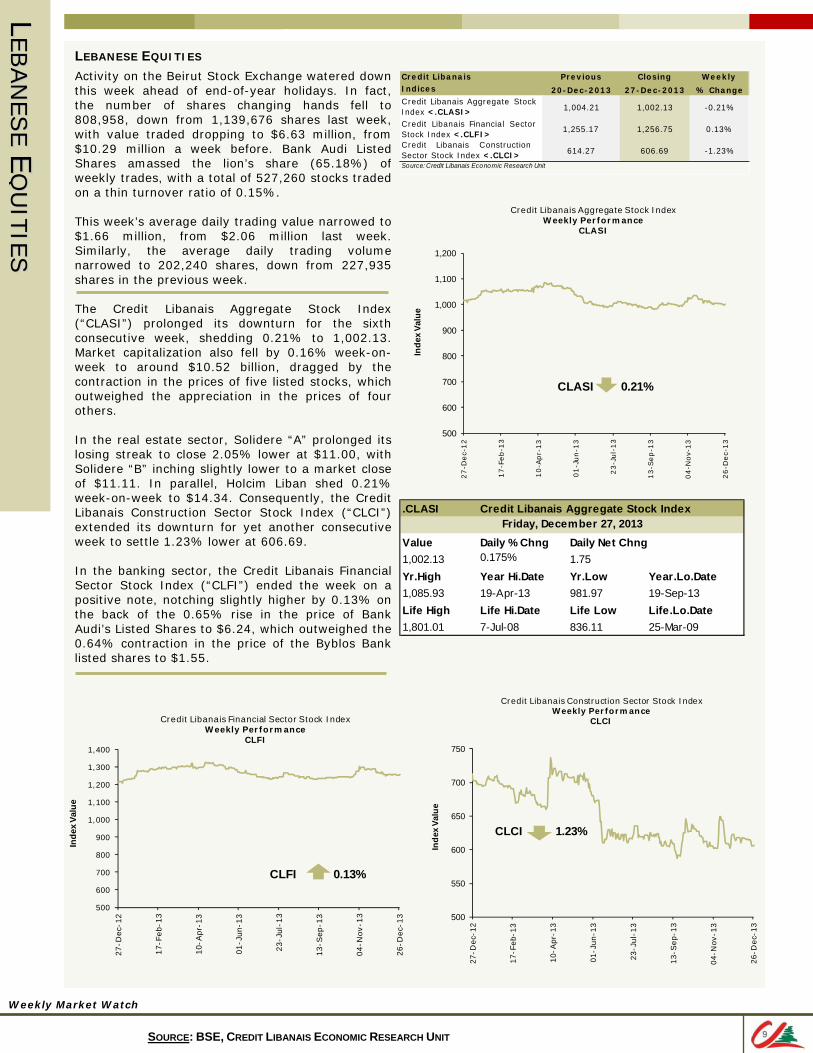
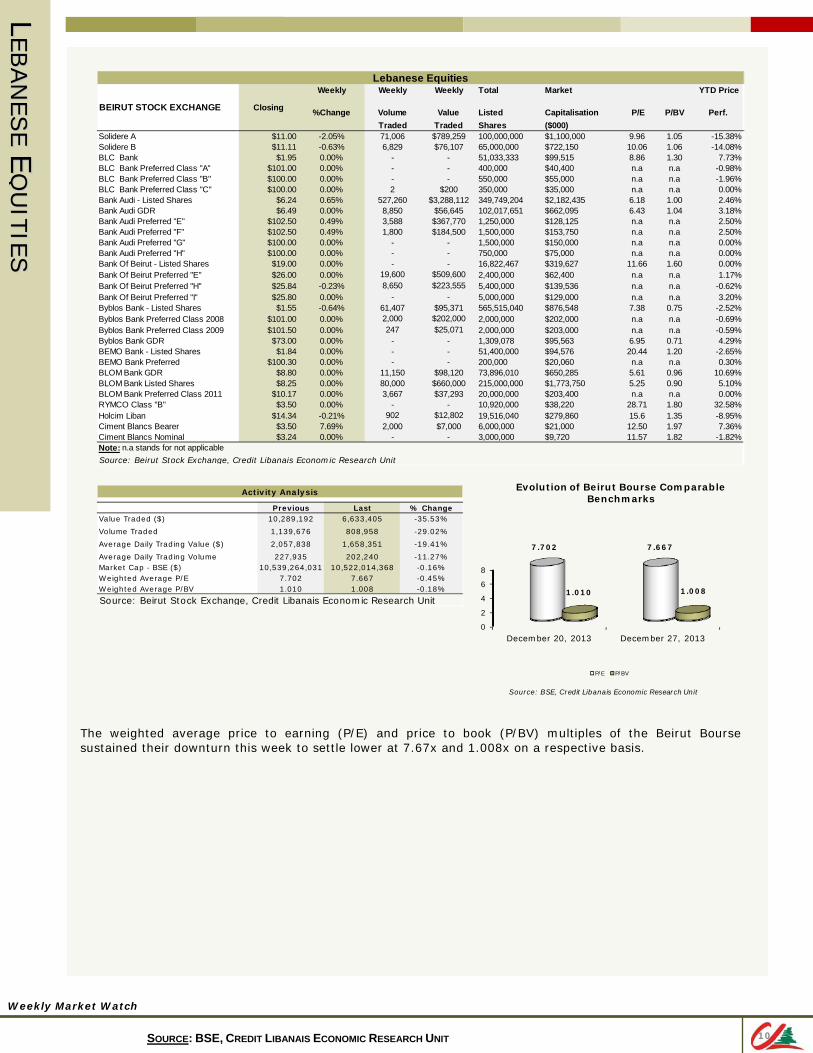
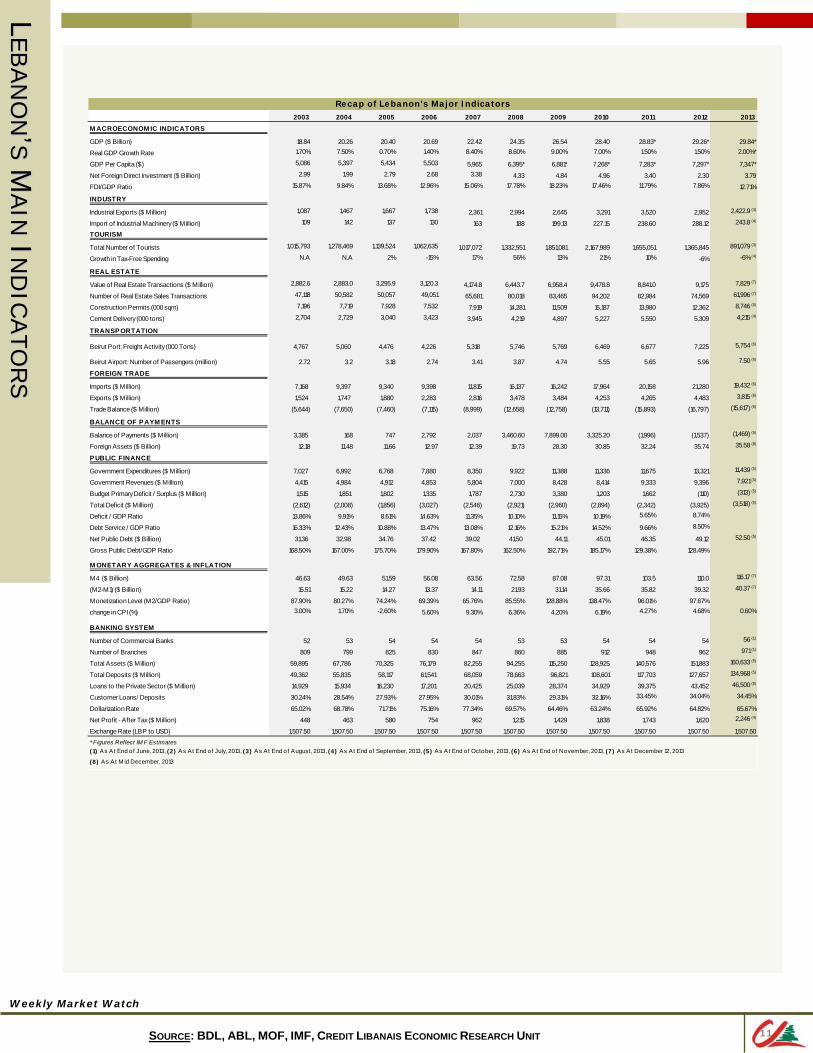
Activity on the Beirut Stock Exchange watered down this week ahead of end-of-year holidays. In fact, the number of shares changing hands fell to 808,958, down from 1,139,676 shares last week, with value traded dropping to $6.63 million, from $10.29 million a week before. Bank Audi Listed Shares amassed the lion’s share (65.18%) of weekly trades, with a total of 527,260 stocks traded on a thin turnover ratio of 0.15%. This week’s average daily trading value narrowed to $1.66 million, from $2.06 million last week. Similarly, the average daily trading volume narrowed to 202,240 shares, down from 227,935 shares in the previous week. The Credit Libanais Aggregate Stock Index (“CLASI”) prolonged its downturn for the sixth consecutive week, shedding 0.21% to 1,002.13. Market capitalization also fell by 0.16% week-on-week to around $10.52 billion, dragged by the contraction in the prices of five listed stocks, which outweighed the appreciation in the prices of four others. In the real estate sector, Solidere “A” prolonged its losing streak to close 2.05% lower at $11.00, with Solidere “B” inching slightly lower to a market close of $11.11. In parallel, Holcim Liban shed 0.21% week-on-week to $14.34. Consequently, the Credit Libanais Construction Sector Stock Index (“CLCI”) extended its downturn for yet another consecutive week to settle 1.23% lower at 606.69. In the banking sector, the Credit Libanais Financial Sector Stock Index (“CLFI”) ended the week on a positive note, notching slightly higher by 0.13% on the back of the 0.65% rise in the price of Bank Audi’s Listed Shares to $6.24, which outweighed the 0.64% contraction in the price of the Byblos Bank listed shares to $1.55.
Credit Libanais Previous Closing WeeklyIndices 20-Dec-2013 27-Dec-2013 % ChangeCredit Libanais Aggregate StockIndex <.CLASI> 1,004.21 1,002.13 -0.21%
Credit Libanais Financial SectorStock Index <.CLFI>
1,255.17 1,256.75 0.13%
Credit Libanais ConstructionSector Stock Index <.CLCI> 614.27 606.69 -1.23%
Source: Credit Libanais Economic Research Unit
500
600
700
800
900
1,000
1,100
1,200
27-D
ec-
12
17-F
eb-1
3
10-A
pr-
13
01-J
un-1
3
23-J
ul-
13
13-S
ep-1
3
04-N
ov-
13
26-D
ec-
13
Inde
x Va
lue
Credit Libanais Aggregate Stock IndexWeekly Performance
CLASI
CLASI 0.21%
.CLASI Credit Libanais Aggregate Stock Index
Value Daily % Chng Daily Net Chng1,002.13 0.175% 1.75Yr.High Year Hi.Date Yr.Low Year.Lo.Date1,085.93 19-Apr-13 981.97 19-Sep-13Life High Life Hi.Date Life Low Life.Lo.Date1,801.01 7-Jul-08 836.11 25-Mar-09
Friday, December 27, 2013
500
600
700
800
900
1,000
1,100
1,200
1,300
1,400
27-D
ec-1
2
17-F
eb-1
3
10-A
pr-1
3
01-J
un-1
3
23-J
ul-1
3
13-S
ep-1
3
04-N
ov-1
3
26-D
ec-1
3
Inde
x Va
lue
Credit Libanais Financial Sector Stock IndexWeekly Performance
CLFI
CLFI 0.13%
500
550
600
650
700
750
27-D
ec-
12
17-F
eb-
13
10-
Apr
-13
01-J
un-1
3
23-J
ul-1
3
13-
Sep
-13
04-
Nov
-13
26-D
ec-
13
Inde
x Va
lue
Credit Libanais Construction Sector Stock IndexWeekly Performance
CLCI
CLCI 1.23%
LLEEBBAANN
EESSEE EE
QQUU
II TTII EE
SS
The weighted average price to earning (P/E) and price to book (P/BV) multiples of the Beirut Bourse sustained their downturn this week to settle lower at 7.67x and 1.008x on a respective basis.
Weekly Market Watch
SOURCE: BSE, CREDIT LIBANAIS ECONOMIC RESEARCH UNIT 10
Weekly Weekly Weekly Total Market YTD Price
%Change Volume Value Listed Capitalisation P/E P/BV Perf.Traded Traded Shares ($000)
Solidere A $11.00 -2.05% 71,006 $789,259 100,000,000 $1,100,000 9.96 1.05 -15.38%Solidere B $11.11 -0.63% 6,829 $76,107 65,000,000 $722,150 10.06 1.06 -14.08%BLC Bank $1.95 0.00% - - 51,033,333 $99,515 8.86 1.30 7.73%-BLC Bank Preferred Class "A" $101.00 0.00% - - 400,000 $40,400 n.a n.a -0.98%BLC Bank Preferred Class "B" $100.00 0.00% - - 550,000 $55,000 n.a n.a -1.96%BLC Bank Preferred Class "C" $100.00 0.00% 2 $200 350,000 $35,000 n.a n.a 0.00%Bank Audi - Listed Shares $6.24 0.65% 527,260 $3,288,112 349,749,204 $2,182,435 6.18 1.00 2.46%Bank Audi GDR $6.49 0.00% 8,850 $56,645 102,017,651 $662,095 6.43 1.04 3.18%Bank Audi Preferred "E" $102.50 0.49% 3,588 $367,770 1,250,000 $128,125 n.a n.a 2.50%Bank Audi Preferred "F" $102.50 0.49% 1,800 $184,500 1,500,000 $153,750 n.a n.a 2.50%Bank Audi Preferred "G" $100.00 0.00% - - 1,500,000 $150,000 n.a n.a 0.00%Bank Audi Preferred "H" $100.00 0.00% - - 750,000 $75,000 n.a n.a 0.00%Bank Of Beirut - Listed Shares $19.00 0.00% - - 16,822,467 $319,627 11.66 1.60 0.00%-Bank Of Beirut Preferred "E" $26.00 0.00% 19,600 $509,600 2,400,000 $62,400 n.a n.a 1.17%Bank Of Beirut Preferred "H" $25.84 -0.23% 8,650 $223,555 5,400,000 $139,536 n.a n.a -0.62%Bank Of Beirut Preferred "I" $25.80 0.00% - - 5,000,000 $129,000 n.a n.a 3.20%-Byblos Bank - Listed Shares $1.55 -0.64% 61,407 $95,371 565,515,040 $876,548 7.38 0.75 -2.52%Byblos Bank Preferred Class 2008 $101.00 0.00% 2,000 $202,000 2,000,000 $202,000 n.a n.a -0.69%Byblos Bank Preferred Class 2009 $101.50 0.00% 247 $25,071 2,000,000 $203,000 n.a n.a -0.59%Byblos Bank GDR $73.00 0.00% - - 1,309,078 $95,563 6.95 0.71 4.29%-BEMO Bank - Listed Shares $1.84 0.00% - - 51,400,000 $94,576 20.44 1.20 -2.65%-BEMO Bank Preferred $100.30 0.00% - - 200,000 $20,060 n.a n.a 0.30%-BLOM Bank GDR $8.80 0.00% 11,150 $98,120 73,896,010 $650,285 5.61 0.96 10.69%BLOM Bank Listed Shares $8.25 0.00% 80,000 $660,000 215,000,000 $1,773,750 5.25 0.90 5.10%BLOM Bank Preferred Class 2011 $10.17 0.00% 3,667 $37,293 20,000,000 $203,400 n.a n.a 0.00%RYMCO Class "B" $3.50 0.00% - - 10,920,000 $38,220 28.71 1.80 32.58%-Holcim Liban $14.34 -0.21% 902 $12,802 19,516,040 $279,860 15.6 1.35 -8.95%Ciment Blancs Bearer $3.50 7.69% 2,000 $7,000 6,000,000 $21,000 12.50 1.97 7.36%Ciment Blancs Nominal $3.24 0.00% - - 3,000,000 $9,720 11.57 1.82 -1.82%-
Lebanese Equities
BEIRUT STOCK EXCHANGE Closing
Source: Beirut Stock Exchange, Credit Libanais Economic Research UnitNote: n.a stands for not applicable
Previous Last % ChangeValue Traded ($) 10,289,192 6,633,405 -35.53%
Volume Traded 1,139,676 808,958 -29.02%
Average Daily Trading Value ($) 2,057,838 1,658,351 -19.41%
Average Daily Trading Volume 227,935 202,240 -11.27%Market Cap - BSE ($) 10,539,264,031 10,522,014,368 -0.16%Weighted Average P/E 7.702 7.667 -0.45%Weighted Average P/BV 1.010 1.008 -0.18%
Activity Analysis
Source: Beirut Stock Exchange, Credit Libanais Economic Research Unit
Source: BSE, Credit Libanais Economic Research Unit
0
2
4
6
8
December 20, 2013 December 27, 2013
7.702 7.667
1.010 1.008
Evolution of Beirut Bourse Comparable Benchmarks
P/E P/BV
Weekly Market Watch
SOURCE: BDL, ABL, MOF, IMF, CREDIT LIBANAIS ECONOMIC RESEARCH UNIT 11
LLEEBBAANN
OONN ’’ SS
MMAAII NN
II NNDD
II CCAATTOO
RRSS
2003 2004 2005 2006 2007 2008 2009 2010 2011 2012 2013M ACROECONOM IC INDICATORS
GDP ($ Billion) 18.84 20.26 20.40 20.69 22.42 24.35 26.54 28.40 28.83* 29.26* 29.84*
Real GDP Growth Rate 1.70% 7.50% 0.70% 1.40% 8.40% 8.60% 9.00% 7.00% 1.50% 1.50% 2.00%*
GDP Per Capita ($) 5,086 5,397 5,434 5,503 5,965 6,395* 6,881* 7,268* 7,283* 7,297* 7,347*
Net Foreign Direct Investment ($ Billion) 2.99 1.99 2.79 2.68 3.38 4.33 4.84 4.96 3.40 2.30 3.79
FDI/GDP Ratio 15.87% 9.84% 13.68% 12.96% 15.06% 17.78% 18.23% 17.46% 11.79% 7.86% 12.71%
INDUSTRY
Industrial Exports ($ Million) 1,087 1,467 1,667 1,738 2,361 2,994 2,645 3,291 3,520 2,952 2,422.9 (4)
Import of Industrial Machinery ($ Million) 109 142 137 130 163 188 199.13 227.15 238.60 288.12 243.8 (4)
TOURISM
Total Number of Tourists 1,015,793 1,278,469 1,139,524 1,062,635 1,017,072 1,332,551 1,851,081 2,167,989 1,655,051 1,365,845 891,079 (3)
Growth in Tax-Free Spending N.A N.A 2% -15% 17% 56% 13% 21% 10% -6% -6% (4)
REAL ESTATE
Value of Real Estate Transactions ($ Million) 2,882.6 2,883.0 3,295.9 3,120.3 4,174.8 6,443.7 6,958.4 9,478.8 8,841.0 9,175 7,829 (7)
Number of Real Estate Sales Transactions 47,118 50,582 50,057 49,051 65,681 80,018 83,465 94,202 82,984 74,569 61,996 (7)
Construction Permits (000 sqm) 7,196 7,719 7,928 7,532 7,919 14,281 11,509 15,187 13,980 12,362 8,746 (5)
Cement Delivery (000 tons) 2,704 2,729 3,040 3,423 3,945 4,219 4,897 5,227 5,550 5,309 4,215 (4)
TRANSPORTATION
Beirut Port: Freight Activity (000 Tons) 4,767 5,060 4,476 4,226 5,318 5,746 5,769 6,469 6,677 7,225 5,754 (6)
Beirut Airport: Number of Passengers (million) 2.72 3.2 3.18 2.74 3.41 3.87 4.74 5.55 5.65 5.96 7.50 (6)
FOREIGN TRADE
Imports ($ Million) 7,168 9,397 9,340 9,398 11,815 16,137 16,242 17,964 20,158 21,280 19,432 (6)
Exports ($ Million) 1,524 1,747 1,880 2,283 2,816 3,478 3,484 4,253 4,265 4,483 3,815 (6)
Trade Balance ($ Million) (5,644) (7,650) (7,460) (7,115) (8,999) (12,658) (12,758) (13,711) (15,893) (16,797) (15,617) (6)
BALANCE OF PAYM ENTS
Balance of Payments ($ Million) 3,385 168 747 2,792 2,037 3,460.60 7,899.00 3,325.20 (1,996) (1,537) (1,469) (5)
Foreign Assets ($ Billion) 12.18 11.48 11.66 12.97 12.39 19.73 28.30 30.85 32.24 35.74 35.58 (8)
PUBLIC FINANCE
Government Expenditures ($ Million) 7,027 6,992 6,768 7,880 8,350 9,922 11,388 11,336 11,675 13,321 11,439 (5)
Government Revenues ($ Million) 4,415 4,984 4,912 4,853 5,804 7,000 8,428 8,414 9,333 9,396 7,921 (5)
Budget Primary Deficit / Surplus ($ Million) 1,515 1,851 1,802 1,335 1,787 2,730 3,380 1,203 1,662 (110) (313) (5)
Total Deficit ($ Million) (2,612) (2,008) (1,856) (3,027) (2,546) (2,921) (2,960) (2,894) (2,342) (3,925) (3,518) (5)
Deficit / GDP Ratio 13.86% 9.91% 8.61% 14.63% 11.35% 10.10% 11.15% 10.19% 5.65% 8.74%
Debt Service / GDP Ratio 16.33% 12.43% 10.88% 13.47% 13.08% 12.16% 15.21% 14.52% 9.66% 8.50%
Net Public Debt ($ Billion) 31.36 32.98 34.76 37.42 39.02 41.50 44.11 45.01 46.35 49.12 52.50 (5)
Gross Public Debt/GDP Ratio 168.50% 167.00% 175.70% 179.90% 167.80% 162.50% 192.71% 185.17% 129.38% 128.49%
M ONETARY AGGREGATES & INFLATION
M4 ($ Billion) 46.63 49.63 51.59 56.08 63.56 72.58 87.08 97.31 103.5 110.0 116.17 (7)
(M2-M1) ($ Billion) 15.51 15.22 14.27 13.37 14.11 21.93 31.14 35.66 35.82 39.32 40.37 (7)
Monetization Level (M2/GDP Ratio) 87.90% 80.27% 74.24% 69.39% 65.76% 85.55% 128.88% 138.47% 96.01% 97.67%
change in CPI (%) 3.00% 1.70% -2.60% 5.60% 9.30% 6.36% 4.20% 6.19% 4.27% 4.68% 0.60%
BANKING SYSTEM
Number of Commercial Banks 52 53 54 54 54 53 53 54 54 54 56 (1)
Number of Branches 809 799 825 830 847 860 885 912 948 962 971 (1)
Total Assets ($ Million) 59,895 67,786 70,325 76,179 82,255 94,255 115,250 128,925 140,576 151,883 160,633 (5)
Total Deposits ($ Million) 49,362 55,835 58,117 61,541 68,059 78,663 96,821 108,601 117,703 127,657 134,968 (5)
Loans to the Private Sector ($ Million) 14,929 15,934 16,230 17,201 20,425 25,039 28,374 34,929 39,375 43,452 46,500 (5)
Customer Loans/ Deposits 30.24% 28.54% 27.93% 27.95% 30.01% 31.83% 29.31% 32.16% 33.45% 34.04% 34.45%
Dollarization Rate 65.02% 68.78% 71.71% 75.16% 77.34% 69.57% 64.46% 63.24% 65.92% 64.82% 65.67%
Net Profit - After Tax ($ Million) 448 463 580 754 962 1,215 1,429 1,838 1,743 1,620 2,246 (4)
Exchange Rate (LBP to USD) 1,507.50 1,507.50 1,507.50 1,507.50 1,507.50 1,507.50 1,507.50 1,507.50 1,507.50 1,507.50 1,507.50
(8) As At M id December, 2013
* Figures Reflect IM F Estimates
Recap of Lebanon's Major Indicators
(1) As At End of June, 2013, (2) As At End of July, 2013, (3) As At End of August, 2013, (4) As At End of September, 2013, (5) As At End of October, 2013, (6) As At End of November, 2013, (7) As At December 12, 2013

LLEEBBAANN
OONN ’’ SS
RRAATTII NN
GGSS
Weekly Market Watch
SOURCE: S&P, MOODY’S, FITCH, CAPITAL INTELLIGENCE, CREDIT LIBANAIS ECONOMIC RESEARCH UNIT 12
Rated Banks
Long Term Foreign Currency
Financial Strength
Outlook Long Term Foreign Currency
Outlook Long Term IDR
Outlook
Bank Audi-Saradar B1 D- Negative B Stable B Stable
BLOM Bank B1 D- Negative B Stable - -
Credit Libanais - - - B Stable - -
Byblos Bank B1 D- Negative B Stable B Stable
BBAC - - - B Stable - -
Fransabank - - - B Stable - -
Bank of Beirut B1 D- Negative - - - -Sources: M oody's Investors Service, Capital Intelligence, Fitch Ratings
Lebanese Banks' Latest Ratings
Capital Intelligence Moody's Investors Service Fitch Ratings
Rating Agency Tenor Rating
Long-Term B-Short-Term B
M oody's Investors Service Ltd. Long-Term B1
Fitch IBCA Ltd. Long-Term BShort-Term B
Republic Of Lebanon Sovereign Ratings
Outlook
Negative
Negative
Source: M oody's Investors Service, Standard & Poor's, Fitch Ratings
Negative
Standard & Poor's
s
CONTACTS RESEARCH Fadlo I. Choueiri, CFA [email protected] 961-1-200 028 EXT: 235 Jad Abi Haidar [email protected] 961-1-200 028 EXT. 251 Joelle Samaha [email protected] 961-1-200 028 EXT. 232 Patrick Karawani [email protected] 961-1-200 028 EXT. 275 Christelle Mouawad [email protected] 961-1-200 028 EXT. 230
MONEY MARKETS DESK Robert Araman [email protected] 961-1-200 028 EXT. 116 FX DESK Christian Hajjar [email protected] 961-1-200 027 CAPITAL MARKETS DESK Gaith Mansour [email protected] 961-1-322 191
This document is being furnished to you solely for your information and may not be reproduced or redistributed to any other person. This document does not constitute an offer or invitation to subscribe to or purchase any security, and neither this document nor anything contained herein shall form the basis of any contract or commitment whatsoever. Reasonable care has been taken to ensure that the facts stated herein are accurate and the estimates, opinions and expectations contained herein are fair and reliable.
CCOO
NNTTAACCTTSS
Weekly Market Watch
ECONOMIC RESEARCH UNIT - SOFIL CENTER, BEIRUT LEBANON - TEL: 01-200028/9 FAX: 01-326786 13