weekly june 11, 2004 / vol. 53 / no. 22 · morbidity and mortality weekly report weekly june 11,...
TRANSCRIPT

Morbidity and Mortality Weekly Report
Weekly June 11, 2004 / Vol. 53 / No. 22
depardepardepardepardepartment of health and human sertment of health and human sertment of health and human sertment of health and human sertment of health and human servicesvicesvicesvicesvicesCenters for Disease Control and PreventionCenters for Disease Control and PreventionCenters for Disease Control and PreventionCenters for Disease Control and PreventionCenters for Disease Control and Prevention
INSIDE
474 Suicide Attempts and Physical Fighting Among HighSchool Students — United States, 2001
476 School-Associated Suicides — United States, 1994–1999478 Suicide Among Hispanics — United States, 1997–2001481 Suicide and Attempted Suicide — China, 1990–2002484 West Nile Virus Activity — United States, June 2–8, 2004484 Outbreak of Salmonella Serotype Enteritidis Infections
Associated with Raw Almonds — United States andCanada, 2003–2004
487 Notice to Readers
Suicide and Attempted SuicideSuicide is the 13th leading cause of death worldwide,
the 11th in the United States (1), and the third amongU.S. residents aged 10–24 years, accounting for 4,243(11.7%) of all deaths in this age group. Suicide attemptsand other acts of self harm that result in nonfatal injuriestake a heavy toll on the health of younger persons. In2002, an estimated 124,409 visits to U.S. emergencydepartments were made after attempted suicides or otherself-harm incidents among persons aged 10–24 years.
To provide insights that might lead to successful pre-vention programs, this week’s MMWR includes reportson 1) trends in suicide by persons aged 10–19 years, 2)suicide attempts and physical fighting among high schoolstudents, 3) school-associated suicides, 4) suicide amongHispanics, and 5) suicidal behavior in China.
Reducing the overall suicide rate and the number ofsuicide attempts reported by adolescents are among the2010 national health objectives (objective nos. 18-1 and18-2) (2). Integrated prevention strategies that addressmultiple associated factors (e.g., substance abuse preven-tion, family and peer support, and access to health ser-vices) are likely to be more effective in reducing suicidalbehavior than programs that focus on a single risk factor (3).Additional information about suicide prevention is avail-able at http://www.cdc.gov/ncipc/factsheets/suifacts.htm.References1. Krug EG, Dahlberg LL, Mercy JA, Zwi A, Lozano R, eds. World
Report on Violence and Health. Geneva, Switzerland: World HealthOrganization, 2002. Available at http://www.who.int/violence_injury_prevention/violence/world_report/wrvheng/en.
2. U.S. Department of Health and Human Services. Healthy People2010, 2nd ed. With Understanding and Improving Health andObjectives for Improving Health (2 vols.). Washington, DC: U.S.Department of Health and Human Services, 2000.
3. Goldsmith SK, Pellmar TC, Kleinman AM, Bunney WE, eds.Reducing Suicide: A National Imperative. Washington, DC:National Academies Press, 2002.
Methods of Suicide Among PersonsAged 10–19 Years — United States,
1992–2001In 2001, suicide was the third leading cause of death among
persons aged 10–19 years (1). The most common method ofsuicide in this age group was by firearm (49%), followed bysuffocation (mostly hanging) (38%) and poisoning (7%) (1).During 1992–2001, although the overall suicide rate amongpersons aged 10–19 years declined from 6.2 to 4.6 per 100,000population (1), methods of suicide changed substantially. Tocharacterize trends in suicide methods among persons in thisage group, CDC analyzed data for persons living in the UnitedStates during 1992–2001. This report summarizes the resultsof that analysis, which indicated a substantial decline in sui-cides by firearm and an increase in suicides by suffocation inpersons aged 10–14 and 15–19 years. Beginning in 1997,among persons aged 10–14 years, suffocation surpassed fire-arms as the most common suicide method. The decline infirearm suicides combined with the increase in suicides bysuffocation suggests that changes have occurred in suicidalbehavior among youths during the preceding decade. Publichealth officials should develop intervention strategies thataddress the challenges posed by these changes, including

472 MMWR June 11, 2004
SUGGESTED CITATIONCenters for Disease Control and Prevention. [Article Title].MMWR 2004;53:[inclusive page numbers].
The MMWR series of publications is published by theEpidemiology Program Office, Centers for Disease Controland Prevention (CDC), U.S. Department of Health andHuman Services, Atlanta, GA 30333.
Centers for Disease Control and Prevention
Julie L. Gerberding, M.D., M.P.H.Director
Dixie E. Snider, M.D., M.P.H.(Acting) Deputy Director for Public Health Science
Tanja Popovic, M.D., Ph.D.(Acting) Associate Director for Science
Epidemiology Program Office
Stephen B. Thacker, M.D., M.Sc.Director
Office of Scientific and Health Communications
John W. Ward, M.D.Director
Editor, MMWR Series
Suzanne M. Hewitt, M.P.A.Managing Editor, MMWR Series
Douglas W. Weatherwax(Acting) Lead Technical Writer/Editor
Jude C. RutledgeTeresa F. Rutledge
Writers/Editors
Lynda G. CupellMalbea A. LaPete
Visual Information Specialists
Kim L. Bright, M.B.A.Quang M. Doan, M.B.A.
Erica R. ShaverInformation Technology Specialists
Division of Public Health Surveillanceand Informatics
Notifiable Disease Morbidity and 122 Cities Mortality DataRobert F. Fagan
Deborah A. AdamsFelicia J. ConnorLateka Dammond
Rosaline DharaDonna Edwards
Patsy A. HallPearl C. Sharp
programs that integrate monitoring systems, etiologic research,and comprehensive prevention activities.
Annual data on suicides occurring in the United States dur-ing 1992–2001 (2) were obtained by using CDC’s Web-basedInjury Statistics Query and Reporting System (WISQARS™)(1) and examined by age group (i.e., persons aged 10–14 and15–19 years) and method (e.g., firearm, suffocation, and poi-soning) for each year and the 10-year period. To analyze thesedata, codes were used from the International Classification ofDiseases, Ninth Revision (ICD-9) and the International Classi-fication of Diseases and Related Health Problems, Tenth Revision(ICD-10), which was implemented in 1999. Although cod-ing of mortality data changed in 1999, the two revisions havenear 100% agreement on classification of suicides by firearm,suffocation, and poisoning (3); thus, the suicide method wasdefined consistently during the period analyzed.
For each method of suicide, annual suicide rates (per100,000 population) were calculated by age group and over-all. Because firearms and suffocation were the two most com-mon methods of suicide among persons aged 10–19 years,accounting for approximately 90% of suicide deaths in thisage group, trends for these two methods (Figures 1 and 2)were formally evaluated by using negative binomial rateregression to account for overdispersion in the data. Supple-mental information on suicides by poisoning (the third mostcommon method) and suicide by all other methods (e.g.,jumping from a height) is provided for illustration purposes.Annual ratios of suffocation suicides to firearm suicides wereexamined as an additional means of assessing changes in therelative magnitude of these methods over time (Table).
Among persons aged 10–14 years, the rate of firearm sui-cide decreased from 0.9 per 100,000 population in 1992 to0.4 in 2001, whereas the rate of suffocation suicide increased
FIGURE 1. Annual suicide rates* among persons aged 10–14years, by year and method — United States, 1992–2001
* Per 100,000 population.
0
0.2
0.4
0.6
0.8
1.0
1.2
1992 1993 1994 1995 1996 1997 1998 1999 2000 2001
FirearmSuffocationPoisoningAll others
Rat
e
Year
Vol. 53 / No. 22 MMWR 473
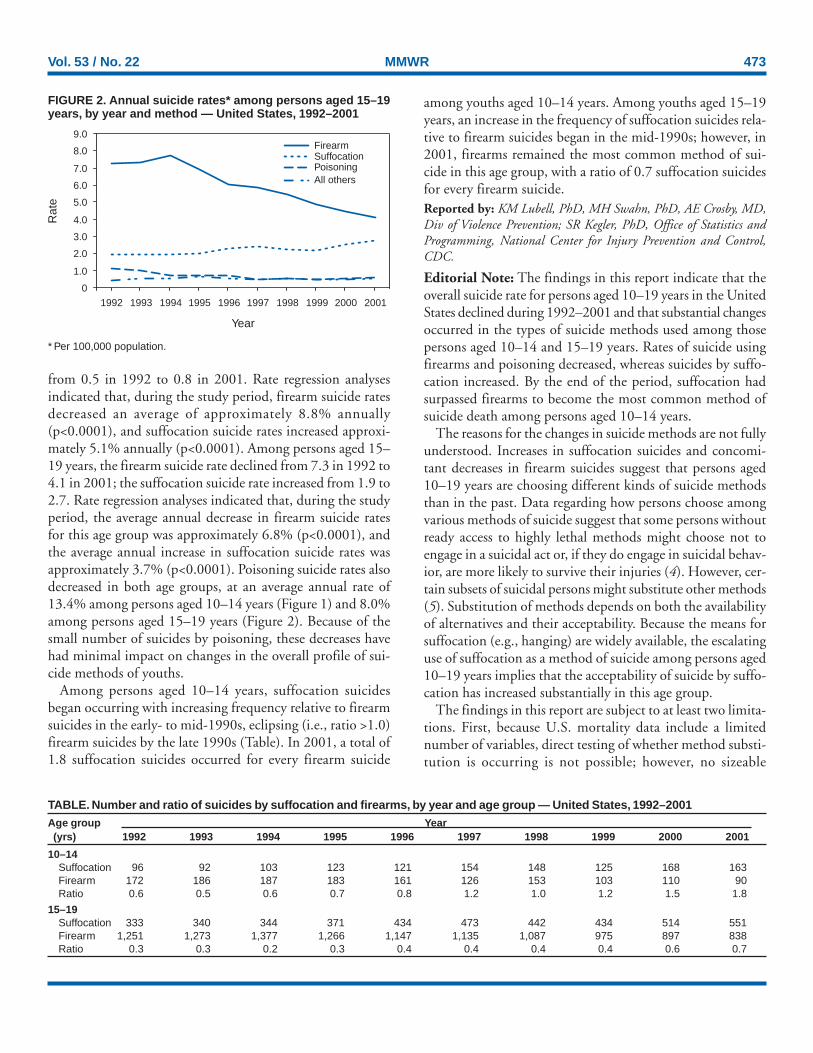
from 0.5 in 1992 to 0.8 in 2001. Rate regression analysesindicated that, during the study period, firearm suicide ratesdecreased an average of approximately 8.8% annually(p<0.0001), and suffocation suicide rates increased approxi-mately 5.1% annually (p<0.0001). Among persons aged 15–19 years, the firearm suicide rate declined from 7.3 in 1992 to4.1 in 2001; the suffocation suicide rate increased from 1.9 to2.7. Rate regression analyses indicated that, during the studyperiod, the average annual decrease in firearm suicide ratesfor this age group was approximately 6.8% (p<0.0001), andthe average annual increase in suffocation suicide rates wasapproximately 3.7% (p<0.0001). Poisoning suicide rates alsodecreased in both age groups, at an average annual rate of13.4% among persons aged 10–14 years (Figure 1) and 8.0%among persons aged 15–19 years (Figure 2). Because of thesmall number of suicides by poisoning, these decreases havehad minimal impact on changes in the overall profile of sui-cide methods of youths.
Among persons aged 10–14 years, suffocation suicidesbegan occurring with increasing frequency relative to firearmsuicides in the early- to mid-1990s, eclipsing (i.e., ratio >1.0)firearm suicides by the late 1990s (Table). In 2001, a total of1.8 suffocation suicides occurred for every firearm suicide
among youths aged 10–14 years. Among youths aged 15–19years, an increase in the frequency of suffocation suicides rela-tive to firearm suicides began in the mid-1990s; however, in2001, firearms remained the most common method of sui-cide in this age group, with a ratio of 0.7 suffocation suicidesfor every firearm suicide.Reported by: KM Lubell, PhD, MH Swahn, PhD, AE Crosby, MD,Div of Violence Prevention; SR Kegler, PhD, Office of Statistics andProgramming, National Center for Injury Prevention and Control,CDC.
Editorial Note: The findings in this report indicate that theoverall suicide rate for persons aged 10–19 years in the UnitedStates declined during 1992–2001 and that substantial changesoccurred in the types of suicide methods used among thosepersons aged 10–14 and 15–19 years. Rates of suicide usingfirearms and poisoning decreased, whereas suicides by suffo-cation increased. By the end of the period, suffocation hadsurpassed firearms to become the most common method ofsuicide death among persons aged 10–14 years.
The reasons for the changes in suicide methods are not fullyunderstood. Increases in suffocation suicides and concomi-tant decreases in firearm suicides suggest that persons aged10–19 years are choosing different kinds of suicide methodsthan in the past. Data regarding how persons choose amongvarious methods of suicide suggest that some persons withoutready access to highly lethal methods might choose not toengage in a suicidal act or, if they do engage in suicidal behav-ior, are more likely to survive their injuries (4). However, cer-tain subsets of suicidal persons might substitute other methods(5). Substitution of methods depends on both the availabilityof alternatives and their acceptability. Because the means forsuffocation (e.g., hanging) are widely available, the escalatinguse of suffocation as a method of suicide among persons aged10–19 years implies that the acceptability of suicide by suffo-cation has increased substantially in this age group.
The findings in this report are subject to at least two limita-tions. First, because U.S. mortality data include a limitednumber of variables, direct testing of whether method substi-tution is occurring is not possible; however, no sizeable
FIGURE 2. Annual suicide rates* among persons aged 15–19years, by year and method — United States, 1992–2001
* Per 100,000 population.
0
1.0
2.0
3.0
4.0
5.0
6.0
7.0
8.0
9.0
1992 1993 1994 1995 1996 1997 1998 1999 2000 2001
FirearmSuffocationPoisoningAll others
Rat
e
Year
TABLE. Number and ratio of suicides by suffocation and firearms, by year and age group — United States, 1992–2001Age group Year(yrs) 1992 1993 1994 1995 1996 1997 1998 1999 2000 2001
10–14Suffocation 96 92 103 123 121 154 148 125 168 163Firearm 172 186 187 183 161 126 153 103 110 90Ratio 0.6 0.5 0.6 0.7 0.8 1.2 1.0 1.2 1.5 1.8
15–19Suffocation 333 340 344 371 434 473 442 434 514 551Firearm 1,251 1,273 1,377 1,266 1,147 1,135 1,087 975 897 838Ratio 0.3 0.3 0.2 0.3 0.4 0.4 0.4 0.4 0.6 0.7

474 MMWR June 11, 2004
demographic changes in the composition of youth suicidedecedents have been documented that might explain thechanges in methods (1). Second, official mortality data forsuicide are known to reflect some degree of undercount; how-ever, such undercounts do not appear to affect conclusionsabout trends over time (6).
The findings in this report demonstrate that rapid shifts inyouth suicidal behavior can occur, underscoring the need forearly effective suicide-prevention efforts that focus on suicidalthoughts and pressures. Moreover, statistical simulations com-paring the impacts of different types of suicide-preventionapproaches suggest that widely implemented population-basedstrategies will have a greater effect in reducing overall suiciderates than the more traditional strategies that concentrate onpersons at high risk (7). One of the most common popula-tion-based strategies focuses on restricting access to highlylethal means (e.g., bridge barriers and bubble-packaging forover-the-counter medications) to diminish the likelihood ofdeath from self-inflicted injuries (8). However, the privatenature of suffocation, its widespread availability, and its highlethality suggest that population-based prevention effortsaddressing access to lethal means also must confront theunderlying reasons for suicidality to avoid the potential formethod substitution.
Suicide is a multifaceted problem for which several risk fac-tors exist, including societal beliefs regarding the acceptabil-ity of suicidal behavior, social isolation and communitydisintegration, stressful life events, mental illness, and sub-stance abuse (9). When such factors combine with widespreadavailability of lethal means, higher rates of suicide tend toresult (8). The actual effectiveness of existing population-basedprevention approaches in reducing the number of suicidedeaths is unclear. In addition to improving data-collectionmethods, public health officials should emphasize the need toevaluate the effectiveness of current suicide-prevention activi-ties and examine how effective strategies can be implementedin diverse communities. CDC supports various efforts toevaluate suicide-prevention programs for youth.Additional information is available at http://www.cdc.gov/ncipc.
AcknowledgmentThe findings in this report are based in part on contributions by
JL Annest, PhD, Office of Statistics and Programming, NationalCenter for Injury Prevention and Control, CDC.
References1. CDC. Web-based Injury Statistics Query and Reporting System
(WISQARS™). Atlanta, Georgia: U.S. Department of Health andHuman Services, CDC, National Center for Injury Prevention andControl, 2004. Available at http://www.cdc.gov/ncipc/wisqars.
2. National Center for Health Statistics. Multiple cause-of-death public-use data files, 1992 through 2001. Hyattsville, Maryland: U.S. Depart-ment of Health and Human Services, CDC, 2003.
3. Anderson RN, Minino AM, Fingerhut LA, Warner M, Heinen MA.Deaths: injuries, 2001. Natl Vital Stat Rep 2004;52:1–5.
4. Cook PJ. The technology of personal violence. In: Tonry M, ed. Crimeand Justice: An Annual Review of Research, vol. 14. Chicago, Illinois:University of Chicago Press, 1991:1–71.
5. Gunnell D, Nowers M. Suicide by jumping. Acta PsychiatricaScandinavica 1997;96:1–6.
6. O’Carroll PW. A consideration of the validity and reliability of suicidemortality data. Suicide and Life-Threatening Behav 1989;19:1–16.
7. Lewis G, Hawton K, Jones P. Strategies for preventing suicide. Br JPsychiatry 1997;171:351–4.
8. Beautrais AL. Methods of youth suicide in New Zealand: trends andimplications for prevention. Australian and New Zealand Journal ofPsychiatry 2000;34:413–9.
9. Goldsmith SK, Pellmar TC, Kleinman AM, Bunney WE, eds.Reducing Suicide: A National Imperative. Washington, DC:National Academies Press, 2002.
Suicide Attempts and PhysicalFighting Among High School
Students — United States, 2001Violence is a major cause of morbidity and mortality, par-
ticularly among youths. In the United States, homicide andsuicide are the second and third leading causes of death,respectively, for persons aged 13–19 years (1). Although sui-cide commonly is associated with anxiety, depression, andsocial withdrawal, research suggests a link between violentbehaviors directed at oneself (i.e., suicidal behaviors) and vio-lent behaviors directed at others among adolescents (2–6). Cer-tain students who engage in extreme forms of violence, suchas school shootings, exhibit suicidal ideation or behaviorbefore or during the attack (2,3). However, suicidal behavioralso might be associated with involvement in less extreme formsof violent behaviors, such as physical fighting, which mightbe a risk factor for more severe forms of violence (3). To char-acterize any potential association between suicide attempts andfighting, CDC analyzed self-reported 2001 data from anationally representative sample of high school students inthe United States. The results of that analysis indicated thatstudents who reported attempting suicide during the preced-ing 12 months were nearly four times more likely also to havereported fighting than those who reported not attemptingsuicide. Prevention programs that seek to reduce both sui-cidal and violent behaviors are needed. Because prevalence ofthis association was determined to be highest in the 9th grade,these efforts might be most effective if implemented beforestudents reach high school.

Vol. 53 / No. 22 MMWR 475
Analyses were based on data from 11,815 (out of 13,601)nationally representative high school students in grades 9–12who participated in the 2001 Youth Risk Behavior Survey(YRBS) and responded to questions about whether they hadattempted suicide and whether they had participated in physi-cal fighting in the preceding 12 months (7). Participation inYRBS was voluntary, anonymous, and required parental per-mission. Students completed a self-administered booklet con-sisting of 95 items and recorded responses directly on acomputer-scannable answer sheet. The data were weighted tobe representative of students in grades 9–12 in public andprivate schools in the United States.
The prevalence of reporting a suicide attempt among allstudents was 8.9% and the prevalence of involvement in anyphysical fight was 33.2%. Overall, 5.3% of the studentsreported both attempting suicide and participating in a fight(females, 6.0%; males, 4.5%). Logistic regression analyses wereused to test whether the prevalence of fighting differed bysuicide attempt status within each demographic population.Students who reported attempting suicide were more likely tohave been in a physical fight than students who reported notattempting suicide (61.5% versus 30.3%). Results from the
stratified models indicated an association between attempt-ing suicide and fighting for each demographic population(Table). Higher proportions of both male and female suicideattempters (77.8% and 54.0%, respectively) reported fight-ing than males and females who had not attempted suicide(41.2% and 19.8%, respectively). Among those who reportedattempting suicide, the proportion who reported fighting washighest among 9th graders (64.5%) and decreased with eachsubsequent grade.Reported by: MH Swahn, PhD, KM Lubell, PhD, TR Simon, PhD,Div of Violence Prevention, National Center for Injury Prevention andControl, CDC.
Editorial Note: The findings of this analysis indicate that onein 20 high school students reported both suicide attempts andparticipation in physical fighting in the preceding year. More-over, the majority (61.5%) of those students who attemptedsuicide also reported physical fighting, compared with less thanone third (30.3%) of those who had not attempted suicide.This analysis extends earlier study (2–6) of the link betweensuicidal behavior and interpersonal violence by documentingthe strength of the association across demographic popula-tions. The findings indicate that suicide attempt status was
TABLE. Number* and odds ratio (OR) for student participation in physical fighting, by suicide attempt status and demographicpopulation† — Youth Risk Behavior Survey, United States, 2001
Reported not attempting suicide Reported attempting suicideParticipated Participated
Demographic in fighting in fightingpopulation No. No. (%)§ OR (95% CI¶) No. No. (%)§ OR (95% CI)
SexMale 5,289 2,128 (41.2) 1 332 243 (77.8) 5.0 (3.6–7.0)Female 5,453 1,128 (19.8) 1 711 369 (54.0) 4.8 (4.1–5.6)
Grade9th 2,536 916 (36.6) 1 304 193 (64.5) 3.1 (2.4–4.1)10th 2,646 843 (31.3) 1 290 175 (64.1) 3.9 (3.0–5.1)11th 2,773 767 (26.6) 1 261 140 (56.2) 3.5 (2.4–5.1)12th 2,762 716 (24.8) 1 180 94 (53.7) 3.5 (2.4–5.2)
Race/EthnicityBlack** 1,847 613 (33.8) 1 164 96 (60.7) 3.0 (2.3–4.0)Hispanic 2,205 683 (32.4) 1 279 154 (58.2) 2.9 (2.2–3.8)Other 1,126 358 (32.5) 1 162 90 (57.8) 2.8 (1.9–4.3)White** 5,438 1,570 (29.4) 1 433 269 (63.5) 4.2 (3.3–5.3)
ResidenceUrban 3,784 1,244 (34.6) 1 428 239 (61.4) 3.0 (2.1–4.3)Suburban 5,847 1,699 (28.2) 1 523 320 (62.2) 4.2 (3.4–5.1)Rural 1,057 308 (30.8) 1 95 55 (59.4) 3.3 (2.2–5.0)
Total†† 10,764 3,263 (30.3) 1 1,051 616 (61.5) 3.7 (3.1–4.3)
* Numbers are crude and do not generate the weighted percentages.†
Data are from participants who completed questions about whether they had attempted suicide and whether they had been involved in physical fighting(N = 11,815).
§Percentages are calculated by using populations weighted to be representative of students in grades 9–12 in public and private schools in the UnitedStates.
¶OR and confidence interval (CI) were computed by using logistic regression analyses to predict fighting by suicide attempt status within each demographicpopulation.
** Non-Hispanic.††
Numbers do not add to total because of missing data.

476 MMWR June 11, 2004
associated with involvement in physical fighting for both malesand females; students in grades 9–12; four racial/ethnic popu-lations; and youths living in urban, suburban, and rural areas.
The observed association between suicide attempts and fight-ing across demographic populations suggests that violence pre-vention programs directed at reducing both suicide andfighting are likely to be relevant for youths. However, themechanisms linking suicidal behavior and interpersonal vio-lence are unclear; these results do not permit an assessment ofthe extent to which suicidal and fighting behaviors aredirectly associated or the direction of the association. The twobehaviors might be linked because they share common riskfactors. Aggressiveness, impulsivity, substance abuse, depres-sion, and hopelessness can increase the risk for both suicidaland violent behaviors (8,9). Additional research is needed toexamine these and other factors to better determine theunderlying mechanisms that link suicidal and violent behav-iors as well as the overlap between multiple types of violentbehavior.
The findings in this report are subject to at least three limi-tations. First, all participants were high school students anddo not reflect the experiences of youths who have droppedout of school. Second, suicide attempts and fights were self-reported and therefore subject to reporting bias. Finally, thedata do not permit either an assessment of the temporalordering between suicide attempts and physical fights or adetermination of whether the two behaviors occurred withina narrower period during the preceding 12 months.
Prevention strategies to reduce both suicide attempts andfighting might be possible and advantageous to design. Strat-egies determined effective in reducing youth problem behav-iors (e.g., skill and competence-building programs, positiveyouth development, and parent training) (10) might reduceunderlying risks and provide the skills and support studentsneed to avoid fighting and suicidal behavior. Additionalresearch is needed to determine whether strategies that reduceyouth risk for interpersonal violence also can be implementedto prevent suicidal behavior.References1. CDC. Web-based Injury Statistics Query and Reporting System
(WISQARS™). Atlanta, Georgia: U.S. Department of Health andHuman Services, CDC, National Center for Injury Prevention andControl, 2004. Available at http://www.cdc.gov/ncipc/wisqars.
2. Vossekuil B, Fein R, Reddy M, Borum R, Modzeleski W. Final reportand findings of the safe school initiative: implications for the preven-tion of school attacks in the United States. Washington, DC: U.S.Department of Education, Office of Elementary and Secondary Edu-cation, Safe and Drug-Free Schools Program, and U.S. Secret Service,National Threat Assessment Center, 2002.
3. Anderson M, Kaufman J, Simon TR, et al. School associated violentdeaths in the United States, 1994–1999. JAMA 2001;286:2695–702.
4. Flannery DJ, Singer MI, Wester K. Violence exposure, psychologicaltrauma, and suicide risk in a community sample of dangerouslyviolent adolescents. J Am Acad Child Adolesc Psychiatry 2001;40:435–42.
5. Borowsky IW, Ireland M, Resnick MD. Adolescent suicide attempts:risks and protectors. Pediatrics 2001;107:485–93.
6. Cleary SD. Adolescent victimization and associated suicidal andviolent behaviors. Adolescence 2000;35:671–82.
7. Grunbaum JA, Kann L, Kinchen SA. Youth risk behavior surveillance—United States, 2001. In: CDC Surveillance Summaries (June 28).MMWR 2002;51(No. SS-4):340–6.
8. Plutchik R. Outward and inward directed aggressiveness: the interac-tion between violence and suicidality. Pharmacopsychiatry1995;28(suppl 2):47–57.
9. Trezza GR, Popp SM. The substance user at risk of harm to self orothers: assessment and treatment issues. J Clin Psychol 2000;56:1193–205.
10. U.S. Department of Health and Human Services, et al. Youth Vio-lence: A Report of the Surgeon General. Rockville, Maryland: U.S.Department of Health and Human Services, CDC, National Centerfor Injury Prevention and Control, 2001.
School-Associated Suicides —United States, 1994–1999
During 1994–1999, at least 126 students carried out ahomicide or suicide that was associated with a private or pub-lic school in the United States (1). Although previous researchhas described students who commit school-associated homi-cides, little is known about student victims of suicide. Todescribe the psychosocial and behavioral characteristics ofschool-associated suicide victims, CDC analyzed data fromschool and police officials. The results of that analysis indi-cated that, among the 126 students who carried out school-associated homicides or suicides, 28 (22%) died by suicide,including eight who intentionally injured someone else im-mediately before killing themselves. Two (7%) of the suicidevictims were reported for fighting and four (14%) for disobe-dient behavior in the year preceding their deaths; none wereassociated with a gang. However, potential indicators of sui-cide risk such as expressions of suicidal thoughts, recent socialstressors, and substance use were common among the victims.These findings underscore the need for school staff to learn torecognize and respond to chronic and situational risk factorsfor suicide.
Included in this analysis were suicides for which the victimwas an elementary or secondary school student and the deathoccurred during July 1, 1994–June 30, 1999, in one of thefollowing settings: 1) on the grounds of an operating publicor private elementary or secondary school in the United States,2) while the victim was en route to or from regular schoolsessions, or 3) while the victim was attending or traveling to

Vol. 53 / No. 22 MMWR 477
or from an official school-sponsored event. Cases of school-associated suicide were identified through a systematic searchof two computerized newspaper and broadcast media data-bases (i.e., Lexis-Nexis and Dialog). Data on the victims werecollected through structured and standardized interviews withschool and police officials and by reviewing police reports.
The 28 school-associated suicide victims included four stu-dents who first committed homicide and four other studentswho first inflicted nonfatal injuries on others. Among the sui-cide victims, 22 (78%) were males, 22 (78%) were non-Hispanic whites, and 17 (60%) lived with two parents (Table).Twenty-six (93%) of the suicide victims used firearms.
Eleven (39%) students were reported to be weekly users ofalcohol or drugs, and five (18%) were reported intoxicated atthe time of their suicides. Six (21%) of the students had ahistory of criminal charges; four (14%) had been reported fordisobedience; two (7%) had been reported for fighting withpeers; and no student was a known gang member. The major-ity (61%) of the students were involved in extracurricularactivities. A total of 16 (57%) of the students had expressedsuicidal thoughts, including 10 who confided in a peer. Eight(29%) students had experienced a romantic breakup and nine(32%) a household disruption such as moving or having ahousehold member move out.Reported by: J Kaufman, PhD, Dept of Sociology, Univ of Miami,Florida. W Modzeleski, MS, Office of Safe and Drug Free SchoolsProgram, U.S. Dept of Education. T Feucht, PhD, National Instituteof Justice, U.S. Dept of Justice. TR Simon, PhD, M Anderson, MD,K Shaw, MPH, I Arias, PhD, Div of Violence Prevention, NationalCenter for Injury Prevention and Control; L Barrios, DrPH, Div of
Adolescent and School Health, National Center for Chronic DiseasePrevention and Health Promotion, CDC.
Editorial Note: The need for safe schools has prompted con-siderable interest in understanding and preventing all types oflethal school-associated violence. The finding that 22% of stu-dents who carried out such violence took their own lives indi-cates that a sizeable proportion of lethal school-associatedviolence was self-directed. In addition, the finding thatapproximately one in four suicide victims injured or killedsomeone else immediately before their suicide suggests an over-lap between risk for committing school-associated homicideand risk for suicide. Efforts to prevent incidents of lethalschool-associated violence should address youth suicidalideation and behavior.
Suicide-prevention efforts are needed not only to addressthe risk for school-associated violence, but also to reduce themuch larger problem of self-directed violence among adoles-cents overall. In 2001, suicide was the third leading cause ofdeath in the United States among youths aged 13–18 years,accounting for 11% of deaths in this age group (2). In 2003,approximately one in 12 high school students in the UnitedStates reported attempting suicide during the preceding 12months (3). Data from Oregon indicate that approximately5% of adolescents treated in hospitals for injuries from asuicide attempt made that attempt at school (4).
The finding that the majority of students who were school-associated suicide victims were involved in extracurricularactivities suggests that these students could be familiar to schoolstaff who might recognize warning signs. Although these stu-dents were unlikely to stand out (e.g., by fighting or involve-ment in gangs) in the manner of those who commitschool-associated homicides (1), other established risk factorsfor suicidal behavior were common (e.g., expression of sui-cidal thoughts, recent household move, and romanticbreakup). These findings support the need for school-basedefforts to identify and assist students who describe suicidalthoughts or have difficulty coping with social stressors. School-based prevention efforts are likely to benefit from school offi-cials working closely with community mental healthprofessionals to enhance the abilities of school counselors,teachers, nurses, and administrators to recognize and respondto risk factors for suicide. CDC’s School Health Guidelinesrecommend that school personnel be provided with regularstaff development opportunities to prepare them to help pre-vent suicide (5). In 2000, only 15% of required health educa-tion courses were taught by teachers who received staffdevelopment on suicide prevention during the preceding 2years, suggesting that additional opportunities for staff devel-opment are needed (6).
TABLE. Number* and percentage of student victims of school-associated suicide, by selected characteristics† — UnitedStates, 1994–1999Characteristic No. (%)
Weekly alcohol or drug use 11 (39)Intoxicated at time of event 5 (18)History of criminal charges 6 (21)Reported for disobedience§ 4 (14)Reported for fighting peers§ 2 (7)Gang member 0 (0)Bullied by peers§ 4 (14)Involved in extracurricular activities 17 (61)Expressed suicidal thoughts/behavior§ 16 (57)Expressed suicidal thoughts to a peer§ 10 (36)Received school-sponsored psychological counseling§ 7 (25)Treated for depression§ 6 (21)Experienced a romantic breakup§ 8 (29)Family moved or anyone in household moved out§ 9 (32)Suspected family history of child abuse or neglect 6 (21)
* N = 28.†
Certain data were unknown for certain students. Percentages reflect theproportion of suicide victims who were reported to have the specific char-acteristic.
§During the 12 months preceding suicide.

478 MMWR June 11, 2004
The findings that one in four of the school-associated sui-cides were preceded by a recent romantic breakup and nearlyone in five suicide victims were under the influence of drugsor alcohol at the time of their deaths underscore the potentialimportance of situational risk factors. Youth suicidal behavioroften is an impulsive response to circumstances rather than awish to die (7). Efforts to help students cope with stressorsand avoid substance abuse are important elements of suicide-prevention strategies (8).
The findings in this report are subject to at least four limi-tations. First, because events were identified from news mediareports, any event not reported in the media was excluded;the nature of the events might have resulted in an undercountof the number of school-associated suicides. Second, certainestimates might be unstable because of the small cell sizes.Third, the data are from secondary sources and are subject torecall error or bias; the nature of these events might have in-fluenced responses. Finally, the number of school-associatedsuicide victims reported with each characteristic might beundercounted, and the percentages of students with thesecharacteristics might not be representative of all students whodied by suicide during 1994–1999.
Prevention of youth suicide is a critical public health prior-ity. The findings in this report underscore the need to“develop and implement safe and effective programs in edu-cational settings for youth that address adolescent distress, crisisintervention and incorporate peer support for seeking help”as described in the Surgeon General’s Call to Action to PreventSuicide, 1999 (8).References1. Anderson M, Kaufman J, Simon TR, et al. School-associated violent
deaths in the United States, 1994–1999. JAMA 2001;286:2695–702.2. CDC. Web-based Injury Statistics Query and Reporting System
(WISQARS™). Atlanta, Georgia: U.S. Department of Health andHuman Services, CDC, National Center for Injury Prevention andControl, 2004. Available at http://www.cdc.gov/ncipc/wisqars.
3. CDC. Youth Risk Behavior Surveillance—United States, 2003. In: CDCSurveillance Summaries (May 21). MMWR 2004;53(No. SS-2).
4. CDC. Fatal and nonfatal suicide attempts among adolescents—Oregon,1988–1993. MMWR 1995;44:321–3.
5. CDC. School health guidelines to prevent unintentional injury andviolence. MMWR 2001;50(No. RR-22).
6. Kann L, Brener ND, Allensworth DD. Health education: results fromthe School Health Policies and Programs Study 2000. J Sch Health2001;71:266–78.
7. Smith K, Crawford S. Suicidal behavior among “normal” high schoolstudents. Suicide Life Threat Behav 1986;16:313–25.
8. U.S. Public Health Service. The Surgeon General’s Call to Action toPrevent Suicide. Washington, DC: U.S. Public Health Service, 1999.
Suicide Among Hispanics —United States, 1997–2001
By 2020, Hispanics are expected to represent 17% of theU.S. population and to surpass all other racial/ethnic minor-ity populations in size (1). In 1996, the U.S. Department ofHealth and Human Services established the Hispanic Agendafor Action initiative; a major goal of this initiative is to iden-tify health problems that affect Hispanics (2). In 2001,although the overall age-adjusted suicide rate per 100,000population among Hispanics (5.6) was lower than the U.S.national rate (10.7), suicide was the third leading cause ofdeath among young (i.e., aged 10–24 years) Hispanics andthe seventh leading cause of years of potential life lost beforeage 75 years (3). To identify demographic groups at risk forsuicide and to help guide prevention efforts, CDC analyzedmortality data for 1997–2001. This report summarizes theresults of that analysis, which indicated that, among Hispan-ics, the largest proportion of suicides occurred among youngpersons; suicide rates were higher among males; and the mostcommon method of suicide was by firearms. To reduce thenumber of suicides, additional prevention strategies areneeded, including 1) improving methods for collecting dataabout suicides, suicide attempts, and related behaviors; 2)expanding evaluation of prevention efforts aimed at reducingsuicidal behaviors; and 3) examining how effective interven-tions can be modified for diverse and culturally specificpopulations.
Data were obtained from CDC’s National Center for HealthStatistics Underlying Cause of Death Mortality file (3). His-panic ethnicity included persons of Mexican, Puerto Rican,Cuban, Central and South American, and other/unknown His-panic origins* (1). Data for 1997–1998 and 1999–2001 werebased on External Cause of Injury codes from the Interna-tional Classification of Diseases, Ninth (ICD-9)† and Tenth(ICD-10)§ Revisions, respectively (4).
Suicide data for 1997–2001 were examined for the His-panic population by sex, age group, and subpopulation. Sui-cide data for the most recent 3-year period available(1999–2001) also were examined by the three leading suicidemethods: firearms (X72–X74), suffocation (X70), and poi-soning (X60–X69). Population estimates for 1997–2001 fromthe U.S. Census bridged-race population estimates were used
* Central American: Costa Rican, Guatemalan, Honduran, Nicaraguan,Panamanian, Salvadoran, and other Central American (excludes Mexican);South American: Argentinean, Bolivian, Chilean, Colombian, Ecuadorian,Paraguayan, Peruvian, Uruguayan, Venezuelan, and other South American;and other/unknown Hispanic origin: Dominican (Dominican Republic),Spaniard, and all other Hispanic or Latino.
† Codes E950–E959 for 1997–1998.§ Codes X60–X84, Y87.0, and U03 for 1999–2001.

Vol. 53 / No. 22 MMWR 479
to calculate rates (5). The intercensal estimates used for 1997–1999 take into account the increase observed in this popula-tion between Census 1990 and Census 2000. Age-adjustedrates per 100,000 population were calculated on the basis ofthe 2000 U.S. standard population. Rates based on <20 deathsor with a coefficient of variation of >30% were consideredunstable and therefore not reported.
During 1997–2001, a total of 8,744 Hispanics (age-adjustedrate: 5.95 per 100,000 population) died from suicide; 7,439(85%) were males. The age-adjusted rate for males was 5.9times the rate for females (10.46 versus 1.78, respectively).Approximately 50% of all suicides occurred among personsaged 10–34 years, although the highest overall rate was amongpersons aged >85 years (Table 1). For Hispanic males, thesuicide rate was highest among those aged >85 years, followedby those aged 80–84 years and those aged 75–79 years (36.54versus 31.55 and 21.69, respectively). For Hispanic females,rates were highest among those aged 50–54 years, followed bythose aged 45–49 years and those aged 15–19 years (3.12 ver-sus 2.52 and 2.36, respectively). Persons of Mexican originaccounted for the majority of suicides (4,934 [56%]), fol-lowed by persons of other/unknown Hispanic origin (1,219[14%]), Central and South Americans (950 [11%]), PuertoRicans (932 [11%]), and Cubans (709 [8%]). Although ratescould not be calculated for these subpopulations, the distri-
bution of suicide was similar to the proportionate distribu-tion of the U.S. Hispanic population by subpopulation (1).
During 1999–2001, a total of 5,332 Hispanics died fromsuicide; 4,531 (85%) were males. Firearms were the suicidemethod reported most frequently (2,405 [45%]), followed bysuffocation (1,834 [34%]) and poisoning (542 [10%])(Table 2). Among Hispanic males, firearms were the most com-mon suicide method (48%), followed by suffocation (35%)and poisoning (7%). In contrast, Hispanic females used fire-arms (29%), suffocation (29%), and poisoning (27%) eachin similar frequency. Among Hispanic males aged 10–24 years(n = 1,135), firearms accounted for 52% of all suicides, fol-lowed by suffocation (38%) and poisoning (3%), whereasamong females in the same age group (n = 211), suffocationaccounted for 44% of all suicides, followed by firearms (33%)and poisoning (11%).Reported by: RM Ikeda, MD, A Crosby, MD, Div of ViolencePrevention; RG Thomas, MSIM, JL Annest, PhD, Office of Statisticsand Programming, National Center for Injury Prevention and Control;SI Berrios-Torres, MD, EIS Officer, CDC.
Editorial Note: This report highlights the magnitude anddemographics of Hispanic suicides, which occurred predomi-nantly among males. Overall, firearms were the most frequentlyreported method used, although suffocation also wascommon among males and females.
TABLE 1. Number and crude rate (CR)* of Hispanic suicides†, by sex and age group — United States, 1997–2001Age group Male Female Total(yrs) No. CR (95% CI§) No. CR (95% CI) No. CR (95% CI)
0–4 0 —¶ — 0 — — 0 — —5–9 4 — — 0 — — 4 — —
10–14 98 1.27 (1.02–1.52) 45 0.61 (0.43–0.79) 143 0.94 (0.79–1.10)15–19 732 9.11 (8.45–9.77) 168 2.36 (2.00–2.71) 900 5.94 (5.55–6.32)20–24 1,102 12.49 (11.75–13.22) 144 1.97 (1.65–2.29) 1,246 7.72 (7.29–8.15)25–29 1,021 11.52 (10.81–12.23) 145 1.93 (1.62–2.24) 1,166 7.12 (6.71–7.53)30–34 899 10.94 (10.23–11.66) 145 2.02 (1.69–2.34) 1,044 6.78 (6.37–7.19)35–39 870 12.23 (11.41–13.04) 149 2.28 (1.92–2.65) 1,019 7.47 (7.01–7.93)40–44 701 12.42 (11.50–13.34) 118 2.18 (1.79–2.57) 819 7.41 (6.90–7.91)45–49 491 11.64 (10.61–12.67) 107 2.52 (2.04–3.00) 598 7.07 (6.50–7.64)50–54 369 11.75 (10.55–12.95) 103 3.12 (2.52–3.72) 472 7.33 (6.67–7.99)55–59 258 11.78 (10.35–13.22) 52 2.15 (1.57–2.73) 310 6.73 (5.98–7.48)60–64 192 11.44 (9.82–13.06) 31 1.60 (1.03–2.16) 223 6.16 (5.35–6.97)65–69 199 15.18 (13.07–17.29) 24 1.48 (0.89–2.08) 223 7.61 (6.62–8.61)70–74 164 16.57 (14.03–19.10) 30 2.30 (1.48–3.12) 194 8.45 (7.26–9.64)75–79 139 21.69 (18.09–25.30) 21 2.30 (1.32–3.28) 160 10.29 (8.70–11.89)80–84 104 31.55 (25.49–37.61) 13 — — 117 13.31 (10.90–15.72)
>85 87 36.54 (28.86–44.22) 10 — — 97 13.35 (10.69–16.01)Unknown 9 — — 0 — — 9 — —
Total 7,439 8.53 (8.33–8.72) 1,305 1.58 (1.50–1.67) 8,744 5.15 (5.04–5.26)
* Per 100,000 population.†
International Classification of Diseases, Ninth Revision (ICD–9) codes E950–E959 and International Classification of Diseases, Tenth Revision (ICD–10)codes X60–X84, Y87.0, and U03.
§Confidence interval.
¶Rates based on <20 deaths or with a coefficient of variation of >30% were considered unstable and therefore not reported.

480 MMWR June 11, 2004
The findings in this report are subject to at least five limita-tions. First, because reporting of Hispanic ethnicity by all 50states and the District of Columbia has been in effect onlysince 1997, the years for which complete data are available arelimited. Second, although Census 2000 was the first toinclude a separate question on Hispanic origin in theCommonwealth of Puerto Rico, national statistics do notinclude its 3.4 million Hispanic residents (1). Third, during1997–2001, rates could not be compared by geographic loca-tion because a large percentage (17 [33%]) of states hadunstable rates. Fourth, unavailability of comparability ratiosfor individual method of suicide at the time of analysis pre-cluded the ability to perform trend analysis or combine 1997–1998 and 1999–2001 data to examine further certainsubcategories, such as mechanism of injury (6). Finally, nu-merator data on suicides by Hispanic subpopulations are avail-able, but the corresponding denominator data are not availableusing the bridged-race population estimates, which precludedcalculating age-adjusted rates or comparing rates betweensubpopulations.
Although higher suicide rates were among older males,young Hispanics also are at risk. Hispanic youth are the fast-est-growing segment of the U.S. population, accounting for48% of the total Hispanic population and 26% of Hispanicsuicides (versus 2% and 4% for Hispanics aged >75 years,respectively). Hispanics in grades 9–12, particularly females,report more feelings of sadness or hopelessness and of suicidal
TABLE 2. Number of Hispanic suicides*, by method of death, sex, and age group — United States, 1999–2001Male Female Total†
Age group (n = 4,531) (n = 801) (N = 5,332)(yrs) Firearm Suffocation Poisoning Firearm Suffocation Poisoning Firearm Suffocation Poisoning
0–4 0 0 0 0 0 0 0 0 05–9 0 2 0 0 0 0 0 2 0
10–14 18 46 1 7 18 1 25 64 215–19 217 169 11 32 45 13 249 214 2420–24 356 217 25 31 29 10 387 246 3525–29 304 209 37 33 30 20 337 239 5730–34 228 216 40 22 25 29 250 241 6935–39 201 213 69 30 22 30 231 235 9940–44 178 158 47 18 20 27 196 178 7445–49 164 101 36 26 9 29 190 110 6550–54 113 70 22 19 14 23 132 84 4555–59 85 43 15 4 6 14 89 49 2960–64 63 36 5 2 5 6 65 41 1165–69 68 26 10 4 2 2 72 28 1270–74 57 30 2 2 5 6 59 35 875–79 51 19 4 1 1 5 52 20 980–84 39 21 2 1 3 0 40 24 2
>85 28 22 0 0 1 0 28 23 0Unknown 3 1 1 0 0 0 3 1 1Total 2,173 1,599 327 232 235 215 2,405 1,834 542
* International Classification of Diseases, Tenth Revision (ICD–10) code: firearms (X72–X74), suffocation (X70), and poisoning (X60–X69).†
Includes methods of suicides presented and all other methods.
ideation and attempt, compared with their white or black non-Hispanic counterparts (7). Higher prevalence of these risk fac-tors for suicidal behavior from previous studies and the highincidence of suicide among Hispanic youth reported in thisstudy suggest that Hispanic youth should be targeted for self-harm prevention efforts. To intervene and prevent suicide suc-cessfully, organizations should apply the knowledge gainedfrom studies on risk and protective factors.
Risk- and protective-factor research focusing on Hispanicyouth is limited. However, mental illness, substance abuse,acculturative stress, family dysfunction, and lower socioeco-nomic status have been associated with increased risk for sui-cidal behavior, and family support has been shown protectiveagainst suicidal behavior (8). Additional data are needed forcomparison before definitive statements about similarities ordifferences across racial/ethnic categories and among Hispanicsubpopulations can be made. Data about specific risk andprotective factors in the Hispanic population (e.g., the effectsof physical and mental health, immigration, acculturation,religious beliefs, substance abuse, and access to health care)also are necessary to develop culturally appropriate preven-tion and treatment programs. For example, one study focusedon a predominantly Hispanic group of patients evaluated forsuicide attempts in a hospital emergency department (9). Inthat study, staff training, outpatient therapy, family therapy,and a video explaining the treatment resulted in lower rates ofsuicide reattempts and suicidal reideation (9).

Vol. 53 / No. 22 MMWR 481
To reduce the number of suicides, additional preventionstrategies are needed, including 1) improving methods for col-lecting data about suicides, attempted suicides, and relatedbehaviors; 2) expanding evaluation of prevention efforts aimedat reducing suicidal behaviors; and 3) examining how effec-tive interventions can be modified for diverse and culturallydistinct populations. Effective suicide-prevention strategiesneed not be specific to suicide, but can address factors that areassociated but not unique to suicidal behavior. A comprehen-sive, strategic plan for suicide prevention should include mul-tiple points for prevention, maximizing the likelihood ofreaching persons in need. The National Strategy for SuicidePrevention, developed in collaboration with multiple federal,state, academic, and community partners, provides a frame-work for action to prevent suicide (10).
AcknowledgmentsThis report is based in part on data provided by D White, MS, K
Webb, Office of Statistics and Programming, National Center forInjury Prevention and Control, CDC.
References1. Cheeseman Day J. U.S. Census Bureau, Population Projections of the
United States by Age, Sex, Race, and Hispanic origin: 1995 to 2050,Current Population Reports, P25-1130, Washington, DC: U.S.Government Printing Office, 1996.
2. Office of Minority Health. The Secretary’s Hispanic Initiative: “His-panic Agenda for Action: Improving Services to Hispanic Americans.”Available at http://www.haa.omhrc.gov/HAA2pg/AboutHAA1e.htm.
3. National Center for Health Statistics. Vital statistics mortality data,underlying cause of death, 1997–2001. Hyattsville, Maryland: U.S.Department of Health and Human Services, Public Health Service,CDC, 2001.
4. National Center for Health Statistics. Recommended ICD-9 and ICD-10 frameworks for presenting injury mortality data. Available athttp://www.cdc.gov/nchs/about/otheract/ice/projects.htm.
5. National Center for Health Statistics. U.S. Census populations withbridged race categories. Available at http://www.cdc.gov/nchs/about/major/dvs/popbridge/popbridge.htm.
6. Anderson RN, Minino AM, Hoyert DL, Rosenberg, HM. Compara-bility of cause of death between ICD-9 and ICD-10: preliminary esti-mates. Hyattsville, Maryland: U.S. Department of Health and HumanServices, CDC, National Center for Health Statistics, 2001 (NatlVital Stat Rep; vol. 49, no. 2).
7. Grunbaum JA, Kann L, Kinchen S, et al. Youth risk behavior surveil-lance—United States, 2003. In: CDC Surveillance Summaries (May21). MMWR 2004;53(No. SS-2).
8. Range LM, Leach MM, McIntyre D, et al. Multicultural perspectiveson suicide. Aggression and Violent Behavior 1999;4:413–30.
9. Rotheram-Borus MJ, Piacentini J, Cantwell C, Belin TR, Song J. The18-month impact of an emergency room intervention for adolescentfemale suicide attempters. J Consult Clin Psychol 2000;68:1081–93.
10. U.S. Public Health Service. National strategy for suicide prevention:goals and objectives for action. Washington, DC: U.S. Department ofHealth and Human Services, 2001.
Suicide and Attempted Suicide —China, 1990–2002
Suicide is the fifth leading cause of death overall in Chinaand the leading cause of death in persons aged 15–34 years(1). During 1995–1999, approximately 287,000 persons diedeach year from suicide, a national rate of 23 per 100,000 popu-lation (1). In addition, an estimated 2 million suicide attemptsoccur each year (2). To characterize suicides and attemptedsuicides in China, analyses were conducted of 1) a psycho-logical autopsy study comparing suicides with other injurydeaths and 2) three studies of attempted suicides. This reportsummarizes the results of these analyses, which indicated that58% of China’s suicides were caused by ingesting pesticide,91% of suicide victims had never visited a mental health pro-fessional, and 45% of suicide attempts were impulsive actsperformed after considering suicide for <10 minutes. Toreduce suicides and suicide attempts, prevention strategiesdirected at disrupting patterns of suicidal behavior should beimplemented in China.
Information about 895 persons who died from suicide (i.e.,cases) and 701 who died from other injuries (i.e., controls)was obtained from a national case-control psychologicalautopsy study (which collected information about the psy-chological state of the deceased and risk factors for suicide)conducted during 1996–2000 by Beijing Hui Long GuanHospital and the Chinese Center for Disease Control andPrevention (3). The selected sample initially totaled 1,854persons; 258 persons were excluded for various reasons (e.g.,persons were aged <10 years or appropriate family membersdeclined to participate or could not be located), and 29 addi-tional persons were not included in the logistic regression analy-sis because data were missing on one or more variables. Deathsattributed to suicide and other injuries were investigated atthree urban and 20 rural disease surveillance points (DSPs),selected to be geographically representative of the 145 DSPsin the national surveillance system. Data regarding demograph-ics of the decedents, potential risk factors for suicide, andmethods of suicide were provided by family members and otherassociates in two independent interviews. The median timefrom death to interview was 11 months (range: 8–14 months).Both backward and forward inclusion of variables in uncon-ditional logistic regression equations were used to identify themost stable model of risk factors for suicide. Age, sex, andlocation of residence were considered known risk factors forsuicide in China; all odds ratios were adjusted to account forthese variables. Details of these methods have beendescribed previously (3).

482 MMWR June 11, 2004
Information about attempted suicides was collected from aretrospective study of all reported suicide attempters (approxi-mately 15,000 persons), based on review of emergencydepartment records at 24 hospitals in northern China during1990–2002. In addition, demographic and risk factor infor-mation was collected from two case-control studies of 635subjects treated for serious suicide attempts (i.e., requiring>6 hours of hospitalization), identified from a total of 1,450suicide attempters treated in nine general hospitals primarilyserving rural populations of northern China during 1998–2002.
SuicidesIn the psychological autopsy study, among the 895 suicide
victims, the median age was 42 years (range: 12–94 years);49% (441) were female; 63% (563) suffered from a mental
illness*; 27% (239) had made previous suicide attempts; 47%(414) had relatives, friends, or associates with a history of sui-cidal behavior; and 9% (77) had visited a mental health pro-fessional at any time in their lives. The most common negativelife events in the year before death were financial problems,40% (358); serious physical illness, 38% (341); and maritalconflict, 35% (310). A total of 58% (517) of the suicidevictims died by ingesting pesticide or rat poison; of these per-sons, 62% (320 of 517) received unsuccessful medical resus-citation before death, and 70% (344 of 494) used pesticidesstored in the home, usually in an unlocked cupboard.
Results of the unconditional logistic regression analysis iden-tified 10 independent risk factors for suicide (Table). Among
* Based on results of a standardized instrument using criteria of the Diagnosticand Statistical Manual of Mental Disorders (DSM-IV).
TABLE. Multivariate model* of risk for suicide comparing 882 persons who died from suicide with 685 persons who died from othertypes of injuries†, by risk factor — psychological autopsy study, China, 1996–2000
Deaths bySuicides other injuries
Risk factor No. (%) No. (%) AOR§ (95% CI¶)
Severity of depression during 2 weeks preceding death (range: 0–100)0 308 (34.9) 616 (89.9) 1.01–25.4 255 (28.9) 60 (8.8) 6.4 (4.4–9.3)>25.4 319 (36.2) 9 (1.3) 41.1 (19.5–86.7)
Previous suicide attempt 235 (26.6) 7 (1.0) 21.5 (7.7–60.2)Acute stress score at time of death
Lowest tertile 101 (11.5) 415 (60.6) 1.0Middle tertile 336 (38.1) 189 (27.6) 3.4 (2.5–4.7)Highest tertile 445 (50.5) 81 (11.8) 11.8 (6.5–21.7)
Quality of life score during month preceding death (range: 0–100)High tertile (>67.0) 104 (11.8) 395 (57.7) 1.0Middle tertile (52.5–67.0) 309 (35.0) 208 (30.4) 2.6 (1.9–3.5)Low tertile (<52.5) 469 (53.2) 82 (12.0) 6.7 (3.7–12.2)
Severe life event during 2 days preceding death 224 (25.4) 23 (3.4) 6.1 (3.1–11.8)Chronic stress score during year preceding death
Lowest tertile 125 (14.2) 386 (56.4) 1.0Middle tertile 322 (36.5) 212 (30.9) 2.1 (1.6–2.7)Highest tertile 435 (49.3) 87 (12.7) 4.3 (2.5–7.6)
Friends or associates had suicidal behavior 334 (37.9) 138 (20.1) 2.9 (1.8–4.6)Relative had suicidal behavior 154 (17.5) 37 (5.4) 2.3 (1.2–4.3)Employment status
Wage earner or student 149 (16.9) 280 (40.9) 1.0Homemaker, retiree, or unemployed 210 (23.8) 86 (12.6) 2.0 (1.0–3.9)Agricultural laborer 523 (59.3) 319 (46.6) 2.0 (1.2–3.5)
Social activities outside of home during month preceding deathVery frequent 282 (32.0) 391 (57.1) 1.0Often 159 (18.0) 98 (14.3) 1.2 (1.0–1.5)Infrequent 222 (25.2) 91 (13.3) 1.5 (1.1–2.2)None 219 (24.8) 105 (15.3) 1.9 (1.1–3.3)
* Nagelkerke R2 for the model is 0.79, and C statistic is 0.97.
† N = 1,567; a total of 29 decedents were excluded because data were missing on one or more risk factor.
§Adjusted odds ratio; adjusted for age (six levels), sex, location of residence (i.e., rural or urban), reporting surveillance point (23 sites), interaction term forage by sex, and other variables in the model. Except for age and employment status, the multilevel variables are fitted as linear variables.
¶Confidence interval.

Vol. 53 / No. 22 MMWR 483
the 1,567 persons who died from suicide and other injuries,suicide risk increased with exposure to multiple risk factors.One percent (two of 223) of persons with fewer than two riskfactors died from suicide; 20% (73 of 366) with two or threerisk factors died from suicide; 72% (379 of 524) with four orfive risk factors died from suicide; and 94% (428 of 454) withsix or more risk factors died from suicide.
Suicide AttemptsAmong 14,771 suicide attempters treated in 24 general
hospitals in northern China, females outnumbered males by2.5 to 1 (10,492 to 4,279), the median age was 29 years (range:10–97 years), and two thirds (9,676) of all attempters wereyoung adults aged 15–34 years. Approximately 90% (13,433of 14,771) of the attempts were by self-poisoning; 54% (7,973)of all attempts were by ingestion of medications (usually anti-anxiety agents or sleeping pills), 28% (4,103) by ingestion ofpesticides, and 9% (1,357) by ingestion of other toxins (e.g.,household cleaners). Among the 10,581 patients treated inhospitals that primarily serve rural or urban populations,ingestion of pesticides was four times more common amongpersons treated in rural hospitals (43%; 2,533 of 5,954) thanamong those treated in urban hospitals (10%; 457 of 4,627)(p<0.01), and 66% (1,667 of 2,533) of the pesticide self-poisonings treated in rural hospitals were among women.Often, the suicide attempts were impulsive; among 594 seri-ous suicide attempters treated in nine hospitals in northernChina, 45% (270) reported considering suicide for <10minutes before their attempts.Reported by: MR Phillips, MD, Beijing Suicide Research andPrevention Center, Beijing Hui Long Guan Hospital; G Yang, MD,Institute of Basic Medical Sciences, Chinese Academy of Medical Science,Peking Union Medical College, Beijing, China.
Editorial Note: This report characterizes suicides and suicideattempts in China, which are marked by a high proportion ofpesticide ingestion and infrequent previous treatment by men-tal health providers. The studies described in this report alsosupport the substantial roles of impulsive behavior and acutestressors in suicidal behavior in China. A previous compari-son of 164 impulsive suicide attempts (i.e., those in whichvictims reported considering suicide for <2 hours before theirattempts) and 142 nonimpulsive attempts determined thatimpulsive attempters were younger, were more likely to live inrural villages, had a better quality of life before the attempt,had less severe depressive symptoms, were less likely to have amental disorder, had less suicidal intent, and had more acuteprecipitating life events (5).
Similar to other countries, suicide attempts in China aremore common among women than men (6). However, in
China, especially in rural areas, a high proportion of suicideattempters ingest pesticide, and the resuscitating capabilitiesof local health-care providers are less than optimal. Therefore,self-inflicted injuries are more likely to result in death in ruralChina than in locations where less lethal suicide methods areused or where resuscitation services are more successful (7).These factors result in an overall increase in rural suicide ratesand a relative increase in female suicide rates.
The findings in this report are subject to at least three limi-tations. First, the psychological autopsy study might be sub-ject to bias by those providing information about the deceasedand the lack of blinding of the interviewer regarding cause ofdeath; however, data obtained by the study’s methods havebeen determined valid (8). Second, unlike the majority of psy-chological autopsy studies, this study used deceased personsrather than living persons as controls. The advantage of usingdeceased persons as controls is that information providers haveall experienced the recent death of a family member or associ-ate, but the disadvantage is that statistical methods arerequired to adjust for differences in age and sex distributions.Finally, the retrospective studies on attempted suicides werelimited to sites in northern China and did not include suicideattempts managed without hospital care or attemptsmisreported by the patient as unintentional.
To develop targeted prevention strategies, several efforts areunder way to improve surveillance and better understand thecharacteristics of suicidal behavior in China. Possible preven-tion activities include 1) restricting access to suicide means,particularly pesticides and toxic drugs, 2) expanding socialsupport networks for persons at high risk, 3) implementinghealth-promotion campaigns focused on mental health andsuicide, 4) improving health providers’ ability to recognizeand manage psychiatric problems associated with suicide, 5)instituting community-based screening programs to identifypersons at high risk, 6) expanding crisis support services andtargeted mental health services for persons at high risk, and 7)increasing the ability of primary care facilities to manage themedical complications of suicide attempts. Further develop-ment, implementation, and evaluation of these interventionswill require the participation and coordination of multipleministries (e.g., health, agriculture, education, public secu-rity, labor and welfare, broadcasting, and media) and organi-zations (e.g., Women’s Federation, Youth League, academicassociations, and funding organizations).
The Chinese government is considering development of anational suicide prevention plan (9). A workshop on the pro-posed plan held in Beijing in November 2003 included gov-ernment leaders, leaders of nongovernment organizations, andrepresentatives of international organizations. The consensus
484 MMWR June 11, 2004
of participants was that the State Council and local govern-ments in China should establish suicide-prevention committeeswith the responsibility and resources needed to develop, imple-ment, and monitor national, regional, and local suicide-prevention plans.References1. Phillips MR, Li X, Zhang Y. Suicide rates in China, 1995–99. Lancet
2002;359:835–40.2. Yin DK. Make concerted efforts in an earnest and forthright fashion to
comprehensively promote mental health work in the new century[Chinese]. Chin J Ment Health 2002;16:4–8.
3. Phillips MR, Yang G, Zhang Y, Wang L, Ji H, Zhou M. Risk factors forsuicide in China: a national case-control psychological autopsy study.Lancet 2002;360:1728–36.
4. First MB, Spitzer RL, Gibbon M, Williams JB. Structured ClinicalInterview for DSM-IV Axis I Disorders. New York, New York: Biomet-rics Research Department, New York State Psychiatric Institute, 1996.
5. Li XY, Phillips MR, Wang YP, et al. Comparison of impulsive and non-impulsive attempted suicide [Chinese]. Chin J Nerv Ment Dis2003;29:27–31.
6. Kerkhof AJ. Attempted suicide: patterns and trends. In: Hawton K, vanHeeringen K, eds. International Handbook of Suicide and AttemptedSuicide. Chichester, England: John Wiley and Sons, 2000:49–64.
7. Eddleston M, Phillips MR. Self poisoning with pesticides. BMJ2004;328:42–4.
8. Hawton K, Appleby L, Platt S, et al. The psychological autopsyapproach to studying suicide: a review of methodological issues.J Affect Disord 1998;50:269–76.
9. United Nations. Prevention of Suicide: Guidelines for the Formulationand Implementation of National Strategies. New York, New York: UnitedNations, 1996.
West Nile Virus Activity —United States, June 2–8, 2004
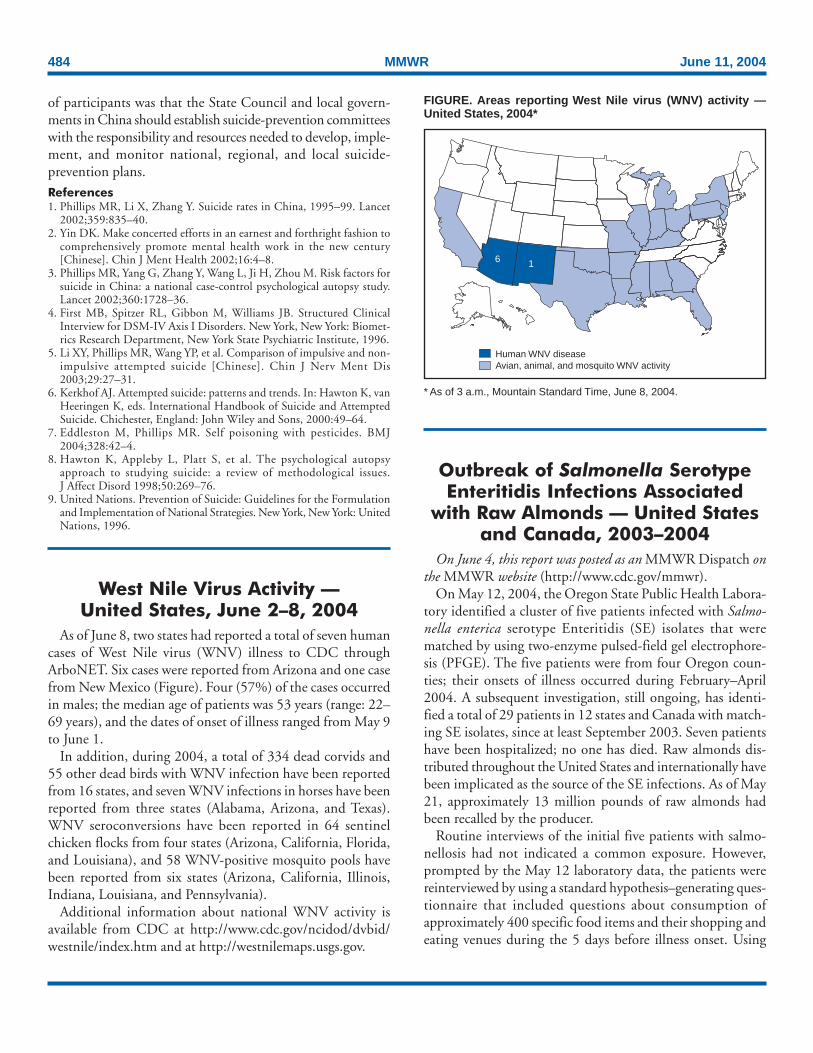
As of June 8, two states had reported a total of seven humancases of West Nile virus (WNV) illness to CDC throughArboNET. Six cases were reported from Arizona and one casefrom New Mexico (Figure). Four (57%) of the cases occurredin males; the median age of patients was 53 years (range: 22–69 years), and the dates of onset of illness ranged from May 9to June 1.
In addition, during 2004, a total of 334 dead corvids and55 other dead birds with WNV infection have been reportedfrom 16 states, and seven WNV infections in horses have beenreported from three states (Alabama, Arizona, and Texas).WNV seroconversions have been reported in 64 sentinelchicken flocks from four states (Arizona, California, Florida,and Louisiana), and 58 WNV-positive mosquito pools havebeen reported from six states (Arizona, California, Illinois,Indiana, Louisiana, and Pennsylvania).
Additional information about national WNV activity isavailable from CDC at http://www.cdc.gov/ncidod/dvbid/westnile/index.htm and at http://westnilemaps.usgs.gov.
Outbreak of Salmonella SerotypeEnteritidis Infections Associated
with Raw Almonds — United Statesand Canada, 2003–2004
On June 4, this report was posted as an MMWR Dispatch onthe MMWR website (http://www.cdc.gov/mmwr).
On May 12, 2004, the Oregon State Public Health Labora-tory identified a cluster of five patients infected with Salmo-nella enterica serotype Enteritidis (SE) isolates that werematched by using two-enzyme pulsed-field gel electrophore-sis (PFGE). The five patients were from four Oregon coun-ties; their onsets of illness occurred during February–April2004. A subsequent investigation, still ongoing, has identi-fied a total of 29 patients in 12 states and Canada with match-ing SE isolates, since at least September 2003. Seven patientshave been hospitalized; no one has died. Raw almonds dis-tributed throughout the United States and internationally havebeen implicated as the source of the SE infections. As of May21, approximately 13 million pounds of raw almonds hadbeen recalled by the producer.
Routine interviews of the initial five patients with salmo-nellosis had not indicated a common exposure. However,prompted by the May 12 laboratory data, the patients werereinterviewed by using a standard hypothesis–generating ques-tionnaire that included questions about consumption ofapproximately 400 specific food items and their shopping andeating venues during the 5 days before illness onset. Using
FIGURE. Areas reporting West Nile virus (WNV) activity —United States, 2004*
* As of 3 a.m., Mountain Standard Time, June 8, 2004.
Human WNV diseaseAvian, animal, and mosquito WNV activity
6 1

Vol. 53 / No. 22 MMWR 485
* Notice available at http://www.fda.gov/oc/po/firmrecalls/almonds.html.
binomial distribution, consumption rates for selected foodswere compared with background rates estimated from a 2002–2003 population-based survey of residents of Oregon (1).
The initial five patients from Oregon all reported consum-ing Kirkland Signature brand raw almonds, purchased atCostco warehouse stores. Survey data (1) indicated that anestimated 9% of Oregon residents (86 of 921 surveyed)consumed raw almonds from any source in the preceding week.Even assuming that 20% of all Oregon residents ate KirklandSignature brand raw almonds each week, the binomial prob-ability of finding five of five sporadic cases with that history is<0.001. No other foods or food sources were associated withillness.
After determining that the raw almonds were distributedwidely, U.S. and Canadian epidemiologists and state and fed-eral regulatory agencies were notified on May 13 via electronicinformation networks. Through PulseNet, the nationalmolecular subtyping network (2), laboratories were queriedfor reports of isolates matching the outbreak PFGE patterns(XbaI: JEGX01.0049; BlnI: JEGA26.0008 or JEGA26.0009,reflecting minor variation later observed with the secondenzyme). Laboratories that did not routinely screen SE iso-lates by using PFGE were encouraged to do so for isolatescollected since February 1, 2004. Phage typing was performedby standard methods. As additional PFGE-matching isolateswere identified, a brief, customized questionnaire was used ininterviews with persons about their nut consumption.
Raw almonds from an opened package recovered from onepatient’s household were tested for Salmonella by enzymeimmunoassay. Unopened packages of nuts from the supplier’swarehouse and environmental samples collected at the almondprocessor and at huller-shellers supplying the processor were testedfor Salmonella by using standard microbiologic methods.
As of June 2, a total of 29 patients with SE infections match-ing both XbaI and BlnI PFGE patterns had been identified in12 states and one Canadian province. Symptom onsets rangedfrom September 2003 to April 2004 (Figure). Patients rangedin age from 11 months to 91 years (median: 40 years); 17(59%) were female. Seven patients were hospitalized; no onedied. Multiple other cases with matching PFGE patterns andonsets earlier in 2003 remain under review. To date, nine iso-lates from the current outbreak have been phage typed; all aretype 9c, which is uncommon.
Among 26 patients interviewed, 24 recalled eating rawalmonds during the week before illness onset; 20 patients iden-tified brands packaged or supplied by Paramount Farms (LostHills, California). One infant patient was presumed second-arily infected. Through retailer computer records linked tomembership cards or customer receipts, dates and places of
almond purchase were verified for 10 households of patients.The dates of verified almond purchases ranged from Novem-ber 3, 2003, to January 28, 2004.
Efforts to identify specific production lots associated withillness, based on almond purchase dates and locations andstore inventory data, are ongoing. On May 18, Paramountannounced a nationwide recall* of all raw almonds soldunder the Kirkland Signature, Trader Joe’s, and Sunkist labels.Costco mailed 1,107,552 letters to members known to havepurchased the recalled product in the United States. Therecall was expanded subsequently to include nuts sold in bulkto approximately 50 other commercial customers, some ofwhom repackaged almonds for sale under other brand names.In addition to sales in the United States, almonds wereexported to France, Italy, Japan, Korea, Malaysia, Mexico,Taiwan, the United Kingdom. The majority of the recalledalmonds likely were consumed months ago; however, raw
0
5
10
Aug Sep Oct Nov Dec Jan Feb Mar Apr May
Num
ber
Month and year2003 2004
Raw almonds fromParamount Farms
Raw almonds withincomplete traceback
Household secondaryinfection
Patient not interviewed orexposure undetermined
FIGURE. Number* of PFGE†-matched cases of salmonellosisassociated with raw almonds, by date of illness onset and modeof exposure — United States and Canada, September 2003–April 2004
* N = 29.†
Pulsed-field gel electrophoresis.

486 MMWR June 11, 2004
almonds have a shelf life of >1 year, and consumers might stillhave the implicated products.
Tests of raw almonds recovered from a patient’s householdand samples collected at Paramount were negative for Salmo-nella; however, Salmonella was isolated from one environmentalsample collected at Paramount and from three samples fromtwo huller-shellers that supplied Paramount during theperiod of interest. Serotype and PFGE analyses of theseisolates have not been completed, and additional samplingcontinues.Reported by: S Keady, Alaska Div of Public Health. G Briggs, ArizonaDept of Health Svcs. J Farrar, DVM, JC Mohle-Boetani, MD,J OConnell, SB Werner, MD, California Dept of Health and HumanSvcs. D Anderson, North Central Idaho District Health Dept;L Tenglesen, DVM, Idaho Dept of Health and Welfare. S Bidols, MPH,Michigan Dept of Community Health. B Albanese, MD, C Gordan,New Mexico Dept of Health. E DeBess, DVM, J Hatch, WE Keene,PhD, M Plantenga, J Tierheimer, Oregon Dept of Human Svcs.AL Hackman, CE Rinehardt, CH Sandt, PhD, Pennsylvania State Deptof Health. A Ingram, MPH, Tennessee Dept of Health. S Hansen, SaltLake Valley Health Dept; S Hurt, Summit County Public Health Dept;M Poulson, Utah Dept of Health. R Pallipamu, J Wicklund, MPH,Washington Dept of Health. Food and Drug Administration. C Braden,MD, J Lockett, S Van Duyne, MA, Div of Bacterial and Mycotic Diseases,National Center for Infectious Diseases; A Dechet, MD, C Smelser, MD,EIS officers, CDC.
Editorial Note: The only previously recognized outbreak ofsalmonellosis associated with tree nuts was identified in 2001,when raw almonds were linked to an outbreak of SE infec-tions, mostly in Canada, during a 6-month period (3). TheSE isolates from that 2000–2001 outbreak had different PFGEpatterns and a different phage type (PT30) than those in thecurrent investigation. The almonds in the previous outbreakwere traced to three California orchards that were all con-taminated with SE of identical phage and PFGE patterns; SEalso was isolated from unopened packages of nuts. Since thatoutbreak, almonds from the implicated orchards reportedlyhave been diverted for use in processed foods only.
Approximately 1 billion pounds of California almonds wereproduced in 2003 (4), of which 5% were sold for raw con-sumption. Almonds are California’s largest agricultural crop,with an annual value of $1.5 billion; California producesapproximately 80% of the world’s almonds and almost 100%of the almonds sold in the United States (4).
California and federal regulatory agencies are continuing toinvestigate how almonds become contaminated with Salmo-nella; the mechanisms are poorly understood. Typical harvest-ing, drying, and hulling-shelling practices readily enablecross-contamination. Raw nuts can be treated with dry heat,steam, propylene oxide, or other methods to reduce the risk
for bacterial contamination; at least one almond processor hasbeen treating all raw almonds since the 2001 outbreak. Noevidence has been presented that roasted, blanched, or other-wise heat-processed nuts pose any risk for Salmonellacontamination.
Fewer than 5% of Salmonella infections are ever reported inthe United States (5). More cases in the current outbreak arebeing identified as more SE isolates are screened by PFGE.Screening has focused on isolates submitted since February 1,although sales of the almonds in the recalled lots date back tothe summer of 2003.
Although declining in incidence (6), SE remains the sec-ond most common Salmonella serotype (SalmonellaTyphimurium is the most common) isolated from salmonel-losis patients in the United States; nationwide, 5,116 (15.8%)of 32,308 isolates serotyped in 2002 were SE (7). Shell eggsand poultry have been identified as the most commonvehicles for both outbreaks and sporadic infections attributedto SE (8), but multiple other sources also have been identi-fied, including raw milk, meat, and sprouts (8–10).
The current outbreak continued for months, and possiblyfor more than 1 year, without being detected. Althoughserotyping is an invaluable epidemiologic tool, the added dis-tinguishing power of phage typing or molecular techniques(e.g., PFGE) can be critical to separating outbreak cases frombackground cases, especially for common Salmonella serotypessuch as Typhimurium, Enteritidis, Heidelberg, or Newport.Outbreaks caused by products with long shelf lives, wide dis-tribution, and low attack rates might not cause notable spikesin serotype-specific incidence locally or even nationally. Toidentify these outbreaks, isolates must be screened rapidly byadditional methods (e.g., PFGE), and those results must bepooled rapidly over networks such as PulseNet. Appropriateepidemiologic follow-up and coordinated use of standardizedhypothesis-generating questionnaires across multiple jurisdic-tional lines often are necessary to identify sources of infec-tion. At present, certain state health departments do not havethe resources to subtype all Salmonella isolates as they are iden-tified. In the United States, all state public health laboratoriescan perform PFGE and participate in PulseNet; however,phage typing is available only on a limited basis at CDC.
AcknowledgmentsThis report is based in part on the contributions of S Isaacs, MD,
Health Canada. V Berisha, MD, R Klein, Maricopa County Deptof Public Health; B Johnson, Pima County Health Dept, Arizona.J Hopkins, MPH, San Diego County Health and Human SvcsAgency; R Reporter, MD, Los Angeles County, California.M Wilkin, Idaho Dept of Health and Welfare. D Bernazzani,

Vol. 53 / No. 22 MMWR 487
J Fontana, PhD, E Gould, MPH, Massachusetts Dept of PublicHealth. MG Stobierski, DVM, Michigan Dept of CommunityHealth; A Bonnema, MD, MA Jhung, MD, Univ of Michigan,School of Public Health Preventive Medicine Residency, Ann Arbor,Michigan. J Madden, Oregon Dept of Agriculture; R Vega, MS,Oregon Dept of Human Svcs. CR Cook, DA Krouse, JM Tait, Penn-sylvania State Dept of Health. K Lofy, MD, EIS Officer, CDC.
References1. CDC. Foodborne Diseases Active Surveillance Network (FoodNet):
Population Survey Atlas of Exposures, 2002. Atlanta, Georgia: U.S.Department of Health and Human Resources, CDC, 2004.
2. Swaminathan B, Barrett TJ, Hunter SB, Tauxe RV. PulseNet: the mo-lecular subtyping network for foodborne bacterial disease surveillance,United States. Emerg Infect Dis 2001;7:382–9.
3. Chan ES, Aramini J, Ciebin B, et al. Natural or raw almonds and anoutbreak of a rare phage type of Salmonella Enteritidis infection. CanCommun Dis Rep 2002;28:97–9.
4. Almond Board of California. Almond Almanac 2003. Modesto, Cali-fornia: Almond Board of California, 2003. Available at http://www.almondboard.com/docs/current_almanac.pdf.
5. Voetsch AC, Van Gilder TJ, Angulo FJ, et al. FoodNet estimate of theburden of illness caused by nontyphoidal Salmonella infections in theUnited States. Clin Infect Dis 2004;38(suppl 3):S127–34.
6. Marcus R, Rabatsky-Ehr T, Mohle-Boetani JC, et al. Dramatic decreasein the incidence of Salmonella serotype Enteritidis infections in 5 FoodNetsites: 1996–1999. Clin Infect Dis 2004;38(suppl 3):S135–41.
7. CDC. Salmonella Surveillance Summary, 2002. Atlanta, Georgia: U.S.Department of Health and Human Services, CDC, 2003. Available athttp://www.cdc.gov/ncidod/dbmd/phlisdata/salmtab/2002/Salmonellaannualsummary2002.pdf.
8. Patrick ME, Adcock PM, Gomez TM, et al. Salmonella Enteritidis in-fections, United States, 1985–1999. Emerg Infect Dis 2004;10:1–7.
9. Van Duynhoven YT, Widdowson MA, de Jager CM, et al. Salmonellaenterica serotype Enteritidis phage type 4b outbreak associated withbean sprouts. Emerg Infect Dis 2002;8:440–3.
10. Haeghebaert S, Sulem P, Deroudille L, et al. Two outbreaks of Salmo-nella Enteritidis phage type 8 linked to the consumption of Cantal cheesemade with raw milk, France, 2001. Euro Surveill 2003;8:151–6.
Notice to Readers
Change in Source for Arboviral DiseaseData Reported to the National Notifiable
Diseases Surveillance SystemBeginning July 2, 2004 (representing data reported through
week 25), the arboviral disease surveillance data reported tothe National Notifiable Diseases Surveillance System(NNDSS) and displayed in MMWR Tables I and II (1) willbe compiled solely from data reported to CDC’s ArboNETsystem (2) and no longer will reflect data reported to CDCvia the National Electronic Telecommunications System forSurveillance (NETSS) (3). This change applies to all humancases of nationally notifiable arboviral meningitis or encepha-litis meeting the national surveillance case definition for ill-ness caused by any of the following six arboviruses or arbovirus
groups: California serogroup, eastern equine encephalitis,Powassan, St. Louis encephalitis, West Nile, and western equineencephalitis (4). The change also will apply to all yellow fevercases (5). Timely reporting of domestic yellow fever cases isrequired by international health regulations, which stipulatethat the United States must report all cases of suspected andconfirmed yellow fever to the World Health Organizationwithin 24 hours. This change also will apply to finalizedarboviral disease surveillance data collected in 2003 or laterand published in the MMWR Summary of Notifiable Diseases—United States.
Since 2000, state health departments have reported humanand animal West Nile virus surveillance data to ArboNET(2,6–8) and human arboviral disease data to NETSS. Thisduplicate reporting became more labor intensive to state healthdepartments and CDC as the incidence of West Nile virusdisease increased and more staff time was devoted to reconcil-ing discrepancies in data reported to the two systems.
In 2003, ArboNET was enhanced to enable reporting ofthe other five nationally notifiable domestic arboviral diseases,and the 2004 version will accept case reports of yellow fever,which is rare in the United States. ArboNET uses the dataand transmission standards defined by the Public HealthInformation Network (9) and will be incorporated as a mod-ule into the National Electronic Disease Surveillance System(NEDSS) (10). NEDSS provides a standards-based approachto disease surveillance across multiple surveillance systems and,when fully implemented, will connect public health surveil-lance to the clinical information infrastructure. State healthdepartments can report data to ArboNET via a web-basedapplication, stand-alone software, or direct data messaging.Direct data messaging to ArboNET from states’ surveillanceinformation systems is the preferred mechanism. Additionalinformation is available from Richard Hopkins, telephone404-498-6207, e-mail [email protected]; or Roy Campbell,telephone 970-221-6459, e-mail [email protected]. CDC. Table 1: Summary of provisional cases of selected notifiable dis-
eases, United States, cumulative, week ending May 15, 2004 (19thweek) and Table II: Provisional cases of selected notifiable diseases,United States, weeks ending May 15, 2004 and May 10, 2003 (19thweek). MMWR 2004;53:416–24.
2. O’Leary DR, Marfin AA, Montgomery SP, et al. The epidemic of WestNile virus in the United States, 2002. Vector-Borne Zoonotic Dis2004;4:61–9.
3. Koo D, Wetterhall SF. History and current status of the NationalNotifiable Diseases Surveillance System. J Public Health Manag Pract1996;2:4–10.
4. CDC. Encephalitis or meningitis, arboviral (includes Californiaserogroup, eastern equine, St. Louis, western equine, West Nile,Powassan) 2001 case definition. Available at http://www.cdc.gov/epo/dphsi/casedef/encephalitiscurrent.htm.

488 MMWR June 11, 2004
5. CDC. Yellow fever 2001 case definition. Available at http://www.cdc.gov/epo/dphsi/casedef/yellow_fever_current.htm.
6. Marfin AA, Petersen LR, Eidson M, et al. Widespread West Nile virusactivity, eastern United States, 2000. Emerg Infect Dis 2001;7:730–5.
7. CDC. West Nile virus activity—United States, 2001. MMWR2002;51:497–501.
8. CDC. West Nile virus activity—United States, November 20–25, 2003.MMWR 2003;52:1160.
9. CDC. Public Health Information Network. Available at http://www.cdc.gov/phin/index.htm.
10. National Electronic Disease Surveillance System Working Group.National Electronic Disease Surveillance System (NEDSS): a standards-based approach to connect public health and clinical medicine.J Public Health Manag Pract 2001;7:43–50.
Online
know what matters.
e xplore.Trekking through medical and scientific literature on the Web can
sometimes be a long journey – but not at MMWR Online.
Whether you're researching past CDC reports or looking for the
latest updates on important medical topics, MMWR Online quickly
guides you to the information you need, free of charge.
Log on to cdc.gov/mmwr and boldly discover more.

Vol. 53 / No. 22 MMWR 489
* No rubella cases were reported for the current 4-week period yielding a ratio for week 22 of zero (0).† Ratio of current 4-week total to mean of 15 4-week totals (from previous, comparable, and subsequent 4-week periods for the past 5 years). The point where the hatched area
begins is based on the mean and two standard deviations of these 4-week totals.
-: No reported cases.* Incidence data for reporting years 2003 and 2004 are provisional and cumulative (year-to-date).†
Not notifiable in all states.§
Updated monthly from reports to the Division of HIV/AIDS Prevention — Surveillance and Epidemiology, National Center for HIV, STD, and TB Prevention.Last update May 2, 2004.
¶Of 16 cases reported, 11 were indigenous, and five were imported from another country.
** Of 24 cases reported, 17 were indigenous, and seven were imported from another country.††
Updated weekly from reports to the Division of Viral and Rickettsial Diseases, National Center for Infectious Diseases (notifiable as of July 2003).§§
Not previously notifiable.
TABLE I. Summary of provisional cases of selected notifiable diseases, United States, cumulative, week ending June 5, 2004 (22nd Week)*
Cum. Cum. Cum. Cum.2004 2003 2004 2003
Anthrax - - Hemolytic uremic syndrome, postdiarrheal† 27 46Botulism: - - HIV infection, pediatric†§ 72 101
foodborne 6 6 Measles, total 16¶ 24**infant 25 30 Mumps 76 96other (wound & unspecified 3 8 Plague - -
Brucellosis† 41 37 Poliomyelitis, paralytic - -Chancroid 14 26 Psittacosis† 2 5Cholera 2 1 Q fever† 16 32Cyclosporiasis† 50 18 Rabies, human - -Diphtheria - - Rubella 10 4Ehrlichiosis: - - Rubella, congenital syndrome - 1
human granulocytic (HGE)† 33 34 SARS-associated coronavirus disease† †† - 5human monocytic (HME)† 20 28 Smallpox† §§ - NAhuman, other and unspecified - 5 Staphylococcus aureus: - -
Encephalitis/Meningitis: - - Vancomycin-intermediate (VISA)† §§ 4 NACalifornia serogroup viral† 1 - Vancomycin-resistant (VRSA)† §§ 1 1eastern equine† - 1 Streptococcal toxic-shock syndrome† 45 96Powassan† - - Tetanus 4 3St. Louis† - 2 Toxic-shock syndrome 47 60western equine† - - Trichinosis 3 -
Hansen disease (leprosy)† 33 34 Tularemia† 15 9Hantavirus pulmonary syndrome† 6 11 Yellow fever - -
FIGURE I. Selected notifiable disease reports, United States, comparison of provisional 4-week totals June 5, 2004, with historicaldata
DISEASE DECREASE INCREASECASES CURRENT
4 WEEKS
Ratio (Log scale)†
Beyond historical limits
4210.50.250.125
237
334
39
50
3
48
9
477
0
Hepatitis A, acute
Hepatitis B, acute
Hepatitis C, acute
Legionellosis
Measles, total
Mumps
Pertussis
Rubella
Meningococcal disease
0.06250.03125
*

490 MMWR June 11, 2004
N: Not notifiable. U: Unavailable. -: No reported cases. C.N.M.I.: Commonwealth of Northern Mariana Islands.* Incidence data for reporting years 2003 and 2004 are provisional and cumulative (year-to-date).† Chlamydia refers to genital infections caused by C. trachomatis.§ Updated monthly from reports to the Division of HIV/AIDS Prevention — Surveillance and Epidemiology, National Center for HIV, STD, and TB Prevention. Last update
March 26, 2004.¶ Contains data reported through National Electronic Disease Surveillance System (NEDSS).
TABLE II. Provisional cases of selected notifiable diseases, United States, weeks ending June 5, 2004, and May 31, 2003(22nd Week)*
Encephalitis/MeningitisAIDS Chlamydia† Coccidiodomycosis Cryptosporidiosis West Nile
Cum. Cum. Cum. Cum. Cum. Cum. Cum. Cum. Cum. Cum.Reporting area 2004§ 2003 2004 2003 2004 2003 2004 2003 2004 2003
UNITED STATES 12,299 19,194 338,204 361,644 1,866 1,363 893 795 - -
NEW ENGLAND 370 655 12,130 11,556 - - 55 53 - -Maine 5 27 719 802 N N 10 5 - -N.H. 20 15 684 655 - - 14 7 - -Vt. 10 6 433 434 - - 6 9 - -Mass. 117 277 5,834 4,327 - - 16 23 - -R.I. 44 50 1,417 1,347 - - 1 7 - -Conn. 174 280 3,043 3,991 N N 8 2 - -
MID. ATLANTIC 2,398 4,072 45,486 43,519 - - 147 121 - -Upstate N.Y. 185 271 9,317 7,879 N N 36 28 - -N.Y. City 1,134 1,976 12,815 14,499 - - 33 44 - -N.J. 521 780 5,316 6,362 - - 9 8 - -Pa. 558 1,045 18,038 14,779 N N 69 41 - -
E.N. CENTRAL 1,279 1,986 54,786 66,442 5 3 198 192 - -Ohio 235 302 12,082 17,995 - - 53 24 - -Ind. 166 260 7,072 7,229 N N 30 18 - -Ill. 602 959 14,127 20,436 - - 13 33 - -Mich. 208 363 15,954 13,556 5 3 48 37 - -Wis. 68 102 5,551 7,226 - - 54 80 - -
W.N. CENTRAL 309 360 19,780 20,802 4 2 104 75 - -Minn. 68 73 3,596 4,580 N N 40 35 - -Iowa 19 41 1,087 2,116 N N 15 10 - -Mo. 134 180 8,258 7,633 3 1 19 7 - -N. Dak. 11 1 592 567 N N 1 3 - -S. Dak. 5 6 1,070 1,015 - - 11 16 - -Nebr.¶ 17 24 2,143 1,898 1 1 6 3 - -Kans. 55 35 3,034 2,993 N N 12 1 - -
S. ATLANTIC 4,239 5,393 63,597 67,796 - 1 179 107 - -Del. 55 105 1,241 2,610 N N - 1 - -Md. 478 555 7,492 6,826 - 1 9 8 - -D.C. 150 595 1,476 1,421 - - 2 - - -Va. 213 478 9,172 7,725 - - 23 11 - -W. Va. 30 41 1,180 1,055 N N 2 1 - -N.C. 246 564 11,275 10,816 N N 34 15 - -S.C.¶ 267 326 6,788 5,555 - - 7 2 - -Ga. 688 736 7,766 14,289 - - 51 38 - -Fla. 2,112 1,993 17,207 17,499 N N 51 31 - -
E.S. CENTRAL 566 835 21,932 23,405 2 1 40 50 - -Ky. 71 78 2,312 3,440 N N 11 9 - -Tenn. 210 373 9,488 8,163 N N 12 17 - -Ala. 173 185 4,483 6,336 - - 10 21 - -Miss. 112 199 5,649 5,466 2 1 7 3 - -
W.S. CENTRAL 1,723 2,085 44,758 45,328 2 - 20 18 - -Ark. 87 63 3,245 3,088 1 - 8 3 - -La. 342 365 10,660 8,317 1 - - 1 - -Okla. 68 91 4,591 4,655 N N 8 4 - -Tex. 1,226 1,566 26,262 29,268 - - 4 10 - -
MOUNTAIN 495 716 17,206 21,472 1,165 933 49 34 - -Mont. - 10 790 932 N N 9 7 - -Idaho 3 13 1,280 1,076 N N 4 6 - -Wyo. 4 5 461 428 - - 2 1 - -Colo. 98 157 3,160 5,457 N N 24 6 - -N. Mex. 52 51 2,298 3,143 9 2 2 1 - -Ariz. 207 336 5,965 6,377 1,118 913 6 2 - -Utah 29 32 1,421 1,553 12 3 1 8 - -Nev. 102 112 1,831 2,506 26 15 1 3 - -
PACIFIC 920 3,092 58,529 61,324 688 423 101 145 - -Wash. 166 211 7,347 6,558 N N 9 12 - -Oreg. 92 126 2,069 3,216 - - 12 16 - -Calif. 610 2,697 46,810 47,683 688 423 79 117 - -Alaska 11 12 1,552 1,603 - - - - - -Hawaii 41 46 751 2,264 - - 1 - - -
Guam 1 1 - 320 - - - - - -P.R. 209 514 1,002 826 N N N N - -V.I. 4 15 143 138 - - - - - -Amer. Samoa U U U U U U U U U UC.N.M.I. 2 U 32 U - U - U - U

Vol. 53 / No. 22 MMWR 491
N: Not notifiable. U: Unavailable. - : No reported cases.* Incidence data for reporting years 2003 and 2004 are provisional and cumulative (year-to-date).
TABLE II. (Continued) Provisional cases of selected notifiable diseases, United States, weeks ending June 5, 2004, and May 31, 2003(22nd Week)*
Escherichia coli, Enterohemorrhagic (EHEC)Shiga toxin positive, Shiga toxin positive,
O157:H7 serogroup non-O157 not serogrouped Giardiasis GonorrheaCum. Cum. Cum. Cum. Cum. Cum. Cum. Cum. Cum. Cum.
Reporting area 2004 2003 2004 2003 2004 2003 2004 2003 2004 2003
UNITED STATES 457 470 63 85 53 36 5,875 6,409 116,845 134,639
NEW ENGLAND 35 29 18 13 9 2 512 469 2,849 2,875Maine 1 3 - - - - 57 51 106 90N.H. 5 7 3 1 - - 15 20 55 49Vt. - 1 - - - - 42 35 34 34Mass. 13 8 2 5 9 2 270 225 1,338 1,068R.I. 3 1 - - - - 47 44 379 405Conn. 13 9 13 7 - - 81 94 937 1,229
MID. ATLANTIC 41 52 3 6 12 11 1,350 1,349 14,407 17,032Upstate N.Y. 15 17 1 3 4 5 437 329 3,052 2,993N.Y. City 5 3 - - - - 420 499 4,103 5,535N.J. 6 5 1 - 4 - 123 188 2,105 3,785Pa. 15 27 1 3 4 6 370 333 5,147 4,719
E.N. CENTRAL 77 123 12 16 7 6 697 1,163 21,698 28,659Ohio 19 26 1 9 7 6 285 337 5,762 9,226Ind. 8 16 - - - - - - 2,411 2,702Ill. 15 22 - 1 - - 84 344 5,882 8,763Mich. 17 22 2 - - - 217 272 6,139 5,500Wis. 18 37 9 6 - - 111 210 1,504 2,468
W.N. CENTRAL 81 61 9 9 10 8 712 627 6,525 6,958Minn. 26 22 3 6 2 - 249 217 1,406 1,112Iowa 17 8 - - - - 100 83 160 499Mo. 12 18 6 1 3 1 188 189 3,336 3,551N. Dak. 2 1 - 1 3 1 11 16 50 25S. Dak. 3 2 - - - - 28 19 113 74Nebr. 11 5 - 1 - - 55 51 424 620Kans. 10 5 - - 2 6 81 52 1,036 1,077
S. ATLANTIC 44 41 13 29 7 1 928 945 28,309 33,014Del. - - N N N N 20 15 405 1,002Md. 6 1 - - 1 1 36 46 3,174 3,166D.C. 1 1 - - - - 25 14 1,003 1,033Va. 2 17 6 3 - - 152 113 3,708 3,622W. Va. 1 1 - - - - 12 10 361 343N.C. - - 4 11 - - N N 6,036 6,103S.C. 3 - - - - - 24 53 3,125 3,169Ga. 15 7 1 2 - - 231 307 3,426 6,875Fla. 16 14 2 13 6 - 428 387 7,071 7,701
E.S. CENTRAL 26 23 1 - 7 4 138 134 9,405 11,299Ky. 10 8 1 - 4 4 N N 980 1,460Tenn. 4 10 - - 3 - 69 58 3,346 3,311Ala. 6 3 - - - - 69 76 2,633 3,766Miss. 6 2 - - - - - - 2,446 2,762
W.S. CENTRAL 25 20 1 2 1 1 106 103 16,669 18,063Ark. 7 2 - - - - 48 56 1,569 1,648La. 1 1 - - - - 14 6 4,771 4,669Okla. 4 3 - - - - 44 41 1,939 1,751Tex. 13 14 1 2 1 1 - - 8,390 9,995
MOUNTAIN 49 52 5 8 - 3 490 501 4,033 4,520Mont. 2 1 - - - - 15 25 34 55Idaho 14 13 3 4 - - 69 59 35 34Wyo. - 1 - - - - 7 7 23 20Colo. 8 15 1 1 - 3 155 152 1,023 1,238N. Mex. 4 1 - 3 - - 23 21 267 524Ariz. 7 11 N N N N 79 83 1,666 1,683Utah 8 7 - - - - 106 106 200 147Nev. 6 3 1 - - - 36 48 785 819
PACIFIC 79 69 1 2 - - 942 1,118 12,950 12,219Wash. 27 21 - 1 - - 114 106 1,143 1,214Oreg. 11 8 1 1 - - 160 137 265 406Calif. 34 39 - - - - 608 800 11,117 9,934Alaska 1 1 - - - - 25 35 255 224Hawaii 6 - - - - - 35 40 170 441
Guam N N - - - - - - - 32P.R. - 1 - - - - 10 60 91 92V.I. - - - - - - - - 49 37Amer. Samoa U U U U U U U U U UC.N.M.I. - U - U - U - U 3 U

492 MMWR June 11, 2004
N: Not notifiable. U: Unavailable. -: No reported cases.* Incidence data for reporting years 2003 and 2004 are provisional and cumulative (year-to-date).
TABLE II. (Continued) Provisional cases of selected notifiable diseases, United States, weeks ending June 5, 2004, and May 31, 2003(22nd Week)*
Haemophilus influenzae, invasive Hepatitis
All ages Age <5 years (viral, acute), by type
All serotypes Serotype b Non-serotype b Unknown serotype ACum. Cum. Cum. Cum. Cum. Cum. Cum. Cum. Cum. Cum.
Reporting area 2004 2003 2004 2003 2004 2003 2004 2003 2004 2003
UNITED STATES 852 819 9 11 45 59 94 102 2,233 2,621
NEW ENGLAND 80 59 1 1 4 5 3 3 385 113Maine 7 2 - - - - - 1 8 3N.H. 12 6 - - 2 - - - 7 7Vt. 5 6 - - - - 1 - 5 4Mass. 32 31 1 1 - 5 2 1 329 59R.I. 2 3 - - - - - 1 7 10Conn. 22 11 - - 2 - - - 29 30
MID. ATLANTIC 171 142 - - 3 1 24 21 262 560Upstate N.Y. 62 45 - - 3 1 3 6 36 45N.Y. City 35 25 - - - - 7 5 89 210N.J. 25 31 - - - - 2 4 52 87Pa. 49 41 - - - - 12 6 85 218
E.N. CENTRAL 125 139 - 1 10 4 18 27 198 249Ohio 59 36 - - 2 - 10 7 23 42Ind. 25 21 - - 4 2 1 - 15 20Ill. 19 58 - - - - 5 16 72 79Mich. 10 9 - 1 4 2 1 - 70 80Wis. 12 15 - - - - 1 4 18 28
W.N. CENTRAL 50 56 2 - 3 6 4 6 71 74Minn. 20 22 1 - 3 6 - 1 10 20Iowa 1 - 1 - - - - - 22 14Mo. 15 23 - - - - 2 5 23 21N. Dak. 3 1 - - - - - - 1 -S. Dak. - 1 - - - - - - 2 -Nebr. 5 - - - - - - - 7 5Kans. 6 9 - - - - 2 - 6 14
S. ATLANTIC 209 157 - - 11 7 18 10 423 589Del. 8 - - - - - 2 - 4 4Md. 35 38 - - 2 4 - - 59 57D.C. - - - - - - - - 4 17Va. 18 16 - - - - 1 4 41 36W. Va. 10 7 - - - - 3 - 2 8N.C. 25 10 - - 3 - - - 31 26S.C. 2 2 - - - - - - 17 23Ga. 55 32 - - - - 11 4 156 237Fla. 56 52 - - 6 3 1 2 109 181
E.S. CENTRAL 33 42 - 1 - 2 7 4 74 74Ky. - 3 - - - 1 - - 10 13Tenn. 23 23 - - - 1 5 3 45 39Ala. 10 16 - 1 - - 2 1 6 11Miss. - - - - - - - - 13 11
W.S. CENTRAL 34 43 1 1 3 6 1 3 172 267Ark. 1 4 - - - 1 - - 33 13La. 7 15 - - - 2 1 3 11 23Okla. 25 23 - - 3 3 - - 16 5Tex. 1 1 1 1 - - - - 112 226
MOUNTAIN 114 95 3 5 11 13 14 12 211 170Mont. - - - - - - - - 3 2Idaho 4 2 - - - - 2 1 10 9Wyo. - - - - - - - - 2 1Colo. 25 16 - - - - 3 4 21 24N. Mex. 23 12 - - 3 3 3 1 5 8Ariz. 45 54 - 5 7 6 1 4 138 94Utah 9 7 2 - - 2 3 2 27 12Nev. 8 4 1 - 1 2 2 - 5 20
PACIFIC 36 86 2 2 - 15 5 16 437 525Wash. 3 3 2 - - 2 1 1 26 29Oreg. 23 22 - - - - 1 3 30 31Calif. 3 37 - 2 - 13 2 7 370 456Alaska 2 18 - - - - 1 5 4 5Hawaii 5 6 - - - - - - 7 4
Guam - - - - - - - - - 1P.R. - - - - - - - - 7 35V.I. - - - - - - - - - -Amer. Samoa U U U U U U U U U UC.N.M.I. - U - U - U - U - U

Vol. 53 / No. 22 MMWR 493
N: Not notifiable. U: Unavailable. -: No reported cases.* Incidence data for reporting years 2003 and 2004 are provisional and cumulative (year-to-date).
TABLE II. (Continued) Provisional cases of selected notifiable diseases, United States, weeks ending June 5, 2004, and May 31, 2003(22nd Week)*
Hepatitis (viral, acute), by typeB C Legionellosis Listeriosis Lyme disease
Cum. Cum. Cum. Cum. Cum. Cum. Cum. Cum. Cum. Cum.Reporting area 2004 2003 2004 2003 2004 2003 2004 2003 2004 2003UNITED STATES 2,413 2,744 498 460 402 438 174 204 3,117 3,556
NEW ENGLAND 132 134 3 2 10 16 10 8 295 433Maine 1 - - - - - 2 - 46 -N.H. 21 9 - - - 2 1 2 18 7Vt. 1 1 1 2 1 1 - - 10 4Mass. 67 95 2 - 4 6 2 4 106 226R.I. 2 3 - - 1 1 1 - 35 94Conn. 40 26 U U 4 6 4 2 80 102
MID. ATLANTIC 386 358 48 52 96 93 38 38 2,393 2,593Upstate N.Y. 42 32 4 7 22 27 14 8 860 836N.Y. City 41 120 - - 4 10 3 10 - 39N.J. 179 97 - - 23 5 9 7 535 635Pa. 124 109 44 45 47 51 12 13 998 1,083
E.N. CENTRAL 200 207 28 69 88 98 22 24 38 121Ohio 61 63 2 4 42 41 9 3 31 13Ind. 8 10 2 1 8 6 5 1 1 6Ill. 21 11 2 11 2 14 - 7 - 3Mich. 110 100 22 50 34 28 7 9 - -Wis. - 23 - 3 2 9 1 4 6 99
W.N. CENTRAL 169 118 180 101 9 20 4 6 51 38Minn. 17 14 1 3 - 2 2 2 17 21Iowa 6 4 - - 2 5 1 - 6 4Mo. 126 80 179 97 5 8 1 2 24 10N. Dak. 1 - - - 1 1 - - - -S. Dak. - 1 - - 1 - - - - -Nebr. 11 11 - 1 - 2 - 2 3 1Kans. 8 8 - - - 2 - - 1 2
S. ATLANTIC 769 738 81 73 101 119 26 48 278 270Del. 16 4 - - 3 - N N 32 50Md. 64 45 7 5 15 21 4 4 162 168D.C. 12 1 1 - 3 1 - - 2 3Va. 82 58 11 1 8 8 3 7 12 14W. Va. 2 7 10 1 2 - 1 2 2 1N.C. 74 76 6 3 9 9 5 9 41 17S.C. 48 72 7 17 1 4 - 2 1 1Ga. 242 227 6 6 9 14 5 13 2 8Fla. 229 248 33 40 51 62 8 11 24 8
E.S. CENTRAL 182 175 52 39 16 22 13 6 20 20Ky. 22 36 14 7 4 6 4 - 6 3Tenn. 88 62 24 8 10 9 8 1 9 6Ala. 26 34 1 5 2 5 1 3 1 1Miss. 46 43 13 19 - 2 - 2 4 10
W.S. CENTRAL 73 471 60 83 26 24 14 24 2 43Ark. 22 42 - 3 - 1 - - - -La. 26 67 33 48 1 1 1 1 - 4Okla. 16 25 2 - 2 2 - 1 - -Tex. 9 337 25 32 23 20 13 22 2 39
MOUNTAIN 204 249 21 14 29 24 8 13 8 3Mont. 1 8 2 1 1 1 - 1 - -Idaho 6 3 - 1 3 2 1 - 2 1Wyo. 5 14 - - 4 1 - - 1 -Colo. 21 40 4 4 4 4 2 5 - -N. Mex. 6 19 4 - - 2 - 2 - -Ariz. 113 122 2 4 5 6 - 4 1 -Utah 20 16 1 - 10 5 - 1 4 1Nev. 32 27 8 4 2 3 5 - - 1
PACIFIC 298 294 25 27 27 22 39 37 32 35Wash. 23 30 7 10 5 2 6 3 3 -Oreg. 41 - 5 5 N N 4 1 12 8Calif. 220 255 10 11 22 20 29 33 17 26Alaska 12 3 - - - - - - - 1Hawaii 2 6 3 1 - - - - N N
Guam - 3 - 1 - - - - - -P.R. 14 63 - - 1 - - - N NV.I. - - - - - - - - - -Amer. Samoa U U U U U U U U U UC.N.M.I. - U - U - U - U - U

494 MMWR June 11, 2004
N: Not notifiable. U: Unavailable. - : No reported cases.* Incidence data for reporting years 2003 and 2004 are provisional and cumulative (year-to-date).
TABLE II. (Continued) Provisional cases of selected notifiable diseases, United States, weeks ending June 5, 2004, and May 31, 2003(22nd Week)*
Meningococcal Rocky MountainMalaria disease Pertussis Rabies, animal spotted fever
Cum. Cum. Cum. Cum. Cum. Cum. Cum. Cum. Cum. Cum.Reporting area 2004 2003 2004 2003 2004 2003 2004 2003 2004 2003
UNITED STATES 404 394 673 855 3,538 2,751 1,999 2,913 243 143
NEW ENGLAND 35 9 32 41 732 277 206 192 11 -Maine 3 1 8 5 2 2 25 19 - -N.H. - 2 3 3 20 15 7 9 - -Vt. 1 - 1 - 30 29 6 11 - -Mass. 20 6 19 25 659 210 86 71 10 -R.I. 2 - - 2 9 5 13 25 1 -Conn. 9 - 1 6 12 16 69 57 - -
MID. ATLANTIC 89 96 83 101 959 263 178 342 19 11Upstate N.Y. 15 18 19 18 685 100 145 127 1 -N.Y. City 34 51 14 26 55 36 4 4 2 4N.J. 18 13 18 13 81 44 - 62 5 4Pa. 22 14 32 44 138 83 29 149 11 3
E.N. CENTRAL 25 43 95 133 423 205 15 22 10 6Ohio 9 6 40 34 166 90 7 7 6 2Ind. - - 10 21 39 25 3 2 1 1Ill. 2 22 9 37 - 14 4 4 - 2Mich. 9 12 30 23 41 18 1 9 3 1Wis. 5 3 6 18 177 58 - - - -
W.N. CENTRAL 24 15 42 65 209 121 197 285 14 5Minn. 11 9 12 16 40 33 21 11 - -Iowa 1 2 9 10 30 33 27 28 - 1Mo. 3 1 10 27 109 27 7 2 11 4N. Dak. 2 - 1 - 8 2 26 25 - -S. Dak. 1 - 1 1 9 2 10 64 - -Nebr. 1 - 2 5 2 2 53 61 3 -Kans. 5 3 7 6 11 22 53 94 - -
S. ATLANTIC 123 96 123 151 205 183 735 1,184 117 97Del. 3 - 1 8 5 1 9 19 - -Md. 28 25 7 13 38 27 50 166 9 21D.C. 7 5 4 1 2 - - - - -Va. 10 7 8 11 57 33 195 224 1 1W. Va. - 3 4 1 3 4 30 28 - -N.C. 9 6 18 16 33 62 280 318 97 47S.C. 7 1 12 12 25 9 61 83 5 8Ga. 16 20 7 19 8 17 107 158 1 16Fla. 43 29 62 70 34 30 3 188 4 4
E.S. CENTRAL 14 9 29 35 48 54 57 89 37 21Ky. 1 1 3 3 8 15 11 14 - -Tenn. 3 4 10 8 28 24 19 64 21 12Ala. 8 2 6 12 6 10 24 10 7 3Miss. 2 2 10 12 6 5 3 1 9 6
W.S. CENTRAL 35 47 64 107 139 160 507 675 28 2Ark. 5 3 12 10 7 9 24 25 6 -La. 2 2 16 30 3 4 - - 3 -Okla. 2 2 3 8 13 14 55 108 19 -Tex. 26 40 33 59 116 133 428 542 - 2
MOUNTAIN 13 13 31 45 434 462 41 43 3 1Mont. - - 1 2 12 - 5 7 - -Idaho 1 1 4 3 17 9 - 1 1 -Wyo. - - 2 2 3 119 - - - 1Colo. 5 9 9 11 231 170 5 2 - -N. Mex. 1 - 4 4 49 23 - 2 - -Ariz. 1 2 6 19 83 83 31 29 1 -Utah 3 1 3 - 29 43 - 1 1 -Nev. 2 - 2 4 10 15 - 1 - -
PACIFIC 46 66 174 177 389 1,026 63 81 4 -Wash. 2 10 18 16 188 189 - - - -Oreg. 8 5 36 29 152 153 - 1 2 -Calif. 35 49 115 123 35 681 55 75 2 -Alaska - - 1 2 8 - 8 5 - -Hawaii 1 2 4 7 6 3 - - - -
Guam - - - - - - - - - -P.R. - - 2 5 2 1 19 27 N NV.I. - - - - - - - - - -Amer. Samoa U U U U U U U U U UC.N.M.I. - U - U - U - U - U
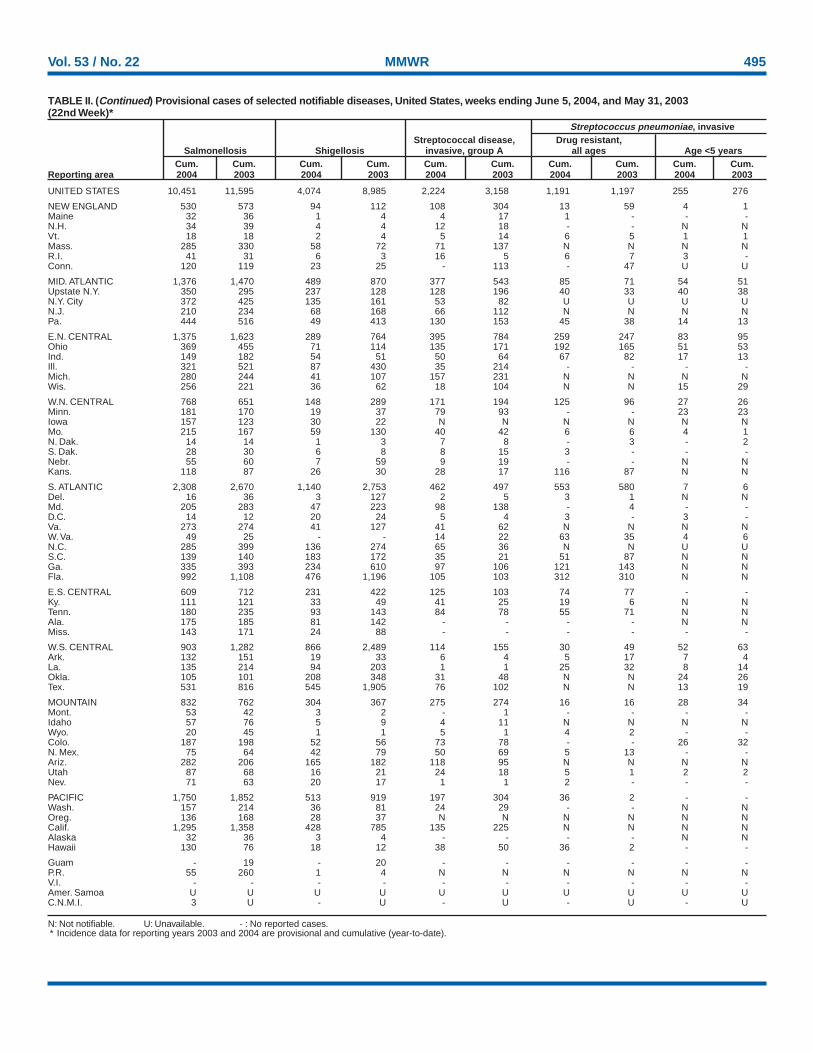
Vol. 53 / No. 22 MMWR 495
N: Not notifiable. U: Unavailable. - : No reported cases.* Incidence data for reporting years 2003 and 2004 are provisional and cumulative (year-to-date).
TABLE II. (Continued) Provisional cases of selected notifiable diseases, United States, weeks ending June 5, 2004, and May 31, 2003(22nd Week)*
Streptococcus pneumoniae, invasiveStreptococcal disease, Drug resistant,
Salmonellosis Shigellosis invasive, group A all ages Age <5 yearsCum. Cum. Cum. Cum. Cum. Cum. Cum. Cum. Cum. Cum.
Reporting area 2004 2003 2004 2003 2004 2003 2004 2003 2004 2003
UNITED STATES 10,451 11,595 4,074 8,985 2,224 3,158 1,191 1,197 255 276
NEW ENGLAND 530 573 94 112 108 304 13 59 4 1Maine 32 36 1 4 4 17 1 - - -N.H. 34 39 4 4 12 18 - - N NVt. 18 18 2 4 5 14 6 5 1 1Mass. 285 330 58 72 71 137 N N N NR.I. 41 31 6 3 16 5 6 7 3 -Conn. 120 119 23 25 - 113 - 47 U U
MID. ATLANTIC 1,376 1,470 489 870 377 543 85 71 54 51Upstate N.Y. 350 295 237 128 128 196 40 33 40 38N.Y. City 372 425 135 161 53 82 U U U UN.J. 210 234 68 168 66 112 N N N NPa. 444 516 49 413 130 153 45 38 14 13
E.N. CENTRAL 1,375 1,623 289 764 395 784 259 247 83 95Ohio 369 455 71 114 135 171 192 165 51 53Ind. 149 182 54 51 50 64 67 82 17 13Ill. 321 521 87 430 35 214 - - - -Mich. 280 244 41 107 157 231 N N N NWis. 256 221 36 62 18 104 N N 15 29
W.N. CENTRAL 768 651 148 289 171 194 125 96 27 26Minn. 181 170 19 37 79 93 - - 23 23Iowa 157 123 30 22 N N N N N NMo. 215 167 59 130 40 42 6 6 4 1N. Dak. 14 14 1 3 7 8 - 3 - 2S. Dak. 28 30 6 8 8 15 3 - - -Nebr. 55 60 7 59 9 19 - - N NKans. 118 87 26 30 28 17 116 87 N N
S. ATLANTIC 2,308 2,670 1,140 2,753 462 497 553 580 7 6Del. 16 36 3 127 2 5 3 1 N NMd. 205 283 47 223 98 138 - 4 - -D.C. 14 12 20 24 5 4 3 - 3 -Va. 273 274 41 127 41 62 N N N NW. Va. 49 25 - - 14 22 63 35 4 6N.C. 285 399 136 274 65 36 N N U US.C. 139 140 183 172 35 21 51 87 N NGa. 335 393 234 610 97 106 121 143 N NFla. 992 1,108 476 1,196 105 103 312 310 N N
E.S. CENTRAL 609 712 231 422 125 103 74 77 - -Ky. 111 121 33 49 41 25 19 6 N NTenn. 180 235 93 143 84 78 55 71 N NAla. 175 185 81 142 - - - - N NMiss. 143 171 24 88 - - - - - -
W.S. CENTRAL 903 1,282 866 2,489 114 155 30 49 52 63Ark. 132 151 19 33 6 4 5 17 7 4La. 135 214 94 203 1 1 25 32 8 14Okla. 105 101 208 348 31 48 N N 24 26Tex. 531 816 545 1,905 76 102 N N 13 19
MOUNTAIN 832 762 304 367 275 274 16 16 28 34Mont. 53 42 3 2 - 1 - - - -Idaho 57 76 5 9 4 11 N N N NWyo. 20 45 1 1 5 1 4 2 - -Colo. 187 198 52 56 73 78 - - 26 32N. Mex. 75 64 42 79 50 69 5 13 - -Ariz. 282 206 165 182 118 95 N N N NUtah 87 68 16 21 24 18 5 1 2 2Nev. 71 63 20 17 1 1 2 - - -
PACIFIC 1,750 1,852 513 919 197 304 36 2 - -Wash. 157 214 36 81 24 29 - - N NOreg. 136 168 28 37 N N N N N NCalif. 1,295 1,358 428 785 135 225 N N N NAlaska 32 36 3 4 - - - - N NHawaii 130 76 18 12 38 50 36 2 - -
Guam - 19 - 20 - - - - - -P.R. 55 260 1 4 N N N N N NV.I. - - - - - - - - - -Amer. Samoa U U U U U U U U U UC.N.M.I. 3 U - U - U - U - U

496 MMWR June 11, 2004
N: Not notifiable. U: Unavailable. - : No reported cases.* Incidence data for reporting years 2003 and 2004 are provisional and cumulative (year-to-date).
TABLE II. (Continued) Provisional cases of selected notifiable diseases, United States, weeks ending June 5, 2004, and May 31, 2003(22nd Week)*
Syphilis VaricellaPrimary & secondary Congenital Tuberculosis Typhoid fever (Chickenpox)Cum. Cum. Cum. Cum. Cum. Cum. Cum. Cum. Cum. Cum.
Reporting area 2004 2003 2004 2003 2004 2003 2004 2003 2004 2003UNITED STATES 2,846 2,955 119 194 3,556 4,973 96 124 7,945 8,492
NEW ENGLAND 68 88 1 - 138 158 9 10 390 1,839Maine - 4 - - - 10 - - 44 575N.H. 2 12 - - 7 8 - - - -Vt. - - - - - 5 - - 346 394Mass. 48 58 - - 86 68 9 5 - 87R.I. 9 6 - - 11 20 - 2 - 3Conn. 9 8 1 - 34 47 - 3 - 780
MID. ATLANTIC 420 329 22 32 775 879 23 22 31 10Upstate N.Y. 39 13 1 3 88 93 2 3 - -N.Y. City 209 179 9 19 409 484 5 12 - -N.J. 71 71 12 10 153 156 9 6 - -Pa. 101 66 - - 125 146 7 1 31 10
E.N. CENTRAL 302 409 31 37 422 448 4 16 3,498 3,291Ohio 94 88 1 2 71 76 1 - 906 839Ind. 22 19 7 7 56 50 - 4 - -Ill. 90 161 1 12 196 207 - 6 - -Mich. 86 130 22 16 72 90 2 6 2,339 1,962Wis. 10 11 - - 27 25 1 - 253 490
W.N. CENTRAL 55 82 - 3 150 198 2 3 114 27Minn. 7 25 - - 64 70 1 1 - -Iowa 2 6 - - 15 11 - 1 N NMo. 30 28 - 3 37 59 1 1 2 -N. Dak. - - - - 3 - - - 69 27S. Dak. - - - - 4 12 - - 43 -Nebr. 4 3 - - 6 9 - - - -Kans. 12 20 - - 21 37 - - - -
S. ATLANTIC 766 776 13 41 732 906 17 26 1,270 1,185Del. 3 8 - - - - - - 4 9Md. 140 110 2 7 88 84 2 7 - -D.C. 31 25 1 - - - - - 16 7Va. 44 36 1 1 81 85 3 11 317 297W. Va. 2 1 - - 10 9 - - 721 738N.C. 62 71 1 9 82 95 2 4 N NS.C. 46 48 - 4 83 53 - - 212 134Ga. 120 191 - 8 11 211 8 2 - -Fla. 318 286 8 12 377 369 2 2 - -
E.S. CENTRAL 157 145 4 7 231 276 4 2 2 -Ky. 23 21 - 1 37 47 2 - - -Tenn. 63 62 1 1 81 85 2 1 - -Ala. 58 51 2 4 80 105 - 1 - -Miss. 13 11 1 1 33 39 - - 2 -
W.S. CENTRAL 454 341 19 29 186 800 5 5 1,160 1,862Ark. 17 19 - 1 56 42 - - - -La. 91 43 - - - - - - 34 8Okla. 12 20 2 - 55 58 - - - -Tex. 334 259 17 28 75 700 5 5 1,126 1,854
MOUNTAIN 145 130 26 18 152 151 5 4 1,480 278Mont. - - - - - - - - - -Idaho 10 4 1 - - 1 - - - -Wyo. 1 - - - 1 2 - - 18 23Colo. 8 18 - 3 37 38 1 3 1,110 -N. Mex. 25 27 1 4 - 23 - - 63 -Ariz. 92 73 24 11 95 62 2 1 - -Utah 2 2 - - 19 13 1 - 289 255Nev. 7 6 - - - 12 1 - - -
PACIFIC 479 655 3 27 770 1,157 27 36 - -Wash. 37 31 - - 85 100 2 2 - -Oreg. 9 16 - - 28 40 1 1 - -Calif. 431 602 3 27 597 948 18 33 - -Alaska - - - - 11 26 - - - -Hawaii 2 6 - - 49 43 6 - - -
Guam - 1 - - - 27 - - - -P.R. 54 80 2 8 14 38 - - 137 252V.I. 4 1 - - - - - - - -Amer. Samoa U U U U U U U U U UC.N.M.I. 2 U - U 10 U - U - U

Vol. 53 / No. 22 MMWR 497
U: Unavailable. -:No reported cases.* Mortality data in this table are voluntarily reported from 122 cities in the United States, most of which have populations of >100,000. A death is reported by the place of its
occurrence and by the week that the death certificate was filed. Fetal deaths are not included.† Pneumonia and influenza.§ Because of changes in reporting methods in this Pennsylvania city, these numbers are partial counts for the current week. Complete counts will be available in 4 to 6 weeks.¶ Total includes unknown ages.
NEW ENGLAND 369 251 81 27 5 5 31Boston, Mass. 111 74 24 6 3 4 8Bridgeport, Conn. 33 22 6 5 - - 2Cambridge, Mass. 18 13 4 1 - - 1Fall River, Mass. 25 18 5 2 - - 3Hartford, Conn. U U U U U U ULowell, Mass. 28 18 5 5 - - 1Lynn, Mass. 14 9 3 2 - - -New Bedford, Mass. 17 11 3 2 1 - 1New Haven, Conn. U U U U U U UProvidence, R.I. U U U U U U USomerville, Mass. 8 6 2 - - - -Springfield, Mass. 34 17 14 2 1 - 4Waterbury, Conn. 26 19 6 - - 1 5Worcester, Mass. 55 44 9 2 - - 6
MID. ATLANTIC 2,024 1,402 419 126 44 30 112Albany, N.Y. 40 25 11 2 - 2 2Allentown, Pa. 20 15 5 - - - -Buffalo, N.Y. 96 70 18 7 1 - 10Camden, N.J. 25 15 6 1 1 2 1Elizabeth, N.J. 13 11 2 - - - -Erie, Pa. 36 27 6 1 2 - 1Jersey City, N.J. 23 16 5 1 - 1 -New York City, N.Y. 990 690 203 66 18 10 51Newark, N.J. 59 28 15 8 3 5 4Paterson, N.J. 21 12 5 1 2 1 -Philadelphia, Pa. 373 237 91 28 12 5 17Pittsburgh, Pa.§ 27 16 7 2 - 2 2Reading, Pa. 27 21 4 1 1 - 1Rochester, N.Y. 107 82 19 3 1 2 11Schenectady, N.Y. 28 25 3 - - - 3Scranton, Pa. 26 19 5 2 - - -Syracuse, N.Y. 68 55 9 3 1 - 6Trenton, N.J. 12 9 2 - 1 - -Utica, N.Y. 16 14 1 - 1 - 2Yonkers, N.Y. 17 15 2 - - - 1
E.N. CENTRAL 1,807 1,199 391 99 76 42 100Akron, Ohio 41 27 6 2 2 4 -Canton, Ohio 28 24 4 - - - -Chicago, Ill. 280 174 71 23 7 5 23Cincinnati, Ohio 62 34 20 5 2 1 -Cleveland, Ohio 180 129 38 10 3 - 6Columbus, Ohio 179 115 38 12 9 5 17Dayton, Ohio 96 66 22 5 - 3 5Detroit, Mich. 168 71 45 15 33 4 8Evansville, Ind. 38 25 6 3 1 3 -Fort Wayne, Ind. 45 36 7 - 1 1 6Gary, Ind. 32 14 13 1 2 2 -Grand Rapids, Mich. 95 64 23 3 1 4 8Indianapolis, Ind. 150 111 26 5 3 5 9Lansing, Mich. 29 23 3 1 1 1 2Milwaukee, Wis. 104 71 25 2 5 1 3Peoria, Ill. 39 29 6 3 1 - 2Rockford, Ill. 53 44 6 2 1 - 3South Bend, Ind. 66 50 11 3 - 2 -Toledo, Ohio 61 41 12 4 4 - 5Youngstown, Ohio 61 51 9 - - 1 3
W.N. CENTRAL 557 355 122 45 17 18 34Des Moines, Iowa 41 30 9 - - 2 2Duluth, Minn. 23 17 4 2 - - 1Kansas City, Kans. 34 19 9 3 2 1 -Kansas City, Mo. 61 40 11 7 2 1 3Lincoln, Nebr. 25 20 4 - 1 - 1Minneapolis, Minn. 59 32 13 6 1 7 7Omaha, Nebr. 84 59 17 6 - 2 7St. Louis, Mo. 70 37 14 10 5 4 1St. Paul, Minn. 43 34 7 1 - 1 6Wichita, Kans. 117 67 34 10 6 - 6
S. ATLANTIC 1,070 675 230 110 32 23 69Atlanta, Ga. 95 58 19 13 4 1 2Baltimore, Md. 183 90 52 28 8 5 18Charlotte, N.C. 64 48 7 8 1 - 7Jacksonville, Fla. 117 77 27 8 4 1 3Miami, Fla. 125 87 17 12 4 5 -Norfolk, Va. 60 38 11 8 1 2 3Richmond, Va. 43 25 11 3 1 3 4Savannah, Ga. 36 23 10 2 1 - 1St. Petersburg, Fla. 67 47 11 4 2 3 7Tampa, Fla. 166 113 37 13 2 1 21Washington, D.C. 100 59 24 11 4 2 1Wilmington, Del. 14 10 4 - - - 2
E.S. CENTRAL 630 416 128 53 15 17 37Birmingham, Ala. 120 79 26 11 - 3 13Chattanooga, Tenn. 50 38 6 4 - 2 6Knoxville, Tenn. 84 61 15 5 3 - 1Lexington, Ky. 58 37 12 5 2 2 4Memphis, Tenn. 97 57 24 10 3 3 1Mobile, Ala. 49 33 7 6 2 1 3Montgomery, Ala. 52 37 12 1 1 1 -Nashville, Tenn. 120 74 26 11 4 5 9
W.S. CENTRAL 1,108 664 282 89 47 26 62Austin, Tex. 68 41 15 9 1 2 3Baton Rouge, La. 21 10 6 5 - - -Corpus Christi, Tex. 24 14 5 4 1 - 1Dallas, Tex. 157 80 49 13 10 5 10El Paso, Tex. 69 51 14 2 2 - 3Ft. Worth, Tex. 83 51 21 5 3 3 3Houston, Tex. 308 172 93 22 14 7 22Little Rock, Ark. 68 38 14 9 3 4 1New Orleans, La. 48 26 13 5 4 - -San Antonio, Tex. 171 123 34 10 2 2 16Shreveport, La. 48 27 14 2 3 2 1Tulsa, Okla. 43 31 4 3 4 1 2
MOUNTAIN 947 626 199 74 30 18 56Albuquerque, N.M. 114 72 27 11 3 1 7Boise, Idaho 45 34 7 3 1 - 1Colo. Springs, Colo. 55 41 11 2 - 1 -Denver, Colo. 75 42 15 9 4 5 6Las Vegas, Nev. 250 172 50 17 8 3 17Ogden, Utah 34 24 7 2 - 1 2Phoenix, Ariz. 104 58 25 12 6 3 8Pueblo, Colo. 26 19 3 3 1 - 4Salt Lake City, Utah 112 72 27 6 3 4 6Tucson, Ariz. 132 92 27 9 4 - 5
PACIFIC 1,185 793 242 94 31 25 93Berkeley, Calif. 12 10 1 - - 1 -Fresno, Calif. 69 47 13 5 3 1 5Glendale, Calif. 10 7 1 2 - - 1Honolulu, Hawaii 62 52 7 3 - - 5Long Beach, Calif. 73 53 17 1 2 - 13Los Angeles, Calif. 130 83 23 21 3 - 17Pasadena, Calif. 29 19 5 3 - 2 2Portland, Oreg. 67 44 15 6 1 1 6Sacramento, Calif. 217 142 47 18 8 2 15San Diego, Calif. 142 103 21 4 5 9 8San Francisco, Calif. U U U U U U USan Jose, Calif. 130 78 32 14 2 4 11Santa Cruz, Calif. 19 14 4 1 - - 1Seattle, Wash. 92 59 20 5 6 2 -Spokane, Wash. 44 27 11 4 - 2 1Tacoma, Wash. 89 55 25 7 1 1 8
TOTAL 9,697¶ 6,381 2,094 717 297 204 594
TABLE III. Deaths in 122 U.S. cities,* week ending June 5, 2004 (22nd Week)All causes, by age (years) All causes, by age (years)
All P&I† All P&I†
Reporting Area Ages >65 45-64 25-44 1-24 <1 Total Reporting Area Ages >65 45-64 25-44 1-24 <1 Total

MMWR
The Morbidity and Mortality Weekly Report (MMWR) Series is prepared by the Centers for Disease Control and Prevention (CDC) and is available free of chargein electronic format and on a paid subscription basis for paper copy. To receive an electronic copy each week, send an e-mail message to [email protected]. Thebody content should read SUBscribe mmwr-toc. Electronic copy also is available from CDC’s World-Wide Web server at http://www.cdc.gov/mmwr or from CDC’sfile transfer protocol server at ftp://ftp.cdc.gov/pub/publications/mmwr. To subscribe for paper copy, contact Superintendent of Documents, U.S. GovernmentPrinting Office, Washington, DC 20402; telephone 202-512-1800.
Data in the weekly MMWR are provisional, based on weekly reports to CDC by state health departments. The reporting week concludes at close of business onFriday; compiled data on a national basis are officially released to the public on the following Friday. Address inquiries about the MMWR Series, including materialto be considered for publication, to Editor, MMWR Series, Mailstop E-96, CDC, 1600 Clifton Rd., N.E., Atlanta, GA 30333; telephone 888-232-3228.
All material in the MMWR Series is in the public domain and may be used and reprinted without permission; citation as to source, however, is appreciated.
All MMWR references are available on the Internet at http://www.cdc.gov/mmwr. Use the search function to find specific articles.
Use of trade names and commercial sources is for identification only and does not imply endorsement by the U.S. Department of Health and Human Services.
References to non-CDC sites on the Internet are provided as a service to MMWR readers and do not constitute or imply endorsement of these organizations ortheir programs by CDC or the U.S. Department of Health and Human Services. CDC is not responsible for the content of these sites. URL addresses listed inMMWR were current as of the date of publication.
✩ U.S. Government Printing Office: 2004-633-140/00019 Region IV ISSN: 0149-2195
498 June 11, 2004