webinar geosciences 2012
DESCRIPTION
This is the presentation for a webinar that we recently held, explaining the use of energy-dispersive spectrometry (EDS) on the scanning electron microscope (SEM) and micro-X-ray fluorexcence spectrometry (µ-XRF) in geosciences. You will find lots of interesting applications from this field. If you are interested in viewing a recording of the webinar, please follow this link: https://bruker.webex.com/bruker/lsr.php?AT=pb&SP=EC&rID=65244917&rKey=c8fbbf90d4bab945TRANSCRIPT

X-ray Expeditions into Geosciences and Mining Geosciences Applications of EDS and µ-XRF Bruker Nano GmbH, Berlin Webinar, April25th, 2012
Innovation with Integrity

Webinar Overview
Part I
Advanced EDS analysis options for geoscience applications using SDD on SEM
Part II
Geological applications of the M4 TORNADO µ-XRF spectrometer

Advanced EDS Analysis Options for Geoscience Applications using SDD
Dr. Tobias Salge, EDS Application Scientist, Bruker Nano GmbH, Berlin

03.05.2012 4
State-of-the-art XFlash® silicon drift detectors (SDD)
• Energy resolution 121 eV (FWHM Mn Kα)
• Best energy resolution range up to 100 kcps
• Multi detector option
QUANTAX EDS system for SEM, EPMA and TEM

03.05.2012 5
Overview
• Fast, high resolution mapping Display of small features
• Spectrum imaging Improved element identification Quantitative analysis of REE by peak deconvolution Modal analysis
• Computer-controlled SEM High resolution at the macroscale Particle search using feature analysis
• Application examples Earth and planetary samples Core samples of impactites at the K-Pg boundary Mining samples focussing on REE, iron oxides

03.05.2012 6
OPD leg 207 (4000 km from crater)
Chicxulub impact structure • ~Ø 180 km, ~65 Ma • Target rock:
silicate basement, 3 km sediments
• Release of SOx, CO2, H2O
K-Pg boundary Asteroid impact and mass extinction
Image of NASA Worldwind
Chicxulub crater
Yax-1 UNAM-7

03.05.2012 7
Schulte et al. 2009
Thin section
K-Pg transition at OPD leg 207 2 cm ejecta spherule deposit

03.05.2012 8
Schulte et al. 2010, Science, 327, 1214-1218
Dolomite spherule with layered clay shell indicates impact-induced mechanical and thermal stress.
ODP leg 207, High-resolution map 4072x3072 pixel, 30 min, 500 kcps

03.05.2012 9
Spectrum Imaging HyperMap

03.05.2012 10
Spectrum Imaging HyperMap

03.05.2012 11
Spectrum Imaging HyperMap

03.05.2012 12
• Synthetic spectrum of highest count level found in each spectrum channel
• Detection of trace elements present in one pixel
MaxPixSpec reveals the presence of Th, La, Ce, …
Granite 200 µm
Element Identification Maximum Pixel Spectrum vs. Sum Spectrum

03.05.2012 13
Ce
Monazite (La, Ce, Nd, Pr…)PO4
MaxPixSpec reveals the presence of Th, La, Ce, …
200 µm
wt.%
Element Identification Maximum Pixel Spectrum vs. Sum Spectrum
• Synthetic spectrum of highest count level found in each spectrum channel
• Detection of elements present in a few pixels only
Granite

03.05.2012 14
How far can we take peak deconvolution? Diagenetic monazite concretion

03.05.2012 15
Peak intensity map
Intensity map and area spectra display zonation.
Area spectra
La Gd 300 µm
How far can we take peak deconvolution? Diagenetic monazite concretion

03.05.2012 16
Peak intensity map
Overlapping element lines lead to wrong display of element distribution.
Gd 300 µm
How far can we take peak deconvolution? Diagenetic monazite concretion
Area spectra

03.05.2012 17
>5.1
4.7
3.5
2.4
1.2
0.0
wt.% Quantitative map Deconvolution result
• Overlapping peaks can be deconvolved • Quantitative map displays correct element distribution
Gd 300 µm
How far can we take peak deconvolution? Diagenetic monazite concretion

03.05.2012 18
• Concentration of Gd, Sm, Nd within the core • Sequential incorporation of LREE • La dominating the outermost rim
Line scan (wt.%) extracted from quantitative map:
How far can we take peak deconvolution? Diagenetic monazite concretion

03.05.2012 19
Salge et al. 2007
BSE
Microcrystalline breccia matrix Core: UNAM-7 381.4 m
Modal analysis Chemical phase mapping UNAM-7
Matrix
Matrix
Matrix
1 cm
Anh
80 µm

03.05.2012 20
80 µm Salge et al. 2008
Autophase result
Modal analysis Chemical phase mapping
Core: UNAM-7 381.4 m
UNAM-7
Matrix
Matrix
Matrix
1 cm
Anh

03.05.2012 21
80 µm
Modal content
Phase Area fraction (%)
Anhydrite 51.8
Dolomite 30.6
Calcite 14.9
K-feldspar 1.0
Celestine 0.7
Na-feldspar 0.5
Modal analysis Chemical phase mapping
Core: UNAM-7 381.4 m
Salge et al. 2008
UNAM-7
Matrix
Matrix
Matrix
1 cm
Anh

03.05.2012 22
Computer-controlled SEM Jobs – StageControl

03.05.2012 23
Yax-1 core: Unit 5 861.72m
Composite of 276 maps • 2 µm pixel resolution • 11,906 x 11,595 pixel • ICR: 450,000 cps • 20 kV, 18 nA, 18 h
(4 min per single map) 5 mm
Matrix Melt rock 1 cm
High resolution at the macroscale 140 megapixel map
Yax-1
Nelson et al. (in press, available online at GCA)

03.05.2012 24
5 mm
Matrix Melt rock
Next image
Yax-1 core: Unit 5 861.72m
Composite of 276 maps • 2 µm pixel resolution • 11,906 x 11,595 pixel • ICR: 450,000 cps • 20 kV, 18 nA, 18 h
(4 min per single map)
1 cm
High resolution at the macroscale 140 megapixel map
Yax-1
Nelson et al. (in print, available online at GCA)

03.05.2012 25
1 mm
• Crystallized impact melt material with hydrothermal overprint.
• Multiple fracturing events due to interaction of hot fluids with solidified melts.
Impact melt Matrix
Impact melt
Matrix
K-metasomatism Multiple fracturing events
Yax-1

03.05.2012 26
Particle detection and classification Feature analysis
1. Particle detection
2. Chemistry: Chemical classification
3. Review: Reclassification

27
Particle detection and classification Feature analysis
Morphological classification dialog: Binarization
03.05.2012

28
Particle detection and classification Feature analysis
2. Chemical classification
03.05.2012

03.05.2012 29
Discrimination of calcite and flourite Feature analysis
Class Count Area fraction (%) Fluorite CaF2 130 9.2 Ca-carbonate CaCO3 4 2.3 Unclassified 482 68.5 All 616 100
20 kV, 60 kcps, 0.5 s
Composite of 14 BSE images

03.05.2012
Altered laterite Classification of monazite and pyrochlore
Bariopyrochlore Ba0.3Sr0.2Ca0.1Nb1.8Ti0.2O5.6(H2O)0.8
Plumbopyrochlore Pb0.8Y0.2U0.1Ca0.1Nb1.4Si0.2Fe2+0.2Ta0.1O6.2(OH)0.5
Zirconolite Ca0.8Ce0.2ZrTi1.5Fe2+0.3Nb0.1Al0.1O7
Hollandite Ba0.8Pb0.2Na0.1Mn4+
6.1Fe3+1.3Mn2+
0.5Al0.2Si0.1O16
Composite of 64 BSE images
30

03.05.2012
Pyrochlore Deconvolution of overlapping peaks
2.90 3.00 3.10 3.20 3.30 3.40 3.50 3.60 3.703.80keV
0.0
0.5
1.0
1.5
2.0
2.5
3.0
3.5
4.0
cps/eV
Ca
U
Th
1.80 2.00 2.20 2.40 2.60keV
0
20
40
60
80
100
120
cps/eV
Sr Pb Zr
Nb Ta
4.2 4.4 4.6 4.8 5.0 5.2 5.4 5.6 5.8 6.0 6.2 6.4 6.6keV
0
2
4
6
8
10
12
14
16
18
20
22
24 cps/eV
Ti
Ba
Ce
Fe
Pyrochlore spectrum XFlash® 5030, 20 kV, 90-120 kcps, 3 s
31

03.05.2012 32
Classification Standardless quantification
Class Count Monazite Nd>8 wt.% 123 Monazite La>18 wt.% 551 Monazite 669 Baryte 32 Hollandite 22 Plumbopyrochlore 15 Bariopyrochlore 20
Zirconolite 2 Unclassified 43 All 1477

03.05.2012 33
Classification of monazite Composition
• An exchange of neodynium with lanthanum is present.
Ce versus Nd
0,00,0
3,0
1,2
5,9
2,5
8,9
3,7
11,8
4,9
14,8
6,2
17,8
7,4
20,7
8,7
23,7
9,9
26,6
11,1
29,6
12,4
Ce
Nd
Ce versus Nd 12.4
11.1
9.9
8.7
7.4
6.2
4.9
3.7
2.5
1.2
0.0
Nd
(wt.
%)
0.0 3.0 5.9 8.9 11.8
14.8 17.8 20.7 13.7 29.6
Ce (wt.%) 26.6
La versus Nd La versus Nd
0,00,0
2,3
1,2
4,5
2,5
6,8
3,7
9,0
4,9
11,3
6,2
13,5
7,4
15,8
8,7
18,0
9,9
20,3
11,1
22,5
12,4
La
Nd
0.0 2.3 4.5 6.8 9.0 11.3 13.5 15.8 18.0 22.5
La (wt.%)
12.4
11.1
9.9
8.7
7.4
6.2
4.9
3.7
2.5
1.2
0.0
Nd
(wt.
%)
20.3
La versus Nd

La-Monazite Monazite Nd-Monazite

03.05.2012 35
Iron oxides Fast quantification using a standard
Haematite Fe2O3
N=10 Expected (at.-%)
Mean (at.-%)
s (±at.-%)
O 60.0 60.0 0.5 Fe 40.0 40.0 0.5 Magnetite Fe3O4
N=10
Expected (at.-%)
Mean (at.-%)
s (±at.-%)
O 57.1 56.9 1.0 Fe 42.9 43.1 1.0
EDX detector: XFlash® 5040 QUAD HV: 15 kV Current: 142.6 nA
Haematite Fe2O3 and Magnetite Fe3O4 • Standard-based quantification is
required to obtain highest accuracy.
• Haematite was used for reference.
• Using high count rates, iron oxides can be discriminated in a short time.
Count rate (In/Out): 900/675 kcps Time reference/sample: 120/30 ms Counts per spectrum: 20000 – 25000

03.05.2012 36
BSE image of iron ore pellet Area spectra
Spectrum imaging of iron oxides Advanced analysis options
Silicate
Haematite Magnetite

03.05.2012 37
Autophase result
Spectrum Imaging of Iron Oxides Autophase
Magnetite / Haematite = 9.4
Class Area fraction (%) Magnetite 86.3 Haematite 9.2 Silicate 3.3 Unassigned 1.2 Total 100.0

03.05.2012 38
Magnetite
Classification of iron oxides Feature analysis
Haematite
Ti-Haematite Ti-Magnetite
BSE image of iron ore pellet 15 kV, ~450 kcps, 0.5 s

03.05.2012 39
Quantification with hybrid method Standardless with reference for Fe and O
Magnetite / Haematite = 9.6 (Autophase 9.4)
Class Count Area fraction (%) Ti-Magnetite 2 0,1 Magnetite 540 79,7 Ti-Haematite 2 0,1 Haematite 57 8,3 Quartz 3 0,6 Olivine 11 1,6 Na-feldspar 4 5,6 Alumosilicate 3 0,1 Calcium pyroxene 1 0,1 Apatite 2 2,1 Calcium carbonate 2 0,3 Unclassified 26 1,4 All 653 100,0

03.05.2012 40
Summary
• State-of-the-art XFlash® SDD technology enables fast mapping
• Spectrum imaging significantly enhances EDS analysis
• Deconvolution is an important tool for element identification and quantification
• Computer-controlled acquisition provides high resolution at the macroscale
• Feature analysis combines morphological and chemical classification
• Hybrid method combines standardless and standard-based quantification

Geological Applications of the M4 TORNADO µ-XRF Spectrometer
Dr. Roald Tagle, µ-XRF Application Scientist, Bruker Nano GmbH, Berlin

A technological alliance From electron to X-ray excitation
µ-XRF ARTAX EDS QUANTAX
High speed µ-XRF spectrometer
03.05.2012 42
03.05.2012 43
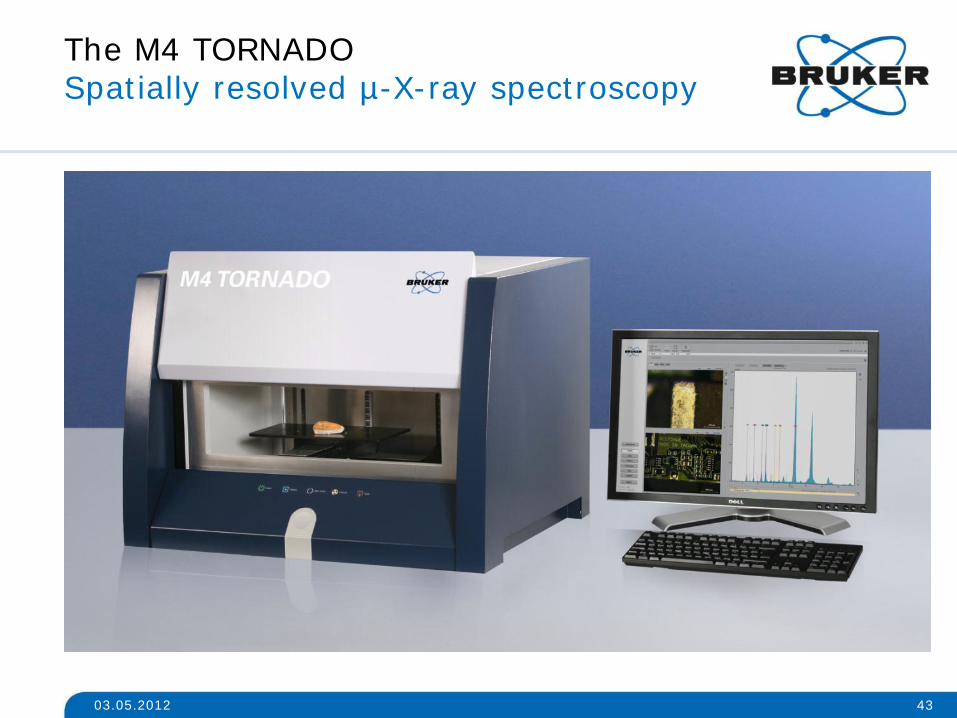
The M4 TORNADO Spatially resolved µ-X-ray spectroscopy

03.05.2012 44
The M4 TORNADO Focusing X-rays with a polycapillary lens
10 mm
23 µm for 17,5 keV
Poly-capillary lens collects large angle of tube radiation and concentrates it into a small spot on the sample
Focusing X-rays

45
The M4 TORNADO Instrument specifications
SDD 30 mm2, <145 eV FWHM
Key Features
• High brilliance X-ray source with small spot
• Video microscope for sample positioning with 10X and 100X magnification
• SDD technology offering high count rate capability in combination with optimum energy resolution
• Large vacuum chamber, 20 mbar in 120 s
• Powerful high speed servo motors, for samples up to 5 kg
03.05.2012

03.05.2012 46
Comparison µ-XRF & electron excitation High sensitivity for heavy elements
• Spectra of NIST 612 with approx. 500 ppm of more than 20 elements, EPMA (blue) and µ-XRF (red)
• Different excitation probability, therefore higher sensitivity for heavy elements

47
Features and applications examples of the M4 Tornado in geology
• Qualitative and quantitative analyses of large samples, up to 30 X 15 cm and 5 kg, without previous preparation
Element distribution in sediments (K/Pg-boundary)
Documenting thin sections (large area scan)
Composition of the unique Dermbach meteorite
(HyperMap quantification)
• Quantitative analysis for mayor and trace elements, down to the low ppm range
Composition of volcanic glasses
03.05.2012

03.05.2012 48
Raton Basin continental K/Pg sites
Chicxulub impact structure • ~Ø 180 km, ~65 Ma • Target rock:
silicate basement, 3 km sediments
K-Pg boundary Asteroid impact and mass extinction
Image of NASA Worldwind
Chicxulub crater
Yax-1 UNAM-7

Scan of the Cretaceous / Paleogene boundary in Raton Basin US
Optimized for trace elements Overview measurement
5 mm
Ca Al Cr Cr Cr/Si Zr/Si Ni/Si
Pg K
03.05.2012 49

Scanning thin sections
Conditions: 35 keV 800 µA, 5 ms per pixel 100 µm step size
Document thin sections or samples in a short time e.g. ~ 30 minutes per section up to 18 at the same time!
Results can be saved in independent files.
03.05.2012 50

Independently saved section results
03.05.2012 51

Qualitative and quantitative analysis of the unique Dermbach iron meteorite
The HyperMap feature allows an optimal “data mining”! Not only compositional overview for recognition of characteristic areas but also quantification of selected regions
The Dermbach meteorite was found in Germany in 1924.The Fe-Ni phase contains one of the highest Ni-concentrations described in literature
Bartoschewitz et al (2012). LPSC. Abs 1292
Conditions: 50 keV 200 µA, 5 ms per pixel 60 µm step size 974 x 883 Pixel 2 h measuring time
03.05.2012 52

Results • The high Ni concentrations were
confirmed. A strong fractionation of the Fe-Ni-metal with a low-Ni rim could be found in the sample
• The Ni increase correlates with the Cu increase in the Fe-Ni metal
Qualitative and quantitative analysis of the unique Dermbach iron meteorite
Fe Co Ni Cu Ni-low 1 70.2 1.11 28.5 0.22 Ni-low 2 65.0 1.08 33.6 0.29 Ni-high 1 58.8 0.96 40.4 0.44 Ni-high 2 55.8 0.95 42.7 0.48
03.05.2012 53

Quantitative analysis of major and trace elements in volcanic glass
The quantification was performed using the M4 standardless quantification routine. 35 kV, 750 µA, 60 s Al/Ti/Cu-filter
Ga ~20 ppm Sr from 30 to 120 ppm
03.05.2012 54

Summary
• Unique speed and performance in the determination of the element distribution in large sample with measurement times per pixel of 0.3 ms and up to 4 Million pixels in a single HyperMap
• High spatial resolution down to 25 µm X-ray spot size, motors steps of 4 µm
• Optimal for the analysis of inhomogeneous samples, due to better identification of the representative location of interest
• Non-destructive, fast analysis of large samples without preparation, including solid, powder or liquid samples
• Qualitative and quantitative analysis of all elements from Na upwards, due to vacuum chamber, detection limit for heavy trace elements in the low ppm range
• Standardless Fundamental Parameter quantification with type calibration option
• Powerful software with multiple tools for optimal data mining
03.05.2012 55

03.05.2012 56
Geozentrum Nordbayern P. Schulte
Museum of Natural History, HU Berlin
D. Stöffler, P. Claeys, L. Hecht
Universidad Nacional Autónoma
de México J. Urrutia- Fucugauchi
Institute of Meteoritics, University of New Mexico H. Newsom
Institute for Planetology,
WWU Münster A. Deutsch
Natural History Museum London
A. Kearsley
International Continental Scientific
Drilling Program
Ocean Drilling Program

Innovation with Integrity
Copyright © 2012 Bruker Corporation. All rights reserved. www.bruker.com

03.05.2012 59
Sample Classification

03.05.2012 60
BSE Ca Si Fe Na

03.05.2012 61
BSE Ca Si Fe Na

03.05.2012 62
2 mm BSE Ca Si Fe Na

03.05.2012 63
Automated particle search • Binarization of BSE image
(Grayscale thresholds: 180-255)
• Morphological filtering (>3µm lengths, >2 µm widths)
• Chemical classification (Zr >55 wt.%%)
2 mm
Feature analysis Baddeleyite (ZrO2) at lunar meteorite
Composite BSE image of Dhofar 287A (9x5 mm)

03.05.2012 64
• 90 images scanned
• 997 grains analyzed in 86 min
• 11 baddeleyite grains were detected
6 µm
Feature analysis Baddeleyite (ZrO2) at lunar meteorite
Automated particle search • Binarization of BSE image
(Grayscale thresholds: 180-255)
• Morphological filtering (>3µm lengths, >2 µm widths)
• Chemical classification (Zr >55 wt.%%)
Composite BSE image of Dhofar 287A (9x5 mm)
2 mm

Measurement on a fish fossil from Solnhofen limestone
Conditions 50 keV 600 µA 1618x462 pixels 40 ms per pixel 40 µm step size 10h meas. Time 747516 single spectra
Mosaic image of the sample
Total x-ray intensity 03.05.2012 65
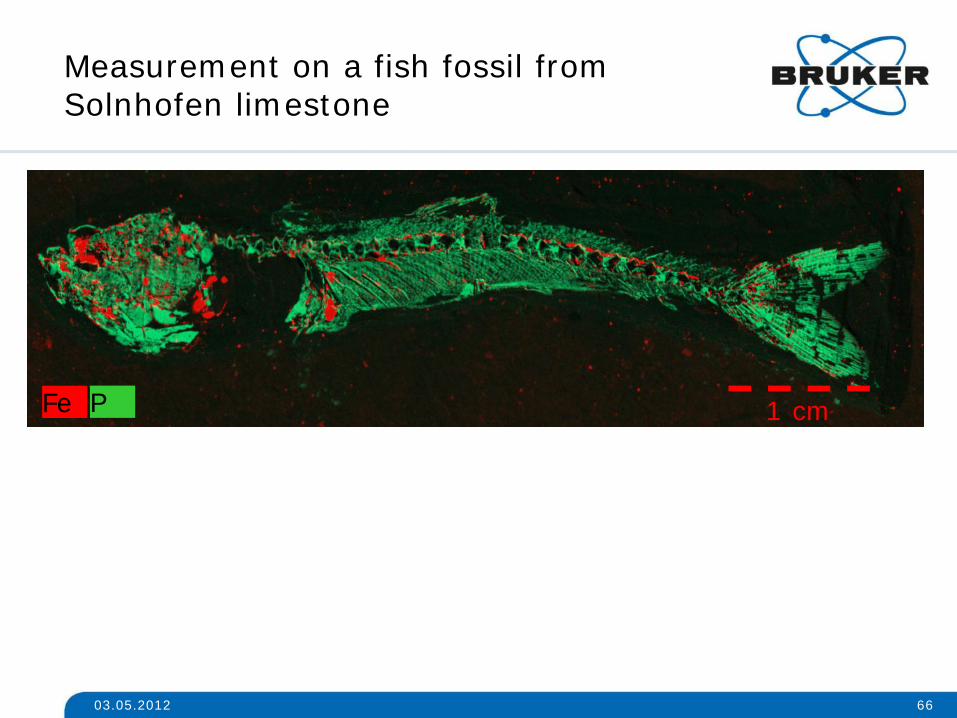
Measurement on a fish fossil from Solnhofen limestone
Fe P 1 cm
03.05.2012 66

M4 TORNADO High-end µ-XRF spectrometer
580
mm
Additional options • Second tube with
collimator e.g. W-anode for optimal detection heavy elements in trace concentration like Ag, Cd or Pd.
• Second detector for faster data acquisition
Complete instrument
03.05.2012 67