weber county, utah county cafr_… · 2014-12-31 · 2380 washington blvd., ste. 320 ogden, utah...
TRANSCRIPT

WEBER COUNTY, UTAH
Comprehensive Annual Financial Report
For the Year Ended December 31, 2014


WEBER COUNTY, UTAH COMPREHENSIVE ANNUAL FINANCIAL REPORT
For the Year Ended December 31, 2014
ELECTED OFFICIALS
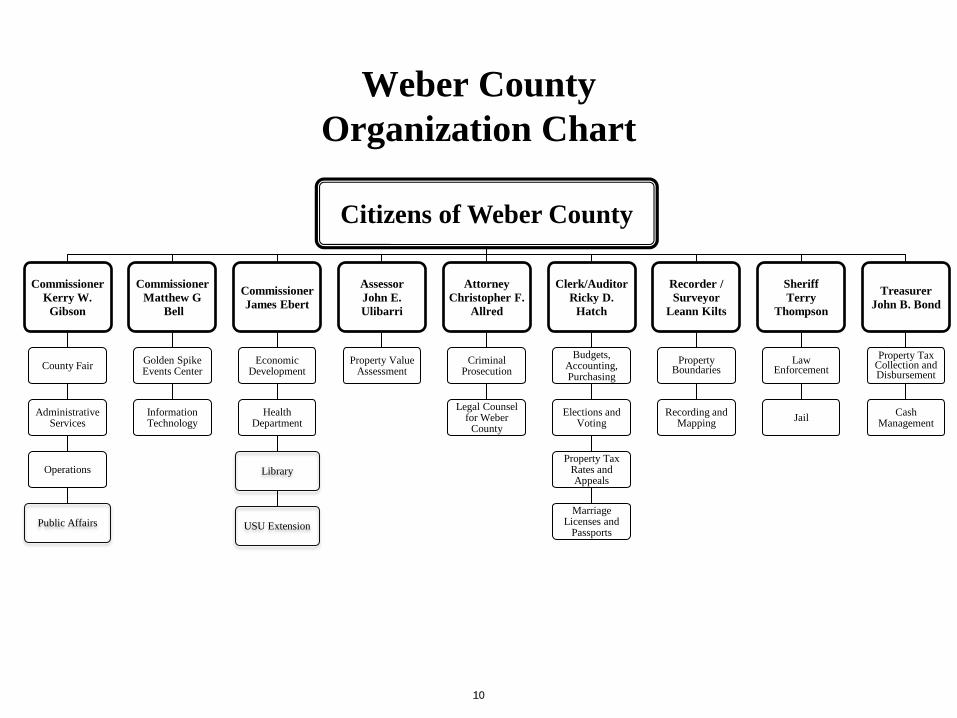
Matthew G. Bell ................................................................................................................ Commissioner Kerry W. Gibson ............................................................................................................... Commissioner James Ebert ........................................................................................................................ Commissioner John E. Ulibarri .......................................................................................................................... Assessor Christopher F. Allred .................................................................................................................. Attorney Ricky D. Hatch ................................................................................................................... Clerk/Auditor Leann Kilts ................................................................................................................. Recorder/Surveyor Terry Thompson ............................................................................................................................ Sheriff John B. Bond ............................................................................................................................. Treasurer
OTHER COUNTY OFFICIALS
Brian Bennion ................................................................................... Weber/Morgan Health Department Brad Dee ...................................................................................................................... Human Resources Jennifer Graham ....................................... Parks and Recreation/Golden Spike Events Center/Ice Sheet Leonard Call ...................................................................................................... Information Technology Lynnda Wangsgard ....................................................................................................................... Library L. Nate Pierce .......................................................................................................................... Operations
ACKNOWLEDGMENTS
This report is prepared by the Weber County Clerk/Auditor’s Office: Ricky D. Hatch, CPA, Clerk/Auditor
Scott Parke, CPA, Comptroller Eric Barrett, CPA, Assistant Comptroller Garaleen Parks, Lead Accountant
We express our appreciation to all of the departmental staff throughout the County whose extra time and effort made this report possible.
1111llllll lllll1

WEBER COUNTY, UTAH COMPREHENSIVE ANNUAL FINANCIAL REPORT
For the Year Ended December 31, 2014
Table of Contents
Introductory Section Page Title Page .............................................................................................................................................................. 1 Table of Contents.................................................................................................................................................. 2 Letter of Transmittal ............................................................................................................................................. 4 Certificate of Achievement for Excellence in Financial Reporting ...................................................................... 9 County Organization Chart ................................................................................................................................... 10
Financial Section Independent Auditors’ Report .............................................................................................................................. 12 Management’s Discussion and Analysis .............................................................................................................. 14 Basic Financial Statements Government-wide Financial Statements Statement of Net Position ....................................................................................................................... 24 Statement of Activities ........................................................................................................................... 25 Governmental Fund Statements Balance Sheet ......................................................................................................................................... 28 Reconciliation of the Balance Sheet – Governmental Funds to the Statement of Net Position .............. 30 Statement of Revenues, Expenditures, and Changes in Fund Balances ................................................. 32 Reconciliation of the Statement of Revenues, Expenditures, and Changes in Fund Balances – Governmental Funds to the Statement of Activities ..................................................... 34 Proprietary Fund Statements Statement of Net Position ....................................................................................................................... 36 Statement of Revenues, Expenses, and Changes in Fund Net Position .................................................. 37 Statement of Cash Flows ........................................................................................................................ 38 Fiduciary Fund Statements Statement of Fiduciary Net Position ....................................................................................................... 40 Statement of Changes in Fiduciary Net Position ................................................................................... 41 Component Unit Statements Combining Statement of Net Position .................................................................................................... 44 Combining Statement of Activities ....................................................................................................... 45 Notes to the Financial Statements ................................................................................................................. 46 Required Supplementary Information Information Related to Other Post-Employment Benefits .................................................................................... 75 Budgetary Comparison Schedule – General Fund ................................................................................................ 76 Budgetary Comparison Schedule – Library Fund ................................................................................................ 78 Budgetary Comparison Schedule – Paramedic Fund ............................................................................................ 79 Budgetary Comparison Schedule – Transportation Development Fund ............................................................... 80 Notes to Required Supplementary Information .................................................................................................... 82 Supplementary Information – Combining Statements and Budgetary Comparison Schedules for Individual
Nonmajor Governmental and Other Funds, and Other Schedules Governmental Funds Nonmajor Governmental Funds Combining Balance Sheet ...................................................................................................................... 86 Combining Statement of Revenues, Expenditures, and Changes in Fund Balances .............................. 88
2222llllll lllll2

Budgetary Compliance Budgetary Comparison Schedule – Municipal Services Fund ............................................................... 90 Budgetary Comparison Schedule – Tourism Fund ................................................................................. 91 Budgetary Comparison Schedule – Impact Fees Fund ........................................................................... 92 Budgetary Comparison Schedule – Municipal Building Authority Fund .............................................. 93 Budgetary Comparison Schedule – Redevelopment Agency Fund ........................................................ 94 Budgetary Comparison Schedule – RAMP Tax Fund ............................................................................ 95 Budgetary Comparison Schedule – Debt Service Fund ......................................................................... 96 Budgetary Comparison Schedule – Special Assessment Bond Fund ..................................................... 97 Budgetary Comparison Schedule – Capital Projects Fund ..................................................................... 98 Budgetary Comparison Schedule – Public Works Fund ........................................................................ 99 Proprietary Funds Internal Service Funds Combining Statement of Net Position .................................................................................................... 102 Combining Statement of Revenues, Expenses, and Changes in Net Position ........................................ 103 Combining Statement of Cash Flows ..................................................................................................... 104 Fiduciary Funds Private-Purpose Trust Funds Combining Statement of Fiduciary Net Position .................................................................................... 106 Combining Statement of Changes in Fiduciary Net Position ................................................................. 107 Agency Funds Combining Statement of Fiduciary Assets and Liabilities ..................................................................... 108 Combining Statement of Changes in Assets and Liabilities ................................................................... 109 Component Unit Weber Morgan Health Department Basic Fund Financial Statements Balance Sheet ......................................................................................................................................... 112 Statement of Revenues, Expenditures, and Changes in Fund Balances ................................................. 113 Other Schedules Tax Collection Agency Fund – Cash Receipts and Disbursements ............................................................... 116 Statement of Taxes Charged, Collected and Disbursed ................................................................................. 120 Schedule of Expenditures of Tourism Tax Revenues .................................................................................... 124
Statistical Section Index to the Statistical Section ............................................................................................................................. 127 Net Position by Component .................................................................................................................................. 128 Changes in Net Position ....................................................................................................................................... 130 Fund Balances – Governmental Funds ................................................................................................................. 132 Changes in Fund Balances – Governmental Funds .............................................................................................. 134 Property Tax Levies and Collections .................................................................................................................... 136 Assessed/Taxable and Estimated Market Value of Taxable Property .................................................................. 137 Property Tax Rates – Direct and Overlapping Governments – All Taxing Districts ............................................ 138 Principal Property Taxpayers ............................................................................................................................... 139 Legal Debt Margin ................................................................................................................................................ 140 Computation of Overlapping Debt ....................................................................................................................... 141 Ratios of Outstanding Debt to Personal Income, Assessed/Taxable Value, and Population ................................ 142 Ratios of General Bonded Debt Outstanding........................................................................................................ 144 Pledged Revenue Coverage .................................................................................................................................. 145 Demographic and Economic Indicators ................................................................................................................ 146 Largest Employers ................................................................................................................................................ 147 Full-Time Equivalent Employees by Function ..................................................................................................... 148 Operating Indicators by Function ......................................................................................................................... 149 Capital Asset Statistics by Function ..................................................................................................................... 150
3333llllll lllll3

2380 Washington Blvd., Ste. 320 � Ogden, Utah 84401-1456 � (801) 399-8400 � FAX (801) 399-8300
RICKY D. HATCH, CPA Clerk/Auditor
June 12, 2015
To the Citizens of Weber County and the Board of County Commissioners:
In accordance with Utah statutes, we are pleased to present the Comprehensive Annual Financial Report of Weber County (the County) for the year ended December 31, 2014. Responsibility for the accuracy of the data and the completeness and fairness of the presentation, including all disclosures, rests with the County’s management.
We believe the enclosed information accurately presents the County’s financial position and results of operations, in all material respects, in accordance with generally accepted accounting principles. We also believe we have included all disclosures necessary to enable the reader to gain an understanding of the County’s financial activities. These assertions are made on the basis of the County’s system of internal control over assets and liabilities recorded in the accounting system. These controls have been designed to provide reasonable, but not absolute, assurance of safeguarding assets against loss from unauthorized use or disposition, and to ensure the reliability of financial records for preparing financial statements. The concept of reasonable assurance recognizes that the cost of a control should not exceed the expected benefits, and that the evaluation of costs and benefits requires estimates and judgments by management.
The Report. The Comprehensive Annual Financial Report includes all funds of the County, and includes all departments, agencies, and other organizational units governed by the Board of County Commissioners. The report is presented in three sections: Introductory, Financial, and Statistical. The Introductory Section contains a list of principal officials, this transmittal letter, and the County’s organization chart. The Financial Section contains the independent auditors’ report, Management’s Discussion and Analysis (MD&A), the Basic Financial Statements, Required Supplementary Information, and Supplementary Information. The Statistical Section provides a history of selected financial, economic, and demographic information.
Management’s Discussion and Analysis (MD&A). The discussion and analysis beginning on page 14 provides an overview and analysis of the County’s recent financial performance. This letter of transmittal is intended to complement the MD&A and should be read in conjunction with it.
Independent Auditors. The Board of County Commissioners selected the firm Christensen, Palmer & Ambrose to perform the annual audit of the County. The firm conducted the audit in accordance with auditing standards generally accepted in the United States and the standards applicable to financial audits contained in Government Auditing Standards issued by the Comptroller General of the United States. The firm has issued an unmodified (“clean”) opinion on the County’s financial statements, as explained in the independent auditors’ report at the front of the Financial Section beginning on page 12.
Federal regulations also require the County to undergo an annual “Single Audit” in conformance with the Federal Single Audit Act of 1984, as amended, and the U.S. Office of Management and Budget Circular A–133, Audits of States, Local Governments, and Non-Profit Organizations. Information related to the Single Audit, including the schedule of expenditures of federal awards, audit findings and recommendations, summary of prior audit findings, and the auditors’ report, is issued in a separate report and is available upon request.
4444llllll lllll4

PROFILE OF THE COUNTY Geography and Demographics. Weber County is situated between the spectacular Wasatch Mountains on the east and the Great Salt Lake on the west, just 35 miles north of Salt Lake City and the Salt Lake International Airport. It is bordered by Box Elder and Cache Counties on the north and by Davis and Morgan Counties on the south. Over one-half of the County lies within the Cache National Forest, offering a variety of scenic, recreational, cultural, and historical attractions. The County occupies 662 square miles, of which approximately 315 square miles are mountain lands. The remaining 347 square miles are about evenly divided between urban areas, agricultural areas, and marshlands near the Great Salt Lake. The unincorporated areas make up approximately 73% of the County’s total land area but only 6% of the total population. Weber County has fifteen incorporated cities and towns. The oldest is Ogden City, which was formed in 1850. The other cities and towns are Roy, South Ogden, North Ogden, Washington Terrace, Riverdale, Pleasant View, Plain City, Harrisville, Huntsville, Farr West, Marriott-Slaterville, Uintah, West Haven, and Hooper. County residents are relatively young, well-educated, and come from a diverse mix of cultures, nationalities, and backgrounds. Although Weber is one of Utah’s smallest counties geographically, its population of approximately 240,475 makes it the fourth- most populous of the state’s 29 counties. Over the last ten years, the County’s population has grown by 30,928 (15%), or an average of 3,093 (1.5%) per year.
Government Structure. As shown in the organization chart on page 10, Weber County is governed by an elected three-member County Commission. Duties of the County Commission include levying property and sales taxes, appropriating funds for the various departments, and managing all County administrative affairs in general. The Commission also licenses and regulates businesses, exhibitions, and recreation within the unincorporated areas of the County. Six other elected officials serve four-year terms as various administrative officers for the County. The County provides services to both incorporated and unincorporated areas within the County. Services administered by the County include public safety, sanitation and health, highways and streets, planning and zoning, recreation, elections, and public libraries. The County also collects property taxes for all taxing entities within the County and distributes those funds to the entities each month. Budgetary Control. State statutes require that budgeted expenditures not exceed budgeted revenues and other sources of funding, including beginning fund balances. The County Commission adopts an annual budget for all governmental funds before December 31 for the following calendar year. Budgetary control is maintained on a division level, as required by state law, and any increases to budgeted revenues or expenditures for a division must be approved by the Commission after a public hearing. Other adjustments may be made to the budget throughout the year so that departments and funds do not end the year in a deficit position. For 2014, three funds exceeded their budgeted appropriation, as explained in the Notes to Required Supplementary Information on page 82.
5555llllll lllll5

ECONOMIC CONDITION AND OUTLOOK
Local Economy. Employers in Weber County posted a modest 3.0% net increase (2,842 jobs) in employment for calendar year 2014, with all industries adding jobs, with the exception of Leisure and Hospitality. Trade Transport Utilities led all sectors with a 4.2% increase (738 jobs), followed by Professional and Business Services and Construction at 5.3% (565 jobs) and 11.0% (539 jobs), respectively. Weber County’s unemployment rate averaged 4.3% for the year, a steady decline over the last four years when the rate remained at or above 5.2% every year. With a diversified employment base across many sectors, Weber County does not rely on just one industry to create and maintain jobs, and is therefore positioned well for further economic recovery.
The housing market continues its slow recovery, which is helping other sectors with modest growth as well. From 1999 through 2007, new building permits for single-family dwelling units averaged over 1,000 units per year. Since 2008, however, new permits have averaged only 345 units per year. 2014 showed a positive climb to 435 units, with an average per-unit value decrease of 4% to $240,000. Single-family units still account for over 63% of all new dwelling units built in the County, a ratio that has held steady for over a decade.
Weber County property values have continued to rise. While Lower Valley prices started to trend upward in 2012, both the Upper and Lower Valleys have shown notable gains when compared with past years. For 2014, the median price of a single-family home was $210,953, up 13.2% from 2013. Some volatility remains in the Upper Valley. Eden/Liberty’s 45.4% gain follows a previous 16.0% loss, and Huntsville’s 6.7% increase follows a 21.0% increase the previous year.
2014 2013 Year-Over
ZIP City Median Price Median Price % Change
Lower Valley:
84067 Roy $149,950 $138,000 8.7%
84315 Hooper / West Haven $253,000 $254,900 -0.7%
84401 Ogden / Marriott-Slaterville $151,025 $129,271 16.8%
84403 South Ogden $162,400 $131,000 24.0%
84404 Farr West / Plain City $149,500 $134,250 11.4%
84405 Riverdale / Washington Terrace $156,950 $157,900 -0.6%
84414 North Ogden / Pleasant View $200,000 $189,900 5.3%
Average, Lower Valley $174,689 $162,174 7.7%
Upper Valley:
84310 Eden / Liberty $367,500 $252,750 45.4%
84317 Huntsville $308,250 $289,000 6.7%
Average, Upper Valley $226,148 $197,662 14.4%
COUNTY AVERAGE MEDIAN PRICE $210,953 $186,330 13.2%
Source: Salt Lake Tribune , www.sltrib.com
6666llllll lllll6

New nonresidential construction has shown volatility over the last five years, with a significant 157% spike upward in 2011. For 2014, nonresidential construction values reached $66.8 million, an increase of 102% from last year. In total, new permit-authorized construction values increased 28.0% to total $ 275.6 million, 63% of which came from residential activities.
The data on permit-authorized construction suggest Weber County will continue to see marginal growth in property tax revenues for at least the next two years, but the worst of the economic downturn seems to be behind us. The County property tax revenues were flat for 2014, The County has estimated 1.0% growth for 2015. Gross taxable sales increased 5.5% over 2013, a positive sign that consumers continue to feel more confident about the overall
economy. Still, with rising prices for food and fuel, sales tax revenues are subject to quick fluctuations and will need to be monitored closely in the short term. For the coming year, the County budgeted $387,000 (4%) growth in sales tax revenues for the General Fund, and year-to-date collections in 2015 are on track to meet that target. Although the County’s economic outlook remains modest for the near term, budget surpluses from prior years have built healthy fund balances in all of the County’s major operating funds. With $9.7 million in unassigned fund balance, the General Fund should be able to absorb any short-term revenue shortfalls. Combined with the County’s traditionally conservative fiscal management and a diversified employment base that crosses many sectors, Weber County is well-positioned to realize solid long-term economic growth. Long-term Financial Planning and Policies Conservative Fiscal Management. Since 2004, General Fund revenues have increased an average of $1.7 million (3.7%) per year. Through conservative budgeting, steady economic growth, and a cost-savings focus, the County has used the excess revenues and cost savings to retire all of its interfund loans, fully fund the fleet program, begin a rolling five-year capital improvement program, retire several capital leases, and begin a systematic method of budgeting for retiree healthcare benefits. Major Initiatives On December 9th 2014, the County issued $7.2 million of sales tax and lease revenue bonds to refund portions of the 2003A and 2006 sales tax bonds and the 2005 lease revenue bond. The County saved $921 thousand by refinancing these bonds. After issuing the Series 2013 general obligation bonds, the County began construction of a new headquarters library facility in Roy in June 2014. The County has also begun to analyze the Main Library in downtown Ogden to better estimate the costs of renovation of that facility. Proceeds of the 2013 bonds
7777llllll lllll7

should be sufficient to complete the Roy building and most of the Ogden renovations. The County has approximately $10.3 million of authorized but unissued bonding authority remaining, pursuant to the bond election held in June 2013, which may be issued to complete the Ogden and North Ogden projects. In April 2014, the County paid $3.8 million to purchase a privately-run firearms training facility in the Weber Industrial Park from the Swanson Family Foundation. The State Legislature appropriated $1.5 million in the 2014 legislative session plus an additional $1.5 million in the 2015 legislative session to reimburse the County for a portion of the purchase price, with the expectation that the facility will be able to offer hunter safety and similar training to the public. The 2015 appropriation will be available to the County after July 1, 2015. On February 18, 2014, Weber County purchased approximately 11.5 acres of vacant land adjacent to the County jail for $2.3 million. Subsequent to the County’s purchase, the State Legislature appropriated up to $2.3 million to acquire some or all of the same property from the County in anticipation of constructing a state-run juvenile detention and youth services facility. Negotiations between the County and the State will continue through 2015 as the State and County determine their specific future plans for the property.
CERTIFICATE OF ACHIEVEMENT The Government Finance Officers Association of the United States and Canada (GFOA) awarded a Certificate of Achievement for Excellence in Financial Reporting to Weber County for its 2013 comprehensive annual financial report. This was the 23rd consecutive year the County has received this prestigious award. In order to be awarded a Certificate of Achievement, a government must publish an easily readable and efficiently organized comprehensive annual financial report. This report must satisfy both generally accepted accounting principles and applicable legal requirements. A Certificate of Achievement is valid for a period of one year only. We believe our current comprehensive annual financial report meets the Certificate of Achievement Program’s requirements, and we are submitting it to the GFOA to determine its eligibility for another certificate. CONCLUSION We believe this report provides useful information in evaluating the financial condition of the County. The preparation of this report is a team effort by the County Clerk/Auditor staff and other departments. We extend our appreciation for their ongoing commitment to excellence in financial reporting and for their continuing effort in providing world-class, friendly service to the citizens of Weber County. Sincerely, Ricky D. Hatch, CPA Clerk/Auditor
8888llllll lllll8

9999llllll lllll9
Citizens of Weber County
Commissioner
Kerry W.
Gibson
County Fair
Administrative Services
Operations
Public Affairs
Commissioner
Matthew G
Bell
Golden Spike Events Center
Information Technology
Commissioner
James Ebert
Economic Development
Health Department
Library
USU Extension
Assessor
John E.
Ulibarri
Property Value Assessment
Attorney
Christopher F.
Allred
Criminal Prosecution
Legal Counsel for Weber
County
Clerk/Auditor
Ricky D.
Hatch
Budgets, Accounting, Purchasing
Elections and Voting
Property Tax Rates and Appeals
Marriage Licenses and
Passports
Recorder /
Surveyor
Leann Kilts
Property Boundaries
Recording and Mapping
Sheriff
Terry
Thompson
Law Enforcement
Jail
Treasurer
John B. Bond
Property Tax Collection and Disbursement
Cash Management
Weber County
Organization Chart
10101010llllll lllll10

Financial Section
11111111llllll lllll11

Christensen, Palmer & Ambrose Certified Public Accountants
Business Advisors
INDEPENDENT AUDITORS' REPORT
The Board of County Commissioners Weber County, Utah
Report on the Financial Statements
Kent R. Christensen, CPA Jeffrey L. Ambrose, CPA
Chuck Palmer, CPA
We have audited the accompanying fmancial statements of the governmental activities, the business-type activities, the aggregate discretely presented component units, each major fund, and the aggregate remaining fund information of Weber County (the County), as of and for the year ended December 31, 2014, and the related notes to the fmancial statements, which collectively comprises the County's basic fmancial statements as listed in the table of contents.
Management's Responsibility for the Financial Statements
Management is responsible for the preparation and fair presentation of these fmancial statements in accordance with accounting principles generally accepted in the United States of America; this includes the design, implementation, and maintenance of internal control relevant to the preparation and fair presentation of fmancial statements that are free from material misstatement, whether due to fraud or error.
Auditor's Responsibility
Our responsibility is to express opinions on these fmancial statements based on our audit. We did not audit the fmancial statements of the Weber Housing Authority which is shown as a discretely presented component unit. Those statements were audited by other auditors whose reports have been furnished to us, and our opinion, insofar as it relates to the amounts included for the Weber Housing Authority, is based solely on the reports of such other auditors. We conducted our audit in accordance with auditing standards generally accepted in the United States of America and the standards applicable to fmancial audits contained in Government Auditing Standards, issued by the Comptroller General of the United States. Those standards require that we plan and perform the audit to obtain reasonable assurance about whether the fmancial statements are free of material misstatement.
An audit involves performing procedures to obtain audit evidence about the amounts and disclosures in the fmancial statements. The procedures selected depend on the auditor's judgment, including the assessment of the risks of material misstatement of the fmancial statements, whether due to fraud or error. In making those risk assessments, the auditor considers internal control relevant to the County's preparation and fair presentation of the fmancial statements in order to design audit procedures that are appropriate in the circumstances, but not for the purpose of expressing an opinion on the effectiveness of the County's internal control. Accordingly, we express no such opinion. An audit also includes evaluating the appropriateness of accounting policies used and the reasonableness of significant accounting estimates made by management, as well as evaluating the overall presentation of the fmancial statements.
We believe that the audit evidence we have obtained is sufficient and appropriate to provide a basis for our audit opinions.
Opinions
In our opinion, based on our audit and the report of other auditors, the fmancial statements referred to above present fairly, in all material respects, the respective fmancial position of the governmental activities, the business-type activities, the aggregate discretely presented component units, each major fund, and the aggregate remaining fund information of the County, as of December 31, 2014, and the respective changes in fmancial position, and, where applicable, cash flows thereof for the year then ended in accordance with accounting principles generally accepted in the United States of America.
298 24th Street, Suite 300 • Ogden, UT 84401 • Phone: 801.627.2060 • Fax: 801.627.2182 • www.ogden-cpas.com

Other Matters
Required Supplementary Information
Accounting principles generally accepted in the United States of America require that the management's discussion and analysis and required supplementary information as listed in the table of contents be presented to supplement the basic fmancial statements. Such information, although not a part of the basic fmancial statements, is required by the Governmental Accounting Standards Board, who considers it to be an essential part of fmancial reporting for placing the basic fmancial statements in an appropriate operational, economic, or historical context. We have applied certain limited procedures to the required supplementary information in accordance with auditing standards generally accepted in the United States of America, which consisted of inquiries of management about the methods of preparing the information and comparing the information for consistency with management's responses to our inquiries, the basic fmancial statements, and other knowledge we obtained during our audit of the basic fmancial statements. We do not express an opinion or provide any assurance on the information because the limited procedures do not provide us with sufficient evidence to express an opinion or provide any assurance.
Other Information
Our audit was conducted for the purpose of forming opinions on the fmancial statements that collectively comprise the County's basic fmancial statements. The introductory section, supplementary information on pages 86-124, and statistical section, are presented for purposes of additional analysis and are not a required part of the basic fmancial statements.
The supplementary information on pages 86-124 are the responsibility of management and were derived from and relate directly to the underlying accounting and other records used to prepare the basic fmancial statements. Such information has been subjected to the auditing procedures applied in the audit of the basic fmancial statements and certain additional procedures, including comparing and reconciling such information directly to the underlying accounting and other records used to prepare the basic fmancial statements or to the basic fmancial statements themselves, and other additional procedures in accordance with auditing standards generally accepted in the United States of America. In our opinion, the supplementary information on pages 86-124 are fairly stated in all material respects in relation to the basic fmancial statements as a whole.
The introductory and statistical sections have not been subjected to the auditing procedures applied in the audit of the basic fmancial statements and, accordingly, we do not express an opinion or provide any assurance on them.
Other Reporting Required by Government Auditing Standards
In accordance with Government Auditing Standards, we have also issued our report dated June 12, 2015, on our consideration of the County's internal control over fmancial reporting and on our tests of its compliance with certain provisions of laws, regulations, contracts, and grant agreements and other matters. The purpose of that report is to describe the scope of our testing of internal control over fmancial reporting and compliance and the results of that testing, and not to provide an opinion on internal control over fmancial reporting or on compliance. That report is an integral part of an audit performed in accordance with Government Auditing Standards in considering the County's internal control over fmancial reporting and compliance.
June 12,2015

WEBER COUNTY, UTAH MANAGEMENT’S DISCUSSION AND ANALYSIS
Year Ended December 31, 2014
INTRODUCTION The following is a discussion and analysis of Weber County’s financial performance and activities for the year ended December 31, 2014. Please read it in conjunction with the transmittal letter in the Introductory Section of this report and with the financial statements that follow. HIGHLIGHTS Government-wide Level
• Net position increased a by $16.4 million (9.8%) primarily from grant-funded infrastructure projects. Capital Assets and Long-term Liabilities
• The County’s capital assets increased by $22.3 million (15.3%) primarily because of construction in progress related to the new county library ($6.4 million), infrastructure projects related to flood control ($7.5 million), and construction of public infrastructure ($5.5 million) related to the special assessment bond issued in 2013.
• The County issued $7.2 million of sales tax and lease revenue bonds to refund portions of the 2003A and 2006 sales tax bonds and the 2005 lease revenue bond. The County saved $921 thousand by refinancing these bonds.
Fund Level
• The General Fund ended the year with an unassigned fund balance of $9.7 million, which equals the industry’s recommended level of 15% of revenues.
• The County received $6.2 million in federal funds and $2.4 million in state funds to continue flood mitigation projects in the western part of the County.
OVERVIEW OF THE FINANCIAL STATEMENTS This discussion and analysis is an introduction to the County’s Basic Financial Statements. The Basic Financial Statements include three components: 1) government-wide financial statements, 2) fund financial statements, and 3) notes to the financial statements. In addition to the Basic Financial Statements, this report also contains other supplementary information, including combining statements for nonmajor funds and a statistical section. Government-wide Statements – Reporting the County as a Whole The Statement of Net Position and the Statement of Activities comprise the government-wide financial statements. These statements provide a broad overview with a long-term focus of the County’s finances as a whole and are prepared using the full-accrual basis of accounting, similar to private-sector companies. This means all revenues and expenses are recognized regardless of when cash is received or spent, and all assets and liabilities, including capital assets and long-term debt, are reported at the entity level. The government-wide statements report the County’s net position and how it has changed from the prior year. Over time, increases and decreases in net position measure whether the County’s overall financial condition is getting better or worse. In evaluating the government’s overall condition, however, additional non-financial factors should be considered, such as the County’s economic outlook, changes in its demographics, and the condition of its capital assets and infrastructure. The government-wide statements distinguish functions of the County that are principally supported by taxes and intergovernmental revenues (governmental activities) from other functions that are intended to recover all or most of their costs through user fees and charges (business-type activities). Weber County’s governmental activities include general government, public safety, public health, library services, streets and public improvements, parks and recreation activities, and conservation and development programs. The County has three business-type activities, two of which are related to the operation and maintenance of a solid waste transfer station and former landfill site, and one related to the County-run animal shelter. Fund Financial Statements – Reporting the County’s Most Significant Funds The fund financial statements provide detailed information about individual major funds, not the County as a whole. A fund is a group of related accounts that the County uses to keep track of specific resources that are segregated for a specific purpose. Some funds are required by law to exist, while others are established internally to maintain control over a particular activity. The County’s funds are divided into three types:
14141414llllll lllll14

WEBER COUNTY, UTAH MANAGEMENT’S DISCUSSION AND ANALYSIS
Year Ended December 31, 2014
Governmental Funds – Most of the County’s basic services are accounted for in governmental funds and are essentially the same functions reported as governmental activities in the government-wide statements. Governmental funds use the modified accrual basis of accounting, which measures the flow of current financial resources that can be converted to cash and the balances left at year-end that are available for future spending. This short-term view of the County’s financial position helps determine whether the County has sufficient resources to cover expenditures for its basic services in the near future. Proprietary Funds – Weber County uses two different types of proprietary funds. Enterprise funds are used to report the same activities presented as business-type activities in the government-wide financial statements. The County has three enterprise funds: the Solid Waste Transfer Station Fund, the Landfill Gas Recovery Fund, and the Animal Shelter Fund. Internal service funds are an accounting device used to accumulate and allocate costs internally among the County’s various functions. The County maintains two internal service funds to account for its fleet management and risk management activities. Because these services predominantly benefit governmental rather than business-type activities, they are included with governmental activities in the government-wide statements. Fiduciary Funds – Fiduciary funds account for resources held for the benefit of parties outside the government. Fiduciary funds use full-accrual accounting, but they are not included in the government-wide statements because the assets in these funds are not available to finance the County’s own programs. Reconciliation Between Government-wide and Fund Statements The financial statements include schedules that reconcile the amounts reported for governmental activities on the government-wide statements with amounts reported on the governmental fund statements. Following are some of the major differences between the two statements:
• Capital assets and long-term debt are included on the government-wide statements but are not included on the governmental fund statements.
• Capital spending produces assets on the government-wide statements but is considered an expenditure on the governmental fund statements.
• Delinquent property tax revenues that are owed to the County but not yet collected are reported as revenue on the government-wide statements but are deferred inflows on the governmental fund statements.
Notes to the Financial Statements The notes provide additional information that is essential to a complete understanding of the financial statements, and they apply to both the government-wide and fund financial statements. Required Supplementary Information Weber County adopts an annual budget for all of its governmental funds. This report includes budgetary comparison schedules for the County’s General Fund and major special revenue funds. The County also reports the progress it has made in funding its other post-employment benefits (OPEB) plan in a separate required schedule. Supplementary Information This section includes combining statements for the County’s nonmajor governmental funds, internal service funds, private-purpose trust funds, and agency funds. This section also includes budgetary comparisons for nonmajor governmental funds and statutorily required schedules related to tourism taxes and property tax collections. Statistical Information This section provides up to ten years of financial, economic, and demographic information about the County.
15151515llllll lllll15

WEBER COUNTY, UTAH MANAGEMENT’S DISCUSSION AND ANALYSIS
Year Ended December 31, 2014
FINANCIAL ANALYSIS OF THE COUNTY AS A WHOLE Net Position The largest component of the County’s net position, 69%, is composed of capital assets (land, buildings, equipment, roads, and other infrastructure), net of all outstanding debt that was issued to buy or build those assets. As capital assets, these resources are not available for future spending, nor can they all be readily liquidated to pay off the related liabilities. Resources needed to repay capital-related debt must be provided from other sources. Restricted net position comprises 24% of total net position and is subject to external restrictions on how the resources may be used. The remaining 7% of net position is unrestricted and may be used at the County’s discretion to meet its ongoing obligations to citizens and creditors.
Changes in Net Position The County’s combined net position increased by $16.4 million (9.8%) from the prior year. Net position of governmental activities increased $16.7 million (10.6%), while the net position of business-type activities decreased $345 thousand, (3.4%). The following charts and schedules summarize the County’s revenues and expenses relative to each other and to the prior year.
Weber County
Net Position as of December 31
Governmental Business-type
Activities Activities Total
2014 2013 2014 2013 2014 2013
Current and Other Assets.................... 117,616,921$ 132,177,213$ 489,417$ 713,107$ 118,106,338$ 132,890,320$
Capital Assets........................................ 168,163,110 145,859,774 12,090,907 12,536,870 180,254,017 158,396,644
Total Assets..................................... 285,780,031 278,036,987 12,580,324 13,249,977 298,360,355 291,286,964
Total Deferred Outflows
of Resources................................. 1,679,817 1,659,918 20,839 — 1,700,656 1,659,918
Current and Other Liabilities................ 7,567,070 5,772,140 568,964 488,626 8,136,034 6,260,766
Long-term Liabilities............................. 105,940,931 104,386,781 2,292,286 2,642,056 108,233,217 107,028,837
Total Liabilities............................... 113,508,001 110,158,921 2,861,250 3,130,682 116,369,251 113,289,603
Net Position:
Net Investment in Capital Assets.... 120,865,911 102,390,851 11,255,612 11,467,927 132,121,523 113,858,778
Restricted............................................. 41,782,851 37,951,506 — — 41,782,851 37,951,506
Unrestricted......................................... 11,303,085 16,891,021 (1,515,699) (1,382,373) 9,787,386 15,508,648
Total Net Position........................... 173,951,847$ 157,233,378$ 9,739,913$ 10,085,554$ 183,691,760$ 167,318,932$
Percent change from prior year 10.6% (3.4)% 9.8%
16161616llllll lllll16

WEBER COUNTY, UTAH MANAGEMENT’S DISCUSSION AND ANALYSIS
Year Ended December 31, 2014
Governmental Activities In total, revenues for all governmental activities increased $21.2 million (18.7%) from the prior year. Of this amount, $8.6 million came from the federal and state governments as reimbursements for flood mitigation projects. A change in how sales tax revenue is collected and distributed resulted in an increase of sales tax revenue and streets and public improvement expense of $15.9 million. Property tax revenues were essentially flat compared to the prior year. Total governmental expenses increased $9.0 million (8.3%) over the prior year. Much of this increase came from significant costs of flood mitigation projects that were paid for using federal grant funds, and from grants awarded from the County’s restricted ¼% transportation sales tax that has accumulated since 2008. The table on the following page shows to what extent the County’s governmental activities relied on self-generated revenues to cover program costs. For 2014, these activities covered $48.9 million (41.5%) of their total expenses through grants and charges for services. Taxes and other general revenues covered the remaining 58.5% of expenses.
Weber County
Changes in Net Position
For the Year Ended December 31Total
Governmental Business-type Percent
Activities Activities Total Change
2014 2013 2014 2013 2014 2013 2013 to 2014
General Revenues:
Taxes..................................................... 84,733,552$ 64,583,139$ —$ —$ 84,733,552$ 64,583,139$ 31.2 %
Other General Revenues........................ 867,181 466,834 134 1,638 867,315 468,472 85.1
Program Revenues:
Charges for Services.............................. 30,563,670 33,780,848 8,348,907 7,388,336 38,912,577 41,169,184 (5.5)
Operating Grants.................................... 5,995,310 13,866,471 — — 5,995,310 13,866,471 (56.8)
Capital Grants........................................ 12,319,747 576,865 — — 12,319,747 576,865 2,035.6
Total Revenues 134,479,460 113,274,157 8,349,041 7,389,974 142,828,501 120,664,131 18.4
General Government.............................. 23,325,818 21,101,639 — — 23,325,818 21,101,639 10.5
Public Safety.......................................... 38,167,752 38,541,683 — — 38,167,752 38,541,683 (1.0)
Public Health and Welfare..................... 2,308,236 12,760,881 — — 2,308,236 12,760,881 (81.9)
Library Services..................................... 8,028,348 8,239,781 — — 8,028,348 8,239,781 (2.6)
Streets and Public Improvements........... 23,052,288 9,452,096 — — 23,052,288 9,452,096 143.9
Parks, Recreation & Public Facilities.... 14,084,346 15,230,970 — — 14,084,346 15,230,970 (7.5)
Conservation and Development............. 5,141,561 1,212,147 — — 5,141,561 1,212,147 324.2
Interest on Long-term Debt.................... 3,652,642 2,244,962 — — 3,652,642 2,244,962 62.7
Business Type Activities....................... — — 8,860,260 8,755,684 8,860,260 8,755,684 1.2
Total Expenses 117,760,991 108,784,159 8,860,260 8,755,684 126,621,251 117,539,843 7.7
Excess (deficit) Before Special Items 16,718,469 4,489,998 (511,219) (1,365,710) 16,207,250 3,124,288
— — 165,578 1,710,607 165,578 1,710,607
16,718,469 4,489,998 (345,641) 344,897 16,372,828 4,834,895
169,537,984 165,047,986 10,119,295 9,774,398 179,657,279 174,822,384
Adjustment to Net Position.................... (12,304,606) — (33,741) — (12,338,347) —
157,233,378 165,047,986 10,085,554 9,774,398 167,318,932 174,822,384
173,951,847$ 169,537,984$ 9,739,913$ 10,119,295$ 183,691,760$ 179,657,279$ 2.2 %Net Position - Ending..............................
Special Items.............................................
Revenues
Expenses
Change in Net Position............................
Net Position - Beginning...........................
Net Position - Beginning as Adjusted........
17171717llllll lllll17

WEBER COUNTY, UTAH MANAGEMENT’S DISCUSSION AND ANALYSIS
Year Ended December 31, 2014
Business-type Activities Business type revenues increased by $960 thousand primarily due a rebound of revenues at the Transfer Station, which spent much of 2013 under construction after a fire in 2012 destroyed the main tipping building. Operating expenses increased by $105 thousand (1.2%) primarily due to increased disposal costs. Overall, net position for all business-type activities decreased $345 thousand (3.5%) and ended the year at $9.7 million. CAPITAL ASSETS AND LONG-TERM DEBT ADMINISTRATION Capital Assets The County’s capital assets increased by $22.3 million (15.3%) primarily because of construction in progress related to the new county library ($6.4 million), infrastructure projects related to flood control ($7.5 million), and construction of a public road and public water and sewer infrastructure on private property adjacent to Powder Mountain Ski Resort ($5.5 million) related to the special assessment bond issued in 2013. Long-term Debt During the year, the County issued the 2014A and B Sales Tax bonds to refund $610 thousand of the Series 2003A and $4.17 million of the Series 2006 Sales Tax Project bonds, resulting in net savings of $498 thousand. The County also issued the Series 2014 Lease Revenue bonds to refund the $3.99 million of outstanding Series 2005 Lease Revenue bonds, resulting in net savings of $423 thousand. The County’s received a AAA rating on its sales tax bonds and a AA- on its lease revenue bonds by Standard and Poors. The following table presents changes in Weber County’s long-term obligations relative to the prior year. Note 9 provides more details on the County’s long-term debt position.
Weber County
Net Cost of Governmental Activities
For the Year Ended December 31
Less Net Program Revenues
Program Program Program as a Percentage of
Expenses Revenues Costs Program Expenses
2014 2014 2014 2013 2014 2013
General Government................................. 23,325,818$ (12,770,952)$ 10,554,866$ 10,628,674$ 54.8 % 49.6 %
Public Safety............................................. 38,167,752 (15,191,298) 22,976,454 22,741,900 39.8 41.0
Public Health and Welfare........................ 2,308,236 — 2,308,236 3,767,599 0.0 70.5
Library Services........................................ 8,028,348 (1,074,910) 6,953,438 7,413,288 13.4 10.0
Streets and Public Improvements.............. 23,052,288 (13,713,016) 9,339,272 1,422,464 59.5 85.0
Parks, Recreation & Public Facilities........ 14,084,346 (5,319,132) 8,765,214 11,144,314 37.8 26.8
Conservation and Development................. 5,141,561 (809,419) 4,332,142 1,196,774 15.7 1.3
Interest on Long-term Debt....................... 3,652,642 — 3,652,642 2,244,962 ― ―
Total Governmental Activities............... 117,760,991$ (48,878,727)$ 68,882,264$ 60,559,975$ 41.5 % 44.3 %
Activities:
Weber County
Long-term Liabilities
For the Year Ended December 31Total
Governmental Business-type Percent
Activities Activities Total Change
2014 2013 2014 2013 2014 2013 2013 to 2014
General Obligation Bonds, net.................. 41,624,690$ 43,376,364$ —$ —$ 41,624,690$ 43,376,364$ (4.0) %
Sales Tax Revenue Bonds, net................. 14,009,611 14,519,555 640,000 738,217 14,649,611 15,257,772 (4.0)
Lease Revenue Bonds, net........................ 14,703,744 18,185,992 — — 14,703,744 18,185,992 (19.1)
Special Assement Area Bonds, net......... 18,558,725 18,608,099 — — 18,558,725 18,608,099 (0.3)
Capital Leases............................................. 50,969 159,022 195,293 335,431 246,262 494,453 (50.2)
Compensated Absences............................ 9,186,779 3,177,310 106,123 86,040 9,292,902 3,263,350 184.8
Net OPEB Obligation.................................. 7,806,413 6,360,439 — 165,578 7,806,413 6,526,017 19.6
Landfill Post-Closure Costs...................... — — 1,350,870 1,316,790 1,350,870 1,316,790 2.6
105,940,931 104,386,781 2,292,286 2,642,056 108,233,217 107,028,837 1.1 %
18181818llllll lllll18

WEBER COUNTY, UTAH MANAGEMENT’S DISCUSSION AND ANALYSIS
Year Ended December 31, 2014
FINANCIAL ANALYSIS OF THE COUNTY’S GOVERNMENTAL FUND
Fund Balances At December 31, Weber County’s governmental funds reported combined fund balances of $105 million, an decrease of $12.1 million (10.3%) from 2013. Changes in fund balance varied widely among the County’s individual funds and will be explained below. Of the total fund balances, $71.4 million (68%) is restricted or committed for various purposes, such as debt service and future capital projects, and is therefore unavailable for discretionary spending. Another $23.8 million (22.7%) is available for new spending subject to the requirements of the funds in which the balances reside. The remaining $9.7 million (9.3%) is unassigned and available for new spending in the General Fund. The table on above presents the County’s 2014 ending governmental fund balances. General Fund During 2014, fund balance in the General Fund decreased $4.1 million (23.6%) mostly due to the purchase of the Swanson Tactical Center for $3.8 million offset by grants from the State of Utah in the amount of $1.5 million, and the purchase of land adjacent to the County jail for $2.3 million. The unassigned fund balance ended the year at 15% of the current year’s revenues and is within the limits allowed by state law. Revenues. General fund revenues increased by $6.1 million (10.5%) over prior years due to an increase in sales tax revenue of $508 thousand (5.5%), increased grant revenue of $2.0 million (222%) mostly related to the Swanson Tactical Center, and an increase in Charges for Services of $3.5 million, mostly related to the Ogden Eccles Conference Center which was previously reported as a Special Revenue Fund, as described in Note 2 of the financial statements. Property tax revenue growth was flat in 2014. Expenditures. In 2014, total expenditures increased by $7.5 million (13.4%) from the prior year due almost entirely to a change in how expenditures for the Ogden Eccles Conference Center, the Ice Sheet, and the Golden Spike Events Center are reported, as described in Note 2 of the financial statements. Budgetary Highlights. The following are major amendments to the General Fund budget that were made during the year:
• Budgeted transfers out of the General Fund were increased by $6.6 million to allow for the purchase of the Swanson Tactical Center ($3.8 million), the purchase of approximately 11.5 acres of vacant land adjacent to the County jail ($2.3 million), and the purchase of the Home Abstract Office in the Weber County Center ($500 thousand). The State Legislature appropriated $1.5 million to reimburse the County for a portion of the Tactical Center purchase price.
• Public Safety’s budget increased by $206 thousand to purchase a body scanner.
Weber County
Governmental Fund Balances
December 31, 2014Change
Nonspendable Restricted Committed Assigned Unassigned Total from 2013
General Fund........................ 44,607$ 558,891$ —$ 3,027,747$ 9,719,904$ 13,351,149$ (23.6)%
Library Fund......................... — — — 3,773,704 — 3,773,704 3.7%
Paramedic Fund................... — — — 3,864,314 — 3,864,314 8.2%
Transportation Fund........... — — 33,309,032 — — 33,309,032 13.0%
Debt Service Fund............... — — — 3,193,130 — 3,193,130 8.3%
Capital Projects Fund.......... — 27,887,365 148,051 1,347,402 — 29,382,818 (17.6)%
Public Works Fund............. — 3,537,776 — 279,005 — 3,816,781 (58.8)%
Nonmajor Funds.................. — 6,000,896 — 8,314,455 — 14,315,351 (5.1)%
Total................................... 44,607$ 37,984,928$ 33,457,083$ 23,799,757$ 9,719,904$ 105,006,279$ (10.3)%
19191919llllll lllll19

WEBER COUNTY, UTAH MANAGEMENT’S DISCUSSION AND ANALYSIS
Year Ended December 31, 2014
• Homeland Security’s budget increased by $224 thousand for various grants it received during the year.
Actual General Fund revenues were $849 thousand (1.3%) above the final budget. Actual expenditures were $870 thousand (1.3%) and $3.5 million (5.1%) below the original and final budgets, respectively. This was the tenth year in a row that actual expenditures of the General Fund came in below the original budget. The budgetary comparison schedule presents budget-to-actual results for all major revenue sources in, and each department of, the General Fund. Transportation Development Fund During 2014, the County paid $2.4 million on nine different transportation projects that will be completed through 2018. Expenditures for these awards are made as reimbursements to the cities and County as the projects are constructed. Also, as described previously, the County changed the way it records sales tax revenue earmarked for transportation, resulting in an increase of sales tax revenue and transportation related expenses of $15.9 million. Public Works Fund. In 2012 the County received a federal grant of up to $14.3 million toward flood mitigation projects in the western part of the County. The grant is reimbursement-based and requires a 25% match from the County. During 2014 the State of Utah also contributed $2.4 million towards costs of improving certain areas on state land near the mouth of the Weber River. For 2014, the County spent $9.5 million on flood mitigation projects, for which it received approximately $6.2 million in federal reimbursements and $2.4 million in state assistance. The projects are expected to continue through 2015. The Public Works Fund also includes costs of construction for the Summit Mountain Special Assessment Area. The fund ended the year with a balance of $3.8 million, most of which is bond proceeds that are restricted for the Summit project. Nonmajor Governmental Funds Weber County’s nonmajor funds had combined fund balances of $14.3 million, a decrease of $762 thousand (5.1%) from the prior year. Following are significant issues related to the County’s nonmajor funds:
Municpal Services Fund. The County’s property and sales tax revenue related to the unincorporated area increased by $83 thousand (3.7%) and permit and fee revenue increased by $167 thousand. At the same time, costs for services increased by $482 thousand (10.2%), primarily due to increases in public safety and road maintenance costs. These increases in costs were partially offset by a one-time revenue of $200 thousand related to forfeited escrow balances from third party developers. These funds will be used to maintain roads and infrastructure in recently developed areas within the unincorporated parts of the county.
20202020llllll lllll20

WEBER COUNTY, UTAH MANAGEMENT’S DISCUSSION AND ANALYSIS
Year Ended December 31, 2014
Tourism Fund. The County’s tourism-related sales tax collections increased $360 thousand (8.8%) due mostly to increased restaurant tax collections. Restaurant and leased vehicle taxes were used to subsidize operations of the Ogden Eccles Conference Center and Golden Spike Events Center. Transient room taxes were used to partially fund a free shuttle service from downtown hotels to local ski resorts and to provide funding to the Ogden/Weber Convention and Visitor’s Bureau for promoting Weber County to outside tour groups. Transient room taxes are also used to help fund the GOAL Foundation’s annual events, including the Ogden Marathon.
RAMP Tax Fund. RAMP sales tax revenues increased slightly by $82 thousand (5.7 %). The County paid out $2.0 million less in RAMP grants than the prior year because several entities have not yet completed eligibility requirements of prior years’ awards and will be paid their grant in future years when they meet the eligibility requirements. As a result, the fund balance increased by $907 thousand (29.8%) over the prior year.
Special Assessment Bond Fund. This fund was established in 2013 to account for principal and interest payments on the County’s special assessment bonds. The entire fund balance of $3.7 million is made of reserve accounts that are restricted for future debt service payments.
FINANCIAL ANALYSIS OF THE COUNTY’S PROPRIETARY FUNDS
Results of operations for the County’s enterprise funds mirror the discussion above under the heading “Business-type Activities” and need not be repeated here. Internal service fund activities for 2014 were as follows:
Risk Management Fund Charges to departments for risk management services were essentially flat, increasing by less than $8 thousand (0.7%). Expenses decreased by $257 thousand (20.8%), the result of fewer self-insured claims during the year. Net position increased by $209 thousand (11.5%) overall, ending the year at $2.0 million.
Fleet Management Fund During the year, the Fleet Fund purchased 24 replacement vehicles with cash and disposed of 27 older vehicles. The Fleet Fund ended the year with $1.0 million in unrestricted net position.
OTHER MATTERS
The following issues may impact Weber County’s future financial position:
Library Bonds and Construction After issuing the Series 2013 general obligation bonds, the County began construction of a new headquarters library facility in Roy in June 2014. The County has also begun to analyze the Main Library in downtown Ogden to better estimate the costs of renovation of that facility. Proceeds of the 2013 bonds should be sufficient to complete the Roy building and most of the Ogden renovations. The County has approximately $10.3 million of authorized but unissued bonding authority remaining, pursuant to the bond election held in June 2013, which may be issued to complete the Ogden and North Ogden projects.
Swanson Tactical Training Facility In April 2014, the County paid $3.8 million to purchase a privately-run firearms training facility in the Weber Industrial Park from the Swanson Family Foundation. The State Legislature appropriated $1.5 million in the 2014 legislative session plus an additional $1.5 million in the 2015 legislative session to reimburse the County for a portion of the purchase price, with the expectation that the facility will be able to offer hunter safety and similar training to the public. The 2015 appropriation will be available to the County after July 1, 2015.
Weber County Tourism Tax Revenues
For the Year Ended December 31Percent
2014 2013 Change
Restaurant Tax..................... 2,919,583$ 2,699,510$ 8.2%
Transient Room Tax............ 1,149,417 1,065,404 7.9%
Leased Vehicle Tax............. 401,156 345,562 16.1%
Total................................. 4,470,156$ 4,110,476$ 8.8%
21212121llllll lllll21

WEBER COUNTY, UTAH MANAGEMENT’S DISCUSSION AND ANALYSIS
Year Ended December 31, 2014
Jail Property Purchase On February 18, 2014, Weber County purchased approximately 11.5 acres of vacant land adjacent to the County jail for $2.3 million. Subsequent to the County’s purchase, the State Legislature appropriated up to $2.3 million to acquire some or all of the same property from the County in anticipation of constructing a state-run juvenile detention and youth services facility. Negotiations between the County and the State will continue through 2015 as the State and County determine their specific future plans for the property. REQUESTS FOR INFORMATION This financial report is designed to provide citizens, taxpayers, and creditors with a general overview of Weber County’s finances and to demonstrate the County’s accountability for the money it receives. Questions concerning any of the information in this report, or any other matters related to the County’s budget and finances, should be addressed to the Weber County Clerk/Auditor, 2380 Washington Blvd., Suite 320, Ogden, Utah, 84401. The preceding discussion and analysis focuses on the County’s primary government operations. Two of the County’s component units each issue separate audited financial statements that include their respective management’s discussion and analysis. Component unit financial information may be obtained from their respective administrative offices or as described in Note 1 of the these financial statements.
22222222llllll lllll22
Basic Financial Statements
23232323llllll lllll23

WEBER COUNTY, UTAH
Statement of Net PositionDecember 31, 2014
Primary GovernmentGovernmental Business-type Component
Activities Activities Total UnitsASSETSCash and Investments................................... $ 67,091,826 $ 13,739 $ 67,105,565 $ 7,849,593 Receivables: Accounts, net.............................................. 2,390,552 789,532 3,180,084 285,745 Taxes........................................................... 6,948,989 — 6,948,989 462,273 Notes, net.................................................... 44,607 — 44,607 — Due From Other Governments.................... 6,043,029 — 6,043,029 777,452 Internal Balances.......................................... 316,210 (316,210) — — Inventories and Prepaids............................... 110,697 — 110,697 73,277 Restricted Cash............................................. 34,671,011 2,356 34,673,367 — Capital Assets: — Land........................................................ 31,982,946 1,604,504 33,587,450 2,900,168 Infrastructure.......................................... 47,687,897 — 47,687,897 — Construction-in-Progress........................ 27,886,248 — 27,886,248 734,880 Buildings and Improvements.................. 149,209,578 11,319,656 160,529,234 12,590 Machinery and Equipment...................... 19,930,249 4,744,000 24,674,249 1,828,516 Intangible Assets - Software................... 756,414 — 756,414 — Less Accumulated Depreciation............. (109,290,222) (5,577,253) (114,867,475) (1,492,281) Total Capital Assets.............................. 168,163,110 12,090,907 180,254,017 3,983,873
Total Assets.................................................. 285,780,031 12,580,324 298,360,355 13,432,213
DEFERRED OUTFLOWS OF RESOURCESDeferred Amount on Refunding................... 1,679,817 20,839 1,700,656 —
Total Deferred Outflows of Resources..... 1,679,817 20,839 1,700,656 —
LIABILITIESAccounts Payable ......................................... 4,628,210 516,897 5,145,107 178,082 Accrued Liabilities........................................ 2,897,411 52,067 2,949,478 304,179 Unearned Revenue........................................ 41,449 — 41,449 — Long-term Liabilities: Due Within One Year.............................. 8,482,016 380,465 8,862,481 — Due in More Than One Year................... 97,458,915 1,911,821 99,370,736 439,218
Total Liabilities............................................. 113,508,001 2,861,250 116,369,251 921,479
NET POSITION Net Investment in Capital Assets............... 120,865,911 11,255,612 132,121,523 3,248,993 Restricted for: Roads and Public Improvements.............. 34,359,824 — 34,359,824 — Economic Development........................... 3,233,156 — 3,233,156 — Parks and Recreation Programs............... 3,953,879 — 3,953,879 — Public Health Programs........................... — — — 46,521 Public Safety Programs............................ 235,992 — 235,992 747,930 Unrestricted.................................................. 11,303,085 (1,515,699) 9,787,386 8,467,290 Total Net Position......................................... $ 173,951,847 $ 9,739,913 $ 183,691,760 $ 12,510,734
The notes to the financial statements are an integral part of this statement.
24242424llllll lllll24

WEBER COUNTY, UTAH
Statement of ActivitiesFor the Year Ended December 31, 2014
Net (Expense) Revenue andProgram Revenues Changes in Net Position
Charges for Operating CapitalServices and Grants and Grants and Governmental Business-type Component
Activities: Expenses Court Fines Contributions Contributions Activities Activities Total UnitsPrimary Government:Governmental Activities: General Government.......................... $ 23,325,818 $ 9,808,112 $ 2,919,851 $ 42,989 $ (10,554,866) $ — $ (10,554,866) $ — Public Safety..................................... 38,167,752 14,546,938 644,360 — (22,976,454) — (22,976,454) — Public Health and Welfare................. 2,308,236 — — — (2,308,236) — (2,308,236) — Library Services................................. 8,028,348 779,914 34,685 260,311 (6,953,438) — (6,953,438) — Streets and Public Improvements....... 23,052,288 613,329 1,353,395 11,746,292 (9,339,272) — (9,339,272) — Parks, Recreation & Public Facilities. 14,084,346 4,795,377 253,600 270,155 (8,765,214) — (8,765,214) — Conservation and Development......... 5,141,561 20,000 789,419 — (4,332,142) — (4,332,142) — Interest on Long-Term Debt............... 3,652,642 — — — (3,652,642) — (3,652,642) — Total Governmental Activities....... 117,760,991 30,563,670 5,995,310 12,319,747 (68,882,264) — (68,882,264) —
Business-type Activities: Solid Waste Transfer Station............. 7,891,674 7,402,317 — — — (489,357) (489,357) — Landfill Gas Recovery....................... 232,629 197,888 — — — (34,741) (34,741) — Animal Shelter................................... 735,957 748,702 — — — 12,745 12,745 — Total Business-type Activities........ 8,860,260 8,348,907 — — — (511,353) (511,353) — Total Primary Government.................... $ 126,621,251 $ 38,912,577 $ 5,995,310 $ 12,319,747 (68,882,264) (511,353) (69,393,617) —
Component Units: Weber Area Dispatch 911 and Emergency Services District.............. 5,917,284 2,077,941 334,845 — — — — (3,504,498) Weber Housing Authority..................... 1,350,286 248,808 1,065,624 — — — — (35,854) Weber Morgan Health Department....... 10,457,858 2,293,092 6,980,303 — — — — (1,184,463)
Total Component Units.................... $ 17,725,428 $ 4,619,841 $ 8,380,772 $ — — — — (4,724,815)
General Revenues:Taxes:
38,942,988 — 38,942,988 4,593,306 41,331,850 — 41,331,850 — 4,458,714 — 4,458,714 —
84,733,552 — 84,733,552 4,593,306 553,290 134 553,424 — 81,446 — 81,446 —
232,445 — 232,445 — 165,578 165,578 —
85,600,733 165,712 85,766,445 4,593,306
16,718,469 (345,641) 16,372,828 (131,509)
169,537,984 10,119,295 179,657,279 5,270,780 (12,304,606) (33,741) (12,338,347) 7,371,463 157,233,378 10,085,554 167,318,932 12,642,243
$ 173,951,847 $ 9,739,913 $ 183,691,760 $ 12,510,734
The notes to the financial statements are an integral part of this statement.
Current Property Taxes...............................................................................Sales and Franchise Taxes...........................................................................Other Property Taxes..................................................................................
Change in Net Position........................................................................
Special Item - Change In OPEB..................................................................Miscellaneous.............................................................................................
Net Position - Beginning..............................................................................
Net Position - Ending..................................................................................
Total Taxes............................................................................................Unrestricted Investment Income..................................................................Gain on Sale of Capital Assets....................................................................
Total General Revenues.........................................................................
Adjustment to Net Position.....................................................................Net Position - Beginning as Adjusted..........................................................
25252525llllll lllll25

26262626llllll lllll26

Governmental Fund Financial Statements General Fund This fund is the principal operating fund of the County. It accounts for all financial resources of the government that are not accounted for in another fund. Library Fund This special revenue fund accounts for the operations of the County’s main library and four branches. The Library Fund’s principal revenue source is property taxes. Paramedic Fund This special revenue fund accounts for the County’s paramedic services. The principal revenue source is property taxes. Transportation Development Fund This special revenue fund accounts for a voter-approved countywide ¼% sales tax levy that is restricted by state law for expenditure on transportation-related infrastructure and expanded transit facilities. The principal revenue source is sales taxes. Debt Service Fund This fund accounts for the accumulation of resources for payment of principal, interest, and related costs on the County’s general obligation and sales tax revenue bonds. The principal revenue source is property taxes. Capital Projects Fund This fund accounts for the acquisition and construction of major capital facilities other than those financed by the proprietary funds. Funding typically comes from bond proceeds, transfers from other funds, and interest earnings. Public Works Capital Projects Fund This fund accounts for County expenditures on infrastructure and other similar capital projects. Funding typically comes from bonds, grants, and transfers from other funds. Nonmajor Governmental Funds Nonmajor governmental funds are presented individually in the Supplementary Information section of the report.
27272727llllll lllll27

WEBER COUNTY, UTAH
Balance Sheet Governmental FundsDecember 31, 2014
TransportationGeneral Library Paramedic Development
Cash and Investments.............................. $ 5,918,312 $ 3,942,287 $ 3,895,355 $ 32,210,463 Receivables: Accounts, net........................................ 2,126,574 257 — — Taxes.................................................... 3,385,118 427,340 143,366 1,105,437 Notes, net............................................. 44,607 — — — Due From Other Governments.............. 1,874,163 160 — — Due From Other Funds............................ 4,018,109 — — — Prepaids and Inventories.......................... 25,697 — — — Cash - Restricted..................................... — — — —
$ 17,392,580 $ 4,370,044 $ 4,038,721 $ 33,315,900
Liabilities: Accounts Payable.................................. $ 1,209,744 $ 91,339 $ 53,325 $ 6,868 Accrued Liabilities................................ 1,461,150 144,100 — — Due To Other Funds.............................. — — — — Unearned Revenue................................. 41,449 — — — Total Liabilities.................................... 2,712,343 235,439 53,325 6,868
DEFERRED INFLOWS OF RESOURCESUnavailable Revenue - Property Taxes.... 1,329,088 360,901 121,082 — Total Deferred Inflows of Resources.... 1,329,088 360,901 121,082 —
Fund Balances: Nonspendable: Long-term Portion of Receivables....... 44,607 — — — Restricted.............................................. 558,891 — — — Committed............................................. — 3,773,704 3,864,314 33,309,032 Assigned................................................ 3,027,747 — — — Unassigned............................................ 9,719,904 — — — Total Fund Balances.......................... 13,351,149 3,773,704 3,864,314 33,309,032
of Resources, and Fund Balances.............. $ 17,392,580 $ 4,370,044 $ 4,038,721 $ 33,315,900
The notes to the financial statements are an integral part of this statement.
Total Assets ............................................
ASSETS
LIABILITIES
FUND BALANCES
Special Revenue
28282828llllll lllll28

Capital ProjectsNonmajor Total
Debt Capital Public Governmental Governmental Service Projects Works Funds Funds
$ 3,540,220 $ 6,432,265 $ — $ 8,048,606 $ 63,987,508
— — — 251,881 2,378,712 172,206 — — 1,715,522 6,948,989
— — — — 44,607 — — 3,640,716 527,990 6,043,029 — — — — 4,018,109 — — — 85,000 110,697
376,941 24,380,422 4,118,792 5,794,856 34,671,011 $ 4,089,367 $ 30,812,687 $ 7,759,508 $ 16,423,855 $ 118,202,662
$ 3,250 $ 1,429,869 $ 1,019,090 $ 771,417 $ 4,584,902 750,784 — — 541,377 2,897,411
— — 2,923,637 778,262 3,701,899 — — — — 41,449
754,034 1,429,869 3,942,727 2,091,056 11,225,661
142,203 — — 17,448 1,970,722 142,203 — — 17,448 1,970,722
— — — — 44,607 — 27,887,365 3,537,776 6,000,896 37,984,928 — 148,051 — — 41,095,101
3,193,130 1,347,402 279,005 8,314,455 16,161,739 — — — — 9,719,904
3,193,130 29,382,818 3,816,781 14,315,351 105,006,279
$ 4,089,367 $ 30,812,687 $ 7,759,508 $ 16,423,855 $ 118,202,662
29292929llllll lllll29

WEBER COUNTY, UTAH
Reconciliation of the Balance Sheet – Governmental FundsTo the Statement of Net PositionDecember 31, 2014
$ 105,006,279
Amounts reported for governmental activities in the Statement of Net Position are different because:
Land.............................................................................................................................. $ 31,982,946 Infrastructure................................................................................................................. 47,687,897 Other capital assets....................................................................................................... 191,310,169 Accumulated depreciation............................................................................................. (105,739,011) 165,242,001
1,970,722
5,993,959
Bonds and notes payable............................................................................................... (85,035,000) Unamortized premiums and discounts on bonds........................................................... (3,861,770) Deferred amount on bond refundings............................................................................ 1,679,817 Capital leases................................................................................................................ (50,969) Net OPEB Obligation.................................................................................................... (7,806,413) Compensated absences.................................................................................................. (9,186,779) (104,261,114)
$ 173,951,847
The notes to the financial statements are an integral part of this statement.
available soon enough to pay for the current year's expenditures and
Total Fund Balances – Governmental Funds..............................................................................
Capital assets used in governmental activities are not financial resources and therefore are not reported in governmental funds, but they are reported in the Statement of Net Position. Capital assets consist of the following:
Some of the County's revenues will be collected after year-end but are not
therefore are reported as unavailable revenue in governmental funds........................................
The County uses internal service funds to charge the costs of certain activities to individual funds. The assets and liabilities of the internal service funds
Net Position of Governmental Activities.....................................................................................
are reported with governmental activities in the Statement of Net Position...............................
Some liabilities and related deferred outflows of resources are not reported in
amounts consist of the following: governmental funds, but they are reported in the Statement of Net Position. These
llllll lllll3030303030

31313131llllll lllll31

WEBER COUNTY, UTAH
Statement of Revenues, Expenditures, and Changes in Fund BalancesGovernmental FundsFor the Year Ended December 31, 2014
TransportationGeneral Library Paramedic Development
REVENUESTaxes: Current Property...................................... $ 21,243,214 $ 6,894,217 $ 2,312,407 $ — Sales......................................................... 9,818,455 — — 21,842,746 Delinquent................................................ 1,318,740 277,055 92,902 — Assessing and Collecting......................... 4,307,197 — — — Total Taxes........................................... 36,687,606 7,171,272 2,405,309 21,842,746
Other Revenues: Licenses, Permits, and Fees..................... 2,199,333 594,602 199,398 — Intergovernmental.................................... 2,923,610 34,685 — — Charges for Services................................ 20,959,758 159,597 — — Fines and Forfeitures................................ 362,447 — — — Miscellaneous.......................................... 1,362,050 35,143 13,071 280,428
Total Revenues..................................... 64,494,804 7,995,299 2,617,778 22,123,174
EXPENDITURESCurrent: General Government................................ 20,241,016 — — — Public Safety............................................ 32,738,670 — 2,324,501 — Public Health and Welfare....................... 2,005,021 — — — Library Services....................................... — 7,435,355 — — Streets and Public Improvements............. 629,461 — — 18,292,338 Parks, Recreation & Public Facilities...... 7,204,756 — — — Conservation and Development............... 747,686 — — — Capital Outlay............................................. — — — — Debt Service: Principal................................................... — — — — Interest and Other Charges....................... — — — —
Total Expenditures................................ 63,566,610 7,435,355 2,324,501 18,292,338
928,194 559,944 293,277 3,830,836
OTHER FINANCING SOURCES (USES) Capital Lease Financing........................... 9,813 — — — Refunding Bonds Issued.......................... — — — — Payment to Refunding Escrow................. — — — — Transfers In.............................................. 1,670,914 — — — Transfers Out........................................... (6,723,048) (425,700) — —
Total Other Financing Sources (Uses).. (5,042,321) (425,700) — —
Net Change in Fund Balances............... (4,114,127) 134,244 293,277 3,830,836
17,465,276 3,639,460 3,571,037 29,478,196
$ 13,351,149 $ 3,773,704 $ 3,864,314 $ 33,309,032
The notes to the financial statements are an integral part of this statement.
Revenues Over (Under) Expenditures............
Fund Balances - Beginning (see note 2).........
Fund Balances - Ending..................................
Special Revenue
32323232llllll lllll32

Capital ProjectsNonmajor Total
Debt Capital Public Governmental Governmental Service Projects Works Funds Funds
$ 3,145,550 $ — $ — $ 4,146,103 $ 37,741,491 — — — 9,670,649 41,331,850
90,188 — — 5,294 1,784,179 — — — — 4,307,197
3,235,738 — — 13,822,046 85,164,717
271,253 — — 764,832 4,029,418 40,894 270,155 9,392,275 2,919,237 15,580,856
272,150 — — 3,264,565 24,656,070 — — — 48,362 410,809
1,564 303,300 58,273 318,648 2,372,477
3,821,599 573,455 9,450,548 21,137,690 132,214,347
— — — 1,397,701 21,638,717 — — — 1,200,735 36,263,906 — — — — 2,005,021 — — — — 7,435,355 — — 539,561 2,936,616 22,397,976 — — — 5,059,104 12,263,860 — — — 4,388,228 5,135,914 — 13,625,072 14,358,541 — 27,983,613
2,350,000 — — 2,490,501 4,840,501 1,969,612 — — 961,729 2,931,341
4,319,612 13,625,072 14,898,102 18,434,614 142,896,204
(498,013) (13,051,617) (5,447,554) 2,703,076 (10,681,857)
— — — — 9,813 4,649,787 — — 2,371,842 7,021,629
(4,566,157) — — (4,148,648) (8,714,805) 658,145 6,761,859 — — 9,090,918
— — — (1,709,725) (8,858,473)
741,775 6,761,859 — (3,486,531) (1,450,918)
243,762 (6,289,758) (5,447,554) (783,455) (12,132,775)
2,949,368 35,672,576 9,264,335 15,098,806 117,139,054
$ 3,193,130 $ 29,382,818 $ 3,816,781 $ 14,315,351 $ 105,006,279
33333333llllll lllll33

WEBER COUNTY, UTAH
Reconciliation of the Statement of Revenues, Expenditures, and Changes in
Fund Balances – Governmental Funds To the Statement of Activities
For the Year Ended December 31, 2014
$ (12,132,775)
Amounts reported for governmental activities in the Statement of Activities are different because:
Capital outlay.............................................................................................................. $ 28,662,803
Assets received from developers in the form of new infrastructure............................. 2,295,744
Depreciation expense.................................................................................................. (5,672,784) 25,285,763
(11,602)
(7,021,629)
(10,352)
Bond and note principal payments.............................................................................. 4,840,501
Payments to the bond refunding escrow...................................................................... 8,714,805
Capital lease principal payments................................................................................. 16,339 13,571,645
368,738
(431,165)
Amortization of bond premiums, discounts, and deferred amounts............................. (720,538)
Arbitrage rebate liability............................................................................................. —
Change in Net OPEB Obligation................................................................................. (1,280,396)
Change in compensated absences................................................................................ (899,220) (2,900,154)
$ 16,718,469
The notes to the financial statements are an integral part of this statement.
Some capital additions were financed through capital leases. In governmental funds,
a capital lease arrangement is considered a source of financing, but in the Statement
of Net Position, the lease obligation is reported as a liability................................................
but the repayment reduces long-term liabilities in the Statement of Net Position. In
issuing debt increases long-term liabilities in the Statement of Net Position. In the
Repayment of long-term debt is reported as an expenditure in governmental funds,
current year, proceeds were received from issuing bonds......................................................
Net Change in Fund Balances – Total Governmental Funds.................................................
Statement of Activities, the cost of capital assets is allocated over their estimated
in governmental funds the proceeds from the sales increase financial resources. Thus,
Bond proceeds provide current financial resources to governmental funds; however,
Capital outlays are reported as expenditures in governmental funds. However, in the
useful lives as depreciation expense. In the current year, these amounts were as follows:
In the Statement of Activities, only the gain on the sale of assets is reported, whereas
the change in net position differs from the change in fund balance by the book value
of the assets sold....................................................................................................................
Change in Net Position of Governmental Activities...............................................................
the current year, these amounts were as follows:
Some expenses reported in the Statement of Activities do not require the use of
current financial resources and therefore are not reported as expenditures in
governmental funds. These activities consist of the following:
Management uses internal service funds to charge the costs of certain activities to
individual funds. The net revenue (expense) of the internal service funds is reported
with governmental activities..................................................................................................
Because delinquent property taxes will not be collected for some time after the end
of the year, they do not provide current financial resources in governmental funds.
Unavailable property tax revenues changed by this amount this year....................................
llllll lllll3434343434

Proprietary Fund Financial Statements Solid Waste Transfer Station Fund This enterprise fund accounts for operations at the County’s waste transfer station and maintenance of the closed landfill site. Revenues come from tipping fees and other charges to users of the facilities. Landfill Gas Recovery Fund This enterprise fund accounts for the operation of a methane gas recovery and electricity generation facility. Revenues come from sales of electricity. Animal Shelter Fund This enterprise fund accounts for activities of the County’s expanded animal shelter. Revenues come mainly from charges to other governments for animal sheltering services, and from charges to the public for shelter and adoption services. Governmental Activities – Internal Service Funds These funds account for certain activities that are charged to other departments on a cost-reimbursement basis. The County maintains internal service funds for risk management, termination and retiree payments, and fleet services. These funds are presented individually in the Supplementary Information section of the report.
35353535llllll lllll35

WEBER COUNTY, UTAH
Statement of Net Position
Proprietary Funds
December 31, 2014
Business-type Activities - Enterprise Funds
Governmental
Activities -
Solid Waste Landfill Gas Animal Internal Service
Transfer Station Recovery Shelter Total Funds
ASSETS
Current Assets:
Cash and Investments .............................. $ 12,789 $ — $ 950 $ 13,739 $ 3,104,318
Receivables:
Accounts, net......................................... 637,543 29,167 122,822 789,532 11,840
Due From Other Funds............................. — — — — —
Total Current Assets............................ 650,332 29,167 123,772 803,271 3,116,158
Noncurrent Assets:
Restricted Cash......................................... — 2,356 — 2,356 —
Capital Assets:
Land........................................................ 1,604,504 — — 1,604,504 —
Buildings and Improvements.................. 11,319,656 — — 11,319,656 —
Machinery and Equipment..................... 2,516,564 2,218,882 8,554 4,744,000 6,472,320
Less Accumulated Depreciation............. (4,443,288) (1,129,260) (4,705) (5,577,253) (3,551,211)
Total Noncurrent Assets....................... 10,997,436 1,091,978 3,849 12,093,263 2,921,109
Total Assets........................................ 11,647,768 1,121,145 127,621 12,896,534 6,037,267
DEFERRED OUTFLOWS OF RESOURCES
Deferred Amount on Bond Refunding....... — 20,839 — 20,839 —
Total Deferred Outflows.................... — 20,839 — 20,839 —
LIABILITIES
Current Liabilities:
Accounts Payable..................................... 500,202 10,241 6,454 516,897 43,308
Accrued Liabilities................................... 41,894 — 10,173 52,067 —
Due To Other Funds................................. — 199,336 116,874 316,210 —
Compensated Absences............................ 69,750 — 12,093 81,843 —
Current Portion of Long-term Liabilities. 138,622 160,000 — 298,622 —
Total Current Liabilities....................... 750,468 369,577 145,594 1,265,639 43,308
Noncurrent Liabilities:
Bonds Payable, net................................... — 480,000 — 480,000 —
Capital Lease Obligations......................... 104,949 — — 104,949 —
Compensated Absences............................ 21,257 — 3,023 24,280 —
Landfill Closure Costs.............................. 1,302,592 — — 1,302,592 —
Total Noncurrent Liabilities................. 1,428,798 480,000 3,023 1,911,821 —
Total Liabilities................................... 2,179,266 849,577 148,617 3,177,460 43,308
NET POSITION
Net Investment in Capital Assets............... 10,802,142 449,621 3,849 11,255,612 2,921,110
Unrestricted................................................ (1,333,640) (157,214) (24,845) (1,515,699) 3,072,849
Total Net Position............................... $ 9,468,502 $ 292,407 $ (20,996) $ 9,739,913 $ 5,993,959
The notes to the financial statements are an integral part of this statement.
36

WEBER COUNTY, UTAH
Statement of Revenues, Expenses, and Changes in Net PositionProprietary FundsFor the Year Ended December 31, 2014
Business-type Activities - Enterprise FundsGovernmental
Activities -Solid Waste Landfill Gas Animal Internal Service
Transfer Station Recovery Shelter Total Funds
OPERATING REVENUES Charges for Services..................................................... $ 6,871,623 $ 197,888 $ 739,776 $ 7,809,287 $ 2,252,893 Miscellaneous............................................................... 530,694 — 8,926 539,620 — Total Revenues.......................................................... 7,402,317 197,888 748,702 8,348,907 2,252,893
OPERATING EXPENSES General and Administrative.......................................... 2,502,955 105,807 502,657 3,111,419 243,308 Disposal Costs.............................................................. 4,916,818 — — 4,916,818 — Depreciation.................................................................. 412,605 107,266 855 520,726 839,290 Claims and Premiums................................................... — — — — 882,655 Total Expenses........................................................... 7,832,378 213,073 503,512 8,548,963 1,965,253
Operating Income (Loss)........................................... (430,061) (15,185) 245,190 (200,056) 287,640
NON OPERATING REVENUES (EXPENSES) Investment Income......................................................... — 135 — 135 — Interest Expense............................................................. (5,242) (19,556) — (24,798) (349) Gain (Loss) on Sale of Capital Assets........................... (54,054) — — (54,054) 81,446 Total Non-Operating Revenues (Expenses).............. (59,296) (19,421) — (78,717) 81,097
Income (Loss) Before Special Item and Transfers.... (489,357) (34,606) 245,190 (278,773) 368,737
Special Item Change in OPEB (Note 2).......................................... 165,578 — — 165,578 — Transfers In................................................................... — — — — — Transfers Out................................................................ — — (232,445) (232,445) —
Change in Net Position.............................................. (323,779) (34,606) 12,745 (345,640) 368,737
Net Position - Beginning (see note 2)............................. 9,792,281 327,013 (33,741) 10,085,553 5,625,222
Net Position - Ending...................................................... $ 9,468,502 $ 292,407 $ (20,996) $ 9,739,913 $ 5,993,959
The notes to the financial statements are an integral part of this statement.
37373737llllll lllll37

WEBER COUNTY, UTAH
Statement of Cash FlowsProprietary FundsFor the Year Ended December 31, 2014
Business-type Activities - Enterprise FundsGovernmental
Activities -Solid Waste Landfill Gas Animal Internal Service
Transfer Station Recovery Shelter Total FundsCASH FLOWS FROM OPERATING ACTIVITIES
Receipts from Customers and Users............................................. $ 7,287,492 $ 200,876 $ 730,334 $ 8,218,702 $ 2,250,848 Payments to Suppliers and Contractors......................................... (5,938,582) (109,698) (140,132) (6,188,412) (1,112,942) Payments to Employees................................................................ (1,554,647) — (370,025) (1,924,672) — Net Cash Provided (Used) by Operating Activities................................................................ (205,737) 91,178 220,177 105,618 1,137,906
CASH FLOWS FROM NON-CAPITALFINANCING ACTIVITIES
Transfers (To) From Other Funds................................................. — — (219,227) (219,227) — Special Item - Insurance Proceeds................................................ 165,578 — — 165,578 — Interfund Balances Due To (From) Other Funds........................... 149,681 49,655 — 199,336 — Net Cash Provided (Used) by Non-Capital Financing Activities............................................. 315,259 49,655 (219,227) 145,687 —
CASH FLOWS FROM CAPITAL ANDRELATED FINANCING ACTIVITIES
Refunding Bonds Issued............................................................... — 619,161 — 619,161 — Payment to Refunding Escrow..................................................... — (603,216) — (603,216) — Acquisition of Capital Assets....................................................... (124,109) — — (124,109) (715,066) Proceeds from Sale of Bonds....................................................... — — — — — Principal Paid on Bonds and Capital Leases................................. (140,139) (135,000) — (275,139) (102,066) Interest Paid on Bonds and Capital Leases................................... (5,242) (39,113) — (44,355) (349) Proceeds from Disposal of Capital Assets.................................... — — — — 175,169 Payments for Landfill Post-Closure Care...................................... 34,080 — — 34,080 — Net Cash Provided (Used) by Capital and Related Financing Activities................................. (235,410) (158,168) — (393,578) (642,312)
CASH FLOWS FROM INVESTING ACTIVITIES Interest on Investments.................................................................. — 135 — 135 — Net Cash Provided (Used) by Investing Activities................................................................. — 135 — 135 —
Net Cash Provided (Used) - All Activities............................... (125,888) (17,200) 950 (142,138) 495,594
Cash and Cash Equivalents - Beginning........................................ 138,677 19,556 — 158,233 2,608,724 Cash and Cash Equivalents - Ending............................................. $ 12,789 $ 2,356 $ 950 $ 16,095 $ 3,104,318
RECONCILIATION OF OPERATING INCOME TO NETCASH PROVIDED (USED) BY OPERATING ACTIVITIES
Operating Income (Loss).............................................................. $ (430,061) $ (15,185) $ 245,190 $ (200,056) $ 287,640 Adjustments to Reconcile Operating Income (Loss): — Depreciation Expense.............................................................. 412,605 107,266 855 520,726 839,290 (Increase) Decrease in Accounts Receivable............................ (114,825) 2,989 (22,887) (134,723) (2,045) (Increase) Decrease in Prepaid Expense................................... — — — — — (Increase) Decrease in Due from Other Governments............... — — 4,518 4,518 — Increase (Decrease) in Accounts Payable................................. 80,683 (3,892) (6,704) 70,087 13,021 Increase (Decrease) in Accrued Liabilities............................... 6,472 — 1,406 7,878 — Increase (Decrease) in Net OPEB Obligation........................... (165,578) — — (165,578) — Increase (Decrease) in Compensated Absences........................ 4,967 — (2,201) 2,766 — Net Cash Provided (Used) by Operating Activities............................................................ $ (205,737) $ 91,178 $ 220,177 $ 105,618 $ 1,137,906
NON-CASH INVESTING, CAPITAL, ANDFINANCING ACTIVITIES
Gain (Loss) on Sale of Capital Assets........................................... (54,054) — — (54,054) 81,446 Total Non-Cash Investing, Capital and Financing Activities................................................................. $ (54,054) $ — $ — $ (54,054) $ 81,446
The notes to the financial statements are an integral part of this statement.
38383838llllll lllll38

Fiduciary Fund Financial Statements Private-Purpose Trust Funds These funds account for resources that are held for the benefit of individuals, private organizations, or other governments. Assets of these funds cannot be used to support the County’s own programs. Individual private-purpose trust funds are presented in the Supplementary Information section of the report. Agency Funds These funds account for assets held by the County as an agent for other governments or organizations. These funds are custodial in nature and do not involve measuring the results of operations. Individual agency funds are presented in the Supplementary Information section of the report.
39393939llllll lllll39

WEBER COUNTY, UTAH
Statement of Fiduciary Net Position
Fiduciary Funds
December 31, 2014
Private-Purpose Agency
Trust Funds Funds
ASSETS
Cash ................................................................ $ 461,075 $ 15,631,353
Taxes Receivable............................................. — 1,370,668
Accounts Receivable....................................... 24,947 —
Due From Other Governments......................... 144,516 —
Delinquent Taxes Receivable.......................... — 5,335,455
Buildings......................................................... 48,853 —
Machinery and Equipment............................... 438,551 —
Less Accumulated Depreciation.................. (390,635) —
Total Assets............................................. 727,307 22,337,476
LIABILITIES
Accounts Payable............................................ 160,133 41,615
Accrued Liabilities.......................................... — 140,257
Due to Other Entities....................................... — 16,118,619
Deposits........................................................... 246,306 —
Reserve for Tax Overpayments........................ — 701,530
Deferred Tax Distributions.............................. — 5,335,455
Total Liabilities....................................... 406,439 22,337,476
NET POSITION
Held In Trust for Individuals,
Organizations, and Other Governments......... $ 320,868 $ —
The notes to the financial statement are an integral part of this statement.
40404040llllll lllll40

WEBER COUNTY, UTAH
Statement of Changes in Fiduciary Net Position
Fiduciary Funds
For the Year Ended December 31, 2014
Private-Purpose
Trust Funds
ADDITIONS
Grants...................................................................... $ 406,606
Contributions From Other Governments.................. 38,212
Charges for Services................................................ 281,750
Fines and Forfeitures............................................... 164,904
Miscellaneous.......................................................... 3,857,445
Investment Income .................................................. 63
Total Additions................................................. 4,748,980
DEDUCTIONS
Trust Operating Expenses........................................ 1,004,490
Awards and Claims.................................................. 3,866,024
Total Deductions............................................. 4,870,514
Change in Net Position............................................ (121,534)
Net Position - Beginning......................................... 442,402
Net Position - Ending............................................... $ 320,868
The notes to the financial statements are an integral part of this statement.
41414141llllll lllll41

42424242llllll lllll42

Component Units Weber Area Dispatch 911 and Emergency Services District This special service district was created by the Weber County Commission to provide dispatch and emergency services to County residents. It is primarily funded through property taxes and charges for services. Weber Housing Authority The Weber Housing Authority was established under the laws of the State of Utah and certified by the Department of Housing and Urban Development (HUD) for the purpose of administering housing programs under the Housing Act of 1937, as amended, in Weber County, Utah. Its principal source of revenue is grants from the federal government. Weber Morgan Health Department The Weber Morgan Health Department’s is an interlocal agreement between Weber and Morgan counties to provide their residents with Public Health Services. Its principal revenue sources include intergovernmental revenues, property taxes, and charges for services.
43434343llllll lllll43
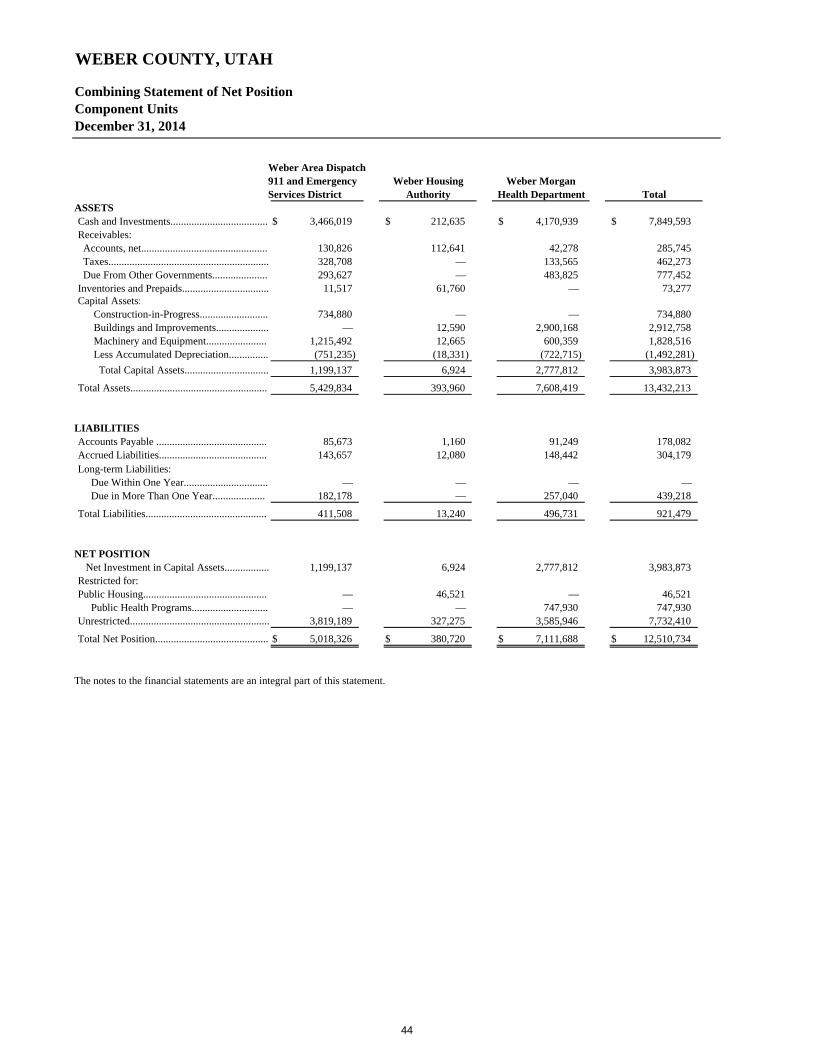
WEBER COUNTY, UTAH
Combining Statement of Net PositionComponent UnitsDecember 31, 2014
Weber Area Dispatch911 and Emergency Weber Housing Weber MorganServices District Authority Health Department Total
ASSETSCash and Investments..................................... $ 3,466,019 $ 212,635 $ 4,170,939 $ 7,849,593 Receivables: Accounts, net................................................ 130,826 112,641 42,278 285,745 Taxes............................................................. 328,708 — 133,565 462,273 Due From Other Governments..................... 293,627 — 483,825 777,452 Inventories and Prepaids................................. 11,517 61,760 — 73,277 Capital Assets: Construction-in-Progress.......................... 734,880 — — 734,880 Buildings and Improvements.................... — 12,590 2,900,168 2,912,758 Machinery and Equipment....................... 1,215,492 12,665 600,359 1,828,516 Less Accumulated Depreciation............... (751,235) (18,331) (722,715) (1,492,281) Total Capital Assets................................ 1,199,137 6,924 2,777,812 3,983,873
Total Assets.................................................... 5,429,834 393,960 7,608,419 13,432,213
LIABILITIESAccounts Payable .......................................... 85,673 1,160 91,249 178,082 Accrued Liabilities......................................... 143,657 12,080 148,442 304,179 Long-term Liabilities: Due Within One Year................................ — — — — Due in More Than One Year.................... 182,178 — 257,040 439,218
Total Liabilities.............................................. 411,508 13,240 496,731 921,479
NET POSITION Net Investment in Capital Assets................. 1,199,137 6,924 2,777,812 3,983,873 Restricted for:Public Housing............................................... — 46,521 — 46,521 Public Health Programs............................. — — 747,930 747,930 Unrestricted..................................................... 3,819,189 327,275 3,585,946 7,732,410
Total Net Position........................................... $ 5,018,326 $ 380,720 $ 7,111,688 $ 12,510,734
The notes to the financial statements are an integral part of this statement.
444444llllll lllll44

WEBER COUNTY, UTAH
Combining Statement of ActivitiesComponent UnitsFor the Year Ended December 31, 2014
$ 5,917,284 $ 1,350,286 $ 10,457,858 $ 17,725,428
Program RevenuesCharges for Services...................................................... 1,790,576 26,532 2,109,090 3,926,198 Intergovernmental.......................................................... 334,845 1,065,624 6,980,303 8,380,772 Licenses, Permits and Fees............................................ 272,152 — 112,274 384,426 Miscellaneous................................................................. 15,213 222,276 71,728 309,217 Total Program Revenues........................................... 2,412,786 1,314,432 9,273,395 13,000,613
Net (Expense) Revenues....................................... (3,504,498) (35,854) (1,184,463) (4,724,815)
General RevenuesCurrent Property Tax..................................................... 3,252,044 — 1,341,262 4,593,306 Total General Revenues............................................ 3,252,044 — 1,341,262 4,593,306 Change in Net Position.......................................... (252,454) (35,854) 156,799 (131,509)
Net Position - Beginning................................................ 5,270,780 416,574 6,954,889 12,642,243
Net Position - Ending..................................................... $ 5,018,326 $ 380,720 $ 7,111,688 $ 12,510,734
The notes to the financial statements are an integral part of this statement.
Weber MorganHealth Department Total
Expenses............................................................................
Weber Area Dispatch911 and Emergency
Services DistrictWeber Housing
Authority
45454545llllll lllll45

WEBER COUNTY, UTAH NOTES TO THE FINANCIAL STATEMENTS
Year Ended December 31, 2014 INDEX TO THE NOTES TO THE FINANCIAL STATEMENTS Page
1. Summary of Significant Accounting Policies A. Reporting Entity ................................................................................................................ 47 B. Government-wide and Fund Financial Statements ........................................................... 48 C. Measurement Focus and Basis of Accounting .................................................................. 49 D. Assets, Liabilities, Deferred Outflows / Inflows of Resources, and Equity ...................... 49 E. Revenues and Expenditures / Expenses ............................................................................ 51 F. Interfund Activity and Balances ........................................................................................ 51 G. Future Changes in Accounting Standards ......................................................................... 52
2. Financial Reporting Changes A. Changes is Fund Classification ......................................................................................... 52 B. Special Item ...................................................................................................................... 53
3. Deposits and Investments A. Custodial Credit Risk ........................................................................................................ 53 B. Credit Risk ........................................................................................................................ 53 C. Interest Rate Risk .............................................................................................................. 54
4. Interfund Balances ........................................................................................................................... 55 5. Interfund Transfers .......................................................................................................................... 55 6. Accounts Payable and Accrued Liabilities ...................................................................................... 56 7. Lease Commitments ........................................................................................................................ 56 8. Capital Assets .................................................................................................................................. 58 9. Long-term Liabilities
A. Changes in Long-term Liabilities ...................................................................................... 60 B. General Obligation Bonds ................................................................................................. 60 C. Sales Tax Revenue Bonds ................................................................................................. 62 D. Lease Revenue Bonds ....................................................................................................... 63 E. Special Assessment Bonds ................................................................................................ 64 F. Defeased Bonds ................................................................................................................ 65 G. Conduit Debt Obligations ................................................................................................. 65
10. Net Position and Fund Balances A. Net Position ....................................................................................................................... 66 B. Governmental Fund Balances – Restricted, Committed, and Assigned ............................ 66 C. Unassigned Fund Balance ................................................................................................. 66
11. Retirement Plans A. Pension Plans .................................................................................................................... 67 B. Deferred Compensation Plans ........................................................................................... 67
12. Other Post-Employment Benefits A. Plan Description ................................................................................................................ 69 B. Funding Policy .................................................................................................................. 69 C. Annual OPEB Costs and Net OPEB Obligation ............................................................... 69 D. Funded Status and Funding Progress ................................................................................ 70 E. Actuarial Methods and Assumptions ................................................................................ 70
13. Risk Management ............................................................................................................................ 70 14. Litigation and Contingencies ........................................................................................................... 70 15. Related Organizations .................................................................................................................... 71 16. Jointly Governed Organizations
A. Weber / Morgan Narcotics Strike Force ........................................................................... 71 B. Northern Utah Regional Landfill Authority ...................................................................... 71
17. Landfill Post-Closure Costs ............................................................................................................. 72 18. Subsequent Events
A. Sale of Real Property – Jail Property ................................................................................ 72 B. Reduction of Federal Subsidy for Certain Bond Interest Payments .................................. 72
46464646llllll lllll46

WEBER COUNTY, UTAH NOTES TO THE FINANCIAL STATEMENTS
Year Ended December 31, 2014 NOTE 1. SUMMARY OF SIGNIFICANT
ACCOUNTING POLICIES The accounting policies of Weber County (the County) conform in all material respects to generally accepted accounting principles (GAAP) as prescribed by the Governmental Accounting Standards Board (GASB). Preparation of the financial statements in conformity with GAAP requires management to make estimates and assumptions that affect the reported amounts and disclosures in the financial statements. Actual results could differ from those estimates. The following is a summary of the County’s significant accounting policies. A. Reporting Entity The County is incorporated under the constitutional provisions of the State of Utah. The County operates under a Commission form of government where the three-member elected Commission has budgetary authority over all county departments and is accountable for all fiscal matters. County property and sales taxes fund a significant portion of the costs of providing services to citizens including public safety, health, courts, highways and streets, sanitation, planning and zoning, recreation, libraries, and general administrative services. For financial reporting purposes, the County reporting entity includes the “primary government” and its “component units.” The primary government includes all funds, agencies, boards, commissions, and authorities that are considered an integral part of the County’s activities. The County’s component units are legally separate organizations for which the County’s elected officials are financially accountable. The Governmental Accounting Standards Board (GASB) has set forth criteria to be considered in determining financial accountability. These criteria include appointing a voting majority of an organization’s governing body and either: (1) the ability of the County to impose its will on that organization; or (2) the potential for the organization to provide specific financial benefits to, or impose specific financial burdens on the County. Where the County does not appoint a voting majority of an organization’s governing body, GASB standards require inclusion in the reporting entity if: (1) an organization is fiscally dependent on the County because its resources are held for the direct benefit of the County or can be accessed by the County; and (2) the potential for the organization to provide specific financial benefits to, or impose specific financial burdens on the County. In addition, component units can be other organizations for which the nature and
significance of their relationship with the primary government are such that exclusion would cause the financial statements to be misleading. A component unit should be reported as part of the primary government and blended into the appropriate funds if: (1) services are provided entirely or almost entirely to the primary government; (2) the governing body is substantively the same as the governing body of the primary government; or (3) the component unit’s total debt outstanding is expected to be repaid entirely or almost entirely by the primary government. Discretely presented component units are reported in a separate column and/or rows in each of the government-wide statements to emphasize that they are legally separate from the County. Blended Component Units The Municipal Building Authority of Weber County is governed by a three-member board comprised of the County Commissioners. Its sole purpose is to finance and construct the County’s major public facilities. Activities for the Municipal Building Authority are blended with the County’s special revenue funds, but separate financial statements are not issued or required for the Authority. The Redevelopment Agency of Weber County is governed by a three-member board comprised of the County Commissioners. The Agency’s purpose is to encourage economic development in certain areas of the County. Activities for the Redevelopment Agency are blended with the County’s special revenue funds, but separate financial statements are not issued or required for the Agency. Both the Municipal Building Authority and the Redevelopment Agency are blended component units because the governing body in each case is the same as the governing body of Weber County. Discretely Presented Component Units Discretely presented component units are reported in a separate column and/or rows in each of the government-wide statements to emphasize that they are legally separate from the County. The Weber Area Dispatch 911 and Emergency Services District (Dispatch) is governed by an Administrative Control Board comprised of seven members who are appointed by the County Commission, although four members are recommended by the Weber Area Council of Governments prior to being appointed. The Administrative Control Board appoints the Executive Director and approves the budget of the Dispatch; however, the County Commission retains the
47474747llllll lllll47

WEBER COUNTY, UTAH NOTES TO THE FINANCIAL STATEMENTS
Year Ended December 31, 2014 authority to set the property tax levy and issue long-term bonds on behalf of the Dispatch and is therefore able to impose its will on the Dispatch. Copies of the Dispatch’s audited financial statements can be obtained from the Dispatch’s administrative office at 2186 Lincoln Avenue, Ogden, Utah, 84401. The Weber Morgan Health Department (WMHD) was created by an interlocal agreement between Weber and Morgan Counties and is governed by the Board of Health. The majority of Board of Health voting members are appointed by the Weber County Commissioners. The County has the ability to modify and approve WMHD's budget and is therefore able to impose its will on the WMHD. Separately audited financial statements are not issued by WMHD. The basic fund financial statements are included in the supplementary section of this report. The Weber Housing Authority (WHA) is governed by a five-member board that is appointed by the County Commission. The board has hired an executive director to oversee WHA's day-to-day operations as it administers low-income housing grant funds. The County has agreed to provide accounting, payroll, human resource management, legal, and banking services to WHA at no cost. These services impose financial burdens on the County. Copies of WHA's audited financial statements can be obtained from the Office of the Utah State Auditor, Utah State Capitol Complex, East Office Building, Suite E310, Salt Lake City, UT 84114 or online at auditor.utah.gov. The County Commissioners are also responsible for appointing or approving the members of the boards of other organizations, but the County's accountability for these organizations does not extend beyond making the appointments. B. Government-wide and Fund Financial
Statements The County’s basic financial statements consist of both government-wide statements and fund statements. The government-wide statements focus on the County as a whole, while the fund statements focus on individual funds. Government-wide Financial Statements The government-wide statements present information on all non-fiduciary activities of the primary government and its component unit. Primary government activities are distinguished between governmental and business-type activities. Governmental activities generally are financed through taxes, grants, and
other non-exchange revenues. Business-type activities are financed in whole or in part by fees charged to external parties for goods or services. The Statement of Net Position presents the reporting entity’s non-fiduciary assets, liabilities, and deferred outflows/inflows, with the difference reported as net position. Net position is restricted when constraints are either externally imposed or are imposed by constitutional provisions or enabling legislation. The Statement of Activities demonstrates the degree to which the direct expenses of a given function or segment are offset by program revenues. Direct expenses are those that are clearly identifiable within a specific function. The County does not allocate general government (indirect) expenses to other functions. Program revenues include 1) charges to customers or applicants who purchase, use, or directly benefit from goods, services, or privileges provided by a given function; 2) court fines; and 3) grants and contributions that are restricted to meeting the operational or capital requirements of a particular function. Taxes and other revenues not meeting the definition of program revenues are reported as general revenues. Fund Financial Statements A fund is a separate accounting entity with a self-balancing set of accounts. Fund accounting is used to demonstrate legal compliance and to aid financial management by segregating transactions related to certain government functions or activities. Separate statements are provided for governmental, proprietary, and fiduciary funds. For governmental and proprietary funds, the emphasis is on major funds, with each displayed in a separate column. The County reports the following major governmental funds: General Fund This fund is the principal
operating fund of the County. It is used to account for all financial resources not accounted for in another fund.
Library Fund This special revenue fund
accounts for the operations of the County’s main library and four branches. The fund’s main source of revenue is a separate property tax levy.
Paramedic Fund This special revenue fund
accounts for the County’s contracts with Ogden and Roy for paramedic services. The fund’s main source of revenue is a separate property tax levy.
48484848llllll lllll48

WEBER COUNTY, UTAH NOTES TO THE FINANCIAL STATEMENTS
Year Ended December 31, 2014 Transportation Development Fund This
special revenue fund accounts for the County’s ¼% sales tax that is restricted for expanding roads, transit, and transportation corridors.
Debt Service Fund This fund accounts for the
accumulation of resources for payment of principal, interest, and related costs on the County’s general obligation and sales tax revenue bonds.
Capital Projects Fund This fund accounts for
construction of major capital facilities, except those financed in proprietary funds.
Public Works Fund This fund accounts for
construction of major infrastructure assets. Weber County’s nonmajor governmental funds account for specific revenue sources that are restricted, committed, or assigned for specific purposes. Funds reported are the Municipal Services, Tourism, Impact Fees, Municipal Building Authority, Redevelopment Agency, and RAMP Tax special revenue funds, and the Special Assessment Bond debt service fund. The County reports the following proprietary funds: Solid Waste Transfer Station Enterprise Fund
This fund accounts for the operations of the County’s transfer station and former landfill site. It is reported as a major enterprise fund.
Landfill Gas Recovery Enterprise Fund This
fund accounts for the operations of a methane gas recovery and electricity generation facility on the County’s former landfill site. It is reported as a major enterprise fund.
Animal Shelter Fund This fund accounts for
the operations of the County’s animal shelter. It is reported as a major enterprise fund.
Internal Service Funds These funds account
for the financing of risk management and fleet services. Internal service funds are combined with governmental activities on the government-wide statements.
The County reports the following fiduciary funds: Strike Force Trust Fund This private-purpose
trust fund accounts for resources held for and used by the Weber/Morgan Narcotics Strike Force, including grant funds, city contributions, and forfeitures.
Inmate Trust Fund This private-purpose trust
fund accounts for the personal funds of inmates who are being held at the county jail.
Other Miscellaneous Trust Fund This private-
purpose trust fund accounts for various resources that are held for the benefit of others outside the County and includes unclaimed funds and event promoter funds.
Agency Funds These funds account for assets
held by the County as a custodian for other governments or organizations and include property and sales taxes, payroll taxes, and other funds that do not belong to the County.
C. Measurement Focus and Basis of Accounting The government-wide financial statements are prepared using the economic resources measurement focus and the accrual basis of accounting. Revenues are recorded when earned and expenses are recorded when the related liability is incurred, regardless of the timing of the cash flows. Property taxes are recognized as revenues in the year for which they are levied. Other revenues are recognized in the year in which the related sales or other activity has occurred. Grants and similar items are recognized as revenue when all eligibility requirements have been met.
The proprietary and fiduciary fund statements are prepared using the economic resources measurement focus and the accrual basis of accounting. Proprietary funds distinguish operating revenues and expenses from nonoperating items. Operating revenues generally result from exchange transactions associated with the principal activity of the fund. Exchange transactions are those in which each party receives and gives up essentially equal values. Nonoperating items, such as interest expense and investment earnings, result from nonexchange transactions or ancillary activities.
The governmental fund financial statements are prepared using the current financial resources measurement focus and the modified accrual basis of accounting. Revenues are recognized when they are both measurable and available. Expenditures are recorded when the related liability is incurred. D. Assets, Liabilities, Deferred Outflows /
Inflows of Resources, and Equity Following are the County’s significant policies regarding recognition and reporting of certain assets, liabilities, deferred outflows/inflows, and equity.
49494949llllll lllll49

WEBER COUNTY, UTAH NOTES TO THE FINANCIAL STATEMENTS
Year Ended December 31, 2014 Cash and Investments Cash and cash equivalents consist primarily of demand deposits with financial institutions and short-term investments with original maturities of three months or less from the purchase date. Investments may include pooled and non-pooled investments with original maturities greater than three months. All cash equivalents and investments are stated at fair value. Restricted cash includes amounts held by the County’s bond trustee that are reserved for future debt service requirements. Receivables Taxes receivable include accrued amounts for sales taxes and delinquent property taxes. Receivables from other governments are reasonably assured. Accordingly, no allowance for uncollectible accounts has been established except for a $10,000 allowance in the Solid Waste Transfer Station Enterprise Fund. Property Taxes Property taxes attach as an enforceable lien on property on January 1st of each year. Taxes are levied on property owners in July and are payable by November 30th. The County bills and collects property taxes for all taxing entities within the County through the Tax Collection Agency Fund. Collections are periodically distributed to the taxing entities, with final settlement due March 31st of the subsequent year. The County records a receivable and deferred inflow for delinquent taxes in governmental funds, but no allowance for doubtful accounts is made as uncollected taxes are deemed to be substantially collectible through foreclosure. Inventories and Prepaid Items In all funds, inventories are recorded as expenditures or expenses when purchased, and amounts paid to vendors for goods and services applicable to future accounting periods are recorded as prepaid items. Capital Assets The County defines a capital asset as an asset with an initial cost of $5,000 or more and an estimated useful life of more than one year. Such assets are recorded at historical cost or estimated historical cost. Donated capital assets are recorded at estimated fair value on the date of donation. Capital assets purchased in governmental funds are recorded as expenditures in the governmental fund statements. Interest expense for capital asset construction related to governmental activities is not capitalized. Interest expense incurred during construction of capital assets related to business-type activities is capitalized. Buildings, equipment, infrastructure, and other depreciable assets are depreciated using the straight-line method over the following estimated useful lives:
Asset Class Years Infrastructure 15-40 Buildings and Improvements 10-50 Heavy Equipment 5-20 Vehicles 3-10 Other Equipment 3-20 Capital assets are reported in the applicable governmental or business-type activities columns in the government-wide financial statements. Deferred Outflows of Resources A deferred outflow of resources is a consumption of net position that applies to a future reporting period and therefore will be reported as an outflow/expense in future years. All deferred amounts on bond refundings are reported as deferred outflows of resources and amortized over the life of the bonds in the government-wide statements. Compensated Absences and Post-employment Benefits County employees accrue vacation leave up to a maximum of 320 hours according to years of service: Years of Hours Accrued Service Per Pay Period 0 – 5 years 4.00 (13 days per year) 6 – 10 years 4.62 (15 days per year) 11 – 15 years 5.54 (18 days per year) Over 15 years 7.07 (23 days per year) Employees are allowed to carry forward all accrued vacation leave into the next calendar year. Up to 320 hours of unused vacation leave is paid to employees upon termination. Employees may also earn compensatory time, but only at the discretion of the employee’s supervisor. The rate is one and one-half hours for each hour worked, with a maximum of 240 hours that can be accrued, except for public safety employees who can accrue up to 30 hours. Vacation and compensatory leave are recorded as an expenditure when used in governmental funds and as an expense when earned in the government-wide and proprietary fund statements. A liability for unused vacation and compensatory leave is recorded in the government-wide Statement of Net Position. Part-time employees accrue sick leave at one day for every 173 hours worked. Permanent full-time employees accrue sick leave at a rate of one day per month, with no limit on accumulated balances for employees hired prior to January 1, 2008. Employees hired on or after January 1, 2008 can accrue a maximum of 600 hours of sick leave. At the end of
50505050llllll lllll50

WEBER COUNTY, UTAH NOTES TO THE FINANCIAL STATEMENTS
Year Ended December 31, 2014 each calendar year an employee may convert to vacation hours 25% of sick leave that was earned but not used during the year. The County pays eligible retirees 1/3 of unused accumulated sick leave hours upon retirement and credits the remaining 2/3 to a Health Service Account on a dollar for dollar basis. For administrative purposes, the County maintains a termination pool within the General Fund. Payments of leave balances at termination are made from the pool and are funded by charges to departments’ ongoing budgets based on a fixed percentage of payroll. As explained in Note 12, payments for post-employment healthcare are also recognized as expenses of the pool, and rates are set annually to cover the estimated cost of the current year’s retiree healthcare benefits. Long-term Obligations In the government-wide statements and proprietary fund statements, long-term debt and other long-term obligations are reported as liabilities. Bond premiums and discounts are deferred and amortized over the life of the bonds using the straight-line method, which approximates the effective interest method. Bonds payable are reported net of unamortized premiums and discounts. In the governmental fund financial statements, bond premiums, discounts, and issuance costs are recognized in the current period. Premiums received on debt issuances are reported as other financing sources, while discounts on debt issuances are reported as other financing uses. Issuance costs, whether or not withheld from the actual debt proceeds, are reported as debt service expenditures. The face amount of debt issued is reported as other financing sources. Deferred Inflows of Resources A deferred inflow of resources is an acquisition of net position by the government that applies to a future reporting period and therefore will be recognized as an inflow/revenue in future years. Delinquent property taxes owed to the County but not yet collected are reported as deferred inflows of resources in the governmental fund statements and recognized as revenue as the taxes are collected in future years.
Net Position and Fund Balances The difference between assets/deferred outflows and liabilities/deferred inflows is net position on the government-wide, proprietary fund, and fiduciary fund statements, and fund balance on the governmental fund statements. Note 10 provides more information on the County’s policies and
classifications related to net position and fund balances. E. Revenues and Expenditures / Expenses Revenue Availability Under the modified accrual basis of accounting, revenues are recognized in governmental funds when they are both “measurable and available.” Revenues are considered to be available when they are collected within the current period or expected to be collected soon enough thereafter to pay liabilities of the current period. Weber County considers property tax revenues to be “available” if they are collected within 30 days after year-end. Grants and similar items are recognized as revenue when all eligibility requirements have been met. All other revenues, including sales taxes, are considered to be available if they are collected within 60 days after year-end. Proceeds of long-term debt and acquisitions under capital leases are reported as other financing sources. Expenditure/Expense Recognition In governmental funds, expenditures are generally recorded when the related liability is incurred. However, debt service expenditures, as well as expenditures related to compensated absences and claims and judgments, are recorded only when payment is due. Capital asset acquisition and construction are reported as expenditures in the period they are acquired or built. In proprietary funds and government-wide statements, expenses are recorded when the related liability is incurred. When an expenditure or expense is incurred for purposes for which both restricted and unrestricted resources are available, the County generally uses restricted resources first, then unrestricted resources.
F. Interfund Activity and Balances
Government-wide Statements In general, eliminations have been made to minimize the double-counting of internal activity, including internal service fund activity. However, interfund services provided and used between different functional categories have not been eliminated when to do so would distort the direct costs and program revenues of the applicable functions. Interfund receivables and payables have been eliminated from the Statement of Net Position, except for the residual amounts due between governmental and business-type activities, if any, which are shown as “internal balances.” Governmental Fund Statements Interfund transactions for goods and services provided and used are reported as revenues and expenditures in the funds involved. Cash transfers between funds of the
51515151llllll lllll51

WEBER COUNTY, UTAH NOTES TO THE FINANCIAL STATEMENTS
Year Ended December 31, 2014 County are reported as other financing sources and uses in the governmental fund statements. G. Future Changes in Accounting Standards The governmental Accounting Standards Board (GASB) issued Statement No. 68, Financial Reporting for Pension Plans – an amendment of GASB Statement No. 27, effective for calendar year 2016. This new accounting and reporting standard will impact the County’s measurement and recognition of liabilities, deferred outflows of resources, deferred inflows of resources, and expense/expenditures in government-wide and fund financial statements. This new accounting standard will require the County to record a liability in the government-wide statements equal to the County’s total Net Pension Liability (NPL) for the County’s proportionate share of the cost-sharing retirement systems in which it participates. The NPL can be volatile due to changes in actuarial estimates and the actual investment returns. The County’s combined unaudited NPL for the applicable plans at December 31, 2013 was $25.27 million based on a discount rate of 7.5 percent. The recording of the NPL in calendar year 2015 will reduce the County’s unrestricted net position in the government-wide statements when the liability is recorded.
NOTE 2. FINANCIAL REPORTING CHANGES / SPECIAL ITEMS
A. Change in Fund Classification In previous years the County reported the operations of the Crime Scene Investigation, Animal Shelter, Ogden Eccles Conference Center, Ice Sheet, and Golden Spike Event Center as separate special revenue funds. These funds no longer have specific revenue sources that are restricted or committed to expenditures for specified purposes as required by GASB 54 and therefore no longer meet the definition to be accounted for in special revenue funds. The County reclassified Crime Scene Investigations to be part of Public Safety in the General Fund. The County also reclassified the Ogden Eccles Conference Center, Ice Sheet, and Golden Spike Event Center to be part of Parks and Recreation in the General Fund. The Animal Shelter was reclassified as an enterprise fund using the full accrual basis of accounting. During the year the County also ceased the operation of the Termination Pool Internal Service Fund as a
separate fund and now reports those activities as part of the County's General Fund. The result of these reporting changes was to increase the beginning fund balance of the General Fund by $3,408,709, as shown below:
The Animal Shelter beginning net position was derived from the prior year ending fund balance adjusted to the full accrual basis of accounting, as follows:
In previous years, the Weber Morgan Health Department (WMHD) was classified as a special revenue fund of the County. However, as discussed in Note 1, the WMHD is a separate legal entity and is now being presented as a discrete component unit of the county.
As discussed in Note 1, the county pays eligible retirees 1/3 of their sick leave upon retirement and credits the remaining 2/3 to a Health Service Account. In previous years the County has not recorded a liability for the expected sick leave payouts in the government-wide Statement of Net Position as required by GASB 16.
Beginning Fund Balance:$ 14,056,567
AdjustmentsCrime Scene Investigations.................................. 143,050 Ogden Eccles Conference Center........................ 325,587 Ice Sheet.................................................................. 1,189 Golden Spike Events Center................................. 20,570 Termination Pool.................................................... 2,918,313
Total Adjustments............................................. 3,408,709
Beginning Fund Balance as Restated............ $ 17,465,276
General Fund per Prior Year Statements................
Beginning Fund Balance:$ (21,128)
Adjustments:Capital Assets, net................................................. 4,704 Compensated Absences....................................... (17,317)
Total Adjustments............................................. (12,613)
Beginning Net Position.................................... $ (33,741)
Animal Shelter per Prior Year Statements..............
Beginning Fund Balance:$ 4,271,410
Adjustments:Capital Assets, net................................................. 2,859,372 Compensated Absences....................................... (255,891) Deferred Revenue.................................................. 79,998
Total Adjustments............................................. 2,683,479
Beginning Net Position.................................... $ 6,954,889
Consolidated Health Fund.......................................
52525252llllll lllll52

WEBER COUNTY, UTAH NOTES TO THE FINANCIAL STATEMENTS
Year Ended December 31, 2014 The County restated the Beginning Net Position of its Governmental Activities by $5,383,458. The net effect of these adjustments on the Beginning Net Position on the Statement of Activities is shown below:
B. Special Items As discussed in Note 1, payments for postemployment benefits are now made out of the termination pool in the general fund and are funded by charges to departments’ ongoing budgets based on a fixed percentage of payroll. As a result, the County transferred the OPEB liability of $165,578 previously recorded in the Solid Waste Transfer Station (enterprise fund) to the general fund and now reports the liability as part of the Governmental Activities long term liabilities on the Statement of Net Position.
NOTE 3. DEPOSITS AND INVESTMENTS
Deposits and investments of Weber County are governed by the Utah Money Management Act (Utah Code Annotated, Title 51, Chapter 7, “the Act”) and by rules of the Utah Money Management Council (“the Council”). Following are discussions of the County’s exposure to various risks related to its cash management activities.
A. Custodial Credit Risk
Deposits. Custodial credit risk for deposits is the risk that in the event of a bank failure, the County’s deposits may not be recovered. The County’s policy for managing custodial credit risk is to adhere to the Money Management Act (the Act). The Act requires all deposits of County funds to be in a qualified depository, defined as any financial institution whose deposits are insured by an agency of the federal government and which has been certified by the Commissioner of Financial Institutions as meeting the requirements of the Act and adhering to the rules of the Utah Money Management Council.
The County’s deposits in the bank in excess of the insured amount are uninsured and are not collateralized, nor do state statutes require them to be. At December 31, 2014, the bank balance of the
County’s deposits was $10,928,364, of which $9,486,142 was uninsured and uncollateralized.
Investments. Custodial credit risk for investments is the risk that in the event of the failure of the counterparty, the County will not be able to recover the value of its investments that are in the possession of an outside party. The County does not have a formal policy for custodial credit risk of investments. As of December 31, 2014, all of the County's investments were held by the public treasurer, in safekeeping by a bank or trust company, or in a book-entry-only record maintained by a securities depository.
B. Credit Risk
Credit risk is the risk that the counterparty to an investment transaction will not fulfill its obligations. The County’s policy for limiting the credit risk of investments is to comply with the Money Management Act. The Act requires investment transactions to be conducted only through qualified depositories, certified dealers, or directly with issuers of the investment securities. Permitted investments include deposits of qualified depositories; repurchase agreements; commercial paper that is classified as “first-tier” by two nationally recognized statistical rating organizations, one of which must be Moody’s Investor Services or Standard & Poors; bankers
Beginning Net Position:$ 169,537,984 $ 10,119,295 $ 5,270,780
Adjustments:Sick Leave............................................................... (5,383,458) - - Animal Shelter........................................................ 33,741 (33,741) Weber Morgan Health Department..................... (6,954,889) 6,954,889 Weber Housing Authority................................... - - 416,574
Total Adjustments............................................. (12,304,606) (33,741) 7,371,463
Beginning Net Position, as Adjusted............ $ 157,233,378 $ 10,085,554 $ 12,642,243
Component Units
Governmental Activities
Net Position per Prior Year Statements..................
Business-typeActivities
53535353llllll lllll53

WEBER COUNTY, UTAH NOTES TO THE FINANCIAL STATEMENTS
Year Ended December 31, 2014 acceptances; obligations of the U.S. Treasury and U.S. government sponsored enterprises; bonds and notes of political subdivisions of the State of Utah; fixed rate corporate obligations and variable rate securities rated “A” or higher by two nationally recognized statistical rating organizations; and shares in a money market fund as defined in the Act.
The County is also authorized to invest in the PTIF, an external pooled investment fund managed by the Utah State Treasurer and subject to the Act and Council requirements. The PTIF is not registered with the SEC as an investment company, and deposits in the PTIF are not insured or otherwise guaranteed by the State of Utah. The PTIF operates and reports to participants on an amortized cost basis. The income, gains, and losses of the PTIF, net of administration fees, are allocated based on the
participants’ average daily balances. The fair value of the PTIF investment pool is approximately equal to the value of the pool shares.
C. Interest Rate Risk
Interest rate risk is the risk that changes in interest rates will adversely affect the fair value of an investment. The County’s policy for managing interest rate risk is to comply with the Money Management Act. The Act requires that the remaining term to maturity of investments may not exceed the period of availability of the funds to be invested. The County manages its exposure to declines in fair value by investing in the PTIF and by adhering to the Act. Following are the County’s investments at December 31, 2014:
Fair QualityInvestment Type Value Maturity RatingsPTIF Investments..................... $ 107,605,754 2 months* not rated
Mutual Funds .......................... 9,968,008 29 months* AA+/Aa1/AA+
Total $ 117,573,762
* Weighted-average maturity
54545454llllll lllll54

WEBER COUNTY, UTAH NOTES TO THE FINANCIAL STATEMENTS
Year Ended December 31, 2014 NOTE 4. INTERFUND BALANCES Interfund balances result from time lags between the dates of payment for goods and services and collection of revenues. Interfund balances at December 31, 2014 consisted of the following amounts:
NOTE 5. INTERFUND TRANSFERS
Transfers between funds occur primarily to finance programs accounted for in one fund with resources collected in other funds in accordance with budgetary authorizations. Interfund transfers among governmental and internal service funds for the year ended December 31, 2014 were as follows:
Due To General Fund from:Major Governmental Funds:
Public Works.......................................................... $ 2,923,637 Nonmajor Governmental Funds:
Municipal Services Fund...................................... 50,807 Tourism Fund......................................................... 724,855 Special Assessment Bond Fund.......................... 2,600
Enterprise Funds:Landfill Gas Recovery Fund................................. 199,336 Animal Shelter Fund.............................................. 116,874
Total Due From Other Funds.......................... $ 4,018,109
Transfers Out reported in:
Redevelopment AnimalTourism Agency Shelter Total
General Library Fund Fund (Enterprise TransfersFund Fund (Nonmajor) (Nonmajor) Fund) In
Transfers In reported in:Governmental Funds:
General Fund............................ $ — $ — $ 1,655,914 $ 15,000 $ — $ 1,670,914 Library Fund............................. — — — — — — Debt Service Fund................... — 425,700 — — 232,445 658,145 Public Works Fund................. — — — — — — Capital Projects Fund.............. 6,723,048 — 38,811 — — 6,761,859
Total Transfers Out.......... $ 6,723,048 $ 425,700 $ 1,694,725 $ 15,000 $ 232,445 $ 9,090,918
55555555llllll lllll55

WEBER COUNTY, UTAH NOTES TO THE FINANCIAL STATEMENTS
Year Ended December 31, 2014 NOTE 6. ACCOUNTS PAYABLE AND ACCRUED LIABILITIES Accounts payable and accrued liabilities as of December 31, 2014 consisted of the following amounts:
NOTE 7. LEASE COMMITMENTS The County has entered into a non-cancelable lease for storage space. Operating leases are leases for which the County will not gain title to the property being leased; therefore, the related assets and liabilities are not recorded on the County’s books. Operating lease payments are recorded as expenditures or expenses when paid or incurred. Total operating lease payments for 2014 were $16,800. Leases that in substance are purchases are reported as capital lease obligations. In the government-wide and proprietary fund statements, assets and liabilities resulting from capital leases are recorded at the inception of the lease at either the lower of fair value
or the present value of the future minimum lease payments. The principal portion of lease payments reduces the liability, and the interest portion is expensed. In governmental fund statements, both the principal and interest portions of capital lease payments are recorded as expenditures of the applicable governmental function. At December 31, 2014, the historical cost and accumulated depreciation of equipment acquired under capital leases were $536,040 and $168,748, respectively. Total capital lease payments for 2014 were $258,544 in principal and $6,005 in interest. Future minimum lease commitments for non-cancelable capital leases as of December 31, 2014 are as follows:
Interest /Salaries / Government RelatedBenefits Vendors Agencies Charges Total
Governmental Activities:General Fund....................... $ 1,437,971 $ 1,060,948 $ 171,975 $ — $ 2,670,894 Library Fund....................... 144,100 88,422 2,917 — 235,439 Paramedic Fund.................. — 53,325 — — 53,325 Transportation Fund......... — 6,868 — — 6,868 Debt Service Fund............. — — — 754,034 754,034 Capital Projects Fund........ — 1,429,869 — — 1,429,869 Public Works Fund............ — 1,019,090 — — 1,019,090 Nonmajor Funds................. 79,187 746,659 24,758 462,190 1,312,794 Internal Service Funds...... 42,944 364 — 43,308 Total Governmental Activities...................... $ 1,661,258 $ 4,448,125 $ 200,014 $ 1,216,224 $ 7,525,621
Business-type Activities:Solid Waste Transfer Station Fund.................. $ 41,894 $ 497,374 $ 2,828 $ — $ 542,096 Landfill Gas Recovery Fund.............. — 10,241 — — 10,241 Animal Shelter.................... 10,173 6,238 216 — 16,627 Total Business-type Activities...................... $ 52,067 $ 513,853 $ 3,044 $ — $ 568,964
56565656llllll lllll56

WEBER COUNTY, UTAH NOTES TO THE FINANCIAL STATEMENTS
Year Ended December 31, 2014
Operating Leases Capital Leases
Governmental Business-type Governmental Business-typeYear Activities Activities Total Activities Activities Total
2015.............. $ 16,800 $ — $ 16,800 $ 17,063 $ 93,118 $ 110,181 2016.............. 16,800 — 16,800 16,408 67,671 84,079 2017.............. 16,800 — 16,800 12,741 38,705 51,446 2018.............. 4,200 — 4,200 5,162 — 5,162 2019.............. — — — 164 — 164
Total........ $ 54,600 $ — $ 54,600 51,538 199,494 251,032
Less Amounts Representing Interest.................................................. (569) (4,201) (4,770)
Present Value of Future Minimum Lease Payments........................... $ 50,969 $ 195,293 $ 246,262
(Notes continue on the next page.)
57575757llllll lllll57

WEBER COUNTY, UTAH NOTES TO THE FINANCIAL STATEMENTS
Year Ended December 31, 2014
NOTE 8. CAPITAL ASSETS
Capital asset activity for the year ended December 31, 2014 was as follows:
* Includes the adjustment to beginning balances as described in Note 2.
Capital Assets
Beginning Ending
Balance * Additions Deletions Balance
Governmental Activities:
Capital assets being depreciated:
Buildings and Improvements.......................... $ 136,897,775 $ 12,311,803 $ — $ 149,209,578
Equipment - Governmental Funds.................. 13,377,815 603,219 523,141 13,457,893
Equipment - Internal Service Funds............... 6,241,745 740,685 510,074 6,472,356
Infrastructure..................................................... 46,491,449 1,196,448 — 47,687,897
Intangible Assets-Software............................ 756,414 — — 756,414
Total............................................................... 203,765,198 14,852,155 1,033,215 217,584,138
Less Accumulated Depreciation for:
Buildings and Improvements.......................... 55,872,385 4,037,762 — 59,910,147
Equipment - Governmental Funds.................. 9,510,764 889,909 511,503 9,889,170
Equipment - Internal Service Funds............... 3,128,307 839,290 416,387 3,551,210
Infrastructure..................................................... 34,770,341 602,004 — 35,372,345
Intangible Assets-Software............................ 424,240 143,110 — 567,350
Total............................................................... 103,706,037 6,512,075 927,890 109,290,222
100,059,161 8,340,080 105,325 108,293,916
28,465,009 3,517,937 — 31,982,946
14,471,528 20,516,258 7,101,538 27,886,248
Governmental Activities Capital Assets, Net..... $ 142,995,698 $ 32,374,275 $ 7,206,863 $ 168,163,110
Business-type Activities:
Capital assets being depreciated:
Buildings and Improvements.......................... $ 11,259,526 $ 60,130 $ — $ 11,319,656
Equipment.......................................................... 5,357,107 63,979 677,086 4,744,000
Total............................................................... 16,616,633 124,109 677,086 16,063,656
Less Accumulated Depreciation for:
Buildings and Improvements.......................... 2,400,037 265,850 — 2,665,887
Equipment.......................................................... 3,279,526 254,874 623,034 2,911,366
Total............................................................... 5,679,563 520,724 623,034 5,577,253
10,937,070 (396,615) 54,052 10,486,403
1,604,504 — — 1,604,504
$ 12,541,574 $ (396,615) $ 54,052 $ 12,090,907 Business-type Activities Capital Assets, Net....
Capital assets being depreciated, net...............
Land and Related Assets...................................
Construction-In-Progress...................................
Capital assets being depreciated, net...............
Land and Related Assets...................................
llllll lllll5858585858

WEBER COUNTY, UTAH NOTES TO THE FINANCIAL STATEMENTS
Year Ended December 31, 2014
Discrete Component Units The following table summarizes net capital assets reported by the discrete component units:
Depreciation expense of governmental activities for 2014 was charged to functions as follows:General Government......................................... $ 722,651 Public Safety...................................................... 1,346,175 Public Health and Welfare............................... 342,065 Library Services................................................ 627,646 Streets and Public Improvements................... 800,511 Parks, Recreation & Public Facilities............. 1,833,000 Conservation and Development..................... 737 Depreciation on capital assets of the County's internal service funds is charged to the various functions based on their usage of assets............... 839,290
Total............................................................ $ 6,512,075
Weber Morgan Weber Housing Weber Morgan911 Authority Health Total
Capital assets being depreciated:Buildings and Improvements.......................... $ — $ 12,590 $ 2,900,168 $ 2,912,758 Equipment ......................................................... 1,215,492 12,665 600,359 1,828,516 0 Total............................................................... 1,215,492 25,255 3,500,527 4,741,274
Less Accumulated Depreciation for:Buildings and Improvements.......................... — 5,666 253,765 259,431 Equipment ......................................................... 751,235 12,665 468,950 1,232,850
Total............................................................... 751,235 18,331 722,715 1,492,281 464,257 6,924 2,777,812 3,248,993 734,880 — — 734,880
Capital Assets, Net................................................. $ 1,199,137 $ 6,924 $ 2,777,812 $ 3,983,873
Capital assets being depreciated, net...............Construction-In-Progress...................................
59595959llllll lllll59

WEBER COUNTY, UTAH NOTES TO THE FINANCIAL STATEMENTS
Year Ended December 31, 2014
NOTE 9. LONG-TERM LIABILITIES
A. Changes in Long-term Liabilities
Changes in long-term liabilities for the year ended December 31, 2014 were as follows:
* Includes the adjustment to the beginning balance of Compensated Absences as described in Note 2.
For active employees, the compensated absences liability of governmental activities is liquidated in the General Fund or special revenue fund where the related employing department operates. Upon termination, the liability is liquidated in the General Fund. See Note 1 for additional discussion of compensated absences.
B. General Obligation Bonds
During 2014, the County did not issue any new General Obligation Bonds. General Obligation Bonds Payable at December 31, 2014 consisted of the following:
Long-term Liabilities
Beginning Ending Due Within
Balance* Additions Deletions Balance One Year
Governmental Activities:
General Obligation Bonds............................. $ 41,010,000 — (1,530,000) $ 39,480,000 $ 1,585,000
Sales Tax Revenue Bonds............................. 14,135,000 4,235,000 (4,990,000) 13,380,000 935,000
Lease Revenue Bonds................................... 18,060,000 2,290,000 (5,845,000) 14,505,000 2,390,000
Special Assement Area Bonds..................... 17,670,000 — — 17,670,000 —
Unamortized Premiums / Discounts............. 3,815,010 496,629 (449,869) 3,861,770 —
RDA Note Payable......................................... — —
Capital Leases - Governmental Funds......... 56,956 10,352 (16,339) 50,969 16,759
Capital Leases - Internal Service Funds...... 102,066 — (102,066) — —
Compensated Absences............................... 8,287,559 4,571,075 (3,671,855) 9,186,779 3,555,257
Net OPEB Obligation..................................... 6,360,439 1,445,974 — 7,806,413 —
Arbitrage Rebate............................................ — — — — —
$ 109,497,030 $ 13,049,030 $ (16,605,129) $ 105,940,931 $ 8,482,016
Business-type Activities:
Sales Tax Revenue Bonds............................. $ 745,000 $ 640,000 $ (745,000) $ 640,000 $ 160,000
Unamortized Discounts................................. (6,783) — 6,783 — —
Capital Leases................................................. 335,431 — (140,138) 195,293 90,344
Compensated Absences............................... 103,357 84,609 (81,843) 106,123 81,843
Net OPEB Obligation..................................... 165,578 — (165,578) — —
Landfill Post-Closure Costs.......................... 1,316,790 82,358 (48,278) 1,350,870 48,278
$ 2,659,373 $ 806,967 $ (1,174,054) $ 2,292,286 $ 380,465
Component Units
Compensated Absences............................... 427,102 209,985 (197,869) 439,218 197,869
$ 427,102 $ 209,985 $ (197,869) $ 439,218 $ 197,869
Total Governmental Long-term Liabilities.....
Total Business-type Long-term Liabilities....
Total Business-type Long-term Liabilities....
llllll lllll6060606060

WEBER COUNTY, UTAH NOTES TO THE FINANCIAL STATEMENTS
Year Ended December 31, 2014
General Obligation Bonds Payable
Issue Maturity Interest Original BalanceDate Date Rate Amount December 31, 2014
2013 Project & Refunding Bonds.. 12/19/2013 1/15/2034 2.00% to 5.00% $ 39,480,000 $ 39,480,000 2004 Refunding Bonds................... 3/30/2004 1/15/2018 2.25% to 5.00% 15,525,000 —
39,480,000 2,144,690
$ 41,624,690 Total General Obligation Bonds Payable...................................................................................................
Add Unamortized Premium........................................................................................................................... Total General Obligation Bonds Outstanding...........................................................................................
General Obligation Bonds - Debt Service Requirements to Maturity
Series 2004 Refunding Series 2013 Project & Ref. Total General Obligation Bonds
Year Principal Interest Principal Interest Principal Interest Total2015.............. — — $ 1,585,000 $ 1,607,696 $ 1,585,000 $ 1,607,696 $ 3,192,696 2016.............. — — 1,615,000 1,575,421 1,615,000 1,575,421 3,190,421 2017.............. — — 1,660,000 1,510,442 1,660,000 1,510,442 3,170,442 2018.............. — — 1,730,000 1,424,779 1,730,000 1,424,779 3,154,779 2019.............. — — 1,435,000 1,352,415 1,435,000 1,352,415 2,787,415 2020 - 2024... — — 8,360,000 5,568,877 8,360,000 5,568,877 13,928,877 2025 - 2029... — — 10,370,000 3,555,158 10,370,000 3,555,158 13,925,158 2030 - 2034... — — 12,725,000 1,149,603 12,725,000 1,149,603 13,874,603 Total........ $ — $ — $ 39,480,000 $ 17,744,391 $ 39,480,000 $ 17,744,391 $ 57,224,391
61616161llllll lllll61

WEBER COUNTY, UTAH NOTES TO THE FINANCIAL STATEMENTS
Year Ended December 31, 2014 C. Sales Tax Revenue Bonds On December 9th 2014, the county issued $640,000 of series 2014A Sales Tax Refunding Bonds to refund the series 2003A Project Bonds and $4,235,000 of series 2014B Sales Tax Refunding Bonds to partially refund the 2006 Project Bonds. Sales Tax Revenue Bonds Payable at December 31, 2014 consisted of the following:
Pledged Revenues. The County has pledged future sales tax revenues to pay up to 100% of the outstanding principal and interest payments of all series of sales tax revenue bonds listed above. Sales taxes are pledged through 2032 and include both the county option ¼% sales tax reported in the General Fund and the local option 1% sales tax reported in the Municipal Services Fund (nonmajor fund). The current year’s principal and interest paid and total pledged sales tax revenue collected were $1,492,655 and $11,814,388, respectively. Proceeds from the County’s sales tax revenue bonds were used to build the landfill gas recovery system (Series 2003A), a new Health Department building (Series 2003B), a new library building (Series 2006), an expansion to the county’s animal shelter (Series 2010AB), an expansion of the Ice Sheet (Series 2012), refunding of the series 2003B bonds (Series 2012), refunding of the series 2003A bonds (Series 2014A) and a partial refunding of the series 2006 bonds (Series 2014B). Although sales tax revenues are legally pledged as security for the bonds, to date all principal and interest payments have been made
from other sources. The County has not used any pledged sales tax revenues to meet annual debt service requirements, nor does it expect to do so in future years. The County issued the Series 2010B bonds as “Build America Bonds” under the American Recovery and Reinvestment Act of 2009. As such, the County will receive an annual cash subsidy from the U.S. Treasury equal to 35% of the interest payable on the bonds until the bonds mature. These subsidy payments are pledged for payment on the bonds and are paid by the U.S. Treasury directly to the County’s bond trustee shortly before the semi-annual interest payment is due. The subsidies are recorded as Intergovernmental Revenue in the Debt Service Fund, and the amounts shown below as future interest on the 2010B bonds do not include the subsidy payments. The following table shows the County’s annual debt service requirements to maturity for all outstanding sales tax revenue bonds.
Sales Tax Revenue Bonds Payable
Issue Maturity Interest Original BalanceDate Date Rate Amount December 31, 2014
Governmental Activities:2006 Project Bonds..................... 12/6/2006 7/1/2026 4.50% to 5.00% $ 6,950,000 $ 615,000 2010A Project Bonds.................. 3/23/2010 7/1/2015 2.00% to 2.50% 685,000 150,000 2010B BAB Project Bonds......... 3/23/2010 7/1/2029 3.20% to 5.70% 2,560,000 2,560,000 2012 Project/Refunding Bonds. 11/27/2012 7/1/2032 1.00% to 2.63% 6,455,000 5,820,000 2014B Refunding Bonds............ 12/9/2014 7/1/2026 2.00% to 4.00% 4,235,000 4,235,000
13,380,000 629,611
14,009,611 Business-type Activities:
2003A Project Bonds.................. 10/22/2003 7/1/2018 3.00% to 5.25% $ 1,835,000 — 2014A Refunding Bonds............ 12/9/2014 7/1/2018 1.20% 640,000 640,000
—
640,000
$ 14,649,611
Total Sales Tax Revenue Bonds Payable, Governmental Activities..................................................
Add Unamortized Premium....................................................................................................................... Total Sales Tax Revenue Bonds Outstanding......................................................................................
Total Sales Tax Revenue Bonds Payable, Primary Government.........................................................
Less Unamortized Discount.....................................................................................................................
Total Sales Tax Revenue Bonds Payable, Business-type Activities.................................................
62626262llllll lllll62

WEBER COUNTY, UTAH NOTES TO THE FINANCIAL STATEMENTS
Year Ended December 31, 2014
D. Lease Revenue Bonds On December 9th 2014, the Municipal Building Authority issued $2,290,000 of series 2014 Lease Revenue Refunding Bonds to refund the series 2005 Refunding Bonds. Lease Revenue Bonds Payable at December 31, 2014 consisted of the following:
Series 2003A Series 2006 Series 2010A Series 2010B
Year Principal Interest Principal Interest Principal Interest Principal Interest2015............ $ — $ — $ 300,000 $ 23,250 $ 150,000 $ 1,875 $ — $ 125,973 2016............ — — 315,000 7,875 — — 150,000 123,573 2017............ — — — — — — 155,000 118,305 2018............ — — — — — — 160,000 112,278 2019............ — — — — — — 165,000 105,611 2020-2024... — — — — — — 885,000 409,010 2025-2029... — — — — — — 1,045,000 153,188
Total....... $ — $ — $ 615,000 $ 31,125 $ 150,000 $ 1,875 $ 2,560,000 $ 1,147,938
Series 2012 Series 2014A Series 2014B Total Sales Tax Revenue Bonds
Year Principal Principal Principal Interest Principal Interest2015............ $ 395,000 $ 117,750 $ 160,000 $ 7,189 $ 90,000 $ 142,138 $ 1,095,000 $ 418,175 2016............ 405,000 109,750 160,000 4,800 30,000 132,700 1,060,000 378,698 2017............ 415,000 101,550 160,000 2,880 360,000 128,800 1,090,000 351,535 2018............ 420,000 93,200 160,000 960 375,000 121,450 1,115,000 327,888 2019............ 430,000 84,700 — — 380,000 113,425 975,000 303,736 2020-2024... 2,005,000 292,425 — — 2,060,000 388,575 4,950,000 1,090,010 2025-2029... 1,060,000 144,141 — — 940,000 38,000 3,045,000 335,329 2030-2032... 690,000 26,578 — — — — 690,000 26,578
Total....... $ 5,820,000 $ 970,094 $ 640,000 $ 15,829 $ 4,235,000 $ 1,065,088 $ 14,020,000 $ 3,231,949
InterestInterest
Sales Tax Revenue Bonds - Debt Service Requirements to Maturity
Lease Revenue Bonds Payable
Issue Maturity Interest Original BalanceDate Date Rate Amount December 31, 2014
2005 Refunding Bonds.......... 5/10/2005 12/15/2019 3.375% to 5.25% $ 6,775,000 $ — 2009 Refunding Bonds.......... 8/18/2009 12/15/2019 2.0% to 5.0% 22,650,000 12,215,000 2014 Refunding Bonds.......... 12/9/2014 12/15/2019 2.0% to 2.5% 2,290,000 2,290,000
14,505,000 198,744
$ 14,703,744 Total Lease Revenue Bonds Payable................................................................................................
Total Lease Revenue Bonds Outstanding........................................................................................ Add: Unamortized Premium................................................................................................................
Lease Revenue Bonds - Debt Service Requirements to Maturity
Series 2014 Refunding Series 2009 Refunding Total Lease Revenue Bonds
Year Principal Interest Principal Interest Principal Interest Total2015............. 480,000 51,519 1,910,000 481,814 2,390,000 533,333 2,923,333 2016............. 490,000 41,129 1,975,000 419,445 2,465,000 460,574 2,925,574 2017............. 505,000 31,264 2,040,000 349,800 2,545,000 381,064 2,926,064 2018............. 515,000 19,839 2,125,000 268,058 2,640,000 287,897 2,927,897 2019............. 300,000 7,188 4,165,000 178,825 4,465,000 186,013 4,651,013
Total........ $ 2,290,000 $ 150,939 $ 12,215,000 $ 1,697,942 $ 14,505,000 $ 1,848,881 $ 16,353,881
63636363llllll lllll63

WEBER COUNTY, UTAH NOTES TO THE FINANCIAL STATEMENTS
Year Ended December 31, 2014 E. Special Assessment Bonds During 2014 the County did not issue any new Special Assessment Bonds. In prior years, the County issued $17,670,000 of Special Assessment bonds. Proceeds from the bonds are being used to finance infrastructure improvements in the Summit Mountain Assessment Area, to fund a capitalized interest account, and to fund a debt service reserve account equal to one year of principal and interest payments (the Bond Funded Reserve Account). The developer, Summit Mountain Holding Group (SMHG), contributed cash to a second reserve account equal to one year of principal and interest payments (the Developer Funded Reserve Account). SMHG also agreed to fund a third reserve account, up to $720,000, over time as building permits are issued for units within the assessment area (the Development Funded Reserve Account). The bonds are payable from the levy of assessments against the properties located in the assessment area. Properties for which assessments are not paid are subject to foreclosure, and proceeds from foreclosure sales are to be used to pay the balance of the assessment applicable to that property. In the event that proceeds from foreclosure sales, combined with
annual assessment payments from property owners, are not sufficient to pay the total annual debt service payment, the debt service reserve accounts will be drawn upon first from the Development Funded Reserve Account, then from the Developer Funded Reserve Account, then from the Bond Funded Reserve Account. In addition, in the event that the Bond Funded Reserve Account is drawn down for any reason, the County has pledged to replenish the Bond Funded Reserve Account from one or more of the following sources: (a) an appropriation from the General Fund; (b) the issuance of general obligation bonds (which would require voter approval); (c) an appropriation from any other available funds as determined by the County; or (d) the levy of a property tax up to .0002 per dollar of taxable value of taxable property within the County in any one year. The County’s pledge to replenish the Bond Funded Reserve Account is legally binding as long as any of the 2013 Special Assessment bonds remain outstanding. Special Assessment Bonds Payable at December 31, 2014 consisted of the following:
Special Assessment Bonds Payable
Issue Maturity Interest Original BalanceDate Date Rate Amount December 31, 2014
2013 Special Assessment Bonds.......... 9/17/2013 1/15/2033 5% to 5.75% $ 17,670,000 $ 17,670,000
17,670,000 888,725
$ 18,558,725 Total Special Assessment Bonds Payable.....................................................................................................
Total Special Assessment Bonds Outstanding............................................................................................ Add Unamortized Premium...............................................................................................................................
Special Assessment Bonds - Debt Service Requirements to Maturity
Series 2013
Year Principal Interest Total2015............. — 959,575 959,575 2016............. 610,000 930,346 1,540,346 2017............. 640,000 898,408 1,538,408 2018............. 670,000 864,971 1,534,971 2019............. 705,000 829,794 1,534,794 2020-2024.... 4,115,000 3,549,088 7,664,088 2025-2029.... 5,380,000 2,244,879 7,624,879 2030-2033.... 5,550,000 514,984 6,064,984
Total........ $ 17,670,000 $ 10,792,045 $ 28,462,045
64646464llllll lllll64

WEBER COUNTY, UTAH NOTES TO THE FINANCIAL STATEMENTS
Year Ended December 31, 2014 F. Defeased Bonds On December 9, 2014, the County used the proceedes from three bond issues to refund previously issued bonds. The Series 2014A Sales Tax bonds were used to currently refund $610,000 of outstanding Series 2003A Sales Tax Project bonds. The net proceeds of the new bonds of $640,000 were deposited into an irrevocable escrow account to be used to redeem the outstanding principal amounts of the Series 2003A bonds. The refunding resulted in a cash flow savings of $36,333 over the next four years and resulted in an economic gain (difference between the present values of the old and new debt service payments) of $35,599. As a result $610,000 of the Series 2003A bonds are considered defeased and a liability of this amount has been removed from the Statement of Net Position. The Series 2014B Sales Tax bonds were used to advance refund $4.17 million of outstanding Series 2006 Sales Tax Project bonds. The net proceeds of the new bonds of $4.65 million were deposited into an irrevocable escrow account to be used to redeem the outstanding principal amounts of the Series 2006 bonds. The refunding resulted in a cash flow savings of $517,162 over the next 12 years and resulted in an economic gain (difference between the present values of the old and new debt service payments) of $462,108. As a result $4.17 million of the Series 2006 bonds are considered defeased and a liability of this amount has been removed from the Statement of Net Position. A balance of $615,000 remains outstanding because a principle payments due July 1, 2015 and July 1, 2016 were not included in the refunding transaction.
The Series 2014 Lease Revenue bonds were used to currently refund $3.99 million of outstanding Series 2005 Lease Revenue refunding bonds. The net proceeds of the new bonds of $4.65 million were deposited into an irrevocable escrow account to be used to redeem the outstanding principal amounts of the Series 2005 bonds. The refunding resulted in a cash flow savings of $1.73 million over the next five years and resulted in an economic gain (difference between the present values of the old and new debt service payments) of $423,373. As a result $3.99 million of the Series 2005 bonds are considered defeased and a liability of this amount has been removed from the Statement of Net Position In prior years, the County defeased certain general obligation and lease revenue bonds by placing the proceeds of new bonds and other monies into irrevocable trusts to provide for all future debt service payments on the old bonds. Accordingly, the trust account assets and the liability for the defeased bonds are not included in the Statement of Net Position. At December 31, 2014, $11.26 million of bonds outstanding are considered defeased. G. Conduit Debt Obligations As allowed by federal and state laws and IRS regulations, Weber County has acted as a conduit for tax-exempt financing for various private entities located in the County. In all such cases, the bonds are secured by the facilities and equipment that were acquired with bond proceeds, and the bonds are payable solely from the revenues of the company for whom the bonds were issued. The County is not obligated in any manner for repayment of the bonds and therefore the bonds are not reported as liabilities of the County. As of December 31, 2014, the following conduit debt obligations were outstanding:
Entity Name / Issue Maturity Par Outstanding atConduit Debt Issue Type of Facilities Financed Date Date Amount Dec. 31, 2014
Weber County Variable Rate Demand IHC Health Services, Inc. /Hospital Revenue Bonds Series 2000 Hospital Facilities 2/15/2000 2/15/2035 125,000,000$ 125,000,000$
Weber County Multi-mode Variable Rate Enable Industries, Inc. /Industrial Revenue Bonds Series 2003 Vocational Rehabilitation 12/1/2003 12/1/2015 1,185,000$ 105,000$
Weber County Business Development Swanson Family Foundation /Revenue Bonds Series 2006 Law Enforcement Training 10/1/2006 10/1/2016 2,750,000$ 2,009,262$
Weber County Business Development U.S. Holdings, Inc. /Revenue Bonds Series 2007 Industrial Manufacturing 3/1/2007 3/1/2027 4,500,000$ 4,500,000$
Weber County Manufacturing Great Salt Lake Brine Shrimp Coop. Inc./Facility Revenue Bonds Series 2010AB Manufacturing Facility 10/10/2010 10/20/2030 6,800,000$ 5,376,633$
65656565llllll lllll65

WEBER COUNTY, UTAH NOTES TO THE FINANCIAL STATEMENTS
Year Ended December 31, 2014 NOTE 10. NET POSITION AND FUND
BALANCES A. Net Position Net position restricted by enabling legislation represents resources which a party external to the County – such as citizens, public interest groups, or the courts – can compel the County to use only for the purpose specified by the legislation. The Statement of Net Position reports $41,782,851 of total restricted net position, of which $37,270,081 is restricted by enabling legislation. The County reported a deficit unrestricted net position in all three of its enterprise funds. Solid Waste Transfer Station Fund - This deficit
is the result of cash subsidies given to the Landfill Gas Recovery Fund to cover operating losses in prior years and operating costs exceeding revenues due to increased costs of waste hauling and disposal. The County is currently exploring options for increasing revenues to help close the deficit, including an increase to the per-ton tipping fee.
Landfill Gas Recovery Fund – This deficit is the result of operating costs exceeding revenues due to lower than expected gas volumes and increased maintenance costs. The County is currently exploring options for decreasing expenses to help close the deficit.
Animal Shelter Fund – This deficit resulted because of a reduction in the number of animals that could be billed to the cities who participate in the shelter’s operations. The deficit amount will be recovered from the cities in 2015 via a supplemental billing.
B. Governmental Fund Balances – Restricted,
Committed, and Assigned Weber County’s spendable fund balances are classified into three categories: 1) Restricted Purposes, which include balances that are legally restricted for specific purposes due to constraints that are externally imposed by creditors, grantors, contributors, or laws or regulations of other governments; 2) Committed Purposes, which include balances that can only be used for specific purposes pursuant to constraints imposed by formal action (motion or resolution) of the County Commission in a public meeting; 3) Assigned Purposes, which include balances that are constrained by the government’s intent to be used for specific purposes, but are neither restricted nor committed. Per County policy, assigned fund balance amounts are
determined by the Clerk/Auditor’s Office at year-end in consultation with other departments that directly manage those specific resources, and in accordance with the purposes of the funds in which the balances reside. When expenditures are incurred for purposes for which both restricted and unrestricted fund balance is available, the County’s policy is to first apply restricted balances, then committed balances, then assigned balances. The table below summarizes the purposes of the County’s restricted, committed, and assigned fund balances.
C. Unassigned Fund Balance Unassigned fund balance is the residual classification for the General Fund. This amount represents fund balance that has not been assigned to other funds and that has not been restricted, committed, or assigned to specific purposes within the General Fund. State law limits unassigned fund balance of the General Fund
Governmental Fund Balances
Restricted Committed AssignedPurposes Purposes Purposes
General Fund:Surveyor Monuments.............................. $ 82,016 $ — $ — Attorney Prosecution............................... 3,556 — 122,445 Stormwater Projects.................................. — — 547,517 Public Safety Programs............................ 232,436 — 399,787 Future Capital Projects............................. 240,883 — — Parks and Recreation................................ — — 21,759 Tourism and Convention Activities....... — — 174,400 Post Employment and Other Liabilities.. — — 1,761,839 Total General Fund.............................. 558,891 — 3,027,747
Other Funds:Library Fund.............................................. — 3,773,704 — Paramedic Fund......................................... — 3,864,314 —
Transportation Development Fund: Grants to Other Governments.............. — 21,757,096 — Future Transportation Projects............ — 11,551,936 — Debt Service Fund.................................... — — 3,193,130
Capital Projects Fund: RAMP Projects....................................... 77,453 — — Library Expansion & Renovation........ 27,809,912 — — Future Capital Projects.......................... — 148,051 1,347,402
Public Works Fund: Flood Mitigation Project....................... 752,687 — — Summit Mountain SAA Project........... 2,785,089 — — Future Infrastructure Projects.............. — — 279,005
Nonmajor Funds:Administrative Services........................... — — 1,001,655 Future Capital Improvements.................. — 727,893 Debt Service............................................... 5,352,451 — 46,317 Economic Development........................... 648,445 — 2,584,711 Parks and Recreation Programs.............. — — 3,953,879 Total Other Funds................................ 37,426,037 41,095,101 13,133,992 Total, All Governmental Funds.......... $ 37,984,928 $ 41,095,101 $ 16,161,739
66666666llllll lllll66

WEBER COUNTY, UTAH NOTES TO THE FINANCIAL STATEMENTS
Year Ended December 31, 2014 to the greater of 20% of General Fund revenues or the current year’s General Fund property tax revenues. For 2014, the General Fund unassigned balance was $9,719,904 which equals 15.1% of General Fund revenues and is below the current-year property tax revenue limit of $21.2 million. NOTE 11. RETIREMENT PLANS A. Pension Plans Weber County contributes to the Local Government Contributory Retirement System, the Local Government Noncontributory Retirement System, and the Public Safety Retirement System (collectively, the Systems), all of which are cost-sharing multiple-employer defined-benefit pension plans. The Systems are administered by Utah Retirement Systems (URS) under the direction of the URS Board, which consists of the state treasurer and six members appointed by the governor. URS is established under and governed by Title 49 of Utah Code Annotated, 1953, as amended. URS publishes an annual financial report that includes financial statements and required supplementary information for all retirement systems and deferred compensation plans administered by it. Copies of the report may be obtained by writing to Utah Retirement Systems, 560 East 200 South, Salt Lake City, Utah 84102; or on the Internet at www.urs.org. Retirement benefits, as specified by Title 49, cover substantially all employees of the State, public education, and other political subdivisions of the State. Only the state legislature can modify benefits. The Systems provide pension, death, and disability benefits for employees who meet all eligibility requirements. Employees are eligible for retirement benefits upon attainment of the age specified for their employment classification or a combination of age plus years of service. Recently, the state legislature closed the existing Systems to new employees hired on or after July 1, 2011, and created a new “hybrid” defined-benefit retirement plan for all new employees. This “Tier 2 System” caps the employer’s contribution at a fixed
rate and requires the employee to pay the difference, if any, between the capped rate and the actuarially required contribution rate. If the actuarially required rate is less than the cap, the difference is credited to the employee’s 401(k) account. The new plan also offers a smaller retirement benefit and requires more years of service than the existing plan. Finally, new employees have the option of choosing a straight defined-contribution plan in lieu of the Tier 2 System. The new plan is administered by Utah Retirement Systems and is expected to reduce pension costs over time for all government employers in the state. A brief summary of eligibility, benefits, and contribution rates of the Tier 1 and Tier 2 Systems is provided in the table on the next page. Expenditures or expenses for retirement costs are recorded in the County’s funds as contributions are made to the Systems. Contributions made each year are equal to the contributions required by the County’s contract with URS. Therefore, the County does not report a liability for pension obligations. B. Deferred Compensation Plans The County participates in a 401(k) Plan and a 457 Plan (collectively, the Plans), both of which are defined-contribution plans administered by URS. The Plans are in addition to the retirement benefits outlined above. Voluntary contributions may be made to the Plans subject to URS and Internal Revenue Service limitations. The County matches employees’ contributions up to 2.0% of eligible employees’ salaries to the 401(k) Plan, and employees may contribute to both Plans up to maximum percentages allowed by IRS regulations. Account balances of the Plans are fully vested to the participants at the time of deposit. All assets and income of the Plans are held by URS for the exclusive benefit of the participants or their beneficiaries. For the year ended December 31, 2014, Weber County contributed $832,412 to employees’ 401(k) Plans, and employees contributed an additional $1,293,278. The following table presents summary information on the County’s retirement benefits and contributions.
67676767llllll lllll67

WEBER COUNTY, UTAH NOTES TO THE FINANCIAL STATEMENTS
Year Ended December 31, 2014
(Notes continue on the next page.)
Summary of Eligibility, Benefits, and Contributions - Utah Retirement Systems
Tier 1 - Local Government Tier 1 - Public Safety Tier 2 - Hybrid DB System
Contributory Noncontributory Noncontributory Local PublicSystem System System Government Safety
30 years any age 30 years any age 20 years any age 35 years any age 25 years any age20 years age 60 (a) 25 years any age (a) 10 years age 60 20 years age 60 (a) 20 years age 60 (a)10 years age 62 (a) 20 years age 60 (a) 4 years age 65 10 years age 62 (a) 10 years age 62 (a)
4 years age 65 10 years age 62 (a) 4 years age 65 4 years age 654 years age 65
1.10% to June 1967 2.0% per year 2.5% per year up to 20 years 1.5% per year 1.5% per year1.25% to June 1975 2.00% per year over 20 years
2.00% thereafter Benefit cannot exceed 70%of final average salary
2014 Rates as Percent of Covered Payroll: (b) Employer 13.28% / 14.46% 17.29% / 18.47% 34.17% / 35.71% 13.99% / 14.91% 22.37% / 23.66% Member 6.00% (c) — — — — Required contribution to DC plan (d) — — 1.59% / 1.78% 1.09% / 1.33%
Actual County Contributions Made, by year (includes amounts paid by the County for the employee and required DC contributions): 2014 $ 65,490 $ 3,357,800 $ 3,936,505 $ 250,940 $ 66,579 2013 $ 81,954 $ 3,101,144 $ 3,834,105 $ 174,306 $ 33,200 2012 $ 73,070 $ 2,675,202 $ 3,506,938 $ 89,600 $ 4,332
(a) Requires full actuarial reductions(b) URS rates change July 1 of each year; this table shows the rates that were effective Jan 1, 2014 and then July 1, 2014(c) All or part may be paid by the County for the employee(d) The T ier 2 System requires the difference between the statutory rate and the actuarially required rate be credited to the employee's DC account
Highest Average Salary
Years of Service and Age of Eligibility
Annual Cost of Living Adjustment
Benefit Percent per Year of Service
5 Years 3 Years 3 Years 5 Years 5 Years
up to 4.0% up to 4.0% up to 4.0% up to 2.5% up to 2.5%
68686868llllll lllll68

WEBER COUNTY, UTAH NOTES TO THE FINANCIAL STATEMENTS
Year Ended December 31, 2014
NOTE 12. OTHER POST-EMPLOYMENT BENEFITS
A. Plan Description
The County offers post-employment healthcare benefits (OPEB) for retired employees through a single-employer defined-benefit plan. The plan provides medical and dental benefits for eligible retirees, their spouses, and dependents through the County’s group insurance plans, which covers both active and retired members. Eligibility requirements, benefit levels, retiree contributions, and employer contributions are governed by County policy and can be amended at any time. The plan is not reported as a trust fund because the County has not established an irrevocable trust to account for the plan. Also, the plan does not issue a separate report; rather, activity of the plan is reported as part of the General Fund.
Employees who are eligible to retire under the URS System Plans and who were also employed by the County for at least 10 consecutive years immediately prior to the date of retirement may receive health and dental insurance coverage for up to five years or until the retiree turns 65, whichever comes first. The County’s cost for such post-employment insurance premiums is fixed at the date of the employee’s retirement, and the retiree is responsible to pay any increase in premiums for the duration of the retiree’s benefit period, although the retiree may use accumulated sick leave credits to cover such cost increases until such credits are exhausted or until age
65. Insurance premiums for retirees are purchasedthrough the County’s existing employee health and dental insurance providers at the same rates as active employees. Per County policy, the County’s plan is not offered to employees hired on or after January 1, 2008, and the County currently does not offer any post-employment benefits to employees hired after that date.
B. Funding Policy
The County pays for post-employment benefits on a “pay-as-you-go” basis by charging departments’ budgets a percentage of payroll that is estimated to provide sufficient resources for the current year’s OPEB expenses. During 2014, actual retiree healthcare costs totaled $548,168, of which $536,564 or 98% was paid by the County.
C. Annual OPEB Costs and Net OPEB Obligation
The County’s annual OPEB cost is calculated based on the employer’s annual required contribution (ARC), an amount actuarially determined in accordance with the parameters of GASB Statement 45. The ARC represents a level of funding that, ifpaid on an ongoing basis, is projected to cover normal cost each year and to amortize any unfunded actuarial liabilities over a period not to exceed 30 years. The following table shows the components of the County’s annual OPEB costs for the current year and the preceding two years:
(Notes continue on the next page.)
2014 2013 2012Changes in Net OPEB Obligation:
Annual Required Contribution (ARC)...................... $ 1,997,940 $ 1,849,522 $ 1,568,331 Interest on Net OPEB Obligation............................... 195,781 202,274 162,221 Adjustment to ARC..................................................... (323,255) (78,917) (225,512) Annual OPEB Cost................................................... 1,870,466 1,972,879 1,505,040
Contributions Made *................................................. (590,070) (503,719) (503,719) Increase in net OPEB Obligation............................ 1,280,396 1,469,160 1,001,321
Net OPEB Obligation - Beginning of year................ 6,526,017 5,056,857 4,055,536 Net OPEB Obligation - End of year.......................... $ 7,806,413 $ 6,526,017 $ 5,056,857
* Percentage of Annual OPEB Cost Contributed... 31.5% 25.5% 33.5%
69696969llllll lllll69
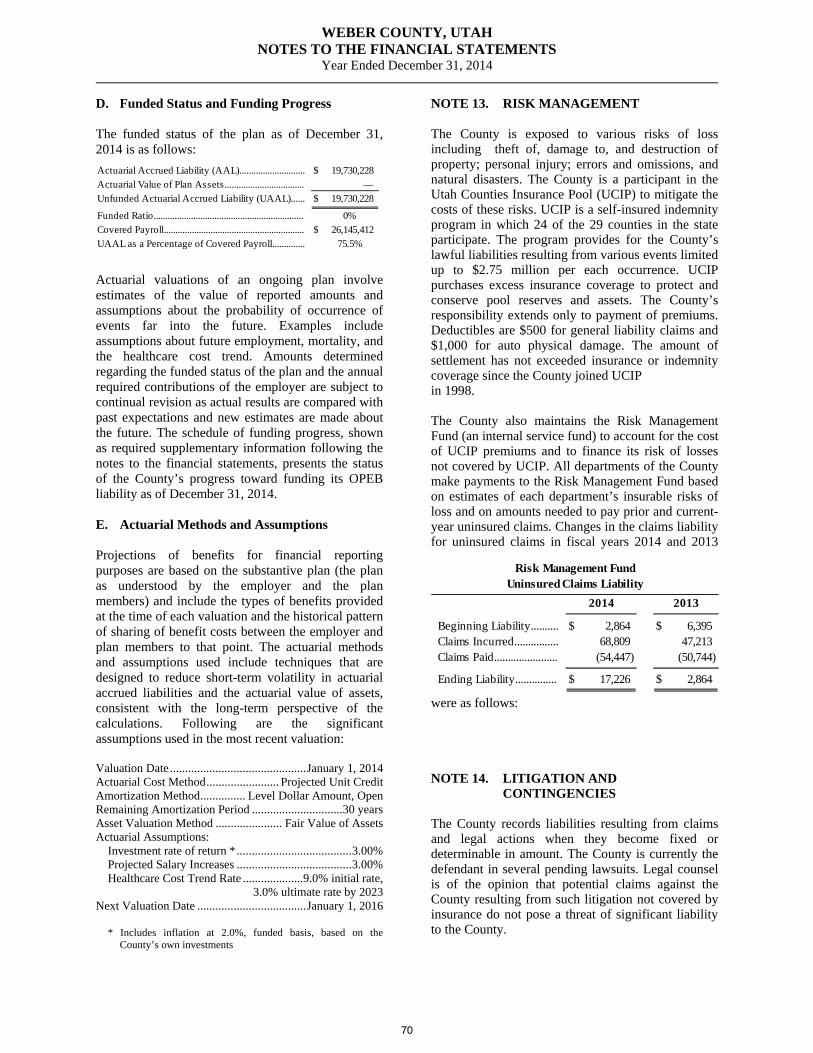
WEBER COUNTY, UTAH NOTES TO THE FINANCIAL STATEMENTS
Year Ended December 31, 2014 D. Funded Status and Funding Progress The funded status of the plan as of December 31, 2014 is as follows:
Actuarial valuations of an ongoing plan involve estimates of the value of reported amounts and assumptions about the probability of occurrence of events far into the future. Examples include assumptions about future employment, mortality, and the healthcare cost trend. Amounts determined regarding the funded status of the plan and the annual required contributions of the employer are subject to continual revision as actual results are compared with past expectations and new estimates are made about the future. The schedule of funding progress, shown as required supplementary information following the notes to the financial statements, presents the status of the County’s progress toward funding its OPEB liability as of December 31, 2014. E. Actuarial Methods and Assumptions Projections of benefits for financial reporting purposes are based on the substantive plan (the plan as understood by the employer and the plan members) and include the types of benefits provided at the time of each valuation and the historical pattern of sharing of benefit costs between the employer and plan members to that point. The actuarial methods and assumptions used include techniques that are designed to reduce short-term volatility in actuarial accrued liabilities and the actuarial value of assets, consistent with the long-term perspective of the calculations. Following are the significant assumptions used in the most recent valuation: Valuation Date ............................................. January 1, 2014 Actuarial Cost Method ........................ Projected Unit Credit Amortization Method ............... Level Dollar Amount, Open Remaining Amortization Period .............................. 30 years Asset Valuation Method ...................... Fair Value of Assets Actuarial Assumptions: Investment rate of return * ...................................... 3.00% Projected Salary Increases ...................................... 3.00% Healthcare Cost Trend Rate ....................9.0% initial rate, 3.0% ultimate rate by 2023 Next Valuation Date .................................... January 1, 2016 * Includes inflation at 2.0%, funded basis, based on the
County’s own investments
NOTE 13. RISK MANAGEMENT The County is exposed to various risks of loss including theft of, damage to, and destruction of property; personal injury; errors and omissions, and natural disasters. The County is a participant in the Utah Counties Insurance Pool (UCIP) to mitigate the costs of these risks. UCIP is a self-insured indemnity program in which 24 of the 29 counties in the state participate. The program provides for the County’s lawful liabilities resulting from various events limited up to $2.75 million per each occurrence. UCIP purchases excess insurance coverage to protect and conserve pool reserves and assets. The County’s responsibility extends only to payment of premiums. Deductibles are $500 for general liability claims and $1,000 for auto physical damage. The amount of settlement has not exceeded insurance or indemnity coverage since the County joined UCIP in 1998. The County also maintains the Risk Management Fund (an internal service fund) to account for the cost of UCIP premiums and to finance its risk of losses not covered by UCIP. All departments of the County make payments to the Risk Management Fund based on estimates of each department’s insurable risks of loss and on amounts needed to pay prior and current-year uninsured claims. Changes in the claims liability for uninsured claims in fiscal years 2014 and 2013
were as follows: NOTE 14. LITIGATION AND
CONTINGENCIES The County records liabilities resulting from claims and legal actions when they become fixed or determinable in amount. The County is currently the defendant in several pending lawsuits. Legal counsel is of the opinion that potential claims against the County resulting from such litigation not covered by insurance do not pose a threat of significant liability to the County.
Actuarial Accrued Liability (AAL)............................ $ 19,730,228 Actuarial Value of Plan Assets.................................. — Unfunded Actuarial Accrued Liability (UAAL)...... $ 19,730,228
Funded Ratio................................................................ 0%Covered Payroll............................................................ $ 26,145,412 UAAL as a Percentage of Covered Payroll.............. 75.5%
Risk Management FundUninsured Claims Liability
2014 2013
Beginning Liability.......... $ 2,864 $ 6,395 Claims Incurred................ 68,809 47,213 Claims Paid....................... (54,447) (50,744)
Ending Liability............... $ 17,226 $ 2,864
70707070llllll lllll70

WEBER COUNTY, UTAH NOTES TO THE FINANCIAL STATEMENTS
Year Ended December 31, 2014
The County has received several federal and state grants for specific purposes that are subject to audit by the grantor agencies. Such audits could lead to requests for reimbursements for expenditures disallowed under the terms of the grants. Based upon prior experience, the County believes such disallowances, if any, will be immaterial.
NOTE 15. RELATED ORGANIZATIONS
Weber County appoints a majority of the Weber Human Services (WHS) governing board and provides financial assistance to fund Human Services programs. During 2014, the County contributed $1,996,896 from the General Fund to WHS, which amount represents approximately 6% of WHS’ fiscal year 2014 budgeted revenues.
NOTE 16. JOINTLY GOVERNED ORGANIZATIONS
A. Weber / Morgan Narcotics Strike Force
The Weber/Morgan Narcotics Strike Force was created through an interlocal governmental agreement among various law enforcement agencies to investigate and prosecute the illegal importation, manufacture, use, and sale of controlled substances within the Weber/Morgan area. The Strike Force is governed by two boards: an Administrative Board acting in an advisory capacity, and an Executive Board vested with voting authority to govern and regulate the Strike Force.
The Executive Board is comprised of a representative from each jurisdiction that provides at least one officer or the monetary equivalent to the Strike Force for a minimum of twelve months of every three years, plus an at-large member appointed by the Weber Area Council of Governments. Currently, the Executive Board has five members, one of whom is the Weber County Sheriff. The Executive Board is responsible for directing the activities of the Strike Force, including approving an annual operating budget and appointing a Unit Commander. Local law enforcement agencies that do not contribute manpower to the Strike Force must pay an annual assessment as established by the Executive Board.
The Strike Force receives federal funds as a sub recipient of grants awarded to the Weber County Sheriff’s Office. The County provides no direct financial assistance to the Strike Force but has dedicated two officers as agents of the Strike Force. The Strike Force also receives accounting and legal
services from Weber County at no cost. All Strike Force funds and assets are held in trust by the County, and such assets are reported in the County’s fiduciary funds as a private-purpose trust fund.
B. Northern Utah Regional Landfill Authority
In January 2007, Weber County entered into an interlocal agreement with three other local governments to create the Northern Utah Regional Landfill Authority (NURLA) to facilitate the acquisition, construction, operation, maintenance, and improvement of solid waste management facilities for its members. The other members of NURLA at its creation were Box Elder County, Logan City, and the Wasatch Integrated Waste Management District (a component unit of Davis County). Each member appoints two representatives to the NURLA Governing Board and one member to the Operations and Management Committee, both of which bodies oversee NURLA operations. Box Elder County has since withdrawn its membership from the organization.
The interlocal agreement does not provide for the members to retain an explicit, measurable interest in the net resources of NURLA operations, and therefore the County does not report any equity interest in NURLA; however, each member contributed equally to capital and start-up costs. Future operating costs will be recovered through tipping fees charged to the various waste haulers who will transport waste from the members’ jurisdictions, should NURLA ever secure a physical location and begin operations. NURLA does not currently issue separate financial statements.
NOTE 17. LANDFILL POST-CLOSURE COSTS
Weber County owns and maintains two landfill sites located in the Ogden, Utah area. The County is required by state and federal law to provide both closure and post-closure care of the landfill facilities.
The County accounts for closure and post-closure care costs in accordance with GASB 18, which requires reporting a portion of these closure and post-closure care costs as an operating expense in each period based on the landfill capacity used as of each balance sheet date. These costs are estimates and are subject to change due to the effects of inflation, revision of laws, and other variables.
71717171llllll lllll71

WEBER COUNTY, UTAH NOTES TO THE FINANCIAL STATEMENTS
Year Ended December 31, 2014
In December 1997, the County closed one landfill as required by state and federal laws and is responsible to maintain and monitor the site for 30 years after closure. The County has recognized the appropriate amount of the closure and post-closure care costs in past operating periods. As of December 31, 2014, the County’s liability of $1,302,698 represents the total estimated costs remaining for site maintenance and monitoring through 2027.
In 2009, Weber County opened a second landfill that accepts construction and demolition waste. As of December 31, 2014, the County’s closure and post closure liability was $48,172, the estimated total closure and post closure costs remaining to be recognized were $2,517,351, the percentage of the landfill used was 1.9%, and the estimated future life of the landfill is over 200 years.
The County has met the Financial Assurance Mechanism pertaining to solid waste facility closures. This was done by complying with the Local Government Financial Test as required by the State of Utah.
NOTE 18. SUBSEQUENT EVENTS
A. Sale of Real Property – Jail Property
On April 21, 2015, Weber County entered into an agreement to sell 7.5 acres of vacant land adjacent to the County jail to the State of Utah for $1.475 million.
B. Reduction of Federal Subsidy for Certain Bond Interest Payments
Due to federal budget sequestration cuts, the federal subsidy for interest on the 2010B sales tax revenue bonds (“Build America Bonds”), payable on July 1, 2015, is expected to be reduced by 8.7%, which is approximately $1,918. The shortfall will be covered by unrestricted fund balance of the Debt Service Fund. Reductions of future interest subsidies are possible but unpredictable at this time.
72727272llllll lllll72

Required Supplementary Information
73737373llllll lllll73

74747474llllll lllll74

WEBER COUNTY, UTAH REQUIRED SUPPLEMENTARY INFORMATION
Year Ended December 31, 2014
INFORMATION RELATED TO OTHER POST-EMPLOYMENT BENEFITS (OPEB) As more fully described in Note 12, the County offers post-employment healthcare benefits (OPEB) for retired employees through a single-employer defined-benefit plan. The table below demonstrates the County’s progress toward funding its actuarial accrued liability, as determined by its most recent actuarial valuation dated January 1, 2014.
Weber County, Utah
Other Post-Employment Benefit Plan
Schedule of Funding Progress
Actuarial
Accrued UAAL as a
Actuarial Liability - Unfunded Percentage
Actuarial Value of Projected AAL Funded Covered of Covered
Reporting Valuation Assets Unit (AAL) (UAAL) Ratio Payroll Payroll
Date Date (a) (b) (b - a) (a / b) (c) ((b - a) / c)
12/31/2014 1/1/2014 $ — $ 19,730,228 $ 19,730,228 0.0% $ 26,145,412 75.5%
12/31/2013 1/1/2012 — 13,369,559 13,369,559 0.0% 27,587,289 48.5%
12/31/2012 1/1/2012 — 13,369,559 13,369,559 0.0% 26,453,606 50.5%
12/31/2011 1/1/2010 — 11,415,221 11,415,221 0.0% 32,854,220 34.7%
12/31/2010 1/1/2010 — 11,415,221 11,415,221 0.0% 33,368,171 34.2%
12/31/2009 1/1/2008 — 10,232,471 10,232,471 0.0% 34,035,262 30.1%
12/31/2008 1/1/2008 — 10,232,471 10,232,471 0.0% 33,010,328 31.0%
75757575llllll lllll75

WEBER COUNTY, UTAH
Budgetary Comparison Schedule
General Fund
For the Year Ended December 31, 2013
Budgeted AmountsVariance From
Original Final Actual Final BudgetREVENUES Taxes:
Current Property..................................... $ 21,917,393 $ 21,917,393 $ 21,243,214 $ (674,179)
Sales........................................................ 9,686,936 9,686,936 9,818,455 131,519
Delinquent.............................................. 1,904,777 1,904,777 1,318,740 (586,037)
Assessing and Collecting........................ 3,907,715 3,907,715 4,307,197 399,482
Total Taxes............................................ 37,416,821 37,416,821 36,687,606 (729,215)
Licenses, Permits, and Fees...................... 2,342,321 2,342,321 2,199,333 (142,988)
Intergovernmental..................................... 1,631,892 1,554,786 2,923,610 1,368,824
Charges for Services................................. 21,920,789 22,061,334 22,066,718 5,384
Fines and Forfeitures................................ 375,000 375,000 362,447 (12,553)
Miscellaneous........................................... 857,548 1,002,548 1,362,050 359,502
Total Revenues...................................... 64,544,371 64,752,810 65,601,764 848,954
EXPENDITURES General Government Commission......................................... 771,169 773,169 776,144 2,975
District Court....................................... 80,000 80,000 87,070 7,070
Public Defender................................... 1,474,800 1,474,800 1,361,690 (113,110)
Training............................................... 105,477 105,477 103,946 (1,531)
Human Resources................................ 541,940 541,940 502,458 (39,482)
Information Technology....................... 2,804,457 2,804,457 2,605,839 (198,618)
G.I.S..................................................... 516,201 512,951 468,446 (44,505)
Clerk/Auditor....................................... 1,271,102 1,286,599 1,251,770 (34,829)
Treasurer.............................................. 594,212 594,212 551,980 (42,232)
Recorder.............................................. 1,032,787 1,032,787 926,311 (106,476)
Attorney - Criminal.............................. 2,492,260 2,502,260 2,490,255 (12,005)
Assessor............................................... 2,309,729 2,333,979 2,300,169 (33,810)
Surveyor............................................... 737,984 737,984 776,721 38,737
Engineering.......................................... 581,752 581,752 577,177 (4,575)
Attorney - Civil.................................... 673,721 673,721 628,868 (44,853)
Non-Departmental............................... 1,125,150 3,138,150 2,939,474 (198,676)
Children's Justice Center...................... 361,945 362,845 342,861 (19,984)
Operations Administration................... 385,420 417,420 409,435 (7,985)
Property Management.......................... 1,166,841 1,144,341 1,137,740 (6,601)
Elections.............................................. 493,512 493,512 356,788 (136,724)
Council of Governments...................... 34,921 33,921 33,855 (66)
19,555,380 21,626,277 20,628,997 (997,280)
Public Safety Sheriff.................................................. 8,924,492 9,098,522 8,566,342 (532,180)
Watershed Fire Protection................... 40,000 40,000 62,867 22,867
Jail....................................................... 24,479,678 24,658,472 23,530,721 (1,127,751)
Crime Scene Investigations................. 677,882 677,882 658,335 (19,547)
Homeland Security............................... 414,019 538,119 532,954 (5,165)
34,536,071 35,012,995 33,351,219 (1,661,776)
76767676llllll lllll76

WEBER COUNTY, UTAH
Budgetary Comparison Schedule
General Fund
For the Year Ended December 31, 2013
Budgeted AmountsVariance From
Original Final Actual Final Budget
Public Health and Welfare Poor and Indigent................................. 12,000 12,000 8,125 (3,875)
Human Services Programs................... 1,996,896 1,996,896 1,996,896 —
2,008,896 2,008,896 2,005,021 (3,875)
Streets and Public Improvements Storm Water Management................... 1,055,000 1,055,000 151,458 (903,542)
Garage................................................. 507,789 507,789 483,547 (24,242)
1,562,789 1,562,789 635,005 (927,784)
Parks and Recreation Parks.................................................... 265,093 312,093 282,036 (30,057)
Golden Spike Events Center................ 1,570,358 1,593,595 1,509,316 (84,279)
Ice Sheet.............................................. 956,314 956,314 906,903 (49,411)
Ogden Eccles Conference Center ........ 2,812,932 2,804,734 3,151,657 346,923
Recreation Facilities Administration... 472,167 482,167 473,834 (8,333)
Recreation............................................ 489,025 479,824 453,764 (26,060)
Special Events...................................... 144,055 143,055 133,807 (9,248)
Weber County Fair............................... 378,271 378,271 371,420 (6,851)
7,088,215 7,150,053 7,282,737 132,684
Conservation and Development USU Extension.................................... 243,147 243,147 240,536 (2,611)
Economic Development....................... 278,903 283,903 271,041 (12,862)
Public Relations................................... 269,763 268,763 259,014 (9,749)
791,813 795,813 770,591 (25,222)
Capital Outlay.......................................
Capital Lease Outlay............................ — — — —
Total Expenditures................................. 65,543,164 68,156,823 64,673,570 (3,483,253)
Revenues Over (Under)
Expenditures............................................ (998,793) (3,404,013) 928,194 4,332,207
OTHER FINANCING SOURCES (USES) Capital Lease Financing........................... — — 9,813 9,813
Bonds Issued............................................. — — — —
Refunding Bonds Issued........................... — — — —
Premium on Bonds Issued......................... — — — —
Payment to Refunding Escrow.................. — — — —
Sale of Capital Assets............................... 5,000 5,000 — (5,000)
Transfers In............................................... 2,263,120 2,263,120 1,670,914 (592,206)
Transfers Out............................................ (835,654) (7,472,960) (6,723,048) 749,912
Total Other Financing Sources (Uses). 1,432,466 (5,204,840) (5,042,321) 162,519
Net Change in Fund Balance............ 433,673 (8,608,853) (4,114,127) 4,494,726
Fund Balance - Beginning .......................... 17,465,276 17,465,276 17,465,276 —
Fund Balance - Ending................................ $ 17,898,949 $ 8,856,423 $ 13,351,149 $ 4,494,726
77777777llllll lllll77

WEBER COUNTY, UTAH
Budgetary Comparison ScheduleLibrary FundFor the Year Ended December 31, 2014
Budgeted AmountsVariance From
REVENUES Original Final Actual Final BudgetTaxes: Current Property.................................. $ 7,018,854 $ 7,018,854 $ 6,894,217 $ (124,637) Delinquent........................................... 374,352 374,352 277,055 (97,297) Total Taxes....................................... 7,393,206 7,393,206 7,171,272 (221,934)
Other Revenues: Licenses, Permits, and Fees................. 588,139 588,139 594,602 6,463 Intergovernmental................................ 34,685 34,685 34,685 — Charges for Services............................ 150,500 150,500 159,597 9,097 Miscellaneous...................................... 30,000 30,000 35,143 5,143 Total Revenues................................. 8,196,530 8,196,530 7,995,299 (201,231)
EXPENDITURESLibrary Services.................................... 8,088,064 8,415,981 7,435,355 (980,626) Total Expenditures........................... 8,088,064 8,415,981 7,435,355 (980,626)
Revenues Over (Under) Expenditures..................................... 108,466 (219,451) 559,944 779,395
OTHER FINANCING SOURCES (USES)Transfers In........................................... — — — — Transfers Out......................................... (529,950) (529,950) (425,700) 104,250
Net Change in Fund Balance............ (421,484) (749,401) 134,244 883,645
Fund Balance, January 1....................... 3,639,460 3,639,460 3,639,460 —
Fund Balance, December 31.................. $ 3,217,976 $ 2,890,059 $ 3,773,704 $ 883,645
78787878llllll lllll78

WEBER COUNTY, UTAH
Budgetary Comparison ScheduleParamedic FundFor the Year Ended December 31, 2014
Budgeted AmountsVariance From
REVENUES Original Final Actual Final BudgetTaxes: Current Property.................................. $ 2,359,841 $ 2,359,841 $ 2,312,407 $ (47,434) Delinquent........................................... 121,130 121,130 92,902 (28,228) Total Taxes....................................... 2,480,971 2,480,971 2,405,309 (75,662)
Other Revenues: Licenses, Permits, and Fees................. 197,737 197,737 199,398 1,661 Miscellaneous...................................... 1,000 1,000 13,071 12,071 Total Revenues................................. 2,679,708 2,679,708 2,617,778 (61,930)
EXPENDITURESPublic Safety - Paramedic Services....... 2,636,435 2,636,435 2,324,501 (311,934) Total Expenditures........................... 2,636,435 2,636,435 2,324,501 (311,934)
Revenues Over (Under) Expenditures..................................... 43,273 43,273 293,277 250,004
OTHER FINANCING SOURCES (USES)Transfers In........................................... — — — — Transfers Out......................................... — — — —
Net Change in Fund Balance............ 43,273 43,273 293,277 250,004
Fund Balance, January 1....................... 3,571,037 3,571,037 3,571,037 —
Fund Balance, December 31.................. $ 3,614,310 $ 3,614,310 $ 3,864,314 $ 250,004
79797979llllll lllll79

WEBER COUNTY, UTAH
Budgetary Comparison ScheduleTransportation Development FundFor the Year Ended December 31, 2014
Budgeted AmountsVariance From
REVENUES Original Final Actual Final BudgetTaxes: Sales.................................................... $ 5,746,000 $ 23,246,000 $ 21,842,746 $ (1,403,254) Total Taxes....................................... 5,746,000 23,246,000 21,842,746 (1,403,254)
Other Revenues: Miscellaneous...................................... 125,000 125,000 280,428 155,428 Total Revenues................................. 5,871,000 23,371,000 22,123,174 (1,247,826)
EXPENDITURES Transportation Development.............. 13,092,705 30,592,705 18,292,338 (12,300,367) Total Expenditures........................... 13,092,705 30,592,705 18,292,338 (12,300,367)
Revenues Over (Under) Expenditures..................................... (7,221,705) (7,221,705) 3,830,836 11,052,541
OTHER FINANCING SOURCES (USES)Transfers In........................................... — — — — Transfers Out......................................... — — — —
Net Change in Fund Balance............ (7,221,705) (7,221,705) 3,830,836 11,052,541
Fund Balance, January 1....................... 29,478,196 29,478,196 29,478,196 —
Fund Balance, December 31.................. $ 22,256,491 $ 22,256,491 $ 33,309,032 $ 11,052,541
80808080llllll lllll80

WEBER COUNTY, UTAH
Budgetary Comparison ScheduleBudget To GAAP ReconciliationFor the Year Ended December 31, 2014
TransportationGeneral Library Paramedic Development
REVENUESActual total revenues (budgetary basis)................... $ 65,601,764 $ 7,995,299 $ 2,617,778 $ 22,123,174
Differences - Budget to GAAP: Intrafund revenues are budgetary revenues but are not revenues for financial reporting (1,106,960) — — —
Total revenues as reported on the Statement of Revenues, Expenditures, and Changes in Fund Balances - Governmental Funds 64,494,804 7,995,299 2,617,778 22,123,174
EXPENDITURESActual total revenues (budgetary basis)................... $ 64,673,570 $ 7,435,355 $ 2,324,501 $ 18,292,338
Differences - Budget to GAAP: Intrafund revenues are budgetary revenues but are not revenues for financial reporting (1,106,960) — — —
Total revenues as reported on the Statement of Revenues, Expenditures, and Changes in Fund Balances - Governmental Funds 63,566,610 7,435,355 2,324,501 18,292,338
The notes to Required Supplementary Information - Budgetary Reporting are an integral part of this schedule.
81818181llllll lllll81

WEBER COUNTY, UTAH NOTES TO REQUIRED SUPPLEMENTARY INFORMATION
Year Ended December 31, 2014
Required Supplementary Information – Budgetary Comparison Schedules The Budgetary Comparison Schedules presented in this section of the report are for the County’s General Fund and major special revenue funds. Budgetary comparison schedules for the County’s nonmajor special revenue funds, debt service funds, and capital projects funds are included as Supplementary Information as listed in the table of contents. Original budgets represent the revenue estimates and spending authority authorized by the County Commission prior to January 1. Final budgets represent the original budget amounts plus any amendments made to the budget during the year by the County Commission through formal resolution. Final budgets do not include unexpended balances from the prior year because such balances automatically lapse to fund balance at the end of each year. Budgeting and Budgetary Control Weber County’s annual budget is prepared and adopted before December 31 for the calendar year commencing the following January 1 in accordance with the Uniform Fiscal Procedures Act for Utah Counties. Once a budget has been adopted, it remains in effect until it has been formally revised. If any obligations are contracted for in excess of the adopted budget, they are not a valid or enforceable claim against the County. The County’s budgets for the General Fund, all special revenue funds, debt service funds, and capital projects funds are legally required and are prepared and adopted on a budgetary basis. Since accounting principles applied for purposes of developing data on a budgetary basis differ from those used to present the financial statements in conformity with GAAP, a reconciliation showing the adjustments necessary at December 31, 2014 to convert from the budgetary basis to the GAAP basis statements in the General Fund and each major special revenue fund has been included. Adopting the Annual Budget
On or before November 1, the Clerk/Auditor submits to the County Commission a tentative operating budget for the calendar year commencing the following January 1. The operating budget includes proposed expenditures and the means of financing them. The tentative operating budget is reviewed and adopted by the County Commission.
Prior to December 31, the County Commission sets a date for a public hearing at which time the taxpayers’ comments regarding the tentative budget are heard. Copies of the tentative budget are made available for public inspection ten days prior to the budget hearing. Following the budget hearing, the proposed budget may be amended and is then legally enacted through passage of a resolution. A copy of the final budget is certified by the Clerk/Auditor and filed with the Utah State Auditor within thirty days of adoption. A certified copy of the budget is available to the public after adoption. Control of budgeted expenditures is exercised, under state law, at the division level. Administrative control is maintained through detailed line-item budgets for all departments. All appropriations lapse at the end of the calendar year. Modifying the Adopted Budget
Transfers of unexpended appropriations from one expenditure account to another within the same department can be made by consent of the department head. Transfers of unexpended appropriations from one department to another department, as well as budget reductions for any department, may be made by resolution of the County Commission. Budgets of any department may be increased by resolution only after a public hearing. Notice of the hearing must be published seven days in advance of the hearing. During 2014, the County modified the budget on several occasions using all of the above procedures. Current Year Excess of Expenditures Over Appropriations During 2014, the following funds exceeded budgeted expenditures:
• Impact Fees, by $23,209, because of expenditures related to the Storm Water Master Plan.
• Redevelopment Agency, by $3,484,668, due to a change in how RDA tax revenues and expenditures are recorded. The increase in expenditures was offset by a corresponding increase in property tax revenue.
• Special Assessment Bond, by $15,926, because of increased trustee fees related to the bond administration.
Spending for all other funds of the County was within approved budgets.
82828282llllll lllll82

Supplementary Information
83838383llllll lllll83

84848484llllll lllll84

Nonmajor Governmental Funds Municipal Services Fund This fund is required to exist by state statutes. It accounts for certain municipal-type services in the unincorporated areas of the County including planning and zoning, building inspection, public safety, road maintenance, and street lighting. Revenues come mainly from sales taxes and state road funds. Tourism Fund This fund accounts for the County’s tourism-related taxes such as the restaurant tax and the hotel room tax. These funds are spent to promote tourism and recreation within the County. Impact Fees Fund This fund accounts for the County’s impact fees that are charged to all new developments in the unincorporated areas of the County. Impact fees are used to pay for capital improvements to vital infrastructure such as roads, sewer systems, and storm water drainage systems. Municipal Building Authority Fund (Blended Component Unit) The Municipal Building Authority exists for the purpose of financing and constructing the County’s major public facilities. The principal revenue source is rental income from County departments. Redevelopment Agency Fund (Blended Component Unit) The Redevelopment Agency exists to encourage economic development by redeveloping certain areas within the County. The principal revenue source is property tax increment funds. RAMP Tax Fund This fund accounts for a voter-approved countywide 1/10th of one percent sales tax that is restricted for use on facilities and activities related to recreation, arts, museums, and parks (“RAMP”). Special Assessment Bond Fund This fund accounts for the accumulation of resources for payment of principal, interest, and related costs on the County’s special assessment bonds. The principal revenue source is payments from owners of property within the assessment area.
85858585llllll lllll85

WEBER COUNTY, UTAH
Combining Balance SheetNonmajor Governmental FundsDecember 31, 2014
Special Revenue
MunicipalMunicipal Impact BuildingServices Tourism Fees Authority
Cash and Investments........................... $ 53,493 $ — $ 727,893 $ 68,702 Receivables: Accounts, net..................................... 240,181 — — — Taxes................................................. 391,696 724,855 — — Due From Other Governments........... 527,990 — — — Prepaids and Inventories....................... — — — — Cash - Restricted.................................. — — — 1,662,979
$ 1,213,360 $ 724,855 $ 727,893 $ 1,731,681
LIABILITIESLiabilities: Accounts Payable............................... $ 64,263 $ — $ — $ — Accrued Liabilities............................. 79,187 — — 22,385 Due To Other Funds........................... 50,807 724,855 — — Total Liabilities................................ 194,257 724,855 — 22,385
DEFERRED INFLOWS OF RESOURCESUnavailable Revenue-Property Taxes... 17,448 — — — Total Deferred Inflows of Resources. 17,448 — — —
FUND BALANCESFund Balances: Restricted............................................ — — — 1,662,979 Assigned............................................. 1,001,655 — 727,893 46,317
Total Fund Balances...................... 1,001,655 — 727,893 1,709,296 Total Liabilities, Deferred Inflows of Resources, and Fund Balances............... $ 1,213,360 $ 724,855 $ 727,893 $ 1,731,681
ASSETS
Total Assets .........................................
86868686llllll lllll86

Debt ServiceTotal
Special NonmajorRedevelopment Assessment Governmental
Agency RAMP Tax Bond Funds
$ 3,845,634 $ 3,352,884 $ — $ 8,048,606
— 11,700 — 251,881 9,590 589,381 — 1,715,522
— — — 527,990 85,000 — — 85,000
— — 4,131,877 5,794,856 $ 3,940,224 $ 3,953,965 $ 4,131,877 $ 16,423,855
$ 707,068 $ 86 $ — $ 771,417 — — 439,805 541,377 — — 2,600 778,262
707,068 86 442,405 2,091,056
— — — 17,448 — — — 17,448
648,445 — 3,689,472 6,000,896 2,584,711 3,953,879 — 8,314,455
3,233,156 3,953,879 3,689,472 14,315,351
$ 3,940,224 $ 3,953,965 $ 4,131,877 $ 16,423,855
87878787llllll lllll87

WEBER COUNTY, UTAH
Combining Statement of Revenues, Expenditures and Changes in Fund BalancesNonmajor Governmental FundsFor the Year Ended December 31, 2014
Special Revenue
MunicipalMunicipal Impact BuildingServices Tourism Fees Authority
REVENUESTaxes: Current Property...................................... $ 298,031 $ — $ — $ — Sales........................................................ 2,021,913 4,470,156 — — Delinquent............................................... 5,294 — — — Total Taxes........................................... 2,325,238 4,470,156 — — Other Revenues: Licenses, Permits, and Fees..................... 474,778 — 290,054 — Intergovernmental.................................... 2,131,463 — — — Charges for Services................................ 315,624 — — 2,948,941 Fines and Forfeitures............................... 48,362 — — — Miscellaneous.......................................... 229,204 225 3,745 14,924
Total Revenues.................................... 5,524,669 4,470,381 293,799 2,963,865
EXPENDITURES
Current: General Government................................ 1,397,701 — — — Public Safety............................................ 1,200,735 — — — Streets and Public Improvements............. 2,605,907 — 330,709 — Parks, Recreation & Public Facilities...... — 2,775,656 — — Conservation and Development............... — — — — Debt Service: Principal.................................................. — — — 2,490,501 Interest and Other Charges...................... — — — —
Total Expenditures................................ 5,204,343 2,775,656 330,709 2,490,501
320,326 1,694,725 (36,910) 473,364
OTHER FINANCING SOURCES (USES) Refunding Bonds Issued.......................... — — — 2,371,842 Payment to Refunding Escrow................. — — — (4,148,648) Transfers In.............................................. — — — — Transfers Out........................................... — (1,694,725) — — Total Other Financing Sources (Uses).. — (1,694,725) — (1,776,806)
Net Change in Fund Balances............... 320,326 — (36,910) (1,303,442)
681,329 — 764,803 3,012,738
$ 1,001,655 $ — $ 727,893 $ 1,709,296
Revenues Over (Under) Expenditures............
Fund Balances - Beginning ...........................
Fund Balances - Ending.................................
88888888llllll lllll88

Special Revenue Debt ServiceTotal
Special NonmajorRedevelopment Assessment Governmental
Agency RAMP Tax Bond Funds
$ 3,848,072 $ — $ — $ 4,146,103 — 3,178,580 — 9,670,649 — — — 5,294
3,848,072 3,178,580 — 13,822,046
— — — 764,832 787,774 — — 2,919,237
— — — 3,264,565 — — — 48,362
445 12,335 57,770 318,648
4,636,291 3,190,915 57,770 21,137,690
— — — 1,397,701 — — — 1,200,735 — — — 2,936,616 — 2,283,448 — 5,059,104
4,388,228 — — 4,388,228
— — — 2,490,501 — — 961,729 961,729
4,388,228 2,283,448 961,729 18,434,614
248,063 907,467 (903,959) 2,703,076
— — — 2,371,842 — — — (4,148,648) — — — —
(15,000) — — (1,709,725) (15,000) — — (3,486,531)
233,063 907,467 (903,959) (783,455)
3,000,093 3,046,412 4,593,431 15,098,806
$ 3,233,156 $ 3,953,879 $ 3,689,472 $ 14,315,351
89898989llllll lllll89

WEBER COUNTY, UTAH
Budgetary Comparison ScheduleMunicipal Services FundFor the Year Ended December 31, 2014
Budgeted AmountsVariance From
REVENUES Original Final Actual Final BudgetTaxes: Current Property.................................. $ 306,000 $ 306,000 $ 298,031 $ (7,969) Sales.................................................... 1,920,340 1,920,340 2,021,913 101,573 Franchise............................................. 30,000 30,000 — (30,000) Delinquent........................................... — — 5,294 5,294 Assessing and Collecting..................... — — — — Total Taxes....................................... 2,256,340 2,256,340 2,325,238 68,898
Other Revenues: Licenses, Permits, and Fees................. 357,000 357,000 474,778 117,778 Intergovernmental................................ 1,930,407 1,930,407 2,131,463 201,056 Charges for Services............................ 382,196 382,196 315,624 (66,572) Fines and Forfeitures........................... 60,000 60,000 48,362 (11,638) Miscellaneous...................................... — — 229,204 229,204 Total Revenues................................. 4,985,943 4,985,943 5,524,669 538,726
EXPENDITURESGeneral Government: Engineering........................................ 95,000 95,000 89,233 (5,767) Planning............................................. 966,637 965,298 795,872 (169,426) Building Inspection............................ 351,370 412,857 417,596 4,739 Administration.................................... 100,000 100,000 95,000 (5,000)
1,513,007 1,573,155 1,397,701 (175,454) Public Safety: Sheriff................................................ 960,000 960,000 960,000 — Animal Control................................... 208,972 208,972 190,943 (18,029) Animal Shelter.................................... 45,000 45,000 49,792 4,792
1,213,972 1,213,972 1,200,735 (13,237)
Streets and Public Improvements: Roads and Highways.......................... 2,365,872 2,518,198 2,519,180 982 Sewer Division................................... 20,200 20,200 5,878 (14,322) Weed Department............................... 101,403 101,403 80,849 (20,554)
2,487,475 2,639,801 2,605,907 (33,894) Total Expenditures........................... 5,214,454 5,426,928 5,204,343 (222,585)
Revenues Over (Under) Expenditures..................................... (228,511) (440,985) 320,326 761,311
OTHER FINANCING SOURCES (USES)Transfers In........................................... — — — — Transfers Out......................................... — — — — Net Change in Fund Balance............ (228,511) (440,985) 320,326 761,311 Fund Balance, January 1....................... 681,329 681,329 681,329 — Fund Balance, December 31.................. $ 452,818 $ 240,344 $ 1,001,655 $ 761,311
90909090llllll lllll90

WEBER COUNTY, UTAH
Budgetary Comparison ScheduleTourism FundFor the Year Ended December 31, 2014
Budgeted AmountsVariance From
REVENUES Original Final Actual Final BudgetTaxes: Sales Taxes: Restaurant Tax.................................................... $ 2,774,559 $ 2,774,559 $ 3,037,459 $ 262,900 Transient Room Tax............................................ 1,140,791 1,140,791 1,031,541 (109,250) Leased Vehicle Tax............................................. 346,872 346,872 401,156 54,284 Total Taxes....................................................... 4,262,222 4,262,222 4,470,156 207,934
Other Revenues: Miscellaneous...................................................... 400 400 225 (175) Total Revenues.................................................. 4,262,622 4,262,622 4,470,381 207,759
EXPENDITURESParks, Recreation & Public Facilities: Tourism Promotion............................................. 940,000 967,500 965,500 (2,000) Facility Rental - Municipal Building Authority.. 1,810,156 1,810,156 1,810,156 — Total Expenditures............................................ 2,750,156 2,777,656 2,775,656 (2,000)
Revenues Over (Under) Expenditures..................................................... 1,512,466 1,484,966 1,694,725 209,759
OTHER FINANCING SOURCES (USES)Transfers In............................................................ — — — — Transfers Out......................................................... (1,512,466) (1,512,466) (1,694,725) (182,259)
Net Change in Fund Balance............................. — (27,500) — 27,500
Fund Balance, January 1........................................ — — — —
Fund Balance, December 31.................................. $ — $ (27,500) $ — $ 27,500
91919191llllll lllll91

WEBER COUNTY, UTAH
Budgetary Comparison ScheduleImpact Fees FundFor the Year Ended December 31, 2014
Budgeted AmountsVariance From
REVENUES Original Final Actual Final BudgetOther Revenues: Licenses, Permits, and Fees................. $ 160,500 $ 160,500 $ 290,054 $ 129,554 Miscellaneous...................................... — — 3,745 3,745 Total Revenues................................. 160,500 160,500 293,799 133,299
EXPENDITURESStreets and Public Improvements.......... 307,500 307,500 330,709 23,209 Total Expenditures........................... 307,500 307,500 330,709 23,209
Revenues Over (Under) Expenditures..................................... (147,000) (147,000) (36,910) 110,090
OTHER FINANCING SOURCES (USES)Transfers In........................................... — — — — Transfers Out......................................... — — — —
Net Change in Fund Balance............ (147,000) (147,000) (36,910) 110,090
Fund Balance, January 1....................... 764,803 764,803 764,803 —
Fund Balance, December 31.................. $ 617,803 $ 617,803 $ 727,893 $ 110,090
92929292llllll lllll92

WEBER COUNTY, UTAH
Budgetary Comparison ScheduleMunicipal Building Authority FundFor the Year Ended December 31, 2014
Budgeted AmountsVariance From
REVENUES Original Final Actual Final BudgetTaxes:Other Revenues: Charges for Services............................ $ 2,948,941 $ 2,948,941 $ 2,948,941 $ — Miscellaneous...................................... 23,000 23,000 14,924 (8,076) Total Revenues................................. 2,971,941 2,971,941 2,963,865 (8,076)
EXPENDITURESDebt Service: Principal.............................................. 2,340,000 2,340,000 2,490,501 150,501 Interest and Other Charges.................. 728,941 728,941 — (728,941) Total Expenditures........................... 3,068,941 3,068,941 2,490,501 (578,440)
Revenues Over (Under) Expenditures..................................... (97,000) (97,000) 473,364 570,364
OTHER FINANCING SOURCES (USES)Refunding Bonds Issued........................ — — 2,371,842 2,371,842 Payment to Refunding Escrow.............. — — (4,148,648) (4,148,648) Transfers In........................................... — — — — Transfers Out......................................... — — — —
Net Change in Fund Balance............ (97,000) (97,000) (1,303,442) (1,206,442)
Fund Balance, January 1....................... 3,012,738 3,012,738 3,012,738 —
Fund Balance, December 31.................. $ 2,915,738 $ 2,915,738 $ 1,709,296 $ (1,206,442)
93939393llllll lllll93

WEBER COUNTY, UTAH
Budgetary Comparison ScheduleRedevelopment Agency FundFor the Year Ended December 31, 2014
Budgeted AmountsVariance From
REVENUES Original Final Actual Final BudgetTaxes: Current Property.................................. $ 1,065,380 $ 1,065,380 $ 3,848,072 $ 2,782,692 Total Taxes....................................... 1,065,380 1,065,380 3,848,072 2,782,692 Other Revenues:
Intergovernmental — — 787,774 787,774 Miscellaneous...................................... — — 445 445 Total Revenues................................. 1,065,380 1,065,380 4,636,291 3,570,911
EXPENDITURESConservation and Development............. 903,560 903,560 4,388,228 3,484,668 Total Expenditures........................... 903,560 903,560 4,388,228 3,484,668
Revenues Over (Under) Expenditures..................................... 161,820 161,820 248,063 86,243
OTHER FINANCING SOURCES (USES)Transfers In........................................... — — — — Transfers Out......................................... (15,000) (15,000) (15,000) —
Net Change in Fund Balance............ 146,820 146,820 233,063 86,243
Fund Balance, January 1....................... 3,000,093 3,000,093 3,000,093 —
Fund Balance, December 31.................. $ 3,146,913 $ 3,146,913 $ 3,233,156 $ 86,243
94949494llllll lllll94

WEBER COUNTY, UTAH
Budgetary Comparison ScheduleRAMP Tax FundFor the Year Ended December 31, 2014
Budgeted AmountsVariance From
REVENUES Original Final Actual Final BudgetTaxes:
Current Property — — Sales Taxes.......................................... $ 3,082,995 $ 3,082,995 $ 3,178,580 $ 95,585 Total Taxes....................................... 3,082,995 3,082,995 3,178,580 95,585 Other Revenues: Miscellaneous...................................... 20,000 20,000 12,335 (7,665) Total Revenues................................. 3,102,995 3,102,995 3,190,915 87,920
EXPENDITURESParks, Recreation & Public Facilities: Grants to Other Entities...................... 3,515,000 3,515,000 2,233,609 (1,281,391) Administration.................................... 30,600 30,600 49,839 19,239 Total Expenditures........................... 3,545,600 3,545,600 2,283,448 (1,262,152)
Revenues Over (Under) Expenditures..................................... (442,605) (442,605) 907,467 1,350,072
OTHER FINANCING SOURCES (USES)Transfers In........................................... — — — — Transfers Out......................................... — — — —
Net Change in Fund Balance............ (442,605) (442,605) 907,467 1,350,072
Fund Balance, January 1....................... 3,046,412 3,046,412 3,046,412 —
Fund Balance, December 31.................. $ 2,603,807 $ 2,603,807 $ 3,953,879 $ 1,350,072
95959595llllll lllll95
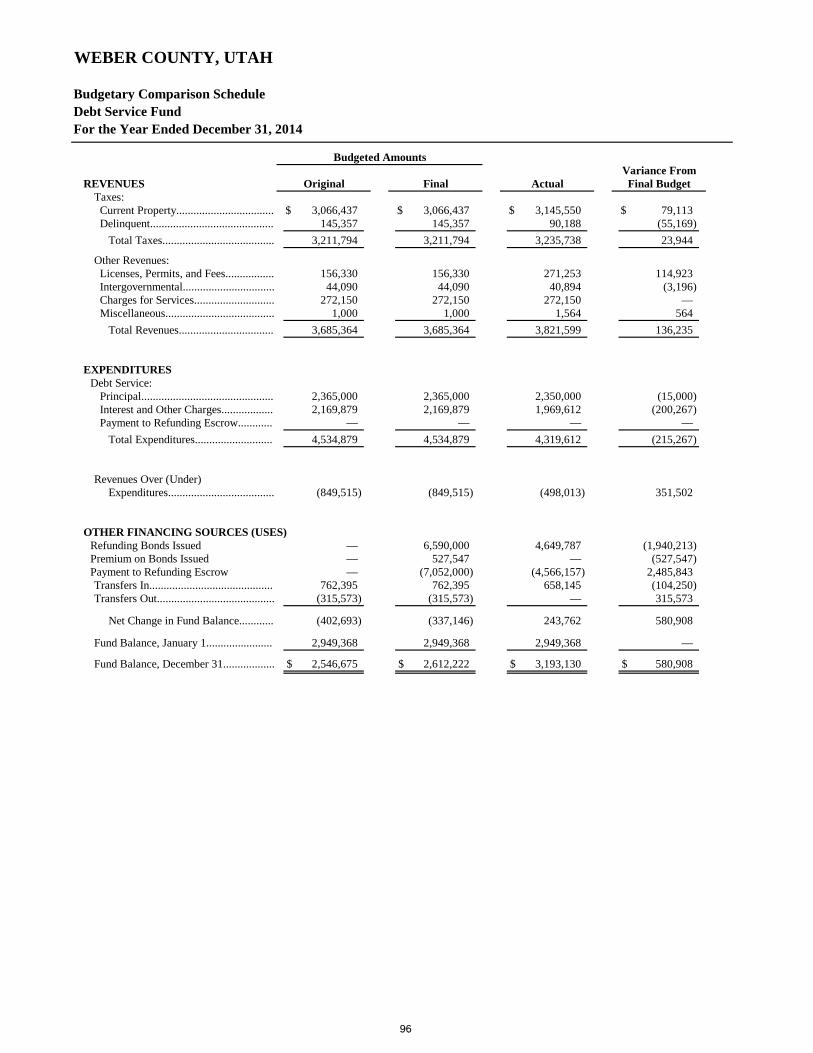
WEBER COUNTY, UTAH
Budgetary Comparison ScheduleDebt Service FundFor the Year Ended December 31, 2014
Budgeted AmountsVariance From
REVENUES Original Final Actual Final BudgetTaxes: Current Property.................................. $ 3,066,437 $ 3,066,437 $ 3,145,550 $ 79,113 Delinquent........................................... 145,357 145,357 90,188 (55,169) Total Taxes....................................... 3,211,794 3,211,794 3,235,738 23,944
Other Revenues: Licenses, Permits, and Fees................. 156,330 156,330 271,253 114,923 Intergovernmental................................ 44,090 44,090 40,894 (3,196) Charges for Services............................ 272,150 272,150 272,150 — Miscellaneous...................................... 1,000 1,000 1,564 564 Total Revenues................................. 3,685,364 3,685,364 3,821,599 136,235
EXPENDITURESDebt Service: Principal.............................................. 2,365,000 2,365,000 2,350,000 (15,000) Interest and Other Charges.................. 2,169,879 2,169,879 1,969,612 (200,267) Payment to Refunding Escrow............ — — — — Total Expenditures........................... 4,534,879 4,534,879 4,319,612 (215,267)
Revenues Over (Under) Expenditures..................................... (849,515) (849,515) (498,013) 351,502
OTHER FINANCING SOURCES (USES)Refunding Bonds Issued — 6,590,000 4,649,787 (1,940,213) Premium on Bonds Issued — 527,547 — (527,547) Payment to Refunding Escrow — (7,052,000) (4,566,157) 2,485,843 Transfers In........................................... 762,395 762,395 658,145 (104,250) Transfers Out......................................... (315,573) (315,573) — 315,573
Net Change in Fund Balance............ (402,693) (337,146) 243,762 580,908
Fund Balance, January 1....................... 2,949,368 2,949,368 2,949,368 —
Fund Balance, December 31.................. $ 2,546,675 $ 2,612,222 $ 3,193,130 $ 580,908
96969696llllll lllll96

WEBER COUNTY, UTAH
Budgetary Comparison ScheduleSpecial Assessment Bond FundFor the Year Ended December 31, 2014
Budgeted AmountsVariance From
REVENUES Original Final Actual Final Budget
Other Revenues: Miscellaneous...................................... 320,000 320,000 57,770 (262,230) Total Revenues................................. 320,000 320,000 57,770 (262,230)
EXPENDITURESDebt Service: Principal.............................................. — — — — Interest and Other Charges.................. 945,803 945,803 961,729 15,926 Payment to Refunding Escrow............ — — — — Total Expenditures........................... 945,803 945,803 961,729 15,926
Revenues Over (Under) Expenditures..................................... (625,803) (625,803) (903,959) (278,156)
OTHER FINANCING SOURCES (USES)Transfers In........................................... — — — — Transfers Out......................................... — — — —
Net Change in Fund Balance............ (625,803) (625,803) (903,959) (278,156)
Fund Balance, January 1....................... 4,593,431 4,593,431 4,593,431 —
Fund Balance, December 31.................. $ 3,967,628 $ 3,967,628 $ 3,689,472 $ (278,156)
97979797llllll lllll97

WEBER COUNTY, UTAH
Budgetary Comparison ScheduleCapital Projects FundFor the Year Ended December 31, 2014
Budgeted AmountsVariance From
REVENUES Original Final Actual Final BudgetOther Revenues: Intergovernmental....................................................... $ 14,074 $ 374,074 $ 270,155 $ (103,919) Miscellaneous............................................................. 150,000 150,000 303,300 153,300 Total Revenues......................................................... 164,074 524,074 573,455 49,381
EXPENDITURESParks, Recreation & Public Facilities............................ — — 1,165 1,165 Capital Outlay: Capital Improvements - Jail....................................... 90,000 2,397,000 2,369,503 (27,497) Capital Improvements - Conference Center............... 154,000 270,630 307,182 36,552 Capital Improvements - Gun Range........................... — 3,806,000 3,805,782 (218) Capital Improvements - Ice Sheet Upgrades.............. — 141,293 141,293 — Capital Improvements - Weber Center....................... 113,000 669,305 624,524 (44,781) Capital Improvements - GSEC................................... 179,550 327,731 156,846 (170,885) Capital Improvements - Recreation............................ 132,370 120,071 109,339 (10,732) Capital Improvements - Libraries............................... 9,000,000 9,000,000 6,098,807 (2,901,193) Capital Improvements - Roads Dept. Facilities.......... 6,000 10,524 10,631 107 Capital Improvements - Transfer Station................... 35,000 35,000 — (35,000) Capital Improvements - Other.................................... 2,500 2,500 — (2,500) Total Expenditures................................................... 9,712,420 16,780,054 13,625,072 (3,154,982)
Revenues Over (Under) Expenditures............................................................ (9,548,346) (16,255,980) (13,051,617) 3,204,363
OTHER FINANCING SOURCES (USES)Transfers In................................................................... 100,000 6,737,306 6,761,859 24,553 Transfers Out................................................................ — — — —
Net Change in Fund Balance................................... (9,448,346) (9,518,674) (6,289,758) 3,228,916
Fund Balance, January 1............................................... 35,672,576 35,672,576 35,672,576 —
Fund Balance, December 31......................................... $ 26,224,230 $ 26,153,902 $ 29,382,818 $ 3,228,916
98989898llllll lllll98

WEBER COUNTY, UTAH
Budgetary Comparison SchedulePublic Works FundFor the Year Ended December 31, 2014
Budgeted AmountsVariance From
REVENUES Original Final Actual Final BudgetOther Revenues: Intergovernmental................................ $ 4,675,000 $ 8,675,000 $ 9,392,275 $ 717,275 Miscellaneous...................................... 3,500 3,500 58,273 54,773
Total Revenues................................. 4,678,500 8,678,500 9,450,548 772,048
EXPENDITURESStreets and Public Improvements:
Sidewalk Repairs................................ 25,000 25,000 49,310 24,310 Old Snow Basin Road......................... 69,397 69,397 71,786 2,389 Trails.................................................. — — 98,000 98,000
Capital Outlay: 3500 West Road Improvements.......... 1,100,000 1,100,000 1,320,805 220,805 Flood Control - Infrastructure............. 3,575,000 7,575,000 7,806,412 231,412 Summit Mountain SAA Infrastructure 6,260,000 6,260,000 5,551,789 (708,211)
Total Expenditures............................ 11,029,397 15,029,397 14,898,102 (131,295)
Revenues Over (Under) Expenditures..................................... (6,350,897) (6,350,897) (5,447,554) 903,343
OTHER FINANCING SOURCES (USES)Transfers In............................................ — — — — Transfers Out......................................... — — — —
Net Change in Fund Balance............ (6,350,897) (6,350,897) (5,447,554) 903,343
Fund Balance, January 1........................ 9,264,335 9,264,335 9,264,335 —
Fund Balance, December 31.................. $ 2,913,438 $ 2,913,438 $ 3,816,781 $ 903,343
99999999llllll lllll99

100100100100llllll lllll100

Internal Service Funds Risk Management Fund This fund accounts for the County’s insurance coverage and loss prevention activities. Coverage is provided using a combination of self-insurance and private insurance. Resources come from charges to departments’ budgets based on estimates of insurance premium costs and self-insured expenses for the current year. Fleet Management Fund This fund accounts for operations of the County’s fleet of vehicles. Resources come from charges to departments’ budgets based on the actual costs of vehicles, insurance, and administration.
101101101101llllll lllll101

WEBER COUNTY, UTAH
Combining Statement of Net PositionInternal Service FundsDecember 31, 2014
Risk FleetManagement Management Total
ASSETSCurrent Assets: Cash and Investments ........................ $ 2,036,751 $ 1,067,567 $ 3,104,318 Receivables: Accounts Receivable.......................... 11,840 — 11,840 Interest............................................... — — — Notes, net........................................... — — — Due From Other Governments........... — — — Due From Other Funds......................... — — — Prepaids................................................ — — — Total Current Assets........................ 2,048,591 1,067,567 3,116,158
Noncurrent Assets: Restricted Cash.................................... — — — Capital Assets: Land................................................... — — — Buildings and Improvements.............. — — — Machinery and Equipment................. — 6,472,320 6,472,320 Construction in Progress.................... — — — Less Accumulated Depreciation......... — (3,551,211) (3,551,211) Total Noncurrent Assets.................. — 2,921,109 2,921,109 Total Assets................................... 2,048,591 3,988,676 6,037,267
LIABILITIESCurrent Liabilities: Accounts Payable................................. 17,266 26,042 43,308 Accrued Liabilities............................... — — — Due To Other Funds............................. — — — Unearned Revenue............................... — — — Claims Payable..................................... — — — Compensated Absences........................ — — — Current Portion of Long-term Debt...... — — — Total Current Liabilities.................. 17,266 26,042 43,308
Noncurrent Liabilities: Interfund Loans Payable....................... — — — Bonds Payable, net............................... — — — Capital Lease Obligations.................... — — — Landfill Closure Costs.......................... — — — Total Noncurrent Liabilities............ — — — Total Liabilities............................. 17,266 26,042 43,308
NET POSITIONNet Investment in Capital Assets........... — 2,921,110 2,921,110 Restricted............................................... — — — Unrestricted............................................ 2,031,325 1,041,524 3,072,849 Total Net Position.......................... $ 2,031,325 $ 3,962,634 $ 5,993,959
102102102102llllll lllll102

WEBER COUNTY, UTAH
Combining Statement of Revenues, Expenses, and Changes in Net PositionInternal Service FundsFor the Year Ended December 31, 2014
Risk FleetManagement Management Total
OPERATING REVENUES Charges for Services......................................... $ 1,186,903 $ 1,065,990 $ 2,252,893 Miscellaneous................................................... — — —
Total Revenues.............................................. 1,186,903 1,065,990 2,252,893
OPERATING EXPENSES General and Administrative.............................. 95,138 148,170 243,308 Disposal Costs.................................................. — — — Depreciation..................................................... — 839,290 839,290 Claims and Premiums....................................... 882,655 — 882,655
Total Expenses.............................................. 977,793 987,460 1,965,253
Operating Income (Loss)............................... 209,110 78,530 287,640
NON OPERATING REVENUES (EXPENSES) Investment Income............................................. — — — Interest Expense................................................ — (349) (349) Gain (Loss) on Sale of Capital Assets............... — 81,446 81,446 Total Non-Operating Revenues (Expenses)... — 81,097 81,097
Income (Loss) Before Transfers................... 209,110 159,627 368,737
Transfers In...................................................... — — — Transfers Out.................................................... — — —
Change in Net Position.................................. 209,110 159,627 368,737
Net Position - Beginning .................................... 1,822,215 3,803,007 5,625,222
Net Position - Ending.......................................... $ 2,031,325 $ 3,962,634 $ 5,993,959
103103103103llllll lllll103

WEBER COUNTY, UTAH
Combining Statement of Cash FlowsInternal Service FundsFor the Year Ended December 31, 2014
Risk FleetManagement Management Total
CASH FLOWS FROM OPERATING ACTIVITIES Receipts from Customers and Users.................................... $ 1,184,858 $ 1,065,990 $ 2,250,848 Payments to Suppliers and Contractors............................... (963,391) (149,551) (1,112,942) Payments to Employees....................................................... — — — Net Cash Provided (Used) by Operating Activities......................................................... 221,467 916,439 1,137,906
CASH FLOWS FROM NON-CAPITALFINANCING ACTIVITIES
Transfers (To) From Other Funds........................................ — — — Repayment Under Interfund Loans..................................... — — — Interfund Balances Due To (From) Other Funds................. — — — Net Cash Provided (Used) by Non-Capital Financing Activities..................................... — — —
CASH FLOWS FROM CAPITAL ANDRELATED FINANCING ACTIVITIES
Borrowing Under Interfund Loans...................................... — — — Repayment Under Interfund Loans..................................... — — — Deferred Financing Proceeds.............................................. — — — Acquisition of Capital Assets.............................................. — (715,066) (715,066) Proceeds from Sale of Bonds.............................................. — — — Principal Paid on Bonds and Capital Leases....................... — (102,066) (102,066) Interest Paid on Bonds and Capital Leases.......................... — (349) (349) Proceeds from Disposal of Capital Assets........................... — 175,169 175,169 Payments for Landfill Post-Closure Care............................ — — — Net Cash Provided (Used) by Capital and Related Financing Activities......................... — (642,312) (642,312)
CASH FLOWS FROM INVESTING ACTIVITIES Interest on Investments......................................................... — — — Net Cash Provided (Used) by Investing Activities.......................................................... — — —
Net Cash Provided (Used) - All Activities....................... 221,467 274,127 495,594
Cash and Cash Equivalents - Beginning.............................. 1,815,284 793,440 2,608,724 Cash and Cash Equivalents - Ending................................... $ 2,036,751 $ 1,067,567 $ 3,104,318
RECONCILIATION OF OPERATING INCOME TO NETCASH PROVIDED (USED) BY OPERATING ACTIVITIES
Operating Income (Loss)..................................................... $ 209,110 $ 78,530 $ 287,640 Adjustments to Reconcile Operating Income (Loss): Depreciation Expense...................................................... — 839,290 839,290 (Increase) Decrease in Accounts Receivable................... (2,045) — (2,045) (Increase) Decrease in Prepaid Expense.......................... — — — (Increase) Decrease in Due from Other Funds................. — — — Increase (Decrease) in Accounts Payable........................ 14,402 (1,381) 13,021 Increase (Decrease) in Accrued Liabilities...................... — — — Increase (Decrease) in Compensated Absences............... — — — Net Cash Provided (Used) by Operating Activities..................................................... $ 221,467 $ 916,439 $ 1,137,906
NON-CASH INVESTING, CAPITAL, ANDFINANCING ACTIVITIES
Assets Acquired Under Capital Lease.................................. $ — $ — $ — Gain (Loss) on Sale of Capital Assets.................................. — 81,446 81,446 Total Non-Cash Investing, Capital and Financing Activities.......................................................... $ — $ 81,446 $ 81,446
104104104104llllll lllll104

Fiduciary Funds Private-Purpose Trust Funds These funds account for resources that are held for the benefit of individuals, private organizations, or other governments. Assets of these funds cannot be used to support the County’s own programs. Weber County reports three private-purpose trust funds: Strike Force
This fund receives grants and fees from other governments, as well as proceeds from forfeited property, to fund the operations of the Weber/Morgan Narcotics Strike Force.
County Inmate Trust This fund accounts for monies that belong to inmates who are being held at the county jail including bail postings and personal funds. Other Miscellaneous This fund consists of various small individual funds created to receive and disburse funds in accordance with applicable laws and trust agreements.
Agency Funds These funds account for assets held by the County as an agent for other governments or organizations. These funds are custodial in nature and do not involve measuring the results of operations. Weber County reports two agency funds:
Treasurer’s Agency Fund This fund accounts for collection and disbursement of various revenue sources on behalf of other governments and entities including the State of Utah, the Utah Transit Authority, and the Internal Revenue Service. Tax Collection Fund This fund accounts for collection and disbursement of property tax revenues on behalf of all taxing authorities within the County including cities, towns, school districts, and special districts.
105105105105llllll lllll105

WEBER COUNTY, UTAH
Combining Statement of Fiduciary Net Position
Private-Purpose Trust Funds
County Other
Strike Force Inmate Trust Miscellaneous Total
ASSETS
Cash ............................................................ $ 276,657 $ 126,439 $ 57,979 $ 461,075
Accounts Receivable................................... — 24,947 — 24,947
Due From Other Governments..................... 144,516 — — 144,516
Buildings..................................................... 48,853 — — 48,853
Machinery and Equipment........................... 438,551 — — 438,551
Less Accumulated Depreciation.............. (390,635) — — (390,635)
Total Assets......................................... 517,942 151,386 57,979 727,307
LIABILITIES
Accounts Payable........................................ 65,869 94,264 — 160,133
Deposits....................................................... 246,306 — — 246,306
Total Liabilities................................... 312,175 94,264 — 406,439
NET POSITION
Held In Trust for Individuals,
Organizations, and Other Governments..... $ 205,767 $ 57,122 $ 57,979 $ 320,868
106106106106llllll lllll106

WEBER COUNTY, UTAH
Combining Statement of Changes in Fiduciary Net Position
Private-Purpose Trust Funds
For the Year Ended December 31, 2014
County Other
Strike Force Inmate Trust Miscellaneous Total
ADDITIONS
Grants.................................................................. $ 406,606 $ — $ — $ 406,606
Contributions From Other Governments.............. 38,212 — — 38,212
Charges for Services............................................ — — 281,750 281,750
Fines and Forfeitures............................................ 164,904 — — 164,904
Miscellaneous...................................................... 1,704 3,855,741 — 3,857,445
Investment Income .............................................. 63 — — 63
Total Additions............................................. 611,489 3,855,741 281,750 4,748,980
DEDUCTIONS
Trust Operating Expenses.................................... 704,895 — 299,595 1,004,490
Awards and Claims.............................................. — 3,848,924 17,100 3,866,024
Total Deductions......................................... 704,895 3,848,924 316,695 4,870,514
Change in Net Position........................................ (93,406) 6,817 (34,945) (121,534)
Net Position - Beginning...................................... 299,173 50,305 92,924 442,402
Net Position - Ending........................................... $ 205,767 $ 57,122 $ 57,979 $ 320,868
107107107107llllll lllll107

WEBER COUNTY, UTAH
Combining Statement of Fiduciary Assets and LiabilitiesAgency Funds
Treasurer's Tax CollectionAgency Fund Fund Total
ASSETSCash .......................................................... $ 5,525,745 $ 10,105,608 $ 15,631,353 Taxes Receivable....................................... — 1,370,668 1,370,668 Delinquent Taxes Receivable..................... — 5,335,455 5,335,455 Total Assets.......................................... $ 5,525,745 $ 16,811,731 $ 22,337,476
LIABILITIESAccounts Payable....................................... $ 41,615 $ — $ 41,615 Accrued Liabilities..................................... — 140,257 140,257 Due to Other Entities.................................. 5,484,130 10,634,489 16,118,619 Reserve for Tax Overpayments.................. — 701,530 701,530 Deferred Tax Distributions........................ — 5,335,455 5,335,455 Total Liabilities..................................... $ 5,525,745 $ 16,811,731 $ 22,337,476
108108108108llllll lllll108

WEBER COUNTY, UTAH
Combining Statement of Changes in Assets and LiabilitiesAgency FundsFor the Year Ended December 31, 2014
Balance BalanceDecember 31, 2013 Additions Deductions December 31, 2014
TREASURER'S AGENCY FUND ASSETSCash ............................................ $ 7,885,992 $ 60,318,154 $ (62,678,401) $ 5,525,745 Total Assets............................ $ 7,885,992 $ 60,318,154 $ (62,678,401) $ 5,525,745
LIABILITIESAccounts Payable........................ $ 250 $ 5,432,132 $ (5,390,767) $ 41,615 Due to Other Entities................... 7,885,742 28,005,637 (30,407,249) 5,484,130 Total Liabilities...................... $ 7,885,992 $ 33,437,769 $ (35,798,016) $ 5,525,745
TAX COLLECTION FUND ASSETSCash ............................................ $ 8,998,743 $ 190,722,103 $ (189,615,238) $ 10,105,608 Taxes Receivable......................... 1,774,882 1,762,266 (2,166,480) 1,370,668 Delinquent Taxes Receivable...... 6,009,160 5,335,455 (6,009,160) 5,335,455 Total Assets............................ $ 16,782,785 $ 197,819,824 $ (197,790,878) $ 16,811,731
LIABILITIESAccrued Liabilities...................... $ 416,721 $ 140,257 $ (416,721) $ 140,257 Due to Other Entities................... 9,680,976 10,547,463 (9,593,950) 10,634,489 Reserve for Tax Overpayments.... 675,928 701,530 (675,928) 701,530 Deferred Tax Distributions.......... 6,009,160 5,335,455 (6,009,160) 5,335,455 Total Liabilities...................... $ 16,782,785 $ 16,724,705 $ (16,695,759) $ 16,811,731
TOTAL AGENCY FUNDS ASSETSCash ............................................ $ 16,884,735 $ 251,040,257 $ (252,293,639) $ 15,631,353 Taxes Receivable......................... 1,774,882 1,762,266 (2,166,480) 1,370,668 Delinquent Taxes Receivable...... 6,009,160 5,335,455 (6,009,160) 5,335,455 Total Assets............................ $ 24,668,777 $ 258,137,978 $ (260,469,279) $ 22,337,476
LIABILITIESAccounts Payable........................ $ 250 $ 5,432,132 $ (5,390,767) $ 41,615 Accrued Liabilities...................... 416,721 140,257 (416,721) 140,257 Due to Other Entities................... 17,566,718 38,553,100 (40,001,199) 16,118,619 Reserve for Tax Overpayments.... 675,928 701,530 (675,928) 701,530 Deferred Tax Distributions.......... 6,009,160 5,335,455 (6,009,160) 5,335,455 Total Liabilities...................... $ 24,668,777 $ 50,162,474 $ (52,493,775) $ 22,337,476
109109109109llllll lllll109

110110110110llllll lllll110

Weber Morgan Health Department Fund Statements
The Weber Morgan Health Department’s (WMHD) is an interlocal agreement between Weber and Morgan counties to provide their residents with Public Health Services. WMHD’s basic fund financial statements are included here. The WMHD does not issue separate financial statements.
111111111111llllll lllll111
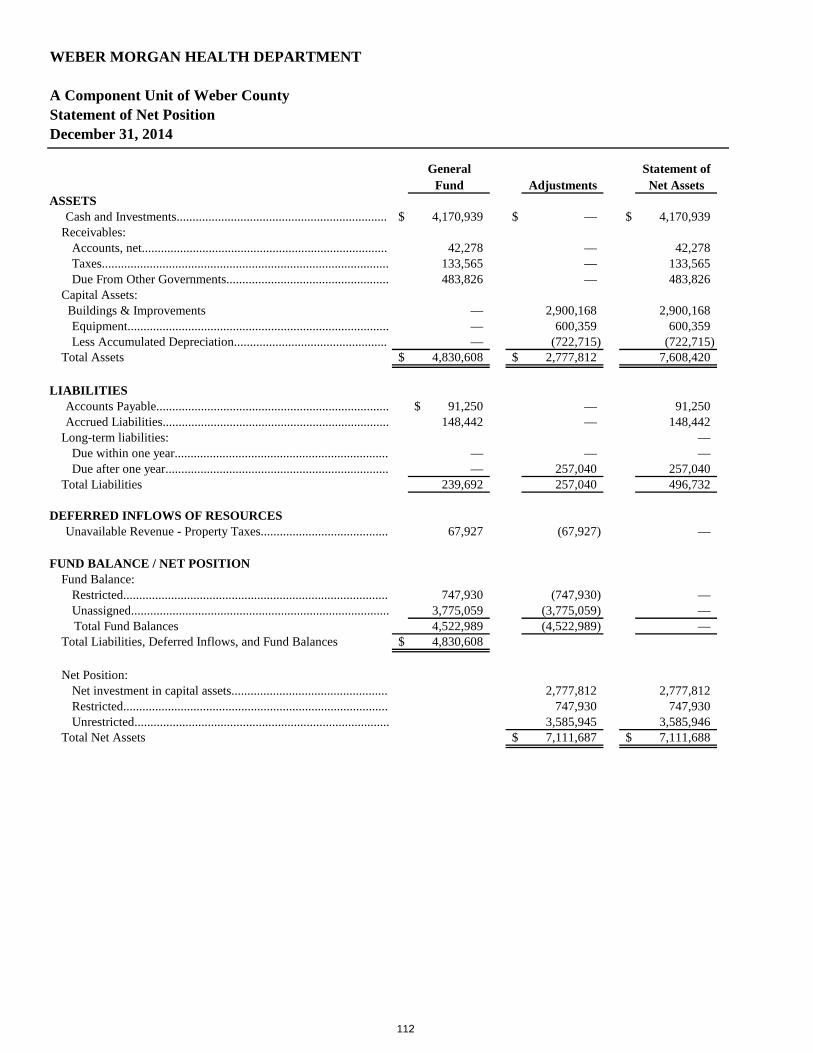
WEBER MORGAN HEALTH DEPARTMENT
A Component Unit of Weber CountyStatement of Net PositionDecember 31, 2014
General Statement ofFund Adjustments Net Assets
ASSETSCash and Investments.................................................................. $ 4,170,939 $ — $ 4,170,939
Receivables: Accounts, net............................................................................. 42,278 — 42,278 Taxes.......................................................................................... 133,565 — 133,565 Due From Other Governments................................................... 483,826 — 483,826
Capital Assets: Buildings & Improvements — 2,900,168 2,900,168 Equipment.................................................................................. — 600,359 600,359 Less Accumulated Depreciation................................................ — (722,715) (722,715)
Total Assets $ 4,830,608 $ 2,777,812 7,608,420
LIABILITIESAccounts Payable......................................................................... 91,250$ — 91,250 Accrued Liabilities....................................................................... 148,442 — 148,442
Long-term liabilities: — Due within one year................................................................... — — — Due after one year...................................................................... — 257,040 257,040
Total Liabilities 239,692 257,040 496,732
DEFERRED INFLOWS OF RESOURCESUnavailable Revenue - Property Taxes........................................ 67,927 (67,927) —
FUND BALANCE / NET POSITIONFund Balance: Restricted................................................................................... 747,930 (747,930) — Unassigned................................................................................. 3,775,059 (3,775,059) —
Total Fund Balances 4,522,989 (4,522,989) — Total Liabilities, Deferred Inflows, and Fund Balances $ 4,830,608
Net Position: Net investment in capital assets................................................. 2,777,812 2,777,812 Restricted................................................................................... 747,930 747,930 Unrestricted................................................................................ 3,585,945 3,585,946
Total Net Assets $ 7,111,687 $ 7,111,688
112

WEBER MORGAN HEALTH DEPARTMENT
A Component Unit of Weber CountyStatement of Changes in Net PositionFor the Year Ended December 31, 2014
General Statement ofFund Adjustments Activities
REVENUESProperty Taxes............................................................................. $ 1,301,338 $ 39,924 $ 1,341,262 Delinquent Taxes......................................................................... 51,995 (51,995) — Licenses, Permits and Fees........................................................... 112,274 — 112,274 Intergovernmental........................................................................ 6,980,304 — 6,980,304 Charges for Services.................................................................... 2,109,090 — 2,109,090 Miscellaneous............................................................................... 52,021 (11,094) 40,927 Gain on Sale of Capital Assets..................................................... 30,800 — 30,800 Total Revenues........................................................................ 10,637,822 (23,165) 10,614,657
EXPENDITURES / EXPENSESCurrent: Employee Wages and Benefits................................................... 4,812,007 1,149 4,813,156 Materials and Services............................................................... 5,542,693 — 5,542,693 Depreciation............................................................................... — 102,009 102,009
Capital Outlay 31,543 (31,543) — Total Expenditures / Expenses................................................ 10,386,243 71,615 10,457,858
Revenues Over (Under) Expenditures.......................................... 251,579 (94,780) 156,799
OTHER FINANCING SOURCES (USES)Transfers In.................................................................................. — — — Transfers Out................................................................................ — — —
Total Other Financing Sources (Uses) — — —
Change in Fund Balance / Net Position................................... 251,579 (94,780) 156,799
Fund Balance / Net Position, January 1 4,271,410 6,954,889 Fund Balance / Net Position, December 31 $ 4,522,989 $ 7,111,688
113

114114114114llllll lllll114

Other Schedules Tax Collection Agency Fund – Cash Receipts and Disbursements This schedule reports the cash coming into and out of the County’s Tax Collection Agency Fund during the year. It provides detail for each taxing authority within the County. This schedule is required by state law. Statement of Taxes Charged and Collected This schedule reports, among other things, total taxable value, current tax rates, total taxes charged, and total taxes collected during the year for each taxing entity within the County. This schedule is required by state law. Schedule of Expenditures of Tourism Tax Revenues This schedule demonstrates how the County spent its tourism-related tax revenues during the year. This schedule is required by state law.
115115115115llllll lllll115

Weber CountyTax Collection Trust FundCash Receipts and DisbursementsFor the Year Ended December 31, 2014
Treasurer Tax Current Delinquent Interest TreasurerBalance Collection Taxes Taxes & Int Earnings Balance
12/31/2013 Receipts Apportioned Apportioned Apportioned Total Disbursed 12/31/2014Tax Collection Accounts
Current Year Taxes.................................... — 184,559,349 (184,482,834) — (76,514) 0 — 0 Redemption Of Prior Year......................... — 6,174,617 — (6,174,617) — — — — Penalties, Int & Costs................................ — 724,542 — (724,542) — — — — Fee In Lieu On Reg Veh............................ — 13,323,480 (13,323,480) — — — — — Tax Overpayments..................................... 675,928 701,530 — — — 1,377,458 675,928 701,530
Total Collections 675,928 205,483,518 (197,806,314) (6,899,159) (76,514) 1,377,458 675,928 701,530
WEBER COUNTY FUNDSWeber County General Fund..................... 1,562,065 — 23,069,234 1,318,740 8,889 25,958,929 24,467,062 1,491,867 Weber County G O Bond Fund................. 116,879 — 3,416,803 90,188 1,312 3,625,182 3,205,300 419,883 Library....................................................... 462,632 — 7,488,819 277,055 2,875 8,231,380 7,772,898 458,482 Weber / Morgan Health............................. 87,810 — 1,413,612 51,995 543 1,553,960 1,466,934 87,025 Paramedic Fund......................................... 154,548 — 2,511,805 92,902 964 2,760,219 2,605,983 154,236 Assess & Collect / County......................... 152,436 — 4,246,307 91,827 1,633 4,492,203 3,884,676 607,527 Assess & Collect / State 2013 & Prior....... 104,844 — — 66,005 — 170,849 167,563 3,287 Tax Sale Fees............................................. — — — 18,975 — 18,975 18,975 — Unincorp Services Fund............................ 24,475 — 314,643 5,294 124 344,537 319,692 24,844
SCHOOL DISTRICTS
Ogden City School Distr............................ 1,224,926 — 29,138,575 1,061,906 11,394 31,436,801 29,078,765 2,358,037 Weber School District................................ 3,501,579 — 53,685,351 1,957,585 20,474 59,164,989 55,414,098 3,750,891 Ogden School Judgment Levy................... — — 77,221 — 32 77,254 73,901 3,353
CITIES & TOWNSHarrisville City.......................................... 26,010 — 330,842 9,147 125 366,123 339,365 26,759 Huntsville Town........................................ 5,988 — 76,328 2,370 30 84,716 77,182 7,534 North Ogden City...................................... 101,369 — 1,192,978 33,112 443 1,327,902 1,249,731 78,170 Ogden City................................................. 454,754 — 10,464,004 417,971 4,090 11,340,818 10,794,403 546,415 Plain City................................................... 10,938 — 153,404 4,383 56 168,781 156,362 12,419 Pleasant View City.................................... 43,034 — 637,956 28,978 245 710,211 672,859 37,352 Riverdale City............................................ 40,723 — 646,471 11,342 244 698,781 650,404 48,377 Roy City..................................................... 197,059 — 2,865,854 82,294 1,072 3,146,278 2,940,979 205,299 South Ogden City...................................... 148,289 — 2,268,875 66,667 864 2,484,695 2,340,814 143,881 Uintah Town.............................................. 2,962 — 68,283 1,499 25 72,769 67,789 4,980 Washington Terrace City........................... 45,971 — 957,660 29,633 362 1,033,626 986,309 47,317 Hooper City............................................... 16,472 — 216,439 4,036 81 237,029 222,234 14,795 Farr West City............................................ 22,864 — 277,416 3,429 106 303,815 284,334 19,481
WATER CONSERVANCY DIST
Weber Basin Water - General.................... 138,529 — 2,251,100 86,230 864 2,476,723 2,345,098 131,626 Weber Basin Water - Ogden...................... 39,771 — 913,697 36,493 357 990,319 942,492 47,826 Roy Water Conservancy Distr................... 9,229 — 131,952 5,340 50 146,571 137,668 8,903 Bona Vista Water Distr.............................. 32,760 — 512,591 27,721 197 573,268 542,671 30,597 Uintah Highlands Improv.......................... 11,136 — 183,078 12,422 71 206,708 195,153 11,554 Hooper Water Imp Distr............................ 19,766 — 265,658 9,956 100 295,479 280,202 15,277 Powder Mntn Water & Sewer Distr........... 1,378 — 18,272 1,228 8 20,886 16,577 4,308 W Warren / Warren Water Imp Dis........... 735 — 21,570 651 8 22,964 20,958 2,006 Weber/Box Elder Conservancy Dis........... 240,064 — 3,433,458 73,954 1,388 3,748,864 3,493,407 255,456 Roy Secondary Water................................ 145,168 — 1,883,978 34,347 760 2,064,253 1,926,165 138,088 Weber Basin Water.................................... 88,809 — 1,251,642 38,339 514 1,379,303 1,307,128 72,175 South Ogden Cons Dist............................. 167,975 — 2,492,874 57,215 1,018 2,719,083 2,536,474 182,608 Wolf Crk Water&Swr................................ 1,592 — 4,089 1,585 10 7,275 7,265 10
116116116116llllll lllll116

Treasurer Tax Current Delinquent Interest TreasurerBalance Collection Taxes Taxes & Int Earnings Balance
12/31/2013 Receipts Apportioned Apportioned Apportioned Total Disbursed 12/31/2014
SEWER DISTRICTS Central Weber Sewer Distr........................ 417,463 — 6,672,097 252,759 2,560 7,344,879 6,962,523 382,356 North Davis Sewer Distr............................ 85,316 — 1,321,203 34,035 494 1,441,049 1,342,764 98,285
CEMETERY DISTRICTS
Ben Lomond Cemetery Distr..................... 9,087 — 112,741 3,867 42 125,738 118,361 7,377 Eden Cemetery Distr.................................. 4,264 — 30,968 1,733 13 36,977 31,792 5,185 Liberty Cemetery Maint Distr.................... 1,704 — 8,767 331 3 10,805 10,019 786 Plain City Cemetery................................... 2,151 — 29,442 839 11 32,443 30,214 2,229 West Weber / Taylor Cemetery.................. 1,331 — 16,665 314 6 18,315 17,007 1,309 Warren / W Warren Cemetery................... 1,430 — 23,411 207 9 25,058 23,149 1,908
MOSQUITO ABATEMENT
Mosquito Abatement Distr........................ 98,574 — 1,595,397 58,932 613 1,753,515 1,655,385 98,129
PARK IMPROVEMENT DISTRICTS West Warren Park Distr............................. 5,228 — 50,181 150 20 55,579 52,301 3,278 Weber Serv Area #5 Liberty Park.............. 4,379 — 30,002 1,142 12 35,535 33,914 1,621 Eden Park................................................... 3,212 — 32,300 960 13 36,485 34,356 2,129
REDEVELOPMENT DISTRICTS
Ogden Redev C B D Mall #1..................... 132,513 — 1,347,685 — 535 1,480,733 1,477,231 3,502 Ogden Redev 25th Street #2...................... 48,874 — 672,448 — 267 721,589 663,106 58,483 Ogden Redev Union Garden #5................. 2,256 — 25,858 — 10 28,124 25,704 2,420 Ogden Redev St Benedicts #4................... 13,414 — 220,810 — 88 234,311 216,549 17,762 Ogden Redev Washington Blvd #6............ 25,833 — 376,126 — 149 402,109 370,697 31,411 So Ogden Redev Washington Blvd........... 1,954 — 24,226 — 10 26,189 24,150 2,040 Ogden Redev Golden Links #8.................. 67 — 715 — 0 782 722 59 Ogden Redev Lester Park #7..................... 8,694 — 92,828 — 37 101,558 96,179 5,380 Ogden Redev Park Blvd #9........................ 7,366 — 63,045 — 25 70,436 64,557 5,878 Ogden Redev 12 Street #10....................... 14,819 — 167,605 — 67 182,491 167,491 15,000 Ogden Redev Lincoln #12......................... 44,271 — 497,180 — 197 541,648 496,166 45,482 Ogden Redev South C B D #11................. 8,145 — 66,378 — 26 74,549 68,093 6,456 Wash Terrace Redev C B D....................... 2,558 — 26,440 — 11 29,009 26,763 2,246 Roy Redev New Iomega #2....................... 22,581 — 269,534 — 107 292,222 268,840 23,382 Wash Terrace Redev Southeast................. 152,872 — 592,087 — 235 745,195 696,196 48,998 Ogden Redev Hinkley Airport #14............ 13,821 — 161,993 — 64 175,878 161,710 14,168 Roy Redev #3 City Center-Alb #............... 3,604 — 41,114 — 16 44,734 41,345 3,390 North Ogden Redev C B D........................ 47,751 — 508,830 — 202 556,783 515,326 41,458 Ogden Redev Fairmount #15..................... 120,549 — 1,237,748 — 491 1,358,788 1,272,999 85,789 So Ogden Redev 36th Street...................... 9,327 — 108,476 — 43 117,846 111,545 6,300 Riverdale Redev 1050 West...................... 27,536 — 274,791 — 109 302,436 286,373 16,063 Ogden Redev DDO #16............................. 408,853 — 5,249,489 — 2,084 5,660,426 5,316,699 343,727 Ogden Redev Am Can #18........................ 38,486 — 492,628 — 196 531,310 496,977 34,333 Ogden Redev Wall Ave #19...................... (1,007) — 135,317 — 54 134,364 124,462 9,902 So Ogden Redev Hinckley......................... 4,955 — 48,407 — 19 53,382 50,185 3,197 Ogden Redev West 12th #20..................... 256,649 — 1,949,492 — 774 2,206,915 2,100,243 106,672 Roy Redev #4 1900 West.......................... 12,450 — — — — 12,450 26,426 (13,976) Ogden Redev Hinckley Eda #21................ 25,766 — 312,948 — 124 338,838 321,478 17,359 Ogden Redev Ogden River #22................. 10,496 — 107,764 — 43 118,303 110,368 7,935 So Ogden Redev Northwest....................... 28,561 — 313,137 — 124 341,822 321,777 20,045 Riverdale Redev Riv Road Amend............ 36,931 — 400,117 — 159 437,207 412,753 24,453 Riverdale Redev 550 West........................ 31,614 — 346,008 — 137 377,759 357,704 20,054 Pleasant View Redev Bus Park #............... 12,449 — 264,963 — 105 277,517 274,563 2,955 Weber County Redev GSL Mineral........... 68,289 — 1,085,609 — 431 1,154,329 1,080,053 74,276 Ogden Redev East Washington #2............ — — 48,716 — 19 48,735 46,872 1,864 Weber County Redev Little Mount............ 1,986 — 35,355 — 14 37,355 35,263 2,093 Ogden Redev Trackline EDC #26............. — — 209,429 — 83 209,512 205,110 4,401 Ogden Redev So Wall EDA....................... — — 31,914 — 13 31,926 29,138 2,789
117117117117llllll lllll117
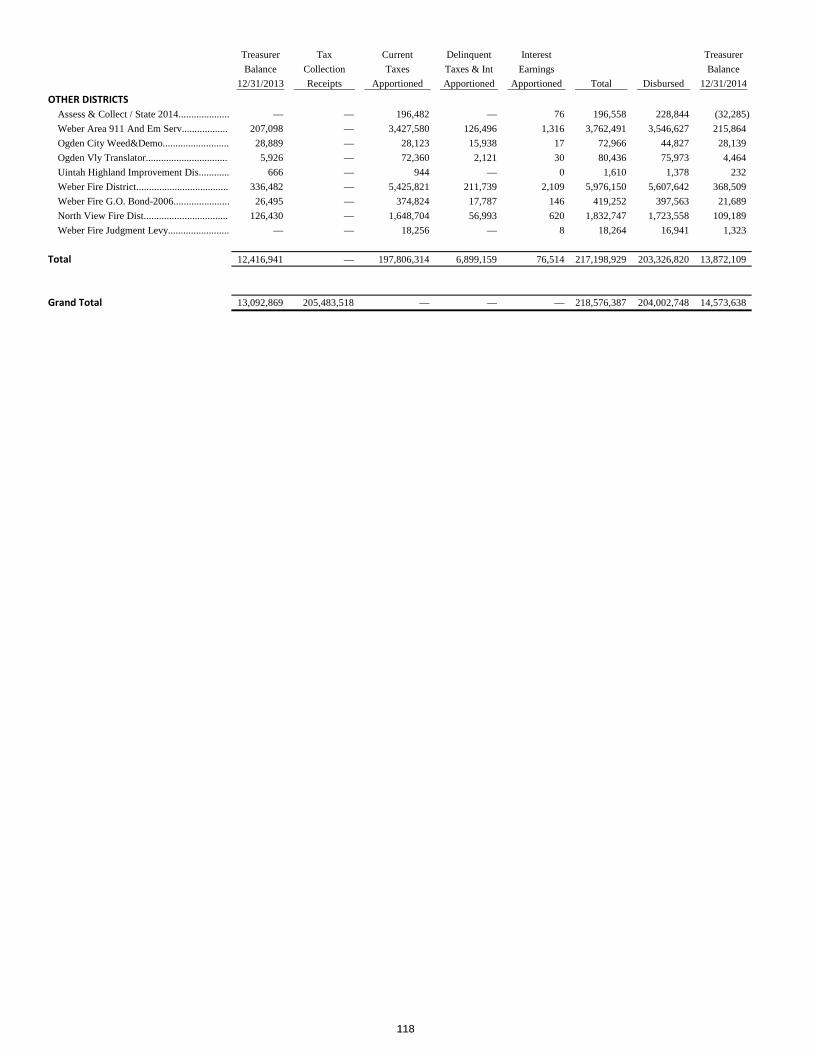
Treasurer Tax Current Delinquent Interest TreasurerBalance Collection Taxes Taxes & Int Earnings Balance
12/31/2013 Receipts Apportioned Apportioned Apportioned Total Disbursed 12/31/2014OTHER DISTRICTS
Assess & Collect / State 2014.................... — — 196,482 — 76 196,558 228,844 (32,285) Weber Area 911 And Em Serv.................. 207,098 — 3,427,580 126,496 1,316 3,762,491 3,546,627 215,864 Ogden City Weed&Demo.......................... 28,889 — 28,123 15,938 17 72,966 44,827 28,139 Ogden Vly Translator................................ 5,926 — 72,360 2,121 30 80,436 75,973 4,464 Uintah Highland Improvement Dis............ 666 — 944 — 0 1,610 1,378 232 Weber Fire District.................................... 336,482 — 5,425,821 211,739 2,109 5,976,150 5,607,642 368,509 Weber Fire G.O. Bond-2006...................... 26,495 — 374,824 17,787 146 419,252 397,563 21,689 North View Fire Dist................................. 126,430 — 1,648,704 56,993 620 1,832,747 1,723,558 109,189 Weber Fire Judgment Levy........................ — — 18,256 — 8 18,264 16,941 1,323
Total 12,416,941 — 197,806,314 6,899,159 76,514 217,198,929 203,326,820 13,872,109
Grand Total 13,092,869 205,483,518 — — — 218,576,387 204,002,748 14,573,638
118118118118llllll lllll118

119119119119llllll lllll119

Weber CountyStatement of Taxes Charged and CollectedCurrent YearFor the Year Ended December 31, 2014
Year-End Real Year-End Year-End Total Current Current PriorProperty Value Centr. Assessed Personal Year-End Property Centr. Assessed Property Real Centr. Assessed
After B.O.E. Property Value Property Value Value Tax Rate Tax Rate Tax Rate (1) Taxes Charged Taxes Charged
WEBER COUNTYWeber County General Fund...................... 10,427,173,084 556,139,384 991,679,676 11,974,992,144 0.002033 0.002033 0.002108 21,198,443 1,130,631 Weber County G O Bond Fund................... 10,427,173,084 556,139,384 991,679,676 11,974,992,144 0.000302 0.000302 0.000180 3,149,006 167,954 Library......................................................... 10,427,173,084 556,139,384 991,679,676 11,974,992,144 0.000662 0.000662 0.000686 6,902,789 368,164 Weber / Morgan Health.............................. 10,427,173,084 556,139,384 991,679,676 11,974,992,144 0.000125 0.000125 0.000129 1,303,397 69,517 Paramedic Fund.......................................... 10,427,173,084 556,139,384 991,679,676 11,974,992,144 0.000222 0.000222 0.000230 2,314,832 123,463 Assess & Collect / State.............................. 10,427,173,084 556,139,384 991,679,676 11,974,992,144 0.000013 0.000013 0.000158 135,553 7,230 Assess & Collect / County.......................... 10,427,173,084 556,139,384 991,679,676 11,974,992,144 0.000354 0.000354 0.000227 3,691,219 196,873 Tax Sale Fees.............................................. — — — — 0.000000 0.000000 0.000000 — —
SCHOOL DISTRICTSOgden City School District......................... 3,104,870,100 121,978,677 603,355,972 3,830,204,749 0.009204 0.009204 0.008754 28,577,224 1,122,692 Ogden School Judgment Levy.................... 3,104,870,100 121,978,677 603,355,972 3,830,204,749 0.000030 0.000030 0.000000 93,146 3,659 Weber School District................................. 7,322,302,984 434,160,707 388,323,704 8,144,787,395 0.006526 0.006526 0.006920 47,785,349 2,833,333 Weber School Judgement Levy.................. 7,322,302,984 434,160,707 388,323,704 8,144,787,395 0.000000 0.000000 0.000000 — —
CITIES & TOWNSFarr West City............................................. 347,580,659 9,251,949 29,211,275 386,043,883 0.000691 0.000691 0.000708 240,178 6,393 Harrisville City............................................ 232,225,956 6,299,477 5,562,360 244,087,793 0.001259 0.001259 0.001292 292,372 7,931 Hooper City................................................. 315,593,825 6,446,880 1,767,569 323,808,274 0.000625 0.000625 0.000656 197,246 4,029 Huntsville Town.......................................... 49,830,651 2,004,253 265,559 52,100,463 0.001445 0.001445 0.001480 72,005 2,896 North Ogden City........................................ 718,650,526 15,982,802 9,600,358 744,233,686 0.001584 0.001584 0.001653 1,138,342 25,317 Ogden City.................................................. 3,111,586,258 122,356,970 603,774,232 3,837,717,460 0.003367 0.003367 0.003415 10,476,711 411,976 Ogden City Weed&Demo........................... — — — — 0.000000 0.000000 0.000000 41,890 — Plain City.................................................... 236,301,415 12,029,271 2,482,978 250,813,664 0.000548 0.000548 0.000583 129,493 6,592 Pleasant View City...................................... 449,673,433 10,113,985 34,564,932 494,352,350 0.001293 0.001293 0.001346 581,428 13,077 Riverdale City............................................. 510,922,893 19,916,737 44,419,163 575,258,793 0.001242 0.001242 0.001263 634,566 24,737 Roy City...................................................... 1,127,254,208 38,245,814 35,483,018 1,200,983,040 0.002285 0.002285 0.002430 2,575,776 87,392 South Ogden City........................................ 751,780,871 14,265,443 31,708,243 797,754,557 0.002852 0.002852 0.002962 2,144,079 40,685 Uintah Town............................................... 54,857,415 4,865,390 1,687,128 61,409,933 0.001029 0.001029 0.001036 56,448 5,006 Washington Terrace City............................ 299,531,490 5,059,647 30,334,997 334,926,134 0.003101 0.003101 0.003217 928,847 15,690
WATER CONSERVANCY DISTRICTSBona Vista Water District........................... 1,410,320,571 70,485,004 175,391,194 1,656,196,769 0.000300 0.000300 0.000311 423,096 21,146 Hooper Water Imp District......................... 584,122,751 12,351,367 5,831,511 602,305,629 0.000415 0.000415 0.000446 242,411 5,126 Powder Mntn Water & Sewer District........ 42,545,497 190,106 523,610 43,259,213 0.000381 0.000381 0.000434 16,210 72 Roy Secondary Water................................. — — — — 0.000000 0.000000 0.000000 1,915,399 — Roy Water Conservancy District................ 1,178,512,116 41,295,385 36,821,509 1,256,629,010 0.000101 0.000101 0.000108 119,030 4,171 South Ogden Conservation District............ — — — — 0.000000 0.000000 0.000000 2,563,052 — Uintah Highland Improvement District...... — — — — 0.000000 0.000000 0.000000 944 — Uintah Highlands Improvement.................. 209,620,002 5,577,845 4,000,681 219,198,528 0.000809 0.000809 0.000837 169,583 4,512 W Warren / Warren Water Imp District..... 38,647,914 2,193,029 4,222,673 45,063,616 0.000429 0.000429 0.000441 16,580 941 Weber Basin Water..................................... — — — — 0.000000 0.000000 0.000000 1,294,871 — Weber Basin Water - General..................... 10,427,155,692 556,139,384 991,679,676 11,974,974,752 0.000199 0.000199 0.000210 2,075,004 110,672 Weber Basin Water - Ogden....................... 3,111,586,258 122,356,970 603,774,232 3,837,717,460 0.000294 0.000294 0.000298 914,806 35,973 Weber/Box Elder Conservancy Dis............ — — — — 0.000000 0.000000 0.000000 3,496,356 — Wolf Crk Water&Swr................................. — — — — 0.000000 0.000000 0.000000 24,980 —
SEWER DISTRICTSCentral Weber Sewer District..................... 7,643,322,654 143,042,993 894,089,594 8,680,455,241 0.000838 0.000838 0.000866 6,405,104 119,870 North Davis Sewer District......................... 1,157,667,633 39,040,827 37,216,601 1,233,925,061 0.001025 0.001025 0.001025 1,186,609 40,017
MOSQUITO ABATEMENT DISTRICTMosquito Abatement District...................... 10,427,173,084 556,139,384 991,679,676 11,974,992,144 0.000141 0.000141 0.000146 1,470,231 78,416
CEMETARY DISTRICTSBen Lomond Cemetery District.................. 1,255,162,708 30,662,336 52,300,835 1,338,125,879 0.000083 0.000083 0.000087 104,179 2,545 Eden Cemetery District............................... 408,552,841 5,451,492 2,962,153 416,966,486 0.000073 0.000073 0.000077 29,824 398
120120120120llllll lllll120

Personal Total Tax IncrementProperty Taxes Unpaid Other Total Taxes Collection Misc. Delinquent Interest & Paid to Net Revenue
Taxes Charged Charged Taxes Abatements Relief Relief Collected Rate Fee-in-lieu Collections Taxes Penalty RDA's Refunds For Distribution
2,090,461 24,419,535 748,052 396,758 48,844 1,193,655 23,225,880 95.1% 1,826,020 150,204 841,767 634,950 2,280,476 1,482 24,396,864 178,502 3,495,463 99,198 58,839 (84,998) 73,038 3,422,424 97.9% 271,253 21,664 85,180 6,890 298,983 127 3,508,303 680,292 7,951,245 218,311 129,195 15,613 363,119 7,588,126 95.4% 594,602 47,661 264,115 17,186 742,459 482 7,768,749 127,927 1,500,841 41,220 24,394 2,580 68,194 1,432,647 95.5% 112,274 8,557 49,561 3,235 140,034 91 1,466,150 228,086 2,666,382 73,210 43,325 5,202 121,737 2,544,644 95.4% 199,398 16,432 88,572 5,754 248,967 162 2,605,671 156,685 299,468 4,716 2,645 100,451 107,812 191,657 64.0% 11,676 (193) 62,858 3,289 6,613 111 262,563 225,111 4,113,204 116,326 68,982 (88,543) 96,765 4,016,439 97.6% 317,959 26,761 87,535 6,505 115,272 160 4,339,768
— — — — — — — 100.0% — — 18,975 — — — 18,975
5,281,778 34,981,694 1,050,432 344,016 (163,006) 1,231,442 33,750,252 96.5% 1,837,756 42,234 1,017,634 61,051 6,493,487 3,565 30,211,875 — 96,805 3,389 1,117 11 4,517 92,289 95.3% — 134 — 48 15,217 — 77,254
2,687,200 53,305,882 1,406,919 1,029,691 141,772 2,578,382 50,727,500 95.2% 4,558,546 443,039 1,862,158 125,615 2,051,404 2,045 55,663,410 — — — — — — — 100.0% — — 0 0 — — 0
20,682 267,253 5,783 5,536 428 11,747 255,506 95.6% 22,431 (572) 3,331 256 (0) — 280,951 7,187 307,490 8,960 5,302 185 14,447 293,043 95.3% 30,621 7,121 8,711 616 — — 340,113 1,160 202,435 4,949 6,703 68 11,720 190,715 94.2% 24,420 1,267 3,923 232 — — 220,556
393 75,294 2,612 362 13 2,987 72,308 96.0% 3,814 192 2,312 102 — — 78,728 15,869 1,179,529 24,799 22,804 605 48,208 1,131,321 95.9% 125,300 640 31,486 2,284 64,433 64 1,226,533
2,061,889 12,950,576 384,713 125,881 12,141 522,735 12,427,841 96.0% 672,963 20,405 400,372 23,661 2,657,786 1,391 10,886,064 — 41,890 13,768 — — 13,768 28,123 67.1% — 17 15,938 — — — 44,077
1,448 137,533 3,363 2,816 125 6,305 131,228 95.4% 19,114 3,037 4,192 272 — — 157,843 46,524 641,030 18,749 12,175 1,695 32,619 608,411 94.9% 52,828 987 27,704 1,637 24,331 58 667,178 56,101 715,404 7,148 10,457 634 18,240 697,164 97.5% 48,438 1,231 10,909 795 100,474 6 658,058 86,224 2,749,391 50,370 95,436 4,944 150,750 2,598,642 94.5% 311,577 5,188 77,771 6,113 49,741 329 2,949,220 93,920 2,278,684 45,125 37,953 2,836 85,914 2,192,770 96.2% 175,709 (675) 64,087 3,864 99,131 218 2,336,406
1,748 63,203 1,722 1,217 8 2,946 60,257 95.3% 7,602 413 1,417 119 — — 69,807 97,588 1,042,125 22,158 23,274 2,919 48,352 993,773 95.4% 91,674 1,559 28,257 1,914 129,522 — 987,655
54,547 498,788 15,422 6,362 1,777 23,561 475,228 95.3% 39,347 2,833 26,483 1,529 4,911 — 540,508 2,601 250,138 5,403 8,833 195 14,431 235,706 94.2% 29,286 618 9,295 809 — — 275,713
227 16,510 830 284 27 1,141 15,368 93.1% 350 2,552 1,168 70 — — 19,508 — 1,915,399 31,421 — — 31,421 1,883,978 98.4% — 760 34,347 — — — 1,919,085
3,977 127,177 2,415 4,490 249 7,154 120,023 94.4% 14,020 98 4,998 415 2,199 15 137,341 — 2,563,052 70,178 — — 70,178 2,492,874 97.3% — 1,018 57,215 — — — 2,551,107 — 944 — — — — 944 100.0% — 0 — — — — 944
3,349 177,444 4,242 3,351 109 7,701 169,742 95.7% 12,952 350 11,849 678 — — 195,571 1,862 19,383 418 257 45 720 18,663 96.3% 2,271 633 602 60 — — 22,229
— 1,294,871 43,229 — — 43,229 1,251,642 96.7% — 514 38,339 — — — 1,290,495 208,253 2,393,928 65,636 38,839 7,316 111,792 2,282,136 95.3% 178,740 14,275 82,151 5,357 224,317 148 2,338,195 179,925 1,130,704 33,592 10,992 998 45,582 1,085,122 96.0% 58,762 1,782 34,952 2,071 232,020 121 950,548
— 3,496,356 62,898 — — 62,898 3,433,458 98.2% — 1,388 73,954 — — — 3,508,800 — 24,980 20,891 — — 20,891 4,089 16.4% — 10 1,585 — — — 5,683
774,282 7,299,256 187,055 111,698 15,028 313,782 6,985,474 95.7% 523,940 8,767 241,168 15,392 846,834 492 6,927,416 38,147 1,264,773 23,731 43,158 (22) 66,868 1,197,905 94.7% 143,196 2,234 32,224 2,543 22,231 139 1,355,733
144,785 1,693,432 46,498 27,517 3,248 77,263 1,616,169 95.4% 126,645 10,498 56,186 3,650 158,104 103 1,654,941
4,550 111,274 2,683 2,137 195 5,016 106,258 95.5% 10,835 556 3,684 246 4,921 7 116,651 228 30,450 2,194 240 13 2,447 28,003 92.0% 1,213 1,746 1,650 102 — — 32,714
Treasurer's Relief Other Collections
121121121121llllll lllll121

Year-End Real Year-End Year-End Total Current Current PriorProperty Value Centr. Assessed Personal Year-End Property Centr. Assessed Property Real Centr. Assessed
After B.O.E. Property Value Property Value Value Tax Rate Tax Rate Tax Rate (1) Taxes Charged Taxes Charged
Liberty Cemetery Maint District................. 185,863,623 2,700,380 181,356 188,745,359 0.000045 0.000045 0.000051 8,364 122 Plain City Cemetery.................................... 283,990,241 17,626,333 1,614,002 303,230,576 0.000088 0.000088 0.000093 24,991 1,551 West Weber / Taylor Cemetery.................. 158,463,937 16,458,800 1,632,644 176,555,381 0.000086 0.000086 0.000090 13,628 1,415 Warren / W Warren Cemetery.................... 62,471,710 171,592,773 33,364,429 267,428,912 0.000127 0.000127 0.000121 7,934 21,792
PARK IMPROVEMENT DISTRICTSEden Park.................................................... — — — — 0.000000 0.000000 0.000000 32,980 — Weber Serv Area #5 Liberty Park............... 185,863,623 2,700,380 181,356 188,745,359 0.000154 0.000154 0.000177 28,623 416 West Warren Park District.......................... 39,616,977 162,530,151 28,870,296 231,017,424 0.000355 0.000355 0.000342 14,064 57,698
REDEVELOPMENT DISTRICTSNorth Ogden Redev C B D......................... 42,372,298 637,519 1,538,463 44,548,280 0.000000 0.000000 0.000000 508,830 — Ogden Redev Am Can #18......................... 35,497,024 274,794 732,958 36,504,776 0.000000 0.000000 0.000000 492,628 — Ogden Redev DDO #16.............................. 257,162,299 2,775,427 138,107,867 398,045,593 0.000000 0.000000 0.000000 5,249,489 — Ogden Redev Wall Ave #19........................ 21,001,863 212,703 5,726,612 26,941,178 0.000000 0.000000 0.000000 135,317 — Ogden Redev West 12th #20...................... 29,993,010 848,043 168,731,081 199,572,134 0.000000 0.000000 0.000000 1,949,492 — Ogden Redev 12 Street #10........................ 12,867,433 76,117 830,682 13,774,232 0.000000 0.000000 0.000000 167,605 — Ogden Redev 25th Street #2....................... 37,594,840 153,559 3,023,947 40,772,346 0.000000 0.000000 0.000000 672,448 — Ogden Redev C B D Mall #1...................... 69,710,141 458,048 7,672,088 77,840,277 0.000000 0.000000 0.000000 1,347,685 — Ogden Redev East Washington #2.............. 21,725,106 180,506 851,474 22,757,086 0.000000 0.000000 0.000000 48,716 — Ogden Redev Fairmount #15...................... 36,496,807 38,124 49,593,709 86,128,640 0.000000 0.000000 0.000000 1,237,748 — Ogden Redev Golden Links #8................... — 7,582 — 7,582 0.000000 0.000000 0.000000 715 — Ogden Redev Hinckley Eda #21................. 14,121,150 10,120 33,504,081 47,635,351 0.000000 0.000000 0.000000 312,948 — Ogden Redev Hinkley Airport #14............. 11,063,670 176,472 108,145 11,348,287 0.000000 0.000000 0.000000 161,993 — Ogden Redev Lester Park #7...................... 14,375,632 305,218 417,354 15,098,204 0.000000 0.000000 0.000000 92,828 — Ogden Redev Lincoln #12.......................... 39,048,069 66,953 422,013 39,537,035 0.000000 0.000000 0.000000 497,180 — Ogden Redev Ogden River #22.................. 16,785,052 248,491 2,019,817 19,053,360 0.000000 0.000000 0.000000 107,764 — Ogden Redev Park Blvd #9......................... 7,925,853 402,163 166,406 8,494,422 0.000000 0.000000 0.000000 63,045 — Ogden Redev So Wall EDA........................ 14,216,150 — 45,139 14,261,289 0.000000 0.000000 0.000000 31,914 — Ogden Redev South C B D #11.................. 9,098,513 162,534 1,195,467 10,456,514 0.000000 0.000000 0.000000 66,378 — Ogden Redev St Benedicts #4..................... 13,782,690 1,169,301 19,111 14,971,102 0.000000 0.000000 0.000000 220,810 — Ogden Redev Trackline EDC #26.............. 10,961,700 — 1,708,115 12,669,815 0.000000 0.000000 0.000000 23,429 — Ogden Redev Union Garden #5.................. 2,188,185 27,240 72,289 2,287,714 0.000000 0.000000 0.000000 25,858 — Ogden Redev Washington Blvd #6............. 37,527,610 12,841,238 1,855,363 52,224,211 0.000000 0.000000 0.000000 376,126 — Pleasant View Redev Bus Park................... 34,502,950 871,776 11,896,605 47,271,331 0.000000 0.000000 0.000000 264,963 — Riverdale Redev Riv Road Amend............. 51,818,711 390,192 4,233,009 56,441,912 0.000000 0.000000 0.000000 400,117 — Riverdale Redev 1050 West........................ 27,478,131 124,687 3,384,758 30,987,576 0.000000 0.000000 0.000000 274,791 — Riverdale Redev 550 West.......................... 31,196,024 98,334 4,821,497 36,115,855 0.000000 0.000000 0.000000 346,008 — Roy Redev #4 1900 West........................... 16,048,096 270,455 1,129,642 17,448,193 0.000000 0.000000 0.000000 — — Roy Redev New Iomega #2........................ 24,460,206 21,256 1,754,899 26,236,361 0.000000 0.000000 0.000000 269,534 — Roy Redev #3 City Center-Alb #................ 6,404,998 30,675 239,060 6,674,733 0.000000 0.000000 0.000000 41,114 — So Ogden Redev 36th Street....................... 10,769,574 112,181 1,414,169 12,295,924 0.000000 0.000000 0.000000 108,476 — So Ogden Redev Hinckley.......................... 3,588,926 19,220 670,415 4,278,561 0.000000 0.000000 0.000000 48,407 — So Ogden Redev Northwest........................ 39,808,830 197,515 3,306,265 43,312,610 0.000000 0.000000 0.000000 313,137 — So Ogden Redev Washington Blvd............. 3,214,202 512,890 324,339 4,051,431 0.000000 0.000000 0.000000 24,226 — Wash Terrace Redev C B D........................ 4,744,890 122,628 168,162 5,035,680 0.000000 0.000000 0.000000 26,440 — Wash Terrace Redev Southeast.................. 63,039,878 948,476 3,767,114 67,755,468 0.000000 0.000000 0.000000 592,087 — Weber County Redev GSL Mineral............ — 159,198,514 1,072,862 160,271,376 0.000000 0.000000 0.000000 1,085,609 — Weber County Redev Little Mount............. 3,602,742 26,023 2,051,773 5,680,538 0.000000 0.000000 0.000000 35,355 —
OTHER DISTRICTSNorth View Fire District............................. 1,399,736,020 32,359,606 49,727,650 1,481,823,276 0.001093 0.001093 0.001131 1,529,911 35,369 Ogden Vly Translator................................. — — — — 0.000000 0.000000 0.000000 74,304 — Unincorp Services Fund.............................. 1,459,733,841 248,800,686 121,173,961 1,829,708,488 0.000175 0.000175 0.000181 255,453 43,540 Weber Area 911 And Em Serv.................... 10,427,173,084 556,139,384 991,679,676 11,974,992,144 0.000303 0.000303 0.000310 3,159,433 168,510 Weber Fire District..................................... 2,934,388,619 307,003,848 192,062,267 3,433,454,734 0.001563 0.001563 0.001456 4,586,449 479,847 Weber Fire G.O. Bond-2006....................... 3,026,129,864 313,128,808 194,994,262 3,534,252,934 0.000105 0.000105 0.000112 317,744 32,879 Weber Fire Judgment Levy......................... 2,934,388,619 307,003,848 192,062,267 3,433,454,734 0.000006 0.000006 0.000000 17,606 1,842
184,821,305 7,944,078
122122122122llllll lllll122

Personal Total Tax IncrementProperty Taxes Unpaid Other Total Taxes Collection Misc. Delinquent Interest & Paid to Net Revenue
Taxes Charged Charged Taxes Abatements Relief Relief Collected Rate Fee-in-lieu Collections Taxes Penalty RDA's Refunds For Distribution
Treasurer's Relief Other Collections
9 8,495 327 91 2 420 8,075 95.1% 592 98 315 21 — — 9,101 150 26,692 633 596 18 1,247 25,446 95.3% 3,575 417 799 56 — — 30,293 147 15,190 213 293 13 520 14,671 96.6% 1,873 118 299 24 — — 16,985
4,037 33,763 621 93 (203) 511 33,252 98.5% 809 405 193 28 11,060 — 23,628
— 32,980 680 — — 680 32,300 97.9% — 13 960 — — — 33,273 32 29,071 1,118 312 7 1,436 27,635 95.1% 2,027 334 1,086 74 — — 31,156
9,874 81,636 1,434 90 (386) 1,138 80,498 98.6% 1,130 184 145 34 31,640 — 50,351
— 508,830 — — — — 508,830 100.0% — 202 — — — — 509,032 — 492,628 — — — — 492,628 100.0% — 196 — — — — 492,824 — 5,249,489 — — — — 5,249,489 100.0% — 2,084 — — — — 5,251,573 — 135,317 — — — — 135,317 100.0% — 54 — — — — 135,371 — 1,949,492 — — — — 1,949,492 100.0% — 774 — — — — 1,950,266 — 167,605 — — — — 167,605 100.0% — 67 — — — — 167,672 — 672,448 — — — — 672,448 100.0% — 267 — — — — 672,715 — 1,347,685 — — — — 1,347,685 100.0% — 535 — — — — 1,348,220 — 48,716 — — — — 48,716 100.0% — 19 — — — — 48,735 — 1,237,748 — — — — 1,237,748 100.0% — 491 — — — — 1,238,239 — 715 — — — — 715 100.0% — 0 — — — — 715 — 312,948 — — — — 312,948 100.0% — 124 — — — — 313,072 — 161,993 — — — — 161,993 100.0% — 64 — — — — 162,057 — 92,828 — — — — 92,828 100.0% — 37 — — — — 92,865 — 497,180 — — — — 497,180 100.0% — 197 — — — — 497,377 — 107,764 — — — — 107,764 100.0% — 43 — — — — 107,807 — 63,045 — — — — 63,045 100.0% — 25 — — — — 63,070 — 31,914 — — — — 31,914 100.0% — 13 — — — — 31,926 — 66,378 — — — — 66,378 100.0% — 26 — — — — 66,404 — 220,810 — — — — 220,810 100.0% — 88 — — — — 220,898 — 23,429 — — — — 23,429 100.0% — 83 — — — — 23,512 — 25,858 — — — — 25,858 100.0% — 10 — — — — 25,868 — 376,126 — — — — 376,126 100.0% — 149 — — — — 376,275 — 264,963 — — — — 264,963 100.0% — 105 — — — — 265,068 — 400,117 — — — — 400,117 100.0% — 159 — — — — 400,276 — 274,791 — — — — 274,791 100.0% — 109 — — — — 274,900 — 346,008 — — — — 346,008 100.0% — 137 — — — — 346,145 — — — — — — — 100.0% — — — — — — — — 269,534 — — — — 269,534 100.0% — 107 — — — — 269,641 — 41,114 — — — — 41,114 100.0% — 16 — — — — 41,130 — 108,476 — — — — 108,476 100.0% — 43 — — — — 108,519 — 48,407 — — — — 48,407 100.0% — 19 — — — — 48,427 — 313,137 — — — — 313,137 100.0% — 124 — — — — 313,261 — 24,226 — — — — 24,226 100.0% — 10 — — — — 24,236 — 26,440 — — — — 26,440 100.0% — 11 — — — — 26,451 — 592,087 — — — — 592,087 100.0% — 235 — — — — 592,322 — 1,085,609 — — — — 1,085,609 100.0% — 431 — — — — 1,086,040 — 35,355 — — — — 35,355 100.0% — 14 — — — — 35,369
56,242 1,621,522 40,732 30,629 1,750 73,111 1,548,411 95.5% 157,644 7,458 54,261 3,649 65,013 93 1,706,317 — 74,304 1,944 — — 1,944 72,360 97.4% — 30 2,121 — — — 74,511
21,932 320,926 12,500 2,907 689 16,095 304,831 95.0% 16,612 8,412 5,178 296 15,267 — 320,061 307,421 3,635,364 99,910 59,130 4,385 163,425 3,471,939 95.5% 272,152 21,717 120,521 7,918 338,636 218 3,555,393 279,643 5,345,939 186,972 81,905 (20,696) 248,181 5,097,758 95.4% 383,312 79,837 201,250 13,558 136,046 — 5,639,668 21,839 372,462 12,924 5,562 1,331 19,817 352,645 94.7% 26,222 5,057 16,876 1,125 9,167 — 392,757
— 19,448 717 313 4 1,033 18,415 94.7% — 349 — 11 511 — 18,264
16,264,833 209,030,215 5,335,455 2,888,958 20,619 8,245,032 200,785,183 13,323,480 979,431 6,174,617 966,103 17,621,203 11,623 204,595,988
123123123123llllll lllll123

WEBER COUNTY, UTAH
Schedule of Expenditures of Tourism Tax RevenuesFor the Year Ended December 31, 2014
Transient Room Taxes (TRT):$ 1,149,417
— 1,149,417
TRT used for: Establishing and promoting:
Tourism................................................................................. 240,000 Recreation.............................................................................. 179,765 Film production..................................................................... — Conventions........................................................................... 577,500
997,265 Acquiring, leasing, constructing, furnishing, or operating:
Convention meeting rooms.................................................... — Exhibit halls........................................................................... — Visitor information centers.................................................... — Museums............................................................................... — Related facilities - Golden Spike Events Center.................... 152,152
152,152 Total TRT Expenditures........................................................ 1,149,417 TRT Not Expended................................................................ $ —
Tourism, Recreation, Culture, and ConventionFacilities Taxes (TRCC): Restaurant Tax Car Rental Tax Total
$ 2,919,583 $ 401,156 $ 3,320,739
TRCC taxes used for:— — —
Development, operation, and maintenance of: — Tourist facilities..................................................................... — — — Recreation facilities - Golden Spike Events Center............... 830,748 48,310 879,058 Recreation facilities - Ice Sheet............................................. — 314,035 314,035 Convention facilities - Ogden Eccles Conference Center...... 2,088,835 38,811 2,127,646 Total TRCC Expenditures..................................................... 2,919,583 401,156 3,320,739 TRCC Taxes Not Expended................................................... $ — $ — $ —
Total TRT available..............................................................
Financing tourism promotion..................................................
TRCC tax revenue, total.............................................................
TRT revenue, current year..........................................................TRT unspent balance from prior year.........................................
124124124124llllll lllll124

Statistical Section
125125125125llllll lllll125

126126126126llllll lllll126

Statistical Section The Statistical Section provides additional historical context and detail to aid in using the information in Weber County’s financial statements and in understanding and assessing the County’s overall financial health. Financial Trends Information These schedules present trend information to help the reader understand how the County’s financial performance and fiscal health have changed over time. Net Position by Component .......................................................................................................... 128 Changes in Net Position ................................................................................................................ 130 Fund Balances – Governmental Funds .......................................................................................... 132 Changes in Fund Balances – Governmental Funds ....................................................................... 134 Revenue Capacity Information These schedules contain information to help the reader assess the County’s capacity to raise revenue from the County’s most significant revenue source, the property tax. Property Tax Levies and Collections ............................................................................................ 136 Assessed/Taxable and Estimated Market Value of Taxable Property ........................................... 137 Property Tax Rates – Direct and Overlapping Governments – All Taxing Districts..................... 138 Principal Property Taxpayers ........................................................................................................ 139 Debt Capacity Information These Schedules present information to help the reader understand and assess the County’s levels of outstanding debt and the County’s ability to issue additional debt in the future. Legal Debt Margin ........................................................................................................................ 140 Computation of Overlapping Debt ................................................................................................ 141 Ratios of Outstanding Debt to Personal Income, Assessed/Taxable Value, and Population ......... 142 Ratios of General Bonded Debt Outstanding ................................................................................ 144 Pledged Revenue Coverage ........................................................................................................... 145 Demographic and Economic Information These schedules present demographic and economic indicators to help the reader understand the environment within which the County’s financial activities take place. Demographic and Economic Indicators ........................................................................................ 146 Largest Employers ......................................................................................................................... 147 Operating Information These schedules offer operating data to help the reader understand how the information in the County’s financial report relates to the services it provides and the activities it performs. Full-Time Equivalent Employees by Function .............................................................................. 148 Operating Indicators by Function .................................................................................................. 149 Capital Asset Statistics by Function .............................................................................................. 150 Sources: Unless otherwise noted, the information in the following schedules is derived from Weber County’s
Comprehensive Annual Financial Reports for the years indicated.
127127127127llllll lllll127

WEBER COUNTY, UTAH
Net Position by ComponentLast Ten Years(Accrual Basis of Accounting)
2014 2013 2012 2011Governmental Activities:
Net Investment in Capital Assets........................ 120,865,911$ 102,390,851$ 99,641,750$ 97,108,067$ Restricted............................................................ 41,782,851 37,951,506 33,696,171 27,539,608 Unrestricted........................................................ 11,303,085 16,891,021 31,710,065 30,974,629 Total Governmental Activities Net Position....... 173,951,847 157,233,378 165,047,986 155,622,304
Business-type Activities:Net Investment in Capital Assets........................ 11,255,612 11,467,927 10,731,814 10,913,000 Restricted............................................................ — — — — Unrestricted........................................................ (1,515,699) (1,382,373) (957,416) (767,664) Total Business-type Activities Net Position....... 9,739,913 10,085,554 9,774,398 10,145,336
Primary Government:Net Investment in Capital Assets........................ 132,121,523 113,858,778 110,373,564 108,021,067 Restricted............................................................ 41,782,851 37,951,506 33,696,171 27,539,608 Unrestricted........................................................ 9,787,386 15,508,648 30,752,649 30,206,965 Total Primary Government Net Position............ 183,691,760$ 167,318,932$ 174,822,384$ 165,767,640$
Notes:
This schedule has been restated for prior period adjustments. Adjustments were made to the year andthe preceding year in which the prior period adjustment was identified.
128128128llllll lllll128

2010 2009 2008 2007 2006 2005
88,851,722$ 86,825,778$ 82,938,348$ 78,007,703$ 69,623,957$ 62,668,950$ 21,326,079 16,160,765 8,467,735 5,054,653 5,177,505 4,530,790 31,571,273 29,044,412 30,123,176 28,114,387 22,157,307 19,498,692
141,749,074 132,030,955 121,529,259 111,176,743 96,958,769 86,698,432
10,759,920 10,059,197 10,172,349 10,372,806 10,564,651 10,552,314 — — — — — —
(289,965) 344,136 45,298 (105,870) (695,156) (1,187,952) 10,469,955 10,403,333 10,217,647 10,266,936 9,869,495 9,364,362
99,611,642 96,884,975 93,110,697 88,380,509 80,188,608 73,221,264 21,326,079 16,160,765 8,467,735 5,054,653 5,177,505 4,530,790 31,281,308 29,388,548 30,168,474 28,008,517 21,462,151 18,310,740
152,219,029$ 142,434,288$ 131,746,906$ 121,443,679$ 106,828,264$ 96,062,794$
129129129llllll lllll129

WEBER COUNTY, UTAH
Changes in Net PositionLast Ten Years(Accrual Basis of Accounting)
2014 2013 2012 2011 2010Expenses Governmental Activities:
General Government.......................................................... 23,325,818$ 21,101,639$ 19,716,731$ 19,206,054$ 19,550,451$ Public Safety...................................................................... 38,167,752 38,541,683 36,684,282 36,589,205 36,590,131 Public Health and Welfare.................................................. 2,308,236 12,760,881 12,417,188 12,005,753 12,422,986 Library Services (1)............................................................ 8,028,348 8,239,781 7,490,927 7,143,563 6,904,249 Streets and Public Improvements....................................... 23,052,288 9,452,096 4,650,596 4,020,977 4,127,677 Parks, Recreation and Public Facilities............................... 14,084,346 15,230,970 13,890,816 12,498,538 12,715,072 Conservation and Development......................................... 5,141,561 1,212,147 1,605,418 1,621,585 1,258,224 Interest on Long-term Debt................................................ 3,652,642 2,244,962 2,017,567 2,213,703 2,332,079
117,760,991 108,784,159 98,473,525 95,299,378 95,900,869 Business-type Activities:
Solid Waste Transfer Station.............................................. 7,891,674 8,426,666 7,647,156 7,386,910 7,373,790 Landfill Gas Recovery........................................................ 232,629 329,018 286,223 355,405 292,380 Animal Shelter (2).............................................................. 735,957 — — — —
8,860,260 8,755,684 7,933,379 7,742,315 7,666,170 126,621,251 117,539,843 106,406,904 103,041,693 103,567,039
Program RevenuesGovernmental Activities:
Charges for Services: Jail.................................................................................... 8,436,396 9,223,039 8,877,843 9,724,212 9,586,832 Parks and Recreation........................................................ 3,821,459 3,640,911 3,251,353 3,803,453 3,897,272 Vehicle Registrations ...................................................... 2,907,886 2,190,466 3,045,276 3,679,157 3,739,585 MBA................................................................................ 2,948,941 3,031,941 3,042,594 2,981,363 2,885,622 Sheriff Contracts.............................................................. 4,330,786 3,324,468 2,257,462 2,176,900 2,229,088 Municipal Services........................................................... 427,836 314,270 438,178 718,148 729,046 Health Department (3)..................................................... — 1,928,191 1,898,125 1,745,839 1,958,690 Recorder Fees................................................................... 886,138 1,092,944 1,019,738 906,664 1,080,357 Other Activities................................................................ 6,804,228 9,034,618 7,258,217 5,536,108 5,291,924 Operating Grants and Contributions................................... 5,995,310 13,866,471 10,710,272 10,356,405 10,174,749 Capital Grants and Contributions....................................... 12,319,747 576,865 1,163,402 2,805,682 793,262
48,878,727 48,224,184 42,962,460 44,433,931 42,366,427 Business type Activities:
Charges for Services:Solid Waste Transfer Station.............................................. 7,402,317 7,175,587 7,320,168 7,188,658 7,577,985 Landfill Gas Recovery........................................................ 197,888 212,749 238,529 224,046 149,019 Animal Shelter (2).............................................................. 748,702 — — — —
8,348,907 7,388,336 7,558,697 7,412,704 7,727,004 57,227,634 55,612,520 50,521,157 51,846,635 50,093,431
Net (Expense)/RevenueGovernmental Activities..................................................... (68,882,264) (60,559,975) (55,511,065) (50,865,447) (53,534,442) Business-type Activities..................................................... (511,353) (1,367,348) (374,682) (329,611) 60,834
(69,393,617) (61,927,323) (55,885,747) (51,195,058) (53,473,608)
General Revenues and Other Changes in Net PositionGovernmental Activities:
Taxes:Current Property Taxes................................................... 38,942,988 36,057,092 37,455,557 37,924,844 37,545,879 Sales and Franchise Taxes............................................... 41,331,850 24,003,012 22,809,826 21,927,372 21,498,663 Other Property Taxes...................................................... 4,458,714 4,523,035 4,287,281 4,230,597 3,780,346
Unrestricted Investment Income........................................ 553,290 303,444 384,083 228,930 180,882 Gain on Sale of Capital Assets........................................... 81,446 163,390 — 426,934 246,791 Miscellaneous..................................................................... 232,445 — — — —
85,600,733 65,049,973 64,936,747 64,738,677 63,252,561 Business-type Activities:
Unrestricted Investment Income........................................ 134 1,638 3,744 4,992 5,788 Gain on Sale of Capital Assets........................................... — — — — — Special Item - Change in Post-Closure Liability................ — — — — — Special Item - Insurance and Capital Contributions........... — 1,710,607 — — — Special Item - Change in OPEB......................................... 165,578 — — — —
165,712 1,712,245 3,744 4,992 5,788 85,766,445 66,762,218 64,940,491 64,743,669 63,258,349
Change in Net PositionGovernmental Activities..................................................... 16,718,469 4,489,998 9,425,682 13,873,230 9,718,119 Business-type Activities..................................................... (345,641) 344,897 (370,938) (324,619) 66,622 Total Primary Government................................................. 16,372,828$ 4,834,895$ 9,054,744$ 13,548,611$ 9,784,741$
Notes:(1) Prior to 2008, Library Services was reported in the Parks, Recreation and Public Facilities function.(2) Prior 2014, the Animal Sherlter was reported in the Public Saftey function.(3) In 2014, the Health Department was reclassified as a Component Unit.
Total Business-type Activities ..............................................Total Primary Government General Revenues......................
Total Governmental Activities Program Revenues................
Total Business-type Activities Program Revenues................Total Primary Government Program Revenues.....................
Total Primary Government Net (Expense)/Revenue.............
Total Governmental Activities Expenses...............................
Total Business-type Activities Expenses...............................Total Primary Government Expenses....................................
Total Governmental Activities..............................................
130130130llllll lllll130

2009 2008 2007 2006 2005
19,248,682$ 19,311,337$ 18,349,613$ 18,543,698$ 17,775,010$ 37,070,989 36,878,442 35,362,909 33,109,170 32,415,287 12,397,501 11,770,507 11,729,306 10,302,672 7,161,755
6,886,132 6,108,538 — — — 3,772,375 3,848,549 3,621,735 3,304,751 1,844,030
13,225,778 14,095,771 19,050,351 16,000,219 12,897,853 1,250,923 1,003,951 918,690 779,637 513,690 2,560,139 2,809,919 2,866,544 3,185,272 3,315,425
96,412,519 95,827,014 91,899,148 85,225,419 75,923,050
7,672,422 7,614,348 6,756,791 6,354,498 6,441,936 314,304 305,118 306,168 383,895 342,688
— — — — — 7,986,726 7,919,466 7,062,959 6,738,393 6,784,624
104,399,245 103,746,480 98,962,107 91,963,812 82,707,674
10,694,208 10,386,647 10,009,537 9,256,884 9,498,877 4,092,505 5,389,176 4,523,047 1,831,218 1,843,303 4,371,873 4,575,667 3,710,312 4,179,091 4,361,117 2,822,569 3,324,848 3,463,422 3,346,070 3,350,091 2,801,198 2,087,661 2,313,059 2,137,035 1,975,716 1,323,410 1,260,717 1,670,381 1,332,733 1,380,390 1,980,633 1,993,925 1,972,604 1,827,630 1,597,653 1,291,645 1,273,144 1,450,140 1,478,782 1,403,043 4,665,820 3,651,368 5,994,649 6,079,357 6,022,018 9,933,008 9,883,616 10,451,305 8,642,814 5,979,208
570,993 1,389,074 4,617,237 3,158,234 161,741 44,547,862 45,215,843 50,175,693 43,269,848 37,573,157
7,873,935 7,514,193 7,306,838 7,158,900 6,784,518 256,936 324,332 83,732 53,805 104,984
— — — — — 8,130,871 7,838,525 7,390,570 7,212,705 6,889,502
52,678,733 53,054,368 57,566,263 50,482,553 44,462,659
(51,864,657) (50,611,171) (41,723,455) (41,955,571) (38,349,893) 144,145 (80,941) 327,611 474,312 104,878
(51,720,512) (50,692,112) (41,395,844) (41,481,259) (38,245,015)
37,365,012 35,416,819 33,494,988 31,594,352 28,232,630 20,906,185 21,224,598 18,395,695 17,061,466 14,234,955
3,767,268 3,551,985 2,935,615 2,894,007 4,444,197 222,303 755,734 689,899 610,966 422,384 105,585 14,551 425,232 55,117 32,060
— — — — — 62,366,353 60,963,687 55,941,429 52,215,908 47,366,226
41,541 31,652 55,580 30,821 2,894 — — 14,250 — — — — — — 1,528,885 — — — — — — — — — —
41,541 31,652 69,830 30,821 1,531,779 62,407,894 60,995,339 56,011,259 52,246,729 48,898,005
10,501,696 10,352,516 14,217,974 10,260,337 9,016,333 185,686 (49,289) 397,441 505,133 1,636,657
10,687,382$ 10,303,227$ 14,615,415$ 10,765,470$ 10,652,990$
131131131llllll lllll131
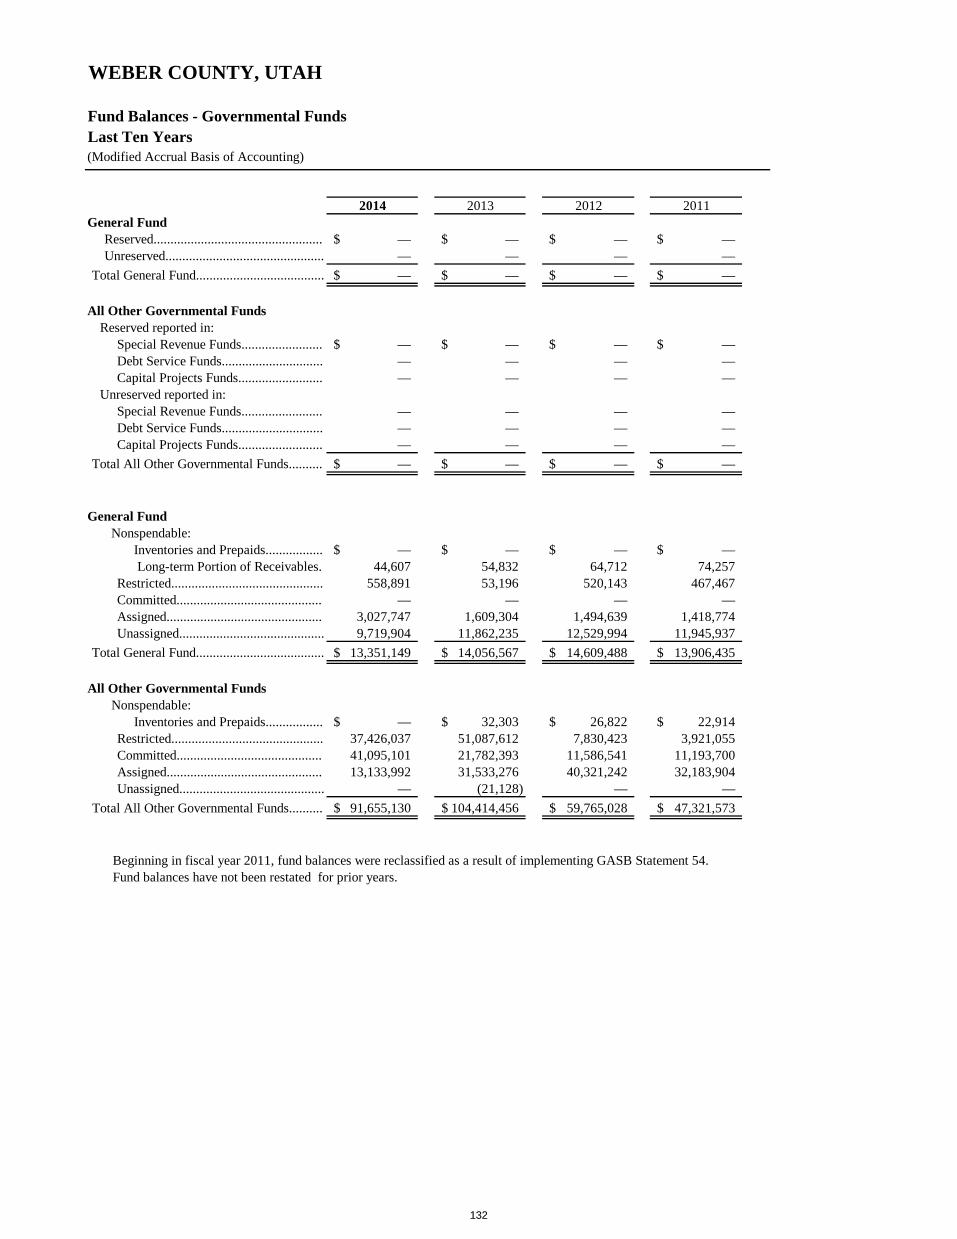
WEBER COUNTY, UTAH
Fund Balances - Governmental FundsLast Ten Years(Modified Accrual Basis of Accounting)
2014 2013 2012 2011General Fund
—$ —$ —$ —$ — — — — —$ —$ —$ —$
All Other Governmental FundsReserved reported in:
Special Revenue Funds........................ —$ —$ —$ —$ Debt Service Funds.............................. — — — — Capital Projects Funds......................... — — — —
Unreserved reported in:Special Revenue Funds........................ — — — — Debt Service Funds.............................. — — — — Capital Projects Funds......................... — — — —
—$ —$ —$ —$
General Fund Nonspendable:
Inventories and Prepaids................. —$ —$ —$ —$ Long-term Portion of Receivables. 44,607 54,832 64,712 74,257 Restricted............................................. 558,891 53,196 520,143 467,467 Committed........................................... — — — — Assigned.............................................. 3,027,747 1,609,304 1,494,639 1,418,774 Unassigned........................................... 9,719,904 11,862,235 12,529,994 11,945,937
13,351,149$ 14,056,567$ 14,609,488$ 13,906,435$
All Other Governmental Funds Nonspendable:
Inventories and Prepaids................. —$ 32,303$ 26,822$ 22,914$ Restricted............................................. 37,426,037 51,087,612 7,830,423 3,921,055 Committed........................................... 41,095,101 21,782,393 11,586,541 11,193,700 Assigned.............................................. 13,133,992 31,533,276 40,321,242 32,183,904 Unassigned........................................... — (21,128) — —
91,655,130$ 104,414,456$ 59,765,028$ 47,321,573$
Beginning in fiscal year 2011, fund balances were reclassified as a result of implementing GASB Statement 54.Fund balances have not been restated for prior years.
Total All Other Governmental Funds..........
Total All Other Governmental Funds..........
Reserved..................................................Unreserved...............................................
Total General Fund......................................
Total General Fund......................................
132132132llllll lllll132

2010 2009 2008 2007 2006 2005
471,488$ 440,154$ 489,008$ 437,002$ 2,435,020$ 4,689,704$ 13,374,214 13,510,676 12,996,459 12,292,915 8,727,126 7,946,812 13,845,702$ 13,950,830$ 13,485,467$ 12,729,917$ 11,162,146$ 12,636,516$
5,308,773$ 4,115,346$ 4,486,375$ 4,445,621$ 4,909,764$ 3,245,147$ — 3,175,268 350,605 — 1,501,458 1,723,209
164,319 60,567 64,892 7,199,809 9,300,760 1,085,645
31,416,159 25,881,787 20,279,872 16,266,038 13,173,754 8,851,922 2,608,947 (596,062) 1,955,069 2,127,870 448,867 201,674 1,990,765 2,283,295 1,854,704 922,929 757,929 419,047
41,488,963$ 34,920,201$ 28,991,517$ 30,962,267$ 30,092,532$ 15,526,644$
—$ —$ —$ —$ —$ —$ — — — — — — — — — — — — — — — — — — — — — — — — — — — — — — —$ —$ —$ —$ —$ —$
—$ —$ —$ —$ —$ —$ — — — — — — — — — — — — — — — — — — — — — — — — —$ —$ —$ —$ —$ —$
133133133llllll lllll133

WEBER COUNTY, UTAH
Changes in Fund Balances - Governmental FundsLast Ten Years(Modified Accrual Basis of Accounting)
2014 2013 2012 2011Revenues
Taxes:Current Property Taxes.................................................. 37,741,491$ 34,732,358$ 36,041,297$ 36,213,017$ General Sales Taxes....................................................... 11,840,368 11,277,993 10,740,701 10,250,993 Transportation Sales Taxes............................................ 21,842,746 5,618,167 5,313,007 5,087,205 Tourism Related Sales Taxes......................................... 4,470,156 4,110,476 3,919,224 3,837,183 RAMP Sales Tax............................................................ 3,178,580 2,996,376 2,836,894 2,715,847 Franchise Tax................................................................. — — — 36,144 Delinquent Property Taxes............................................. 1,784,179 2,747,161 2,585,052 2,582,713 Assessing and Collecting Property Taxes....................... 4,307,197 3,894,487 3,871,971 3,852,032 Total Taxes................................................................ 85,164,717 65,377,018 65,308,146 64,575,134
Other Revenues:Licenses, Permits, and Fees............................................ 4,029,418 3,777,832 3,855,113 3,993,359 Intergovernmental.......................................................... 15,580,856 14,360,916 11,544,120 10,541,674 Charges for Services...................................................... 24,656,070 26,850,409 25,587,555 25,677,040 Fines and Forfeitures...................................................... 410,809 467,083 453,733 452,557 Miscellaneous................................................................ 2,372,477 2,964,370 1,723,585 1,294,061 Total Revenues.......................................................... 132,214,347 113,797,628 108,472,252 106,533,825
ExpendituresGeneral Government...................................................... 21,638,717 19,814,571 18,466,242 18,408,527 Public Safety.................................................................. 36,263,906 36,676,757 35,196,329 35,328,382 Public Health and Welfare............................................. 2,005,021 12,249,697 12,068,185 11,578,591 Library Services............................................................. 7,435,355 7,696,146 7,100,335 6,861,366 Streets and Public Improvements................................... 22,397,976 8,838,648 3,978,440 2,997,463 Parks, Recreation, and Public Facilities......................... 12,263,860 13,790,907 12,247,342 10,953,059 Conservation and Development..................................... 5,135,914 1,206,545 1,592,209 1,615,728 Capital Outlay................................................................ 27,983,613 15,354,955 1,677,261 4,373,788 Debt Service: Principal....................................................................... 4,840,501 4,530,000 4,165,000 5,416,207 Interest and Other Charges........................................... 2,931,341 2,950,137 1,925,629 2,071,074 Payment to Refunding Escrow..................................... — — — — Total Expenditures.................................................... 142,896,204 123,108,363 98,416,972 99,604,185
Revenues Over (Under) Expenditures ........................... (10,681,857) (9,310,735) 10,055,280 6,929,640
Other Financing Sources (Uses)Capital Lease Financing................................................. 9,813 44,796 16,048 — Bonds Issued.................................................................. — 50,560,000 3,935,000 — Refunding Bonds Issued................................................ 7,021,629 6,590,000 2,520,000 — Premium on Bonds Issued.............................................. — 3,335,279 251,700 — Payment to Refunding Escrow....................................... (8,714,805) (7,052,000) (2,591,248) — Sale of Capital Assets.................................................... — 13,683 29,288 5,280 Transfer In...................................................................... 9,090,918 10,508,332 5,241,770 8,141,863 Transfer Out................................................................... (8,858,473) (10,592,848) (6,311,330) (9,183,440) Total Other Financing Sources (Uses)...................... (1,450,918) 53,407,242 3,091,228 (1,036,297)
Net change in Fund Balances......................................... (12,132,775) 44,096,507 13,146,508 5,893,343
118,471,023 74,374,516 61,228,008 55,334,665 (1,331,969) — — —
Fund Balance - Adjusted 117,139,054 74,374,516 61,228,008 55,334,665 105,006,279$ 118,471,023$ 74,374,516$ 61,228,008$
6.8% 7.0% 6.4% 7.9%
Fund Balance - Beginning.....................................................Audjustments to Beginning Fund Balance........................
Fund Balance - Ending..........................................................
Debt Service as a percentage of noncapital expenditures......
134134134llllll lllll134

2010 2009 2008 2007 2006 2005
35,311,470$ 34,975,504$ 33,064,224$ 31,680,683$ 29,955,129$ 28,080,969$ 10,141,572 9,487,533 10,565,867 11,373,152 10,802,281 9,332,174
4,974,646 5,100,282 4,072,048 — — — 3,685,538 3,551,526 3,665,958 3,575,335 3,050,347 2,699,108 2,661,341 2,734,945 2,898,662 3,426,243 3,189,008 2,185,369
35,566 31,899 22,063 20,965 19,830 18,304 2,013,850 2,087,624 1,731,329 1,786,519 1,579,237 1,383,518 3,635,623 3,519,166 3,272,228 2,786,491 2,670,077 3,060,679
62,459,606 61,488,479 59,292,379 54,649,388 51,265,909 46,760,121
4,245,402 4,449,517 4,779,168 4,795,242 4,839,867 5,008,032 10,534,623 10,404,271 9,712,702 10,704,489 8,777,824 5,926,327 25,533,010 27,425,238 26,604,388 27,566,868 24,273,196 24,013,256
618,587 986,730 1,126,795 1,335,796 1,370,328 1,578,020 1,156,455 1,399,027 2,543,186 2,660,133 1,891,380 1,391,226
104,547,683 106,153,262 104,058,618 101,711,916 92,418,504 84,676,982
18,608,275 18,360,006 18,802,518 17,815,493 18,099,654 17,306,327 35,054,042 35,672,777 35,401,934 34,354,044 32,414,738 32,215,419 12,195,386 12,028,652 11,441,992 11,437,229 10,033,265 6,980,375
6,706,243 6,491,538 6,285,918 5,487,761 5,532,522 5,391,749 3,464,983 3,432,939 3,303,173 3,165,330 2,870,682 2,953,937
11,233,976 11,845,430 12,647,504 11,934,490 9,062,922 6,155,270 1,258,752 1,252,351 989,872 922,420 771,831 515,295 3,739,012 2,696,896 9,213,391 3,126,114 991,570 2,213,079
5,518,279 5,262,586 4,703,638 4,946,384 3,964,776 3,565,000 2,215,783 2,515,806 2,682,413 2,925,457 3,158,930 3,184,649
— 366,048 — 134,865 — 365,995 99,994,731 99,925,029 105,472,353 96,249,587 86,900,890 80,847,095
4,552,952 6,228,233 (1,413,735) 5,462,329 5,517,614 3,829,887
— 259,767 159,494 179,538 214,356 — 3,245,000 — — — 6,950,000 —
— 22,650,000 — 26,523,000 — 6,775,000 22,502 609,676 — — 399,265 149,567
— (23,169,000) — (26,523,000) — (7,459,898) 4,059 42,345 39,041 545,639 10,283 3,337
3,309,699 6,303,621 5,674,120 2,906,609 10,295,909 5,627,277 (4,670,578) (6,530,595) (5,674,120) (6,656,609) (10,295,909) (5,625,618) 1,910,682 165,814 198,535 (3,024,823) 7,573,904 (530,335)
6,463,634 6,394,047 (1,215,200) 2,437,506 13,091,518 3,299,552
48,871,031 42,476,984 43,692,184 41,254,678 28,163,160 24,863,608 — — — — — —
48,871,031 42,476,984 43,692,184 41,254,678 28,163,160 24,863,608 55,334,665$ 48,871,031$ 42,476,984$ 43,692,184$ 41,254,678$ 28,163,160$
8.1% 8.5% 7.8% 9.5% 9.2% 10.1%
135135135llllll lllll135

WEBER COUNTY, UTAH
Property Tax Levies and CollectionsLast Ten Years
Charges Less: Collections PercentCurrent Abated Net Current Current Collections
Year and Taxes to be Year Year Levy in Subsequent Percentage Year Levy (1) Appeals Collected Levy Collected Years (2) (3) Amount of Levy
2014 45,588,559$ 623,787$ 44,964,771$ 43,655,955$ 95.76% —$ 43,655,955$ 95.76%
2013 40,357,897 (669,970) 39,687,927 38,219,812 94.70% 993,460 39,213,272 97.16%
2012 41,759,811 (682,709) 41,077,102 39,493,176 94.57% 1,333,368 40,826,544 97.77%
2011 42,203,787 (669,336) 41,534,451 39,638,600 93.92% 1,764,510 41,403,110 98.10%
2010 41,698,961 (622,784) 41,076,177 38,493,254 92.31% 2,534,718 41,027,972 98.39%
2009 40,951,757 (584,761) 40,366,996 37,778,592 92.25% 2,575,418 40,354,010 98.54%
2008 38,939,360 (526,494) 38,412,866 35,787,462 91.91% 2,617,802 38,405,264 98.63%
2007 36,423,545 (458,748) 35,964,797 33,837,515 92.90% 2,126,622 35,964,137 98.74%
2006 34,260,845 (317,650) 33,943,195 32,140,832 93.81% 1,801,866 33,942,698 99.07%
2005 32,543,686 (342,121) 32,201,565 30,572,237 93.94% 1,628,913 32,201,150 98.95%
Notes:(1) Current year levy includes redevelopment agencies' valuations.(2) Delinquent taxes collected do not include interest and penalty received.(3) Subsequent collections do not include appeals and abatements in subsequent years.
Source: Weber County Treasurer
Total Collections to Date
136136136llllll lllll136

WEBER COUNTY, UTAH
Assessed / Taxable and Estimated Market Value of Taxable PropertyLast Ten Years
Ratio ofState Assessed /
Buildings Centrally Total Estimated Taxable toand Personal Assessed Direct Market Estimated
Year Real Estate Improvements Property Property Total Tax Rate Value Market Value
2014 3,003,838,340$ 7,423,334,744$ 991,679,676$ 556,139,384$ 11,974,992,144$ 0.003409 15,852,922,055$ 75.5%
2013 2,994,023,774 7,013,483,544 1,012,241,958 547,280,566 11,567,029,842 0.003719 16,741,640,705 69.1%
2012 3,026,573,743 6,737,042,978 955,865,773 535,237,042 11,254,719,536 0.003966 17,966,655,944 62.6%
2011 3,137,491,521 6,933,867,347 939,442,018 508,889,595 11,519,690,481 0.003916 18,433,254,359 62.5%
2010 3,288,924,764 6,888,156,852 1,012,212,458 456,154,228 11,645,448,302 0.003832 18,748,560,971 62.1%
2009 3,789,588,360 7,104,738,471 1,000,250,151 387,512,054 12,282,089,036 0.003560 20,007,438,628 61.4%
2008 3,840,792,004 6,797,715,296 956,313,652 370,819,346 11,965,640,298 0.003447 19,678,956,447 60.8%
2007 3,125,667,664 6,322,813,525 812,541,417 340,005,164 10,601,027,770 0.003608 17,072,115,297 62.1%
2006 2,328,145,239 5,532,376,378 726,439,391 328,127,182 8,915,088,190 0.004063 14,365,081,710 62.1%
2005 2,026,907,506 5,131,777,452 723,943,908 328,279,574 8,210,908,440 0.004284 12,758,721,589 64.4%
Source: Weber County Clerk / Auditor Weber County Assessor
137137137llllll lllll137
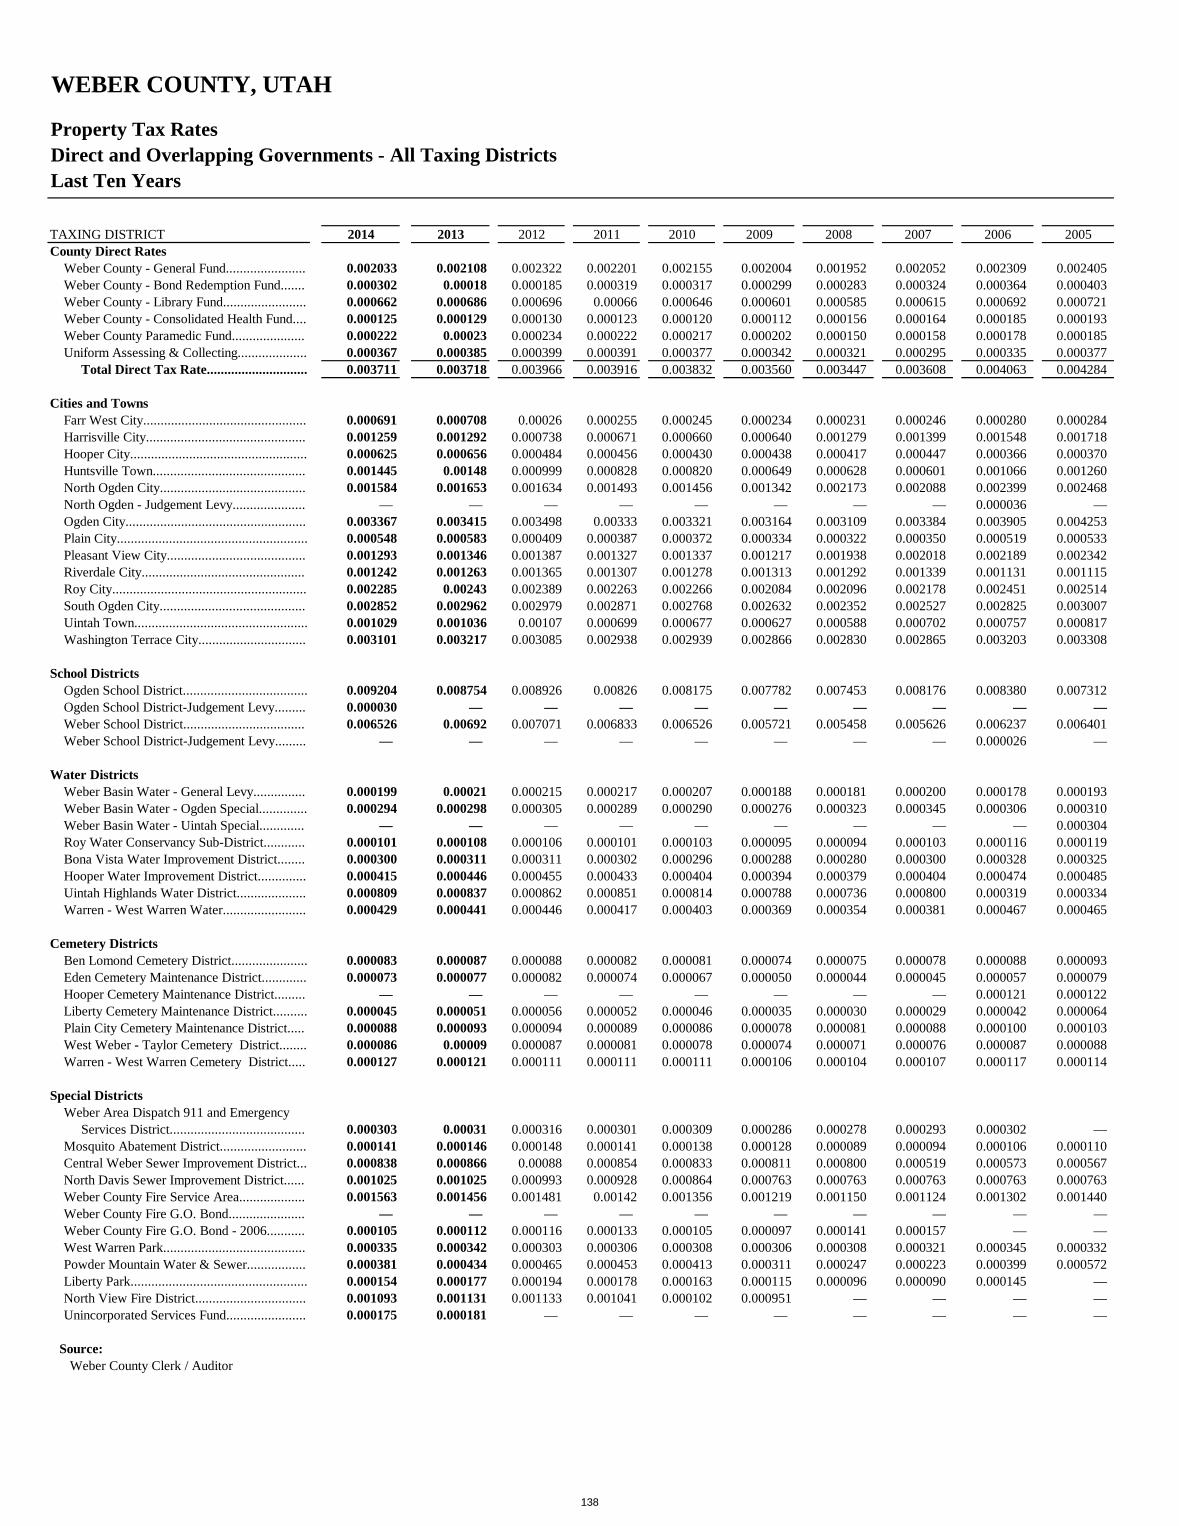
WEBER COUNTY, UTAH
Property Tax RatesDirect and Overlapping Governments - All Taxing DistrictsLast Ten Years
TAXING DISTRICT 2014 2013 2012 2011 2010 2009 2008 2007 2006 2005County Direct Rates
Weber County - General Fund....................... 0.002033 0.002108 0.002322 0.002201 0.002155 0.002004 0.001952 0.002052 0.002309 0.002405 Weber County - Bond Redemption Fund....... 0.000302 0.00018 0.000185 0.000319 0.000317 0.000299 0.000283 0.000324 0.000364 0.000403 Weber County - Library Fund........................ 0.000662 0.000686 0.000696 0.00066 0.000646 0.000601 0.000585 0.000615 0.000692 0.000721 Weber County - Consolidated Health Fund.... 0.000125 0.000129 0.000130 0.000123 0.000120 0.000112 0.000156 0.000164 0.000185 0.000193 Weber County Paramedic Fund..................... 0.000222 0.00023 0.000234 0.000222 0.000217 0.000202 0.000150 0.000158 0.000178 0.000185 Uniform Assessing & Collecting.................... 0.000367 0.000385 0.000399 0.000391 0.000377 0.000342 0.000321 0.000295 0.000335 0.000377 Total Direct Tax Rate............................. 0.003711 0.003718 0.003966 0.003916 0.003832 0.003560 0.003447 0.003608 0.004063 0.004284
Cities and TownsFarr West City............................................... 0.000691 0.000708 0.00026 0.000255 0.000245 0.000234 0.000231 0.000246 0.000280 0.000284 Harrisville City.............................................. 0.001259 0.001292 0.000738 0.000671 0.000660 0.000640 0.001279 0.001399 0.001548 0.001718 Hooper City................................................... 0.000625 0.000656 0.000484 0.000456 0.000430 0.000438 0.000417 0.000447 0.000366 0.000370 Huntsville Town............................................ 0.001445 0.00148 0.000999 0.000828 0.000820 0.000649 0.000628 0.000601 0.001066 0.001260 North Ogden City.......................................... 0.001584 0.001653 0.001634 0.001493 0.001456 0.001342 0.002173 0.002088 0.002399 0.002468 North Ogden - Judgement Levy..................... — — — — — — — — 0.000036 — Ogden City.................................................... 0.003367 0.003415 0.003498 0.00333 0.003321 0.003164 0.003109 0.003384 0.003905 0.004253 Plain City....................................................... 0.000548 0.000583 0.000409 0.000387 0.000372 0.000334 0.000322 0.000350 0.000519 0.000533 Pleasant View City........................................ 0.001293 0.001346 0.001387 0.001327 0.001337 0.001217 0.001938 0.002018 0.002189 0.002342 Riverdale City............................................... 0.001242 0.001263 0.001365 0.001307 0.001278 0.001313 0.001292 0.001339 0.001131 0.001115 Roy City........................................................ 0.002285 0.00243 0.002389 0.002263 0.002266 0.002084 0.002096 0.002178 0.002451 0.002514 South Ogden City.......................................... 0.002852 0.002962 0.002979 0.002871 0.002768 0.002632 0.002352 0.002527 0.002825 0.003007 Uintah Town.................................................. 0.001029 0.001036 0.00107 0.000699 0.000677 0.000627 0.000588 0.000702 0.000757 0.000817 Washington Terrace City............................... 0.003101 0.003217 0.003085 0.002938 0.002939 0.002866 0.002830 0.002865 0.003203 0.003308
School DistrictsOgden School District.................................... 0.009204 0.008754 0.008926 0.00826 0.008175 0.007782 0.007453 0.008176 0.008380 0.007312 Ogden School District-Judgement Levy......... 0.000030 — — — — — — — — — Weber School District................................... 0.006526 0.00692 0.007071 0.006833 0.006526 0.005721 0.005458 0.005626 0.006237 0.006401 Weber School District-Judgement Levy......... — — — — — — — — 0.000026 —
Water DistrictsWeber Basin Water - General Levy............... 0.000199 0.00021 0.000215 0.000217 0.000207 0.000188 0.000181 0.000200 0.000178 0.000193 Weber Basin Water - Ogden Special.............. 0.000294 0.000298 0.000305 0.000289 0.000290 0.000276 0.000323 0.000345 0.000306 0.000310 Weber Basin Water - Uintah Special............. — — — — — — — — — 0.000304 Roy Water Conservancy Sub-District............ 0.000101 0.000108 0.000106 0.000101 0.000103 0.000095 0.000094 0.000103 0.000116 0.000119 Bona Vista Water Improvement District........ 0.000300 0.000311 0.000311 0.000302 0.000296 0.000288 0.000280 0.000300 0.000328 0.000325 Hooper Water Improvement District.............. 0.000415 0.000446 0.000455 0.000433 0.000404 0.000394 0.000379 0.000404 0.000474 0.000485 Uintah Highlands Water District.................... 0.000809 0.000837 0.000862 0.000851 0.000814 0.000788 0.000736 0.000800 0.000319 0.000334 Warren - West Warren Water........................ 0.000429 0.000441 0.000446 0.000417 0.000403 0.000369 0.000354 0.000381 0.000467 0.000465
Cemetery DistrictsBen Lomond Cemetery District...................... 0.000083 0.000087 0.000088 0.000082 0.000081 0.000074 0.000075 0.000078 0.000088 0.000093 Eden Cemetery Maintenance District............. 0.000073 0.000077 0.000082 0.000074 0.000067 0.000050 0.000044 0.000045 0.000057 0.000079 Hooper Cemetery Maintenance District......... — — — — — — — — 0.000121 0.000122 Liberty Cemetery Maintenance District.......... 0.000045 0.000051 0.000056 0.000052 0.000046 0.000035 0.000030 0.000029 0.000042 0.000064 Plain City Cemetery Maintenance District..... 0.000088 0.000093 0.000094 0.000089 0.000086 0.000078 0.000081 0.000088 0.000100 0.000103 West Weber - Taylor Cemetery District........ 0.000086 0.00009 0.000087 0.000081 0.000078 0.000074 0.000071 0.000076 0.000087 0.000088 Warren - West Warren Cemetery District..... 0.000127 0.000121 0.000111 0.000111 0.000111 0.000106 0.000104 0.000107 0.000117 0.000114
Special DistrictsWeber Area Dispatch 911 and Emergency Services District....................................... 0.000303 0.00031 0.000316 0.000301 0.000309 0.000286 0.000278 0.000293 0.000302 — Mosquito Abatement District......................... 0.000141 0.000146 0.000148 0.000141 0.000138 0.000128 0.000089 0.000094 0.000106 0.000110 Central Weber Sewer Improvement District... 0.000838 0.000866 0.00088 0.000854 0.000833 0.000811 0.000800 0.000519 0.000573 0.000567 North Davis Sewer Improvement District...... 0.001025 0.001025 0.000993 0.000928 0.000864 0.000763 0.000763 0.000763 0.000763 0.000763 Weber County Fire Service Area................... 0.001563 0.001456 0.001481 0.00142 0.001356 0.001219 0.001150 0.001124 0.001302 0.001440 Weber County Fire G.O. Bond...................... — — — — — — — — — — Weber County Fire G.O. Bond - 2006........... 0.000105 0.000112 0.000116 0.000133 0.000105 0.000097 0.000141 0.000157 — — West Warren Park......................................... 0.000335 0.000342 0.000303 0.000306 0.000308 0.000306 0.000308 0.000321 0.000345 0.000332 Powder Mountain Water & Sewer................. 0.000381 0.000434 0.000465 0.000453 0.000413 0.000311 0.000247 0.000223 0.000399 0.000572 Liberty Park................................................... 0.000154 0.000177 0.000194 0.000178 0.000163 0.000115 0.000096 0.000090 0.000145 — North View Fire District................................ 0.001093 0.001131 0.001133 0.001041 0.000102 0.000951 — — — — Unincorporated Services Fund....................... 0.000175 0.000181 — — — — — — — —
Source: Weber County Clerk / Auditor
138138138llllll lllll138

WEBER COUNTY, UTAH
Principal Property TaxpayersFor 2014 and Ten Years Previous
2014 2005% of % of
Assessed / County Assessed / CountyPrincipal Nature Taxable Taxable Taxable Taxable
Taxpayer of Business Rank Value (1) (2) Value Rank Value ValueBoyer Corporation........................................... Construction/Real Estate 1 245,264,342$ 2.0% 1 131,260,201 1.6%Fresenius Medical Care................................... Manufacturing 2 196,458,401 1.6% 3 83,465,649 1.0%Pacificorp........................................................ Utility/Electrical 3 169,429,046 1.4% 2 103,729,878 1.3%Great Salt Lake Minerals................................. Mining 4 158,875,596 1.3% 10 36,640,581 0.4%IHC Health Services/McKay Dee................... Medical Services/Hospitals 5 92,363,992 0.8% — — Questar Gas..................................................... Utility/Natural Gas 6 71,328,506 0.6% 9 41,623,488 0.5%Kimberly-Clark................................................ Manufacturing 7 63,213,446 0.5% 8 43,313,707 0.5%Autoliv ASP.................................................... Manufacturing 8 58,619,708 0.5% 5 57,040,925 0.7%General Growth Properties.............................. Real Estate 9 53,053,693 0.4% — — Union Pacific Railroad.................................... Rail Transportation 10 51,840,369 0.4% — — Qwest............................................................... Utility/Communications — — 4 75,017,893 0.9%Williams International Corp............................ Manufacturing — — 6 50,377,865 0.6%Associated Food Stores................................... Distribution — — 7 46,325,762 0.6%
1,160,447,099$ 9.7% 668,795,949$ 8.1%
County Taxable Value 11,974,992,144$ 8,210,908,440$
Notes:(1) Taxable value does not include personal property accounts with a taxable value less than $250,000.(2) Taxable value does not include real estate parcles with a taxable value less than $250,000.
Source:Weber County Assessor
139139139llllll lllll139

WEBER COUNTY, UTAH
Legal Debt MarginLast Ten Years
2014 2013 2012 2011 2010
Estimated Fair Market Value................ 15,852,922,055$ 16,741,640,705$ 17,966,655,944$ 18,433,254,359$ 18,748,560,971$ Debt Limit (2% of Fair market value)... 317,058,441 334,832,814 359,333,119 368,665,087 374,971,219
Total net debt applicable to limit........... 41,624,690 43,376,364 10,356,168 11,185,425 13,846,414
Legal Debt Margin................................ 275,433,751$ 291,456,450$ 348,976,951$ 357,479,662$ 361,124,805$
Total net debt applicable to limit as a percentage of debt limit............. 13.1% 13.0% 2.9% 3.0% 3.7%
2009 2008 2007 2006 2005
Estimated Fair Market Value................ 20,007,438,628$ 19,678,956,447$ 17,072,115,297$ 14,365,081,710$ 12,758,721,589$ Debt Limit (2% of Fair market value)... 400,148,773 393,579,129 341,442,306 287,301,634 255,174,432
Total net debt applicable to limit........... 16,421,130 18,905,846 21,035,562 23,080,278 25,039,995
Legal Debt Margin................................ 383,727,643$ 374,673,283$ 320,406,744$ 264,221,356$ 230,134,437$
Total net debt applicable to limit as a percentage of debt limit............. 4.1% 4.8% 6.2% 8.0% 9.8%
140140140llllll lllll140
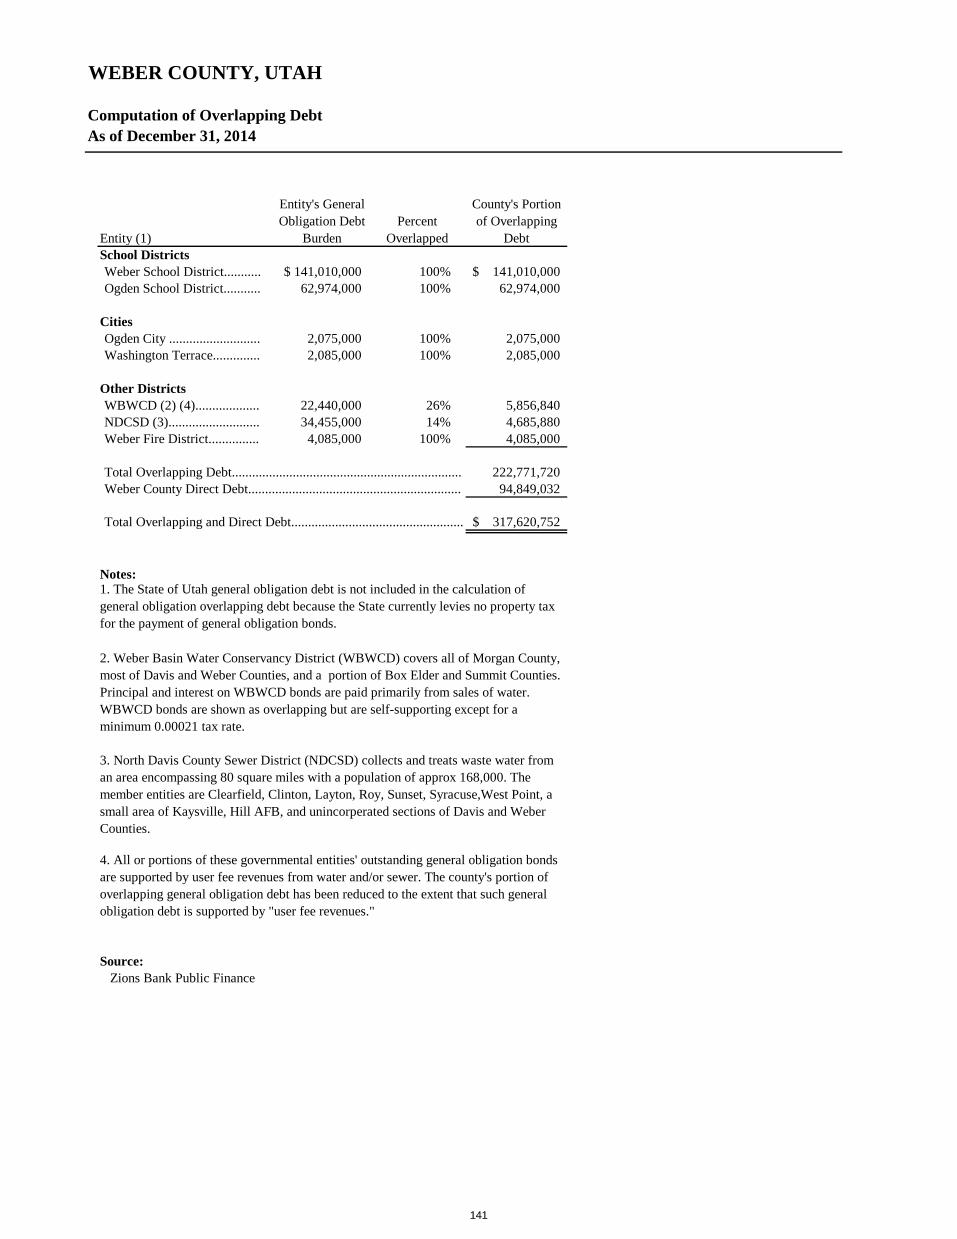
WEBER COUNTY, UTAH
Computation of Overlapping DebtAs of December 31, 2014
Entity (1)
Entity's General Obligation Debt
BurdenPercent
Overlapped
County's Portion of Overlapping
DebtSchool DistrictsWeber School District........... 141,010,000$ 100% 141,010,000$ Ogden School District........... 62,974,000 100% 62,974,000
CitiesOgden City ........................... 2,075,000 100% 2,075,000 Washington Terrace.............. 2,085,000 100% 2,085,000
Other DistrictsWBWCD (2) (4)................... 22,440,000 26% 5,856,840 NDCSD (3)........................... 34,455,000 14% 4,685,880 Weber Fire District............... 4,085,000 100% 4,085,000
222,771,720 94,849,032
317,620,752$
Notes:
Source: Zions Bank Public Finance
2. Weber Basin Water Conservancy District (WBWCD) covers all of Morgan County, most of Davis and Weber Counties, and a portion of Box Elder and Summit Counties. Principal and interest on WBWCD bonds are paid primarily from sales of water. WBWCD bonds are shown as overlapping but are self-supporting except for a minimum 0.00021 tax rate.
3. North Davis County Sewer District (NDCSD) collects and treats waste water from an area encompassing 80 square miles with a population of approx 168,000. The member entities are Clearfield, Clinton, Layton, Roy, Sunset, Syracuse,West Point, a small area of Kaysville, Hill AFB, and unincorperated sections of Davis and Weber Counties.
4. All or portions of these governmental entities' outstanding general obligation bonds are supported by user fee revenues from water and/or sewer. The county's portion of overlapping general obligation debt has been reduced to the extent that such general obligation debt is supported by "user fee revenues."
Total Overlapping Debt....................................................................Weber County Direct Debt...............................................................
Total Overlapping and Direct Debt...................................................
1. The State of Utah general obligation debt is not included in the calculation of general obligation overlapping debt because the State currently levies no property tax for the payment of general obligation bonds.
141141141llllll lllll141
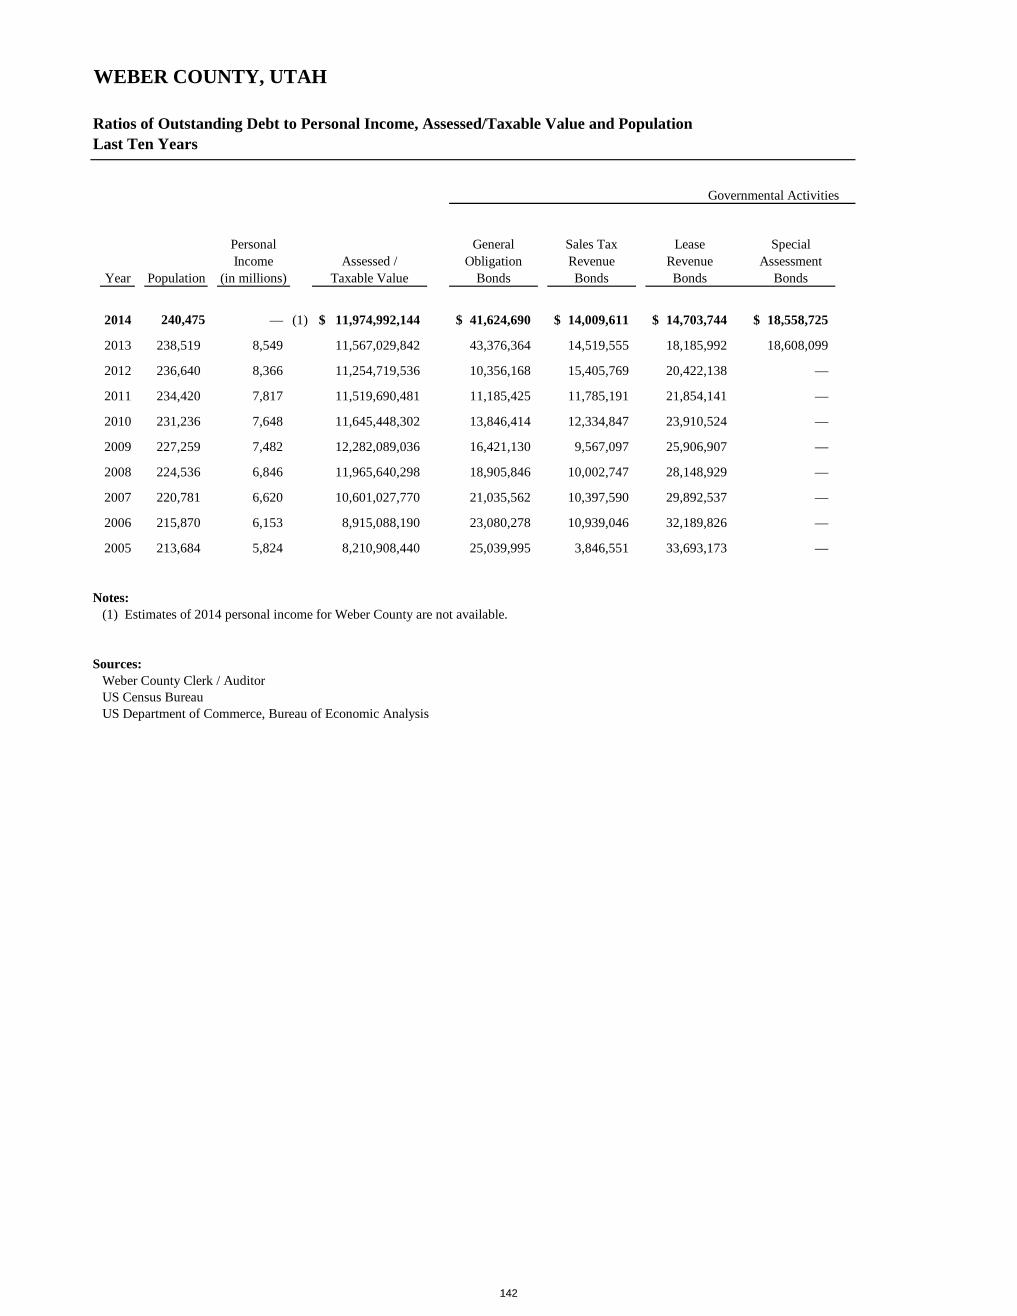
WEBER COUNTY, UTAH
Ratios of Outstanding Debt to Personal Income, Assessed/Taxable Value and PopulationLast Ten Years
Governmental Activities
Year Population
Personal Income
(in millions)Assessed /
Taxable Value
General Obligation
Bonds
Sales Tax Revenue Bonds
LeaseRevenueBonds
Special Assessment
Bonds
2014 240,475 — (1) 11,974,992,144$ 41,624,690$ 14,009,611$ 14,703,744$ 18,558,725$
2013 238,519 8,549 11,567,029,842 43,376,364 14,519,555 18,185,992 18,608,099
2012 236,640 8,366 11,254,719,536 10,356,168 15,405,769 20,422,138 —
2011 234,420 7,817 11,519,690,481 11,185,425 11,785,191 21,854,141 —
2010 231,236 7,648 11,645,448,302 13,846,414 12,334,847 23,910,524 —
2009 227,259 7,482 12,282,089,036 16,421,130 9,567,097 25,906,907 —
2008 224,536 6,846 11,965,640,298 18,905,846 10,002,747 28,148,929 —
2007 220,781 6,620 10,601,027,770 21,035,562 10,397,590 29,892,537 —
2006 215,870 6,153 8,915,088,190 23,080,278 10,939,046 32,189,826 —
2005 213,684 5,824 8,210,908,440 25,039,995 3,846,551 33,693,173 —
Notes:(1) Estimates of 2014 personal income for Weber County are not available.
Sources:Weber County Clerk / Auditor US Census BureauUS Department of Commerce, Bureau of Economic Analysis
142142142llllll lllll142

Business-type Activities
Tax Increment
BondsAssociated Foods Note
Capital Leases
Sales Tax Revenue Bonds
Capital Leases
Total Primary Government
Percentage of Assessed /
Taxable Value
Ratio of Outstanding
Debt to Personal Income
Outstanding Debt
Per Capita
—$ —$ 50,969$ 640,000$ 195,293$ 89,783,032$ 0.75% N/A (1) 373
— — 159,022 738,217 335,431 95,922,680 0.83% 1.12% 402
— — 700,823 866,720 496,424 48,248,042 0.43% 0.58% 204
— — 1,424,259 985,206 436,595 47,670,817 0.41% 0.61% 203
— 77,851 1,739,089 1,098,706 328,693 53,336,124 0.46% 0.70% 231
305,000 240,153 1,689,889 1,207,201 461,524 55,798,901 0.45% 0.75% 246
470,000 372,072 1,390,880 1,310,696 265,260 60,866,430 0.51% 0.89% 271
680,000 504,710 972,013 1,414,193 281,658 65,178,263 0.61% 0.98% 295
885,000 628,094 1,678,091 1,512,687 409,055 71,322,077 0.80% 1.16% 330
1,090,000 742,870 3,452,434 1,611,182 300,048 69,776,253 0.85% 1.20% 327
143143143llllll lllll143

WEBER COUNTY, UTAH
Ratios of General Bonded Debt OutstandingLast Ten Years
Year
General Obligation
BondsSales Tax
Revenue BondsLease Revenue
Bonds
Special Assessment
Bonds
Tax Increment
Bonds
Less Amounts in Debt Service
Reserves
NetGeneral BondedDebt (1)
Assessed /Taxable Value
Ratio of Net General
Bonded Debt to Assessed
Taxable Value Population
Net General Bonded Debt Per Capita
2014 41,624,690$ 14,009,611$ 14,703,744$ 18,558,725$ —$ $ (5,725,161) 83,171,609 11,974,992,144$ 0.69% 240,475 346$
2013 43,376,364 14,519,555 18,185,992 18,608,099 — (7,737,931) 86,952,079 11,567,029,842 0.75% 238,519 365
2012 10,356,168 15,405,769 20,422,138 — — (2,869,500) 43,314,575 11,254,719,536 0.38% 236,640 183
2011 11,185,425 11,785,191 21,854,141 — — (2,869,500) 41,955,257 11,519,690,481 0.36% 234,420 179
2010 13,846,414 12,334,847 23,910,524 — — (2,870,670) 47,221,115 11,645,448,302 0.41% 231,236 204
2009 16,421,130 9,567,097 25,906,907 — 305,000 (2,994,453) 49,205,681 12,282,089,036 0.40% 227,259 217
2008 18,905,846 11,313,443 28,148,929 — 470,000 (3,454,067) 55,384,151 11,965,640,298 0.46% 224,536 247
2007 21,035,562 11,811,783 29,892,537 — 680,000 (3,470,519) 59,949,363 10,601,027,770 0.57% 220,781 272
2006 23,080,278 12,451,733 32,189,826 — 885,000 (3,810,869) 64,795,968 8,915,088,190 0.73% 215,870 300
2005 25,039,995 3,846,551 33,693,173 — 1,090,000 (3,802,306) 59,867,413 8,210,908,440 0.73% 213,684 280
Notes:(1) Net General Bonded Debt is total general bonded debt less amounts held in reserve for debt service.
Source:Weber County Clerk / Auditor
144144144llllll lllll144

WEBER COUNTY, UTAH
Pledged Revenue CoverageLast Ten Years
Less: Net Gross Operating Available Coverage
Year Revenue Expenses Revenue Principal Interest Ratio
Sales Tax Revenue Bonds2014 11,840,368$ —$ 11,840,368$ 955,000$ 515,213$ 8.05 2013 11,277,993 — 11,277,993 980,000 579,962 7.23 2012 10,740,701 — 10,740,701 720,000 536,474 8.55
2011 10,250,993 — 10,250,993 650,000 611,771 8.12
2010 10,141,572 — 10,141,572 530,000 601,320 8.96
2009 9,487,533 — 9,487,533 525,000 511,743 9.15
2008 10,565,867 — 10,565,867 500,000 530,351 10.25
2007 11,373,152 — 11,373,152 610,000 546,876 9.83
2006 10,802,281 — 10,802,281 255,000 263,059 20.85
2005 9,332,174 — 9,332,174 250,000 242,365 18.95
Redevelopment Agency Tax Increment Bonds and Notes2014 —$ —$ —$ —$ —$ —
2013 — — — — — —
2012 — — — — — — (1)
2011 194,936 — 194,936 76,207 1,644 2.50
2010 650,367 — 650,367 458,279 11,317 1.38
2009 579,321 — 579,321 307,586 40,134 1.67
2008 511,621 — 511,621 342,638 61,016 1.27
2007 517,294 — 517,294 328,384 83,497 1.26
2006 614,241 — 614,241 319,766 104,592 1.45
2005 608,879 — 608,879 315,000 130,717 1.37
Special Assessment Area Bonds2014 —$ —$ —$ —$ 277,524 — (2)
2013 — — — — 277,524 —
Notes:(1) The County has had no outstanding tax incement debt since 2012(2) All dept service payments through 2015 are funded in a Capitalized Interest account held by a trustee.
Debt Service
145145145llllll lllll145

WEBER COUNTY, UTAH
Demographic and Economic IndicatorsLast Ten Years
Permit -Population Personal Per Capita Authorized Public Gross
Change from Income Personal Construction School Taxable Sales UnemploymentYear Population Prior Year (in millions) Income (in thousands) Enrollment (in thousands) Rate2014 240,475 0.82% n/a (1) n/a (1) 275,579 43,538 3,719,095 4.30%
2013 238,519 0.79% 8,549 35,844 76,234 45,683 3,523,736 5.2%
2012 236,640 0.90% 8,366 35,355 141,554 43,302 3,324,318 6.6%
2011 234,420 1.4% 7,817 33,344 274,772 43,075 3,131,054 7.8%
2010 231,236 1.7% 7,648 33,074 148,904 42,915 3,069,390 8.6%
2009 227,259 1.2% 7,482 32,923 158,126 42,995 3,214,628 7.6%
2008 224,536 1.7% 6,846 30,490 286,005 42,763 3,291,158 4.1%
2007 220,781 2.3% 6,620 29,984 326,966 42,700 3,422,164 3.1%
2006 215,870 1.0% 6,153 28,503 323,580 41,668 3,214,747 3.3%
2005 213,684 1.0% 5,824 27,256 278,112 41,316 2,862,973 4.6%
Notes:
Sources:Utah Population Estimates CommitteeUtah Department of Workforce ServicesBureau of Economic and Business Research, University of UtahUtah State Office of EducationUtah State Tax CommissionBureau of Economic Analysis, U.S. Dept. of CommerceU.S. Census Bureau
(1) Estimates of 2014 personal income for Weber County are not available.
146146146llllll lllll146
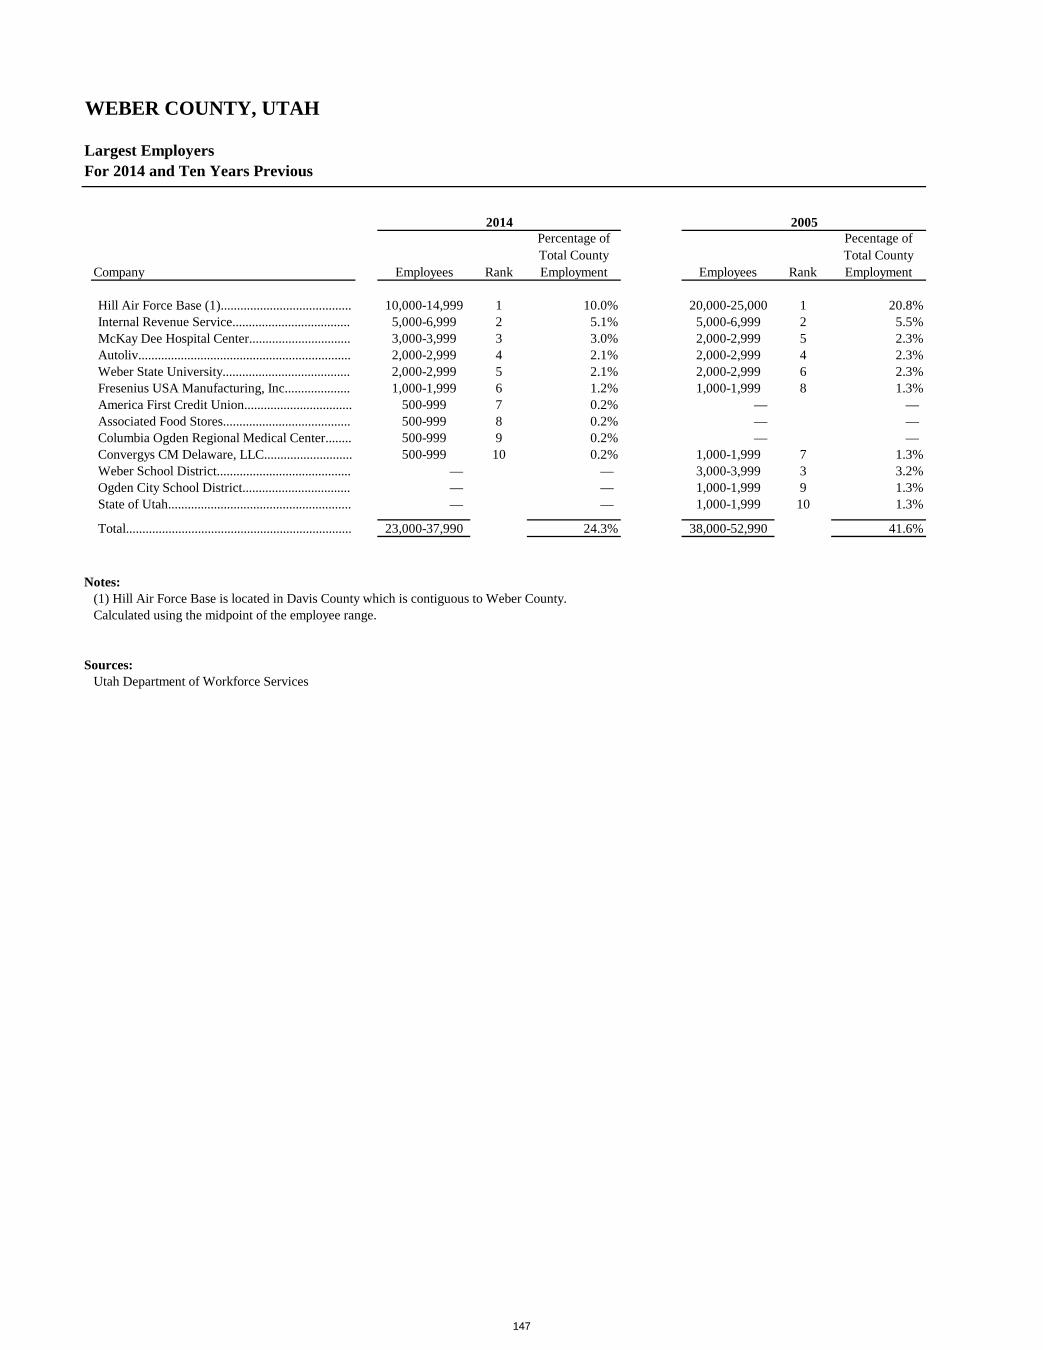
WEBER COUNTY, UTAH
Largest Employers
Company Employees Rank
Percentage of Total County Employment Employees Rank
Pecentage of Total County Employment
Hill Air Force Base (1)........................................ 10,000-14,999 1 10.0% 20,000-25,000 1 20.8%Internal Revenue Service.................................... 5,000-6,999 2 5.1% 5,000-6,999 2 5.5%McKay Dee Hospital Center............................... 3,000-3,999 3 3.0% 2,000-2,999 5 2.3%Autoliv................................................................. 2,000-2,999 4 2.1% 2,000-2,999 4 2.3%Weber State University....................................... 2,000-2,999 5 2.1% 2,000-2,999 6 2.3%Fresenius USA Manufacturing, Inc.................... 1,000-1,999 6 1.2% 1,000-1,999 8 1.3%America First Credit Union................................. 500-999 7 0.2% — — Associated Food Stores....................................... 500-999 8 0.2% — — Columbia Ogden Regional Medical Center........ 500-999 9 0.2% — — Convergys CM Delaware, LLC........................... 500-999 10 0.2% 1,000-1,999 7 1.3%Weber School District......................................... — — 3,000-3,999 3 3.2%Ogden City School District................................. — — 1,000-1,999 9 1.3%State of Utah........................................................ — — 1,000-1,999 10 1.3%
Total..................................................................... 23,000-37,990 24.3% 38,000-52,990 41.6%
Notes:
Sources:
For 2014 and Ten Years Previous
Calculated using the midpoint of the employee range.
20052014
(1) Hill Air Force Base is located in Davis County which is contiguous to Weber County.
Utah Department of Workforce Services
147147147llllll lllll147

WEBER COUNTY, UTAH
Full-Time Equivalent Employees by FunctionLast Ten Years
Function 2014 2013 2012 2011 2010 2009 2008 2007 2006 2005
Governmental Activities:General Government................................ 174.4 170.4 167.9 168.4 179.3 177.8 175.3 195.3 219.8 221.6Public Safety............................................ 384.5 384.2 384.8 392.6 416.0 412.9 425.9 395.5 371.8 365.7Public Health and Welfare....................... 71.5 70.3 69.1 66.1 72.2 66.9 65.9 64.4 61.7 61.5Library...................................................... 79.3 78.8 79.1 79.9 80.6 78.9 70.7 70.8 71.3 70.4Streets and Public Improvements............. 23.3 23.0 21.2 20.9 20.8 20.5 20.9 20.4 20.3 20.6Parks, Recreation, & Public Facilities 57.3 57.0 57.5 57.5 58.8 57.2 56.8 56.1 55.2 53.6Conservation and Development............... 2.7 2.7 2.5 2.5 2.6 2.5 2.6 2.9 3.1 3.2
Business-type Activities:Solid Waste Transfer Station.................... 25.4 25.2 25.6 23.2 23.0 22.5 21.9 19.8 18.8 19.2Animal Services....................................... 8.2 8.6 8.4 7.6 1.1 0.0 0.0 0.0 0.0 0.0 Total FTEs........................................... 826.6 820.2 816.1 818.7 853.3 839.2 840.0 825.2 822.0 815.8
Note:During 2014, the county changed its methodology for calculating FTEs. Prior year figures have been restated using the new methodology.
Source: Weber County Human Resources
148148148llllll lllll148

WEBER COUNTY, UTAHOperating Indicators by FunctionLast Ten YearsFunction 2014 2013 2012 2011 2010 2009 2008 2007 2006 2005
Governmental Activities `General Government:Justice Court: Traffic Cases Disposed................................. 2,067 2,355 790 793 824 6,062 6,450 7,767 11,950 15,594 Misdemeanor Cases Disposed....................... 1,107 4,423 295 244 191 829 754 869 985 1,124
Clerk/Auditor: Marriage Licenses Issued.............................. 2,208 2,140 2,109 2,140 2,012 2,060 2,263 2,210 2,258 2,165 Tax Sale Properties Sold............................... 12 36 22 27 16 13 18 17 11 21 Tax Relief Applications................................. 3,581 3,498 3,502 3,469 3,411 3,342 3,185 3,185 4,707 3,594 Passports Issued............................................ 2,847 2,310 2,222 1,934 2,850 2,468 3,060 1,932 790 518
Recorder: Documents Recorded.................................... 47,033 56,678 57,006 47,130 51,181 69,425 69,618 80,215 80,606 74,686 Subdivisions Recorded.................................. 110 103 67 53 68 90 129 163 140 173 Number of Lots Within Subdivisions............ 972 828 725 286 351 753 1,288 2,373 2,250 2,374
Assessor: Residential Construction Permits.................. 1,652 1,632 1,494 1,369 1,245 1,782 2,233 3,338 3,430 2,810 Commercial Construction Permits................ 504 543 534 532 437 567 626 646 672 624 Board of Equalization Appeals..................... 1,545 1,723 2,397 2,865 3,574 4,238 3,162 3,005 1,142 1,202 Parcel Count................................................. 92,719 92,172 97,331 97,239 97,155 96,916 96,703 93,215 91,800 89,804
Children's Justice Center: Children Interviewed..................................... 451 456 554 465 388 481 459 586 724 799 Cases Served................................................. 479 509 606 529 470 523 668 827 776 850
Planning: Applications.................................................. 68 320 40 83 95 96 86 70 94 67 Subdivision Lots Approved........................... 163 248 77 12 42 112 153 838 1,318 771 Land Use Permits.......................................... 247 221 196 155 162 156 210 285 339 400 Code Enforcement Complaints Resolved...... 205 147 184 131 168 198 270 210 230 101
Engineering Excavation Permits.................................... 126 104 88 100 91 117 173 192 211 235 Sewer Connections .................................... 6 8 1 1 3 — 3 25 13 35
Building Inspection: Plan Reviews................................................. 260 187 132 160 182 181 232 263 284 311 Permits Issued............................................... 373 338 270 306 298 342 410 384 476 311
Public Safety:Sheriff: Citations Issued............................................. 4,155 5,288 5,745 6,069 5,458 6,896 6,183 6,849 8,564 11,720 Traffic Accidents Investigated....................... 79 1,072 1,027 1,148 1,148 1,249 1,158 1,290 1,225 1,145 Calls for Service............................................ 34,656 38,547 29,330 39,866 40,368 40,369 42,856 42,793 50,596 52,769 Civil Population Served................................ 55,657 55,657 55,657 55,666 49,187 49,187 49,187 48,223 n/a 46,469 Average Inmate Population........................... 902 970 920 969 979 952 987 1,028 1,046 1,036
Public Health and Welfare:Health Department: Births Recorded ........................................... 11,596 6,190 6,562 6,568 6,565 6,719 6,859 6,626 6,253 5,845 Immunizations Given.................................... 12,433 12,182 13,218 10,652 20,413 39,224 26,542 18,375 5,383 5,280 Soil Samples Taken....................................... 114 81 44 33 63 58 85 248 309 225 Septic Permits Issued.................................... 97 79 57 55 54 75 92 115 128 154 WIC Average Monthly Participation............. 7,216 7,363 7,336 7,366 7,571 7,064 6,567 6,439 n/a 6,763
Streets and Public Improvements:Roads Department: Miles of Asphalt Overlays............................. 9.13 3.05 4.60 3.00 2.15 2.40 4.30 3.05 3.5 4.1 Miles of New Chip Seal Applied .................. 16.15 23.25 15 — (1) 14.40 12.80 — 14.35 13.2 3.6 Winter Overtime Operations Hours............... 1,504 1,511 1,063 1,435 1,129 2,302 2,144 1,249 1,474 1,207
Library: Library Cards Issued..................................... 21,265 21,561 22,518 23,221 25,598 25,361 23,101 18,433 23,332 23,021 Circulation Transactions............................... 2,022,727 2,205,123 2,094,199 1,766,444 2,028,739 (2) 2,148,379 1,774,208 1,346,481 1,226,786 1,217,912 Reference Service Transactions.................... 418,262 821,095 (5) 794,045 820,097 820,856 (2) 2,572,707 2,228,734 2,072,102 1,942,277 1,389,184 Public Computer Sessions Logged............... 170,869 204,878 (4) — — — — — — — — Annual Visits................................................ 1,871,533 1,289,862 (4) — — — — — — — — Programs...................................................... 2,503 2,590 (4) — — — — — — — — Program Attendees....................................... 93,642 93,889 (4) — — — — — — — — Meetings...................................................... 5,211 4,538 (4) — — — — — — — — Meeting Attendees....................................... 122,575 94,773 (4) — — — — — — — —
Parks, Recreation & Public Facilities:Golden Spike Events Center: Attendance.................................................... 199,894 193,254 220,999 245,639 211,409 224,884 219,384 261,924 195,239 260,305 Events........................................................... 285 272 287 208 244 278 240 188 206 194
Business-type ActivitiesSolid Waste Transfer Station: Tons of Solid Waste Received...................... 174,770 198,847 208,992 211,582 224,351 244,032 217,486 213,422 206,524 195,451 C & D Landfill.............................................. 23,168 21,897 19,796 27,598 28,957 (3) – – – – – Tons of Metal Recycled................................ 1,688 1,453 1,496 1,346 1,979 2,439 2,270 2,033 2,278 1,895 Yards of Compost Sold................................. 8,371 7,860 9,236 9,658 8,903 9,419 5,447 8,202 7,714 11,007
Notes:(1) During 2011, the time required of the Roads Department to manage flood issues prevented the Roads Department from applying chip seal to any county roads.(2) In 2010 the Library revised its reference categories and methods of recording transactions which has resulted in a much lower number.(3) The C&D Landfill opened in 2010.(4) We began reporting this information in 2013(5) In 2014, the Library revised its methods of recording transactions, which has resulted in a much lower number.
Source: Weber County Departments, as listed
149149149llllll lllll149

WEBER COUNTY, UTAH
Capital Asset Statistics by Function
Function 2014 2013 2012 2011 2010 2009 2008 2007 2006 2005
Governmental ActivitiesGeneral Government:
Buildings............................................... 1 1 1 1 1 1 1 1 1 1 Fleet Vehicles........................................ 45 25 43 39 10 10 10 10 10 10
Public Safety:Detention Facilities................................ 2 2 2 2 2 2 2 2 2 2
Inmate Capacity............................... 1,186 1,186 1,186 1,186 1,188 1,188 1,188 1,188 1,188 1,188 Fleet Vehicles........................................ 144 120 188 161 158 158 158 152 139 163 Animal Control Facility.......................... 1 1 1 1 1 1 1 1 1 1
Canine Kennels................................ 182 182 182 182 28 28 28 28 28 28 Feline Kennels................................. 276 276 276 276 52 52 52 52 52 52 Exotic Animal Kennels.................... 17 17 17 17 17 — — — — —
Public Health and Welfare:Buildings............................................... 2 2 2 1 1 1 1 1 1 1 Fleet Vehicles........................................ 20 67 20 14 14 14 14 12 12 13
Library Services:Library Branches.................................... 5 5 5 5 5 5 4 4 4 4 Fleet Vehicles........................................ 2 2 4 4 4 4 4 4 4 4
Streets and Public Improvements:Roads (Miles)........................................ 190 187 187 219 205 205 205 205 203 202 Fleet Vehicles........................................ 30 32 9 9 3 3 3 3 3 3 Heavy equipment................................... 39 39 39 39 39 39 39 39 38 39
Parks, Recreation & Public FacilitiesIndoor Arenas........................................ 2 2 2 2 2 2 2 2 2 2 Outdoor Stadiums.................................. 1 1 1 1 1 1 1 1 1 1 Auction Arena........................................ 1 1 1 1 1 1 1 1 1 1 3/4 Mile Flat Track................................ 1 1 1 1 1 1 1 1 1 1 Cross Country Track.............................. 1 1 1 1 1 1 1 1 1 1 Courtyard............................................... 1 1 1 1 1 1 1 1 1 1 Exhibit Hall........................................... 1 1 1 1 1 1 1 1 1 1 Fair Storage Building............................. 1 1 1 1 1 — — — — — Shop Facilities........................................ 2 2 2 2 — — — — — — 10 x 10 Stalls (Total Capacity)............... 546 546 546 546 546 546 546 546 546 546 Covered Pavilion w/ Restrooms............. 1 1 1 1 1 1 1 1 1 1 Basketball Courts................................... 2 2 2 2 2 2 2 2 2 2 Baseball/Softball Fields.......................... 5 5 6 6 6 6 6 6 6 6 Complex at Baseball/Softball Fields....... 1 1 1 1 1 1 1 1 1 1 Soccer/Football Fields............................ 7 7 7 7 7 7 7 7 7 7 Individual Campsites.............................. 252 252 252 252 252 252 252 252 252 247 Group Sites w/pavilion........................... 9 8 8 7 7 7 7 7 7 7 Group Sites w/o pavilion........................ 4 5 5 5 5 5 5 5 5 5 Lodge..................................................... 1 1 1 1 1 1 1 1 1 1 Restrooms.............................................. 29 29 29 29 27 27 27 27 22 22 Historical Bldgs..................................... 4 4 4 4 4 4 4 4 3 3 Mobile Stage.......................................... 1 1 1 1 1 1 — — — — Fleet Vehicles........................................ 7 17 11 11 6 6 3 3 3 3 Indoor Ice Rinks..................................... 2 2 1 1 1 1 1 1 1 1 Educational Center................................. 1 1 1 1 1 1 1 — — —
Business-type ActivitiesSolid Waste Transfer Station
Heavy Equipment................................... 15 15 15 14 13 13 13 12 12 11 Fleet Vehicles........................................ 5 13 3 3 1 1 1 1 1 1 Scales..................................................... 3 3 3 3 3 3 3 3 3 2
Landfill Gas RecoveryGenerator .............................................. 1 1 1 1 1 1 1 1 1 1 Lineal Feet of Gas Pipe, all sizes............ 7,630 7,630 7,630 7,630 7,630 7,630 7,630 7,630 7,630 7,630
Source: Weber County DepartmentsWeber County Fleet Department - All Fleet Vehicle Information
Last Ten Years
150150150llllll lllll150

CREDITS
Cover Photo courtesy of:
Visit Ogden 2348 Washington Blvd Ogden, UT 84401 (800) 255-8824
www.visitogden.com

Weber County Corporation 2380 Washington Boulevard
Ogden, Utah 84401 www.co.weber.ut.us