wigstonacademy.orgwigstonacademy.org/.../10197/case-study-booklet-sn-2.docx · web viewzambia...
TRANSCRIPT

Case Study Revision Guide
OCR B GCSE Geography
Exam 1 Exam 2 Exam 3
Natural World People and Society Geographical exploration
Global hazardsClimate change
Distinctive landscapesSustaining
ecosystems
Urban futuresDynamic
developmentUK in 21st century
Resource Reliance
Synoptic decision making across all
units of study
70 marks 70 marks 60 marks
1 hour 15 minutes 1 hour 15 minutes 1 hour 30 minutes
35% 35% 30%
Monday 18th May AM2020
Wednesday 3rd June PM
2020
Thursday 11th June AM
2020
1 hour 15 minutes (70 marks) 35% of final mark
Divided into 2 sections (A & B)
Section A covers four topics:• Global Hazards• Changing Climate
• Distinctive Landscapes• Sustaining Ecosystems
Section B covers Physical Geography Fieldwork
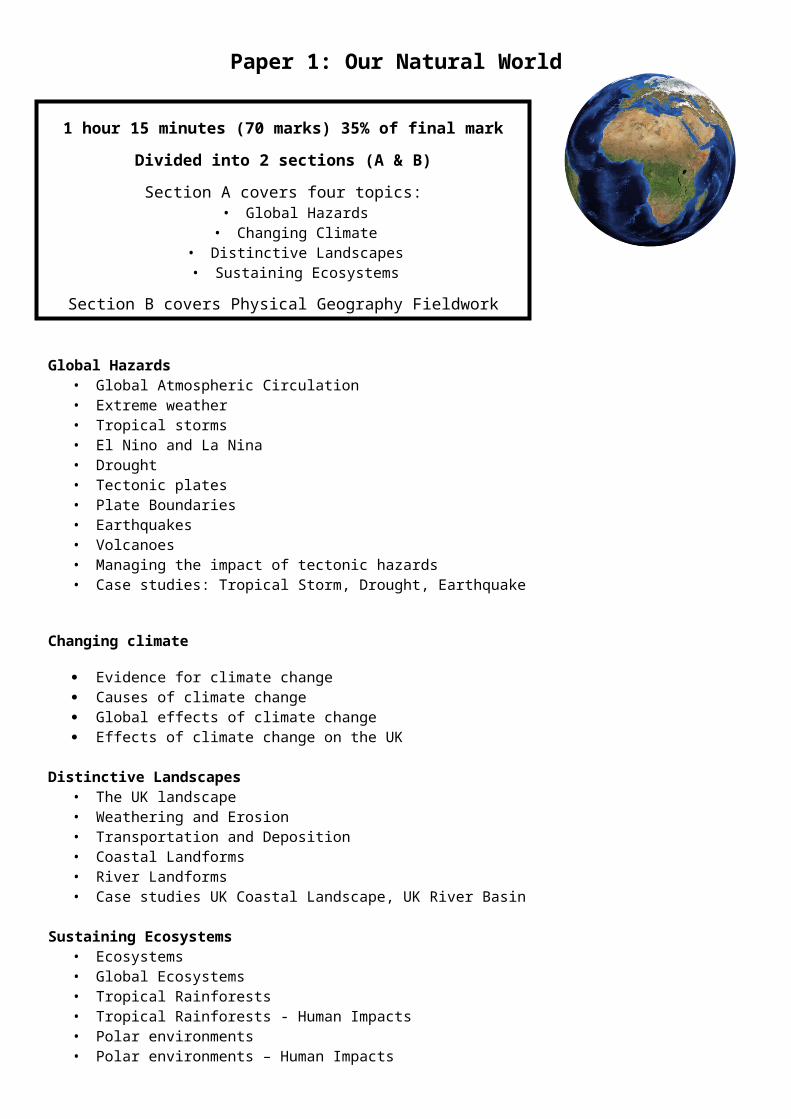
Paper 1: Our Natural World
Global Hazards• Global Atmospheric Circulation• Extreme weather• Tropical storms• El Nino and La Nina• Drought• Tectonic plates• Plate Boundaries• Earthquakes• Volcanoes• Managing the impact of tectonic hazards• Case studies: Tropical Storm, Drought, Earthquake
Changing climate
Evidence for climate change Causes of climate change Global effects of climate change Effects of climate change on the UK
Distinctive Landscapes• The UK landscape• Weathering and Erosion• Transportation and Deposition• Coastal Landforms• River Landforms• Case studies UK Coastal Landscape, UK River Basin
Sustaining Ecosystems• Ecosystems• Global Ecosystems• Tropical Rainforests• Tropical Rainforests - Human Impacts• Polar environments• Polar environments – Human Impacts• Case studies: Antarctica, Amazon Tropical Rainforest

Case study of Natural weather hazard - Non UK based – tropical storm – Typhoon Haiyan, Philippines
Typhoon Haiyan hit the southeast coast of the Philippines with winds of up to 195mph recorded on 8 th November 2013.
Causes
Latitude 7o N of the equator Pacific ocean over 60m deep Sea temperature 26.5oc
Coriolis effect started storm spinning (the way the spinning of the earth makes winds veer to right in N hemisphere and to the left in S hemisphere)
Consequences
Social Economic Environmental More than 6,300 people
reported dead and a large number missing.
11.5 million people affected (10% of the population)
670,000 people made homeless (55% living in evacuation shelters).
90% of the houses in Tacloban were destroyed or damaged.
130,000 houses were destroyed.
Estimated economic damage of $2.86 billion.
$85 million lost from farm damage
77% farmers and 74% fishermen lost main source of income
5m storm surge with waves up to 15m high.
Flash floods and landslides Barge punctured and 85000
litres of oil leaked into the sea
Trees uprooted
Responses to the hazard
Emergency Reponses
• 1215 evacuation centres were set up.
• Britain sent HMS Daring as part of the emergency response.
• Widespread looting and violence in Tacloban led the government to deploy soldiers to restore law and order.
• The UN and countries such as the UK, Australia, Japan and the USA donated millions of pounds and sent medical teams. The UK government alone sent £50 million, Australia gave $28million
• The Philippine Red Cross delivered basic food aid including rice, canned goods, sugar and cooking oil.
Longer term responses
By April 2014 restored services to;
– 560 schools - 30 hospitals - 1500km roads
-220 health centres 1100km drainage canals - replanted mangroves
GLOBAL HAZARDS

Impacts of the heatwave
Categorise these into social, economic and environmental impacts.
Wimbledon spectators advised to wear hats to protect themselves from heat
Some school sports days cancelled
Struggling train services and heavy traffic on roads as roads and tracks began melting in the heat
Car breakdown calls were up 14% due to overheating cars
1300% rise in sale of fans compared to same time in 2014
Barbeque sales up 67% / Sunglasses up 39%
Bristol Zoo handed out lollies and frozen iced tea to its animals to help them beat the heat
RSPCA has reminded people never to leave a dog alone in a car on a warm day, even with the windows left open.
Health warnings were also issued to young children, the elderly and those with serious illnesses who are encouraged to stay in the shade, wear loose clothing and drink plenty of water.The heat has caused bin collections to be delayed across Bath and North Somerset because the circuit boards in the compactors of the bin Lorries are overheating.This led to greater evaporation of reservoirs.
Dry Soil- It is difficult for the rain that did fall to soak into the ground as the soil was dry and baked hard
Responses from different stakeholders
Southern Water applied for a drought permit to help refill Bewl reservoir, while South East Water was granted a drought order to help refill Ardingly.
Anglian Water has also been issued with two drought permits to refill two of its reservoirs.
Hose pipe ban - 20 million people face £1,000 fine if they defy hosepipe bans, introduced after one of driest two-year periods on record.
Network rail set speed restrictions on lines that were vulnerable to buckling in the heat
Virgin trains cancelled 20 trains
A health alert known at level 3 heatwave action was issued by the government
999 calls doubled in one day particularly those involving the elderly
Causes
Low pressure system over west of the UK. High pressure system dominating parts of central and southern Europe
The heatwave ended with thunderstorms that delivered ½ months rain in an hour to parts of Dorset and East Anglia
This led to greater evaporation of reservoirs.
Dry Soil- It is difficult for the rain that did fall to soak into the ground as the soil was dry and baked hard.
High pressure – air cools it becomes denser and falls towards the ground which increases the air pressure. The cool air is subject to warming which causes any clouds to evaporate with heavy rain at the equator this means most of the moisture in the atmosphere is removed before the air reaches the sub tropics. Leads to clear ski, dry hot and calm conditions.
Case Study - Heatwave: UK Summer 2015 - UK based natural weather hazard event
What is a heatwave?
Is defined by the Met Office when the daily maximum temperature exceeds the average by 5oc for more than 5 consecutive days.
UK 2015- end June and into beginning of July
How would the impacts have been different if the heatwave had continued for?
a. A further week? - Slight increase in hospital/healthcare visits
Continuation of hosepipe bans
b. Two months? - Severe water shortages
Over stretched hospitals /healthcare services
Shortages of food as crops ruined
GLOBAL HAZARDS

A case study of a tectonic event that has been hazardous for people: Chile Earthquake 2010
Causes
Destructive plate boundary
Oceanic (NAZCA) plate moves towards continental (SOUTH AMERICAN) plate. The oceanic plate is denser than the continental plate so, as they move together, the oceanic plate is forced underneath the continental plate. The point at which this happens is called the subduction zone. As the oceanic plate is forced below the continental plate it melts to form magma and earthquakes are triggered.
Consequences
Social Economic Environmental- 2 million people affected- 800 died- 3 hospitals collapsed- In many cities people slept in streets/parks/tents for fear of aftershocks- 500000 homes destroyed- Power blackout for 93% Chile’s population for several days- despite army presence – stealing and looting by mobs near Conception
- economic loss to economy $20 billion- airport damaged no flights for 24 hours- Santiago’s National fine art museum closed until 9 march 2010- tsunami travelled across Pacific ocean causes $66 million of damage- months later food prices in Chile much higher as crops were damaged
-2 m high tsunami waves – large areas of coast flooded- landslides triggered from shaking- earthquake so powerful it moved town of Conception 3 m to the west- boats washed in on Tsunami wave run aground- liquefaction
Responses to the event
Buildings intact
- A seismic isolation system by Sirve helped Chile’s tallest building (190m high) Titanium tower, Santiago to remain intact as they have put huge steel structures to support buildings from below like a car shock absorber which twists independently of the shaking ground.
- Massive concrete blocks weighing 160 tonnes which hang inside the buildings and swing like a pendulum which offsets the weight as the ground sways.
- All 13 Sirve built towers withstood 2010 quake
Water access
- A pipe line made of polyethylene – a flexible easy to transport but durable material is put into a water source, it is then attached to a helicopter and dragged along the ground to the stranded community
Text alerts
- eVigilio company uses a geo- targeted system that allows officials to send out mass alerts simultaneously to computers, pagers and mobile phones as well to radio and television. It can reach millions within seconds even if networks are busy.
North Norfolk Coast
Where is it?
8.8 Richter scale 8.0 Mercalli scale 27th February 2010 03.34
GLOBAL HAZRADS
DISTINCTIVE LANDSCAPES

Norfolk County in England bordering Suffolk, Lincolnshire and Cambridgeshire
Southern border of the wash (an inlet of the North Sea)
North Norfolk coast is 74km long (Hunstanton to Lowestoft)
Includes towns and villages of Wells next to the Sea, Cley, Sheringham, Cromer, Sea Palling, Happisburgh
Landforms created by geomorphic processes
Spit - Blakeney Point
It is 4 miles long
Created by process of longshore drift (swash up beach in direction of prevailing wind, backwash down beach with gravity, this continues along coastline, then a secondary wind approaches from opposite direction and this stabilises the end of the spit and creates its curved end, over time a salt marsh becomes established in the sheltered water behind the spit)
Seals live in the salt marsh
Boat trips are run from Morston out to see the seals on the spit as well as birdwatching – both popular tourist activities which adds to value of tourism and to the local economy.
Protected as it is an SSSI
Slumping cliffs - Happisburgh
Destruction of the cliffs by destructive waves, due to weak rock type (brown sands and clay)
Cliff attack at the base of the cliff (hydraulic action, abrasion) and cliff top weathering with soaking of the sand on the wet clay leads to mass movement (sliding and slumping)
Salt marshes – Stiff key
Salt marshes have developed where fine material has been trapped by specialist plants which can tolerate high levels of salt to create natural sea defences – low lying but build up as sea level rises
Rare place – protected by National Trust
Geology
Underlying rock type is chalk
A large number of flints are found within the chalk
The chalk is hidden by a layer of material called drift (from ice sheet)
Glacial terminal moraine found in north east section from Sheringham round to Mundesley (including Overstrand and Cromer)
How human activity, including management, works in combination with geomorphic processes to impact the landscape
• 34km of it is being protected by sea defences

• If all defences were taken out and re-built today cost would be £70m
• Annual maintenance budget of £280,000
Name of protection Location How it works
Sea walls, rock armour, groynes
Sheringham Sea walls/rock armour absorb wave energy to protect the cliff from erosionGroynes are to stop LSD and keep material on the beach to absorb wave energy
Sand dunes – planted vegetation
Holkham Sand dunes have been planted with pine trees which stabilises the dune systemVisitors are encouraged to use boardwalks rather than disturb the marram grass and erode the dunes
Groynes , gabion baskets
Wells next to the sea Groynes are to stop LSD and keep material on the beach to absorb wave energy and break waves before reach cliffs protecting beach hutsGabions absorb wave energy to protect the cliff from erosion
Shingle ridge – Living Landscape project
Cley Provides a home for wildlife but shingle ridge protects the base of Blakeney spit – allows the LSD process to occur to feed the spit with material
Off shore breakwaters /sea wall
Sea Palling Absorb the wave energy as wave intensity is less by time reaches cliffs/sand dunes as wave break on breakwater before therefore reduces coastal erosion. The decreases in wave energy has meant less LSD so beach has become wider as well.
Do nothing Happisburgh Erosion of cliffs 2-5 m a year due to no protection methodsCliffs also weak rock sands on top of clay (slumping)Had revetments but these were broken in storm and never replaced2005 Rock groyne cost £5 put in place but only protecting one section of the cliffsRate of 1 house per year lost to the sea, as well as business loss for caravan park and tea shops both lost to sea
Human activity positive /negatively impacting
Less positives but how important is the positive compared to the negative.
Tourist’s causing footpath erosion and trampling on vegetation
Coastal management strategies interfering with the natural processes
Cliff top developments have made the cliff more unstable
Global warming increasing the storminess of the North sea and causing more erosion
Anchors from fishing vessels are damaging the sea bed
Tourist‘s dropping rubbish on the beach and conservation areas
Tourism brings in significant amount of money to areas such as Cromer and Sheringham due to variety of tourist attractions.
Do nothing approach at Happisburgh has meant that the cliffs have fallen into sea at rate between 2-10m a year
Global warming increasing sea level and causing more areas to flood

Case study of one river basin – RIVER THAMES
Where is it?
The river Thames is 346 km long and is the most densely populated river basin with 13 million people living in it.
Geology
The source is in the Cotswold Hills (Jurassic Limestone). It then flows East between the Chilterns and Berkshire downs (permeable chalk). Then it flows over London clay out to the North Sea.
Landforms created by geomorphic processes influenced by geology and climate
The river Thames is a lowland river.
Its source Cotswold is only 108m above sea level, therefore it does not have the increased energy of an upland river so does not have typical upland features such as waterfalls, gorges
MEANDERS
High amounts of lateral erosion as high volume of water
OUTSIDE bend fastest current = EROSION – leads to creation of a RIVER CLIFF
INSIDE bend slowest current = DEPOSITION- leads to creation of SLIP OFF SLOPE
RIVER TERRACES
The river Thames has flowed more or less on its present course since ice age that began ½ million years ago- temperature changes have led to advance and retreat of ice sheets and sea level changes
Past sea level changes affected the power of the Thames to erode.
When the sea level fell the river gained energy because it had to drop further to sea level and eroded downwards into its old floodplain (REJUVENATION)
Sea level rose so the river lost its energy and began to deposit material on the floodplain
This occurred each ice age – so each time it was rejuvenated it formed a new floodplain at a lower level.
DISTINCTIVE LANDSCAPES

How human activity, including management, works in combination with geomorphic processes to impact the landscape
PAST Flooding
1928 – 14 people dies and thousands were homeless when flood occurred in January
1953 – Big flood on east coast of UK – London had embankments which prevented flooding
Concerned for future risk- MANAGEMENT
THAMES BARRIER constructed 1984
- When high tides forecast the gates on the barrier are raised to prevent tidal water reaching London
- During storms in 2013/2014 – the barrier was closed 50 times
- Proposal to build new barrier in near future to cope with predicted sea level rise
PRESENT - Thames flood February 2014
5000 homes and businesses flooded in village of Wraysbury and Staines (west London)
Thousands people evacuated
Clean up costs £500 million
CAUSES FLOODING 2014
HIGH RAINFALL/SATURATED SOIL
- Saturated soil after months of rain and high water level in the river
- Winter 2013/14 wettest in southern England on record
- Between 1st Dec 2013-19 Feb 2014 487 mm rain fell (twice normal winter amount)
- Due to series of ATLANTIC STORMS- 9th February – 14 severe flood alerts issued
JUBILEE RIVER
Wraysbury had a new artificial channel called the Jubilee River built in 2002
It was designed to take overflow water from the Thames around Maidenhead, Windsor and Eton (£110 million- the most expensive manmade river in UK)
It takes a shorter route than the Thames so water reaches its destination faster
Therefore in 2014 it carried the flood water very quickly to Wraysbury and Staines
There is new a new plan for another FLOOD RELIEF CHANNEL to Teddington part of £500 million project to reduce flood risk
Sustainable management - Barking riverside
As London space is under huge housing pressure- they are building on flood plains
However at Barking they are transforming the flood risk into a landscape feature
- Rather than barriers water will be allowed to spread naturally over flood plain and fill local creeks
- Create green corridors as water features- Trees and parkland to increase
interception- Raised residential areas to protect from
flooding

SUSTIANBLE MANAGEMNT OF AN AREA OF TROPICAL RAINFOREST AT LOCAL OR REGIONAL SCALE
Tropical rainforest
Agro-forestry
This is when you grow both trees and crops at the same time.
This allows farmers take advantage of shelter from the canopy of trees. It prevents soil erosion, and the crops benefit from the nutrients from the dead organic matter.
Selective logging
Trees are only felled when they reach a particular height. This allows young trees a guaranteed life span.
The forest will regain full maturity after around 30 - 50 years.
Education Ensuring those involved in exploitation and management of the forest understand the consequences behind their actions of deforestation on soil erosion, habitats, and water, carbon and nutrient cycles.
Afforestation The opposite of deforestation. This is when you plant trees and seeds in an area that previously had no trees.
Forest Reserves
Areas of land protected by law where by harvesting of wood products is excluded
Monitoring This is the use of satellite technology and photography to check that any activities taking place are legal and follow guidelines for sustainability.
SUSTAINING ECOSYSTEMS

Costa Rica Case Study – how an area has managed the rainforest to be sustainable


Polar Regions Antarctica International /Global case study
Antarctica small scale example of sustainable management – tourism
Ecotourism -Tourism directed towards exotic natural environments, intended to support conservation efforts and observe wildlife.
Sustainable tourism at Union Glacier
Union glacier is a logistic hub operated by Adventure Network International (ANI)
Union glacier is an expanse of ice in the Ellsworth Range part of the Transantarctic Mountains
Camp near blue ice runway which is used for cargo planes to bring equipment for expeditions or scientific support
Advance crew arrives before tourists to prepare base camp with tents, other buildings and equipment they lay fuel depots for field teams.
70 tents and a catering mess tent
All tourists that come to union glacier to explore do small scale activities with low impact such as;
Walking or trekking Climbing up mount Vinson Visit penguin colonies – visitors must stay 5m from wildlife and are limited to being in a group of up to 20
and follow specific routes to approach the penguin colony Walk in footsteps of Amundsen up the Axel Hieburg glacier
Expensive to visit for a tourist – 6 day trip £17000, 12 day trip is £21000
Guidelines are given to tourists about how to behave with respect to the environment (link to Antarctica Treaty)
Some of the equipment is solar panels to reduce diesels use
All waste is carefully contained and removed at the end of the season
SUSTAINING ECOSYSTEMS

Antarctica Case Study – global scale example of managing polar environments to be sustainable
‘A natural reserve dedicated to peace and science’
••
••••
• The Antarctic treaty was signed in 1961 by 46 countries because the area was under threat
• Humans are only allowed on the continent for scientific research and tourism (tourism is limited to a certain number of visitors each year)
• The scientific research there discovered the o-zone layer. This helped humans identify how our greenhouse gases were destroying it.
• This scientific research has benefitted the future of our planet.
• Treaty remains in force indefinitely
• Two further agreements were added to the original treaty
• Convention for conservation of Antarctic seals (1972)
• Convention on the conservation of Antarctic Marine Living Resources (1980)
• Strict controls on non-native species were introduced and one consequence for this was removal of sledge dogs – 1994 as thought might lead to diseases spreading to seals or might attack native wildlife
Established in 1961 – was originally signed by 12 nations but now has been agreed by 53 nations.
1. There are certain rules put in place that all countries must follow:a. No military or nuclear weapon testing is allowedb. No waste disposalc. The whole of Antarctic is a nature reserved. Tourists and scientists have to follow certain rulese. No mining is allowedf. Historic sites like Shackleton’s base are preserved. g. Guaranteed freedom for all scientific research

1 hour 15 minutes (70 marks) 35% of final mark
Divided into 2 sections (A & B)
Section A covers four topics:
Urban Futures Dynamic Development UK in the 21st Century
Resource Reliance
Section B covers Human Geography Fieldwork
Paper 2: People and Society
Urban Futures
Urban Growth Urbanisation in LIDCs Suburbanisation Counter-Urbanisation Re-urbanisation Case studies: Lagos, Leicester
Dynamic Development
Measuring development Uneven development Factors Affecting Development Increasing development- Stages and Goals Increasing development- Trade and TNCs LIDC Development- Case Study Zambia
UK in the 21st Century
• Characteristics of the UK• Changing population of the UK• The UK’s ageing population• The changing economy of the UK• UK economic hubs• The UK’s role in the World• UK Media Exports• Multicultural UK
Resource Reliance
• Resource supply and demand• Human use of the environment• Food security• Access to food• Increasing food production• Ethical consumerism• Small-scale food production• Case study- Tanzania

One city in an LIDC – Lagos
Challenges of city and how it can become more sustainable
LOCATION
- Western Africa- Coastal location – Gulf of Guinea- Atlantic ocean- 21 million people- Fast growing by over 500,000 a year - Previous capital city (now Abuja)
PATTERNS OF GROWTH
- Urbanisation growth rate in Lagos is 18.6%- 96% people arriving in Lagos come from within Nigeria- RURAL TO URBAN MIGRATION (incomes are 4 times
higher in city)- Smallest city in terms of land area, largest city in the country – over 20 Million- Growth rate: 500,000 per year, 3.4 million between 2000-2010- People move to Lagos from other countries: 29% from Benin/ 22% from Ghana/ 16% from Mali- Some immigrants come from the UK, USA, or China, However, international immigrants only make up 0.7%
of Lagos’ population
WAYS OF LIFE IN CITY
Consumption Ethnicity Housing Leisure/culture‘Lagos consumes N1.6bn worth of cattle daily’Nigerians' love of champagne - consumption in the west African country will reach 1.1 million litres by 2017
250 ethnic groups67% speak YorubaOther inhabitants are non-Yoruba speaking Nigerians, other Africans plus international
9 Thousand millionairesVariety of housing for wealthy – old colonial style, mansions, gated communities on Banana island (very rich)2/3 live in slums /squatter settlements
Nollywood filmsMusic- Afro beat/Afro hip-hop (Bracket)Shopping- street vendors / markets/ westernised shopping malls on Lagos islandStreet parties/pool parties/nightclubbingFestivals
CONTEMPORARY CHALLENGES
SQUATTER SETTLEMENTS
- 60% people live in squatter settlements (biggest is Makoko- floating city)- illegally built – flimsy out of scrap materials - The population estimates vary widely, from 40,000 to as much as 300,000.- Communal toilets (shared by 15 households)- Illegal electricity – but is scarce and one communal water point - High crime levels (controlled by gangs called ‘area boys’- one primary school – distinctive building design - There are no hospitals. Makoko continues to be served by a network of informal, unregistered clinics that
attend to basic ailments.
- Life revolves around the water with people living, working and shopping on small row boats
URBAN FUTURES

INFORMAL SECTOR JOBS
- Informal sector jobs includes a wide variety of work that is not regulated (monitored) by the government- In Lagos, many migrants cannot find a formal job so they find work doing whatever they can – selling food,
fishing, building boats, dredging sand and clay etc.- Accounts for 60-80% jobs- Worth $125 Billion of 2/3 of Lagos’ GDP- Long hours, low pay, no protection
WASTE DISPOSAL /HEALTH
- Lack of sewers/waste disposal - Malaria issue with stagnant water- 0.65kg waste per person per day- 10000 metric tonnes of waste a day in the city- Toxic waste / lack of control of both air and water pollution - Issues with waste are the biggest cause of disease- the biggest childhood killers- pandemics such as cholera,
diarrheal diseases and malaria are due to the waste but are easily preventable
SUSTAINABILITY INITIATIVE – WASTE MANAGEMENT/RECYCLING
- ‘The cleaner Lagos initiative’ – AIMS; Reduce amount of waste going to landfill sites and to Reduce air pollution
- Financed by the World bank – collecting waste from food markets and turning into compost – reduced methane creation and is turned into a useful product for fertilising farms/fields
- Ikosi fruit market is harnessing the waste methane product from rotting fruit and burning the methane to generate electricity – this same idea is beginning to be used also at Olusosun landfill where pipes are fitted into rubbish to collect methane to burn
- Wecyclers- collect between 500kg to 1 tonne recycling a day - Collect 525 tonnes of waste recycling which provides income for 3400 families in a year - Give points for recycling which texted to people and they exchange these for prizes like plates, pans, toasters
etc. - Also clean as mainly collected by bikes (no emissions)

One city in an AC – Leicester
Challenges of city and how it can become more sustainable
LOCATION
Leicester is an urban area located within the United Kingdom in Europe. It is found within UK region of the East Midlands and has Nottinghamshire to the north and Northamptonshire to the south.
Leicester is important economically within the East Midlands region as its central location M1/M69 to the M6 and good travel infrastructure makes it ideal for distribution industries.
Leicester is important historically within the country as the remains of King Richard III were recently discovered buried underneath a car park in Leicester city centre.
Leicester is important scientifically worldwide as the University of Leicester is recognised as a world leader in research into astrophysics and developing engineering solutions for space exploration. This is the main reason why Leicester was chosen as the location for the National Space Centre tourist attraction.
MIGRATION- CHANGING CHARACTER OF THE CITY
Leicester East Midlands England
Foreign Born 37% 10% 14%
White British 50% 90% 86%
Indian Asian 32% 5% 6%
English as main Language
70% 93% 90%
- Leicester has seen the highest growth in population in 10 years after London, Manchester and Milton Keynes.
- Between 2001 and 2011, the number of people went up by 47,100 (almost 17%), from 282,800 to 329,900, according to the latest 2011 Census figures.
WAYS OF LIFE IN CITY
Ethnicity Housing Leisure/cultureNarborough road in Leicester is the most diverse street in the UK (23 nationalities)
English as main language 70%.
Since 2000 there has also been a
Varied by areaHousing in richer areas tends to be larger housing with gardens e.g. Evington, StoneygateIn poorer area such as inner city areas housing tends to be terraced or higher density e.g. St Matthews,
Indian culture – Melton Road where you find authentic shops and restaurants. Melton Road is also home to the city’s Diwali celebrations – the largest outside India and well worth getting involved in. The area has largest
Leicester has one of the most diverse populations in the country
Narborough road in Leicester is the most diverse street in the UK (23 nationalities)
People in Leicester work together well there are very few problems between people
People in Leicester work together but they don’t live together
URBAN FUTURES

sharp increase of Polish Migrants. 7000 polish people have settled in Leicester since 2000. Leicester already has polish migrants who arrived after WW2. But this new influx has created further diversity in Leicester
Highfields, football stadium.However some of the inner city has been regenerated such as modern apartments along the River Soar, Western Boulevard and houses and new flats in Clarendon park.
concentration of Indian jewellery shops outside India. It has authentic sweetmeat shops, restaurants, chaat houses and lassi bars, offering some of the finest Indian cuisine.
Polish culture - Many eastern European migrants have arrived, opening many shops and creating businesses such as hand car wash services, found all over the city. Many supermarkets now stock Polish food, and on Narborough road you can find polish takeaways and restaurants.
Festivals – Caribbean carnival/Diwali
Historical – Richard III
CHALLENGES OF THE CITY
HOUSING AVAILABILITY
- Nearly 120,000 new homes needed in Leicester and Leicestershire by 2036.This works out at 4,700 homes a year.
- New developments currently underway at Thurmaston (5500 homes) and New Parks, as well as regenerated apartments in the city centre
TRANSPORT PROVISION
- Leicester is the 11th most congested city in the UK.
- Journey times increase by 87% during morning and evening rush hour.
- Arriva Bus Company is changing some of it routes to make them more punctual. This means people will have to walk further to bus stops.
ACCESS TO SERVICES/INEQUALITY
• Schools -The proposed £45 million expansion of Babington, Crown Hills, English Martyrs, Judgemeadow, Rushey Mead, Soar Valley, St Paul's, and The City of Leicester, will create 2,500 extra places across the city - the equivalent of building two new schools.
• Hospitals - Casualty crisis at Leicester hospitals shows no sign of stopping. Leicester Royal Infirmary is currently being expanded to cope with the increase number of patients. In 2016 20% of patients where not seen in first 4 hours of arriving at A&E.
• Inequalities linked to professional jobs which are one where someone may have a high level of education, for example: doctor, teacher or an accountant. High areas are Clarendon park/Stoneygate. Low areas are Highfields/St Matthews/ Spinney Hill- this links to house prices-3 bedroom house- Greenhill road/Queens road (Clarendon Park) £250000-£350000, whereas Highfields is £170000-£200000.
SUSTAINABILITY INITATIVE – PARK & RIDE
Air pollution in Leicester CBD
Leicester has highest recorded levels of nitrogen in
the UK
LEICESTER’S SUSTAINABILITY ACTION PARK & RIDE
Park & ride is a Leicester sustainable initiative for reducing urban traffic congestion and air pollution is a Park and Ride car parks. This is where drivers leave their cars in car parks on the outskirts of a city and travel to the city centre on public transport.
Advantages disadvantages
Reduces the amount of traffic congestion and air pollution in city centres
The buses have diesel engines which cause the worst air pollution
They run regularly every 15 minutes They don’t appear to be very popular so the council have dropped the prices
They are cheaper than city centre car parks It is difficult to carry large amounts of shopping onto a bus
They often get full up at peak times of the day People use them less in bad weather
There are three park and rides in Leicester
The buses use bus lanes to get you into town more rapidly than if you were in a car

Dynamic Development Zambia Millennium Development goals
Zambia meets some targets Falls short on others
Most children attend primary
1990 80% 2010 95%
Child mortality is still high
1990 195 2010 120
Gender equality in primary education = equal for primary but still unequal in secondary
Mothers still die in childbirth
1990 610 2010 450
Number with HIV/AIDS has fallen
1990 15% 201012%
Many lack proper sanitation
Zambia has gained Debt relief Extreme poverty not fallen significantly
1990 55% 2010 40%
Zambia
Development over time … • 1970 – the price of copper falls
and Zambia has to accept aid. • AIDS spreads across Zambia. • 1990 – debt it high. Food is
expensive and there are riots. • 2000 – copper starts to rise
again. • 2006 – the IMF cancel Zambia’s
debt. • 2010 – Zambia develops new
industries in tourism, farming and hydro electric power through the Kariba Dam.
A brief history … Is rich in minerals like copper but has never developed. It is landlocked and was a Britsh colony in 1888 until 1964. With a population of 14 million, 80% can read and write and the gross national income is $3,000.
The Millennium Development Goals (MDGs) In 2000 world leaders agreed to these MDGs. They are…
1. Halve extreme poverty and and hunger 2. Reduce child mortality3. Improve maternal health 4. Achieve primary education everywhere
Zambia’s achievement of these was mixed. The number of HIV infections has dropped, most children attend primary school but child mortality is still high and many mothers still die in pregnancy/childbirth.
• 90% of children attend primary school• 10% of the populstion is affected by AIDS• 140 childen per thousand die under 5yrs old
Foreign investmentIn 2012 Zambia started a project called ‘Why invest in Zambia?’ The country has been a peaceful democracy since 1964, the economy has been growing since 2000, Zambia borders 8 countries and is part of the World Trade Organisation (WTO) and 50% of its land is suitable for farming.
Zambia’s reliance on a single commodity – Copper Zambia relies on the copper metal it has, it makes up 70% of its international export. Between 1970-2000 the price of copper fell and this put the economy into decline and Zambia went into debt. Since 2000 the price has risen but Zambia wants to diversify its economy. China uses the most copper in the world and has therefore invested in Zambia. Over 500 Chinese companies invest in Zambia from mining to tourism to manufacturing. China has expanded the Kariba Dam, built 8,000km of new roads and there are 100,000 Chinese people now living and working in Zambia.
DYNAMIC DEVELOPMENT

Zambia
Bottom-up development case study
Room to readZambiaBottom-up Development- is funded and carried out by Non-Government Organisation (NGO) in co-operation with local communitiesNGO = charity
Room to Read is an NGO that is working to improve literacy in Africa and AsiaIn ZAMBIA one of the NGOs main projects is Girls Education ProgrammeAims to promote gender equality in education
Educational problems girls face in Zambia
High dropout rate from school especially in rural areas as culturally girls expected to help at home and earn money
2:1 ratio of girls to boys drop out Girls sometimes forced into early marriage or become pregnant and have to leave school Class size is on average between 40 and 50 so achievement is difficult
The successes of this bottom-up development strategy are-
• established 487 school libraries• supported 1,617 secondary school girls through our Girls’ Education Programme and provided 55 classes with improved reading and writing instruction. • In total programmes have impacted 320,328 children and 1,461 teachers in Zambia.
Potential disadvantages of bottom-up strategies are:
May not be planned very systematically so might happen in some places but not others If aid/money is withdrawn the scheme may have to close as aid pays for workers
Top-Down Development StrategyKariba Dam - Zambia - Central Southern AfricaLIDC - low life expectancy at 52 and HDI is 0.43 (ranked 164/187 in world)
Kariba Dam
Funded by governments of Zambia and Zimbabwe so is an example of top-down developmentBuilt in 1950sProduces HYDRO ELECTRIC POWER (HEP) - copper mines in Zambia need the electricity
DYNAMIC DEVLOPMENT

Many advantages include
HEP helps Zambia develop manufacturing industry which in turn help close development gap HEP does not produce carbon emissions and is renewable
Disadvantages include
57000 Tonga people were moved and resettled many a long way from their original land in the Zambezi valley
Natural flooding no longer occurs downstream leading to loss of ecosystems and farmland
Future concerns about the Kariba Dam
Possible that dam could collapse as riverbed is being eroded undercutting dam If dam collapses then 40 % of southern Africa’s HEP would be lost Ecosystems and wildlife as far as Indian Ocean could be lost
Is top-down a good option?
60 years ago only optionHowever there was no consultation with local people about type of development that they would have liked to have
Top down development – ‘The Kariba Dam’ Bottom up development – ‘Room to Read’
Advantages: power is vital for the copper industry, renewable form of energy; fishing and tourism have developed around the Lake.
Its aims: increase the years of schooling for girls, increase girls self-awareness and life skills, increase family and community support for girls education.
Disadvantages: 57,000 local people were evicted from the land and moved to less fertile land,
Why target girls…higher drop out rate, girls are expected to do chores and parents don’t value education for girls. Girls are pushed into early marriage.
The future…the dam could collapse because of erosion. Mozambique would be flooded within hours, ecosystemsa and wildlife wold be lost and 3.5 million peoples lives would be at risk from flooding.
Reading for success…school attendance is poor and there are very few schools in Zambia’s countryside. Room to Read trais teachers to engage students, children like Milmo travel 90mins to school and he is learning to read, he wants to become a teacher one day himself.

An attempt to achieve food security in Tanzania at a local scale
Goat Aid in Babati Northern Tanzania
Location – Babati District Northern Tanzania – 90% of population live in villages and depends upon agriculture
Goat Aid Facts
Example of bottom-up aid Farm Africa a NGO working with local people ask them about their needs Toggenburg goats chosen Goats produce 3 litres of milk a day Goats given on credit as Farm Africa believes that the villagers will look after them more if not free
Advantages/positives
More nutritious diet – cheese, butter, milk, crops Crops better yields due to using goat manure as a fertiliser Money from selling spare milk helps villagers improve their houses Can afford to send children to school so long term sustainability as children will earn more money as they
will get better paid jobs in tertiary sector Successful as income for farmers in Goat Aid scheme 3 times higher than those not in the scheme
Criticisms of the scheme
Goats require lots of water which is scarce Goats hooves and overgrazing damage land and lead to desertification Vet bills expensive if goats get ill

A past attempt at a national scale to achieve food security
Tanzania-Canada Wheat Project (1967-93)
Why was the project introduced?
1967 President of Tanzania argued that should grow own food Severe droughts in 1973 and 1974 made food security even more important Mid 70’s – 90% maize and 80% wheat was imported 1975 relied on emergency food aid for first time
What was the Tanzania-Canada Wheat Project?
Canada was asked to help as it was used to growing lots of wheat So it was an example of top-down development 1968-1993 Canada provided $95 million in aid Project covered 26 400 hectares in Hanang Province in northern Tanzania Canada provided seeds, training and machinery At first seeds and equipment was free but eventually Tanzania had to pay for them
Why was the project seen as a success?
Provided 60% of all Tanzania’s wheat Road, rail and electricity connections were improved Employed up to 400 people In 1992 drought Tanzania was only southern African country not to rely on food aid
Why was the project seen as a failure?
Forcing the Barabaig tribe off their land where they grazed their cattle so wheat could be grown caused conflict and was very controversial – project threatened the livelihoods of 40 000 people
Growing one crop reduced biodiversity and soil fertility decreased After harvesting heavy rain washed away top soil Most Tanzanians eat maize so low technology bottom-up maize production might have been a better project
Evaluation of its effectiveness
Who benefitted most from the project? Tanzania or Canada? Were their conditions of the aid given by Canada to Tanzania? Was top-down development appropriate?
RESOURCE RELIANCE

A current attempt at a national scale of achieving food security
Southern Agricultural Growth Corridor of Tanzania (SAGCOT)
Project Fact File
Started in 2010 Aim is to improve farming in Tanzania in a
growth corridor ( a region of economic growth)
East to west strip of land across the width of Tanzania is very fertile
Connected to port of Dar es Salaam by road and TAZARA railway
Investment in infrastructure like roads, irrigation and railways by national and foreign governments and TNCs e.g. China has invested $39 million in the TAZARA railway
Will help food security by producing more food and earn money by exporting food to other countries Claim is that by 2030 project will create thousands of jobs and lift millions out of poverty
Early Successes
Kilombero Plantation has had millions of dollars invested in it Tractors, irrigation and a rice mill have been provided Some farms have produced 8 times more rice Getting a better price for their rice as access to markets has improved 4 developments near Morogoro also had successes – 2 tobacco factories been built providing a market for
famers tobacco crops, sunflower processing plant increased farm incomes and a factory making farm equipment has increased its output
Criticisms
Most investment benefits TNCs/commercial farms Small landowners not been involved in decision making ( top-down) Nomadic (move around looking for best pasture) tribes lost land and access to water for animals Last 2 criticisms the same as those for the Tanzania-Canada wheat project so government has not learnt
from their past mistakes
RESOURCE RELIANCE