abstract€¦ · web viewone of the biggest problems in developing a model of truck movements is...
TRANSCRIPT

Southeast Florida RegionalTravel Characteristics StudyPrepared for:Florida Department of Transportation, Districts IV and VIMiami-Dade MPOBroward County MPOPalm Beach County MPO
Submitted by:CARR SMITH CORRADINOIn association with:Gannett Fleming, Inc.Florida State University Survey Research LaboratoryYvonne Ziel Traffic Consultant, Inc.PMG Associates, Inc.Dickey Consulting ServicesDavid Fierro & Associates
Executive Summary Report
CORRADINO
October 2000

CORR
ADIN
OExecutive Summary Report
PAGE
I
Table of Contents
1. Introduction.................................................................................1
2. Household Survey........................................................................1
3. On-Board Transit Survey..............................................................7
4. The Visitor Survey......................................................................13
5. Truck Movement Survey............................................................16
6. Workplace Survey......................................................................19
L:\Projects\2361\Execsum\Execsum.doc

PAGE
IIPA
GE II
CORR
ADIN
OExecutive Summary Report
List of TablesTable 1: Completed Surveys by System.....................................8Table 2: Visitor Survey: Trips Per Room by County...................16Table 3: Visitor Survey: Trip Purpose by County.......................16Table 4: Workplace Survey: Employment Center Locations......23Table 5: Workplace Survey: Employer Responses....................25Table 6: Workplace Survey: Employee Responses....................26
List of Figures
Figure 1 Household Survey Instrument...................................3Figure 2 Mode Shares..............................................................7Figure 3 Transit Survey Form................................................10Figure 4 Visitor Travel Survey Form.......................................14Figure 5 Visitor Trip Log.........................................................15Figure 6 Truck Movement Survey..........................................18Figure 7 Employer Survey......................................................20Figure 8 Employee Survey................................................21-22

PAGE
5PA
GE 5
CORR
ADIN
OExecutive Summary Report
IntroductionState and local governments in Florida spend millions of dollars annually on surface transportation facilities – roads, buses and trains. For example, more than $1.6 billion is expected to be spent on transportation improvements between now and the year 2020 in Palm Beach County. The figure for Broward County exceeds $2.1 billion. Estimates for Miami-Dade County are similar.
To plan effectively, state and local government planners need to develop a thorough understanding of when, where, how and why people travel. This information, combined with an understanding of where growth will occur, will allow planners to estimate where congestion is likely to occur in the future and to evaluate how improvements to roads, buses and trains might improve travel conditions.
The Southeast Florida Regional Travel Characteristics Study (Travel 2000) provided the needed observed travel information for developing planning tools for the three-county region of Southeast Florida.
Data collection efforts began in December 1998 and were completed in September 1999. Travel logs were collected for 5,100 households -- all travel by all residents for one day. Approximately 10,000 bus riders were surveyed. Visitors were surveyed at 79 hotels. Trucking information was gathered from 848 commercial establishments using trucks. Workers were surveyed at seven major employment areas in the three counties.
This report presents a summary of the findings of this extensive survey effort.
The Household SurveyPerhaps the most well-known and often-conducted type of travel survey is the household survey. Data was collected to characterize demographics of household and travel patterns of household members. The survey was designed to collect data for calibrating travel forecasting models for:

PAGE
5PA
GE 5
CORR
ADIN
OExecutive Summary Report
What characteristics of households, such as the number of persons, number of workers, auto availability, income and presence of children, are correlated with the number of trips made by household members in an average day?
How many trips, by purpose, are made on an average day? Generally, travel modelers are interested in home-to-work trips, several subcategories of home-to-other trips, and trips that have neither end at the home.
What travel modes are used, and how is the choice of mode influenced by household characteristics? Modes may include public transit, drive-alone auto, carpool and non-motorized modes.
How long were the trips for each trip purpose in terms of time and distance?
At what time of the day were the trips made?
Most household surveys today use small sample surveying techniques. Statistical theory says that the sample size needed to characterize a given group is not related to the size of the group if the group is sampled randomly and without bias. The sample size is controlled more by the number of groups that need to be characterized, such as the number of persons and other demographics as noted above, number of trip purposes, geographic stratifications and other similar considerations. The sample size calculated for Travel 2000 was 5,060 households. This sample required a specified number of households by each of 18 geographic areas and for a set of demographic characteristics.
Perhaps the method most commonly used today is the computer-aided-telephone interview (CATI). Travel 2000 used a variation of the CATI-based survey. The Florida State University Survey Research Laboratory conducted the CATI survey. It was a two-stage survey. Households were identified from a list of random phone numbers. These households were called or recruited. During the recruitment phone call basic demographic information was assembled, and respondents were asked to participate in the survey. The CATI equipment provided the survey questions, verified allowable responses, branched as appropriate depending on answers to the survey questions and provided data entry. An innovation in the Travel 2000 survey was real-time geocoding during the retrieval of all CATI responses. Geocoding was done while the respondent was on the telephone. Thus, the interviewer could probe and verify the address information, eliminating all unknown address locations.

PAGE
5PA
GE 5
CORR
ADIN
OExecutive Summary Report
A common problem in household surveys is underreporting trips. In an effort to minimize underreporting, the survey (Figure 1 presents a sample form) was organized to gather travel information for tours. A tour was defined as a series of trips that began at home, visited other locations, and ended at home. This idea was conveyed in test and graphical form. Tours were utilized to minimize the underreporting of short trips. Another advantage of this approach is that the survey data will support emerging new models that use tours and “trip chaining.”

PAGE
5PA
GE 5
CORR
ADIN
OExecutive Summary Report
Figure 1Household Survey Instrument

PAGE
5PA
GE 5
CORR
ADIN
OExecutive Summary Report
Figure 1 (continued)

PAGE
5PA
GE 5
CORR
ADIN
OExecutive Summary Report
Figure 1 (continued)

CORR
ADIN
OExecutive Summary Report
PAGE
26
Households that agreed to participate were mailed a survey package that included travel diaries for each resident for all travel during the survey day. The responses were then retrieved using the CATI method and real-time geocoding. The response rate for households, once recruited, was very high, about 90 percent.
The survey questionnaire was extensive. Some key statistics obtained from the 5,168 households responding to the survey include (generally, these are raw numbers that may change slightly when weighted and factored):
The average household makes 9.811 person trips per day (9.86, 9.61 and 9.97 for Broward, Miami-Dade and Palm Beach residents, respectively).
A non-home-based trip was the largest category for both Palm Beach County (26%) and Broward County (24.8%), while home-based-work was the largest category for Miami-Dade County (26.6%). The second largest category was home-based-work for Broward County (23.2%), followed by "home-based-other" for Palm Beach County (23.3%), while home-based-other and non-home-based both tied for the second largest category for Miami-Dade County (22.3%). A "non-home-based" trip was the largest category for the region as a whole (24.4%), followed by home-based-work (23.1%).
Region wide, the average household had access to 1.80 vehicles. Both Miami-Dade and Palm Beach Counties averaged 1.77 vehicles per household, while vehicle availability was slightly higher in Broward County (1.85).
The average auto occupancy was 1.33 persons per vehicle. The average auto occupancy rate for both Miami-Dade and Palm Beach Counties was 1.34, while the rate was slightly lower for Broward County (1.31).
Most travelers were either auto drivers or auto passengers (92.6% for the region) (Figure 2).
The peak travel hour is the hour beginning at 7 a.m. (12.1% of the daily trips). The highest afternoon travel hour is the hour beginning at 5 p.m. (8.5% of the daily trips).
The average home-based-work trip travel time is 29.59 minutes for the entire region. The average time has been weighted and factored, and the response times were limited to 1-200 minutes. A detailed analysis of the development
1 These trip rates were corrected to account for underreporting of persons and workers during the collection stage of the survey.

CORR
ADIN
OExecutive Summary Report
PAGE
26
of these factors is explained in the Technical Report Development of Trip Rates and Friction Factors for Southeast Florida Demand Forecast Models.
Only a few statistics have been presented here. Extensive data tabulations will be available from the Technical Reports of this project as well as data files that have been organized to support travel-forecasting models.
On-Board Transit SurveyA companion survey to the household survey was conducted on transit vehicles. The purpose of the transit on-board survey was to provide travel information for transit riders to be used in developing and calibrating travel models. The transit ridership data is used to enhance or “enrich” the data provided by the household survey. The household survey will not pick up enough transit riders because the region-wide transit mode share is only slightly more than one percent. The transit

CORR
ADIN
OExecutive Summary Report
PAGE
26
survey must gather information on the demographics of the traveler’s household as well as the characteristics of the transit trip.
The transit on-board survey was conducted for transit systems providing fixed-schedule, fixed-route services in Palm Beach, Broward, and Miami-Dade counties. A sample survey of seven transit systems was conducted. The survey focus was weekday travel 24 hours per day. The desired number of samples in the sample plan was designed to achieve a +5 percent accuracy at a 95 percent confidence level of transit usage at the county level.
Surveyors offered forms to all passengers boarding the bus or train car. The forms were filled out during the trip or mailed (Figure 3 presents a sample form). Survey forms were available in English, Spanish, and Creole.
11,173 transit on-board surveys were completed providing a detailed snapshot of the region’s transit users. Survey responses were grouped into two categories based upon the types of questions asked of transit users – household demographics and travel patterns.
The majority of completed surveys (44%) were received from Miami Dade Metrobus (Table 1). Broward County Transit patrons provided 33 percent of total completed surveys.
Table 1: Completed Surveys by SystemTransit System Frequen
cyPercen
t Miami-Dade Metro Rail 477 4% Tri-Rail 615 6% Palm Tran 1,492 13% Miami-Dade Metro Bus 4,870 44% Broward County Transit 3,719 33%TOTAL 11,173 100%
As mentioned earlier, the survey collected both demographic and trip information. Key observations include:
Household Size: The largest number of surveyed transit users (23%) lived in two-person households. Closely behind were transit users (21.9%) who lived in households of five or more people.

CORR
ADIN
OExecutive Summary Report
PAGE
26
Children in Household: Almost half (47.3%) of transit users reported no children in their household over the age of 18. Respondents reporting one child under the age of 18 were next at 21 percent. Households with four or more (the maximum amount of children on the survey form) comprised the least amount (5.7%) of completed surveys.
Household Outside Employment: More than half (53.8%) of survey respondents reported two or more people in their household with an outside job during the weekday. Survey respondents with one person employed outside the home followed at 31.7 percent.
Household Vehicles: The largest number of transit survey respondents (39.9%) reported that there were no vehicles available to drivers in their household. Respondents reporting the availability of one vehicle followed closely behind at 35.4 percent.
Household Income: Almost half of surveyed transit users (47.3%) reported a household income of $15,000 or less. The next most frequent responses were $15,000 to $30,000 (34.4%) and $30,000 to $50,000 (12.9%).
Transit User Location Prior to First Trip: Almost half (49.3%) of the respondents reported that they were at home prior to their first trip. Next followed work (21.3%) and other (10%). Possible choices included home, work, shopping, social-recreational, school-class and other.
Distance to Transit Location: Transit users were surveyed regarding the distance traveled (walking or driving) to reach the bus stop or train station. More than 2/3 of respondents (69.9%) reported walking three blocks or less to reach the transit location. The second largest response reported walking four to eight blocks (16.3%).
Mode of Travel to Transit Location: A little over eighty-six percent of the
respondents reported walking to reach transit. The second most frequent response (6.8%) reported being dropped off by auto.
Transit Wait: Approximately one-third (32.1%) of survey respondents reported waiting between six to 10 minutes for the arrival of a bus or train. The next largest response (27.4%) reported waiting between zero and five minutes.
Transit Fare: The type of fare paid by transit users was surveyed and included the possible choices of full cash fare, discounted cash fare,

CORR
ADIN
OExecutive Summary Report
PAGE
26
discounted pass or token. The largest number (56.2%) of respondents reported paying full cash fare. The second largest response (22.9%) reported use of a discounted pass.
Transit User Destination After Trip Completion: Subsequent to trip completion, the highest percentage of respondents (39.5%) reported their destination as home. The next highest percentage of respondents (28.3%) reported their destinations as work.
Figure 3Southeast Florida Transit Survey
The FDOT is planning for the future. To do that we need to learn more about your experience on public transportation in southeast Florida. We would appreciate it if you would take a couple of minutes right now to complete this survey and return it to the surveyor as you leave the bus. Please complete as many questions as your time allows. If you don’t have time to complete the survey, you can take it home and mail it in (no stamp required). We don’t need your name and all information is confidential.
A. How many people live in your household? (Please circle one.)1 2 3 4 5+
B. How many children under 18 are in your household? (Please circle one.)0 1 2 3 4+
C. How many people in your household have a job outside the home during the weekday? (Please circle one.)
0 1 2+
D. How many vehicles (cars, pick up trucks, motorcycles, etc.) are available to the drivers in your household? (Please circle one.)
0 1 2 3+E. Where were you before you got on the first bus or train for this trip?
I WAS AT:
(Circle One) Address of the place that you circledHomeWork
Shopping (street address [or corner or building], city, zip) orSocial/Recreational nearest major intersection
School Other name of place or nearby landmark
F. What time was it when you left the place you circled in Question E above?
ID#
VERYIMPORTANT

CORR
ADIN
OExecutive Summary Report
PAGE
26
a.m. p.m.
G. Approximately how far did you walk or drive to get to the bus stop or train station (Please circle one)?Walked (in blocks): 3 or less 4 – 8 9+ or Drove (in miles): 1 or less 1 – 3
3+
H. How did you get to the bus or train from the place you circled in Question E above? (Please circle one.)
Walked Drove Auto Dropped off by Auto Other
I. How many minutes did you wait for the bus or train (Please circle one)?
0 – 5 6 – 10 11 – 20 20+ minutes
OVER

PAGE
26
CORR
ADIN
OExecutive Summary Report
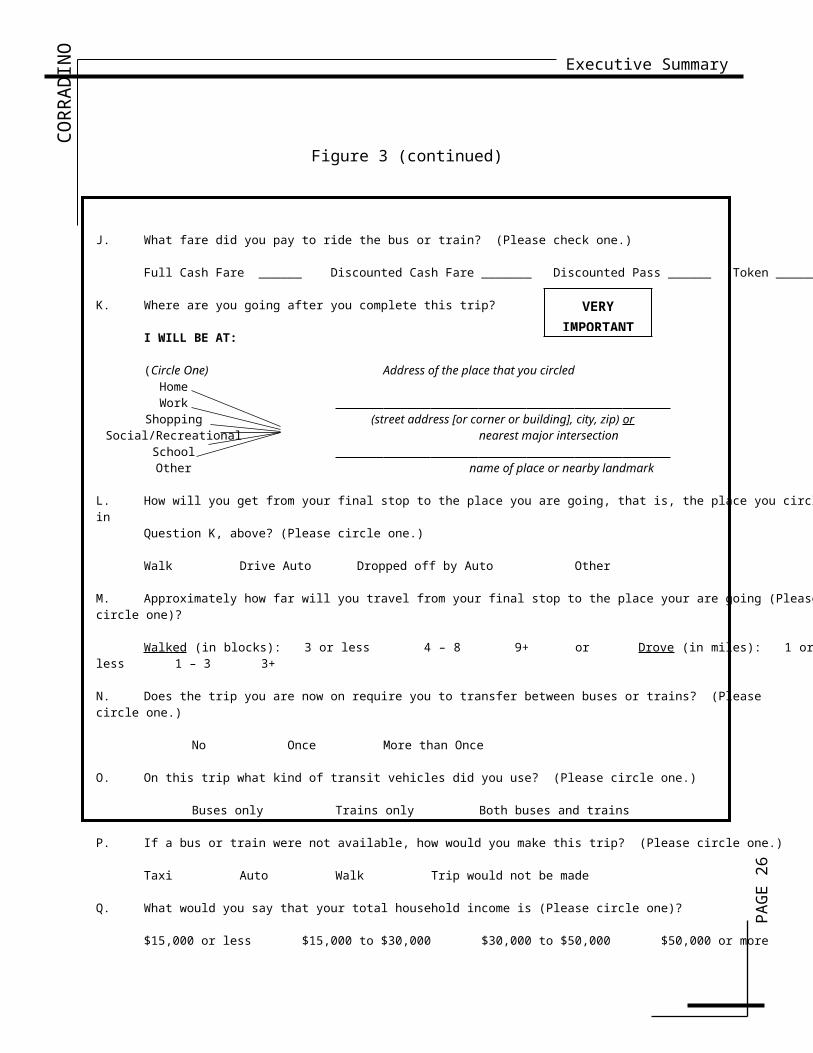
Figure 3 (continued)
J. What fare did you pay to ride the bus or train? (Please check one.)
Full Cash Fare ______ Discounted Cash Fare _______ Discounted Pass ______ Token ______
K. Where are you going after you complete this trip?
I WILL BE AT:
(Circle One) Address of the place that you circledHomeWork
Shopping (street address [or corner or building], city, zip) orSocial/Recreational nearest major intersection
School Other name of place or nearby landmark
L. How will you get from your final stop to the place you are going, that is, the place you circled in Question K, above? (Please circle one.)
Walk Drive Auto Dropped off by Auto Other
M. Approximately how far will you travel from your final stop to the place your are going (Please circle one)?
Walked (in blocks): 3 or less 4 – 8 9+ or Drove (in miles): 1 or less 1 – 3 3+
N. Does the trip you are now on require you to transfer between buses or trains? (Please circle one.)
No Once More than Once
O. On this trip what kind of transit vehicles did you use? (Please circle one.)
Buses only Trains only Both buses and trains
P. If a bus or train were not available, how would you make this trip? (Please circle one.)
Taxi Auto Walk Trip would not be made
Q. What would you say that your total household income is (Please circle one)?
$15,000 or less $15,000 to $30,000 $30,000 to $50,000 $50,000 or more
VERYIMPORTANT

PAGE
26
CORR
ADIN
OExecutive Summary Report
Mode of Travel from Transit Location: The most frequently reported mode of travel from final transit stop to ultimate destination was walking (82.6%).
Distance from Final Stop to Destination: Most transit users (64.1%) reported walking three blocks or less to reach their ultimate destination upon completion of their final transit stop. Walking four to eight blocks was the second most frequently reported distance (18.2%). These percentages are very similar to those reported for the distance to the transit location.
Transfer Between Buses or Trains: Approximately half (50.4%) of respondents reported that their trip does not require a transfer between buses or trains. Next was 34.5 percent of respondents who reported that their trip required one transfer.
Lack of Transit Availability: Transit users were surveyed regarding the options available to them in the event that transit was not available. Most respondents (36.8%) reported that their trip would not be made if transit service were not available. The next most frequent responses were auto (29.5%), taxi (19.3%) and walk (14.4%). Those transit riders that would have made their trip by auto are assumed to be “choice riders.”
Trip Destination: As expected, most of the riders surveyed were on their way to or from home or work.
Distance to Transit: The walking or driving distance to access transit varied by system. Of those surveyed, the bus systems generally had more riders with shorter distances walked or driven to the transit system than Tri-Rail or Metrorail. The percentage of the riders surveyed who drive to access transit was also higher for the rail system than for the bus systems.
The transit trip ends need to be geocoded to be useful in mode choice model calibration. FSU was able to geocode approximately 82 percent of the origins and 81 percent of the destinations.

PAGE
26
CORR
ADIN
OExecutive Summary Report
The Visitor SurveyThe visitor survey was intended to collect data at hotels and motels to characterize travel in the region by visitors. Again, the purpose was to provide data to support the travel models.
Surveyors conducted face-to-face visitor travel interviews on hotel/motel premises. Hotel/motel guests were intercepted randomly. Each surveyor was equipped with survey forms and a set of maps. As guests came into the lobby, the surveyors asked those guests who appeared to be approachable (i.e., they are not rushing and in a hurry) to participate in the survey. When a guest or party agreed, the surveyor escorted them to a table and completed the survey. When completed, the surveyor "recruited" another party.
The locations of trip ends were identified by Public Lands Surveys section number (using county maps typical of those bought in convenience gas stations). The interviewers worked with a guest or individuals in a party to see where their trips occurred. Laminated maps were used to assist in defining locations. In addition, a list of common locations was developed for each county to simplify the process.
The survey form included the name of the hotel/motel, the party’s general travel purpose, dates of travel, the number of people in the party, and the room rate (Figures 4 and 5).
After gathering general data on each party of visitors, specific information regarding travel was gathered and filled out by the surveyor on the Visitor Travel Log form. The form was used to record information on the trips completed by each survey respondent within a 24-hour period.
In the three-county region, 1,063 visitors (persons) were surveyed. Approximately 33 percent of the surveys were collected in Broward County, 42 percent in Dade County, and 25 percent in Palm Beach County. The average occupancy per room was 1.63 people.
With the exception of conference trips, well over half of all types of trips were made by auto. For all trip purposes, two occupant vehicles were most common. The average auto occupancy for all trips was 2.3 persons per vehicle.
PAGE
26
CORR
ADIN
OExecutive Summary Report
Figure 4Visitor Travel Survey Packet
Thank you for agreeing to participate in the hotel/motel visitor survey for the Southeast Florida Regional Travel Characteristics Study. The information from this survey will be used by state and local governments to improve local roadways and public transportation. All information is confidential.
NAME OF SURVEYOR ____________________________________
COUNTY_________________ DATE OF SURVEY _________________
1. NAME OF HOTEL/MOTEL: ______________________ NUMBER FROM MASTER MAP _____
2. NUMBER OF PEOPLE IN PARTY (Please circle one):
1 2 3 4 5+
3. PARTY’S GENERAL TRAVEL PURPOSE (Please circle one):
Work Vacation Personal Business Other:________________(please fill in)
4. TRAVEL DATES: ____/___/99 TO ___/___/99
5. ROOM RATE PER NIGHT (Please circle one):
Less than $50 $51 to 79 $80 to $100 $100 to $150 $151 to $200 $201+
6. HOW DID YOU GET TO SOUTH FLORIDA? (Please circle one):
Auto Train Airplane Boat Inter-city bus
7. HOW DID YOU GET TO THE HOTEL? (Please circle one)
Auto City-bus Tri-Rail Metrorail Metromover
Inter-city Bus Taxi Shuttle Service Limo
8. DID YOU HAVE VISITORS FROM OUTSIDE THE HOTEL? ________ YES_______ NO
8A. IF YES, HOW MANY? _____________
FOR EACH PERSON IN THE PARTY, PLEASE COMPLETE THE ATTACHED FORMS. WE NEED GENERAL INFORMATION ON THE TRIPS YOU MADE YESTERDAY. THE SURVEYORS WILL ASSIST YOU IF YOU HAVE QUESTIONS ABOUT THE LOCATION OF YOUR TRIPS. THANK YOU.

PAGE
26
CORR
ADIN
OExecutive Summary Report
Figure 5Visitor Trip Log
Person 1 Date: _________Start Time, 24 hour period _______ am/pm End Time, 24 hour period _______ am/pm
Trip #_____
Starting Point:_______________________ Starting time:_______________________
Ending Point:________________________ Arrival time: ________________________
Trip Purpose (circle one): recreation work shopping conference dine/eat
Mode of travel (circle one): auto** city-bus walk bicycle
Metromover Metrorail shuttle service limo charter bus Tri-Rail
**If Auto (Following questions are only for those whose response was Auto)
A. Was the car (Circle one):Personal vehicle rental car taxi other ________________
B. How many people were in the car on this trip (Circle one):1 2 3 4 5+
C. Parking cost (circle one): Free less than $1.00 $1.00 to $3.00 $3.00+
Note: The survey instrument was set up to allow for trips for each of five persons.

PAGE
26
CORR
ADIN
OExecutive Summary Report
Data was also collected on the number of trips per room by county (Table 2). The average number of trips per room for the three-county area was 7.8. Data was also tabulated by trip purpose by county (Table 3).
Table 2: Trips Per Room Surveyed
County Rooms TripsTrips
Per RoomBroward 211 2,015 9.5Dade 280 1,949 7.0Palm Beach 160 1,133 7.1
Total 651 5,097 7.8
Table 3: Trip Purpose by County
CountyRecreatio
n WorkShoppin
gConferenc
e Dine/EatNo
Answer TotalBroward 1,070 172 176 15 570 12 2,015Dade 964 241 224 31 384 105 1,949Palm Beach 476 198 116 4 331 8 1,133Total 2,510 611 516 50 1285 125 5,097
Data from the visitors survey will support enhancement of the portions of the models dealing with visitor travel in Southeast Florida.
Truck Movement SurveyThe purpose of the truck movement survey was to provide information on truck movements, which will provide data for developing a truck component for travel demand models. Truck traffic is a main concern for roadway pavement and intersection design. It is important for highway capacity analysis because a truck is equivalent to more than one car in the traffic stream. The truck movement survey focused on three primary types of truck activities:
Truck, which is local delivery/distribution of goods, materials, and commodities.
Freight, which is long-distance trucking. Service, which refers to the truck activity associated with the delivery of
services, such as plumbers, repair services, etc.

PAGE
26
CORR
ADIN
OExecutive Summary Report
Modeling and planning for the movement of freight and goods has gained increased significance over the past few years, partly because of U.S. DOT planning requirements. One of the biggest problems in developing a model of truck movements is a lack of data that is useful for regional and urban travel modeling. The truck movement survey was designed to gather data to support a better truck model.
Initially, an extensive and detailed survey that collected truck trip origins and destinations was planned. However, during the pretest it was found that almost no trucking companies were willing to participate in the survey. Senior project staff members were then sent to the trucking companies to determine how to change the survey to make it more acceptable to the trucking companies. In most cases, these senior staff members were unable to secure a meeting with company officials.
As a result, an abbreviated survey with seven questions was developed (Figure 6). A pretest was conducted resulting in approximately a 10 percent response rate. It was decided to proceed with the survey. A total of 4,110 firms were contacted to participate, and 848 of them completed the survey. Approximately 40 percent of the surveys were collected in Broward County, 32 percent in Dade County and 28 percent in Palm Beach County.
The truck movement survey focused on three primary types of firms:
Local trucking, which is local delivery/distribution of goods, materials, and commodities.
Service trucking, which refers to the truck activity associated with the delivery of services, such as plumbers, repair services, etc.
Freight, which is long-distance trucking.
Of the 848 firms that participated in the survey 72 percent identified themselves as Local Service Trucking, followed by local trucking and delivery with 18 percent, and freight with 10 percent.
Miami-Dade County averaged the highest number of trucks on the road per firm with 9.4 trucks; followed by Palm Beach County with 6.6 trucks, and Broward County with 5.6 trucks on the road per firm. The three county average was 7.2 trucks.

PAGE
26
CORR
ADIN
OExecutive Summary Report
Companies were asked the number of employees at their location. Firms in Miami-Dade County averaged 16.8 employees per firm; followed by Broward County with 15.2 employees, and Palm Beach County averaged 14.1 employees per firm. The three-county average was 15.4 employees.

PAGE
26
CORR
ADIN
OExecutive Summary Report
Figure 6Truck Movement Survey Form
Travel 2000 Truck Survey/Information SheetName of Firm:1. Trucks are located at:
Street Number
Street NameCityZip
2. Type(s) and number(s) of trucks you have:Type(s) – See Sheet with Pictures
Types of Trucks Yes/No (circle one)
Number ofVehicles
A. Pick-up Van Y NB. Medium Y NC. Heavy/HD (tractor trailer)
Y N
3. Number of employees at the truck location
4. Number of trucks on the road per day
5. Average miles per truck per day
6. Average hours (operated) per truck per day
7. Average number of stops per truck per day
8. Type of business SIC(As described by respondent.) (Off truck list)
Once completed, fax to (954) 480-8836 or call with information

PAGE
26
CORR
ADIN
OExecutive Summary Report
toll free (877) 764-3266.
Dade County had the highest average miles per truck per firm per day with 86.9 miles for each truck; followed by Palm Beach County with an average of 74.6 miles, and Broward County with 72.9 miles per truck per firm per day. The three county average was 78.1 miles.
Trucks in Broward County averaged 6.0 hours of operation each day; followed by Dade County with 5.9 hours of operation, and Palm Beach County averaged 4.5 hours per truck per day. The three county average was 5.5 hours.
Trucks in Dade County averaged 4.9 stops per day; followed by Broward and Palm Beach Counties with 4.8 stops each. The three-county average was 4.8 stops.
The Workplace SurveyThe purpose of the Southeast Florida Travel Characteristics Workplace Mode Choice Survey was to collect data used to validate travel demand models. The data collected describes employee travel patterns and will provide a benchmark to evaluate model performance. The results of this survey effort produced new data that provide new insights into work-based travel patterns.
The Southeast Florida region, including Miami-Dade, Broward and Palm Beach counties, was surveyed in this effort. This workplace survey had two components: (1) the employer survey - used to gain general information about each type of business in the area where the surveys were distributed (Figure 7), and (2) a one-day trip questionnaire, which was distributed to all employees located at each participating business (Figure 8).
Throughout the region, including all seven sites, 579 employers were surveyed. Of them, 317 employers agreed to participate in the employee survey, or 55 percent. Among the 317 employers who agreed to participate, 1163 employee surveys were returned.
The methodology and findings of the Workplace Mode Choice Survey are discussed in this report. Included in this report are the following sections:

PAGE
26
CORR
ADIN
OExecutive Summary Report
Seven employment centers were surveyed in the Southeast Florida area (Table 4), three in Miami-Dade County, two in Broward County and two in Palm Beach County. These seven sites were chosen because they reflected typical commercial development patterns in Southeast Florida. The land use types were predominately industrial, predominantly commercial, or Central Business District. It was believed that choosing these three different land use types would measure a diverse set of employee trip-making characteristics. The sites were also chosen for their access to a public transportation facility, such as Tri-Rail or the public bus.
Figure 7Employer Survey

PAGE
26
CORR
ADIN
OExecutive Summary Report

PAGE
26
CORR
ADIN
OExecutive Summary Report
Figure 8Employee Survey

PAGE
26
CORR
ADIN
OExecutive Summary Report
Figure 8 (Continued)

PAGE
26
CORR
ADIN
OExecutive Summary Report
Table 4: Workplace Mode Choice Survey Employment Center Locations
Area # County Area Name/ Description TAZ
1999 Estimated
Employment*
Area 1 Miami-Dade Miami-CBD 653 2,800
Area 2 Miami-Dade
Airport West-Commercial & Industry 490 3,758
Area 3 Miami-Dade
Golden Glades- Industry & Commercial 102 3,227
Area 4 Broward Ft. Lauderdale-CBD 301 2,031
Area 5 Broward
Cypress Creek Uptown- Commercial/ TriRail
396 2,295
Area 6 Palm Beach West Palm Beach-CBD 196 1,431
Area 7 Palm Beach
Arvida-Office Park & Light Industrial 596 4,148
*Calculated from available FSUTMS ZDATA file.
Historically, travel demand models have used Traffic Analysis Zones (TAZs) as a way to divide the socioeconomic data into functional areas. Therefore, this data collection effort was carried out at the TAZ level, and the TAZs were defined as the unit of analysis for this workplace survey. Each site consisted of one TAZ.
The employer survey consisted of a personal interview with a representative from each employer within the site. The employer did not see the questionnaire, but was queried for the answers to the questions. The questionnaire was less than one page and had less than 20 questions for the company’s representative to answer, keeping the interview relatively short.
After the employer information was collected, a packet was prepared containing survey forms for each employer to distribute to all of his/her employees. The employee survey was conducted for one day’s worth of trips. Surveying the employees’ previous day of travel was done so the employees could complete the survey immediately. The employees filled out the survey the day it was distributed,

PAGE
26
CORR
ADIN
OExecutive Summary Report
and were able to return the completed form to the company’s representative the same day. This process encouraged greater response rates.
All employers were given enough questionnaires to pass out to every employee. The following information was solicited from each employee:
Trip origin and destination including land use categories, intermediate stops, travel times, mode choice, auto occupancy and parking,
Trip activity and purpose, and
Demographics including age, sex, race, job description, ownership of a driver’s license, car availability, household size, number of children less than 16 years old in the household and household income.
The survey instrument was divided into five sections. Most questions were answered by using check boxes, because check boxes are faster to answer for respondents. Check boxes also gave the appearance of a shorter questionnaire. Participants were thus more likely to fill out the whole questionnaire. Tables 5 and 6 present a summary of the results of the employer survey.
A total of 14,637 employee surveys were distributed throughout the seven sites. Of those, 1,163 or 9 percent of employee surveys were returned. The return rates ranged from 3 to 20 percent, usually higher in the industrial sites than in the downtown sites. The Cypress Creek Uptown site in Ft. Lauderdale had the greatest return rate with 20 percent of the surveys returned. The lowest return rate was in Airport West site in Miami.

PAGE
26
CORR
ADIN
OExecutive Summary Report
Table 5: Employer Responses: Workplace Survey: Totals and Percentages of Employers Surveyed
Area Name/ Description TAZ
Number or
Percentage
Total Employers
found
Employers who agreed
to participate in the
employee survey
Employers
returned
employee
surveys
Miami-CBD 653 # 48 33 10% 100% 69% 30%
Airport West-Commercial &
Industry490
# 92 57 14
% 100% 62% 25%Golden Glades-
Industry & Commercial
102# 65 51 11
% 100% 79% 22%Ft.
Lauderdale-CBD
301# 121 18 5
% 100% 15% 28%Cypress Creek
Uptown- Commercial/
TriRail
396# 98 74 30
% 100% 76% 41%West Palm Beach-CBD 196 # 94 36 8
% 100% 38% 22%Arvida-Office Park & Light
Industrial596
# 61 48 19
% 100% 79% 31%TOTAL FOR
N/A# 579 318 111
SEVEN SITES % 55% 55% 35%

PAGE
26
CORR
ADIN
OExecutive Summary Report
Table 6: Employee Responses: Workplace Survey:Totals and Percentages of Employees Surveyed
Area Name/ Description
TAZ# of
Employee surveys
distributed
# of Employee surveys returned
% of Employee surveys returned
Miami-CBD 653 716 108 15%Airport West-Commercial & Industry
490 5,394 148 3%
Golden Glades- Industry & Commercial
102 1,357 150 11%
Ft. Lauderdale-CBD 301 753 134 18%Cypress Creek Uptown- Commercial/ TriRail
396 2,033 409 20%
West Palm Beach-CBD 196 747 49 7%Arvida-Office Park & Light Industrial 596 3,637 304 8%
Total for Seven Sites N/A 14,637 1,163 9%