web mapping tool documentation 2 - oedit · web mapping tool documentation ... the web mapping tool...
TRANSCRIPT

1625 Broadway, Suite 2700 | Denver, CO 80202 USA | P 303.892.3840 | F 303.892.3848 | www.AdvanceColorado.com
COVER PAGE
ENTERPRISE ZONES RE‐DESIGNATION
WEB MAPPING TOOL DOCUMENTATION January 26, 2015
1625 Broadway, Suite 2700 | Denver, CO 80202 USA | P 303.892.3840 | F 303.892.3848 | www.AdvanceColorado.com
TABLE OF CONTENTS
TABLE OF CONTENTS
INTRODUCTION 1
APPLICATION LAYOUT 2
WEB MAP NAVIGATION 3
LOCATION SEARCH 4
MAP LEGEND 5
BASEMAP GALLERY 6
DATA LAYERS 7
DATA TABLE 8
MAP POP‐UPS 10
PRINTING 11
HELP & INFORMATION 13
APPENDIX: DATA SOURCES 14
1625 Broadway, Suite 2700 | Denver, CO 80202 USA | P 303.892.3840 | F 303.892.3848 | www.AdvanceColorado.com
PAGE 1
INTRODUCTION
Intended Use The intended use of the Web Mapping Tool is to give users the ability to properly identify areas that meet basic eligibility criteria for Enterprise Zone status, and by which metric—i.e. Population Growth Rate, Unemployment Rate, and/or Per Capita Income. It is recommended that this Web Mapping Tool be used in conjunction with the Data Tool.
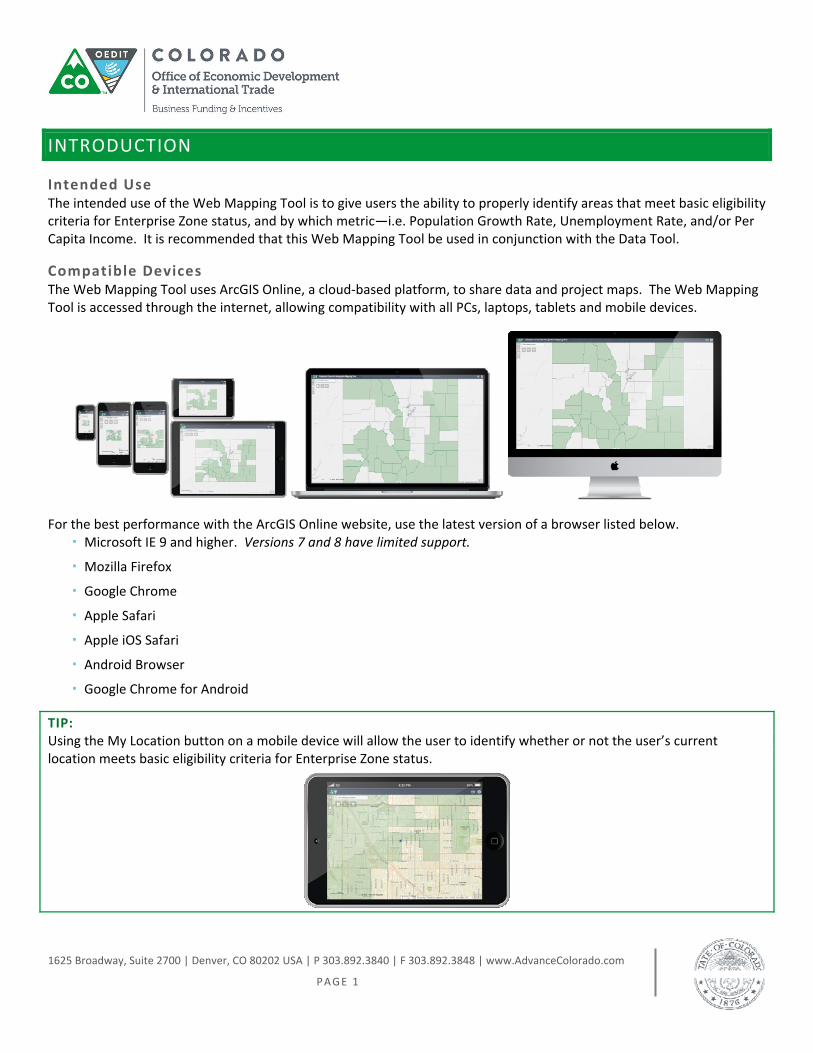
Compatible Devices The Web Mapping Tool uses ArcGIS Online, a cloud‐based platform, to share data and project maps. The Web Mapping Tool is accessed through the internet, allowing compatibility with all PCs, laptops, tablets and mobile devices.
For the best performance with the ArcGIS Online website, use the latest version of a browser listed below. Microsoft IE 9 and higher. Versions 7 and 8 have limited support.
Mozilla Firefox
Google Chrome
Apple Safari
Apple iOS Safari
Android Browser
Google Chrome for Android
TIP: Using the My Location button on a mobile device will allow the user to identify whether or not the user’s current location meets basic eligibility criteria for Enterprise Zone status.

1625 Broadway, Suite 2700 | Denver, CO 80202 USA | P 303.892.3840 | F 303.892.3848 | www.AdvanceColorado.com
PAGE 2
APPLICATION LAYOUT
Web Map Navigation
Zoom — Click to scale map’s extent inward (+) or outward (‐). Home — Click to zoom to map's initial extent. My Location — Detects your physical location and zooms the map to it.
Location Search — Enables finding a location on the map.
Legend & Layers Basemap Gallery — Presents a gallery of basemaps and allows you to select one. Legend — Displays a legend for the visible layers in the map. Data Layers — Displays a list of operational layers in the application.
Data Table — Displays a tabular view of operational layers' data attributes.
Print — Advanced or basic printing of the current map.
Help & Information — Displays contents about the app.

1625 Broadway, Suite 2700 | Denver, CO 80202 USA | P 303.892.3840 | F 303.892.3848 | www.AdvanceColorado.com
PAGE 3
WEB MAP NAVIGATION
Zoom The [+] button allows the user to zoom the extents of the map inward, whereas the [‐] button will zoom the extents of the map outward. Please note, layers that are at the Census Tract, Block Group, and Place levels require the user to zoom inward, from the default extent.
Home The Home button will zoom the map to the initial map extent. When the application starts, the Home button is automatically enabled. Clicking it resets the map extent to the map’s initial extent.
My Location The My Location button allows the network to detect the user’s physical location and zoom the map to it. The location can be highlighted if necessary. When the application starts, the My Location button is automatically enabled to access the user’s physical location. Clicking the My Location button zooms the map to the user’s current location.
TIP: You might get an error message after clicking the My Location button. It is often caused by the browser's security. Check the browser's setting for pop‐ups asking if you want to share your location. Click Yes, to find your location.

1625 Broadway, Suite 2700 | Denver, CO 80202 USA | P 303.892.3840 | F 303.892.3848 | www.AdvanceColorado.com
PAGE 4
LOCATION SEARCH The Location Search geocoder enables the user to find a location on the map. The following methods of finding a location are supported in the geocoding service:
By a place name By a point of interest By an address
When the application starts, the Location Search geocoder is automatically enabled. When the user types a place name or an address in the Location Search box, the active geocoding service is used, and the map extent is centered on the location searched.

1625 Broadway, Suite 2700 | Denver, CO 80202 USA | P 303.892.3840 | F 303.892.3848 | www.AdvanceColorado.com
PAGE 5
MAP LEGEND The Legend button displays labels and symbols for layers within the map. The Legend is set to automatically update when the visibility of a layer or sublayer changes. When no operational layers are rendered in the map, the Legend is blank.
By default, basemaps are not shown within the Legend. The order in which layers appear in the Legend corresponds to the layer order in the map. The Legend is also set to respect the scale dependencies of the layers in the map. This can be a useful indicator, to the map user, that additional data layers are present in the map, but currently not displayed in the map because of scale dependencies.
When the application starts, the Legend is automatically enabled. Clicking the Legend button displays the legend window. Clicking the X button in the upper right corner of the legend window closes it.
TIP: By default, green represents areas that meet basic eligibility criteria for Enterprise Zone status, based on the selected layer(s). Additionally, orange represents areas that meet eligibility criteria based on the Population Growth Rate, blue represents areas that meet eligibility criteria based on the Unemployment Rate, and teal represents areas that meet eligibility criteria based on Per Capita Income.
1625 Broadway, Suite 2700 | Denver, CO 80202 USA | P 303.892.3840 | F 303.892.3848 | www.AdvanceColorado.com
PAGE 6
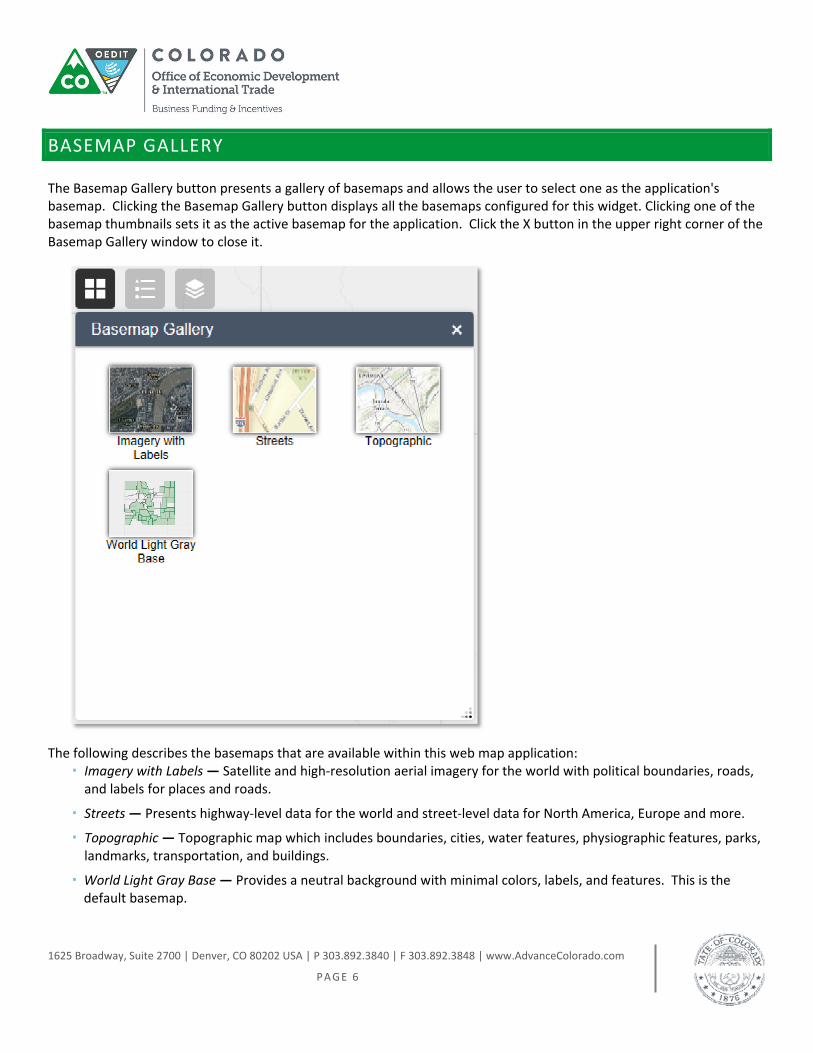
BASEMAP GALLERY The Basemap Gallery button presents a gallery of basemaps and allows the user to select one as the application's basemap. Clicking the Basemap Gallery button displays all the basemaps configured for this widget. Clicking one of the basemap thumbnails sets it as the active basemap for the application. Click the X button in the upper right corner of the Basemap Gallery window to close it.
The following describes the basemaps that are available within this web map application: Imagery with Labels — Satellite and high‐resolution aerial imagery for the world with political boundaries, roads, and labels for places and roads.
Streets — Presents highway‐level data for the world and street‐level data for North America, Europe and more.
Topographic — Topographic map which includes boundaries, cities, water features, physiographic features, parks, landmarks, transportation, and buildings.
World Light Gray Base — Provides a neutral background with minimal colors, labels, and features. This is the default basemap.

1625 Broadway, Suite 2700 | Denver, CO 80202 USA | P 303.892.3840 | F 303.892.3848 | www.AdvanceColorado.com
PAGE 7
DATA LAYERS The Data Layers button provides a list of operational layers and their symbols, allowing the user to turn individual layers on and off. Each layer in the list has a check box that allows the user to easily control each layer’s visibility.
Clicking the Data Layers button in the application displays the layer list or table of contents window. Clicking on the expansion arrow, for an individual layer, will show the legend for that layer.
Clicking the down arrow on the right side of a layer displays the layer menu, which includes the following functions:
Zoom to — Sets the map extent to the extent of the layer
Transparency — Sets the transparence for the layer
Move up — Moves the layer one level up
Move down — Moves the layer one level down
Open attribute table—Opens the attribute table for the feature layer
Description—Opens the description page for the service associated with the layer, if available
Clicking the X button in the upper right corner of the Data Layers window closes it.
TIP: The order in which layers appear in the list corresponds to the layer order in the map. The application provides functionality allowing the user to change the ordering of layers within the map.

1625 Broadway, Suite 2700 | Denver, CO 80202 USA | P 303.892.3840 | F 303.892.3848 | www.AdvanceColorado.com
PAGE 8
DATA TABLE The Data Table button displays a tabular view of operational layers' attributes. It displays at the bottom of the web mapping application and can be opened, resized, or closed. When more than one layer's attributes display, multiple tabs automatically generate in the attribute panel allowing you to toggle among the attribute tables.
Click the arrow button at the center bottom of the map to turn on the Data Table. Click arrow button on the top, or the X button in the upper right corner, of the Data Table to hide it.
Additionally, the Data Table can be accessed through the Data Layers button.
When turned on, the Data Table offers the user the following additional functions: Zoomed to selected features — Clicking Zoom to resets the map extent to center around selected features.
Clear selections — Clicking the Clear Selection button clears all selections.
Refresh — Refreshes the tables.
Sort a field — Clicking a field heading sorts the records by this field.
Show or hide columns — Clicking the + icon at the right side of Attribute Table panel opens the field visibility window. Check or uncheck the fields to set them to visible or invisible in the table.
Number of records in a page — Clicking the drop‐down arrow at the lower righter corner of the Data Table panel sets the number of records displayed on a page.
Select a record — Clicking a record in the table selects it and highlights the corresponding feature in the map. Press the Shift or Ctrl key to select multiple records.
Number of selected records — shown at the left bottom of the table.

1625 Broadway, Suite 2700 | Denver, CO 80202 USA | P 303.892.3840 | F 303.892.3848 | www.AdvanceColorado.com
PAGE 9
Additional Options: Select Records in Current Page — Selects all features displayed on the current page.
Select Records in All Pages — Selects all features in the feature layer.
Filter by Map Extent — Only displays attributes for features within the current map extent.
Show or Hide Columns — Equivalent to clicking the + icon at the right side of the panel to set visibility for individual fields.
Export to CSV — Exports the attributes to a CSV file. If records are selected, only the selected records are exported. To support this function, the Export Data property must be enabled for the corresponding feature service.

1625 Broadway, Suite 2700 | Denver, CO 80202 USA | P 303.892.3840 | F 303.892.3848 | www.AdvanceColorado.com
PAGE 10
MAP POP‐UPS The map can show descriptive information about features configured to display in a pop‐up. The default pop‐up appearance for a layer is a plain list of attributes and values. The pop‐ups are configured to show the related data within the Data Layer or in the Data Table.

1625 Broadway, Suite 2700 | Denver, CO 80202 USA | P 303.892.3840 | F 303.892.3848 | www.AdvanceColorado.com
PAGE 11
PRINTING This Print button connects the web application with a printing service that will allow the current map to print.
Click the print icon to open the Print widget. Enter a title for the map in the Map Title text box. Select the applicable Layout and Format for the exported map. Click Advanced to open a menu with advanced print options.
The Map scale/extent section defines the method that the print service should use to calculate the printed extent of the map. Preserving map scale may cause the printed map to maintain its scale while recalculating the extent around the existing center point, while preserving the map extent may cause the scale to adjust to fit the current map extent into the printed map. The user may also force a specific scale by checking the Force scale option and entering a scale. Click current to populate the value with the present scale of the map.
The Layout metadata allows the user to override the default values set by the configuration. Enter values for the Author and Copyright fields to provide current information to the print service. Check the Include legend check box to display the legend on the printed map.
If the MAP_ONLY format is selected, the user may provide dimensions for the Width and Height in pixels. Otherwise, these values are ignored.
The Print quality section allows you to update the resolution of the printed map. Provide an updated value for the DPI (dots per inch) in the text box.
1625 Broadway, Suite 2700 | Denver, CO 80202 USA | P 303.892.3840 | F 303.892.3848 | www.AdvanceColorado.com
PAGE 12
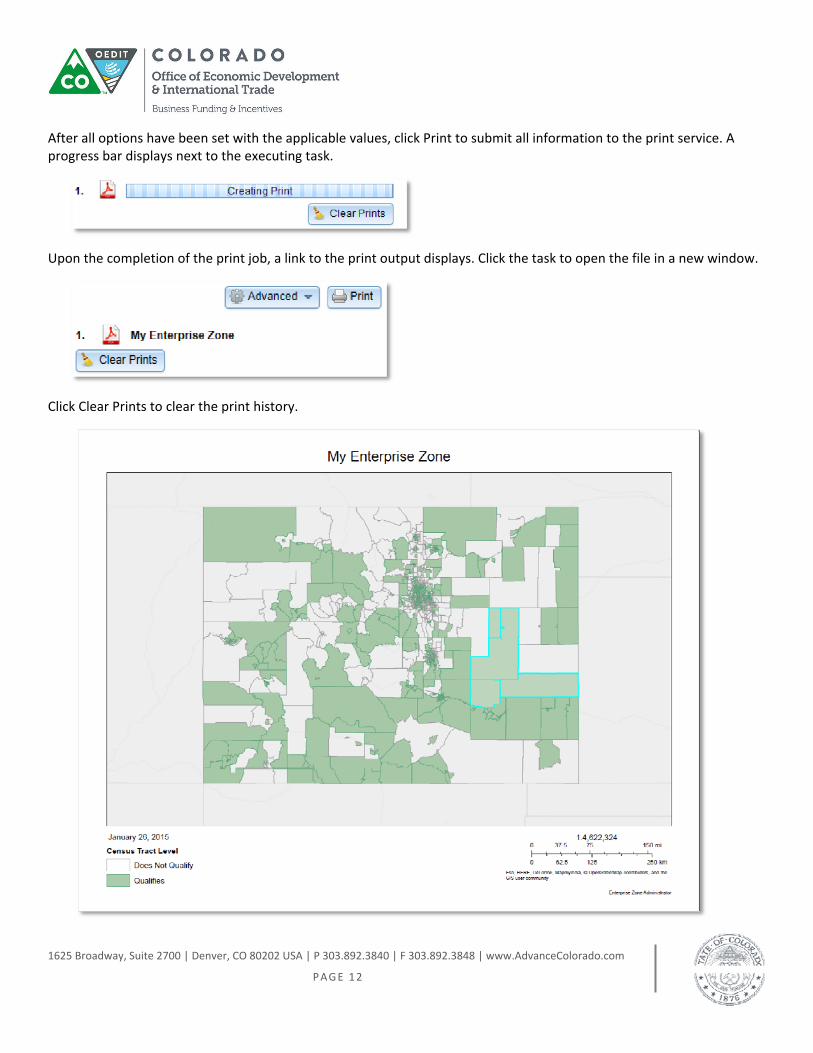
After all options have been set with the applicable values, click Print to submit all information to the print service. A progress bar displays next to the executing task.
Upon the completion of the print job, a link to the print output displays. Click the task to open the file in a new window.
Click Clear Prints to clear the print history.

1625 Broadway, Suite 2700 | Denver, CO 80202 USA | P 303.892.3840 | F 303.892.3848 | www.AdvanceColorado.com
PAGE 13
HELP & INFORMATION The Help & Information displays links to additional tools, documentation, and project contacts.
Click the Help & Information icon to display the contents about the app.
Close the widget or click the double arrow to hide the content.
For the Enterprise Re‐Designation Mapping Tool, click here.
For the Enterprise Re‐Designation Data Tool, click here.
The Enterprise Zone Re‐Designation Mapping Tool Documentation can be found here.
The Enterprise Zone Re‐Designation Mapping Tool Documentation can be found here.
To access the Enterprise Zones Re‐Designation Project webpage, click here.
For general questions regarding the Enterprise Zones Re‐Designation Project, please contact Sonya Guram ([email protected]).
For technical questions regarding the Enterprise Zones Re‐Designation Tools, please contact Robert Whalen ([email protected]).

1625 Broadway, Suite 2700 | Denver, CO 80202 USA | P 303.892.3840 | F 303.892.3848 | www.AdvanceColorado.com
PAGE 14
APPENDEX: DATA SOURCES
Colorado Department of Local Affairs Population Totals for Colorado, Regions, Counties & Municipal it ies, 2000 ‐2013
Data Available Population Totals
Geographies States Counties Municipalities (Select)
Time Periods 2009 2013
Download http://www.colorado.gov/...
United States Census Bureau American Community Survey, 5 ‐Year Est imates, 2009 ‐2013
Data Available Population Totals Unemployment Rates Per Capita Income
Geographies States Counties County Subdivisions Census Tracts Census Block Group Places
Time Periods 2009 2013
Download http://factfinder2.census.gov/...