web mapping made easy with google fusion · pdf filethe fusion tables team has developed a...
TRANSCRIPT
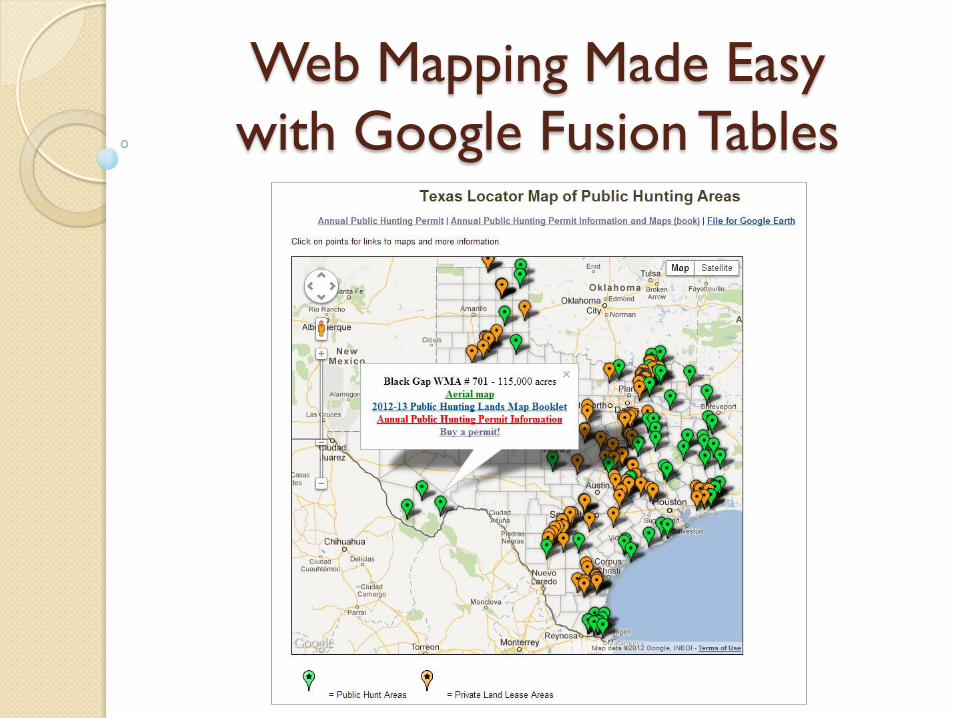
Web Mapping Made Easy with Google Fusion Tables
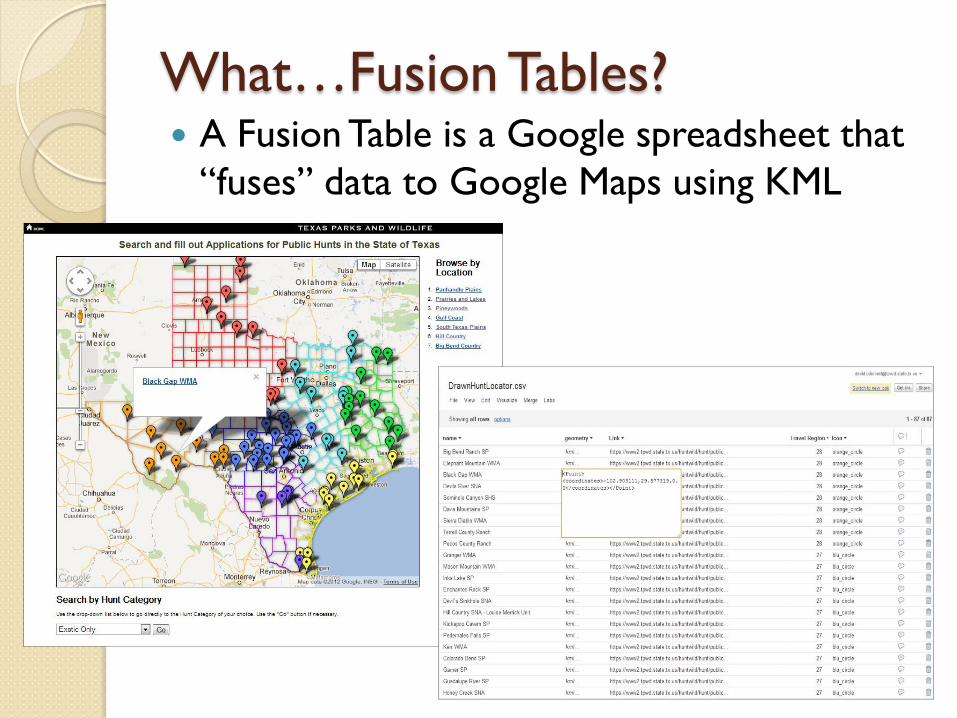
What…Fusion Tables? A Fusion Table is a Google spreadsheet that
“fuses” data to Google Maps using KML
Why Fusion Tables?
Spatially presents tabular data Get the functionality of Google Maps Familiar “look and feel” people have come
to “know and love” Dynamic; updates are applied instantly Quick and easy to share and embed on a
web page Collaborators can share and edit data
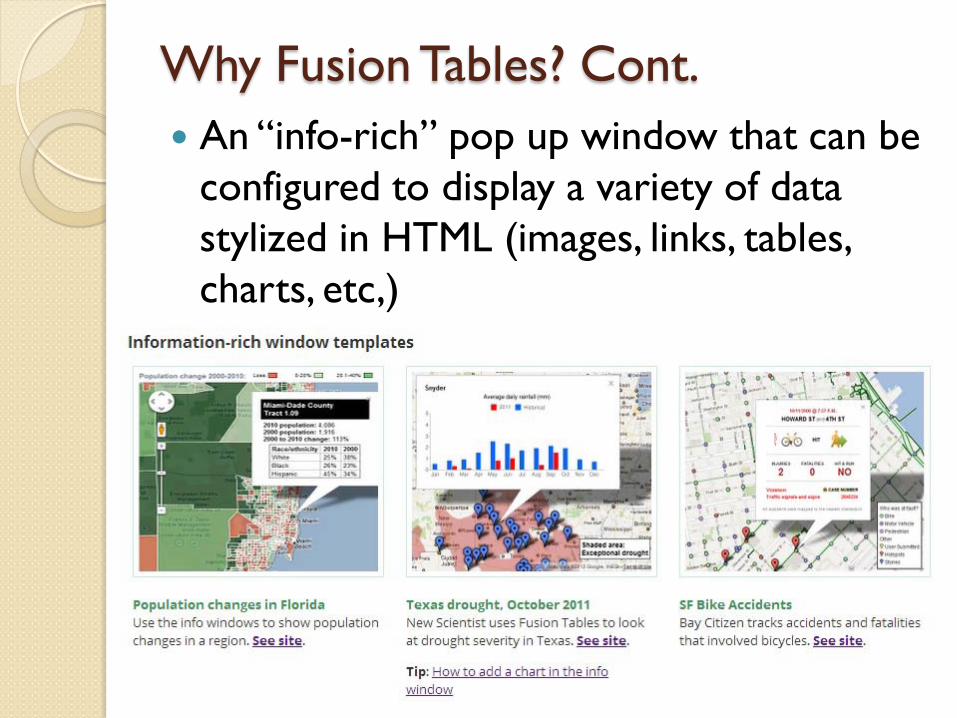
Why Fusion Tables? Cont. An “info-rich” pop up window that can be
configured to display a variety of data stylized in HTML (images, links, tables, charts, etc,)

Why (Not) Fusion Tables?
Restricted to Google format for symbology (somewhat)
Difficult (but possible) to display multiple layers
Need to have a Google account Subject to mandatory “upgrades”

When to use Fusion Tables? When you need a simple map to
convey data for public consumption When you want to share data with a
collaborator for viewing or editing
When you have a map that is continuously or periodically updated

Where to use Fusion Tables? Embedded on a web page

Where else? Securely shared via email link for collaboration
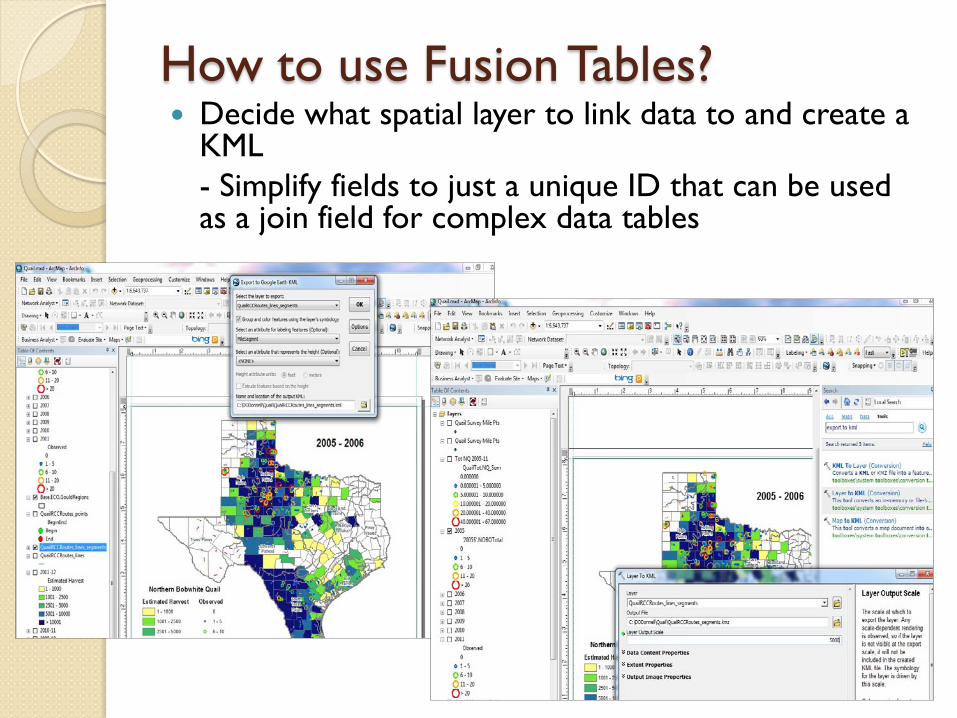
How to use Fusion Tables? Decide what spatial layer to link data to and create a
KML - Simplify fields to just a unique ID that can be used
as a join field for complex data tables
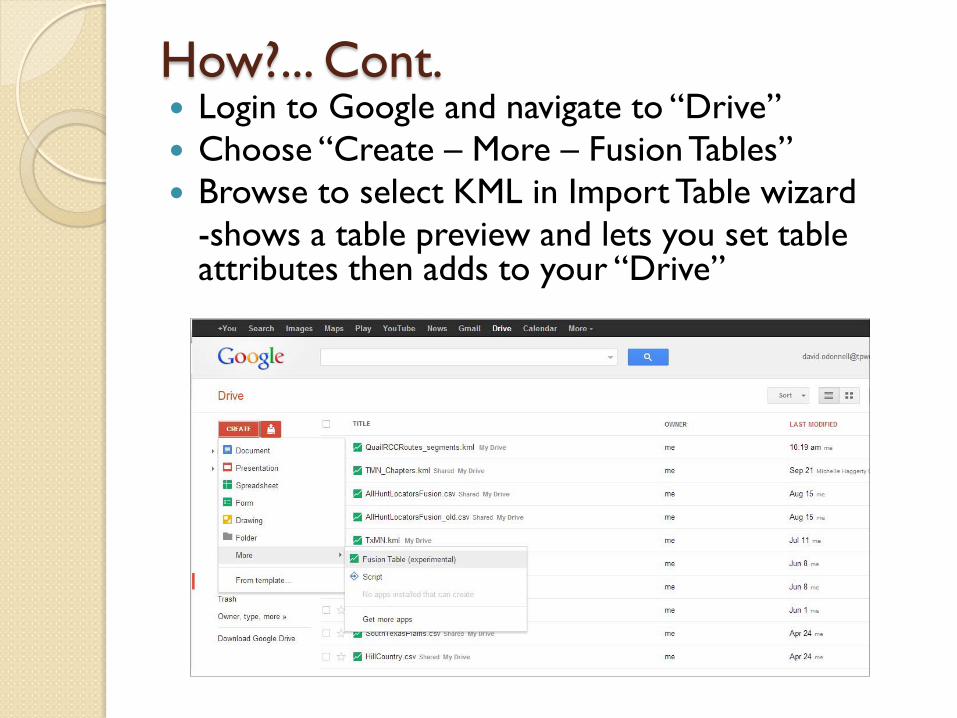
How?... Cont. Login to Google and navigate to “Drive” Choose “Create – More – Fusion Tables” Browse to select KML in Import Table wizard -shows a table preview and lets you set table
attributes then adds to your “Drive”
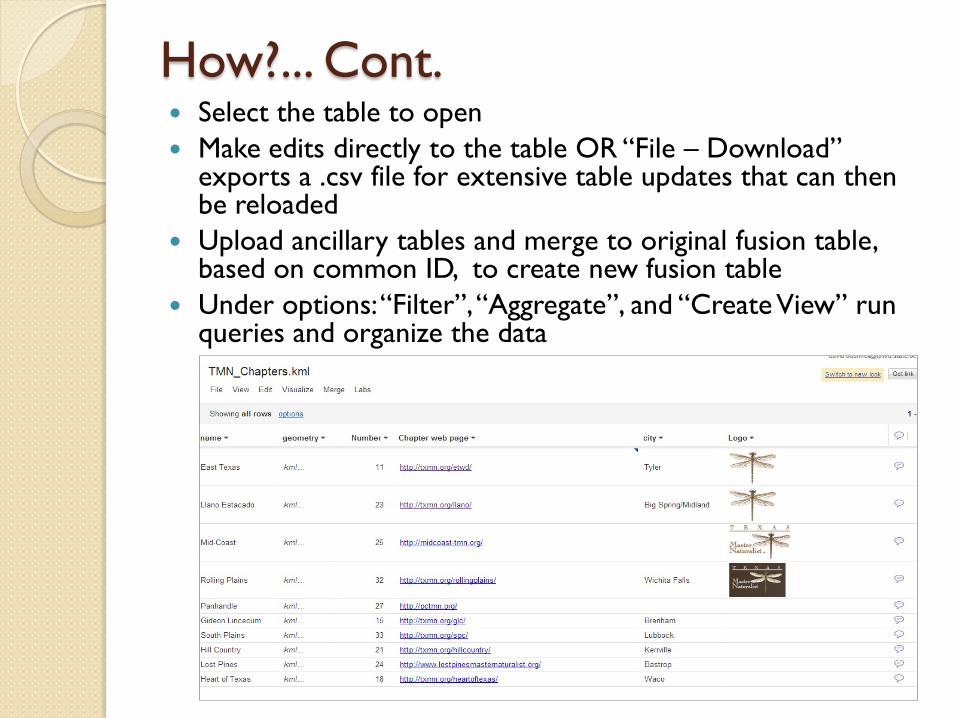
How?... Cont. Select the table to open Make edits directly to the table OR “File – Download”
exports a .csv file for extensive table updates that can then be reloaded
Upload ancillary tables and merge to original fusion table, based on common ID, to create new fusion table
Under options: “Filter”, “Aggregate”, and “Create View” run queries and organize the data
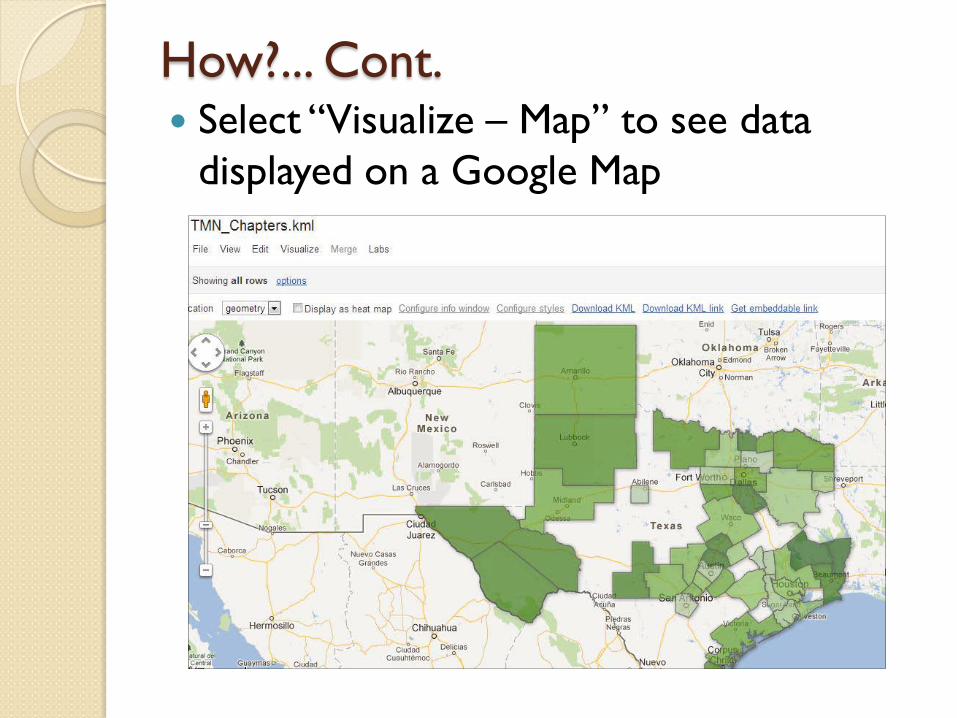
How?... Cont. Select “Visualize – Map” to see data
displayed on a Google Map

How?... Cont. Symbology is modified within “Configure Styles” - Somewhat limited; especially point symbols aka
“marker icons” A column titled icon can specify symbology if
attributed with the name Google recognizes “Map Styles” allows for symbology or gradient based
on value in a column


How?... Cont. Arrange info-rich pop up window using
“Configure info styles” The window can display a dynamic combination
of tabular data, links, images, charts all formatted with simple HTML that reads the table columns to fetch data.

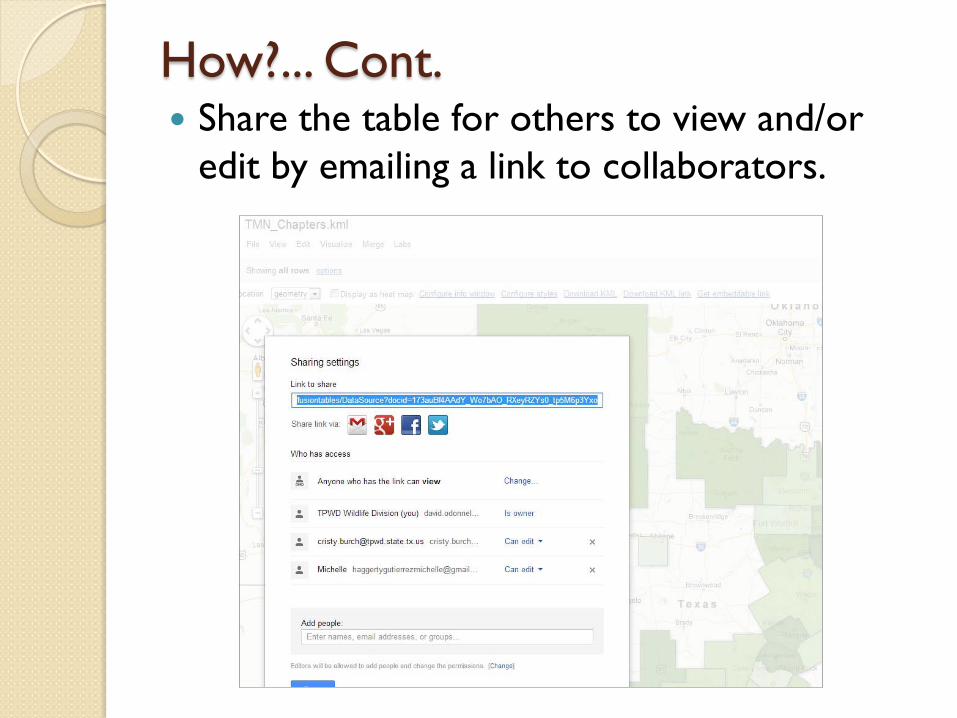
How?... Cont. Share the table for others to view and/or
edit by emailing a link to collaborators.

How?... Cont. Permissions can be set to: - “Private” which only allows those added to a list
access, with sign in required - limited to those who have the link, no sign in
necessary - full public access
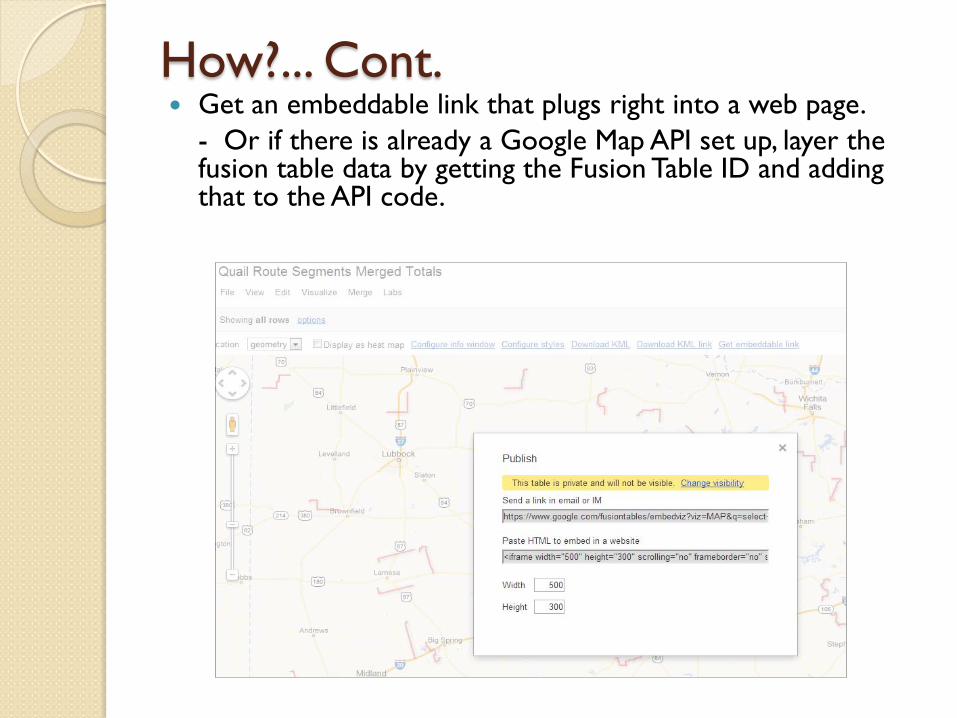
How?... Cont. Get an embeddable link that plugs right into a web page. - Or if there is already a Google Map API set up, layer the
fusion table data by getting the Fusion Table ID and adding that to the API code.
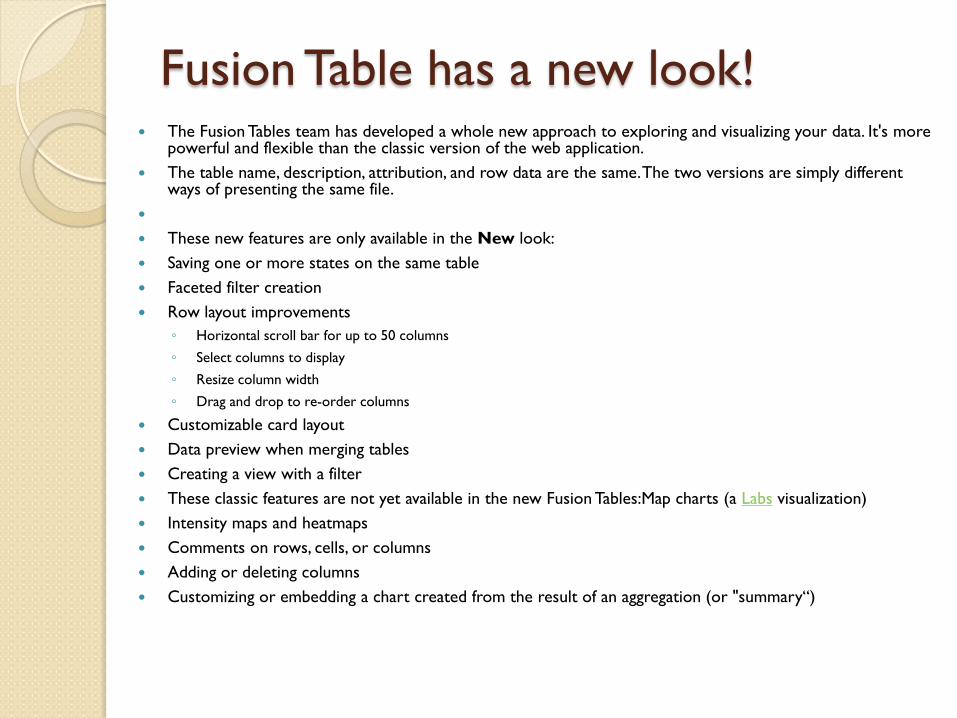
Fusion Table has a new look! The Fusion Tables team has developed a whole new approach to exploring and visualizing your data. It's more
powerful and flexible than the classic version of the web application. The table name, description, attribution, and row data are the same. The two versions are simply different
ways of presenting the same file. These new features are only available in the New look: Saving one or more states on the same table Faceted filter creation Row layout improvements
◦ Horizontal scroll bar for up to 50 columns ◦ Select columns to display ◦ Resize column width ◦ Drag and drop to re-order columns
Customizable card layout Data preview when merging tables Creating a view with a filter These classic features are not yet available in the new Fusion Tables:Map charts (a Labs visualization) Intensity maps and heatmaps Comments on rows, cells, or columns Adding or deleting columns Customizing or embedding a chart created from the result of an aggregation (or "summary“)
