web demographic and enrollment tables undergraduates: 2011 …nces.ed.gov/pubs2015/2015025.pdf ·...
TRANSCRIPT

WEB TABLES U.S. DEPARTMENT OF EDUCATION SEPTEMBER 2015 NCES 2015-025
Demographic and Enrollment Characteristics of Nontraditional
Undergraduates: 2011–12
This report was prepared for the National Center for Education Statistics under Contract No. ED-IES-12-C-0095 with RTI International. Mention of trade names, commercial products, or organizations does not imply endorsement by the U.S. Government. These Web Tables were authored by Alexandria Walton Radford, Melissa Cominole, and Paul Skomsvold of RTI International. The NCES Project Officer was Sean A. Simone. For questions about content or to view this report online, go to http://nces.ed.gov/pubsearch/pubsinfo.asp?pubid=2015025.
What makes an undergraduate student
“traditional” or “nontraditional”? While
definitions vary, researchers generally
consider nontraditional students to
have the following characteristics:
being independent for financial aid
purposes, having one or more
dependents, being a single caregiver,
not having a traditional high school
diploma, delaying postsecondary en-
rollment, attending school part time,
and being employed full time (Brock
2010; Choy 2002; Horn 1996; Kim 2002;
Taniguchi and Kaufman 2005).1
While undergraduates who possess
these characteristics are often thought
of as nontraditional, a large proportion
of undergraduates have these charac-
teristics (Brock 2010; Choy 2002; Horn
1996; Taniguchi and Kaufman 2005). As
table 1 shows, about 74 percent of all
2011–12 undergraduates had at least
one nontraditional characteristic.
Moreover, this result is consistent over
recent decades: since 1995–96, at
least 70 percent of undergraduates
possessed at least one nontraditional
characteristic.
Examining nontraditional characteris-
tics is important not only because a
high percentage of postsecondary stu-
dents possess them, but also because
students with these characteristics can
be vulnerable to challenges that can
affect their well-being, levels of stress
and satisfaction (Giancola, Grawitch,
and Borchert 2009; Quimby and
O’Brien 2006), and likelihood of persist-
ing and attaining a degree (Berkner,
Cuccaro-Alamin, and McCormick 1996;
Berkner, He, and Cataldi 2002; Choy
2002; Horn 1996; Skomsvold, Radford,
and Berkner 2011).
These Web Tables use nationally
representative data from the National
Postsecondary Student Aid Study
(NPSAS) to provide descriptive
statistics regarding nontraditional
characteristics in the U.S. undergraduate
population. Using the most recent data
available, the statistics presented in the
tables update and augment previous
NCES reports that focused on the topic
(Choy 2002; Horn 1996).
To examine trends over time, table 1
shows the distribution of undergradu-
ates by number of nontraditional
characteristics possessed and specific
nontraditional characteristics during the
1995–96, 1999–2000, 2003–04, 2007–08,
and 2011–12 academic years. The re-
maining Web Tables use the most recent
NPSAS data, collected in 2011–12.
Tables 2–8 present the individual
characteristics used to define nontradi-
tional students, by demographic and
enrollment characteristics. Tables 9–17
document various characteristics related
to undergraduates’ academic prepara-
tion and postsecondary number of
nontraditional characteristics and
specific nontraditional characteristics
undergraduates held. Table 9 examines

2
high school grade point average (GPA)
and high school mathematics coursetak-
ing among undergraduates under age
30. Tables 10 and 11 show previous post-
secondary degrees or certificates earned
and the types of postsecondary institu-
tions ever attended. The final tables
exhibit 2011–12 postsecondary enroll-
ment characteristics: type of institution
attended (table 12), participation in
online courses and online degree pro-
grams (table 13), type of degree program
pursued (table 14), reasons for taking
courses if not in a degree or certificate
program (table 15), field of study for
students enrolled in a certificate or asso-
ciate’s degree program (table 16), and
field of study for students enrolled in a
bachelor’s degree program (table 17).
RELATED NCES REPORTS Nontraditional Undergraduates
(NCES 2002-012).
http://nces.ed.gov/pubsearch/
pubsinfo.asp?pubid=2002012
Nontraditional Undergraduates: Trends
in Enrollment from 1986 to 1992 and
Persistence and Attainment Among
1989–90 Beginning Postsecondary
Students (NCES 97-578).
http://nces.ed.gov/pubsearch/
pubsinfo.asp?pubid=97578
Web Tables—Six-Year Attainment,
Persistence, Transfer, Retention, and
Withdrawal Rates of Students Who
Began Postsecondary Education in
2003–04 (NCES 2011-152).
http://nces.ed.gov/pubsearch/
pubsinfo.asp?pubid=2011152
Descriptive Summary of 1995–96
Beginning Postsecondary Students:
Six Years Later (NCES 2003-151).
http://nces.ed.gov/pubsearch/
pubsinfo.asp?pubid=2003151
Descriptive Summary of 1989–90
Beginning Postsecondary Students:
Five Years Later (NCES 96-155).
http://nces.ed.gov/pubsearch/
pubsinfo.asp?pubid=96155
DATA The estimates presented in these
Web Tables are based on data from
five administrations of the National
Postsecondary Student Aid Study
(NPSAS): NPSAS:96, NPSAS:2000,
NPSAS:04, NPSAS:08, and NPSAS:12.
These studies, conducted by the U.S.
Department of Education’s National
Center for Education Statistics
(NCES), are comprehensive, national-
ly representative surveys of how
students finance their postsecondary
education. NPSAS also includes a
broad array of demographic and en-
rollment characteristics.
NPSAS uses a two-stage sampling
design. Institutions are selected for
inclusion in the first stage, and stu-
dents are selected from these
institutions during the second stage.
The NPSAS:12 target population con-
sisted of all eligible undergraduate
and graduate students enrolled any
time between July 1, 2011, and June
30, 2012, in Title IV eligible postsec-
ondary institutions in the 50 states
and the District of Columbia.
The eligibility conditions for institutions
were consistent with all previous NPSAS
administrations with three exceptions:
Title IV participation, inclusion of corre-
spondence schools, and exclusion of
Puerto Rico. The requirement that an
institution be eligible to distribute
federal Title IV aid was implemented
beginning with NPSAS:2000. Institutions
that offered only correspondence
courses, provided these same institu-
tions were also eligible to distribute
federal Title IV student aid, were first
included in NPSAS:04. In NPSAS:12, in-
stitutions in Puerto Rico were not
included in the sample. In table 1, the
disaggregated estimates for NPSAS ad-
ministrations prior to 2011–12 exclude
students in Puerto Rican institutions to
be comparable to the 2011–12 esti-
mates. To yield comparable estimates
across cycles, use the COMPTO87 varia-
ble to exclude Puerto Rican institutions
from estimates. Approximately 95,000
undergraduates were study respond-
ents in NPSAS:12; analogous sample
sizes for the earlier NPSAS administra-
tions were 114,000 in NPSAS:08, 80,000
in NPSAS:04, 49,000 in NPSAS:2000, and
41,000 in NPSAS:96.
Due to improvements in weighting
procedures over time and the subse-
quent reweighting of historical
datasets, prior year estimates in these
tables may not match those published
earlier. For more information about
NPSAS reweighting over time, visit
http://nces.ed.gov/surveys/npsas/
datainfo.asp. NPSAS:08 data were
reweighted in August 2013.

3
For more information about the meth-
odology used in the NPSAS surveys,
see the following reports:
• National Postsecondary Student Aid
Study, 1995–96 (NPSAS:96)
Methodology Report
(http://nces.ed.gov/pubsearch/
pubsinfo.asp?pubid=98073)
• National Postsecondary Student Aid
Study 1999–2000 (NPSAS:2000)
Methodology Report
(http://nces.ed.gov/pubsearch/
pubsinfo.asp?pubid=2002152)
• 2004 National Postsecondary Student
Aid Study (NPSAS:04) Full-scale
Methodology Report
(http://nces.ed.gov/pubsearch/
pubsinfo.asp?pubid=2006180)
• 2007–08 National Postsecondary
Student Aid Study (NPSAS:08) Full-
scale Methodology Report
(http://nces.ed.gov/pubsearch/
pubsinfo.asp?pubid=2011188)
• 2011–12 National Postsecondary
Student Aid Study (NPSAS:12) Data
File Documentation
(http://nces.ed.gov/pubsearch/
pubsinfo.asp?pubid=2014182)
ANALYSIS The estimates presented in these
Web Tables were produced using
PowerStats, a web-based software
application that enables users to
generate tables for most of the post-
secondary surveys conducted by NCES.
Samples drawn for such NCES studies
as NPSAS are not simple random sam-
ples; therefore, simple random sample
techniques for estimating sampling
errors cannot be applied to these data.
VARIABLES USED
The variables used in these Web Tables are listed below. Visit the NCES
DataLab website http://nces.ed.gov/datalab to view detailed information
on question wording for variables coming directly from an interview,
how variables were constructed, and their sources. After selecting
“Postsecondary Education” in the “Go To” box on the right, click on “Codebooks”
and use the drop-down menus to select a codebook organized by subject or
by variable name for the NPSAS year desired. The program files that generated
the statistics presented in these Web Tables can be found at
http://nces.ed.gov/pubsearch/pubsinfo.asp?pubid=2015025.
Name
Label NPSAS:96 NPSAS:2000 NPSAS:04 NPSAS:08 NPSAS:12
Age as of 12/31/11 AGE
Any postsecondary degree or certificate before 2011–12 DEGPR
Associate’s degree prior to 2011–12 DEGPRAA
Attendance status ATTNSTAT ATTNSTAT ATTNSTAT ATTNSTAT ATTNSTAT
Bachelor’s or higher degree prior to 2011–12 DEGPRBA
Certificate prior to 2011–12 DEGPRCRT
Delayed postsecondary enrollment DELAYENR DELAYENR DELAYENR DELAYENR DELAYENR
Dependency status DEPEND2 DEPEND DEPEND DEPEND DEPEND
Disability status DISABLE
Entire degree program was online ALTONLN2
Ever attended a public 2-year institution EVER2PUB
Ever attended a 4-year institution EVER4YR
Has dependent(s) DEPEND2 ANYDEP DEPANY DEPANY DEPANY
High school completion status HSDEG HSDEG HSDEG HSDEG HSDEG
High school grade point average HSGPA
Highest education attained by either parent PAREDUC
Highest level of math completed or planned to complete in high school HCMATHHI
Income group PCTALL
Institution level AIDLEVL
See notes at end of table.

4
VARIABLES USED—continued
Name
Label NPSAS:96 NPSAS:2000 NPSAS:04 NPSAS:08 NPSAS:12
Major field of study: associate’s degree or certificate program MAJORS2Y
Major field of study: bachelor’s degree program MAJORS4Y
Number of dependents DEPNUM
Number of institutions attended STUDMULT
Number of months between high school completion and postsecondary entry ELAPSE
Number of nontraditional characteristics RISKNDX1 RISKINDR RISKINDX RISKINDX RISKIND2
Race/ethnicity RACE
Reason for taking classes ATTENDMR
Sex GENDER
Single with dependent(s) SINGLPAR SINGLPAR SINGLPAR SINGLPAR SINGLPAR
Took classes completely online ALTONLN
Type of institution AIDSECT
Undergraduate degree program UGDEG
Worked while enrolled HRSWORK ENRJOB JOBENR JOBENR JOBENR
NOTE: Blank cells indicate that the variable for that year was not used in this report.
PowerStats takes into account the
complexity of the sampling procedures
and calculates standard errors appro-
priate for such samples. The method
for computing sampling errors used by
PowerStats involves approximating the
estimator by replication of the sampled
population. The procedure used is a
bootstrap technique.
With PowerStats, users can replicate
or expand upon the tables presented
here. The output from PowerStats
includes the table estimates (e.g.,
percentages or means), the design-
adjusted standard errors, and
weighted sample sizes for the esti-
mates. If the number of valid cases is
too small to produce a reliable esti-
mate (fewer than 30 cases), PowerStats
prints the double dagger symbol (‡)
instead of the estimate.
In addition to producing tables,
PowerStats users may conduct linear
or logistic regressions. Many options
are available for output with the
regression results. For a description
of all the options available, users
should access the PowerStats
website at http://nces.ed.gov/
datalab/index.aspx.
For more information, contact
(800) 677-6987
For readers with disabilities, a Section
508-compliant version of these
Web Tables is available at
http://nces.ed.gov/pubsearch/
pubsinfo.asp?pubid=2015025.
REFERENCES Berkner, L., Cuccaro-Alamin, S., and
McCormick, A. (1996). Descriptive
Summary of 1989–90 Beginning Post-
secondary Students: Five Years Later
(NCES 96-155). National Center for
Education Statistics, U.S. Department
of Education. Washington, DC.
Berkner, L., He, S., and Cataldi, E.F. (2002).
Descriptive Summary of 1995–96
Beginning Postsecondary Students:
Six Years Later (NCES 2003–151).
National Center for Education
Statistics, U.S. Department of
Education. Washington, DC.
Brock, T. (2010). Young Adults and Higher
Education: Barriers and Breakthroughs
to Success. The Future of Children,
20(1): 109–132.
Choy, S. (2002). Nontraditional
Undergraduates (NCES 2002-012).
National Center for Education
Statistics, U.S. Department of
Education. Washington, DC.
Giancola, J., Grawitch, M., and
Borchert, D. (2009). Dealing With the
Stress of College: A Model for Adult
Students. Adult Education Quarterly,
59(3): 246–263.

5
Horn, L. (1996) Nontraditional Under-
graduates: Trends in Enrollment From
1986 to 1992 and Persistence and
Attainment Among 1989–90 Begin-
ning Postsecondary Students (NCES
97-578). National Center for Educa-
tion Statistics, U.S. Department of
Education. Washington, DC.
Kim, K.A. (2002). ERIC Review: Exploring
the Meaning of “Nontraditional” at
the Community College. Community
College Review, 30(1): 74–89.
Quimby, J., and O’Brien, K. (2006).
Predictors of Well-Being Among
Nontraditional Female Students With
Children. Journal of Counseling and
Development, 84(4): 451–460.
Skomsvold, P., Radford, A.W., and
Berkner, L. (2011) Web Tables—
Six-Year Attainment, Persistence,
Transfer, Retention, and Withdrawal
Rates of Students Who Began
Postsecondary Education in 2003–04
(NCES 2011-152). National Center for
Education Statistics, Institute of
Education Sciences, U.S. Department
of Education. Washington, DC.
Taniguchi, H., and Kaufman, G. (2005).
Degree Completion Among
Nontraditional College Students.
Social Science Quarterly, 86(4): 912–927.
ENDNOTES
1 Age is sometimes used in the definition of nontraditional students. The definition used in this publication (and earlier NCES reports) does not include age, but rather characteristics that are often correlated with age. Tables 2–8 include age as a row variable to show how age correlates with the characteristics used in this report’s definition of nontraditional students.

National Center for Education Statistics
Selected characteristics 1995–96 1999–2000 2003–04 2007–08 2011–12
U.S. total (excluding Puerto Rico) 100.0 100.0 100.0 100.0 100.0
Number of nontraditional characteristics1
Zero 24.8 25.5 27.9 28.4 26.2One 18.3 16.9 16.7 17.6 18.7Two to three 33.8 31.8 28.0 27.7 31.3Four or more 23.2 25.8 27.4 26.3 23.8
Dependency status2
Dependent 49.2 49.5 50.4 51.3 48.7Independent 50.8 50.5 49.6 48.7 51.3
Has dependent(s)Yes 24.6 26.8 27.0 26.3 27.5No 75.4 73.2 73.0 73.7 72.5
Single with dependent(s)3
Yes 11.1 13.2 13.4 13.7 15.2No 88.9 86.8 86.6 86.3 84.8
High school completion statusHigh school diploma, foreign high school, or home schooled4 92.0 93.6 91.5 92.3 91.0GED or other equivalency, completion certificate, or no high school diploma, certificate, or other equivalency 8.0 6.4 8.5 7.7 9.0
Delayed postsecondary enrollment Less than one year 67.9 54.6 61.5 67.3 65.8One year or more 5 32.1 45.4 38.5 32.7 34.2
Attendance status6
Any full-time 51.0 51.6 54.3 52.6 56.6Exclusively part-time 49.0 48.4 45.7 47.4 43.4
Worked while enrolled7
Worked full time 34.6 38.1 32.6 33.1 25.9Worked part time 43.3 42.0 41.5 42.0 36.4Did not work 22.1 19.9 25.9 24.8 37.7
See notes at end of table.
Table 1. NONTRADITIONAL STUDENTS OVER TIME: Percentage distribution of undergraduates, by selected characteristics: 1995–96, 1999–2000, 2003–04, 2007–08, and 2011–12
– 6 –

National Center for Education StatisticsTable 1. NONTRADITIONAL STUDENTS OVER TIME: Percentage distribution of undergraduates, by selected characteristics: 1995–96, 1999–2000, 2003–04, 2007–08, and 2011–12—Continued
4 The response values for the high school completion variable differ slightly among survey administrations. Prior to the 2003-04 National Postsecondary Student Aid Study (NPSAS:04), values for completing high school at a foreign school or through homeschool were not available. In NPSAS:12, some 3 percent of undergraduates had completed high school at a foreign high school, and 0.5 percent had completed through homeschool.
SOURCE: U.S. Department of Education, National Center for Education Statistics, 1995–96, 1999–2000, 2003–04, 2007–08, and 2011–12 National Postsecondary Student Aid Studies (NPSAS:96, NPSAS:2000, NPSAS:04, NPSAS:08, and NPSAS:12).
2 Independent students are age 24 or over and students under 24 who are married, have dependents, are veterans or on active duty, are orphans or wards of the courts, are homeless or at risk of homelessness, or were determined to be independent by a financial aid officer using professional judgment. Other undergraduates under age 24 are considered to be dependent.
1 Seven characteristics identify nontraditional students: being independent for financial aid purposes, having one or more dependents, being a single caregiver, not having a traditional high school diploma, delaying postsecondary enrollment, attending school part time, and being employed full time. See below for more details on these characteristics. This variable indicates how many of these characteristics students had.
7 Estimates exclude students who worked in school-related jobs (e.g., work-study or assistantships) and jobs held while not enrolled, including summer break. Before NPSAS:12, students in NPSAS studies were not asked to exclude jobs held while not enrolled. Full-time status was defined as working 35 or more hours per week, and part-time status was defined as working less than 35 hours per week.
6 Full-time status for the purposes of financial aid eligibility was based on 12 credit hours, unless the awarding institution employed a different standard.
3 Includes students who were single, never married; separated; widowed; or divorced.
5 For consistency across years, this table defines delayed postsecondary enrollment as not entering postsecondary education in the calendar year of completing high school. Delayed entry estimates exclude students who did not earn a high school diploma, certificate, or equivalency because these students did not have a high school completion date. The remaining tables in this publication, which use only data from NPSAS:12, define delayed postsecondary enrollment as entering postsecondary education 13 months or more after completing high school. Table 6 provides results for both definitions.
NOTE: Italicized text indicates characteristics of nontraditional students. Estimates include students enrolled in Title IV eligible postsecondary institutions in the 50 states and the District of Columbia. NPSAS:96, NPSAS:2000, NPSAS:04, and NPSAS:08 included sampled institutions from Puerto Rico while NPSAS:12 did not. In order to yield comparable estimates across cycles, the COMPTO87 variable was used to exclude Puerto Rican institutions from the estimates for the NPSAS cycles prior to NPSAS:12. Detail may not sum to totals because of rounding. Prior year data have been reweighted and may not match those published earlier. For more information about NPSAS reweighting over time, visit http://nces.ed.gov/surveys/npsas/datainfo.asp.
– 7 –

National Center for Education Statistics
Selected characteristics 1995–96 1999–2000 2003–04 2007–08 2011–12
U.S. total (excluding Puerto Rico) † † † † †
Number of nontraditional characteristicsZero 0.65 0.31 0.45 0.22 0.24One 0.44 0.30 0.25 0.21 0.22Two to three 0.72 0.37 0.30 0.23 0.28Four or more 0.45 0.40 0.45 0.28 0.25
Dependency statusDependent 0.73 0.49 0.55 0.31 0.31Independent 0.73 0.49 0.55 0.31 0.31
Has dependent(s)Yes 0.42 0.36 0.41 0.33 0.28No 0.42 0.36 0.41 0.33 0.28
Single with dependent(s)Yes 0.30 0.26 0.29 0.21 0.21No 0.30 0.26 0.29 0.21 0.21
High school completion statusHigh school diploma, foreign high school, or home schooled 0.56 0.26 0.29 0.18 0.19GED or other equivalency, completion certificate, or no high school diploma, certificate, or other equivalency 0.56 0.26 0.29 0.18 0.19
Delayed postsecondary enrollment Less than one year 0.64 0.46 0.45 0.25 0.32One year or more 0.64 0.46 0.45 0.25 0.32
Attendance statusAny full-time 1.10 0.53 0.51 0.33 0.40Exclusively part-time 1.10 0.53 0.51 0.33 0.40
Worked while enrolledWorked full time 0.92 0.42 0.39 0.30 0.24Worked part time 0.87 0.48 0.34 0.28 0.25Did not work 0.70 0.38 0.26 0.22 0.26
† Not applicable.
Table S1. Standard errors for table 1: NONTRADITIONAL STUDENTS OVER TIME: Percentage distribution of undergraduates, by selected characteristics: 1995–96, 1999–2000, 2003–04, 2007–08, and 2011–12
SOURCE: U.S. Department of Education, National Center for Education Statistics, 1995–96, 1999–2000, 2003–04, 2007–08, and 2011–12 National Postsecondary Student Aid Studies (NPSAS:96, NPSAS:2000, NPSAS:04, NPSAS:08, and NPSAS:12).
– 8 –

National Center for Education Statistics
Selected characteristics Dependent1 Independent 1
Total 48.7 51.3
SexMale 53.7 46.3Female 45.0 55.0
Race/ethnicity2
White 51.2 48.8Black 35.5 64.5Hispanic 49.7 50.3Asian 58.9 41.1Other 48.5 51.5
Age as of 12/31/1118 years or younger 93.8 6.219–23 years 85.3 14.724–29 years † 100.030–39 years † 100.040 years or older † 100.0
Type of institutionPublic 2-year 40.3 59.7Public 4-year 64.4 35.6Private nonprofit 4-year 67.3 32.7For-profit 4-year 13.0 87.0For-profit less-than-2-year 28.6 71.4More than one institution or other3 47.4 52.6
Undergraduate degree or certificate programNo degree or certificate 30.7 69.3Certificate 27.4 72.6Associate’s degree 40.1 59.9Bachelor’s degree 61.5 38.5
Income group4
Lowest 25 percent 48.8 51.2Lower middle 25 percent 48.6 51.4Upper middle 25 percent 48.7 51.3Highest 25 percent 48.7 51.3
Highest education attained by either parent5
High school diploma or less 37.4 62.6Some postsecondary education 46.6 53.4Bachelor’s degree or higher 61.7 38.3
See notes at end of table.
Table 2. DEPENDENCY STATUS AND NONTRADITIONAL CHARACTERISTICS: Percentage distribution of undergraduates’ dependency status for financial aid purposes, by selected characteristics: 2011–12
– 9 –

National Center for Education Statistics
Selected characteristics Dependent1 Independent 1
Disability statusNo disability reported 50.1 49.9Some type of disability reported6 37.5 62.5
Has dependent(s)Yes † 100.0No 67.2 32.8
Single with dependent(s)7
Yes † 100.0No 57.4 42.6
High school completion statusHigh school diploma, foreign high school, or home schooled 51.7 48.3GED or other equivalency, completion certificate, or no high school diploma, certificate, or other equivalency 18.3 81.7
Number of months between high school completion and postsecondary entry8
0–12 59.7 40.313 or more 21.7 78.3
Attendance status9
Any full-time 60.0 40.0Exclusively part-time 34.0 66.0
Worked while enrolled10
Worked full time 24.4 75.6Worked part time 60.1 39.9Did not work 54.4 45.6
See notes at end of table.
Table 2. DEPENDENCY STATUS AND NONTRADITIONAL CHARACTERISTICS: Percentage distribution of undergraduates’ dependency status for financial aid purposes, by selected characteristics: 2011–12—Continued
– 10 –

National Center for Education Statistics
† Not applicable.
NOTE: Italicized text indicates characteristics of nontraditional students. Estimates include students enrolled in Title IV eligible postsecondary institutions in the 50 states and the District of Columbia. Prior cycles of the National Postsecondary Student Aid Study (NPSAS) included sampled institutions from Puerto Rico; to yield comparable estimates across cycles, use the COMPTO87 variable to exclude Puerto Rican institutions from estimates. Detail may not sum to totals because of rounding. SOURCE: U.S. Department of Education, National Center for Education Statistics, 2011–12 National Postsecondary Student Aid Study (NPSAS:12).
5 Excludes the 3.5 percent of students who reported that they did not know their parents’ highest level of education.6 Indicates reporting a long-lasting condition such as deafness or serious difficulty hearing; blindness or serious difficulty seeing; serious difficulty concentrating, remembering or making a decision; or serious difficulty walking or climbing stairs.
8 Excludes the .9 percent of students who did not earn a high school diploma, certificate, or equivalency because these students did not have a high school completion date.9 Full-time status for the purposes of financial aid eligibility was based on 12 credit hours, unless the awarding institution employed a different standard. 10 Estimates exclude students who worked in school-related jobs (e.g., work-study or assistantships) and jobs held while not enrolled, including summer break. Full-time status was defined as working 35 or more hours per week, and part-time status was defined as working less than 35 hours per week.
1 Independent students are age 24 or over and students under 24 who are married, have dependents, are veterans or on active duty, are orphans or wards of the courts, are homeless or at risk of homelessness, or were determined to be independent by a financial aid officer using professional judgment. Other undergraduates under age 24 are considered to be dependent.
7 Includes students who were single, never married; separated; widowed; or divorced.
Table 2. DEPENDENCY STATUS AND NONTRADITIONAL CHARACTERISTICS: Percentage distribution of undergraduates’ dependency status for financial aid purposes, by selected characteristics: 2011–12—Continued
2 Black includes African American, Hispanic includes Latino, and Other includes American Indian, Alaska Native, Native Hawaiian or other Pacific Islander, and Two or more races. Race categories exclude Hispanic origin unless specified.3 Includes the 9.0 percent of students who attended more than one institution, a public less-than-2 year institution, a private nonprofit 2-year institution, a private nonprofit less-than-2-year institution, or a for-profit 2-year institution.4 Total income in 2010 was used because it was reported on the federal financial aid application and used for federal need analysis for 2011–12. Income consists of parents’ income for dependent students. For independent students, consists of the income of the student (and spouse if the student is married).
– 11 –

National Center for Education Statistics
Selected characteristics Dependent Independent
Total 0.31 0.31
SexMale 0.48 0.48Female 0.37 0.37
Race/ethnicityWhite 0.41 0.41Black 0.77 0.77Hispanic 0.64 0.64Asian 1.27 1.27Other 1.35 1.35
Age as of 12/31/1118 years or younger 0.35 0.3519–23 years 0.30 0.3024–29 years † †30–39 years † †40 years or older † †
Type of institutionPublic 2-year 0.53 0.53Public 4-year 0.62 0.62Private nonprofit 4-year 0.88 0.88For-profit 4-year 0.94 0.94For-profit less-than-2-year 1.71 1.71More than one institution or other 0.83 0.83
Undergraduate degree or certificate programNo degree or certificate 1.64 1.64Certificate 1.00 1.00Associate’s degree 0.48 0.48Bachelor’s degree 0.48 0.48
Income groupLowest 25 percent 0.56 0.56Lower middle 25 percent 0.58 0.58Upper middle 25 percent 0.54 0.54Highest 25 percent 0.71 0.71
Highest education attained by either parentHigh school diploma or less 0.47 0.47Some postsecondary education 0.53 0.53Bachelor’s degree or higher 0.48 0.48
See notes at end of table.
Table S2. Standard errors for table 2: DEPENDENCY STATUS AND NONTRADITIONAL CHARACTERISTICS: Percentage distribution of undergraduates’ dependency status for financial aid purposes, by selected characteristics: 2011–12
– 12 –

National Center for Education Statistics
Selected characteristics Dependent Independent
Disability statusNo disability reported 0.32 0.32Some type of disability reported 0.80 0.80
Has dependent(s)Yes † †No 0.34 0.34
Single with dependent(s)Yes † †No 0.35 0.35
High school completion statusHigh school diploma, foreign high school, or home schooled 0.33 0.33GED or other equivalency, completion certificate, or no high school diploma, certificate, or other equivalency 0.78 0.78
Number of months between high school completion and postsecondary entry0–12 0.37 0.3713 or more 0.43 0.43
Attendance statusAny full-time 0.39 0.39Exclusively part-time 0.50 0.50
Worked while enrolledWorked full time 0.49 0.49Worked part time 0.49 0.49Did not work 0.48 0.48
† Not applicable.SOURCE: U.S. Department of Education, National Center for Education Statistics, 2011–12 National Postsecondary Student Aid Study (NPSAS:12).
Table S2. Standard errors for table 2: DEPENDENCY STATUS AND NONTRADITIONAL CHARACTERISTICS: Percentage distribution of undergraduates’ dependency status for financial aid purposes, by selected characteristics: 2011–12—Continued
– 13 –

National Center for Education Statistics
Selected characteristics Zero One TwoThree
or more
Total 72.5 9.9 10.0 7.6
SexMale 81.0 6.5 7.2 5.3Female 66.1 12.5 12.1 9.3
Race/ethnicity1
White 75.6 9.0 9.2 6.2Black 58.8 13.5 14.4 13.3Hispanic 71.7 10.6 10.4 7.3Asian 82.4 6.6 5.7 5.3Other 72.0 10.6 8.7 8.8
Age as of 12/31/1118 years or younger 97.6 1.4 0.6 0.419–23 years 91.8 5.1 2.3 0.924–29 years 62.2 15.9 14.0 7.930–39 years 31.8 16.4 26.4 25.440 years or older 39.3 19.1 22.9 18.6
Type of institutionPublic 2-year 67.6 11.9 12.0 8.5Public 4-year 84.6 5.7 5.7 3.9Private nonprofit 4-year 83.0 5.9 6.0 5.1For-profit 4-year 43.8 17.1 20.2 18.8For-profit less-than-2-year 53.2 19.2 17.6 10.0More than one institution or other2 71.6 11.0 9.7 7.8
Undergraduate degree or certificate programNo degree or certificate 69.5 11.9 12.5 6.1Certificate 56.4 17.8 14.8 11.0Associate’s degree 66.3 12.0 12.4 9.4Bachelor’s degree 81.1 6.6 6.8 5.5
Income group3
Lowest 25 percent 78.6 9.5 6.8 5.1Lower middle 25 percent 73.3 10.6 9.4 6.7Upper middle 25 percent 72.3 9.8 10.0 7.9Highest 25 percent 66.2 9.7 13.6 10.4
Highest education attained by either parent4
High school diploma or less 62.8 12.8 13.7 10.6Some postsecondary education 71.5 10.4 10.2 7.9Bachelor’s degree or higher 82.7 6.9 6.3 4.1
See notes at end of table.
Table 3. NUMBER OF DEPENDENTS AND NONTRADITIONAL CHARACTERISTICS: Percentage distribution of undergraduates’ number of dependents, by selected characteristics: 2011–12
Number of dependents
– 14 –

National Center for Education Statistics
Selected characteristics Zero One TwoThree
or more
Disability statusNo disability reported 73.1 9.8 9.7 7.3Some type of disability reported5 67.5 11.0 12.0 9.4
Dependency status6
Dependent 100.0 † † †Independent 46.4 19.4 19.5 14.8
Single with dependent(s)7
Yes † 42.1 34.2 23.8No 85.5 4.2 5.7 4.7
High school completion statusHigh school diploma, foreign high school, or home schooled 74.8 9.3 9.3 6.6GED or other equivalency, completion certificate, or no high school diploma, certificate, or other equivalency 49.6 15.8 17.3 17.3
Number of months between high school completion and postsecondary entry8
0–12 80.1 7.7 7.1 5.113 or more 53.9 15.4 17.1 13.6
Attendance status9
Any full-time 78.4 7.9 7.5 6.3Exclusively part-time 64.8 12.6 13.2 9.3
Worked while enrolled10
Worked full time 57.6 14.9 15.5 12.1Worked part time 80.2 7.6 7.2 5.0Did not work 75.3 8.8 8.9 7.0
See notes at end of table.
Table 3. NUMBER OF DEPENDENTS AND NONTRADITIONAL CHARACTERISTICS: Percentage distribution of undergraduates’ number of dependents, by selected characteristics: 2011–12—Continued
Number of dependents
– 15 –

National Center for Education Statistics
† Not applicable.
SOURCE: U.S. Department of Education, National Center for Education Statistics, 2011–12 National Postsecondary Student Aid Study (NPSAS:12).
Table 3. NUMBER OF DEPENDENTS AND NONTRADITIONAL CHARACTERISTICS: Percentage distribution of undergraduates’ number of dependents, by selected characteristics: 2011–12—Continued
9 Full-time status for the purposes of financial aid eligibility was based on 12 credit hours, unless the awarding institution employed a different standard.
NOTE: Italicized text indicates characteristics of nontraditional students. Estimates include students enrolled in Title IV eligible postsecondary institutions in the 50 states and the District of Columbia. Prior cycles of the National Postsecondary Student Aid Study (NPSAS) included sampled institutions from Puerto Rico; to yield comparable estimates across cycles, use the COMPTO87 variable to exclude Puerto Rican institutions from estimates. Detail may not sum to totals because of rounding.
10 Estimates exclude students who worked in school-related jobs (e.g., work-study or assistantships) and jobs held while not enrolled, including summer break. Full-time status was defined as working 35 or more hours per week, and part-time status was defined as working less than 35 hours per week.
1 Black includes African American, Hispanic includes Latino, and Other includes American Indian, Alaska Native, Native Hawaiian or other Pacific Islander, and Two or more races. Race categories exclude Hispanic origin unless specified.2 Includes the 9.0 percent of students who attended more than one institution, a public less-than-2 year institution, a private nonprofit 2-year institution, a private nonprofit less-than-2-year institution, or a for-profit 2-year institution.3 Total income in 2010 was used because it was reported on the federal financial aid application and used for federal need analysis for 2011–12. Income consists of parents’ income for dependent students. For independent students, consists of the income of the student (and spouse if the student is married).4 Excludes the 3.5 percent of students who reported that they did not know their parents’ highest level of education.5 Indicates reporting a long-lasting condition such as deafness or serious difficulty hearing; blindness or serious difficulty seeing; serious difficulty concentrating, remembering or making a decision; or serious difficulty walking or climbing stairs.6 Independent students are age 24 or over and students under 24 who are married, have dependents, are veterans or on active duty, are orphans or wards of the courts, are homeless or at risk of homelessness, or were determined to be independent by a financial aid officer using professional judgment. Other undergraduates under age 24 are considered to be dependent.7 Includes students who were single, never married; separated; widowed; or divorced.8 Excludes the .9 percent of students who did not earn a high school diploma, certificate, or equivalency because these students did not have a high school completion date.
– 16 –

National Center for Education Statistics
Selected characteristics Zero One TwoThree
or more
Total 0.28 0.16 0.18 0.17
SexMale 0.36 0.23 0.25 0.20Female 0.38 0.25 0.23 0.23
Race/ethnicityWhite 0.37 0.22 0.22 0.20Black 0.84 0.44 0.52 0.50Hispanic 0.65 0.41 0.41 0.34Asian 0.91 0.61 0.49 0.62Other 1.29 0.83 0.78 0.83
Age as of 12/31/1118 years or younger 0.23 0.14 0.13 0.0719–23 years 0.23 0.17 0.14 0.0724–29 years 0.66 0.48 0.46 0.3830–39 years 0.65 0.55 0.64 0.6140 years or older 1.02 0.68 0.73 0.73
Type of institutionPublic 2-year 0.54 0.29 0.36 0.31Public 4-year 0.43 0.23 0.25 0.19Private nonprofit 4-year 0.80 0.45 0.53 0.48For-profit 4-year 1.16 0.79 0.89 0.49For-profit less-than-2-year 1.98 0.72 1.01 1.05More than one institution or other 0.70 0.44 0.36 0.39
Undergraduate degree or certificate programNo degree or certificate 2.00 1.52 1.28 0.85Certificate 1.10 0.70 0.59 0.70Associate’s degree 0.47 0.27 0.30 0.28Bachelor’s degree 0.34 0.19 0.21 0.17
Income groupLowest 25 percent 0.47 0.31 0.29 0.30Lower middle 25 percent 0.52 0.36 0.31 0.28Upper middle 25 percent 0.56 0.35 0.31 0.33Highest 25 percent 0.55 0.31 0.42 0.34
Highest education attained by either parentHigh school diploma or less 0.50 0.31 0.34 0.29Some postsecondary education 0.54 0.37 0.36 0.31Bachelor’s degree or higher 0.36 0.23 0.25 0.20
See notes at end of table.
Number of dependents
Table S3. Standard errors for table 3: NUMBER OF DEPENDENTS AND NONTRADITIONAL CHARACTERISTICS: Percentage distribution of undergraduates’ number of dependents, by selected characteristics: 2011–12
– 17 –

National Center for Education Statistics
Selected characteristics Zero One TwoThree
or more
Disability statusNo disability reported 0.29 0.17 0.17 0.18Some type of disability reported 0.86 0.54 0.63 0.54
Dependency statusDependent † † † †Independent 0.44 0.30 0.31 0.31
Single with dependent(s)Yes † 0.63 0.67 0.64No 0.26 0.13 0.16 0.14
High school completion statusHigh school diploma, foreign high school, or home schooled 0.29 0.17 0.18 0.16GED or other equivalency, completion certificate, or no high school diploma, certificate, or other equivalency 0.96 0.65 0.66 0.69
Number of months between high school completion and postsecondary entry0–12 0.29 0.18 0.18 0.1513 or more 0.52 0.39 0.37 0.38
Attendance statusAny full-time 0.32 0.20 0.17 0.17Exclusively part-time 0.50 0.30 0.34 0.27
Worked while enrolledWorked full time 0.59 0.39 0.43 0.35Worked part time 0.40 0.26 0.26 0.22Did not work 0.48 0.24 0.27 0.30
† Not applicable.SOURCE: U.S. Department of Education, National Center for Education Statistics, 2011–12 National Postsecondary Student Aid Study (NPSAS:12).
Number of dependents
Table S3. Standard errors for table 3: NUMBER OF DEPENDENTS AND NONTRADITIONAL CHARACTERISTICS: Percentage distribution of undergraduates’ number of dependents, by selected characteristics: 2011–12—Continued
– 18 –

National Center for Education Statistics
Selected characteristics
Single with
dependent(s) 2
Single without
dependent(s)2
Married with
dependent(s)2
Married without
dependent(s)2 Dependent1
Total 15.2 18.4 12.3 5.4 48.7
SexMale 7.9 22.0 11.0 5.4 53.7Female 20.7 15.6 13.3 5.5 45.0
Race/ethnicity3
White 11.1 18.0 13.3 6.5 51.2Black 30.7 20.2 10.5 3.1 35.5Hispanic 16.9 17.5 11.4 4.5 49.7Asian 7.8 18.6 9.8 5.0 58.9Other 15.9 19.7 12.2 3.8 48.5
Age as of 12/31/1118 years or younger 2.2 3.6 0.2 ! 0.2 93.819–23 years 6.6 4.3 1.5 2.1 85.324–29 years 23.5 53.0 14.3 9.1 #30–39 years 32.4 24.6 35.9 7.2 #40 years or older 26.3 24.3 34.3 15.0 #
Type of institutionPublic 2-year 17.9 20.8 14.5 6.5 40.3Public 4-year 7.3 15.7 8.1 4.5 64.4Private nonprofit 4-year 8.1 11.8 8.9 3.9 67.3For-profit 4-year 33.2 24.1 23.0 6.7 13.0For-profit less-than-2-year 35.3 21.0 11.5 3.5 28.6More than one institution or other4 16.9 19.1 11.5 5.1 47.4
Undergraduate degree or certificate programNo degree or certificate 13.3 26.2 17.3 12.5 30.7Certificate 28.2 21.6 15.4 7.4 27.4Associate’s degree 19.2 20.4 14.5 5.8 40.1Bachelor’s degree 9.5 15.4 9.4 4.2 61.5
Income group5
Lowest 25 percent 19.1 28.1 2.3 1.7 48.8Lower middle 25 percent 21.0 22.0 5.7 2.7 48.6Upper middle 25 percent 15.9 18.0 11.7 5.6 48.7Highest 25 percent 5.3 6.2 28.5 11.3 48.7
See notes at end of table.
Table 4. SINGLE CAREGIVER AND NONTRADITIONAL CHARACTERISTICS: Percentage distribution of undergraduates’ marital and caregiving status, by selected characteristics: 2011–12
Independent1
– 19 –

National Center for Education Statistics
Selected characteristics
Single with
dependent(s) 2
Single without
dependent(s)2
Married with
dependent(s)2
Married without
dependent(s)2 Dependent1
Highest education attained by either parent6
High school diploma or less 21.0 19.2 16.2 6.2 37.4Some postsecondary education 15.8 18.9 12.6 6.0 46.6Bachelor’s degree or higher 8.6 16.5 8.7 4.5 61.7
Disability statusNo disability reported 14.7 17.7 12.2 5.3 50.1Some type of disability reported7 19.2 23.8 13.3 6.2 37.5
High school completion statusHigh school diploma, foreign high school, or home schooled 13.6 17.6 11.7 5.4 51.7
GED or other equivalency, completion certificate, or no high school diploma, certificate, or other equivalency 31.8 25.7 18.6 5.6 18.3
Number of months between high school completion and postsecondary entry8
0–12 10.9 15.8 9.0 4.7 59.713 or more 25.7 24.8 20.5 7.4 21.7
Attendance status9
Any full-time 13.2 14.8 8.4 3.6 60.0Exclusively part-time 17.8 23.1 17.4 7.8 34.0
Worked while enrolled10
Worked full time 21.7 24.2 20.7 9.0 24.4Worked part time 11.8 15.7 8.0 4.4 60.1Did not work 14.1 16.9 10.6 4.0 54.4
See notes at end of table.
Table 4. SINGLE CAREGIVER AND NONTRADITIONAL CHARACTERISTICS: Percentage distribution of undergraduates’ marital and caregiving status, by selected characteristics: 2011–12—Continued
Independent1
– 20 –

National Center for Education Statistics
3 Black includes African American, Hispanic includes Latino, and Other includes American Indian, Alaska Native, Native Hawaiian or other Pacific Islander, and Two or more races. Race categories exclude Hispanic origin unless specified.
10 Estimates exclude students who worked in school-related jobs (e.g., work-study or assistantships) and jobs held while not enrolled, including summer break. Full-time status was defined as working 35 or more hours per week, and part-time status was defined as working less than 35 hours per week.
! Interpret data with caution. The coefficient of variation (CV) for this estimate is between 30 and 50 percent.1 Independent students are age 24 or over and students under 24 who are married, have dependents, are veterans or on active duty, are orphans or wards of the courts, are homeless or at risk of homelessness, or were determined to be independent by a financial aid officer using professional judgment. Other undergraduates under age 24 are considered to be dependent.2 Includes students who were single, never married; separated; widowed; or divorced.
Table 4. SINGLE CAREGIVER AND NONTRADITIONAL CHARACTERISTICS: Percentage distribution of undergraduates’ marital and caregiving status, by selected characteristics: 2011–12—Continued
# Rounds to zero.
NOTE: Italicized text indicates characteristics of nontraditional students. Estimates include students enrolled in Title IV eligible postsecondary institutions in the 50 states and the District of Columbia. Prior cycles of the National Postsecondary Student Aid Study (NPSAS) included sampled institutions from Puerto Rico; to yield comparable estimates across cycles, use the COMPTO87 variable to exclude Puerto Rican institutions from estimates. Detail may not sum to totals because of rounding. SOURCE: U.S. Department of Education, National Center for Education Statistics, 2011–12 National Postsecondary Student Aid Study (NPSAS:12).
4 Includes the 9.0 percent of respondents who attended more than one institution, a public less-than-2 year institution, a private nonprofit 2-year institution, a private nonprofit less-than-2-year institution, or a for-profit 2-year institution.5 Total income in 2010 was used because it was reported on the federal financial aid application and used for federal need analysis for 2011–12. Income consists of parents’ income for dependent students. For independent students, consists of the income of the student (and spouse if the student is married).6 Excludes the 3.5 percent of respondents who reported that they did not know their parents’ highest level of education.7 Indicates reporting a long-lasting condition such as deafness or serious difficulty hearing; blindness or serious difficulty seeing; serious difficulty concentrating, remembering or making a decision; or serious difficulty walking or climbing stairs.8 Excludes the .9 percent of respondents who did not earn a high school diploma, certificate, or equivalency because these respondents did not have a high school completion date.9 Full-time status for the purposes of financial aid eligibility was based on 12 credit hours, unless the awarding institution employed a different standard.
– 21 –
National Center for Education Statistics
Selected characteristics
Single with
dependent(s)
Single without
dependent(s)
Married with
dependent(s)
Married without
dependent(s) Dependent
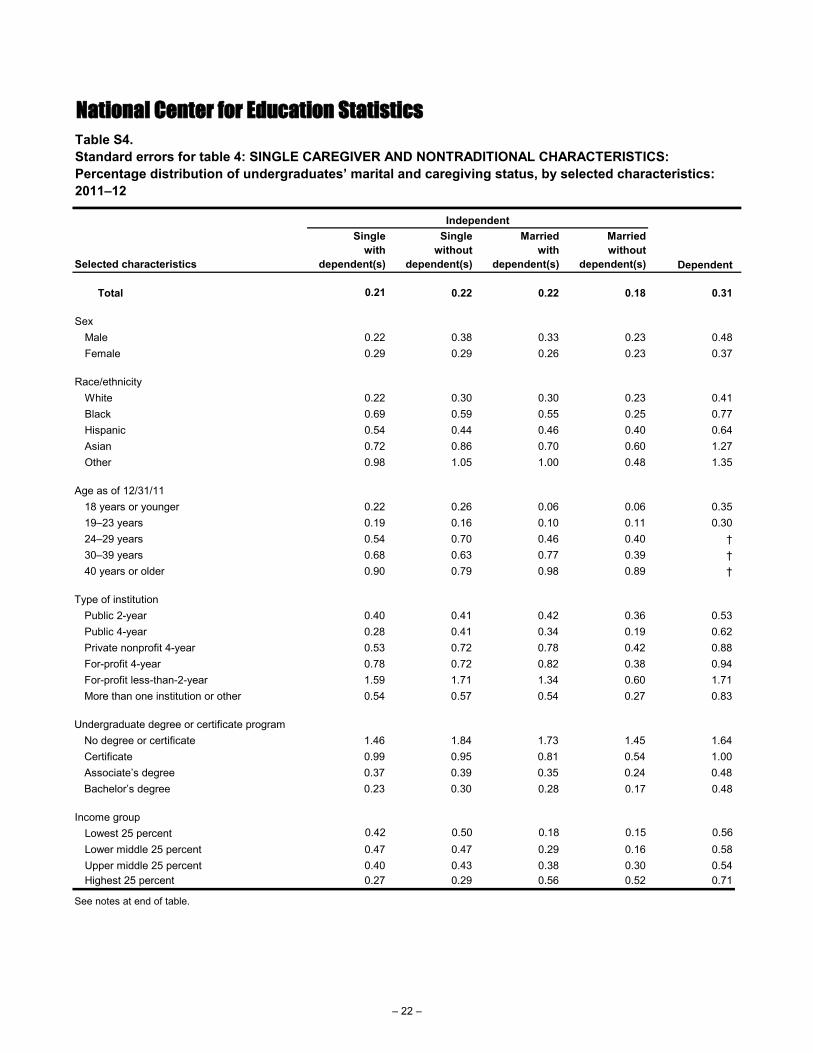
Total 0.21 0.22 0.22 0.18 0.31
SexMale 0.22 0.38 0.33 0.23 0.48Female 0.29 0.29 0.26 0.23 0.37
Race/ethnicityWhite 0.22 0.30 0.30 0.23 0.41Black 0.69 0.59 0.55 0.25 0.77Hispanic 0.54 0.44 0.46 0.40 0.64Asian 0.72 0.86 0.70 0.60 1.27Other 0.98 1.05 1.00 0.48 1.35
Age as of 12/31/1118 years or younger 0.22 0.26 0.06 0.06 0.3519–23 years 0.19 0.16 0.10 0.11 0.3024–29 years 0.54 0.70 0.46 0.40 †30–39 years 0.68 0.63 0.77 0.39 †40 years or older 0.90 0.79 0.98 0.89 †
Type of institutionPublic 2-year 0.40 0.41 0.42 0.36 0.53Public 4-year 0.28 0.41 0.34 0.19 0.62Private nonprofit 4-year 0.53 0.72 0.78 0.42 0.88For-profit 4-year 0.78 0.72 0.82 0.38 0.94For-profit less-than-2-year 1.59 1.71 1.34 0.60 1.71More than one institution or other 0.54 0.57 0.54 0.27 0.83
Undergraduate degree or certificate programNo degree or certificate 1.46 1.84 1.73 1.45 1.64Certificate 0.99 0.95 0.81 0.54 1.00Associate’s degree 0.37 0.39 0.35 0.24 0.48Bachelor’s degree 0.23 0.30 0.28 0.17 0.48
Income groupLowest 25 percent 0.42 0.50 0.18 0.15 0.56Lower middle 25 percent 0.47 0.47 0.29 0.16 0.58Upper middle 25 percent 0.40 0.43 0.38 0.30 0.54Highest 25 percent 0.27 0.29 0.56 0.52 0.71
See notes at end of table.
Independent
Table S4. Standard errors for table 4: SINGLE CAREGIVER AND NONTRADITIONAL CHARACTERISTICS: Percentage distribution of undergraduates’ marital and caregiving status, by selected characteristics: 2011–12
– 22 –

National Center for Education Statistics
Selected characteristics
Single with
dependent(s)
Single without
dependent(s)
Married with
dependent(s)
Married without
dependent(s) Dependent
Highest education attained by either parentHigh school diploma or less 0.44 0.36 0.43 0.35 0.47Some postsecondary education 0.43 0.37 0.39 0.33 0.53Bachelor’s degree or higher 0.26 0.41 0.30 0.19 0.48
Disability statusNo disability reported 0.22 0.23 0.24 0.19 0.32Some type of disability reported 0.70 0.65 0.69 0.42 0.80
High school completion statusHigh school diploma, foreign high school, or home schooled 0.22 0.23 0.23 0.19 0.33
GED or other equivalency, completion certificate, or no high school diploma, certificate, or other equivalency 0.71 0.81 0.80 0.46 0.78
Number of months between high school completion and postsecondary entry
0–12 0.22 0.26 0.20 0.17 0.3713 or more 0.45 0.46 0.50 0.34 0.43
Attendance statusAny full-time 0.24 0.25 0.23 0.12 0.39Exclusively part-time 0.37 0.38 0.40 0.37 0.50
Worked while enrolledWorked full time 0.45 0.52 0.46 0.38 0.49Worked part time 0.29 0.31 0.31 0.21 0.49Did not work 0.33 0.36 0.34 0.23 0.48
† Not applicable.
Table S4. Standard errors for table 4: SINGLE CAREGIVER AND NONTRADITIONAL CHARACTERISTICS: Percentage distribution of undergraduates’ marital and caregiving status, by selected characteristics: 2011–12—Continued
SOURCE: U.S. Department of Education, National Center for Education Statistics, 2011–12 National Postsecondary Student Aid Study (NPSAS:12).
Independent
– 23 –

National Center for Education Statistics
Selected characteristicsHigh school
diplomaForeign high school
or homeschooledGED or other equivalency
High school completion
certificate or no high school diploma,
certificate, or equivalency
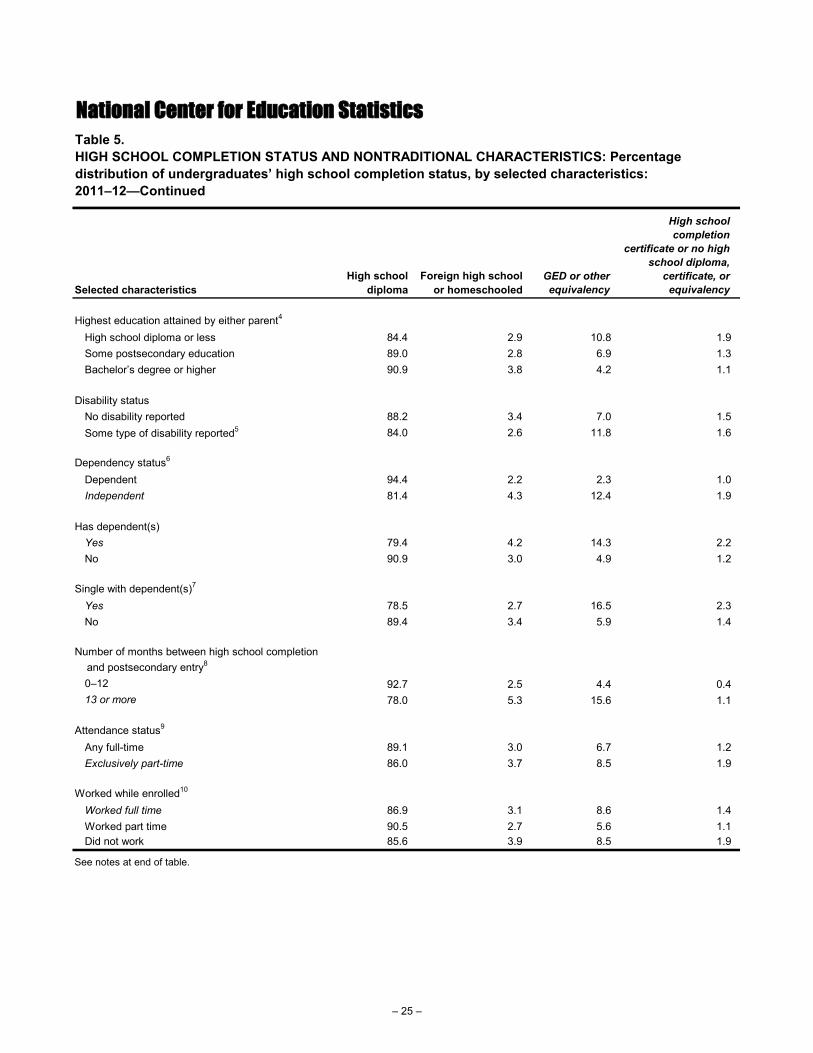
Total 87.7 3.3 7.5 1.5
SexMale 88.5 3.0 7.2 1.4Female 87.2 3.5 7.7 1.6
Race/ethnicity1
White 89.9 2.0 7.1 1.0Black 85.1 3.3 9.6 1.9Hispanic 86.3 3.8 7.4 2.5Asian 77.7 16.5 4.0 1.8Other 86.9 2.2 9.4 1.6
Age as of 12/31/1118 years or younger 94.0 1.8 2.7 1.519–23 years 93.3 2.3 3.2 1.224–29 years 84.1 4.2 10.2 1.530–39 years 77.3 4.8 15.7 2.140 years or older 78.3 5.4 14.4 2.0
Type of institutionPublic 2-year 85.0 3.6 9.3 2.1Public 4-year 93.1 3.0 3.3 0.6Private nonprofit 4-year 91.6 3.9 3.6 0.9For-profit 4-year 80.8 1.7 16.3 1.2For-profit less-than-2-year 72.8 2.6 ! 17.6 6.9More than one institution or other2 86.9 3.7 7.9 1.6
Undergraduate degree or certificate programNo degree or certificate 88.2 5.3 5.0 1.5Certificate 78.1 3.4 13.6 4.9Associate’s degree 84.6 3.4 10.2 1.8Bachelor’s degree 92.2 3.0 4.1 0.7
Income group3
Lowest 25 percent 83.4 3.3 11.1 2.2Lower middle 25 percent 88.1 2.7 7.7 1.5Upper middle 25 percent 89.3 3.0 6.6 1.1Highest 25 percent 90.0 4.0 4.9 1.2
See notes at end of table.
Table 5. HIGH SCHOOL COMPLETION STATUS AND NONTRADITIONAL CHARACTERISTICS: Percentage distribution of undergraduates’ high school completion status, by selected characteristics: 2011–12
– 24 –
National Center for Education Statistics
Selected characteristicsHigh school
diplomaForeign high school
or homeschooledGED or other equivalency
High school completion
certificate or no high school diploma,
certificate, or equivalency
Highest education attained by either parent4
High school diploma or less 84.4 2.9 10.8 1.9Some postsecondary education 89.0 2.8 6.9 1.3Bachelor’s degree or higher 90.9 3.8 4.2 1.1
Disability statusNo disability reported 88.2 3.4 7.0 1.5Some type of disability reported5 84.0 2.6 11.8 1.6
Dependency status6
Dependent 94.4 2.2 2.3 1.0Independent 81.4 4.3 12.4 1.9
Has dependent(s)Yes 79.4 4.2 14.3 2.2No 90.9 3.0 4.9 1.2
Single with dependent(s)7
Yes 78.5 2.7 16.5 2.3No 89.4 3.4 5.9 1.4
Number of months between high school completion and postsecondary entry8
0–12 92.7 2.5 4.4 0.413 or more 78.0 5.3 15.6 1.1
Attendance status9
Any full-time 89.1 3.0 6.7 1.2Exclusively part-time 86.0 3.7 8.5 1.9
Worked while enrolled10
Worked full time 86.9 3.1 8.6 1.4Worked part time 90.5 2.7 5.6 1.1Did not work 85.6 3.9 8.5 1.9
See notes at end of table.
Table 5. HIGH SCHOOL COMPLETION STATUS AND NONTRADITIONAL CHARACTERISTICS: Percentage distribution of undergraduates’ high school completion status, by selected characteristics: 2011–12—Continued
– 25 –

National Center for Education Statistics
7 Includes students who were single, never married; separated; widowed; or divorced.
9 Full-time status for the purposes of financial aid eligibility was based on 12 credit hours, unless the awarding institution employed a different standard. 10 Estimates exclude students who worked in school-related jobs (e.g., work-study or assistantships) and jobs held while not enrolled, including summer break. Full-time status was defined as working 35 or more hours per week, and part-time status was defined as working less than 35 hours per week.
Table 5. HIGH SCHOOL COMPLETION STATUS AND NONTRADITIONAL CHARACTERISTICS: Percentage distribution of undergraduates’ high school completion status, by selected characteristics: 2011–12—Continued
NOTE: Italicized text indicates characteristics of nontraditional students. Estimates include students enrolled in Title IV eligible postsecondary institutions in the 50 states and the District of Columbia. Prior cycles of the National Postsecondary Student Aid Study (NPSAS) included sampled institutions from Puerto Rico; to yield comparable estimates across cycles, use the COMPTO87 variable to exclude Puerto Rican institutions from estimates. Detail may not sum to totals because of rounding.
! Interpret data with caution. The coefficient of variation (CV) for this estimate is between 30 and 50 percent.
SOURCE: U.S. Department of Education, National Center for Education Statistics, 2011–12 National Postsecondary Student Aid Study (NPSAS:12).
1 Black includes African American, Hispanic includes Latino, and Other includes American Indian, Alaska Native, Native Hawaiian or other Pacific Islander, and Two or more races. Race categories exclude Hispanic origin unless specified.2 Includes the 9.0 percent of respondents who attended more than one institution, a public less-than-2 year institution, a private nonprofit 2-year institution, a private nonprofit less-than-2-year institution, or a for-profit 2-year institution.3 Total income in 2010 was used because it was reported on the federal financial aid application and used for federal need analysis for 2011–12. Income consists of parents’ income for dependent students. For independent students, consists of the income of the student (and spouse if the student is married).4 Excludes the 3.5 percent of respondents who reported that they did not know their parents’ highest level of education.5 Indicates reporting a long-lasting condition such as deafness or serious difficulty hearing; blindness or serious difficulty seeing; serious difficulty concentrating, remembering or making a decision; or serious difficulty walking or climbing stairs.6 Independent students are age 24 or over and students under 24 who are married, have dependents, are veterans or on active duty, are orphans or wards of the courts, are homeless or at risk of homelessness, or were determined to be independent by a financial aid officer using professional judgment. Other undergraduates under age 24 are considered to be dependent.
8 Excludes the .9 percent of respondents who did not earn a high school diploma, certificate, or equivalency because these respondents did not have a high school completion date.
– 26 –

National Center for Education Statistics
Selected characteristicsHigh school
diplomaForeign high school
or homeschooledGED or other equivalency
High school completion
certificate or no high school diploma,
certificate, or equivalency
Total 0.21 0.12 0.17 0.08
SexMale 0.28 0.17 0.24 0.11Female 0.29 0.17 0.21 0.11
Race/ethnicityWhite 0.23 0.10 0.19 0.09Black 0.49 0.30 0.43 0.18Hispanic 0.64 0.37 0.45 0.28Asian 1.07 1.07 0.52 0.28Other 0.81 0.35 0.71 0.35
Age as of 12/31/1118 years or younger 0.42 0.23 0.23 0.2419–23 years 0.19 0.12 0.14 0.1024–29 years 0.53 0.27 0.42 0.1730–39 years 0.66 0.37 0.53 0.2540 years or older 0.86 0.42 0.76 0.25
Type of institutionPublic 2-year 0.40 0.23 0.35 0.20Public 4-year 0.25 0.15 0.21 0.06Private nonprofit 4-year 0.53 0.35 0.33 0.21For-profit 4-year 0.71 0.18 0.65 0.17For-profit less-than-2-year 2.12 1.28 1.64 1.20More than one institution or other 0.53 0.50 0.37 0.19
Undergraduate degree or certificate programNo degree or certificate 1.33 1.01 0.78 0.37Certificate 0.94 0.59 0.77 0.54Associate’s degree 0.33 0.21 0.30 0.16Bachelor’s degree 0.22 0.14 0.17 0.06
Income groupLowest 25 percent 0.41 0.22 0.38 0.17Lower middle 25 percent 0.35 0.20 0.27 0.15Upper middle 25 percent 0.36 0.19 0.30 0.12Highest 25 percent 0.40 0.24 0.24 0.15
See notes at end of table.
Table S5. Standard errors for table 5: HIGH SCHOOL COMPLETION STATUS AND NONTRADITIONAL CHARACTERISTICS: Percentage distribution of undergraduates’ high school completion status, by selected characteristics: 2011–12
– 27 –

National Center for Education Statistics
Selected characteristicsHigh school
diplomaForeign high school
or homeschooledGED or other equivalency
High school completion
certificate or no high school diploma,
certificate, or equivalency
Highest education attained by either parentHigh school diploma or less 0.41 0.19 0.32 0.16Some postsecondary education 0.37 0.20 0.29 0.12Bachelor’s degree or higher 0.31 0.20 0.18 0.10
Disability statusNo disability reported 0.22 0.12 0.18 0.09Some type of disability reported 0.63 0.28 0.53 0.20
Dependency statusDependent 0.18 0.12 0.12 0.09Independent 0.38 0.19 0.31 0.14
Has dependent(s)Yes 0.50 0.24 0.40 0.19No 0.19 0.14 0.17 0.07
Single with dependent(s)Yes 0.61 0.23 0.50 0.22No 0.19 0.13 0.16 0.08
Number of months between high school completion and postsecondary entry
0–12 0.16 0.12 0.14 0.0413 or more 0.47 0.27 0.40 0.10
Attendance statusAny full-time 0.26 0.15 0.19 0.08Exclusively part-time 0.32 0.18 0.25 0.16
Worked while enrolledWorked full time 0.37 0.21 0.31 0.14Worked part time 0.29 0.14 0.23 0.11Did not work 0.31 0.20 0.30 0.13
SOURCE: U.S. Department of Education, National Center for Education Statistics, 2011–12 National Postsecondary Student Aid Study (NPSAS:12).
Table S5. Standard errors for table 5: HIGH SCHOOL COMPLETION STATUS AND NONTRADITIONAL CHARACTERISTICS: Percentage distribution of undergraduates’ high school completion status, by selected characteristics: 2011–12—Continued
– 28 –

National Center for Education Statistics
Delayed enrollment defined by calendar year
Selected characteristics0–4
months5–7
months8–12
months13–24
months
25 or more
months
Total 34.2 27.8 64.9 3.5 3.8 9.2 18.6 40
SexMale 34.2 27.6 64.9 3.5 3.9 9.2 18.4 39Female 34.3 28.0 64.9 3.4 3.7 9.2 18.8 42
Race/ethnicity1
White 31.4 26.0 67.7 3.0 3.3 8.2 17.8 43Black 44.0 36.4 55.4 3.9 4.3 11.3 25.1 44Hispanic 36.2 27.4 63.3 4.2 5.2 10.2 17.2 37Asian 30.1 23.1 68.4 4.7 3.8 10.2 12.9 26Other 34.1 27.6 65.2 3.6 3.6 9.8 17.8 32
Age as of 12/31/1118 years or younger 12.3 2.5 87.1 5.8 4.6 2.1 0.4 1519–23 years 23.6 17.0 75.6 3.5 4.0 10.7 6.2 1824–29 years 45.2 38.1 53.9 3.4 4.6 10.1 28.0 4730–39 years 52.3 47.5 46.9 2.7 3.0 9.3 38.2 7940 years or older 55.7 52.1 43.3 2.5 2.1 6.8 45.3 129
See notes at end of table.
Table 6. DELAYED ENROLLMENT AND NONTRADITIONAL CHARACTERISTICS: Percentage of undergraduates who did not enter postsecondary education in the calendar year they completed high school; percentage who did not enter within 12 months of completing high school; percentage distribution of number of months between high school completion and postsecondary entry; and among those who entered 13 or more months after high school completion, median number of months to entry, by selected characteristics: 2011–12
Percentage distribution of number of months between high school
completion and postsecondary entry
Delayed enrollment defined by months elapsed
Percentage who did not enter
postsecondary education within
12 months of completing
high school
Of those with 13 or more months
between high school completion and
postsecondary entry, median number of
months delayed
Percentage who did not enter
postsecondary education in the
calendar year they completed
high school
– 29 –

National Center for Education Statistics
Delayed enrollment defined by calendar year
Selected characteristics0–4
months5–7
months8–12
months13–24
months
25 or more
months
Type of institutionPublic 2-year 42.9 34.4 56.6 4.2 4.8 10.6 23.8 43Public 4-year 21.4 16.7 77.9 2.6 2.7 6.7 10.0 30Private nonprofit 4-year 19.5 16.0 79.2 2.6 2.2 6.9 9.1 28For-profit 4-year 55.7 49.0 42.6 3.6 4.8 11.9 37.1 61For-profit less-than-2-year 54.2 45.8 42.8 5.4 6.0 15.6 30.2 39More than one institution or other2 34.2 28.0 64.9 3.4 3.7 10.0 18.0 38
Undergraduate degree or certificate programNo degree or certificate 27.8 23.7 71.3 2.3 2.7 7.7 16.0 48Certificate 50.8 43.0 47.6 4.3 5.1 13.1 29.9 45Associate’s degree 45.2 36.6 54.2 4.4 4.9 11.4 25.1 43Bachelor’s degree 22.0 17.6 77.2 2.5 2.7 6.6 11.0 35
Income group3
Lowest 25 percent 39.6 30.5 59.7 4.6 5.2 11.8 18.7 32Lower middle 25 percent 35.4 28.4 63.8 3.7 4.1 9.7 18.6 39Upper middle 25 percent 32.7 27.0 66.3 3.3 3.3 8.2 18.9 44Highest 25 percent 29.6 25.5 69.6 2.3 2.7 7.3 18.2 53
See notes at end of table.
Table 6. DELAYED ENROLLMENT AND NONTRADITIONAL CHARACTERISTICS: Percentage of undergraduates who did not enter postsecondary education in the calendar year they completed high school; percentage who did not enter within 12 months of completing high school; percentage distribution of number of months between high school completion and postsecondary entry; and among those who entered 13 or more months after high school completion, median number of months to entry, by selected characteristics: 2011–12—Continued
Delayed enrollment defined by months elapsed
Percentage who did not enter
postsecondary education in the
calendar year they completed
high school
Percentage who did not enter
postsecondary education within
12 months of completing
high school
Percentage distribution of number of months between high school
completion and postsecondary entry
Of those with 13 or more months
between high school completion and
postsecondary entry, median number of
months delayed
– 30 –

National Center for Education Statistics
Delayed enrollment defined by calendar year
Selected characteristics0–4
months5–7
months8–12
months13–24
months
25 or more
months
Highest education attained by either parent4
High school diploma or less 44.3 36.9 54.8 3.7 4.6 10.8 26.0 50Some postsecondary education 34.1 27.2 65.0 3.9 3.9 8.9 18.3 40Bachelor’s degree or higher 23.9 18.8 75.4 2.8 3.0 7.5 11.4 31
Disability statusNo disability reported 33.4 26.9 65.8 3.4 3.8 9.1 17.8 39Some type of disability reported5 41.1 34.8 58.0 3.5 3.7 10.0 24.8 51
Dependency status6
Dependent 18.7 12.2 80.4 3.8 3.7 8.4 3.8 16Independent 49.1 42.8 50.1 3.2 4.0 10.0 32.8 58
Has dependent(s)Yes 53.9 47.0 45.5 3.1 4.3 10.5 36.6 63No 26.8 20.6 72.3 3.6 3.6 8.7 11.8 28
Single with dependent(s)7
Yes 55.4 47.3 44.2 3.6 5.0 11.6 35.7 53No 30.5 24.3 68.6 3.4 3.6 8.8 15.6 38
See notes at end of table.
Percentage who did not enter
postsecondary education within
12 months of completing
high school
Percentage distribution of number of months between high school
completion and postsecondary entry
Of those with 13 or more months
between high school completion and
postsecondary entry, median number of
months delayed
Table 6. DELAYED ENROLLMENT AND NONTRADITIONAL CHARACTERISTICS: Percentage of undergraduates who did not enter postsecondary education in the calendar year they completed high school; percentage who did not enter within 12 months of completing high school; percentage distribution of number of months between high school completion and postsecondary entry; and among those who entered 13 or more months after high school completion, median number of months to entry, by selected characteristics: 2011–12—Continued
Delayed enrollment defined by months elapsed
Percentage who did not enter
postsecondary education in the
calendar year they completed
high school
– 31 –

National Center for Education Statistics
Delayed enrollment defined by calendar year
Selected characteristics0–4
months5–7
months8–12
months13–24
months
25 or more
months
High school completion statusHigh school diploma, foreign high school, or home schooled 31.1 25.2 68.0 3.2 3.5 8.6 16.7 39GED or other equivalency, completion certificate, or no high school diploma, certificate, or other equivalency 69.3 56.5 30.4 6.2 6.9 16.3 40.2 50
Attendance status8
Any full-time 29.1 23.3 70.1 3.2 3.4 8.2 15.2 39Exclusively part-time 40.9 33.6 58.2 3.8 4.3 10.5 23.1 43
Worked while enrolled9
Worked full time 42.7 36.4 56.5 3.3 3.8 10.1 26.3 50Worked part time 28.1 22.1 71.2 3.2 3.4 8.7 13.5 32Did not work 34.3 27.3 64.7 3.8 4.2 9.1 18.2 43
See notes at end of table.
Table 6. DELAYED ENROLLMENT AND NONTRADITIONAL CHARACTERISTICS: Percentage of undergraduates who did not enter postsecondary education in the calendar year they completed high school; percentage who did not enter within 12 months of completing high school; percentage distribution of number of months between high school completion and postsecondary entry; and among those who entered 13 or more months after high school completion, median number of months to entry, by selected characteristics: 2011–12—Continued
Delayed enrollment defined by months elapsed
Percentage who did not enter
postsecondary education in the
calendar year they completed
high school
Percentage who did not enter
postsecondary education within
12 months of completing
high school
Percentage distribution of number of months between high school
completion and postsecondary entry
Of those with 13 or more months
between high school completion and
postsecondary entry, median number of
months delayed
– 32 –

National Center for Education Statistics
3 Total income in 2010 was used because it was reported on the federal financial aid application and used for federal need analysis for 2011–12. Income consists of parents’ income for dependent students. For independent students, consists of the income of the student (and spouse if the student is married).
7 Includes students who were single, never married; separated; widowed; or divorced.8 Full-time status for the purposes of financial aid eligibility was based on 12 credit hours, unless the awarding institution employed a different standard.
Table 6. DELAYED ENROLLMENT AND NONTRADITIONAL CHARACTERISTICS: Percentage of undergraduates who did not enter postsecondary education in the calendar year they completed high school; percentage who did not enter within 12 months of completing high school; percentage distribution of number of months between high school completion and postsecondary entry; and among those who entered 13 or more months after high school completion, median number of months to entry, by selected characteristics: 2011–12—Continued
4 Excludes the 3.5 percent of respondents who reported that they did not know their parents’ highest level of education.5 Indicates reporting a long-lasting condition such as deafness or serious difficulty hearing; blindness or serious difficulty seeing; serious difficulty concentrating, remembering or making a decision; or serious difficulty walking or climbing stairs.6 Independent students are age 24 or over and students under 24 who are married, have dependents, are veterans or on active duty, are orphans or wards of the courts, are homeless or at risk of homelessness, or were determined to be independent by a financial aid officer using professional judgment. Other undergraduates under age 24 are considered to be dependent.
NOTE: Two measures of delayed enrollment are shown. The first is comparable to National Postsecondary Student Aid Studies (NPSAS) conducted prior to 2012 and defines delayed enrollment as not entering postsecondary education in the calendar year of completing high school. The second is new for the 2011–12 NPSAS and defines delayed enrollment as entering postsecondary education 13 months or more after completing high school. Delayed entry estimates exclude the .9 percent of respondents who did not earn a high school diploma, certificate, or equivalency because these respondents did not have a high school completion date. Italicized text indicates characteristics of nontraditional students. Estimates include students enrolled in Title IV eligible postsecondary institutions in the 50 states and the District of Columbia. Prior cycles of NPSAS included sampled institutions from Puerto Rico; to yield comparable estimates across cycles, use the COMPTO87 variable to exclude Puerto Rican institutions from estimates. Detail may not sum to totals because of rounding. SOURCE: U.S. Department of Education, National Center for Education Statistics, 2011–12 National Postsecondary Student Aid Study (NPSAS:12).
9 Estimates exclude students who worked in school-related jobs (e.g., work-study or assistantships) and jobs held while not enrolled, including summer break. Full-time status was defined as working 35 or more hours per week, and part-time status was defined as working less than 35 hours per week.
1 Black includes African American, Hispanic includes Latino, and Other includes American Indian, Alaska Native, Native Hawaiian or other Pacific Islander, and Two or more races. Race categories exclude Hispanic origin unless specified.2 Includes the 9.0 percent of respondents who attended more than one institution, a public less-than-2 year institution, a private nonprofit 2-year institution, a private nonprofit less-than-2-year institution, or a for-profit 2-year institution.
– 33 –

National Center for Education Statistics
Delayed enrollment defined by calendar year
Selected characteristics0–4
months5–7
months8–12
months13–24
months
25 or more
months
Total 0.32 0.31 0.33 0.11 0.11 0.18 0.23 1.0
SexMale 0.46 0.45 0.48 0.18 0.16 0.26 0.38 1.3Female 0.38 0.36 0.38 0.12 0.14 0.21 0.29 1.5
Race/ethnicityWhite 0.36 0.33 0.35 0.14 0.13 0.23 0.28 1.0Black 0.83 0.73 0.86 0.28 0.31 0.42 0.65 2.1Hispanic 0.76 0.68 0.78 0.26 0.34 0.38 0.58 2.4Asian 1.10 1.05 1.11 0.43 0.46 0.75 0.82 2.1Other 1.27 1.20 1.26 0.46 0.39 0.75 1.01 4.5
Age as of 12/31/1118 years or younger 0.51 0.20 0.49 0.36 0.35 0.19 0.07 0.419–23 years 0.34 0.31 0.34 0.14 0.14 0.25 0.18 0.724–29 years 0.79 0.72 0.77 0.24 0.30 0.44 0.62 1.930–39 years 0.78 0.75 0.78 0.27 0.25 0.47 0.63 3.140 years or older 1.01 0.92 0.98 0.28 0.29 0.45 0.87 5.5
See notes at end of table.
Percentage distribution of number of months between high school
completion and postsecondary entry
Of those with 13 or more months
between high school completion and
postsecondary entry, median number of
months delayed
Delayed enrollment defined by months elapsed
Table S6. Standard errors for table 6: DELAYED ENROLLMENT AND NONTRADITIONAL CHARACTERISTICS: Percentage of undergraduates who did not enter postsecondary education in the calendar year they completed high school; percentage who did not enter within 12 months of completing high school; percentage distribution of number of months between high school completion and postsecondary entry; and among those who entered 13 or more months after high school completion, median number of months to entry, by selected characteristics: 2011–12
Percentage who did not enter
postsecondary education in the
calendar year they completed
high school
Percentage who did not enter
postsecondary education within
12 months of completing
high school
– 34 –

National Center for Education Statistics
Delayed enrollment defined by calendar year
Selected characteristics0–4
months5–7
months8–12
months13–24
months
25 or more
months
Type of institutionPublic 2-year 0.58 0.58 0.58 0.20 0.21 0.37 0.47 1.2Public 4-year 0.44 0.38 0.44 0.18 0.15 0.22 0.30 1.5Private nonprofit 4-year 0.71 0.71 0.72 0.26 0.28 0.45 0.57 3.2For-profit 4-year 1.18 1.35 1.19 0.24 0.32 0.43 1.20 3.1For-profit less-than-2-year 2.07 1.87 1.84 0.57 0.61 1.47 1.37 2.4More than one institution or other 0.63 0.57 0.59 0.22 0.25 0.37 0.55 1.3
Undergraduate degree or certificate programNo degree or certificate 1.99 1.95 2.00 0.49 0.60 1.14 1.44 5.2Certificate 1.10 1.04 1.08 0.33 0.43 0.67 0.92 2.5Associate’s degree 0.46 0.47 0.46 0.20 0.20 0.29 0.42 1.0Bachelor’s degree 0.35 0.35 0.36 0.11 0.13 0.20 0.28 1.6
Income groupLowest 25 percent 0.58 0.53 0.58 0.22 0.23 0.31 0.44 1.1Lower middle 25 percent 0.57 0.51 0.57 0.22 0.23 0.36 0.44 0.8Upper middle 25 percent 0.59 0.58 0.57 0.20 0.20 0.28 0.51 1.6Highest 25 percent 0.53 0.50 0.53 0.16 0.20 0.33 0.45 1.7
See notes at end of table.
Percentage distribution of number of months between high school
completion and postsecondary entry
Of those with 13 or more months
between high school completion and
postsecondary entry, median number of
months delayed
Delayed enrollment defined by months elapsed
Percentage who did not enter
postsecondary education in the
calendar year they completed
high school
Percentage who did not enter
postsecondary education within
12 months of completing
high school
Table S6. Standard errors for table 6: DELAYED ENROLLMENT AND NONTRADITIONAL CHARACTERISTICS: Percentage of undergraduates who did not enter postsecondary education in the calendar year they completed high school; percentage who did not enter within 12 months of completing high school; percentage distribution of number of months between high school completion and postsecondary entry; and among those who entered 13 or more months after high school completion, median number of months to entry, by selected characteristics: 2011–12—Continued
– 35 –

National Center for Education Statistics
Delayed enrollment defined by calendar year
Demographic and enrollment characteristics and characteristics that define traditional/nontraditional students
0–4 months
5–7 months
8–12 months
13–24 months
25 or more
months
Highest education attained by either parentHigh school diploma or less 0.61 0.57 0.65 0.19 0.22 0.38 0.39 1.6Some postsecondary education 0.52 0.50 0.52 0.19 0.21 0.30 0.45 1.4Bachelor’s degree or higher 0.34 0.35 0.34 0.14 0.16 0.23 0.30 1.1
Disability statusNo disability reported 0.33 0.30 0.33 0.12 0.11 0.19 0.23 0.4Some type of disability reported 0.89 0.85 0.85 0.27 0.31 0.54 0.79 1.9
Dependency statusDependent 0.30 0.26 0.31 0.15 0.14 0.22 0.14 0.2Independent 0.52 0.48 0.52 0.16 0.16 0.27 0.39 1.7
Has dependent(s)Yes 0.58 0.56 0.56 0.20 0.23 0.35 0.50 1.9No 0.32 0.30 0.34 0.13 0.13 0.19 0.22 0.7
Single with dependent(s)Yes 0.79 0.76 0.78 0.26 0.29 0.45 0.72 1.8No 0.32 0.30 0.33 0.12 0.12 0.19 0.23 0.9
See notes at end of table.
Percentage who did not enter
postsecondary education in the
calendar year they completed
high school
Percentage who did not enter
postsecondary education within
12 months of completing
high school
Percentage distribution of number of months between high school
completion and postsecondary entry
Of those with 13 or more months
between high school completion and
postsecondary entry, median number of
months delayed
Delayed enrollment defined by months elapsed
Table S6. Standard errors for table 6: DELAYED ENROLLMENT AND NONTRADITIONAL CHARACTERISTICS: Percentage of undergraduates who did not enter postsecondary education in the calendar year they completed high school; percentage who did not enter within 12 months of completing high school; percentage distribution of number of months between high school completion and postsecondary entry; and among those who entered 13 or more months after high school completion, median number of months to entry, by selected characteristics: 2011–12—Continued
– 36 –

National Center for Education Statistics
Delayed enrollment defined by calendar year
Selected characteristics0–4
months5–7
months8–12
months13–24
months
25 or more
months
High school completion statusHigh school diploma, foreign high school, or home schooled 0.32 0.32 0.33 0.12 0.12 0.20 0.25 0.3GED or other equivalency, completion certificate, or no high school diploma, certificate, or other equivalency 0.78 0.86 0.81 0.39 0.48 0.78 0.87 2.1
Attendance statusAny full-time 0.38 0.34 0.39 0.13 0.13 0.18 0.29 0.5Exclusively part-time 0.48 0.50 0.49 0.17 0.17 0.32 0.40 1.5
Worked while enrolledWorked full time 0.56 0.56 0.58 0.21 0.22 0.37 0.48 1.7Worked part time 0.40 0.37 0.40 0.15 0.17 0.27 0.31 1.2Did not work 0.48 0.48 0.47 0.16 0.17 0.24 0.43 1.0
SOURCE: U.S. Department of Education, National Center for Education Statistics, 2011–12 National Postsecondary Student Aid Study (NPSAS:12).
Table S6. Standard errors for table 6: DELAYED ENROLLMENT AND NONTRADITIONAL CHARACTERISTICS: Percentage of undergraduates who did not enter postsecondary education in the calendar year they completed high school; percentage who did not enter within 12 months of completing high school; percentage distribution of number of months between high school completion and postsecondary entry; and among those who entered 13 or more months after high school completion, median number of months to entry, by selected characteristics: 2011–12—Continued
Delayed enrollment defined by months elapsed
Percentage who did not enter
postsecondary education in the
calendar year they completed
high school
Percentage who did not enter
postsecondary education within
12 months of completing
high school
Percentage distribution of number of months between high school
completion and postsecondary entry
Of those with 13 or more months
between high school completion and
postsecondary entry, median number of
months delayed
– 37 –

National Center for Education Statistics
Selected characteristicsExclusively
full timeMix of full time
and part timeExclusively
part time
Total 38.4 18.1 43.4
SexMale 39.0 18.2 42.8Female 38.0 18.1 43.9
Race/ethnicity1
White 40.2 17.4 42.4Black 32.6 22.4 45.0Hispanic 34.5 17.0 48.5Asian 46.7 15.2 38.1Other 40.4 20.2 39.4
Age as of 12/31/1118 years or younger 59.4 15.4 25.219–23 years 49.8 16.6 33.624–29 years 24.6 20.9 54.430–39 years 22.2 21.4 56.340 years or older 17.1 18.0 64.9
Type of institutionPublic 2-year 20.3 15.6 64.1Public 4-year 53.0 14.7 32.3Private nonprofit 4-year 62.7 15.5 21.8For-profit 4-year 32.0 36.6 31.4For-profit less-than-2-year 28.0 49.4 22.6More than one institution or other2 44.0 19.5 36.5
Undergraduate degree or certificate programNo degree or certificate 11.4 8.9 79.8Certificate 23.0 35.4 41.6Associate’s degree 23.9 17.9 58.2Bachelor’s degree 56.4 16.0 27.6
Income group3
Lowest 25 percent 39.7 21.7 38.5Lower middle 25 percent 39.2 19.2 41.7Upper middle 25 percent 37.4 17.9 44.7Highest 25 percent 37.6 14.1 48.3
Highest education attained by either parent4
High school diploma or less 31.5 20.9 47.6Some postsecondary education 36.6 17.7 45.7Bachelor’s degree or higher 46.8 15.6 37.6
See notes at end of table.
Table 7. ATTENDANCE STATUS AND NONTRADITIONAL CHARACTERISTICS: Percentage distribution of undergraduates’ attendance status during the academic year, by selected characteristics: 2011–12
– 38 –

National Center for Education Statistics
Selected characteristicsExclusively
full timeMix of full time
and part timeExclusively
part time
Disability statusNo disability reported 39.1 17.8 43.1Some type of disability reported5 33.0 21.2 45.9
Dependency status6
Dependent 54.7 15.0 30.3Independent 23.0 21.1 55.9
Has dependent(s)Yes 22.1 22.4 55.5No 44.6 16.5 38.8
Single with dependent(s)7
Yes 24.0 25.3 50.8No 41.0 16.9 42.1
High school completion statusHigh school diploma, foreign high school, or home schooled 39.9 17.3 42.8GED or other equivalency, completion certificate, or no high school diploma, certificate, or other equivalency 23.7 26.1 50.1
Number of months between high school completion and postsecondary entry8
0–12 44.1 16.2 39.713 or more 24.8 22.9 52.3
Worked while enrolled9
Worked full time 20.3 17.4 62.3Worked part time 44.3 16.1 39.6Did not work 45.3 20.6 34.2
See notes at end of table.
Table 7. ATTENDANCE STATUS AND NONTRADITIONAL CHARACTERISTICS: Percentage distribution of undergraduates’ attendance status during the academic year, by selected characteristics: 2011–12—Continued
– 39 –

National Center for Education Statistics
8 Excludes the .9 percent of students who did not earn a high school diploma, certificate, or equivalency because these students did not have a high school completion date.
NOTE: Full-time status for the purposes of financial aid eligibility was based on 12 credit hours, unless the awarding institution employed a different standard. Italicized text indicates characteristics of nontraditional students. Estimates include students enrolled in Title IV eligible postsecondary institutions in the 50 states and the District of Columbia. Prior cycles of the National Postsecondary Student Aid Study (NPSAS) included sampled institutions from Puerto Rico; to yield comparable estimates across cycles, use the COMPTO87 variable to exclude Puerto Rican institutions from estimates. Detail may not sum to totals because of rounding.
1 Black includes African American, Hispanic includes Latino, and Other includes American Indian, Alaska Native, Native Hawaiian or other Pacific Islander, and Two or more races. Race categories exclude Hispanic origin unless specified.2 Includes the 9.0 percent of students who attended more than one institution, a public less-than-2 year institution, a private nonprofit 2-year institution, a private nonprofit less-than-2-year institution, or a for-profit 2-year institution.3 Total income in 2010 was used because it was reported on the federal financial aid application and used for federal need analysis for 2011–12. Income consists of parents’ income for dependent students. For independent students, consists of the income of the student (and spouse if the student is married).as the income reported on the federal financial aid application and used for federal need analysis for the 2011–12 academic year.4 Excludes the 3.5 percent of students who reported that they did not know their parents’ highest level of education.5 Indicates reporting a long-lasting condition such as deafness or serious difficulty hearing; blindness or serious difficulty seeing; serious difficulty concentrating, remembering or making a decision; or serious difficulty walking or climbing stairs.6 Independent students are age 24 or over and students under 24 who are married, have dependents, are veterans or on active duty, are orphans or wards of the courts, are homeless or at risk of homelessness, or were determined to be independent by a financial aid officer using professional judgment. Other undergraduates under age 24 are considered to be dependent.
Table 7. ATTENDANCE STATUS AND NONTRADITIONAL CHARACTERISTICS: Percentage distribution of undergraduates’ attendance status during the academic year, by selected characteristics: 2011–12—Continued
7 Includes students who were single, never married; separated; widowed; or divorced.
9 Estimates exclude students who worked in school-related jobs (e.g., work-study or assistantships) and jobs held while not enrolled, including summer break. Full-time status was defined as working 35 or more hours per week, and part-time status was defined as working less than 35 hours per week.
SOURCE: U.S. Department of Education, National Center for Education Statistics, 2011–12 National Postsecondary Student Aid Study (NPSAS:12).
– 40 –

National Center for Education Statistics
Selected characteristicsExclusively
full timeMix of full time
and part timeExclusively
part time
Total 0.32 0.38 0.40
SexMale 0.41 0.45 0.56Female 0.43 0.44 0.45
Race/ethnicityWhite 0.39 0.45 0.51Black 0.79 0.75 0.82Hispanic 0.68 0.68 0.81Asian 1.32 0.93 1.27Other 1.17 1.22 1.23
Age as of 12/31/1118 years or younger 0.73 0.63 0.6919–23 years 0.44 0.39 0.4324–29 years 0.62 0.68 0.7930–39 years 0.57 0.82 0.7540 years or older 0.58 0.88 1.09
Type of institutionPublic 2-year 0.42 0.61 0.71Public 4-year 0.68 0.44 0.59Private nonprofit 4-year 0.90 0.86 0.98For-profit 4-year 0.73 1.54 1.90For-profit less-than-2-year 1.59 2.37 3.03More than one institution or other 1.31 0.54 1.20
Undergraduate degree or certificate programNo degree or certificate 1.23 1.27 1.79Certificate 0.76 1.00 1.23Associate’s degree 0.51 0.59 0.59Bachelor’s degree 0.47 0.37 0.49
Income groupLowest 25 percent 0.72 0.64 0.59Lower middle 25 percent 0.63 0.55 0.66Upper middle 25 percent 0.55 0.53 0.71Highest 25 percent 0.66 0.48 0.86
Highest education attained by either parentHigh school diploma or less 0.53 0.63 0.53Some postsecondary education 0.49 0.48 0.59Bachelor’s degree or higher 0.46 0.42 0.56
See notes at end of table.
Table S7. Standard errors for table 7: ATTENDANCE STATUS AND NONTRADITIONAL CHARACTERISTICS: Percentage distribution of undergraduates’ attendance status during the academic year, by selected characteristics: 2011–12
– 41 –

National Center for Education Statistics
Selected characteristicsExclusively
full timeMix of full time
and part timeExclusively
part time
Disability statusNo disability reported 0.32 0.37 0.40Some type of disability reported 0.74 0.81 0.91
Dependency statusDependent 0.45 0.38 0.43Independent 0.38 0.58 0.57
Has dependent(s)Yes 0.49 0.67 0.68No 0.37 0.39 0.42
Single with dependent(s)Yes 0.65 0.80 0.81No 0.33 0.37 0.41
High school completion statusHigh school diploma, foreign high school, or home schooled 0.33 0.35 0.41GED or other equivalency, completion certificate, or no high school diploma, certificate, or other equivalency 0.76 1.14 0.96
Number of months between high school completion and postsecondary entry0–12 0.36 0.36 0.4113 or more 0.49 0.70 0.68
Worked while enrolledWorked full time 0.43 0.55 0.67Worked part time 0.47 0.48 0.52Did not work 0.43 0.48 0.52
Table S7. Standard errors for table 7: ATTENDANCE STATUS AND NONTRADITIONAL CHARACTERISTICS: Percentage distribution of undergraduates’ attendance status during the academic year, by selected characteristics: 2011–12—Continued
SOURCE: U.S. Department of Education, National Center for Education Statistics, 2011–12 National Postsecondary Student Aid Study (NPSAS:12).
– 42 –

National Center for Education Statistics
Selected characteristicsWorked
full time 1Worked
part time1Did not
work1
Total 25.9 36.4 37.7
SexMale 26.2 34.7 39.1Female 25.6 37.7 36.6
Race/ethnicity2
White 26.3 38.8 35.0Black 27.9 30.8 41.3Hispanic 26.2 35.1 38.7Asian 16.5 32.6 50.9Other 24.8 35.1 40.1
Age as of 12/31/1118 years or younger 8.5 36.1 55.419–23 years 16.0 45.1 38.924–29 years 37.5 31.4 31.130–39 years 41.9 26.0 32.140 years or older 42.3 21.3 36.4
Type of institutionPublic 2-year 31.9 35.1 33.0Public 4-year 18.4 43.0 38.6Private nonprofit 4-year 16.7 34.5 48.8For-profit 4-year 45.7 21.1 33.3For-profit less-than-2-year 15.0 33.1 51.9More than one institution or other3 22.1 37.6 40.3
Undergraduate degree or certificate programNo degree or certificate 39.9 31.3 28.8Certificate 25.0 30.6 44.4Associate’s degree 30.9 35.1 34.0Bachelor’s degree 20.5 38.9 40.5
Income group4
Lowest 25 percent 16.4 35.9 47.7Lower middle 25 percent 21.9 41.2 36.8Upper middle 25 percent 31.9 35.1 33.0Highest 25 percent 32.8 33.4 33.8
Highest education attained by either parent5
High school diploma or less 29.4 32.4 38.2Some postsecondary education 28.6 37.3 34.1Bachelor’s degree or higher 20.9 39.8 39.3
Disability statusNo disability reported 26.1 36.9 37.0Some type of disability reported6
24.1 32.5 43.4
See notes at end of table.
Table 8. WORKING WHILE ENROLLED AND NONTRADITIONAL CHARACTERISTICS: Percentage distribution of undergraduates’ employment status while enrolled during the academic year, by selected characteristics: 2011–12
– 43 –

National Center for Education Statistics
Selected characteristicsWorked
full time 1Worked
part time1Did not
work1
Dependency status7
Dependent 13.0 44.9 42.1Independent 38.2 28.3 33.5
Has dependent(s)Yes 40.0 26.2 33.9No 20.6 40.3 39.2
Single with dependent(s)8
Yes 37.0 28.2 34.9No 23.9 37.9 38.2
High school completion statusHigh school diploma, foreign high school, or home schooled 25.6 37.3 37.1GED or other equivalency, completion certificate, or no high school diploma, certificate, or other equivalency 28.9 27.4 43.7
Number of months between high school completion and postsecondary entry9
0–12 22.8 39.3 37.913 or more 33.8 29.2 37.0
Attendance status10
Any full-time 17.3 38.9 43.9Exclusively part-time 37.2 33.2 29.7
4 Total income in 2010 was used because it was reported on the federal financial aid application and used for federal need analysis for 2011–12. Income consists of parents’ income for dependent students. For independent students, consists of the income of the student (and spouse if the student is married).
3 Includes the 9.0 percent of students who attended more than one institution, a public less-than-2 year institution, a private nonprofit 2-year institution, a private nonprofit less-than-2-year institution, or a for-profit 2-year institution.
2 Black includes African American, Hispanic includes Latino, and Other includes American Indian, Alaska Native, Native Hawaiian or other Pacific Islander, and Two or more races. Race categories exclude Hispanic origin unless specified.
8 Includes students who were single, never married; separated; widowed; or divorced.
SOURCE: U.S. Department of Education, National Center for Education Statistics, 2011–12 National Postsecondary Student Aid Study (NPSAS:12).
NOTE: Estimates exclude students who worked in school-related jobs (e.g., work-study or assistantships) and jobs held while not enrolled, including summer break. Full-time status was defined as working 35 or more hours per week, and part-time status was defined as working less than 35 hours per week. Italicized text indicates characteristics of nontraditional students. Estimates include students enrolled in Title IV eligible postsecondary institutions in the 50 states and the District of Columbia. Prior cycles of the National Postsecondary Student Aid Study (NPSAS) included sampled institutions from Puerto Rico; to yield comparable estimates across cycles, use the COMPTO87 variable to exclude Puerto Rican institutions from estimates. Detail may not sum to totals because of rounding.
10 Full-time status for the purposes of financial aid eligibility was based on 12 credit hours, unless the awarding institution employed a different standard.
9 Excludes the .9 percent of students who did not earn a high school diploma, certificate, or equivalency because these students did not have a high school completion date.
Table 8. WORKING WHILE ENROLLED AND NONTRADITIONAL CHARACTERISTICS: Percentage distribution of undergraduates’ employment status while enrolled during the academic year, by selected characteristics: 2011–12—Continued
1 Estimates exclude students who worked in school-related jobs (e.g., work-study or assistantships) and jobs held while not enrolled, including summer break. Full-time status was defined as working 35 or more hours per week, and part-time status was defined as working less than 35 hours per week.
7 Independent students are age 24 or over and students under 24 who are married, have dependents, are veterans or on active duty, are orphans or wards of the courts, are homeless or at risk of homelessness, or were determined to be independent by a financial aid officer using professional judgment. Other undergraduates under age 24 are considered to be dependent.
6 Indicates reporting a long-lasting condition such as deafness or serious difficulty hearing; blindness or serious difficulty seeing; serious difficulty concentrating, remembering or making a decision; or serious difficulty walking or climbing stairs.
5 Excludes the 3.5 percent of students who reported that they did not know their parents’ highest level of education.
– 44 –

National Center for Education Statistics
Selected characteristicsWorkedfull time
Worked part time
Did not work
Total 0.24 0.25 0.26
SexMale 0.42 0.38 0.44Female 0.30 0.36 0.33
Race/ethnicityWhite 0.34 0.35 0.34Black 0.62 0.63 0.65Hispanic 0.63 0.62 0.65Asian 0.92 0.96 0.99Other 1.18 1.38 1.17
Age as of 12/31/1118 years or younger 0.37 0.57 0.5919–23 years 0.30 0.41 0.4124–29 years 0.67 0.57 0.6730–39 years 0.81 0.61 0.7240 years or older 0.82 0.67 0.76
Type of institutionPublic 2-year 0.47 0.50 0.47Public 4-year 0.41 0.43 0.50Private nonprofit 4-year 0.85 0.85 0.92For-profit 4-year 1.01 0.72 0.72For-profit less-than-2-year 1.13 1.36 1.95More than one institution or other 0.59 0.62 0.61
Undergraduate degree or certificate programNo degree or certificate 1.84 2.10 2.15Certificate 0.89 0.94 1.03Associate’s degree 0.41 0.44 0.42Bachelor’s degree 0.39 0.34 0.39
Income groupLowest 25 percent 0.38 0.46 0.55Lower middle 25 percent 0.39 0.56 0.54Upper middle 25 percent 0.51 0.54 0.49Highest 25 percent 0.55 0.46 0.55
Highest education attained by either parentHigh school diploma or less 0.40 0.41 0.43Some postsecondary education 0.45 0.49 0.46Bachelor’s degree or higher 0.39 0.44 0.43
See notes at end of table.
Table S8. Standard errors for table 8: WORKING WHILE ENROLLED AND NONTRADITIONAL CHARACTERISTICS: Percentage distribution of undergraduates’ employment status while enrolled during the academic year, by selected characteristics: 2011–12
– 45 –

National Center for Education Statistics
Selected characteristicsWorkedfull time
Worked part time
Did not work
Disability statusNo disability reported 0.27 0.27 0.29Some type of disability reported 0.81 0.72 0.79
Dependency statusDependent 0.26 0.39 0.41Independent 0.40 0.35 0.37
Has dependent(s)Yes 0.57 0.48 0.60No 0.26 0.32 0.33
Single with dependent(s)Yes 0.70 0.61 0.71No 0.25 0.27 0.29
High school completion statusHigh school diploma, foreign high school, or home schooled 0.26 0.27 0.28GED or other equivalency, completion certificate, or no high school diploma, certificate, or other equivalency 0.89 0.82 0.89
Number of months between high school completion and postsecondary entry0–12 0.30 0.31 0.3213 or more 0.46 0.41 0.51
Attendance statusAny full-time 0.26 0.31 0.34Exclusively part-time 0.46 0.45 0.43
SOURCE: U.S. Department of Education, National Center for Education Statistics, 2011–12 National Postsecondary Student Aid Study (NPSAS:12).
Table S8. Standard errors for table 8: WORKING WHILE ENROLLED AND NONTRADITIONAL CHARACTERISTICS: Percentage distribution of undergraduates’ employment status while enrolled during the academic year, by selected characteristics: 2011–12—Continued
– 46 –

National Center for Education Statistics
Selected characteristics Less
than 2.50 2.50–2.99 3.00–3.49 3.50 or
higher Algebra II Trigo-
nometry Pre-
calculus CalculusNone of
these
Total 12.0 12.8 36.6 38.6 28.8 9.4 22.1 24.7 15.0
Number of nontraditional characteristicsZero 7.8 10.7 32.9 48.6 22.1 10.8 25.5 34.0 7.6One 12.4 14.2 37.6 35.8 29.9 9.9 22.7 24.0 13.5Two to three 15.1 14.1 39.6 31.2 33.0 8.3 20.1 17.9 20.8Four or more 17.5 13.7 38.9 30.0 37.6 6.6 15.3 13.0 27.4
Dependency status2
Dependent 10.0 12.3 34.9 42.8 26.0 10.1 24.2 29.4 10.3Independent 15.8 13.8 39.7 30.7 34.1 8.0 18.2 16.0 23.7
Has dependent(s)Yes 16.5 14.5 38.3 30.7 35.9 7.0 17.4 13.5 26.2No 11.2 12.5 36.3 40.0 27.6 9.8 22.9 26.7 13.0
Single with dependent(s)3
Yes 17.5 14.7 37.8 30.0 36.2 7.0 18.0 13.4 25.5No 11.4 12.6 36.4 39.6 27.9 9.7 22.6 26.0 13.8
High school completion statusHigh school diploma, foreign high school, or home schooled 11.8 12.9 36.4 38.9 28.2 9.5 22.8 25.3 14.1GED or other equivalency, completion certificate, or no high school diploma, certificate, or other equivalency 15.1 11.2 39.2 34.5 38.5 7.1 10.9 15.7 27.8
See notes at end of table.
High school GPA
Table 9. ACADEMIC PREPARATION AND NONTRADITIONAL CHARACTERISTICS: Among undergraduates under age 30, percentage distribution of high school grade point average (GPA) and highest level of mathematics completed or planned to complete in high school, by selected characteristics: 2011–12
Highest level of mathematics completed or planned to complete in high school1
– 47 –

National Center for Education Statistics
Selected characteristics Less
than 2.50 2.50–2.99 3.00–3.49 3.50 or
higher Algebra II Trigo-
nometry Pre-
calculus CalculusNone of
these
Number of months between high school completion and postsecondary entry4
0–12 10.9 12.4 35.8 40.8 27.4 9.9 23.5 26.9 12.313 or more 16.0 14.6 39.2 30.2 33.8 7.6 17.1 16.8 24.7
Attendance status5
Any full-time 10.4 12.1 35.4 42.1 26.1 10.0 23.2 28.1 12.6Exclusively part-time 14.7 14.0 38.5 32.8 33.3 8.4 20.3 19.2 18.8
Worked while enrolled6
Worked full time 15.0 14.1 39.0 31.9 33.9 8.4 20.7 18.8 18.2Worked part time 10.7 12.7 37.0 39.7 27.7 9.7 24.3 25.3 13.0Did not work 11.8 12.4 34.8 41.0 27.2 9.6 20.6 27.2 15.4
2 Independent students are age 24 or over and students under 24 who are married, have dependents, are veterans or on active duty, are orphans or wards of the courts, are homeless or at risk of homelessness, or were determined to be independent by a financial aid officer using professional judgment. Other undergraduates under age 24 are considered to be dependent.
4 Excludes the .9 percent of respondents who did not earn a high school diploma, certificate, or equivalency because these respondents did not have a high school completion date.
6 Estimates exclude students who worked in school-related jobs (e.g., work-study or assistantships) and jobs held while not enrolled, including summer break. Full-time status was defined as working 35 or more hours per week, and part-time status was defined as working less than 35 hours per week.NOTE: Data concerning students’ high school academic preparation were collected only for students younger than age 30. Italicized text indicates characteristics of nontraditional students. Estimates include students enrolled in Title IV eligible postsecondary institutions in the 50 states and the District of Columbia. Prior cycles of the National Postsecondary Student Aid Study (NPSAS) included sampled institutions from Puerto Rico; to yield comparable estimates across cycles, use the COMPTO87 variable to exclude Puerto Rican institutions from estimates. Detail may not sum to totals because of rounding.
Table 9. ACADEMIC PREPARATION AND NONTRADITIONAL CHARACTERISTICS: Among undergraduates under age 30, percentage distribution of high school grade point average (GPA) and highest level of mathematics completed or planned to complete in high school, by selected characteristics: 2011–12—Continued
High school GPAHighest level of mathematics completed or planned to complete in high school1
1 Information on the courses students completed in high school were obtained from two sources: surveys students completed when they took the ACT or SAT in high school or the NPSAS interview. Students who reported this information on an entrance examination survey may not have completed all courses at the time they took the survey.
5 Full-time status for the purposes of financial aid eligibility was based on 12 credit hours, unless the awarding institution employed a different standard.
3 Includes students who were single, never married; separated; widowed; or divorced.
SOURCE: U.S. Department of Education, National Center for Education Statistics, 2011–12 National Postsecondary Student Aid Study (NPSAS:12).
– 48 –

National Center for Education Statistics
Selected characteristics Less
than 2.50 2.50–2.99 3.00–3.49 3.50 or
higher Algebra II Trigo-
nometry Pre-
calculus CalculusNone of
these
Total 0.23 0.19 0.29 0.31 0.30 0.19 0.26 0.24 0.25
Number of nontraditional characteristicsZero 0.25 0.25 0.41 0.49 0.40 0.30 0.38 0.42 0.23One 0.44 0.42 0.61 0.53 0.63 0.36 0.55 0.52 0.46Two to three 0.45 0.39 0.64 0.63 0.63 0.37 0.49 0.45 0.58Four or more 0.73 0.61 0.89 0.77 0.87 0.46 0.64 0.60 0.75
Dependency statusDependent 0.25 0.23 0.34 0.37 0.33 0.25 0.31 0.31 0.23Independent 0.42 0.39 0.56 0.54 0.57 0.29 0.41 0.39 0.47
Has dependent(s)Yes 0.64 0.56 0.88 0.71 0.79 0.46 0.64 0.52 0.74No 0.22 0.20 0.32 0.33 0.30 0.21 0.28 0.26 0.24
Single with dependent(s)Yes 0.73 0.71 0.99 0.84 0.91 0.51 0.82 0.65 0.85No 0.22 0.19 0.30 0.33 0.30 0.20 0.27 0.25 0.24
High school completion statusHigh school diploma, foreign high school, or home schooled 0.23 0.20 0.31 0.31 0.30 0.20 0.27 0.24 0.25GED or other equivalency, completion certificate, or no high school diploma, certificate, or other equivalency 0.79 0.72 1.19 1.12 1.18 0.62 0.78 0.87 1.09
See notes at end of table.
High school GPAHighest level of mathematics completed or planned to complete in high school
Table S9. Standard errors for table 9: ACADEMIC PREPARATION AND NONTRADITIONAL CHARACTERISTICS: Among undergraduates under age 30, percentage distribution of high school grade point average (GPA) and highest level of mathematics completed or planned to complete in high school, by selected characteristics: 2011–12
– 49 –

National Center for Education Statistics
Selected characteristics Less
than 2.50 2.50–2.99 3.00–3.49 3.50 or
higher Algebra II Trigo-
nometry Pre-
calculus CalculusNone of
these
Number of months between high school completion and postsecondary entry
0–12 0.23 0.20 0.34 0.35 0.34 0.21 0.30 0.27 0.2513 or more 0.55 0.45 0.66 0.54 0.61 0.38 0.54 0.52 0.63
Attendance statusAny full-time 0.21 0.24 0.33 0.37 0.33 0.23 0.31 0.30 0.26Exclusively part-time 0.43 0.35 0.50 0.47 0.52 0.30 0.45 0.40 0.45
Worked while enrolledWorked full time 0.49 0.55 0.65 0.68 0.72 0.41 0.56 0.60 0.56Worked part time 0.33 0.32 0.41 0.50 0.48 0.29 0.44 0.36 0.33Did not work 0.32 0.30 0.44 0.47 0.41 0.29 0.41 0.42 0.37
SOURCE: U.S. Department of Education, National Center for Education Statistics, 2011–12 National Postsecondary Student Aid Study (NPSAS:12).
Table S9. Standard errors for table 9: ACADEMIC PREPARATION AND NONTRADITIONAL CHARACTERISTICS: Among undergraduates under age 30, percentage distribution of high school grade point average (GPA) and highest level of mathematics completed or planned to complete in high school, by selected characteristics: 2011–12—Continued
High school GPAHighest level of mathematics completed or planned to complete in high school
– 50 –

National Center for Education Statistics
Selected characteristics
Any postsecondary degree or certificate
before 2011–12Certificate
before 2011–12
Associate’s degree
before 2011–12
Bachelor’s or higher degree
before 2011–12
Total 27.6 12.3 11.9 5.4
Number of nontraditional characteristicsZero 8.7 3.3 4.8 1.1One 19.2 7.4 9.0 4.0Two to three 38.3 15.9 15.9 9.3Four or more 43.1 22.4 17.4 6.6
Dependency status1
Dependent 10.6 4.7 5.0 1.4Independent 43.8 19.5 18.4 9.1
Has dependent(s)Yes 44.0 21.6 18.0 7.6No 21.4 8.7 9.5 4.5
Single with dependent(s)2
Yes 39.6 22.1 15.3 5.3No 25.4 10.5 11.2 5.4
High school completion statusHigh school diploma, foreign high school, or home schooled 27.0 11.5 11.9 5.6GED or other equivalency, completion certificate, or no high school diploma, certificate, or other equivalency 33.1 19.9 11.8 3.5
Number of months between high school completion and postsecondary entry3
0–12 25.5 9.9 11.6 6.013 or more 32.7 18.2 12.6 3.7
Attendance status4
Any full-time 21.3 9.7 9.9 3.0Exclusively part-time 35.8 15.6 14.4 8.4
Worked while enrolled5
Worked full time 40.3 17.3 17.9 8.3Worked part time 23.6 10.2 10.5 4.6Did not work 22.7 10.8 9.0 4.1
See notes at end of table.
Table 10. PRIOR DEGREE EARNED AND NONTRADITIONAL CHARACTERISTICS: Percentage of undergraduates who earned a degree or certificate before the 2011–12 academic year and percentage who earned specific types of degrees or certificates, by selected characteristics: 2011–12
– 51 –

National Center for Education Statistics
NOTE: Because respondents could have earned multiple prior degrees the percentages are not mutually exclusive. Italicized text indicates characteristics of nontraditional students. Estimates include students enrolled in Title IV eligible postsecondary institutions in the 50 states and the District of Columbia. Prior cycles of the National Postsecondary Student Aid Study (NPSAS) included sampled institutions from Puerto Rico; to yield comparable estimates across cycles, use the COMPTO87 variable to exclude Puerto Rican institutions from estimates.SOURCE: U.S. Department of Education, National Center for Education Statistics, 2011–12 National Postsecondary Student Aid Study (NPSAS:12).
5 Estimates exclude students who worked in school-related jobs (e.g., work-study or assistantships) and jobs held while not enrolled, including summer break. Full-time status was defined as working 35 or more hours per week, and part-time status was defined as working less than 35 hours per week.
1 Independent students are age 24 or over and students under 24 who are married, have dependents, are veterans or on active duty, are orphans or wards of the courts, are homeless or at risk of homelessness, or were determined to be independent by a financial aid officer using professional judgment. Other undergraduates under age 24 are considered to be dependent.
3 Excludes the .9 percent of respondents who did not earn a high school diploma, certificate, or equivalency because these respondents did not have a high school completion date.4 Full-time status for the purposes of financial aid eligibility was based on 12 credit hours, unless the awarding institution employed a different standard.
Table 10. PRIOR DEGREE EARNED AND NONTRADITIONAL CHARACTERISTICS: Percentage of undergraduates who earned a degree or certificate before the 2011–12 academic year and percentage who earned specific types of degrees or certificates, by selected characteristics: 2011–12—Continued
2 Includes students who were single, never married; separated; widowed; or divorced.
– 52 –

National Center for Education Statistics
Selected characteristics
Any postsecondary degree or certificate
before 2011–12Certificate before
2011–12
Associate’s degree before
2011–12
Bachelor’s or higher degree
before 2011–12
Total 0.26 0.19 0.19 0.13
Number of nontraditional characteristicsZero 0.25 0.17 0.19 0.10One 0.51 0.34 0.34 0.28Two to three 0.49 0.38 0.39 0.29Four or more 0.60 0.48 0.52 0.27
Dependency statusDependent 0.23 0.17 0.16 0.11Independent 0.40 0.31 0.32 0.24
Has dependent(s)Yes 0.55 0.42 0.44 0.30No 0.27 0.18 0.18 0.14
Single with dependent(s)Yes 0.69 0.59 0.51 0.33No 0.28 0.18 0.20 0.15
High school completion statusHigh school diploma, foreign high school, or home schooled 0.28 0.20 0.19 0.14
GED or other equivalency, completion certificate, or no high school diploma, certificate, or other equivalency 0.93 0.74 0.68 0.33
Number of months between high school completion and postsecondary entry
0–12 0.31 0.22 0.20 0.1713 or more 0.52 0.41 0.36 0.21
Attendance statusAny full-time 0.32 0.23 0.22 0.12Exclusively part-time 0.43 0.35 0.34 0.26
Worked while enrolledWorked full time 0.51 0.45 0.42 0.30Worked part time 0.38 0.31 0.28 0.22Did not work 0.44 0.30 0.28 0.20
SOURCE: U.S. Department of Education, National Center for Education Statistics, 2011–12 National Postsecondary Student Aid Study (NPSAS:12).
Table S10. Standard errors for table 10: PRIOR DEGREE EARNED AND NONTRADITIONAL CHARACTERISTICS: Percentage of undergraduates who earned a degree or certificate before the 2011–12 academic year and percentage who earned specific types of degrees or certificates, by selected characteristics: 2011–12
– 53 –

National Center for Education Statistics
4-year
Selected characteristicsEver attended
a public 2-year Ever attended
a public 2-year Ever attended
any 4-year Ever attended
a public 2-year Ever attended
any 4-year
Total 32.3 94.8 23.3 36.5 22.6
Number of nontraditional characteristicsZero 15.6 93.5 13.8 31.8 15.7One 32.6 95.0 19.8 33.4 21.9Two to three 47.9 94.7 28.8 41.0 24.9Four or more 49.2 95.2 22.9 34.4 22.8
Dependency status2
Dependent 17.9 95.5 15.5 26.9 13.1Independent 51.2 94.3 28.4 40.4 26.5
Has dependent(s)Yes 50.8 93.3 26.5 39.3 25.8No 27.0 95.5 21.7 34.1 19.9
Single with dependent(s)3
Yes 47.7 92.0 23.1 40.1 24.5No 30.3 95.4 23.4 34.7 21.7
High school completion statusHigh school diploma, foreign high school, or home schooled 31.8 95.1 24.5 38.2 24.3
GED or other equivalency, completion certificate, or no high school diploma, certificate, or other equivalency 40.9 92.5 14.1 31.0 17.3
Number of months between high school completion and postsecondary entry4
0–12 30.7 95.6 27.5 43.8 27.713 or more 38.0 93.5 15.9 28.9 17.3
Attendance status5
Any full-time 27.3 89.4 19.4 36.3 21.0Exclusively part-time 44.4 98.3 25.9 37.1 28.0
Worked while enrolled6
Worked full time 47.1 97.1 28.8 38.7 25.1Worked part time 31.5 95.7 22.0 38.9 25.6Did not work 24.9 91.8 19.7 34.2 19.8
See notes at end of table.
Level of institution, 2011–121
Table 11. INSTITUTION TYPES ATTENDED AND NONTRADITIONAL CHARACTERISTICS: Of those who attended various levels of institutions in 2011–12, percentage who ever attended a public 2-year institution or any 4-year institution, by selected characteristics: 2011–12
Less-than-2-year2-year
– 54 –

National Center for Education Statistics
SOURCE: U.S. Department of Education, National Center for Education Statistics, 2011–12 National Postsecondary Student Aid Study (NPSAS:12).
1 Includes public, private nonprofit, and for-profit institutions.
Table 11. INSTITUTION TYPES ATTENDED AND NONTRADITIONAL CHARACTERISTICS: Of those who attended various levels of institutions in 2011–12, percentage who ever attended a public 2-year institution or any 4-year institution, by selected characteristics: 2011–12—Continued
2 Independent students are age 24 or over and students under 24 who are married, have dependents, are veterans or on active duty, are orphans or wards of the courts, are homeless or at risk of homelessness, or were determined to be independent by a financial aid officer using professional judgment. Other undergraduates under age 24 are considered to be dependent.
6 Estimates exclude students who worked in school-related jobs (e.g., work-study or assistantships) and jobs held while not enrolled, including summer break. Full-time status was defined as working 35 or more hours per week, and part-time status was defined as working less than 35 hours per week.
5 Full-time status for the purposes of financial aid eligibility was based on 12 credit hours, unless the awarding institution employed a different standard.
NOTE: Italicized text indicates characteristics of nontraditional students. Estimates include students enrolled in Title IV eligible postsecondary institutions in the 50 states and the District of Columbia. Prior cycles of the National Postsecondary Student Aid Study (NPSAS) included sampled institutions from Puerto Rico; to yield comparable estimates across cycles, use the COMPTO87 variable to exclude Puerto Rican institutions from estimates.
4 Excludes the .9 percent of students who did not earn a high school diploma, certificate, or equivalency because these students did not have a high school completion date.
3 Includes students who were single, never married; separated; widowed; or divorced.
– 55 –
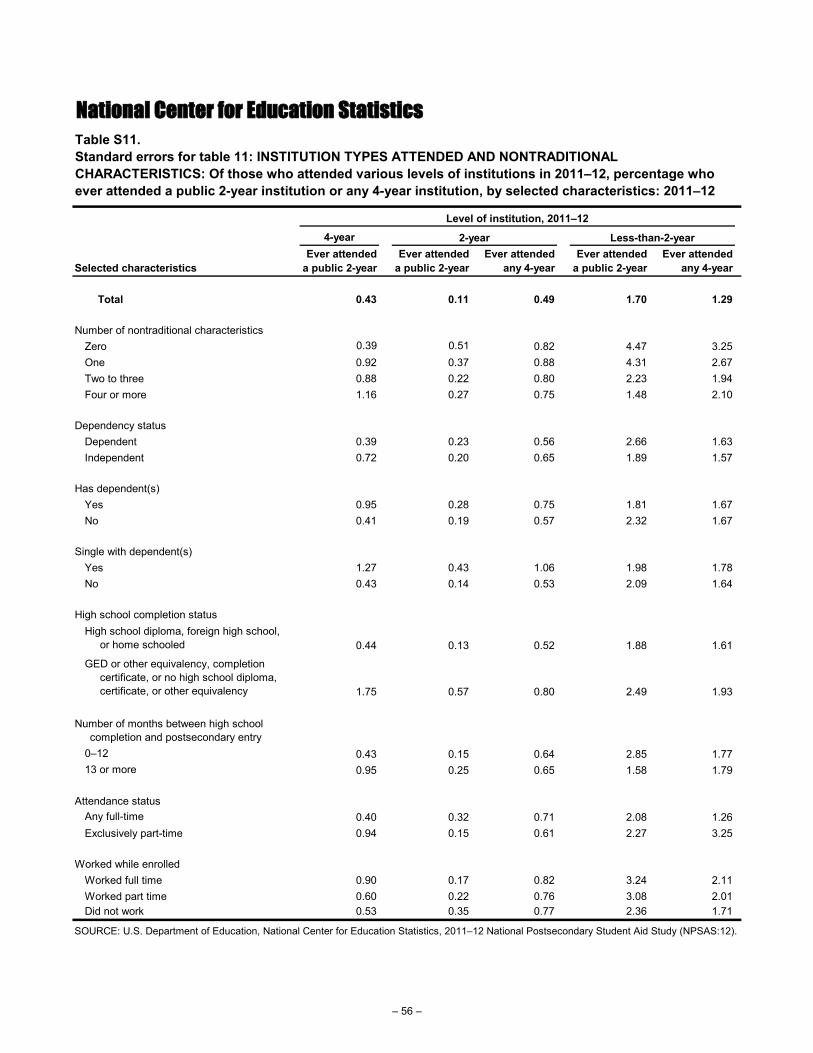
National Center for Education Statistics
4-year
Selected characteristicsEver attended
a public 2-year Ever attended
a public 2-year Ever attended
any 4-year Ever attended
a public 2-year Ever attended
any 4-year
Total 0.43 0.11 0.49 1.70 1.29
Number of nontraditional characteristicsZero 0.39 0.51 0.82 4.47 3.25One 0.92 0.37 0.88 4.31 2.67Two to three 0.88 0.22 0.80 2.23 1.94Four or more 1.16 0.27 0.75 1.48 2.10
Dependency statusDependent 0.39 0.23 0.56 2.66 1.63Independent 0.72 0.20 0.65 1.89 1.57
Has dependent(s)Yes 0.95 0.28 0.75 1.81 1.67No 0.41 0.19 0.57 2.32 1.67
Single with dependent(s)Yes 1.27 0.43 1.06 1.98 1.78No 0.43 0.14 0.53 2.09 1.64
High school completion statusHigh school diploma, foreign high school, or home schooled 0.44 0.13 0.52 1.88 1.61
GED or other equivalency, completion certificate, or no high school diploma, certificate, or other equivalency 1.75 0.57 0.80 2.49 1.93
Number of months between high school completion and postsecondary entry
0–12 0.43 0.15 0.64 2.85 1.7713 or more 0.95 0.25 0.65 1.58 1.79
Attendance statusAny full-time 0.40 0.32 0.71 2.08 1.26Exclusively part-time 0.94 0.15 0.61 2.27 3.25
Worked while enrolledWorked full time 0.90 0.17 0.82 3.24 2.11Worked part time 0.60 0.22 0.76 3.08 2.01Did not work 0.53 0.35 0.77 2.36 1.71
SOURCE: U.S. Department of Education, National Center for Education Statistics, 2011–12 National Postsecondary Student Aid Study (NPSAS:12).
Level of institution, 2011–12
2-year Less-than-2-year
Table S11. Standard errors for table 11: INSTITUTION TYPES ATTENDED AND NONTRADITIONAL CHARACTERISTICS: Of those who attended various levels of institutions in 2011–12, percentage who ever attended a public 2-year institution or any 4-year institution, by selected characteristics: 2011–12
– 56 –

National Center for Education Statistics
Selected characteristicsPublic 2-year
Public 4-year
Private nonprofit
4-yearFor-profit
4-year
For-profit less-than-
2-year
More than one institution
or other1
Total 38.1 28.4 11.7 8.0 2.0 11.9
Number of nontraditional characteristicsZero 17.4 46.3 22.7 1.3 0.8 11.5One 40.5 31.0 9.6 3.9 1.9 13.2Two to three 46.5 20.5 7.1 11.0 2.5 12.5Four or more 50.0 15.0 6.1 15.4 2.7 10.8
Dependency status2
Dependent 31.5 37.5 16.1 2.1 1.1 11.6Independent 44.4 19.7 7.4 13.5 2.7 12.3
Has dependent(s)Yes 44.9 15.9 7.2 16.3 3.3 12.3No 35.5 33.1 13.3 4.8 1.4 11.8
Single with dependent(s)3
Yes 44.8 13.7 6.2 17.4 4.5 13.3No 36.9 31.0 12.6 6.3 1.5 11.7
High school completion statusHigh school diploma, foreign high school, or home schooled 37.1 29.9 12.2 7.2 1.6 11.9
GED or other equivalency, completion certificate, or no high school diploma, certificate, or other equivalency 48.4 12.3 5.9 15.6 5.3 12.6
Number of months between high school completion and postsecondary entry4
0–12 34.4 33.1 13.7 5.6 1.4 11.913 or more 46.9 17.2 6.7 14.1 3.1 12.0
Attendance status5
Any full-time 24.2 33.9 16.1 9.7 2.7 13.4Exclusively part-time 56.2 21.1 5.8 5.8 1.0 10.0
Worked while enrolled6
Worked full time 46.9 20.2 7.5 14.1 1.1 10.2Worked part time 36.7 33.5 11.0 4.6 1.8 12.3Did not work 33.4 29.0 15.1 7.0 2.7 12.8
See notes at end of table.
Table 12. CURRENT INSTITUTION TYPE AND NONTRADITIONAL CHARACTERISTICS: Percentage distribution of the type of institution attended in 2011–12, by selected characteristics: 2011–12
Type of institution, 2011–12
– 57 –

National Center for Education Statistics
NOTE: Italicized text indicates characteristics of nontraditional students. Estimates include students enrolled in Title IV eligible postsecondary institutions in the 50 states and the District of Columbia. Prior cycles of the National Postsecondary Student Aid Study (NPSAS) included sampled institutions from Puerto Rico; to yield comparable estimates across cycles, use the COMPTO87 variable to exclude Puerto Rican institutions from estimates. Detail may not sum to totals because of rounding. SOURCE: U.S. Department of Education, National Center for Education Statistics, 2011–12 National Postsecondary Student Aid Study (NPSAS:12).
6 Estimates exclude students who worked in school-related jobs (e.g., work-study or assistantships) and jobs held while not enrolled, including summer break. Full-time status was defined as working 35 or more hours per week, and part-time status was defined as working less than 35 hours per week.
5 Full-time status for the purposes of financial aid eligibility was based on 12 credit hours, unless the awarding institution employed a different standard.
Table 12. CURRENT INSTITUTION TYPE AND NONTRADITIONAL CHARACTERISTICS: Percentage distribution of the type of institution attended in 2011–12, by selected characteristics: 2011–12—Continued
1 Includes the 9.0 percent of students who attended more than one institution, a public less-than-2 year institution, a private nonprofit 2-year institution, a private nonprofit less-than-2-year institution, or a for-profit 2-year institution.2 Independent students are age 24 or over and students under 24 who are married, have dependents, are veterans or on active duty, are orphans or wards of the courts, are homeless or at risk of homelessness, or were determined to be independent by a financial aid officer using professional judgment. Other undergraduates under age 24 are considered to be dependent.
4 Excludes the .9 percent of students who did not earn a high school diploma, certificate, or equivalency because these students did not have a high school completion date.
3 Includes students who were single, never married; separated; widowed; or divorced.
– 58 –

National Center for Education Statistics
Selected characteristicsPublic 2-year
Public 4-year
Private nonprofit
4-yearFor-profit
4-year
For-profit less-than-
2-year
More than one institution
or other
Total 0.14 0.10 0.08 0.02 0.01 0.28
Number of nontraditional characteristicsZero 0.39 0.44 0.31 0.11 0.09 0.24One 0.63 0.53 0.45 0.28 0.13 0.40Two to three 0.46 0.41 0.28 0.19 0.11 0.44Four or more 0.55 0.50 0.38 0.44 0.14 0.52
Dependency statusDependent 0.34 0.30 0.20 0.15 0.07 0.23Independent 0.34 0.31 0.21 0.17 0.07 0.42
Has dependent(s)Yes 0.51 0.43 0.33 0.36 0.14 0.46No 0.27 0.17 0.14 0.12 0.06 0.26
Single with dependent(s)Yes 0.64 0.48 0.37 0.49 0.19 0.45No 0.22 0.12 0.11 0.07 0.04 0.29
High school completion statusHigh school diploma, foreign high school, or home schooled 0.18 0.12 0.10 0.07 0.04 0.28
GED or other equivalency, completion certificate, or no high school diploma, certificate, or other equivalency 0.95 0.61 0.50 0.62 0.39 0.62
Number of months between high school completion and postsecondary entry
0–12 0.28 0.18 0.13 0.13 0.05 0.2813 or more 0.48 0.38 0.30 0.34 0.14 0.37
Attendance statusAny full-time 0.35 0.28 0.20 0.24 0.10 0.18Exclusively part-time 0.52 0.34 0.27 0.33 0.14 0.57
Worked while enrolledWorked full time 0.55 0.44 0.38 0.31 0.09 0.43Worked part time 0.40 0.33 0.27 0.16 0.08 0.29Did not work 0.41 0.33 0.26 0.15 0.10 0.32
SOURCE: U.S. Department of Education, National Center for Education Statistics, 2011–12 National Postsecondary Student Aid Study (NPSAS:12).
Type of institution, 2011–12
Table S12. Standard errors for table 12: CURRENT INSTITUTION TYPE AND NONTRADITIONAL CHARACTERISTICS: Percentage distribution of the type of institution attended in 2011–12, by selected characteristics: 2011–12
– 59 –

National Center for Education Statistics
Selected characteristics None Some All
Total 68.3 23.5 8.2 6.5
Number of nontraditional characteristicsZero 77.4 19.7 2.9 2.3One 70.8 24.3 4.9 3.4Two to three 65.6 24.6 9.8 7.7Four or more 59.0 25.9 15.1 12.4
Dependency status1
Dependent 74.8 21.5 3.8 2.7Independent 62.2 25.4 12.4 10.1
Has dependent(s)Yes 59.0 25.8 15.2 12.4No 71.8 22.6 5.5 4.2
Single with dependent(s)2
Yes 62.1 25.5 12.4 10.6No 69.4 23.2 7.5 5.7
High school completion statusHigh school diploma, foreign high school, or home schooled 68.4 23.6 8.1 6.3GED or other equivalency, completion certificate, or no high school diploma, certificate, or other equivalency 67.1 22.9 9.9 8.0
Number of months between high school completion and postsecondary entry3
0–12 69.6 23.5 6.9 5.213 or more 64.8 23.5 11.7 9.7
Attendance status4
Any full-time 71.0 21.9 7.2 6.2Exclusively part-time 64.7 25.7 9.6 6.9
Worked while enrolled5
Worked full time 57.5 26.8 15.7 12.8Worked part time 68.7 26.3 5.0 3.7Did not work 75.3 18.6 6.1 4.8
See notes at end of table.
Table 13. ONLINE COURSETAKING AND NONTRADITIONAL CHARACTERISTICS: Among undergraduates who attended only one institution in 2011–12, percentage distribution who took none, some, or all of their classes completely online during the 2011–12 academic year and percentage who took their entire degree program online, by selected characteristics: 2011–12
Proportion of 2011–12 classes that were completely online
Entire degree program was
online
– 60 –

National Center for Education StatisticsTable 13. ONLINE COURSETAKING AND NONTRADITIONAL CHARACTERISTICS: Among undergraduates who attended only one institution in 2011–12, percentage distribution who took none, some, or all of their classes completely online during the 2011–12 academic year and percentage who took their entire degree program online, by selected characteristics: 2011–12—Continued
SOURCE: U.S. Department of Education, National Center for Education Statistics, 2011–12 National Postsecondary Student Aid Study (NPSAS:12).
3 Excludes the .9 percent of students who did not earn a high school diploma, certificate, or equivalency because these students did not have a high school completion date.
NOTE: Italicized text indicates characteristics of nontraditional students. Estimates include students enrolled in Title IV eligible postsecondary institutions in the 50 states and the District of Columbia. Prior cycles of the National Postsecondary Student Aid Study (NPSAS) included sampled institutions from Puerto Rico; to yield comparable estimates across cycles, use the COMPTO87 variable to exclude Puerto Rican institutions from estimates. Detail may not sum to totals because of rounding.
1 Independent students are age 24 or over and students under 24 who are married, have dependents, are veterans or on active duty, are orphans or wards of the courts, are homeless or at risk of homelessness, or were determined to be independent by a financial aid officer using professional judgment. Other undergraduates under age 24 are considered to be dependent.
5 Estimates exclude students who worked in school-related jobs (e.g., work-study or assistantships) and jobs held while not enrolled, including summer break. Full-time status was defined as working 35 or more hours per week, and part-time status was defined as working less than 35 hours per week.
2 Includes students who were single, never married; separated; widowed; or divorced.
4 Full-time status for the purposes of financial aid eligibility was based on 12 credit hours, unless the awarding institution employed a different standard.
– 61 –

National Center for Education Statistics
Selected characteristics None Some All
Total 0.34 0.29 0.21 0.19
Number of nontraditional characteristicsZero 0.39 0.38 0.16 0.15One 0.66 0.63 0.32 0.23Two to three 0.55 0.48 0.34 0.28Four or more 0.67 0.52 0.53 0.55
Dependency statusDependent 0.37 0.35 0.18 0.13Independent 0.48 0.39 0.37 0.35
Has dependent(s)Yes 0.61 0.52 0.53 0.52No 0.36 0.32 0.17 0.13
Single with dependent(s)Yes 0.71 0.63 0.51 0.48No 0.38 0.32 0.22 0.18
High school completion statusHigh school diploma, foreign high school, or home schooled 0.36 0.31 0.23 0.21GED or other equivalency, completion certificate, or no high school diploma, certificate, or other equivalency 0.93 0.82 0.65 0.57
Number of months between high school completion and postsecondary entry0–12 0.37 0.32 0.22 0.1813 or more 0.55 0.47 0.45 0.46
Attendance statusAny full-time 0.40 0.36 0.22 0.20Exclusively part-time 0.54 0.47 0.36 0.32
Worked while enrolledWorked full time 0.66 0.58 0.55 0.54Worked part time 0.52 0.48 0.23 0.18Did not work 0.42 0.36 0.27 0.22
SOURCE: U.S. Department of Education, National Center for Education Statistics, 2011–12 National Postsecondary Student Aid Study (NPSAS:12).
Proportion of 2011–12 classes that were completely online
Entire degree program was
online
Table S13. Standard errors for table 13: ONLINE COURSETAKING AND NONTRADITIONAL CHARACTERISTICS: Among undergraduates who attended only one institution in 2011–12, percentage distribution who took none, some, or all of their classes completely online during the 2011–12 academic year and percentage who took their entire degree program online, by selected characteristics: 2011–12
– 62 –

National Center for Education Statistics
Selected characteristicsNo certificate
or degree CertificateAssociate’s
degreeBachelor’s
degree
Total 3.3 8.0 42.3 46.4
Number of nontraditional characteristicsZero 0.9 2.7 20.7 75.7One 3.0 7.0 44.3 45.7Two to three 5.2 10.6 50.7 33.6Four or more 4.1 11.8 55.6 28.5
Dependency status1
Dependent 2.1 4.5 34.8 58.6Independent 4.5 11.4 49.4 34.8
Has dependent(s)Yes 3.7 12.7 51.8 31.8No 3.2 6.3 38.7 51.9
Single with dependent(s)2
Yes 2.9 14.9 53.4 28.9No 3.4 6.8 40.3 49.5
High school completion statusHigh school diploma, foreign high school, or home schooled 3.4 7.2 40.9 48.5GED or other equivalency, completion certificate, or no high school diploma, certificate, or other equivalency 2.4 16.6 56.3 24.7
Number of months between high school completion and postsecondary entry3
0–12 3.5 6.1 36.9 53.413 or more 2.8 12.0 55.6 29.6
Attendance status4
Any full-time 1.2 8.3 31.2 59.3Exclusively part-time 6.1 7.7 56.7 29.5
Worked while enrolled5
Worked full time 5.1 7.8 50.4 36.8Worked part time 2.9 6.7 40.8 49.6Did not work 2.5 9.5 38.2 49.8
See notes at end of table.
Table 14. DEGREE PROGRAM AND NONTRADITIONAL CHARACTERISTICS: Percentage distribution of undergraduates’ degree program, by selected characteristics: 2011–12
– 63 –

National Center for Education StatisticsTable 14. DEGREE PROGRAM AND NONTRADITIONAL CHARACTERISTICS: Percentage distribution of undergraduates’ degree program, by selected characteristics: 2011–12—Continued
SOURCE: U.S. Department of Education, National Center for Education Statistics, 2011–12 National Postsecondary Student Aid Study (NPSAS:12).
1 Independent students are age 24 or over and students under 24 who are married, have dependents, are veterans or on active duty, are orphans or wards of the courts, are homeless or at risk of homelessness, or were determined to be independent by a financial aid officer using professional judgment. Other undergraduates under age 24 are considered to be dependent.
3 Excludes the .9 percent of students who did not earn a high school diploma, certificate, or equivalency because these students did not have a high school completion date.
NOTE: Italicized text indicates characteristics of nontraditional students. Estimates include students enrolled in Title IV eligible postsecondary institutions in the 50 states and the District of Columbia. Prior cycles of the National Postsecondary Student Aid Study (NPSAS) included sampled institutions from Puerto Rico; to yield comparable estimates across cycles, use the COMPTO87 variable to exclude Puerto Rican institutions from estimates. Detail may not sum to totals because of rounding.
5 Estimates exclude students who worked in school-related jobs (e.g., work-study or assistantships) and jobs held while not enrolled, including summer break. Full-time status was defined as working 35 or more hours per week, and part-time status was defined as working less than 35 hours per week.
2 Includes students who were single, never married; separated; widowed; or divorced.
4 Full-time status for the purposes of financial aid eligibility was based on 12 credit hours, unless the awarding institution employed a different standard.
– 64 –

National Center for Education Statistics
Selected characteristicsNo certificate
or degree CertificateAssociate’s
degreeBachelor’s
degree
Total 0.20 0.25 0.39 0.22
Number of nontraditional characteristicsZero 0.09 0.18 0.45 0.44One 0.30 0.38 0.69 0.64Two to three 0.42 0.40 0.69 0.51Four or more 0.31 0.48 0.74 0.63
Dependency statusDependent 0.15 0.22 0.44 0.37Independent 0.29 0.37 0.60 0.43
Has dependent(s)Yes 0.26 0.47 0.71 0.57No 0.23 0.23 0.39 0.29
Single with dependent(s)Yes 0.34 0.64 0.83 0.67No 0.21 0.24 0.40 0.25
High school completion statusHigh school diploma, foreign high school, or home schooled 0.20 0.23 0.39 0.23GED or other equivalency, completion certificate, or no high school diploma, certificate, or other equivalency 0.35 0.87 1.05 0.92
Number of months between high school completion and postsecondary entry0–12 0.24 0.23 0.41 0.2813 or more 0.25 0.41 0.60 0.51
Attendance statusAny full-time 0.11 0.30 0.44 0.38Exclusively part-time 0.39 0.33 0.63 0.47
Worked while enrolledWorked full time 0.33 0.40 0.81 0.60Worked part time 0.22 0.31 0.50 0.42Did not work 0.27 0.29 0.52 0.41
Table S14. Standard errors for table 14: DEGREE PROGRAM AND NONTRADITIONAL CHARACTERISTICS: Percentage distribution of undergraduates’ degree program, by selected characteristics: 2011–12
SOURCE: U.S. Department of Education, National Center for Education Statistics, 2011–12 National Postsecondary Student Aid Study (NPSAS:12).
– 65 –

National Center for Education Statistics
Selected characteristicsPrepare to earn
a degree later
Prepare for job certification or
license
Gain job or occupation
skillsSelf-
improvement
Total 62.6 8.6 11.3 17.5
Number of nontraditional characteristicsZero 78.2 5.9 ! 7.8 ! 8.2 !One 68.0 6.8 6.0 ! 19.1Two to three 58.8 8.1 13.0 20.1Four or more 61.5 11.3 12.7 14.5
Dependency status1
Dependent 66.7 6.1 9.3 17.9Independent 60.8 9.7 12.2 17.3
Has dependent(s)Yes 60.9 11.7 12.0 15.3No 63.4 7.3 11.0 18.4
Single with dependent(s)2
Yes 58.6 15.3 ! 6.9 ! 19.2No 63.2 7.6 12.0 17.2
High school completion statusHigh school diploma, foreign high school, or home schooled 62.9 8.5 10.9 17.7GED or other equivalency, completion certificate, or no high school diploma, certificate, or other equivalency 58.7 10.8 ! 16.6 ! 13.9 !
Number of months between high school completion and postsecondary entry3
0–12 62.0 9.0 11.3 17.613 or more 65.3 7.0 11.1 16.6
Attendance status4
Any full-time 70.1 8.2 7.8 14.0Exclusively part-time 60.7 8.7 12.2 18.4
Worked while enrolled5
Worked full time 56.7 10.0 16.2 17.0Worked part time 68.4 8.1 7.3 16.2Did not work 64.5 7.3 8.8 19.4
See notes at end of table.
Table 15. REASON FOR TAKING CLASSES AND NONTRADITIONAL CHARACTERISTICS: Among undergraduates who were not enrolled in a degree or certificate program, percentage distribution of main reason for taking classes, by selected characteristics: 2011–12
– 66 –

National Center for Education Statistics
NOTE: Italicized text indicates characteristics of nontraditional students. Estimates include students enrolled in Title IV eligible postsecondary institutions in the 50 states and the District of Columbia. Prior cycles of the National Postsecondary Student Aid Study (NPSAS) included sampled institutions from Puerto Rico; to yield comparable estimates across cycles, use the COMPTO87 variable to exclude Puerto Rican institutions from estimates. Detail may not sum to totals because of rounding. SOURCE: U.S. Department of Education, National Center for Education Statistics, 2011–12 National Postsecondary Student Aid Study (NPSAS:12).
1 Independent students are age 24 or over and students under 24 who are married, have dependents, are veterans or on active duty, are orphans or wards of the courts, are homeless or at risk of homelessness, or were determined to be independent by a financial aid officer using professional judgment. Other undergraduates under age 24 are considered to be dependent.
3 Excludes the .9 percent of respondents who did not earn a high school diploma, certificate, or equivalency because these respondents did not have a high school completion date.4 Full-time status for the purposes of financial aid eligibility was based on 12 credit hours, unless the awarding institution employed a different standard. 5 Estimates exclude students who worked in school-related jobs (e.g., work-study or assistantships) and jobs held while not enrolled, including summer break. Full-time status was defined as working 35 or more hours per week, and part-time status was defined as working less than 35 hours per week.
Table 15. REASON FOR TAKING CLASSES AND NONTRADITIONAL CHARACTERISTICS: Among undergraduates who were not enrolled in a degree or certificate program, percentage distribution of main reason for taking classes, by selected characteristics: 2011–12—Continued
2 Includes students who were single, never married; separated; widowed; or divorced.
! Interpret data with caution. The coefficient of variation (CV) for this estimate is between 30 and 50 percent.
– 67 –

National Center for Education Statistics
Selected characteristicsPrepare to earn
a degree later
Prepare for job certification or
license
Gain job or occupation
skillsSelf-
improvement
Total 1.85 1.05 1.07 1.47
Number of nontraditional characteristicsZero 4.12 2.48 2.57 2.51One 4.25 1.78 2.14 3.81Two to three 2.56 1.46 1.69 2.43Four or more 3.83 3.06 2.13 2.82
Dependency statusDependent 3.29 1.62 1.97 2.65Independent 2.39 1.33 1.37 1.68
Has dependent(s)Yes 3.89 2.87 2.23 2.43No 2.10 0.94 1.20 1.87
Single with dependent(s)Yes 5.88 5.44 2.68 4.34No 1.88 0.84 1.19 1.59
High school completion statusHigh school diploma, foreign high school, or home schooled 1.97 1.15 1.05 1.53GED or other equivalency, completion certificate, or no high school diploma, certificate, or other equivalency 6.95 3.94 6.64 5.19
Number of months between high school completion and postsecondary entry
0–12 2.29 1.39 1.31 1.6913 or more 3.41 1.64 1.92 2.53
Attendance statusAny full-time 3.28 1.73 1.59 2.38Exclusively part-time 2.23 1.30 1.27 1.80
Worked while enrolledWorked full time 3.14 2.28 2.10 2.37Worked part time 2.60 1.68 1.52 2.28Did not work 3.58 1.74 2.04 3.10
SOURCE: U.S. Department of Education, National Center for Education Statistics, 2011–12 National Postsecondary Student Aid Study (NPSAS:12).
Table S15. Standard errors for table 15: REASON FOR TAKING CLASSES AND NONTRADITIONAL CHARACTERISTICS: Among undergraduates who were not enrolled in a degree or certificate program, percentage distribution of main reason for taking classes, by selected characteristics: 2011–12
– 68 –

National Center for Education Statistics
Selected characteristics
Computer and
information sciences
Engineering and
engineering technology
Biology and physical science, science
technology, mathematics,
agriculture
General studies
and other
Social sciences
and human-
ities
Personal and con-
sumer services
Manufac-turing,
construction, repair,
transportation
Military technology
and protective
services
Health care
fields BusinessOther
applied1
Total 4.7 4.4 3.6 17.2 6.1 5.1 5.2 4.7 26.7 12.4 10.0
Number of nontraditional characteristicsZero 4.0 5.0 6.1 20.0 9.6 6.0 5.0 5.0 18.7 10.9 9.7One 4.1 4.7 4.2 21.1 7.2 5.2 5.5 5.7 21.4 10.4 10.6Two to three 5.5 4.4 3.5 16.7 5.6 5.1 5.6 4.4 27.7 12.1 9.4Four or more 4.4 3.8 2.4 14.1 4.5 4.6 4.7 4.4 32.0 14.7 10.5
Dependency status2
Dependent 4.0 4.7 5.1 21.9 8.0 5.0 5.1 5.6 19.2 11.4 10.0Independent 5.1 4.2 2.8 14.3 4.8 5.1 5.3 4.2 31.2 13.0 10.0
Has dependent(s)Yes 4.1 3.3 2.2 13.0 4.3 5.4 4.3 4.3 35.1 13.3 10.7No 5.0 4.9 4.4 19.5 7.0 4.9 5.7 5.0 22.0 11.9 9.7
Single with dependent(s)3
Yes 3.2 2.8 2.0 12.4 4.2 6.8 3.9 4.9 35.3 13.6 10.9No 5.1 4.8 4.1 18.4 6.5 4.6 5.6 4.7 24.4 12.1 9.8
High school completion statusHigh school diploma, foreign high school, or home schooled 4.6 4.4 3.8 17.8 6.2 4.8 4.8 4.8 26.4 12.5 10.0GED or other equivalency, completion certificate, or no high school diploma, certificate, or other equivalency 5.6 4.1 2.7 12.9 5.4 6.8 8.1 4.2 28.3 11.9 10.1
See notes at end of table.
Table 16. FIELD OF STUDY AND NONTRADITIONAL CHARACTERISTICS: Among undergraduates in an associate’s degree or certificate program who had decided on a field of study, percentage distribution of field of study, by selected characteristics: 2011–12
– 69 –

National Center for Education Statistics
Selected characteristics
Computer and
information sciences
Engineering and
engineering technology
Biology and physical science, science
technology, mathematics,
agriculture
General studies
and other
Social sciences
and human-
ities
Personal and con-
sumer services
Manufac-turing,
construction, repair,
transportation
Military technology
and protective
services
Health care
fields BusinessOther
applied1
Number of months between high school completion and postsecondary entry4
0–12 4.4 4.1 4.2 18.5 6.9 4.7 4.5 4.8 25.8 11.5 10.313 or more 5.2 4.9 2.8 15.3 4.8 5.4 6.1 4.6 27.7 13.9 9.5
Attendance status5
Any full-time 4.8 4.7 3.6 13.6 5.9 7.5 6.6 5.2 26.8 11.7 9.7Exclusively part-time 4.6 4.1 3.6 20.0 6.2 3.1 4.1 4.4 26.6 13.0 10.3
Worked while enrolled6
Worked full time 5.8 4.8 3.7 16.3 4.9 3.2 5.1 5.4 25.6 15.4 9.9Worked part time 3.7 4.0 3.9 20.0 6.8 5.0 4.4 4.2 26.8 10.9 10.2Did not work 4.7 4.3 3.3 15.2 6.3 6.6 6.1 4.7 27.4 11.3 9.9
Table 16. FIELD OF STUDY AND NONTRADITIONAL CHARACTERISTICS: Among undergraduates in an associate’s degree or certificate program who had decided on a field of study, percentage distribution of field of study, by selected characteristics: 2011–12—Continued
2 Independent students are age 24 or over and students under 24 who are married, have dependents, are veterans or on active duty, are orphans or wards of the courts, are homeless or at risk of homelessness, or were determined to be independent by a financial aid officer using professional judgment. Other undergraduates under age 24 are considered to be dependent.
1 This other applied category for subbaccalaureate undergraduates includes education; architecture; communications; public administration and human services; design and applied arts; law and legal studies; library sciences; and theology and religious vocations.
4 Excludes the .9 percent of respondents who did not earn a high school diploma, certificate, or equivalency because these respondents did not have a high school completion date.
NOTE: Italicized text indicates characteristics of nontraditional students. Estimates include students enrolled in Title IV eligible postsecondary institutions in the 50 states and the District of Columbia. Prior cycles of the National Postsecondary Student Aid Study (NPSAS) included sampled institutions from Puerto Rico; to yield comparable estimates across cycles, use the COMPTO87 variable to exclude Puerto Rican institutions from estimates. Detail may not sum to totals because of rounding.
6 Estimates exclude students who worked in school-related jobs (e.g., work-study or assistantships) and jobs held while not enrolled, including summer break. Full-time status was defined as working 35 or more hours per week, and part-time status was defined as working less than 35 hours per week.
SOURCE: U.S. Department of Education, National Center for Education Statistics, 2011–12 National Postsecondary Student Aid Study (NPSAS:12).
5 Full-time status for the purposes of financial aid eligibility was based on 12 credit hours, unless the awarding institution employed a different standard.
3 Includes students who were single, never married; separated; widowed; or divorced.
– 70 –

National Center for Education Statistics
Selected characteristics
Computer and
information sciences
Engineering and
engineering technology
Biology and physical science, science
technology, mathematics,
agriculture
General studies
and other
Social sciences
and human-
ities
Personal and con-
sumer services
Manufac-turing,
construction, repair,
transportation
Military technology
and protective
services
Health care
fields BusinessOther
applied
Total 0.20 0.17 0.18 0.49 0.21 0.34 0.29 0.19 0.56 0.29 0.34
Number of nontraditional characteristicsZero 0.47 0.42 0.51 0.84 0.56 0.54 0.61 0.40 0.86 0.58 0.54One 0.37 0.41 0.36 0.82 0.41 0.51 0.49 0.47 0.79 0.51 0.50Two to three 0.33 0.29 0.29 0.63 0.32 0.41 0.40 0.29 0.72 0.55 0.51Four or more 0.32 0.30 0.25 0.69 0.32 0.39 0.34 0.32 0.88 0.58 0.56
Dependency statusDependent 0.27 0.28 0.32 0.66 0.35 0.38 0.40 0.27 0.56 0.39 0.37Independent 0.26 0.21 0.18 0.51 0.25 0.40 0.30 0.25 0.71 0.38 0.43
Has dependent(s)Yes 0.28 0.23 0.20 0.63 0.29 0.48 0.28 0.29 0.86 0.50 0.51No 0.24 0.24 0.25 0.56 0.27 0.34 0.36 0.21 0.54 0.33 0.35
Single with dependent(s)Yes 0.29 0.32 0.24 0.69 0.33 0.63 0.34 0.38 0.93 0.56 0.58No 0.24 0.20 0.22 0.54 0.23 0.31 0.33 0.20 0.56 0.33 0.36
High school completion statusHigh school diploma, foreign high school, or home schooled 0.22 0.19 0.20 0.51 0.22 0.32 0.29 0.20 0.56 0.31 0.35GED or other equivalency, completion certificate, or no high school diploma, certificate, or other equivalency 0.49 0.46 0.36 0.76 0.52 0.65 0.64 0.35 1.08 0.69 0.84
See notes at end of table.
Table S16. Standard errors for table 16: FIELD OF STUDY AND NONTRADITIONAL CHARACTERISTICS: Among undergraduates in an associate’s degree or certificate program who had decided on a field of study, percentage distribution of field of study, by selected characteristics: 2011–12
– 71 –

National Center for Education Statistics
Selected characteristics
Computer and
information sciences
Engineering and
engineering technology
Biology and physical science, science
technology, mathematics,
agriculture
General studies
and other
Social sciences
and human-
ities
Personal and con-
sumer services
Manufac-turing,
construction, repair,
transportation
Military technology
and protective
services
Health care
fields BusinessOther
applied
Number of months between high school completion and postsecondary entry
0–12 0.24 0.22 0.24 0.53 0.28 0.33 0.28 0.21 0.59 0.36 0.3713 or more 0.34 0.28 0.24 0.63 0.28 0.45 0.44 0.31 0.74 0.47 0.47
Attendance statusAny full-time 0.30 0.26 0.24 0.48 0.26 0.63 0.50 0.25 0.74 0.37 0.44Exclusively part-time 0.24 0.22 0.23 0.71 0.29 0.23 0.25 0.25 0.68 0.41 0.47
Worked while enrolledWorked full time 0.35 0.31 0.27 0.63 0.35 0.27 0.39 0.34 0.78 0.60 0.49Worked part time 0.25 0.27 0.26 0.65 0.32 0.42 0.33 0.24 0.65 0.42 0.42Did not work 0.28 0.28 0.24 0.63 0.32 0.51 0.45 0.28 0.78 0.42 0.52
SOURCE: U.S. Department of Education, National Center for Education Statistics, 2011–12 National Postsecondary Student Aid Study (NPSAS:12).
Table S16. Standard errors for table 16: FIELD OF STUDY AND NONTRADITIONAL CHARACTERISTICS: Among undergraduates in an associate’s degree or certificate program who had decided on a field of study, percentage distribution of field of study, by selected characteristics: 2011–12—Continued
– 72 –

National Center for Education Statistics
Selected characteristics
Computer and information
sciences
Engineering and
engineering technology
Biology and physical
science, science technology,
mathematics, agriculture
General studies
and otherSocial
sciences Humanities
Health care
fields Business EducationOther
applied1
Total 3.9 5.7 9.7 4.5 12.0 9.4 11.8 20.0 6.7 16.3
Number of nontraditional characteristicsZero 2.7 7.2 13.5 2.8 13.0 11.6 10.4 15.6 7.7 15.5One 3.7 6.5 10.2 4.6 12.1 10.7 11.1 18.0 5.9 17.4Two to three 5.6 3.7 6.3 6.5 10.8 7.8 12.4 24.2 6.3 16.4Four or more 5.7 2.9 2.4 6.4 10.4 3.3 16.6 29.7 5.5 17.1
Dependency status2
Dependent 3.0 7.0 12.7 3.8 12.6 11.1 10.3 16.4 7.1 15.9Independent 5.3 3.5 5.0 5.6 11.0 6.7 14.3 25.6 6.2 16.8
Has dependent(s)Yes 5.2 2.6 3.1 6.2 10.7 3.8 16.9 28.1 7.1 16.2No 3.6 6.4 11.3 4.1 12.3 10.7 10.7 18.1 6.6 16.3
Single with dependent(s)3
Yes 3.9 2.1 3.5 5.8 12.6 3.3 17.3 27.7 6.3 17.7No 3.9 6.0 10.4 4.4 11.9 10.0 11.3 19.2 6.8 16.1
High school completion statusHigh school diploma, foreign high school, or home schooled 3.8 5.7 10.0 4.4 12.0 9.5 11.9 19.7 6.9 16.1GED or other equivalency, completion certificate, or no high school diploma, certificate, or other equivalency 7.4 3.9 3.9 6.5 11.6 8.0 10.2 25.0 4.3 19.1
See notes at end of table.
Table 17. FIELD OF STUDY AND NONTRADITIONAL CHARACTERISTICS: Among undergraduates in a bachelor’s degree program who had decided on a field of study, percentage distribution of field of study, by selected characteristics: 2011–12
– 73 –

National Center for Education Statistics
Selected characteristics
Computer and information
sciences
Engineering and
engineering technology
Biology and physical
science, science technology,
mathematics, agriculture
General studies
and otherSocial
sciences Humanities
Health care
fields Business EducationOther
applied1
Number of months between high school completion and postsecondary entry4
0–12 3.5 5.9 10.8 4.2 12.2 10.2 11.6 18.9 7.0 15.713 or more 5.7 4.5 5.1 5.7 11.1 5.8 12.9 24.9 5.7 18.7
Attendance status5
Any full-time 3.5 6.0 10.9 3.3 12.7 10.1 11.3 18.7 7.3 16.2Exclusively part-time 5.2 4.8 6.6 7.7 10.0 7.6 13.2 23.4 5.2 16.4
Worked while enrolled6
Worked full time 6.2 3.5 4.4 5.8 10.3 4.7 14.3 29.2 5.2 16.4Worked part time 3.2 5.0 10.8 4.4 12.5 10.1 12.1 17.1 8.1 16.6Did not work 3.5 7.4 11.4 3.9 12.3 11.1 10.3 18.0 6.2 15.9
6 Estimates exclude students who worked in school-related jobs (e.g., work-study or assistantships) and jobs held while not enrolled, including summer break. Full-time status was defined as working 35 or more hours per week, and part-time status was defined as working less than 35 hours per week.
1 This other applied category for baccalaureate undergraduates includes personal and consumer services; manufacturing, construction, repair, transportation; military technology and protective services; architecture; communications; public administration and human services; design and applied arts; law and legal studies; library sciences; theology and religious vocations.
3 Includes students who were single, never married; separated; widowed; or divorced.4 Excludes the .9 percent of students who did not earn a high school diploma, certificate, or equivalency because these students did not have a high school completion date.
NOTE: Italicized text indicates characteristics of nontraditional students. Estimates include students enrolled in Title IV eligible postsecondary institutions in the 50 states and the District of Columbia. Prior cycles of the National Postsecondary Student Aid Study (NPSAS) included sampled institutions from Puerto Rico; to yield comparable estimates across cycles, use the COMPTO87 variable to exclude Puerto Rican institutions from estimates. Detail may not sum to totals because of rounding.
Table 17. FIELD OF STUDY AND NONTRADITIONAL CHARACTERISTICS: Among undergraduates in a bachelor’s degree program who had decided on a field of study, percentage distribution of field of study, by selected characteristics: 2011–12—Continued
2 Independent students are age 24 or over and students under 24 who are married, have dependents, are veterans or on active duty, are orphans or wards of the courts, are homeless or at risk of homelessness, or were determined to be independent by a financial aid officer using professional judgment. Other undergraduates under age 24 are considered to be dependent.
SOURCE: U.S. Department of Education, National Center for Education Statistics, 2011–12 National Postsecondary Student Aid Study (NPSAS:12).
5 Full-time status for the purposes of financial aid eligibility was based on 12 credit hours, unless the awarding institution employed a different standard.
– 74 –
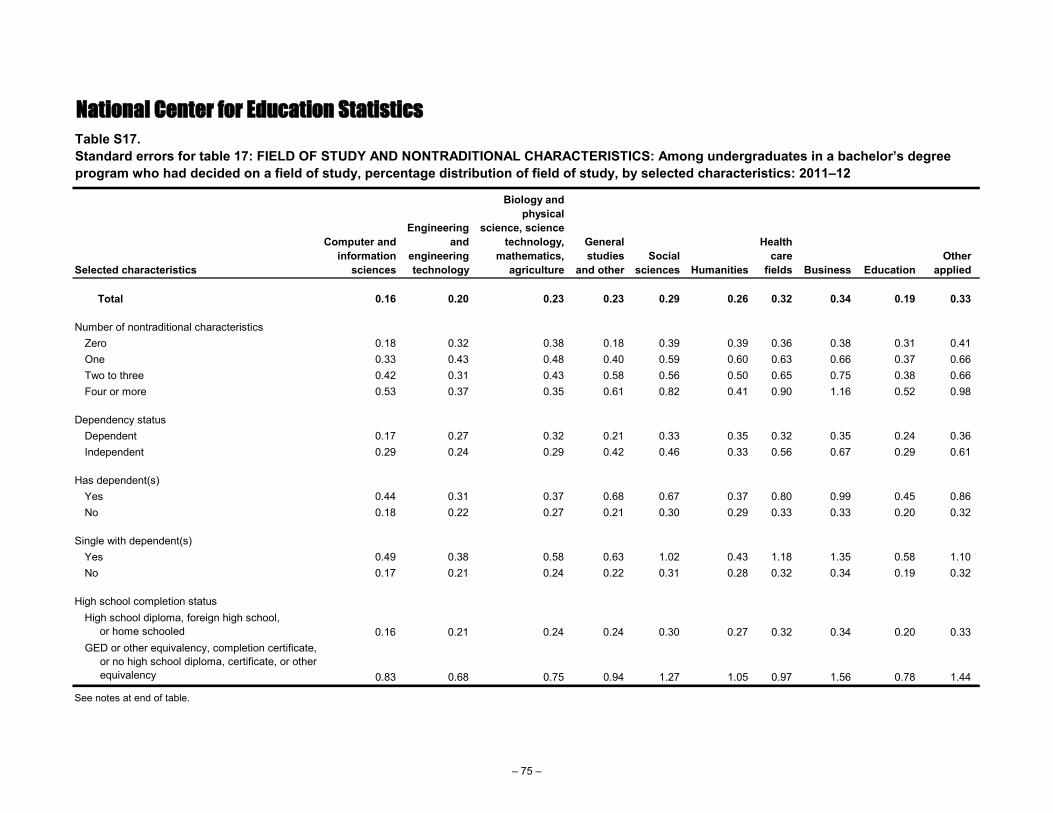
National Center for Education Statistics
Selected characteristics
Computer and information
sciences
Engineering and
engineering technology
Biology and physical
science, science technology,
mathematics, agriculture
General studies
and otherSocial
sciences Humanities
Health care
fields Business EducationOther
applied
Total 0.16 0.20 0.23 0.23 0.29 0.26 0.32 0.34 0.19 0.33
Number of nontraditional characteristicsZero 0.18 0.32 0.38 0.18 0.39 0.39 0.36 0.38 0.31 0.41One 0.33 0.43 0.48 0.40 0.59 0.60 0.63 0.66 0.37 0.66Two to three 0.42 0.31 0.43 0.58 0.56 0.50 0.65 0.75 0.38 0.66Four or more 0.53 0.37 0.35 0.61 0.82 0.41 0.90 1.16 0.52 0.98
Dependency statusDependent 0.17 0.27 0.32 0.21 0.33 0.35 0.32 0.35 0.24 0.36Independent 0.29 0.24 0.29 0.42 0.46 0.33 0.56 0.67 0.29 0.61
Has dependent(s)Yes 0.44 0.31 0.37 0.68 0.67 0.37 0.80 0.99 0.45 0.86No 0.18 0.22 0.27 0.21 0.30 0.29 0.33 0.33 0.20 0.32
Single with dependent(s)Yes 0.49 0.38 0.58 0.63 1.02 0.43 1.18 1.35 0.58 1.10No 0.17 0.21 0.24 0.22 0.31 0.28 0.32 0.34 0.19 0.32
High school completion statusHigh school diploma, foreign high school, or home schooled 0.16 0.21 0.24 0.24 0.30 0.27 0.32 0.34 0.20 0.33GED or other equivalency, completion certificate, or no high school diploma, certificate, or other equivalency 0.83 0.68 0.75 0.94 1.27 1.05 0.97 1.56 0.78 1.44
See notes at end of table.
Table S17. Standard errors for table 17: FIELD OF STUDY AND NONTRADITIONAL CHARACTERISTICS: Among undergraduates in a bachelor’s degree program who had decided on a field of study, percentage distribution of field of study, by selected characteristics: 2011–12
– 75 –

National Center for Education Statistics
Selected characteristics
Computer and information
sciences
Engineering and
engineering technology
Biology and physical
science, science technology,
mathematics, agriculture
General studies
and otherSocial
sciences Humanities
Health care
fields Business EducationOther
applied
Number of months between high school completion and postsecondary entry
0–12 0.17 0.22 0.26 0.22 0.29 0.29 0.33 0.35 0.21 0.3513 or more 0.47 0.38 0.39 0.56 0.63 0.47 0.66 0.85 0.46 0.68
Attendance statusAny full-time 0.16 0.22 0.26 0.18 0.33 0.30 0.36 0.38 0.23 0.33Exclusively part-time 0.38 0.35 0.42 0.58 0.53 0.40 0.65 0.70 0.37 0.73
Worked while enrolledWorked full time 0.42 0.32 0.39 0.43 0.72 0.34 0.68 0.96 0.44 0.76Worked part time 0.23 0.24 0.36 0.32 0.39 0.36 0.42 0.40 0.29 0.47Did not work 0.23 0.33 0.40 0.25 0.45 0.42 0.43 0.49 0.27 0.48
SOURCE: U.S. Department of Education, National Center for Education Statistics, 2011–12 National Postsecondary Student Aid Study (NPSAS:12).
Table S17. Standard errors for table 17: FIELD OF STUDY AND NONTRADITIONAL CHARACTERISTICS: Among undergraduates in a bachelor’s degree program who had decided on a field of study, percentage distribution of field of study, by selected characteristics: 2011–12—Continued
– 76 –