web appendix for: understanding cultural persistence and change · 2 a1. introduction this appendix...
TRANSCRIPT

1
Web Appendix for:
Understanding Cultural Persistence and Change
(Not for Publication)
Paola Giuliano
University of California Los Angeles, NBER, CEPR, IZA
Nathan Nunn
Harvard University, NBER, BREAD
July 2017

2
A1. Introduction
This appendix accompanies “Understanding Cultural Persistence and Change” by Paola
Giuliano and Nathan Nunn. Section A2 provides the details of the data used in the paper, as well as
their sources. Sections A3 and A4 report additional figures and tables that were discussed in the body
of the paper, but not reported there explicitly.
A2. Data and their sources
Dependent variables
The individual-level data on respect for tradition are taken from the most recent two waves of
the World Value Survey (WVS), which is a compilation of national surveys on values and norms on a
wide variety of topics. The surveys contain information on different types of attitudes, religions and
preferences, as well as information on standard demographic characteristics, such as sex, age,
education, labor market status, and income. We use data from a question that asks about the
respondent’s view on the importance of maintaining traditions and family customs. For the question,
respondents are given the description of a person and then they are asked to report how similar they
are to the person. For this measure, the following description was used: “Tradition is important to this
person; to follow the family customs handed down by one’s religion or family.” Respondents then
choose the response that best described how similar this person/description was to them: (1) very much
like me; (2) like me; (3) somewhat like me; (4) a little like me; (5) not like me; and (6) not at all like me.
We recoded the question, so that it is increasing in the value placed on tradition (and ranges from 1 to
6).
Measures of female labor force participation, when measured at the country level, is from the
World Bank’s World Development Indicators. The variable is defined in the standard manner: the
percentage of women aged 15 to 64 that are in the labor force. Although the data are available
annually, our analysis uses measures from 1970 and 2012.
For the within-country analysis, the measure of female labor force participation is taken
from national Censuses, which are obtained from IPUMS International. We select all countries t h a t
report individual information about ethnicity and for which there is subnational variation in ethnicity.
Each of the ethnicities from the Censuses are mapped to an ethnicity in the Ethnographic Atlas. For the
case of Cambodia and the Philippines, there was no information about ethnicity and the mapping
was done using information on the individual’s mother tongue. The time periods available vary by
country and are as follows: Belarus, 1999, Cambodia: 1998, 2008; Malaysia: 1970, 1980, 1991 and 2000;

3
Nepal, 2001; Philippines, 1990; Sierra Leone, 2004; Uganda, 1991, 2002; Vietnam, 1989, 1999 and 2009.
We measure the prevalence of polygamy today using data from the OECD Gender, Institutions and
Development Database. The variable is a country-level indicator that equals one if having more than one
spouse is accepted or legal.
Information on marriage among second generation U.S. immigrants is taken from the March
Supplement of the Current Population Survey (CPS). This source is the only data source for the United
States in which individuals are asked (starting from 1994) about their parents’ country of birth. We pool
data from eighteen years (1994–2014) to obtain the largest possible sample size. Inter-marriage is
defined as an indicator variable that equals one if an individual’s spouse has the same origin country.
The spouse is coded as one if he/she was born in origin country c, or if either the mother or father were
born in origin country c.
Information about the language spoken at home is available from the 2000 Census. This Census
does not report the country of origin of the parents. Instead, it records individuals’ self-reported
“ancestry”. Our sample includes all individuals who were born in the United States and report a foreign
ancestry. Thus, the sample only includes individuals who are second-generation immigrants or later. We
define an indicator variable that equals one if a language other than English (i.e., a foreign language) is
the primary language spoken at home. We exclude from the analysis countries for which English is an
official language.
Our analysis of whether Native American ethnic groups speak English or their aboriginal
language uses data from all U.S. Census years with the necessary data available (1930, 1990, and 2000).
We calculate the fraction of Native Americans belonging to a given ethnic group and living in a given
location that do not speak English at home. The Censuses record the name of the tribe with which the
person is connected. The Censuses ask the following question about language: “Does the person speak
a language other than English at home?”, which we use to code up an indicator variable.
For the analysis of Native Canadian populations, we use the 2001, 2006, and 2011 rounds of the
Census Aboriginal Population Profiles, available from Statistics Canada. The data include all Indigenous
populations that are living on a reserve or a legal land base. Statistics Canada collects information on
the proportion of the population who: (i) has an Indigenous language as their mother tongue, (ii) have
an Indigenous language spoken at home; and (iii) can conduct a conversation in at least one Indigenous
language. Unlike the U.S. Census data, these data are not publicly available at the individual level.
Data on generalized trust are taken from the World Values Survey. The measure is based on the
following survey questions: “Generally speaking, would you say that most people can be trust or that
you can’t be too careful in dealing with people?” Respondents chose on the following answers: “most

4
people can be trusted” or “cannot be too careful”. We use this information to code and indicator
variable that equals 1 if the respondent answers that “most people can be trusted” and 0 if he/she
answers “cannot be too careful.”
Historical control variables
Historical economic development: the measure comes from variable v30 of the Ethnographic Atlas.
Each ethnic group is categorized into one of the following categories describing their pattern of
settlement: ( 1 ) nomadic or fully migratory, (2) semi-nomadic, (3) semi-sedentary, (4) compact but
temporary settlements, (5) neighborhoods of dispersed family homes, (6) separated hamlets forming a
single community, (7) compact and relatively permanent, (8) complex settlements. The variable takes on
the listed values of 1 to 8, with 1 indicating fully nomadic groups and 8 groups with complex settlement.
Political hierarchies: we use the number of jurisdictional hierarchies beyond the local
community to quantify the pre-industrial political sophistication of an ethnic group. The original
measure, taken from variable v33 of the Ethnographic Atlas, takes on the values of 1 to 5, with 1
indicating no levels of hierarchy beyond the local community and 5 indicating four levels. Since the
local community represents one level of authority, we interpret the variable as measuring the total
number of jurisdictional hierarchies in the society.
Year in which the ethnicity was sampled: we construct a measure indicating the average date of
observation of ancestors in the Ethnographic Atlas in a country. This information is taken using the
variable v102 of the Ethnographic Atlas. This variable indicates the year in which the ethnicity was
sampled.
Historical latitude: we construct a measure indicating the average historical distance from the
equator of ancestors in a given country. This information is taken using the variable v104 of the
Ethnographic Atlas, which reports the latitude of the centroid of each ethnic group. We use the absolute
value of the measure, which is the distance from the equator measured in decimal degrees.
Historical cultural characteristics
Historical female participation in agriculture: we measure traditional female participation during the pre-
industrial period using variable v54 from the Ethnographic Atlas. Ethnicities are categorized into one of the
following five categories that measure the extent of female participation in pre-industrial agriculture: (1) males
only, (2) males appreciably more, (3) equal participation, (4) female appreciably more and (5) female only. To
make the traditional FLFP variable (which ranges from 1 to 5) more comparable with the contemporary measure
of FLFP, we normalize it so that the range of possible values is from 0 to 100.
5
Historical polygamy: we measure the traditional presence of polygamy using variable v9 from the
Ethnographic Atlas. The original coding in the Ethnographic Atlas uses the following classification for marital
practices: (1) independent nuclear monogamous, (2) polygyny, (3) preferential sororal living in the same dwelling,
(4) preferential sororal living in a separate dwelling, (5) non-sororal living in separate dwelling, (6) non-sororal
living in the same dwelling, (7) polyandry. Using this information, we create an indicator variable that equals one
if an ethnic group is coded as being in category 2 or 7.
Historical consanguineous marriage: we measure the traditional presence of polygamy using variable v25 from
the Ethnographic Atlas. The original coding in the Ethnographic Atlas has 14 categories for different types of cousin
marriage preference when cousin marriages are preferred to non-cousin marriage. The fifteenth category is for
“No preferred cousin marriages”. From variable v25, we create an indicator variable that equals 0 if the ethnicity
has “No preferred cousin marriages” and zero if it has a preferred cousin marriage of any type.
Contemporary control variable
Natural log of real per capita GDP: the measure of the log of the per-capita GDP is taken from
the World Bank’s World Development Indicators and is measured in 2012.

6
A3. Additional Figures
Figure A1. Native language spoken at home: U.S. Indigenous Populations
Figure A2. Mother tongue is an Indigenous language: Canadian Indigenous populations
010
2030
Den
sity
0 .2 .4 .6 .8 1Native language spoken at home
01
23
Den
sity
0 .2 .4 .6 .8 1Mother tongue is indigenous language
7
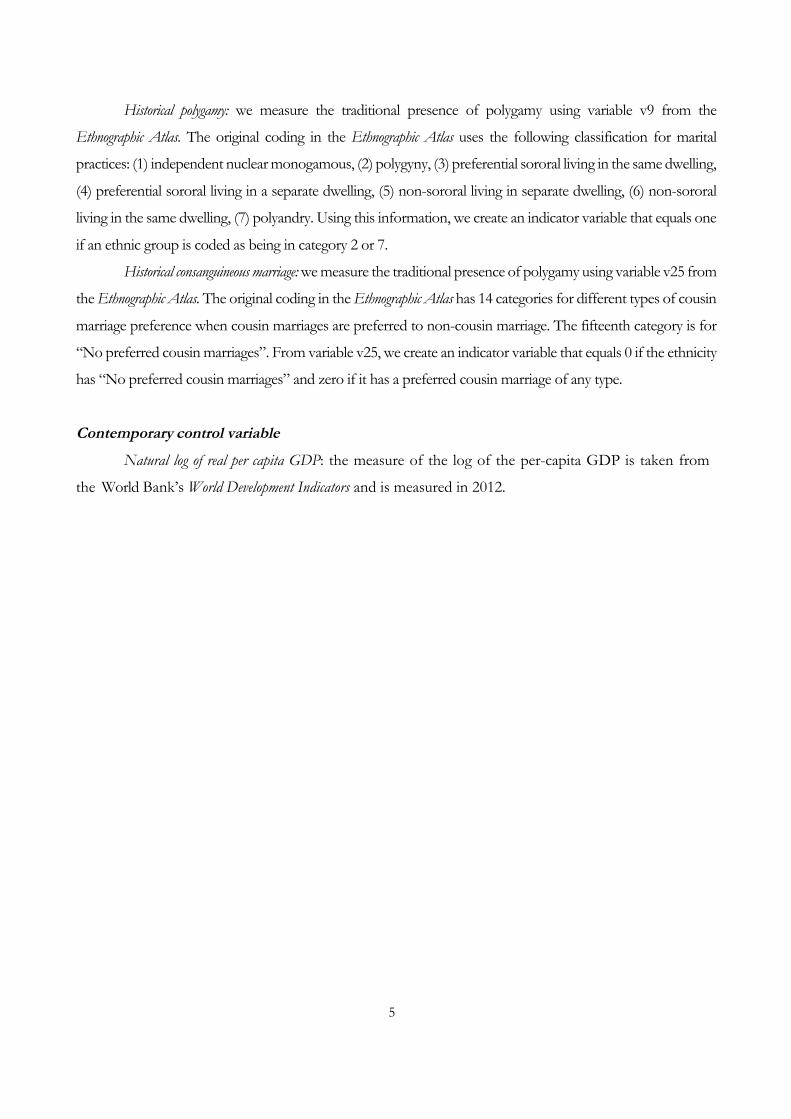
Figure A3. Indigenous language spoken at home, Canadian Indigenous populations
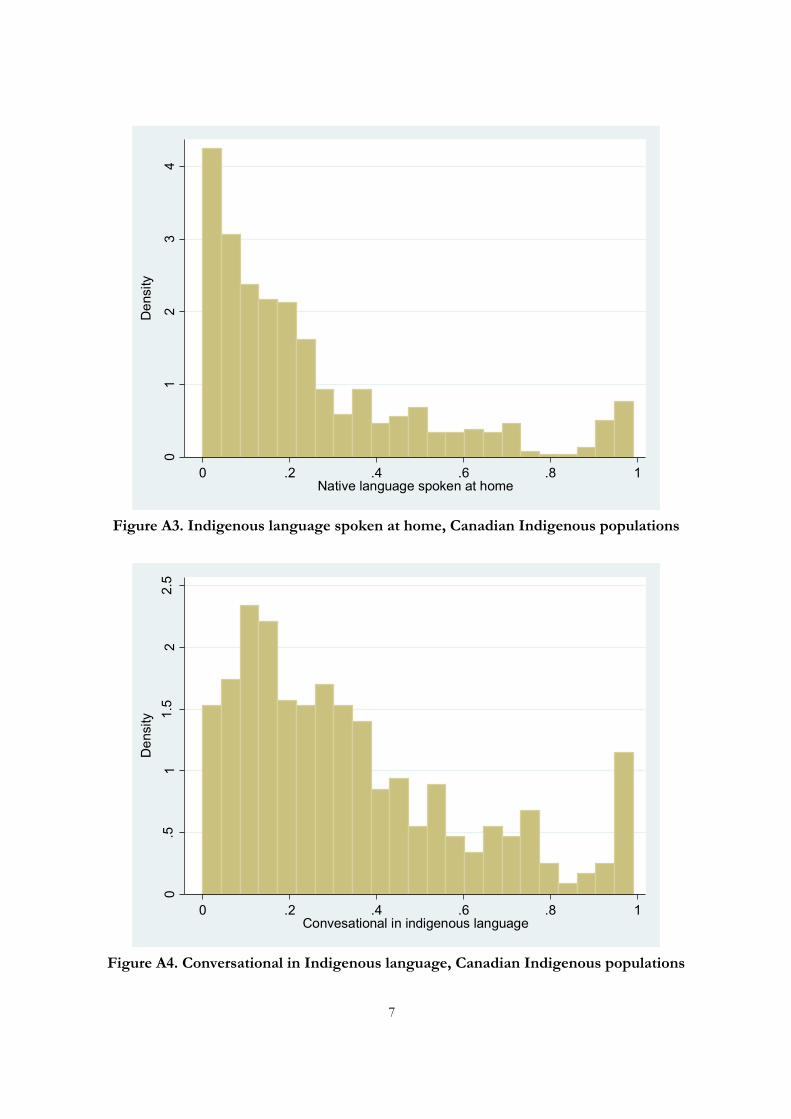
Figure A4. Conversational in Indigenous language, Canadian Indigenous populations
01
23
4
Den
sity
0 .2 .4 .6 .8 1Native language spoken at home
0.5
11.
52
2.5
Den
sity
0 .2 .4 .6 .8 1Convesational in indigenous language

8
A4. Additional tables
Table A1. Descriptive statistics
Variable Obs. Mean St. Dev. Variable Obs. Mean St. Dev.
Respect for tradition 75 4.521 0.549 FLFP 2012 165 53.158 15.388Traditional female part. agricult. 165 33.524 20.231
Climatic instability 75 0.252 0.108 Climatic instability 165 0.236 0.103Distance from equator 74 32.814 14.309 Log(per capita GDP) 165 9.167 1.218Economic complexity 74 6.496 1.353 Distance from the equator 165 27.437 16.851Political hierarchies 74 3.844 0.650 Economic complexity 165 6.430 1.332
Political hierarchies 165 3.489 0.907Climatic instability 75 0.252 0.110 Year ethnicity sampled 165 1.775 0.677Distance from equator 74 33.017 14.579 Polygamy 109 0.440 0.407Economic complexity 74 6.471 1.363 Traditional polygamy 109 0.702 0.409Political hierarchies 74 3.872 0.678 Consanguineous marriage 60 12.775 16.396
Traditional consanguineous marriage 60 31.204 43.151Climatic instability 75 0.253 0.113 FLFP 1970 77 32.614 17.683Distance from equator 74 33.383 14.957Economic complexity 74 6.478 1.417 FLFP 211 0.548 0.224Political hierarchies 74 3.900 0.628 Traditional female part. agricult. 211 0.392 0.238Ln(per capita GDP) 74 8.499 1.492 Climatic instability 211 0.191 0.101
Distance from the equator 211 19.834 15.139Respect for tradition 127,667 4.490 1.414 Economic complexity 211 6.351 1.509
Political hierarchies 211 3.199 1.447Climatic instability 127,667 0.271 0.117 Year ethnicity sampled 211 1.921 0.190Distance from equator 127,667 35.670 13.965Economic complexity 127,667 6.679 1.365Political hierarchies 127,667 3.008 0.854 Same country marriage 36,082 0.328 0.469
Climatic instability 36,082 0.287 0.089Climatic instability 127,685 0.265 0.118 Distance from the equator 36,082 40.163 10.268Distance from equator 127,685 35.696 13.995 Economic complexity 36,082 7.142 0.462Economic complexity 127,685 6.667 1.368 Political hierarchies 36,082 3.927 0.507Political hierarchies 127,685 3.134 0.925 Ln (per capita GDP) 36,082 9.940 0.660
Genetic distance from the US 36,082 0.476 0.577Climatic instability 126,630 0.264 0.118 Fraction of first and second gen. 36,082 0.034 0.058Distance from equator 126,630 35.695 14.065 Immigrants from same country of originEconomic complexity 126,630 6.667 1.419Political hierarchies 126,630 3.188 0.929
Women marrying men from the same country, CPS 1994-2014
With the World Ethnographic Sample Extension
With Eastern Europe and Siberia Extension
World Values Survey, Individual level sample
Baseline
Baseline
Father side
Cross-country, interactions regressionsWorld Values Survey, Country level sample
With the World Ethnographic Sample Extension
With Eastern Europe and Siberia Extension
Within-countries, interactions regressions

9
Table A1-continued. Descriptive statistics
Variable Obs. Mean St. Dev. Variable Obs. Mean St. Dev.
Same country marriage 3,343,097 0.124 0.330Same country marriage 34,045 0.317 0.465 Climatic instability 3,343,097 0.324 0.072Climatic instability 34,045 0.291 0.088 Distance from the equator 3,343,097 47.485 7.426Distance from the equator 34,045 40.433 10.249 Economic complexity 3,343,097 7.142 0.394Economic complexity 34,045 7.147 0.423 Political hierarchies 3,343,097 3.995 0.261Political hierarchies 34,045 3.927 0.498 Ln (per capita GDP) 3,343,097 10.014 0.837Ln (per capita GDP) 34,045 9.968 0.652 Genetic distance from the US 3,343,097 0.168 0.382Genetic distance from the US 34,045 0.472 0.578 Fraction of first and second gen. 3,343,097 0.089 0.094Fraction of first and second gen. 34,045 0.032 0.056 immigrants from same country of originimmigrants from same country of origin
Native language spoken 128,005 0.182 0.386Climatic instability 128,005 0.270 0.108
Same country marriage 38,419 0.281 0.449 Distance from the equator 128,005 38.666 6.158Climatic instability 38,419 0.294 0.090 Economic complexity 128,005 4.683 2.188Distance from the equator 38,419 41.113 10.124 Political hierarchies 128,005 1.904 0.930Economic complexity 38,419 7.170 0.460Political hierarchies 38,419 3.947 0.500Ln (per capita GDP) 38,419 9.985 0.649 Native language spoken 3,564 0.039 0.144Genetic distance from the US 38,419 0.430 0.563 Climatic instability 3,564 0.296 0.106Fraction of first and second gen. 38,419 0.031 0.056 Distance from the equator 3,564 40.086 7.429immigrants from same country of origin Economic complexity 3,564 4.295 2.385
Political hierarchies 3,564 1.803 0.869Same country marriage 35,639 0.287 0.452Climatic instability 35,639 0.298 0.089 Native language spoken 546 0.253 0.256Distance from the equator 35,639 41.348 10.037 Climatic instability 546 0.357 0.121Economic complexity 35,639 7.175 0.433 Distance from the equator 546 51.172 4.953Political hierarchies 35,639 3.947 0.484 Economic complexity 546 2.144 1.030Ln (per capita GDP) 35,639 10.015 0.636 Political hierarchies 546 1.484 0.504Genetic distance from the US 35,639 0.423 0.563Fraction of first and second gen. 35,639 0.029 0.054immigrants from same country of origin
Canada
Women marrying men from the same country, CPS 1994-2014Mother side
Men marrying women from the same country, CPS 1994-2014Father side
Mother side
Speaking a foreign language at home, 2000 Census
Traditional language spoken by Indigenous population in the United States
Trad. Lang. spoken by Indigenous pop. in the US and Canada, pooled regressionsUnited States

10
Table A2. List of ethnicities from the Word Value Survey individual-level regressions using the Ethnographic Atlas only
Ethnicity Obs. Ethnicity Obs. Ethnicity Obs. Ethnicity Obs. Ethnicity Obs.
ABKHAZ 2 CZECHS 1,917 IRANIANS 1,876 MINIANKA 10 SONINKE 30ADANGME 59 DAGARI 8 ISALA 2 MOBA 4 SOTHO 597AFAR 6 DAGOMBA 248 ISOKO 2 MOROCCANS 2,082 SPAN BASQ 13ALGERIANS 918 DARASA 6 IWA 17 MOSSI 659 SPANIARDS 15,211AMHARA 652 DIULA 156 JAPANESE 3,032 MZAB 2 SUBANUN 65AMI 1 DJUKA 96 JAVANESE 1,477 NANKANSE 6 SUMBAWANE 23ANFILLO 1 DOGON 44 JORDANIAN 2,154 NDEMBU 8 SWAZI 76ANNAMESE 969 DORSE 86 KABRE 1 NEAPOLITA 23 SYRIANS 1ARMENIANS 1,093 DUSUN 12 KALMYK 4 NEGRISEMB 7 TAGBANUA 518ASHANTI 1,866 DUTCH 19,333 KAONDE 62 NEWENGLAN 2,935 TAMIL 356ASSINI 16 EDO 1 KAREN 3 NUPE 19 TAWI-TAWI 22ATAYAL 144 EFIK 19 KARIERA 1 ORAON 33 TAZARAWA 95AYMARA 18 EGYPTIANS 4,441 KASENA 1 PAEZ 2 TELUGU 144AZJER 84 EWE 328 KASHMIRI 3 PAHARI 3 THONGA 165BABYLONIA 3,142 FRENCHCAN 542 KASONKE 40 PAIWAN 2 TIGRINYA 147BAKHTIARI 106 GA 183 KAZAK 1,867 PATHAN 228 TIV 8BAMBARA 961 GBARI 3 KERALA 279 PEDI 501 TORADJA 19BASA 2 GEORGIANS 1,419 KHASI 257 PL TONGA 218 TSAMAI 4BASARI 40 GHEG 13 KONKOMBA 3 PUNJABI 719 TSWANA 562BATAK 10 GREEKS 1,020 KONSO 6 QASHGAI 1,367 TUMBUKA 26BAULE 16 GUJARATI 391 KOREANS 3 RIFFIANS 2 TUNISIANS 1,129BEMBA 524 GURAGE 67 KUBU 3 ROMANS 794 TURKMEN 16BENGALI 317 HADIMU 12 KUNDA 28 RUSSIANS 8,295 TURKS 3,718BHIL 341 HAMYAN 42 KURD 363 RWALA 1,175 UKRAINIAN 1,167BISA 3 HAZARA 121 KUSASI 4 SANUSI 1,946 UTTARPRAD 1,152BOERS 1,008 HUNGARIAN 3,233 LEBANESE 1,161 SENOI 62 VENDA 109BOKI 2 HUTSUL 4 LIPTAKO 59 SERBS 3,054 WALLOONS 1,243BONTOK 8 IBAN 67 LOVEDU 244 SHAKO 1 XHOSA 1,001BUILSA 44 IBIBIO 6 LUIMBE 10 SHANTUNG 1,814 YAMI 11BULGARIAN 883 IBO 339 MALAYS 2,164 SHONA 1,226 YORUBA 370BYELORUSS 95 IDOMA 6 MAMPRUSI 13 SIAMESE 2,456 ZAZZAGAWA 587CAMBODIAN 136 IFUGAO 45 MANOBO 2 SIDAMO 171 ZULU 1,530CHECHEN 36 IGBIRA 4 MAORI 2 SINDHI 146CHEKIANG 6 IJAW 8 MARGI 1 SINHALESE 2 Total 127,667CHEWA 241 INCA 130 MARRI 72 SOMALI 2CHOCO 5 INGASSANA 2 MINCHINES 4,226 SONGHAI 29

11
Table A3. List of ethnicities from the Word Value Survey individual-level regressions using the Ethnographic Atlas and the Eastern Europe and Siberian extensions.
Ethnicity Obs. Ethnicity Obs. Ethnicity Obs. Ethnicity Obs. Ethnicity Obs.
Ethnicity Obs. Ethnicity Obs. Ethnicity Obs. Ethnicity Obs. Ethnicity Obs.ABKHAZ 2 CZECHS 1,909 IJAW 8 MARGI 1 SINHALESE 2ADANGME 59 DAGARI 8 INCA 130 MARRI 72 SOMALI 2AFAR 6 DAGOMBA 248 INGASSANA 2 MINCHINES 4,226 SONGHAI 29ALGERIANS 918 DARASA 6 IRANIANS 1,876 MINIANKA 10 SONINKE 30AMHARA 652 DIULA 156 ISALA 2 MOBA 4 SOTHO 597AMI 1 DJUKA 96 ISOKO 2 MOLDOVANS 12 SPAN BASQ 13ANFILLO 1 DOGON 44 IWA 17 MOROCCANS 2,082 SPANIARDS 15,211ANNAMESE 969 DORSE 86 JAPANESE 3,032 MOSSI 659 SUBANUN 65ARMENIANS 1,093 DUSUN 12 JAVANESE 1,477 MZAB 2 SUMBAWANE 23ASHANTI 1,866 DUTCH 5,563 JORDANIAN 2,154 NANKANSE 6 SWAZI 76ASSINI 16 EDO 1 KABRE 1 NDEMBU 8 SYRIANS 1ATAYAL 144 EFIK 19 KALMYK 4 NEAPOLITA 23 TAGBANUA 518AYMARA 18 EGYPTIANS 4,441 KAONDE 62 NEGRISEMB 7 TAMIL 356AZJER 84 ENGLISH 10,035 KAREN 3 NEWENGLAN 2,935 TAWI-TAWI 22BABYLONIA 3,142 ESTONIANS 1,010 KARIERA 1 NUPE 19 TAZARAWA 95BAKHTIARI 106 EWE 328 KASENA 1 ORAON 33 TELUGU 144BAMBARA 961 FRENCHCAN 542 KASHMIRI 3 PAEZ 2 THONGA 165BASA 2 GA 183 KASONKE 40 PAHARI 3 TIGRINYA 147BASARI 40 GAGAUZ 24 KAZAK 1,781 PAIWAN 2 TIV 8BATAK 10 GBARI 3 KAZAN TATAR 84 PATHAN 228 TORADJA 19BAULE 16 GEORGIANS 1,419 KERALA 279 PEDI 501 TSAMAI 4BEMBA 524 GERMANS (PRUSSIA) 3,772 KHASI 257 PL TONGA 218 TSWANA 562BENGALI 317 GHEG 13 KONKOMBA 3 PUNJABI 719 TUMBUKA 26BHIL 341 GREEKS 1,020 KONSO 6 QASHGAI 1,367 TUNISIANS 1,129BISA 3 GUJARATI 391 KOREANS 3 RIFFIANS 2 TURKMEN 16BOERS 1,008 GURAGE 67 KUBU 3 ROMANS 782 TURKS 3,694BOKI 2 HADIMU 12 KUNDA 28 RUSSIANS 8,295 UKRAINIAN 1,156BONTOK 8 HAMYAN 42 KURD 363 RWALA 1,175 UTTARPRAD 1,152BUILSA 44 HAZARA 121 KUSASI 4 SANUSI 1,946 VENDA 109BULGARIAN 883 HUNGARIAN 2,223 LEBANESE 1,161 SENOI 62 WALLOONS 1,243BYELORUSS 95 HUTSUL 4 LIPTAKO 59 SERBS 3,054 XHOSA 1,001CAMBODIAN 136 IBAN 67 LOVEDU 244 SHAKO 1 YAMI 11CHECHEN 36 IBIBIO 6 LUIMBE 10 SHANTUNG 1,814 YORUBA 370CHEKIANG 6 IBO 339 MALAYS 2,164 SHONA 1,226 ZAZZAGAWA 587CHEWA 241 IDOMA 6 MAMPRUSI 13 SIAMESE 2,456 ZULU 1,530CHOCO 5 IFUGAO 45 MANOBO 2 SIDAMO 171CHUVASH 2 IGBIRA 4 MAORI 2 SINDHI 146 Total 127,685

12
Table A4. List of ethnicities from the Word Value Survey individual-level regressions using the Ethnographic Atlas, Eastern Europe and Siberian extensions, and World Ethnographic Sample.
Ethnicity Obs. Ethnicity Obs. Ethnicity Obs. Ethnicity Obs. Ethnicity Obs.
ABKHAZ 2 CZECHS 1,917 IJAW 8 MARGI 1 SOMALI 2ADANGME 59 DAGARI 8 INCA 130 MARRI 72 SONGHAI 29AFAR 6 DAGOMBA 248 INGASSANA 2 MINCHINES 4,226 SONINKE 30ALGERIANS 918 DANES (LOLLAND) 2,974 IRANIANS 1,876 MINIANKA 10 SOTHO 597AMHARA 652 DARASA 6 ISALA 2 MOBA 4 SPAN BASQ 13AMI 1 DIULA 156 ISOKO 2 MOLDOVANS 794 SPANIARDS 15,211ANFILLO 1 DJUKA 96 IWA 17 MOROCCANS 2,082 SUBANUN 65ANNAMESE 969 DOGON 44 JAPANESE 3,032 MOSSI 659 SUMBAWANE 23ARMENIANS 1,093 DORSE 86 JAVANESE 1,477 MZAB 2 SWAZI 76ASHANTI 1,866 DUSUN 12 JORDANIAN 2,154 NANKANSE 6 SYRIANS 1ASSINI 16 DUTCH 2,501 KABRE 1 NDEMBU 8 TAGALOG 518ATAYAL 144 EDO 1 KALMYK 4 NEAPOLITA 23 TAJIK (MOUNTAIN) 119AYMARA 18 EFIK 19 KAONDE 62 NEGRISEMB 7 TAMIL 356AZJER 84 EGYPTIANS 4,441 KAREN 3 NEWENGLAN 2,935 TAWI-TAWI 22BABYLONIA 3,142 ENGLISH 10,049 KARIERA 1 NUPE 19 TAZARAWA 95BAKHTIARI 106 ESTONIANS 1,010 KASENA 1 ORAON 33 TELUGU 144BAMBARA 961 EWE 328 KASHMIRI 3 PAEZ 2 THONGA 165BASA 2 FRENCHCAN 542 KASONKE 40 PAHARI 3 TIGRINYA 147BASARI 40 GA 183 KAZAK 1,781 PAIWAN 2 TIV 8BATAK 10 GAGAUZ 24 KAZAN TATAR 84 PATHAN 228 TORADJA 19BAULE 16 GBARI 3 KERALA 279 PEDI 501 TSAMAI 4BEMBA 524 GEORGIANS 1,419 KHASI 257 PL TONGA 218 TSWANA 562BENGALI 317 GERMANS (PRUSSIA) 3,774 KONKOMBA 3 PUNJABI 719 TUMBUKA 26BHIL 341 GHEG 13 KONSO 6 QASHGAI 1,367 TUNISIANS 1,129BISA 3 GREEKS 1,020 KOREANS 3 RIFFIANS 2 TURKMEN 16BOERS 1,008 GUJARATI 391 KUBU 3 RUSSIANS 8,295 TURKS 3,694BOKI 2 GURAGE 67 KUNDA 28 RWALA 1,175 UKRAINIAN 1,167BONTOK 8 HADIMU 12 KURD 363 SANUSI 1,946 UTTARPRAD 1,152BUILSA 44 HAMYAN 42 KUSASI 4 SENOI 62 VENDA 109BULGARIAN 883 HUNGARIAN 1,223 LEBANESE 1,161 SERBS 3,054 WALLOONS 1,243BYELORUSS 95 HUTSUL 4 LIPTAKO 59 SHAKO 1 XHOSA 1,001CAMBODIAN 136 IBAN 67 LOVEDU 244 SHANTUNG 1,814 YAMI 11CHECHEN 36 IBIBIO 6 LUIMBE 10 SHONA 1,226 YORUBA 370CHEKIANG 6 IBO 339 MALAYS 2,164 SIAMESE 2,456 ZAZZAGAWA 587CHEWA 241 IDOMA 6 MAMPRUSI 13 SIDAMO 171 ZULU 1,530CHOCO 5 IFUGAO 45 MANOBO 2 SINDHI 146CHUVASH 2 IGBIRA 4 MAORI 2 SINHALESE 2 Total 126,630

13
Table A5. Importance of tradition using the WVS and excluding North and South America, Australia, New Zealand, and South Africa
(1) (2) (3) (4) (5) (6)
Climaticinstability -1.836*** -2.035** -1.819*** -2.074** -1.733*** -1.983**(0.582) (0.790) (0.562) (0.783) (0.524) (0.750)
Historicalcontrols:Distancefromequator 0.008 0.008 0.008
(0.006) (0.006) (0.006)Economiccomplexity -0.065* -0.061 -0.059*
(0.037) (0.037) (0.035)Politicalhierarchies -0.031 -0.040 -0.046
(0.109) (0.106) (0.121)Contemporarycontrols:Ln(percapitaGDP) -0.162*** -0.164*** -0.164***
(0.051) (0.051) (0.053)
Mean(st.dev.)ofdepvar 4.56(0.57) 4.56(0.57) 4.56(0.57) 4.56(0.57) 4.56(0.57) 4.56(0.57)Observations 63 62 63 62 63 62R-squared 0.132 0.369 0.134 0.369 0.130 0.363
AlsowiththeWorldEthnographicSample
Extension
Notes : The unit of observation is a country. The dependent variable is the average at the country levelof a measure of the self-reported importance of tradition. The mean and st. dev. of Climatic Instabilityis0.25(0.11).***,**and*indicatesignificanceatthe10,5and1%levels.
DependentVariable:ImportanceofTradition,1-6AncestralCharacteristicsMeasures
OriginalEA WithEasternEurope&SiberiaExtension

14
Table A6. The importance of tradition using the WVS: Robustness to the exclusion of potentially endogenous covariates
(1) (2) (3) (4) (5) (6)
Climaticinstability -1.626** -1.842** -1.657** -1.828** -1.600** -1.704**(0.703) (0.733) (0.703) (0.732) (0.679) (0.717)
Historicalcontrols:Distancefromequator -0.003 -0.001 -0.003 -0.001 -0.003 -0.001
(0.006) (0.005) (0.006) (0.005) (0.006) (0.005)Economiccomplexity -0.134*** -0.131*** -0.128***
(0.035) (0.035) (0.032)Politicalhierarchies 0.044 0.047 0.056
(0.115) (0.112) (0.123)
Mean(st.dev.)ofdepvar 4.52(0.55) 4.52(0.55) 4.52(0.55) 4.52(0.55) 4.52(0.55) 4.52(0.55)Observations 75 75 75 75 75 75R-squared 0.253 0.148 0.250 0.148 0.251 0.144
AncestralCharacteristicsMeasures
OriginalEA
Notes : The unit of observation is a country. The dependent variable is the average at the country level of a measure of the self-reported importance of tradition. The mean and st. dev. of Climatic Instability is 0.25 (0.11). ***, ** and * indicate significance at the 10, 5 and 1% levels.
DependentVariable:ImportanceofTradition,1-6
AlsowiththeWorldEthnographic
SampleExtension
WithEasternEurope&SiberiaExtension

15
Table A7. Importance of tradition using the WVS: Robustness to additional covariates
(1) (2) (3) (4) (5) (6) (7)
Climaticinstability -1.732** -1.871** -1.876** -2.131*** -1.663** -1.827** -1.920**(0.769) (0.848) (0.714) (0.689) (0.661) (0.693) (0.791)
Historicalcontrols:Distancefromequator 0.005 0.006 0.006 0.013** 0.002 0.008 0.010
(0.005) (0.006) (0.005) (0.006) (0.006) (0.006) (0.007)Economiccomplexity -0.066* -0.061 -0.067* -0.044 -0.059* -0.054* -0.035
(0.035) (0.038) (0.035) (0.038) (0.033) (0.030) (0.036)Politicalhierarchies 0.010 0.011 0.014 -0.026 0.035 0.039 0.027
(0.097) (0.098) (0.098) (0.098) (0.102) (0.088) (0.091)Contemporarycontrols:Ln(percapitaGDP) -0.158*** -0.162*** -0.167*** -0.153*** -0.145*** -0.145*** -0.113**
(0.045) (0.055) (0.050) (0.046) (0.053) (0.048) (0.054)Additionalcontrols:Ruggedness 0.042 0.015
(0.061) (0.055)Distancefromthecoast 0.037 -0.018
(0.227) (0.209)Numberofproxiesforclimaticdata 0.029 0.046
(0.026) (0.029)Ethnicfractionalization 0.658** 0.532*
(0.313) (0.317)GeneticDiversity 1.555 1.840**
(0.941) (0.869)Trust -1.007** -1.074**
(0.389) (0.437)
Mean(st.dev.)ofthedependentvariable 4.52(0.55) 4.52(0.55) 4.52(0.55) 4.51(0.55) 4.51(0.55) 4.52(0.55) 4.52(0.55)Observations 74 74 74 73 73 74 72R-squared 0.391 0.388 0.389 0.440 0.404 0.445 0.516
DependentVariable:ImportanceofTradition,1-6
Notes :Theunitofobservationisacountry.Thedependentvariableistheaverageatthecountrylevelofameasureoftheself-reportedimportanceoftradition.Themeanandst.dev.ofClimaticInstabilityis0.25(0.11).***,**and*indicatesignificanceatthe10,5and1%levels.
16
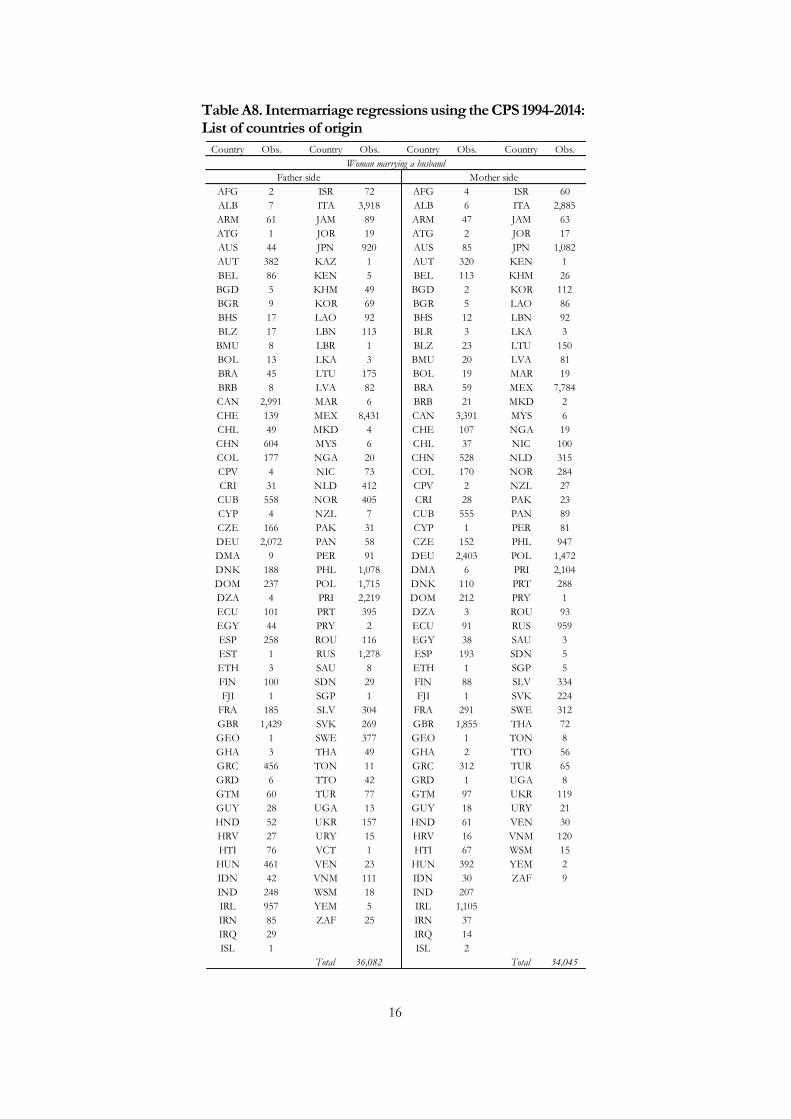
Table A8. Intermarriage regressions using the CPS 1994-2014: List of countries of origin
Country Obs. Country Obs. Country Obs. Country Obs.
AFG 2 ISR 72 AFG 4 ISR 60ALB 7 ITA 3,918 ALB 6 ITA 2,885ARM 61 JAM 89 ARM 47 JAM 63ATG 1 JOR 19 ATG 2 JOR 17AUS 44 JPN 920 AUS 85 JPN 1,082AUT 382 KAZ 1 AUT 320 KEN 1BEL 86 KEN 5 BEL 113 KHM 26BGD 5 KHM 49 BGD 2 KOR 112BGR 9 KOR 69 BGR 5 LAO 86BHS 17 LAO 92 BHS 12 LBN 92BLZ 17 LBN 113 BLR 3 LKA 3BMU 8 LBR 1 BLZ 23 LTU 150BOL 13 LKA 3 BMU 20 LVA 81BRA 45 LTU 175 BOL 19 MAR 19BRB 8 LVA 82 BRA 59 MEX 7,784CAN 2,991 MAR 6 BRB 21 MKD 2CHE 139 MEX 8,431 CAN 3,391 MYS 6CHL 49 MKD 4 CHE 107 NGA 19CHN 604 MYS 6 CHL 37 NIC 100COL 177 NGA 20 CHN 528 NLD 315CPV 4 NIC 73 COL 170 NOR 284CRI 31 NLD 412 CPV 2 NZL 27CUB 558 NOR 405 CRI 28 PAK 23CYP 4 NZL 7 CUB 555 PAN 89CZE 166 PAK 31 CYP 1 PER 81DEU 2,072 PAN 58 CZE 152 PHL 947DMA 9 PER 91 DEU 2,403 POL 1,472DNK 188 PHL 1,078 DMA 6 PRI 2,104DOM 237 POL 1,715 DNK 110 PRT 288DZA 4 PRI 2,219 DOM 212 PRY 1ECU 101 PRT 395 DZA 3 ROU 93EGY 44 PRY 2 ECU 91 RUS 959ESP 258 ROU 116 EGY 38 SAU 3EST 1 RUS 1,278 ESP 193 SDN 5ETH 3 SAU 8 ETH 1 SGP 5FIN 100 SDN 29 FIN 88 SLV 334FJI 1 SGP 1 FJI 1 SVK 224
FRA 185 SLV 304 FRA 291 SWE 312GBR 1,429 SVK 269 GBR 1,855 THA 72GEO 1 SWE 377 GEO 1 TON 8GHA 3 THA 49 GHA 2 TTO 56GRC 456 TON 11 GRC 312 TUR 65GRD 6 TTO 42 GRD 1 UGA 8GTM 60 TUR 77 GTM 97 UKR 119GUY 28 UGA 13 GUY 18 URY 21HND 52 UKR 157 HND 61 VEN 30HRV 27 URY 15 HRV 16 VNM 120HTI 76 VCT 1 HTI 67 WSM 15
HUN 461 VEN 23 HUN 392 YEM 2IDN 42 VNM 111 IDN 30 ZAF 9IND 248 WSM 18 IND 207IRL 957 YEM 5 IRL 1,105IRN 85 ZAF 25 IRN 37IRQ 29 IRQ 14ISL 1 ISL 2
Total 36,082 Total 34,045
Woman marrying a husbandMother sideFather side

17
Table A8-continued. Intermarriage regressions using the CPS 1994-2014: List of countries of origin
Country Obs. Country Obs. Country Obs. Country Obs.
AFG 4 ISR 46 AFG 2 JAM 64ALB 12 ITA 4,832 ALB 8 JOR 8ARM 57 JAM 85 ARM 39 JPN 1,117ATG 7 JOR 12 AUS 99 KEN 3AUS 46 JPN 1,007 AUT 413 KHM 22AUT 432 KAZ 1 AZE 2 KNA 3AZE 2 KEN 3 BEL 111 KOR 106BEL 108 KHM 50 BGD 1 LAO 40BGD 1 KNA 3 BGR 7 LBN 82BGR 5 KOR 50 BHS 11 LBR 1BHS 18 KWT 1 BLR 3 LTU 191BLR 2 LAO 46 BLZ 17 LVA 58BLZ 13 LBN 124 BMU 12 MAR 11BMU 7 LBR 2 BOL 5 MDA 3BOL 7 LCA 1 BRA 43 MEX 6,925BRA 30 LKA 1 BRB 8 MKD 1BRB 22 LTU 223 CAN 3,751 MYS 2CAN 3,446 LVA 71 CHE 124 NGA 17CHE 141 MAR 5 CHL 53 NIC 66CHL 39 MDA 2 CHN 535 NLD 330CHN 612 MEX 7,739 COL 145 NOR 421CMR 1 MYS 5 CPV 5 NZL 25COL 132 NGA 26 CRI 25 PAK 38CPV 3 NIC 78 CUB 551 PAN 75CRI 17 NLD 466 CYP 1 PER 60CUB 555 NOR 529 CZE 178 PHL 875CYP 1 NZL 7 DEU 2,656 POL 1,710CZE 204 PAK 35 DMA 8 PRI 1,904DEU 2,495 PAN 45 DNK 176 PRT 306DMA 6 PER 61 DOM 176 ROU 113DNK 230 PHL 1,056 ECU 83 RUS 1,202DOM 179 POL 1,968 EGY 27 SAU 4ECU 117 PRI 1,982 ESP 216 SDN 5EGY 39 PRT 381 ETH 6 SGP 3ESP 289 ROU 154 FIN 98 SLV 398ETH 4 RUS 1,617 FJI 1 SVK 272FIN 106 SAU 2 FRA 308 SWE 365FJI 2 SDN 27 GBR 2,041 THA 80
FRA 227 SLV 341 GHA 7 TON 12GBR 1,640 SVK 318 GRC 334 TTO 46GHA 6 SWE 449 GRD 6 TUR 55GRC 491 THA 33 GTM 88 UGA 11GRD 5 TON 12 GUY 27 UKR 139GTM 79 TTO 44 HND 45 URY 9GUY 27 TUR 74 HRV 20 VCT 3HND 35 TZA 1 HTI 45 VEN 35HRV 28 UGA 24 HUN 487 VNM 90HTI 59 UKR 225 IDN 30 WSM 19
HUN 562 URY 8 IND 177 YEM 3IDN 26 VCT 3 IRL 1,248 ZAF 25IND 210 VEN 30 IRN 24IRL 1,124 VNM 81 IRQ 17IRN 52 WSM 17 ISL 1IRQ 27 YEM 3 ISR 51ISL 1 ZAF 23 ITA 3,734
Total 38,419 Total 35,639
Mother sideMan marrying a wife
Father side
18
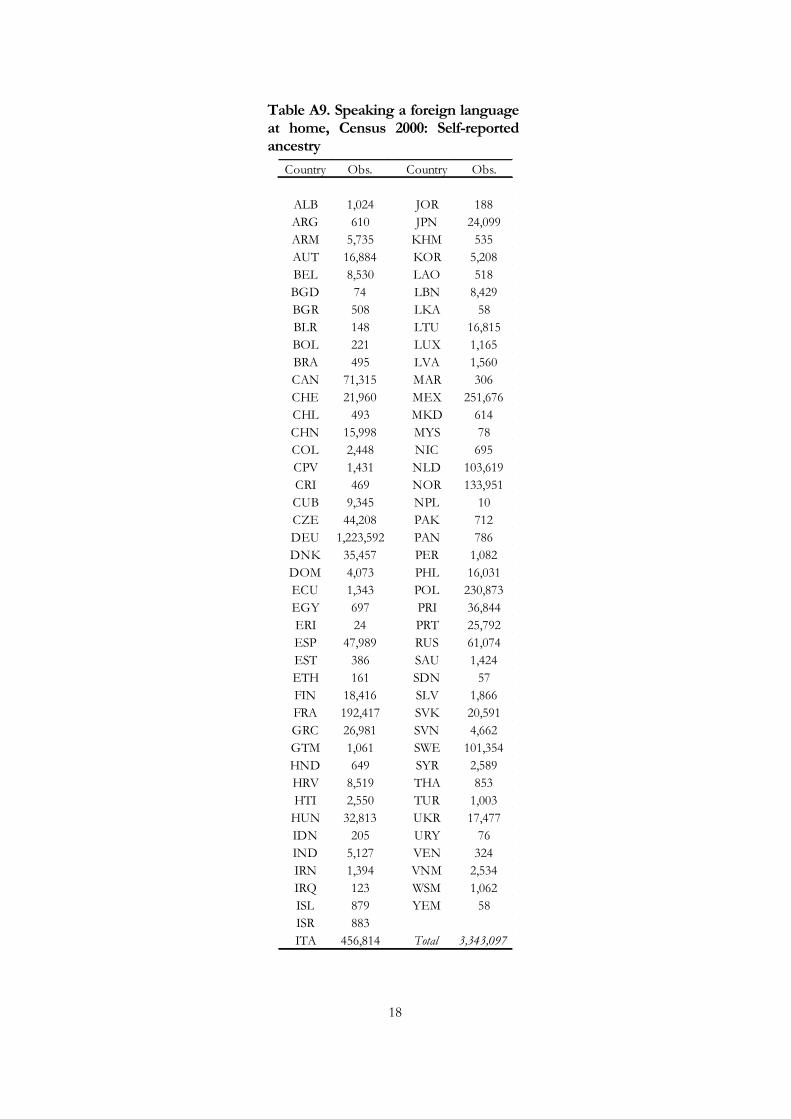
Table A9. Speaking a foreign language at home, Census 2000: Self-reported ancestry
Country Obs. Country Obs.
ALB 1,024 JOR 188ARG 610 JPN 24,099ARM 5,735 KHM 535AUT 16,884 KOR 5,208BEL 8,530 LAO 518BGD 74 LBN 8,429BGR 508 LKA 58BLR 148 LTU 16,815BOL 221 LUX 1,165BRA 495 LVA 1,560CAN 71,315 MAR 306CHE 21,960 MEX 251,676CHL 493 MKD 614CHN 15,998 MYS 78COL 2,448 NIC 695CPV 1,431 NLD 103,619CRI 469 NOR 133,951CUB 9,345 NPL 10CZE 44,208 PAK 712DEU 1,223,592 PAN 786DNK 35,457 PER 1,082DOM 4,073 PHL 16,031ECU 1,343 POL 230,873EGY 697 PRI 36,844ERI 24 PRT 25,792ESP 47,989 RUS 61,074EST 386 SAU 1,424ETH 161 SDN 57FIN 18,416 SLV 1,866FRA 192,417 SVK 20,591GRC 26,981 SVN 4,662GTM 1,061 SWE 101,354HND 649 SYR 2,589HRV 8,519 THA 853HTI 2,550 TUR 1,003HUN 32,813 UKR 17,477IDN 205 URY 76IND 5,127 VEN 324IRN 1,394 VNM 2,534IRQ 123 WSM 1,062ISL 879 YEM 58ISR 883ITA 456,814 Total 3,343,097

19
Table A10. Speaking a foreign language at home, Census 2000. Self-reported ancestry, full sample
(1) (2) (3) (4) (5)
Allages 18oryounger Over18
Climaticinstability -0.348** -0.279* -0.735*** -0.653*** -0.786***(0.149) (0.151) (0.195) (0.189) (0.201)
Country-levelcontrols:Distancefromequator -0.015*** -0.015*** -0.011*** -0.009** -0.012***
(0.004) (0.004) (0.004) (0.004) (0.004)Economiccomplexity -0.153*** -0.151*** -0.151*** -0.131*** -0.165***
(0.046) (0.047) (0.044) (0.039) (0.047)Politicalhierarchies 0.117 0.100 0.164* 0.147* 0.178*
(0.090) (0.086) (0.089) (0.088) (0.090)Ln(percapitaGDP) 0.011 0.012 -0.002 -0.007 0.000
(0.020) (0.018) (0.025) (0.024) (0.026)GeneticdistancefromtheUS 0.157* 0.149* 0.189** 0.202*** 0.177**
(0.081) (0.082) (0.074) (0.067) (0.077)Fractionofpopulationwiththesameancestry 0.098* 0.099* 0.063 0.064 0.061inthesamemetropolitanarea (0.055) (0.054) (0.062) (0.056) (0.067)
Individuallevelcontrols yes yes yes yes yesNumberofcountries 106 106 106 106 106Mean(st.dev.)ofdependentvariable 0.09(0.29) 0.08(0.27) 0.17(0.38) 0.17(0.38) 0.17(0.38)Observations 5,162,026 4,553,894 608,132 249,261 358,871R-squared 0.278 0.249 0.371 0.351 0.390Notes : OLS estimates are reported with standard errors clustered at the ancestry-country level in parentheses. The unit of observation is a personborn in the United States with an ancestry from a country other than the United States. The dependent variable is an indicator that equals one if theperson does not speak English at home. All specifications include the following individual-level control variables: a quadratic in age, two indicatorvariables for education (less than high school and high school), labor force participation fixed effects, personal income, and location (i.e., MSA) fixedeffects.ThemeanandstandarddeviationofClimaticinstabilityis0.33(0.07).***,**and*indicatesignificanceatthe10,5and1%levels.
Depvariable:IndicatorforspeakingaforeignlanguageathomeLivingwithparentsAll2ndgen+
individualsNotlivingwith
parents

20
Table A11. Speaking a foreign language at home, Census 2000. Self-reported ancestry, regressions collapsed at the ancestry-MSA level
(1) (2) (3) (4) (5)
Allages 18oryounger Over18
Climaticinstability -0.351* -0.257 -0.436** -0.443** -0.481***(0.198) (0.175) (0.198) (0.201) (0.170)
Country-levelcontrols:Distancefromequator -0.007*** -0.007*** -0.006*** -0.006*** -0.009***
(0.002) (0.002) (0.002) (0.002) (0.002)Economiccomplexity -0.019 -0.015 -0.038* -0.041** -0.061***
(0.017) (0.012) (0.020) (0.020) (0.020)Politicalhierarchies 0.045 0.045 0.060 0.062 0.087
(0.051) (0.046) (0.057) (0.060) (0.056)Ln(percapitaGDP) -0.026 -0.012 -0.034* -0.037** -0.011
(0.017) (0.016) (0.018) (0.018) (0.018)GeneticdistancefromtheUS 0.022 0.008 0.036 0.039 0.027
(0.043) (0.043) (0.045) (0.045) (0.047)Fractionofpopulationwiththesameancestry -0.012 0.048 -0.067 -0.070 0.018inthesamemetropolitanarea (0.317) (0.352) (0.264) (0.260) (0.241)
Numberofcountries 84 84 84 84 84Mean(st.dev.)ofdependentvariable 0.25(0.33) 0.21(0.31) 0.28(0.36) 0.28(0.36) 0.24(0.36)Observations 15,760 14,372 12,227 11,678 7,528R-squared 0.278 0.221 0.318 0.322 0.325
Depvariable:IndicatorforspeakingaforeignlanguageathomeAll2ndgen+individuals
Notlivingwithparents
Livingwithparents
Notes : OLS estimates are reported with standard errors clustered at the ancestry level in parentheses. The unit of observation is an ethnic/ancestralgroup in a location (i.e., MSA) in the United States. The dependent variable is the fraction of individuals that do not speak English at home. The meanandstandarddeviationofClimaticInstabilityis0.27(0.11).***,**and*indicatesignificanceatthe10,5and1%levels.

21
Table A12. Speaking an indigenous language at home, Census 1930, 1990 and 2000. Individual-level estimates, Native Americans
Ethnicity Obs. Ethnicity Obs.
ACHOMAWI 55 MAIDU 19ACOMA 48 MAKAH 23ALEUT 2,329 MANDAN 13ARAPAHO 84 MATTOLE 3ARIKARA 37 MENOMINI 61ASSINIBOI 76 MIAMI 28BANNOCK 25 MIWOK 18BLACKFOOT 3,831 MODOC 4CADDO 19 MOHAVE 49CAHUILLA 7 NAVAHO 26,814CHEMEHUEV 8 NEZPERCE 26CHEROKEE 38,515 NOMLAKI 2CHEYENNE 1,306 OMAHA 59CHINOOK 60 OTTAWA 107CHIPPEWA 13,601 PAPAGO 1,913CHOCTAW 10,698 PAWNEE 23COCHITI 20 PIMA 965COCOPA 20 PONCA 41COEURD'AL 23 POTAWATOM 2,034COMANCHE 1,241 PUYALLUP 38COOS 1 QUILEUTE 7CREEK 4,926 QUINAULT 27CROW 478 S UTE 95DELAWARE 54 SANTEE 38E CREE 43 SHASTA 11E POMO 53 SHAWNEE 22FLATHEAD 89 TENINO 30GOSIUTE 25 TETON 179GROSVENTR 50 TLINGIT 1,143HAIDA 931 TSIMSHIAN 29HOPI 126 UMATILLA 8HUPA 45 W APACHE 6,882IOWA 17 WASHO 56IROQUOIS 6,304 WICHITA 17JEMEZ 1 WINNEBAGO 76KALISPEL 13 WINTU 17KIDUTOKAD 26 YAQUI 1,088KIOWA 531 YUCHI 1KLALLAM 42 YUMA 84KLAMATH 29 ZUNI 1KUTENAI 54LAGUNA 86LUMMI 27 Total 128,005

22
Table A13. Speaking an indigenous language at home Native Americans (Census 1930, 1990 and 2000) and Native Canadians (Census 2001, 2006, 2011). Ethnicity-location level estimates
Ethnicity Obs. Ethnicity Obs. Ethnicity Obs.
ACHOMAWI 2 LUMMI 1 ASSINIBOI 8ACOMA 1 MAIDU 1 BEAVER 13ALEUT 142 MAKAH 1 BELLABELL 2ARAPAHO 1 MANDAN 1 BELLACOOL 2ARIKARA 1 MATTOLE 1 BLACKFOOT 9ASSINIBOI 1 MENOMINI 1 CARRIER 22BANNOCK 1 MIAMI 3 CHILCOTIN 7BLACKFOOT 296 MIWOK 1 CHIPEWYAN 13CADDO 1 MODOC 1 CHIPPEWA 15CAHUILLA 1 MOHAVE 2 COMOX 5CHEMEHUEV 1 NAVAHO 254 COWICHAN 3CHEROKEE 517 NEZPERCE 1 DELAWARE 5CHEYENNE 133 NOMLAKI 1 DOGRIB 6CHINOOK 1 OMAHA 1 E CREE 9CHIPPEWA 321 OTTAWA 4 HAIDA 3CHOCTAW 321 PAPAGO 56 HAISLA 2COCHITI 1 PAWNEE 1 IROQUOIS 1COCOPA 1 PIMA 30 KASKA 5COEURD'AL 1 PONCA 1 KUTCHIN 6COMANCHE 147 POTAWATOM 167 KUTENAI 9COOS 1 PUYALLUP 2 KWAKIUTL 10CREEK 225 QUILEUTE 1 LILLOOET 9CROW 41 QUINAULT 1 MICMAC 60DELAWARE 1 S UTE 2 MONTAGNAI 9E CREE 1 SANTEE 1 NOOTKA 13E POMO 2 SHASTA 1 OJIBWA 118FLATHEAD 1 SHAWNEE 3 PLAINSCRE 78GOSIUTE 1 TENINO 1 POTAWATOM 3GROSVENTR 1 TETON 1 SHUSWAP 16HAIDA 67 TLINGIT 37 SLAVE 34HOPI 1 TSIMSHIAN 1 SQUAMISH 3HUPA 1 UMATILLA 1 STALO 15IOWA 1 W APACHE 305 TAHLTAN 3IROQUOIS 320 WASHO 1 THOMPSON 12JEMEZ 1 WICHITA 1 TLINGIT 3KALISPEL 1 WINNEBAGO 2 TSIMSHIAN 15KIDUTOKAD 1 WINTU 1KIOWA 38 YAQUI 68KLALLAM 1 YUCHI 1KLAMATH 1 YUMA 3KUTENAI 1 ZUNI 1LAGUNA 1 Total 3564 Total 546
United States Canada
23
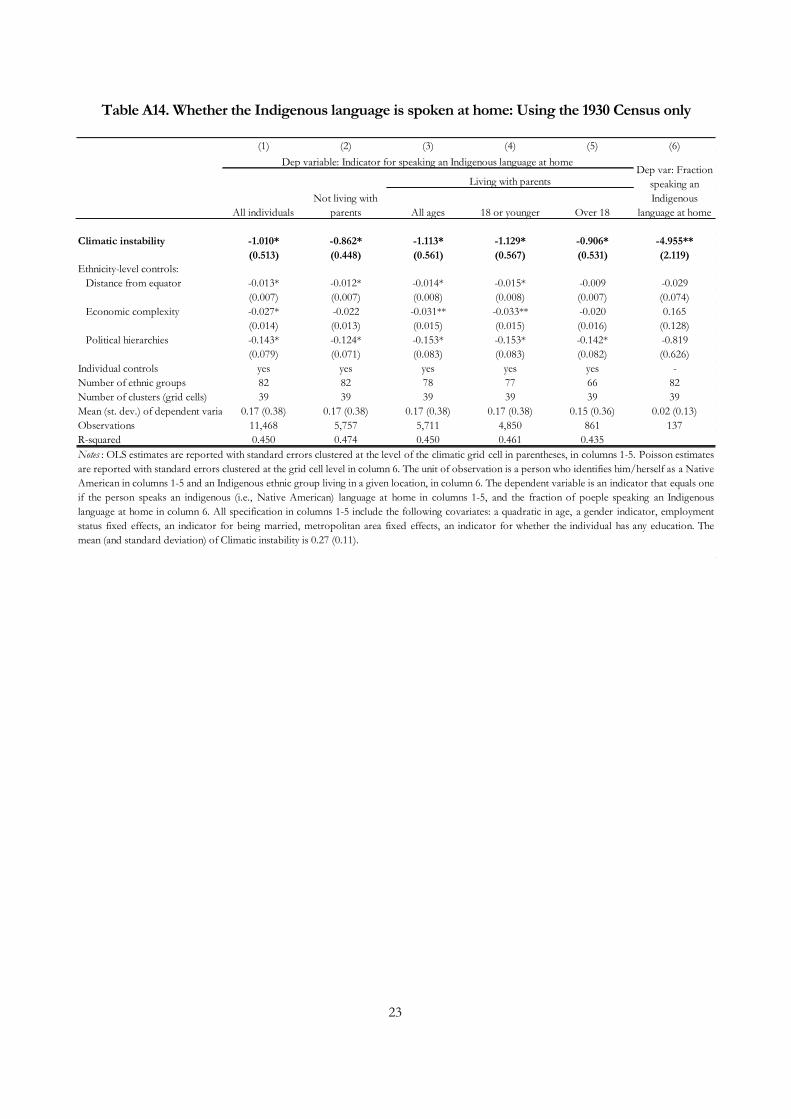
Table A14. Whether the Indigenous language is spoken at home: Using the 1930 Census only
(1) (2) (3) (4) (5) (6)
All ages 18 or younger Over 18
Climatic instability -1.010* -0.862* -1.113* -1.129* -0.906* -4.955**(0.513) (0.448) (0.561) (0.567) (0.531) (2.119)
Ethnicity-level controls:Distance from equator -0.013* -0.012* -0.014* -0.015* -0.009 -0.029
(0.007) (0.007) (0.008) (0.008) (0.007) (0.074)Economic complexity -0.027* -0.022 -0.031** -0.033** -0.020 0.165
(0.014) (0.013) (0.015) (0.015) (0.016) (0.128)Political hierarchies -0.143* -0.124* -0.153* -0.153* -0.142* -0.819
(0.079) (0.071) (0.083) (0.083) (0.082) (0.626)Individual controls yes yes yes yes yes -Number of ethnic groups 82 82 78 77 66 82Number of clusters (grid cells) 39 39 39 39 39 39Mean (st. dev.) of dependent variable 0.17 (0.38) 0.17 (0.38) 0.17 (0.38) 0.17 (0.38) 0.15 (0.36) 0.02 (0.13)Observations 11,468 5,757 5,711 4,850 861 137R-squared 0.450 0.474 0.450 0.461 0.435Notes : OLS estimates are reported with standard errors clustered at the level of the climatic grid cell in parentheses, in columns 1-5. Poisson estimatesare reported with standard errors clustered at the grid cell level in column 6. The unit of observation is a person who identifies him/herself as a NativeAmerican in columns 1-5 and an Indigenous ethnic group living in a given location, in column 6. The dependent variable is an indicator that equals oneif the person speaks an indigenous (i.e., Native American) language at home in columns 1-5, and the fraction of poeple speaking an Indigenouslanguage at home in column 6. All specification in columns 1-5 include the following covariates: a quadratic in age, a gender indicator, employmentstatus fixed effects, an indicator for being married, metropolitan area fixed effects, an indicator for whether the individual has any education. Themean (and standard deviation) of Climatic instability is 0.27 (0.11).
Dep var: Fraction speaking an Indigenous
language at home
Dep variable: Indicator for speaking an Indigenous language at home
All individualsNot living with
parents
Living with parents