web 2.0 in transportation: practices, utilization, and
TRANSCRIPT

WEB 2.0 IN TRANSPORTATION:
PRACTICES, UTILIZATION, AND POTENTIAL
by
Abdulkadir Ozden
A thesis submitted to the Faculty of the University of Delaware in partial fulfillment of the requirements for the degree of Master of Civil Engineering
Summer 2010
Copyright 2010 Abdulkadir Ozden All Rights Reserved

WEB 2.0 IN TRANSPORTATION:
PRACTICES, UTILIZATION AND POTENTIAL
by Abdulkadir Ozden
Approved: __________________________________________________________ Ardeshir Faghri, Ph.D. Professor in charge of thesis on behalf of the Advisory Committee Approved: __________________________________________________________ Harry W. Shenton III, Ph.D. Chair of the Department of Civil and Environmental Engineering Approved: __________________________________________________________ Michael J. Chajes, Ph.D. Dean of the College of Engineering Approved: __________________________________________________________ Debra Hess Norris, M.S. Vice Provost for Graduate and Professional Education

iii
ACKNOWLEDGMENTS
I am heartily thankful to my advisor, Dr. Ardeshir Faghri, who has
supported me throughout my study. Without his guidance, this thesis would never
have been possible. His continued guidance has enabled me to step beyond my
boundaries.
I also owe my loving thanks to my wife. She supported me in all respect
during the completion of the thesis. Without her encouragement and support it would
have been hard for me to complete this study.

iv
TABLE OF CONTENTS
LIST OF TABLES ........................................................................................................ vi LIST OF FIGURES ...................................................................................................... vii ABSTRACT .................................................................................................................. ix INTRODUCTION .......................................................................................................... 1
1.1. Problem Statement ..................................................................................... 3 1.2. Purpose and Objectives of the Study ......................................................... 3 1.3. Thesis Organization ................................................................................... 4
BACKGROUND: WHAT IS “WEB 2.0” ...................................................................... 5 2.1. Web 2.0 Technologies and Tools .............................................................. 6
2.1.1. Web-Based Applications ............................................................... 9 2.1.2. Social Networking Technologies and Tools ............................... 11 2.1.3. Collaborative Editing Technologies and Tools ........................... 13 2.1.4. Blogs ...................................................................................... 14 2.1.5. Social Bookmarking Tools .......................................................... 16 2.1.6. Photo/Video Sharing Technologies and Tools ............................ 17 2.1.7. Content Syndication Technologies and Tools ............................. 18 2.1.8. Calendaring Tools ....................................................................... 19 2.1.9. Synchronous Conferencing Technologies and Tools .................. 20 2.1.10. Tag Clouds .................................................................................. 22 2.1.11. Virtual Games .............................................................................. 23 2.1.12. Mashups ...................................................................................... 25
2.2. Advantages and Disadvantages of the Web 2.0 Technologies and Tools ..................................................................................................... 29
2.3. Summary of the Chapter .......................................................................... 30 WEB 2.0 APPLICATIONS IN TRANSPORTATION ................................................ 32
3.1. Information Dissemination Applications ................................................ 33 3.2. Transportation Planning Applications ..................................................... 40 3.3. Public Collaboration Applications .......................................................... 48 3.4. Social Networking Applications ............................................................. 52 3.5. Summary of the Chapter .......................................................................... 54
WEB 2.0 TECHNOLOGIES AND TOOLS UTILIZATION IN TRANSPORTATION: A SURVEY ................................................................ 56 4.1. Objective of the Survey ........................................................................... 56 4.2. Survey Design ......................................................................................... 57
4.2.1. Methodology ............................................................................... 57 4.2.2. Participants .................................................................................. 57
v
4.2.3. Questionnaire............................................................................... 57 4.3. Data Analysis ........................................................................................... 58
4.3.1. Participants’ Professional Experience ......................................... 58 4.3.2. Awareness and Usage of Web 2.0 ............................................... 61 4.3.3. Agency Information .................................................................... 74
4.4. Results ..................................................................................................... 79 4.5. Summary of the Chapter .......................................................................... 81
COMMUTER INFORMATION SYSTEM (CIS): WEB 2.0 UTILIZATION IN CONGESTION MANAGEMENT ................................................................... 82 5.1. Commuter Information System (CIS) ..................................................... 83
5.1.1. CIS - Traffic Information Database ............................................. 83 5.1.2. CIS - Commuter Information Database ....................................... 85 5.1.3. CIS - Social Networking ............................................................. 88
5.2. Developing and Implementing the CIS: A Theoretical Framework ....... 89 5.3. Summary of the Chapter .......................................................................... 94
POTENTIAL OF THE WEB IN TRANSPORTATION: WEB 2.0 AND BEYOND ......................................................................................................... 95 6.1. Short-term Potentials ............................................................................... 97 6.2. Long-Term Potentials .............................................................................. 99 6.3. Summary of the Chapter ........................................................................ 102
SUMMARY, CONCLUSIONS AND RECOMMENDATIONS .............................. 103 7.1. Summary of Findings ............................................................................ 103 7.2. Conclusions ........................................................................................... 105 7.3. Recommendations ................................................................................. 107

vi
LIST OF TABLES
Table 4.1 Awareness of Web 2.0 Technologies and Tools .................................... 62
Table 4.2 Usage of Web 2.0 Technologies and Tools ............................................ 64
vii
LIST OF FIGURES
Figure 2.1 Role of the Web Users ............................................................................ 7
Figure 2.2 An Example of Tag Cloud ..................................................................... 22
Figure 2.3 Registered Motor Vehicle (per person) and Road Accident Death (per 100,000) in 1995 ............................................................................. 27
Figure 2.4 Registered Motor Vehicle (per person) and Road Accident Death (per 100,000) in 2006 ............................................................................. 28
Figure 2.5 Registered Motor Vehicle (per person) and Road Accident Death (per 100,000) Change Tracking Between 1990 and 2006 for State of Delaware ............................................................................................ 29
Figure 3.1 Screenshot of MassStats ......................................................................... 38
Figure 3.2 Screenshot of FlightRadar 24 Web Site ................................................. 40
Figure 3.3 Screenshot of Build a System Tool ........................................................ 43
Figure 3.4 Screenshot of Go To 2040 Invent 2040 ................................................. 46
Figure 4.1 Respondent’s Profession ........................................................................ 59
Figure 4.2 Respondent’s Organization Type ........................................................... 60
Figure 4.3 Respondent’s Age Profile ....................................................................... 60
Figure 4.4 Ways of Using Web 2.0 Technologies and Tools .................................. 65
Figure 4.5 Effectiveness of Web 2.0 on Transportation Modes .............................. 66
Figure 4.6 Effectiveness of Web 2.0 on Transportation Study Areas ..................... 67
Figure 4.7 Most Effective Web 2.0 Technologies and Tools in Different Transportation Study Areas .................................................................... 69
Figure 4.8 Web 2.0 Utilization Frequency of Transportation Professionals ........... 71

viii
Figure 4.9 Advantages of Web 2.0 Technologies and Tools ................................... 72
Figure 4.10 Disadvantages of Web 2.0 Technologies and Tools .............................. 73
Figure 4.11 Web 2.0 Utilization in Respondents’ Agencies, Organizations and Institutions .............................................................................................. 75
Figure 4.12 Web 2.0 Investment in Respondent’s Agencies, Organizations and Institutions .............................................................................................. 77
Figure 4.13 Evaluation of Agencies’ Investment in Web 2.0 Technologies and Tools ....................................................................................................... 78
Figure 4.14 Usage of Web 2.0 Technologies and Tools in Transportation Agencies ................................................................................................. 79
Figure 5.1 Concept Map of the CIS ......................................................................... 91
Figure 5.2 Implementation Steps of the CIS ........................................................... 92

ix
ABSTRACT
Advances in information and communication technology have changed
many aspects of our life. Since the invention of the World Wide Web, thousands of
miles became seconds in terms of reaching and using information and communicating
with people. However, there were still gaps for creating an interactive communication
and collaboration environment. In 2004, Web 2.0 was introduced as a new version of
the World Wide Web (WWW), not in terms of technical specifications but in the ways
of communication and usage. With the Web 2.0 technologies such as web-based
applications, social-networking platforms, photo/video sharing, wikis, blogs, content
syndication applications, mashups, and synchronous conferencing applications, web
sites turn into interactive and dynamic platforms from static information providers.
Recent applications show that transportation industry has been adapting to
the evolution of web technologies. In this study, Web 2.0 technologies and tools are
explained in detail with the popular examples within and without the transportation
field to emphasize the effectiveness and capabilities of the new version of the World
Wide Web. Usage of Web 2.0 in different transportation areas such as transportation
planning, public transit and public relations are presented with successfully
implemented applications.
Additionally, utilization of Web 2.0 tools and applications by
transportation professionals are examined with a national level survey. The survey is
designed to gather information from transportation professionals about their
familiarity with Web 2.0, the ways Web 2.0 is used in transportation, the most used
Web 2.0 technologies and tools in different transportation study areas, and the
utilization of Web 2.0 technologies at the institution/agency/organization levels. 1080
transportation professional were contacted from across the U.S. and 137 of them

x
participated in the survey. Survey results demonstrate that 71% of transportation
professionals are aware of Web 2.0 technologies. However, only 24% of respondents
utilize Web 2.0 for professional purposes and 28% of them for personal reasons. Also,
participants’ responses indicate that Web 2.0 technologies are highly effective in
transportation planning, transportation education and public relations areas.
After introducing Web 2.0 and presenting practices in transportation area,
a Commuter Information System (CIS) is proposed to improve the congestion
management by utilizing Web 2.0. CIS, which will provide real-time information to
daily commuters, is aiming at relieving the effects of the congestion by informing
drivers before and during their trips. CIS utilizes Web 2.0 to facilitate commuter data
entry and information dissemination, and provides communication and collaboration
environment for the public.
Finally, future potential of Web 2.0 and the next step, Web Squared, are
discussed. Because web technologies are changing rapidly, 3-5 years predictions are
presented. In this perspective, smart computers and devices are expected to be the
most significant change in near future.
1
Chapter 1
INTRODUCTION
Due to the advances in technology, usage of web applications in
transportation has been increasing. Information and communication technologies have
changed from one-way data and information stream to two way data and information
sharing beginning from the 2000s with the emergence of Web 2.0 technologies.
Transportation planning, operations, public relations and information dissemination
have become easier, faster, and more affordable with this new way of communication
by increasing the collaboration between professionals and non-professionals,
providing intra and cross-agency collaboration, reducing planning time and cost, and
encouraging public involvement.
The web is an opportunity for transportation agencies to provide results of
the transportation studies to the public [1]. The 2005 Safe, Accountable, Flexible,
Efficient Transportation Equity Act: A Legacy for Users (SAFETEA-LU) mandates
that metropolitan planning organizations (MPO) should disseminate information and
data via Internet by using visualization techniques in terms of public involvement
which is an essential element of the transportation planning process [2].
Since the invention of the internet, web developers have been in a
competition of creating more useful and usable applications. The new version of the
WWW, Web 2.0, has increased the amount of information available and has enabled
active web users to create, change and share custom-made web content [3]. User
friendly, accessible and mostly free applications are preferred by users to contribute to

2
the creation of the new data age. Therefore, success of the applications comes with the
“operating by new rules”. According to Jarvis [4], new rules of the new age for
adapting to the social media are:
• Customers are now in charge. They can be heard around the globe and
have an impact on huge institutions in an instant.
• People can find each other anywhere and coalesce around you—or against
you.
• The mass market is dead, replaced by the mass of niches.
• “Markets are conversations,” decreed The Cluetrain Manifesto, the
seminal work of the internet age, in 2000. That means the key skill in any
organization today is no longer marketing but conversing.
• We have shifted from an economy based on scarcity to one based on
abundance. The control of products or distribution will no longer guarantee a
premium and a profit.
• Enabling customers to collaborate with you—in creating, distributing,
marketing, and supporting products—is what creates a premium in today’s
market.
• The most successful enterprises today are networks—which extract as
little value as possible so they can grow as big as possible—and the platforms
on which those networks are built.
• Owning pipelines, people, products, or even intellectual property is no
longer the key to success. Openness is.

3
1.1. Problem Statement
Until the advent of the Internet, the most appropriate ways of information
dissemination were printed materials such as books, reports and articles, paper maps,
and media tools such as TV, radio, and newspaper. As a milestone in communication
technology, the Internet has facilitated communication, collaboration and information
dissemination in all parts of our life. After a decade, an updated version of the WWW,
Web 2.0, came to the stage to increase the effectiveness of the Internet.
However, transportation industry has not adapted to the web
developments as much and as fast as education and marketing industry. For this
reason, Web 2.0 technologies and tools need to be explored for use in transportation.
This study is aimed at providing a source of information regarding the effect of Web
2.0 to transportation.
1.2. Purpose and Objectives of the Study
The purpose of the study is to present the Web 2.0 technologies and tools,
providing applications in transportation areas, presenting the current web technology
familiarity of the transportation professionals by conducting a national level survey,
and developing a theoretical framework for daily commuters. The study explores the
potential of the current and future’s web technologies, Social Media and Web
Squared.
The following questions constitute the objectives of the study:
• What effect do the Web 2.0 technologies have on the transportation?
• What Web 2.0 technologies and tools are being used in transportation
areas? Are they effective? What is the future potential of Web 2.0?

4
• How much do transportation professionals and transportation agencies
currently utilize Web 2.0 technologies? Are they aware of Web 2.0
and the potential of it?
• How can we utilize Web 2.0 in congestion management?
• What does the future hold for applying Web 2.0 or Web Squared in
different transportation problems?
1.3. Thesis Organization
The thesis is organized into 7 chapters.
In Chapter 2, Web 2.0 technologies and tools are described in detail for
providing background information. The chapter is introduced by definition and history
of Web 2.0. Then, Web 2.0 technologies and tools are explained with the most popular
and successfully implemented examples.
In Chapter 3, existing Web 2.0 applications in transportation area are
presented in 4 categories: information dissemination, transportation planning, public
collaboration and social networking applications.
In Chapter 4, results of a survey, which is conducted to better understand
the utilization of Web 2.0 technologies and tools by transportation professionals and
agencies, are analyzed.
In Chapter 5, the Commuter Information System (CIS), which is aimed at
improving congestion management by utilizing Web 2.0 tools and applications, is
presented.
In Chapter 6, the potential of Web 2.0 for transportation is discussed.
Possible developments and utilization are presented.
In Chapter 7, summary of the study and recommendations are given.

5
Chapter 2
BACKGROUND: WHAT IS “WEB 2.0”
The innovation of the World Wide Web (WWW) by Tim Berners-Lee in
1991 was the first step of the web technology. In the beginning, only static
information could be uploaded by hand to a web browser, and mostly small size of
images or graphs could be used because of low-bandwidth modem connections [5].
Starting from 1996, interactive communication started to become available through
Web that promoted e-commerce and instant communications. In the beginning of
2002, information sharing and exchanging with new applications (later called Web
2.0) such as Weblogs and RSS was becoming popular [6], which was the turning point
for the Web.
Darcy DiNucci [7] was the first who used the term Web 2.0 in her
article called “Fragmented future” in 1999. She stated that “the first glimmerings of
Web 2.0 are beginning to appear, and we are just starting to see how that embryo
might develop” (p.32). Later in 2003, the concept of Web 2.0 came forward for a
conference by O’Reilly Media Group and its partner Media Live. They started the
Web 2.0 conference to draw attention to new developments on the web and
technologies. Tim O’Reilly and John Battelle defined Web 2.0 to expand the term.
The most popular Web 2.0 applications are Google, Yahoo, Facebook, Wikipedia and
e-commerce properties Amazon and eBay [5]. O’Reilly and Battelle stated the
development of web [8]: “1990-2004 was the match being struck; 2005-2009 was the
fuse; and 2010 will be the explosion”.
6
Like many other areas, the transportation industry has increasingly
employed Web 2.0 technologies and tools. Although Web 2.0 technologies and tools
are not generally being used as a single tool or application in the transportation area,
many transportation studies, planning processes and projects include a combination of
the multiple tools for being more effective, collaborative and creative. This chapter
introduces Web 2.0 technologies and tools with successfully implemented
applications. Examples in this chapter are mostly aimed at describing Web 2.0
technologies and tools and most of the examples are out of the transportation area.
Applications in the transportation area are presented in Chapter 3.
2.1. Web 2.0 Technologies and Tools
It is hard to define what exactly Web 2.0 is because it is a “gravitational
core” rather than a concept with “hard boundaries” according to O’Reilly, inventor of
the term [9]. Defining the characteristics and capabilities of Web 2.0 would be better
than giving a single simple definition. However, most sources use the definition in
Wikipedia [10] which is “Web 2.0 is commonly associated with web applications that
facilitate interactive information sharing, interoperability, user-centered design, and
collaboration on the World Wide Web (WWW)”.
Web 2.0 started with a brainstorming session between O’Reilly and
MediaLive International in 2004 [9], [11]. After analyzing several web-based
companies which survived from 2001 crises, O’Reilly and his team realized the
importance of user-generated content and sparked the new version of the World Wide
Web, Web 2.0 [11]. From “user-generated” point of view, network effect is an
essential element of Web 2.0. Gehl [11] explains the network effect with a simple
example: If someone owns a telephone and no one else does, the ownership of the

7
telephone will not be practical because it is not allow the user to communicate with
anyone. For this reason the common expression highlights importance of the network
effect: “as more people use, more valuable it will be”. Additionally, O’Reilly and
Battelle [8] emphasize the importance of users in terms of the power of the network
effect: “Web 2.0 is all about harnessing the collective intelligence.”
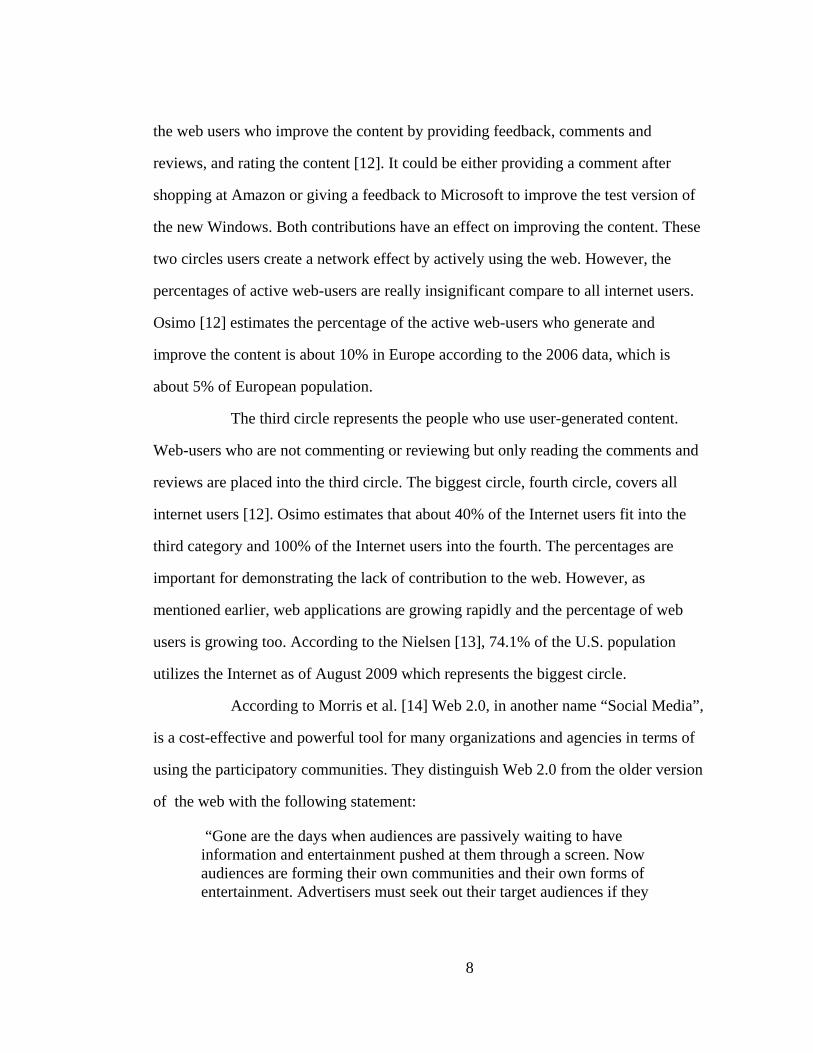
Osimo [12] characterizes the role of the web users in four categories in
Figure 2.1.
Figure 2.1 Role of the Web Users [12]
In this figure, the smallest circle represents users who take an active role
in creating, designing and providing the content. The second biggest circle represents
8
the web users who improve the content by providing feedback, comments and
reviews, and rating the content [12]. It could be either providing a comment after
shopping at Amazon or giving a feedback to Microsoft to improve the test version of
the new Windows. Both contributions have an effect on improving the content. These
two circles users create a network effect by actively using the web. However, the
percentages of active web-users are really insignificant compare to all internet users.
Osimo [12] estimates the percentage of the active web-users who generate and
improve the content is about 10% in Europe according to the 2006 data, which is
about 5% of European population.
The third circle represents the people who use user-generated content.
Web-users who are not commenting or reviewing but only reading the comments and
reviews are placed into the third circle. The biggest circle, fourth circle, covers all
internet users [12]. Osimo estimates that about 40% of the Internet users fit into the
third category and 100% of the Internet users into the fourth. The percentages are
important for demonstrating the lack of contribution to the web. However, as
mentioned earlier, web applications are growing rapidly and the percentage of web
users is growing too. According to the Nielsen [13], 74.1% of the U.S. population
utilizes the Internet as of August 2009 which represents the biggest circle.
According to Morris et al. [14] Web 2.0, in another name “Social Media”,
is a cost-effective and powerful tool for many organizations and agencies in terms of
using the participatory communities. They distinguish Web 2.0 from the older version
of the web with the following statement:
“Gone are the days when audiences are passively waiting to have information and entertainment pushed at them through a screen. Now audiences are forming their own communities and their own forms of entertainment. Advertisers must seek out their target audiences if they
9
wish to communicate their messages. Traditional media are now being called, “Old Media.”
The following sections present the Web 2.0 applications and tools with
successfully implemented examples in twelve categories.
2.1.1. Web-Based Applications
Web-based applications are eliminating the dependency on desktops by
providing access to the various applications through the web. Advanced web
technologies enabled people to utilize both simple and advanced applications such as
Google Docs, Microsoft Office Live Workspace, Crazy Egg, Phonevite and Mint.
These online web-based applications are becoming more available and more popular
day by day. According to Angelo et al. [15], there are many advantages of web-based
applications and a few of them are:
Low software requirements: Web applications use the system Software as
a Service (SaaS) which only requires a browser. In these applications, maintenance
will be managed by the application provider such as Google, Microsoft, etc.
Application providers manage maintenance and guarantee the possible content
changes and user faults in reasonable limits.
Content Ubiquity: Content only depends on accessibility of the Internet
and a web browser. Meeting these two requirements provide accessibility to the data,
documents and spreadsheets anytime and anywhere.
Collaboration: Web-based applications are also a great example of
collaboration. By using the AJAX (the technical ingredient of the Web 2.0) behind the
application, collaboration becomes almost real-time editing.
Document creating and sharing is a popular field for web-based
application developers. Web office suites are ubiquitous and user-friendly applications

10
which do not require software to access the applications. There were not too many
web-based applications in the transportation area due to the size and complexity of the
programs which need powerful processors and computers. However, developments in
technology have reduced these downsides. Office Live and Google Docs are the most
popular applications of online office suites and Mint is the merged application of the
Citilabs in transportation area.
Office Live Workspace (is created and powered by Microsoft) and Google
Docs (is created and powered by Google) provide a web-based online environment to
create, view, store and share data and documents without any software needed. Both
applications require only an internet connection and a web browser to serve users. As
mentioned earlier, there are many advantages of online web-based applications such
as storing thousands of documents and files without any cost, accessing the data from
anywhere and anytime easily, collaborating by real time editing, managing the shared
documents (only viewable, or editable by other users), and having the files protected
by the application provider.
Mint is one of the leading cloud-based modeling applications in the
transportation industry. Provider of the web-based planning platform, Citilabs, defines
the Mint with the following statement:
“Mint is a cloud-based, hosted scalable platform for transportation modeling that provides governments and consulting firms with software-as-a-service (SaaS) benefits. In other words, Mint is a “no software” solution.” [16]
Mint allows users to conduct different transportation simulation processes
and share them without using any software. “No software” solution also eliminates the
accessibility problem to the transportation modeling and forecasting programs by
providing an online environment which is accessible from anywhere [16].
11
One of the leading transportation planning software providers, Citilabs,
has adjusted itself to the advances in advanced web technology by Mint. This notable
step also points out the upcoming trend in transportation industry in terms of software
development.
2.1.2. Social Networking Technologies and Tools
Online social networking is one of the new trends in our daily life.
Millions of users and billions of posts attest to the popularity of the social networking
technologies. Creating profiles, posting updates, sharing photos and videos, adding
notes, creating and advertising events, sending messages, commenting to other’s
posts, and keeping in touch with friends are just a few features of social networking
tools. Facebook, Twitter (which is also known as microblogging), MySpace, and
LinkedIn are some famous social networking sites and applications.
The popularity of the online social networking offers the idea of using it
professionally for communication and collaboration. One common idea is using
current social networking tools and sites in more professional ways while the other
idea is creating new social networking, collaboration and communication tools only
for specific purposes such as research database. There are many Facebook and Twitter
pages which are created and operated by transportation departments, institutions and
agencies to build an online communication environment such as Texas Department of
Transportation (TxDOT)’s Facebook page and Transportation Research Board
(TRB)’s Twitter page. Since the 2000s, especially with Web 2.0 technologies,
information dissemination and communication has gained a new dimension. The main
reason for using social networking sites by transportation agencies is to reach people
via the most common tools they are using.
12
Social networking applications are also effective tools for researchers.
Even though Web 2.0 technologies and tools provide unlimited sources and options in
terms of collaboration, purely social networking sites such as Facebook and Twitter
and professionally-social networking sites such as LinkedIn and ResearhGate are not
being used effectively by the research community [17]. However, the potentiality and
popularity of online social networking forced institutions to invest in creating new
applications and using current resources effectively. According to Maxmen [17],
National Institutes of Health (NIH) awarded $27 Million Recovery Act (ARRA) fund
for developing social networking sites for researchers. Two teams, from University of
Florida and Harvard University, have been developing social networking applications
only for scientists with the ARRA fund.
Popularity of the social networking applications might change place to
place. For example, some social networking sites are very popular in Europe like
Bebo, some in East Asia like Cyworld, some in South America and India like Orkut
[3]. However, Twitter, Facebook and MySpace are the most common social
networking applications throughout the world.
In terms of agencies and companies, using social networking sites is a
tremendously effective way to build an environment for communication and
collaboration with the public. Easy to follow, less officiality, and time and place
flexibility would be the positive sides of social networking in terms of the public.
However, from transportation agencies point of view, monitoring and managing a
social networking application needs time and effort to make it usable and useful.
13
2.1.3. Collaborative Editing Technologies and Tools
Collaborative editing is one of the most important and common Web 2.0
practices. The simplest definition of collaborative editing is “editing a document
simultaneously”. Purposes of collaborative editing tools are developing the content,
increasing the collaboration, and augmenting an online community. Individuals from
different locations, different backgrounds and different professions are able to work
collaboratively to improve the quality of work [18].
As Noveck [19] explains,
“Ordinary people, regardless of institutional affiliation or professional status, possess information – serious, expert, fact-based, scientific information – to enhance decision-making, information not otherwise available to isolated bureaucrats. Partly as a result of the simple tools now available for collaboration and partly as a result of a highly mobile labor market of ’knowledge workers,’ people are ready and willing to share that information across geographic, disciplinary and institutional boundaries”.
Some successfully implemented collaborative editing applications are
presented below:
Intellipedia, a collaborative editing system used by United Stated
Intelligence Community (IC), is a remarkable example of collaborative editing
applications. The system enables intelligence community analysts to share information
and data in three different classification levels: unclassified, secret and top-secret [20].
Intellipedia was started with an award-winning paper by Calvin Andrus, a CIA
employee, in 2004 and formally introduced in April 2006. According to Vogel and
Central Intelligence Agency (CIA) web page, there were 15,000 daily contributions,
about 900,000 pages and 100,000 user accounts in 16 different intelligence agencies
as of August 2009 [20], [21].

14
Intellipedia created an online environment to share information and data
between the intelligence agencies’ employees without dependency on the institutions
and agencies. Osimo [12] describes the Intellipedia, wiki-based information system,
that users from different agencies can create group reports collaboratively. They can
also express critique and dissenting opinions in the system.
Peer to Patent, created by New York Law School and endorsed by
United States Patent and Trademark Office, is an online system that improves
reviewing process of patent applications. Collaboration of participants improves the
quality of projects, reduces the reviewing process time, and promotes peer to peer
interaction between innovators. Osimo [12] states that Peer to Patent improves the
current patent examination process which is not efficient and fast because it requires
advanced knowledge and has excessive applications.
Cyclopath created and operated by GroupLens Research at the University
of Minnesota, is a great example of public collaboration in the Minneapolis area. It is
a map mashup application in which users can edit the map. Individuals can enter
routes they experienced, share problems they faced on the roads, rate trails and roads
and inform other people by using the web site. The purpose of the application is to
create a community for bikers to share cycling knowledge, route information and
personal bikeability ratings for the Minneapolis area [22]. Rating the content, one of
the popular and effective features of Web 2.0 technologies, helps bikers to find the
best route or trail in the area.
2.1.4. Blogs
Definition of the blog (weblog) is “a personal web site that provides
updated headlines and news articles of other sites that are interest to the users also

15
may include journal entries, commentaries and recommendations compiled by the
user.” However, in addition to the personal usage, last applications and practices show
that blogs can be used by governmental institutions, agencies and organizations to
facilitate communication and information dissemination. The official blog of the U.S.
Secretary of Transportation, Fastlane; Transportation Security Administration’s blog,
The TSA Blog; and the blogs created by groups of peoples in order to establish a
community to discuss transportation related issues, Greater Greater Washington,
StreetBlog, and many others prove the increased usage of blogs in transportation area,
even by institutions. Regarding the target audience and content provider, blogs can be
named as personal blogs, expert blogs (managed by a group of people), local blogs,
local advocacy blogs and national blogs [14].
Blogs include “timestamped information in reverse chronological order”,
the content of which could be cited, paraphrased or linked from outside sources [23].
The following prominent examples describe objectives of some blogs briefly:
Greater Greater Washington is a blog of residents of the Greater
Washington Area. The goal of the blog is to create a community including
professionals, experts and general public for providing information and ideas to the
officials to improve the livability of the area [24].
LivableStreets is “an online community for people working to create
sustainable cities through sensible urban planning, design, and transportation policy”.
The web-based system which includes sub-pages for blogging, video sharing and
education, is an open source application about different planning, design and
transportation issues such as: transportation and urban planning policies, innovations,
climate change, sustainability and congestion [25].
16
Fastlane, the official blog of the U.S. Secretary of Transportation, is an
online environment that provides transportation news from the first hand. In addition
to information dissemination, visitors can make comments, and rate and share the
content with others which are the advantages of Web 2.0 [26].
MyBikeLane is another example of blogs created by a citizen who feels
responsible himself for illegal parking on bike lanes. In the web site, cyclists post
photos of cars which are inappropriately parked on a bike lane and thereby publishing
plate numbers of the cars. Information about the photos (where and when taken) and
cars (pictures and plate number) are pointed on a map by using Google Maps powered
application [12], [27].
Blogs are one of the most used and adopted Web 2.0 applications in
transportation area. Currently, there are many transportation related blogs and the
number of the blogs is increasing day by day.
2.1.5. Social Bookmarking Tools
Social bookmarking is storing and managing the most used or visited web
pages and sharing them with others. The old way of bookmarking was simply storing
the data in a specific computer in which the data was bookmarked. With the advanced
technology, people can store their bookmarks in their e-mail accounts and reach them
via internet all time. However, today, not only we can store the bookmarks, but also
we can tag and organize them in any way we like. We can also encourage people and
increase the popularity of web sites that we bookmarked by using social bookmarking
applications [5].
17
There are many social bookmarking applications and some of them are:
Delicious, Digg, Stumbleupon, and Faves. The following social bookmarking tools are
slightly different from each other. Objectives, usage and user types of some
applications are described below briefly:
Delicious is one of the most popular social bookmarking applications
which allows users to bookmark the web pages and tag them in any way they like. By
bookmarking a web page, users can see how many people and who bookmarked the
same page. Also, the system allows users to see the bookmarks of other people [28].
Digg is more of a news following and sharing application in terms of
purposes. The process of bookmarking and sharing is very similar to delicious. The
main idea of Digg application is to determine the value of the content by user
contribution [29]. This means, the more people “dig” the page, the more popular it
will be.
2.1.6. Photo/Video Sharing Technologies and Tools
Photo and video sharing applications and web sites provide opportunity to
publish, store and share photos and videos by using the Internet. Moreover,
applications which are compatible with cell phone operating systems facilitated the
process of sharing with cell phones. There are hundreds of thousands of videos and
photos that are added to cyber space via web sites every day. Youtube and Google Videos
are the most popular video sharing applications while Flickr and Picasa are for photo
sharing.
Although many of the photos and videos are created and published for fun
or for personal reasons, there are also some professional usages of the system. For
example lectures, conferences, and presentations are previously recorded and
18
published on the web sites. Also innovative technology simulation videos about future
technologies and transportation; descriptive videos to inform people about “how to
make” issues; and product advertisements, applications and application instruction
videos are the other professional usage instances.
Like some other professional areas, video and photo sharing technologies
are being used in transportation. Maryland State Highway Administration’s video
channel provides videos about projects they conduct and informative videos about
Maryland highways and issues they have faced [30]. Virginia DOT, Washington State
DOT, North Carolina DOT, Nashville Area MPO and many other transportation
agencies are using video channels to inform residents.
Washington State DOT uses Flickr to publish and share transportation
project improvement photos, construction photos and historical transportation related
photos on their Flickr site [31]. In addition to the informing the public about projects,
proving the construction progress with photos increases the trustworthiness and
transparency of the agency.
Photo sharing applications such as Flickr focus on uploading, organizing
and sharing photos online to increase the accessibility. Using the tagging system to
organize photos improves the manageability by classifying them according to the
content. Tagging also increases the accessibility of the photos by others if they are
open to the public [14]. By simply searching a word in Picasa or Flickr, users are able
to reach all photos tagged with the search word.
2.1.7. Content Syndication Technologies and Tools
Content syndication technologies are one of the most effective ways of
following the content from different websites, blogs and online newspapers without

19
using search engines, without entering multiple websites, and most importantly
without spending extra time. Web syndication is a form of information distribution to
make content of the website available for other websites. These applications convert
one’s website or one’s computer to an information hub by collecting the news,
articles, and updates from other websites that one subscribed to based on your
interests. RSS, Google Reader, Bloglines, NewsGator, and iTunes Podcast are the
most popular content syndication applications with some differences and nuances.
There are benefits of using content syndication technologies for both
webmasters and web surfers. By using content syndication tools like RSS,
webmasters can update the content and provide recent news and articles easily to their
users. In terms of web surfers, minimizing the time to access the information, getting
summarized and categorized information and locating the information easily are the
benefits of using content syndication technologies [32].
Podcasting is a little different than RSS based content following
applications in terms of final product. Podcast provides audio and/or video following
via syndication. By simply subscribing to the web sites or audio/video providers, users
can download the available latest audio and video files by using the software
applications. Apple’s iTunes is the most popular example of podcasting [14].
2.1.8. Calendaring Tools
Calendars are a must-have part of most professionals’ daily life. Meetings,
conferences, holidays, tax returns, insurance, and payment dates, may be forgotten in
our busy lives. Since the increased usage of personal computers, people started to
organize the important dates in their computers. However, accessibility to the
computers and manipulating the events in the calendar without the personal computer

20
was the main issue in terms of effective usage. After the developments in domain
services such as Google Calendar and Yahoo Calendar, calendars become more
accessible via the internet.
Internet-enabled smart phones open up a new era in terms of accessibility
and synchronization. Adding a new event to the calendar either using cell phones or
computers and getting notification via SMS, email or phone alerts increases the
effectiveness of the calendaring applications. Users may also synchronize calendars
between different applications such as Google Calendar and Microsoft Outlook
Calendar. There is a wide usage of calendaring tools for intra-agency collaboration in
many institutions, departments, agencies, and companies.
2.1.9. Synchronous Conferencing Technologies and Tools
Working collaboratively in small task groups, which is a usual practice of
professional life, is one of the effective ways of increasing the quality of the final
product. Synchronous conferencing tools and applications increase the effectiveness
of the participants by eliminating dependency on the location and providing an online
environment for communication and collaboration [33]. Arranging a time and having a
computer with an internet connection are the only requirements of organizing an
online meeting or conference, even for hundreds of people. Recent synchronous web
conferencing tools like Dimdim does not even require software to provide video
conferencing. The only requirement is a web browser [34].
There are different applications of synchronous conferencing such as
webinars, audio and video conferencing, online chat, shared whiteboard, application
sharing, data conferencing, and instant messaging [33].

21
Skype, Google Talk, and Windows Live Messenger are the most common
synchronous conferencing tools since the early 2000s. They have provided chat,
instant messaging, and audio/video conferencing. Common usage purpose of these
tools is providing social interaction between people. However, recent web
conferencing applications bring a new dimension to synchronous collaboration.
Professionally designed applications for web conferencing such as Dimdim and
WebEx, provide an online environment which is almost like a classroom meeting.
Meeting instantly, sharing desktop with others, using webcams and chat, recording
and embedding the meeting, and mashing it up are some features of using one of the
awarded web conferencing tools, Dimdim [34].
In terms of transportation, online conferencing applications such as
webinars are becoming more popular to facilitate the collaboration and
communication. Transportation institutions like Transportation Research Board (TRB)
and Institution of Transportation Engineers (ITE), software developers such as ESRI
and Citylabs are using synchronous conferencing technologies (mostly webinars) to
provide meetings, lectures, and sessions to their users.
Although there are many advantages of synchronous conferencing
applications to increase the communication and collaboration, there are also some
downsides to the system. Possible internet connection problems and computer
troubleshooting are some of the possible technical problems. Not using the body
language effectively and loosing eye contact are also downsides of the synchronous
conferencing applications. However, saving time and money, not travelling long
distances, not encountering traffic and parking problems and location flexibility are
the benefits of using synchronous conferencing applications.

22
2.1.10. Tag Clouds
Tag cloud is the content visualization of a web page in different types:
most used word frequencies, most popular word frequencies and subcategory
frequencies. Most used type of the tag clouds show the 20+ words from the content of
the web site to visually present the frequencies as shown in Figure 2.2. So, the biggest
size represents the most used or hit word on the website. The goal of the tag clouds is
to give a big picture from the web site. Figure 2.2 provides an example of a tag cloud
from ZeroStrategist.com web site [35].
Figure 2.2 An Example of a Tag Cloud [35]
Application in the following web site shows the effectiveness of a tag
cloud. < http://chir.ag/projects/preztags/ > A graduate student created this tag cloud
application by using the speeches, official documents, declarations, and letters written
by the presidents of the United States between 1776 and 2007. Most used words in the
documents represent the bigger sizes. By simply moving the slider from left to right in

23
the web site, the dominant words give an idea of the agenda of the presidents at that
time. For example, “Constitution”, “Mexico” and “war” were dominant between 1845
and 1850; “Spain” and “Cuba” between 1897 and 1900; “economy”, “Japanese” and
“war” between 1945 and 1948; and “terrorist”, “weapon” and “war” since 2001 [36].
2.1.11. Virtual Games
A virtual environment is a computer-generated, three-dimensional
representation of a setting which could be used for different purposes such as games,
simulations and even education. Virtual worlds are the next level in social networking
by using avatars. Although they are called “games” because of the computer based
unreal representation, virtual worlds are beyond the game. Aldrich’s [37] statement
about the virtual worlds helps us to better understand the dimension beyond the game:
“Games are fun, engaging activities usually used purely for entertainment, but they may also allow people to gain exposure to a particular set of tools, motions, or ideas. In contrast, simulations use rigorously structured scenarios carefully designed to develop specific competencies that can be directly transferred into the real world.”
Aldrich [37] likens the virtual environments to swimming pools for
children in terms of learning and practicing actions before the real world. There are
many virtual games designed for different fields. Some of them are: SimCity Series by
Electronic Arts for urban planning and social psychology, Sid Meier’s Civilization
Series by Firaxis for history and social sciences, and Zoo Tycoon by Microsoft for
planning and economics.
There are many agencies, organizations and universities who are seriously
taking action in virtual worlds. For example, University of Delaware has a campus in
Second Life and also provides lectures, meetings, discussions, seminars, and radio

24
programs occasionally. Some of the events are regularly performed through the virtual
worlds [38].
Another great example from transportation area is Los Angeles
Metropolitan Transportation Authority in Second Life. Metro is one of the leading
transportation authorities in SecondLife. It provides a transportation library, gives
links to Metro maps and Trip Planner via Google Transit, presents a historical
photography collection, and offers a link to contact Metro [39]. Los Angeles
Metropolitan Transportation Authority [40] stated the reasons for utilizing Second
Life:
“Second Life is a rapidly growing application for libraries, academia, and government entities. Participation in Second Life and our mission go hand in hand. Visual literacy is an important skill which continues to grow in the increasingly technological aspects of our daily lives. It enhances our ability to demonstrate, share, and collaborate with others who are not physically nearby.”
Virtual games and simulations have been used by U.S. military for
teaching, socializing and training purposes for decades. According to the U.S. Army
Simulation, Training and Instrumentation Command, Michael Macedonia [41],
Department of Defense has been using games and simulations to build teams and
improve skills. Macedonia emphasizes the determination of the U.S. military in terms
of the importance of the simulations and games: “The United States has incorporated
war gaming and simulation into the curriculum of every war college and into the
operations of every commander-in-chief (CINC) headquarters”[41].
Examples and applications show the effectiveness and capabilities of the
simulations and virtual games. In terms of transportation, more consideration should
be given to games and virtual worlds to understand their capabilities. Comparing the

25
old version traffic simulations in 1990s and recent simulation techniques exposes the
importance of the virtual worlds. Capabilities of current traffic simulation models such
as Vissim show that the simulation industry will almost imitate real-world situations.
Driver behaviors, pedestrian movements, and different transportation modes (rail,
transit, etc.) are some new features of simulation models for the last couple years.
These advanced simulation techniques shape the future of transportation in virtual
worlds.
2.1.12. Mashups
Mashup combines multiple services and data to create a new application
in terms of definition. For example, a real estate web page which uses Google Maps or
Yahoo Maps to display houses on the map on its web site is a mashup. It merges the
data for houses (geographic locations, pictures, prices, information, etc.) and the map
which Google Maps provides. This combination is named a mashup application in
web development literature.
The last decade has witnessed advanced web-based interactive mapping in
terms of technical capabilities and visualization [1]. Map mashup applications are
becoming an essential element of transportation studies and implementations by using
the power of the map application programming interface (API) providers such as
Google Maps, Yahoo Maps and Bing Maps. Ease of implementation with nearly no
cost increases the usage of the applications even by non-professionals and the general
public. Google Maps has been providing API since 2005 to allow users to create map
mashups and present the data and information on Google Maps [42].
Batty et al. [42] highlights the importance of the map mashup
applications:

26
“This obviously addresses the fact that it is now possible for users other than professional geographers, geographic information scientists and cartographers to create their own map content, and this has the potential to broaden the domain of interest and applications quite radically “.
Google Transit provides public transit information such as routes, stops,
travel time, and schedules for planning a trip by using the public transit. Wikimapia
allows users to name the places (cities, districts, schools, hospitals, shopping centers,
restaurants, parks, lakes, etc.), and add photos and descriptions by utilizing the user-
friendly sketch tools on map powered by Google. Gapminder uses the statistics of the
countries and displays the time series of the developments of countries. WalkScore
shows the walkability of a neighborhood by displaying the surrounding environment,
community and transit accessibility on a map. These are just a few examples of
mashup applications that combine the data from different sources to develop new
applications.
In terms of transportation, there are many mashup applications which
provide valuable information created by using tons of data from different sources.
Displaying transportation department’s traffic cams on a map, displaying traffic
information on a map, displaying work zones and closures on a map is some simple
applications that we all are familiar with. As an unusual example, New Zealand’s
Virtual Highway product allows people to choose routes they want to travel on a map
and watch a pre-recorded version of the same route by fast forwarding [43].
As a different application than a map mashup, Gapminder provides
statistical time series of the developments of countries. Gapminder defines its goal as
“converting boring numbers into enjoyable, animated and interactive graphics” [44].
Tracking the developments in countries, regions, and states is easy and enjoyable with
Gapminder. It uses the data provided by governments and organizations such as
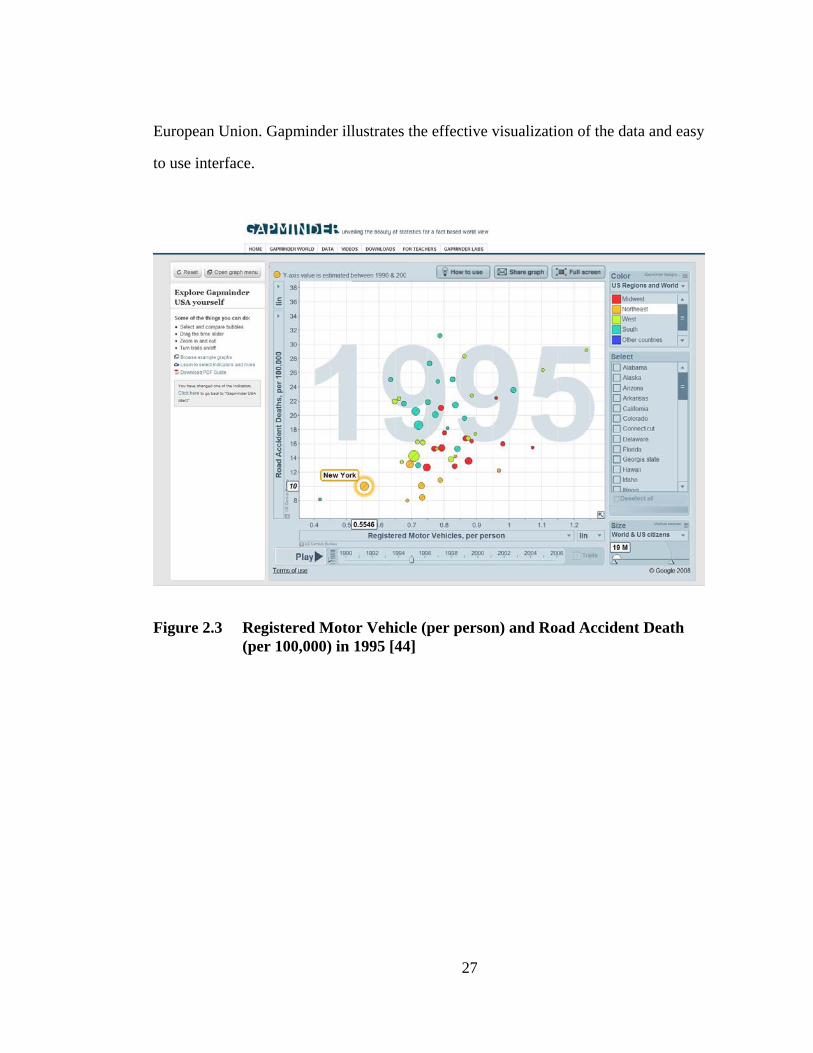
27
European Union. Gapminder illustrates the effective visualization of the data and easy
to use interface.
Figure 2.3 Registered Motor Vehicle (per person) and Road Accident Death (per 100,000) in 1995 [44]

28
Figure 2.4 Registered Motor Vehicle (per person) and Road Accident Death (per 100,000) in 2006 [44]
In Figure 2.3 and 2.4, registered motor vehicle and road accident death
relation is illustrated for all states in the U.S. Each circle represents a state and states
are categorized in terms of geographical location by different colors. By simply
keeping mouse cursor on a circle shows the name and the data of the state which is
represented by that circle or choosing the state from the list on the right side highlights
the position and the data of the representative circle. Additionally, clicking the play
button on the bottom left demonstrates the change of the data by the time. In Figure
2.5, highlighted path represents the data between 1990 and 2006 for the State of
Delaware in terms of registered motor vehicles and road accident deaths.

29
Figure 2.5 Registered Motor Vehicle (per person) and Road Accident Death (per 100,000) changes tracking between 1990 and 2006 for Delaware [44]
2.2. Advantages and Disadvantages of the Web 2.0 Technologies and Tools
It is important to point out that Web 2.0 technologies are still new and
need new approaches in order to use them effectively. Even though there is a huge
potential of web based applications to improve the quality of personal and
professional life, there is also downsides of using these applications that should be
considered before adapting them.
The most attractive advantages of Web 2.0 technologies are being user
friendly and mostly cost-free which also offer high level of public and professional

30
participation and lead up collaboration between them [12]. Another advantage of Web
2.0 is that asynchronous communication opportunities eliminate time and place
restrictions. The technology has changed the profile of web and internet users from
being only viewer to active participants. Individuals are able to contribute to content
and decision making process. It is also important that these technological tools
promoted personal learning because most information and knowledge became open
sources with web applications [12], [45].
The new developed internet technologies enabled such online platforms in
which people are able to access a huge amount of information from multiple sources,
have opportunity to comment and edit on the information. They could also make better
decisions because they have access to all different point of views instead of one. It
seems that “Web 2.0 would make the Internet a true democratic system, a digital
democracy” in this century [12], [45].
There are also disadvantages of Web 2.0 technologies and tools as well.
These technologies increase the dependency on the Internet and computers, even
mobile phones. All applications are also time consuming. Privacy and security issues
are other important points especially for governmental institutions and agencies [12].
Open source applications always have a potential for hackers [45]. “Behavior of the
users” is another considerable dimension of Web 2.0 applications. Destructive
behavior and low quality of the contribution may affect outcomes of the application
[12].
2.3. Summary of the Chapter
In Chapter 2, Web 2.0 technologies and tools are presented. History of
Web, emergence of Web 2.0, differences, improvements, advantages and

31
disadvantages are discussed. 12 main components of Web 2.0 are described with
successfully implemented applications.
Collaborative editing applications, blogs, social networking applications,
synchronous conferencing technologies and mashup applications, which are the most
common Web 2.0 applications in transportation area, are also explained in detail to
prepare a substructure for Chapter 3.

32
Chapter 3
WEB 2.0 APPLICATIONS IN TRANSPORTATION
Web 2.0 technologies are already being used in transportation not only for
information dissemination and public relations, but also for fundamental operations
and activities such as planning processes, decision-making processes, and intra- and
cross-agency collaboration. There are many successfully implemented Web 2.0
applications in the transportation area. Wikis, collaborative editing tools, social
networking applications, and map mashups are the most popular applications in the
transportation area. Each one of the technologies explained in Chapter 2 could be an
application by itself as given by the Intellipedia example. However, in the area of
transportation, Web 2.0 tools and applications are mostly combined and utilized in a
planning process or in public relations.
In this Chapter, Web 2.0 technologies and tools applied to transportation
areas are analyzed in detail. There are some applications created by using mostly Web
2.0 technologies and tools such as SeeClickFix, and there are some only partially
using Web 2.0 such as Build Your High Capacity System by Oregon Metro and Peer-
to-plan CSS 2.0.
Web 2.0 technologies are evaluated and classified in four categories in
terms of transportation: Information dissemination applications, transportation
planning applications, public collaboration applications, and social networking
applications. It is hard to define the boundaries of the categories because, as stated
earlier, transportation applications and studies mostly use multiple Web 2.0

33
applications. For example, some transportation planning processes may include both
social networking tools and information dissemination tools. These categories are
considered as a general classification of the applications in the transportation area. It is
important to note that public collaboration applications are considered as originally
created and managed by the public such as in the case of SeeClickFix and ride-sharing
applications.
Osimo [12] states that Web 2.0 technologies have already been used in
many activity areas of government by citizens and employees, and there is a large
potential for new applications. Presently, many transportation agencies and
organizations are commonly using subscription services and/or Web 2.0 toolboxes on
their websites, such as “Get Connected” and “Follow Us”. With these services and
toolboxes, once users subscribe, they will receive information, updates, emergency
situations, closures, etc. via Web 2.0 tools such as Facebook, Twitter, Flickr, RSS and
many others.
3.1. Information Dissemination Applications
Web 2.0 applications are already being used for dissemination of
transportation and traffic information. We have witnessed the explosion of the Web
2.0 application market with the increase in usage of the Internet and mobile phones.
Internet-enabled devices such as iPhone, Blackberry, Kindles, and Ipads have an
impact on dissemination of real-time information. In addition to providing easier and
faster access to information, mobile phones make creating and sharing information
more efficient.
Social networking applications and blogs are the most famous Web 2.0
information dissemination tools in transportation. News, updates, emergency issues,
34
developments, and traffic information reach people quickly and at no cost. The official
blog of the U.S. Secretary of Transportation, Fastlane; the Transportation Security
Administration’s blog, The TSA Blog; and the Transportation Research Board
(TRB)’s Twitter page are some popular information dissemination examples of Web
2.0 in the transportation area.
Advances in web technologies have improved the web-mapping
applications in the transportation area. Mapping applications, which are some of the
most common visualization techniques of transportation studies, have changed
dramatically after the web-based mapping services and tools. Geographic Information
Systems (GIS) and web-mapping services such as Google Maps, Bing Maps and
Yahoo! Maps enable people to create, store and disseminate the large quantity of data
on simple, understandable and visually nice maps. Web- mapping services facilitate
displaying the data on a map by providing application programming interfaces (API).
Therefore, even non-expert users are able to display the data on a map by using web-
mapping services because user-friendly web-based mapping applications ensure
simplicity and functionality at the same time [1].
Many mapping mashup applications in the transportation area facilitate
accessibility of the transportation data by converting tons of data to maps, graphs, and
tables. Utilizing the GIS and web-mapping services improves the quality of the
outputs of transportation studies. Flammia and Rabinowicz [1] state that users can
reach the data as soon as it is available and do not need to download the data and use
specific software to view it. Google Maps and Bing Maps, which are real-time traffic
information practices, show the easiness of reaching real-time traffic information.

35
For example, in a study, Welch et al. [46] state that most transportation
organizations and firms do not yet store all the data digitally, and many times
accessing and using the data become an issue. As a result, they established a system to
store and view the traffic count data for intersection and roadways in Google Maps.
This system enables accessibility of the data by interested parties in addition to the
organizing and storing of data on the web. Users can find am/pm traffic counts, counts
for different time ranges (last 3 months, last year, etc.), and intersection and roadway
counts [46].
Following examples demonstrate transportation data and information
dissemination in different ways via Web 2.0:
The Census Transportation Planning Package (CTPP) provides
visualization of the fundamental source of many transportation studies, home-to-work
flow data, in another name origin-destination (OD) matrix. The CTPP web-based
Mapping and Query System utilizes GIS and advanced web technology to make the
census transportation data stack to a visually nice and easy to understand source. User-
friendly interface, dynamic data services, map-aided geographic entity query, multi-
dimensional data query, and map-based charting are some of the features of the web-
based applications. Total workers, mean travel time and aggregate travel time are
some of the results of the application in Travel Analysis Zone (TAZ) level [47]. The
application is also able to provide GIS shape files for some of the results to make it
compatible with GIS desktop applications.
From a Web 2.0 point of view, combining the census data and
visualization of GIS is an example of properly using mashup applications.
Additionally, reaching most of the census data and visually displaying it without

36
needing to download or use software is an example of the effective use of web-based
applications.
Google Transit is one of the most popular examples of an information
dissemination tool used in the area of transportation. Although it looks like a simple
navigation application for many people, energy and effort behind the system is the
sign of the collaboration. From a technical point of view, Google Maps is the
underlying platform of Google Transit. However, only with the contribution of federal
and local transit agencies will the application be valuable and effective for providing
public transit information. As mentioned in the example in Chapter 2, having a
telephone which no one has, does not provide communication between you and other
people, because only you have the tool. By pooling their information resources,
Google Transit and federal and local transit agencies will better their product and
make it accessible to more users. Transit authorities will provide information about
routes, schedules and the location of the stations to Google Transit to make the public
transit information easily accessible [14]. Users are able to plan their trips by using
Google Transit in a single step even with possible route options without entering
different public transit websites and spending too much time.
gCensus is another web site which visualizes the Census 2000 data by
using the Google Maps. It is created by a web-developer team to transform the Census
2000’s row data to more understandable visual tabular information that is freely and
easily accessible to the public. Users are able to navigate on the map to zoom in to the
level of the data they need and to expand the Census 2000 data for any given area.
One of the best features of the gCensus Website is that users are able to create a link
to specific data. Creating a link to specific data allows users the option to save and/or

37
share the link by using copy and paste features. When the link is clicked, users can see
the exact detail of the data and map without navigating to it. In terms of information
dissemination, displaying the Census 2000 data on a map provides information and
data for the general public, third party developers and professional agencies that
would be beneficial to them [48].
MassStats website is an excellent example of visually providing a wide
variety of transportation data. The data which is collected from different sources such
as the U.S. Census Bureau, Massachusetts State Police, Massachusetts Department of
Public Health, and Federal Emergency Management Agency (FEMA) is categorized
in different groups (Demographic, Economic, Education, Transportation, etc.) and
visually presented on a map powered by the Maptitude for the State of Massachusetts.
Figure 3.1 is a screenshot of the MassStats webpage, which shows the mean commute
time by city/town level on the map and a table to display some quantitative
information such as population, registered vehicles, commute time, commute types,
vehicles per unit and average vehicle age for the Boston area [49].

38
Figure 3.1 Screenshot of MassStats [49]

39
From the point of view of Web 2.0, MassStats website provides
information on a wide variety of data by combining the different sources for a new
service. The power of the web-mapping applications is that they increase the
effectiveness of the data by visualization. Reliability and popularity of the application
depend on the availability of the data. The absence of data or dependence on a single
source such as the U.S. Census Bureau will definitely adversely affect the quality of
the service. Providing data might also increase the cross-agency collaboration for
further studies and applications.
FlightRadar24 is a different type of application in terms of information
dissemination. The website, which was launched in Sweden in 2007, shows live
airplane traffic over Europe and other continents. From a technical standpoint, ADS-B
transponder-equipped aircraft signals are received by ADS-B receivers. About 60% of
passenger aircrafts and some military aircrafts have the transponder, and there are
about 100 receivers across Europe [50]. The position of the aircraft, their flight path,
and the location of the airports are shown on the map, and flight information (aircraft
model, airline, altitude, ground speed, destination, etc.), filtering tools, chat panel, and
some additional features are shown on a different panel on the right side (Figure 3.2).
The chat panel also provides social networking for followers. A dynamic map changes
every few seconds to provide real-time information. Developers of the application also
collaborate with individuals who have ADS-B receivers by sending a script to their
computers to enable them to send the received flight information to the center [50]. In
addition to the FlightRadar24 website, the ISTStatus application, which uses the
FlightRadar24 website to provide flight information for Istanbul Ataturk Airport,
enables people to listen to conversations between pilots and tower [51].

40
Figure 3.2 Screenshot of FlightRadar24 Web Site [50]
3.2. Transportation Planning Applications
Usage of the Web 2.0 technology in transportation planning processes is
becoming more common. Many transportation agencies are using Web 2.0
technologies to expand the accessibility of projects to the public and to transportation
professionals. The purpose of using the Web 2.0 technology in transportation planning
processes is to increase the productivity of employees in terms of collaboration and
communication and to disseminate the information in more effective ways. Although
the title of the category is Transportation Planning Applications, the content of the

41
applications involves a wide variety of transportation services such as transportation
design, maintenance, operations, and public relations. Web 2.0 tools, however, are the
most utilized in transportation planning processes, especially in public relations.
Public involvement became more efficient and effective in the planning
process with the aid of the Web 2.0 technology. Guidelines and regulations require
public involvement for all major transportation projects, but many public involvement
programs are organized to meet minimum requirements. However, some agencies
have realized that the quality of public involvement affects the quality of the project.
High-quality public participation might improve projects, reduce superfluous ideas,
and decrease project implementation time [19].
Another contribution to the process is creating a community between
professionals within and without the agency or project team to improve decision-
making processes. For example, an expert can make a contribution or solve a problem
from thousands of miles away without any expectation if one makes one’s projects,
problems, methods and processes accessible. Naik and Nash [19] aimed at establishing
a network from “self-selected and invited experts” by using Web 2.0 tools in a major
transportation planning process.
The following examples illustrate Web 2.0 implementations in the
transportation planning area:
Build Your High Capacity System is created by Metro as a part of the
30-year regional transportation plan for Oregon. Metro has been working on a long-
range plan for light rail, commuter rail, bus rapid transit, and rapid streetcars in the
Portland metro region since 2008 to develop a guideline for appropriate investments
[52]. As part of the project, Metro has developed the Build-a-system tool to

42
collaborate with the public in the planning process to learn more about priorities and
choices of potential users of the system.
The Build-a-system tool includes corridors and activity centers in a
mapping mashup application. Transit Corridors between centers are evaluated and
selected in advance by a project team and presented on the map to enable users to
select preferred corridors. After the professional evaluation, corridors also include
information about capital cost, operating cost, ridership, travel time, and
environmental benefits. A user can choose corridors and create his/her own high-
capacity transit system, depending on what is the most beneficial or appropriate for
him/her. Next, the application provides the ridership, travel time, cost, and
environmental benefits of the total system according to the user’s choice. Users are
able to evaluate their systems, create different corridors and compare them, and submit
the high capacity system they created to make it available to other users and
professionals. An important point of the application is that all users have the same
budget, which equals the possible investment amount for a high capacity transit
system. The limited budget prevents creating imaginary and unaffordable examples
[52].
Metro provided a great application to facilitate effective public
involvement in the planning process of a major transportation project. In the short
time between March 23rd and April 26, 2009, over 4,250 people used the Build-a-
system tool, and 657 of them submitted their thoughts via corridor selection and
questionnaire. By using appropriate Web 2.0 technologies such as mapping mashup
applications, users were able to use and reflect their choices and priorities easily.
Users evaluated their system, budget, and corridors by using the questionnaire part of
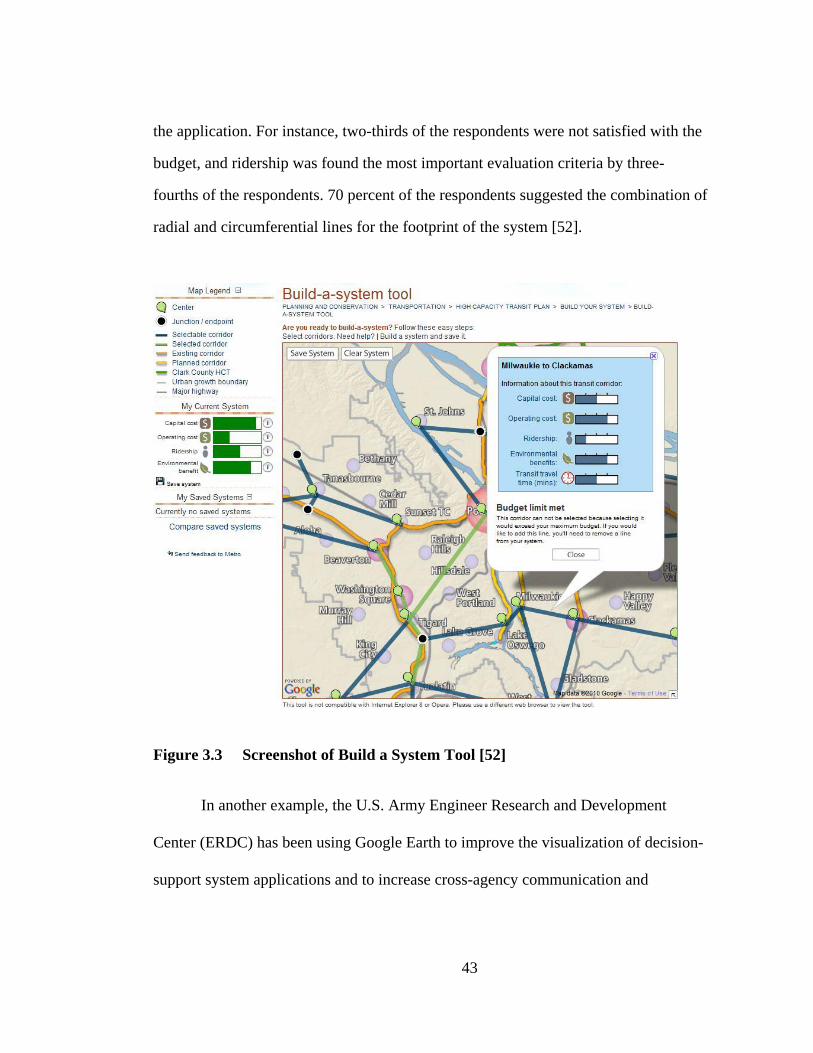
43
the application. For instance, two-thirds of the respondents were not satisfied with the
budget, and ridership was found the most important evaluation criteria by three-
fourths of the respondents. 70 percent of the respondents suggested the combination of
radial and circumferential lines for the footprint of the system [52].
Figure 3.3 Screenshot of Build a System Tool [52]
In another example, the U.S. Army Engineer Research and Development
Center (ERDC) has been using Google Earth to improve the visualization of decision-
support system applications and to increase cross-agency communication and

44
collaboration. The goal of the system is to create an online environment to store and
display all the necessary data and information. Authorized users from different
locations and departments are able to edit and use the data collaboratively to create a
system which has up-to-date information and data.
In addition to storing information and data, the aforementioned applications
show the contribution of the online environments to decision-support systems
designed for departments such as transportation, geospatial research, and military
engineering in the U.S. Army. The Airfield Management application provides real-
time information about the infrastructure, surface condition and load-bearing capacity
of airfields by using Google Earth. The Transportation Information System (TIS)
controls transportation activities between units in the U.S. boundaries. TIS stores all
the road networks in different layers for different priorities and improves the planning
and decision-support system. The Airfield Location Tool provides information about
the locations of airfields and terrain near the airfields. In addition to the U.S. airfields,
many other airfields that are utilized by the U.S. army mostly in Iraq and Afghanistan
are covered [53].
All three applications provide all the necessary information needed for a
specific purpose in an online environment by using the effective visualization
techniques and mapping tools of Google Earth. Beyond the mapping applications,
establishing an online environment by editing the content collaboratively is another
Web 2.0 utilization point that should be considered.
45
Go To 2040 Invent 2040 is a similar application with Metro’s Build Your
High Capacity System in terms of providing information about the planning process of
a major project and improving public involvement in the decision-making process.
The Chicago Metropolitan Agency for Planning (CMAP) describes the objective of
the Go to 2040 Invent 2040 as follows:
“Our future depends on transportation, housing, water, education, jobs, air quality, and many other quality-of-life issues. You can have your say to influence decisions that will shape the region for decades to come.” [54].
The process began in 2007 to develop a comprehensive regional plan for
the Chicago area. The plan not only contains transportation and land use developments
but also considers economic developments, environmental issues, housing, education,
health care, and social services for a better prediction of the future [54].
The screenshot of the evaluation tool visually demonstrates the changes
possible by manipulation of the users (Figure 3.4). The well-designed interface gives
possible choices (on the left side in Figure 3.4) for 2040 in terms of development
density, road network improvements, transit system, and policies. Users are able to
choose possible developments and see the effect of the changes on the outcomes menu
on the right side of the screen. The middle part of the screen provides visualization of
the changes by time on a map or in a graph. These are just a few of the features of the
web-based application. Users are able to plan different scenarios and share them with
others. They are also able to compare their scenarios with some possible solutions and
rate other scenarios in the web-based application.
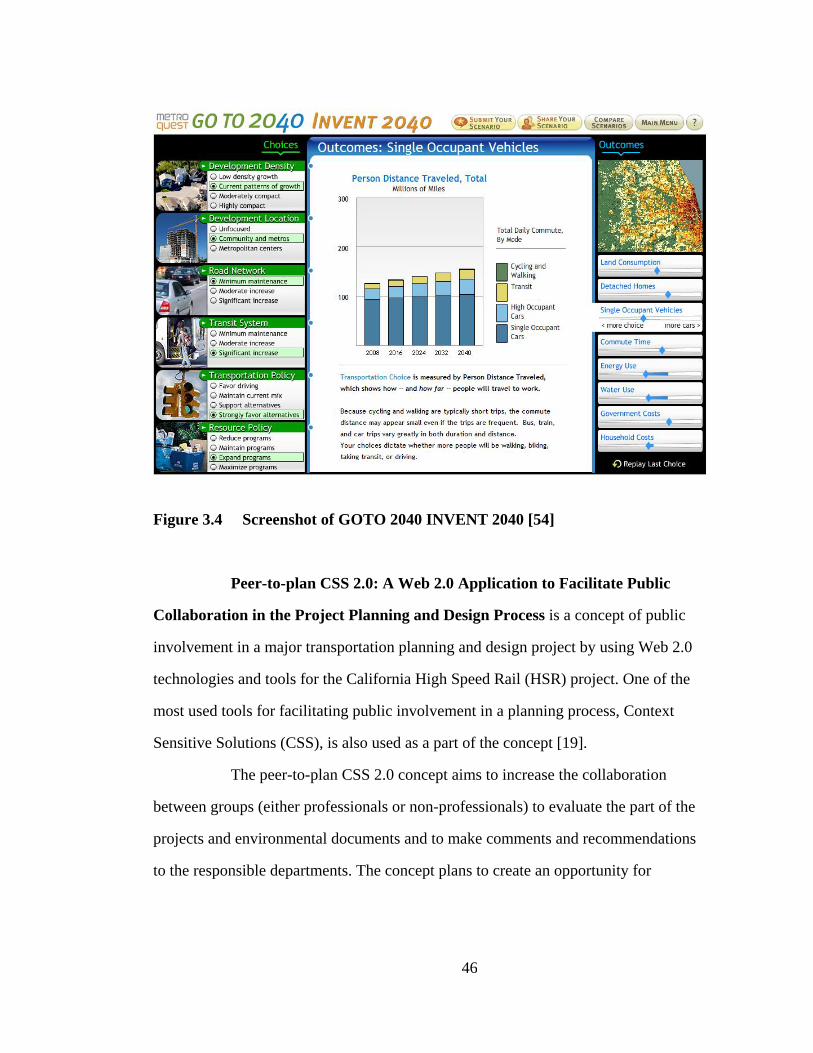
46
Figure 3.4 Screenshot of GOTO 2040 INVENT 2040 [54]
Peer-to-plan CSS 2.0: A Web 2.0 Application to Facilitate Public
Collaboration in the Project Planning and Design Process is a concept of public
involvement in a major transportation planning and design project by using Web 2.0
technologies and tools for the California High Speed Rail (HSR) project. One of the
most used tools for facilitating public involvement in a planning process, Context
Sensitive Solutions (CSS), is also used as a part of the concept [19].
The peer-to-plan CSS 2.0 concept aims to increase the collaboration
between groups (either professionals or non-professionals) to evaluate the part of the
projects and environmental documents and to make comments and recommendations
to the responsible departments. The concept plans to create an opportunity for

47
participation, to establish a network from self-selected and invited experts, to capture
new ideas, to increase collaboration and communication, and to provide real-time,
online public participation [19]. According to Naik and Nash, Peer-to-plan is not an
additional part of the planning process, but rather another public involvement: it could
be used instead of some of the common public involvement steps. Also, high-quality
public involvement positively affects the success of the project by improving the
design, reducing the public opposition, and reducing the cost, correspondingly. In a
public involvement program, the quality of the participant groups represents the
quality of the content, reports and comments.
Peer-to-plan CSS 2.0 includes 5 major parts:
A Wiki-based planning document is the place that participants can find
all necessary information about the project: description of the design, explanations and
definitions, diagrams, photos, simulations, etc.
A Design library provides design options to the participants. Possible
solutions are explained and documented for different types of problems, such as
railway crossings, geometric design elements, and bridge designs.
An Environmental impact library is a wiki-based library for environmental
issues. Regulations, technical standards and evaluation techniques are presented in this
platform.
A Google sketch-up design center is a place that users, either individuals
or groups, can design their approaches to the Peninsula HSR project.
The Peninsula HSR social networking center facilitates the
communication and collaboration between users and decision makers. Participants can
48
discuss ideas and make recommendations, and decision makers can also collaborate
with participants and give feedback to them about their designs and applications [19].
3.3. Public Collaboration Applications
We have witnessed that availability and wide currency of communication
and collaboration tools have dramatically increased the contributions of creativity by
the public. Thousands of people are coming together in an online environment and
contributing toward a common goal. One of the core elements of Web 2.0, which is
user-generated content, is the main source of the public collaboration. This section
explains applications which are created and managed by the public, either by
professionals or non-professionals. Public involvement in a transportation planning
process is explained in section 3.2. To be frank, transportation agencies are not
working effectively on non-motorized transportation modes such as bicycle and
pedestrian issues. For this reason, sometimes citizens establish a community to work
collaboratively for a solution of a common problem.
Wikipedia and Trapster are two key examples needed to understand the
power of public solidarity. Wikipedia, which was created from the collaboration and
contribution of the public, is becoming one of the biggest information sources for
people. Thousands of people are improving the content of its website daily.
In Trapster, 6.5 million people post the locations of traffic law
enforcement tools (radars, red light cameras, police locations, etc.) to make other
people aware of them. About 7,000 law enforcement locations are posted daily
throughout the world, which clearly demonstrates the capabilities of public
collaboration [55].
49
Another public collaboration area is car-sharing applications for reducing
traffic, congestion and the cost of trips by eliminating the dependency on personal
cars. One common way of car-sharing is carpooling or vanpooling. Generally, in
metropolitan areas, many people living in the suburbs and commute long distances
every day. Some carpooling/vanpooling websites such as eRideShare and
CarpoolConnect, social networking groups such as Zimride, and cell phone
applications such as Avego have increased the popularity of these applications. On the
eRideShare website, there are 12,356 daily carpool rides, 1,906 cross-country rides,
and 149 shopping, medical or airport-related rides made daily as of June 20, 2010
[56].
A second type of application for car-sharing is managed by companies
like CitycarShare for the San Francisco area, iGoCarSharing for the Chicago area, and
Zipcar for the entire U.S. Users can create an account on the website by providing all
the information necessary to be able to use the cars and reserve them for a specific
time on hourly/daily-based rates. These applications increase the number of short trips
a day without requiring the daily rental of a car. Many people in metropolitan areas
use car-sharing applications for shopping, airport rides and short distance trips. The
many choices for car models and the availability of cars in several convenient places
around the metropolitan areas increase the popularity and accessibility of this car-
sharing option. Another convenience is the compatibility of cell phones with some of
the applications in providing real-time information for reserving and locating the cars.
Google’s car-sharing program: There is a car-sharing program, different
from other applications with which one is familiar, at Google Inc’s facilities in
Mountain View, CA. The aim of the free-car sharing program is to reduce commute

50
traffic to and from the facilities by providing cars to employees to use during the day,
if needed. Employees who come to work by public transportation, Google’s shuttle,
carpooling, biking, or walking are able to use corporate cars during the day for their
meetings, errand runs, etc. This program is a part of the RechargeIT project and is
conducted for the purposes of analyzing greenhouse gas emission usage of the plug-in
cars as well as decreasing the commute to and from the facility. The RechargeIT
program provides the findings of this project, such as emission calculations, charts,
and graphs to the public on their blog.
SeeClickFix is one of the best examples of public collaboration by using
Web 2.0 and cell phone applications for problem identification. The mission of the
application is explained on the website as “encouraging residents to become citizens
by participating in taking care of and improving their neighborhoods” [57]. The CEO
of SeeClickFix, Ben Berkowitz, said in an interview with Felicia Hunter: “There is a
big difference between being a resident and being a citizen of a community, by which
he meant to highlight the importance of local participation in local issues and solutions
[58]. SeeClickFix is a process by which citizens report non-emergency issues to make
the issues available to the public and responsible agencies. A user-friendly website
and compatible cell phone applications provide the opportunity to public and agencies
to report and monitor issues easily and at no cost.
Individuals, who feel responsible in their community and neighborhood,
are able to report any issue affectingtheir neighborhood, community, orenvironment,
such as safety issues, traffic problems, missing signs, pot holes, pedestrian issues
(sidewalks, crosswalks, etc), trash problems, and graffiti. In terms of transportation,
congestion problems, signalized intersection problems, safety issues (icy roads, unsafe
51
turning lanes, speed limit issues, etc), missing signs, and marking problems are the
most commonly reported issues on the website. Users are able to contribute to the
application by agreeing on others’ reports or following reported issues.
In terms of agencies or responsible departments, it is easy to monitor any
area without any cost. A user-friendly mapping mashup application allows anyone
who wants to monitor an area to filter the issues reported by using the input box on the
left side. Also, the SeeClickFix application emails reported issues to the watcher
(either an individual or an agency) as soon as they are reported. In addition to
watching an area by using the SeeClickFix website, agencies can also embed the
watching area map into their own websites by using the SeeClickFix widget.
The SeeClickFix is a great example of public and professional
collaboration by using an online application. “Agreeing” other issues, sharing issues
with others, posting issues to social networking websites, and following issues and
responses are the advantages of the Web 2.0 applications, which are used in this
application. The mapping mashup application gives people the ability to identify the
location of the issues on the map, create a watching area, and even embed the map in
their website, for example. Cell phone compatibility of the system enables users to
report an issue by simply clicking a button. Citizens are also able to post photos about
the problems to make it more clear and understandable.
Applications such as SeeClickFix are embraced by local transportation
authorities and municipalities to improve the livability of the community. Many local
agencies and municipalities, such as the City of Manor and the City of Bainbridge, are
utilizing SeeClickFix to create a communication and collaboration tool with the
community and to be able to serve their residents better.
52
3.4. Social Networking Applications
Social networking is an upward trend in today’s daily life and a key
element of the future’s communication methods. The majority of this young
generation is already adapted to social media and new generations are born with it.
Many people are using social networking tools and technologies only for fun.
However, recent applications show that governmental institutions, agencies,
companies, and organizations have realized the potential of social networking. As
stated earlier, the Recovery Act (ARRA) has funded the National Institute of Health
(NIH) with $27 Million to develop social networking sites for scientists [17]. Amount
of the funding verifies the importance of creating an online collaboration environment
for professionals.
Although there do not currently exist any social networking applications
for transportation professionals, there are many professional-social networking groups
in existing social networking environments. These online environments offer
professional networking to establish and improve relationships with professionals.
LinkedIn is an example of a professional-social networking site. Online environments
such as Mendeley increase the collaboration between professionals, especially
scientists. As a combination of desktop and web-based application, Mendeley assists
researchers in managing and sharing the studies they are conducting. Mendeley’s web-
based application creates a research network that tracks its colleague’s studies and
gives them an opportunity to find people with similar interests [59].
In addition to social networking applications, institutional webpages such
as that of the Transportation Research Board (TRB) and the Institute of Transportation
Engineers (ITE) create an online environment to communicate and collaborate.
Webinars and online sessions facilitate interaction between professionals. Needless to

53
say, these progressive organizations have long been dealing with and utilizing social
networking applications such as Facebook and Twitter for information dissemination
and communication.
Web 2.0 has proven to be a strong communication and collaboration tool
for people, organizations and government. Nevertheless, Web 2.0 is not a technology
to replace the existing communication and collaboration technologies: it is one more
tool to improve them. Social media is a dynamic field and requires continuous effort
to monitor and operate the web applications [14]. For agencies, on-time responses and
transparency increase the participation and quality of contribution.
There are some common mistakes to be considered to understand the
implementation of Web 2.0:
One common mistake is the belief that “adding Web 2.0 tools and applications to
websites should increase public contribution” [12]. The point to be made, however, is
not that these tools should be “added” but rather that they should be used “effectively”
to succeed in facilitating interaction between agencies and the public. Osimo states
that without dedicated effort to encourage the participation, applications will not be
sufficient. In fact, there are thousands of non-used blogs and wikis already on the web.
Moreover, according to Osimo[12], there are many risks involved with
Web 2.0 technologies, which should be considered, such as destructive behavior,
privacy, and security issues, and loss of control.
Another common mistake made is reproducing the application or tool
instead of utilizing similar available tools which are already being used for similar
goals. For instance, there is no need to establish a social networking application on an
institutional website, because people are already communicating and collaborating

54
outside of their institutional websites by using Facebook, LinkedIn, MySpace, etc.
[12], [14]. Utilizing available and popular applications and services might be more
beneficial than creating (or reproducing) new ones.
“Adopting the technology” is another misunderstood point at many
agencies and institutions. Only adopting the technology is not a solution or an
improvement. In fact, “simply adopting the technologies, without embracing the value,
will have little or negative impact” on the communication and collaboration system.
Embracing the technologies and understanding the capabilities of the applications may
help to use Web 2.0 tools effectively [12].
3.5. Summary of the Chapter
In Chapter 3, Web 2.0 applications in transportation area are presented in
four categories: information dissemination, transportation planning, public
collaboration and social networking. Most of transportation applications which utilize
Web 2.0 are in information dissemination category. Especially, utilization of mapping
mashup applications has facilitated presentation of enormous data on a visually nice
and a simple map.
In transportation planning processes, Web 2.0 technologies are mostly
used to facilitate public participation and collaboration to improve projects. Also,
collaboration with professionals out of the agency has a positive effect on quality of
the projects.
In public collaboration applications, citizens create a community to
improve livability of a neighborhood, city or an area. In terms of communication and
collaboration, Web 2.0 provides effective tools such as social networking applications,
wikis and mashups to facilitate interaction between users.

55
Social networking applications are not very common in terms of
transportation. However, many professionals utilize existing social networking
application to communicate each other.

56
Chapter 4
WEB 2.0 TECHNOLOGIES AND TOOLS UTILIZATION IN TRANSPORTATION: A SURVEY
In order to increase and enhance Web 2.0 utilization, it is important to
understand the current technology and Web 2.0 familiarity of transportation
professionals. As an emerging technology, Web 2.0 has been begun to be utilized by
transportation industry since 2004. However, the transportation professionals and
agencies are still not knowledgeable about Web 2.0 and its capabilities. For this
reason, a national level survey was conducted to better understand the utilization of
Web 2.0 in transportation.
4.1. Objective of the Survey
The survey was conducted in order to better understand the usage of web
2.0 tools and technologies by transportation professionals and agencies. State DOT’s,
MPO’s, national level transportation institutions, agencies and organizations were the
target audience. The survey was aimed at gathering information from transportation
professionals about their current technology familiarity, the ways Web 2.0 tools are
used in transportation, the most used Web 2.0 technologies and tools in different
transportation study areas, and the utilization of Web 2.0 technologies and tools at the
institution, agency and organization levels.
57
4.2. Survey Design
4.2.1. Methodology
The survey was designed in Spring 2010 using the Qualtrics, which is
employed by the University of Delaware. The survey opened on 26 April 2010,
remained open for 9 weeks and closed on 27 June 2010. During these 9 weeks, the
survey was completed by 137 respondents. The University of Delaware Institutional
Review Board reviewed and approved the survey.
4.2.2. Participants
A total of 1080 transportation professionals from many transportation
agencies across the U.S. were contacted. 1020 of them were contacted by email, and
60 of them were given by hand both at the Institute of Transportation Engineers (ITE)
Mid-Colonial District Annual Meeting on April 28-30, 2010 and at the University of
Delaware. A prepaid return envelope was provided to facilitate and increase the
participation from ITE Meeting and University of Delaware participants. 113
responses were received by online Qualtrics survey system and 24 responses were
received by mail. The 24 responses were manually entered to the Qualtrics.
4.2.3. Questionnaire
Web 2.0 Utilization Survey included 23 questions (20 multiple choice and
3 open ended). The survey was divided into three parts: General Information, Web 2.0
Awareness and Usage, and Agency Information. The General Information part had
four questions which were aimed at describing the age, occupation, and organization
of the participants. The second part, Web 2.0 Awareness and Usage, included eleven
questions which were focused on participants’ awareness of Web 2.0, usage purposes,
58
the ways Web 2.0 used in transportation area, and efficiency of the tools in
transportation. The main purpose of this part was to determine the profile of
transportation professionals who employ Web 2.0. The third part of the survey,
Agency Information Part, was composed of five questions to learn how and in what
level transportation organizations, agencies or institutions of participants utilize Web
2.0. At the end of the survey, three open-ended questions were included to gather the
participants’ thoughts about Web 2.0 and its future potential in transportation area.
4.3. Data Analysis
Findings of the survey are presented in three parts based on the
questionnaire’s sections. Descriptive statistic methods were used to present the
findings. Results and possible further analyses were discussed.
4.3.1. Participants’ Professional Experience
In the first three questions, respondents were asked to identify their
profession, work area and in what type of organization they work. Respondents were
allowed to choose more than one choice or write their responses in “other” boxes.
Seventy-nine of the respondents identified themselves as planners (58%),
37 engineers (27%), 19 academic (14%), and 14 researchers (10%). 26 of respondents
(18%) identified themselves as belonging to another category such as designer,
builder, and technician (see Figure 4.1)
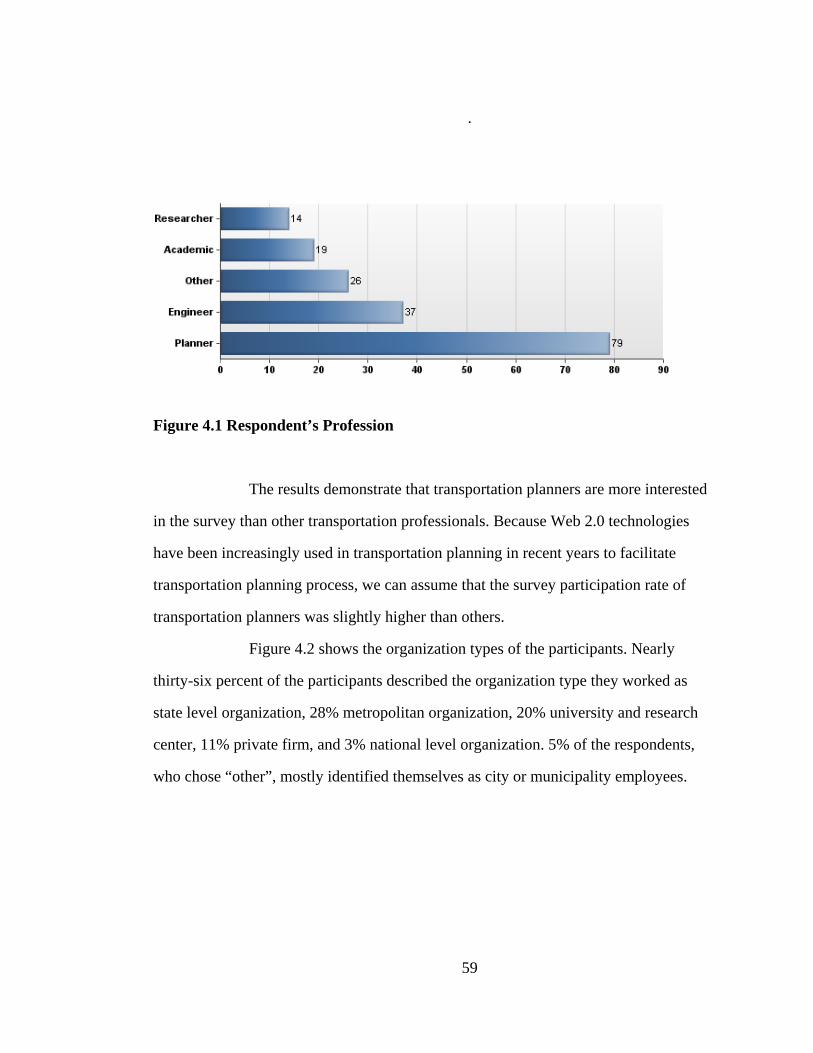
59
.
Figure 4.1 Respondent’s Profession
The results demonstrate that transportation planners are more interested
in the survey than other transportation professionals. Because Web 2.0 technologies
have been increasingly used in transportation planning in recent years to facilitate
transportation planning process, we can assume that the survey participation rate of
transportation planners was slightly higher than others.
Figure 4.2 shows the organization types of the participants. Nearly
thirty-six percent of the participants described the organization type they worked as
state level organization, 28% metropolitan organization, 20% university and research
center, 11% private firm, and 3% national level organization. 5% of the respondents,
who chose “other”, mostly identified themselves as city or municipality employees.

60
Figure 4.2 Respondent’s Organization Type
The results show that participations from State level organizations and
MPOs were dominant in the survey. It is important to note that state level
organizations and MPOs are more in contact with the public than other institutions,
organizations and agencies. At this point, their participation is crucial to demonstrate
the utilization of Web 2.0.
Figure 4.3 Respondent’s Age Profile
61
Figure 4.3 illustrates the age profile of respondents. The majority of the
participants were between 45 and 54 years old (33%). There were only 6 participants
under the age 25 (4%). More than 80% of the respondents were over 35 and they are
aware of the web developments from the beginning.
4.3.2. Awareness and Usage of Web 2.0
In the second part of the survey, awareness and utilization of Web 2.0
technologies and tools were asked of participants. Web 2.0 categories were provided
with a couple of best known examples to ensure that participants could clearly
understand the categories.
The Table 4.1 below shows the participant’s awareness of Web 2.0
technologies and tools. The majority of web 2.0 tools are known by the most of the
transportation professionals. Social Networking Applications are known by all
participants (100%). Collaborative Editing (95%), Photo/Video Sharing (96%), and
Synchronous Conferencing (93%) were other popular applications. However, social
bookmarking, tag clouds and mashups are the least known applications. It is a
considerable result that 53 % of the professionals were not aware of the mashup
applications. Yet, this is one of the most used Web 2.0 technologies by transportation
agencies. It could be possible that they do not know the name “mashup” even though
they use the application.

62
Table 4.1 Awareness of Web 2.0 Technologies and Tools (Response Numbers)
# Question Aware of
Not Aware of Responses
1 Web-Based Applications (OpenOffice, Google Docs, etc)
107 28 135
2 Social Networking (Facebook, MySpace, LinkedIn, Twitter, etc) 134 0 134
3 Collaborative Editing (Wikipedia, WikiTravel, Intellipedia, etc) 127 6 133
4 Blogs (Fast Lane, StreetsBlog, etc) 120 13 133
5 Social Bookmarking (del.icio.us, Diigo, StumbleUpon, Faves, etc) 42 94 136
6 Photo/Video Sharing (Flickr, Slide, YouTube, Dailymotion, etc) 128 6 134
7 Content Syndication (Google reader, RSS Feeds, Podcasting, etc) 108 28 136
8 Calendaring (Google Calendar, Yahoo! Calendar, etc) 110 24 134
9 Synchronous Conferencing (Skype, Google Talk, Windows Live Messenger, etc)
126 9 135
10 Tag Clouds 23 114 137
11 Virtual games (SecondLife, Onverse, SmallWorlds, etc) 61 75 136
12 Mashups (Google transit, Walkscore, etc) 65 72 137

63
Usage of Web 2.0 and usage purposes were also asked of participants.
Table 4.2 demonstrates the usage of Web 2.0 by transportation professionals. In total,
28% of the participants reported that they use Web 2.0 tools for personal purposes and
24% used for work purposes. 48% of the participants stated that they were not using
the Web 2.0 technologies. The results point out that Web-based Applications (36%),
Collaborative Editing Technologies (34%) and Calendaring Applications (32%) are
the most used Web 2.0 applications in their professional work. Social Bookmarking
Applications (85%), Tag Clouds (94%) and Virtual Games (93%) were the least used
applications by transportation professionals.

64
Table 4.2 Usage of Web 2.0 Technologies and Tools (Response numbers)
# Question For
Personal Reasons
For Work Purposes
Not Using Responses
1 Web-Based Applications (OpenOffice, Google Docs, etc)
45 57 55 157
2 Social Networking (Facebook, MySpace, LinkedIn, Twitter, etc) 83 48 38 169
3 Collaborative Editing (Wikipedia, WikiTravel, Intellipedia, etc) 63 60 52 175
4 Blogs (Fast Lane, StreetsBlog, etc) 37 36 75 148
5 Social Bookmarking (del.icio.us, Diigo, StumbleUpon, Faves, etc) 10 8 101 119
6 Photo/Video Sharing (Flickr, Slide, YouTube, Dailymotion, etc) 94 44 33 171
7 Content Syndication (Google reader, RSS Feeds, Podcasting, etc) 36 38 66 140
8 Calendering (Google Calendar, Yahoo! Calendar, etc) 40 51 70 161
9 Synchronous Conferencing (Skype, Google Talk, Windows Live Messenger, etc)
56 45 53 154
10 Tag Clouds 4 3 105 112
11 Virtual games (SecondLife, Onverse, SmallWorlds, etc) 8 0 111 119
12 Mashups (Google transit, Walkscore, etc) 24 31 77 132
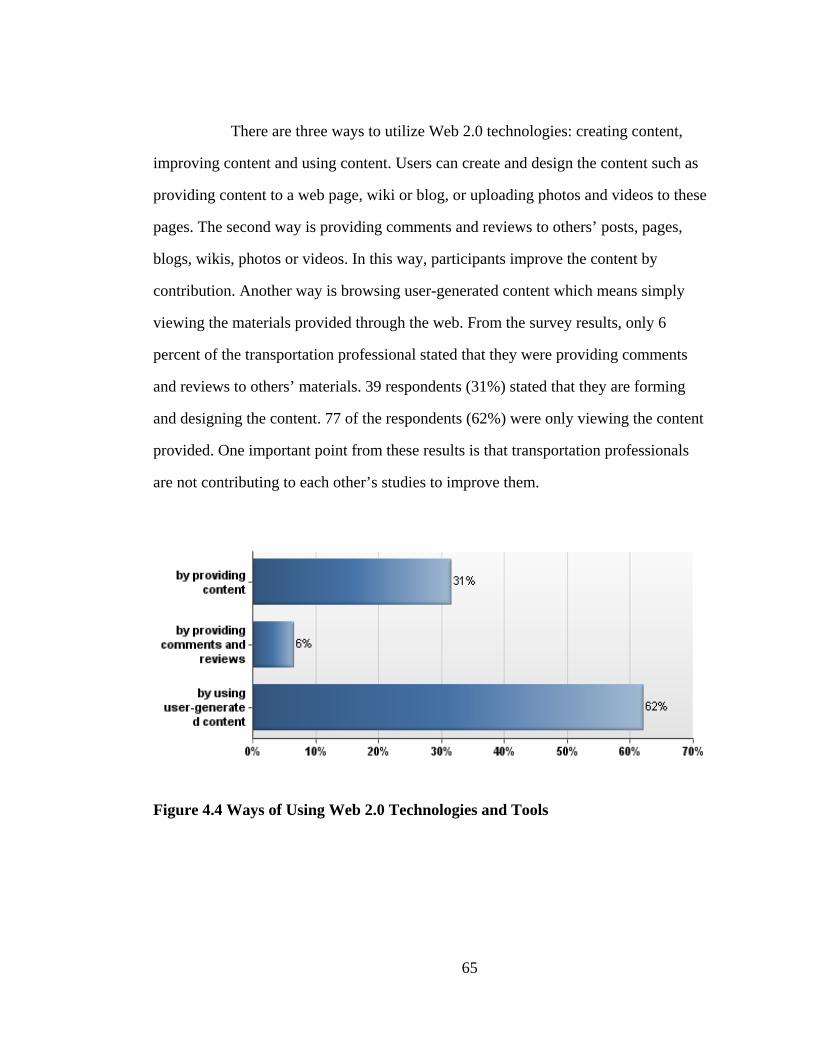
65
There are three ways to utilize Web 2.0 technologies: creating content,
improving content and using content. Users can create and design the content such as
providing content to a web page, wiki or blog, or uploading photos and videos to these
pages. The second way is providing comments and reviews to others’ posts, pages,
blogs, wikis, photos or videos. In this way, participants improve the content by
contribution. Another way is browsing user-generated content which means simply
viewing the materials provided through the web. From the survey results, only 6
percent of the transportation professional stated that they were providing comments
and reviews to others’ materials. 39 respondents (31%) stated that they are forming
and designing the content. 77 of the respondents (62%) were only viewing the content
provided. One important point from these results is that transportation professionals
are not contributing to each other’s studies to improve them.
Figure 4.4 Ways of Using Web 2.0 Technologies and Tools
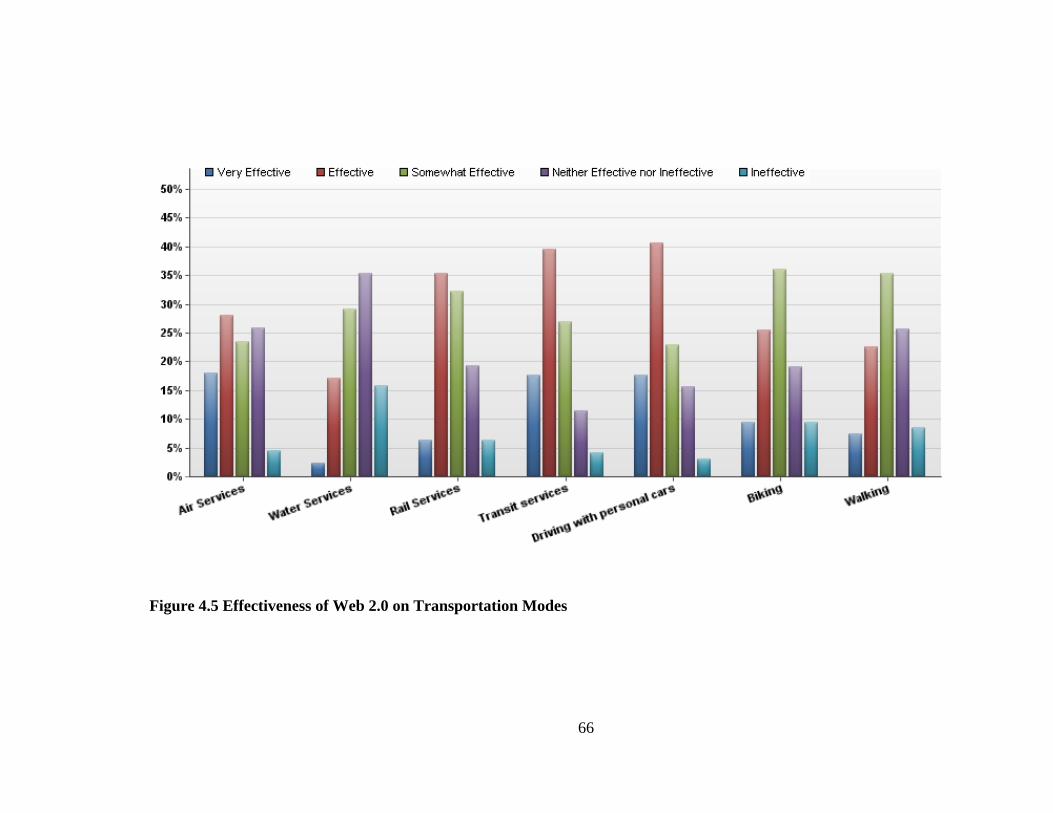
66
Figure 4.5 Effectiveness of Web 2.0 on Transportation Modes

67
Respondents were asked to identify the effectiveness of Web 2.0
technologies and tools on transportation modes based on their experiences. In Figure
4.5, results show that about 60% of the respondents stated that Web 2.0 is more
effective on Transit Services and Driving with Personal Cars. Transportation
professionals indicated that Web 2.0 is less effective on pedestrian and bike modes.
However, there are many Web 2.0 applications which are created by public facilitate
pedestrian and bike issues.
Figure 4.6 Effectiveness of Web 2.0 on Transportation Study Areas
68
In addition to transportation modes, transportation study areas were also
asked in the survey. As demonstrated in Figure 4.6, about 90% of the respondents
found that Web 2.0 is the most effective on Public Relations and 83% of them thought
that Web 2.0 is effective on Transportation Planning areas.
Participants were also asked to choose three Web 2.0 technologies and
tools which have the most significant effect on various transportation areas. The
results point out that the Web-based applications, Social Networking Applications,
Collaborative Editing Applications, Blogs and Photo/Video Sharing Applications were
found effective on most transportation areas (See Figure 4.7). Three technologies that
were found effective on transportation planning are respectively: Web-based
Applications, Collaborative Editing and Social Networking. In terms of public
relations, the most three effective Web 2.0 technologies and tools were Social
Networking, Photo/Video Sharing and Blogs.
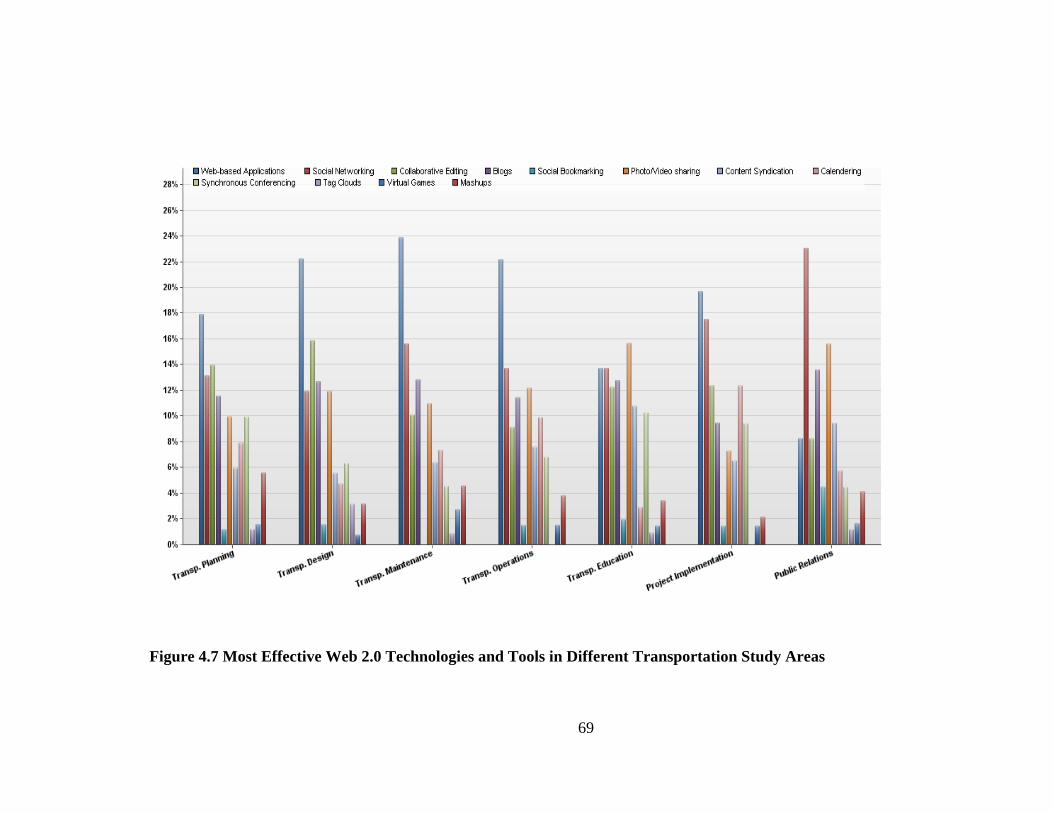
69
Figure 4.7 Most Effective Web 2.0 Technologies and Tools in Different Transportation Study Areas

70
Respondents were also asked about usage frequency of some Web 2.0
applications. Figure 4.8 illustrates the frequency of visiting or using Web 2.0 tools and
applications by transportation professionals. 68% of the professionals reported that
they never use or visit transportation related mashup applications. About 38 % of the
professionals visit or use institutional web pages daily. Nearly 39% reported that they
never use or visit transportation related social networking pages. 36% never use
transportation related collaborative editing technologies or tools.
This Figure 4.8 illustrates that many transportation professionals are not
utilizing Web 2.0 technologies and tools regularly. However, once users become
familiar with the applications and tools, utilization process will be easy and less time
consuming. For instance, if a person utilizes Content Syndication Technologies such
as RSS or Google Reader to receive information from different sources, he or she does
not need to go to those information provider websites every day. RSS or Google
Reader provides updates from those pages regularly. The person only needs to
subscribe to the web site or service.

71
Figure 4.8 Web 2.0 Utilization Frequency of Transportation Professionals

72
In order to emphasize the advantages and disadantages, respondents were
asked to rank the benefits and risks of Web 2.0 Technologies and tools. Ranking
criteria explained to respondents as 1 represents the most beneficial, 7 is the least
beneficial, and 1 is the most risky, 8 is the least risky. In Figure 4.9, first three choices
of the respondents represented. Most of the respondents found that “easy-to-use” and
“time independency and flexibility” were the biggest advantages of Web 2.0 (30% and
26%, respectively).
In terms of risks, responses were not significantly different from each
other. Low participation, low quality of contribution, manageability problems,
destructive behavior of users, and privacy/security issues were found to be the most
risky points of Web 2.0 utilization (See Figure 4.10).
Figure 4.9 Advantages of Web 2.0 Technologies and Tools
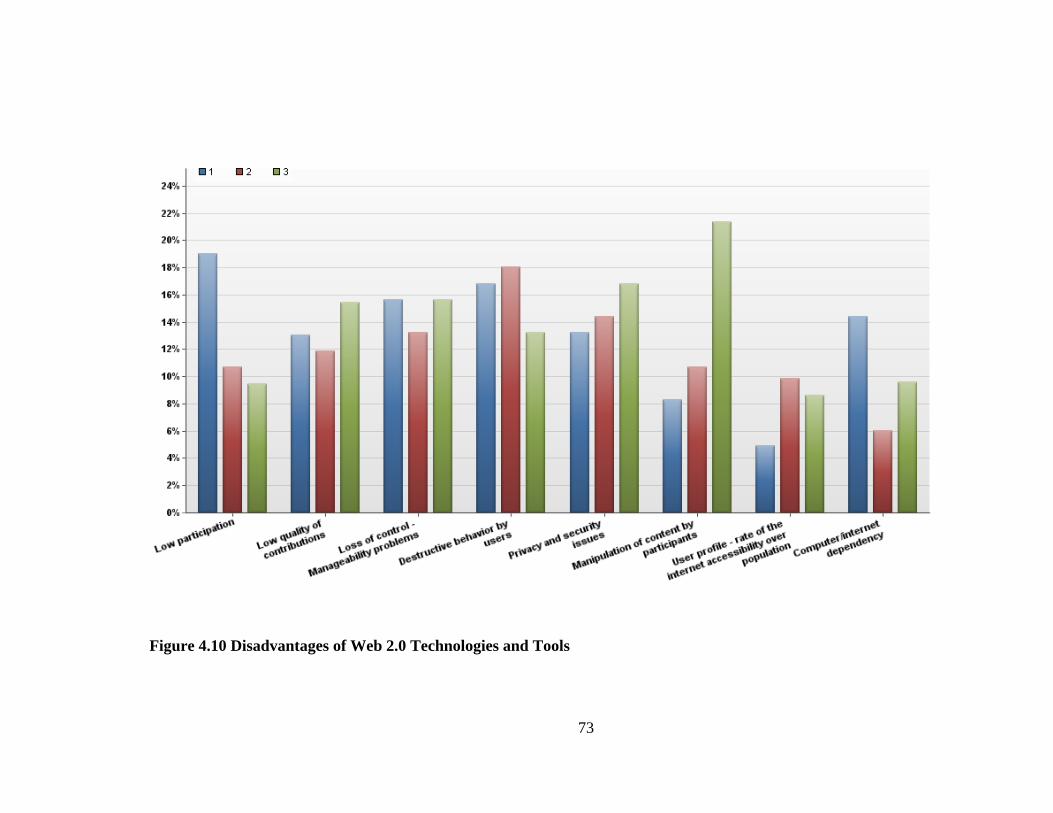
73
Figure 4.10 Disadvantages of Web 2.0 Technologies and Tools

74
4.3.3. Agency Information
In Agency Information Part, respondents were asked to provide
information about Web 2.0 adaptation of their agencies or institutions. Respondents
were asked whether their organizations use or are planning to use Web 2.0
technologies and tools. Figure 4.11 illustrates the results of Web 2.0 utilization in
agency, institution or organization. 30% of the respondent pointed out that their
agency is utilizing Web 2.0 and 7% of the respondents stated that their agency is
planning to utilize Web 2.0 technologies and tools. Remaining 63% stated that they do
not know about the utilization of Web 2.0 in their agency. 71 respondents reported
that their organization is using web services (6%) and 41 of the respondents’
organization is using synchronous conferencing technologies and tools (3%). About
3% of respondents reported that their organization is planning to use Social
Networking, Collaborative Editing Technologies and Blogs.

75
Figure 4.11 Web 2.0 Utilization in Respondents’ Agencies, Organizations and Institutions

76
In order to demonstrate the future potential of the Web 2.0 technologies
and tools, respondents were asked whether their organization is investing for web
technologies. The majority of the respondents (76%) stated that they do not know
whether their agency is investing in Web 2.0. 20% of the respondents reported that
their agencies were already investing in Web 2.0 Technologies and tools. Only 4% of
the respondents stated that their agencies are planning to invest in Web 2.0 (See
Figure 4.12).
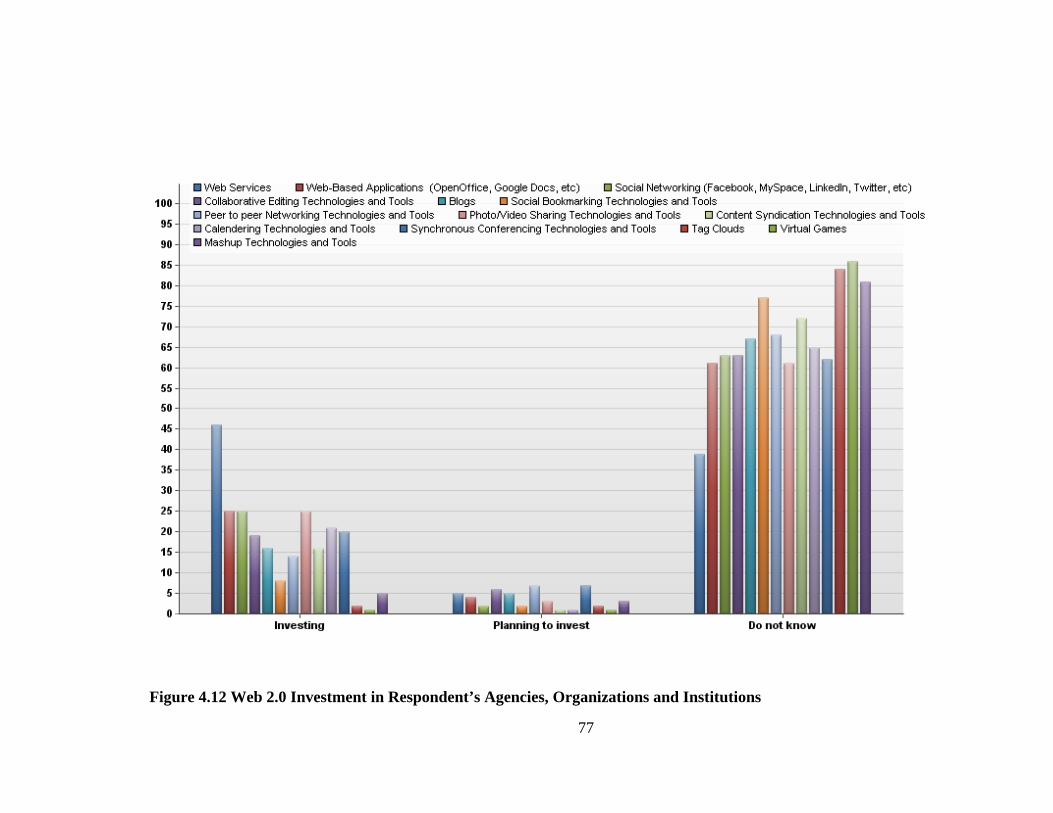
77
Figure 4.12 Web 2.0 Investment in Respondent’s Agencies, Organizations and Institutions

78
Respondents were also asked to evaluate their agency’s investment. The
majority of the respondents indicated that the investment was well timed (54%).
However, 41% of the well-timed investment was not sufficient and 13% was
redundant investment. In contrast, 24% of the respondents stated that the investment
was not well-timed nor sufficient. 16% of the respondents, who chose “other”,
generally stated that they are not aware of the investment in web 2.0 in their agencies
(See Figure 4.13).
Figure 4.13 Evaluation of Agencies’ Investment in Web 2.0 Technologies and Tools
To determine the reasons of utilizing Web 2.0 technologies and tools in
transportation, respondents were asked to specify the purposes of the Web 2.0
utilization in the agency. Most of the respondents stated that Web 2.0 has been utilized
for Information Dissemination (92%). Moreover, encouraging public involvement,
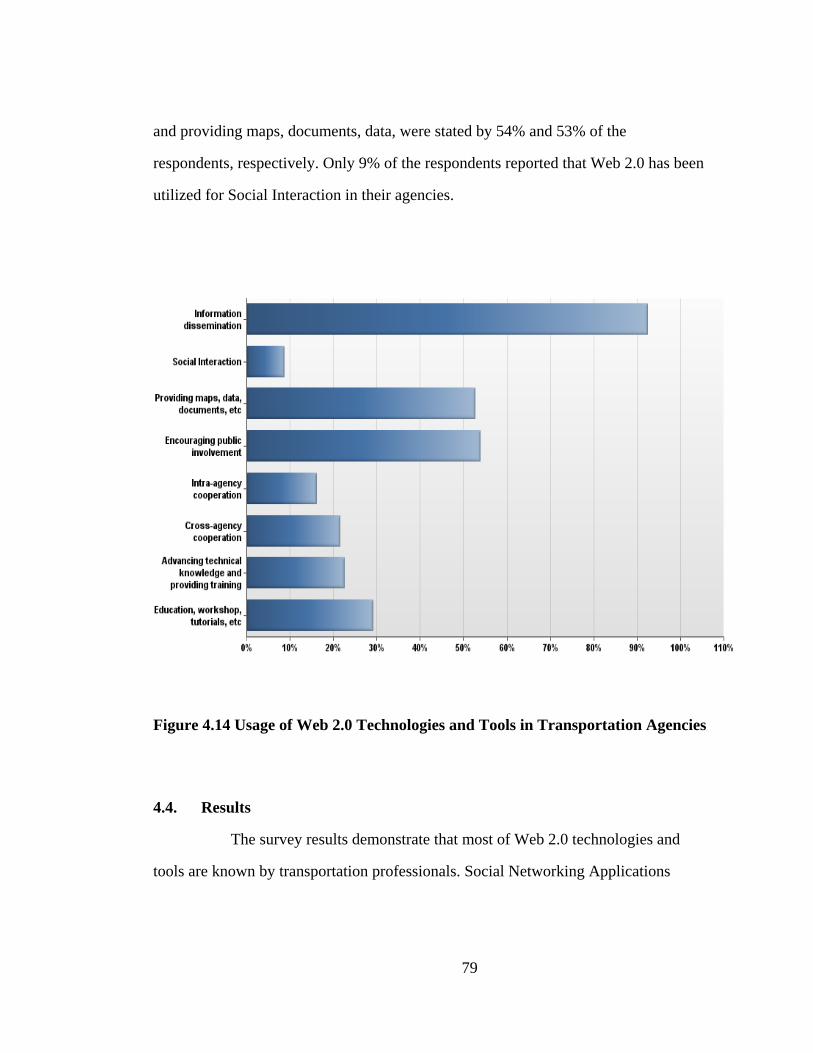
79
and providing maps, documents, data, were stated by 54% and 53% of the
respondents, respectively. Only 9% of the respondents reported that Web 2.0 has been
utilized for Social Interaction in their agencies.
Figure 4.14 Usage of Web 2.0 Technologies and Tools in Transportation Agencies
4.4. Results
The survey results demonstrate that most of Web 2.0 technologies and
tools are known by transportation professionals. Social Networking Applications

80
(100%), Collaborative Editing (95%), Photo/Video Sharing (96%), and Synchronous
Conferencing (93%) were the most known applications by participants. Additionally,
Social Bookmarking (31%), Tag Clouds (17%), Virtual Games (45%) and Mashup
applications (47%) were the least known applications. In terms of utilization of Web
2.0, 48% of the respondents stated that they are not using Web 2.0 technologies and
tools neither personal nor professional purposes. Only 24% of the respondents stated
that they are utilizing Web 2.0 for work purposes.
In terms of transportation modes and services, Web 2.0 technologies and tools were
found more effective on “transit services” and “driving with personal cars”. Also,
“transportation planning”, “transportation education” and “public relations” areas
were found more related to Web 2.0 technologies and tools.
Frequency of Web 2.0 utilization was also asked of participants. 68% of
the respondents reported that they never use or visit transportation related mashup
applications. However, especially mapping mashup applications are one of the
important element of transportation studies. In terms of usage frequency, institutional
web pages were the only regularly visited web application by transportation
professionals (38%, daily visit).
In terms of agencies, most of the respondents stated that they were not
aware of agency’s Web 2.0 utilization and investment. 30% of the respondents stated
that their agencies are utilizing Web 2.0 and 20% stated that their agencies are
investing on Web 2.0. Additionally, 24% of the respondents indicated that the
investment was well-timed and sufficient.

81
4.5. Summary of the Chapter
In this Chapter, result of the survey (Usage of Web 2.0 Technologies and
Tools) are presented and discussed. Descriptive statistic methods were used to present
the results of the survey. Transportation professionals’ Web 2.0 awareness and
utilization were mainly presented with the results of the survey. Also transportation
agencies’ Web 2.0 utilization was mentioned in the discussions.

82
Chapter 5
COMMUTER INFORMATION SYSTEM (CIS): WEB 2.0 UTILIZATION IN CONGESTION MANAGEMENT
Congestion is one of the biggest threats to the world’s economy and
people’s daily lives and has dramatically increased in the last two decades. Cost of
congestion in America is about 3.7 billion hours of lost work time, 2.3 billion gallons
of fuel on roadways and $200 billion of wasted money every year [60]. It is quite clear
that, the negative effects of congestion have been influencing governments,
transportation agencies, and the public economically and healthwise.
Advanced technology has a positive effect on relieving the congestion.
Today, it is possible to collect real-time traffic information by traffic monitoring
sensors, traffic cameras, Electronic Toll Collection (ETC) systems, cell phone
stations, and GPS/Bluetooth-enabled mobile phones. The challenge remains, however,
in disseminating real-time information to drivers in the vicinity of congestion.
In this study, a hybrid system called Commuter Information system (CIS)
is proposed to create a communication and collaboration structure for daily
commuters. The purpose of the CIS is to disseminate real-time traffic information to
daily commuters about their routes by utilizing information and communication
technologies and social networking tools. CIS consists of three parts: traffic
information database, commuter information database and social networking
application. The traffic information database collects and stores real-time traffic data;
the commuter information database collects and stores commute data of individuals

83
(commute time, dates, hours, preferred communication methods, etc.); and the social
networking application creates an online environment to facilitate communication and
collaboration between commuters and system operators. In this chapter, a theoretical
framework of the CIS is presented.
5.1. Commuter Information System (CIS)
Recent developments in traffic information provider web sites and
services such as Google Maps, Bing Maps and Traffic.com increased the utilization of
real-time traffic information for trip planning. However, as a dynamic system, traffic
changes fast, and most drivers are not able to check real-time traffic information while
driving. The goal of the web-based commuter information system is to inform drivers
about current and expected traffic conditions on the roadways.
Objectives of the Commuter Information System (CIS) are:
• Improving the traffic information services by providing timely and
accurate information to daily commuters
• Encouraging the public to share travel and commute information for
congestion management and provide data for transportation planning agencies
• Creating an online environment to enhance communication and
collaboration between drivers and transportation authorities.
• Improving the overall reliability of web-based applications in
transportation
5.1.1. CIS - Traffic Information Database
State DOT’s Transportation Management Centers (TMCs) have already
been obtaining real-time traffic information and disseminating this information via
84
web-sites, 511 services, dynamic message signs, and local media organs (TVs and
radios). In recent years, there has been an increase in availability of real-time traffic
information due to the advances in technology, and this availability facilitates the
decision-making process for both transportation authorities and individual drivers.
Locally, the Delaware Department of Transportation (DelDOT) is working to provide
real-time traffic volume data for highways and major arterials in the near future.
Traffic Information Databases will receive and store all traffic information
that TMCs might utilize for either informing drivers or using in further studies. Work
zone data and information, effects of the work zone to the nearby roads, recurring
congestion segments, congestion caused by special events, and expected weather
conditions are some of the information that could probably be known and predicted by
TMCs. Possible effects of these situations could be used to inform drivers. Non-
recurring congestions such as accidents, earthquakes, hurricanes, and emergency
situations are only known by the support of the real-time traffic information receivers,
monitoring systems, and through cross-agency collaboration. On this point,
communication between police departments, emergency services and TMCs plays a
critical role in informing people and relieving the congestion.
In addition to disseminating information to improve the movement of the
traffic, traffic information databases also facilitate the transportation planning process.
Real-time traffic information and data collected by sensors, traffic cameras, Electronic
Toll Collection (ETC) systems, cell phone stations, and GPS/Bluetooth-enabled
mobile phones provide massive data to transportation planning agencies for enhanced
transportation planning.
85
5.1.2. CIS - Commuter Information Database
Commuter information databases receive, appropriately tag, and store the
commute data of individuals to make them organized and accessible in case of need.
Databases will be built by the contribution of commuters. Information will be
requested from commuters on two different levels: basic information and detailed
information. The basic information only includes commute information (commute
days, time and routes) and preferred communication method. The detailed information
will vary depending on the transportation authority’s preferences to create or improve
the Origin-Destination (OD) matrix which is currently the basic element of the
transportation planning studies. To expand the participation, detailed information will
not be required. However, commuters will be encouraged to enter detailed information
to provide data for increasing the accuracy and efficiency of the transportation
planning studies.
For example, a person who lives in Elkton, MD and works in Wilmington,
DE and who mostly uses I-95 to drive to and from work can enter his/her commute
information in two different ways:
• Either by entering information for the required fields only (Basic
Information):
o Commute days: all weekdays
o Origin: Elkton, MD
o Destination: Wilmington, DE
o Departure time: 7:15 am
o Return time: 4: 45 pm
o Route(s): I 95, Martin Luther King Boulevard
o Preferred communication method: Twitter
86
• Or, by entering information for all fields (Detailed Information): In
addition to the basic information, transportation agencies might request
different types of information to create an OD matrix. Home and work
addresses based on the TAZ level, route information, and possible activity
locations after and before the commute (shopping, nursery, fitness center, etc.)
could be some of the possible data points that transportation agencies may
request.
In this example, the commuter will be informed about the traffic condition
during the calculated commute time intervals for both I-95 and Martin Luther King
Boulevard by using Twitter. Basic or detailed information will not affect types or
content of information that will be sent to drivers, it only will affect the accuracy of
route calculations to avoid from unnecessary messages and advisories.
Information input interfaces could be designed in varying ways,
depending on the technical and technological possibilities. Mapping mashup
applications can facilitate information entry and increase the accuracy of data. For
example, Traffic Analysis Zones (TAZs) could be tagged or place-marked on a map to
enable a user to enter their origin and destination points by simply clicking on the
map. Additionally, highways and major arterials could be tagged to facilitate the route
information entry process. Another advantage of utilizing mapping mashups could be
to provide data for an OD matrix by tagging TAZs on the map. In this way, origin and
destination data will be created based on TAZ levels and will be ready to use for
analysis.
Starting with the implementation of the process, Commuter Information
Systems (CIS) will combine the data from the Traffic Information Database and
87
Commute Information Database and send alerts or advisories to drivers who are
subscribed to the CIS. For example, if a police department reports an accident on a
roadway, CIS will only send an alert to the drivers who are expected to use mentioned
section of the roadway at that time. Also, CIS operators are able to send advisory
messages to drivers such as suggested routes or expected delays, if necessary.
One of the most critical challenges of the system is deciding the
appropriate tools for information dissemination. The decision for tool selection
depends on the transportation agencies’ technical infrastructure, technology
familiarity of potential users of the system, popularity of tools for daily usage, and
availability of resources. There are many tools and technologies that can be used for
information dissemination: automated phone call system, short message systems
(SMS), e-mail, social networking applications (Facebook, Twitter, etc.), and mobile
phone applications. Of course, there are advantages and disadvantages to each
application, however, utilizing different tools and applications provides a wide variety
of selection for users and might increase the contribution to the CIS.
Automated phone call systems and SMS systems require technical
infrastructure for implementation, but common usage of cell phones will most likely
increase the popularity and utilization of the CIS. E-mail systems are also one of the
more popular communication systems that people are using, however, dependency on
the internet and internet-enabled mobile phones limits accessibility to the CIS. Social
networking applications are new trends of communication and provide more
widespread access. Many people are communicating via social networking
applications either using desktops and laptops or internet-enabled devices and mobile
phones.

88
From a technical point of view, mobile phone applications are different
than the previously mentioned communication tools. These applications can vary from
simple information receiver applications to advanced route guides. An example of one
of the most advanced mobile phone applications for traffic operations might be
Trapster [55], which works like a navigation application and informs users visually
and audibly.
5.1.3. CIS - Social Networking
The social networking component of CIS builds an online environment to
create a synergy between users and operators of the system. Commuters are able to
make comments, give feedback, share their experiences on the roads, and even suggest
possible solutions. Although most of the commuters are not transportation
professionals or experts on traffic issues, their experiences, feedback and suggestions
are very important for planning, because they are users of the system. The relationship
between commuters and transportation planners is foreseeable akin to that exemplified
by the existing industry-scientist relationship. Such as, it is not hard to design an
effective and efficient system theoretically, but if it is hard to implement or produce, it
will be worthless.
Most social networking applications are user-driven environments. As a
result, content of the environment, issues, topics, discussions, and products of
contribution will be generated more and more as social networking applications are
used. Participants will be encouraged to provide feedback about the effectiveness of
the CIS, and benefits and downsides of the system. Agencies’ contributions and
response times are also critical for the quality of the discussions and effectiveness of
communication. Public participants should feel that their ideas, feedback and
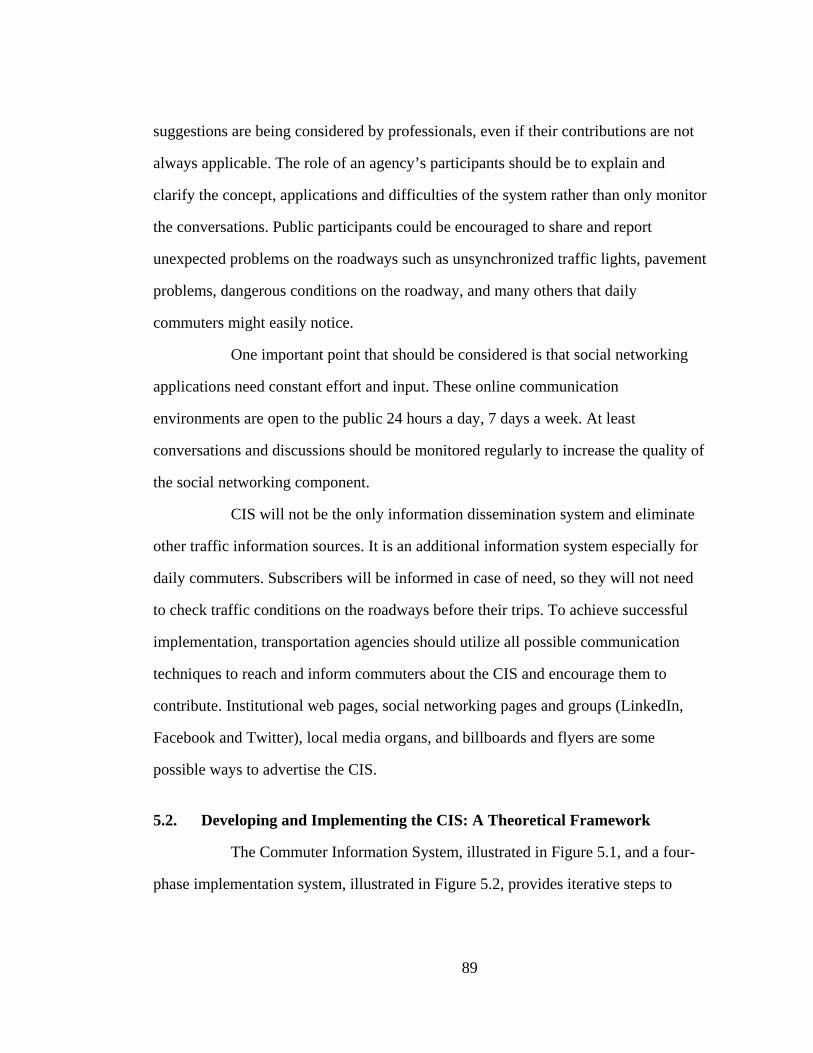
89
suggestions are being considered by professionals, even if their contributions are not
always applicable. The role of an agency’s participants should be to explain and
clarify the concept, applications and difficulties of the system rather than only monitor
the conversations. Public participants could be encouraged to share and report
unexpected problems on the roadways such as unsynchronized traffic lights, pavement
problems, dangerous conditions on the roadway, and many others that daily
commuters might easily notice.
One important point that should be considered is that social networking
applications need constant effort and input. These online communication
environments are open to the public 24 hours a day, 7 days a week. At least
conversations and discussions should be monitored regularly to increase the quality of
the social networking component.
CIS will not be the only information dissemination system and eliminate
other traffic information sources. It is an additional information system especially for
daily commuters. Subscribers will be informed in case of need, so they will not need
to check traffic conditions on the roadways before their trips. To achieve successful
implementation, transportation agencies should utilize all possible communication
techniques to reach and inform commuters about the CIS and encourage them to
contribute. Institutional web pages, social networking pages and groups (LinkedIn,
Facebook and Twitter), local media organs, and billboards and flyers are some
possible ways to advertise the CIS.
5.2. Developing and Implementing the CIS: A Theoretical Framework
The Commuter Information System, illustrated in Figure 5.1, and a four-
phase implementation system, illustrated in Figure 5.2, provides iterative steps to
90
develop, implement, evaluate, and modify the process of implementation. It is
important to have an appropriate and well-planned model, and a cost effective
allocation of resources to support the technology infrastructure, staff training, and
concept design.
In Figure 5.1, CIS collects all necessary information and data from Traffic
Information Databases and Commute Information Databases and sends alerts and
advisory messages to the drivers. Also, users’ feedback received from CIS’s Social
Networking Application will be used to improve the system and increase the
efficiency. CIS might also have an effect on creating and/or improving the Origin-
Destination (OD) matrix. Subscribers of the system who provide detailed information
for their daily trips also provide data for OD matrix. Therefore, the Commuter
Information System could be used not only as an information dissemination tool but
also as a transportation planning component.
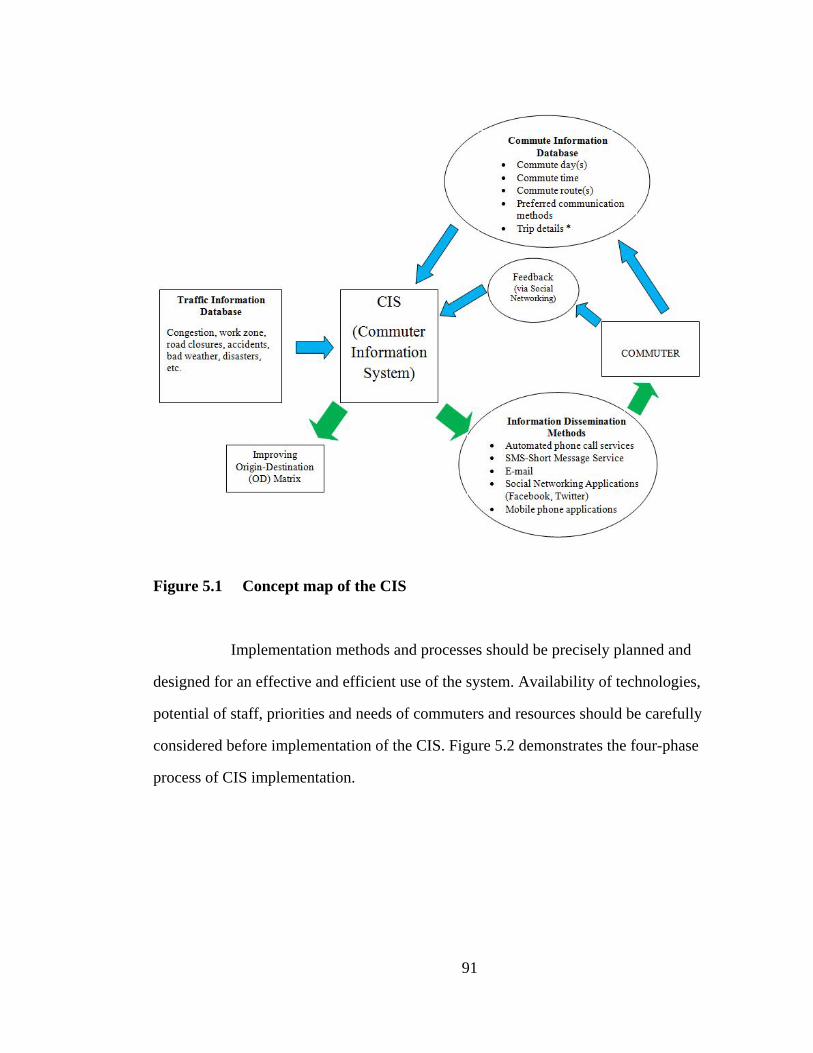
91
Figure 5.1 Concept map of the CIS
Implementation methods and processes should be precisely planned and
designed for an effective and efficient use of the system. Availability of technologies,
potential of staff, priorities and needs of commuters and resources should be carefully
considered before implementation of the CIS. Figure 5.2 demonstrates the four-phase
process of CIS implementation.

92
Figure 5.2 Implementation Steps of the CIS

93
The first phase includes steps of adopting technologies and adapting to
them. In order for the CIS to be used effectively, it is important to know the
capabilities of the technologies and applications employed. An evaluation of possible
alternatives, advantages and disadvantages of the systems, cost of implementation and
service, and future expectations needs to be considered before adopting the
technologies. Staff training and concept design constitutes the second step of the
Phase 1. Feedback from the professional staff on the concept will help improve the
design and eliminate possible further failures.
In Phase 2, CIS will be used by transportation agencies’ employees to test
the system before releasing it to the public. In this first trial phase, CIS will be
monitored and evaluated by the agency. With the feedback of the users, vulnerabilities
of the system will be examined to make necessary improvements.
In the first two phases, communication and collaboration between
operators of the system and users will be provided via the social networking
component of the CIS. Discussions between users might lead to possible solutions,
different approaches and better decisions. In terms of effectiveness of the social
networking component, users should be encouraged to participate.
CIS meets with the public in Phase 3 as a trial version. In this phase, a
transportation agency monitors the process and applications and evaluates users’
feedback to improve the CIS concept. Familiarity with the technology that the public
uses is important for the success of the implementation. Hence, information about the
system and how-to-use guide should be provided to the users. CIS will be improved in
a short time with the contribution of the public users, if necessary.
94
Phase 4 is the final version of the concept which is improved by users’
feedback. In addition to monitoring the system and evaluating users’ requests,
monitoring changes in advanced technology and possible adaptation to the system will
be included in Phase 4.
CIS is an information gathering and dissemination system mainly for
daily commuters. Requesting commute information from daily commuters by using
effective web tools and providing specific information to them about current traffic
conditions before and during the commute time are two main goals of the CIS. Web
2.0, as a free web-based information dissemination and communication method, has a
positive effect on CIS to increase the participation. Easy-to-use applications and
popularity of social networking applications facilitate operation of the system.
5.3. Summary of the Chapter
In this chapter, a theoretical framework of the Commuter Information
System (CIS) is presented. Concept map and implementation steps of the CIS are also
presented. Utilization of Web 2.0 and advanced communication technologies are
discussed. Lastly, the potential of CIS and additional implementations such as
improving OD matrix are mentioned.
95
Chapter 6
POTENTIAL OF THE WEB IN TRANSPORTATION: WEB 2.0 AND BEYOND
Since the early 2000s, collective intelligence has taken the driver’s seat of
the communication and information technology. Web 2.0 has affected, improved and
facilitated our daily life and professional interaction. As Morris et al. [14] stated,
people are no more awaiting the information and entertainment coming from the
screens, now they are forming their own environments. Additionally, according to
O’Reilly and Battelle [8], “the Web opportunity is no longer growing arithmetically;
it’s growing exponentially”. So, what is the next step? Where are we heading? How
can we adapt to the new information and communication era? These are some of the
questions that people are asking every day to imagine and understand the limits and
boundaries of the future’s information and communication technology. But, it is
obvious that the future is not so far away, it is in 2-3 years and we have already seen
some of the future’s applications. O’Reilly and Battelle’s “Web squared: Web 2.0 Five
Years On“ is one of the top-line articles that simply explains and describes the
forthcoming communication age. They [8] described the Web 2.0 and the next step,
Web Squared – which is also called Semantic Web, Web 3.0, Sentient Web, Social
Web, and Mobile Web in Web literature – below:
“Imagine the Web (broadly defined as the network of all connected devices and applications, not just the PC-based application formally known as the World Wide Web) as a newborn baby. She sees, but at first she can’t focus. She can feel, but she has no idea of size till she puts something in her mouth. She hears the words of her smiling
96
parents, but she can’t understand them. She is awash in sensations, few of which she understands. She has little or no control over her environment.
Gradually, the world begins to make sense. The baby coordinates the input from multiple senses, filters signal from noise, learns new skills, and once difficult tasks become automatic.
The question before us is this: Is the Web getting smarter as it grows up?”
With Web 2.0 and advanced technology, devices will become sensors of
our body: smartphones and cameras see and hear for us; motion and location sensors
know where we are, what we are looking at and whether we are moving or not [8].
From this perspective, next generation devices and machines will be able to
understand and process Web resources without human intervention [61]. More users
mean more sensors and also, as these users and sensors provide data to applications
and platforms, developers will be more able to deal with the “real-world problems”
[8]. As Goodchild [62] says, there are six billion humans on the Earth which is six
billion sensors.
In terms of transportation, Web 2.0 has already facilitated information
dissemination, public participation in decision making processes, communication and
collaboration; reduced dependency to the desktops and desktop applications; and
expedited data and information sharing [5], [9], [10], [15]. From public relations to
maintenance, operations and even major transportation planning projects, Web 2.0 has
influenced all components of transportation. In terms of future potential, Web 2.0 and
also Web Squared are presented in two categories: short-term potentials (1-2 years)
and long-term potentials (3-5 years). It is important to understand that long-term
assumptions or evaluations for the next 15-20 years might not be realistic because
technology changes rapidly. The invention of the World Wide Web was about 20
97
years ago. In 1990, who could have known that Web will become a personal assistant
of individuals in 20 years? Also, Web 2.0 is about 6-7 years old. Therefore, a 3-5
years prediction could be considered long-term.
6.1. Short-term Potentials
We have witnessed that recent web developments facilitated providing
and using open-source data and governments also encouraged institutions and
agencies to utilize the system. Utilization of the open-source data and applications will
increase in following years; data and information will be more available and
applications which use open data will explode. Welch et al. [46] stated that many local
organizations would like to make most of the data they have available to everyone
within systems for collaboration and cooperation. However, they emphasized that
because many data are not digitally created and stored and even digitally stored data
are not compatible with other software and programs, the process of data-openness is
very difficult to implement. Nevertheless, advances in technology have begun to
facilitate the compatibility of data resources with the creation and storage of the
digital data. Schlossberg and Brehm’s [63] study, which discusses the development
and implementation of two GIS-based mobile applications for public to create
georeferenced local data, shows the easiness of obtaining complex data which is
ready-to-use and compatible with most GIS analysis software. Osimo [12] highlights
the importance of data availability and the potential of Web 2.0 in terms of utilizing it
with the following statement:
“The wide availability of public data for re-use seems to be an important enabling factor for Web 2.0 application to flourish. Indeed, the managers of these initiatives agreed that wider availability of public data was their main recommendation to policy makers”.

98
Increasing the communication and collaboration between agencies,
institutions and professionals is another potential effect of Web 2.0 and advanced web
technologies in the next 1-2 years. Collaborative editing applications such as wikis
and synchronous conferencing technologies such as webinars are some of the systems
that facilitate interaction.
From a public relation point of view, transportation agencies have already
employed Web 2.0 to increase and ease public participation in transportation planning
projects. Metro’s Build Your High Capacity System, Chicago Metropolitan Planning
Agency’s Go to 2040 Invent 2040 and Peer-to-plan CSS 2.0 are some of the notable
applications that utilize Web 2.0 technologies and tools to facilitate the public
involvement. As mentioned in Schlossberg and Brehm’s [63] study, public are even
able to provide georeferenced local data such as street and sidewalk conditions,
bikeability of the neighborhood and quality of the transit operations. In this point,
transportation agencies will not want to miss the opportunity of cooperating with the
public. Hopefully, transportation agencies will collaborate and cooperate with the
public more via Web 2.0 applications in the near future.
Another possible effect of Web 2.0 could be increasing the transparency
of the transportation agencies in following years. As Osimo [12] stated, transparency
is one of the important changes for future governments. Web 2.0 technologies and
tools which increase citizens’ awareness, facilitate public participation, provide data
and information about the agency, projects and implementation processes of the
projects will increase the transparency of the transportation agencies.
Transit operations have also been affected by Web 2.0 in recent years.
Google Transit is one of the most known Web 2.0 mashup applications that provide
99
information, facilitate trip planning by transit and encourage usage of the public transit
system. Although Google Transit does not cover all transit operation in the U.S., many
metropolitan areas utilize the system to provide data and information to public.
Google Transit included more than 446 cities’ transit information across the world as
of July 2010 and the number will probably increase in the next 1-2 years. Hopefully, it
will cover all transit systems of the U.S.
6.2. Long-Term Potentials
Potential of the assistive web technologies such as web-based decision
support systems, mapping mashup applications and design tools will surely affect the
transportation planning process and traffic analysis methods. Most of these web-based
applications do not require software installation and do not charge for utilization of
the system. These mostly free web-based applications will be more popular and used
by transportation agencies in the next 3-5 years. Mapping mashup applications such as
Build Your High Capacity System and SeeClickFix, sketch design tools such as
Google Sketchup, and collaborative editing applications such as wiki facilitate
planning process and reduce the cost of the project by eliminating the dependency on
software programs.
In addition to the free web-based services, Software as a Service (SaaS)
applications will be more offered in the near future. SaaS provides its applications
online and does not require software installation in desktops; in this way, it minimizes
technical and usage problems. It is expected that even heavy-duty computer programs
will be available in the near future as a service. Citilabs’ Mint has already pointed out
the change.

100
Rapid advances in sensor technology are introduced at the beginning of
the Chapter. From this perspective, we will probably witness more automated
applications, smarter devices which can understand and process the data and
information [61], and information networks that components of the network can
communicate to each other. It is obvious that developments in technology will
increase the quality and amount of the data and information that agencies receive from
sensors and traffic monitoring devices. O’Reilly and Battelle [8] indicated that
Internet-enabled GPS applications – in mostly cell phones, report vehicle speed and
estimate arrival time based on the traffic ahead. Also, they explained today’s and
future’s traffic estimations by saying: “Today, traffic patterns are largely estimated;
increasingly, they will be measured in real time”. I believe that timely and accurate
real-time traffic information and data will be ordinary in 3-5 years and accessible by
web tools and mobile phones. In addition to the real-time information, creation of the
real-time OD matrix will be possible with advanced communication techniques.
As mentioned in Short-term Potentials, transit applications are expected to
be more advanced in 3-5 years. In addition to the trip planning, real-time movements
of the transit vehicles on a map, details of the vehicle (such as number of passengers,
fares, advisory information, etc.), and even information about friends on-board could
be available.
The Commuter Information System, which is introduced and explained in
Chapter 5, will be the first step of the automated information dissemination for
drivers. In the next five years, a system that monitoring devices can process and
analyze the data and inform the built-in vehicle devices about the traffic condition will
not be imaginary or fantasy. According to Cohn [64], a new system which is called

101
“high-definition traffic” has been implemented in some European countries that
provides traffic information directly to the Tom Tom navigation devices in vehicles.
Traffic information and data that is collected from different sources (GPS system for
mobile communication networks, Tom Tom navigation devices, governmental
institutions -traffic centers and historical traffic information) is used to provide real
time traffic information and calculate routes based on the real time traffic.
Further, there is a high possibility that smartphones, built-in vehicle
systems or any other devices that can utilize different information sources to provide
possibilities will be able to make choices without your instruction. Additionally, as
system used in time, devices will be familiar with the users’ lifestyle, rituals and
practices, and act as a personal assistant of them. For example, if you are driving from
New York to Washington D.C., your personal assistant, such as smartphone, can
provide all different types of information that you need or are interested in such as:
real time traffic conditions on I-95 and possible alternative routes, attraction places on
your route based on your interest, restaurants that you may be interested in visiting
based on your previous visits, and even your friends in a buffer zone of your travel
route.
Another potential of Web 2.0 will be utilization of the virtual worlds for
information dissemination, communication, education, and most importantly practices
of applications. Some transportation agencies such as the Los Angeles Metropolitan
Authority [39], governmental institutions, and universities such as the University of
Delaware [38], have already started to utilize virtual applications.
102
6.3. Summary of the Chapter
Chapter 6 covered the potential of Web 2.0 and advanced Web
technologies in transportation area for the near future. Possible developments and the
applications were discussed in two categories: short-term potentials and long-term
potentials. Effect of the possible changes in sensor technology, improved transit
operations, availability of free applications and tools that could be used in
transportation, and virtual worlds were some of the topics that were mentioned. In
addition to the predictions of the web developers and transportation professional,
personal comments and predictions were presented.
103
Chapter 7
SUMMARY, CONCLUSIONS AND RECOMMENDATIONS
7.1. Summary of Findings
The Internet and Web are indispensable parts of our lives. Advanced
technologies have facilitated the utilization of Internet and web sources. Beginning
from the 1990s with the invention of the World Wide Web, information and
communication have become easier. After a decade, Web 2.0 has changed the ways of
communication by providing real-time and online interaction. Online services such as
eBay and Amazon were the first sign of today’s ordinary applications in the early
2000s. Then, marketing industry and education industry have adapted this new version
of the Web, Web 2.0, in the early stages. After realizing the capabilities of Web 2.0
technologies and tools, many other industries, governmental institutions, and private
companies have started to utilize it.
Web 2.0 technologies and tools have been increasingly employed by the
transportation industry like many of the professional industries. Especially,
information dissemination, intra- and cross-agency collaboration, and public relations
have become easier and faster with Web 2.0.
In this study, Web 2.0 technologies and tools, and also applications in the
transportation area were presented in Chapter 2 and Chapter 3. Applications in
transportation area were presented in four categories: information dissemination,
transportation planning, public collaboration, and social networking. Particularly in
104
transportation planning category, the effect of Web 2.0 technologies and tools on
transportation planning studies, public involvement in planning processes, and
information providing about planning processes and projects were emphasized.
In order to understand the utilization of Web 2.0 in transportation area and current
web-technology familiarity of transportation professionals, a national level survey was
conducted and the results of the survey were presented in Chapter 4. Survey results
demonstrated that transportation professionals are aware of current web technologies
and Web 2.0; however, many of them are not utilizing these technologies and tools for
transportation related purposes. 24% of the respondents mentioned that they are
utilizing Web 2.0 for work purposes.
In Chapter 5, a theoretical framework was proposed to facilitate real-time
traffic information dissemination for daily commuters. In the Commuter Information
System (CIS), real-time traffic data which is received from traffic monitoring devices
(sensors, surveillance cameras, cell phone data, etc.) is utilized to inform drivers about
traffic conditions on the roadways. Web 2.0 technologies and tools facilitate the data
entry process for commuters. User friendly interface and facilitating tools such as
mapping mashup applications simplify and expedite the data entry process, social
networking component provides communication and collaboration between
commuters and system operators, and the CIS also improves the updates for and/or the
creation of the origin-destination (OD) matrix for further studies.
Finally, the next step of Web 2.0, named Web Squared, Semantic Web,
Web 3.0, and future potential of the current web technologies were presented in
Chapter 6. Because information and communication technologies are growing rapidly,

105
future potential of Web 2.0 and Web Squared were explained in two categories: short
term potential (1-2 years) and long-term potential (3-5 years).
7.2. Conclusions
The main goal of this study has been achieved: namely, to examine the
utilization of Web 2.0 technologies and tools in transportation area.
One of the main objectives of the study was to analyze the most utilized Web 2.0
technologies and tools in transportation area and their effectiveness. This objective
was explained with very successful practices and applications. Especially Web-based
applications, social networking, mapping mashups, collaborative editing tools, and
synchronous conferencing technologies have been employed by transportation
professionals and agencies. In addition to information dissemination and public
relations, Web 2.0 has a significant effect on transportation planning studies. Intra-
and cross-agency collaboration and public involvement in a planning process has
become easier and convenient via Web 2.0. Another important contribution of Web
2.0 is facilitating real-time information and data sharing for transportation studies.
Web-based mapping applications have also been positively affected from Web 2.0
technologies and tools. Powerful GIS applications and map service providers such as
Google Maps and Bing Maps facilitated increased utilization of mapping mashup
application even by non-expert users.
In addition to current Web 2.0 utilization in transportation area, future
potential of web technologies has also been analyzed. Web 2.0 has facilitated
communication and collaboration between people and sparked the interaction between
humans and devices. The most significant changes will be the smart computers and
devices after Web 2.0, in Web Squared. Computers will be able to process the

106
information and data to facilitate decision making processes. We have already seen
some of these applications. For instance, advertisements in Amazon.com are generated
based on web profile, interests and shopping history.
The second main objective of the study was presenting the transportation
professionals’ Web 2.0 utilization profile. This objective has been met by presenting
the results of a national level survey. The survey has pointed out that, although
transportation professionals are aware of Web 2.0 technologies and tools, they are not
utilizing them in transportation area as much. Also, results of the survey highlighted
that Web 2.0 is very effective in public relations and effective in transportation
planning and transportation education areas. One surprising result was that, 53% of
respondents stated that they are not aware of mashup applications. However, mashups,
especially mapping mashup applications, are one of the most utilized Web 2.0
applications in transportation. In this point, some respondents might be familiar with
the practices but not the name.
The third objective was to investigate the effect of Web 2.0 technologies
and tools on congestion management. A theoretical framework, CIS has been
proposed to meet this objective. The Commuter Information System (CIS) provides
real-time traffic information to daily commuters. In this system, Web 2.0 technologies
and tools have been utilized to facilitate data entry and information dissemination
processes. Social networking applications are aimed at providing an online
environment for communication between commuters and system operators. Mapping
mashup applications are also utilized to simplify data entry process.
The last objective of the study was presenting the effects of Web 2.0
technologies and tools on transportation. The study presents successfully implemented

107
Web 2.0 applications in transportation areas and discusses the effectiveness of
applications in different places. However, Web 2.0 technologies and tools are not only
effective in transportation industry but also in every part of our daily and professional
lives. For this reason, the point to be considered is how effectively we are using Web
2.0 technologies and tools.
7.3. Recommendations
Web 2.0 is practically a new area for transportation industry; however,
current utilization of Web 2.0 technologies has a great effect on transportation studies.
As a rapid growing system, Web 2.0 and the next step, Web Squared, are needed to be
considered by transportation industry in order to increase the benefits of the web
technologies. For further studies, following future tasks are recommended:
• Effects of Web 2.0 technologies and tools on different transportation
modes and areas need to be studied.
• Based on the survey results, possible methods and ways to increase the
utilization of Web 2.0 by transportation professionals could be developed.
• Future potential of Web 2.0 and Web Squared could be analyzed in detail.
• In terms of Web 2.0 utilization in congestion management, Commuter
Information System can be applied on a small scale to evaluate and test the
system.

108
BIBLIOGRAPHY
[1] G. Flammia and A. Rabinowicz, "Turning Transportation Planning Data Into
Effective Web Sites," Washington D.C.: Transportation Research Board, 2004.
[2] C.T. Casper and F. Orr, "Metropolitan Planning Organization Use of Google Earth as a Visualization Tool to Aid Public Involvement and Integration of NEPA with Transportation Planning," Washington D.C.: Transportation Research Board, 2007, pp. 1-23.
[3] J. Bhatt, S. Chandra, and D. Denick, "Using Web 2 . 0 Applications as Information Awareness Tools for Science and Engineering Faculty and Students in Academic Institutions," Philadelphia, PA: DSpace at Drexel University Libraries (United States), 2009.
[4] J. Jarvis, What Would Google Do?, New York, New York, USA: Harper Business, 2009.
[5] T. Funk, Web 2.0 and Beyond, Westport, Connecticut: 2009.
[6] "History of the World Wide Web."
[7] D. DiNucci, "Fragmented Future," Design & New Media, vol. 53, 1999.
[8] T. O'Reilly and J. Battelle, "Web Squared: Web 2.0 Five Years On," Continuing Education in Anaesthesia, Critical Care, vol. 7, 2009.
[9] T. O'Reilly, "What is Web 2.0."
[10] "Web 2.0," Wikipedia.
[11] R.W. Gehl, "A Cultural and Political Econoly of Web 2.0," Identity, 2010.
[12] D. Osimo, "Web 2 .0 in Government : Why and How ?," Innovation, 2008.
[13] "Internet Usage and Broadband Usage Report," 2009.
[14] W.P. Morris, K. Robertson, and J. Spinks, "Utilizing Information Technology in Innovative Marketing Approaches for Public Transportation," Security, 2010.
109
[15] G.D. Angelo, F. Vitali, and S. Zacchiroli, "Content Cloaking : Preserving Privacy with Google Docs and other Web Applications," Sierre, Switzerland: Symposium on Applied Computing, 2010.
[16] "MINT."
[17] A. Maxmen, Science Networking Gets Serious., 2010.
[18] "7 Things You Should Know About Collaborative Editing," Educause, 2005, pp. 1-2.
[19] N. Naik and A. Nash, Peer-to-plan CSS 2.0: A Web 2.0 Application to Facilitate Public Collaboration in the Project Planning and Design Process.
[20] S. Vogel, "For Intelligence Officers, A Wiki Way to Connect Dots," Washington Post.
[21] "Intellipedia Celebrates Third Anniversary with a Successful Challenge," Central Intelligance Agency.
[22] "Cyclopath."
[23] A. Bruns, "Ubiquitous Online News : Content Syndication and the Semantic Web," University of Sussex, Brighton: Association of Internet Researchers Conference, .
[24] "Greater Greater Washington."
[25] "Livable Streets," vol. 73.
[26] "Fast Lane - The official Blog of the U.S. Secretary of transportation," vol. 5.
[27] "MyBikeLane."
[28] "Learn More About Delicious," Delicious, vol. 23.
[29] "What is Digg?," Digg.
[30] "Maryland State Highway Administration's Channel."
[31] "Flickr WSDOT's Photostream," 2007.
[32] "RSS Syndication."
[33] A.G. Lauron, "FOSTERING COLLABORATION TO ENHANCE ONLINE INSTRUCTION," Turkish Online Journal of Distance Education, vol. 9, 2008, pp. 109-122.

110
[34] "What is Dimdim?."
[35] "Tag Cloud."
[36] C. Mehta, "US Presidential Speeches Tag Cloud," 2007.
[37] C. Aldrich, "Virtual Worlds, Simulations, and games for Education: A Unifying View," Innovate, vol. 4, 2009, pp. 340-352.
[38] "University of Delaware in Second Life," vol. 7, 2010.
[39] "Metro - Second Life."
[40] "Metro - Social Media - Web 2.0."
[41] M. Macedonia, "Games and E ducation," Computer, 2006.
[42] M. Batty, A. Hudson-Smith, R. Milton, and A. Crooks, "Map mashups, Web 2.0 and the GIS Revolution," Annals of GIS, vol. 16, 2010, pp. 1-13.
[43] "NZ Transport Agency Virtual Highway."
[44] "About Gapminder," Gapminder.
[45] "advantages-and-disadvantages-of-web-2."
[46] T. Welch, K. Tufte, R.S. Mccourt, R.L. Bertini, and A. Snook, "Implementing a Web-based Transportation Data Management System," ITE District 6 Annual Meeting, 2006, pp. 1-8.
[47] "CTPP Web-based Mapping and Query System," U.S. Department of Transportation.
[48] "gCensus."
[49] "MassStats."
[50] "FlightRadar24."
[51] "Istanbul Ataturk Airport IST (LTBA) Status."
[52] "Build Your High Capacity System."
[53] R.S. Walker, C.D. Butler, and S. David, "Transportation Decision Support Systems Using Google Earth Technology," Washington D.C.: Transportation Research Board, , pp. 1-12.
[54] "Goto2040invent2040."
111
[55] "Trapster."
[56] "eRideShare."
[57] "SeeClickFix About Us."
[58] "NEWCO: A Web Based Neighborhood Watch," Connact.com.
[59] "Mendeley."
[60] "National Strategy to Reduce Congestion on America's Transportation Network," United States of America Department of Transportation, 2006.
[61] I. Torre, "Adaptive systems in the era of the semantic and social web , a survey," User Modeling and User-Adapted Interaction, vol. 19, 2009, pp. 433-486.
[62] M.F. Goodchild, "Citizens as Voluntary Sensors : Spatial Data Infrastructure in the World of Web 2 . 0," International Journal of Spatial Data Infrastructures Research, vol. 2, 2007, pp. 24-32.
[63] M.A. Schlossberg and C. Brehm, "Participatory Geographic Information Systems and Active Transportation- Collecting Data and Creating Change," Transportation Research Record: Journal of the Transportation Research Board, 2009, pp. 83-91.
[64] N. Cohn, "Real-Time Traffic Information and Navigation: An Operational System," Transportation Research Board, 2009, pp. 129-135.

112
Appendix A: Survey

Part 1: General Information
Web 2.0 Technologies and Tools Usage in Transportation
Q1
Engineer
Planner
Researcher
Designer
Builder
Technician
Academic
Other:
What is your profession? (mark all that apply)
Q2
Transportation Planning
Design and Construction
Operations and Management
Traffic Engineering
Infrastructure Management
Public Transportation
Energy and Environment
Data and Information Systems
Policy and Organization
Safety
Intelligent Transportation System (ITS)
Research and Education
Other:
What is your study or work area? (mark all that apply)
Q3
State Level Institution/Agency/Organization (State DOT's, Municipalities, etc)
National Level institution/agency/organization (USDOT, FHWA, FTA, etc)
Metropolitan Organization (MPO)
University, Research Center, etc.
Private Firm
Other:
What is your organization type? (mark all that apply)
Qualtrics Survey Software http://delaware.qualtrics.com/ControlPanel/?ClientAction=EditSurvey&S...
1 of 8 4/28/2010 4:07 PM
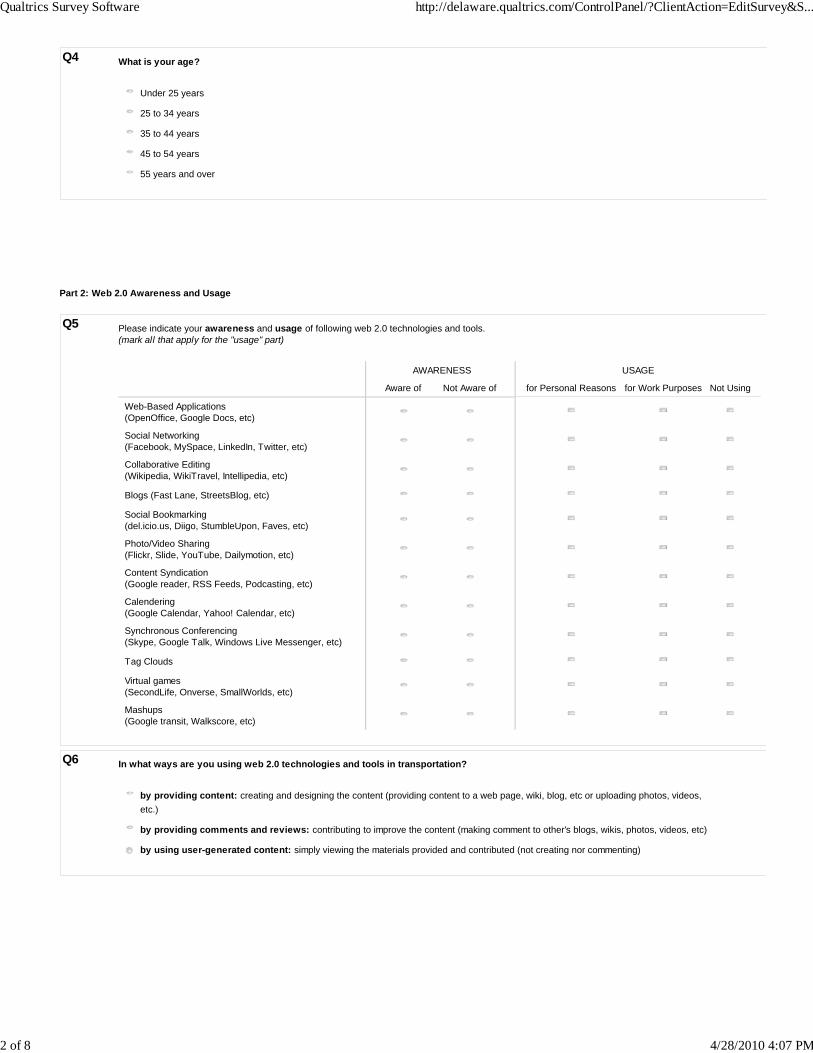
Part 2: Web 2.0 Awareness and Usage
Q4
Under 25 years
25 to 34 years
35 to 44 years
45 to 54 years
55 years and over
What is your age?
Q5 Please indicate your awareness and usage of following web 2.0 technologies and tools.(mark all that apply for the "usage" part)
AWARENESS USAGE
Aware of Not Aware of for Personal Reasons for Work Purposes Not Using
Web-Based Applications(OpenOffice, Google Docs, etc)
Social Networking(Facebook, MySpace, LinkedIn, Twitter, etc)
Collaborative Editing(Wikipedia, WikiTravel, Intellipedia, etc)
Blogs (Fast Lane, StreetsBlog, etc)
Social Bookmarking(del.icio.us, Diigo, StumbleUpon, Faves, etc)
Photo/Video Sharing(Flickr, Slide, YouTube, Dailymotion, etc)
Content Syndication(Google reader, RSS Feeds, Podcasting, etc)
Calendering(Google Calendar, Yahoo! Calendar, etc)
Synchronous Conferencing(Skype, Google Talk, Windows Live Messenger, etc)
Tag Clouds
Virtual games(SecondLife, Onverse, SmallWorlds, etc)
Mashups(Google transit, Walkscore, etc)
Q6
by providing content: creating and designing the content (providing content to a web page, wiki, blog, etc or uploading photos, videos,
etc.)
by providing comments and reviews: contributing to improve the content (making comment to other's blogs, wikis, photos, videos, etc)
by using user-generated content: simply viewing the materials provided and contributed (not creating nor commenting)
In what ways are you using web 2.0 technologies and tools in transportation?
Qualtrics Survey Software http://delaware.qualtrics.com/ControlPanel/?ClientAction=EditSurvey&S...
2 of 8 4/28/2010 4:07 PM

Q7
I would definitely prefer free technologies and tools
I would prefer free or inexpensive technologies and tools
I would consider the quality of technologies and tools not the price
I am not paying for technologies and tools
How effective is the cost of the technologies and tools on your usage?
Q8 Based on your professional experience and knowledge of current technology, how effective is the Web 2.0 technologies and tools on the followingtransportation modes?
Very Effective Effective Somewhat EffectiveNeither Effectivenor Ineffective Ineffective
Air Services
Water Services
Rail Services
Transit services
Driving with personal cars
Biking
Walking
Q9 Based on your professional experience and knowledge of current technology, how effective is the Web 2.0 technologies and tools on thefollowing transportation areas?
Very Effective Effective Somewhat EffectiveNeither Effectivenor Ineffective Ineffective
Transportation Planning
Transportation Design
Transportation Maintenance
Transportation Operations
Transportation Education
Project Implementation
Public Relations
Qualtrics Survey Software http://delaware.qualtrics.com/ControlPanel/?ClientAction=EditSurvey&S...
3 of 8 4/28/2010 4:07 PM

Q10 Based on your professional experience and knowledge of current technology, please choose three Web 2.0 technologies and tools whichhave the most significant effect on the following transportation areas?(Choose three for each transportation area - Three for each column)
TransportationPlanning
TransportationDesign
TransportationMaintenance
TransportationOperations
Transportationeducation
Projectimplementation
Publicrelations
Web-based Applications(OpenOffice)
Social Networking(Facebook, LinkedIn)
Collaborative Editing(Wikis)
Blogs
Social Bookmarking(Del.icio.us)
Photo/Video sharing(YouTube, Flickr)
Content Syndication(RSS, Podcasting)
Calendering(Google Calender)
Synchronous Conferencing(Skype, Google Talk)
Tag Clouds
Virtual Games(SecondLife)
Mashups(Walkscore)
Q11 How often do you visit or use following transportation related web technologies and tools?
Never
Less thanOnce aMonth
Once aMonth
2-3 Timesa Month
Once aWeek
2-3 Timesa Week Daily
Institutional web pages
Transportation related social networking pages orgroups (Facebook, LinkedIn, Twitter pages/groups. etc)
Transportation related Collaborative Editingtechnologies or tools
Transportation related blogs
Content syndication technologies and tools (RSS,Podcastinng, etc)
Transportation related Mashup applications
Q12 What are your main reasons of using web 2.0 technologies and tools?(mark all that apply)
Personal Usage (for fun or for personal reasons) Transportation Related Usage
Social interaction
Sharing materials
Dissemination of knowledge/information
Peer based collaboration
Following institutional web pages
Following other people's thoughts, ideas, etc
Qualtrics Survey Software http://delaware.qualtrics.com/ControlPanel/?ClientAction=EditSurvey&S...
4 of 8 4/28/2010 4:07 PM

Q13 Which web 2.0 technologies and tools are you using to share information/data with your colleagues for either intra-agency or cross-agencycooperation/collaboration? (mark all that apply)
Intra-agency Cross-agency
cooperartion cooperation
Web-Based Applications(OpenOffice, Google Docs, etc)
Social Networking(Facebook, MySpace, LinkedIn, Twitter, etc)
Collaborative Editing(Wikipedia, WikiTravel, Intellipedia, etc)
Blogs (Fast Lane, StreetsBlog, etc)
Social Bookmarking(del.icio.us, Diigo, StumbleUpon, Faves, etc)
Photo/Video Sharing(Flickr, Slide, YouTube, Dailymotion, etc)
Content Syndication(Google reader, RSS Feeds, Podcasting, etc)
Calendering(Google Calendar, Yahoo! Calendar, etc)
Synchronous Conferencing(Skype, Google Talk, Windows Live Massenger, etc)
Tag Clouds
Virtual games(SecondLife, Onverse, SmallWorlds, etc)
Mashups(Google transit, Walkscore, etc)
Q14 Please rank the benefits of using web 2.0 technologies and tools in transportation.(1: most beneficial, 7: least beneficial)
Easy to Use
Participative and Inclusive
Cross-Agency Cooperation/Collaboration
Intra-Agency Cooperation/Collaboration
Cost Reductive
Transparent
Time independence / Flexibility
Q15 Please rank the risks of using web 2.0 technologies and tools in transportation(1: most risky, 8: least risky)
Low participation
Low quality of contributions
Loss of control - Manageability problems
Destructive behavior by users
Privacy and security issues
Manipulation of content by participants
User profile - rate of the internet accessibility over population
Computer/internet dependency
Qualtrics Survey Software http://delaware.qualtrics.com/ControlPanel/?ClientAction=EditSurvey&S...
5 of 8 4/28/2010 4:07 PM

Part 3: Agency Information
Q16 Is your institution/agency/organization using or planning to use any of these following web 2.0 technologies or tools? (Please, mark all that apply)
Using Planning to use Do not know
Web Services
Web-Based Applications(OpenOffice, Google Docs, etc)
Social Networking Technologies and Tools
Collaborative Editing Technologies and Tools
Blogs
Social Bookmarking Technologies and Tools
Photo/Video Sharing Technologies and Tools
Content Syndication Technologies and Tools
Calendering Technologies and Tools
Synchronous Conferencing Technologies and Tools
Tag Clouds
Virtual Games
Mashup Technologies and Tools
Q17 Is your institution/agency/organization investing or planning to invest in any of these following web 2.0 technologies or tools? (Please, mark all thatapply)
Investing Planning to invest Do not know
Web Services
Web-Based Applications(OpenOffice, Google Docs, etc)
Social Networking(Facebook, MySpace, LinkedIn, Twitter, etc)
Collaborative Editing Technologies and Tools
Blogs
Social Bookmarking Technologies and Tools
Peer to peer Networking Technologies and Tools
Photo/Video Sharing Technologies and Tools
Content Syndication Technologies and Tools
Calendering Technologies and Tools
Synchronous Conferencing Technologies and Tools
Tag Clouds
Virtual Games
Mashup Technologies and Tools
Qualtrics Survey Software http://delaware.qualtrics.com/ControlPanel/?ClientAction=EditSurvey&S...
6 of 8 4/28/2010 4:07 PM

Q18
Well timed and sufficient investment.
Well timed but not sufficient investment.
Well timed but redundant investment.
Sufficient but not well timed investment.
Not well timed nor sufficient investment.
Other:
Please share your opinion about the sufficiency of your institution/agency/organization's investment in the Web 2.0 technologies or tools.
Q19 Please identify the three technologies or tools that are most important to your institution/agency/organization in terms of following transportationimprovement areas.(Please, mark three for each column)
InformationDissemination Public Relations
Peer BasedProfessionalCollaboration
Cross-AgencyCooperation
Web Services
Web-Based Applications(OpenOffice, Google Docs, etc)
Social Networking Technologies and Tools
Collaborative Editing Technologies and Tools
Blogs
Social Bookmarking Technologies and Tools
Peer to peer Networking Technologies andTools
Photo/Video Sharing Technologies and Tools
Content Syndication Technologies and Tools
Calendering Technologies and Tools
Synchronous Conferencing Technologies andTools
Tag Clouds
Virtual Games
Mashup Technologies and Tools
Q20
Information dissemination
Social Interaction
Providing maps, data, documents, etc
Encouraging public involvement
Intra-agency cooperation
Cross-agency cooperation
Advancing technical knowledge and providing training
Education, workshop, tutorials, etc
What are the most important three reasons of your institution/agency/organization for using Web 2.0 technologies and tools?(Please, mark only three)
Qualtrics Survey Software http://delaware.qualtrics.com/ControlPanel/?ClientAction=EditSurvey&S...
7 of 8 4/28/2010 4:07 PM

Q21 (Optional) What do you think are the most effective ways of increasing the usage of web 2.0 technologies and tools by transportationprofessionals?
Q22 (Optional) What do you think about the web applications/software instead of desktop applications/software in transportation area?
Q23 (Optional) What do you expect from web technologies and tools in the next 3-5 years in transportation area?
Qualtrics Survey Software http://delaware.qualtrics.com/ControlPanel/?ClientAction=EditSurvey&S...
8 of 8 4/28/2010 4:07 PM