weather station website presented by: pratima vijayakumar rafi ahmed qureshi vinay gaonkar course...
Post on 19-Dec-2015
214 views
TRANSCRIPT

Weather Station Website
Presented By:Pratima VijayakumarRafi Ahmed Qureshi
Vinay Gaonkar
Course Instructor: Dr. Charles Tappert

Today’s Presentation About the Pace Weather Station Why build a Weather Station Website? Goals of the project Tasks Screen Shots Methodology Conclusion

About the Pace Weather Station Pace has purchased and installed a Davis Vantage Pro Wireless
Weather Station. It is housed at the Pace Environmental Center (the farmhouse). Information from the data collectors (rain gauge, anemometer, wind
vane, barometer, temperature, solar incidence) are received and displayed at the base station.
In addition, Pace has purchased the Davis WeatherLink software which is an interface that connects the base station to a computer. It displays the weather information in the form of reports and graphs.

Data Display On WeatherLink Software
Bulletin Display:

Data Display On WeatherLink Software
Strip Charts:

Data Display On WeatherLink Software
Graphs:

Need for a Weather Station Website
Current system constraints the users from using it for two main reasons: System housed in Pleasantville, requiring any
person interested in using the system to be physically present in front of the system.
System is not user-friendly.
Big Decision – MAKE or BUY?
Extensive research to make this vital decision: What do other schools do? Drew a conclusion

Big Decision – MAKE or BUY? Oregon State University:
Uses WeatherLink software Unreliable web interface – dead links
University of Michigan: Used UM Weather software for 2 years Dissatisfied Students building a website Grant approved

Other Services There are few other free and paid services
that offer to build websites – www.weather.com & www.weatherbug.com Free ones are non-customizable, limited
functionalities, common Paid ones are too expensive

Decision Better to MAKE than BUY because
Can be customized to suit client requirements. No cost of development, operation and maintenance since all
resources are provided by Pace University and guidance is provided by Dr. Charles Tappert.
Since database is also designed and developed by us, this allows for handling, presentation and manipulation of data in the desired fashion.

Goals of the project
Display all weather related data, in a user-friendly manner, on a website. Display daily statistics Display monthly statistics Display tabular data for a particular day Graphical display for temperature, pressure, humidity, wind
speed and wind direction

Tasks Understand the vantagePro system Create a database with all the weather data Create a user interface Display any data that a user can request,
on the interface Display in tabular form and graphical form

Methodology
Technologies used: Back end – SQL Server Front End – ASP, XML, HTML, Flash

Methodology (Contd.) Database Design
The database has been populated with the data in the CSV files, procured from the base station.
There are individual tables for all parameters (temperature, humidity, barometric pressure etc.)
All stored according to date.

Methodology (Contd.) Front End
Queries are built into ASP Information is displayed according to query For graphical display, XML data is fed into a flash
component and graphs are built. XML files are generated dynamically using ASP.

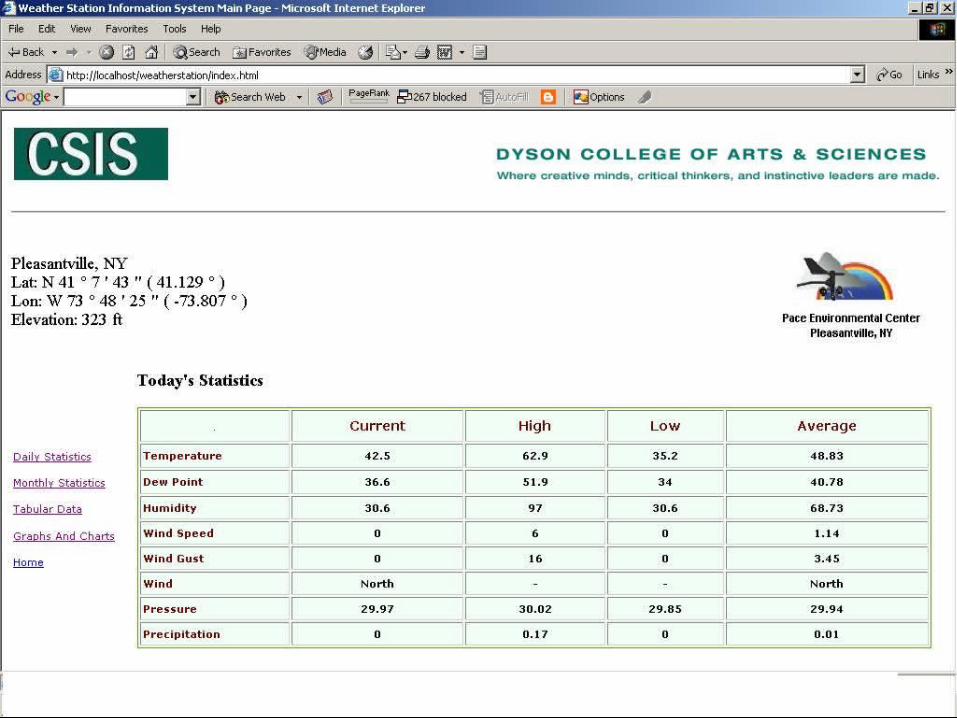

Screen Shots
Daily Statistics:


Screen Shots (Contd.)
Tabular Display:

Screen Shots (Contd.)
Graphical Display:


Suggested Future Enhancements Interface to download all weather data
directly into the system. Implement dynamic weather dial. Display sun data.
Questions?
We would be glad to answer any of your questions.
Thanks for your attention!