weak defect identification for centrifugal compressor
TRANSCRIPT
University of Wollongong University of Wollongong
Research Online Research Online
Faculty of Engineering and Information Sciences - Papers: Part B
Faculty of Engineering and Information Sciences
2018
Weak defect identification for centrifugal compressor blade crack based on Weak defect identification for centrifugal compressor blade crack based on
pressure sensors and genetic algorithm pressure sensors and genetic algorithm
Hongkun Li Dalian University of Technology
Changbo He Dalian University of Technology, University of Lyon
Reza Malekian University of Pretoria
Zhixiong Li University of Wollongong
Follow this and additional works at: https://ro.uow.edu.au/eispapers1
Part of the Engineering Commons, and the Science and Technology Studies Commons
Recommended Citation Recommended Citation Li, Hongkun; He, Changbo; Malekian, Reza; and Li, Zhixiong, "Weak defect identification for centrifugal compressor blade crack based on pressure sensors and genetic algorithm" (2018). Faculty of Engineering and Information Sciences - Papers: Part B. 1321. https://ro.uow.edu.au/eispapers1/1321
Research Online is the open access institutional repository for the University of Wollongong. For further information contact the UOW Library: [email protected]

Weak defect identification for centrifugal compressor blade crack based on Weak defect identification for centrifugal compressor blade crack based on pressure sensors and genetic algorithm pressure sensors and genetic algorithm
Abstract Abstract The Centrifugal compressor is a piece of key equipment for petrochemical factories. As the core component of a compressor, the blades suffer periodic vibration and flow induced excitation mechanism, which will lead to the occurrence of crack defect. Moreover, the induced blade defect usually has a serious impact on the normal operation of compressors and the safety of operators. Therefore, an effective blade crack identification method is particularly important for the reliable operation of compressors. Conventional non-destructive testing and evaluation (NDT & E) methods can detect the blade defect effectively, however, the compressors should shut down during the testing process which is time-consuming and costly. In addition, it can be known these methods are not suitable for the long-term on-line condition monitoring and cannot identify the blade defect in time. Therefore, the effective on-line condition monitoring and weak defect identification method should be further studied and proposed. Considering the blade vibration information is difficult to measure directly, pressure sensors mounted on the casing are used to sample airflow pressure pulsation signal on-line near the rotating impeller for the purpose of monitoring the blade condition indirectly in this paper. A big problem is that the blade abnormal vibration amplitude induced by the crack is always small and this feature information will be much weaker in the pressure signal. Therefore, it is usually difficult to identify blade defect characteristic frequency embedded in pressure pulsation signal by general signal processing methods due to the weakness of the feature information and the interference of strong noise. In this paper, continuous wavelet transform (CWT) is used to pre-process the sampled signal first. Then, the method of bistable stochastic resonance (SR) based on Woods-Saxon and Gaussian (WSG) potential is applied to enhance the weak characteristic frequency contained in the pressure pulsation signal. Genetic algorithm (GA) is used to obtain optimal parameters for this SR system to improve its feature enhancement performance. The analysis result of experimental signal shows the validity of the proposed method for the enhancement and identification of weak defect characteristic. In the end, strain test is carried out to further verify the accuracy and reliability of the analysis result obtained by pressure pulsation signal.
Disciplines Disciplines Engineering | Science and Technology Studies
Publication Details Publication Details Li, H., He, C., Malekian, R. & Li, Z. (2018). Weak defect identification for centrifugal compressor blade crack based on pressure sensors and genetic algorithm. Sensors, 18 (4), 1264-1-1264-19.
This journal article is available at Research Online: https://ro.uow.edu.au/eispapers1/1321
sensors
Article
Weak Defect Identification for CentrifugalCompressor Blade Crack Based on Pressure Sensorsand Genetic Algorithm
Hongkun Li 1, Changbo He 1,2,*, Reza Malekian 3,* ID and Zhixiong Li 4 ID
1 School of Mechanical Engineering, Dalian University of Technology, Dalian 116024, China; [email protected] Laboratoire Vibrations Acoustique, University of Lyon, INSA-Lyon, LVA EA677, Villeurbanne F-69621,
France3 Department of Electrical, Electronic & Computer Engineering, University of Pretoria, Pretoria 0002,
South Africa4 School of Mechanical, Materials, Mechatronic and Biomedical Engineering, University of Wollongong,
Wollongong, NSW 2522, Australia; [email protected]* Correspondence: [email protected] (C.H.); [email protected] (R.M.);
Tel.: +86-182-4111-5338 (C.H.); +27-124-204-305 (R.M.)
Received: 5 March 2018; Accepted: 15 April 2018; Published: 19 April 2018�����������������
Abstract: The Centrifugal compressor is a piece of key equipment for petrochemical factories. As thecore component of a compressor, the blades suffer periodic vibration and flow induced excitationmechanism, which will lead to the occurrence of crack defect. Moreover, the induced blade defectusually has a serious impact on the normal operation of compressors and the safety of operators.Therefore, an effective blade crack identification method is particularly important for the reliableoperation of compressors. Conventional non-destructive testing and evaluation (NDT&E) methodscan detect the blade defect effectively, however, the compressors should shut down during the testingprocess which is time-consuming and costly. In addition, it can be known these methods are notsuitable for the long-term on-line condition monitoring and cannot identify the blade defect in time.Therefore, the effective on-line condition monitoring and weak defect identification method shouldbe further studied and proposed. Considering the blade vibration information is difficult to measuredirectly, pressure sensors mounted on the casing are used to sample airflow pressure pulsation signalon-line near the rotating impeller for the purpose of monitoring the blade condition indirectly inthis paper. A big problem is that the blade abnormal vibration amplitude induced by the crack isalways small and this feature information will be much weaker in the pressure signal. Therefore, it isusually difficult to identify blade defect characteristic frequency embedded in pressure pulsationsignal by general signal processing methods due to the weakness of the feature information and theinterference of strong noise. In this paper, continuous wavelet transform (CWT) is used to pre-processthe sampled signal first. Then, the method of bistable stochastic resonance (SR) based on Woods-Saxonand Gaussian (WSG) potential is applied to enhance the weak characteristic frequency containedin the pressure pulsation signal. Genetic algorithm (GA) is used to obtain optimal parameters forthis SR system to improve its feature enhancement performance. The analysis result of experimentalsignal shows the validity of the proposed method for the enhancement and identification of weakdefect characteristic. In the end, strain test is carried out to further verify the accuracy and reliabilityof the analysis result obtained by pressure pulsation signal.
Keywords: centrifugal compressor; pressure sensor; defect identification; continuous wavelettransform; stochastic resonance; woods-saxon and Gaussian; genetic algorithm
Sensors 2018, 18, 1264; doi:10.3390/s18041264 www.mdpi.com/journal/sensors

Sensors 2018, 18, 1264 2 of 19
1. Introduction
During the operation of a centrifugal compressor, the blades suffer from combined effects ofcentrifugal force, unsteady flow and vibration and so forth [1]. Therefore, as the most sensitive part ina compressor, blades are exposed to periodic vibration and fluid excitation for the long time [2]. At thesame time, with the development of turbo-machinery, the working environment for the impeller ismore and more complex. Consequently, the blades are more susceptible to cracks and other defects.The defect information of blades is usually difficult to identify at an early stage of the crack but theblade may fracture at any time in the late stage which will lose meaning for condition monitoring.Therefore, how to detect the crack defect of blades dynamically with a relatively simple and highaccuracy method is one of the complex problems in fault diagnosis field. Generally, displacementsensors are used to detect the shaft defect [3,4] but the blade crack is always difficult to identify by shaftvibration signal because of the complex transfer path. Compared to the shaft crack, the identificationfor blade crack is more difficult.
Many scholars studied the blade condition monitoring with different ways. For example,Rao et al., proposed a method to extract the characteristic information from vibration signal of the gasturbine for recognizing the blade state [5]. Witek studied the development process of the blade crackby using a vibration signal obtained in the laboratory [2]. Egusquiza et al. studied the blade failuremechanism of a turbine pump, which provides the theoretical foundation for blade characteristicextraction [6]. In addition, acoustic emission signal is also investigated for the defect classification ofturbine blades [7]. Support vector machine has been proved to have good performance on shaft crackclassification and prediction, therefore, it was tried to diagnose the blade damage of a helicopter [8].At the same time, König conducted a series of studies on the rotating impeller failure mechanismthrough a pressure pulsation signal, which provided good results and confirmed that the vibrationinformation of the blade can be reflected in the pressure pulsation signal [9,10]. However, most ofthe research is focused on the gas turbine currently, although there exists a certain similarity betweencentrifugal compressors and gas turbines. Moreover, most of the research hasn’t focused on theblade on-line condition monitoring, especially by using pressure pulsation signal. Considering theinteraction between the blade and the airflow nearby during the operation of the compressor, pressurepulsation signal close to the rotating impeller may well reflect the health states of the blade andtherefore is selected for the identification of blade crack in this paper.
A big problem should be noted is that the characteristic information representing the blade crackis often submerged in the complex background noise, which will lead to the weak defect characteristicdifficult to identify from pressure pulsation signal. Therefore, it is necessary to study the methodthat can effectively extract the weak crack information from the test signal with strong backgroundnoise. Restraining noise seems to be a common and effective method, which can inhibit the noiseand increase the signal-to-noise ratio (SNR). However, it is not useful for the weak signal with strongnoise. Stochastic resonance (SR) can provide a new idea compared to the traditional noise suppressionmethods. That is because the stochastic resonance is able to transfer part of noise energy to theweak characteristic through a nonlinear system. As a result, it can improve the quality of weaksignal [11]. So, the stochastic resonance method utilizing noise reasonably can be considered for theweak defect characteristic frequency enhancement of the cracked blade. Stochastic resonance was firstput forward by Benzi and his partners in 1981, and was used to explain the glacial periodically recurrentphenomenon in the Earth’s meteorology occurring every 100 thousand years [12]. Subsequently, manyscholars found that the stochastic resonance is also conducive to extract weak characteristics fromstrong noise and then this nonlinear phenomenon has been widely used in the identification of earlyweak fault [13–18]. Wherein, He et al., studied the multi-scale noise tuning methods [19]. Qiao et al.considered the influence of potential asymmetries on stochastic resonance that was subject to bothmultiplicative and additive noise [20]. Qin et al., found the frequency range selection characteristicof re-scaling frequency stochastic resonance because of the driving frequency limitation of bistablestochastic resonance and then separated vibration components with different frequencies by iteratively

Sensors 2018, 18, 1264 3 of 19
using stochastic resonance [21]. Hu and Li applied an adaptive stochastic resonance method todiagnose crack defect [22]. However, there is seldom reference in the literature about the centrifugalcompressor blade crack detection by using stochastic resonance methods.
This paper uses CWT to filter the sampled signal around blade passing frequency first and thenutilizes Gaussian potential (GP) to change Woods-Saxon single stable stochastic resonance system intoa bistable stochastic resonance system for extracting the weak characteristic frequency excited by bladecrack defect. GA is used to optimize the related parameters. The method is validated with the analysisof simulation signal and actual test signal. The detailed structure is shown as follows: Section 2introduces the theory of continuous wavelet transform. Section 3 describes the basic principles of thepotential well model and the theory of bistable stochastic resonance system based on the combinedWoods-Saxon and Gaussian potential (WSG). Section 4 presents the simulation signal with strong noiseand characteristic frequency analysis by CWT-envelope method and CWT-WSG stochastic resonancemethod respectively. Section 5 introduces the application of the proposed method on blade crackdetection of the centrifugal compressor with pressure pulsation signal. Strain test is further carried outto verify the correctness of the result. The conclusions are given in Section 6.
2. Continuous Wavelet Transform
Wavelet transform developed from the traditional Fourier transform is a local transform in timeand frequency domain which can extract the details of signal through multi-scale analysis. It has beenintensively investigated and applied to extract fault characteristics of mechanical equipment fromits vibration signal as it can effectively filter noise and preserve characteristics information. In thispaper, continuous wavelet transform is used to pre-process the obtained experimental signal and itsdefinition is shown as Equation (3). Set ψ(t) as a finite energy function ψ(t) ∈ L2(R), if its Fouriertransform ψ̂(ω) could satisfy the conditions of permissibility shown by Equation (1)
Cψ =∫|ψ̂(ω)|2/|ω|dω < ∞ (1)
Then ψ(t) is referred to as a mother wavelet. Expand and translate the mother wavelet ψ(t) andset a to be the scale factor and b to be the translation factor. Then, ψa,b(t) shown by Equation (2) is thefunction after stretched and translated.
ψa,b(t) = |a|−1/2ψ
(t− b
a
)(2)
ψa,b(t) above depending on the stretching parameters and translation parameters is called thewavelet function. And CWT of the continuous time signal x(t) ∈ L2(R) is defined as the inner productof the signal and wavelet function.
Wx(a, b; ψ) = a−1/2∫
x(t)ψ∗(
t− ba
)dt (3)
Wherein ψ∗(t) is the conjugate of ψ(t). According to Equation (3), it can be found the signal will beprojected onto the two-dimensional time-scale plane after the CWT. The wavelet transform coefficientsactually reflect the similarity between the local signal and the wavelet function, which means thelarger the coefficient is, the greater similarity they have. In addition, the continuous wavelet inversetransform is shown as follows, which can be used to reconstruct the processed signal.
x(t) =1
Cψ
∫ ∫a−2Wx(a, b; ψ)ψa,bdadb (4)
The inverse transform equation indicates that there is no energy loss for CWT and the energyis conserved. Thus, Equation (5) is valid. Moreover, the modulus of the signal’s CWT coefficient

Sensors 2018, 18, 1264 4 of 19
SG(a, b; ψ) is defined as Equation (6) which can usually be used for further analysis. As CWT is amulti-scale analysis method, different scales correspond to different frequencies. In this paper, CWT isused for pressure pulsation signal to obtain the wavelet scale spectrum first, then the scales aroundblade passing frequency are selected to reconstruct time domain signal for the purpose of filteringnoise and preserving the characteristic information induced by blade crack defect.∫
|x(t)|2dt =1
Cψ
∫a−2da
∫|Wx(a, b; ψ)|2db (5)
SG(a, b; ψ) = |Wx(a, b; ψ)|2 (6)
3. Stochastic Resonance
Woods-Saxon potential (WSP) and GP are combined to form the new potential function ofbistable stochastic resonance system which will be described in Section 3.4. The WSP is a monostablepotential with three parameters—potential height, width and steep degree controlling the shape ofWSP. Moreover, for the same input, different potentials always produce different outputs. GP satisfiessymmetry, continuity and boundness, so it is chosen as the potential barrier and changes theWoods-Saxon monostable potential function into a bistable potential function.
3.1. Woods-Saxon Potential Well Model
The potential function Uws(x) in the WSP well model is a nonlinear symmetric potential proposedby Woods and Saxon. It is also used by Deza and others for the collection of energy at first. The modelcan be expressed as follows:
UWS(x) = − V1
1 + exp((|x| − R1)/a)(7)
Wherein, V1 is the well depth, R1 is the well width and a is the steep degree of the potential.These three parameters determine the shape of the potential which also means they can determine theenergy that the oscillator can obtain. Figure 1 shows the effect of different parameters on the shapeof the potential function. The three solid lines in the figure correspond to the change of parameter a(parameter V1 and parameter R1 are fixed), the influence of parameter a on the potential function can beseen from the solid lines. When a is smaller the potential will be steeper. Two point lines correspond tofixed V1, a and varying R1, the influence of parameter R1 on the well width can be seen by comparingthese lines. There also exists a dotted line corresponding to the varying V1, it shows the effect of V1 onthe well depth. Therefore, unlike the potential in classical bistable stochastic resonance system, theparameters of WSP change the shape of the potential independently. They are not coupled together.
Figure 1. The shape of the potential function with different parameters.

Sensors 2018, 18, 1264 5 of 19
3.2. The Potential Well Model of Gaussian Potential (GP)
The radial GP well model can be expressed as follows:
UG(x) = −V2 exp
(− x2
R22
)(8)
Wherein, V2 represents the depth of the potential well and R2 represents the width. Figure 2shows the influence of different parameters on the potential function. It can be seen from the figurethat the potential well will be steeper when R2 is smaller.
Figure 2. The shape of Gaussian potential function with different parameters.
3.3. The Combined Potential Model
The WSP and GP models mentioned above can be combined into a new bistable potential wellmodel. And the new WSG potential function can be expressed as follows:
U(x) = Uws(x)−UG(x) = − V11+exp((|x|−R1)/a)
+V2 exp(− x2
R22)
(9)
The shape of the new potential function is shown in Figure 3, where the corresponding parametersare V1 = 3, R1 = 1.6, a = 0.02, V2 = 1.5, R2 = 0.15. It can be seen from the figure below that it is abistable potential well model with two symmetrical potential wells and V2 is the height of the potentialbarrier. The width of each potential well and the distance between the two potential wells can bechanged by adjusting R1 and R2. So, the shape of the potential well model is controlled by fiveparameters and they are not coupled, which means the shape of the potential well can be adjusted bychanging any single parameter. As the new bistable potential well model is formed by adding GP intothe WSP model, so it not only has the advantage of the Woods-Saxon single potential well but also hasthe advantage of the traditional bistable potential. Obviously, it is more likely to achieve stochasticresonance state if the well wall is steeper and the bottom is flatter. Therefore, the weak periodic signalcan be well processed and enhanced by stochastic resonance with this kind of potential well.

Sensors 2018, 18, 1264 6 of 19
Figure 3. The shape of Woods-Saxon and Gaussian (WSG) potential function.
3.4. Stochastic Resonance System
As the bistable stochastic resonance can enhance the weak low frequency signal by utilizing thenoise energy reasonably, it can be thought as a nonlinear low pass filter in some literature [15,23].Therefore, according to the careful study of some model based research works on the signal processingand analysis [24–26], the bistable stochastic resonance here is thought as a nonlinear system andthe noisy signal [27] containing the periodic signal and strong noise is considered as the input ofthis nonlinear system shown in Figure 4. Then, the weak characteristic frequency can be obviouslyenhanced in the output signal. Since there will be multiple stable points for the high order potentialfunction, the nonlinear system also includes multi-stable system besides the bistable system.
Figure 4. The general structure block diagram of stochastic resonance.
Taking Brown particle’s over damped motion excited by noise and external driving force in abistable system into consideration, the stochastic resonance system can be described by the followingequation:
dxdt
= −V′(x) + A0 sin(2π f0t + ϕ) + n(t) (10)
Wherein V(x) is the nonlinear bistable potential function and the traditional V(x) is shown byEquation (11).
V(x) = − a2 x2 + b
4 x4 a > 0, b > 0 (11)
n(t) =√
2Dξ(t), E[n(t)n(t + τ)] = 2Dδ(τ) in Equation (10), where D represents the noiseintensity, ξ(t) is white noise with zero mean and unit variance. Parameters a and b are real andpositive structural coefficients. A0(t) is the amplitude of periodic signal and f0 is the driving frequency.Substituting Equation (11) into Equation (10) and the following Equation (12) can be obtained.
dxdt
= ax− bx3 + A0 sin(2π f0t + ϕ) +√
2Dξ(t) (12)
Equation (12) above represents a classical bistable stochastic resonance system through thenonlinear Langevin equation. If WSG bistable potential well model is used to replace the traditional

Sensors 2018, 18, 1264 7 of 19
potential function V(x), then the new system can be called WSG stochastic resonance system.Accordingly, the equation can be expressed as follows.
dxdt = −V1
a sgn(x) exp(|x|−R1
a
)(1 + exp
(|x|−R1
a
))−2
+ 2V2xR2
2exp
(− x2
R22
)+ A0 sin(2π f0t + ϕ) + n(t)
(13)
Wherein, sgn(x) is the symbolic equation and sgn(x) =
1 x > 00 x = 0−1 x < 0
.
It can be seen from Equation (13) that the system output depends on the potential model and inputsignals. The difference between WSG stochastic resonance system and the classical system lies in thepotential model. In fact, the occurrence of stochastic resonance is determined by the combined effect ofthe system, input signal and the noise. The stochastic resonance phenomenon can be described by theoscillation of Brown particles under a variety of excitation (including potential well force, periodicforce and noise force) in a created special scene. In all forces, potential well force is obtained from thefirst-order derivative of potential function. In reality, the periodic force and the noise power are fixed,so the effectiveness of the stochastic resonance system is largely determined by the potential well force.
In general, if the potential well is too wide, the particle can’t reach the potential well wall of theother end or the barrier. It also means the particle needs greater resilience to help its periodic motionin a cycle. On the other hand, if the well is too narrow, the particle can’t reach the expected positionalong the right path in a cycle, because the wall of the potential well will force the particle return backto its original position in advance. Similarly, the excessively high barrier will make it difficult for theparticles to move back and forth in two potential wells, as a result they will only do the reciprocatingmotion in one potential well which will have no effect on enhancing the weak signal from strong noise.If the barrier is too low, the motion of particles will have no periodicity and just be controlled by theeffect of noise. That is to say, the output signal is disordered. In addition, if the potential well wall is toosteep, the produced great resilience will further lead to the rebound of the particles. Conversely, it willnot provide sufficient energy for particles to complete the periodic movement if the well wall is veryflat. In conclusion, the periodic motion of the particles and the amplification of a weak characteristicsignal can be ensured only when the shape of the potential model reaches the best state. Therefore,the corresponding parameter optimization method is necessary.
3.5. Weak Characteristic Extraction Based on CWT-WSG Stochastic Resonance Method and GA
Based on the CWT filtering and WSG stochastic resonance feature enhancement method,the CWT-WSG method is proposed to extract the weak characteristic information. As the outputsignal quality of WSG stochastic resonance method is determined by potential parameters, the optimaloutput signal can be obtained by tuning related potential parameters. Therefore, Genetic algorithm(GA) is studied here for the determination of optimal parameters. Signal-to-noise ratio (SNR) of theoutput signal shown by Equation (14) is set as the objective function in GA.
SNR = 10 log10
(Ac
∑N/2i=1 Ai − Ac
)(14)
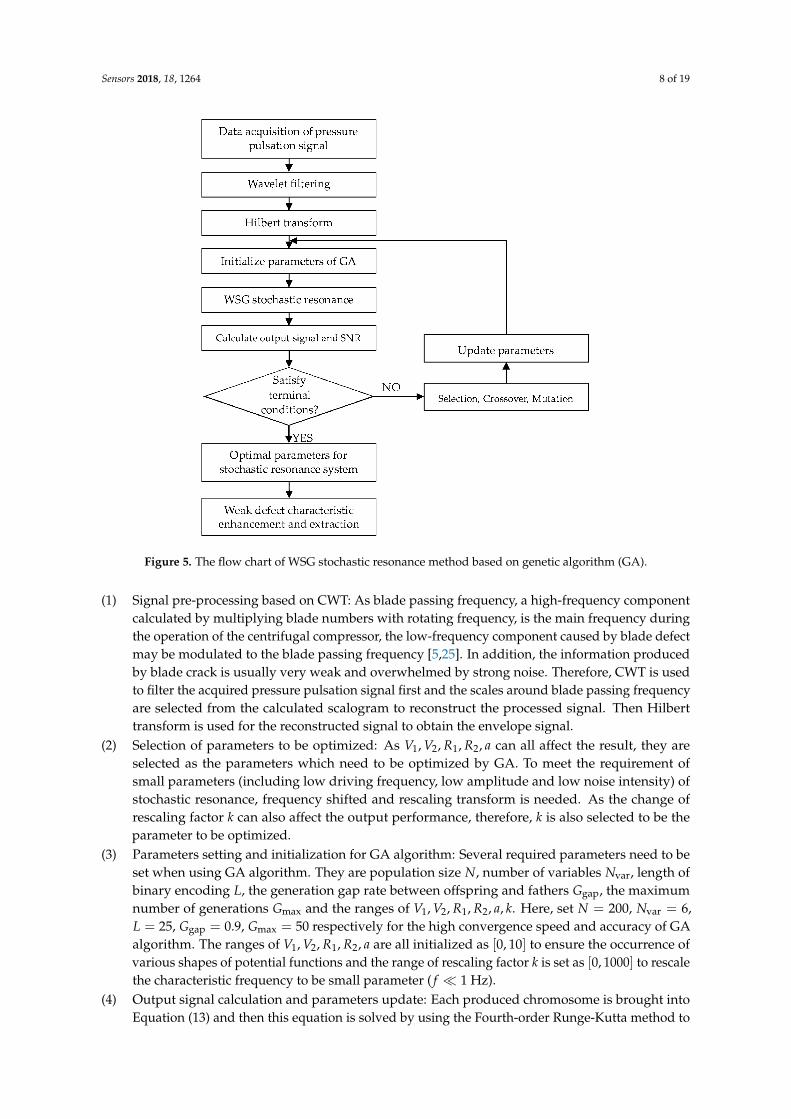
where Ac is the amplitude of weak characteristic frequency in the frequency spectrum. N representsthe length of signal and Ai stands for the amplitude of each spectrum line in the frequency spectrum ofoutput signal. The purpose of GA is to search for optimal parameters so that the optimal SNR can beobtained, as the larger SNR means the better characteristic enhancement performance. The flowchartof the proposed method is illustrated in Figure 5 and detailed procedures are described as follows.
Sensors 2018, 18, 1264 8 of 19
Figure 5. The flow chart of WSG stochastic resonance method based on genetic algorithm (GA).
(1) Signal pre-processing based on CWT: As blade passing frequency, a high-frequency componentcalculated by multiplying blade numbers with rotating frequency, is the main frequency duringthe operation of the centrifugal compressor, the low-frequency component caused by blade defectmay be modulated to the blade passing frequency [5,25]. In addition, the information producedby blade crack is usually very weak and overwhelmed by strong noise. Therefore, CWT is usedto filter the acquired pressure pulsation signal first and the scales around blade passing frequencyare selected from the calculated scalogram to reconstruct the processed signal. Then Hilberttransform is used for the reconstructed signal to obtain the envelope signal.
(2) Selection of parameters to be optimized: As V1, V2, R1, R2, a can all affect the result, they areselected as the parameters which need to be optimized by GA. To meet the requirement ofsmall parameters (including low driving frequency, low amplitude and low noise intensity) ofstochastic resonance, frequency shifted and rescaling transform is needed. As the change ofrescaling factor k can also affect the output performance, therefore, k is also selected to be theparameter to be optimized.
(3) Parameters setting and initialization for GA algorithm: Several required parameters need to beset when using GA algorithm. They are population size N, number of variables Nvar, length ofbinary encoding L, the generation gap rate between offspring and fathers Ggap, the maximumnumber of generations Gmax and the ranges of V1, V2, R1, R2, a, k. Here, set N = 200, Nvar = 6,L = 25, Ggap = 0.9, Gmax = 50 respectively for the high convergence speed and accuracy of GAalgorithm. The ranges of V1, V2, R1, R2, a are all initialized as [0, 10] to ensure the occurrence ofvarious shapes of potential functions and the range of rescaling factor k is set as [0, 1000] to rescalethe characteristic frequency to be small parameter ( f � 1 Hz).
(4) Output signal calculation and parameters update: Each produced chromosome is brought intoEquation (13) and then this equation is solved by using the Fourth-order Runge-Kutta method to

Sensors 2018, 18, 1264 9 of 19
obtain the output signal, where the processed envelope signal is set as the input weak periodicsignal. Next, calculate the SNR of output signal with Equation (14) and set it as objective functionvalue. Searching the optimal parameters based on fitness function and updating the generation.Repeat the above procedures until the optimal parameters are obtained.
(5) Weak characteristic enhancement and extraction: Based on the obtained optimal potentialparameters V1, V2, R1, R2, a and rescaling factor k, take the filtered envelope signal intoEquation (13) and calculate the output signal. Then, conducting Fourier transform on the outputsignal, as a result, the weak characteristic frequency can be enhanced and extracted.
3.6. The Blade Weak Defect Identification Based on the Proposed Method
As the weak characteristic frequency induced by the blade crack defect is usually difficult to beidentified, the proposed method is used here to improve this problem. Considering the strain methodis not suitable for the long-term condition monitoring of all the blades, pressure pulsation signalis adopted in this paper. Then, the proposed CWT-WSG SR method combined with GA is used toenhance and extract the weak defect characteristic frequency from the pressure signal. Strain data willalso be sampled and analysed to evaluate the reliability and effectiveness of the analysis result obtainedby using the proposed method. In the condition that the consistent defect characteristic frequency canbe extracted from both strain signal and pressure pulsation signal with the proposed method, it can beverified this method is effective and has potential in the application of long-term condition monitoringand weak defect warning for large-scale centrifugal compressor blades. The detailed scheme is shownby the following system diagram seen as Figure 6.
Figure 6. The system diagram on the application and evaluation for the proposed method.
4. Simulation Signal Analysis
In order to illustrate the effectiveness of the proposed CWT-WSG stochastic resonance method,a simulation signal is analysed first. Considering the actual situation that amplitude modulationphenomenon will occur if there is defect in the blade, an amplitude-modulated signal is constructedshown by Equation (15).
s(t) = A(1 + B cos(2π fet)) sin(2π fct). (15)
Wherein the carrier frequency fc = 1500 Hz and the modulation frequency fe = 60 Hz. ParametersA = 1 and B = 0.2. The sampling frequency is fs = 10240 Hz and the number of sampling points is5120. The obtained amplitude-modulated signal is shown as Figure 7a and it is analysed by FFT to

Sensors 2018, 18, 1264 10 of 19
obtain the frequency spectrum which is shown as Figure 7b, where 1500 Hz is the main frequencyand 60 Hz is the modulation frequency. Amplifying the frequency information around 1500 Hz toobtain Figure 7c and it can be clearly seen that there exists sideband around 1500 Hz, which indicates60 Hz is modulated to the carrier frequency. In order to simulate the actual situation, strong Gaussianwhite noise with SNR = −9 dB is added to the simulation signal and the obtained time domain signalis shown as Figure 8a. Figure 8b shows the corresponding frequency domain. It can be found thatthe side band information is difficult to be identified due to the noise interference. Amplifying thefrequency domain near 1500 Hz shown by Figure 8c, however, the characteristic frequency is stilldifficult to obtain through side-band analysis due to the strong noise interference.
Figure 7. Simulation signal without noise: (a) Amplitude modulated signal without noise;(b) The frequency domain of simulation signal; (c) The larger image of frequency domain.
Figure 8. Simulation signal with noise: (a) The time domain signal with noise; (b) The frequencydomain; (c) The larger image of frequency domain.
In order to extract the weak modulation frequency 60 Hz, CWT method is used to filter the signalaround 1500 Hz first shown in Figure 9. Then envelope spectrum analysis is used for the signal and theresult is shown as Figure 10. It can be seen from Figure 10, although the characteristic frequency 60 Hzand its harmonic frequency 120 Hz marked with red circles can be extracted. However, due to the

Sensors 2018, 18, 1264 11 of 19
noise interference, the useful feature information is not clear and submerged in strong noise. Therefore,the characteristic frequency needs to be analysed further with feature enhancement algorithm.
For further extracting the characteristic frequency, WSG stochastic resonance model is constructedto process the envelope signal. Related optimal parameters of the WSG model are set asV1 = 3.9, V2 = 0.6, R1 = 8.8, R2 = 9.7, a = 1.4 based on GA algorithm and the rescaling factork is set as 660. Calculate Equation (13) with the determined parameters and then the output signalshown in Figure 11a can be obtained through this nonlinear system. Spectrum analysis is used forthe output signal to obtain the result shown in Figure 11b. It can be clearly seen from the figurethat the motion of the particle in two potentials reaches resonance state well, so the characteristicfrequency 60 Hz is enhanced obviously and easier to be identified after WSG stochastic resonancesystem. Therefore, the proposed CWT-WSG stochastic resonance method is verified effective andfeasible to enhance the weak characteristic frequency. Based on the simulation analysis, it can beproved the CWT-WSG stochastic resonance method is helpful for weak feature enhancement anddetection. Moreover, the result also shows the proposed method can provide a new idea for incipientweak defect detection of the centrifugal compressor blade.
Figure 9. The time and frequency domain of signal after continuous wavelet transform (CWT).
Figure 10. The time and frequency domain after CWT-envelope analysis.

Sensors 2018, 18, 1264 12 of 19
Figure 11. The processed signal with stochastic resonance: (a) The output signal of stochastic resonancesystem; (b) The frequency domain of output signal.
5. Application for the Actual Compressor Signal
5.1. The Experiment and Data Acquisition System
The centrifugal compressor test rig is shown in Figure 12 and it can be seen from the figure thatthe test rig consists of motor, coupler, gear box, impeller and so forth. The impeller is a semi-openone with 13 blades and 800 mm diameter. It is an experimental impeller used for engineering study.The impeller is driven by the motor and its speed can be adjusted through the coupler and gearbox with the speed range from 500 rpm to 9000 rpm. In this experiment, the rotating speed of theimpeller is set as 5000 rpm and the corresponding shaft frequency and blade passing frequency are5000/60 = 83.3 Hz and 5000× 13/60 = 1083.3 Hz respectively. The detailed experimental parametersare given in Table 1. In order to simulate the blade crack defect, a notch is machined on one blade ofthe normal semi-open impeller. Strain signal of the blade and pressure pulsation signal of the airfloware both collected during the rotation of the impeller and the relationship between the crack and theacquired signal is studied with feature extraction method so that the crack can be accurately identifiedat initially. The length of the crack shown in Figure 13 is 70 mm. As the thickness of the blade isvery large, the abnormal vibration amplitude caused by the blade crack is actually very weak, what’sworse, the useful defect characteristic information contained indirectly in pressure pulsation signalwill be much weaker. Moreover, there is strong noise interference during the high-speed rotation ofthe impeller. Therefore, the defect characteristic frequency is difficult to identify with traditional signalprocessing methods. In order to improve this problem, the proposed CWT-WSG stochastic resonancemethod will be applied on the acquired pressure pulsation signal.
In order to accurately collect crack defect information of the blade, appropriate data acquisitionsystem and sensors are needed to collect and read data. NI4472 eight channel dynamic signalacquisition module, a synchronous signal acquisition module with 110 dB dynamic range, 24-bitresolution and 102.4 kHz sampling frequency, is selected as the hardware and it constitutes thetest system with the DASP software of East China Institute of Noise and Vibration during theexperiment. Dynamic pressure sensors are used to monitor the pressure pulsation signal in theexperiment. The principle of the sensor is that sound wave can cause the vibration of air. The pulsantair will then press the diaphragm and the diaphragm will generate an electric signal under the action ofthe mechanical force. The test results are closely related to the arrangement of measuring points. Howto arrange the data points is a key factor to the success of the test and it is also an important guaranteefor the validity and accuracy of the data. In addition, measuring points positions play an importantrole for the effective extraction of the blade crack information in the subsequent data processing step.

Sensors 2018, 18, 1264 13 of 19
Therefore, it is necessary to design measuring points reasonably before the experiment. The reasonablepositions of the measuring points must meet the following requirements: (1) The layout of measuringpoints need to meet the requirements of the test; (2) The positions of measuring points need to ensurethe authenticity and validity of the test data; (3) The positions also need to meet the requirementsof site conditions, which means the test equipment should be placed on the points easily and safely.The pressure sensors are placed on the impeller inlet, the diffuser inlet and exit respectively to monitorthe pressure pulsation signal in this experiment and Figure 14 shows the installation positions ofpressure sensors.
Figure 12. The centrifugal compressor test rig: (a) Schematic for the test-rig; (b) Experimentalcentrifugal compressor.
Table 1. Test parameters.
Speed Blade Number Shaft Frequency Blade Passing Frequency The Length of Crack
5000 rpm 13 83.3 Hz 1083.3 Hz 70 mm
Figure 13. The impeller and crack.

Sensors 2018, 18, 1264 14 of 19
Figure 14. The installation location of sensors.
Considering the defect characteristic is weak, the used pressure sensors should be placed near theposition of the rotating impeller. According to the actual situation of the Φ800 test rig, radial holes aremachined in the selected measuring points so that pressure sensors can be embedded. The probe ofsound pressure transducer stretches a certain distance into the pipe inner wall, which is very close tothe impeller so that the useful pressure signal containing the crack information can be obtained. PCB106B is chosen as the sound pressure sensor in the experiment. The maximum dynamic pressure it canwithstand is 68.9 KPa.
5.2. Pressure Pulsation Signal Analysis
Pressure pulsation signal is generated due to the interaction between the rotor and the statorinside the compressor and the main characteristic frequencies in normal operation conditions are bladepassing frequency and its harmonic frequencies. In order to get crack information of the cracked bladecomprehensively, a test is carried out on a compressor with a cracked blade at 5000 rpm workingcondition. Pressure pulsation signal of the three positions mentioned above are collected synchronouslywith multi-channel acquisition system. Figure 15 shows the time and frequency domain of the sampledpressure pulsation signal at 5000 rpm. As the blade passing frequency 1083.3 Hz belongs to highfrequency component and the characteristic frequency induced by blade crack is a low frequencycomponent, so this characteristic frequency will be modulated to blade passing frequency duringthe rotation of the blade. However, the obvious modulated frequency in Figure 15 is two times shaftfrequency 166.6 Hz which may be caused by the misalignment of the shaft and there aren’t otherobvious modulated frequencies except it, which means the weak feature information caused by bladecrack can’t be identified by general spectrum analysis.
Figure 15. Time and frequency domain of pressure pulsation signal under 5000 rpm.
Therefore, the feature frequency caused by blade crack needs to be demodulated with furtheranalysis. As the blade passing frequency is 1083.33 Hz, CWT is first used to filter the signal around

Sensors 2018, 18, 1264 15 of 19
1083 Hz and the filtered signal is reconstructed through continuous wavelet inverse transform shownas Figure 16. Envelope spectrum analysis is then used for the filtered signal and the result is shownin Figure 17. The two frequencies marked with red circles in Figure 17 are 53 Hz and 106 Hzrespectively, that is to say, there exists typical frequency multiplication relationship between thefundamental frequency 53 Hz and the harmonic frequency 106 Hz. It can be determined that 53 Hz isthe characteristic frequency excited by blade crack which will be verified by strain test shown in thefollowing but it is not clear enough due to strong noise interference. Moreover, it can also be found thetwo times shaft frequency component 166.6 Hz marked with red rectangle is more obvious comparedwith 53 Hz. Therefore, WSG stochastic resonance model is absolutely necessary to further process theenvelope signal for the purpose of enhancing the weak characteristic frequency 53 Hz.
Figure 16. The filtered signal through CWT.
Figure 17. Envelope analysis for filtered pressure pulsation signal under 5000 rpm.
According to the optimization result of GA, the optimal parameters of the WSG stochasticresonance model are set as V1 = 0.7, V2 = 3.1, R1 = 6.7, R2 = 8.9, a = 0.14 respectively and thecorresponding rescaling factor k is set as 1000 to change 53 Hz into small parameter. Calculate theoutput signal and go ahead with spectrum analysis by Fourier transform. The obtained output signaland the corresponding spectrum are shown by Figure 18 and it can be seen the characteristic frequency53 Hz marked by red circle is more obvious than two times shaft frequency 166.6 Hz marked by redrectangle. Comparing Figures 17 and 18, it can be clearly found the characteristic frequency is mucheasier to be identified with the further processing of stochastic resonance. Therefore, it can be knownthe effective weak crack information enhancement is achieved by the proposed CWT-WSG stochasticresonance method.
It can be concluded from the above analysis that a low vibration frequency 53 Hz is generatedfor the cracked blade during the rotation of the impeller. This low frequency vibration of the crackedblade will act on the air and can be found from pressure pulsation signal nearby. As blade passingfrequency belongs to high frequency component, the 53 Hz will be modulated to it seen as the sideband.CWT-envelope method can’t extract this weak defect frequency effectively because of the strong noiseinterference. Conversely, this characteristic frequency can be found easily with further processing by

Sensors 2018, 18, 1264 16 of 19
CWT-WSG stochastic resonance method. In order to further verify the validity of the result, strain testand analysis are also conducted described as follows.
Figure 18. The output signal of stochastic resonance model under 5000 rpm.
5.3. Verification Analysis of Strain Data
The blade’s strain test acquisition system consists of a SG403/SG404 four-channel wirelessstrain sensor node, a wireless receiving gateway, BeeDate wireless sensor network software andBF120-2AAGN20-W strain gauges. The installation of the wireless strain node is shown in Figure 19.Strain signal is sampled both from the cracked blade and the adjacent normal blade and the installationpositions of strain gauges are shown in Figure 20, wherein position 1,2,3 are attached on the crackedblade and position 4 is on a normal blade.
Figure 19. The installation of wireless strain node.
Analysing the strain signal obtained at 5000 rpm working condition. The acquired spectrums areshown in Figure 21 and it can be seen from the result that the blade’s defect frequency of 53 Hz can bedetected at position 2 and position 3. This characteristic frequency at measuring point 2 which is nearthe crack is more obvious but it cannot be found at point 4, which is on the normal blade. Based on theanalysis result of the strain signal, it can be found that the low frequency of 53 Hz exists both in thestrain signal and the pressure pulsation signal. In order to further ensure the reliability of the identifieddefect frequency, the strain signal is also sampled and analysed at 4000 rpm and 4500 rpm workingconditions. The defect characteristic frequency can still be obviously extracted from the frequencyspectrums. Moreover, there will exist a low frequency component modulated to the high frequencycomponent-blade passing frequency in the condition that the impeller blade is cracked according toReferences [5,25]. Therefore, it can be proved that the proposed method is reliable and effective for thecondition monitoring and weak defect identification of the incipient blade crack.

Sensors 2018, 18, 1264 17 of 19
Figure 20. The installation position of strain gauges.
Figure 21. The experimental strain results under 5000 rpm: (a) The experimental strain result ofposition 1; (b) The experimental strain result of position 2; (c) The experimental strain result ofposition 3; (d) The experimental strain result of position 4.

Sensors 2018, 18, 1264 18 of 19
6. Conclusions
Condition monitoring and incipient weak defect warning for centrifugal compressor blades isalways a big challenge as the impeller works in a closed space, which means the signal that caneffectively reflect the blade’s state is difficult to acquire. Traditional non-destructive testing andevaluation (NDT&E) methods can determine the blade defect effectively, however, these methodscan only be performed during the shutdown period of the compressors, which are time-consumingand costly. Therefore, they are not suitable for the long-term on-line condition monitoring of blades.Considering the interaction between the rotating impeller and the airflow nearby, the blade’s abnormalvibration induced by the crack defect will affect the around pressure pulsation of the airflow. Therefore,pressure pulsation signal is used for the on-line condition monitoring and defect characteristicextraction in this paper. However, as the characteristic information is usually weak together withstrong noise, traditional signal processing methods cannot identify it effectively. CWT is used topre-process the sampled signal and WSG stochastic resonance is then adopted to enhance the weakcharacteristic frequency. GA is used to obtain the optimal parameters for improving the enhancementperformance of this stochastic resonance system. The accuracy of the proposed method is verified bythe strain experiment. In conclusion, this paper provides a new idea for the weak defect characteristicenhancement and the identification of centrifugal compressor blades. For future research, a study onmulti-cracks of different sizes should be conducted by using a pressure pulsation signal, which canmake this method more helpful in practice. In addition, as the synergistic effect of noise can betterimprove the characteristic enhancement performance of the stochastic resonance system, multi-scalenoise tuning can also be further studied in the future to achieve a better blade defect detectionperformance for the proposed CWT-WSG stochastic resonance method.
Acknowledgments: The work was supported by the Natural Science Foundation of China under Grant No.51575075, China Scholarship Council and UOW VC Fellowship.
Author Contributions: H.L. and C.H. designed the proposed method and prepared the manuscript; R.M., C.H.and Z.L. contributed in analysis of data. All authors prepared, revised and approved the final submission.
Conflicts of Interest: The authors declare no conflict of interest.
References
1. Eisinger, F.L. Acoustic Fatigue of Impellers of Rotating Machinery. J. Press. Vessel Technol. 2002, 124, 154–160.[CrossRef]
2. Witek, L. Experimental Crack Propagation and Failure Analysis of the First Stage Compressor Blade Subjectedto Vibration. Eng. Fail. Anal. 2009, 16, 2163–2170. [CrossRef]
3. Li, Z.; Jiang, Y.; Guo, Q.; Hu, C.; Peng, Z. Multi-Dimensional Variational Mode Decomposition forBearing-Crack Detection in Wind Turbines with Large Driving-Speed Variations. Renew. Energy 2018,116, 55–73. [CrossRef]
4. Saravanan, K.; Sekhar, A. Crack Detection in a Rotor by Operational Deflection Shape and Kurtosis UsingLaser Vibrometer Measurements. J. Vib. Control 2013, 19, 1227–1239. [CrossRef]
5. Rao, A.R.; Dutta, B. Vibration Analysis for Detecting Failure of Compressor Blade. Eng. Fail. Anal. 2012, 25,211–218.
6. Egusquiza, E.; Valero, C.; Huang, X.; Jou, E.; Guardo, A.; Rodriguez, C. Failure Investigation of a LargePump-turbine Runner. Eng. Fail. Anal. 2012, 23, 27–34. [CrossRef]
7. Joosse, P.A.; Blanch, M.J.; Dutton, A.G.; Kouroussis, D.A.; Philippidis, T.P.; Vionis, P.S. Acoustic EmissionMonitoring of Small Wind Turbine Blades. J. Sol. Energy Eng. 2002, 124, 446–454. [CrossRef]
8. Pawar, P.M.; Jung, S.N. Support Vector Machine Based Online Composite Helicopter Rotor Blade DamageDetection System. J. Intell. Mater. Syst. Struct. 2008, 19, 1217–1228. [CrossRef]
9. König, S.; Petry, N.; Wagner, N.G. Aeroacoustic Phenomena in High-pressure CentrifugalCompressors—A Possible Root Cause for Impeller Failures. In Proceedings of the 38th TurbomachinerySymposium, Houston, TX, USA, 11–14 September 2009; pp. 103–121.

Sensors 2018, 18, 1264 19 of 19
10. Petry, N.; Benra, F.K.; König, S. Experimental Study of Acoustic Resonances in the Side Cavities of aHigh-pressure Centrifugal Compressor Excited by Rotor/stator Interaction. In Proceedings of the ASMETurbo Expo 2010: Power for Land, Sea, and Air, Glasgow, UK, 14–18 June 2010; pp. 1–13.
11. Leng, Y.G.; Leng, Y.S.; Wang, T.Y.; Guo, Y. Numerical Analysis and Engineering Application of LargeParameter Stochastic resonance. J. Sound Vib. 2006, 292, 788–801. [CrossRef]
12. Benzi, R.; Sutera, A.; Vulpiani, A. The Mechanism of Stochastic Resonance. J. Phys. A Math. Gen. 1981, 14,453–457. [CrossRef]
13. He, Q.; Wang, J.; Liu, Y.; Dai, D.; Kong, F. Multiscale Noise Tuning of Stochastic Resonance for EnhancedFault Diagnosis in Rotating Machines. Mech. Syst. Signal Process. 2012, 28, 443–457. [CrossRef]
14. Qiao, Z.; Lei, Y.; Lin, J.; Jia, F. An adaptive unsaturated bistable stochastic resonance method and itsapplication in mechanical fault diagnosis. Mech. Syst. Signal Process. 2017, 84, 731–746. [CrossRef]
15. Lei, Y.; Qiao, Z.; Xu, X.; Lin, J.; Niu, S. An Underdamped Stochastic Resonance Method with Stable-stateMatching for Incipient Fault Diagnosis of Rolling Element Bearings. Mech. Syst. Signal Process. 2017, 94,148–164. [CrossRef]
16. Tan, J.; Chen, X.; Wang, J.; Chen, H.; Cao, H.; Zi, Y.; He, Z. Study of Frequency-shifted and Re-scalingStochastic Resonance and Its Application to Fault Diagnosis. Mech. Syst. Signal Process. 2009, 23, 811–822.[CrossRef]
17. Zhang, H.; He, Q.; Lu, S.; Kong, F. Stochastic Resonance with a Joint Woods-Saxon and Gaussian Potentialfor Bearing Fault Diagnosis. Math. Probl. Eng. 2014, 2014, 315901. [CrossRef]
18. Zhang, X.; Hu, N.; Hu, L.; Cheng, Z. Multi-scale Bistable Stochastic Resonance Array: A Novel Weak SignalDetection Method and Application in Machine Fault Diagnosis. Sci. China Technol. Sci. 2013, 56, 2115–2123.[CrossRef]
19. He, Q.; Wang, J. Effects of Multiscale Noise Tuning on Stochastic Resonance for Weak Signal Detection.Digit. Signal Process. 2012, 22, 614–621. [CrossRef]
20. Qiao, Z.; Lei, Y.; Lin, J.; Niu, S. Stochastic Resonance Subject to Multiplicative and Additive Noise:The Influence of Potential Asymmetries. Phys. Rev. E 2016, 94. [CrossRef] [PubMed]
21. Qin, Y.; Zhang, Q.; Mao, Y.; Tang, B. Vibration Component Separation by Iteratively Using StochasticResonance with Different Frequency-scale Rations. Measurement 2016, 94, 538–553. [CrossRef]
22. Hu, B.; Li, B. Blade Crack Detection of Centrifugal Fan Using Adaptive Stochastic Resonance. Shock Vib.2015, 2015, 954932. [CrossRef]
23. Lu, S.; He, Q.; Kong, F. Effects of Underdamped Step-varying Second-order Stochastic Resonance for WeakSignal Detection. Digit. Signal Process. 2015, 36, 93–103. [CrossRef]
24. Fan, M.; Cao, B.; Yang, P.; Li, W.; Tian, G. Elimination of Liftoff Effect Using a Model-based Method for EddyCurrent Characterization of a Plate. NDT E Int. 2015, 74, 66–71. [CrossRef]
25. Fan, M.; Wang, Q.; Cao, B.; Ye, B.; Sunny, A.I.; Tian, G. Frequency Optimization for Enhancement of SurfaceDefect Classification Using the Eddy Current Technique. Sensors 2016, 16, 649. [CrossRef] [PubMed]
26. Yu, J.; Chang, J.; Su, B. Modeling of whole-space transient electromagnetic responses based on FDTD and itsapplication in the mining industry. IEEE Trans. Ind. Inf. 2017, 13, 2974–2982. [CrossRef]
27. Malekian, R.; Bogatinoska, D.C.; Karadimce, A.; Ye, N.; Trengoska, J.; Nyako, W.A. A Novel Smart ECOModel for Energy Consumption Optimization. Elektronika ir Elektrotechnika 2015, 21, 75–80. [CrossRef]
© 2018 by the authors. Licensee MDPI, Basel, Switzerland. This article is an open accessarticle distributed under the terms and conditions of the Creative Commons Attribution(CC BY) license (http://creativecommons.org/licenses/by/4.0/).