we are future ready - varroc › wp-content › uploads › 2019 › 09 › ...passenger car,...
TRANSCRIPT

ANNUAL REPORT2018-19
WE AREFUTURE READY

FORWARD-LOOKING STATEMENT
Forward-Looking StatementIn this Annual Report, we have disclosed forward-looking information to enable investors to comprehend our prospects and take investment decisions.
This report and other statements-written and oral-that we periodically make contain forward-looking statements that set out anticipated results based on the management’s plans and assumptions. We have tried, wherever possible, to identify such statements by using words such as ‘anticipate’, ‘estimate’, ‘expects’, ‘projects’, ‘intends’, ‘plans’, ‘believes’, and words of similar substance in connection with any discussion of future performance.
We cannot guarantee that these forward-looking statements will be realized, although we believe we have been prudent in our assumptions. The achievements of results are subject to risks, uncertainties and even inaccurate assumptions. Should, known or unknown risks or uncertainties materialize, or should underlying assumptions prove inaccurate, actual results could vary materially from those anticipated, estimated or projected. Readers should keep this in mind.
We undertake no obligation to publicly update any forward-looking statement, whether as a result of new information, future events or otherwise.

Polymers-Seat Assembly
Exterior Lighting-Headlamp Assembly
Electrical-Electronics-Magneto
Metallic-Automotive Gears
Introduction
Mission, Vision & Values
Financial Performance
Future is Discovery
• New Product Offerings: VLS Business
New Product Offerings: India Business
Future is Customer
Future is Capability
Future is Digitalization
Future is People
MD’s Message
Corporate Information
Group Structure
Board of Directors
Key Management
Statutory Reports
• Management Discussions & Analysis
• Board’s Report
• Corporate Governance Report
Financial Statements
• Financial Statements-Standalone
• Financial Statements-Consolidated
Notice of Annual General Meeting
Contents
CONTENTS
02
04
05
07
07
08
13
14
19
20
22
24
28
30
32
33
42
68
84
148
239
Annual Report 2018-19 01

INTRODUCTION
Future Is Created By Paving TheWay For A Better Tomorrow
Revenue Split by Product*
* as per MIS Grouping
Europe 45.6%
North America 17.9%
Asia Pacific 0.8%
Others 1.1%
India 34.6%
Revenue Split by Region
Research & Development Centres
Operating Manufacturing Facilities
Diverse trends impact the world we live in and present complex and uncertain outcomes. These disruptive factors with respect to the automotive industry include innovations pertaining to autonomous driving, connected vehicles, government pursuing environment-friendly public mandates, emission-related regulations and changing consumer preferences of ownership—all challenging our ability to make decisions today.
Varroc, however, sees the future being filled with opportunity, discovery and expansion that will take Varroc to the next level.
Hence at Varroc, we believe We are Future Ready
• Comprehensive global footprint across 5 continents, 14 countries, 41 operating and 2 upcoming manufacturing facilities, 16 Research & Development centres
• Over 13800 employees across the globe
• Broad-based client base including major global PV OEMs and leading Indian 2W OEMs
• Manufacturing base in low-cost countries like Czech Republic, India, Mexico, Morocco, China, Poland and Turkey
• Technology-focused products aligned to the upcomingtrends in the automotive sector such as Electric vehicles, connected vehicles and advanced lighting applications for a greener, connected and autonomous world
• An empowering culture to enable every employee with a sense of purpose. We nurture talent and have created future-ready programs to drive sustainable expansion
• Strong Competitive Position in a Growing Market Segments
02 Varroc Engineering Limited
Lighting 60.4%
Others 5.0%
Electrical 12.0%
Metallic 6.9%
Polymer 15.7%
INTRODUCTION
Our Businesses
We have end-to-end capabilities across design, R&D, engineering, testing, manufacturing and supply of various products across our business. We have two primary business lines, namely (i) the design, manufacture and supply of exterior lighting systems to passenger cars OEMs worldwide (our “Global Lighting Business” or VLS) which we undertake through our subsidiaries forming part of the VLS group and (ii) the design, manufacture and supply of a wide range of auto components in India (our “India Business”), primarily to 2-wheeler and 3-wheeler OEMs, including exports. Our India Business offers a diversified set of products across three product lines, namely Polymers/Plastics, Electrical/Electronic and Metallic components. In addition, we have other smaller businesses, which include the design, manufacture and supply of 2-wheeler lighting to global OEMs, and undercarriage forged machine components for OHVs and drill bits for the oil and gas sector (our “Other Businesses”).
By locating its manufacturing facilities in comparatively lower cost countries, VLS is able to provide customers with lighting systems in a cost-efficient manner. VLS has a diversified customer base across nearly all major automotive markets in the world, except Japan and Korea. VLS has long-term relationships with leading auto manufacturers across the premium, mid-range and mass-market pricing spectrum, including Ford, Jaguar Land Rover, the Volkswagen Group, Renault-Nissan-Mitsubishi, Groupe PSA, FCA, a European multinational car manufacturer and an American electric car manufacturer. VLS has a broad portfolio of lighting products, including Halogen, Xenon/high-intensity discharge, light-emitting diode (“LED”), Matrix LED, high definition Micro-Electro-Mechanical Systems (“MEMS”) and digital micromirror device (“DMD”), surface LED, organic light-emitting diode (“OLED”) module, Flex LED, LED pixel and LED pixel headlamp, catering to the five product segments within external automotive lighting. VLS has sales offices in France, Germany and the United Kingdom and is headquartered in Plymouth, Michigan (United States of America).
Annual Report 2018-19 03
About UsGroup Overview
Varroc is a global tier-1 automotive component group. We design, manufacture and supply exterior lighting systems, plastic and polymer components, electrical-electronics components, and precision metallic components to passenger car, commercial vehicle, 2-wheeler, 3-wheeler and off-highway vehicle (“OHV”) OEMs directly worldwide. We are the second largest Indian auto component group (by consolidated revenue for FY2017) (Source: CRISIL Research) and a leading tier-1 manufacturer and supplier to Indian 2-wheeler and 3-wheeler OEMs (by consolidated revenue for FY2017) (Source: CRISIL Research). We are the sixth-largest global exterior automotive lighting manufacturer and one of the top three independent exterior lighting players (by market share in 2016) (Source: Yole). In FY19, we clocked in revenue in excess of 1̀20 billion. Between FY2016 and FY2019, we had a compound annual growth rate (“CAGR”) of 13.6% in our revenue.
History
We commenced operations in India with our Polymer business in 1990. We initially grew organically in India by adding new business lines, such as our Electrical division and Metallic division. Subsequently, we diversified our product offerings and expanded our production capacity through various investments, joint ventures and acquisitions. The acquisitions most notably included our 2012 acquisition of Visteon’s global lighting business, now known as Varroc Lighting Systems. In 2007 we acquired I.M.E.S (a manufacturer of hot steel forged parts for the construction and oil and gas industries) in Italy and in 2011 we acquired TRI.O.M. (now known as VLS Italy, a manufacturer of high-end lighting systems for global motorcycle OEMs) with operations in Italy, Romania and Vietnam. On February 13, 2018, we entered into a joint venture with Dell’Orto S.p.A., Italy, for the development of electronic fuel injection control systems for 2-wheelers and 3-wheelers. In 2018 we acquired a Turkey-based lighting products manufacturer.

Values
Mission
To be a 2̀00 Billion supplier of innovative solutions for transportation and allied industry in 2020. Core business sectors will be exterior lighting and 2- wheelers mobility
Be a partner of choice for vision, mobility and emission technologies
Be the fastest growing player in our core sectors
Our core values SHIPS serve as a common identity for every employee in the organization. These values have been ingrained in Varroc since inception and have stood the test of time. Our principles have helped us thrive in the global competitive market.
SHIPS:
Sincerity
Bring leading edge technologies to the mainstream markets with high quality, cost competitive solutions. By delivering customized solutions with superior service
Incorporating speed, agility and creativity
Fostering an environment that empowers employees and encourages the pursuit of excellence
Humility Integrity
Passion Self Discipline
VISION, MISSION & VALUES
Vision
04 Varroc Engineering Limited
Consolidated Financial Performance
FINANCIAL PERFORMANCE
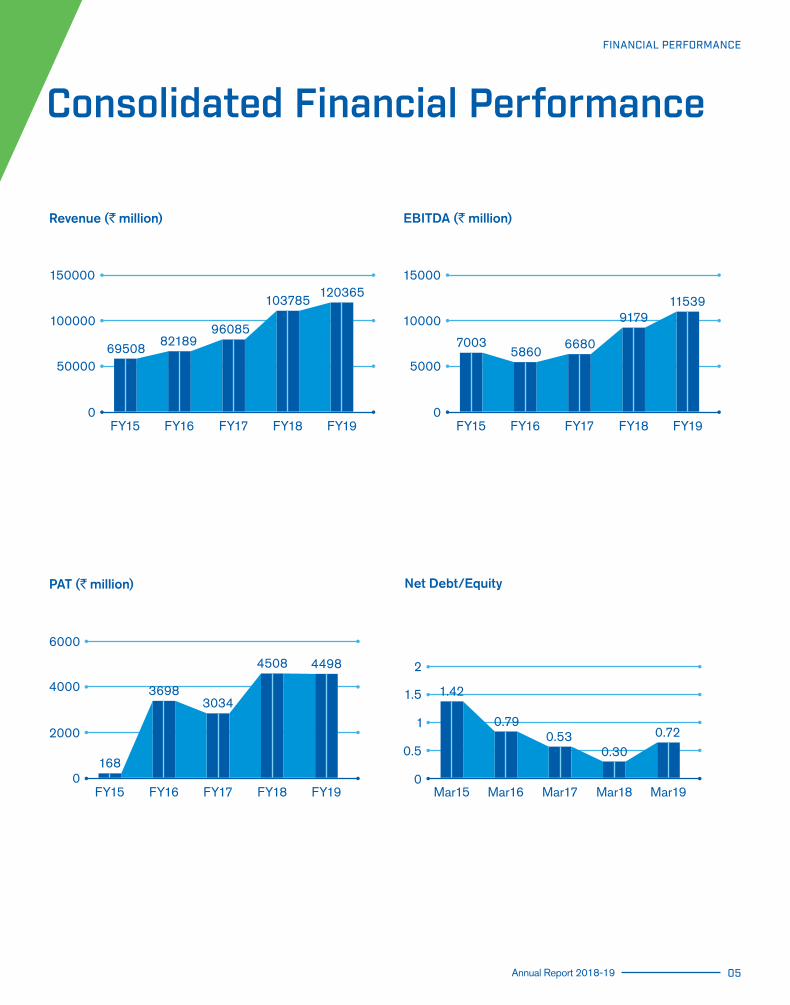
Revenue (` million)
150000 15000
10000
5000
100000
50000
0
69508 8218996085
FY15
FY15 Mar15 Mar16 Mar17 Mar18 Mar19
FY16
FY16
FY17
FY17
FY18
FY18
FY19
FY19
103785120365
FY15 FY16 FY17 FY18 FY19
EBITDA (` million)
6000
4000
2000
0168
36983034
4508 4498
Net Debt/EquityPAT (` million)
0
0.5
1
1.5 1.42
2
0.790.53
0.300.72
0
Annual Report 2018-19 05
70035860
6680
917911539

Net Debt/EBITDA ROCE (%)
0
1
2
3
2.23 2.41
1.74
0.94
1.46
0
10.00%
20.00%
30.00%
20.9%
11.8% 12.7%
17.0%14.2%
ROE (%)
0 0
10.00%
20.00%
30.00%
1.2%
26.0%
15.3%18.0%
15.1%
10
20
30
40
1.35
21.7727.21
33.40 33.11
Earnings Per Share ( ` )
Consolidated Financial Performance
FY15 FY16 FY17 FY18 FY19
FY15 FY16 FY17 FY18 FY19 FY15 FY16 FY17 FY18 FY19
FY15 FY16 FY17 FY18 FY19
06 Varroc Engineering Limited
FINANCIAL PERFORMANCE
We have taken concrete steps to inculcate future readiness in all our new endeavours. One such step is that we are investing in new technology for the mass market application. As a move to enhance the cost-effectiveness and to increase our reach, we have developed technology that is expected to be used on a broader scale.
New Product Offerings: VLS Business
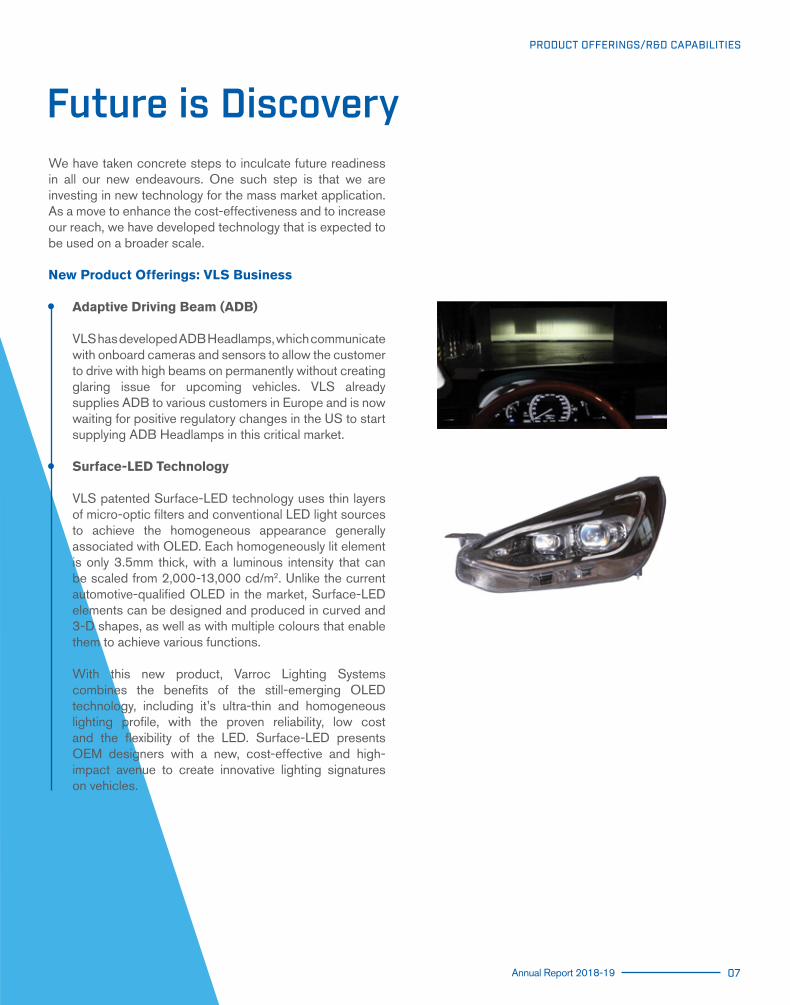
• Adaptive Driving Beam (ADB)
VLS has developed ADB Headlamps, which communicate with onboard cameras and sensors to allow the customer to drive with high beams on permanently without creating glaring issue for upcoming vehicles. VLS already supplies ADB to various customers in Europe and is now waiting for positive regulatory changes in the US to start supplying ADB Headlamps in this critical market.
• Surface-LED Technology
VLS patented Surface-LED technology uses thin layers of micro-optic filters and conventional LED light sources to achieve the homogeneous appearance generally associated with OLED. Each homogeneously lit element is only 3.5mm thick, with a luminous intensity that can be scaled from 2,000-13,000 cd/m2. Unlike the current automotive-qualified OLED in the market, Surface-LED elements can be designed and produced in curved and 3-D shapes, as well as with multiple colours that enable them to achieve various functions.
With this new product, Varroc Lighting Systems combines the benefits of the still-emerging OLED technology, including it’s ultra-thin and homogeneous lighting profile, with the proven reliability, low cost and the flexibility of the LED. Surface-LED presents OEM designers with a new, cost-effective and high-impact avenue to create innovative lighting signatures on vehicles.
Future is Discovery
PRODUCT OFFERINGS/R&D CAPABILITIES
Annual Report 2018-19 07

New Product Offerings: India Business
The 2-wheeler segment of the auto industry in India is expected to see major changes in the near term. Some of those relate to emission norms like BS-VI and some are led by technology upgradations, particularly the transition to EV’s.
Varroc has developed futuristic technology-driven products that relate to these trends. Some examples are:
• Telematics Products
The future trends indicate the need for an interdisciplinary field that encompasses telecommunications, vehicular technologies, and computer science. We have developed products such as turn-by-turn dashboards and connected 2-wheeler/car devices, which enable a host of analytical capabilities for multiple stakeholders apart from the drivers.
Varroc has developed the Varroc Telematics Control unit. It gathers vehicle data from ECU and transmits to a cloud-based platform (fig.1) and then the information is used for various use cases (fig.2) depending on the functionality of the location, fuel consumption or speed.
The telematics help not only keep up with the latest government legislation in telematics, but also helps cope with climate change.
The OEMs and fleet operators are strongly emphasizing energy saving and vehicle safety measures. At the same time, they want to ensure business models which can reduce total operational cost.
The primary use case for telematics is to measure driving data to offer services like driver behaviour analysis, predictive analysis and connected vehicle frameworks. Data collected from the vehicle is converted into a structured form to make accurate business decisions. For instance, helping an insurance company know the driver performance data to offer better products.
Figure 1 Varroc Standalone Telematics Unit
Figure 2 Various Data That Is AssimilatedFrom The Telematics Control Unit
PRODUCT OFFERINGS/R&D CAPABILITIES
08 Varroc Engineering Limited
Cornering
Elevation Breaking G-Force
No. ofJourneys
Latitude/Longitude
JourneyTime
Road Type Acceleration
Avg.Speed
Max.Speed
DistanceTravelled
VehicleData
CloudBased
Platform
GSM

• Connected Vehicles
Increase in the purchasing power of customers has led to a shift in preference for vehicles equipped with advanced functions which are driven by Connectivity and Telematics, rather than simple commuting machines.
Varroc’s engineering team has also developed a connected instrument cluster with mobile phone connectivity and turn-by-turn functionality (fig.3). This optionally can also be offered with cloud connectivity.
Figure 3 Varroc Instrument Cluster integrated with Telematics
• Electronic Fuel Injection (EFI)
As per the stricter BS-VI norms, the use of EFI is expected to become widespread in 2-wheelers from April 2020.The EFI system presents electronics hardware that can be used to integrate multiple product lines. We have developed an EFI technology with our joint venture with Dell’Orto and have received initial orders for the same.
• Advance Driver Assistance System (ADAS)
An autonomous car is a vehicle that can guide itself without human intervention. This kind of vehicle has become a concrete reality and may pave the way for future systems where computers take over the art of driving. We are advancing our technology to aid autonomous cars, that are going to be the future.
Varroc is laying the foundation for an era where vehicles drive themselves (ADAS) offering services to vehicle OEMs.
PRODUCT OFFERINGS/R&D CAPABILITIES
CloudBased
Platform
GSM
Annual Report 2018-19 09
VehicleData
Data:OBDEngineDTC
• LED Lamps
Varroc is the first tier-1 supplier/ancillary to produce LED lamps for a leading 2-wheeler OEM in India. Since then LED lamps have become a trend in the new launches. Our technological capabilities in Indian markets have enabled us to offer a variety of innovative solutions in this product category and Varroc is the only company in India to own technology in LED lamps. We now look forward to increasing our presence in 4 wheeler LED lamps in India.
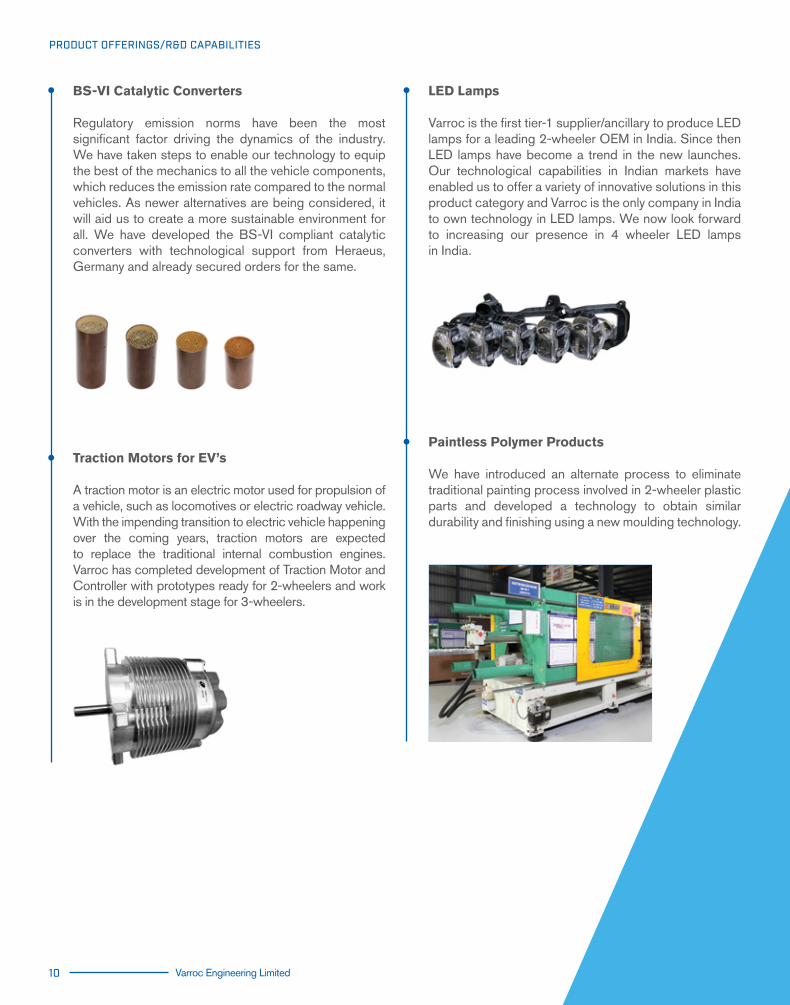
• Paintless Polymer Products
We have introduced an alternate process to eliminate traditional painting process involved in 2-wheeler plastic parts and developed a technology to obtain similar durability and finishing using a new moulding technology.
• BS-VI Catalytic Converters
Regulatory emission norms have been the most significant factor driving the dynamics of the industry. We have taken steps to enable our technology to equip the best of the mechanics to all the vehicle components, which reduces the emission rate compared to the normal vehicles. As newer alternatives are being considered, it will aid us to create a more sustainable environment for all. We have developed the BS-VI compliant catalytic converters with technological support from Heraeus, Germany and already secured orders for the same.
• Traction Motors for EV’s
A traction motor is an electric motor used for propulsion of a vehicle, such as locomotives or electric roadway vehicle. With the impending transition to electric vehicle happening over the coming years, traction motors are expected to replace the traditional internal combustion engines. Varroc has completed development of Traction Motor and Controller with prototypes ready for 2-wheelers and work is in the development stage for 3-wheelers.
PRODUCT OFFERINGS/R&D CAPABILITIES
10 Varroc Engineering Limited

• Research & Development Capabilities In Numbers
Future is always created with innovations and with our in-house R&D capabilities spread across India, China, USA, Mexico, Germany, Italy, Romania and Poland, we have established ourselves at a steady pace. With 1,500 R&D engineers and 185 patents granted globally, we have been at the forefront of discovering newer ways and means of simplifying mobility.
Head Lamps
Rear Lamps
Electronics
Xenon
LED
LED Module HeadlampControl Modules
Projector
LED
Matrix
PRODUCT OFFERINGS/R&D CAPABILITIES
Other Lights
Annual Report 2018-19 11
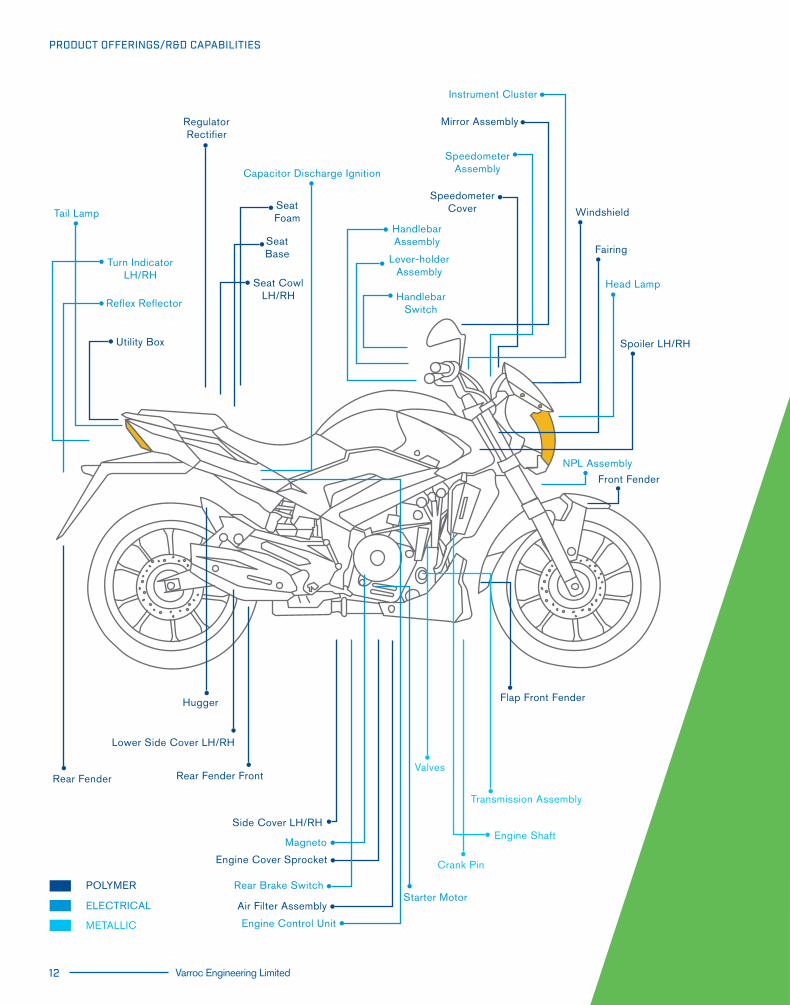
Rear Brake Switch
Engine Control Unit
Speedometer Assembly
Handlebar Assembly
Handlebar Switch
Lever-holder Assembly
Head Lamp
Starter Motor
Engine Shaft
Transmission Assembly
Valves
Crank Pin
Magneto
Turn Indicator LH/RH
Reflex Reflector
Rear Fender
Tail Lamp
Engine Cover Sprocket
Speedometer Cover
Mirror Assembly
Instrument Cluster
Windshield
Fairing
Spoiler LH/RH
Front Fender
Flap Front Fender
Air Filter Assembly
Lower Side Cover LH/RH
Rear Fender Front
Utility Box
Side Cover LH/RH
Hugger
Regulator Rectifier
Seat Foam
Seat Base
Seat CowlLH/RH
NPL Assembly
Capacitor Discharge Ignition
POLYMER
ELECTRICAL
METALLIC
PRODUCT OFFERINGS/R&D CAPABILITIES
12 Varroc Engineering Limited

Unique Customer Proposition
We have always offered a unique customer proposition for all our businesses. Since inception, we have built our reputation as a preferred supplier to many OEMs such as Bajaj, Royal Enfield, Honda and others. This reputation has helped us to diversify our customer portfolio and recently we have expanded our presence with Hero Group and we have secured our first order with TVS. Customer propositions have been part of our strategy and have helped us grow. Post our acquisition of VLS business our first priority was restoring confidence with the existing customers. This helped us in doubling our revenue to over USD 1 billion over a period of 5 years. The next phase of growth is expected to be driven by expanding our presence with leading global players like VW and Renault-Nissan-Mitsubishi combine. During the year FY19, our VLS business secured orders for 462 million Euro (526 million USD) equivalent in annual revenues, which is the highest ever order within a particular year in the history of VLS.
Building Blocks Of Our Unique Customer Proposition Are:
Speed
We are quick to respond to the needs of our customers. We have equipped ourselves with the means to be ever ready with the needs of the customer and it has helped us in reducing our turnaround time.
Geographical Reach
We are an Indian company with a global presence in 17 countries.
Flexibility
We have always been flexible to the needs of the customers. We go the extra mile to make sure our customers are happy and satisfied with our products and services.
Low Cost and Comprehensive Footprint for Lighting Business
Our manufacturing and R&D footprints are in low-cost geographies which enable us to provide cost-effective solutions to our customers without compromising on quality and technology.
Strong Customer Relationships
We make sure our relationship with the customer extends more than just transactional. It is imbibed in our culture to respect relationships and create a lasting bond that goes beyond business and services.
Technology Focus
For our India business, we are focused on bringing the best of the technology into the market and creating a unique offering which differentiates us from the competition.
For our global lighting business, by continuously adopting as well as inventing emerging technologies in the shortest possible time we have positioned ourselves as the fastest technology follower. This strategy has helped us optimize our R&D costs and improvise our product offerings.
One-Stop Solution Provider to Key OEMs
From the latest technology to the latest lighting components, we are a one-stop shop for all our customers need.
UNIQUE CUSTOMER PROPOSITION
Future is Customer
Annual Report 2018-19 13

Our relentless focus on technology-enabled capability development has played a key role in driving growth. We continuously focus on building capabilities by expanding our locational footprints for manufacturing as well as R&D, focusing on select value-accretive acquisitions and expanding customer base. During the year many such initiatives were undertaken. A summary of them is given below:
Expanding our Geographical Footprints
• Turkey Acquisition
To capitalize on emerging market growth and increase our global presence we acquired a Turkey-based interior and exterior lighting manufacturer viz. Sa-Ba, Turkey.This being a growing market, the acquisition enhances our ability to support existing customers on a global platform. This also increases our global manufacturing presence to 14 countries.
• New Facilities
Morocco & Brazil: During the year, VLS has set up a new manufacturing plant in Brazil, to serve the South American market, and in Morocco, to serve the Southern European and North African markets. Both these facilities started commercial production in the fourth quarter of FY19.
Poland & Chennai: VLS is in the process of setting up a new manufacturing plant in Poland, to serve key customers in European markets, and in Chennai, to serve some of the key global OEMs. We anticipate that our manufacturing plants in Poland and Chennai will commence production in FY20.
Japan: Varroc has expanded its footprints in Japan with the opening up of an office in Tokyo to increase the level of collaboration with existing and potential Japanese customers. They currently constitute a substantial portion of India revenue.
Brazil
Morocco
Japan
OUR CAPABILITIES
Future is Capability
14 Varroc Engineering Limited

OUR CAPABILITIES
Expanding our R&D Capabilities
Focus on R&D and the quest for low-cost solutions has always been our key strength. Recently we have expanded our R&D footprint by commissioning a facility in Krakow, Poland. This centre hosts a workspace for 120 engineers with spaces for mechanical, electrical and optical engineering. Coupled with electronic laboratory, we intend to use this facility as a focal point for global purchase team.
Expanding our Customer Base
During the year we have been successful in penetrating deeper into the existing customer and adding new customers for both of our businesses. We successfully added TVS Motor Company as a customer for our India business and expanded the existing offering to Hero Group. For our international business, we have won several orders from VW group and won significant orders from Renault-Nissan- Mitsubishi combine.
Annual Report 2018-19 15

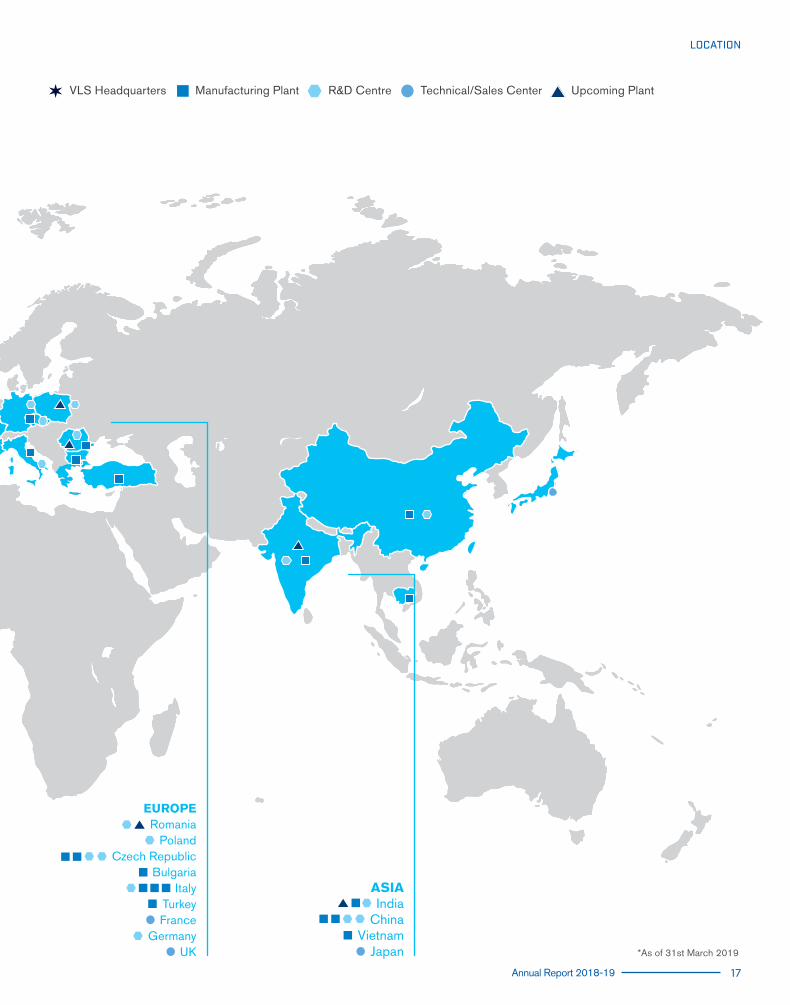
LOCATION
Geographical presence for our Global Business
SOUTH AMERICABrazil
AFRICAMorocco
NORTH AMERICAMexico
USA
16 Varroc Engineering Limited
LOCATION
*As of 31st March 2019
VLS Headquarters Manufacturing Plant R&D Centre Technical/Sales Center Upcoming Plant
ASIAIndia
ChinaVietnam
Japan
EUROPERomania
PolandCzech Republic
BulgariaItaly
TurkeyFrance
GermanyUK
Annual Report 2018-19 17
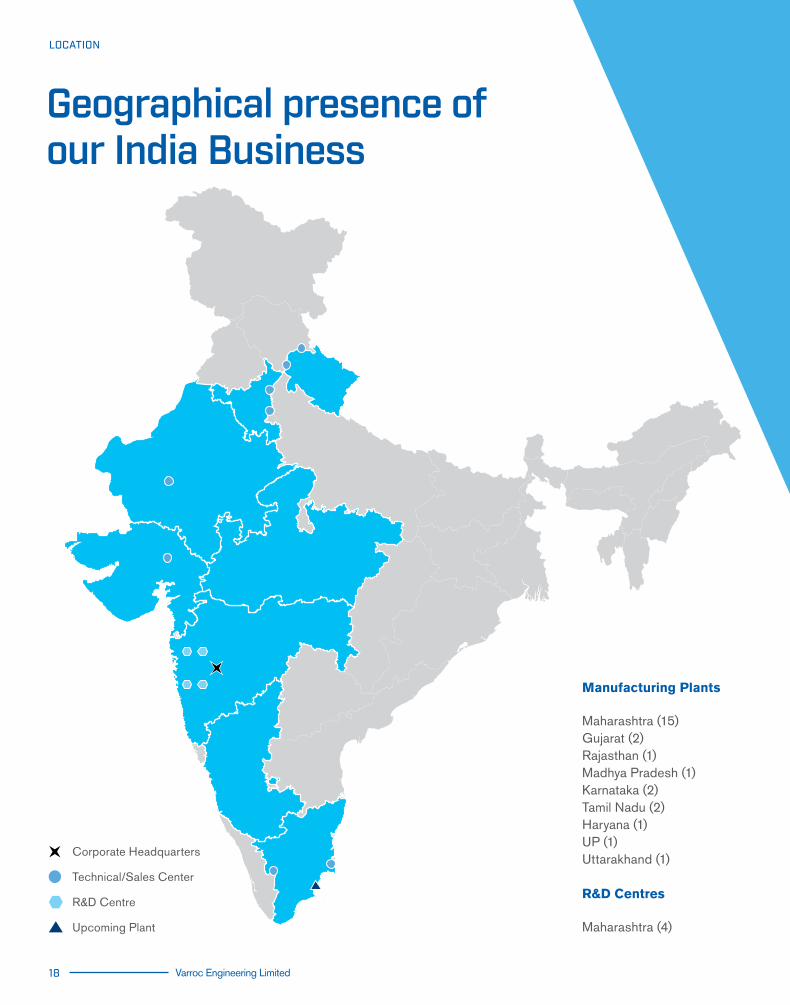
LOCATION
Manufacturing Plants*
Maharashtra (15)Gujarat (2)Rajasthan (1)Madhya Pradesh (1)Karnataka (2)Tamil Nadu (2)Haryana (1)UP (1)Uttarakhand (1)
R&D Centres
Maharashtra (4)
Corporate Headquarters
Technical/Sales Center
R&D Centre
Upcoming Plant
18 Varroc Engineering Limited
Geographical presence of our India Business

Digitalization is core to the successful functioning of a future-ready organization. This process needs to happen in every core function of the organization. Our process will introduce new softwares that would replace the old transactional ways and streamline everything for the ease of function. Our aim is to centralise the mode of transaction and make employees, vendors and customers a part of a system that is for all. To make our internal operations seamless and dynamic, we have aimed at achieving Digitalization across two spectrums viz. Business Process Automation and Digital Operations. The key activities undertaken in these two areas are:
Spectrum Category Activities Being Undertaken
Business Process Automation
BusinessDevelopment
Use of Digital platforms in the management of customer wise product profiles including cost structures and subsequent amendments
Production Automation of the capacity planning process
Finance
Digitalized Capex approval system
Digitization of Debtors/Creditors related processes and Cash Management Systems
Human Resources
Employee Self Service modules integrating all processes BI Module for the HR Function
“Real-Time Data” of shop headcount of each Plant/Process/BU to take Business decisions. Upgradation of Contract Labour Management System (CLMS) is not in a matured stage
Digital Operations
New Product Development
Driver Telematics to explore opportunities by providing Real-Time Data to various stakeholders
ProductionDriving IoT and Energy Management System for all Electrical Business unit plants
Purchase & ProcurementSupplier Capacity Planning and Real-Time Monitoring of the same
DIGITALIZATION
Future is Digitalization
Annual Report 2018-19 19

How is HR planning to create an empowering culture
Human resources require a continuous process of systematic planning ahead or being future ready to achieve optimum use of an organization’s most valuable asset—quality employees. Human Resources ensures the best fit between employees and jobs while avoiding manpower shortages or surpluses. At Varroc, our main goal for HR is to create and communicate a clear picture of the organization and to hire and develop the resources needed to achieve the organization’s business objectives. The uncompromising factor about the organization is that it has one global framework. As Varroc grows, the diversity grows, and HR is the leader in ensuring the organizational culture is clearly defined. At Varroc, our culture is clearly defined through our SHIPS values. Our SHIPS culture is an inclusive and empowering culture that enables all employees to achieve their goals. Over a number of years, we have grown from a few employees to many thousands and spread ourselves to different corners of the world. During these transitions, we have successfully maintained the agility and as we are growing, we will keep the same feeling of empowerment and inclusiveness as a footnote for all our future endeavours.
People Readiness–Nurturing Talent
We are living in exciting times where technology is changing frequently and impacting the role requirements of our jobs. This also means that many new jobs will be created over the next 10 years. The key to tackle this situation is by predicting the future and be future ready by nurturing and developing our talent. 4.0 is becoming a new normal. BS-VI is in the sight. EVs is the necessity of time. ABS is mandatory for 2-wheelers. These norms have heavily influenced the automobile sector and have cascaded onto the auto-ancillary space. This means talent can not only be developed functionally to meet future challenges but also be agile and flexible to deal with uncertainties. Customer Centricity and Operational Excellence will continue to remain pivotal to the performance of employees. In such a scenario, improving the ability to predict job performance is an important goal for Varroc. It is only by estimating an employee’s probability of contributing to the organization in the future that we will be able to make smart hiring and promotion decisions.
To be future ready, Varroc distinctly focuses on following interventions:
Future Ready Program
Building functional capability and creating a talent pool to meet future challenges is planned through our various university programs globally. We hire fresh talent from various premier engineering colleges across the globe and map them to critical projects in various functions like Quality, Advanced Engineering, R&D, SCM and Manufacturing Engineering to work on. These projects are supervised and fast-tracked through the guidance of project guides and mentors. There are project reviews scheduled across the year to track their progress or at the completion of the projects. Towards the end of projects, they are evaluated for potential assessment for future full-time roles. To guarantee utmost exposure, they may be provided an opportunity of job rotation through feeder roles, world-class training programs and on the job training. Individual Development Plans help to define their career paths and transition into the aspirational role. Future Leaders Program
We at Varroc are unique in identifying and nurturing talent from colleges and universities across all of our locations to be future leaders at Varroc. The selection is based on hiring plans in our Annual Business Plan and is decided on expertise to be brought on depending on the projects. The candidates in these schools undergo a series of assessment tests ranging from personality, reasoning, analytical tests, etc. Varroc strongly believes in aligning the organizational goals with the individual goals. Hence, it is paramount to steer talent in the right direction for greater impact. For achieving this, we have focused induction giving management trainees the business context, future critical projects, organizational challenges and opportunities. Business Leaders share their perspective to infuse confidence and they are given high impact projects. A strong review mechanism is set to analyze and track progress on deliverables, value-add in the business, and key contribution made.
NURTURED TALENT
Future is People
20 Varroc Engineering Limited
Leadership Capability Building
Technology is a game changer for Varroc. Technology also brings in niche skills that are rare to find in the market. The speed of technological advancement is immense. However, technology along with leadership competence is necessary for excellence. We at Varroc understand that retaining talent in a VUCA (Volatility, Uncertainty, Complexity and Ambiguity) world is of extreme priority. Varroc focuses on developing successors for critical roles to ensure that there are no gaps in the leadership succession plan. Varroc invests into critical talent to build flexibility by aligning an employee’s potential to the Varroc Competency Framework. It also aims to build capability through blended learning experiences, partnership with universities and learning partners. Our focus is on building world-class leadership and a culture of learning, build talent for the future. We have mapped high potential employees to critical roles, identified them on the grid of performance and potential and looked at gaps to plan for succession and growth movements that meet business needs.
Building a Strong Succession Pipeline
Varroc has successfully identified high-impact critical roles in the company’s succession plan for employee’s that are ready now and those that need additional development assignments. The identified successors are earmarked to these roles along with tenure for such transition. The pipeline of leadership with a high readiness quotient requires a sustainable process of selection, training, and development. We have implemented periodic reviews of learning on the job, trainings, teach back sessions, and leadership coaching program for targeted diverse populations.
NURTURED TALENT
Annual Report 2018-19 21

I am pleased to present you the annual report of the Company for the financial year 2018-19. I take this opportunity to thank you for the trust and confidence reposed by you on the Company and the management.
Global and Indian economic scenario
The financial year gone by posed a number of challenges. Economic growth slowed down in all the major economies. The consumer demand softened across the globe due to a confluence of factors like trade tensions between United States and China, the slowdown in economic growth, Brexit, higher fuel prices and more stringent emission regulations. The demand for passenger vehicles in China actually declined during the year after many years of strong growth, while the growth in Europe and North America was marginal.
India’s economic growth was also impacted by the softness in rural demand and the policy uncertainties due to the upcoming elections, with the slowdown more pronounced in the later part for the year. The demand for both 2-wheelers and passenger vehicles actually declined in the second half of the year due to the slowdown in economic growth, higher fuel prices, new regulations related to insurance and the constraints in the availability of financing for new vehicles from the non-banking sector.
Global lighting industry
In 2018, the worldwide sales of passenger cars and light commercial vehicles declined for the first time since 2009, as car makers sold 0.5% fewer vehicles, according to JATO Dynamics figures, based on their data of 54 top markets.
Chinese auto sales were impacted by the macroeconomic situation, trade sanctions by the US and the withdrawal of Government incentives for new car purchases, leading to a YoY decline of 13.5% in passenger vehicles sales after many years of growth.
The overall decline in demand for passenger vehicles has naturally impacted the demand for lighting products as well. However, the increasing penetration of advanced lighting technologies like LED, resulting in higher lighting content per vehicles has helped in neutralising the same to some extent. This trend is expected to continue in the medium term, which augurs well for the medium-term growth prospects of the business.
We are Future Ready
22 Varroc Engineering Limited
MD’S MESSAGE

Indian 2-Wheeler Industry
The 2-wheeler production in India grew at a slower pace of 5.8% YoY in FY19 when compared to double-digit growth in FY18, according to the data published by SIAM. The strong growth in the first 6 months of the year was offset by a decline of almost 10% in the last quarter of the year. The export of 2-wheelers from India saw a strong growth of 16.5% over the previous year. Varroc Performance during FY19
In these challenging economic environment and market conditions, we outperformed the market and reported another year of strong revenue growth. During the year, we saw our consolidated revenue growing past the 1̀20 billion-mark, a reported growth of 16.0%. Our India Business grew by 17.1% and our Global Lighting Business revenue growth was 15%. The consolidated EBITDA for the full year was at ̀ 11.5 Billion, a growth of 25.7% over the previous year. The India Business contributed EBITDA of 4̀.6 billion while our Global Lighting Business contributed 6.4 billion (excluding our share of China JV but after considering the positive impact of Ind AS 115). Our Consolidated PAT for the year was 4̀.5 Billion, almost equal to that in FY18, in spite of the significant reduction in the contribution of profit from the China JV from 6̀73 mn to less than 3̀03 mn in the current year. During the year, our VLS business won the highest ever new orders of Euro 462 million. In India business, we won our first order from TVS, expanded the range of products we supply to other customers and secured the first orders for new BS-VI related products like the Electronic Fuel Injection (EFI) and Catalytic Converter. We have also developed a prototype for Traction Motor for 2-wheeler EV, which is currently under test by potential customers. We are also developing other products related to EVs.
During the year, we started commercial production at three new manufacturing facilities (Brazil, Morocco and Halol, Gujarat, India) and started construction of new plants for the VLS business in Poland and in Chennai, India. We also completed the expansion and technological upgradation of VLS Czech plants. The full benefit of these investments will be visible in the next two to three years.
Our key strengths continue to be our strong competitive position in attractive growing markets, strong and long-standing customer relationships, comprehensive product portfolio and low cost, strategically located manufacturing and design footprint. We also have robust in-house technology, innovation and R&D capabilities, which gives us a clear edge over our competition and helps us to meet our customer requirements for customised solutions in a cost-effective manner.
Outlook
The economic outlook in the short term continue to be quite uncertain. This, coupled with the upcoming regulatory changes relating to BS-VI poses challenges with visibility in the recovery of demand. In order to protect our profitability, we will be focusing on increasing productivity, optimising operational costs and capex, and capitalising on new opportunities such as BS-VI emission norms and increasing 2-wheeler EV penetration in India.
Thank you for your ongoing commitment to Varroc. I also like to thank our Customers, Creditors, Banks, Financial Institutions and other Stakeholders, without whose patronage we could not have been where we are.
TARANG JAINManaging Director
Annual Report 2018-19 23
MD’S MESSAGE
Auditors
S R B C & CO LLP, Pune.
Company Secretary &Compliance Officer
Rakesh Darji
Management Team
Tarang JainManaging Director
Ashwani Maheshwari Whole-time Director and Chief Executive Officer, India Business
Stephane VediePresident and Chief Executive Officer-Varroc Lighting Systems
T.R. Srinivasan Group Chief Financial Officer
Arjun JainBusiness Head Electrical-Electronics Division; Whole Time Director
Dharapuram S. SethumadhavanBusiness Head-Polymer Division
Bankers
Bajaj Finance Ltd.Citibank N.A.Corporation BankHDFC Bank LimitedHSBCICICI Bank LimitedIDBI Bank LimitedKotak Mahindra Bank LimitedSaraswat Co-operative Bank LimitedStandard Chartered Bank
Registrar and Transfer Agent
Link Intime India Private LimitedC 101, 247 Park, L.B.S Marg,Vikhroli West, Mumbai–400 083.Tel. No: +91 22 49186270Fax: +91 22 49186060
E-mail id: [email protected]: www.linkintime.co.in
Website
www.varrocgroup.comwww.varroclighting.com
Registered & Corporate Office
Registered OfficeL-4, MIDC Area, Waluj, Aurangabad 431 136. Tel: +91 240 6653 700/6653 699 Fax: +91 240 2564 540
Corporate OfficeVarroc Engineering Ltd. B-3010, 3rd Floor, Marvel Edge, Datta Mandir Chowk, Vimannagar, Pune–411 014, India.
Corporate Identity Number (CIN)L28920MH1988PLC047335
CORPORATE INFORMATION
Corporate Information
24 Varroc Engineering Limited
Plants – India Business
VEL IProducts: Electrical, LightingPlot No. E–4, MIDC Waluj, Aurangabad–431136 (M.S.)
VEL IIProducts: ElectricalPlot No. K-101/102, MIDC, Waluj, Aurangabad–431136 (M.S.)
VEL IIIProducts: ElectronicsPlot No. B–24/25, MIDC, Chakan, Tal. Khed. Dist. Pune–410501 (M.S.)
VEL IVProducts: ElectricalPlot No. M–140/141, MIDC, Waluj, Aurangabad–431136 (M.S.)
VEL VProducts: MetallicsPlot No. L–6/2, MIDC, Waluj, Aurangabad–431136 (M.S.)
VEL VIProducts: ElectricalGut No. 390, Takve (Bk) Dist. Pune-412106 (M.S.)
VEL VIIProducts: MetallicsPlot No. L–4, MIDC, Waluj, Aurangabad–431136 (M.S.)
VEL VIIIProducts: MetallicsPlot No. M–191/3, MIDC, Waluj,Aurangabad–431136 (M.S.)
VEL (exhaust plant) Products: Electrical Plot No. B14, MIDC, Chakan, Tal. Khed. Dist. Pune–410501 (M.S.)
VEL HalolProducts: Electrical103/4 Maswad, GIDC, Halol-II, Dist. Panchmahal, 389350 (GJ)
VEL CNProducts: ElectricalSurvey No. 645 2G/2C, Panruti Kandigai, 602105 (CN)
VEL PNProducts: Electrical, Polymer, MetallicPlot No. 20, Sector 9, IIE, Pantnagar, 263153 (UK)
DIPL Valves Products: MetallicsPlot No. F–57 / 58, MIDC, Waluj, Aurangabad 431136 (M.S.)
VPPL IProducts: PolymerGut No. 390, Takve BK, Tal. Maval, Dist, Pune 412106 (M.S.)
VPPL IIProducts: PolymerE-88, MIDC, Ranjangaon, Tal. Shirur, Dist. Pune 412 220 (M.S.)
VPPL IIIProducts: Polymer Plot No. M–165/167, MIDC, Waluj, Aurangabad 431136 (M.S.)
VPPL IVProducts: PolymerGut No. 99, Village Pharola, Tq. Paithan, Dist. Aurangabad 431105 (M.S.)
VPPL TCProducts: PolymerPlot No. M–138/139, MIDC, Waluj, Aurangabad 431136 (M.S.)
CORPORATE INFORMATION
Annual Report 2018-19 25

VPPL GNProducts: PolymerPlot No. 35A Udyog Vihar, Greater Noida, Dist–Gautam Budh Nagar, 201306
VPPL BNProducts: Polymer58th Milestone, Near Mittal Orchid Resorts, NH8, Binola, Gurgaon, 122413 (Haryana)
VPPL PHProducts: PolymerPlot No. SP3-803, Pathredi Industrial area, Dist.Alwar, 301018 (Rajasthan)
VPPL CNProducts: Polymer Survey No. 128-1B & 129-1B, Ezhichur Village, Sriperambudur taluk,Kancheepuram Dist. 603204 (Chennai)
VPPL GJProducts: Polymer Survey No: 154/1,154/3,155/2, Karsanpura, TQ, Mandal Dist, Ahmedabad 382140 (GJ)
VPPL BGProducts: Polymer Plot No.271 & 272(P), Narasapura Industrial Area, Kolar Dist. 563133 (Karnataka)
VPPL INProducts: Polymer Plot No. 601-A & B Sector-III, Industrial Area, Pithampur, Dist. Dhar 454775 (M.P.)
VPPL CKProducts: PolymerC-III, Phase-II, MIDC Chakan, Village Bhamboli, Taluka Khed, Dist. Pune 410501 (M.S.)
TCPL Products: Polymer Plot No. 136/B, Harohalli Industrial Area, Kanakapura Taluka, Ramanagara District 562112 (Karnataka)
Plants – Varroc Lighting Systems
• Novy Jicin, Czech Republic.
• Rychvald, Czech Republic.
• Monterrey, Mexico.
• Survey No. 279, Maan, Hinjewadi, Pune.
• Tangier, Morocco.
• Sorocaba, Brazil.
Varroc TYC (Changzhou)228 Taishan Road, Changzhou, PRC–213 022, China
Varroc TYC (Chongqing)1# Tongyi Road, Qinggang Street, BishanDistrict, Chongqing, China
VLS Small LampsVLS Italy S.p.A.Products: 2-Wheeler Via Dei Prati 20, Cambiano (TO), Italy
VLS Romania S.A.Products: 2-Wheeler Str. Calarasilor, 112-114, TG-Mures, Romania
VLS VietnamProducts: 2-Wheeler Lot 11, Quang Minh Industrial Zone, Me Linh, Hanoi, Vietnam
I.M.E.S S.p.A.Products: MetallicsVia Sandroni 34, Sumirago, Italy
Nuova CTSProducts: MetallicVia Trinita 3 Vignola, Italy
CORPORATE INFORMATION
26 Varroc Engineering Limited

Annual Report 2018-19 27
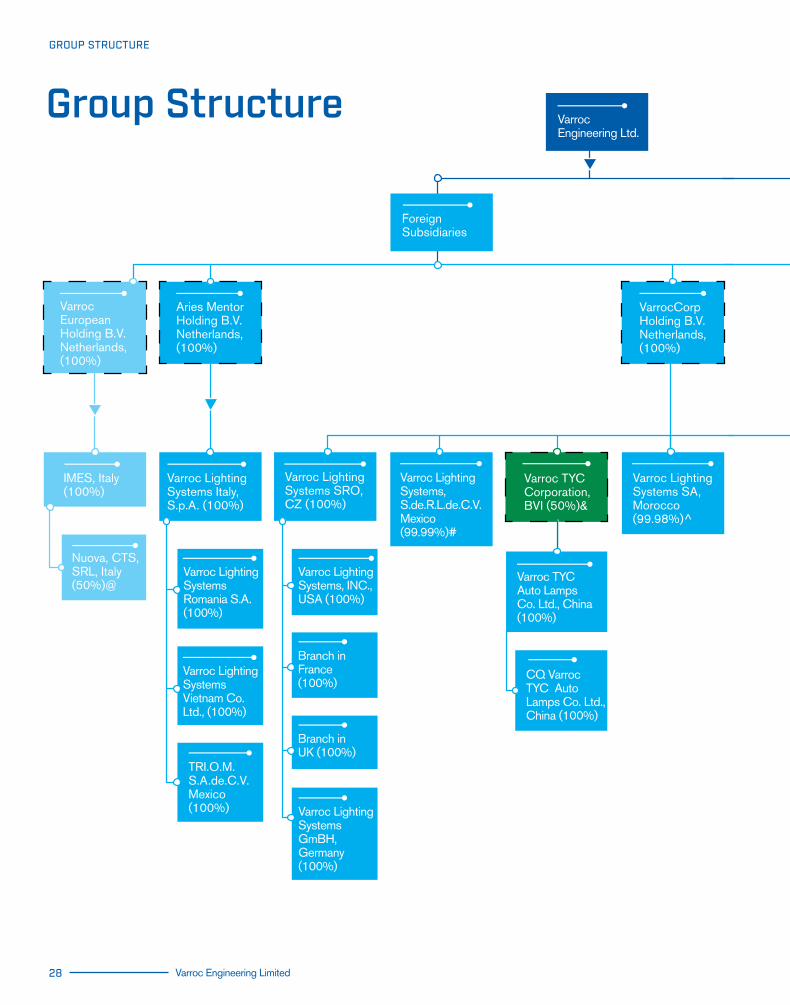
Varroc TYCAuto LampsCo. Ltd., China(100%)
Varroc LightingSystemsGmBH,Germany (100%)
Varroc EuropeanHolding B.V.Netherlands,(100%)
Aries MentorHolding B.V.Netherlands,(100%)
Varroc TYCCorporation,BVI (50%)&
CQ Varroc TYC Auto Lamps Co. Ltd., China (100%)
VarrocCorpHolding B.V.Netherlands, (100%)
Varroc LightingSystems SA,Morocco (99.98%)^
Varroc doBrasil IndustrialE ComerciaLTDA (99.99%)+
Varroc LightingSystems, S.p.z.o.o.(99%)$
Varroc LightingSystemsBulgaria Eood(100%)
ForeignSubsidiaries
Varroc Engineering Ltd.
JointVenture
IndianSubsidiaries
VarrocDell’Orto Pvt.Ltd. (50%)^^
Varroc LightingSystems (India) Pvt. Ltd. (100%)
Varroc PolymersPvt. Ltd. (100%)
Team ConceptsPvt. Ltd. (95%)&&
DurovalvesIndia Pvt. Ltd.(72.78%)$$
Varroc Lighting Systems Turkey Endüstriyel Ürünler İmalat ve Ticaret Şirketi, (100%)
Varroc ElbaElectronicsSRL, Romania(70%)**
Varroc LightingSystems,S.de.R.L.de.C.V.Mexico(99.99%)#
Varroc LightingSystems Italy,S.p.A. (100%)
Varroc LightingSystems SRO,CZ (100%)
Varroc LightingSystems, INC.,USA (100%)
Branch inFrance (100%)
Branch in UK (100%)
Varroc LightingSystemsRomania S.A.(100%)
Varroc LightingSystemsVietnam Co.Ltd., (100%)
TRI.O.M.S.A.de.C.V.Mexico (100%)
IMES, Italy(100%)
Nuova, CTS,SRL, Italy(50%)@
Varroc JapanCo. Ltd. Japan(100%)
GROUP STRUCTURE
Group Structure
28 Varroc Engineering Limited

Varroc TYCAuto LampsCo. Ltd., China(100%)
Varroc LightingSystemsGmBH,Germany (100%)
Varroc EuropeanHolding B.V.Netherlands,(100%)
Aries MentorHolding B.V.Netherlands,(100%)
Varroc TYCCorporation,BVI (50%)&
CQ Varroc TYC Auto Lamps Co. Ltd., China (100%)
VarrocCorpHolding B.V.Netherlands, (100%)
Varroc LightingSystems SA,Morocco (99.98%)^
Varroc doBrasil IndustrialE ComerciaLTDA (99.99%)+
Varroc LightingSystems, S.p.z.o.o.(99%)$
Varroc LightingSystemsBulgaria Eood(100%)
ForeignSubsidiaries
Varroc Engineering Ltd.
JointVenture
IndianSubsidiaries
VarrocDell’Orto Pvt.Ltd. (50%)^^
Varroc LightingSystems (India) Pvt. Ltd. (100%)
Varroc PolymersPvt. Ltd. (100%)
Team ConceptsPvt. Ltd. (95%)&&
DurovalvesIndia Pvt. Ltd.(72.78%)$$
Varroc Lighting Systems Turkey Endüstriyel Ürünler İmalat ve Ticaret Şirketi, (100%)
Varroc ElbaElectronicsSRL, Romania(70%)**
Varroc LightingSystems,S.de.R.L.de.C.V.Mexico(99.99%)#
Varroc LightingSystems Italy,S.p.A. (100%)
Varroc LightingSystems SRO,CZ (100%)
Varroc LightingSystems, INC.,USA (100%)
Branch inFrance (100%)
Branch in UK (100%)
Varroc LightingSystemsRomania S.A.(100%)
Varroc LightingSystemsVietnam Co.Ltd., (100%)
TRI.O.M.S.A.de.C.V.Mexico (100%)
IMES, Italy(100%)
Nuova, CTS,SRL, Italy(50%)@
Varroc JapanCo. Ltd. Japan(100%)
GROUP STRUCTURE
Varroc Engineering Limited
Balance 50% is held by Mr. Roberto Tassi
Balance 0.01% is held by Mr. Tarang Jain
Balance 50% is held by BESTE Motor Co. Ltd.
Balance 0.02% is held by the Administrators
Balance 0.01% is held by Varroc European Holding B.V.
Balance 0.01% is held by VLS, CZ
Balance 5% is held by erstwhile Promoters
Balance 27.22% is held by Scarpa & Freccia
Balance 30% is held by Elba SA, Romania
Balance 50% is held by Dell’Orto S.p.A., Italy
@
#
&
^
+
$
&&
$$
**
^^
Parent Company
Varroc India Business
Varroc Lighting Systems
Joint Ventures
IMES
Holding Company, No Operations
Annual Report 2018-19 29
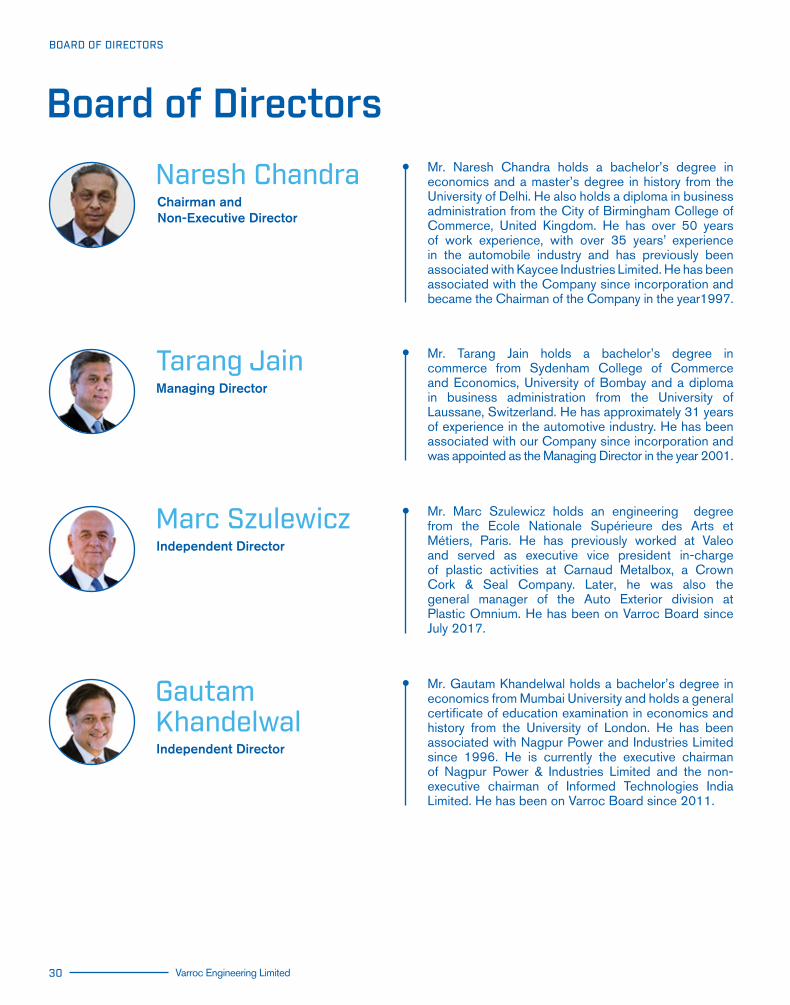
• Mr. Marc Szulewicz holds an engineering degree from the Ecole Nationale Supérieure des Arts et Métiers, Paris. He has previously worked at Valeo and served as executive vice president in-charge of plastic activities at Carnaud Metalbox, a Crown Cork & Seal Company. Later, he was also the general manager of the Auto Exterior division at Plastic Omnium. He has been on Varroc Board since July 2017.
• Mr. Tarang Jain holds a bachelor’s degree in commerce from Sydenham College of Commerce and Economics, University of Bombay and a diploma in business administration from the University of Laussane, Switzerland. He has approximately 31 years of experience in the automotive industry. He has been associated with our Company since incorporation and was appointed as the Managing Director in the year 2001.
• Mr. Gautam Khandelwal holds a bachelor’s degree in economics from Mumbai University and holds a general certificate of education examination in economics and history from the University of London. He has been associated with Nagpur Power and Industries Limited since 1996. He is currently the executive chairman of Nagpur Power & Industries Limited and the non-executive chairman of Informed Technologies India Limited. He has been on Varroc Board since 2011.
Chairman andNon-Executive Director
Naresh Chandra
Managing Director
Tarang Jain
GautamKhandelwal
• Mr. Naresh Chandra holds a bachelor’s degree in economics and a master’s degree in history from the University of Delhi. He also holds a diploma in business administration from the City of Birmingham College of Commerce, United Kingdom. He has over 50 years of work experience, with over 35 years’ experience in the automobile industry and has previously been associated with Kaycee Industries Limited. He has been associated with the Company since incorporation and became the Chairman of the Company in the year1997.
Independent Director
Independent Director
Marc Szulewicz
BOARD OF DIRECTORS
Board of Directors
30 Varroc Engineering Limited

• Mr. Arjun Jain holds a bachelor’s degree in arts from Vassar College, New York. Previously he was associated with Bain & Company India Private Limited. He joined in October 2013 as the general manager-business excellence division. He was appointed as the business head of the electrical division in May 2015. From July 2015 to February 2018, he was also the whole-time Director of the Company.
• Mr. Ashwani Maheshwari holds a bachelor’s degree in engineering (mechanical engineering) from the Indian Institute of Technology, Roorkee (formerly University of Roorkee) and a master of science degree in leadership and strategy from the London Business School, London, United Kingdom. He has also successfully completed the executive development program from the Wharton School, University of Pennsylvania, USA. He has previously worked with The Tata Iron and Steel Company Limited as a graduate trainee, as a senior vice president–India business division in ITC Infotech India Limited and as the president–Birla Tyres at Kesoram Industries Limited. He has been on Varroc Board since March 2016.
Ashwani Maheshwari Whole-time DirectorCEO, India business
Independent Director
Independent Director
Vinish Kathuria • Mr. Vinish Kathuria holds a bachelor’s degree in chemical engineering from Indian Institute of Technology, Delhi and a master’s degree in science from Case Western Reserve University, Cleveland, Ohio. He also holds a master’s degree in business administration from the Duke University’s Fuqua School of Business, North Carolina. He is the co-founder and president of Rank Software Inc. He has previously been associated with Ericsson India Private Limited, HT Mobile Solutions Limited, Indian Angel Network Services Private Limited and has served on the boards of Phonon Solutions Private Limited and Rank Software Inc. He has been on Varroc Board since February 2018.
Vijaya Sampath • Mrs. Vijaya Sampath holds a bachelor’s degree in arts from Madras University and a bachelor’s degree in law from Mysore University. She is registered as an advocate with the Bar Council of Delhi. She is also a fellow member of the Institute of Company Secretaries of India. She attended the advanced management program of Harvard Business School, USA and a program on managing strategic alliances conducted by the Wharton School, University of Pennsylvania, USA. Previously, she has been associated with Lakshmikumaran & Sridharan Attorneys as a senior partner and with the Bharti Airtel Limited as group general counsel and company secretary. She has been on Varroc Board since July 2017.
Arjun JainWhole-time DirectorBusiness Head Electrical-Electronics Division
BOARD OF DIRECTORS
Annual Report 2018-19 31
• Mr. Stephane Vedie holds a diploma in purchasing management function from the Academy of Grenoble, France and a degree from Amiens Business School, France. He has previously been associated with Magneti Marelli. He has 15 years of experience in automotive lighting. He joined our Subsidiary, Varroc Lighting Systems Inc. in December 2016.
• Mr. T. R. Srinivasan holds a bachelor’s degree in commerce from Bharathidasan University, Tamil Nadu. He has obtained a post-graduate diploma in management from Indian Institute of Management, Calcutta. He is a member of the Institute of Cost and Works Accountant of India. He has previously been associated with Hindustan Lever Limited, Philips Electronics India Limited, Reliance Digital Retail Limited, Siro Clinpharm Private Limited, ATC Tires Private Limited. He has approximately 30 years of work experience. He joined the Company in October 2017 and was appointed as a Chief Financial Officer in February 2018.
• Mr. Sethumadhavan D. holds a Master’s degree in Material Science from the Regional Engineering College, Trichy, India.
In his career spanning 22 years, he has been associated with Assa Abloy, Stanley Black & Decker, Schneider Electric, General Electric and Lucas TVS. He joined Varroc in June 2018.
T.R. Srinivasan
Sethumadhavan D.
In addition to Tarang Jain, our Managing Director and Ashwani Maheshwari, our whole-time Director and CEO of India Business and Arjun Jain, Whole-time Director and Business Head-Electrical-Electronics Division, the following persons are the Key Management of our Company.
Group Chief Financial Officer
Business Head-Polymer Division
President and Chief Executive Officer, Varroc Lighting Systems
Stephane Vedie
KEY MANAGEMENT
Key Management
32 Varroc Engineering Limited

Annual Report 2018-19 33
Management Discussion and Analysis
ECONOMIC REVIEW
Global Economic Overview
Following a broad-based upswing in cyclical growth that lasted nearly two years, the global economic expansion decelerated in the second half of 2018. Activities softened amid an increase in trade tensions and tariff hikes between United States and China, a decline in business confidence, a tightening of financial conditions and policy uncertainty across many economies.
The Euro area economy lost more momentum than expected as consumer and business confidence weakened and car production in European countries like Germany was disrupted by the introduction of new emission standards. Trade tensions contributed to the worsening of financial market sentiments with conditions tightening for emerging economies in the spring of 2018 and for developed economies later in the year, weighing on global demand. Conditions have relatively eased in 2019 as US Federal Reserve signaled a more accommodative monetary policy stance and the markets become more optimistic about a US-China trade deal.
As a result of these developments, global economic growth is now projected to slow from 3.6% in 2018 to 3.3% in 2019, before returning to 3.6% in 2020. The projected pickup in the second half of 2019 is predicted on an ongoing buildup of policy stimulus in China, recent improvements in global financial market sentiments and the waning of some temporary drags on growth in the Euro area.
Improved momentum for emerging market and developing economies is projected to continue in 2020, primarily reflecting recovery from the economic distress. By contrast, activity in advanced economies is projected to continue to slow gradually as the impact of US fiscal stimulus fades and growth tends towards modest potential.
(Source: World Economic Outlook - April 2019, IMF)
Exhibit 01: Global GDP Growth (%)
3.0 1. Advanced Economies
3. Selected Advanced Economies
4. Selected Emerging Market and Developing Economies
2. Emerging Market and Developing Economies
2.5
2.0
1.5
1.0
-10
1
2
3
4
5
-10-50510152025
6.0
5.5
5.0
4.5
3.5
4.0
2015:H1
2015:H1
17:H1
17:H1
19:H1
19:H1
20:H2
20:H2
2015:H1
17:H1
19:H1
20:H2
United StatesEuro areaJapan
ArgentinaBrazilChina
MexicoTurkeyEm. Asia ex. China
(Source: World Economic Outlook - April 2019, IMF)
Indian economy overview
In India growth is projected to pick up to 7.0% in FY2020, supported by the continued recovery of investments and robust consumption amid a more expansionary stance of monetary policy and some expected impetus from fiscal policy. This stabilization will also be due to continued implementation of structural reforms and easing of infrastructure bottlenecks.
While growth will remain consumption driven, investment will improve gradually, aided by bank recapitalization and improved capacity utilization. Export growth, at 8%, increased at the highest pace in the past five years during FY19. However, imports too grew at a even higher pace expanding the trade deficite to USD 176 billion. Consumer Price Index (CPI)-linked inflation is expected to soften to around 3% in first six months of FY20 due to lower food and fuel prices.
Upside risks to inflation, however, arise from three factors:(i) fiscal actions (such as higher minimum support price (MSP) and higher pension out going to the Seventh Pay Commission) that will exert higher influence on inflation;(ii) firmer global oil and metal prices that will compel manufacturers to raise prices given improving domestic demand conditions; and (iii) higher MSPs for farmers and higher import duties. Current account deficit (CAD) is expanded from in fiscal 2019, owing to import growth exceeding export growth. Higher CAD will exert pressure on the Rupee as well. Capital inflows face risks from tightening of global liquidity and adverse global financial developments.

34 Varroc Engineering Limited
Exhibit 02: India’s GDP (%)
Management Discussion and Analysis
7.9%
7.0%
FY 17
6.7%
7.3%
7.0%
8.0%
6.0%
7.0%
7.5%
6.5%
FY 16 FY 18 FY 19 FY 20
India's GDP Growth Rate Trend
Source: CSO, Govt of India, RBI
BUSINESS SCENARIO AND INDUSTRY OUTLOOK & OPPORTUNITIES
Our business is directly related to our customers’ vehicle sales and production levels across various segments. Automotive sales and production are highly cyclical and depend on general economic conditions and other factors, including consumer spending and preferences, as well as changes in interest rate levels, consumer confidence and fuel costs.
We have two primary business lines, namely (i) the design, manufacture and supply of exterior lighting systems to passenger cars OEMs worldwide (our "Global Lighting Business" for VLS), which we undertake through our subsidiaries forming part of the VLS group and (ii) the design, manufacture and supply of a wide range of auto components in India (our "India Business"), primarily to two-wheeler and three-wheeler OEMs, including exports.
Our India Business offers a diversified set of products across three product lines, namely Polymers/Plastics, Electrical/Electronics and Metallic components. In addition, we have other smaller businesses, which include the design, manufacture and supply of two-wheeler lighting to global OEMs, and under carriage forged machine components for OHVs and drill bits for the oil and gas sector.
i) Global lighting business In 2018, worldwide sales of passenger cars and light commercial vehicles decreased for the first time since 2009, as carmakers sold 0.5% fewer
vehicles, according to JATO Dynamics figures, based on their data of 54 top markets.
Passenger car and pick-up sales were down 0.6% to 81.8 million and LCV sales were up 2.5% to 4.2 million vehicles. Of the major markets, double digit growth was recorded by Thailand (+20%), Brazil (+14%) and Russia (+13%), while sales declined by double digits in Turkey (-35%) and Argentina (-10%) as these two countries battled economic downturns. But small declines in Europe, United States, and most significantly China had a great impact on global car sales. India, on the other hand, set a fourth consecutive annual sales record and finally surpassed Germany to become the world’s fourth largest car market. The fastest growing segment worldwide was that of EVs, which increased by more than 73% to over 1.2 million sales.
Regarding future trends, Yole expects global PC and LCV sales to reach 99 million units in 2021 at a CAGR2016-2021 of 2.0%. Yole notes that growth will be driven by emerging markets where GDP growth per capita will enable more households to purchase their first car.
Factors which will revolutionize the automotive industry in the upcoming years are:
• Electrification,• Stricter emission regulations,• Autonomous driving• Shared mobility
Review and outlook on the global automotive exterior lighting market
The increasing demand for superior systems that enhance users’ driving experience and convenience is propelling the growth of the global automotive exterior lighting system market. The increasing initiatives by government agencies to promote road safety campaigns is leading to innovations and the introduction of advanced automotive lighting systems in the market. The development and adoption of ADAS technology will augment the demand for laser headlamps and OLED lights in the global market.
The introduction of electric and hybrid vehicles and the establishment of safety and emission regulations will create lucrative opportunities for key players operating the global market. Innovations in the electrification of engine mechanism and propulsion technologies will drive the global automotive exterior lighting system market
Annual Report 2018-19 35
Management Discussion and Analysis
The geographical segment in the global automotive exterior lighting system market is divided into APAC, Europe, North America, Latin America, and MEA. APAC occupied the largest market share in 2017. The increasing production across China, Japan, India, and South Korea will boost the development of the APAC region in the global market. The growing sales of SUVs in China and other countries in APAC will increase the performance of the automotive market in this region. The presence of large manufacturers such as Toyota, Honda, Suzuki, and Nissan will contribute to the revenues in the global automotive exterior lighting system market.
The beginning of the favourable economic environment, availability of financing options, and established presence of global OEMs will contribute to increased sales and help companies in APAC to gain a larger market share. The digital revolutions and supportive trade reforms will increase revenues in the APAC market.
ii) India business
Indian Two-Wheeler Sector
According to CRISIL Research, India is one of the largest two-wheeler manufacturer in the world. Two-wheeler sales in the domestic market in the 2018-19 financial year saw a 4.7% increase in volumes. According to SIAM, the domestic two-wheeler
sales stood at 2,11,81,390 units in FY2018-19, as against 2,02,00,117 units sold in 2017-18. However, this growth numbers were lesser than estimated, especially after registering double digit growth for the past year post a five-year hiatus. Factors including a weak customer sentiment, increase in fuel prices and overall increase in insurance for vehicles contributed to slow buying period, especially in the second half of the financial year.
Domestic sales for scooters during FY2018-19 stood at 67,01,469 units, dropping by 0.27% over 67,19,909 units sold in 2017-18. Motorcycle sales, on the other hand, continued to bring in the larger chunk of volumes as sales increased by 7.8% to 1,35,99,678 units in 2018-19, as against 1,26,20,690 units sold during the previous fiscal. Moped sales also increased by 2.41 per cent to 8,80,243 units from 8,59,518 units in 2017-18.
Two-wheeler exports witnessed a strong growth for the 2018-19 fiscal with 32,80,841 units shipped, a growth of 16.6% over the 28,15,303 units sold in FY2017-18. Scooter exports grew by 26.74 per cent with 3,98,316 units shipped while motorcycle exports increased at a relatively lesser pace by 15.4% with 28,65,851 units.
The biggest challenge for the industry would be to make the transition to the new norms related to safety and emission over the next 12 months. New regulation like ABS to the 100 and 125 CC vehicles would increase price to end users effective April 2020. BS VI implementation is also expected to result an increase in price of the vehicles and hence impact demand in the near term.
Indian Three-Wheeler Sector:
India is one of the largest exporters of three-wheelers, and major players are continuously expanding their distribution reach in other countries to boost exports growth. Exporting countries include emerging markets like Africa, South East Asia and Latin America.
Issuance of fresh permits, availability of funding, replacement demand, favorable CNG economics and demand from cab aggregators for three wheelers are driving the domestic growth for the three wheelers.
The three-wheeler segment has reported a robust 24% growth in overall production volume (sales) in the financial year 2019, producing 12.68 lakh units vis-à-vis 10.22 lakh units in FY 18
While the domestic sales during the fiscal under review saw a 10% growth to 701,011 units as compared to 635,698 units in FY18, exports supported domestic sales heavily with 49% growth to 567,689 units in FY19, against 381,002 in the year-ago period. SIAM attributes this growth possibly to enormous demand for the Indian three-wheelers in Asian and African regions.
According to CARE Ratings, carmakers are also setting up units for manufacturing electric vehicles and many launches, both in two- and three-wheelers categories, are planned in the coming months during FY20.
We at Varroc have developed products to cater to these changing emission norms and expect to benefit from the trend. We have already secured orders for products like Electronic Fuel Injection (EFI) and Catalytic Convertor (Cat Con) to meet the BS VI emission norms.
Apart from these products, Varroc is well positioned to capture the growth emanating from trends like Electrical Vehicle penetration. We have successfully developed prototypes for products like traction motor for EVs. This is being highlighted in detail in the outlook and opportunity section below.
(Source: SIAM, CRISIL Research, CARE).
OUTLOOK AND OPPORTUNITY
The increases the lighting value and lighting content per car as a result of technological improvement and upgradation presents a big opportunity for our lighting business. Going forward we will continue to focus on high growth markets and customers where we can increase customer revenue and on improving operational efficiency across our businesses. We will continue to invest in our R&D, design, engineering and software capabilities in order to capitalize on future trends.
The Indian two and three-wheeler industry is expected to grow at a promising rate in the medium term supported by a buoyant economy with rising rural income. In addition, there are significant opportunities created by the future safety and emission norms for our Electrical and Lighting divisions. All of these factors are likely to support our growth going forward.
36 Varroc Engineering Limited
Our Strategies
Focus on high growth markets for our Global Lighting Business
The global exterior automotive lighting market is expected to grow at a CAGR of 4.3% between 2016 and 2021 (Source: Yole). Such growth is driven by the trend towards autonomous driving and connectivity between cars, with lighting becoming an increasingly prominent design and aesthetic feature, as well as playing a critical role in safety requirements and lighting technologies playing a greater role in energy efficiency and design flexibility. As such, we are looking to expand our market share in the global exterior automotive lighting market, including projection systems, signalling functions and electronics.
We have expanded our customer base to include new OEMs such as the VW Group, Renault-Nissan-Mitsubishi, TVS Motors and Volvo Truck. With our cost efficient and global manufacturing footprint, we are well-positioned to continue to serve our customers' needs across different car models and geographies.
Focus on increasing customer revenue for our India Business
The primary demand drivers for the Indian domestic two-wheeler industry are improving affordability and lower cost of ownership, whilst the key growth drivers for two-wheeler industry exports are rising crude oil prices and a focus on other markets. Given the high exposure of two-wheelers in rural areas, they depend, in turn, on trends in rural incomes and infrastructure
In addition to benefiting from the overall growth in the Indian two-wheeler and three-wheeler markets, we also intend to increase our revenue with our existing customers by expanding the array of our existing products that we supply to them and by continuing to develop technology solutions aligned with their needs. Our pan-India manufacturing footprint provides us with the ability to be close to our customers across key automotive manufacturing hubs in India, and we seek to foster customer loyalty by being closely attuned to each of their needs.
In particular, our growing business with Hero and Honda, India's two largest two-wheeler OEMs, provides us with significant opportunities to capitalize on the growing market for scooters and motorcycles in India. In addition, we have added TVS as a customer during the year, which should provide additional avenues to increase our scale in India.
We also have grown revenue in the passenger vehicle and commercial vehicle segments in India for both our lighting and polymer businesses. Since 2012, we have seen a growth in revenue from our business relationships with Mahindra, Volvo Truck, VECV and Renault-Nissan-Mitsubishi. We have also won orders from customers like VW in the previous year.
Continue to invest in our R&D, design, engineering and software capabilities in order to capitalize on future trends
We plan to continue expanding our R&D, engineering and software development capabilities in order to capture future growth trends. We seek to expand our capabilities in a cost efficient manner, by focusing on low-cost geographies nearby major automotive markets, in order to expand our capabilities in a cost-efficient manner. For example, in India we established a R&D facility specifically catering to VLS, which provides support to our core R&D facility in the Czech Republic. Moreover, we established a new R&D facility in Poland which started operations in 2018.
Pursue strategic joint ventures and inorganic growth opportunities
We intend to actively pursue acquisitive opportunities and strategic alliances with targets that are complementary to our business. We are mainly focused on growing existing product lines, such as automotive lighting and electronics for the global exterior automotive lighting market, in key markets including North America. While we will continue to focus on the polymer, electrical and metallic businesses within India, we will also continue to be disciplined in evaluating complementary businesses in India to increase our focus on other segments if necessary. In particular, we will seek to make acquisitions that provide us with access to new technologies, or new customers, or new geographies.
Focus on operational efficiency
We also focus on operational efficiency in order to improve returns in a rapidly changing technological environment. Within each production facility in India and internationally, we have sought to improve efficiencies, streamline our capacity and asset utilisation and manage our capital expenditure. We have implemented various initiatives to lower costs, improve man & equipment productivity and improve customer delivery. Few such examples are: purchasing raw materials in bulk to take advantage of promotions and economies of scale, shop automation to improve output and quality, Industry 4.0 implementation for faster response with accurate data, Implementation of Lean tools and practices.
We apply a lean manufacturing standard in the Global Lighting Business, which we refer to as the Varroc Excellence System ("VES"). VES is structured to boost industrial efficiencies and increase profits and operating cash flows by reducing costs and eliminating waste in excessive stocks, workforce and processes. Through the VES, VLS aims to achieve operational excellence by meeting our key goals of "Superior Quality", "Lowest Cost", "Timely Delivery" and "Highest Motivation", which we pursue through the three pillars of flow management, people development and quality enhancement. By focusing on these elements, we seek to achieve: (i) zero defects, by implementing scheduled maintenance and monitoring in order to detect and remove the causes of such defects; (ii) zero waste, by reviewing manufacturing methods to manage and minimize excess produce; (iii) zero lead time, by managing product processes and delivery times; and (iv) zero accidents, by focusing on training and safety.
VLS's global industrialisation team is directly responsible for the global result of the VES strategy and agrees targets and goals with the Board of Directors of VLS for each fiscal year. Plant managers are responsible for aligning their respective facilities to the global vision across daily Key Performance Indicators ("KPIs"), which are standardized across the Global Lighting Business.
For our India Business, we have implemented total preventive maintenance ("TPM") in order to help ensure high quality, low costs and on-time delivery for our customers. This program has now been rolled into Varroc Manufacturing Excellence System (MES). This new program exerts more
Management Discussion and Analysis

Annual Report 2018-19 37
Management Discussion and Analysis
rigor on improving the efficiency of production and support functions by identifying and eliminating losses. For example, on the shop floor, we conduct activities to eliminate major losses that affect equipment and achieve higher OEE, production per hour, production per headcount and lower costs. We have also received TPM Awards for our 12 plants from our largest customer, Bajaj, during 2008-2014. The practices which we have put in place at our manufacturing plants, Business Units and at group level are, among others, (i) the development of the periodic TPM audit system in 2011 to ensure the effective implementation and improvement of the TPM system, (ii) the development of TPM knowledge through the preparation of a methodology manual and (iii) the TPM pillars awareness book in 2014. Each Business Unit Head and Business Unit management team is directly responsible for business results and, together with the Board of Directors, define the goals for each fiscal year. Each Plant Head is responsible for aligning the respective facilities to the group's vision, mission, business plans, KPIs and project themes, which are standardized across the units and plants of our India Business.
OPERATIONAL REVIEW
Financial Review
Analysis of profit and loss account and balance sheet including the key ratios based on consolidated results is mentioned is as follows:
Profit and loss account
Revenue from operations Our consolidated revenue from operations increased by 16.0% to `120,364.6 million in FY2019 from `103,784.6 million in FY2018, primarily as a
result of an increase in sales across all businesses.
Other Income Other income increased to `907.9 million in FY2019 from `386.1 million in FY2018. The other income increased as a result of benefit of change in
surrender value of keyman insurance policy, increase in government grants and increase in miscellaneous income as compared to FY2018.
Expenses Raw Materials Costs Raw materials costs increased by 18.2% to `75,457.9 million in FY2019 from `63,826.9 million in FY2018, which was mostly in line with the
increase in our revenue.
Excise Duty Excise duty of ̀ 996.3 million in FY2018 was not applicable in FY2019 on account of the introduction of the Goods and Service Tax, which took effect
from July 1, 2017.
Employee Benefits Expense Employee benefits expense increased by 14.3% to `15,014.9 million in FY2019 from `13,135.2 million in FY2018, primarily due to increase in
volume of operations and the impact of annual salary increments.
Operating Profit and Margin (%) The operating profit as measured by EBITDA for the year increased to `11,539.3 million in FY2019 from `9,179.0 million in FY2018, i.e. as increase
of 25.7%, positively impacted by implementation of Ind AS 115 and strong improvement in profitability of India business.
Depreciation and Amortisation Expense Depreciation and amortisation expense increased by 46.4% to ` 5,656.4 million in FY2019 from `3,864.7 million in FY2018, primarily as a result
of implementation of Ind AS 115 Accounting Standard in our VLS business and incremental depreciation on capital expenditure incurred in last two years across our manufacturing facilities located in our VLS business and in India.
Finance cost Finance costs increased by 12.4% to `968.5 million in FY2019 from `861.7 million in FY2018, primarily as a result of increased finance costs
attributable to capital expenditures and increased working capital in our VLS business.
Interest Coverage Ratio for FY2019 was at 6.7x as against 6.9x in FY2018. The ratio declined as interest expenses increased during the year.
Other Expenses Other expenses increased by 11.7% to `19,002.7 million in FY2019 from `17,018.0 million in FY2018, which was less than our increased sales of
+16.0%. This was achieved as a result of operational cost efficiencies in the second half of FY2019 in our VLS business and in our India business.
Tax Expense Total tax expenses increased by 52.0% to `988.9 million in FY2019 from `650.6 million in FY2018. Our total tax expenses increased mainly on
account of an increase in profit before tax and lower tax benefit in our VLS business as compared to FY2018.
Profit for the Year Primarily for the reasons stated above, our profit for the year was at ̀ 4,497.8 million in FY2019 as compared to `4507.8 million in FY2018. The profit was at
almost similar level to FY2018 in a challenging situation across our global operations throughout the year and in the fourth quarter in our Indian operations. Net Profit Margin (%) for the year was at 3.7% as compared to 4.3% in the previous year. The margin was negatively impacted by higher depreciation
and amortisation expenses and higher taxes.
38 Varroc Engineering Limited
Balance Sheet Net worth Net worth increased to `31,112.3 million in FY2019 from `28,487.7 million in FY2018.
Return on Net Worth Return on Net Worth declined to 15.1% as compared to 18% in the previous year mainly due to increase in net borrowings over FY2018. Net asset per value The net asset value per share has increased to `230.8 per share at the end of FY2019 from `209.8 per share at the end of FY2018 (including the
impact of additional shares)
Gross Borrowings Gross borrowings increased to `24,393.0 millions from `11,990.2 million at the end of FY2018. The debt increased as a result of increase in
working capital and higher capital expenditure to meet future growth requirements at our VLS business and acquisition in Turkey for `3,453 million.
Debt-to-equity ratio Net debt to equity ratio for the company is at 0.7x as at the end of FY2019. The ratio increased from 0.3x in FY2018. The ratio increased as
borrowings increased due to increase in working capital, higher capital expenditure during the year and acquisition of Sa-Ba business in Turkey.
Debtors Turnover Debtors turnover ratio measured in the number of days sales outstanding for the company for the years decreased to 41 days as at the end of FY2019
from 50 days as at the end of FY2018. Debtors considered for calucating this ratio are year end.
Inventory Turnover Inventory turnover ratio measured in the number of days sales outstanding for the company for the years decreased to 28 days as at the end of
FY2019 from days from 31 days as at the end of FY2018. Inventory considered for calculating this ratio are year end
Current Ratio Current ratio for the company is at 0.7x as at the end of FY2019 as against 1.0x as at the end of FY2018 due to increase in current liabilities as short-
term borrowings and current maturities were substantially higher than those in FY2018.
RISK MANAGEMENT The current economic environment, in combination with significant growth ambitions of the Company, carried with it an evolving set of risks. It counters the impact of unfavourable internal and external events and attempts to ensure business continuity across different stages of the economic cycle. The Company’s risk management processes ensure that the Company accepts risks as per the boundary conditions based on its risk appetite. The Company is primarily engaged in the business of manufacturing auto components relating to automobiles sector which is a cyclical industry where global liquidity, government policies, government spending, competition and corporate sentiments have a huge bearing on the industry’s prospects, and the long-term success of the Company depends mainly on the existence of a robust risk identification and mitigation process. The Company recognises that these risks need to be managed to protect its customers, employees, shareholders and stakeholders, to achieve its business objectives and enable sustainable growth. Our risk management framework reduces the volatility due to unfavorable internal and external events, facilitates risk assessment and mitigation procedures, lays down reporting procedures and enables timely reviews by the management. The Audit Committee of the Board oversees implementation and effectiveness of the risk management processes. Business level risks and their mitigation plans for each business unit are reviewed periodically by the risk management committee. This section provides an overview of the key risks and control framework and its approach to risk management.
The following section discusses some of these risks :
Risk type Description and mitigation
Pricing pressure from customers
Pricing pressure from customers may adversely affect our gross margin, profitability and ability to increase our prices, which in turn may materially adversely affect our business, results of operations and financial condition. Our customers generally negotiate for larger discounts in price as the volume of their orders increase. In addition, substantially all our products are customised to specific customer requirements, which requires us to incur significant costs in setting up our capabilities to manufacture these products.
We believe that we have high pricing power given the following factors: a concentrated market with few number of players, low lighting cost (as a percentage of car cost) and the importance of technology and design which prevents entry of new players. Additionally, we are continuously working towards achieving sufficient production cost savings to offset price reductions by the customers. These reductions are through improved operating efficiencies, new manufacturing processes, sourcing alternatives and other cost reduction initiatives etc.
Management Discussion and Analysis

Annual Report 2018-19 39
Risk type Description and mitigation
Market Risk Market risk is the risk of loss related to adverse changes in market prices, including commodity risk and interest rate risk. We are exposed to interest rate risk, commodity risk, foreign exchange risk and inflation risk in the normal course of our business.
We follow established risk management policies to mitigate these risks.
We are exposed to risks in respect of price and availability of certain commodities that we use in the process of manufacturing our products. This risk is mitigated to some extend as we primarily purchase raw materials back-to-back and in line with the terms and prices that are agreed with our customers for our India business. For our international business, we typically agree a fixed per-unit price for raw materials for each purchase order, and thus bear the raw material price risk for such purchase order.
Interest rate risk is the risk that the fair value or future cash flows of a financial instrument will fluctuate because of changes in market interest rates. Our exposure to the risk of changes in market interest rates relates primarily to the fluctuation of the prevailing market interest rates relating to our long-term debt obligations with floating rates. We continuously monitor our borrowing levels and the cost of funding these loans. We have also been able to lower our borrowing costs for a variety of reasons, including, in particular, the improvement of our credit rating in India as our financial strength has improved, which has allowed us to access cheaper sources of credit, commercial paper in particular. Additionally, decreasing interest rates have allowed us to refinance loans as they come due with cheaper sources of funding.
Changes in currency exchange rates influence our results of operations. We have designated certain derivative instruments as cash flow hedges to mitigate the foreign exchange exposure of forecasted highly probable cash flows. For our Indian operations, we enter into forward contracts, in order to cover our foreign currency exposure, especially in the case of exports.
Credit Risk Credit risk is the risk that a counterparty will not meet its obligations under a financial instrument or customer contract, leading to a financial loss. We are exposed to credit risk from our operating activities, primarily from trade receivables. We typically have credit terms of 45 to 60 days with customers of our Global Lighting Business and of 15 to 60 days with customers of our India Business, save that our exports from India typically give customers 90 to 170 days credit terms. Most of our largest customers have high credit ratings, which helps to mitigate credit risk.
Customer credit risk is also managed by the group's established policies, procedures and control relating to customer credit risk management. Further, our customers include marquee OEMs and tier one companies, which have long standing relationship with us. Outstanding customer receivables are regularly monitored and reconciled.
Loss of major customers
Our business is dependent on certain major customers, with whom we do not have firm commitment agreements. Significant reduction in purchases by any of our major customers, or a lack of commercial success of a particular vehicle model or lack of commercial success of such model, of which we are a significant supplier could adversely affect our business, results of operations and financial condition.
At Varroc, we strive to meet our customer requirements with our QCD program. We always strive to remain competitive through our R&D efforts and with respect to technology, design and quality. In addition, our success in expanding our business also depend on significant investments in our R&D capabilities, in order to support our growth and business strategy. We have been continuously investing in our R&D capabilities.
Safety Risk/ Cyber Risk
The Company is committed to conduct all its activities in such a manner so as to avoid harm to employees and the community.
At Varroc, the use of information and telecommunication technologies are increasing, resulting in greater security threats to its digital infrastructure. These impacts may include the loss of sensitive data or information, legal and regulatory breaches and reputational damage.
The Company continues to strengthen its cyber security policies, standards, technical safeguard, ongoing monitoring of new and existing threats and IT security awareness initiatives which include IT disaster recovery, emergency response and business continuity management capabilities to enable reduction of impact of any cyber-security event.
Regulatory Compliance Risk
The Company recognises that timely compliance with the ongoing frequently changing regulatory requirements can at times be challenging, and therefore will:
• Strive to understand the changing regulatory standards, so as to strengthen its decision-making processes and integrate these in the business strategy of each of the segments in which it operates
• Drive business performance through the convergence of risk, compliance processes and control mechanisms to ensure continued operational efficiency and effectiveness
Political Risk Social / Civil unrest, act of terrorism within India or internationally can have an impact on the Company’s operations. Political and civil unrest and tensions globally may have an impact on the safe and timely execution of projects, which may have financial implications.
We review the our risk management practices and activities on a quarterly basis. This included a review of risks to the achievement of key business objectives covering growth, profitability, talent aspects, operational excellence and actions taken to address these risks.
INTERNAL CONTROLS
The Company has an adequate system of internal controls implemented by the management towards achieving efficiency in operation, optimum utilisation of the Company’s resources and effective monitoring thereof and compliance with applicable laws and regulations.
Controls deployed are appropriately designed to manage the key business risks and is operating effectively. Audit plans, internal auditor’s observations and recommendations, significant risk areas assessments and adequacy of internal controls are also periodically reviewed by the Audit Committee. The Company has an ERP system - SAP, to have better internal control systems and flow of information. Further, the Company adheres to rules and regulations of ISO.
Management Discussion and Analysis

40 Varroc Engineering Limited
The Company’s internal audit department conducts regular audits to ensure adequacy of internal control systems, adherence to management instructions and compliance with laws and regulations of the country, as well as to suggest improvements. The Internal Audit Function provides assurance to the Board and Senior Management in the various Businesses and Functions that the system of internal
ENVIRONMENT, HEALTH AND SAFETY
Health, employee safety and the environment is among our top priorities and is seen as both a right and a responsibility for all our employees. We take initiatives to reduce the risk of accidents and prevent environmental pollution through implementing a five-pronged environment, occupational health and safety ("EOHS") plan which is based on the requirements of ISO 14001 on OHSAS 18000. First, we seek to eliminate exposure to serious accidents by identifying hazards and reducing the total number of accidents. Second, we work towards preserving our industrial assets by achieving compliance with all applicable legal norms. Third, through a systematic approach towards training and development, we hope to enhance our managers' skills such that these concerns will be efficiently managed. Fourth, we remain conscious of the impact our industrial activities have on our environment, and actively monitor and minimize the environmental impact of our operations. Fifth, we seek to prevent occupational disease and maintain employee health and safety by maintaining industrial hygiene at work places. We also maintain public liability act insurance for some of our plants and also have a commercial general liability policy for all our locations in India. The EOHS plan is implemented on a group level and we are committed to measuring, evaluating and continually improving our EOHS performance by establishing goals and objectives through regular periodic management reviews and guidance. EOHS performance is reviewed periodically in order to monitor the EOHS performance of our plants and EOHS strategies are developed to achieve our EOHS objectives, which include:
• reduce the dependability of conventional energy sources through the use of renewable energy sources;
• having all our plants in India certified for environmental management systems, in accordance with the requirements of ISO 14001 and OHSAS 18001;
• proactively enriching the EOHS culture within key parts of our organisation;
• having a strong focus on the sustainability of our EOHS system and compliance with the system;
• developing EOHS competency in our organisation;
• having a proactive focus on upcoming legal requirements and internal mechanism of audits; and
• driving sustainability through various initiatives.
Varroc’s EHS core values
To ensure compliance with occupational regulations and controlling occupational hazards that put risk to employees’ life, property and the environment by investing in safe and eco-friendly technologies.
Implementation of Varroc’s EHS Core Values through:
• Communication – Actively informing stakeholders about EHS guidelines
• Collaboration – Working as a team (CFT) to provide and implement EHS practices
• Commitment – Dedicated to promote a proactive EHS culture
EHS is an integrated part of our core values. Our goal is to be injury-free, while being eco-friendly. Our employees are expected to follow these values with team work and integrity. Employees who passionately improve the EHS plan have been duly rewarded. Health and employee safety We are committed to maintaining high standards of workplace health and safety and we regard the safeguarding of such interests as one of our
most fundamental responsibilities as an employer. We see safety as both a right and a responsibility for all employees and we aim to become a zero-accident organisation. Any mishaps or accidents at our facilities or any emission or leakage from our factory could lead to personal injury, property damage, production loss, adverse publicity and legal claims. It is therefore important that we maintain the Occupational Health and Safety certification in relation to our management of the safety of our people and property.
As of March 31, 2019, 17 of our plants in India have been certified for environmental management systems, in accordance with the requirements of ISO 14001 and OHSAS 18001.
Environment In addition to creating initiatives to improve workplace employee safety, we also implement initiatives to reduce the environmental impact of our operations.
As at March 31, 2019, we have obtained, or are in the process of renewing, all material environmental consents and licenses from the relevant governmental agencies that are necessary for us to carry on our business. Our activities are subject to environmental laws and regulations, which govern, among other things, air emissions, wastewater discharges, the handling, storage and disposal of hazardous substances and wastes, the remediation of contaminated sites and natural resource damages. We have an automated internal system to track laws applicable to us. For further details on approvals relating to our business and operations, please see "Government and Other Approvals" on page 559 of this Prospectus.
As part of our commitment to the environment, we have set up three wind power plants, totaling 12 windmills with an aggregate power generation capacity of 8.35 MW. These windmills are located at three different locations, with four windmills at Supa, Maharashtra with power generation capacity
Management Discussion and Analysis
Annual Report 2018-19 41
of 1 MW each, six windmills at Satara, Maharashtra with power generation capacity of 0.35 MW each and two windmills at Jaisalmer, Rajasthan with power generation capacities of 1 MW and 1.25 MW each. The power generated at Supa and Satara is consumed by our plants located at Waluj and Aurangabad and the power generated at Jaisalmer is sold to Rajasthan Vidyut Board as per the Power Purchase Agreement executed with the Rajasthan and Jodhpur Vidyut Nigam.
We have also set up a solar plant at Shiwaji Nagar Sakri Dist Dhule, which has a power generation capacity of 5 MW. The power generated by the solar plant is used by our forging plant in Aurangabad.
Further, we have setup solar panels at eight of our plants that have sufficient roof space for the installations, with total power generation capacity of 4.2 MW.
HUMAN RESOURCES
We have seen significant enhancement in employee engagement driven by a focused agenda, rewards and recognitions. Our policies and benefits continue to help us in attracting and retaining best resources.
As of March 31, 2019 we employed approximately 13,800 full-time employees across the globe (excluding those employed at our China JV).
As at March 31, 2019, many of our employees are members of labour unions. We have in the past entered into labour union agreements, for the mutual benefit of our employees and our business, as we recognise that employee satisfaction impacts upon productivity, quality of product, employee engagement and employee discipline. Such agreements have involved, inter alia, agreeing revised wage structures, ex-gratia payments, interest free loans, attendance bonuses and the provision of or enhancement of insurance policies as a quid pro quo for employee agreement to adhere to specified disciplinary rules, codes of conduct, rules on absenteeism, productivity and quality standards and other miscellaneous terms and conditions.
In addition to our full-time employees, we frequently hire workers on a contractual basis through registered contractors for some of our ancillary activities. Such activities include packing, material handling, housekeeping, cleaning, gardening, driving, security and canteen services.
CORPORATE SOCIAL RESPONSIBILITY
The Company has engaged in CSR activities for more than two decades and has contributed in the areas like healthcare, education, safe drinking water, food distribution, women empowerment. etc. We were always been at the forefront of voluntary CSR. Details regarding CSR initiatives taken by the Company during the year under review is available on page no. 52 of this report.
CAUTIONARY STATEMENT
This report comprises the facts and figures along with assumptions, strategy, goal and intentions of the Company which may be “forward-looking”. The Company’s actual results, performance may differ considerably from those presented herein. The Company’s performance is dependent upon global and national economic conditions, price of commodities, business risk, change of government’s rules and regulations, etc
Management Discussion and Analysis

42 Varroc Engineering Limited
Board’s Report
Dear Shareholders,
The Directors of your Company take pleasure in presenting the 31st Annual Report on the business and operations of the Company together with financial statements for the financial year ended on March 31, 2019.
1. Financial results & appropriations
a. Financial results
(`in Million)
ParticularsSTANDALONE CONSOLIDATED
Financial Year 2018-19
Financial Year 2017-18
Financial Year 2018-19
Financial Year 2017-18
Revenue from operations 25,731.53 20,954.75 1,20,364.65 1,03,784.57
Total Income 26,246.37 21,242.46 1,21,272.53 1,04,170.67
Profit before finance cost, depreciation, exceptional items and extraordinary expenses
3,205.94 2,469.21 11,796.97 9,194.41
Less: Depreciation and amortization 1,075.19 1,016.11 5,656.42 3,864.65
Less: Finance cost 392.01 401.50 968.45 861.70
Add: Share of Net Profit of Investment accounted for using the equity Method - - 314.54 690.27
PROFIT BEFORE TAX 1,738.74 1,051.60 5,486.64 5,158.33
Less: Current tax expense 381.92 232.97 1,444.66 1193.75
Less: Deferred tax 161.42 120.33 -455.81 -543.19
NET PROFIT FOR THE YEAR 1,195.40 698.30 4,497.79 4,507.77
Less: Profit attributable to Non-controlling interest - - 34.59 5.19
Profit attributable to owners of the Company 1,195.40 698.30 4,463.20 4,502.58
Add: Profit brought forward from last year 1,818.60 1,182.23 9,639.98 5,135.42
Less: Re-measurements of defined benefit plans, net of tax 11.81 -10.82 46.84 4.89
Less: Imapact of change in accounting policy - - 689.92 -
Less: Transfer to Debenture Redemption Reserve (DRR) - - - 125
Add: On Account of Capital Reduction - - - 205.95
Appropriation:
Dividend on Equity Shares 5.84 61.56 5.84 61.56
Tax on Dividend 1.19 11.19 2.55 12.52
Balance carried forward to Balance Sheet 2,995.16 1,818.60 13,358.03 9,639.98
b. Company’s Performance
Continuing the resilient revenue growth, on a consolidated basis, the revenue from operations for the Financial Year 2018-19 stood at `120,364.65 million as against `103,784.57 million in previous year representing a growth of 16% on a reported basis, driven equally by the Indian and Overseas business. On standalone basis, the gross revenue for the Financial Year 2018-19 stood at `25,731.53 million as against `20,954.75 million in previous year representing a growth of 23%.
The Net Profit, on a consolidated basis, for the Financial Year 2018-19 remained stagnant at `4,497.79 million as against `4507.77 million in previous year. On standalone basis, the Net Profit for the financial year 2018-19 stood at `1,195.40 million as against `698.30 million in previous year representing a growth of 71% mainly on account of improved performance.
c. Dividend and transfer to reserve
The Board has recommended a dividend of `4/- (Rupees Four only) (i.e. @ 400%) per equity share of `1/- each for the Financial Year 2018-19. The total cash outflow on account of payment of Dividend would be Rs.650.09 million including Dividend Distribution Tax of Rs.109.80 million. The said recommendation of Dividend is in compliance with Dividend Distribution Policy adopted by the Company.
The Board of Directors has considered it appropriate not to transfer any amount to the General Reserve before declaration of Dividend.
As per Regulation 43A of the Securities and Exchange Board of India (Listing Obligations and Disclosure Requirements) Regulations, 2015 (hereinafter referred to as ‘SEBI LODR Regulations’), your Company has formulated a Dividend Distribution Policy which is available on the website of the Company at weblink http://www.varrocgroup.com/corporate_governance under the tab Policies.

Annual Report 2018-19 43
d. Credit Rating
During the year under review, ICRA changed the outlook on the credit ratings for the Company’s long term borrowing to ‘AA-(Negative)’ from ‘ICRA AA-(Stable)’ and maintained ratings for short term borrowings at ‘ICRA A1+’.
e. Details of Internal Financial Controls with reference to the Financial Statements
The management guide the conduct of affairs of your Company and clearly delineates the roles, responsibilities and authorities at each level and key functionaries involved in the governance.
The management is commited to govern financial and accounting policies, systems and processes. Your Company’s Financial Statements are prepared on the basis of the Significant Accounting Policies that are carefully selected by the Management. These Accounting policies are reviewed and updated by the Management from time to time.
The internal audit function prepares annual audit plan with the aim of evaluation of the efficacy and adequacy of internal control system and compliance thereof, robustness of internal processes, policies and accounting procedures, compliance with laws and regulations. Based on the reports of internal audit function, process owners undertake corrective action in their respective areas. Significant audit observations and corrective actions thereon are presented to the Audit Committee.
The Company uses best IT system to record data for accounting, consolidation and management information purposes and connects to multiple locations for efficient exchange of information. The Audit Committee reviews reports submitted by internal auditors regularly and suggests the improvements for implementation by the Company.
The internal financial control with reference to the financial statements were adequate and operating effectively as endorsed by Statutory Auditors in their report.
f. Details in respect of frauds reported by Auditors
During the year under review, there have not been any instances of fraud and accordingly, the Statutory Auditors have not reported any frauds either to the Audit Committee or to the Board under Section 143(12) of the Companies Act, 2013 ("the Act").
2. Industry Outlook and Business Overview
Details on economic outlook, industrial outlook, business overview and SWOT analysis of the company is covered in the Management Discussion and Analysis report.
3. Financial Information and Disclosures
a. Report on Performance of Subsidiaries, Associates and Joint Venture Companies
Your Company has 23 subsidiaries including step-down subsidiaries and 5 joint ventures companies as on March 31, 2019. During the year, the Board of Directors ("the Board") reviewed the affairs of material subsidiaries. In accordance with Section 129(3) of the Act and SEBI LODR Regulations, the Consolidated Financial Statements of the Company including the financial details of the subsidiaries and associats forms part of the Annual Report. Further, the report on the performance and financial position of each of the subsidiary and joint venture companies and salient features of their financial statements are provided in the prescribed Form AOC-1 and it forms part of the Financial Statements of the Company.
Update on Varroc Lighting Systems entities
Consequent upon completion of 100% acquisition of shares and integration of management and operations under the overseas lighting business or for the statutory reasons, the name of the following entities were changed during the year under review:
Sr.No.
Old name of the Company New name
1 TRI.O.M., S.p.A., Italy Varroc Lighting Systems, Italy S.p.A.
2 Electromures SA, Romania Varroc Lighting Systems, Romania S.A.
3 TRI.O.M Vietnam Co., Ltd Varroc Lighting Systems, Vietnam CO. Ltd.
4 Sa-Ba Endüstriyel Urünler Imalat Ve Ticaret Anonim SirketiVarroc Lighting Systems Turkey Endüstriyel Urünler Imalat Ve Ticaret Anonim Sirketi
5 Sa-Ba Bulgaria EOOD Varroc Lighting Systems Bulgaria, EOOD
6Varroc do Brasil Comercio, Importacao e Exportacao de Maquinas, Equipamento e Pecas Ltd., Brazil
Varroc do Brasil Industria E Commercia LTDA
As reported in last Annual Report, VarrocCorp Holding BV, a WoS has acquired 100% stake in SA-BA Endüstriyel Ürünler imalat ve Ticaret Anonim Sirketi, (name changed to Varroc Lighting Systems Turkey Endüstriyel Urünler Imalat Ve Ticaret Anonim Sirketi) a Turkey based company engaged in the business of manufacturing and supply of automotive lighting for four wheelers along with its wholly owned subsidiary company in Bulgaria at an aggregate consideration of Euro 43 million in June 2018.
Board’s Report

44 Varroc Engineering Limited
During the year under review, Varroc Lighting Systems has formed small and two-wheeler lighting division under its umbrella. Aries Mentor Holding B.V., The Netherlands has acquired balance 20% stake in Varroc Lighting Systems, Italy S.p.A. (erstwhile TRI.O.M., S.p.A., Italy) as per the Option Agreement with its erstwhile promoters. With the acquisition of said stake, Varroc Lighting Systems, Italy S.p.A. has became wholly owned subsidiary of Aries Mentor Holding B.V., The Netherlands.
In September, 2018, Varroc Lighting Systems has signed a joint venture agreement with ELBA Electronics SRL, a privately-held lighting and electronics company based in Romania. By virtue of the said JV agreement, in the month of January, 2019, a new Joint Venture Company under the name and style of Varroc ELBA Electronics SRL, Romania was formed for manufacture of electronic components and sub-assemblies (modules). The manufacturing facility is being set up at Timisoara, Romania. VarrocCorp Holding B.V., The Netherlands a WoS is holding 70% stake in the said entity.
In January, 2019, Varroc do Brasil Industria E Commercia LTDA has started commercial production in Sorocaba, São Paulo, Brazil. The said plant is manufacturing automotive lighting products to cater to the requirements of north American customers.
In January, 2019, Varroc Lighting Systems, Bulgaria EOOD has started production facility in Dimitrovgrad, Bulgaria. This facility is initially producing a variety of small lighting products, including centre high-mounted stop lights, fog lamps, and turn indicators. It is part of Varroc Lighting's newly formed small and two-wheeler lighting division, which leverages the global Varroc network to bring state-of-the-art mass-market lighting technology into lower-volume vehicle market segments through right-sized processes and dedicated lower-volume facilities. The Dimitrovgrad facility increases Varroc Lighting's presence in Europe, joining the existing European facilities in the Czech Republic, Italy, Romania and Turkey.
Varroc Lighting Systems SA, Morocco has completed the construction of first phase of the facility and started commercial production in February, 2019. It is a green field manufacturing facility located in Tangier, Morocco. The said facility produces headlamps, rear lamps, and daytime running lamps for the customers located in Morocco, Spain and France.
In March, 2019, Varroc Lighting Systems S.p.Z.o.o., Poland opened a new research and development office in Krakow, Poland and has planned to tap the best engineering resources in cooperation with AGH University of Science and Technology and Krakow University of Technology. The said Company has also started construction of a new manufacturing plant in Niemce, Poland which is planned to be completed by third quarter of 2019.
Update on Indian entities/plants
As reported last year, the Company has partnered with Dell'Orto S.p.A., Italy for equal co-ownership of IP rights of Electronic Control Unit (ECU) to be used in electronic fuel injection system and signed a Joint Venture Agreement for setting up 50:50 joint venture company for manufacturing and sale of electronic fuel injection system mainly for two wheelers in India. By virtue of the said JV agreement, a private limited company under the name and style of Varroc Dell'Orto Private Limited was incorporated on January 10, 2019.
Further, the Company has commenced commercial production at Halol, Dist.: Panchmahal, Gujarat State in January, 2019. The said plant is catering the requirements of two-wheeler OEM Hero MotoCorp Ltd. The said plant is at present producing electrical items for two wheelers viz.; Blinkers, head lamps and tail lamps.
The Company has partnered with Heraeus, a globally leading technology group founded in 1851 and headquartered in Hanau, Germany for development of cutting-edge and cost-effective solutions for catalytic converters in automotive applications which will be compliant with the stringent emission norms of BS-6, EURO-V as well as an future emission norms. This would enable the Comapny to provide innovative emission solutions to automotive OEMs to help them remain competitive while complying with the aforesaid emission norms.
In March, 2019, the Company through its wholly owned subsidiary Varroc Polymers Pvt. Ltd. has acquired additional 5% stake in Bangalore based Company Team Concepts Pvt. Ltd. As on March 31, 2019, Varroc Polymers Pvt. Ltd. is currently holding 95% of the paid-up share capital of Team Concepts Pvt. Ltd.
The Company’s wholly owned subsidiary Varroc Polymers Pvt. Ltd. has decided to merge the operations of Pathredi Plant into Binola Plant as
both plants are catering to the requirement of customer Hero Motorcycle & Scooters India Pvt. Ltd. This will enable the Company to optimise the existing resources and reduce costs.
In accordance with Section 136 of the Companies Act, 2013, the audited financial statements, including the consolidated financial statements, financial statements of Subsidiary Companies and related information of the Company will be available on Company’s website at web link http://www.varrocgroup.com/financial_results. These documents will also be available for inspection during business hours at the registered office of the Company. A Copy of these financial statements shall be made available to any Member of the Company, on request.
The changes in subsidiaries, joint ventures or associate companies during the year under review are as follows:
Companies which have become Subsidiaries: Varroc ELBA Electronics, SRL, Romania (70:30 JV Company) Companies which have ceased to be Subsidiaries of the Company: Nil Companies which have become a Joint Venture of the company: Varroc Dell'Orto Pvt. Ltd. Companies which have ceased to be a Joint Venture of the company: Nil Entities which have ceased to be an Associate of the Company: Nil Entities which have become an Associate of the Company: Nil
Details of subsidiaries and joint ventures of the Company and their performance are covered in Management Discussion and Analysis Report forming part of this Annual Report.
b. Share Capital
During the year under review, the following corporate actions were executed resulting in change in the paid-up share capital of the Company.
Board’s Report
Annual Report 2018-19 45
Board’s Report
(i) Conversion of Preference Shares
As per the terms of issue of Series C 0.0001% Compulsorily Convertible Preference Shares, 11,683,770 shares of `1 each were converted into 11,683,770 equity shares of `1 each and allotted to Mr. Tarang Jain on May 31, 2018.
(ii) Initial Public Offering
As reported in the last Annual Report, during the year under review, the Company came out with its maiden Initial Public Offer (“IPO”) by way of Offer for Sale (“OFS”) under which 20,221,730 equity shares of `1 were offered to the public for subscription by Promoter, Mr. Tarang Jain (1,752,560 equity shares) and private equity investor Omega TC holdings Pte. Ltd. (16,917,130 equity shares) and Tata Capital Financial Services Limited (1,552,040 equity shares) at a price band of ̀ 965 to ̀ 967. The IPO of the Company was subscribed 3.6 times and the equity shares of the Company were listed on National Stock Exchange of India Limited and BSE Limited on July 6, 2018. As on March 31, 2019, 15% of the shareholding is held by public and balance 85% is held by the Promoter and Promoter group.
c. Utilisation of IPO Proceeds
The Company’s IPO was by way of an Offer for Sale by existing shareholders and the proceeds were paid to the offering shareholders.
d. Fixed Deposits
During the year under review, the Company has not accepted any deposits from the public. e. Disclosures under Section 134(3)(1) of the Act – Material Changes and Commitment
There has been no material change and commitment affecting the financial position of the Company which occurred between the end of the financial year to which these financial statements relate and on the date of this report.
f. Disclosure regarding significant and material orders passed by regulators or Courts or Tribunal
During the year under review, there were no significant and material orders passed by the regulators or courts or tribunals impacting the going concern status and Company’s operations in future.
g. Particulars of contracts or arrangements made with Related Parties
All related party transactions that were entered into during the financial year were on arm’s length basis and in the ordinary course of the business. There are no materially significant related party transactions made by the Company with Promoters, Key Managerial Personnel or other designated persons which may have potential conflict with interest of the Company at large.
h. Particulars of Loans, Guarantees or Investments
Particulars of loans, guarantees, investments and securities provided during the financial year under review along with the purposes of such loans, guarantees and securities is given in notes to the Financial Statements.
i. Disclosure under Section 43(a)(ii) of the Act
The Company has not issued any shares with differential rights and hence no information as per provisions of Section 43(a)(ii) of the Act read with Rule 4(4) of the Companies (Share Capital and Debenture) Rules, 2014 is required to be furnished.
j. Disclosure under Section 54(1)(d) of the Act
The Company has not issued any sweat equity shares during the year under review and hence no information as per provisions of Section 54(1)(d) of the Act read with Rule 8(13) of the Companies (Share Capital and Debenture) Rules, 2014 is required to be furnished.
k. Disclosure under Section 62(1}(b) of the Act
The Company has not issued any equity shares under Employees Stock Option Scheme during the year under review and hence, no information as per provisions of Section 62(1)(b) of the Act read with Rule 12(9) of the Companies (Share Capital and Debenture) Rules, 2014 is required to be furnished.
l. Disclosure under Section 67(3) of the Act
During the year under review, there were no instances of non-exercising of voting rights in respect of shares purchased directly by employees under a scheme pursuant to Section 67(3) of the Act read with Rule 16(4) of Companies (Share Capital and Debentures) Rules, 2014.
4. Disclosures related to Board, Committees, Remuneration and Policies
a. Directors and Key Managerial Personnel
Mr. Padmanabh Sinha (DIN 00101379), Investor Nominee Director has resigned w.e.f. May 28, 2018. The Board places on record its sincere appreciation for the services rendered and guidance provided to the management of the Company during his tenure.

46 Varroc Engineering Limited
Board’s Report
Mr. Arjun Jain (DIN 07228175) was appointed as Additional Director/Whole-time Director of the Company by the Board on August 07, 2018 and his terms of appointment, including remuneration, was subsequently approved by special resolution passed at the Annual general meeting of the Company held on September 05, 2018.
Directors liable to retirement by rotation The Independent Directors hold office for a fixed period of three years from the date of their appointment and are not liable to retire by rotation. Out
of the remaining Non-Executive/ Non-Independent Directors, in accordance with the provisions of the Companies Act and the Articles of Association of the Company, Mr. Naresh Chandra (DIN: 00027696) being longest in office retire by rotation and being eligible, offer his candidature for re-appointment as Director.
b. Declaration by Independent Directors and Board's Opinion on Independence
The Company has received declarations from all its Independent Directors, confirming that they meet the criteria of independence as prescribed under Section 149(6) of the Companies Act, 2013 and Regulation 16(1)(b) of the Securities and Exchange Board of India (Listing Obligations and Disclosure Requirements) Regulations, 2015.
In the opinion of the Board, Independent Directors, fulfil the conditions specified in the SEBI LODR Regulations and are independent of the Management.
c. Information on Board Meeting procedure and attendance during the Financial Year 2018-19
During the year, eight Board Meetings were convened and held. Details of number of committee(s) and board meeting(s) held during the year along with attendance record of each director has been disclosed in the Corporate Governance Report which forms part of the Annual Report.
The Board meetings of the Company are conducted as per the provisions of the Companies Act,2013 and applicable Secretarial Standards. Information as mentioned in the Act and all other material information, as may be decided by the management, are placed for consideration of the Board thereof. The details on the matters to be discussed along with relevant supporting documents, data and other information are also furnished with the detailed agenda to the Board, to enable directors to take informed decisions and and give directions to the management.
d. Director’s Remuneration Policy and Criteria for Matters under Section 178 of the Act and Payment of Commission
As stipulated under Section 178 of the Act, the Board has approved a Nomination and Remuneration Policy of the Company.
The Policy documents the mechanism for appointment, cessation, evaluation and remuneration of the Directors, Key Managerial Personnel and Senior Management of the Company. Information on the Policy and details of the criteria for determining qualifications, positive attributes and other matters in terms of Section 178 of the Act are provided in the Corporate Governance Report.
The Company has not paid any commission to Managerial Personnel during the financial year under review. The aggregate profit related commission of `10.15 million payable to the non-executive directors for the Financial Year 2018-19 (which is within 1% of profit approved by the shareholders) will be paid during FY 2019-20 and the details of the same are provided in Corporate Governance Report.
e. Formal annual evaluation of the performance of the Board, its Committees and Directors
Formal evaluation of performance of the board and its committees and directors is undertaken annually.
The Company has implemented a system of evaluating performance of the Board and of its Committees and Directors on the basis of a structured questionnaire which comprises evaluation criteria taking into consideration various performance related aspects. The said structured questionnaire was prepared after taking into consideration, inputs received from the Directors, covering various aspects of the Board’s functioning such as adequacy of the composition of the Board and its Committees, Board culture, execution and performance of specific duties, obligations and governance.
The Board of Directors has expressed their satisfaction with the evaluation process. f. Directors’ Responsibility Statement
Pursuant to Section 134(5) of the Act, the Directors, based on the representation received from the management, confirm that:
(i) in the preparation of the annual accounts for the year ended March 31, 2019, the applicable accounting standards have been followed along with proper explanation relating to material departures;
(ii) the directors have selected such accounting policies and applied them consistently and made judgments and estimates that are reasonable and prudent so as to give a true and fair view of the state of affairs of the Company at the end of the Financial Year 2018-19 and of the profit of the Company for that period;
(iii) the directors have taken proper and sufficient care for the maintenance of adequate accounting records in accordance with the provisions of this Act for safeguarding the assets of the Company and for preventing and detecting fraud and other irregularities;
(iv) the directors have prepared the annual accounts on a going concern basis;

Annual Report 2018-19 47
Board’s Report
(v) the directors have laid down internal financial controls to be followed by the Company and such internal financial controls are adequate and operating effectively; and
(vi) the directors have devised proper systems to ensure compliance with the provisions of all applicable laws and that such systems are adequate and operating effectively.
g. Corporate Governance
Corporate Governance Report along with General Shareholder Information and Management Discussion and Analysis are included in this Annual Report.
The CEO cum Whole-time Director and Group Chief Financial Officer have certified to the Board with regard to financial statements and other matters as required under Regulation 17(8) read with Schedule II to the SEBI LODR Regulations.
h. Corporate Social Responsibility and CSR Policy
Corporate Social Responsibility is an integral part of the Company’s ethos and policy and the Company is pursuing it on a sustainable basis. In this endeavour, the Company has contributed funds for the CSR activities/project related to promoting rural and nationally recognized sports, promotion of education and employment, enhancing vocational skills, environment sustainability and promoting art and culture. During the year under review, the Company was required to spent `11.9 million towards CSR activities against which, the Company has spent `30.99 million.
The Annual Report on CSR activities as required to be given under Section 135 of the Companies Act, 2013 and Rule 8 of the Companies (Corporate Social Responsibility Policy) Rules, 2014 has been provided in an Annexure – I to this Report.
i. Enterprise Risk Management Policy
The Board of Directors has approved and adopted comprehensive Enterprise Risk Management Policy (ERM) for the Company.
The Enterprise Risk Management Policy is designed to manage risk within the risk threshold established by the Board and provide reasonable assurance over the achievement of strategic and operational objectives. The policy document covers the enterprise wide risk management aspects of all Business Units/Plants of the Company. The Policy will help in risk identification, risk measurement, define risk appetite and threshold limits and suggesting risk mitigation measures. The Company has with the professional help implemented ERM Policy by carrying out detailed risk identification, assessment and ranking in consultation with senior management of the Company. The process is ongoing and require continuous exercise across all locations and functions of the Company. As a part of risk mitigation measure, the Company has implemented Compliance Management Tool across all business units and functions to monitor compliance of all applicable laws in India. The Risk Management Committee will do the periodic review of implementation, assessment and mitigation measures under ERM. The Chief Internal Auditor has been appointed as Chief Risk Officer to monitor on-going basis risk and to suggest mitigation measures.
5. Auditors
a. Statutory Auditor
In accordance with Sec 139 of the Companies Act, 2013, M/s S R B C & CO LLP, Chartered Accountants (Firm Registration No: 324982E/ E300003), were appointed by the shareholders of the Company at the Annual General Meeting held on September 5, 2018, as Statutory Auditors for a period of 5 years to hold office from the conclusion of 30th AGM till the conclusion of the 35th Annual General Meeting of the Company to be held in calendar year 2023.
The Ministry of Corporate Affairs vide its Notification dated May 7, 2018, has dispensed with the requirement of ratification of Auditor’s appointment by the shareholders, every year. Hence, approval of the Members for the ratification of Auditor’s appointment is not being sought at the ensuing Annual General Meeting.
The Auditors Report does not contain any qualification, reservation or adverse remark on the financial statements for the year ended March 31, 2019. The Notes on financial statement referred to in the Auditors’ Report are self-explanatory and do not call for any further comments. The auditor’s report is enclosed with the financial statements.
Total fees for all services paid by the Company and its subsidiaries, on a consolidated basis, to the statutory auditor and all entities in the network firm/network entity of which the statutory auditor is a part is given below:
(`in million)
Particular As at March 31, 2019
Audit Fees (Including fees for Overseas Subsidiary entities) 53.95
Tax Audit Fees 1.45
Other Service 5.76
Reimbursement of Expenses 6.77
Total 67.94

48 Varroc Engineering Limited
b. Cost Auditor
As per the provisions of Section 148 of the Act and Rule 3 of the Companies (Cost Records and Audit) Rules, 2014 (“the Rules”), the Company is required to maintain cost records with respect to certain products of the Company and get the same audited.
Based on the recommendation of the Audit Committee, the Board, at its meeting held on May 24, 2019, has appointed M/s S. R. Bhargave & Co., Cost Accountants as Cost Auditor of the Company for the financial year 2019-20 at a remuneration of `3,00,000 (Rupees Three Lakhs only). The said fee is exclusive of applicable taxes and reimbursement of out-of-pocket expenses, which shall be payable at actuals. A proposal for ratification of the cost audit fee for the audit of cost records for the financial year 2019-20 has been proposed at the forthcoming Annual General Meeting. The Cost Audit Report for the financial year 2018-19 will be filed within the stipulated period of 30 days after it is submitted by the Cost Auditors.
c. Secretarial Auditor
In terms of the provisions of Section 204 of the Act and the Companies (Appointment and Remuneration of Managerial Personnel) Rules, 2014, M/s Uma Lodha & Co. (C.P. No.2593), Company Secretary in Practice, Mumbai was appointed by the Board as Secretarial Auditor to undertake the Secretarial Audit for the financial year 2018-19.
The Secretarial Audit Report for the financial year 2018-19 is annexed herewith as Annexure- II to this report. The comments made in the Secreterial Report regarding laps in filing of document with stock exchange was rectified subsequently by filing amended document and regarding filing of e-form is under process to file along with late filing fees or compounding fees as applicable.
6. Business Responsibility Report
The ‘Business Responsibility Report’ of your Company for the year 2018-19 as required under Regulation 34(2)(f) of the SEBI LODR Regulations, is enclosed as Annexure III to this report.
7. Other Disclosures and Statutory Information
a. Compliance with Secretarial Standards
The Company complies with applicable secretarial standards.
b. Policies and code adopted by the Company
The Board of Directors has from time to time framed and approved policies as required by the SEBI LODR Regulations as well as under the Companies Act, 2013. These policies will be reviewed by the Board at periodic intervals. Some of the key policies that have been adopted are as follows:
(i) Policy for Board Diversity Appointment Remuneration Training and Evaluation of Directors and Employees (ii) Material Subsidiary Policy (iii) Policy for determination of materiality threshold for Disclosure of Events (iv) Code for Disclosure of Unpublished Price Sensitive Information (v) Code of Conduct for Insider Trading (vi) Policy on Preservation of Information and Archival of documents (vii) Policy on Related Party Transactions (viii) Code of Conduct for Directors and Senior Management Personnel (ix) Enterprise Risk Management Policy (x) Whistle Blower Policy (xi) Dividend Distribution Policy.
The above policies are available on the Company’s website on the link http://www.varrocgroup.com/corporate_governance.
c. Disclosure under code of conduct for Prevention of Insider Trading and Fair Disclosure of Unpublished Price Sensitive Information
In terms of the SEBI (Prohibition of Insider Trading) Regulations, 2015, the Company has adopted a ‘Code of Conduct for Prevention of Insider Trading’ (“PIT Code”). Further, the Company has also adopted a ‘Code of Practices and Procedures for Fair Disclosure of Unpublished Price Sensitive Information’ (“UPSI Code”). The required details have been disclosed in the Corporate Governance Report of the Company.
d. Particulars of employees and related disclosures
Disclosure of remuneration and other details as required under Section 197(12) of the Act read with Rule 5(1) of the Companies (Appointment and Remuneration of Managerial Personnel) Rules, 2014 are annexed herewith as Annexure IV.
A statement containing particulars of employees as required under Section 197(12) of the Act read with Rules 5(2) and 5(3) of the Companies (Appointment and Remuneration of Managerial Personnel) Rules, 2014 is provided as separate annexure forming part of this Report. In terms of Section 136 of the Act, the Annual Report and financial statements are being sent to the Members excluding the aforesaid annexure. The said annexure is available for inspection at the registered and corporate office of the Company during business hours and will be made available to any shareholder, on request.
The said statement is also available on your Company’s website at the web link http://www.varrocgroup.com/financial_results.
I) None of the Whole-Time Directors received any commission nor any remuneration from any of the Company’s subsidiaries except Managing Director who also serves as Managing Director and receives remuneration from Varroc Polymers Private Limited.
II) The following details are given in the Report on Corporate Governance forming part of this Annual Report:
(i) all elements of remuneration package of all the Directors;
Board’s Report
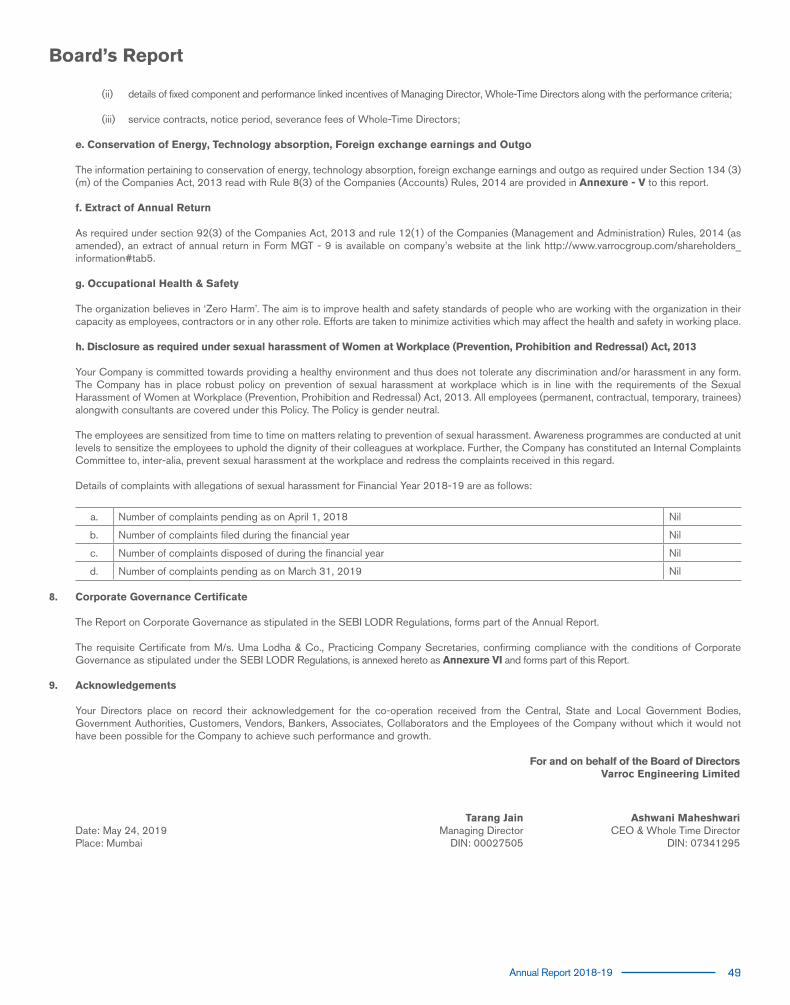
Annual Report 2018-19 49
Board’s Report
(ii) details of fixed component and performance linked incentives of Managing Director, Whole-Time Directors along with the performance criteria;
(iii) service contracts, notice period, severance fees of Whole-Time Directors;
e. Conservation of Energy, Technology absorption, Foreign exchange earnings and Outgo
The information pertaining to conservation of energy, technology absorption, foreign exchange earnings and outgo as required under Section 134 (3)(m) of the Companies Act, 2013 read with Rule 8(3) of the Companies (Accounts) Rules, 2014 are provided in Annexure - V to this report.
f. Extract of Annual Return
As required under section 92(3) of the Companies Act, 2013 and rule 12(1) of the Companies (Management and Administration) Rules, 2014 (as amended), an extract of annual return in Form MGT - 9 is available on company’s website at the link http://www.varrocgroup.com/shareholders_information#tab5.
g. Occupational Health & Safety
The organization believes in ‘Zero Harm’. The aim is to improve health and safety standards of people who are working with the organization in their capacity as employees, contractors or in any other role. Efforts are taken to minimize activities which may affect the health and safety in working place.
h. Disclosure as required under sexual harassment of Women at Workplace (Prevention, Prohibition and Redressal) Act, 2013
Your Company is committed towards providing a healthy environment and thus does not tolerate any discrimination and/or harassment in any form. The Company has in place robust policy on prevention of sexual harassment at workplace which is in line with the requirements of the Sexual Harassment of Women at Workplace (Prevention, Prohibition and Redressal) Act, 2013. All employees (permanent, contractual, temporary, trainees) alongwith consultants are covered under this Policy. The Policy is gender neutral.
The employees are sensitized from time to time on matters relating to prevention of sexual harassment. Awareness programmes are conducted at unit levels to sensitize the employees to uphold the dignity of their colleagues at workplace. Further, the Company has constituted an Internal Complaints Committee to, inter-alia, prevent sexual harassment at the workplace and redress the complaints received in this regard.
Details of complaints with allegations of sexual harassment for Financial Year 2018-19 are as follows:
a. Number of complaints pending as on April 1, 2018 Nil
b. Number of complaints filed during the financial year Nil
c. Number of complaints disposed of during the financial year Nil
d. Number of complaints pending as on March 31, 2019 Nil
8. Corporate Governance Certificate
The Report on Corporate Governance as stipulated in the SEBI LODR Regulations, forms part of the Annual Report.
The requisite Certificate from M/s. Uma Lodha & Co., Practicing Company Secretaries, confirming compliance with the conditions of Corporate Governance as stipulated under the SEBI LODR Regulations, is annexed hereto as Annexure VI and forms part of this Report.
9. Acknowledgements
Your Directors place on record their acknowledgement for the co-operation received from the Central, State and Local Government Bodies, Government Authorities, Customers, Vendors, Bankers, Associates, Collaborators and the Employees of the Company without which it would not have been possible for the Company to achieve such performance and growth.
For and on behalf of the Board of DirectorsVarroc Engineering Limited
Date: May 24, 2019Place: Mumbai
Tarang JainManaging Director
DIN: 00027505
Ashwani MaheshwariCEO & Whole Time Director
DIN: 07341295

50 Varroc Engineering Limited
ANNUAL REPORT ON CORPORATE SOCIAL RESPONSIBILITY (CSR) ACTIVITIESFOR THE FINANCIAL YEAR 2018-19
1. The Board of Directors at their meeting held on July 28, 2014 has approved policy for Corporate Social Responsibility (CSR) with a vision to actively contribute to the social and economic development of the communities in which Company operates. The said policy was later on amended based on the recommendation of the CSR Committee and amended CSR policy was adopted at the Board meeting held on July 15, 2015.
The Policy is aimed at socio-economic welfare, uplifting quality of life of the people, maintain environment, promoting youth and young talents,
providing opportunities to underprivileged and bright student, imparting vocational education etc. in line with the broad framework of Schedule VII of the Companies Act, 2013. The Policy can be referred in detail on the Company’s website www.varrocgroup.com.
2. Composition of the CSR Committee: The CSR Committee comprises of three Directors - Mr. Tarang Jain, Mr. Gautam Khandelwal and Mr. Ashwani Maheshwari.
3. Average net profit of the Company for last three financial years : `594.7 million
4. Prescribed CSR expenditure (Two percent of the amount mentioned in item 3 above) : `11.9 million
5. Details of CSR spent during the financial year:a) Total amount to be spent for the financial year : `11.9 millionb) Total amount spent during the financial year : `30.99 millionc) Amount unspent, if any : NILd) Manner in which the amount spent during the financial year : Refer Annexure A
6. Reason for not spending the amount of 2% as provided in clause (4) above : Not Applicable
7. Responsibility Statement We hereby declare that implementation and monitoring of the CSR policy is in compliance with CSR objectives and policy of the Company. For Varroc Engineering Limited
Tarang Jain(DIN 00027505)Managing Director &Member of CSR Committee
Date: May 24, 2019Place: Mumbai
ANNEXURE - I To Board’s Report

Annual Report 2018-19 51
ANNEXURE - I To Board’s Report
Annexure A
Sr. No.
CSR projector ActivityIdentified
Sector in which the project is covered (clause no. of Schedule
VII to the Companies Act, 2013, as amended)
Project of Program(1) Local Area or
Other(2) Specify the State and district where
projects or programs were undertaken
Amount Outlay
(Budget) Project or Program
wise(`in
Million
Amount spent on the Projects or Programs during the FY 2018-19
(`inMillion)
Cumulative Expenditure
upto the reporting period i.e.
FY 2018-19(`in
Million)
Amount Spent Direct or through
Implementing Agency
1 Skill Development
Cl. (ii) promoting education, including special education and employment enhancing vocation skills especially among children, women, elderly, and the differently abled and livelihood enhancement projects;
Local Area: Aurangabad (Maharashtra)
22.00 22.88 41.37 Direct/DMCFS*
2 Promoting Young Sports Talent enabling them to compete at national and international level
Cl. (vii) training to promote rural sports, nationally recognized sports, Paralympic sports and Olympic sports;
Local Area: Aurangabad, Pune (Maharashtra)
4.55 4.27 5.43 Implementing Partner-Varroc Foundation**
3 Kham River Restoration Project
Cl. (iv) ensuring environmental sustainability, ecological balance, protection of flora and fauna, animal welfare, agroforestry, conservation of natural resources and maintaining quality of soil, air and water [including contribution to the Clean Ganga Fund set-up by the Central Government for rejuvenation of river Ganga];
Local Area: Aurangabad 5.00 0.60 1.15 Direct / Varroc Foundation**
4 Promoting Art and Culture
Cl. (v) protection of national heritage, art and culture including restoration of buildings and sites of historical importance and works of art; setting up public libraries; promotion and development of traditional and handicrafts:
Local Area: Aurangabad, Ajanta, Ellora
0.00 0.00 0.09 Direct / Violin Academy*
5 Promoting Environment sustainability
Cl. (iv) ensuring environmental sustainability, ecological balance, protection of flora and fauna, animal welfare, agroforestry, conservation of natural resources and maintaining quality of soil, air and water [including contribution to the Clean Ganga Fund set-up by the Central Government for rejuvenation of river Ganga];
Local Area: Aurangabad 0.00 0.00 0.04 Direct / Varroc Foundation**
6 promoting health care including preventive health careand sanitation
Cl. (i) Eradicating hunger, poverty and malnutrition, promoting health care including preventive health care and sanitation including contribution to the Swacch Bharat Kosh set-up by the Central Government for the promotion of sanitation and making available safe drinking water.
Maharashtra – Mumbai, Thane, Navi Mumbai, Pune
0.00 3.00 7.20 Direct/Implementing Partner I love Mumbai Foundation
Total - Direct Expenses 31.55 30.75 55.28
Total - Indirect Expenses - 0.24 -
Grand Total 31.55 30.99 55.28 * Deccan Management Consultants Finishing School (DMCFS), and Violin Academy are non-profitable organization having an established track record of more than 3 years in undertaking such kind of projects and programmes** Varroc Foundation (VF) is a Trust registered under Indian Trust Act, 1982 and has an established track record of more than 3 years in undertaking similar kind of projects and programs with an overall aim to create and support a stronger and inclusive India

52 Varroc Engineering Limited
ANNEXURE - II To Board’s Report
FORM MR-3SECRETARIAL AUDIT REPORT
[Pursuant to Section 204 (1) of the Companies Act, 2013 and Rule 9 of theCompanies (Appointment and Remuneration Personnel) Rules, 2014]
FOR THE FINANCIAL YEAR ENDED 31ST MARCH 2019
To,The Members ofVarroc Engineering LimitedPlot No. L-4, MIDC, Waluj,Aurangabad- 431136.
We have conducted the Secretarial Audit of the compliance of applicable statutory provision and the adherence to good corporate practices by M/s Varroc Engineering Limited (CIN: L28920MH1988PLC047335) (hereinafter called “the Company”). Secretarial Audit was conducted in a manner that provided me a reasonable basis for evaluating the corporate conducts/statutory compliances and expressing my opinion thereon.
Based on our verification of the M/s Varroc Engineering Limited books, papers, minute books, forms and returns filed and other records maintained by the Company and also the information provided by the Company, its officers, agents and authorized representatives during the conduct of secretarial audit, we hereby report that in our opinion, the Company has, during the audit period covering the financial year ended on March 31, 2019 complied with the statutory provisions listed hereunder and also that the Company has proper Board-processes and compliance-mechanism in place to the extent, in the manner and subject to the reporting made hereinafter:
We have examined the books, papers, minutes books, forms and returns filed and other records maintained by M/s Varroc Engineering Limited for the financial year ended on March 31, 2019 according to the provisions of:
(i) The Companies Act, 2013 (the Act) and the rules made there under;
(ii) The Securities Contracts (regulation) Act, 1956 (SCRA) and the rules made there under; (iii) The Depositories Act, 1996 and the Regulations any Bye-laws framed there under;
(iv) Foreign Exchange Management Act, 1999 and the rules and regulations made there under to the extent of Foreign Direct Investment, Overseas Direct Investment and External Commercial Borrowings;
v). The following Regulations and Guidelines prescribed under the Securities and Exchange Board of India Act, 1992 (‘SEBI Act’)
(a) The Securities and Exchange Board of India (Substantial Acquisition of Shares and Takeovers) Regulations, 2011;
(b) The Securities and Exchange Board of India (Prohibition of Insider Trading) Regulations, 2015;
(c) The Securities and Exchange Board of India (Issue of Capital and Disclosure requirements) Regulations, 2018;
(d) The Securities and Exchange Board of India (Registrars to issue and Share Transfer Agents) Regulations, 1993 regarding the Companies Act and dealing with client;
(vi) All Tax related laws as applicable in respective states where company is operating its business;
(vi) I further report that having regard to the compliance system prevailing in the Company and on examination of the relevant documents and records in pursuance thereof, the Company has complied with the following laws applicable specifically to the Company:
• Motor Vehicles Act, 1988 and the Rules made thereunder; • The Motor Transport Workers Act,1961• The Explosive Act, 1884 and Gas Cylinders Rules, 2016• The Petroleum Act,1934 and the Rules made thereunder; • The Environment (Protection) Act, 1986 read with Bio-Medical Waste Management Rules, 2016• The Water (Prevention and Control of Pollution) Act, 1974• The Air (Prevention and Control of Pollution) Act, 1981• The Batteries (Management and Handling) Rules, 2016.
We have also examined compliance with the applicable clauses of the following:
(i) Secretarial Standards issued by the Institute of Company Secretaries of India.
(ii) Securities and Exchange Board of India (Listing Obligations and Disclosure Requirements) Regulations, 2015.
During the period under review, the Company has complied with the provisions of the Act, Rules, Regulations, Guidelines, Standards, etc. mentioned above.

Annual Report 2018-19 53
ANNEXURE - II To Board’s Report
I further report that there were no events/actions in pursuance of:
• The Securities and Exchange Board of India (Issue and Listing of Debt Securities) Regulations, 2008;
• The Securities and Exchange Board of India (Delisting of Equity Shares), Regulations, 2009;
• The Securities and Exchange Board of India (Buyback of Securities) Regulations, 2018;
• The Securities and Exchange Board of India (Share Based Employee Benefits) Regulations, 2014;
We further report that:
As per the explanation given by the Company, all the existing related party transactions of the Company with its related parties are in the ordinary course of business and on arm’s length basis or as per the contracts existing on the commencement of the Act, 2013 and have been approved by the Audit Committee, where applicable.
The Board of Directors of the Company is duly constituted with proper balance of Executive Directors ,Non-Executive Directors, Women Director and Independent Directors. The changes in the composition of the Board of Directors that took place during the period under review were carried out in compliance with the provisions of the Act.
Adequate notice is given to all Directors to schedule the Board Meetings, agenda and detailed notes on agenda were sent at least seven days in advance, and a system exists for seeking and obtaining further information and clarification on the agenda items before the meeting and for meaningful participation at the meeting.
We further report that there are adequate systems and processes in the company commensurate with the size and operations of the Company to monitor and ensure compliance with applicable laws, rules, regulations and guidelines.
During the period under review the Company has complied with the provisions of the Act, Rules, Regulations, Guidelines, Standards, etc. mentioned above except the following;
1. As per Regulation 8(2) of SEBI(Prohibition of Insider Trading) Regulation, 2015, Company failed to intimate the stock exchanges with respect to amendments made in Code of practices and procedures for fair disclosure of unpublished price sensitive information at the Board meeting held on 13/11/2018.
2. Non-Compliance of Section 117 of the Companies Act, 2013 read with Section 179 of the Act, as the Company failed to file Form MGT-14 with respect to Appointment of Mr. Ashwani Maheshwari as Chief Executive Officer (CEO) of the Company and Appointment of Mr. Arjun Jain as Whole Time Director (WTD) as well as Key managerial Personnel of the Company.
We further report that during the audit period there were no major events which had bearing on the Company’s affairs in pursuance of the above referred laws, rules, regulations, guidelines
For Uma Lodha & Co.Practicing Company Secretaries
Place: Mumbai Date: May 24,2019
Uma Lodha (Proprietor)
FCS No.: 5363C.P. No.2593
Note: This report is to be read with our letter of even date which is annexed as ANNEXURE A and forms an integral part of this report.

54 Varroc Engineering Limited
ANNEXURE - II To Board’s Report
ANNEXURE A
To,The Members ofVarroc Engineering LimitedPlot No. L-4, MIDC, Waluj,Aurangabad- 431136.
Our report of even date is to be read along with this letter.
• Maintenance of secretarial record is the responsibility of the management of the company. Our responsibility is to express an opinion on these secretarial records based on our audit.
• We have followed the audit practices and processes as were appropriate to obtain reasonable assurance about the correctness of the contents of the Secretarial records. The verification was done on test basis to ensure that correct facts are reflected in secretarial records. We believe that the processes and practices, we followed provide a reasonable basis for our opinion.
• We have not verified the correctness and appropriateness of financial records and Books of Accounts of the company.
• Wherever required, we have obtained the Management representation about the compliance of laws, rules and regulations and happening of events etc.
• The compliance of the provisions of Corporate and other applicable laws, rules, regulations, standards is the responsibility of management. Our examination was limited to the verification of procedures on test basis.
• The Secretarial Audit report is neither an assurance as to the future viability of the company nor of the efficacy or effectiveness with which the management has conducted the affairs of the company.
For Uma Lodha & Co.Practicing Company Secretaries
Place: Mumbai Date: May 24,2019
Uma Lodha (Proprietor)
FCS No.: 5363C.P. No.2593

Annual Report 2018-19 55
ANNEXURE - III To Board’s Report
BUSINESS RESPONSIBILITY REPORT
SECTION A: GENERAL INFORMATION ABOUT THE COMPANY
1. Corporate Identity Number (CIN) of the Company L28920MH1988PLC047335
2. Name of the Company Varroc Engineering Limited
3. Registered address Plot No. L-4, MIDC, Waluj Aurangabad (M.S.) - 431136
4. Website http://www.varrocgroup.com/
5. E-mail id [email protected]
6. Financial Year reported FY 2018-19
7. Sector(s) that the Company is engaged in (industrial activity code-wise) Automotive Components
8. List three key products/services that the Company manufactures /provides (as in balance sheet)
Flywheel Magneto, Steel Forged Products and Automotive Exterior lighting
9. Total number of locations where business activity isundertaken by the Company
(a) Number of International Locations (Provide details of major 5) Nil
(b) Number of National Locations The Company has 13 plants in India at below locations:i. Waluj and Shendra, Dist. Aurangabad (Maharashtra)ii. Chinchwad, Chakan and Maval, Dist. Pune (Maharashtra)iii. Sriperumbudur Taluk, Dist. Chennai (Tamil Nadu)iv. Halol, Dist. Panchmahal (Gujarat)v. Pantnagar (Uttarakhand)
10. Markets served by the Company – Local/State/National/International We serve Local/State/National/International markets.
SECTION B: FINANCIAL DETAILS OF THE COMPANY
1. Paid up Capital ( `) `134.81 Million
2. Total Turnover ( `) `26,246.37 Million
3. Total profit after taxes ( `) `1,195.40 Million
4. Total Spending on Corporate Social Responsibility (CSR) as percentage of profit after tax (%)
`30.99 million (2.59% of PAT for FY 2018-19)
5. List of activities in which expenditure in 4 above has been incurred:- Please refer Annexure I – ‘Annual Report on CSR Activitie's to the Board’s Report for details
SECTION C: OTHER DETAILS
1. Does the Company have any Subsidiary Company/ Companies? Yes, Varroc Engineering Limited (VEL) has subsidiary companies in India and abroad.
2. Do the Subsidiary Company/Companies participate in the Business Responsibility (BR) Initiatives of the parent company? If yes, then indicate the number of such subsidiary company(s)
Subsidiary companies of VEL conduct their standalone BR initiatives and do follow the principles of BR as per the local laws applicable to them.
3. Do any other entity/entities (e.g. suppliers, distributors etc.) that the Company does business with, participate in the BR initiatives of the Company? If yes, then indicate the percentage of such entity/entities? [Less than 30%, 30-60%, More than 60%]
The Company encourage its other stakeholders i.e. suppliers, distributors and other stakeholders in the value chain to participate in its BR initiatives,
however it does not track the actual participation.
SECTION D: BR INFORMATION
1. Details of Director/Directors responsible for BR
(a) Details of the Director/Director responsible for implementation of the BR policy/policies1. DIN Number : 000275052. Name : Mr. Tarang Jain3. Designation : Managing Director
(b) Details of the BR head
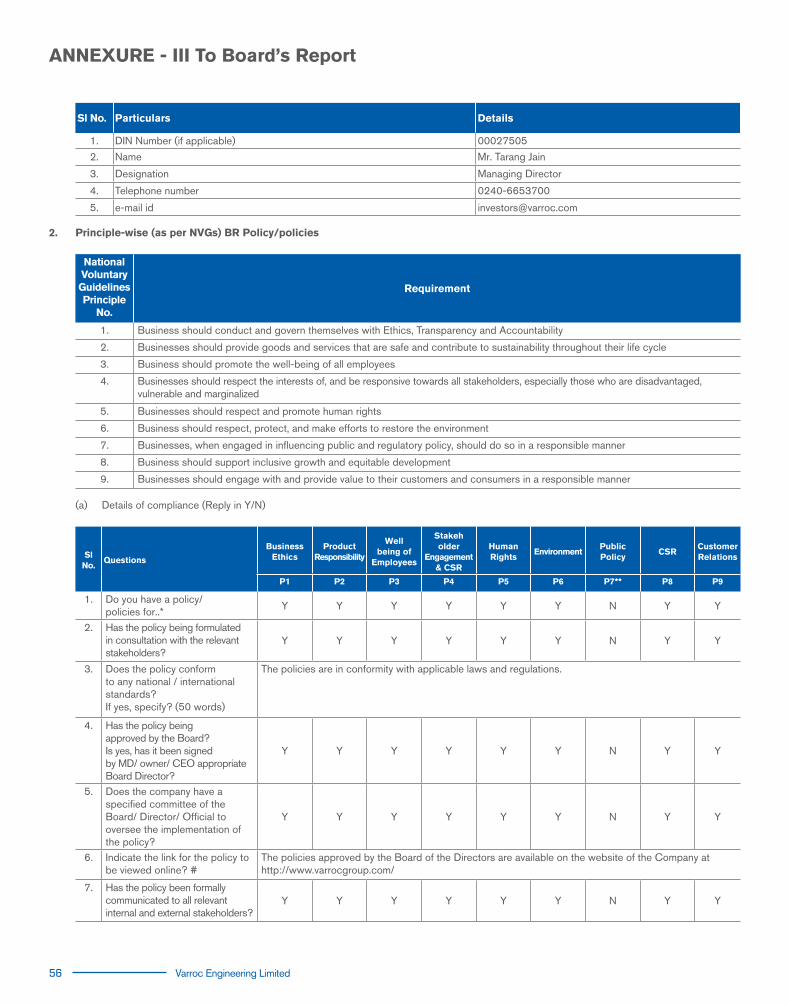
56 Varroc Engineering Limited
ANNEXURE - III To Board’s Report
Sl No. Particulars Details
1. DIN Number (if applicable) 00027505
2. Name Mr. Tarang Jain
3. Designation Managing Director
4. Telephone number 0240-6653700
5. e-mail id [email protected]
2. Principle-wise (as per NVGs) BR Policy/policies
NationalVoluntaryGuidelinesPrinciple
No.
Requirement
1. Business should conduct and govern themselves with Ethics, Transparency and Accountability
2. Businesses should provide goods and services that are safe and contribute to sustainability throughout their life cycle
3. Business should promote the well-being of all employees
4. Businesses should respect the interests of, and be responsive towards all stakeholders, especially those who are disadvantaged, vulnerable and marginalized
5. Businesses should respect and promote human rights
6. Business should respect, protect, and make efforts to restore the environment
7. Businesses, when engaged in influencing public and regulatory policy, should do so in a responsible manner
8. Business should support inclusive growth and equitable development
9. Businesses should engage with and provide value to their customers and consumers in a responsible manner
(a) Details of compliance (Reply in Y/N)
SlNo.
Questions
Business Ethics
ProductResponsibility
Wellbeing of
Employees
Stakeholder
Engagement& CSR
HumanRights
EnvironmentPublicPolicy
CSRCustomerRelations
P1 P2 P3 P4 P5 P6 P7** P8 P9
1. Do you have a policy/policies for..* Y Y Y Y Y Y N Y Y
2. Has the policy being formulated in consultation with the relevant stakeholders?
Y Y Y Y Y Y N Y Y
3. Does the policy conformto any national / international standards?If yes, specify? (50 words)
The policies are in conformity with applicable laws and regulations.
4. Has the policy beingapproved by the Board?Is yes, has it been signedby MD/ owner/ CEO appropriate Board Director?
Y Y Y Y Y Y N Y Y
5. Does the company have a specified committee of the Board/ Director/ Official to oversee the implementation of the policy?
Y Y Y Y Y Y N Y Y
6. Indicate the link for the policy to be viewed online? #
The policies approved by the Board of the Directors are available on the website of the Company at http://www.varrocgroup.com/
7. Has the policy been formally communicated to all relevantinternal and external stakeholders?
Y Y Y Y Y Y N Y Y

Annual Report 2018-19 57
8. Does the company have in-house structure to implement the policy / policies.
Y Y Y Y Y Y N Y Y
9. Does the Company have a grievance redressal mechanism related to the policy/ policies to address stakeholders’ grievances related to the policy/ policies?
Y Y Y Y Y Y N Y Y
10. Has the company carriedout independent audit/evaluation of the working of this policy by an internal or external agency?
Y Y Y Y Y Y N Y Y
* Policy(ies) include defined/ documented procedures and SOPs.** The management of the Company engages in public policy through industry associations only.# Internal Policies and SOPs are available on internal portal ‘HR-home” which is accessible only to the employees.
(b) If answer to the question at serial number 1 against any principle, is ‘No’, please explain why: (Tick up to 2 options)
SlNo.
Questions
Business Ethics
ProductResponsibility
Wellbeing of
Employees
Stakeholder
Engagement& CSR
HumanRights
EnvironmentPublicPolicy
CSRCustomerRelations
P1 P2 P3 P4 P5 P6 P7 P8 P9
1. The company has not understood the Principles
- - - - - - - - -
2. The company is not at a stage where it finds itself in a position to formulate and implement thepolicies on specified principles
- - - - - - - -
3. The company does not havefinancial or manpower resources available for the task
- - - - - - - - -
4. It is planned to be done within next 6 months
- - - - - - - - -
5. It is planned to be done within the next 1 year
- - - - - - - - -
6. Any other reason (please specify) - - - - - - - - -
3. Governance related to BR
(a) Indicate the frequency with which the Board of Directors, Committee of the Board or CEO to assess the BR performance of the Company Within 3 months, 3-6 months, Annually, More than 1 year
The Management regularly monitors the BR initiatives and complete assessment of various BR parameters is done on need basis and annually.
(b) Does the Company publish a BR or a Sustainability Report? What is the hyperlink for viewing this report? How frequently it is published? This BRR for the financial year 2018-19 is the first report of the Company that is published. Going forward, we shall be publishing BRR for a
financial year, annually, as part of the Annual Report.
SECTION E: PRINCIPLE-WISE PERFORMANCE
Principle 1: Business should conduct and govern themselves with Ethics, Transparency and Accountability
1. Does the policy relating to ethics, bribery and corruption cover only the company? Yes/ No. Does it extend to the Group/Joint Ventures/ Suppliers/Contractors/NGOs /Others?
Varroc is guided by five core values coined as SHIPS:
• Sincerity – To speak and act from the heart• Humility – To walk with everyone• Integrity – To do what is right• Passion – To go the distance against all odds• Self-Discipline – To make it happen
ANNEXURE - III To Board’s Report
58 Varroc Engineering Limited
ANNEXURE - III To Board’s Report
The Company’s Code of Business Conduct and Ethics addresses subjects like bribery, corruption, compliance to the Company’s standards of business conduct and ethics and ensures compliance with regulatory requirements. All employees provide necessary undertaking at the time of joining the Company. As a new initiative Code of Conduct and Business Ethics session has been made mandatory for all new joinees. The Company also has in place a Whistle Blower Policy. The workmen are governed by model standing order.
All joint ventures, suppliers and contractors of the Company are independent entities. Therefore, the Company’s Code of Conduct and Whistle Blower Policy do not apply to them.
2. How many stakeholder complaints have been received in the past financial year and what percentage was satisfactorily resolved by the management?
If so, provide details thereof, in about 50 words or so.
NIL complaints were received in the past Financial year 2018-19.
Principle 2: Businesses should provide goods and services that are safe and contribute to sustainability throughout their life cycle
1. List up to 3 of your products or services whose design has incorporated social or environmental concerns, risks and/or opportunities. The Company is engaged in the business of manufacturing of automotive components. These products have insignificant social or environmental
concern or risk. However, Social and environmental concerns are always on the fore with regard to all manufacturing processes.
2. For each such product, provide the following details in respect of resource use (energy, water, raw material etc.) per unit of product(optional):
The Company always take efforts for optimum utilization of natural resources.
(a) Reduction during sourcing/production/ distribution achieved since the previous year throughout the value chain? NOT APPLICABLE
(b) Reduction during usage by consumers (energy, water) has been achieved since the previous year? NOT APPLICABLE
3. Does the company have procedures in place for sustainable sourcing (including transportation)? (a) If yes, what percentage of your inputs was sourced sustainably? Also, provide details thereof, in about 50 words or so.
Yes, The Company has a procurement policy in place for purchase of goods and raw material. The Company evaluates the vendors for different
components/materials based on Productivity, Quality, Cost, Delivery, Safety & Morale criteria (PQCDSM).
It is difficult to ascertain the percentage of inputs sourced from these suppliers accounting towards total inputs due to different kind of materials being used by the Company.
4. Has the company taken any steps to procure goods and services from local & small producers, including communities surrounding their place of work? (a) If yes, what steps have been taken to improve their capacity and capability of local and small vendors?
Yes. Localization is one of the important aspects of sourcing strategy and the Company is procuring goods and services from local Vendors which
include large, mid size and small scale industries which meets our criteria of PQCDSM. Most of the Company’s vendors are located in vicinity to its manufacturing plants. The Company has developed a Local Direct (Tier I) and sub-supplier (Tier II) base of 900 vendors around its manufacturing plants. To encourage small suppliers, 85 vendors (@10%) are selected from the MSME (Micro, Small and Medium Enterprises). The Company is continuously working to build the capability of its vendors through a structured Vendor Up-gradation program. Long Term Suppliers (LTS) for various products and the categories of the same are identified. The Company, at periodic intervals, reviews its suppliers based on Vendor Performance Rating and developmental support in the past. Capabilities of LTS are enhanced through: Trainings for Total Productive Maintenance (TPM) way of working are conducted; these are aimed at overall efficiency improvement with defined PQCDSM targets (Productivity, Quality, Cost, Delivery, Safety, and Morale).
39 vendors are Practicing TPM under company guidance and 24 out of them were awarded by the Company for TPM sustenance during the FY 2018-19.
Technology up-gradation of suppliers is done by providing training for manufacturing, quality, flexibility, validation and testing of components, sharing of process knowledge & driving continuous improvement.
5. Does the company have a mechanism to recycle products and waste? If yes what is the percentage of recycling of products and waste (separately as <5%, 5-10%, >10%). Also, provide details thereof, in about 50 words or so.
The Company believes that waste can be used as a resource and recycles/ reuses the waste generated during manufacturing process. Awareness sessions and workshops are conducted internally on water conservation. Water saving kaizens are implemented through use of water balance diagram. The Company also encourages use of recyclable (green)/returnable packaging wherever possible. This consumption is between 5 and 10% of our total packaging consumption. We intend to increase wherever possible in future.

Annual Report 2018-19 59
Principle 3: Business should promote the well-being of all employees
1. Please indicate the Total number of employees: 3,472 Nos.
2. Please indicate the Total number of employees hired on temporary/contractual/casual basis: 6,398 Nos.
3. Please indicate the Number of permanent women employees: 254 Nos.
4. Please indicate the Number of permanent employees with disabilities: Nil
5. Do you have an employee association that is recognized by management: There are 6 agreements entered into with labour unions for the Company’s plants located at Waluj (Aurangabad, Maharashtra), Takve & Chakan (Dist.
Pune, Maharashtra) and Pantnagar (Uttarakhand).
6. What percentage of your permanent employees is members of this recognized employee association? As of March 31, 2019, 749 employees, representing 19% of our total workforce, are members of labour unions.
7. Please indicate the Number of complaints relating to child labour, forced labour, involuntary labour, sexual harassment in the last financial year and pending, as on the end of the financial year
Sl No.
CategoryNo. of complaintsfiled during thefinancial year
No. of complaintspending as on end of
the financial year
1. Child labour/ forced labour/involuntary labour Nil Nil
2. Sexual harassment Nil Nil
3. Discriminatory employment Nil Nil
8. What percentage of your under mentioned employees were given safety & skill up-gradation training in the last year?
Sl No.
Category% Employees
that were givensafety training
% Employees thatwere given skill
upgradation training
(a) Permanent Employees 65 65
(b) Permanent Women Employees 85 85
(c) Casual/Temporary/Contractual Employees 90 90
(d) Employees with Disabilities Nil Nil
Principle 4: Businesses should respect the interests of, and be responsive towards all stakeholders, especially those who are disadvantaged, vulnerable and marginalized
1. Has the company mapped its internal and external stakeholders? Yes/No Yes, VEL has mapped its internal and external stakeholders.
Our stakeholders both internal and external, play a significant role in expressing our values, carrying out our mission, developing strategies, implementing processes and fostering long-term relationships.
Internal and external stakeholders mapped includes, Employees, Customers, Shareholders, Investors, Regulatory bodies, Suppliers, Vendors, Distributors, CSR beneficiaries, Governments and Knowledge partners.
2. Out of the above, has the company identified the disadvantaged, vulnerable & marginalized stakeholders: Yes
3. Are there any special initiatives taken by the company to engage with the disadvantaged, vulnerable and marginalized stakeholders. If so, provide details thereof, in about 50 words or so.
Yes, the Company has identified the disadvantaged, vulnerable & Marginalized stakeholders viz. unemployed & unskilled youth, people having limited or no access to basic education, clean water etc.
The Company has taken initiatives to engage with the disadvantaged, vulnerable, marginalized stakeholders as per its CSR policy both directly and through implementation agencies.
ANNEXURE - III To Board’s Report

60 Varroc Engineering Limited
ANNEXURE - III To Board’s Report
(a) Skill Development Programme directly by the Company for the vocational courses conducted jointly by Varroc Academy & Deccan Management Consultant Finishing School (DMCFS) in partnership with Tata Institute of Social Studies–School of Vocational Education (TISS-SVE) for promoting skill development of local underprivileged youth. Successful students are absorbed in the industries in and around respective locations. During the year, 223 students have enrolled out of which 185 students have been sponsored by the Company for the 3 years Vocational Course.
(b) Kham River Eco Restoration Programme: The Company in association with CII has undertaken restoration project of Kham River. The company has so far completed various activities which include 6 green bridges, 1 Eco Park, 2 MS Metal Screens to clean nondegradable solid waste and beautification of river beds. The said project will maintain natural beauty of the river and environmental sustainability. The Company is committed to maintain environmental sustainability and ecological balance and conservation of natural resources.
(c) Varroc Vengsarkar Cricket Academy (VVCA), Pune is formed between the Company and Dilip Vengsarkar Foundation. The Academy provides cricket training to the promising talents in the age group of U-12, U-14, U-16 and U-19 and nurture them for the national tournaments. The academy presently provides coaching to around 150 promising players and it has so far produced more than 10 best players who have been selected for Maharashtra State, National matches and for Ranji Trophy.
Principle 5: Businesses should respect and promote human rights
1. Does the policy of the company on human rights cover only the company or extend to the Group/Joint Ventures/Suppliers/Contractors/NGOs/Others?
We at Varroc respect the dignity of all individuals and communities and adhere to the principles of Human Rights.
The Company has adopted Code of ethics and whistle blower policy. These policies are applicable to Varroc India Business employees. The underlining principles are communicated to all the vendors, suppliers and distributors and other key business associates of the company, which they are expected to adhere to while dealing with the company.
2. How many stakeholder complaints have been received in the past financial year and what percent was satisfactorily resolved by the management?
There have been no complaints against breach of human rights aspects in the reporting period.
Principle 6: Business should respect, protect, and make efforts to restore the environment
1. Does the policy related to Principle 6 cover only the company or extends to the Group/Joint Ventures/Suppliers/Contractors/NGOs/others. The ‘Environment, Occupational Health and Safety’ policy is applicable to the Company and its subsidiaries in India. The vendors are governed by their
respective policies. Adherence to environmental laws and regulations is one of the pre-requisites for awarding a contract to any vendor. Various steps are taken for optimal utilization of our resources in-line with ISO 14001 standards requirements.
2. Does the company have strategies/ initiatives to address global environmental issues such as climate change, global warming, etc? Y/N. If yes, please give hyperlink for webpage etc.
The Company has been undertaking various initiatives to address environmental issues. The emissions or waste generated by the company are within the permissible limits specified by the Central Pollution Control Board (CPCB) and State Pollution Control Board (SPCB).
3. Does the company identify and assess potential environmental risks? Y/N
Yes, environmental risk is covered in the company principles that are based on ISO 14001 standards. Once risk is identified, the steps are taken to measures and mitigate the risk.
4. Does the company have any project related to Clean Development Mechanism? If so, provide details thereof, in about 50 words or so. Also, if Yes, whether any environmental compliance report is filed?
The Company continues to work towards development and implementation of climate change mitigation project mainly through energy saving projects (including generation of power through wind mills and solar) across the company. However, we do not have any registration of CDM projects.
5. Has the company undertaken any other initiatives on – clean technology, energy efficiency, renewable energy, etc. Y/N. If yes, please give hyperlink for web page etc.
The measures introduced by the Company for conservation of energy at its plant locations are contained in the Report on Conservation of Energy and
Technology Absorption which forms part of the Board’s Report.
6. Are the Emissions/Waste generated by the company within the permissible limits given by CPCB/SPCB for the financial year being reported?
Yes
Annual Report 2018-19 61
7. Number of show cause/ legal notices received from CPCB/SPCB which are pending (i.e. not resolved to satisfaction) as on end of Financial Year.
Nil
Principle 7: Businesses, when engaged in influencing public and regulatory policy, should do so in a responsible manner
1. Is your company a member of any trade and chamber or association? If Yes, Name only those major ones that your business deals with: The Company is a member of several leading Industry Associations, including:
• ACMA - Automobile Component Manufacturers Association,• BAVA - Bajaj Auto Vendor Association,• SIAM - Society of Indian Automobile Manufacturers• CII - Confederation of Indian Industries,• JIPM - Japan Institute of Plant Maintenance • CMIA - Chamber of Marathwada Industries Association
2. Have you advocated/lobbied through above associations for the advancement or improvement of public good? Yes/No; if yes specify the broad areas (drop box: Governance and Administration, Economic Reforms, Inclusive Development Policies, Energy security, Water, Food Security, Sustainable Business Principles, Others)
As a responsible corporate citizen, the Company’s approach is to contribute to public policy formulation through recognized industry associations only.
Principle 8: Business should support inclusive growth and equitable development
1. Does the company have specified programmes/initiatives/projects in pursuit of the policy related to Principle 8? If yes details thereof.
Yes, the Company has a Corporate Social Responsibility Policy which derived its core value on various aspects as per the requirements of the Companies Act, 2013. The Policy is aimed at socioeconomic welfare, uplifting quality of life of the people, maintain environment, promoting youth and young talents, providing opportunities to underprivileged and bright student, imparting vocational education etc. in line with the broad framework of Schedule VII of the Companies Act, 2013. The Policy can be referred in detail on the Company’s website www.varrocgroup.com.
2. Are the programmes/projects undertaken through in-house team/own foundation/external NGO/government structures/any other organization?
The CSR initiatives are implemented either directly by the company or through implementing partners which include NGOs having an established track record of at least 3 years in carrying on the specific activity. The main implementation partners the company works with are Varroc Foundation and Varroc Vengsarkar Cricket Academy and I Love Mumbai Foundation.
3. Have you done any impact assessment of your initiative? The CSR Committee periodically reviews the progress of the initiatives for all the projects and programmes to assess the desired outcome on the society.
4. What is your company’s direct contribution to community development projects- Amount in INR and the details of the projects undertaken.
For details on Company’s contribution to its CSR projects and programmes, please refer ‘Annexure – I Annual Report on CSR activities’, to the Board’s report for FY 2018-19.
5. Have you taken steps to ensure that this community development initiative is successfully adopted by the community? Please explain in 50 words, or so.
Yes, the Company regularly monitors CSR initiatives to ensures that they are properly implemented and sustain within communities beyond our interactions.
Principle 9: Businesses should engage with and provide value to their customers and consumers in a responsible manner
1. What percentage of customer complaints/consumer cases are pending as on the end of financial year. The Company (including its subsidiaries in India) caters to two, three and four-wheeler Original Equipment Manufacturers (“OEMs”). There is a strong
mechanism defined in the Company to deal with issues and complaints reported by OEMs. OEMs can communicate issues through their online portals, e-mail communications, during their visits to plants or at meetings. The Company also caters to retail market through its aftermarket division. The Complaints can be raised through any or all of the following modes:
• Lodging of complaint on dedicated Customer Care number;• Sending complaints through email at [email protected];• Communicate the complaint at the customer care desk at local representative/ distributor.
There is no complaint which is pending attention and requisite action at Company’s end.
ANNEXURE - III To Board’s Report

62 Varroc Engineering Limited
ANNEXURE - III To Board’s Report
2. Does the company display product information on the product label, over and above what is mandated as per local laws? Yes/No/N.A. /Remarks (additional information)
Yes.
We display information as required by the Legal Metrology Act, 2009. Since the Company’s product are OEM specific and as per OEM requirements, the Company display product requirement of OEM and consistent with applicable laws. The typical information display on product includes details of manufacturers & marketed by, Product Part number, code, Price Details, Customer Care Number and email etc.
3. Is there any case filed by any stakeholder against the company regarding unfair trade practices, irresponsible advertising and/or anti-competitive behavior during the last five years and pending as on end of financial year. If so, provide details thereof, in about 50 words or so.
No
4. Did your company carry out any consumer survey/ consumer satisfaction trends?
Customer response and customer satisfaction are one of the most important factors of any business. The Company engages with its customers at various platforms to understand their expectations. The company obtains the customer feedback directly on a regular basis to identify the areas of concerns. Accordingly, corrective measures have been planned and implemented. Customer satisfactions trends are complied, monitored and reviewed by the top management at reguler intervals for getting the directives for improvements.

Annual Report 2018-19 63
DISCLOSURE OF REMUNERATION AND OTHER DETAILS AS REQUIRED UNDER SECTION 197(12)OF THE ACT READ WITH RULE 5(1) OF THE COMPANIES (APPOINTMENT AND REMUNERATION OF
MANAGERIAL PERSONNEL) RULES, 2014
A. Ratio of remuneration of each Director to the median remuneration of the employees of the Company for the FY 2018-19 as well as the percentage increase in remuneration of each Director, Chief Financial Officer, Company Secretary is as under:
Name of the Director / KMP DesignationRemuneration(`in million)
Ratio toMedian
Remuneration
% change inRemunerati
on over previous year
Mr. Naresh Chandra Chairman 0.71 NA Nil
Mr. Tarang Jain Managing Director 52.27 13337% 10.00%
Mr. Arjun Jain Whole-time Director 6.89 1758% #
Mr. Gautam Khandelwal Independent Director 3.40 NA -2.86%
Mr. Marc Szulewicz Independent Director 4.27 NA -14.60%
Mrs. Vijaya Sampath Independent Director 3.50 NA Nil
Mr. Vinish Kathuria Independent Director 3.48 NA -0.6%
Mr. Ashwani Maheshwari CEO & Wholetime Director 19.95 5091% 35.35%
Mr. T. R. Srinivasan Chief Financial Officer 21.34 5445% $
Mr. Rakesh Darji Company Secretary 5.88 1500% 8.9%
# Mr. Arjun Jain, was appointed as Whole-time Director during FY 2018-19 and therefore % change in remuneration over previous year is not appicable.$ Mr. T. R. Srinivasan, was appointed as Chief Financial Officer during FY 2017-18 and therefore % change in remuneration over previous year is not appicable.
Note: For above calculation, remuneration includes siting fee and commission. Commission relates to the financial year ended March 31, 2019 which will be paid during FY 2019-20.
B. The median remuneration of employees of the Company during FY 2018-19 `393,943
C. Percentage increase in median remuneration in the FY 2018-19 18.80%
D. Number of Permanent employees on the roll of the company as on March 31, 2019 3472
E. Average percentile increase in Salary of employees other than managerial personnel 8.03%
F. Average percentile increase in remuneration of managerial personnel 9.33%
G. Affirmation: It is affirmed that the remuneration paid to the Directors, Key Managerial Personnel and other employees is as per the Remuneration Policy of the Company.
H. Justification for Average increase in Salary The average increase in Salary is in line with average industry standards and comparable to the prevalent market rates.
ANNEXURE - IV To Board’s Report
64 Varroc Engineering Limited
ANNEXURE - V To Board’s Report
INFORMATION AS PER SECTION 134 (3)(m) OF THE COMPANIES ACT, 2013 READ WITH RULE 8(3)OF THE COMPANIES (ACCOUNTS) RULES, 2014 AND FORMING PART OF THE DIRECTORS’ REPORT
FOR THE YEAR ENDED ON MARCH 31, 2019
A) CONSERVATION OF ENERGY
The Company continued to give major emphasis for conservation of Energy and the measures taken during the previous years were continued. The Efficiency of Energy Utilization in each manufacturing unit is monitored properly, in order to achieve effective conservation of energy.
During the year under review, the wind mills installed by the Company at Satara and Supa in Maharashtra State and Badabaugh in Rajasthan State, generated 79,00,601 units of electricity (including 62,61,485 units of captive consumption). The Company earned an income of `54.07 million (including captive consumption `46.29 million) from the generation of wind power.
Further, Solar Plant installed by the Company at Shivaji Nagar, Distt. Dhule, Maharashtra State generated 61,17,031 units of electricity. The said units were captively consumed by the Company. The total amount of captive consumption is `46.29 Million.
The Company ensures that the manufacturing operations are conducted in the manner whereby optimum utilization and maximum possible savings of energy is achieved.
i) THE STEPS TAKEN OR IMPACT ON CONSERVATION OF ENERGY:
The significant Energy Conservation measures taken during the year were:
• Capacitors provided to maintain power factor to unity• VFD provided for dust collector and cooling tower• Compressed Air line leakages identification and rectification• Modification of reduce roll machine hydraulic power pack circuit• Energy efficient LED lamp replaced in machine shop• Centralized cooling system - Installation of Evaporative air-cooling systems to save energy• IBH coil modification for energy consumption reduction from 4000 KW coil to 3400 KW coil• Eliminate idle running of hyd. motor – Eliminated by modification of logic• Eliminate separate cooling pump to modify cooling system• RO plant converted into UV filtration system• Cooling tower sprinkle system modification done by using gravitational force instead of motor• Provided air blower to MNPH instead of use of compressor air• One methanol pump used for furnaces instead of pumps• IBH coil modified for energy consumption• Plate Type Heat Exchanger installed in place of Chillers• Kaeser DSD 238 Screw Replacement• VFDs provided to Air Compressor, Hydraulic power packs, STP aeration blower and Grinding wheel of Grading machines• Air pressure optimization and machine shops and cold forging area• Air booster installed for HMT press and shop floor• Energy efficient pumps installed in heat treatment cooling tower• Air supply interlock with machine operation timer in dry cut machines• Hot forging cooling tower Energy efficient pumps installed with revised piping logic• Ideal machine trip circuit modification in grinding machine• Air supply to be controlled by timer to save air and energy at Machine Shop• Energy saver valve to be installed before air gun to control air pressure to reduce air and energy consumption• Bus bar ducting for LT panel incoming to reduce the losses• Normal air gun replaced with low pressure air gun• Hydraulic interlock provided for idle running of machines• Interlock added for Centerless Grinding machines for programming modification done for idle running• Load balancing at each phase• Use of Solar water heater with HWG• Magnet pre-heating oven removed from line in place of curving oven• 11W CFL Inspection lights replaced with 8W LED• Street Light CFL 85W replaced with LED-60W• Auto ON & OFF control system provided at New STP Plant• Auto ON & OFF control system provided at New ETP / ZLD/ STP Plants• Use of LED Indication lamps on Machine & Control Panels• LED fittings installed at Transformer Area / DG – LT Room• Modified Air Line main header installed to reduce load on compressors• Continuous monitoring of power usage throughout the year.
ii) THE STEPS TAKEN BY THE COMPANY FOR UTILIZING ALTERNATE SOURCE OF ENERGY
• Installation of roof top solar at three manufacturing facilities (VEL-III, V & VII) have been done in FY 2018-19.
• The Company is using green source power like solar and wind for its plant operations as an alternative source to thermal power.

Annual Report 2018-19 65
ANNEXURE - V To Board’s Report
iii) THE CAPITAL INVESTMENT ON ENERGY CONSERVATION EQUIPMENTS An amount of `55.95 Million has been spent on energy conservation equipments during the Financial year ended on March 31, 2019.
B) TECHNOLOGY ABSORPTION Research & Development:
(i) Automotive industry has been showing reasonable growth with stable demand from within the country as well as from other countries. The Company has been making investment in Research and Development (R&D), In-house Technology Development and innovation for achieving targeted growth, business profitability and sustainability. The Company has two R&D Centres approved by the Department of Scientific and Industrial Research (DSIR) which are dedicated in developing new products and improvise existing product portfolio in order to offer technologically upgraded solutions to its customers.
(ii) The benefits derived like product development, cost reduction or import substitution:The efforts taken by your Company towards in-house technology development and absorption help deliver competitive advantage to your Company through the launch of new products and variants, introduction of new features and improvement of product performance coupled with enhanced customer delight and confidence.
(iii) In case of imported technology (imported during the last three years reckoned from the beginning of the Financial Year) : Not applicable
(iv) Expenditure on R & D for FY 2018-19:
(`in Million)
Particulars Amount
Capital 165.53
Recurring 487.97
Total 653.50
Total R&D expenditure as a Percentage of total turnover 2.54%
C) FOREIGN EXCHANGE EARNINGS & OUTGO Actual Foreign Exchange used and earned for FY 2018-19:
(`in Million)
Sl. No
Item Amount
A Used for:
1 Capital Goods 365.38
2 Raw Materials 1,433.23
3 Components, Stores & Spares 26.23
4 Foreign Travels 9.65
5 Consultancy Charges 36.75
6 Interest on Term Loans 30.04
7 Royalty 3.21
8 Others 59.44
TOTAL 1,963.93
B Earned:
1 Exports 1,682.47
2 Others 210.24
TOTAL 1,892.71

66 Varroc Engineering Limited
ANNEXURE - VI To Board’s Report
CERTIFICATE ON CORPORATE GOVERNANCE
To,The Members ofVarroc Engineering LimitedPlot No. L-4, MIDC, Waluj,Aurangabad· 431136
We have examined the compliance of conditions of Corporate Governance by M/S. VARROC ENGINEERING LIMITED (CIN: L28920MH1988PLC047335) (the Company) for the year ended March 31, 2019 as stipulated in the relevant provisions of Securities and Exchange Board of India (Listing Obligations and Disclosure Requirements) Regulations, 2015 (collectively referred to as “SEBI Listing Regulations, 2015) as referred in Regulations 15(2) of the listing regulations for the period from April 1, 2018 to March 31, 2019.
The compliance of conditions of Corporate Governance is the responsibility of the Management. Our examination was limited to procedures and implementation thereof, adopted by the Company for ensuring the compliance on the financial statement of the Company.
In our opinion and to the best of our information and according to the explanations given to us, we certify that the Company has complied with all conditions of Corporate Governance as stipulated in the SEBI Listing Regulations, 2015.
We state such compliance is neither an assurance as to the future viability of the Company nor the efficiency or effectiveness with which the management has conducted the affairs of the Company.
For Uma Lodha & Co.Practicing Company Secretaries
Date: May 10, 2019Place: Mumbai
Uma Lodha(Proprietor)
C.P. No. 2593Membership No.5363
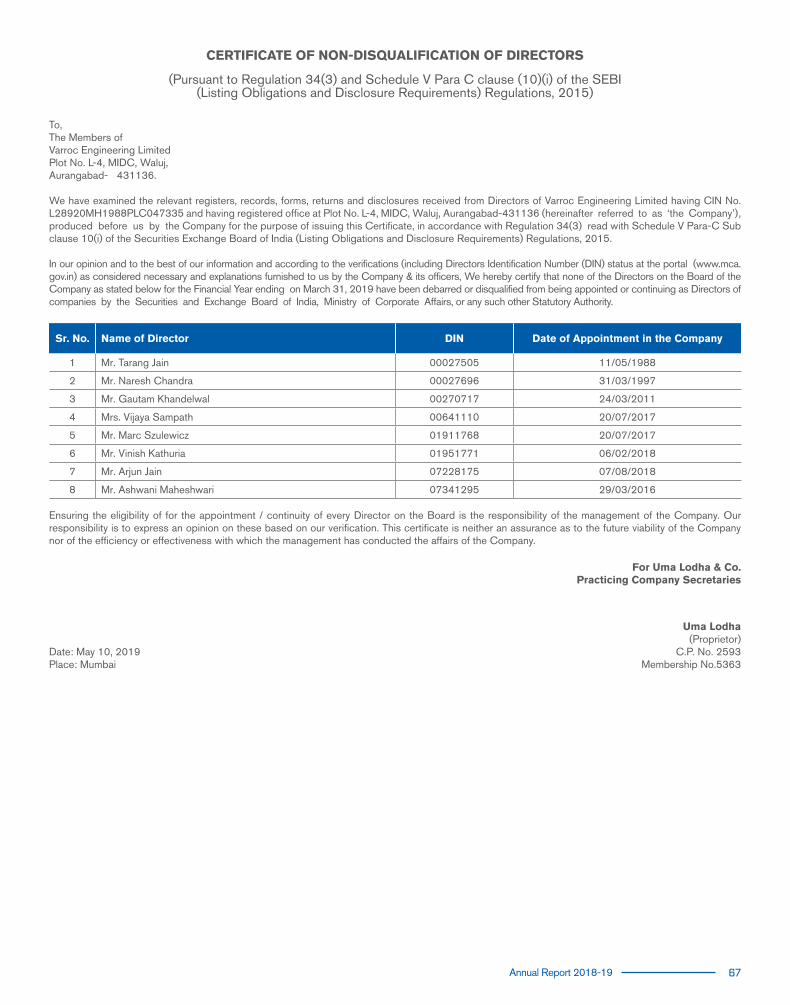
Annual Report 2018-19 67
CERTIFICATE OF NON-DISQUALIFICATION OF DIRECTORS
(Pursuant to Regulation 34(3) and Schedule V Para C clause (10)(i) of the SEBI(Listing Obligations and Disclosure Requirements) Regulations, 2015)
To,The Members ofVarroc Engineering LimitedPlot No. L-4, MIDC, Waluj,Aurangabad- 431136.
We have examined the relevant registers, records, forms, returns and disclosures received from Directors of Varroc Engineering Limited having CIN No. L28920MH1988PLC047335 and having registered office at Plot No. L-4, MIDC, Waluj, Aurangabad-431136 (hereinafter referred to as ‘the Company’), produced before us by the Company for the purpose of issuing this Certificate, in accordance with Regulation 34(3) read with Schedule V Para-C Sub clause 10(i) of the Securities Exchange Board of India (Listing Obligations and Disclosure Requirements) Regulations, 2015.
In our opinion and to the best of our information and according to the verifications (including Directors Identification Number (DIN) status at the portal (www.mca.gov.in) as considered necessary and explanations furnished to us by the Company & its officers, We hereby certify that none of the Directors on the Board of the Company as stated below for the Financial Year ending on March 31, 2019 have been debarred or disqualified from being appointed or continuing as Directors of companies by the Securities and Exchange Board of India, Ministry of Corporate Affairs, or any such other Statutory Authority.
Sr. No. Name of Director DIN Date of Appointment in the Company
1 Mr. Tarang Jain 00027505 11/05/1988
2 Mr. Naresh Chandra 00027696 31/03/1997
3 Mr. Gautam Khandelwal 00270717 24/03/2011
4 Mrs. Vijaya Sampath 00641110 20/07/2017
5 Mr. Marc Szulewicz 01911768 20/07/2017
6 Mr. Vinish Kathuria 01951771 06/02/2018
7 Mr. Arjun Jain 07228175 07/08/2018
8 Mr. Ashwani Maheshwari 07341295 29/03/2016
Ensuring the eligibility of for the appointment / continuity of every Director on the Board is the responsibility of the management of the Company. Our responsibility is to express an opinion on these based on our verification. This certificate is neither an assurance as to the future viability of the Company nor of the efficiency or effectiveness with which the management has conducted the affairs of the Company.
For Uma Lodha & Co.Practicing Company Secretaries
Date: May 10, 2019Place: Mumbai
Uma Lodha(Proprietor)
C.P. No. 2593Membership No.5363
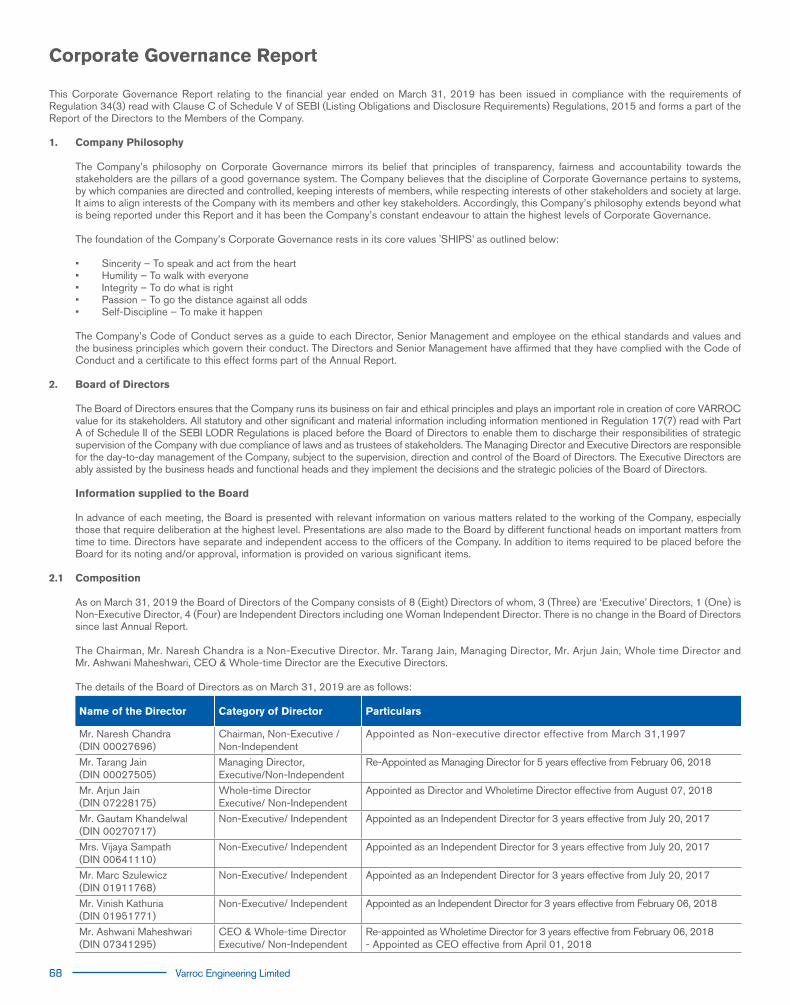
68 Varroc Engineering Limited
This Corporate Governance Report relating to the financial year ended on March 31, 2019 has been issued in compliance with the requirements of Regulation 34(3) read with Clause C of Schedule V of SEBI (Listing Obligations and Disclosure Requirements) Regulations, 2015 and forms a part of the Report of the Directors to the Members of the Company.
1. Company Philosophy
The Company’s philosophy on Corporate Governance mirrors its belief that principles of transparency, fairness and accountability towards the stakeholders are the pillars of a good governance system. The Company believes that the discipline of Corporate Governance pertains to systems, by which companies are directed and controlled, keeping interests of members, while respecting interests of other stakeholders and society at large. It aims to align interests of the Company with its members and other key stakeholders. Accordingly, this Company’s philosophy extends beyond what is being reported under this Report and it has been the Company’s constant endeavour to attain the highest levels of Corporate Governance.
The foundation of the Company’s Corporate Governance rests in its core values 'SHIPS’ as outlined below:
• Sincerity – To speak and act from the heart• Humility – To walk with everyone• Integrity – To do what is right• Passion – To go the distance against all odds• Self-Discipline – To make it happen
The Company’s Code of Conduct serves as a guide to each Director, Senior Management and employee on the ethical standards and values and the business principles which govern their conduct. The Directors and Senior Management have affirmed that they have complied with the Code of Conduct and a certificate to this effect forms part of the Annual Report.
2. Board of Directors
The Board of Directors ensures that the Company runs its business on fair and ethical principles and plays an important role in creation of core VARROC value for its stakeholders. All statutory and other significant and material information including information mentioned in Regulation 17(7) read with Part A of Schedule II of the SEBI LODR Regulations is placed before the Board of Directors to enable them to discharge their responsibilities of strategic supervision of the Company with due compliance of laws and as trustees of stakeholders. The Managing Director and Executive Directors are responsible for the day-to-day management of the Company, subject to the supervision, direction and control of the Board of Directors. The Executive Directors are ably assisted by the business heads and functional heads and they implement the decisions and the strategic policies of the Board of Directors.
Information supplied to the Board
In advance of each meeting, the Board is presented with relevant information on various matters related to the working of the Company, especially those that require deliberation at the highest level. Presentations are also made to the Board by different functional heads on important matters from time to time. Directors have separate and independent access to the officers of the Company. In addition to items required to be placed before the Board for its noting and/or approval, information is provided on various significant items.
2.1 Composition As on March 31, 2019 the Board of Directors of the Company consists of 8 (Eight) Directors of whom, 3 (Three) are ‘Executive’ Directors, 1 (One) is
Non-Executive Director, 4 (Four) are Independent Directors including one Woman Independent Director. There is no change in the Board of Directors since last Annual Report.
The Chairman, Mr. Naresh Chandra is a Non-Executive Director. Mr. Tarang Jain, Managing Director, Mr. Arjun Jain, Whole time Director and Mr. Ashwani Maheshwari, CEO & Whole-time Director are the Executive Directors.
The details of the Board of Directors as on March 31, 2019 are as follows:
Name of the Director Category of Director Particulars
Mr. Naresh Chandra(DIN 00027696)
Chairman, Non-Executive /Non-Independent
Appointed as Non-executive director effective from March 31,1997
Mr. Tarang Jain(DIN 00027505)
Managing Director,Executive/Non-Independent
Re-Appointed as Managing Director for 5 years effective from February 06, 2018
Mr. Arjun Jain(DIN 07228175)
Whole-time DirectorExecutive/ Non-Independent
Appointed as Director and Wholetime Director effective from August 07, 2018
Mr. Gautam Khandelwal(DIN 00270717)
Non-Executive/ Independent Appointed as an Independent Director for 3 years effective from July 20, 2017
Mrs. Vijaya Sampath(DIN 00641110)
Non-Executive/ Independent Appointed as an Independent Director for 3 years effective from July 20, 2017
Mr. Marc Szulewicz(DIN 01911768)
Non-Executive/ Independent Appointed as an Independent Director for 3 years effective from July 20, 2017
Mr. Vinish Kathuria(DIN 01951771)
Non-Executive/ Independent Appointed as an Independent Director for 3 years effective from February 06, 2018
Mr. Ashwani Maheshwari(DIN 07341295)
CEO & Whole-time DirectorExecutive/ Non-Independent
Re-appointed as Wholetime Director for 3 years effective from February 06, 2018- Appointed as CEO effective from April 01, 2018
Corporate Governance Report

Annual Report 2018-19 69
Corporate Governance Report
2.2 Details of Board Meetings, Annual General Meeting and attendance:
During the financial year ended on March 31, 2019, Eight (8) Board meetings were held on April 20, 2018; May 31, 2018; June 29, 2018; July 04, 2018; August 07, 2018; September 05, 2018; November 13, 2018 and February 08, 2019. The Annual General Meeting was held on September 05, 2018.
The Attendance of the Directors at the Board meetings and the Annual General Meeting during the year is given below:
Name of the DirectorNo. of Board Meetings Attendance at the AGM held on
Held Eligible to attend Attended September 05, 2018Held Eligible to attend Attended
Mr. Naresh Chandra 8 8 7 Yes
Mr. Tarang Jain 8 8 8 Yes
Mr. Arjun Jain# 8 4 4 Yes
Mr. Padmanabh Sinha$ 8 1 1 N.A.
Mr. Gautam Khandelwal 8 8 6 Yes
Mrs. Vijaya Sampath 8 8 4 No@
Mr. Marc Szulewicz 8 8 4 Yes
Mr. Vinish Kathuria 8 8 7 Yes
Mr. Ashwani Maheshwari 8 8 5 Yes Notes: @- Mrs. Vijaya Sampath had sought leave of absence, in advance, from attending the said meeting. $- Mr. Padmanabh Sinha resigned from the Company w.e.f May 28, 2018. #- Mr. Arjun Jain was appointed by the Board of Directors as an additional cum Wholetime Director w.e.f. August 07, 2018 and his appointment was
confirmed by the members of the Company at the Annual General Meeting held on September 05, 2018.
The Chief Financial Officer, who is a permanent invitee to the meetings of the Board of Directors, and the Company Secretary, who is the Secretary of the Board of Directors, have attended all meetings of the Board of Directors.
2.3 Directorships and Committee membership
None of the Directors on the Board is a member of more than 10 Committees and Chairman of more than 5 Committees as specified in Regulation 26 of SEBI (Listing Obligations and Disclosure Requirements) Regulations, 2015 across all listed companies in India of which they are a Director.
Independent Directors do not serve in more than 7 listed companies. None of the Independent Directors are wholetime directors in any listed Company hence the limitations mentioned in Regulation 25 of SEBI (Listing Obligations and Disclosure Requirements) Regulations, 2015 are not applicable.
Directorships (including names of listed Companies) and membership of Committees held by Directors as on March 31, 2019 are given below:
Name of the Director
No. of DirectorshipsHeld in PublicCompanies*
No. ofCommittees
of whichChairman@
No. ofCommittees
of whichMember
Names of Listed Company and Category of Directorship
Mr. Naresh Chandra 3 1 1 1. Varroc Engineering Limited, Non-Executive Director (Chairman)2. Hercules Hoists Limited, Non-Executive Director3. Endurance Technologies Limited, Non-Executive Director (Chairman)
Mr. Tarang Jain 1 - 1 1. Varroc Engineering Limited, Managing Director
Mr. Arjun Jain 1 - - 1. Varroc Engineering Limited, Whole-time Director
Mr. Gautam Khandelwal 3 2 6 1. Varroc Engineering Limited, Independent Director2. Nagpur Power and Industries Limited, Executive Director3. Informed Technologies India Limited, Executive Director
Mrs. Vijaya Sampath 8 1 7 1. Varroc Engineering Limited, Independent Director2. Safari Industries (India) Limited, Independent Director3. Suzlon Energy Limited, Independent Director4. Eris Lifesciences Limited, Independent Director5. Intellect Design Arena Limited, Independent Director6. Ingersoll Rand (India) Limited, Independent Director
Mr. Marc Szulewicz 1 - - 1. Varroc Engineering Limited, Independent Director
Mr. Vinish Kathuria 1 - 1 1. Varroc Engineering Limited, Independent Director
Mr. Ashwani Maheshwari 1 - 1 1. Varroc Engineering Limited, CEO & Wholetime Director
Note:* This excludes directorships in Private Companies, foreign companies and companies licensed under Section 8 of the Companies Act, 2013 /
Section 25 of the Companies Act, 1956. These include Directorship and Committee Membership of Varroc Engineering Limited.@ This relates to membership of Committees referred to in Regulation 26(1) of the SEBI LODR Regulations, viz. Audit Committee and Stakeholders
Relationship Committee of all public limited companies, whether listed or not and excludes private limited companies, foreign companies and companies licensed under Section 8 of the Companies Act, 2013 / Section 25 of the Companies Act, 1956.

70 Varroc Engineering Limited
2.4 Inter-se relationships among Directors Mr. Naresh Chandra-Chairman, Mr. Tarang Jain-Managing Director and Mr. Arjun Jain-Wholetime Director are family members and related to each
other as Grandfather, Father and Son. Mr. Ashwani Maheshwari, CEO & Whole-time Director is a professional executive. The Independent Directors are eminent industrialist and/or professionals having expertise in their respective field and bring with them the reputation of independent judgement and experience, which they exercise in decision making process. The Independent Directors satisfy the criteria of independence.
2.5 Shareholding of Directors and Key Managerial Personnel
Details of the shareholding of Directors and Key Managerial Personnel in the Company as on March 31, 2019 is as under:
Name of the Director/KMP Designation No. of shares held
Mr. Naresh Chandra* Chairman 1,00,00,000Mr. Tarang Jain Managing Director 6,07,29,800Mr. Tarang Jain$ 3,38,50,000Mr. Arjun Jain Wholetime Director 5,000Mr. Ashwani Maheshwari CEO and Wholetime Director 540Mrs. Vijaya Sampath Independent Director 703Mr. Marc Szulewicz Independent Director NilMr. Vinish Kathuria Independent Director NilMr. Gautam Khandelwal Independent Director NilMr. T. R. Srinivasan Chief Financial Officer 540Mr. Rakesh Darji Company Secretary 540
* Held by Naresh Chandra in his capacity as the trustee of Naresh Chandra Holdings Trust.$ Held by Tarang Jain in his capacity as the trustee of TJ Holdings Trust.
As on date of this report, no convertible instruments are outstanding in the Company.
2.6 Familiarization Programme for Independent Directors The Company has established a Familiarization Programme for Independent Directors. The discussions at various Board Meetings provide the Board
members with a realistic view of the Company’s businesses, the challenges and its potential. At the Board Meetings, the following aspects are presented to the Board:
• Nature of the industry in which the Company operates – detailed information on the industry trends, industry challenges, industry innovations vis-à-vis business operations, business plans and strategy are presented by the Managing Director, Chief Executive Officer and Gr. CFO. Business model of the Company including risks and challenges being faced by the Company;
• Changes in business environment and impact thereof on the working of the Company;• Strategic future outlook and way forward to achieve Company’s Vision.
To create awareness amongst the directors about recent regulatory changes, an eminent law firm was invited to give presentation on regulatory changes made in SEBI regulations, the Companies Act, 2013 and other allied corporate laws.
The framework together with the details of the Familiarization Programme conducted has been uploaded on the website of the Company. The web-link to this is http://www.varrocgroup.com/corporate_governance.
2.7 Key Board qualification, expertise and attributes
The Company’s Board comprises qualified members who bring in the required skills, competencies and expertise that allow them to make effective contribution to the Board and its committees.
The table below summarises the key skills/competencies and expertise identified by the Board in the context of its business and those actually available with the Board:
Leadership Extended leadership experience in organizations with demonstrated strengths in developing talents, fostering growth and bringing a positive change through alternative thinking
Global Business Experience in driving business success on global platform, with an understanding of diverse business environments, cultural differences and regulatory framework
Technology Background in technology with an ability to extend or create new business models, adopting state-of-the-art technology
Ethics & Corporate Governance To lead by example best ethical and Corporate Governance practices
Financial Proficiency in financial management, capital allocation and financial reporting process
Mergers and Acquisitions A history of leading growth through acquisitions and other business combinations, analyzing the strategic fit of target entity vis-à-vis Company’s vision and mission
Management & Business Excellence
Follow best management practices and working towards business & operational excellence and research and development of the niche products
Corporate Governance Report

Annual Report 2018-19 71
Corporate Governance Report
2.8 Details of the Director liable to retire by rotation
In compliance with the provisions of section 152 and other applicable provisions of the Companies Act, 2013, Mr. Naresh Chandra (DIN 00027696) will retire by rotation at the ensuing Annual General Meeting and it is proposed to re-appoint him as a Director of the Company. The personal information about Mr. Naresh Chandra is mentioned in the Notice convening the Annual General Meeting and therefore is not mentioned separately in this Report.
2.9 Code of Conduct The Code of Conduct adopted by the Board of Directors, is applicable to the Directors and all Senior Management Personnel of the Company. This
Code of Conduct emphasizes the Company’s commitment to the compliance with the highest standards of legal and ethical behaviour. The Code of Conduct is available on the website of the Company www.varrocgroup.com under heading ‘Investor’. All Directors, Key Managerial Personnel and senior management have adhered to the Code of Conduct of the Company during the year and have signed declarations and given affirmation of compliance to the Code of Conduct. A certificate signed by the CEO & Whole time Director as required under Regulation 34 (3) of SEBI (LODR) Regulations affirming compliance of said code is given in this Annual Report.
2.10 Independent Directors
Independent Directors play a key role in the governance processes of the Board and in shaping various strategic initiatives of the Company. These Directors are professionals, with expertise and experience in general corporate management, business, finance and information technology. This wide knowledge of their respective fields of expertise and best-in-class boardroom practices helps foster varied, unbiased, independent and experienced perspective and also prevent possible conflicts of interest that may emerge in such decision making.
Your Company has several subsidiaries, both in India and overseas. In order to leverage the experience of Independent Directors of the Company for the benefit of and for improved Corporate Governance and better reporting to the Board, some of the Independent Directors also serve on the Boards of material subsidiary companies.
An Independent Director is the Chairman of each of the Audit Committee, Nomination & Remuneration Committee and Stakeholders Relationship Committee.
None of the Independent Directors serve as “Independent Directors” in more than seven listed companies in line with the requirements of the SEBI LODR Regulations.
The Independent Directors have confirmed that they meet the criteria of independence as laid down under the Act and the SEBI LODR Regulations as amended. During the year under review, none of the independent directors has resigned.
2.11 Confirmation regarding independence of Independent Directors In the opinion of the Board, Independent Directors, fulfil the conditions specified in the SEBI LODR Regulations and are independent of the Management.
2.12 Pecuniary transactions with Non-executive Director
During the year under review, there were no pecuniary transactions with any of the Non-executive Director of the Company except payment of sitting fees and profit based commission and professional fees as disclosed in this report.
The register of contracts is maintained by the Company under Section 189 of the Act and the same is placed before the Board for approval from time to time. The register so placed before the Board is signed by all the directors present at such meetings.
2.13 Directors Remuneration
The Non-executive Directors are entitled to sitting fees for every meeting of the Board or Committee thereof attended by them. They are also entitled to commission not exceeding 1% of the net profits of the Company. The Managing Director and Wholetime Directors do not receive sitting fees for attending the meetings of the Board or any Committee thereof nor do they receive any commission on net profits. None of the Directors had any material pecuniary relationship or transaction with the Company during the year.
Details of remuneration paid to the Directors are given in MGT-9 which is available on company’s website on the link http://www.varrocgroup.com/shareholders_information#tab5.
The remuneration paid to the Managing Director and the Whole-time Director(s) was duly approved by the Board of Directors and members.
The Company has obtained Directors and Officers Liability Insurance Policy covering all Directors and Officers of the Company in respect of any legal action that might be initiated against any Director or Officer of the Company.
3. Committees of the Board
The Board of Directors have constituted the following Committees:3.1 Audit Committee3.2 Nomination and Remuneration Committee3.3 Stakeholders Relationship Committee3.4 Corporate Social Responsibility Committee3.5 Risk Management Committee3.6 Finance Committee
The composition, terms of reference, attendance and other details of these Committees are mentioned hereunder.
No voluntary recommendations were made by the aforesaid committees to the board.

72 Varroc Engineering Limited
3.1 Audit Committee
3.1.1 Constitution and Composition
The Audit Committee was constituted on February 06, 2018 in compliance with the provisions of Section 177 of the Companies Act, 2013 and Regulation 18(1) of SEBI (Listing Obligations and Disclosure Requirements) Regulations, 2015. The constitution of the Audit Committee as on March 31, 2019 is as follows:
Name of the Member Position in the Committee Category
Mr. Gautam Khandelwal Chairman Non – Executive, Independent Director
Mrs. Vijaya Sampath Member Non – Executive, Independent Director
Mr. Tarang Jain Member Managing Director, Executive Non-Independent
Mr. Vinish Kathuria* Member Non – Executive, Independent Director * Inducted as member w.e.f. November 13, 2018.
The Chief Financial Officer is permanent invitee in all meetings of the Audit Committee. The Company Secretary is the Secretary of the Audit Committee. All the Directors are financially literate, and Mr. Gautam Khandelwal, Mr Tarang Jain and Mrs. Vijaya Sampath have accounting and related financial management expertise. The Statutory Auditors and Internal Auditors are invited to the meetings to discuss with the Directors the scope of audit, their comments and recommendation on the accounts, records, risks, internal procedures and internal controls of the Company and to discuss the Internal Audit Reports. Minutes of the Audit Committee meetings are circulated to all the Directors and discussed at the Board meetings.
As per Regulation 18(a)(d) of the SEBI LODR Regulations, Mr. Gautam Khandelwal, Chairman of the Audit Committee was present at the last Annual General Meeting to answer Shareholders’ queries.
3.1.2 Terms of reference
The terms of reference of the Audit Committee cover all the areas mentioned under Section 177 of the Companies Act, 2013 and Regulation 18 read with Part C of Schedule II of SEBI (Listing Obligations and Disclosure Requirements) Regulations, 2015. The broad terms of reference of the Audit Committee therefore include review of all financial results, statements and disclosures and recommend the same to the Board, review the internal audit reports and discuss the same with the internal auditors, review internal control systems and procedures, evaluation of internal financial controls and risk management systems and their effectiveness, to meet the statutory auditors and discuss their findings, their scope of audit, post audit discussion, auditor’s independence, adequacy of internal audit functions, audit qualifications, if any, appointment/removal and remuneration of auditors, changes in accounting policies and practices, if any, and disclosure of all related party transactions and compliance with company law and other statutory provisions.
3.1.3 Internal Audit The Internal Audit Department of the Company conducts internal audit on a pan India basis and is also supported by external agency in some of the
areas of internal audit. The Chief Internal Auditor presents his report to the Audit Committee on quarterly basis.
3.1.4 Attendance During the financial year 2018-19, 6 (Six) meetings of the Audit Committee were held on April 20, 2018; May 31, 2018; August 07, 2018; September
05, 2018; November 13, 2018 and February 08, 2019. The Attendance of the committee members at these Audit Committee meetings is given below:
Name of the MemberNo. of Meetings
Held Eligible to attend Attended
Mr. Gautam Khandelwal 6 6 6
Mrs. Vijaya Sampath 6 6 5
Mr. Tarang Jain 6 6 6
Mr. Vinish Kathuria 6 1 1 It can be seen from the above table that the frequency of the Committee Meetings was more than the minimum limit prescribed under applicable
regulatory requirements and the gap between two Committee Meetings was not more than one hundred and twenty days.
The Minutes of the Meeting of the Audit Committee are discussed and noted by the Board of Directors at the subsequent Board Meeting.
The functional / business representatives also attend the committee meetings periodically and provide such information and clarifications as required by the committee members, which gives a deeper insight into the respective business and functional areas of operations. The Cost Auditors and the Statutory Auditors attend the Audit Committee Meetings for their respective agenda items relating to Cost Audit Report and Limited Review Report on Quarterly Financial Results. Mr T. R. Srinivasan, Chief Financial Officer and Mr. Rakes Darji, Company Secretary had attended all committee meetings.
3.2 Nomination and Remuneration Committee
3.2.1 Constitution and Composition The Nomination and Remuneration Committee was constituted on February 06, 2018 in compliance with the provisions of section 178 of the
Companies Act, 2013 and Regulation 19(1) of SEBI (Listing Obligations and Disclosure Requirements) Regulations, 2015. The constitution of the
Corporate Governance Report

Annual Report 2018-19 73
Corporate Governance Report
Nomination and Remuneration Committee as on March 31, 2019 is as follows:
Name of the Member Position in the Committee Category
Mr. Gautam Khandelwal Chairman Non – Executive, Independent Director
Mrs. Vijaya Sampath Member Non – Executive, Independent Director
Mr. Marc Szulewicz Member Non – Executive, Independent Director
3.2.2 Terms of Reference
The terms of reference of the Nomination and Remuneration Committee cover all the areas mentioned under Section 178 of the Companies Act, 2013 and Regulation 19 (4) of SEBI (Listing Obligations and Disclosure Requirements) Regulations, 2015. The broad terms of reference of the Nomination and Remuneration Committee therefore include analysing, monitoring and reviewing various human resource and compensation matters; remuneration and employment terms of wholetime directors and senior management personnel, adherence to and review of the remuneration/employment policy as approved by the Board of Directors, formulating the criteria and identify persons who may be appointed as directors or senior management of the Company, preliminary evaluation of every Director’s performance, Board diversity, compliance of the Code for Independent Directors referred to in Schedule IV of the Companies Act, 2013, compliance with the Company’s Code of Conduct by Directors and Senior Management of the Company, reporting non-compliances to the Board of Directors and any other matters which the Board of Directors may direct and/or are statutorily prescribed from time to time.
3.2.3 Attendance
During the financial year ended on March 31, 2019, two meetings of the Nomination and Remuneration Committee were held on April 20, 2018 and November 13, 2018. The Attendance of the Directors at these Committee meetings is given below:
Name of the MemberNo. of Meetings
Held Eligible to attend Attended
Mr. Gautam Khandelwal 2 2 1
Mrs. Vijaya Sampath 2 2 2
Mr. Marc Szulewicz 2 2 2
Mr T. R. Srinivasan, Chief Financial Officer and Mr. Rakes Darji, Company Secretary had attended all these committee meetings. As per Regulation 19(3) of the SEBI LODR Regulations, Mr. Gautam Khandelwal, Chairman of the Nomination and Remuneration committee was
present at the last Annual General Meeting to answer shareholders’ queries.
3.2.4 Performance Evaluation of Directors
Pursuant to the provisions of the Companies Act, 2013 and SEBI LODR Regulations, 2015, the Board has carried out an annual performance evaluation of its own performance, and that of its Committees, Chairperson and Directors. The manner in which such formal annual evaluation was made by the Board during the year 2018-19 is given below:
• Performance evaluation criteria for Board, Committees of the Board and Directors as approved by the Board at its meeting held on February 06, 2018 were revised on recommendation of independent director, in line with SEBI’s Guidance Note dated January 5, 2017 on Board Evaluation, by the Board at its meeting held on November 13, 2018 and the same were placed on the Company’s website www.varrocgroup.com.
• Based on the said revised criteria, rating sheets were filled by each of the directors towards the end of the year with regard to evaluation of the performance of the Board, its Committees, Chairperson and Directors (except for the director being evaluated) for the year under review.
• A consolidated summary of the ratings given by each of the directors was then prepared, based on which a report of performance evaluation was prepared by the CHRO in respect of the performance of the Board, its Committees, Chairperson and Directors during the year under review.
• The report of performance evaluation so arrived at was then noted and discussed by the Nomination and Remuneration Committee and the Board at their meetings held on April 03, 2019.
The directors have received briefings and updates on key financial, legal and governance matters. The Independent Directors have ensured governance and good conduct, adherence to laws, mitigating risks and growth. The evaluation covered overall performance of the Board and its Committees, individual reviews of each Director and analysis of the performance the Chairman. The evaluation concluded that the Board remained of high caliber and was functioning well, with open and challenging debate and transparent information flow. Assessment of individual Directors concluded that they contributed effectively and proactively in debates at all meetings and devoted adequate time. Committees have also operated effectively.
3.2.5 The Terms and Conditions of appointment of Independent Directors are available on the website of the Company www.varrocgroup.com under heading Investor/Corporate Governance.
3.3 Stakeholders Relationship Committee
3.3.1 Constitution and Composition The Stakeholders Relationship Committee was constituted on February 06, 2018 in compliance with the provisions of section 178 of the Companies
Act, 2013 and Regulation 20 of SEBI (Listing Obligations and Disclosure Requirements) Regulations, 2015.

74 Varroc Engineering Limited
The constitution of the Stakeholders Relationship Committee as on March 31, 2019 is as follows:
Name of the Member Position in the Committee Category
Mr. Gautam Khandelwal Chairman Non – Executive, Independent DirectorMrs. Vijaya Sampath Member Non – Executive, Independent DirectorMr. Ashwani Maheshwari Member CEO & Wholetime Director
3.3.2 Terms of Reference
The terms of reference of the Stakeholders Relationship Committee cover all the areas mentioned under Section 178 of the Companies Act, 2013 and Regulation 20 of SEBI (Listing Obligations and Disclosure Requirements) Regulations, 2015. The broad terms of reference of the Stakeholders Relationship Committee therefore include redressal of grievances of shareholders, debenture holders and other security holders, analyze reports received periodically from the Registrar and the Share Transfer Agent (“RTA”), Allotment of shares, approval of transfer or transmission of shares, debentures or any other securities and dividend related matters.
3.3.3 Attendance
During the financial year ended on March 31, 2019, no meeting of the Stakeholders relationship Committee was held.
Mr. Gautam Khandelwal, Chairman of the committee was present at the last Annual Genaral Meeting to answer security holders queries.
3.3.4 Compliance Officer The Company Secretary is the Secretary of this Committee and his contact details are given below:
The Complaince Officer. Varroc Engineering LimitedRegd. Office: Plot No. L-4, MIDC, Waluj, Aurangabad – 431136, Maharashtra, IndiaPhone : (0240) 6653700 Fax : (0240) 2564540Email : [email protected]
3.3.5 Pledge of shares No pledge has been created over the Equity Shares held by the Promoters as on March 31, 2019.
3.3.6 Details of Complaints from Shareholders
No. of complaints remaining unresolved as on April 1, 2018 NANo. of complaints received during the year 11No. of complaints resolved during the year 11No. of complaints unresolved as on March 31, 2019 0
The Company did not receive any complaints from other Security holders during the year.
The Registrar and Share Transfer Agents (RTA), M/s. Link Intime India Private Limited, attend to all grievances of shareholders received directly or through SEBI, Stock Exchanges or the Ministry of Corporate Affairs. Most of the grievances/correspondences are attended within a period of 7 days from the date of receipt of such grievances.
The Company maintains continuous interaction with the RTA and takes proactive steps and actions for resolving shareholder complaints/queries.
Likewise, the Company also has regular interaction with the Debenture Trustees to ascertain the grievances, if any, of the Debenture holders.
3.4 Corporate Social Responsibility Committee
3.4.1 Constitution and Composition The Corporate Social Responsibility Committee was constituted on April 07, 2014 in compliance with the provisions of Section 135 of the Companies Act, 2013.
The constitution of the Corporate Social Responsibility Committee as on March 31, 2019 is as follows:
Name of the Member Position in the Committee Category
Mr. Tarang Jain Member Managing Director Mr. Gautam Khandelwal Member Non – Executive, Independent Director Mr. Ashwani Maheshwari* Member CEO & Wholetime Director
* Inducted as member w.e.f. August 07, 2018
3.4.2 Terms of Reference
The terms of reference of this Committee is to comply with the requirements of section 135 of the Companies Act, 2013, the Companies (Corporate
Corporate Governance Report

Annual Report 2018-19 75
Corporate Governance Report
Social Responsibility Policy) Rules, 2014 and all other relevant compliances. Corporate Social Responsibility Policy is available on the Company’s website www.varrocgroup.com/ Investor/Corporate Governance.
3.4.3 Attendance During the financial year ended on March 31, 2019, 3 (Three) meetings of the Corporate Social Responsibility Committee were held on April 20,
2018; August 07, 2018 and February 08, 2019. The Attendance of the Directors at these Committee meetings is given below:
Name of the MemberNo. of Meetings
Held Eligible to attend AttendedMr. Tarang Jain 3 3 3
Mr. Gautam Khandelwal 3 3 2
Mr. Ashwani Maheshwari 3 2 2
Mr. Padmanabh Sinha (Resigned w.e.f. May 28, 2018) 3 1 1
3.5 Risk Management Committee
3.5.1 Constitution and Composition The Risk Management Committee was constituted on April 03, 2019, in compliance with the provisions of Regulation 21 of SEBI (Listing Obligations and
Disclosure Requirements) Regulations, 2015.
The constitution of the Risk Management Committee is as follows:
Name of Member Position in the Committee Category
Mrs. Vijaya Sampath Chairperson Non – Executive, Independent Director
Mr. Vinish Kathuria Member Non – Executive, Independent Director
Mr. Tarang Jain Member Managing Director
Mr. Ashwani Maheshwari Member CEO & Whole time Director
Mr. T. R. Srinivasan Member Group CFO
Mr. Lalit Dua Member and Convener Head Internal Audit The Company Secretary is the Secretary to the Risk Management Committee.
3.5.2. Terms of Reference
The Risk Management Committee shall be responsible for, among other things and as may be required by the stock exchanges from time to time, the following:
a. the adequacy of the Company’s processes for managing risk;b. the policies and procedure that have been established and implemented to identify, assess, monitor and manage material business risks
including cyber security; c. any incident involving fraud or other break down of the Company’s internal control; d. formulate an action plan to address areas of identified risk and monitor implementation programs;e. review and make recommendations on the strategic direction, objectives and effectiveness of the Company’s risk management policies;f. review the Company’s insurance program, having regard to the Company’s business and the insurable risks associated with its business; andg. perform such other functions as may be delegated by the Board of Directors and/or are statutorily prescribed under any law to be attended to
by such committee. Further, the powers, role, functions, terms and the responsibilities including requirement of reviewing certain information, vested in the Risk
Management Committee would stand enhanced, reduced or otherwise modified to the extent as may be notified under any statute or applicable rules and regulations from time to time.
3.5.3 Attendance
Since, the Risk Management Committee was constituted on April 03, 2019, no meeting of the Risk Management Committee was held during the financial year ended on March 31, 2019.
3.6 Finance Committee
3.6.1 Constitution and Composition The Finance Committee was constituted on February 06, 2018. The constitution of the Finance Committee as on March 31, 2019 is as follows:
Name of the Member Position in the Committee Category
Mr. Naresh Chandra Chairman Non – Executive Director Mr. Tarang Jain Member Managing Director Mr. Ashwani Maheshwari Member CEO & Wholetime Director
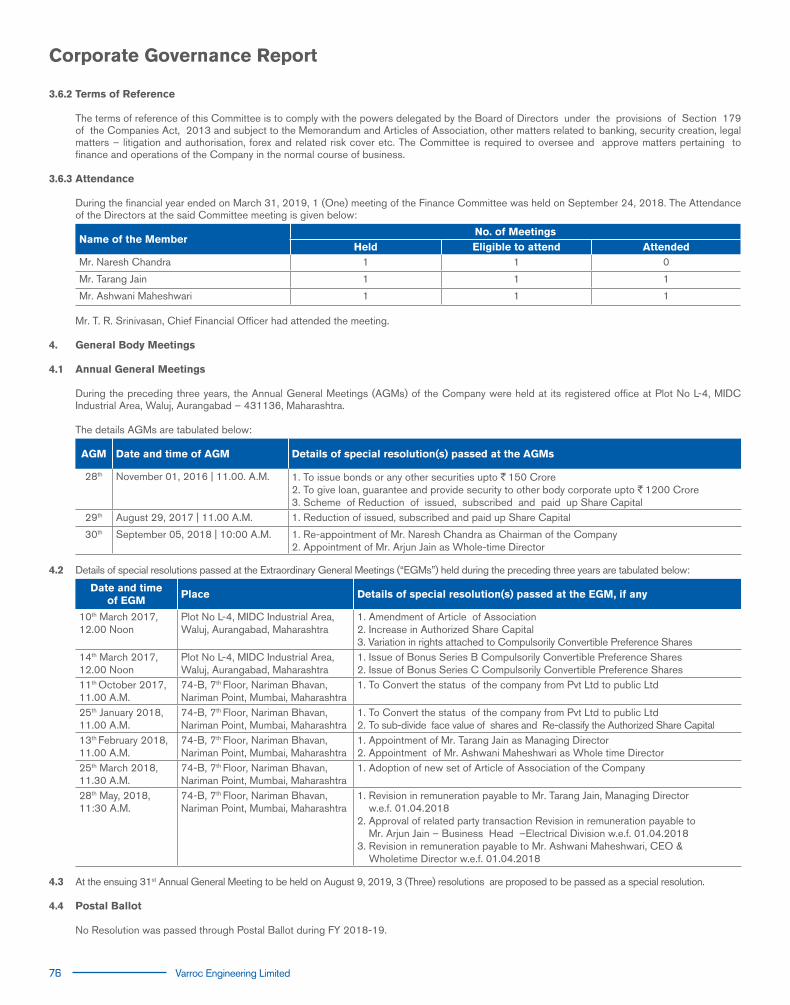
76 Varroc Engineering Limited
3.6.2 Terms of Reference
The terms of reference of this Committee is to comply with the powers delegated by the Board of Directors under the provisions of Section 179 of the Companies Act, 2013 and subject to the Memorandum and Articles of Association, other matters related to banking, security creation, legal matters – litigation and authorisation, forex and related risk cover etc. The Committee is required to oversee and approve matters pertaining to finance and operations of the Company in the normal course of business.
3.6.3 Attendance
During the financial year ended on March 31, 2019, 1 (One) meeting of the Finance Committee was held on September 24, 2018. The Attendance of the Directors at the said Committee meeting is given below:
Name of the MemberNo. of Meetings
Held Eligible to attend AttendedMr. Naresh Chandra 1 1 0
Mr. Tarang Jain 1 1 1
Mr. Ashwani Maheshwari 1 1 1
Mr. T. R. Srinivasan, Chief Financial Officer had attended the meeting.
4. General Body Meetings
4.1 Annual General Meetings
During the preceding three years, the Annual General Meetings (AGMs) of the Company were held at its registered office at Plot No L-4, MIDC Industrial Area, Waluj, Aurangabad – 431136, Maharashtra.
The details AGMs are tabulated below:
AGM Date and time of AGM Details of special resolution(s) passed at the AGMs
28th November 01, 2016 | 11.00. A.M. 1. To issue bonds or any other securities upto `150 Crore2. To give loan, guarantee and provide security to other body corporate upto `1200 Crore3. Scheme of Reduction of issued, subscribed and paid up Share Capital
29th August 29, 2017 | 11.00 A.M. 1. Reduction of issued, subscribed and paid up Share Capital
30th September 05, 2018 | 10:00 A.M. 1. Re-appointment of Mr. Naresh Chandra as Chairman of the Company2. Appointment of Mr. Arjun Jain as Whole-time Director
4.2 Details of special resolutions passed at the Extraordinary General Meetings (“EGMs”) held during the preceding three years are tabulated below:
Date and timeof EGM
Place Details of special resolution(s) passed at the EGM, if any
10th March 2017,12.00 Noon
Plot No L-4, MIDC Industrial Area, Waluj, Aurangabad, Maharashtra
1. Amendment of Article of Association2. Increase in Authorized Share Capital3. Variation in rights attached to Compulsorily Convertible Preference Shares
14th March 2017,12.00 Noon
Plot No L-4, MIDC Industrial Area, Waluj, Aurangabad, Maharashtra
1. Issue of Bonus Series B Compulsorily Convertible Preference Shares2. Issue of Bonus Series C Compulsorily Convertible Preference Shares
11th October 2017, 11.00 A.M.
74-B, 7th Floor, Nariman Bhavan, Nariman Point, Mumbai, Maharashtra
1. To Convert the status of the company from Pvt Ltd to public Ltd
25th January 2018, 11.00 A.M.
74-B, 7th Floor, Nariman Bhavan, Nariman Point, Mumbai, Maharashtra
1. To Convert the status of the company from Pvt Ltd to public Ltd2. To sub-divide face value of shares and Re-classify the Authorized Share Capital
13th February 2018, 11.00 A.M.
74-B, 7th Floor, Nariman Bhavan, Nariman Point, Mumbai, Maharashtra
1. Appointment of Mr. Tarang Jain as Managing Director2. Appointment of Mr. Ashwani Maheshwari as Whole time Director
25th March 2018, 11.30 A.M.
74-B, 7th Floor, Nariman Bhavan, Nariman Point, Mumbai, Maharashtra
1. Adoption of new set of Article of Association of the Company
28th May, 2018, 11:30 A.M.
74-B, 7th Floor, Nariman Bhavan, Nariman Point, Mumbai, Maharashtra
1. Revision in remuneration payable to Mr. Tarang Jain, Managing Director w.e.f. 01.04.20182. Approval of related party transaction Revision in remuneration payable to Mr. Arjun Jain – Business Head –Electrical Division w.e.f. 01.04.20183. Revision in remuneration payable to Mr. Ashwani Maheshwari, CEO & Wholetime Director w.e.f. 01.04.2018
4.3 At the ensuing 31st Annual General Meeting to be held on August 9, 2019, 3 (Three) resolutions are proposed to be passed as a special resolution.
4.4 Postal Ballot No Resolution was passed through Postal Ballot during FY 2018-19.
Corporate Governance Report

Annual Report 2018-19 77
Corporate Governance Report
5. Means of Communication The company got listed on Stock Exchanges i.e. National Stock Exchange and Bombay Stock Exchange on July 6, 2018. The Company
recognizes the importance of two-way communication with shareholders and of giving a balanced reporting of results and progress and responds to questions and issues raised in a timely and consistent manner. Shareholders seeking information may contact the Company directly throughout the year. They also have an opportunity to ask questions in person at the Annual General Meeting.
Some of the modes of communication are mentioned below:
A. Quarterly Results
The approved financial results are forthwith sent to the Stock Exchanges where the shares are listed and are displayed on the Company’s website www.varrocgroup.com and are generally published in The Financial Express/ Business Standard (all editions) (English) and Loksatta (Marathi), within forty eight hours of approval thereof.
B. Presentations
Presentations made to the institutional investors/analysts are intimated to the Stock Exchanges within the prescribed time period under the SEBI LODR Regulations and are simultaneously hosted on the website.
C. Website
The Company’s website www.varrocgroup.com contains a separate dedicated section for Investors, the link to which is www.varrocgroup.com/investor wherein all information and relevant policies to be provided under applicable regulatory requirements, are available in a user friendly form.
D. Annual Report
The Annual Report containing inter-alia the Auditors’ Report, Audited Standalone and Consolidated Financial Statements, Board’s Report, Management Discussion and Analysis Report, Corporate Governance Report and other important information is circulated to Members and others entitled thereto. The Annual Report is also posted on the website of the Company.
E. Designated Exclusive Email ID
The Company has designated the Email ID [email protected] exclusively for investor servicing. This Email ID has been displayed on the Company’s website www.varrocgroup.com
6. General Shareholder Information
6.1 Date, time & venue of the Annual General Meeting:
The date, time and venue of the 31st Annual General Meeting of the Company is as under:
Date: August 9, 2019 Time: 10:00 A.M.Venue: Auditorium Hall, Plot No L-4, MIDC Industrial Area, Waluj, Aurangabad - 431136
6.2 Financial year The financial year of the Company starts on April 1 and ends on March 31 of next year.
6.3 Record Date and Cut Off Date:
6.3.1 The Record Date for determining shareholders who will be entitled to receive dividend to be declared at the ensuing Annual General Meeting is August 9, 2019.
6.3.2 Cut Off Date for determining shareholders who will be entitled to vote electronically on the resolutions mentioned in the Notice convening the Annual General Meeting by remote e-Voting and also vote at the meeting venue is August 2, 2019.
6.4 Electronic Voting
6.4.1 Pursuant to section 108 and other applicable provisions of the Companies Act, 2013 read with the Companies (Management and Administration) Rules, 2014 and other applicable requirements, voting at the 31st Annual General Meeting will be made through electronic voting. The electronic voting (“E-Voting”) period will be from 9.00 a.m. on August 5, 2019 to 5.00 p.m. on August 8, 2019, both days inclusive.
6.4.2 The following special resolution(s) are proposed to be conducted through electronic voting for:
(1) To Increase borrowing limits of the Company
(2) Creation of Mortgage/Charge on the assets of the Company
(3) Increase in the limits applicable for making investments / extending loans and giving guarantees or providing securities in connection with loans to Persons / Bodies Corporate

78 Varroc Engineering Limited
6.4.3 Scrutiniser for electronic voting: Mrs. Uma Lodha, Proprietor of Uma Lodha & Co, Practicing Company Secretaries (Membership No. 5363 and C.P. No.2593) having office at Suite No. 507, 5th Floor, Highway Commercial Centre, I.B Patel Road, Goregaon East, Mumbai-400063 [Phone: (022) 40131001/ 40131002 Email : [email protected]] has been appointed as the Scrutiniser to scrutinise the electronic voting process and the voting at the venue of the Annual General Meeting in a fair and transparent manner and to give her report to the Chairman.
6.5 Dividend payment date: Dividend at the rate of `4 per share of nominal value `1/- each has been recommended by the Board of Directors for the year ended on March 31, 2019, subject to the approval from the Members at the ensuing Annual General Meeting. If dividend is declared at the Annual General Meeting, the dividend will be deposited with the Bank on or before August 13, 2019 and payment of dividend will be made within 30 days from the date of declaration.
6.6 Listing on Stock Exchanges: The Company has listed its equity shares at the following Stock Exchanges on July 06, 2018 with the ISIN INE665L01035:
Sr No. Name Address Stock Code
1 BSE Limited (BSE) 1st Floor, Phiroze Jeejeebhoy Towers, Dalal Street, Mumbai 400 001 541578
2 National Stock Exchange of India Limited (NSE) Exchange Plaza, Bandra-Kurla Complex, Bandra (E), Mumbai 400 051 VARROC
Annual Listing Fees for FY 2019-20 has been paid and all requirements of the stock exchanges where the shares of the Company are listed, including submission of quarterly reports and certificates, were complied with.
6.7 Market Price Data The Company got listed on Stock Exchanges i.e. National Stock Exchange and Bombay Stock Exchange on July 6, 2018.
High, Low and closing price of the Company’s Equity Shares during each month of the last financial year 2018-19 at BSE and NSE are given below:
MonthBSE NSE
High (`) Low (`) High (`) Low (`)
July, 2018 1062.00 931.70 1061.65 931.10
August, 2018 1170.00 958.15 1170.10 960.00
September, 2018 1177.45 811.00 1178.70 812.20
October, 2018 911.10 685.00 915.00 682.70
November, 2018 860.00 698.25 852.95 700.00
December, 2018 736.45 631.80 739.90 636.30
January, 2019 750.00 623.40 746.90 627.05
February, 2019 658.00 565.30 660.05 565.25
March, 2019 666.35 578.50 663.95 575.05
Stock Performance vs S&P BSE Sensex and NIFTY 500
Performance of the Company’s Equity Shares on BSE Limited (“BSE”) and National Stock Exchange of India Limited (“NSE”) relative to the BSE Sensex and NIFTY 500 respectively are graphically represented in the charts below:
Liquidity
The shares of the Company are actively traded on BSE and NSE ensuring good liquidity for the investors.
6.8 Registrar to the Issue and Share Transfer Agent The Company vide Agreement dated March 9, 2018 has appointed the following agency to act as its Registrar and Share Transfer Agent (“RTA”).
The RTA is, inter alia, responsible for processing of requests pertaining to share transfers/ transmission/ dematerialisation/ rematerialisation and other activities related thereto for both electronic and physical shareholdings. Further, RTA also handles corporate actions such as data requirements for conduct of AGMs, dividends etc. The RTA corresponds with the depositories viz. National Securities Depository Limited (NSDL) and Central Depository Services (India) Limited (CDSL) in this regard.
Corporate Governance Report
BSE Sensex Vs Varroc Share Price
Sha
re P
rice
Jul-18 Aug-18 Sep-18 Oct-18 Nov-18 Dec-18 Jan-19 Feb-19 Mar-19
140012001000800600400200
0
3900038000370003600035000340003300032000
Month and YearClosing Price BSE Sensex
Month and YearClosing Price NSE Nifty 500
1400 10200
1200 10000
10009800
800
9400
600
9200
400
900088008600840082008000
200
0Jul-18 Aug-18 Sep-18 Oct-18 Nov-18 Dec-18 Jan-19 Feb-19 Mar-19
NIFTY 500 Vs Varroc Share Price
Sha
re P
rice

Annual Report 2018-19 79
Corporate Governance Report
Link Intime India Private Limited C 101, 247 Park, L B S Marg, Vikhroli West, Mumbai 400 083 Contact Person: Mrs. Shanti Gopalkrishnan E-mail: [email protected] No: +91 22 49186000 Fax: +91 22 49186060 SEBI Registration No.: INR000004058
6.9 Share Transfer System The entire share capital of the company is in dematerialised form. The shares can be transferred by shareholders through their Depository Participants.
6.10 Distribution of Shareholding as on March 31, 2019
No. of Shares held No. of shareholders% to total no. of
shareholdersNo. of shares
% to total no. ofshares
1 - 500 46,791 98.86 1,282,042 0.95
501 - 1000 200 0.43 149,716 0.11
1001 - 2000 141 0.30 210,737 0.16
2001 - 3000 49 0.10 123,799 0.09
3001 - 4000 25 0.05 85,128 0.06
4001 - 5000 17 0.03 81,764 0.06
5001 - 10000 31 0.06 214,312 0.16
Above - 10001 81 0.17 132,664,032 98.41
Total 47,335 100.00 134,811,530 100.00
The below two tables provide details about the pattern of shareholding among various categories and number of shares held, as on March 31, 2019.
Equity Shares
Category Category of shareholderNo. of fully paid up equity shares held
%
(A) Promoter & Promoter Group 114,589,800 85.00
(B) Public 20,221,730 15.00
Institutions:
Mutual Funds 6,928,867 5.15
Alternate Investment Funds 815,220 0.60
Foreign Portfolio Investors 9,126,496 6.77
Financial Institutions/Banks 24,141 0.02
Non-Institutions:
Individuals 1,941,881 1.44
NBFCs registered with RBI 20,009 0.01
Others:
Trusts 103,425 0.08
HUF 101,552 0.08
NRIs 128,028 0.09
Clearing Members 45,517 0.03
Bodies Corporate 986,594 0.73
(C) Non-Promoter – Non-Public
(C1) Shares Underlying DRs 0 0.00
(C2) Shares Held by Employee Trust 0 0.00
Total 134,811,530 100.00
6.11.1 Demat/Remat of shares During the year, the RTA had received one request for rematerialisation of 1 equity share. Subsequently, the said rematerialized share has been dematerialised. The Company’s shares are compulsorily traded in dematerialised form. The Company has arrangements with National Securities Depository Limited
(NSDL) and Central Depository Services (India) Limited (CDSL) for demat facility.

80 Varroc Engineering Limited
Corporate Governance Report
As at March 31, 2019, 100% Shares of the Company are held in demat form.
Particulars Position as on March 31, 2019
No. of shares % to total shareholding
Physical 0 0.00
Dematerialised
NSDL 133,979,719 99.38
CDSL 831,811 0.62
Total 134,811,530 100.00
6.11.2 Convertible Instruments
As on March 31, 2019, there are no convertible instruments outstanding in the Company.
6.11.3 Foreign exchange risk and hedging activities The Company is exposed to foreign exchange risk with respect to foreign currencies, denominated mainly in Euro and US dollars, on revenue and supplies.
However, the risk is naturally hedged as the Company is engaged both in imports and exports and is used to take future cover as the situation so warrants.
6.11.4 Plant Location The details of manufacturing plants are provided separately in Coroporate information section of the Annual Report.
6.11.5 Address for correspondence Investors and shareholders can correspond with the RTA (for share transfer/ dematerialisation/ change of address etc) or at Registered office (for
general correspondence) at the following address:
Registrar and Transfer Agent Company
Link Intime India Private LimitedC 101, 247 Park, L B S Marg, Vikhroli West, Mumbai 400 083
For requests pertaining to dematerialisation / rematerialisation:
Contact person: Mrs. Shanti GopalkrishnanTel No: +91 22 49186000 Fax: +91 22 49186060E-mail: [email protected]
Varroc Engineering LimitedRegistered Office: Plot No. L-4,MIDC Industrial Area, Waluj,Aurangabad – 431136, Maharashtra
Contact person: Mr. Rakesh Darji, Company Secretary and Compliance Officer
Telephone: +91 (240) 6653700Facsimile: +91 (240) 2564540 E-mail: [email protected]
6.12 Transfers during the year to the Investor Education and Protection Fund (IEPF) and Unclaimed Dividend to be transferred to IEPF: The Company does not have any amount of unclaimed dividend to be transferred to Investor Education and Protection Fund (IEPF).
6.13 Unclaimed Shares As on March 31, 2019, there were no shares of any shareholder lying unclaimed with the Company or lying in the suspense account. The disclosure
required to be given under Regulation 34(3) read with Clause F of Schedule V of SEBI (Listing Obligations and Disclosure Requirements) Regulations, 2015 are therefore not applicable.
7. Other Disclosures
a) Related party transactions
During the year, as required under Section 177 of the Act and Regulation 23 of the SEBI LODR Regulations, all RPTs were placed before Audit Committee for approval. A statement tabulating the value and nature of transactions with related parties as required under Accounting Standard 18 (Ind AS 24) is set out separately under Note no. 47 to the financial statements in this Annual Report.
During the year, there were no material transactions entered into with related parties, which may have had any potential conflict with the interests of the Company.
The Policy on determining materiality of and dealing with Related Party Transactions’ is placed on Company’s website at http://www.varrocgroup.com/corporate_governance.
b) Details of Capital Market Non-Compliance, if any
The Company has listed its equity shares on stock exchanges with effect from July 6, 2018. There has been no non-compliance by the Company of any legal requirements; nor has there been any penalty/stricture imposed on the Company by any stock exchange, SEBI or any other statutory authority on any matter related to capital markets.
Annual Report 2018-19 81
c) Whistle Blower Policy/Vigil mechanism Pursuant to Section 177(9) of the Act, the Board at its meeting held on April 7, 2014, adopted the Whistle Blower Policy. The Whistle
Blower Policy includes vigil mechanism as mandated under the SEBI LODR Regulations and provides a mechanism for director/employee to report violations, any unethical behaviour, suspected or actual fraud, violation of the Code of Conduct etc. which could be detrimental to the organisation’s interest. The mechanism protects whistle blower from any kind of discrimination, harassment, victimisation or any other unfair employment practice. The Company affirms that no employee has been denied access to the Audit Committee.
The said Policy is amended from time to time and is also placed on the Company’s website at http://www.varrocgroup.com/corporate_governance.
d) Disclosure of material transactions In terms of Regulation 26(5) of the SEBI LODR Regulations, Senior Management has made disclosure to the Board relating to all material
financial and commercial transactions, if any, where they had personal interest that might have been in potential conflict with the interest of the Company. Based on disclosures received, none of the officials in senior management team of the Company have personal interest in any financial or commercial transactions that may have potential conflict with the interest of the Company.
e) Disclosures of the Compliance with corporate governance under Regulations 17 to 27 of the SEBI LODR Regulations except those which are already disclosed elsewhere in this report:
i. Orderly succession to Board and Senior Management The Board had satisfied itself that in the event of a requirement for addition/succession at the Board level or in the Senior Management,
there is a process in place.
ii. Information supplied to the Board
The Board is presented with relevant information on various matters related to the working of the Company, especially those which are critical and require deliberation for arriving at a decision or for resolving an issue. Presentations are also made to the Board by CEO and different function heads on important matters from time to time. In addition to the items which are required to be placed before the Board for its noting and/or approval, information is properly provided on various significant matters.
In terms of quality and importance, the information supplied by the management to the Board of Directors of the Company is precise and
provided with relevant details that is necessary for the directors to enable them to fulfil their duties. The Independent Directors of the Company expressed satisfaction on the quality, quantity and timeliness of flow of information between the Company management and the Board that is necessary for the Board to effectively and reasonably perform their duties.
iii. Compliance Certificate The CEO and Wholetime Director and Group Chief Financial Officer have certified to the Board with regard to the financial statements
and other matters as required under Regulation 17(8), read with Part B of Schedule II to the SEBI LODR Regulations and the same is given in this Annual Report.
iv. Report on Corporate Governance
This section, read together with the information given in the Board’s Report, Management Discussion and Analysis section and General Shareholder Information, constitute the compliance report on Corporate Governance during the year. The company submits the quarterly compliance report on regular basis to the stock exchanges as required under Regulation 27 of the SEBI LODR Regulations.
v. Certificate from Practicing Company Secretary on compliance of Corporate Governance conditions
The Company has obtained the Certificate from a Practicing Company Secretary regarding compliance with the provisions relating to corporate governance laid down in Part E of Schedule V to the SEBI LODR Regulations along with Certificate to the effect that none of the Directors of the Company have been debarred or disqualified from being appointed or continuing as Director of companies by the Securities and Exchange Board of India, Ministry of Corporate Affairs, or any such other Statutory Authority.
These Certificate(s) are annexed to the Board’s Report and will be sent to the stock exchanges, along with the Annual Report to be
filed by the Company.
Corporate Governance Report
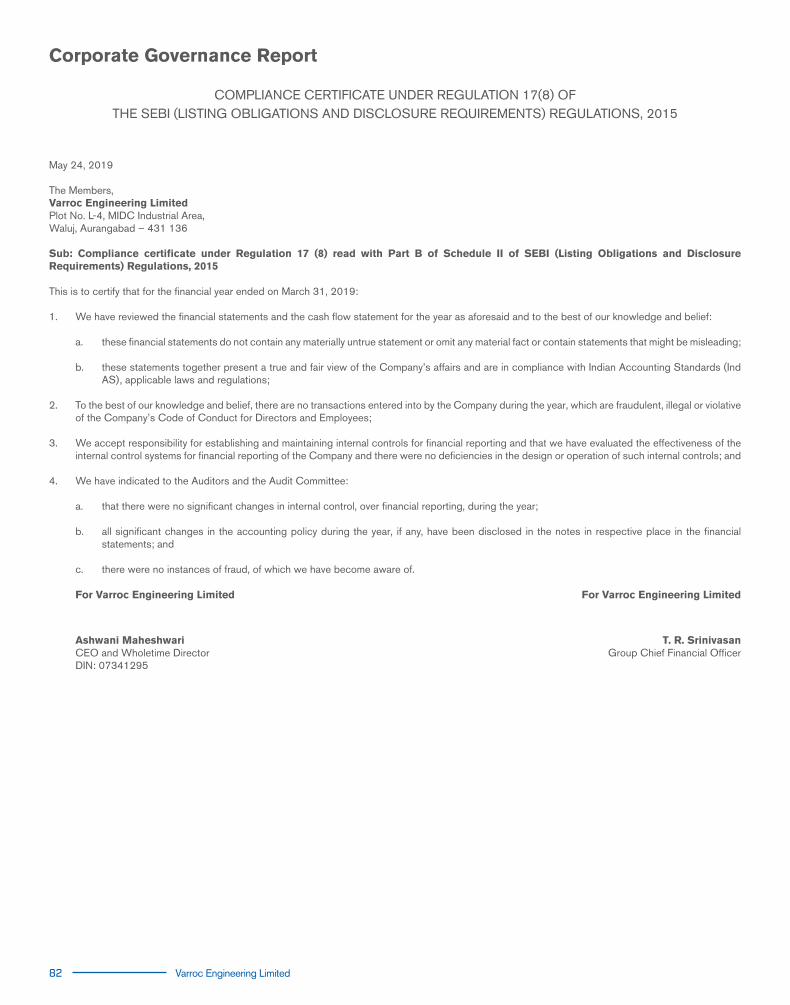
82 Varroc Engineering Limited
COMPLIANCE CERTIFICATE UNDER REGULATION 17(8) OFTHE SEBI (LISTING OBLIGATIONS AND DISCLOSURE REQUIREMENTS) REGULATIONS, 2015
May 24, 2019
The Members,Varroc Engineering LimitedPlot No. L-4, MIDC Industrial Area,Waluj, Aurangabad – 431 136
Sub: Compliance certificate under Regulation 17 (8) read with Part B of Schedule II of SEBI (Listing Obligations and Disclosure Requirements) Regulations, 2015
This is to certify that for the financial year ended on March 31, 2019:
1. We have reviewed the financial statements and the cash flow statement for the year as aforesaid and to the best of our knowledge and belief:
a. these financial statements do not contain any materially untrue statement or omit any material fact or contain statements that might be misleading;
b. these statements together present a true and fair view of the Company’s affairs and are in compliance with Indian Accounting Standards (Ind AS), applicable laws and regulations;
2. To the best of our knowledge and belief, there are no transactions entered into by the Company during the year, which are fraudulent, illegal or violative of the Company’s Code of Conduct for Directors and Employees;
3. We accept responsibility for establishing and maintaining internal controls for financial reporting and that we have evaluated the effectiveness of the internal control systems for financial reporting of the Company and there were no deficiencies in the design or operation of such internal controls; and
4. We have indicated to the Auditors and the Audit Committee:
a. that there were no significant changes in internal control, over financial reporting, during the year;
b. all significant changes in the accounting policy during the year, if any, have been disclosed in the notes in respective place in the financial statements; and
c. there were no instances of fraud, of which we have become aware of.
For Varroc Engineering Limited For Varroc Engineering Limited
Ashwani MaheshwariCEO and Wholetime DirectorDIN: 07341295
T. R. SrinivasanGroup Chief Financial Officer
Corporate Governance Report

Annual Report 2018-19 83
DECLARATION BY CHIEF EXECUTIVE OFFICER UNDER REGULATION 34(3) READ WITH PART D OF
SCHEDULE V TO THE SEBI (LISTING OBLIGATIONS AND DISCLOSURE REQUIREMENTS) REGULATIONS, 2015
May 24, 2019
The Members,Varroc Engineering LimitedPlot No. L-4, MIDC Industrial Area,Waluj, Aurangabad – 431 136
Sub: Declaration regarding compliance with the Company’s Code of Conduct for Directors and Senior Management I, Ashwani Maheshwari, Chief Executive Officer and Whole-time Director of Varroc Engineering Limited, hereby declare that all the members of the Board of Directors and Senior Management have affirmed compliance with the Code of Conduct for Directors and Senior Management of the Company for FY 2018-19.
For Varroc Engineering Limited
Ashwani MaheshwariCEO and Wholetime DirectorDIN: 07341295
Corporate Governance Report
84 Varroc Engineering Limited
Independent Auditor’s ReportFinancial Statements - Standalone
To the Members of Varroc Engineering Limited Report on the Audit of the Standalone Ind AS Financial Statements
Opinion
We have audited the accompanying standalone Ind AS financial statements of Varroc Engineering Limited (“the Company”), which comprise the Balance sheet as at March 31 2019, the Statement of Profit and Loss, including the statement of Other Comprehensive Income, the Cash Flow Statement and the Statement of Changes in Equity for the year then ended, and notes to the financial statements, including a summary of significant accounting policies and other explanatory information.
In our opinion and to the best of our information and according to the explanations given to us, the aforesaid standalone Ind AS financial statements give the information required by the Companies Act, 2013 (“the Act”) in the manner so required and give a true and fair view in conformity with the accounting principles generally accepted in India, of the state of affairs of the Company as at March 31, 2019, its profit including other comprehensive income, its cash flows and the changes in equity for the year ended on that date.
Basis for Opinion
We conducted our audit of the standalone Ind AS financial statements in accordance with the Standards on Auditing (SAs), as specified under section 143(10) of the Act. Our responsibilities under those Standards are further described in the ‘Auditor’s Responsibilities for the Audit of the Standalone Ind AS Financial Statements’ section of our report. We are independent of the Company in accordance with the ‘Code of Ethics’ issued by the Institute of Chartered Accountants of India together with the ethical requirements that are relevant to our audit of the financial statements under the provisions of the Act and the Rules thereunder, and we have fulfilled our other ethical responsibilities in accordance with these requirements and the Code of Ethics. We believe that the audit evidence we have obtained is sufficient and appropriate to provide a basis for our audit opinion on the standalone Ind AS financial statements.
Key Audit Matters
We have determined that there are no key audit matters to communicate in our report.
Other Information
The Company’s Board of Directors is responsible for the other information. The other information comprises the Board’s Report (including the Annexures), Corporate Governance Report and Management Discussions and Analysis (but does not include the standalone/consolidated Ind AS financial statements and our auditor’s report thereon), which we obtained prior to the date of this auditor’s report, and Corporate overview and other details to be included in the annual report, which is expected to be made available to us after that date.
Our opinion on the standalone Ind AS financial statements does not cover the other information and we do not and will not express any form of assurance conclusion thereon.
In connection with our audit of the standalone Ind AS financial statements, our responsibility is to read the other information identified above and, in doing so, consider whether the other information is materially inconsistent with the standalone Ind AS financial statements or our knowledge obtained in the audit or otherwise appears to be materially misstated.
If, based on the work we have performed on the other information that we obtained prior to the date of this auditor’s report, we conclude that there is a material misstatement of this other information, we are required to report that fact. We have nothing to report in this regard.
When we read the Corporate overview and other details included in the annual report, if we conclude that there is a material misstatement therein, we are required to communicate the matter to those charged with governance.
Responsibilities of Management for the Standalone Ind AS Financial Statements
The Company’s Board of Directors is responsible for the matters stated in section 134(5) of the Act with respect to the preparation of these standalone Ind AS financial statements that give a true and fair view of the financial position, financial performance including other comprehensive income, cash flows and changes in equity of the Company in accordance with the accounting principles generally accepted in India, including the Indian Accounting Standards (Ind AS) specified under section 133 of the Act read with the Companies (Indian Accounting Standards) Rules, 2015, as amended. This responsibility also includes maintenance of adequate accounting records in accordance with the provisions of the Act for safeguarding of the assets of the Company and for preventing and detecting frauds and other irregularities; selection and application of appropriate accounting policies; making judgments and estimates that are reasonable and prudent; and the design, implementation and maintenance of adequate internal financial controls, that were operating effectively for ensuring the accuracy and completeness of the accounting records, relevant to the preparation and presentation of the standalone Ind AS financial statements that give a true and fair view and are free from material misstatement, whether due to fraud or error.
In preparing the standalone Ind AS financial statements, management is responsible for assessing the Company’s ability to continue as a going concern, disclosing, as applicable, matters related to going concern and using the going concern basis of accounting unless management either intends to liquidate the Company or to cease operations, or has no realistic alternative but to do so.
The Board of Directors is also responsible for overseeing the Company’s financial reporting process.
Annual Report 2018-19 85
Financial Statements - Standalone
Auditor’s Responsibilities for the Audit of the Standalone Ind AS Financial Statements
Our objectives are to obtain reasonable assurance about whether the standalone Ind AS financial statements as a whole are free from material misstatement, whether due to fraud or error, and to issue an auditor’s report that includes our opinion. Reasonable assurance is a high level of assurance, but is not a guarantee that an audit conducted in accordance with SAs will always detect a material misstatement when it exists. Misstatements can arise from fraud or error and are considered material if, individually or in the aggregate, they could reasonably be expected to influence the economic decisions of users taken on the basis of these standalone Ind AS financial statements.
As part of an audit in accordance with SAs, we exercise professional judgment and maintain professional skepticism throughout the audit. We also:
• Identify and assess the risks of material misstatement of the standalone Ind AS financial statements, whether due to fraud or error, design and perform audit procedures responsive to those risks, and obtain audit evidence that is sufficient and appropriate to provide a basis for our opinion. The risk of not detecting a material misstatement resulting from fraud is higher than for one resulting from error, as fraud may involve collusion, forgery, intentional omissions, misrepresentations, or the override of internal control.
• Obtain an understanding of internal control relevant to the audit in order to design audit procedures that are appropriate in the circumstances. Under section 143(3)(i) of the Act, we are also responsible for expressing our opinion on whether the Company has adequate internal financial controls system in place and the operating effectiveness of such controls.
• Evaluate the appropriateness of accounting policies used and the reasonableness of accounting estimates and related disclosures made by management.
• Conclude on the appropriateness of management’s use of the going concern basis of accounting and, based on the audit evidence obtained, whether a material uncertainty exists related to events or conditions that may cast significant doubt on the Company’s ability to continue as a going concern. If we conclude that a material uncertainty exists, we are required to draw attention in our auditor’s report to the related disclosures in the financial statements or, if such disclosures are inadequate, to modify our opinion. Our conclusions are based on the audit evidence obtained up to the date of our auditor’s report. However, future events or conditions may cause the Company to cease to continue as a going concern.
• Evaluate the overall presentation, structure and content of the standalone Ind AS financial statements, including the disclosures, and whether the standalone Ind AS financial statements represent the underlying transactions and events in a manner that achieves fair presentation.
We communicate with those charged with governance regarding, among other matters, the planned scope and timing of the audit and significant audit findings, including any significant deficiencies in internal control that we identify during our audit.
We also provide those charged with governance with a statement that we have complied with relevant ethical requirements regarding independence, and to communicate with them all relationships and other matters that may reasonably be thought to bear on our independence, and where applicable, related safeguards.
From the matters communicated with those charged with governance, we determine those matters that were of most significance in the audit of the standalone Ind AS financial statements for the financial year ended March 31, 2019 and are therefore the key audit matters. We describe these matters in our auditor’s report unless law or regulation precludes public disclosure about the matter or when, in extremely rare circumstances, we determine that a matter should not be communicated in our report because the adverse consequences of doing so would reasonably be expected to outweigh the public interest benefits of such communication.
Other Matter
The Ind AS financial statements of the Company for the year ended March 31, 2018, included in these standalone Ind AS financial statements, have been audited by the predecessor auditor who expressed an unmodified opinion on those statements on June 6, 2018.
Report on Other Legal and Regulatory Requirements
1. As required by the Companies (Auditor’s Report) Order, 2016 (“the Order”), issued by the Central Government of India in terms of sub-section (11) of section 143 of the Act, we give in the “Annexure 1” a statement on the matters specified in paragraphs 3 and 4 of the Order.
2. As required by Section 143(3) of the Act, we report that:
(a) We have sought and obtained all the information and explanations which to the best of our knowledge and belief were necessary for the purposes of our audit;
(b) In our opinion, proper books of account as required by law have been kept by the Company so far as it appears from our examination of those books;
(c) The Balance Sheet, the Statement of Profit and Loss including the Statement of Other Comprehensive Income, the Cash Flow Statement and Statement of Changes in Equity dealt with by this Report are in agreement with the books of account;
(d) In our opinion, the aforesaid standalone Ind AS financial statements comply with the Accounting Standards specified under Section 133 of the Act, read with Companies (Indian Accounting Standards) Rules, 2015, as amended;
(e) On the basis of the written representations received from the directors as on March 31, 2019 taken on record by the Board of Directors, none of the directors is disqualified as on March 31, 2019 from being appointed as a director in terms of Section 164 (2) of the Act;
Independent Auditor’s Report
86 Varroc Engineering Limited
Financial Statements - Standalone
Independent Auditor’s Report
(f) With respect to the adequacy of the internal financial controls over financial reporting of the Company with reference to these standalone Ind AS financial statements and the operating effectiveness of such controls, refer to our separate Report in “Annexure 2” to this report;
(g) In our opinion, the managerial remuneration for the year ended March 31, 2019 has been paid / provided by the Company to its directors in accordance with the provisions of section 197 read with Schedule V to the Act;
(h) With respect to the other matters to be included in the Auditor’s Report in accordance with Rule 11 of the Companies (Audit and Auditors) Rules, 2014, as amended, in our opinion and to the best of our information and according to the explanations given to us:
i. The Company has disclosed the impact of pending litigations on its financial position in its standalone Ind AS financial statements – Refer Note 50 to the standalone Ind AS financial statements;
ii. The Company has made provision, as required under the applicable law or accounting standards, for material foreseeable losses, if any, on long-term contracts including derivative contracts – Refer Note 27 to the standalone Ind AS financial statements;
iii. There were no amounts which were required to be transferred to the Investor Education and Protection Fund by the Company.
For S R B C & CO LLPChartered AccountantsICAI Firm Registration Number: 324982E/E300003
per Paul AlvaresPartnerMembership Number: 105754
Place of Signature: MumbaiDate: May 24, 2019

Annual Report 2018-19 87
Financial Statements - Standalone
Annexure 1 referred to in paragraph 1 under the heading "Report on Other Legal and Regulatory Requirement " of our report of even date
Re: Varroc Engineering Limited (the "Company")
(i) (a) The Company has maintained proper records showing full particulars, including quantitative details and situation of fixed assets. (b) All fixed assets have not been physically verified by management during the year but there is a regular programme of verification to cover all the
items over a period of three years which, in our opinion, is reasonable having regard to the size of the Company and the nature of its assets. No material discrepancies were noticed on such verification.
(c) According to the information and explanations given by management, the title deeds of immovable properties included in property, plant and
equipment are held in the name of the Company.
(ii) The inventory has been physically verified by management during the year. In our opinion, the frequency of verification is reasonable. No material discrepancies were noticed on such physical verification. Inventories lying with third parties have been substantially confirmed by them and no material discrepancies were noticed in respect of such confirmations.
(iii) According to the information and explanations given to us, the Company has not granted any loans, secured or unsecured to companies, firms, Limited
Liability Partnerships or other parties covered in the register maintained under section 189 of the Companies Act, 2013. Accordingly, the provisions of clause 3(iii) (a), (b) and (c) of the Order are not applicable to the Company and hence not commented upon.
(iv) In our opinion and according to the information and explanations given to us, provisions of section 185 and 186 of the Companies Act 2013 in respect of loans to directors including entities in which they are interested and in respect of loans and advances given, investments made and guarantees and securities given, have been complied with by the Company.
(v) The Company has not accepted any deposits within the meaning of Sections 73 to 76 of the Act and the Companies (Acceptance of Deposits) Rules, 2014 (as amended). Accordingly, the provisions of clause 3(v) of the Order are not applicable.
(vi) We have broadly reviewed the books of account maintained by the Company pursuant to the rules made by the Central Government for the maintenance of cost records under section 148(1) of the Companies Act, 2013, related to the manufacture of its products and are of the opinion that prima facie, the specified accounts and records have been made and maintained. We have not, however, made a detailed examination of the same.
(vii) (a) Undisputed statutory dues including provident fund, employees’ state insurance, income-tax, duty of custom, goods and service tax, cess and other statutory dues have generally been regularly deposited with the appropriate authorities though there has been a slight delay in a few cases in respect of payment of income taxes (TDS) and provident fund. According to the information and explanations given to us, no undisputed amounts payable in respect of provident fund, employees’ state insurance, income-tax, goods and services tax, customs duty, cess and other statutory dues were outstanding, at the year end, for a period of more than six months from the date they became payable.
(b) According to the records of the Company, the dues of income-tax, sales-tax, service tax, duty of custom, duty of excise, value added tax and cess which have not been deposited on account of any dispute, are as follows:
Name of the statuteNature of the
duesAmount*
( `in Million)
Period to which the amount
relatesForum where the dispute is pending
Income Tax Act, 1961 Income Tax 12.70 AY 2008-09 Bombay High Court, Aurangabad bench
Income Tax Act, 1961 Income Tax 11.06 AY 2015-16 CIT (A), Pune
Sales Tax Act Sales Tax 0.65 FY 2000-01 Bombay High Court
The Central Excise Act, 1944 Excise Duty 200.53 FY 2011-16 Commissioner of Central Excise, Aurangabad
The Central Excise Act, 1944 & The Finance Act, 1994
Excise Duty & Service Tax
21.23 Jan 2005 to June 2017
Various Tax Authorities
* Against the litigation amount as mention above , `0.53 million have been deposited with respective authorities.
(viii) In our opinion and according to the information and explanations given by management, the Company has not defaulted in repayment of loans or borrowing to a financial institution, bank or government or dues to debenture holders.
(ix) In our opinion and according to information and explanations given by management, monies raised by the company by way of term loans were applied for the purpose for which they were raised. According to the information and explanations given by management, the Company has not raised any money by way of initial public offer or further public offer (including debt instruments).
(x) Based upon the audit procedures performed for the purpose of reporting the true and fair view of the financial statements and according to the information and explanations given by management, we report that no fraud by the Company or no fraud on the Company by the officers and employees of the Company has been noticed or reported during the year.
(xi) According to the information and explanations given by management, the managerial remuneration has been paid/provided in accordance with the requisite approvals mandated by the provisions of section 197 read with Schedule V to the Companies Act, 2013.

88 Varroc Engineering Limited
Financial Statements - Standalone
(xii) In our opinion, the Company is not a nidhi company. Therefore, the provisions of clause 3(xii) of the order are not applicable to the Company and hence not commented upon.
(xiii) According to the information and explanations given by the management, transactions with the related parties are in compliance with section 177 and 188 of the Companies Act, 2013 where applicable and the details have been disclosed in the notes to the financial statements, as required by the applicable accounting standards.
(xiv) According to the information and explanations given by management, the Company has not made any preferential allotment or private placement of shares or fully or partly convertible debentures during the year under review and accordingly reporting requirements under clause 3(xiv) are not applicable to the Company and hence not commented upon.
(xv) According to the information and explanations given by management, the Company has not entered into any non-cash transactions with directors or persons connected with him as referred to in section 192 of Companies Act, 2013.
(xvi) According to the information and explanations given to us, the provisions of section 45-IA of the Reserve Bank of India Act, 1934 are not applicable to the Company.
For S R B C & CO LLPChartered AccountantsICAI Firm Registration Number: 324982E/E300003
per Paul AlvaresPartnerMembership Number: 105754
Place of Signature: MumbaiDate: May 24, 2019
Annexure 1 referred to in paragraph 1 under the heading "Report on Other Legal and Regulatory Requirement " of our report of even date

Annual Report 2018-19 89
Financial Statements - Standalone
Report on the Internal Financial Controls under Clause (i) of Sub-section 3 of Section 143 of the Companies Act, 2013 (“the Act”)
We have audited the internal financial controls over financial reporting of Varroc Engineering Limited (“the Company”) as of March 31, 2019 in conjunction with our audit of the standalone Ind AS financial statements of the Company for the year ended on that date.
Management’s Responsibility for Internal Financial Controls
The Company’s Management is responsible for establishing and maintaining internal financial controls based on the internal control over financial reporting criteria established by the Company considering the essential components of internal control stated in the Guidance Note on Audit of Internal Financial Controls Over Financial Reporting issued by the Institute of Chartered Accountants of India. These responsibilities include the design, implementation and maintenance of adequate internal financial controls that were operating effectively for ensuring the orderly and efficient conduct of its business, including adherence to the Company’s policies, the safeguarding of its assets, the prevention and detection of frauds and errors, the accuracy and completeness of the accounting records, and the timely preparation of reliable financial information, as required under the Companies Act, 2013.
Auditor’s Responsibility
Our responsibility is to express an opinion on the Company's internal financial controls over financial reporting based on our audit. We conducted our audit in accordance with the Guidance Note on Audit of Internal Financial Controls Over Financial Reporting (the “Guidance Note”) and the Standards on Auditing as specified under section 143(10) of the Companies Act, 2013, to the extent applicable to an audit of internal financial controls, both applicable to an audit of Internal Financial Controls and, both issued by the Institute of Chartered Accountants of India. Those Standards and the Guidance Note require that we comply with ethical requirements and plan and perform the audit to obtain reasonable assurance about whether adequate internal financial controls over financial reporting was established and maintained and if such controls operated effectively in all material respects.
Our audit involves performing procedures to obtain audit evidence about the adequacy of the internal financial controls system over financial reporting and their operating effectiveness. Our audit of internal financial controls over financial reporting included obtaining an understanding of internal financial controls over financial reporting, assessing the risk that a material weakness exists, and testing and evaluating the design and operating effectiveness of internal control based on the assessed risk. The procedures selected depend on the auditor’s judgement, including the assessment of the risks of material misstatement of the financial statements, whether due to fraud or error. We believe that the audit evidence we have obtained is sufficient and appropriate to provide a basis for our audit opinion on the internal financial controls system over financial reporting with reference to these standalone Ind AS financial statements.
Meaning of Internal Financial Controls Over Financial Reporting
A company's internal financial control over financial reporting is a process designed to provide reasonable assurance regarding the reliability of financial reporting and the preparation of financial statements for external purposes in accordance with generally accepted accounting principles. A company's internal financial control over financial reporting includes those policies and procedures that (1) pertain to the maintenance of records that, in reasonable detail, accurately and fairly reflect the transactions and dispositions of the assets of the company; (2) provide reasonable assurance that transactions are recorded as necessary to permit preparation of financial statements in accordance with generally accepted accounting principles, and that receipts and expenditures of the company are being made only in accordance with authorisations of management and directors of the company; and (3) provide reasonable assurance regarding prevention or timely detection of unauthorised acquisition, use, or disposition of the company's assets that could have a material effect on the financial statements.
Inherent Limitations of Internal Financial Controls Over Financial Reporting with reference to these standalone financial statements
Because of the inherent limitations of internal financial controls over financial reporting with reference to these standalone financial statements, including the possibility of collusion or improper management override of controls, material misstatements due to error or fraud may occur and not be detected. Also, projections of any evaluation of the internal financial controls over financial reporting with reference to these standalone financial statements to future periods are subject to the risk that the internal financial control over financial reporting with reference to these standalone financial statements may become inadequate because of changes in conditions, or that the degree of compliance with the policies or procedures may deteriorate.
Opinion
In our opinion, the Company has, in all material respects, adequate internal financial controls over financial reporting with reference to these standalone financial statements and such internal financial controls over financial reporting with reference to these standalone financial statements were operating effectively as at March 31, 2019, based on the internal control over financial reporting criteria established by the Company considering the essential components of internal control stated in the Guidance Note on Audit of Internal Financial Controls Over Financial Reporting issued by the Institute of Chartered Accountants of India.
For S R B C & CO LLPChartered AccountantsICAI Firm Registration Number: 324982E/E300003
per Paul AlvaresPartnerMembership Number: 105754
Place of Signature: MumbaiDate: May 24, 2019
Annexure 2 to The Independent Auditors Report of Even Date on The Standalone Ind as Financial Statement

90 Varroc Engineering Limited
Standalone Balance Sheet
(`in million)
Notes As at March 31, 2019 As at March 31, 2018
ASSETS
Non current assets
Property, plant and equipment 3 8,451.40 7,632.20
Capital work-in-progress 3 506.15 217.13
Investment properties 4 275.05 286.42
Intangible assets 5 91.34 91.05
Intangible assets under development 5 30.01 5.97
Investments in subsidiaries and joint venture 6 (a) 4,647.34 4,647.09
Financial assets
Investments 6 (b) 0.12 0.12
Loans 7 23.35 17.45
Other financial assets 8 125.32 0.39
Income tax assets (net) 20.52 24.04
Other non-current assets 9 420.06 328.51
Total non-current assets 14,590.66 13,250.37
Current assets
Inventories 10 2,257.72 1,946.90
Financial assets
Investments 11 - 0.10
Trade receivables 12 3,060.46 3,888.43
Cash and cash equivalents 13 65.40 84.03
Other bank balances 14 1.95 1.83
Loans 15 60.39 18.71
Other financial assets 16 17.72 175.32
Other current assets 17 330.11 234.58
Total current assets 5,793.75 6,349.90
Total Assets 20,384.41 19,600.27
EQUITY AND LIABILITIES
EQUITY
Equity share capital 18 134.81 123.13
Compulsorily convertible preference shares (entirely equity in nature) 18 - 11.68
Other equity 19 11,152.84 9,980.66
Total equity 11,287.65 10,115.47
LIABILITIES
Non-current liabilities
Financial liabilities
Borrowings 20 1,560.00 2,204.61
Other financial liabilities 21 - 5.64
Provisions 22 54.72 53.05
Deferred tax liabilities (net) 23 306.31 135.22
Other non-current liabilities 24 159.82 172.66
Total non-current liabilities 2,080.85 2,571.18
Financial Statements - Standalone

Annual Report 2018-19 91
(`in million)
Notes As at March 31, 2019 As at March 31, 2018
Current liabilities
Financial liabilities
Borrowings 25 821.96 1,724.32
Trade payables
Total outstanding dues of micro enterprises and small enterprises 26 504.25 8.75
Total outstanding dues other than micro enterprises and small enterprises
26 3,000.40 3,234.54
Acceptances 212.10 184.12
Other financial liabilities 27 2,024.50 1,331.00
Provisions 28 200.51 194.07
Other current liabilities 29 252.19 236.82
Total current liabilities 7,015.91 6,913.62
Total liabilities 9,096.76 9,484.80
Total equity and liabilities 20,384.41 19,600.27
Summary of significant accounting policies 2The accompanying notes are an integral part of these financial statements
As per our report of even date For and on behalf of the Board of Directors
For S R B C & CO LLP TARANG JAIN GAUTAM KHANDELWAL Chartered Accountants Managing Director Director ICAI Firm Registration Number: 324982E/E300003 (DIN 00027505) (DIN 00270717)
ASHWANI MAHESHWARI CEO and Whole Time Director (DIN 07341295) per Paul Alvares THARUVAI R. SRINIVASAN RAKESH M.DARJI Partner Group CFO Company Secretary Membership No: 105754 (Membership No: ACS13085)
Place: Mumbai Place: Mumbai Date: May 24, 2019 Date: May 24, 2019
Standalone Balance SheetFinancial Statements - Standalone

92 Varroc Engineering Limited
(`in million)
NotesFor the year ended
March 31, 2019For the year ended
March 31, 2018
Revenue
Revenue from contracts with customers 30 25,731.53 20,954.75
Other income 31 514.84 287.71
Total income 26,246.37 21,242.46
Expenses
Cost of materials consumed 32 16,993.69 13,045.36
Changes in inventories of work-in-progress and finished goods 33 (244.52) (10.54)
Excise duty (Refer note 30 ) - 485.83
Employee benefits expense 34 2,196.13 1,753.76
Depreciation and amortisation expense 35 1,075.19 1,016.11
Finance costs 36 392.01 401.50
Other expenses 37 4,095.13 3,498.84
Total expenses 24,507.63 20,190.86
Profit before tax 1,738.74 1,051.60
Income tax expense
Current tax 387.60 232.97
Short/(excess) provision in respect of earlier years (5.68) -
Net current tax 381.92 232.97
Deferred Tax 161.42 120.33
Total tax expense 39 543.34 353.30
Profit for the year 1,195.40 698.30
Other comprehensive income
Items that may be reclassified to profit or loss
Deferred hedging gains/(losses) on cash flow hedges 45.82 10.88
Income tax relating to these items (16.01) (4.20)
Deferred hedging gains/(losses) on cash flow hedges (net of tax) 29.81 6.68
Items that will not be reclassified to profit or loss
Remeasurement gains/(losses)of defined benefit obligation (18.16) 16.63
Income tax relating to these items 6.35 (5.81)
Remeasurement of defined benefit obligation (net of tax) (11.81) 10.82
Other comprehensive income for the year (net of tax) 18.00 17.50
Total comprehensive income for the year 1,213.40 715.80
Standalone Statement of Profit and LossFinancial Statements - Standalone

Annual Report 2018-19 93
Standalone Statement of Profit and Loss
(`in million)
NotesFor the year ended
March 31, 2019For the year ended
March 31, 2018
Earnings per equity share [Nominal value per share: `1 (Previous year : `1)]
49
Basic and Diluted 8.87 4.96
Summary of significant accounting policies 2The accompanying notes are an integral part of these financial statements
As per our report of even date For and on behalf of the Board of Directors
For S R B C & CO LLP TARANG JAIN GAUTAM KHANDELWAL Chartered Accountants Managing Director Director ICAI Firm Registration Number: 324982E/E300003 (DIN 00027505) (DIN 00270717)
ASHWANI MAHESHWARI CEO and Whole Time Director (DIN 07341295) per Paul Alvares THARUVAI R. SRINIVASAN RAKESH M.DARJI Partner Group CFO Company Secretary Membership No: 105754 (Membership No: ACS13085)
Place: Mumbai Place: Mumbai Date: May 24, 2019 Date: May 24, 2019
Financial Statements - Standalone

94 Varroc Engineering Limited
A. Equity and preference share capital
(`in million)
Particulars NotesEquity Shares Preference shares
March 31, 2019 March 31, 2018 March 31, 2019 March 31, 2018
Balance at the beginning of the year 17 123.13 123.13 11.68 20.20
"Less:- Capital reduction ( refer note 18 (d))" - (8.52)
Add/( less): Conversion of series "B" CCPS Preference shares into 852,359 equity shares. [refer note 18 (d)]
17 8.52 (8.52)
Add/(less): Conversion of series "C" CCPS Preference shares into 11,683,770 equity shares. [refer note 18 (e)]
17 11.68 (11.68)
Balance at the end of the year 134.81 123.13 - 11.68
B. Other equity for the year ended March 31, 2019
(`in million)
Particulars Notes
Reserves and SurplusOther
Reserves
TotalRetained earnings
General reserve
Capital reserve
Securities premium
Debenture redemption
reserve
Cash flow hedge reserve
Balance at April 1, 2017 1,182.23 1,474.38 - 6,481.43 200.00 (8.95) 9,329.09
Profit for the year 698.30 - - - - - 698.30
Remeasurement of defined benefit obligation (net of tax)
10.82 - - - - - 10.82
Gain/(loss) on changes in fair value of hedging instruments (net of tax)
19 - - - - - 6.68 6.68
Capital reduction (refer note 18 (d))
- - 8.52 - - - 8.52
Dividend paid [(`0.50 per Equity share) (dividend distribution tax `11.19 million)]
18 (72.75) - - - - - (72.75)
Balance at March 31, 2018 1,818.60 1,474.38 8.52 6,481.43 200.00 (2.27) 9,980.66
Statement of Changes in Equity for the year ended March 31, 2019Financial Statements - Standalone

Annual Report 2018-19 95
Statement of Changes in Equity for the year ended March 31, 2019
(`in million)
Particulars Notes
Reserves and SurplusOther
Reserves
TotalRetained earnings
General reserve
Capital reserve
Securities premium
Debenture redemption
reserve
Cash flow hedge reserve
Profit for the year 1,195.40 - - - - - 1,195.40
Remeasurement of defined benefit obligation (net of tax)
(11.81) - - - - - (11.81)
Gain/(loss) on changes in fair value of hedging instruments (net of tax)
19 - - - - - (4.38) (4.38)
Dividend paid [(`0.50 per equity share) (dividend distribution tax `1.19 million)]
18 (7.03) - - - - - (7.03)
Balance at March 31, 2019 2,995.16 1,474.38 8.52 6,481.43 200.00 (6.65) 11,152.84 The accompanying notes are an integral part of these financial statements For and on behalf of the Board of Directors
As per our report of even date
For S R B C & CO LLP TARANG JAIN GAUTAM KHANDELWAL Chartered Accountants Managing Director Director ICAI Firm Registration Number: 324982E/E300003 (DIN 00027505) (DIN 00270717)
ASHWANI MAHESHWARI CEO and Whole Time Director (DIN 07341295) per Paul Alvares THARUVAI R. SRINIVASAN RAKESH M.DARJI Partner Group CFO Company Secretary Membership No: 105754 (Membership No: ACS13085)
Place: Mumbai Place: Mumbai Date: May 24, 2019 Date: May 24, 2019
Financial Statements - Standalone

96 Varroc Engineering Limited
Cash Flow Statement
(`in million)
Sr. No.
ParticularsYear ended
March 31, 2019Year ended
March 31, 2018
A. Cash flow from operating activities
Net Profit before tax 1,738.74 1,051.60
Adjustments for:
Depreciation and amortization expense 1,075.19 1,016.11
Loss on sale of property, plant and equipment / intangible assets 56.26 5.36
Provision for doubtful debts / advances 0.45 6.81
Unrealised exchange loss on restatement of as loans 11.48 0.50
Finance cost 392.01 401.50
Rent income from investment property (50.42) (46.72)
Provision for guarantees for loan taken by subsidiary (5.89) 21.47
Profit on sale of current investments - (0.58)
Provisions/liabilities no longer required written back (19.89) -
Increase in Surrender value of key man insurance (98.23) -
Dividend income (6.62) (6.62)
Interest income (7.16) (2.33)
Government grant (180.16) 1,167.02 (105.24) 1,290.26
Operating profits before working capital changes 2,905.76 2,341.86
Adjustments for changes in working capital (increase)/decrease
Trade receivables 830.42 (1,370.92)
Trade payables 309.24 911.58
Inventories (310.82) (215.42)
Other financial assets 83.38 (131.02)
Other current and non current asset (71.09) 136.97
Provision (4.16) 7.51
Other financial liabilities 46.11 42.89
Other current and non current liabilities 5.78 888.86 75.59 (542.82)
Cash generated from operations 3,794.62 1,799.04
Income tax paid (376.74) (233.33)
Net cash flow generated from operating activities 3,417.88 1,565.71
B. Cash flow from investing activities
Dividend received 6.62 6.62
Interest received 7.10 3.23
Government grant received 94.67 -
(Purchase of)/ proceeds from sale of current investments (net) 0.10 0.48
Proceeds from sale of property, plant and equipment 14.68 116.11
Rent received on investment property 50.42 46.72
Purchase of property, plant and equipment (2,341.58) (1,139.75)
Fixed deposits (placed)/ redeemed (net) (0.12) 0.03
Payment for non current investments (0.25) -
Net cash used in investing activities (2,168.36) (966.56)
Financial Statements - Standalone

Annual Report 2018-19 97
Cash Flow Statement
(`in million)
Sr. No.
ParticularsYear ended
March 31, 2019Year ended
March 31, 2018
C. Cash flow from financing activities
Repayment of long term borrowings (966.34) (541.77)
Proceeds from long term borrowings 1,000.00 -
Proceeds/(repayment) in short term borrowings (880.89) 552.03
Dividend paid on equity shares and preference shares (including dividend distribution tax thereon)
(7.03) (72.75)
Interest paid (392.42) (405.79)
Net cash flow generated from financing activities (1,246.68) (468.28)
Increase in cash and cash equivalents 2.84 130.87
Opening cash and cash equivalents 31.39 (99.48)
Closing cash and cash equivalents 34.23 31.39
Cash and cash equivalents consists of
Cash in hand 0.75 0.79
Current accounts / deposit with maturity of less than 3 months 64.65 83.24
Bank overdraft (refer note 25 ) (31.17) (52.64)
34.23 31.39
Notes:
1) The above Statement of Cash Flows has been prepared under the indirect method as set out in Ind AS 7 on 'Statement of Cash flows'. 2) Figures in brackets represent outflow of cash and cash equivalents.
The accompanying notes are an integral part of these financial statements
As per our report of even date For and on behalf of the Board of Directors
For S R B C & CO LLP TARANG JAIN GAUTAM KHANDELWAL Chartered Accountants Managing Director Director ICAI Firm Registration Number: 324982E/E300003 (DIN 00027505) (DIN 00270717)
ASHWANI MAHESHWARI CEO and Whole Time Director (DIN 07341295) per Paul Alvares THARUVAI R. SRINIVASAN RAKESH M.DARJI Partner Group CFO Company Secretary Membership No: 105754 (Membership No: ACS13085)
Place: Mumbai Place: Mumbai Date: May 24, 2019 Date: May 24, 2019
Financial Statements - Standalone
98 Varroc Engineering Limited
Notes to the financial statements for the year ended March 31, 2019
1. Corporate information Varroc Engineering Limited (the "Company" ) is engaged in the business of manufacturing of automobile components. The Company is a public
company domiciled in India and is incorporated under the provisions of the Companies Act applicable in India. Its shares are listed on two recognised stock exchanges in India. The registered office of the Company is located at L-4 M.I.D.C Area ,Waluj, Aurangabad-431 136.
The Company has 13 manufacturing plants, 3 research and development centres, 3 wind power and 1 solar power projects in India and caters to customers both in the domestic and international markets. The Company and its subsidiaries operate from manufacturing plants and technical development centers across 4 continents and 14 countries spread across the globe.
The above financial statements were authorised for issue in accordance with a resolution of the Board of directors on May 24, 2019.
2. Summary of significant accounting policies
This note provides a list of the significant accounting policies adopted in the preparation of these financial statements. These policies have been consistently applied to all the years presented, unless otherwise stated.
Basis of Preparation
(i) Compliance with Ind AS These financial statements comply in all material aspects with Indian Accounting Standards (Ind AS) notified under Section 133 of the
Companies Act, 2013 (the Act) [Companies (Indian Accounting Standards) Rules, 2015] and other relevant provisions of the Act.
All amounts included in these financial statements are reported in Million of Indian rupees (`In Million) except earning per share data and unless stated otherwise.
All amounts in the financial statements have been rounded off to the nearest million or decimal thereof. (ii) Use of estimates and assumptions
The preparation of the Financial Statements requires the management to make certain judgments, estimates and assumptions. It also requires the management to exercise judgement in the process of applying the accounting policies. The areas involving a higher degree of judgement or complexity, or areas where assumptions and estimates are significant to the financial statements are disclosed in Note 2A.
(iii) Historical cost convention "The financial statements have been prepared on a historical cost basis, except for the following:
• certain financial assets and liabilities (including derivative instruments) that are measured at fair value; and
• defined benefit plans, plan assets measured at fair value.
(iv) Current - non-current classification: All assets and liabilities have been classified as current or non current as per the company's operating cycle and other criteria set out in the
Schedule III to the Companies Act, 2013. Based on the nature of products and the time between the acquisition of assets for processing and their realisation in cash and cash equivalents, the Company has ascertained its operating cycle as 12 months for the purpose of current- non current classification of assets and liabilities.
A) Property, plant and equipment Tangible assets Freehold land is carried at historical cost. All other items of property, plant and equipment are stated at historical cost less depreciation. Historical
cost includes expenditure that is directly attributable to the acquisition of the items.
Subsequent costs are included in the asset’s carrying amount or recognised as a separate asset, as appropriate, only when it is probable that future economic benefits associated with the item will flow to the Company and the cost of the item can be measured reliably. The carrying amount of any component accounted for as a separate asset is derecognised when replaced. All other repairs and maintenance are charged to profit or loss during the reporting period in which they are incurred.
Depreciation methods, estimated useful lives and residual value Depreciation is calculated using the straight-line method to allocate their cost, net of their residual values, over their estimated useful lives or, in the
case of certain leased furniture, fittings and equipment, the shorter lease term as follows:
• Leasehold Land Amortised over the period of lease • Buildings Factory 30- years • Buildings offices 60 years
Financial Statements - Standalone

Annual Report 2018-19 99
Notes to the financial statements for the year ended March 31, 2019
• Plant and Machinery • Plant and Machinery, Factory Equipment & Electrical installation and fittings 8-12 years • Moulds 2-7 years • Computers 3-6 years • Vehicles 2-5 years • Furniture and Fixtures 5-10 years • Tools and office equipment 2-5 years
The property, plant and equipment acquired under finance leases is depreciated over the asset’s useful life or over the shorter of the asset’s useful life and lease term if there is no reasonable certainty that the company will obtain ownership at the end of the lease term.
The useful lives have been determined based on technical evaluation done by the management's expert which are different than those specified by Schedule
II to the Companies Act; 2013, in order to reflect the actual usage of the assets. The residual values are not more than 5% of the original cost of the asset.
The asset’s carrying amount is written down immediately to its recoverable amount if the asset’s carrying amount is greater than its estimated recoverable amount. Gains and losses on disposals are determined by comparing proceeds with carrying amount. These are included in profit or loss within other gains/(losses).
Capital work in progress is stated at cost, net of accumulated impairment loss, if any. The present value of the expected cost for the decommissioning of an asset after its use is included in the cost of the respective asset if the
recognition criteria for a provision are met.
The residual values, useful lives and methods of depreciation of property, plant and equipment are reviewed at each financial year end and adjusted prospectively, if appropriate
Investment properties Property that is held for long-term rental yields or for capital appreciation or both, and that is not occupied by the Company, is classified as investment
property. Investment property is measured initially at its cost, including related transaction costs and where applicable borrowing costs. Subsequent expenditure is capitalised to the asset’s carrying amount only when it is probable that future economic benefits associated with the expenditure will flow to the Company and the cost of the item can be measured reliably. All other repairs and maintenance costs are expensed when incurred. When part of an investment property is replaced, the carrying amount of the replaced part is derecognised.
Investment properties are depreciated using the straight-line method over their estimated useful lives. Investment properties generally have a useful life of 30-50 years. The useful life has been determined based on technical evaluation performed by the management’s expert.
Intangible assets Intangible assets acquired separately are measured on initial recognition at cost. Following initial recognition, intangible assets are carried at cost less
any accumulated amortisation and accumulated impairment losses. Internally generated intangibles, excluding capitalised development costs, are not capitalised and the related expenditure is reflected in profit or loss in the period in which the expenditure is incurred.
(i) Computer software
The amortisation period and the amortisation method for an intangible asset with a finite useful life are reviewed at least at the end of each reporting period. Changes in the expected useful life of the asset are considered to modify the amortisation period or method, as appropriate, and are treated as changes in accounting estimates.
Gains or losses arising from derecognition of an intangible asset are measured as the difference between the net disposal proceeds and the
carrying amount of the asset and are recognised in the statement of profit or loss when the asset is derecognised softwares amortised over a period of 3 years.
(ii) Technical know how Expenditure on acquiring technical know-how (including income tax and R & D Cess) is capitalised and amortised over a period of six years.
(iii) Research and development Research costs are expensed as incurred. Development expenditures on an individual project are recognised as an intangible asset when the
Company can demonstrate:
• The technical feasibility of completing the intangible asset so that the asset will be available for use or sale• Its intention to complete and its ability and intention to use or sell the asset• How the asset will generate future economic benefits• The availability of resources to complete the asset• The ability to measure reliably the expenditure during development
Development costs previously recognised as an expense are not recognised as an asset in a subsequent period. During the period of development, the asset is tested for impairment annually.
Financial Statements - Standalone

100 Varroc Engineering Limited
B) Investments in subsidiaries/joint venture The Company accounts for its investments in subsidiaries/joint venture at cost less accumulated impairment losses (if any) in its separate financial
statements. Investments accounted for at cost are accounted for in accordance with Ind AS 105, Non-current Assets Held for Sale and Discontinued Operations, when they are classified as held for sale
C) Leases
The determination of whether an arrangement is (or contains) a lease is based on the substance of the arrangement at the inception of the lease. The arrangement is, or contains, a lease if fulfilment of the arrangement is dependent on the use of a specific asset or assets and the arrangement conveys a right to use the asset or assets, even if that right is not explicitly specified in an arrangement.
As a lessee Leases where the Company, as lessee, has substantially all the risks and rewards of ownership are classified as finance leases. Finance leases
are capitalized at the lease’s inception at the fair value of the leased property or, if lower, the present value of the minimum lease payments. The corresponding rental obligations, net of finance charges, are included in borrowings or other financial liabilities as appropriate. Each lease payment is allocated between the liability and finance cost. The finance cost is charged to the profit or loss over the lease period so as to produce a constant periodic rate of interest on the remaining balance of the liability for each period. Contingent rentals are recognized as expenses in the periods in which they are incurred.
Leases in which a significant portion of the risks and rewards of ownership are not transferred to the Company as lessee are classified as operating
leases. Payments made under operating leases (net of any incentives received from the lessor) are charged to profit or loss on a straight-line basis over the period of the lease unless the payments are structured to increase in line with expected general inflation to compensate for the lessor’s expected inflationary cost increases.
As a lessor Leases in which the Company does not transfer substantially all the risks and rewards of ownership of an asset are classified as operating leases.
Rental income from operating lease is recognized on a straight-line basis over the term of the relevant lease unless the payments are structured to increase in line with expected general inflation to compensate for the lessor’s expected inflationary cost increases. Initial direct costs incurred in negotiating and arranging an operating lease are added to the carrying amount of the leased asset and recognized over the lease term on the same basis as rental income. Contingent rents are recognized as revenue in the period in which they are earned.
Leases are classified as finance leases when substantially all of the risks and rewards of ownership transfer from the Company to the lessee. Amounts due from lessees under finance leases are recorded as receivables at the Company's net investment in the leases. Finance lease income is allocated to accounting periods so as to reflect a constant periodic rate of return on the net investment outstanding in respect of the lease.
The Company has determined that it does not meet criteria for recognition of lease rental expense/ income on a basis other than straight-line basis.
D) Impairment of non-financial assets The Company assesses, at each reporting date, whether there is an indication that an asset may be impaired. If any indication exists, or when annual
impairment testing for an asset is required, the Company estimates the asset's recoverable amount. An asset's recoverable amount is the higher of an asset's or cash-generating unit's (CGU) fair value less costs of disposal and its value in use. Recoverable amount is determined for an individual asset, unless the asset does not generate cash inflows that are largely independent of those from other assets or group of assets. When the carrying amount of an asset or CGU exceeds its recoverable amount, the asset is considered impaired and is written down to its recoverable amount.
In assessing value in use, the estimated future cash flows are discounted to their present value using a pre-tax discount rate that reflects current market assessments of the time value of money and the risks specific to the asset. In determining fair value less costs of disposal, recent market transactions are taken into account. If no such transactions can be identified, an appropriate valuation model is used. These calculations are corroborated by valuation multiples, quoted share prices for publicly traded companies or other available fair value indicators.
The Company bases its impairment calculation on detailed budgets and forecast calculations, which are prepared separately for each of the Company's CGUs to which the individual assets are allocated. These budgets and forecast calculations generally cover a period of five years. For longer periods, a long-term growth rate is calculated and applied to project future cash flows after the fifth year. To estimate cash flow projections beyond periods covered by the most recent budgets/forecasts, the Company extrapolates cash flow projections in the budget using a steady or declining growth rate for subsequent years, unless an increasing rate can be justified. In any case, this growth rate does not exceed the long-term average growth rate for the products, industries, or country or countries in which the entity operates, or for the market in which the asset is used.
Impairment losses of continuing operations, including impairment on inventories, are recognized in the statement of profit or loss.
Intangible assets with indefinite useful lives are tested for impairment annually as at the year end at the CGU level, as appropriate, and when circumstances indicate that the carrying value may be impaired.
E) Borrowing costs General and specific borrowing costs that are directly attributable to the acquisition, construction or production of a qualifying asset are capitalised
during the period of time that is required to complete and prepare the asset for its intended use or sale. Qualifying assets are assets that necessarily take a substantial period of time to get ready for their intended use or sale.
Financial Statements - Standalone
Notes to the financial statements for the year ended March 31, 2019

Annual Report 2018-19 101
Investment income earned on the temporary investment of specific borrowings pending their expenditure on qualifying assets is deducted from the borrowing costs eligible for capitalisation.
Other borrowing costs are expensed in the period in which they are incurred.
F) Inventories Inventories are valued at the lower of cost and net realisable value. Costs incurred in bringing each product to its present location and condition are accounted for as follows:
a) Raw materials, Stores and spare-parts, Loose tools and Packing materials: cost includes cost of purchase and other costs incurred in bringing the inventories to their present location and condition. Cost is determined on weighted average basis.
b) Finished goods and work in progress: cost includes cost of direct materials and labour and a proportion of manufacturing overheads based on the normal operating capacity, but excluding borrowing costs. Cost is determined on weighted average basis.
c) Net realisable value is the estimated selling price in the ordinary course of business, less estimated costs of completion and the estimated costs necessary to make the sale.
d) Duties and other taxes (other than those subsequently recoverable by the entity from the taxing authorities) are included in the value of inventory.
G) Government grants Grants from the government are recognised at their fair value where there is a reasonable assurance that the grant will be received and the Company
will comply with all attached conditions.
Government grants relating to income are deferred and recognised in the profit or loss over the period necessary to match them with the costs that they are intended to compensate and presented within other income.
Government grants relating to purchase of property, plant and equipment are included in current and non-current liabilities as deferred income and are credited to profit or loss on straight-line basis over the expected lives of the related assets and presented within other income.
H) Revenue Recognition
Revenue from contracts with customers Revenue from contracts with customers is recognised when control of the goods or services are transferred to the customer at an amount that reflects
the consideration to which the Company expects to be entitled in exchange for those goods or services. The Company has generally concluded that it is the principal in its revenue arrangements because it typically controls the goods or services before transferring them to the customer. Amounts disclosed as revenue are net of goods and service tax (GST).
The disclosures of significant accounting judgements, estimates and assumptions relating to revenue from contracts with customers are provided in Note 30.
Sale of goods Revenue from sale of goods is recognised at the point in time when control of the goods is transferred to the customer, generally on delivery of the
goods. The normal credit term is 30 to 120 days upon delivery. The Company considers whether there are other promises in the contract that are separate performance obligations to which a portion of the
transaction price needs to be allocated (e.g.,warranties). In determining the transaction price for the sale of goods, the Group considers the effects of variable consideration, the existence of significant financing components, noncash consideration, and consideration payable to the customer (if any)..
Variable consideration If the consideration in a contract includes a variable amount (like volume rebates/incentives, cash discounts etc.), the Company estimates the amount
of consideration to which it will be entitled in exchange for transferring the goods to the customer. The variable consideration is estimated at contract inception and constrained until it is highly probable that a significant revenue reversal in the amount of cumulative revenue recognised will not occur when the associated uncertainty with the variable consideration is subsequently resolved. The estimate of variable consideration for expected future volume rebates/incentives, cash discounts etc. are made on the most likely amount method. Revenue is disclosed net of such amounts.
Significant financing component Generally, the Company receives short-term advances from its customers. Using the practical expedient in Ind AS 115, the Company does not adjust
the promised amount of consideration for the effects of a significant financing component if it expects, at contract inception, that the period between the transfer of the promised good or service to the customer and when the customer pays for that good or service will be one year or less.
Warranty obligations The Company typically provides warranties for general repairs of defects as per terms of the contract with customers, These assurance-type warranties
are accounted for under Ind AS 37 Provisions, Contingent Liabilities and Contingent Assets. Refer to the accounting policy on warranty provisions in section (L) Provisions.
Financial Statements - Standalone
Notes to the financial statements for the year ended March 31, 2019

102 Varroc Engineering Limited
Sale of services Income from services is recognised on the basis of time/work completed as per contract with the customers. The Company collects goods and service
tax (GST) on behalf of the government and, therefore, it is not an economic benefit flowing to the Company. Hence, it is excluded from revenue.
Contract balances Trade receivables A receivable represents the Company’s right to an amount of consideration that is unconditional (i.e., only the passage of time is required before
payment of the consideration is due). Refer to accounting policy refer note S Financial instruments – Financial assets at amortised cost.
Contract Assets A contract asset is the right to consideration in exchange for goods or services transferred to the customer. If the Group performs by transferring
goods or services to a customer before the customer pays consideration or before payment is due, a contract asset is recognised for the earned consideration that is conditional
Contract liabilities A contract liability is the obligation to transfer goods to a customer for which the Company has received consideration (or an amount of consideration
is due) from the customer. If a customer pays consideration before the Company transfers goods or services to the customer, a contract liability is recognised when the payment is made. Contract liabilities are recognised as revenue when the Company performs under the contract.
Refund liabilities A refund liability is the obligation to refund some or all the consideration received (or receivable) from the customer and is measured at the amount
the Company ultimately expects it will have to return to the customer. The Company updates its estimates of refund liabilities (and the corresponding change in the transaction price) at the end of each reporting period.
Wind/solar power generation Income from the wind / solar power generation is recognised when earned on the basis of contractual arrangements with the buyers.
Export Incentives Income from duty drawback and export incentives is recognised on an accrual basis.
I) Foreign currency translation
The Company's financial statements are presented in INR, which is also the functional currency.
Transactions and balances Transactions in foreign currencies are initially recorded by the Company at their respective functional currency spot rates at the date the transaction
first qualifies for recognition.
Monetary assets and liabilities denominated in foreign currencies are translated at the functional currency spot rates of exchange at the reporting date.
Foreign exchange differences regarded as an adjustment to borrowing costs are presented in the statement of profit and loss, within finance costs. All other foreign exchange gains and losses are presented in the statement of profit and loss on a net basis within other gains/(losses).
Exchange differences arising on settlement or translation of monetary items are recognized in profit or loss with the exception of the following:
Exchange differences arising on monetary items that are designated as part of the hedge of the Company's net investment of a foreign operation. These are recognized in OCI until the net investment is disposed of, at which time, the cumulative amount is reclassified to profit or loss.
Tax charges and credits attributable to exchange differences on those monetary items are also recorded in OCI.
Non-monetary items that are measured in terms of historical cost in a foreign currency are translated using the exchange rates at the dates of the initial transactions. Non-monetary items measured at fair value in a foreign currency are translated using the exchange rates at the date when the fair value is determined. The gain or loss arising on translation of non-monetary items measured at fair value is treated in line with the recognition of the gain or loss on the change in fair value of the item (i.e., translation differences on items whose fair value gain or loss is recognized in OCI or profit or loss are also recognized in OCI or profit or loss, respectively).
J) Employee benefits
(i) Short-term obligations
Liabilities for wages and salaries, including non-monetary benefits that are expected to be settled wholly within 12 months after the end of the period in which the employees render the related service are recognized in respect of employees’ services up to the end of the reporting period and are measured at the amounts expected to be paid when the liabilities are settled. The liabilities are presented as current employee benefit obligations in the balance sheet.
(ii) Other long-term employee benefit obligations The liabilities for earned leaves are not expected to be settled wholly within 12 months after the end of the period in which the employees render
the related service. They are therefore measured as the present value of expected future payments to be made in respect of services provided
Financial Statements - Standalone
Notes to the financial statements for the year ended March 31, 2019

Annual Report 2018-19 103
by employees up to the end of the reporting period using the projected unit credit method. The benefits are discounted using the market yields at the end of the reporting period that have terms approximating to the terms of the related obligation. Remeasurements as a result of experience adjustments and changes in actuarial assumptions are recognised in profit or loss.
The obligations are presented as current liabilities in the balance sheet if the entity does not have an unconditional right to defer settlement for at least twelve months after the reporting period, regardless of when the actual settlement is expected to occur.
(iii) Post-employment obligations
The Company operates the following post-employment schemes:(a) defined benefit plans such as gratuity and(b) defined contribution plans such as provident fund
Gratuity obligations The liability or asset recognised in the balance sheet in respect of defined benefit gratuity plan is the present value of the defined benefit obligation at
the end of the reporting period less the fair value of plan assets. The defined benefit obligation is calculated annually by actuaries using the projected unit credit method.
The present value of the defined benefit obligation denominated in INR is determined by discounting the estimated future cash outflows by reference
to market yields at the end of the reporting period on government bonds that have terms approximating to the terms of the related obligation.
The net interest cost is calculated by applying the discount rate to the net balance of the defined benefit obligation and the fair value of plan assets. This cost is included in employee benefit expense in the statement of profit and loss.
Remeasurement gains and losses arising from experience adjustments and changes in actuarial assumptions are recognised in the period in which they occur, directly in other comprehensive income. They are included in retained earnings in the statement of changes in equity and in the balance sheet.
Changes in the present value of the defined benefit obligation resulting from plan amendments or curtailments are recognised immediately in profit or loss as past service cost.
Defined contribution plans The Company makes contributions to funds for certain employees to the regulatory authorities. The Company has no further payment obligations once
the contributions have been paid. The contributions are accounted for as defined contribution plans and the contributions are recognised as employee benefit expense when an employee renders the related service. Prepaid contributions are recognised as an asset to the extent that a cash refund or a reduction in the future payments is available.
(iv) Bonus plans
The Company recognises a liability and an expense for bonuses. The Company recognises a provision where contractually obliged or where there is a past practice that has created a constructive obligation.
(v) Termination benefits Termination benefits are payable when employment is terminated by the company before the normal retirement date, or when an employee
accepts voluntary redundancy in exchange for these benefits. The Company recognises termination benefits at the earlier of the following dates: (a) when the Company can no longer withdraw the offer of those benefits; and (b) when the entity recognises costs for a restructuring that is within the scope of Ind AS 37 and involves the payment of terminations benefits. In the case of an offer made to encourage voluntary redundancy, the termination benefits are measured based on the number of employees expected to accept the offer. Benefits falling due more than 12 months after the end of the reporting period are discounted to present value.
K) Income tax
Current tax Current income tax assets and liabilities are measured at the amount expected to be recovered from or paid to the taxation authorities.
Current income tax relating to items recognized outside profit or loss is recognized outside profit or loss (either in other comprehensive income or in equity). Current tax items are recognized in correlation to the underlying transaction either in OCI or directly in equity. Management periodically evaluates positions taken in the tax returns with respect to situations in which applicable tax regulations are subject to interpretation and establishes provisions where appropriate.
Deferred tax Deferred tax is provided using the liability method on temporary differences between the tax bases of assets and liabilities and their carrying amounts
for financial reporting purposes at the reporting date.
Deferred tax liabilities are recognized for all taxable temporary differences, except: - When the deferred tax liability arises from the initial recognition of goodwill or an asset or liability in a transaction that is not a business combination
and, at the time of the transaction, affects neither the accounting profit nor taxable profit or loss; - In respect of taxable temporary differences associated with investments in subsidiaries, associates and interests in joint ventures, when the timing of
the reversal of the temporary differences can be controlled and it is probable that the temporary differences will not reverse in the foreseeable future.
Financial Statements - Standalone
Notes to the financial statements for the year ended March 31, 2019
104 Varroc Engineering Limited
Deferred tax assets are recognised for all deductible temporary differences, the carry forward of unused tax credits and any unused tax losses. Deferred tax assets are recognised to the extent that it is probable that taxable profit will be available against which the deductible temporary differences, and the carry forward of unused tax credits and unused tax losses can be utilised, except:
- When the deferred tax asset relating to the deductible temporary difference arises from the initial recognition of an asset or liability in a transaction that is not a business combination and, at the time of the transaction, affects neither the accounting profit nor taxable profit or loss
- In respect of deductible temporary differences associated with investments in subsidiaries, associates and interests in joint ventures, deferred tax assets are recognised only to the extent that it is probable that the temporary differences will reverse in the foreseeable future and taxable profit will be available against which the temporary differences can be utilised.
Minimum alternate tax (MAT) paid in a year is charged to the statement of profit and loss as current tax for the year. The deferred tax asset is recognised for MAT credit available only to the extent that it is probable that the concerned company will pay normal income tax during the specified period, i.e., the period for which MAT credit is allowed to be carried forward. In the year in which the company recognizes MAT credit as an asset, it is created by way of credit to the statement of profit and loss and shown as part of deferred tax asset. The Company reviews the “MAT credit entitlement” asset at each reporting date and writes down the asset to the extent that it is no longer probable that it will pay normal tax during the specified period.
The carrying amount of deferred tax assets is reviewed at each reporting date and reduced to the extent that it is no longer probable that sufficient taxable profit will be available to allow all or part of the deferred tax asset to be utilised. Unrecognised deferred tax assets are re-assessed at each reporting date and are recognised to the extent that it has become probable that future taxable profits will allow the deferred tax asset to be recovered.
Deferred tax assets and liabilities are measured at the tax rates that are expected to apply in the year when the asset is realised or the liability is settled, based on tax rates (and tax laws) that have been enacted or substantively enacted at the reporting date.
Deferred tax relating to items recognised outside profit or loss is recognised outside profit or loss (either in other comprehensive income or in equity). Deferred tax items are recognised in correlation to the underlying transaction either in OCI or directly in equity.
Deferred tax assets and deferred tax liabilities are offset if a legally enforceable right exists to set off current tax assets against current tax liabilities and the deferred taxes relate to the same taxable entity and the same taxation authority
L) Provisions
General Provisions are recognized when the Company has a present obligation (legal or constructive) as a result of a past event, it is probable that an outflow of
resources embodying economic benefits will be required to settle the obligation and a reliable estimate can be made of the amount of the obligation. When the Company expects some or all of a provision to be reimbursed, for example, under an insurance contract, the reimbursement is recognized as a separate asset, but only when the reimbursement is virtually certain. The expense relating to a provision is presented in the statement of profit or loss net of any reimbursement.
If the effect of the time value of money is material, provisions are discounted using a current pre-tax rate that reflects, when appropriate, the risks specific to the liability. When discounting is used, the increase in the provision due to the passage of time is recognized as a finance cost.
Warranty provisions Provisions for warranty-related costs are recognized when the product is sold or service provided to the customer. Initial recognition is based on
historical experience. The initial estimate of warranty-related costs is revised annually
Onerous contracts If the Company has a contract that is onerous, the present obligation under the contract is recognised and measured as a provision.
M) Earnings Per Share
(i) Basic earnings per share
Basic earnings per share is calculated by dividing the profit attributable to owners of the Company by the weighted average number of equity shares outstanding during the reporting period. The weighted average number of equity shares outstanding during the period and for all periods presented is adjusted for events, such as bonus shares, other than the conversion of potential equity shares that have changed the number of equity shares outstanding, without a corresponding change in resources.
(ii) Diluted earnings per share Diluted earnings per share adjusts the figures used in the determination of basic earnings per share to take into account:
• the after income tax effect of interest and other financing costs associated with dilutive potential equity shares, and• the weighted average number of additional equity shares that would have been outstanding assuming the conversion of all dilutive
potential equity shares.
Dilutive potential equity shares are deemed converted as at the beginning of the period, unless issued at a later date. Dilutive potential equity shares are determined independently for each period presented.
The number of equity shares and potentially dilutive equity shares are adjusted retrospectively for all period presented for any share splits and bonus shares issues including for changes effected prior to the authorization for issue of the financial statements by the Board of Directors.
Financial Statements - Standalone
Notes to the financial statements for the year ended March 31, 2019

Annual Report 2018-19 105
N) Cash and Cash Equivalents Cash and cash equivalent in the balance sheet comprise cash at banks and on hand and short-term deposits with an original maturity of three months
or less, which are subject to an insignificant risk of changes in value.
For the purpose of the statement of cash flows, cash and cash equivalents consist of cash and short-term deposits, as defined above, net of outstanding bank overdrafts as they are considered an integral part of the Company's cash management. Bank overdraft are shown within borrowings in current liabilities in the Balance sheet.
O) Dividends
Provision is made for the amount of any dividend declared, being appropriately authorised and no longer at the discretion of the entity, on or before the end of the reporting period but not distributed at the end of the reporting period.
P) Segment reporting
In accordance with paragraph 4 of notified Ind AS 108 "Operating segments", the Company has disclosed segment information only on the basis of the consolidated financial statements.
Q) Financial Instruments
Financial Assets
Initial Recognition and measurement All financial assets are recognized initially at fair value plus, in the case of financial assets not recorded at fair value through profit and loss, transactions
costs that are attributable to the acquisition of the financial asset. Transaction costs of financial assets carried at fair value through profit or loss are expensed in profit or loss.
Subsequent measurementFor purposes of subsequent measurement, financial assets are classified in four categories:• Debt instruments at amortized cost• Debt instruments at fair value through other comprehensive income (FVTOCI)• Debt instruments, derivatives and equity instruments at fair value through profit or loss (FVTPL)• Equity instruments measured at fair value through other comprehensive income (FVTOCI)
Debt instruments at amortized cost A 'debt instrument' is measured at the amortized cost if both the following conditions are met:
(a) The asset is held within a business model whose objective is to hold assets for collecting contractual cash flows, and
(b) Contractual terms of the asset give rise on specified dates to cash flows that are solely payments of principal and interest (SPPI) on the principal amount outstanding.
This category is the most relevant to the Company. After initial measurement, such financial assets are subsequently measured at amortized cost using the effective interest rate (EIR) method. Amortized cost is calculated by taking into account any discount or premium on acquisition and fees or costs that are an integral part of EIR. The EIR amortization is included in finance costs/income in the Statement of Profit or Loss. The losses arising from impairment are recognized in the Statement of profit or loss. This category generally applies to trade and other receivables.
Debt instruments at FVTOCI A 'debt instrument' is classified as at the FVTOCI if both of the following criteria are met:
(a) The objective of the business model is achieved both by collecting contractual cash flows and selling the financial assets, and
(b) The asset's contractual cash flows represent SPPI.
Debt instruments included within the FVTOCI category are measured initially as well as at each reporting date at fair value. Fair value movements are recognized in the other comprehensive income (OCI). However, the Company recognizes interest income, impairment losses and reversals and foreign exchange gain or loss in the P&L. On de-recognition of the asset, cumulative gain or loss previously recognized in OCI is reclassified from the equity to P&L. Interest earned whilst holding FVTOCI debt instrument is reported as interest income under EIR method.
Debt instruments at FVTPL FVTPL is a residual category for debt instruments. Any debt instrument, which does not meet the criteria for categorization as at amortized cost or as
FVTOCI is classified as FVTPL.
In addition, the Company may elect to designate a debt instrument, which otherwise meets amortized cost or FVTOCI criteria, as at FVTPL. However, such election is allowed only if doing so reduces or eliminates a measurement or recognition inconsistency (referred to as 'accounting mismatch'). The Company has not designated any debt instruments as at FVTPL.
Financial Statements - Standalone
Notes to the financial statements for the year ended March 31, 2019

106 Varroc Engineering Limited
Debt instruments included within the FVTPL category are measured at fair value with all changes recognized in P&L.
Equity investments All equity investments in scope of Ind-AS 109 are measured at fair value. Equity instruments which are held for trading and contingent consideration
recognized by an acquirer in a business combination to which Ind-AS 103 applies are classified as at FVTPL. For all other equity instruments, the Company may make an irrevocable election to present in other comprehensive income subsequent changes in the fair value. The Company makes such an election on an instrument-by-instrument basis. This classification is made on initial recognition and is irrevocable.
If the Company decides to classify an equity instrument at FVTOCI, then all fair value changes on the instrument, excluding dividends, are recognized in the OCI. There is no recycling of the amounts from OCI to P&L, even on the sale of the investment. However, the Company may transfer the cumulative gain or loss within equity.
Equity instruments included within the FVTPL category are measured at fair value with all changes recognized in P&L.
Derecognition A financial asset (or, where applicable, a part of a financial asset or part of a company of similar financial assets) is primarily derecognized (i.e. removed
from the Company balance sheet) when:
-The rights to receive cash flows from the asset have expired, or -The Company has transferred its rights to receive cash flows from the asset or has assumed an obligation to pay the received cash flows in full
without material delay to a third party under a "pass-through" arrangement; and either (a) the company has transferred substantially all the risks and rewards of the asset, or (b) the Company has neither transferred nor retained substantially all the risks and rewards of the asset, but has transferred control of the asset.
When the Company has transferred its rights to receive cash flows from an asset or has entered into a pass-through arrangement, it evaluates if and to what extent it has retained the risks and rewards of ownership. When it has neither transferred nor retained substantially all of the risks and rewards of the asset, nor transferred control of the asset, the Company continues to recognize the transferred asset to the extent of the Company continuing involvement. In that case, the Company also recognizes an associated liability. The transferred asset and the associated liability are measured on a basis that reflects the rights and obligations that the Company has retained.
Continuing involvement that takes the form of a guarantee over the transferred asset is measured at the lower of the original carrying amount of the asset and the maximum amount of consideration that the Company could be required to repay.
Impairment of financial assets In accordance with Ind-AS 109, the Company applies expected credit loss (ECL) model for measurement and recognition of impairment loss on the
following financial assets and credit risk exposure:-
(a) Financial assets that are debt instruments, and are measured at amortized cost e.g. loans, debt securities, deposits, trade receivables and bank balance(b) Financial assets that are debt instruments and are measured at FVTOCI(c) Lease receivables under Ind-AS 17(d) Trade receivables or any contractual right to receive cash or another financial asset that result from transactions that are within the scope of Ind AS 18 (e) Loan commitments which are not measured as at FVTPL(f) Financial guarantee contracts which are not measured as at FVTPL
The Company follows 'simplified approach' for recognition of impairment loss allowance on: -Trade receivables
-All lease receivables resulting from transactions within the scope of Ind AS 17
The application of simplified approach does not require the Company to track changes in credit risk. Rather, it recognizes impairment loss allowance based on lifetime ECLs at each reporting date, right from its initial recognition.
For recognition of impairment loss on other financial assets and risk exposure, the Company determines that whether there has been a significant increase in the credit risk since initial recognition. If credit risk has not increased significantly, 12-month ECL is used to provide for impairment loss. However, if credit risk has increased significantly, lifetime ECL is used. If, in a subsequent period, credit quality of the instrument improves such that there is no longer a significant increase in credit risk since initial recognition, then the entity reverts to recognizing impairment loss allowance based on 12-month ECL.
Lifetime ECL are the expected credit losses resulting from all possible default events over the expected life of a financial instrument. The 12-month ECL is a portion of the lifetime ECL which results from default events on a financial instrument that are possible within 12 months after the reporting date.
ECL is the difference between all contractual cash flows that are due to the company is in accordance with the contract and all the cash flows that the entity expects to receive (i.e. all cash shortfalls), discounted at the original EIR. When estimating the cash flows, an entity is required to consider:
-All contractual terms of the financial instrument (including prepayment, extension, call and similar options) over the expected life of the financial instrument. However, in rare cases when the expected life of the financial instrument cannot be estimated reliably, then the entity is required to use the remaining contractual term of the financial instrument.
Financial Statements - Standalone
Notes to the financial statements for the year ended March 31, 2019

Annual Report 2018-19 107
-Cash flows from the sale of the collateral held or other credit enhancements that are integral to the contractual terms.
As a practical expedient, the Company uses a provision matrix to determine impairment loss allowance on portfolio of its trade receivables. The provision matrix is based on its historically observed default rates over the expected life of the trade receivables and is adjusted for forward-looking estimates. At every reporting date, the historical observed default rates are updated and changes in the forward-looking estimates are analysed.
ECL impairment loss allowance (or reversal) recognized during the period is recognized as income/expense in the statement of profit and loss (P&L). This amount is reflected under the head 'other expenses' in the P&L. The balance sheet presentation for various financial instruments is described below:
Financial assets measured at amortized cost, contract assets and lease receivables: ECL is presented as an allowance, i.e. as an integral part of the measurement of those assets in the balance sheet. The allowance reduces the net
carrying amount. Until the asset meets write-off criteria, the Company does not reduce impairment allowance from the gross carrying amount.
Loan commitments and financial guarantee contracts: ECL is presented as a provision in the balance sheet i.e. as a liability.
Debt instruments measured at FVTOCI: Since financial assets are already reflected at fair value, impairment allowance is not further reduced from its value. Rather, ECL amount is presented as 'accumulated impairment amount' in the OCI.
For assessing increase in credit risk and impairment loss, the Company combines financial instruments on the basis of shared credit risk characteristics with the objective of facilitating an analysis that is designed to enable significant increases in credit risk to be identified on a timely basis.
The Company does not have any purchased or originated credit-impaired (POCI) financial assets, i.e., financial assets which are credit impaired on purchase/origination.
Financial liabilities
Initial recognition and measurement Financial liabilities are classified, at initial recognition, as financial liabilities at fair value through profit or loss, loans and borrowings, payables, or as
derivatives designated as hedging instruments in an effective hedge, as appropriate.
All financial liabilities are recognized initially at fair value and, in the case of loans and borrowings and payables, net of directly attributable transaction costs.
The Company's financial liabilities include trade and other payables, loans and borrowings including bank overdrafts, financial guarantee contracts and derivative financial instruments.
Subsequent measurement The measurement of financial liabilities depends on their classification, as described below:
- Financial liabilities at fair value through profit or loss Financial liabilities at fair value through profit or loss include financial liabilities held for trading and financial liabilities designated upon initial recognition
as at fair value through profit or loss. Financial liabilities are classified as held for trading if they are incurred for the purpose of repurchasing in the near term. This category also includes derivative financial instruments entered into by the company that are not designated as hedging instruments in hedge relationships as defined by Ind-AS 109. Separated embedded derivatives are also classified as held for trading unless they are designated as effective hedging instruments. Gains or losses on liabilities held for trading are recognized in the profit or loss.
Financial liabilities designated upon initial recognition at fair value through profit or loss are designated at the initial date of recognition, and only if the
criteria in Ind-AS 109 are satisfied. For liabilities designated as FVTPL, fair value gains/losses attributable to changes in own credit risk are recognized in OCI. These gains/losses are not subsequently transferred to P&L. However, the company may transfer the cumulative gain or loss within equity. All other changes in fair value of such liability are recognized in the statement of profit or loss. The Company has not designated any financial liability as at fair value through profit and loss.
Loans and borrowings This is the category most relevant to the Company. After initial recognition, interest-bearing loans and borrowings are subsequently measured at
amortized cost using the effective interest rate ( EIR) method. Gains and losses are recognized in profit or loss when the liabilities are derecognized as well as through the EIR amortization process.
Amortized cost is calculated by taking into account any discount or premium on acquisition and fees or costs that are an integral part of the EIR. The EIR amortization is included as finance costs in the statement of profit or loss. This category generally applies to interest bearing loans and borrowings.
Financial guarantee contracts Financial guarantee contracts issued by the Company are those contracts that require a payment to be made to reimburse the holder for a loss it
incurs because the specified debtor fails to make a payment when due in accordance with the terms of the debt instrument. Financial guarantee contracts are recognized initially as a liability at fair value, adjusted for transaction costs that are directly attributable to the issuance of the guarantee. Subsequently, the liability is measured at the higher of the amount of loss allowance determined as per the impairment requirements of Ind-AS 109 and the amount recognized less cumulative amortization.
Derecognition A financial liability is derecognized when the obligation under the liability is discharged or cancelled or expires when an existing financial liability
is replaced by another from the same lender on substantially different terms, or the terms of an existing liability are substantially modified, such an
Financial Statements - Standalone
Notes to the financial statements for the year ended March 31, 2019

108 Varroc Engineering Limited
exchange or modification is treated as the derecognition of the original liability and the recognition of a new liability. The difference in the respective carrying amounts is recognized in the statement of profit or loss.
Embedded Derivatives If the hybrid contract contains a host that is a financial asset within the scope of Ind-AS 109, the company does not separate embedded derivatives.
Rather, it applies the classification requirements contained in Ind-AS 109 to the entire hybrid contract.
Derivatives embedded in all other host contracts are accounted for as separate derivatives and recorded at fair value if their economic characteristics and risks are not closely related to those of the host contracts and the host contracts are not held for trading or designated at fair value through profit or loss. These embedded derivatives are measured at fair value with changes in fair value recognized in profit or loss, unless designated as effective hedging instruments. Reassessment only occurs if there is either a change in the terms of the contract that significantly modifies the cash flows that would otherwise be required or a reclassification of a financial asset out of the fair value through profit or loss.
Embedded derivatives closely related to the host contracts are not separated.
Embedded foreign currency derivatives Embedded foreign currency derivatives are not separated from the host contract if they are closely related. Such embedded derivatives are closely related
to the host contract, if the host contract is not leveraged, does not contain any option feature and requires payments in one of the following currencies:
-the functional currency of any substantial party to that contract,
-the currency in which the price of the related good or service that is acquired or delivered is routinely denominated in commercial transactions around the world,
-a currency that is commonly used in contracts to purchase or sell non-financial items in the economic environment in which the transaction takes place (i.e. relatively liquid and stable currency)
Foreign currency embedded derivatives which do not meet the above criteria are separated and the derivative is accounted for at fair value through profit and loss. The Company currently does not have any such derivatives which are not closely related.
Fair value measurement The Company measures financial instruments, such as, derivatives at fair value at each balance sheet date.
Fair value is the price that would be received to sell an asset or paid to transfer a liability in an orderly transaction between market participants at the measurement date. The fair value measurement is based on the presumption that the transaction to sell the asset or transfer the liability takes place either:
- In the principal market for the asset or liability, or - In the absence of a principal market, in the most advantageous market for the asset or liability
The principal or the most advantageous market must be accessible by the Company. The fair value of an asset or a liability is measured using the assumptions that market participants would use when pricing the asset or liability, assuming that market participants act in their economic best interest.
A fair value measurement of a non-financial asset takes into account a market participant’s ability to generate economic benefits by using the asset in its highest and best use or by selling it to another market participant that would use the asset in its highest and best use.
The Company uses valuation techniques that are appropriate in the circumstances and for which sufficient data are available to measure fair value, maximizing the use of relevant observable inputs and minimizing the use of unobservable inputs. All assets and liabilities for which fair value is measured or disclosed in the financial statements are categorized within the fair value hierarchy, described as follows, based on the lowest level input that is significant to the fair value measurement as a whole:
Level 1 — Quoted (unadjusted) market prices in active markets for identical assets or liabilities Level 2 — Valuation techniques for which the lowest level input that is significant to the fair value measurement is directly or indirectly observable Level 3 — Valuation techniques for which the lowest level input that is significant to the fair value measurement is unobservable
For assets and liabilities that are recognized in the financial statements on a recurring basis, the Company determines whether transfers have occurred between levels in the hierarchy by re-assessing categorisation (based on the lowest level input that is significant to the fair value measurement as a whole) at the end of each reporting period.
For the purpose of fair value disclosures, the Company has determined classes of assets and liabilities on the basis of the nature, characteristics and risks of the asset or liability and the level of the fair value hierarchy as explained above.
This note summarizes accounting policy for fair value. Other fair value related disclosures are given in the relevant notes. Disclosures for valuation methods, significant estimates and assumptions (Note 43) Quantitative disclosures of fair value measurement hierarchy (Note 43) Financial instruments (including those carried at amortized cost) (Note 44, 45 and 46)
Financial Statements - Standalone
Notes to the financial statements for the year ended March 31, 2019

Annual Report 2018-19 109
Derivative financial instruments and hedge accounting
Initial recognition and subsequent measurement The Company uses derivative financial instruments, such as forward currency contracts and interest rate swaps, to hedge its foreign currency risks
and interest rate risks, respectively. Such derivative financial instruments are initially recognized at fair value on the date on which a derivative contract is entered into and are subsequently re-measured at fair value. Derivatives are carried as financial assets when the fair value is positive and as financial liabilities when the fair value is negative.
Any gains or losses arising from changes in the fair value of derivatives are taken directly to profit or loss, except for the effective portion of cash flow hedges, which is recognized in OCI and later reclassified to profit or loss when the hedge item affects profit or loss or treated as basis adjustment if a hedged forecast transaction subsequently results in the recognition of a non-financial asset or non-financial liability.
For the purpose of hedge accounting, hedges are classified as:
1) Fair value hedges when hedging the exposure to changes in the fair value of a recognized asset or liability or an unrecognized firm commitment
2) Cash flow hedges when hedging the exposure to variability in cash flows that is either attributable to a particular risk associated with a recognized asset or liability or a highly probable forecast transaction or the foreign currency risk in an unrecognized firm commitment
3) Hedges of a net investment in a foreign operation
At the inception of a hedge relationship, the Company formally designates and documents the hedge relationship to which the Company wishes to apply hedge accounting and the risk management objective and strategy for undertaking the hedge. The documentation includes the Company's risk management objective and strategy for undertaking hedge, the hedging/ economic relationship, the hedged item or transaction, the nature of the risk being hedged, hedge ratio and how the entity will assess the effectiveness of changes in the hedging instrument's fair value in offsetting the exposure to changes in the hedged item's fair value or cash flows attributable to the hedged risk. Such hedges are expected to be highly effective in achieving offsetting changes in fair value or cash flows and are assessed on an ongoing basis to determine that they actually have been highly effective throughout the financial reporting periods for which they were designated.
Hedges that meet the strict criteria for hedge accounting are accounted for, as described below:
Cash flow hedges The effective portion of the gain or loss on the hedging instrument is recognized in OCI in the cash flow hedge reserve, while any ineffective portion
is recognized immediately in the statement of profit or loss.
The Company uses derivative contracts as hedges of its exposure to foreign currency risk in forecast transactions and firm commitments. The ineffective portion relating to foreign currency contracts is recognized in finance costs.
Amounts recognized as OCI are transferred to profit or loss when the hedged transaction affects profit or loss, such as when the hedged financial income or financial expense is recognized or when a forecast sale occurs. When the hedged item is the cost of a non-financial asset or non-financial liability, the amounts recognized as OCI are transferred to the initial carrying amount of the non-financial asset or liability.
If the hedging instrument expires or is sold, terminated or exercised without replacement or rollover (as part of the hedging strategy), or if its designation as a hedge is revoked, or when the hedge no longer meets the criteria for hedge accounting, any cumulative gain or loss previously recognized in OCI remains separately in equity until the forecast transaction occurs or the foreign currency firm commitment is met.
Reclassification of financial assets and liabilities The Company determines classification of financial assets and liabilities on initial recognition. After initial recognition, no reclassification is made for
financial assets which are equity instruments and financial liabilities.
For financial assets which are debt instruments, a reclassification is made only if there is a change in the business model for managing those assets. Changes to the business model are expected to be infrequent.
The Company senior management determines changes in the business model as result of external or internal changes which are significant to the company operations. Such changes are evident to external parties. A change in the business model occurs when the company either begins or ceases to perform an activity that is significant to the operations.
If the Company reclassifies financial assets, it applies the reclassification prospectively from the reclassification date which is the first day of the immediately next reporting period following the change in business model. The Company does not restate any previously recognized gains, losses (including impairment gains or losses) or interest.
Financial Statements - Standalone
Notes to the financial statements for the year ended March 31, 2019

110 Varroc Engineering Limited
The following table shows various reclassifications and how they are accounted for:
Original Classification Revised Classification Accounting Treatment
Amortized cost FVTPL Fair value is measured at reclassification date. Difference between previous amortized cost and fair value is recognized in P&L.
FVTPL Amortized cost Fair value at reclassification date becomes its new gross carrying amount. EIR is calculated based on the new gross carrying amount.
Amortized cost FVTOCI Fair value is measured at reclassification date. Difference between previous amortized cost and fair value is recognized in OCI. No change in EIR due to reclassification.
FVTOCI Amortized cost Fair value at reclassification date becomes its new amortized cost carrying amount. However, cumulative gain or loss in OCI is adjusted against fair value. Consequently, the asset is measured as if it had always been measured at amortized cost.
FVTPL FVTOCI Fair value at reclassification date becomes its new carrying amount. No other adjustment is required.
FVTOCI FVTPL Assets continue to be measured at fair value. Cumulative gain or loss previously recognized in OCI is reclassified to P&L at the reclassification date.
R) Contingent liabilities
A disclosure for a contingent liability is made where there is a possible obligation that arises from past events and the existence of which will be confirmed only by the occurrence or non-occurrence of one or more uncertain future events not wholly within the control of the Company or a present obligation that arises from the past events where it is either not probable that an outflow of resources will be required to settle the obligation or a reliable estimate of the amount cannot be made.
2.1 Changes in accounting policies and disclosures
New and amended standards
The Company applied Ind AS 115 for the first time. The application of Ind AS 115 does not have any material recognition and measurement impact. However, disclosures as required under Ind AS 115 in respect of revenue from contracts with customers have been given.
Several other amendments and interpretations apply for the first time in March 2019, but do not have an impact on the financial statements of the Company. The Company has not early adopted any standards or amendments that have been issued but are not yet effective.
Ind AS 115 Revenue from Contracts with Customers
Ind AS 115 supersedes Ind AS 11 Construction Contracts and Ind AS 18 Revenue and it applies, with limited exceptions, to all revenue arising from contracts with customers. Ind AS 115 establishes a five-step model to account for revenue arising from contracts with customers and requires that revenue be recognised at an amount that reflects the consideration to which an entity expects to be entitled in exchange for transferring goods or services to a customer. In addition, the standard requires extensive disclosures.
The Company adopted Ind AS 115 using the modified retrospective method of adoption with the date of initial application of 1 April 2018. There was no material impact on application of Ind AS 115. The comparative information for previous year was not restated and continues to be reported under previously applicable standards.
Financial Statements - Standalone
Notes to the financial statements for the year ended March 31, 2019
Annual Report 2018-19 111
Note 2A: Significant accounting judgements, estimates and assumptions
The preparation of the Company’s financial statements requires management to make judgments, estimates and assumptions that affect the reported amounts of revenues, expenses, assets, liabilities and the accompanying disclosures, and the disclosure of contingent liabilities. Uncertainty about these assumptions and estimates could result in outcomes that require a material adjustment to the carrying amount of assets or liabilities affected in future periods.
Judgements In the process of applying the Company’s accounting policies, there are no significant judgements made by the management.
Estimates and assumptions The key assumptions concerning the future and other key sources of estimation uncertainty at the reporting date, that have a significant risk of causing
a material adjustment to the carrying amounts of assets and liabilities within the next financial year, are described below. The Company based its assumptions and estimates on parameters available when the financial statements were prepared. Existing circumstances and assumptions about future developments, however, may change due to market changes or circumstances arising that are beyond the control of the Company. Such changes are reflected in the assumptions when they occur.
1) Defined benefit plans The cost of the defined benefit gratuity plan and the present value of the gratuity obligation are determined using actuarial valuation. An actuarial
valuation involves making various assumptions that may differ from actual developments in the future. These include the determination of the discount rate, future salary increases and mortality rates. Due to the complexities involved in the valuation and its long-term nature, a defined benefit obligation is highly sensitive to changes in these assumptions. All assumptions are reviewed at each reporting date.
Further details about gratuity obligation are given in Note 42.
2) Deferred taxes At each reporting date, the Company assesses whether the realization of future tax benefits is sufficiently probable to recognize/carry forward
deferred tax assets (including MAT credits). This assessment requires the use of significant estimates/assumptions with respect to assessment of future taxable income. The recorded amount of total deferred tax assets could change if estimates of projected future taxable income change or if changes in current tax regulations are enacted.
Note 2B: Standards issued but not yet effective
1) Ind AS 116 - Leases
Ind AS 116 - Leases was notified by MCA on 30 March 2019 and it replaces Ind AS 17 - Leases, including appendices thereto. Ind AS 116 is effective for annual periods beginning on or after 1 April 2019. Ind AS 116 sets out the principles for the recognition, measurement, presentation and disclosure of leases and requires lessees to account for all leases under a single on-balance sheet model similar to the accounting for finance leases under Ind AS 17. The standard includes two recognition exemptions for lessees – leases of ‘low-value’ assets (e.g., personal computers) and short-term leases (i.e., leases with a lease term of 12 months or less). At the commencement date of a lease, a lessee will recognise a liability to make lease payments (i.e., the lease liability) and an asset representing the right to use the underlying asset during the lease term (i.e., the right-of-use asset). Lessees will be required to separately recognise the interest expense on the lease liability and the depreciation expense on the right-of-use asset.
Lessees will be also required to remeasure the lease liability upon the occurrence of certain events (e.g., a change in the lease term, a change in future lease payments resulting from a change in an index or rate used to determine those payments). The lessee will generally recognise the amount of the remeasurement of the lease liability as an adjustment to the right-of-use asset.
Lessor accounting under Ind AS 116 is substantially unchanged from the current accounting under Ind AS 17. Lessors will continue to classify all leases using the same classification principle as in Ind AS 17 and distinguish between two types of leases: operating and finance leases.
The Company intends to adopt Ind AS 116 from 1 April 2019. As the Company does not have material leases, therefore the adoption of this standard is not likely to have a material impact in its financial statements.
2) Other Amendments to Standards, issued but not effective, which are either not applicable to the Company or the impact is not expected to be material
(a) Appendix C to Ind AS 12 Uncertainty over Income Tax Treatment
(b) Amendments to Ind AS 109: Prepayment Features with Negative Compensation
(c) Amendments to Ind AS 19: Plan Amendment, Curtailment or Settlement
(d) Amendments to Ind AS 28: Long-term interests in associates and joint ventures (e) Annual improvement to Ind AS (2018): - Amendments to Ind AS 103: Party to a Joint Arrangements obtains control of a business that is a Joint Operation - Amendments to Ind AS 111: Joint Arrangements - Amendments to Ind AS 12: Income Taxes - Amendments to Ind AS 23: Borrowing Costs
Financial Statements - Standalone
Notes to the financial statements for the year ended March 31, 2019
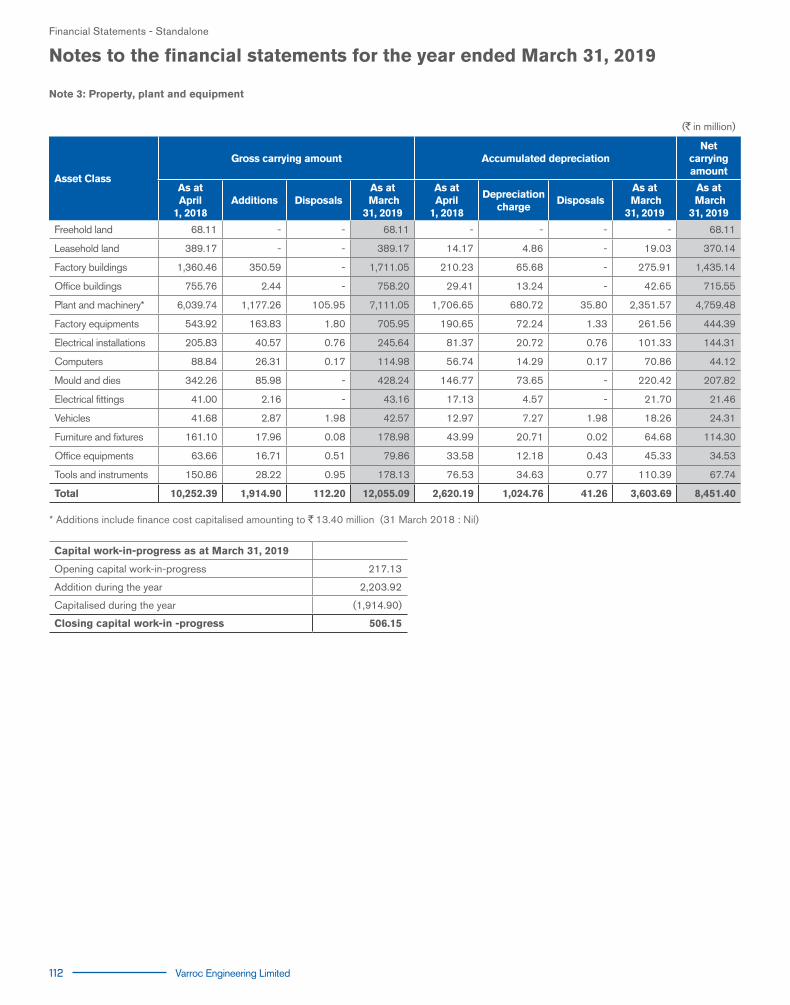
112 Varroc Engineering Limited
Note 3: Property, plant and equipment
(`in million)
Asset Class
Gross carrying amount Accumulated depreciation Net
carryingamount
As at April
1, 2018Additions Disposals
As at March31, 2019
As at April
1, 2018
Depreciation charge
DisposalsAs at
March31, 2019
As at March31, 2019
Freehold land 68.11 - - 68.11 - - - - 68.11
Leasehold land 389.17 - - 389.17 14.17 4.86 - 19.03 370.14
Factory buildings 1,360.46 350.59 - 1,711.05 210.23 65.68 - 275.91 1,435.14
Office buildings 755.76 2.44 - 758.20 29.41 13.24 - 42.65 715.55
Plant and machinery* 6,039.74 1,177.26 105.95 7,111.05 1,706.65 680.72 35.80 2,351.57 4,759.48
Factory equipments 543.92 163.83 1.80 705.95 190.65 72.24 1.33 261.56 444.39
Electrical installations 205.83 40.57 0.76 245.64 81.37 20.72 0.76 101.33 144.31
Computers 88.84 26.31 0.17 114.98 56.74 14.29 0.17 70.86 44.12
Mould and dies 342.26 85.98 - 428.24 146.77 73.65 - 220.42 207.82
Electrical fittings 41.00 2.16 - 43.16 17.13 4.57 - 21.70 21.46
Vehicles 41.68 2.87 1.98 42.57 12.97 7.27 1.98 18.26 24.31
Furniture and fixtures 161.10 17.96 0.08 178.98 43.99 20.71 0.02 64.68 114.30
Office equipments 63.66 16.71 0.51 79.86 33.58 12.18 0.43 45.33 34.53
Tools and instruments 150.86 28.22 0.95 178.13 76.53 34.63 0.77 110.39 67.74
Total 10,252.39 1,914.90 112.20 12,055.09 2,620.19 1,024.76 41.26 3,603.69 8,451.40
* Additions include finance cost capitalised amounting to `13.40 million (31 March 2018 : Nil)
Capital work-in-progress as at March 31, 2019
Opening capital work-in-progress 217.13
Addition during the year 2,203.92
Capitalised during the year (1,914.90)
Closing capital work-in -progress 506.15
Financial Statements - Standalone
Notes to the financial statements for the year ended March 31, 2019

Annual Report 2018-19 113
(`in million)
Asset Class
Gross carrying amount Accumulated depreciation Net
carryingamount
As at April
1, 2017Additions Disposals
As at March31, 2018
As at April
1, 2017
Depreciation charge
DisposalsAs at
March31, 2018
As at March31, 2018
Freehold land 68.11 - - 68.11 - - - - 68.11
Leasehold land 360.90 28.27 - 389.17 9.38 4.79 - 14.17 375.00
Factory buildings 1,343.05 17.41 - 1,360.46 144.45 65.78 - 210.23 1,150.23
Office buildings 714.32 127.44 86.00 755.76 22.75 9.98 3.32 29.41 726.35
Plant and machinery 5,433.85 653.17 47.28 6,039.74 1,076.00 653.56 22.91 1,706.65 4,333.09
Factory equipments 474.75 82.10 12.93 543.92 125.76 69.25 4.36 190.65 353.27
Electrical installations 194.96 10.87 - 205.83 57.65 23.72 - 81.37 124.46
Computers 75.92 13.03 0.11 88.84 39.39 17.46 0.11 56.74 32.10
Mould and dies 279.69 77.32 14.75 342.26 89.62 58.30 1.15 146.77 195.49
Electrical fittings 40.77 0.28 0.05 41.00 11.66 5.50 0.03 17.13 23.87
Vehicles 16.05 29.55 3.92 41.68 10.61 6.14 3.78 12.97 28.71
Furniture and fixtures 115.11 45.99 - 161.10 26.10 17.89 - 43.99 117.11
Office equipments 52.03 11.93 0.30 63.66 21.62 12.21 0.25 33.58 30.08
Tools and instruments 106.25 47.98 3.37 150.86 45.10 32.09 0.66 76.53 74.33
Total 9,275.76 1,145.34 168.71 10,252.39 1,680.09 976.67 36.57 2,620.19 7,632.20
Capital work-in-progress as at March 31, 2018
Opening capital work-in-progress 253.13
Addition during the year 1,109.34
Capitalised during the year (1,145.34)
Closing capital work-in -progress 217.13
(i) Contractual obligations Refer to note 48 for disclosure of contractual commitments for the acquisition of property, plant and equipment.
(ii) Office building includes premises on ownership basis in a Co-Operative Society `6.3 Million, including cost of shares therein of `125/- per share.
Financial Statements - Standalone
Notes to the financial statements for the year ended March 31, 2019
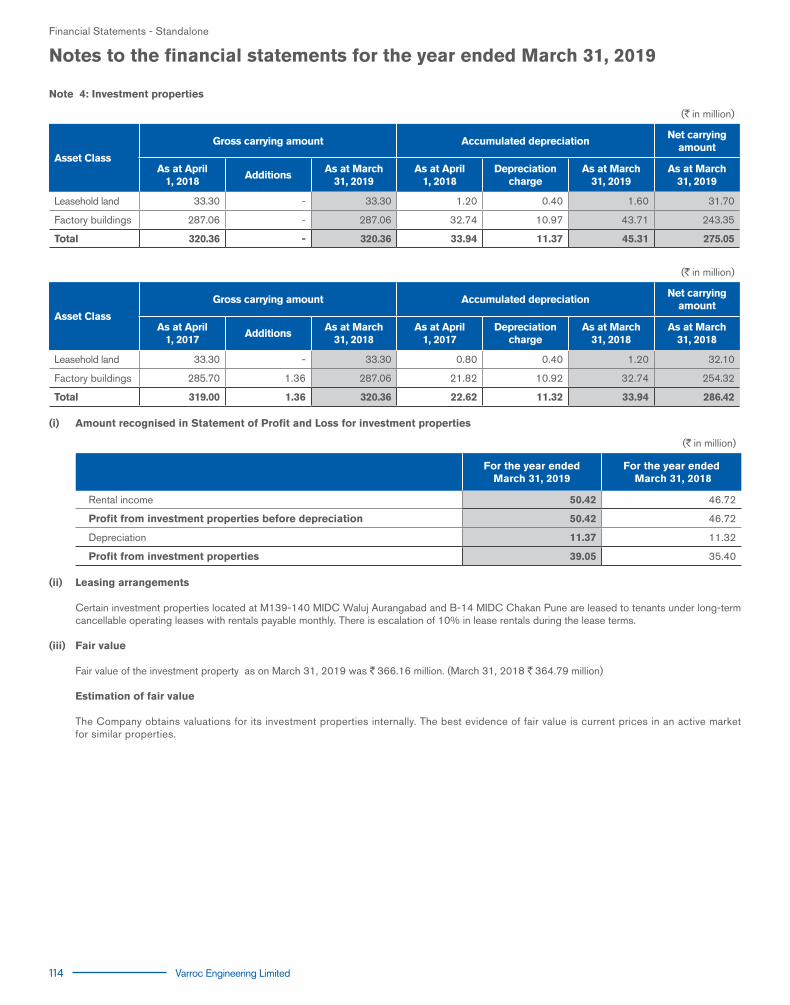
114 Varroc Engineering Limited
Note 4: Investment properties
(`in million)
Asset Class
Gross carrying amount Accumulated depreciation Net carrying
amount
As at April 1, 2018
AdditionsAs at March
31, 2019As at April
1, 2018Depreciation
chargeAs at March
31, 2019As at March
31, 2019
Leasehold land 33.30 - 33.30 1.20 0.40 1.60 31.70
Factory buildings 287.06 - 287.06 32.74 10.97 43.71 243.35
Total 320.36 - 320.36 33.94 11.37 45.31 275.05
(`in million)
Asset Class
Gross carrying amount Accumulated depreciation Net carrying
amount
As at April 1, 2017
AdditionsAs at March
31, 2018As at April
1, 2017Depreciation
chargeAs at March
31, 2018As at March
31, 2018
Leasehold land 33.30 - 33.30 0.80 0.40 1.20 32.10
Factory buildings 285.70 1.36 287.06 21.82 10.92 32.74 254.32
Total 319.00 1.36 320.36 22.62 11.32 33.94 286.42
(i) Amount recognised in Statement of Profit and Loss for investment properties
(`in million)
For the year ended March 31, 2019
For the year ended March 31, 2018
Rental income 50.42 46.72
Profit from investment properties before depreciation 50.42 46.72
Depreciation 11.37 11.32
Profit from investment properties 39.05 35.40 (ii) Leasing arrangements
Certain investment properties located at M139-140 MIDC Waluj Aurangabad and B-14 MIDC Chakan Pune are leased to tenants under long-term cancellable operating leases with rentals payable monthly. There is escalation of 10% in lease rentals during the lease terms.
(iii) Fair value Fair value of the investment property as on March 31, 2019 was `366.16 million. (March 31, 2018 `364.79 million)
Estimation of fair value The Company obtains valuations for its investment properties internally. The best evidence of fair value is current prices in an active market
for similar properties.
Financial Statements - Standalone
Notes to the financial statements for the year ended March 31, 2019

Annual Report 2018-19 115
Note 5: Intangible Assets
(`in million)
Asset class
Gross carrying amount AmortisationNet carrying
amount
As at April 1, 2018
AdditionsAs at March
31, 2019As at April
1, 2018Amortisation
chargeAs at March
31, 2019As at March
31, 2019
Software 140.78 39.35 180.13 72.83 34.39 107.22 72.91
Technical Knowhow 28.06 - 28.06 4.96 4.67 9.63 18.43
Total 168.84 39.35 208.19 77.79 39.06 116.85 91.34
Intangible assets under development as at March 31, 2019
Opening balance 5.97
Addition during the year 63.39
Capitalised during the year (39.35)
Closing balance 30.01
(`in million)
Asset class
Gross carrying amount AmortisationNet carrying
amount
As at April 1, 2017
AdditionsAs at March
31, 2018As at April
1, 2017Amortisation
chargeAs at March
31, 2018As at March
31, 2018
Software 87.57 53.21 140.78 47.81 25.02 72.83 67.95
Technical Knowhow 8.94 19.12 28.06 1.86 3.10 4.96 23.10
Total 96.51 72.33 168.84 49.67 28.12 77.79 91.05
Intangible assets under development as at March 31, 2018
Opening balance 0.21
Addition during the year 78.09
Capitalised during the year (72.33)
Closing balance 5.97
Financial Statements - Standalone
Notes to the financial statements for the year ended March 31, 2019

116 Varroc Engineering Limited
(`in million)
As at March31, 2019
As at March31, 2018
6(a) Investments in subsidiaries and joint venture
(i) Investments in subsidiaries- equilty investments at cost fully paid up (unquoted) Face value
per share
Number of Shares
As at March
31, 2019
As at March
31, 2018
Durovalves India Private Limited `10.00 31,44,730 31,44,730 324.78 324.78
Varroc Lighting Systems (India) Private Limited `10.00 4,39,997 4,39,997 445.09 445.09
Varroc Polymers Private Limited `10.00 5,29,100 5,29,100 500.00 500.00
Varroc European Holding B.V. €100.00 2,07,670 2,07,670 1,300.42 1,300.42
Aries Mentor Holding B.V. €100.00 1,02,475 1,02,475 738.34 738.34
Varroc Corp Holding B.V. €100.00 3,70,712 3,70,712 2,871.08 2,871.08
Varroc Japan Co. Ltd ¥10.00 10,000 10,000 0.10 0.10
Total (A) 6,179.81 6,179.81
Less : Provision for impairment in equity investment instruments in subsidiaries ( B ) (1,532.72) (1,532.72)
Total non current investment (A-B) 4,647.09 4,647.09
(ii) Investment in joint venture - equity instruments at cost
Varroc Dell'Orto Private Limited* 0.25
Total ( C ) 0.25
Total (A+B+C) 4,647.34 4,647.09
* Equity shares are pending for allotment as on March 31, 2019
6 (b) Non-current investments
Facevalue per
share
Number of Shares
As atMarch
31, 2019
As atMarch
31, 2018Investment in equity instruments at FVTPL (unquoted)
The Saraswat Co-operative Bank Limited `10.00 6,000 6,000 0.06 0.06
Investment in government securities at amortised cost (unquoted)
National saving certificates 0.06 0.06
Total 0.12 0.12
7 Non-current - Loans
Security deposits (considered good) 23.35 17.45
Total Non-Current - Loans 23.35 17.45
8 Non-current - Other financial assets
Financial asset at amortised cost
Surrender value of keyman insurance receivable 98.23 -
Other assets 27.09 0.39
Total non-current other financial assets 125.32 0.39
Financial Statements - Standalone
Notes to the financial statements for the year ended March 31, 2019

Annual Report 2018-19 117
(`in million)
As at March31, 2019
As at March31, 2018
9 Other non-current assets
Capital advances 205.93 152.25
Provision for capital advances (2.41) (1.57)
203.52 150.68
Amount paid under protest (refer note 50) 1.46 1.73
Prepaid expenses 17.54 -
Vat recoverable 3.60 5.45
Government grant receivable 193.94 170.65
Total Other non-current assets 420.06 328.51
10 Inventories
Raw materials [Includes material in transit of `16.37 million (March 31, 2018 `28.19 million) 793.90 689.70
Work-in-progress 935.80 704.76
Finished goods[Includes finished goods in transit of `281.42 million (March 31, 2018 `284.41 million) 319.89 306.40
Stores and spare-parts [Includes stores-spares in transit of `0.11 million (March 31, 2018 `1.14 million) 88.09 99.59
Loose tools [Includes loose tools in transit of `NIL (March 31, 2018 `2.81 million) 103.51 129.51
Packing material 16.53 16.19
Renewable energy certificates - 0.75
Total 2,257.72 1,946.90
11 Current investment
Investment in mutual funds (unquoted) (at FVTPL)
Nil units of 'LIC MF Liquid Fund (March 31,2018 31.777 units ) - 0.10
Aggregate amount of fair value of unquoted investment - 0.10
12 Trade receivables
Trade receivables 2,839.30 3,788.17
Receivable from related parties (refer note 47) 225.58 106.05
Total 3,064.88 3,894.22
Break-up of security details
Unsecured, considered good* 3,060.46 3,888.43
Trade receivables - credit impaired 4.42 5.79
Total 3,064.88 3,894.22
Impairment allowance (Trade receivables - credit impaired) (4.42) (5.79)
Total 3,060.46 3,888.43
Non-current portion - -
Current portion 3,060.45 3,888.43
* There are no trade receivables which have significant increase in credit risk as at March 31, 2019 and March 31, 2018.
Credit periodTrade receivables are non-interest bearing and are generally on payment terms of 45 to 120 days.
No trade or other receivable are due from directors or other officers of the Company either severally or jointly with any other person. Nor any trade or other receivable are due from firms or private companies respectively in which any director is a partner, a director or a member.
Financial Statements - Standalone
Notes to the financial statements for the year ended March 31, 2019

118 Varroc Engineering Limited
(`in million)
As at March31, 2019
As at March31, 2018
Transferred receivablesThe carrying amounts of trade receivables as at March 31, 2018 include receivable which were subject to a factoring arrangement. Under the arrangement, the Company had transferred the relevant receivables to the factor in exchange for cash and was prevented from selling or pledging the receivables. However, Company had retained credit risk and late payment risk. The Company, therefore continued to recognise the transferred assets in its balance sheet as at March 31, 2018. The amount repayable under the factoring agreement is presented as unsecured borrowing as at March 31, 2018.
The relevant carrying amounts are as follows:
Total transferred receivables - 1,018.91
13 Cash and cash equivalents
Cash in hand 0.75 0.79
Bank balances
In current accounts 64.65 83.24
Total cash and cash equivalents 65.40 84.03
There are no restrictions with regard to cash and cash equivalents as at the end of the reporting period and prior period.
14 Other bank balances
Deposits with original maturity more than 3 months but less than 12 months 1.95 1.83
Total other bank balances 1.95 1.83
15 Current - Loans
Loans to related parties (Unsecured, considered doubtful) ( refer note 47 )*
Interest receivable 75.17 78.40
Less: Provision for doubtful interest (75.17) (78.40)
Unsecured, considered good
Security deposits 59.19 17.64
Loans to employees 1.20 1.07
Total current loans 60.39 18.71
16 Other financial assets (Current)
Derivative instruments at fair value through OCI (Cash flow hedge)
Foreign exchange forward contracts 17.56 38.26
Non-derivative financial asset at amortised cost
Accrued interest 0.14 0.08
Initial Public Offer expenses receivable* - 136.98
Others 0.02 -
Total other current financial assets 17.72 175.32
*During the previous year, Initial Public Offer expenses receivable comprise share issue expenses incurred in connection with the proposed Initial Public offer (IPO) by way of offer for sale by existing shareholders of the Company. These receivables include fees paid to stock exchanges, SEBI, lawyers, auditors etc., in connection with the IPO of the Company. As per the offer agreement between the Company and the selling shareholders, upon successful completion of the Offer, these expenses will be reimbursed by the selling shareholders in proportion to their respective Offered Shares sold pursuant to the Offer. Accordingly, the Company has classified these expenses as receivable from selling shareholders under other financial assets. Initial Public Offer expenses includes receivable from related parties refer note 47. Subsequently the above amount has been received from selling shareholders after listing date i.e. July 6, 2018.
17 Other current assets
Advance to suppliers 25.34 35.42
Prepaid expenses 58.81 51.22
Financial Statements - Standalone
Notes to the financial statements for the year ended March 31, 2019

Annual Report 2018-19 119
(`in million)
As at March31, 2019
As at March31, 2018
Balance with government authorities 0.90 1.03
Government grant receivable 147.05 107.19
Export and other incentives 88.43 22.84
Others 9.58 16.88
Total other current assets 330.11 234.58
18 Share capital Number of Shares
Movement in Authorised CapitalEquity Share
CapitalPreference
Share Capital
Opening Balance as on April 01, 2018 25,00,00,000 25,00,00,000
Closing Balance as on March 31, 2019 25,00,00,000 25,00,00,000
Authorized: 250.00 250.00
Equity shares of `1 each (previous year `1 each) 250.00 250.00
Preference shares of `1 each (previous year `1 each) 500.00 500.00
Issued, subscribed and paid-up:March
31, 2019March
31, 2018
Equity shares of `1 each (previous year `1 each) fully paid up 13,48,11,530 12,31,27,760 134.81 123.13
0.0001% Series "C" compulsorily convertible preference shares - 1,16,83,770 - 11.68
("Series C CCPS") of `1 each (previous year `1 each) fully paid up 134.81 134.81
(a) Movement in share capital Nos ̀ in Million Nos ̀ in Million
As atMarch
31, 2019
As atMarch
31, 2019
As atMarch
31, 2018
As atMarch
31, 2018Equity shares
Outstanding at the beginning of the year 12,31,27,760 123.13 1,23,12,766 123.13
0.001% series C CCPS 11,683,770 shares converted into equity shares 1,16,83,770 11.68 - -
Less- Capital reduction (Refer Note 18 (d)) - - (8,52,349) (8.52)
Add:- 0.0001% series B CCPS 8,52,359 shares converted into equity shares - - 8,52,359 8.52
Outstanding number of shares before considering the impact of sub division of equity shares 13,48,11,530 134.81 1,23,12,776 123.13
Adjusted closing number of shares on account of sub-division of equity shares (Refer Note 18 (d)) - - 12,31,27,760 123.13
Outstanding at the end of the year 13,48,11,530 134.81 12,31,27,760 123.13
Preference shares
Outstanding at the beginning of the year 1,16,83,770 11.68 20,20,736 20.20
Add/(Less) :- 0.0001% Series B CCPS 8.52359 shares converted in to equity shares during the year - - (8,52,359) (8.52)
Less:- 0.0001% series C CCPS 11,683,770 shares converted into equity shares during the year (1,16,83,770) (11.68) - -
Outstanding number of shares before considering the impact of sub division of preference shares - - 11,68,377 11.68
Adjusted number of shares on account of sub-division of preference shares (Refer Note 18 (c)) - 1,16,83,770 11.68
Outstanding at the end of the year - - 1,16,83,770 11.68
(b) Rights, preferences and restrictions attached to equity sharesEquity shares: The Company has equity shares having a par value of `1 per share (previous year `1- per share). In the event of liquidation, the equity shareholders are eligible to receive the remaining assets of the Company after distribution of all preferential amounts, in proportion to their shareholding. The dividend proposed by the Board of Directors is subject to the approval of the shareholders in the ensuing Annual General Meeting, except in case of interim dividend.
Financial Statements - Standalone
Notes to the financial statements for the year ended March 31, 2019

120 Varroc Engineering Limited
(`in million)
As at March31, 2019
As at March31, 2018
(c) Bonus issue of series C CCPSDuring the year ended March 31, 2017, the Company issued and allotted 1,168,377 Series C CCPS of ̀ 10/- each fully paid as bonus to eligible equity shareholders of the Company in the ratio of 57 fully paid up Series C CCPS for every 469 equity shares of the Company held by them. The Series C CCPS were non-cumulative, participating preference shares, mandatorily and fully convertible into equity shares on occurrence of the trigger event. The holder of each Series C CCPS were entitled to preferential dividend at the rate of 0.0001% per year on the face value. The Series C CCPS were entitled to participate, on a pari passu basis with Equity Shares, in any dividend distribution to the holders of Equity Shares on an ‘as if converted’ basis. For the purpose of dividend distribution, the Series C CCPS prior to their conversion would constitute 1.3% of the Equity Share Capital on a fully diluted basis. Under Ind AS, Series C CCPS were classified as an equity instrument based on the terms of the agreement and trigger event, which is earlier of:(i) the date on which the Company files a red herring prospectus with the SEBI for undertaking an IPO or (ii) IPO Veto Date; (iii) the Conversion Deadline, as defined in the terms of the agreement.
(d) Capital reductionDuring the previous year, the Company, pursuant to the provisions of Section 66 of the Companies Act, 2013 and the rules made thereunder, had filed a petition for reduction of 852,349 equity shares of `10 each held by wholly owned subsidiary Varroc Polymers Private Limited (VPPL) without any consideration. This scheme was approved by the National Company Law Tribunal (NCLT) and was filed with the Registrar of Companies (ROC) on December 18, 2017. The ROC registered the order on January 15, 2018 and the Company took on record this transaction at the Board Meeting on January 16, 2018. Pursuant to this transaction, share capital of `8.52 million has been transferred to Capital Reserve as at March 31, 2018.
(e) During the previous year, face value per equity share and preference share have been sub divided from `10 to `1. Further authorised share capital of the Company was reclassified from `500 million consisting of `165 million (165,000,000 equity Shares of `1/- each) and `335 million (335,000,000 preference shares of `1/- each) to `250 million (250,000,000 equity shares of `1/- each) and `250 million (Consisting of 250,000,000 preference shares of `1/- each).
(f) Details of shares held by shareholders holding more than 5% of the aggregate shares in the Company
As at March 31, 2019 As at March 31, 2018
Name of the Shareholder
Numbersof shares % of
shareholding
Numbersof shares % of
shareholdingFace value `1
Face value `1
Equity shares
Mr. Tarang Jain 6,07,29,800 45.05% 5,07,98,590 41.26%
TJ Holdings Trust 3,38,50,000 25.11% 3,38,50,000 27.49%
Omega TC Holdings PTE LTD - 0.00% 1,69,17,130 13.74%
Naresh Chandra Holdings Trust 1,00,00,000 7.42% 1,00,00,000 8.12%
Suman Jain Holdings Trust 1,00,00,000 7.42% 1,00,00,000 8.12%
Preference shares
Mr. Tarang Jain - - 1,16,83,770 100.00%
(g) Aggregate number of bonus shares issued during the five years immediately preceding March 31, 2019
0.0001% Series B CCPS and Series C CCPS allotted as fully paid up bonus shares out of securities premium during the year ended March 31, 2017.
No of Shares
20,20,736
The Company during the preceding 5 years:i. Has not allotted shares pursuant to contracts without payment received in cash.ii. Has not issued shares by way of bonus shares except as above.iii. Has not bought back any shares.
Financial Statements - Standalone
Notes to the financial statements for the year ended March 31, 2019

Annual Report 2018-19 121
(`in million)
As at March31, 2019
As at March31, 2018
19 Other equity
Reserves and surplus
Retained earnings
Balance at the beginning of the year 1,818.60 1,182.23
Add:- Profit for the year 1,195.40 698.30
Add:- items of other comprehensive income recognised directly in retained earning
Remeasurement of post-employment benefit obligation (net of tax) (11.81) 10.82
Less:- Interim dividend of `0.50 per equity share* of `1 each (previous year: `0.50 per equity share of `1 each) [(including dividend distribution tax `1.19 million) (Previous year `11.19 million)] [refer note 18 (c)]
(7.03) (72.75)
Balance at the end of the year 2,995.16 1,818.60
* paid in respect of CCPS converted into equity shares in the current year
General reserve
Balance at the beginning of the year 1,474.38 1,474.38
Balance at the end of the year 1,474.38 1,474.38
Capital reserve
Balance at the beginning of the year 8.52 -
Add:-On account of capital reduction ( Refer Note 18(d)) - 8.52
Balance at the end of the year 8.52 8.52
Debenture redemption reserve
Balance at the beginning of the year 200.00 200.00
Balance at the end of the year 200.00 200.00
Securities premium
Balance at the beginning of the year 6,481.43 6,481.43
Balance at the end of the year 6,481.43 6,481.43
Total reserves and surplus 11,159.49 9,982.93
Other reserves
Cash flow hedge reserve
Balance at the beginning of the year (2.27) (8.95)
Gain/ (Loss) on changes in fair value of hedging instruments 45.82 10.88
Income tax relating to gains/loss reclassified to profit and loss (16.01) (4.20)
Reclassification to Statement of Profit and Loss (34.19) -
Balance at the end of the year (6.65) (2.27)
Total other equity 11,152.84 9,980.66
Financial Statements - Standalone
Notes to the financial statements for the year ended March 31, 2019

122 Varroc Engineering Limited
(`in million)
As at March31, 2019
As at March31, 2018
Nature and purpose of reservesGeneral reserveGeneral reserve is the retained earning of the Company which is kept aside out of the Company's profits to meet future (known or unknown) obligations.
Debenture redemption reserveThe C ompany is required to create a debenture redemption reserve out of the profits which is available for payment of dividend for the purpose of redemption of debentures.
Capital reserveCapital reserve is not available for distribution as dividend. Securities premiumSecurities premium is used to record the premium on issue of shares. It is utilised in accordance with the provisions of the Companies Act, 2013.
Cash flow hedge reserveThe Company uses hedging instruments to hedge its exposure to movements in foreign exchange rates and interest rates, which are designated as cash flow hedges. To the extent these hedges are effective, the change in fair value of the hedging instrument is recognised in the cash flow hedge reserve. Amounts recognised in cash flow hedge reserve are reclassified to profit or loss when the hedged item affects profit or loss.
20 Non- current - Borrowings
Secured
Debentures - 800.00
800 8.10% Non convertible debentures of `1,000,000 each
Term loans
Rupee loans from banks 1,215.28 388.89
Foreign currency loans from banks 232.83 608.26
Rupee loans from financial Institutions 64.32 202.38
1,512.43 1,199.53
Buyer's credit (capital nature) - 122.41
Unsecured
Deferred sales tax loan 47.57 82.67
Total non-current borrowing 1,560.00 2,204.61
Maturity profile of non-current borrowings
ParticularsEffective Interest
Rate
Current (refer
note 27)
Non Current
2020-2021 2021-2022 2022-2023 2023-2024 Total
Term Loans 8.55% to 11.% 725.49 645.26 374.11 305.56 187.50 1,512.43
Debentures 8.10% 800.00 - - - - -
Deferred Sales Tax Loan 35.10 25.25 16.12 6.20 - 47.57
1,560.59 670.51 390.23 311.76 187.50 1,560.00
1) Rupee term loans , foreign currency loan (ECB) are secured by:a) ECB Loan from ICICI Bank secured by first pari-passu charge by way of joint mortgage of immovable properties of the Company located at E-4, L-6/2, and L-4 MIDC ,Waluj, Aurangabad-431136. b) Foreign currency loan from CITI Bank N.A. is secured by first pari-passu charge on movable fixed assets of crankshaft unit both present and future located at M-191/3, MIDC, Waluj, Aurangabad - 431136. c) Foreign currency loan from CITI Bank N.A. is secured by first pari-passu charge on movable fixed assets of solar unit both present and future located at Sakri, Dhule.
Financial Statements - Standalone
Notes to the financial statements for the year ended March 31, 2019
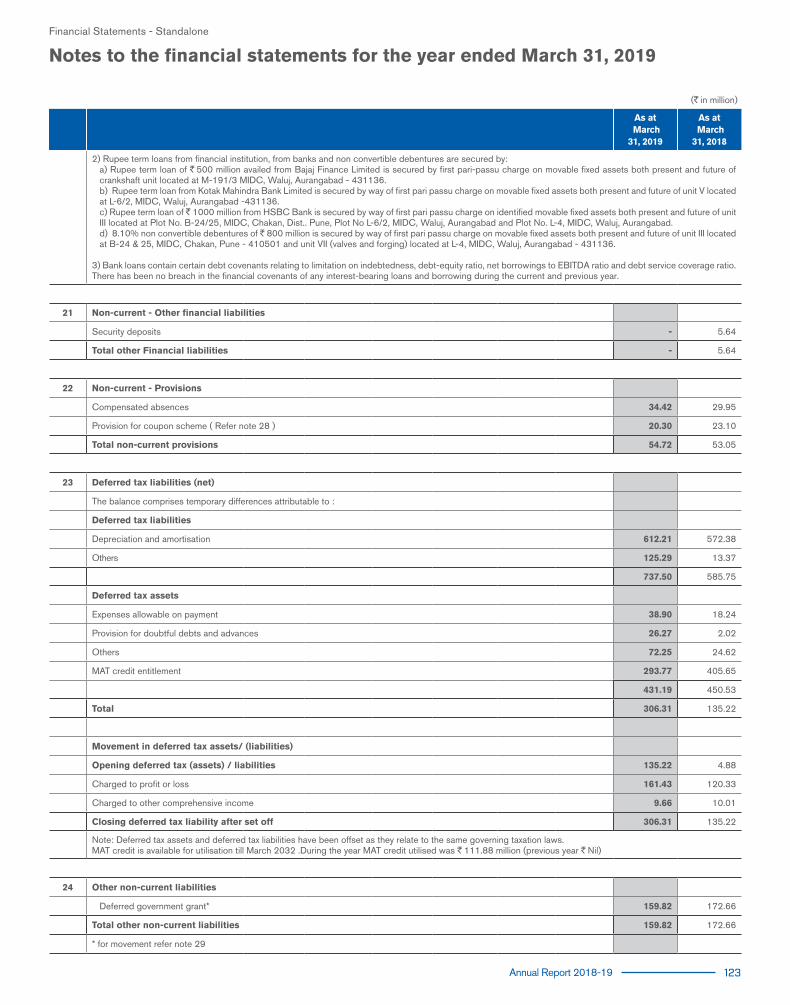
Annual Report 2018-19 123
(`in million)
As at March31, 2019
As at March31, 2018
2) Rupee term loans from financial institution, from banks and non convertible debentures are secured by:a) Rupee term loan of `500 million availed from Bajaj Finance Limited is secured by first pari-passu charge on movable fixed assets both present and future of crankshaft unit located at M-191/3 MIDC, Waluj, Aurangabad - 431136. b) Rupee term loan from Kotak Mahindra Bank Limited is secured by way of first pari passu charge on movable fixed assets both present and future of unit V located at L-6/2, MIDC, Waluj, Aurangabad -431136.c) Rupee term loan of `1000 million from HSBC Bank is secured by way of first pari passu charge on identified movable fixed assets both present and future of unit III located at Plot No. B-24/25, MIDC, Chakan, Dist.. Pune, Plot No L-6/2, MIDC, Waluj, Aurangabad and Plot No. L-4, MIDC, Waluj, Aurangabad.d) 8.10% non convertible debentures of `800 million is secured by way of first pari passu charge on movable fixed assets both present and future of unit III located at B-24 & 25, MIDC, Chakan, Pune - 410501 and unit VII (valves and forging) located at L-4, MIDC, Waluj, Aurangabad - 431136.
3) Bank loans contain certain debt covenants relating to limitation on indebtedness, debt-equity ratio, net borrowings to EBITDA ratio and debt service coverage ratio. There has been no breach in the financial covenants of any interest-bearing loans and borrowing during the current and previous year.
21 Non-current - Other financial liabilities
Security deposits - 5.64
Total other Financial liabilities - 5.64
22 Non-current - Provisions
Compensated absences 34.42 29.95
Provision for coupon scheme ( Refer note 28 ) 20.30 23.10
Total non-current provisions 54.72 53.05
23 Deferred tax liabilities (net)
The balance comprises temporary differences attributable to :
Deferred tax liabilities
Depreciation and amortisation 612.21 572.38
Others 125.29 13.37
737.50 585.75
Deferred tax assets
Expenses allowable on payment 38.90 18.24
Provision for doubtful debts and advances 26.27 2.02
Others 72.25 24.62
MAT credit entitlement 293.77 405.65
431.19 450.53
Total 306.31 135.22
Movement in deferred tax assets/ (liabilities)
Opening deferred tax (assets) / liabilities 135.22 4.88
Charged to profit or loss 161.43 120.33
Charged to other comprehensive income 9.66 10.01
Closing deferred tax liability after set off 306.31 135.22
Note: Deferred tax assets and deferred tax liabilities have been offset as they relate to the same governing taxation laws.MAT credit is available for utilisation till March 2032 .During the year MAT credit utilised was `111.88 million (previous year `Nil)
24 Other non-current liabilities
Deferred government grant* 159.82 172.66
Total other non-current liabilities 159.82 172.66
* for movement refer note 29
Financial Statements - Standalone
Notes to the financial statements for the year ended March 31, 2019

124 Varroc Engineering Limited
(`in million)
As at March31, 2019
As at March31, 2018
25 Current borrowingsMaturity
DateTerms of
RepaymentInterest
rate
Secured
Cash credit On Demand On Demand9.15% to11.80%
31.17 52.64
Unsecured
Working capital facilities
Factored receivables/Bill discounting Various 45 days8.25% to 8.50%
- 1,018.91
From banks (Pre-shipment credit (PCRE)) Various 6 Month 5.15% 200.00 47.77
From financial institutions Various41 to 42
days8.45% - 605.00
Commercial papers 11.06.2019 90 days 7.93% 590.79 -
Total current borrowings 821.96 1,724.32
Total current borrowingsCash credit facilities availed from Corporation Bank, Standard Chartered Bank, HDFC Bank Limited, CITI Bank N.A, ICICI Bank Limited, IDBI Bank Limited and Kotak Mahindra Bank Limited are secured by first pari-passu charge by way of hypothecation of stocks of raw materials, work in progress, finished goods, consumable, stores and spares, packing materials and receivables of the Company both present and future.
Net debt reconciliationMarch
31, 2019March
31, 2018
Cash and cash equivalents including cash credit (refer note 13 ) 34.23 31.39
Current borrowings (790.79) (1,671.68)
Non-current borrowings includes current maturities of non-current borrowings (refer note 20 and 27) (3,120.59) (3,041.26)
Interest accrued but not due (refer note 27) (27.63) (28.04)
Net debt (3,904.78) (4,709.59)
Reconciliation of net debt as at March 31, 2019
ParticularsAs on April
1, 2018Cashflows
Interest expenses
Interest Paid
Cash flow hedge reserve
Gain / loss on sale of
investments
Forex revaluation
As atMarch
31, 2019
Cash and cash equivalent 31.39 2.84 34.23
Liquid Investment 0.10 (0.10) - -
Current borrowings 1,671.68 (880.89) 790.79
Non-current borrowings 3,041.26 33.66 34.19 11.48 3,120.59
Interest accrued but not due 28.04 392.01 392.42 27.63
Reconciliation of net debt as at March 31, 2018
ParticularsAs on April
1, 2017Cashflows
Interest expenses
Interest Paid
Cash flow hedge reserve
Gain / loss on sale of
investments
As atMarch
31, 2018
Cash and cash equivalent (99.48) 130.87 31.39
Liquid Investment - 0.48 0.58 0.10
Current borrowings 1,119.65 552.03 1,671.68
Non-current borrowings 3,581.39 (541.27) 1.14 3,041.26
Interest accrued but not due 32.33 401.50 405.79 28.04
Financial Statements - Standalone
Notes to the financial statements for the year ended March 31, 2019

Annual Report 2018-19 125
(`in million)
As at March31, 2019
As at March31, 2018
26 Trade payables
Total outstanding dues of micro enterprises and small enterprises (refer note 41) 504.25 8.75
Total outstanding dues other than micro enterprises and small enterprises and related parties 2,925.61 3,085.24
Trade payables to related parties (refer note 47) 74.79 149.30
Total trade payables 3,504.65 3,243.29
27 Current - Other financial liabilities
Financial liabilities at amortised costs
Current maturities of non-current borrowings (refer note 20) 1,560.59 836.65
Interest accrued but not due on borrowings 27.63 28.04
Payable for purchase of capital goods 234.61 274.78
Customer security deposits 49.43 36.75
Employee benefits payable 145.26 106.19
Financial liabilities at fair value through OCI (cash flow hedges)
Cross currency interest rate swap 6.98 48.59
Total other financial liabilities 2,024.50 1,331.00
28 Current - Provisions
Provision for employee benefits
Gratuity (refer note 42) 4.35 -
Compensated absences 4.84 4.58
Others
Provision for loan taken by subsidiary* 144.88 150.77
Provision for warranties** 32.91 23.32
Provision for coupon scheme*** 13.53 15.40
Total current provision 200.51 194.07
Particulars
WarrantiesProvision for loan taken
by subsidiaryProvision for coupon
scheme
March31, 2019
March31, 2018
March31, 2019
March31, 2018
March31, 2019
March31, 2018
Balance as at the beginning of the year
23.32 16.91 150.77 129.30 38.50 36.01
Additions during the year 34.64 24.32 - 21.47 16.57 12.91
Utilization/Reversed during the year (25.05) (17.91) (5.89) - (21.24) (10.42)
Balance as at the end of the year 32.91 23.32 144.88 150.77 33.83 38.50
Current Portion 32.91 23.32 144.88 150.77 13.53 15.40
Non-Current Portion - - - - 20.30 23.10
Total 32.91 23.32 144.88 150.77 33.83 38.50
* Provision for loan taken by subsidiary - One of the foreign subsidiary had taken intercorporate loan from another subsidiary for which the Company had given a guarantee. The Company has created a provision in the financial year 2013-14. against the same . Changes in the value of provision is due to foreign exchange restatement .
** Provision for warranties - The Company provides warranties on applicable products, for their satisfactory performance during the warranty period as per the contracts with buyers. Provision for warranty claims arising out of such obligation is made based on such warranty period. The impact of discounting is not material.
*** Provision for coupon scheme - Provision is made for supplies to other than OEMs on estimated cost of coupons redemption. These coupons are expected to be redeemed with in 2-3 years. Management estimates the provision based on historical claims information and any recent trends. The impact on discounting of the provision is not material.
Financial Statements - Standalone
Notes to the financial statements for the year ended March 31, 2019

126 Varroc Engineering Limited
(`in million)
As at March31, 2019
As at March31, 2018
29 Other current liabilities
Advance received from customers 43.00 57.43
Statutory dues payable (includes GST, TDS, PF payables) 60.16 98.15
Other payables 104.91 46.71
Deferred government grant * 44.12 34.53
Total other current liabilities 252.19 236.82
* Deferred government grantGrants from the government are recognised at their fair value where there is a reasonable assurance that the grant will be received and the company will comply with all attached conditions.Government grants relating to purchase of property, plant and equipment are included in current and non-current liabilities as deferred income and are credited to statement of profit or loss on straight-line basis over the expected lives of the related assets and presented within other income.
ParticularsMarch
31, 2019March
31, 2018
Balance as at the beginning of the year 207.19 61.10
Recognised during the year 176.91 251.33
Released to statement of profit and loss (refer note 31) 180.16 105.24
Balance as at the end of the year 203.94 207.19
Current portion 44.12 34.53
Non-current portion 159.82 172.66
Total 203.94 207.19
Financial Statements - Standalone
Notes to the financial statements for the year ended March 31, 2019
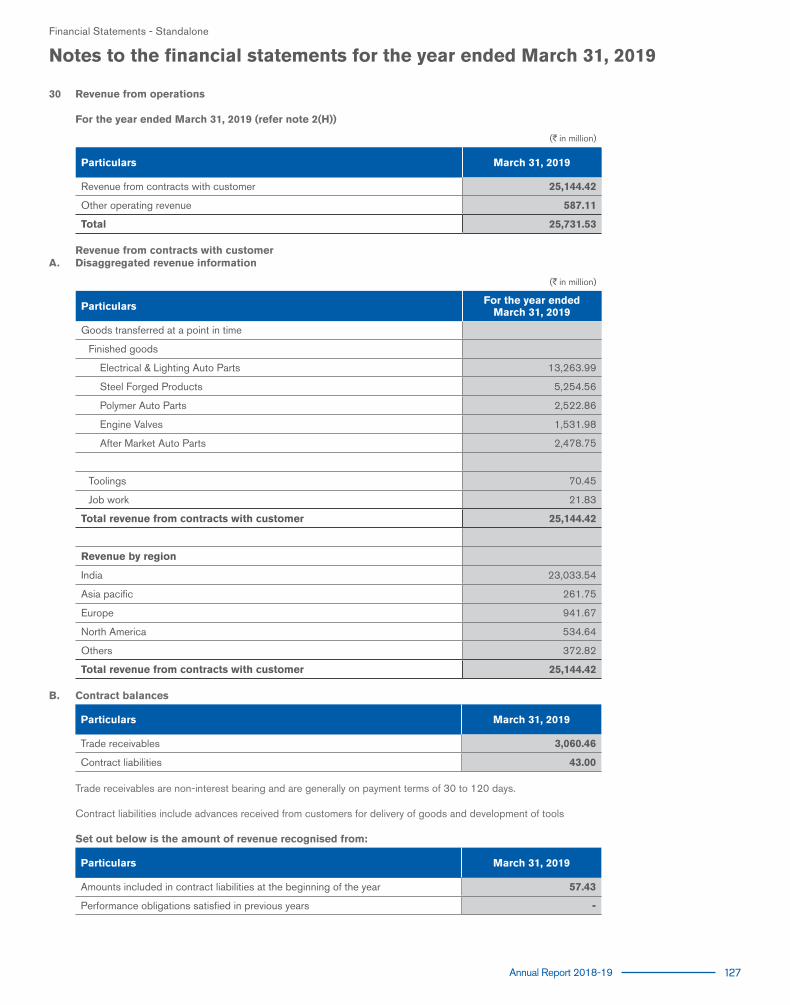
Annual Report 2018-19 127
30 Revenue from operations
For the year ended March 31, 2019 (refer note 2(H))
(`in million)
Particulars March 31, 2019
Revenue from contracts with customer 25,144.42
Other operating revenue 587.11
Total 25,731.53 Revenue from contracts with customerA. Disaggregated revenue information
(`in million)
Particulars For the year ended March 31, 2019
Goods transferred at a point in time
Finished goods
Electrical & Lighting Auto Parts 13,263.99
Steel Forged Products 5,254.56
Polymer Auto Parts 2,522.86
Engine Valves 1,531.98
After Market Auto Parts 2,478.75
Toolings 70.45
Job work 21.83
Total revenue from contracts with customer 25,144.42
Revenue by region
India 23,033.54
Asia pacific 261.75
Europe 941.67
North America 534.64
Others 372.82
Total revenue from contracts with customer 25,144.42
B. Contract balances
Particulars March 31, 2019
Trade receivables 3,060.46
Contract liabilities 43.00 Trade receivables are non-interest bearing and are generally on payment terms of 30 to 120 days.
Contract liabilities include advances received from customers for delivery of goods and development of tools
Set out below is the amount of revenue recognised from:
Particulars March 31, 2019
Amounts included in contract liabilities at the beginning of the year 57.43
Performance obligations satisfied in previous years -
Financial Statements - Standalone
Notes to the financial statements for the year ended March 31, 2019

128 Varroc Engineering Limited
C. Reconciling the amount of revenue recognised in the statement of profit and loss with the contracted price
Particulars March 31, 2019
Revenue as per contracted price 25,259.28
Adjustments
Discount (114.86)
Revenue from contract with customers 25,144.42 D. Performance obligation Revenue from contracts with customers include revenue from finished goods, tooling, and Job work.
Finished goods / tooling For the sale of finished goods the performance obligation is generally satisfied upon its delivery or as per the terms of the customer contract and
payment is generally due within 30 to 120 days from delivery. For sale of toolings, the performance obligation is considered satisfied on billing after approval of the part(s) by the customer. The Company generally receives advance for toolings contracts ranging from 30 % to 50% of the contracted price. The revenue from the sale of finished goods/toolings is measured at the fair value of the consideration received or receivable, net of returns and allowances, trade discounts and volume rebates.
The Company provides normal warranty provisions on some of its products sold, in line with the industry practice. The Company considers that the contractual promise made to the customer in the form of warranties for the parts supplied does not meet the definition of separate performance obligation as it does not give rise to additional service.
Job work revenue is recognised when the work is completed and billed to customer.
Other operating revenue
Particulars For the year ended March 31, 2019
Scrap sales 135.41
Wind and solar power generation 100.36
Export Incentives 131.19
Management fees 150.10
Others 70.05
Total other operating revenue 587.11
For the year ended March 31, 2018
Particulars For the year ended March 31, 2018
Revenue from operations
Sale of products
Finished goods 20,604.16
Other operating revenue
Wind and solar power generation 95.68
Job work receipts 4.40
Scrap sales 82.65
Export Incentives 66.61
Management fees 73.43
Others 27.81
Total revenue from operations 20,954.74
Revenue from contract with customers for the year ended March 31, 2018 includes excise duty, which is discontinued w.e.f. July 1, 2017 upon implementation of Goods and Services Tax (GST) in India. The Company collects GST on behalf of the Government. Hence, GST is not included in Revenue from contract with customers . In view of the aforesaid restructuring of Indirect taxes, Revenue from contract with customers for the year ended March 31, 2019 is not comparable with the previous year.
Financial Statements - Standalone
Notes to the financial statements for the year ended March 31, 2019

Annual Report 2018-19 129
(`in million)
For the yearended March
31, 2019
For the yearended March
31, 2018
31 Other income
Rent income from investment properties (refer note 4 ) 50.42 46.72
Dividend Income from equity investments carried at cost 6.62 6.62
Interest income
from financial assets measured at amortised cost 0.37 0.23
Others 4.85 0.61
Unwinding of discount on security deposit 1.94 1.49
Net gain on sale of investments - 0.58
Government grants* 180.16 105.24
Net foreign exchange gain - 69.53
Commission on corporate guarantees 64.79 47.29
Liabilities no longer required written back 19.89 -
Increase in surrender value of key man insurance 98.23 -
Miscellaneous income 87.57 9.40
Total other income 514.84 287.71
*Government grants relating to income are deferred and recognised in the statement of profit or loss over the period necessary to match them with the costs that they are intended to compensate and presented within other income.
32 Cost of materials consumed
Raw material at the beginning of the year 689.70 472.20
Add: Purchases 17,097.89 13,262.86
17,787.59 13,735.06
Less: Raw material at the end of the year 793.90 689.70
Total cost of materials consumed 16,993.69 13,045.36
33 Changes in Inventories of work-in-progress and finished goods
Opening balance
Work-in-progress 704.76 667.19
Finished goods 306.41 333.44
Total opening balance 1,011.17 1,000.63
Closing balance
Work-in-progress 935.80 704.76
Finished goods 319.89 306.41
Total closing balance 1,255.69 1,011.17
Total changes in inventories of work-in-progress and finished goods (244.52) (10.54)
34 Employee benefits expense
Salaries, wages and bonus 1,951.47 1,525.41
Contribution to gratuity and other funds (refer note 42) 121.96 113.35
Staff welfare expenses 122.70 115.00
Total employee benefits expense 2,196.13 1,753.76
Financial Statements - Standalone
Notes to the financial statements for the year ended March 31, 2019

130 Varroc Engineering Limited
(`in million)
For the yearended March
31, 2019
For the yearended March
31, 2018
35 Depreciation and amortisation expense
Depreciation of property, plant and equipment (refer note 3) 1,024.76 976.67
Depreciation of investment property (refer note 4) 11.37 11.32
Amortisation of intangible assets (refer note 5) 39.06 28.12
Total depreciation and amortisation 1,075.19 1,016.11
36 Finance costs
Interest on debts and borrowings 374.47 376.45
Exchange differences regarded as an adjustment to borrowing costs 3.98 12.43
Other borrowing cost 13.56 12.62
Total finance cost 392.01 401.50
37 Other Expenses
Consumption of stores and spares and loose tools 508.37 433.51
Consumption of packing materials 227.41 206.90
Repairs to
Buildings 14.61 6.79
Machinery 96.79 80.81
Others 138.65 115.65
Communication expenses 22.16 13.64
Water and electricity charges 645.03 544.93
Rent charges {refer note 48 (b)} 49.10 47.43
Rates and taxes 10.42 10.67
Contract labour cost 940.08 815.97
Legal and professional fees 74.59 87.59
Exchange loss (net) 12.72 -
Net loss on sale of tangible/ intangible assets 56.26 5.36
Travelling and conveyance 156.90 155.22
Insurance 14.85 15.48
Payment to auditors - refer note (a) below 9.26 9.89
Corporate social responsibility expenditure - refer note (b) below 30.99 18.59
Provision for doubtful loans, advances and debts (net) 0.45 6.81
Sales promotion, marketing and advertisement cost 80.78 64.37
Research and development expenses - refer note (c) below 449.12 357.91
Freight and forwarding expenses 337.68 326.75
Royalty 3.38 2.98
Warranties 34.64 24.32
Miscellaneous expenses 180.89 147.27
Total other expenses 4,095.13 3,498.84
(a) Payment to auditors
Statutory audit fees (including limited reviews) 8.20 2.89
Tax audit fees 0.30 0.28
Financial Statements - Standalone
Notes to the financial statements for the year ended March 31, 2019
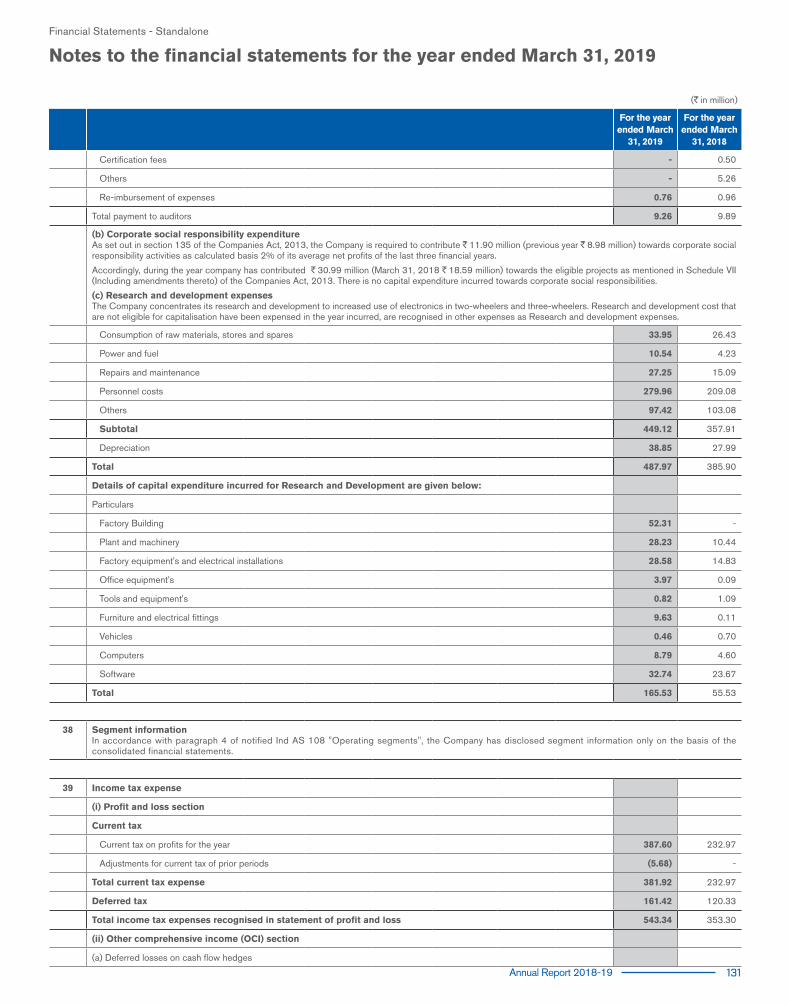
Annual Report 2018-19 131
(`in million)
For the yearended March
31, 2019
For the yearended March
31, 2018
Certification fees - 0.50
Others - 5.26
Re-imbursement of expenses 0.76 0.96
Total payment to auditors 9.26 9.89
(b) Corporate social responsibility expenditureAs set out in section 135 of the Companies Act, 2013, the Company is required to contribute `11.90 million (previous year `8.98 million) towards corporate social responsibility activities as calculated basis 2% of its average net profits of the last three financial years.
Accordingly, during the year company has contributed `30.99 million (March 31, 2018 `18.59 million) towards the eligible projects as mentioned in Schedule VII (Including amendments thereto) of the Companies Act, 2013. There is no capital expenditure incurred towards corporate social responsibilities.
(c) Research and development expensesThe Company concentrates its research and development to increased use of electronics in two-wheelers and three-wheelers. Research and development cost that are not eligible for capitalisation have been expensed in the year incurred, are recognised in other expenses as Research and development expenses.
Consumption of raw materials, stores and spares 33.95 26.43
Power and fuel 10.54 4.23
Repairs and maintenance 27.25 15.09
Personnel costs 279.96 209.08
Others 97.42 103.08
Subtotal 449.12 357.91
Depreciation 38.85 27.99
Total 487.97 385.90
Details of capital expenditure incurred for Research and Development are given below:
Particulars
Factory Building 52.31 -
Plant and machinery 28.23 10.44
Factory equipment's and electrical installations 28.58 14.83
Office equipment's 3.97 0.09
Tools and equipment's 0.82 1.09
Furniture and electrical fittings 9.63 0.11
Vehicles 0.46 0.70
Computers 8.79 4.60
Software 32.74 23.67
Total 165.53 55.53
38 Segment informationIn accordance with paragraph 4 of notified Ind AS 108 "Operating segments", the Company has disclosed segment information only on the basis of the consolidated financial statements.
39 Income tax expense
(i) Profit and loss section
Current tax
Current tax on profits for the year 387.60 232.97
Adjustments for current tax of prior periods (5.68) -
Total current tax expense 381.92 232.97
Deferred tax 161.42 120.33
Total income tax expenses recognised in statement of profit and loss 543.34 353.30
(ii) Other comprehensive income (OCI) section
(a) Deferred losses on cash flow hedges
Financial Statements - Standalone
Notes to the financial statements for the year ended March 31, 2019

132 Varroc Engineering Limited
Financial Statements - Standalone
(`in million)
For the yearended March
31, 2019
For the yearended March
31, 2018
Income tax charged to OCI (16.01) (4.20)
(b) Remeasurement of defined benefit obligation
Income tax charged to OCI 6.35 (5.81)
Total Deferred tax charged to OCI (9.66) (10.01)
Reconciliation of tax expense and the accounting profit :
Profit before tax 1,738.74 1,051.60
Tax rate 34.94% 34.61%
Income tax expense as per applicable tax rate 607.59 363.94
Tax effect of amounts which are not deductible (taxable) in calculating taxable income:
Weighted deduction on research and development expenditure (78.02) (71.17)
Corporate social responsibility expenditure 10.83 6.43
Disallowance u/s 14A of Income Tax Act, 1961 2.31 4.40
Exempt non-operating Income (2.31) (2.29)
Other non-deductible expenses 2.55 19.26
Tax expense of prior periods (5.68) -
Others 6.07 32.73
(64.25) (10.64)
543.34 353.30
40 Conversion to Public company and Initial Public OfferDuring the previous year, the shareholders at their meeting held on January 25, 2018, had approved for conversion of the Company from a “Private Limited Company” to “Public Limited Company”. Necessary documents were filed with the Ministry of Corporate Affairs and the same were approved by the Register of Companies (ROC) Mumbai on February 05, 2018.
During the year, the Company completed the Initial Public Offer (‘IPO’) (through offer for sale) and listing of its equity shares on recognised stock exchanges in India. The equity shares of the Company were listed on July 6, 2018. The IPO being an offer for sale, the issue proceeds were received by the selling shareholders who sold 20,221,730 equity shares in the IPO at a price of `967 per equity share. No new equity shares were issued by the Company. The expenses incurred for the IPO have been entirely reimbursed to the Company by the selling shareholders.
Note 41: Dues to micro and small enterprises
The Company has certain dues to suppliers registered under Micro, Small and Medium Enterprises Development Act, 2006 (‘MSMED Act’). The disclosures pursuant to the said MSMED Act are as follows:
(`in million)
Sr.no ParticularsMarch
31, 2019March
31, 2018
a) Principal amount due to suppliers registered under the MSMED Act and remaining unpaid as at year end 504.25 7.21
b) Interest due to suppliers registered under the MSMED Act and remaining unpaid as at year end 1.42 0.01
c) Principal amounts paid to suppliers registered under the MSMED Act, beyond the appointed day during the year 3,229.68 29.04
d) Interest paid, other than under section 16 of MSMED Act, to suppliers registered under the MSMED Act, beyond the appointed day during the year
- -
e) Interest paid, under section 16 of MSMED Act, to suppliers registered under the MSMED Act, beyond the appointed day during the year
- -
f) Interest due and payable towards suppliers registered under MSMED Act, for payments already made* 13.06 0.25
g) Further interest remaining due and payable for earlier years 1.54 1.28
* The above interest has not been provided for in the books of accounts.
The Company has a process of sending out confirmations to all vendors, regarding their status as MSME. Based on responses received, The Company marks vendors as MSME and others.
Notes to the financial statements for the year ended March 31, 2019

Annual Report 2018-19 133
Note 42: Employee benefit obligation
A. Defined contribution plans: The Company has certain defined contribution plans. Contributions are made to provident fund in India for employees at the rate of 12% of basic
salary as per regulations. The contributions are made to registered provident fund administered by the government. The obligation of the Company is limited to the amount contributed and it has no further contractual nor any constructive obligation. The expense recognised during the year towards defined contribution plan is as under :
(`in million)
March 31, 2019 March 31, 2018
(I) Contribution to Employees' provident fund 47.79 41.51
(II) Contribution to Employees' family pension fund 37.17 32.35
Total 84.96 73.86
B. Defined benefit plan (Gratuity) The Company provides for gratuity for employees in India as per the Payment of Gratuity Act, 1972. Employees who are in continuous service for
a period of 5 years are eligible for gratuity. The amount of gratuity payable on retirement/termination is the employees last drawn basic salary plus dearness allowance per month computed proportionately for 15 days salary multiplied for the number of years of service. The gratuity plan is a funded plan and the Company makes contributions to recognised funds in India. The Company does not fully fund the liability and maintains a target level of funding to be maintained over a period of time based on estimations of expected gratuity payments.
The amounts recognised in the balance sheet and the movements in the net defined benefit obligation over the year are as follows:
(`in million)
Particulars March 31, 2019 March 31, 2018
(a) Change in present value of benefit obligations
Liability at the beginning of the year 158.62 149.57
Service cost 27.47 28.84
Interest expense 12.18 10.29
Transfer of obligation (0.09) -
Remeasurements - Actuarial (gains)/ losses (refer note (e) below) 17.41 (16.53)
Benefits paid (9.01) (13.55)
Liability at the end of the year 206.58 158.62
(b) Change in fair value of plan assets
Fair value of plan assets at the beginning of the year 158.64 134.59
Interest income 13.82 10.24
"Remeasurements- Return on plan assets excluding amounts recognised in interest income (refer note (e) below)"
(0.75) 0.09
Contributions 39.83 27.27
Benefits paid (9.01) (13.55)
Fair value of plan assets at the end of the year 202.53 158.64
(c) The net liability disclosed above relates to funded plan is as follows:
Present value of defined benefit obligations 206.58 158.62
Fair value of plan assets 202.53 158.64
(Surplus)/Deficit 4.05 (0.02)
Financial Statements - Standalone
Notes to the financial statements for the year ended March 31, 2019

134 Varroc Engineering Limited
(`in million)
ParticularsFor the year ended
March 31, 2019For the year ended
March 31, 2018
(d) Expenses to be recognized in the Statement of Profit and Loss underemployee benefit expenses
Service cost 27.47 25.70
Past service cost* - 3.14
Net interest (income)/expense (1.64) 0.04
Net gratuity cost 25.83 28.88
*This pertains to past service cost on account of amendment to Payment of Gratuity (Amendment) Act, 2018 dated March 29, 2018, there is an increase in the existing ceiling limit of the amount of gratuity payable to employees who have completed five years of continuous service from `10 lakhs to `20 lakhs.
(e) Expenses to be recognized in statement of other comprehensive income:
Remeasurement
Experience (Gain)/ Losses on plan liabilities 9.98 (1.66)
(Return) / loss on plan assets excluding amounts recognised in interest (income)/expenses 0.75 (0.09)
(Gain)/loss from change in financial assumptions 7.43 (14.88)
18.16 (16.63)
(f) Valuation in respect of gratuity has been carried out by independent actuary, as at the balance sheet date, based on the following assumptions:
Discount rate 7.60% 7.90%
Salary growth rate 7.00% 7.00%
Weighted average duration of defined benefit obligation 11.28 11.40
Expected rate of return on plan assets 7.90% 7.20%
Withdrawal Rate
Service below 5 years 20.00% 20.00%
Service 5 years & above 2.00% 2.00%
The Company assesses these assumptions with its projected long-term plans of growth and prevalent industry standards. The discount rate is based on the government bonds.
Quantitative sensitivity analysis for significant assumptions are as follows:
(`in million)
Change in Assumption As at March 31, 2019 As at March 31, 2018
Increase/(decrease) in present value of defined benefit obligation as at the end of the year
(i) 1% increase in discount rate 11.28% 11.46%
(ii) 1% decrease in discount rate 13.56% 13.78%
(iii) 1% increase in rate of salary escalation 12.23% 12.49%
(iv) 1% decreasing rate of salary escalation 10.47% 10.68% Sensitivity for significant actuarial assumptions is computed by varying one actuarial assumption used for the valuation of the defined benefit obligation by 1%, keeping all other actuarial assumptions constant. When calculating the sensitivity of the defined benefit obligation to significant actuarial assumptions the same method(present value of defined benefit obligation calculated with the projected unit credit method at the end of reporting period) has been applied while calculating the defined benefit liability recognised in the balance sheet. The methods and types of assumptions used in preparing the sensitivity analysis did not change compared to the prior period.
Financial Statements - Standalone
Notes to the financial statements for the year ended March 31, 2019

Annual Report 2018-19 135
Major categories of plan assets are as follows:
(`in million)
ParticularsAs at March 31, 2019 As at March 31, 2018
Amount % Amount %
Funds managed by Insurer 202.53 100% 158.64 100%
Total 202.53 100% 158.64 100%
As the funds are managed wholly by the insurance company, the break-up of the plan assets is unavailable.
Actual return on assets for the year ended March 31, 2019 and year ended March 31, 2018 was `13.07 million and `10.34 million respectively.
The Company expects to contribute `20.00 million to the plan asset during the year ended March 31, 2020. During the year ended March 31, 2019, the Company has contributed amount of `39.83 million net of charges and taxes.
maturity profile of defined benefit obligation:
(`in million)
Particulars As at March 31, 2019 As at March 31, 2018
Within 1 year `8.03 `4.31
1-2 year `9.17 `6.47
2-3 year `12.08 `9.76
3-4 year `17.81 `12.41
4-5 year `16.42 `16.84
5-10 years `136.91 `113.96
RISK EXPOSURE AND ASSET LIABILITY MATCHING
Provision of a defined benefit scheme poses certain risks, some of which are detailed here under as companies take on uncertain long-term obligations to make future benefit payments.
1) Liability Risks
Asset-Liability mismatch risk- Risk which arises if there is a mismatch in the duration of the assets relative to the liabilities. By matching duration with the defined benefit liabilities,
the Company is successfully able to neutralize valuation swings caused by interest rate movements. Hence, companies are encouraged to adopt asset-liability management.
Discount rate risk-
Variations in the discount rate used to compute the present value of the liabilities may seem small, but in practice can have a significant impact on the defined benefit liabilities.
Future salary escalation and inflation risk -
Since price inflation and salary growth are linked economically, they are combined for disclosure purposes. Rising salaries will often resulting higher future defined benefit payments resulting in a higher present value of liabilities especially unexpected salary increases provided at management's discretion may lead to uncertainties in estimating this increasing risk.
2) Asset risks All plan assets are maintained in a trust fund managed by a public sector insurer viz; LIC of India. LIC has a sovereign guarantee and has been
providing consistent and competitive returns over the years. The Company has opted for a traditional fund wherein all assets are invested primarily in risk averse markets. The Company has no control over the
management of funds but this option provides a high level of safety for the total corpus. A single account is maintained for both the investment and claim settlement and hence 100% liquidity is ensured. Also, interest rate and inflation risk are taken care of.
Financial Statements - Standalone
Notes to the financial statements for the year ended March 31, 2019

136 Varroc Engineering Limited
Note 43: Fair Value Measurement
Financial instruments by category
(`in million)
Particulars
March 31, 2019 March 31, 2018
FVPL FVOCIAmortized
CostFVPL FVOCI
AmortizedCost
Financial assets
Investments
- Equity instruments 0.06 - - 0.06 - -
- Mutual funds - - - 0.10 - -
- Government securities - - 0.06 - - 0.06
Trade receivables - - 3,064.88 - - 3,894.22
Loans - - 83.74 - - 36.16
Cash and bank balances - - 67.35 - - 85.86
Derivative contracts 17.56 - 38.26 -
Other financial assets - - 125.48 - - 137.45
Total financial assets 17.62 - 3,341.51 38.42 - 4,153.75
Financial liabilities
Borrowings - - 3,942.55 - - 4,765.58
Derivative contracts 4.22 2.76 - - 48.59 -
Security deposits - - 49.43 - - 42.39
Trade payables - - 3,504.65 - - 3,243.29
Acceptances - - 212.10 - - 184.12
Other financial liabilities - - 407.50 - - 409.01
Total financial liabilities 4.22 2.76 8,116.23 - 48.59 8,644.39
(i) Fair value hierarchy The following table provides the fair value measurement hierarchy of the Companys assets and liabilities.
(`in million)
Quantitative disclosures fair value measurement hierarchy for assets as at March 31, 2019
Quoted prices
in active markets(Level 1)
Significant observable
inputs (Level 2)
Significant unobservable
inputs(Level 3)
Total
Assets measured at fair value
Equity instruments 0.06 - 0.06
Derivative contracts - 17.56 - 17.56
Total - 17.62 - 17.62
Liabilities measured at fair value
Derivative contracts - 2.76 - 2.76
Total - 2.76 - 2.76
Financial Statements - Standalone
Notes to the financial statements for the year ended March 31, 2019

Annual Report 2018-19 137
(`in million)
Quantitative disclosures fair value measurement hierarchy for assets as at March 31, 2018
Quoted prices
in active markets(Level 1)
Significant observable
inputs (Level 2)
Significant unobservable
inputs(Level 3)
Total
Assets measured at fair value
Equity instruments - 0.06 - 0.06
Investments - Mutual funds 0.10 - - 0.10
Derivative contracts - 38.26 - 38.26
Total 0.10 38.32 - 38.42
Liabilities measured at fair value
Derivative contracts - 48.59 - 48.59
Total - 48.59 - 48.59
(ii) Valuation technique used to determine fair value The following methods and assumptions were used to estimate the fair value of the financial instruments included in the above tables: - The fair values of the mutual funds are based on price quotations at the reporting date.
- The Company enters into derivative financial instruments with financial institutions with investment grade credit ratings. Foreign exchange forward contracts, interest rate swaps are valued using valuation techniques, which employs the use of market observable inputs. The most frequently applied valuation techniques include forward pricing model, using present value calculations. The models incorporate various inputs including the credit quality counterparties, foreign exchange spot and forward rates, yield curves of the respective currencies, currency basis spread between the respective currencies, interest rate curves etc. The changes in counterparty credit risk had no material effect on financial instruments recognised at fair value through profit and loss.
Commentary
The carrying amounts of trade receivables, loans, trade payables, cash and bank balances, security deposits, government securities, other financial assets, borrowings, other financial liabilities, acceptances are considered to be the same as their fair values, due to their short-term nature. The fair value of non-current financial assets and non-current liabilities also approximates its carrying value.
For financial assets and liabilities that are measured at fair value, the carrying amounts are equal to the fair values.
Note 44: Financial risk management
The Company’s principal financial liabilities, other than derivatives, comprise loans and borrowings, trade and other payables, and financial guarantee contracts. The main purpose of these financial liabilities is to finance the Company’s operations and to provide guarantees to support its operations. The Company’s principal financial assets include loans, trade and other receivables, and cash and cash equivalents that derive directly from its operations. The Company also enters into derivative transactions.
The Company is exposed to market risk, credit risk and liquidity risk. The Company’s senior management oversees the management of these risks. All derivative activities for risk management purposes are carried out by specialist teams that have the appropriate skills, experience and supervision. It is the Company’s policy that no trading in derivatives for speculative purposes may be undertaken. The Board of Directors reviews and agrees policies for managing each of these risks, which are summarised below:
Market Risk
Market risk is the risk that the fair value of future cash flows of a financial instrument will fluctuate because of changes in market prices. Market risk comprises three types of risk: currency risk, interest rate risk and other price risk such as equity price risk and commodity price risk. Financial instruments affected by market risk include loans and borrowings, receivables, payables, deposits, investments and derivative financial instruments.
a) Foreign currency risk
The Company operates internationally and the business is transacted in several currencies. Consequently, the Company is exposed to foreign exchange risk through its sale and purchase of goods and services, mainly in the North America and Europe and borrowings in various foreign currencies. The exchange rate between the rupee and foreign currencies has changed substantially in recent years and may fluctuate substantially in the future. Consequently, the results of the Company’s operations are affected positively/adversely as the rupee appreciates /depreciates against these currencies. The Company evaluates exchange rate exposure arising from these transactions and enters into foreign exchange forward contracts, interest and principle swaps and options to mitigate the risk of changes in exchange rates on foreign currency exposures. The Company follows established risk management policies, to hedge forecasted cash flows denominated in foreign currency. The Company has designated certain derivative instruments as cash flow hedges to mitigate the foreign exchange exposure.
Financial Statements - Standalone
Notes to the financial statements for the year ended March 31, 2019

138 Varroc Engineering Limited
i) The Company's exposure to foreign currency risk as at March 31, 2019 expressed in `, is as follows:
(`In million)
ParticularsMarch 31, 2019
USD EURO JPY Other Currencies Total
Financial assets
Trade receivables 281.80 271.34 - - 553.14
Interest receivable - 75.17 - - 75.17
Financial liabilities
Trade payables 33.53 19.70 16.22 19.37 88.82
Other liabilities - 144.88 - - 144.88
Net assets / (liabilities) 248.27 181.93 (16.22) (19.37) 394.61
ii) The Company's exposure to foreign currency risk as at March 31, 2018 expressed in `, is as follows:
(`In million)
ParticularsMarch 31, 2018
USD EURO JPY Other Currencies Total
Financial assets
Trade receivables 211.45 333.33 - - 544.78
Interest receivable - 78.40 - - 78.40
Other assets 7.55 5.83 8.38 - 21.76
Financial liabilities
Borrowings - 70.14 71.52 - 141.66
Trade payables 265.39 24.32 52.40 11.19 353.30
Other liabilities 9.93 150.77 - - 160.70
Net assets / (liabilities) (56.32) 172.33 (115.54) (11.19) (10.72)
iii) Sensitivity For the year ended March 31, 2019 and March 31, 2018, every 5% percentage point appreciation/depreciation in the exchange rate between the
Indian rupee and U.S. Dollar,would have affected the Company's incremental operating margins by approximately `12.41 million and `2.82 million, respectively. And for Euro, every 5% percentage point appreciation/depreciation in the exchange rate would have affected the Company's incremental operating margin by approximately `9.10 million, previous year `8.62 million The sensitivity for net exposure in JPY and in other currencies does not have material impact to Statement of Profit and Loss.
Sensitivity analysis is computed based on the changes in the receivables and payables in foreign currency upon conversion into functional currency, due to exchange rate fluctuations between the previous reporting period and the current reporting period.
b) Interest rate risk Interest rate risk is the risk that the fair value or future cash flows of a financial instrument will fluctuate because of change in market interest rates. The
Company’s exposure to the risk of changes in market interest rates relates primarily to the Company’s long term debt obligations with floating interest rates.
Interest rate sensitivity The sensitivity analysis below have been determined based on exposure to interest rate. For floating rate liabilities, analysis is prepared assuming
the amount of liability outstanding at the end of the reporting period was outstanding for the whole year. With all other variables held constant, the Company’s profit before tax is affected through the impact on floating rate borrowings, as follows:
(`In million)
For the year ended CurrencyIncrease/ decrease in
base pointsEffect on profit before
taxVariable rate CC
balance / Term loans
March 31, 2019 ` +100 (16.21) 1,621.15
` -100 16.21 1,621.15
March 31, 2018 ` +100 (10.90) 1,089.89
` -100 10.90 1,089.89
Financial Statements - Standalone
Notes to the financial statements for the year ended March 31, 2019

Annual Report 2018-19 139
C) Other price risk The Company does not have material investments in equity securities other than investments in its subsidiaries. Hence, equity price risk is considered
to be low. Further, the Company's operating activities require the ongoing purchase of various commodities for manufacture of automotive parts. However, the movement is commodity prices are substantially adjusted through price differences as per customer contracts and hence commodity price risk for the Company is also considered to be low.
Credit risk management Credit risk arises when a customer or counterparty does not meet its obligations under a financial instrument or customer contract, leading to a
financial loss. The Company is exposed to credit risk from its operating activities (primarily trade receivables) and from its investing activities, including deposits with banks and financial institutions, foreign exchange transactions and other financial instruments. The Company only deals with parties which have good credit rating/worthiness given by external rating agencies or based on the Company's internal assessment.
Trade receivables Customer credit risk is managed by the Company’s established policy, procedures and control relating to customer credit risk management. Further,
Company’s customers includes marquee OEMs and Tier I companies, having long standing relationship with the Company. Outstanding customer receivables are regularly monitored and reconciled. At March 31, 2019, receivable from Company’s top 5 customers accounted for approximately 75.76 % (March 31, 2018: 74.26%) of all the receivables outstanding. An impairment analysis is performed at each reporting date on an individual basis based on historical data. The maximum exposure to credit risk at the reporting date is the carrying value of trade receivables disclosed in Note 12. The Company does not hold collateral as security.
Financial instruments and cash deposits Credit risk from balances with banks and financial institutions is managed by the Company’s corporate treasury department in accordance with the
Company’s policy. Investments of surplus funds are made only with approved counterparties. Credit limits are set to minimise the concentration of risks and therefore mitigate financial loss through counterparty’s potential failure to make payments.
The Company’s maximum exposure to credit risk for the components of the balance sheet at March 31, 2019 and March 31, 2018 is the carrying amounts as disclosed in note 13 except for financial guarantees. The Company’s maximum exposure relating to financial guarantees is disclosed in note 50 (B)
d) Liquidity risk Liquidity risk is defined as the risk that the Company will not be able to settle or meet its obligations on time or at a reasonable price. The Company’s
corporate treasury department is responsible for liquidity and funding as well as settlement management. In addition, processes and policies related to such risks are overseen by senior management. Management monitors the Company’s net liquidity position through rolling forecasts on the basis of expected cash flows. As of March 31, 2019, cash and cash equivalents are held with major banks.
(ii) Maturities of financial liabilities The table below summarises the maturity profile of the company’s financial liabilities based on contractual payments.
(`In million)
March 31, 2019 On demand < 1 year 1 to 5 years > 5 years
Non- derivative
Borrowings 31.17 2,351.38 1,560.00 -
Trade Payables - 3,504.65 - -
Acceptances - 212.10 - -
Other financial liabilities 49.43 407.50 - -
Derivative liabilities pending settlement - 6.98 - -
(`In million)
March 31, 2018 On demand < 1 year 1 to 5 years > 5 years
Non- derivative
Borrowings 52.64 2,508.33 2,204.61 -
Trade Payables - 3,243.29 - -
Acceptances - 184.12 - -
Other financial liabilities 36.75 409.01 6.00 -
Derivative liabilities pending settlement - 48.59 - -
'The amounts disclosed in the above table are the contractual undiscounted cash flows.For Financial guarantee contracts, refer Note 50(B).
Financial Statements - Standalone
Notes to the financial statements for the year ended March 31, 2019
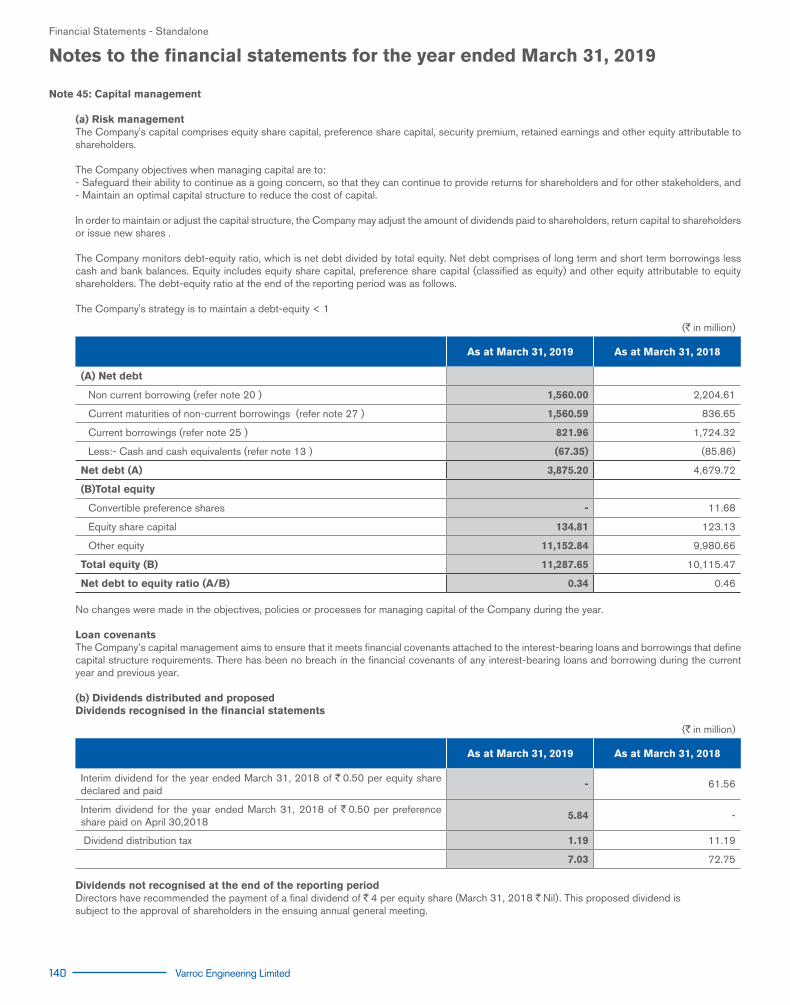
140 Varroc Engineering Limited
Note 45: Capital management
(a) Risk management The Company's capital comprises equity share capital, preference share capital, security premium, retained earnings and other equity attributable to
shareholders.
The Company objectives when managing capital are to: - Safeguard their ability to continue as a going concern, so that they can continue to provide returns for shareholders and for other stakeholders, and - Maintain an optimal capital structure to reduce the cost of capital.
In order to maintain or adjust the capital structure, the Company may adjust the amount of dividends paid to shareholders, return capital to shareholders or issue new shares .
The Company monitors debt-equity ratio, which is net debt divided by total equity. Net debt comprises of long term and short term borrowings less cash and bank balances. Equity includes equity share capital, preference share capital (classified as equity) and other equity attributable to equity shareholders. The debt-equity ratio at the end of the reporting period was as follows.
The Company's strategy is to maintain a debt-equity < 1
(`in million)
As at March 31, 2019 As at March 31, 2018
(A) Net debt
Non current borrowing (refer note 20 ) 1,560.00 2,204.61
Current maturities of non-current borrowings (refer note 27 ) 1,560.59 836.65
Current borrowings (refer note 25 ) 821.96 1,724.32
Less:- Cash and cash equivalents (refer note 13 ) (67.35) (85.86)
Net debt (A) 3,875.20 4,679.72
(B)Total equity
Convertible preference shares - 11.68
Equity share capital 134.81 123.13
Other equity 11,152.84 9,980.66
Total equity (B) 11,287.65 10,115.47
Net debt to equity ratio (A/B) 0.34 0.46
No changes were made in the objectives, policies or processes for managing capital of the Company during the year.
Loan covenants The Company’s capital management aims to ensure that it meets financial covenants attached to the interest-bearing loans and borrowings that define
capital structure requirements. There has been no breach in the financial covenants of any interest-bearing loans and borrowing during the current year and previous year.
(b) Dividends distributed and proposed Dividends recognised in the financial statements
(`in million)
As at March 31, 2019 As at March 31, 2018
Interim dividend for the year ended March 31, 2018 of `0.50 per equity share declared and paid
- 61.56
Interim dividend for the year ended March 31, 2018 of `0.50 per preference share paid on April 30,2018
5.84 -
Dividend distribution tax 1.19 11.19
7.03 72.75
Dividends not recognised at the end of the reporting period Directors have recommended the payment of a final dividend of `4 per equity share (March 31, 2018 `Nil). This proposed dividend is
subject to the approval of shareholders in the ensuing annual general meeting.
Financial Statements - Standalone
Notes to the financial statements for the year ended March 31, 2019
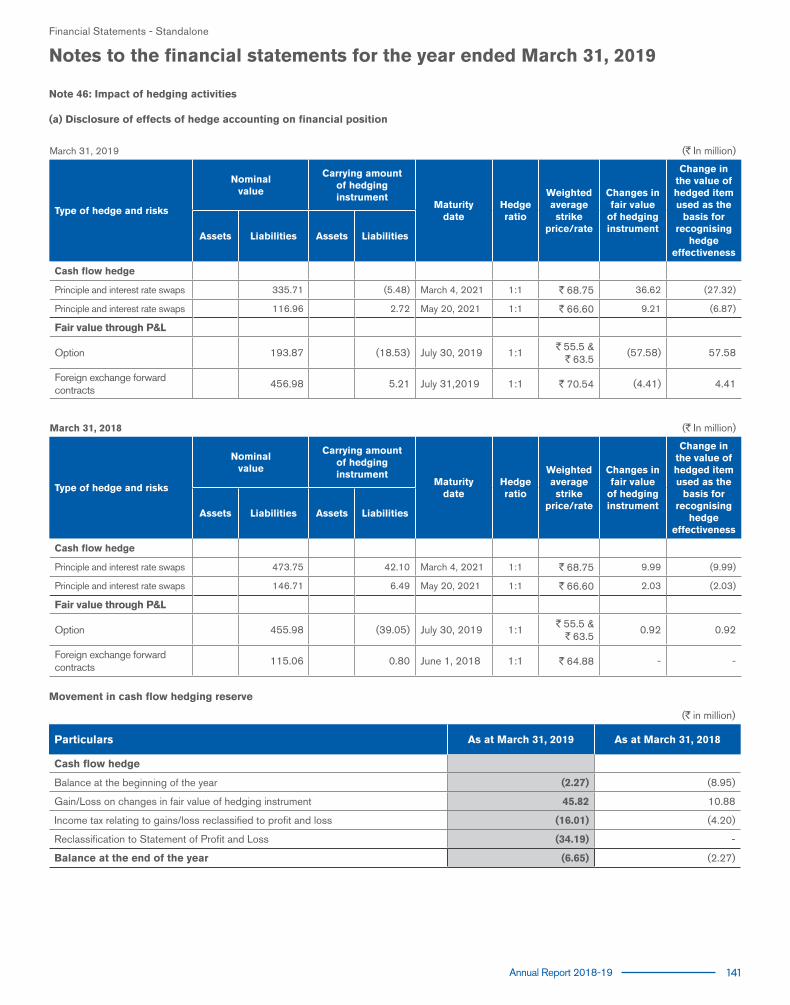
Annual Report 2018-19 141
Note 46: Impact of hedging activities
(a) Disclosure of effects of hedge accounting on financial position
March 31, 2019 (`In million)
Type of hedge and risks
Nominal value
Carrying amountof hedging instrument
Maturitydate
Hedge ratio
Weighted average strike
price/rate
Changes in fair value
of hedging instrument
Change in the value of hedged item used as the
basis for recognising
hedge effectiveness
Assets Liabilities Assets Liabilities
Cash flow hedge
Principle and interest rate swaps 335.71 (5.48) March 4, 2021 1:1 `68.75 36.62 (27.32)
Principle and interest rate swaps 116.96 2.72 May 20, 2021 1:1 `66.60 9.21 (6.87)
Fair value through P&L
Option 193.87 (18.53) July 30, 2019 1:1 `55.5 & `63.5
(57.58) 57.58
Foreign exchange forward contracts
456.98 5.21 July 31,2019 1:1 `70.54 (4.41) 4.41
March 31, 2018 (`In million)
Type of hedge and risks
Nominal value
Carrying amountof hedging instrument
Maturitydate
Hedge ratio
Weighted average strike
price/rate
Changes in fair value
of hedging instrument
Change in the value of hedged item used as the
basis for recognising
hedge effectiveness
Assets Liabilities Assets Liabilities
Cash flow hedge
Principle and interest rate swaps 473.75 42.10 March 4, 2021 1:1 `68.75 9.99 (9.99)
Principle and interest rate swaps 146.71 6.49 May 20, 2021 1:1 `66.60 2.03 (2.03)
Fair value through P&L
Option 455.98 (39.05) July 30, 2019 1:1 `55.5 & `63.5
0.92 0.92
Foreign exchange forward contracts
115.06 0.80 June 1, 2018 1:1 `64.88 - -
Movement in cash flow hedging reserve
(`in million)
Particulars As at March 31, 2019 As at March 31, 2018
Cash flow hedge
Balance at the beginning of the year (2.27) (8.95)
Gain/Loss on changes in fair value of hedging instrument 45.82 10.88
Income tax relating to gains/loss reclassified to profit and loss (16.01) (4.20)
Reclassification to Statement of Profit and Loss (34.19) -
Balance at the end of the year (6.65) (2.27)
Financial Statements - Standalone
Notes to the financial statements for the year ended March 31, 2019

142 Varroc Engineering Limited
Note 47: Related Party Disclosure. a. Related parties and their relationships
A. Related parties where control exists
1 Subsidiaries Varroc Polymers Private LimitedDurovalves India Private LimitedVarroc Lighting Systems (India) Private LimitedTeam Concepts Private LimitedVarroc European Holding B.V. The NetherlandsAries Mentor Holding B.V. The NetherlandsVarrocCorp Holding B.V. The NetherlandsVarroc Japan Co. Ltd Japan
Industria Meccanica E Stampaggio s.p.a.,ItalyVarroc Lighting Systems Italy SPA( Formerly known as TRI.O.M., S.p.A., Italy )Varroc Lighting Systems Romania S.A. (Formerly known as Electromures SA, Romania)Varroc Lighting Systems Vietnam Co. Ltd. (Formerly known as TRI.O.M. Vietnam Co. Ltd., Vietnam)Varroc Lighting Systems SRO, Czech RepublicVarroc Lighting Systems S.de.R.L. De. C.V., MexicoVarroc Lighting Systems GmBH, GermanyVarroc Lighting Systems Inc. USAVarroc Lighting Systems sp. Z o.o., PolandVarroc Lighting Systems SA, MoroccoVarroc do Brasil Industria E Commercia LTDA (Formerly known as Varroc Do Brasil Comércio, Importação E Exportação De Máquinas, Equipamento E Peças Ltda.)TRI.O.M. SA De. C. V.MexicoVarroc Lighting Systems, Turkey Endüstriyel Urünler Imalat Ve Ticaret Anonim Sirketi (Formerly known as SA-BA Endüstriyel Ürünler Imalat ve Ticaret Anonim Sirketi (w.e.f July 02, 2018)Varroc Lighting Systems, Bulgaria EOOD (Formerly known as SA-BA Bulgaria EOOD) (w.e.f. July 02, 2018)
2 Jointly Controlled Entities Varroc TYC Corporation British Virgin IslandsVarroc TYC Auto Lamps Co. Ltd., China (Subsidiaries of Varroc TYC Corporation, BVI)Varroc TYC Auto Lamps Co. Ltd. CQ (Subsidiaries of Varroc TYC Auto Lamp Co., China)Nuova CTS S.r.L.,ItalyVarroc Dell'Orto Pvt.Ltd. (w.e.f. January 10, 2019)Varroc Elba Electronics S.r.l, Romania (w.e.f. January 14, 2019)
B. Other related parties with whom transactions have taken place during the period
3 Key Management Personnel Mr. Tarang Jain - Managing Director
Whole time DirectorsMr. Arjun Jain (w.e.f. August 07, 2018)Mr. Ashwani Maheshwari
Non-executive DirectorsMr. Naresh Chandra
Independent DirectorsMr. Gautam KhandelwalMr. Marc SzulewiczMrs. Vijaya SampathMr. Vinish Kathuria
4 Relatives of Key Management Personnel with whom transactions have taken place
Mrs. Rochana Jain - Wife Mr. Dhruv Jain
5 Enterprises owned or controlled by/or over which parties described in para 3 & 4 or their relatives exercise significant influence where transactions have taken place [Other than those included above]
Endurance Technologies Limited TJ Holdings Trust Naresh Chandra Holdings Trust Suman Jain Holdings Trust
Financial Statements - Standalone
Notes to the financial statements for the year ended March 31, 2019

Annual Report 2018-19 143
b. Transactions with related parties
Description of the nature of transactions
Volume of transactions
Amount (`in Millions)
As at March 31, 2019 As at March 31, 2018
For theyear
endedMarch
31, 2019
For theyear
endedMarch
31, 2018
Receivable Payable Receivable Payable
A] Sale of goods, services and fixed assets *
Industria Meccanica E Stampaggio s.p.a., ITALY 4.20 7.54 - - 10.34 -
Varroc Lighting Systems Italy SPA 0.12 0.08 0.84 - 0.89 -
Varroc Polymers Private Limited 182.97 137.53 52.63 - 32.10 -
Durovalves India Private Limited 24.94 21.51 4.67 - 4.76 -
Varroc Lighting Systems (India) Private Limited 120.21 11.09 46.74 - 8.90 -
Endurance Technologies Limited 90.14 91.35 12.58 - 8.12 -
Tarang Jain (Refer Note below) - 83.00 - - - -
B] Purchase of goods, services and fixed assets *
Durovalves India Private Limited 85.04 173.41 - 12.37 - 32.18
Industria Meccanica E Stampaggio s.p.a., ITALY 0.49 - - 0.49 - -
Varroc Lighting System,Italy 3.09 2.09 - 1.38 - 0.57
Varroc Lighting Systems Romania S.A. - - - 0.13 - 0.14
Varroc Lighting Systems SRO, Czech Republic - 9.15 - 0.20 - 9.34
Varroc Lighting System India Pvt. Ltd. 0.98 5.09 - - - 0.07
Varroc Japan Co Ltd 24.44 16.47 - 2.24 2.92
Varroc Polymers Private Limited 337.97 321.73 - 34.50 - 53.33
C] Dividend received
Varroc Polymers Private Limited - Equity Shares 6.61 6.61 - - - -
D] Management consultancy fees received
Durovalves India Private Limited 5.00 5.00 1.37 - 1.35 -
Varroc Lighting Systems Italy SPA 3.85 3.83 3.83 - 3.83 -
Varroc Lighting Systems Inc. USA 141.25 63.93 68.52 - 32.08 -
E] Rent received
Varroc Polymers Private Limited 15.64 14.22 - - - -
F] Interest receivable
Varroc European Holding B.V. The Netherlands## - - 75.17 - 78.40 -
G] Guarantee commission received
Varroc Lighting Systems (India) Private Limited - 0.55 - - 0.59 -
Varroc Lighting Systems S.de.R.L. De. C.V., Mexico 12.98 12.82 - - - -
Varroc Lighting Systems Inc. USA 19.86 16.82 20.26 - - -
Varroc European Holding B.V. The Netherlands 18.15 17.10 9.77 - 2.34 -
VarrocCorp Holding B.V.The Netherlands 13.80 - 4.46 - - -
H] Professional charges /Commission Paid/Payable
Mr. Naresh Chandra 0.57 0.57 - - - -
Financial Statements - Standalone
Notes to the financial statements for the year ended March 31, 2019
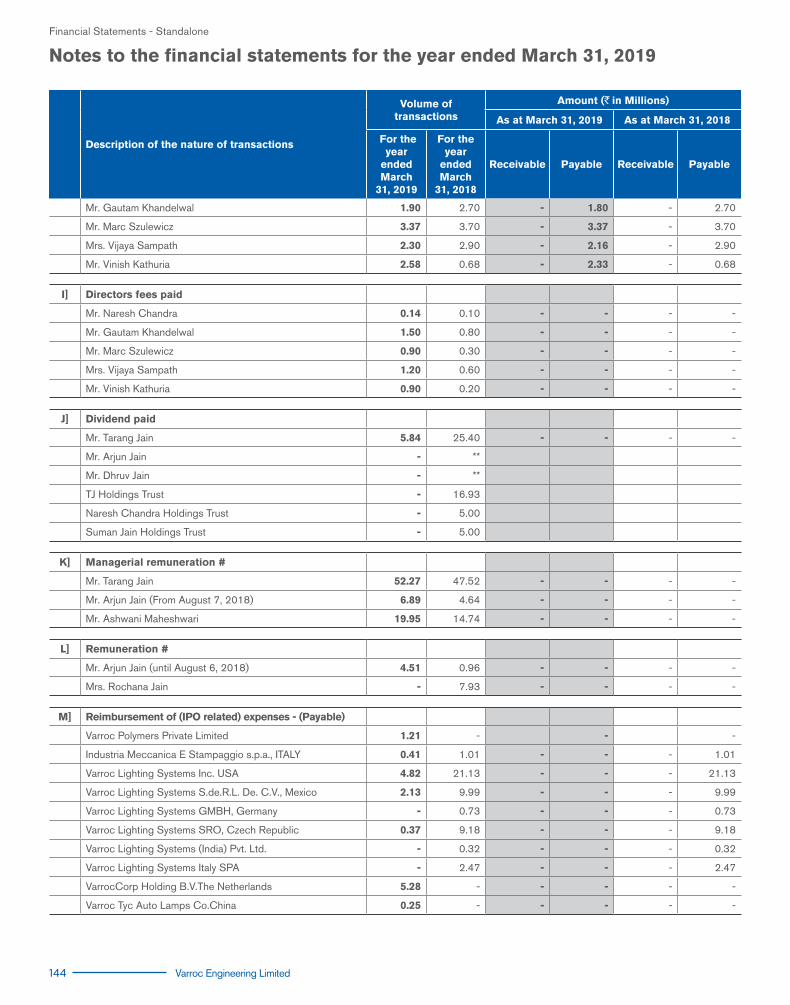
144 Varroc Engineering Limited
Description of the nature of transactions
Volume of transactions
Amount (`in Millions)
As at March 31, 2019 As at March 31, 2018
For theyear
endedMarch
31, 2019
For theyear
endedMarch
31, 2018
Receivable Payable Receivable Payable
Mr. Gautam Khandelwal 1.90 2.70 - 1.80 - 2.70
Mr. Marc Szulewicz 3.37 3.70 - 3.37 - 3.70
Mrs. Vijaya Sampath 2.30 2.90 - 2.16 - 2.90
Mr. Vinish Kathuria 2.58 0.68 - 2.33 - 0.68
I] Directors fees paid
Mr. Naresh Chandra 0.14 0.10 - - - -
Mr. Gautam Khandelwal 1.50 0.80 - - - -
Mr. Marc Szulewicz 0.90 0.30 - - - -
Mrs. Vijaya Sampath 1.20 0.60 - - - -
Mr. Vinish Kathuria 0.90 0.20 - - - -
J] Dividend paid
Mr. Tarang Jain 5.84 25.40 - - - -
Mr. Arjun Jain - **
Mr. Dhruv Jain - **
TJ Holdings Trust - 16.93
Naresh Chandra Holdings Trust - 5.00
Suman Jain Holdings Trust - 5.00
K] Managerial remuneration #
Mr. Tarang Jain 52.27 47.52 - - - -
Mr. Arjun Jain (From August 7, 2018) 6.89 4.64 - - - -
Mr. Ashwani Maheshwari 19.95 14.74 - - - -
L] Remuneration #
Mr. Arjun Jain (until August 6, 2018) 4.51 0.96 - - - -
Mrs. Rochana Jain - 7.93 - - - -
M] Reimbursement of (IPO related) expenses - (Payable)
Varroc Polymers Private Limited 1.21 - - -
Industria Meccanica E Stampaggio s.p.a., ITALY 0.41 1.01 - - - 1.01
Varroc Lighting Systems Inc. USA 4.82 21.13 - - - 21.13
Varroc Lighting Systems S.de.R.L. De. C.V., Mexico 2.13 9.99 - - - 9.99
Varroc Lighting Systems GMBH, Germany - 0.73 - - - 0.73
Varroc Lighting Systems SRO, Czech Republic 0.37 9.18 - - - 9.18
Varroc Lighting Systems (India) Pvt. Ltd. - 0.32 - - - 0.32
Varroc Lighting Systems Italy SPA - 2.47 - - - 2.47
VarrocCorp Holding B.V.The Netherlands 5.28 - - - - -
Varroc Tyc Auto Lamps Co.China 0.25 - - - - -
Financial Statements - Standalone
Notes to the financial statements for the year ended March 31, 2019
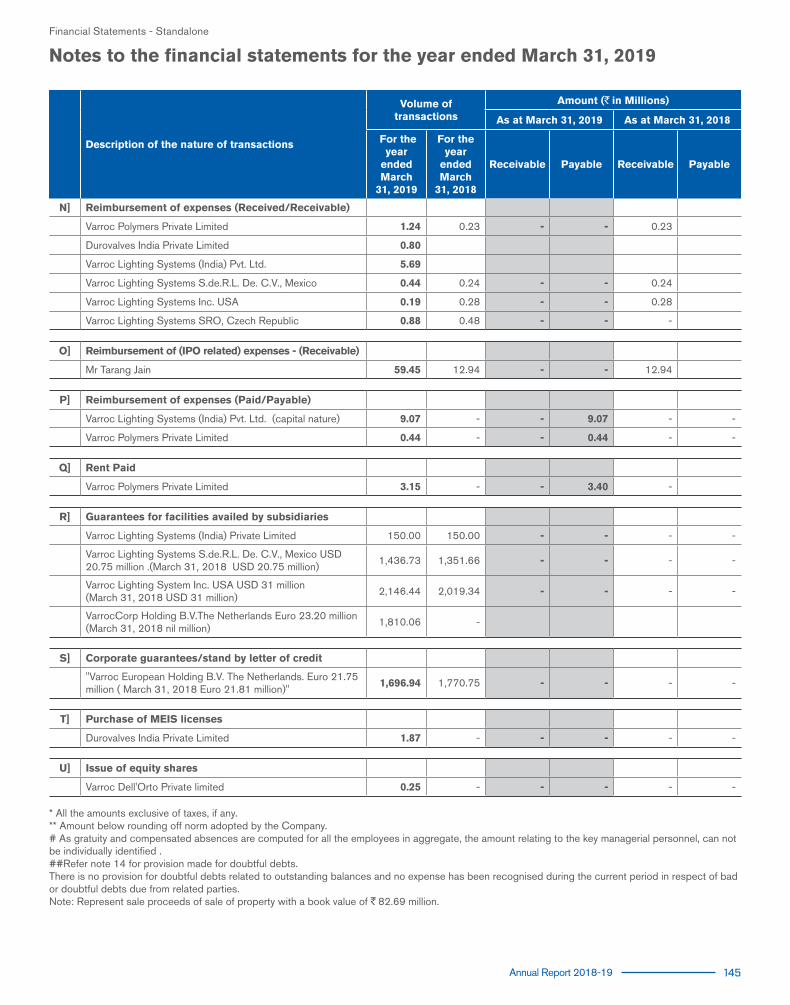
Annual Report 2018-19 145
Description of the nature of transactions
Volume of transactions
Amount (`in Millions)
As at March 31, 2019 As at March 31, 2018
For theyear
endedMarch
31, 2019
For theyear
endedMarch
31, 2018
Receivable Payable Receivable Payable
N] Reimbursement of expenses (Received/Receivable)
Varroc Polymers Private Limited 1.24 0.23 - - 0.23
Durovalves India Private Limited 0.80
Varroc Lighting Systems (India) Pvt. Ltd. 5.69
Varroc Lighting Systems S.de.R.L. De. C.V., Mexico 0.44 0.24 - - 0.24
Varroc Lighting Systems Inc. USA 0.19 0.28 - - 0.28
Varroc Lighting Systems SRO, Czech Republic 0.88 0.48 - - -
O] Reimbursement of (IPO related) expenses - (Receivable)
Mr Tarang Jain 59.45 12.94 - - 12.94
P] Reimbursement of expenses (Paid/Payable)
Varroc Lighting Systems (India) Pvt. Ltd. (capital nature) 9.07 - - 9.07 - -
Varroc Polymers Private Limited 0.44 - - 0.44 - -
Q] Rent Paid
Varroc Polymers Private Limited 3.15 - - 3.40 -
R] Guarantees for facilities availed by subsidiaries
Varroc Lighting Systems (India) Private Limited 150.00 150.00 - - - -
Varroc Lighting Systems S.de.R.L. De. C.V., Mexico USD 20.75 million .(March 31, 2018 USD 20.75 million)
1,436.73 1,351.66 - - - -
Varroc Lighting System Inc. USA USD 31 million (March 31, 2018 USD 31 million)
2,146.44 2,019.34 - - - -
VarrocCorp Holding B.V.The Netherlands Euro 23.20 million (March 31, 2018 nil million)
1,810.06 -
S] Corporate guarantees/stand by letter of credit
"Varroc European Holding B.V. The Netherlands. Euro 21.75 million ( March 31, 2018 Euro 21.81 million)"
1,696.94 1,770.75 - - - -
T] Purchase of MEIS licenses
Durovalves India Private Limited 1.87 - - - - -
U] Issue of equity shares
Varroc Dell'Orto Private limited 0.25 - - - - -
* All the amounts exclusive of taxes, if any.** Amount below rounding off norm adopted by the Company.# As gratuity and compensated absences are computed for all the employees in aggregate, the amount relating to the key managerial personnel, can not be individually identified .##Refer note 14 for provision made for doubtful debts.There is no provision for doubtful debts related to outstanding balances and no expense has been recognised during the current period in respect of bad or doubtful debts due from related parties.Note: Represent sale proceeds of sale of property with a book value of `82.69 million.
Financial Statements - Standalone
Notes to the financial statements for the year ended March 31, 2019

146 Varroc Engineering Limited
i) Note 48 (a): Commitments
Estimated amount of contracts remaining to be excuted on capital account and not provided for (net of advance)
(`in million)
Particulars As at March 31, 2019 As at March 31, 2018
Purchase of property, plant and equipment 1,362.43 1,303.48
i) Note 48 (b) : Leases Company as lessee
The Company has entered into operating leases on certain premises, with lease terms between three to ten years. The Company has the option, under some of its leases, to lease the premises for additional terms of three to five years.
The Company has paid `49.10 million (March 31,2018 `47.43 million) during the year towards minimum lease payment. Future minimum rentals payable under non-cancellable operating leases as at March 31, 2019 as follows.
(`in million)
ParticularsFor the year ended
March 31, 2019For the year ended
March 31, 2018
Within one year 66.83 42.11
After one year but not more than five years 181.12 137.75
Note 49: Earnings per share
(`in million)
ParticularsYear Ended
March 31, 2019Year Ended
March 31, 2018
Earnings per share (EPS)
Basic
Profit attributable to ordinary equity shareholders (`in million) 1,195.40 698.30
Weighted average number of shares outstanding (without considering impact of shares split)* - 1,40,90,641
Weighted average number of shares outstanding (after considering impact of shares split) 13,48,11,530 14,09,06,410
Basic EPS (Amount in `) 8.87 4.96
Diluted
Profit attributable to ordinary equity shareholders (`in million) 1,195.40 698.30
Weighted average number of shares outstanding 13,48,11,530 14,09,06,410
Diluted EPS (Amount in `) 8.87 4.96
*Note : During the previous year, face value per equity share and preference share have been sub divided from `10 to `1.
Note 50: Contingent liabilities
(A) Claims against the Company not acknowledged as debt
(`in million)
Particulars March 31, 2019 March 31, 2018
Disputed excise and service tax matters 221.34 122.15
Income tax matters 23.73 124.59
Sales tax matters 0.65 4.24
Employee related disputes 43.72 48.99
Export promotion capital goods (EPCG) export obligation 85.53 -
Provident fund liability See note (ii) below -
Financial Statements - Standalone
Notes to the financial statements for the year ended March 31, 2019

Annual Report 2018-19 147
(i) The Company is contesting excise and service tax demand and the management, including its tax advisors, believe that it's position will likely be upheld in the appellate process. No expense has been accrued in the financial statements for the tax demands raised. The management believes that the ultimate outcome of this proceeding will not have a material adverse effect on the Company's financial position and results of the operations. The Company has deposited `1.46 million with the tax authorities against the said demand to comply the order of hon'ble tax authorities. The hon'ble tax authorities has accepted the plea of Company and has given stay on entire demand after deposit of specified amount till the disposal of case.
(ii) There are numerous interpretative issues relating to the Supreme Court (SC) judgement on PF dated February 28, 2019. As a matter of caution, the company has made a provision on a prospective basis from the date of the SC order. The company will update its provision, on receiving further clarity on the subject.
Note 50: Contingent liabilities
(B) The Company has provided corporate guarantees / stand by letter of credit as at March 31, 2019 :
(`in million)
Particulars March 31, 2019 March 31, 2018
Corporate guarantees for loan taken by Indian Subsidiary 150.00 150.00
Corporate guarantees for loan taken by Foreign Subsidiaries [(March 31, 2019 - USD 51.75 million (March 31, 2018 - USD 51.75 million)]
3,583.17 3,371.00
Standby letter of credit and corporate guarantees given for loans taken by Foreign subsidiaries [('March 31,2019 - EURO 44.95 million (March 31, 2018 - Euro 21.81 million) ]
3,507.00 1,770.75
For above guarantees following charge is created in favour of
1) Stand by letter of credit from CITI Bank is secured by first pari-passu charge on movable fixed assets of crankshaft unit both present and future located at M-191/3, MIDC, Waluj, Aurangabad - 431136.
2) Stand by letter of credit from IDBI Bank is secured by first pari-passu charge by way of hypothecation of stocks of raw materials, work in progress, finished goods, consumable, stores and spares, packing materials and receivables of the Company both present and future.
3) Stand by letter of credit from Axis Bank is secured by subservient charge on the entire current assets and movable fixed assets of the Company.
As per our report of even date For and on behalf of the Board of Directors
For S R B C & CO LLP TARANG JAIN GAUTAM KHANDELWAL Chartered Accountants Managing Director Director ICAI Firm Registration Number: 324982E/E300003 (DIN 00027505) (DIN 00270717)
ASHWANI MAHESHWARI CEO and Whole Time Director (DIN 07341295) per Paul Alvares THARUVAI R. SRINIVASAN RAKESH M.DARJI Partner Group CFO Company Secretary Membership No: 105754 (Membership No: ACS13085)
Place: Mumbai Place: Mumbai Date: May 24, 2019 Date: May 24, 2019
Financial Statements - Standalone
Notes to the financial statements for the year ended March 31, 2019

148 Varroc Engineering Limited
Financial Statements - Consolidated
Independent Auditor’s Report
To the Members of Varroc Engineering Limited Report on the Audit of the Consolidated Ind AS Financial Statements
Opinion
We have audited the accompanying consolidated Ind AS financial statements of Varroc Engineering Limited (hereinafter referred to as “the Holding Company”), its subsidiaries (the Holding Company and its subsidiaries together referred to as “the Group”) and its joint ventures comprising of the consolidated Balance sheet as at March 31 2019, the consolidated Statement of Profit and Loss, including Other comprehensive income, the consolidated Cash Flow Statement and the consolidated Statement of Changes in Equity for the year then ended, and notes to the consolidated Ind AS financial statements, including a summary of significant accounting policies and other explanatory information (hereinafter referred to as “the consolidated Ind AS financial statements”).
In our opinion and to the best of our information and according to the explanations given to us and based on the consideration of reports of other auditors on separate financial statements and on the other financial information of the subsidiaries and joint venture, the aforesaid consolidated Ind AS financial statements give the information required by the Companies Act, 2013 (“the Act”) in the manner so required and give a true and fair view in conformity with the accounting principles generally accepted in India, of the consolidated state of affairs of the Group, and its joint ventures as at March 31, 2019, their consolidated profit including other comprehensive income, their consolidated cash flows and the consolidated statement of changes in equity for the year ended on that date.
Basis for Opinion
We conducted our audit of the consolidated Ind AS financial statements in accordance with the Standards on Auditing (SAs), as specified under section 143(10) of the Act. Our responsibilities under those Standards are further described in the ‘Auditor’s Responsibilities for the Audit of the Consolidated Ind AS Financial Statements’ section of our report. We are independent of the Group in accordance with the ‘Code of Ethics’ issued by the Institute of Chartered Accountants of India together with the ethical requirements that are relevant to our audit of the financial statements under the provisions of the Act and the Rules thereunder, and we have fulfilled our other ethical responsibilities in accordance with these requirements and the Code of Ethics. We believe that the audit evidence we have obtained is sufficient and appropriate to provide a basis for our audit opinion on the consolidated Ind AS financial statements.
Key Audit Matters
Key audit matters are those matters that, in our professional judgment, were of most significance in our audit of the consolidated Ind AS financial statements for the financial year ended March 31, 2019. These matters were addressed in the context of our audit of the consolidated Ind AS financial statements as a whole, and in forming our opinion thereon, and we do not provide a separate opinion on these matters. For each matter below, our description of how our audit addressed the matter is provided in that context.
We have determined the matters described below to be the key audit matters to be communicated in our report. We have fulfilled the responsibilities described in the Auditor’s responsibilities for the audit of the consolidated Ind AS financial statements section of our report, including in relation to these matters. Accordingly, our audit included the performance of procedures designed to respond to our assessment of the risks of material misstatement of the consolidated Ind AS financial statements. The results of our audit procedures, including the procedures performed to address the matters below, provide the basis for our audit opinion on the accompanying consolidated Ind AS financial statements.
Key audit matters How our audit addressed the key audit matter
1. Accounting for Business combinations (as described in note 54 of the consolidated Ind AS financial statements)
Accounting for Business combinations is complex and requires involvement of the Group’s senior management in identification, valuation and recognition of assets acquired and liabilities assumed. Business combinations also involve determining Goodwill, the future evaluation of which requires estimates with significant effects for the Group.
The recognition at fair value of the assets acquired and liabilities assumed requires the use of valuation methodologies that require significant judgments and estimates and the involvement of the Group’s external experts.
During the year ended March 31, 2019, the Group acquired SA-BA Endustriyel Urunler Imalat ve Ticaret Anonim Sirketi (now Varroc Lighting Systems Endüstriyel Ürünler imalat ve Ticaret Anonim sirketi) in Turkey (“Turkey subsidiary”) that resulted in the inclusion and measurement of assets acquired and liabilities assumed in the consolidated financial statements. The accounting for the above business combination including the valuation criteria and judgements and estimates made have a significant impact on the consolidated financial statements for the year ended March 31, 2019 and for future years. Accordingly, the same is determined to be a key audit matter in our audit of the consolidated Ind AS financial statements
Our audit procedures included the following:
• Obtained an understanding of the terms and conditions of the purchase agreement and the consideration transferred. We tested the fair valuation of the assets acquired and liabilities assumed as arrived at by Group’s external experts, the assignment of such fair values and the process used to determine residual Goodwill.
• Tested the methodology used to identify and value the assets/liabilities;
• Tested the estimates and projections of cash flows and the discount rates applied for valuation of the intangible assets;
• For the valuation of tangible assets, we read the reports of the independent external valuation experts;
• Tested the liabilities recognised, analysing their valuation and estimates of the provisions taken into account based on the information available at the date of acquisition;
• Tested the arithmetical accuracy of the models;
• Tested the disclosures of the information in the consolidated financial statements.
• Involved valuation specialists, where warranted.

Annual Report 2018-19 149
Financial Statements - Consolidated
Independent Auditor’s Report
Key audit matters How our audit addressed the key audit matter
2. Impairment of Goodwill relating to acquisition of Turkey subsidiary (as described in note 5(b) of the consolidated Ind AS financial statements)
The Goodwill of `1,992.53 million in the Group’s balance sheet includes `1,657.81 million pertaining to goodwill towards the acquisition of Turkey subsidiary. Goodwill balances are allocated to Cash Generating Units (CGUs) which are tested annually for impairment using discounted cash-flow models wherein each CGU’s recoverable value is compared to the carrying value of the assets. A deficit between the recoverable value and the CGU’s net assets would result in impairment.
The inputs to the Goodwill impairment testing model for Turkey subsidiary which have the most significant impact on CGU’s recoverable value include:- Revenue forecasts and EBITDA margins during explicit forecast period of 5 years;- Growth rate and EBITDA margins for terminal value period;- Discount rates;
The impairment test model includes sensitivity testing of key assumptions, including revenue growth, EBITDA margins, terminal value and discount rate.
The annual impairment testing for Goodwill pertaining to Turkey subsidiary is considered a significant accounting judgement and estimate and a key audit matter because the assumptions on which the tests are based are highly judgmental and are affected by future market and economic conditions which are inherently uncertain and also because of the materiality of Goodwill to the financial statements as a whole.
Our audit procedures included the following:
• Assessed the Group’s methodology applied in determining the CGUs to which Goodwill is allocated with the applicable Ind AS.
• Assessed the assumptions around the key drivers of the recoverable amounts for the CGU pertaining to Turkey subsidiary including revenue growth, EBITDA margins, terminal values and discount rates used.
• Also assessed the recoverable value headroom by performing sensitivity testing of key assumptions used.
• Tested the arithmetical accuracy of the models.
• Tested the disclosures in the Ind AS financial statements for compliance with the relevant accounting standards requirements.
• Involved valuation specialists, where warranted.
3. Recoverability of deferred tax assets recognised in Varroc Lighting Systems SRO (“Czech subsidiary”) and Varroc Lighting Systems, S.de.R.L.de.C.V (“Mexico subsidiary”) (as described in note 22 of the consolidated Ind AS financial statements)
The Group has deferred tax assets of `1,755.02 million as at March 31, 2019, of which `1,646.54 million pertains to Czech subsidiary and Mexico subsidiary, the recoverability of which depends on the generation of sufficient taxable income in future years.
The estimation of future taxable profits of Czech subsidiary and Mexico subsidiary is based on the respective business plans and the applicable tax legislations under the respective jurisdictions.
Therefore, the conclusion concerning the recovery of the deferred tax assets recognized in the consolidated balance sheet in respect of Czech subsidiary and Mexico subsidiary is subject to significant judgments and estimates by the management with respect to both future tax results and applicable tax legislation in the respective jurisdictions in which they operate.
The audit procedures performed by the independent auditors of Czech subsidiary and Mexico subsidiary included the following:
• Tested the projected figures which are based on business plans/budgets approved by the Board and analysed the key assumptions used to determine growth rates and future margins, comparing them against available comparatives and available third party contracts;
• Assessed the criteria used by the management to estimate the possibility of recovering the deferred tax assets in subsequent years, in light of the business plans;
• Tested the tax adjustments, with support from tax specialists, which are taken into account to estimate taxable income, applicable tax legislation and the decisions concerning the possibilities of using applicable tax benefits with respect to the group entities.
• Tested the disclosures of the information in the consolidated financial statements.
4. Transition to Ind AS 115 – Revenue from contracts with customers (as described in note 2.1 and 29 of the consolidated Ind AS financial statements)
The Group has applied Ind AS 115 “Revenue from Contracts with Customers” from April 1, 2018 using the modified retrospective approach.
The management has evaluated each type of contract with the customers in light of the requirements of Ind AS 115. The evaluation involved significant judgment in determining whether the promises to transfer goods and services to the customers are separate performance obligations or one or more of such promises are part of the same performance obligation. Further, significant judgement is also involved in evaluating whether the performance obligations identified are satisfied at a point in time or satisfied over time.
Based on such evaluation, the management has determined that Product development/Engineering services for automotive lighting business should be considered as related to supply of parts rather than a separate performance obligation. As a result, revenue from product development/engineering services is recognized over the period of production as the promise to supply the parts is fulfilled.
Accordingly, the application of Ind AS 115 in respect of product development/engineering services was determined to be a key audit matter in our audit of the consolidated Ind AS financial statements.
The audit procedures performed by us and/or by the independent auditors of the components included the following:
• Assessed the evaluation done by the management in identifying the promises to transfer goods and services in the customer contracts and the performance obligations arising from such promises and also the criteria used to determine whether the performance obligations identified are satisfied at a point in time or satisfied over time.
• Reviewed sample customer contracts and discussed with group senior personnel involved in providing product development/engineering services to understand the rights and obligations of the Group under the customer contracts.
• Tested the workings prepared by management for the application of Ind AS 115 under the modified retrospective approach for completeness of data and tested sample contracts for accuracy of the calculations.
• Tested the disclosures in the Ind AS financial statements for compliance with the relevant accounting standard requirements.
Other Information
The Holding Company’s Board of Directors is responsible for the other information. The other information comprises the Board’s Report (including the Annexures), Corporate Governance Report and Management Discussions and Analysis (but does not include the standalone/consolidated Ind AS financial

150 Varroc Engineering Limited
Financial Statements - Consolidated
Independent Auditor’s Report
statements and our auditor’s report thereon), which we obtained prior to the date of this auditor’s report, and Corporate overview and other details to be included in the annual report, which are expected to be made available to us after that date.
Our opinion on the consolidated Ind AS financial statements does not cover the other information and we do not and will not express any form of assurance conclusion thereon.
In connection with our audit of the consolidated Ind AS financial statements, our responsibility is to read the other information identified above and, in doing so, consider whether the other information is materially inconsistent with the consolidated Ind AS financial statements or our knowledge obtained in the audit or otherwise appears to be materially misstated.
If, based on the work we have performed on the other information that we obtained prior to the date of this auditor’s report, we conclude that there is a material misstatement of this other information, we are required to report that fact. We have nothing to report in this regard.
When we read the Corporate overview and other details included in the annual report, if we conclude that there is a material misstatement therein, we are required to communicate the matter to those charged with governance.
Responsibilities of Management for the Consolidated Ind AS Financial Statements
The Holding Company’s Board of Directors is responsible for the preparation and presentation of these consolidated Ind AS financial statements in terms of the requirements of the Act that give a true and fair view of the consolidated financial position, consolidated financial performance including other comprehensive income, consolidated cash flows and consolidated statement of changes in equity of the Group including its joint ventures in accordance with the accounting principles generally accepted in India, including the Indian Accounting Standards (Ind AS) specified under section 133 of the Act read with the Companies (Indian Accounting Standards) Rules, 2015, as amended. The respective Board of Directors of the companies included in the Group and of its joint ventures are responsible for maintenance of adequate accounting records in accordance with the provisions of the Act for safeguarding of the assets of the Group and of its joint venture and for preventing and detecting frauds and other irregularities; selection and application of appropriate accounting policies; making judgments and estimates that are reasonable and prudent; and the design, implementation and maintenance of adequate internal financial controls, that were operating effectively for ensuring the accuracy and completeness of the accounting records, relevant to the preparation and presentation of the consolidated Ind AS financial statements that give a true and fair view and are free from material misstatement, whether due to fraud or error, which have been used for the purpose of preparation of the consolidated Ind AS financial statements by the Directors of the Holding Company, as aforesaid.
In preparing the consolidated financial statements, the respective Board of Directors of the companies included in the Group and of its joint venture are responsible for assessing the ability of the Group and of its joint venture to continue as a going concern, disclosing, as applicable, matters related to going concern and using the going concern basis of accounting unless management either intends to liquidate the Group and its joint venture or to cease operations, or has no realistic alternative but to do so.
Those respective Board of Directors of the companies included in the Group and of its joint venture are also responsible for overseeing the financial reporting process of the Group and of its joint venture.
Auditor’s Responsibilities for the Audit of the Consolidated Ind AS Financial Statements
Our objectives are to obtain reasonable assurance about whether the consolidated Ind AS financial statements as a whole are free from material misstatement, whether due to fraud or error, and to issue an auditor’s report that includes our opinion. Reasonable assurance is a high level of assurance, but is not a guarantee that an audit conducted in accordance with SAs will always detect a material misstatement when it exists. Misstatements can arise from fraud or error and are considered material if, individually or in the aggregate, they could reasonably be expected to influence the economic decisions of users taken on the basis of these consolidated Ind AS financial statements.
As part of an audit in accordance with SAs, we exercise professional judgment and maintain professional skepticism throughout the audit. We also:
• Identify and assess the risks of material misstatement of the consolidated Ind AS financial statements, whether due to fraud or error, design and perform audit procedures responsive to those risks, and obtain audit evidence that is sufficient and appropriate to provide a basis for our opinion. The risk of not detecting a material misstatement resulting from fraud is higher than for one resulting from error, as fraud may involve collusion, forgery, intentional omissions, misrepresentations, or the override of internal control.
• Obtain an understanding of internal control relevant to the audit in order to design audit procedures that are appropriate in the circumstances. Under section 143(3)(i) of the Act, we are also responsible for expressing our opinion on whether the Holding Company has adequate internal financial controls system in place and the operating effectiveness of such controls.
• Evaluate the appropriateness of accounting policies used and the reasonableness of accounting estimates and related disclosures made by management.
• Conclude on the appropriateness of management’s use of the going concern basis of accounting and, based on the audit evidence obtained, whether a material uncertainty exists related to events or conditions that may cast significant doubt on the ability of the Group and its joint venture to continue as a going concern. If we conclude that a material uncertainty exists, we are required to draw attention in our auditor’s report to the related disclosures in the consolidated Ind AS financial statements or, if such disclosures are inadequate, to modify our opinion. Our conclusions are based on the audit evidence obtained up to the date of our auditor’s report. However, future events or conditions may cause the Group and its joint venture to cease to continue as a going concern.
• Evaluate the overall presentation, structure and content of the consolidated Ind AS financial statements, including the disclosures, and whether the consolidated Ind AS financial statements represent the underlying transactions and events in a manner that achieves fair presentation.

Annual Report 2018-19 151
Financial Statements - Consolidated
Independent Auditor’s Report
• Obtain sufficient appropriate audit evidence regarding the financial information of the entities or business activities within the Group and its joint venture of which we are the independent auditors and whose financial information we have audited, to express an opinion on the consolidated Ind AS financial statements. We are responsible for the direction, supervision and performance of the audit of the financial statements of such entities included in the consolidated financial statements of which we are the independent auditors. For the other entities included in the consolidated financial statements, which have been audited by other auditors, such other auditors remain responsible for the direction, supervision and performance of the audits carried out by them. We remain solely responsible for our audit opinion.
We communicate with those charged with governance of the Holding Company and such other entities included in the consolidated Ind AS financial statements of which we are the independent auditors regarding, among other matters, the planned scope and timing of the audit and significant audit findings, including any significant deficiencies in internal control that we identify during our audit.
We also provide those charged with governance with a statement that we have complied with relevant ethical requirements regarding independence, and to communicate with them all relationships and other matters that may reasonably be thought to bear on our independence, and where applicable, related safeguards.From the matters communicated with those charged with governance, we determine those matters that were of most significance in the audit of the consolidated Ind AS financial statements for the financial year ended March 31, 2019 and are therefore the key audit matters. We describe these matters in our auditor’s report unless law or regulation precludes public disclosure about the matter or when, in extremely rare circumstances, we determine that a matter should not be communicated in our report because the adverse consequences of doing so would reasonably be expected to outweigh the public interest benefits of such communication.
Other Matter
(a) We did not audit the financial statements and other financial information, in respect of 8 subsidiaries, whose Ind AS financial statements include total assets of `54,195.65 million as at March 31, 2019, and total revenues of `74,185.67 million and net cash outflows of `1,128.92 million for the year ended on that date. These Ind AS financial statement and other financial information have been audited by other auditors, whose financial statements, other financial information and auditor’s reports have been furnished to us by the management. The consolidated Ind AS financial statements also include the Group’s share of net profit of `302.86 million for the year ended March 31, 2019, as considered in the consolidated Ind AS financial statements, in respect of 1 joint venture, whose financial statements and other financial information have been audited by other auditors and whose reports have been furnished to us by the Management. Our opinion on the consolidated Ind AS financial statements, in so far as it relates to the amounts and disclosures included in respect of these subsidiaries and joint venture, and our report in terms of sub-sections (3) of Section 143 of the Act, in so far as it relates to the aforesaid subsidiaries and joint venture, is based solely on the reports of such other auditors.
Certain of these subsidiaries and joint venture are located outside India whose financial statements and other financial information have been prepared in accordance with accounting principles generally accepted in their respective countries and which have been audited by other auditors under generally accepted auditing standards applicable in their respective countries. The Company’s management has converted the financial statements of such subsidiaries/joint ventures located outside India from accounting principles generally accepted in their respective countries to accounting principles generally accepted in India. We have audited these conversion adjustments made by the Company’s management. Our opinion in so far as it relates to the balances and affairs of such subsidiaries/joint ventures located outside India is based on the report of other auditors and the conversion adjustments prepared by the management of the Company and audited by us.
(b) The accompanying consolidated Ind AS financial statements include unaudited financial statements and other unaudited financial information in respect of 9 subsidiaries, whose financial statements and other financial information reflect total assets of `12,633.21 million as at March 31, 2019 and total revenues of `1,458.44 million and net cash inflows of `165.69 million for the year ended on that date. These unaudited financial statements and other unaudited financial information have been furnished to us by the management. The consolidated Ind AS financial statements also include the Group’s share of net profit of `12.37 million for the year ended March 31, 2019, as considered in the consolidated Ind AS financial statements, in respect of 3 joint ventures, whose financial statements, other financial information have not been audited and whose unaudited financial statements, other unaudited financial information have been furnished to us by the Management. Our opinion, in so far as it relates amounts and disclosures included in respect of these subsidiaries and joint venture and our report in terms of sub-sections (3) of Section 143 of the Act in so far as it relates to the aforesaid subsidiaries and joint venture, is based solely on such unaudited financial statements and other unaudited financial information. In our opinion and according to the information and explanations given to us by the Management, these financial statements and other financial information are not material to the Group.
(c) The consolidated Ind AS financial statements of the Company for the year ended March 31, 2018, included in these consolidated Ind AS financial statements, have been audited by the predecessor auditor who expressed an unmodified opinion on those statements on June 6, 2018.
Our opinion above on the consolidated Ind AS financial statements, and our report on Other Legal and Regulatory Requirements below, is not modified in respect of the above matters with respect to our reliance on the work done and the reports of the other auditors and the financial statements and other financial information certified by the Management.
Report on Other Legal and Regulatory Requirements
As required by Section 143(3) of the Act, based on our audit and on the consideration of report of the other auditors on separate financial statements and the other financial information of subsidiaries and joint venture as noted in the ‘other matter’ paragraph, we report, to the extent applicable, that:
(a) We/the other auditors whose report we have relied upon have sought and obtained all the information and explanations which to the best of our knowledge and belief were necessary for the purposes of our audit of the aforesaid consolidated Ind AS financial statements;
(b) In our opinion, proper books of account as required by law relating to preparation of the aforesaid consolidation of the financial statements have been
kept so far as it appears from our examination of those books and reports of the other auditors;

152 Varroc Engineering Limited
Financial Statements - Consolidated
Independent Auditor’s Report
(c) The Consolidated Balance Sheet, the Consolidated Statement of Profit and Loss including the Statement of Other Comprehensive Income, the Consolidated Cash Flow Statement and Consolidated Statement of Changes in Equity dealt with by this Report are in agreement with the books of account maintained for the purpose of preparation of the consolidated Ind AS financial statements;
(d) In our opinion, the aforesaid consolidated Ind AS financial statements comply with the Accounting Standards specified under Section 133 of the Act, read with Companies (Indian Accounting Standards) Rules, 2015, as amended;
(e) On the basis of the written representations received from the directors of the Holding Company as on March 31, 2019 taken on record by the Board of Directors of the Holding Company and the reports of the statutory auditors who are appointed under Section 139 of the Act, of its subsidiary companies, none of the directors of the Group’s companies incorporated in India is disqualified as on March 31, 2019 from being appointed as a director in terms of Section 164(2) of the Act;
(f) With respect to the adequacy and the operating effectiveness of the internal financial controls over financial reporting with reference to these consolidated Ind AS financial statements of the Holding Company and its subsidiary companies incorporated in India, refer to our separate Report in “Annexure 1” to this report;
(g) In our opinion, the managerial remuneration for the year ended March 31, 2019 has been paid / provided by the Holding Company and its subsidiaries incorporated in India to their directors in accordance with the provisions of section 197 read with Schedule V to the Act;
(h) With respect to the other matters to be included in the Auditor’s Report in accordance with Rule 11 of the Companies (Audit and Auditors) Rules, 2014, as amended, in our opinion and to the best of our information and according to the explanations given to us and based on the consideration of the report of the other auditors on separate financial statements as also the other financial information of the subsidiaries and joint ventures, as noted in the ‘Other matter’ paragraph:
i. The consolidated Ind AS financial statements disclose the impact of pending litigations on the consolidated financial position of the Group and its joint ventures in its consolidated Ind AS financial statements – Refer Note 40 to the consolidated Ind AS financial statements;
ii. Provision has been made in the consolidated Ind AS financial statements, as required under the applicable law or accounting standards, for material foreseeable losses, if any, on long-term contracts including derivative contracts – Refer Note 26 to the consolidated Ind AS financial statements in respect of such items as it relates to the Group and its joint ventures;
iii. There were no amounts which were required to be transferred to the Investor Education and Protection Fund by the Holding Company and its subsidiaries incorporated in India during the year ended March 31, 2019.
For S R B C & CO LLPChartered AccountantsICAI Firm Registration Number: 324982E/E300003
per Paul AlvaresPartnerMembership Number: 105754
Place of Signature: MumbaiDate: May 24, 2019
Annual Report 2018-19 153
Financial Statements - Consolidated
Annexure 1 to The Independent Auditor's Report of Even Date on The Consolidated Ind as Financial Statements
Report on the Internal Financial Controls under Clause (i) of Sub-section 3 of Section 143 of the Companies Act, 2013 (“the Act”)
In conjunction with our audit of the consolidated Ind AS financial statements of Varroc Engineering Limited as of and for the year ended March 31, 2019, we have audited the internal financial controls over financial reporting of Varroc Engineering Limited (hereinafter referred to as the “Holding Company”) and its subsidiary companies, which are companies incorporated in India, as of that date.
Management’s Responsibility for Internal Financial Controls
The respective Board of Directors of the Holding Company, its subsidiary companies, which are companies incorporated in India, are responsible for establishing and maintaining internal financial controls based on the internal control over financial reporting criteria established by the Holding Company considering the essential components of internal control stated in the Guidance Note on Audit of Internal Financial Controls Over Financial Reporting issued by the Institute of Chartered Accountants of India. These responsibilities include the design, implementation and maintenance of adequate internal financial controls that were operating effectively for ensuring the orderly and efficient conduct of its business, including adherence to the respective company’s policies, the safeguarding of its assets, the prevention and detection of frauds and errors, the accuracy and completeness of the accounting records, and the timely preparation of reliable financial information, as required under the Act.
Auditor’s Responsibility
Our responsibility is to express an opinion on the company's internal financial controls over financial reporting with reference to these consolidated Ind AS financial statements based on our audit. We conducted our audit in accordance with the Guidance Note on Audit of Internal Financial Controls Over Financial Reporting (the “Guidance Note”) and the Standards on Auditing, both, issued by Institute of Chartered Accountants of India, and deemed to be prescribed under section 143(10) of the Act, to the extent applicable to an audit of internal financial controls. Those Standards and the Guidance Note require that we comply with ethical requirements and plan and perform the audit to obtain reasonable assurance about whether adequate internal financial controls over financial reporting with reference to these consolidated Ind AS financial statements was established and maintained and if such controls operated effectively in all material respects.
Our audit involves performing procedures to obtain audit evidence about the adequacy of the internal financial controls over financial reporting with reference to these consolidated Ind AS financial statements and their operating effectiveness. Our audit of internal financial controls over financial reporting included obtaining an understanding of internal financial controls over financial reporting with reference to these consolidated Ind AS financial statements, assessing the risk that a material weakness exists, and testing and evaluating the design and operating effectiveness of internal control based on the assessed risk. The procedures selected depend on the auditor’s judgement, including the assessment of the risks of material misstatement of the financial statements, whether due to fraud or error.
We believe that the audit evidence we have obtained, is sufficient and appropriate to provide a basis for our audit opinion on the internal financial controls over financial reporting with reference to these consolidated Ind AS financial statements.
Meaning of Internal Financial Controls Over Financial Reporting With Reference to these Consolidated Ind AS Financial Statements
A company's internal financial control over financial reporting with reference to these consolidated Ind AS financial statements is a process designed to provide reasonable assurance regarding the reliability of financial reporting and the preparation of financial statements for external purposes in accordance with generally accepted accounting principles. A company's internal financial control over financial reporting with reference to these consolidated Ind AS financial statements includes those policies and procedures that (1) pertain to the maintenance of records that, in reasonable detail, accurately and fairly reflect the transactions and dispositions of the assets of the company; (2) provide reasonable assurance that transactions are recorded as necessary to permit preparation of financial statements in accordance with generally accepted accounting principles, and that receipts and expenditures of the company are being made only in accordance with authorisations of management and directors of the company; and (3) provide reasonable assurance regarding prevention or timely detection of unauthorised acquisition, use, or disposition of the company's assets that could have a material effect on the financial statements.
Inherent Limitations of Internal Financial Controls Over Financial Reporting With Reference to these Consolidated Ind AS Financial Statements
Because of the inherent limitations of internal financial controls over financial reporting with reference to these consolidated Ind AS financial statements, including the possibility of collusion or improper management override of controls, material misstatements due to error or fraud may occur and not be detected. Also, projections of any evaluation of the internal financial controls over financial reporting with reference to these consolidated Ind AS financial statements to future periods are subject to the risk that the internal financial control over financial reporting with reference to these consolidated Ind AS financial statements may become inadequate because of changes in conditions, or that the degree of compliance with the policies or procedures may deteriorate.
Opinion
In our opinion, the Holding Company and its subsidiary companies, which are companies incorporated in India, have, maintained in all material respects, adequate internal financial controls over financial reporting with reference to these consolidated Ind AS financial statements and such internal financial controls over financial reporting with reference to these consolidated Ind AS financial statements were operating effectively as at March 31,2019, based on the internal control over financial reporting criteria established by the Holding Company considering the essential components of internal control stated in the Guidance Note on Audit of Internal Financial Controls Over Financial Reporting issued by the Institute of Chartered Accountants of India.
For S R B C & CO LLPChartered AccountantsICAI Firm Registration Number: 324982E/E300003
per Paul AlvaresPartnerMembership Number: 105754
Place of Signature: MumbaiDate: May 24, 2019

154 Varroc Engineering Limited
(`in million)
Notes As at March 31, 2019 As at March 31, 2018
ASSETS
Non current assets
Property, plant and equipment 3 29,137.15 25,863.21
Capital work-in-progress 3 6,662.80 2,440.47
Investment properties 4 134.40 140.55
Goodwill 5 (b) 1,992.53 334.72
Other Intangible assets 5 (a) 4,334.14 1,701.05
Intangible assets under development 5 (a) 3,331.90 1,000.25
Investments accounted for using the equity method 53 3,433.86 3,564.96
Financial assets
Investments 6 0.20 0.20
Loans 7 127.88 106.81
Other financial assets 8 374.90 138.71
Income tax assets (net) 152.03 124.35
Deferred tax assets (net) 22 1,755.02 1,030.00
Other non-current assets 9 2,422.09 1,474.26
Total non-current assets 53,858.90 37,919.54
Current assets
Inventories 10 9,199.24 8,640.97
Financial assets
Investments 11 186.41 30.32
Trade receivables 12 13,495.13 14,027.34
Cash and cash equivalents 13(a) 1,608.42 3,265.78
Other bank balances 13(b) 25.86 23.59
Loans 14 179.48 40.07
Other financial assets 15 18.72 222.56
Other current assets 16 8,958.20 4,353.75
Total current assets 33,671.46 30,604.38
Total Assets 87,530.36 68,523.92
EQUITY AND LIABILITIES
Equity
Equity share capital 17 134.81 123.13
Compulsorily convertible preference shares (entirely equity in nature) - 11.68
Other equity 18 30,736.21 28,145.24
Equity attributable to equity holders of the parent 30,871.02 28,280.05
Non-controlling interests 241.31 207.67
Total equity 31,112.33 28,487.72
Consolidated Balance Sheet Financial Statements - Consolidated
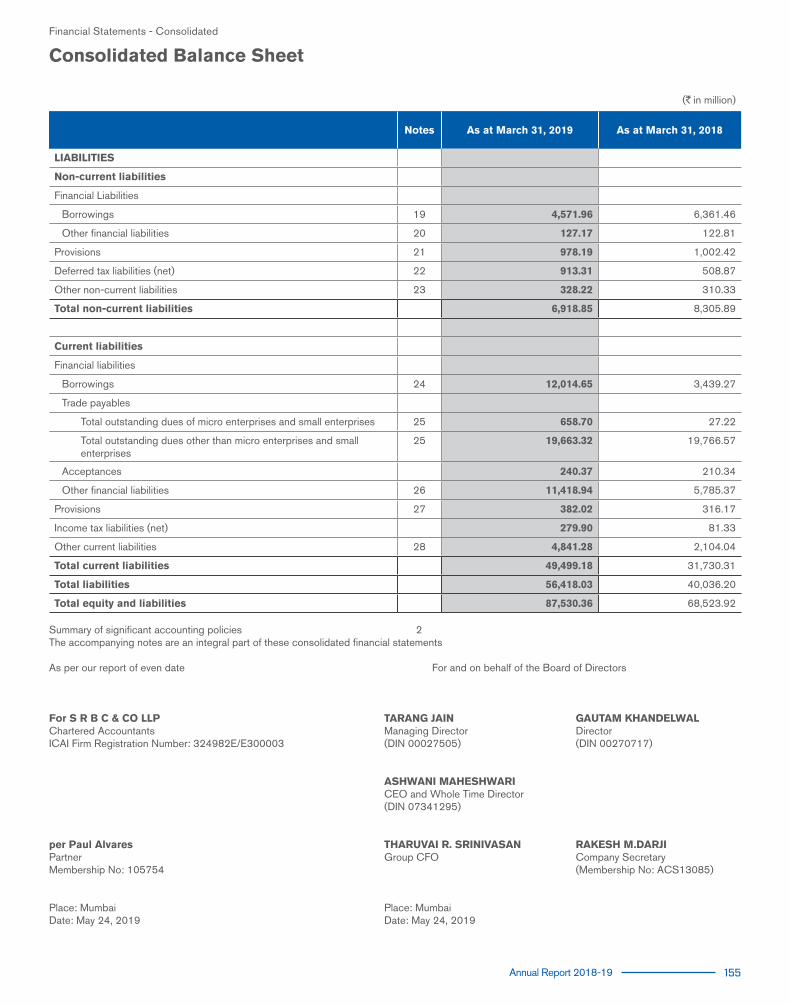
Annual Report 2018-19 155
(`in million)
Notes As at March 31, 2019 As at March 31, 2018
LIABILITIES
Non-current liabilities
Financial Liabilities
Borrowings 19 4,571.96 6,361.46
Other financial liabilities 20 127.17 122.81
Provisions 21 978.19 1,002.42
Deferred tax liabilities (net) 22 913.31 508.87
Other non-current liabilities 23 328.22 310.33
Total non-current liabilities 6,918.85 8,305.89
Current liabilities
Financial liabilities
Borrowings 24 12,014.65 3,439.27
Trade payables
Total outstanding dues of micro enterprises and small enterprises 25 658.70 27.22
Total outstanding dues other than micro enterprises and small enterprises
25 19,663.32 19,766.57
Acceptances 240.37 210.34
Other financial liabilities 26 11,418.94 5,785.37
Provisions 27 382.02 316.17
Income tax liabilities (net) 279.90 81.33
Other current liabilities 28 4,841.28 2,104.04
Total current liabilities 49,499.18 31,730.31
Total liabilities 56,418.03 40,036.20
Total equity and liabilities 87,530.36 68,523.92
Summary of significant accounting policies 2The accompanying notes are an integral part of these consolidated financial statements
As per our report of even date For and on behalf of the Board of Directors
For S R B C & CO LLP TARANG JAIN GAUTAM KHANDELWAL Chartered Accountants Managing Director Director ICAI Firm Registration Number: 324982E/E300003 (DIN 00027505) (DIN 00270717)
ASHWANI MAHESHWARI CEO and Whole Time Director (DIN 07341295) per Paul Alvares THARUVAI R. SRINIVASAN RAKESH M.DARJI Partner Group CFO Company Secretary Membership No: 105754 (Membership No: ACS13085)
Place: Mumbai Place: Mumbai Date: May 24, 2019 Date: May 24, 2019
Consolidated Balance Sheet Financial Statements - Consolidated
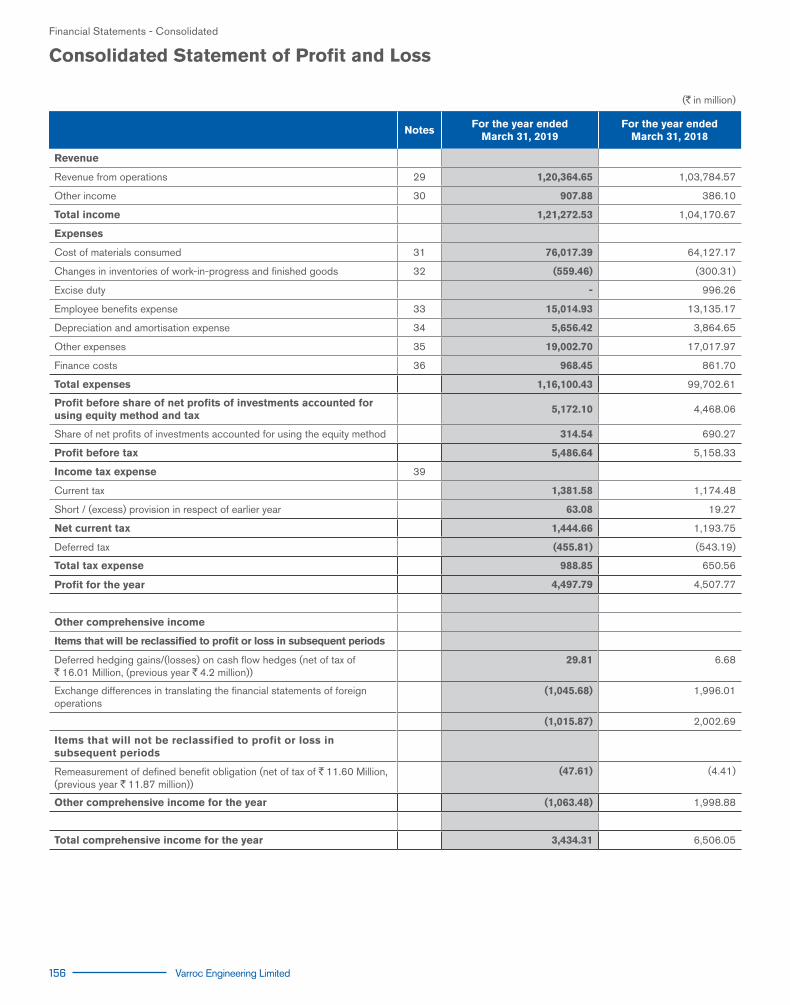
156 Varroc Engineering Limited
Consolidated Statement of Profit and Loss
(`in million)
NotesFor the year ended
March 31, 2019For the year ended
March 31, 2018
Revenue
Revenue from operations 29 1,20,364.65 1,03,784.57
Other income 30 907.88 386.10
Total income 1,21,272.53 1,04,170.67
Expenses
Cost of materials consumed 31 76,017.39 64,127.17
Changes in inventories of work-in-progress and finished goods 32 (559.46) (300.31)
Excise duty - 996.26
Employee benefits expense 33 15,014.93 13,135.17
Depreciation and amortisation expense 34 5,656.42 3,864.65
Other expenses 35 19,002.70 17,017.97
Finance costs 36 968.45 861.70
Total expenses 1,16,100.43 99,702.61
Profit before share of net profits of investments accounted for using equity method and tax
5,172.10 4,468.06
Share of net profits of investments accounted for using the equity method 314.54 690.27
Profit before tax 5,486.64 5,158.33
Income tax expense 39
Current tax 1,381.58 1,174.48
Short / (excess) provision in respect of earlier year 63.08 19.27
Net current tax 1,444.66 1,193.75
Deferred tax (455.81) (543.19)
Total tax expense 988.85 650.56
Profit for the year 4,497.79 4,507.77
Other comprehensive income
Items that will be reclassified to profit or loss in subsequent periods
Deferred hedging gains/(losses) on cash flow hedges (net of tax of `16.01 Million, (previous year `4.2 million))
29.81 6.68
Exchange differences in translating the financial statements of foreign operations
(1,045.68) 1,996.01
(1,015.87) 2,002.69
Items that will not be reclassified to profit or loss in subsequent periods
Remeasurement of defined benefit obligation (net of tax of `11.60 Million, (previous year `11.87 million))
(47.61) (4.41)
Other comprehensive income for the year (1,063.48) 1,998.88
Total comprehensive income for the year 3,434.31 6,506.05
Financial Statements - Consolidated

Annual Report 2018-19 157
Consolidated Statement of Profit and Loss
(`in million)
NotesFor the year ended
March 31, 2019For the year ended
March 31, 2018
Profit attributable to:
Owners 4,463.20 4,502.58
Non-controlling interests 34.59 5.19
Other comprehensive income attributable to:
Owners (1,062.71) 1,997.80
Non-controlling interests (0.77) 0.48
Total comprehensive income attributable to:
Owners 3,400.49 6,500.38
Non-controlling interests 33.82 5.67
Earnings per equity share attributable to Owners [Nominal value per share: `1 (Previous year : `1)]
51
Basic 33.11 33.40
Diluted 33.11 33.40
Summary of significant accounting policies 2The accompanying notes are an integral part of these consolidated financial statements
As per our report of even date For and on behalf of the Board of Directors
For S R B C & CO LLP TARANG JAIN GAUTAM KHANDELWAL Chartered Accountants Managing Director Director ICAI Firm Registration Number: 324982E/E300003 (DIN 00027505) (DIN 00270717)
ASHWANI MAHESHWARI CEO and Whole Time Director (DIN 07341295) per Paul Alvares THARUVAI R. SRINIVASAN RAKESH M.DARJI Partner Group CFO Company Secretary Membership No: 105754 (Membership No: ACS13085)
Place: Mumbai Place: Mumbai Date: May 24, 2019 Date: May 24, 2019
Financial Statements - Consolidated

158 Varroc Engineering Limited
A. E
qu
ity
an
d p
refe
ren
ce s
hare
cap
ital
(`in
mill
ion)
Eq
uit
y S
hare
sP
refe
ren
ce S
hare
s
Marc
h31
, 201
9M
arc
h
31, 2
018
Marc
h31
, 201
9M
arc
h
31, 2
018
Bala
nce
at
the b
eg
inn
ing
of
the y
ear
123
.13
114
.61
11.
68
20.
20
Add
: Con
vers
ion
of s
erie
s "B
" C
CP
S P
refe
renc
e sh
ares
into
852
,359
equ
ity s
hare
s (r
efer
not
e 17
(d))
-
8.5
2 -
(8
.52)
Add
: Con
vers
ion
of s
erie
s "C
" C
CP
S P
refe
renc
e sh
ares
into
11,
683,
770
equi
ty
shar
es (r
efer
not
e 17
(c))
11.
68
-
(11
.68)
-
Bala
nce
at
the e
nd
of
the y
ear
134
.81
123
.13
-
11.
68
B.
O
ther
Eq
uit
y
(`in
mill
ion)
Rese
rves
an
d S
urp
lus
Oth
er
Rese
rves
Eq
uit
yatt
rib
uta
ble
toO
wn
ers
No
nC
on
tro
llin
gIn
tere
sts
Tota
l E
qu
ity
Reta
ined
earn
ing
sG
en
era
l re
serv
e
Deb
en
ture
re
dem
pti
on
re
serv
e
Cap
ital
red
em
pti
on
re
serv
e
Cap
ital
Rese
rve
Sta
tuto
ry
rese
rves
Secu
riti
es
pre
miu
m
Fo
reig
n
Cu
rren
cy
Tran
slati
on
R
ese
rve
Cash
flo
w
hed
ge
rese
rve
Bala
nce
at
Ap
ril 1,
201
7 4
,862
.75
3,7
47.1
4 2
00.0
0 1
1.30
6
,095
.34
365
.50
6,1
28.6
6 5
4.90
(8
.94)
21,
456.
65
201
.59
21,
658.
24
Cor
rect
ion
of P
rior P
erio
d er
ror (
Ref
er N
ote
38)
272
.67
-
-
-
-
-
-
(10.
38)
262
.29
-
262
.29
As
at
1 A
pri
l 20
17 (
rest
ate
d)
5,1
35.4
2 3
,747
.14
200
.00
11.
30
6,0
95.3
4 3
65.5
0 6
,128
.66
44.
52
(8.9
4) 2
1,71
8.94
2
01.5
9 2
1,92
0.53
Pro
fit fo
r the
yea
r 4
,502
.58
-
-
-
-
-
-
-
-
4,5
02.5
8 5
.19
4,5
07.7
7
Oth
er c
ompr
ehen
sive
inco
me
(4.8
9) -
-
-
-
-
-
1
,996
.01
6.6
8 1
,997
.80
0.4
8 1
,998
.28
Tota
l co
mp
reh
en
sive
in
com
e 4
,497
.69
-
-
-
-
-
-
1,9
96.0
1 6
.68
6,5
00.3
8 5
.67
6,5
06.0
5
Tran
sfer
to d
eben
ture
rede
mpt
ion
rese
rve
(125
.00)
-
125
.00
-
-
-
-
-
-
-
-
-
Adj
ustm
ent o
n ac
coun
t of c
apita
l red
uctio
n (r
efer
not
e 17
(d))
205
.95
447
.59
(760
.26)
45.
30
61.
42
-
-
-
-
-
Div
iden
d pa
id (i
nclu
ding
div
iden
d di
strib
utio
n ta
x `
12.5
2 m
illio
n) (7
4.08
) -
-
-
(7
4.08
) -
(7
4.08
)
Oth
er
-
-
-
-
-
0.4
1 0
.41
Bala
nce
at
Marc
h 3
1, 2
018
9,6
39.9
8 4
,194
.73
325
.00
11.
30
5,3
35.0
8 4
10.8
0 6
,190
.08
2,0
40.5
3 (
2.26
) 2
8,14
5.24
2
07.6
7 2
8,35
2.91
Financial Statements - Consolidated
Sta
tem
en
t o
f ch
an
ges
in e
qu
ity
for
the y
ear
en
ded
Marc
h 3
1, 2
019

Annual Report 2018-19 159
(`in
mill
ion)
Rese
rves
an
d S
urp
lus
Oth
er
Rese
rves
Eq
uit
yatt
rib
uta
ble
toO
wn
ers
No
nC
on
tro
llin
gIn
tere
sts
Tota
l E
qu
ity
Reta
ined
earn
ing
sG
en
era
l re
serv
e
Deb
en
ture
re
dem
pti
on
re
serv
e
Cap
ital
red
em
pti
on
re
serv
e
Cap
ital
Rese
rve
Sta
tuto
ry
rese
rves
Secu
riti
es
pre
miu
m
Fo
reig
n
Cu
rren
cy
Tran
slati
on
R
ese
rve
Cash
flo
w
hed
ge
rese
rve
Bala
nce
as
at
Ap
ril 01
, 201
8 9
,639
.98
4,1
94.7
3 3
25.0
0 1
1.30
5
,335
.08
410
.80
6,1
90.0
8 2
,040
.53
(2.2
6) 2
8,14
5.24
2
07.6
7 2
8,35
2.91
Impa
ct o
f cha
nge
in a
ccou
ntin
g po
licy
(refe
r no
te 2
.1)
(689
.92)
(77.
01)
(766
.93)
-
(766
.93)
As
at
1 A
pri
l 20
18 (
rest
ate
d)
8,9
50.0
6 4
,194
.73
325
.00
11.
30
5,3
35.0
8 4
10.8
0 6
,190
.08
1,9
63.5
2 (2
.26)
27,
378.
31
207
.67
27,
585.
98
Pro
fit fo
r the
yea
r 4
,463
.20
-
-
-
-
-
-
-
-
4,4
63.2
0 3
4.59
4
,497
.79
Oth
er c
ompr
ehen
sive
inco
me
(46.
84)
-
-
-
-
-
-
(1,0
45.6
8) (4
.39)
(1,0
96.9
1) (0
.77)
(1,0
97.6
8)
Tota
l co
mh
reh
en
sive
in
com
e 4
,416
.36
-
-
-
-
-
-
(1,
045.
68)
(4.
39)
3,3
66.2
9 3
3.82
3
,400
.11
Div
iden
d pa
id (i
nclu
ding
div
iden
d di
strib
utio
n ta
x `
2.55
mill
ion)
(8.3
9) -
-
-
-
-
-
-
-
(8
.39)
(8
.39)
Oth
er
-
-
-
(0.1
8) (0
.18)
Bala
nce
at
Marc
h 3
1, 2
019
13,
358.
03
4,1
94.7
3 3
25.0
0 1
1.30
5
,335
.08
410
.80
6,1
90.0
8 9
17.8
4 (
6.65
) 3
0,73
6.21
24
1.31
30,9
77.5
2
The
acco
mpa
nyin
g no
tes
are
an in
tegr
al p
art o
f the
se c
onso
lidat
ed fi
nanc
ial s
tate
men
tsA
s pe
r our
repo
rt o
f eve
n da
te
Fo
r and
on
beha
lf of
the
Boa
rd o
f Dire
ctor
s
Fo
r S
R B
C &
CO
LLP
TAR
AN
G J
AIN
GA
UTA
M K
HA
ND
ELW
AL
Cha
rter
ed A
ccou
ntan
ts
Man
agin
g D
irect
or
D
irect
or
IC
AI F
irm R
egis
trat
ion
Num
ber:
3249
82E
/E30
0003
(D
IN 0
0027
505)
(DIN
002
7071
7)
AS
HW
AN
I M
AH
ES
HW
AR
I
C
EO
and
Who
le T
ime
Dire
ctor
(DIN
073
4129
5)
per
Pau
l A
lvare
s
TH
AR
UV
AI
R. S
RIN
IVA
SA
N
RA
KE
SH
M.D
AR
JI
Par
tner
Gro
up C
FO
C
ompa
ny S
ecre
tary
Mem
bers
hip
No:
105
754
(M
embe
rshi
p N
o: A
CS
1308
5)
Pla
ce: M
umba
i
Pla
ce: M
umba
i D
ate:
May
24,
201
9
Dat
e: M
ay 2
4, 2
019
Financial Statements - Consolidated
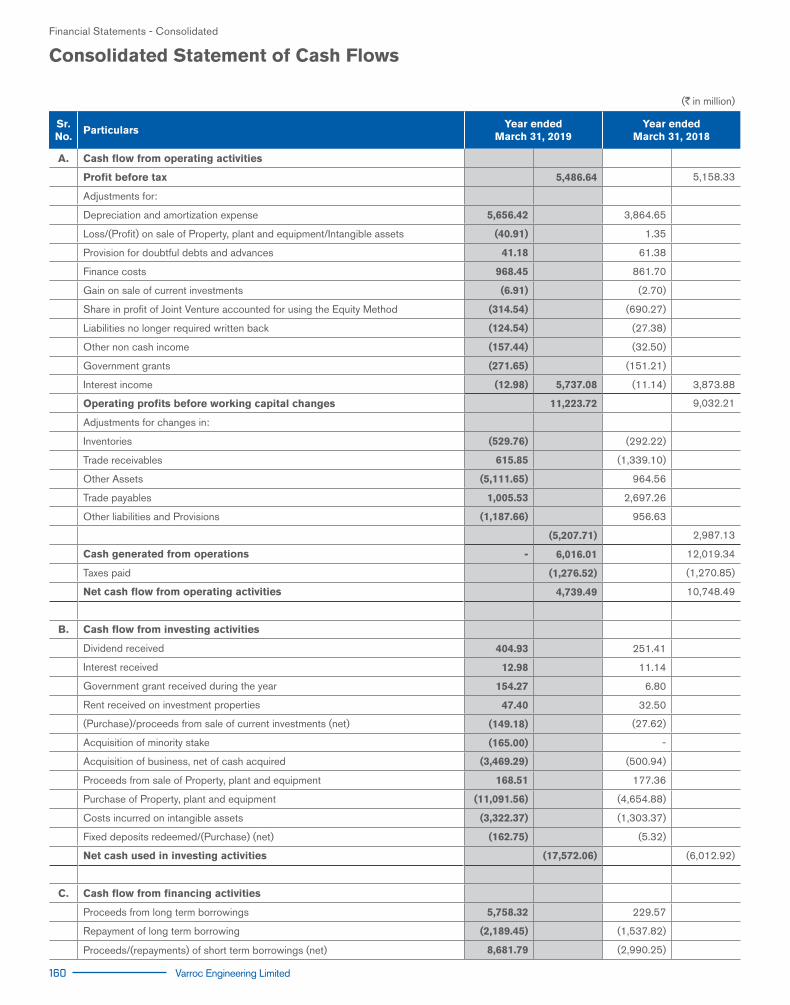
160 Varroc Engineering Limited
(`in million)
Sr. No.
ParticularsYear ended
March 31, 2019Year ended
March 31, 2018
A. Cash flow from operating activities
Profit before tax 5,486.64 5,158.33
Adjustments for:
Depreciation and amortization expense 5,656.42 3,864.65
Loss/(Profit) on sale of Property, plant and equipment/Intangible assets (40.91) 1.35
Provision for doubtful debts and advances 41.18 61.38
Finance costs 968.45 861.70
Gain on sale of current investments (6.91) (2.70)
Share in profit of Joint Venture accounted for using the Equity Method (314.54) (690.27)
Liabilities no longer required written back (124.54) (27.38)
Other non cash income (157.44) (32.50)
Government grants (271.65) (151.21)
Interest income (12.98) 5,737.08 (11.14) 3,873.88
Operating profits before working capital changes 11,223.72 9,032.21
Adjustments for changes in:
Inventories (529.76) (292.22)
Trade receivables 615.85 (1,339.10)
Other Assets (5,111.65) 964.56
Trade payables 1,005.53 2,697.26
Other liabilities and Provisions (1,187.66) 956.63
(5,207.71) 2,987.13
Cash generated from operations - 6,016.01 12,019.34
Taxes paid (1,276.52) (1,270.85)
Net cash flow from operating activities 4,739.49 10,748.49
B. Cash flow from investing activities
Dividend received 404.93 251.41
Interest received 12.98 11.14
Government grant received during the year 154.27 6.80
Rent received on investment properties 47.40 32.50
(Purchase)/proceeds from sale of current investments (net) (149.18) (27.62)
Acquisition of minority stake (165.00) -
Acquisition of business, net of cash acquired (3,469.29) (500.94)
Proceeds from sale of Property, plant and equipment 168.51 177.36
Purchase of Property, plant and equipment (11,091.56) (4,654.88)
Costs incurred on intangible assets (3,322.37) (1,303.37)
Fixed deposits redeemed/(Purchase) (net) (162.75) (5.32)
Net cash used in investing activities (17,572.06) (6,012.92)
C. Cash flow from financing activities
Proceeds from long term borrowings 5,758.32 229.57
Repayment of long term borrowing (2,189.45) (1,537.82)
Proceeds/(repayments) of short term borrowings (net) 8,681.79 (2,990.25)
Consolidated Statement of Cash FlowsFinancial Statements - Consolidated

Annual Report 2018-19 161
(`in million)
Sr. No.
ParticularsYear ended
March 31, 2019Year ended
March 31, 2018
Dividend on equity and preference shares including tax thereon (8.39) (74.08)
Interest paid (952.83) (859.18)
Net cash flow from /(used in) financing activities 11,289.45 (5,231.76)
Net increase/ (decrease) in Cash and Cash Equivalents (A+B+C) (1,543.12) (496.19)
Opening cash and cash equivalents 3,117.05 3,053.21
Effect of exchange difference on translation of foreign currency cash and cash equivalents (118.65) 560.03
Total 2,998.40 3,613.24
Closing cash and cash equivalents 1,455.28 3,117.05
Cash and cash equivalents consists of
Cash in hand 2.26 2.19
Bank balances
Current accounts and deposits with maturity of less than three months 1,606.16 3,263.59
Bank overdraft (Refer note 24) (153.13) (148.73)
1,455.28 3,117.05
Notes: 1 The above Statement of Cash Flows has been prepared under the indirect method as set out in Ind AS 7 : on "Statement of Cash Flows". 2 Figures in brackets represent out flow of Cash and cash equivalents.
Summary of significant accounting policies 2The accompanying notes are an integral part of these consolidated financial statements
As per our report of even date For and on behalf of the Board of Directors
For S R B C & CO LLP TARANG JAIN GAUTAM KHANDELWAL Chartered Accountants Managing Director Director ICAI Firm Registration Number: 324982E/E300003 (DIN 00027505) (DIN 00270717)
ASHWANI MAHESHWARI CEO and Whole Time Director (DIN 07341295) per Paul Alvares THARUVAI R. SRINIVASAN RAKESH M.DARJI Partner Group CFO Company Secretary Membership No: 105754 (Membership No: ACS13085)
Place: Mumbai Place: Mumbai Date: May 24, 2019 Date: May 24, 2019
Consolidated Statement of Cash FlowsFinancial Statements - Consolidated

162 Varroc Engineering Limited
1. Corporate information
Varroc Engineering Limited (the "Company" ) is engaged in the business of manufacturing of Automobile components. The company is a public company domiciled in India and is incorporated under the provisions of the Companies Act applicable in India. Its shares are listed on two recognised stock exchanges in India. The registered office of the company is located at L-4 M.I.D.C Area ,Waluj, Aurangabad-431 136.
The Company and its subsidiaries (collectively, the Group) are primarily engaged in the business of auto components and services in the automotive
industry to Indian and global customers. The Company, its subsidiaries and jointly controlled entities operate from manufacturing plants and technical development centers across 4 continents and 12 countries spread across the globe.
The consolidated financial statements were authorised for issue in accordance with a resolution of the Board of directors on May 24, 2019.
2. Significant accounting policies
This note provides a list of the significant accounting policies adopted in the preparation of these consolidated financial statements. These policies have been consistently applied to all the years presented, unless otherwise stated. The consolidated financial statements comprise financial statements of the Company, its subsidiaries and its jointly controlled entities.
(a) Basis of preparation
(i) Compliance with Ind AS:
The Consolidated Financial Statements comply in all material aspects with Indian Accounting Standards (Ind AS) notified under Section 133 of the Companies Act, 2013 (the Act) [Companies (Indian Accounting Standards) Rules, 2015] and other relevant provisions of the Act.
All amounts included in these consolidated financial statements are reported in Million of Indian rupees (`In Million) except earning per share data and unless stated otherwise. All amounts in these consolidated financial statements have been rounded off to the nearest million or decimal thereof unless otherwise stated.
(ii) Use of estimates and assumptions
The preparation of the Consolidated Financial Statements requires the management to make certain judgments, estimates and assumptions. It also requires the management to exercise judgement in the process of applying the accounting policies. The areas involving a higher degree of judgement or complexity, or areas where assumptions and estimates are significant to the consolidated financial statements are disclosed in Note 2A.
(iii) Historical cost convention:
The consolidated financial statements have been prepared on a historical cost basis, except for the following: • certain financial assets and liabilities (including derivative instruments) that are measured at fair value; and • defined benefit plans and plan assets measured at fair value.
(iv) Current - Non-current classification:
All assets and liabilities have been classified as current or non-current as per the Group’s operating cycle and other criteria set out in the Schedule III to the Companies Act, 2013. Based on the nature of products and the time between the acquisition of assets for processing and their realisation in cash and cash equivalents, the Group has ascertained its operating cycle as 12 months for the purpose of current – non-current classification of assets and liabilities.
(b) Principles of consolidation and equity accounting
The Consolidated Financial Statements comprise the financial statements of the Company, its subsidiaries and joint ventures as at and for the year ended 31 March, 2019.
Control is achieved when the Group is exposed, or has rights, to variable returns from its involvement with the investee and has the ability to affect those returns through its power over the investee. Specifically, the Group controls an investee if and only if the Group has:
• Power over the investee (i.e. existing rights that give it the current ability to direct the relevant activities of the investee) • Exposure, or rights, to variable returns from its involvement with the investee, and • The ability to use its power over the investee to affect its returns
The Group re-assesses whether or not it controls an investee if facts and circumstances indicate that there are changes to one or more of the three elements of control. Consolidation of a subsidiary begins when the Group obtains control over the subsidiary and ceases when the Group loses control of the subsidiary. Assets, liabilities, income and expenses of a subsidiary acquired or disposed of during the year are included in the Consolidated Financial Statements from the date the Group gains control until the date the Group ceases to control the subsidiary.
Consolidated financial statements are prepared using uniform accounting policies for like transactions and other events in similar circumstances. If a member of the group uses accounting policies other than those adopted in the consolidated financial statements for like transactions and events in similar circumstances, appropriate adjustments are made to that group member's financial statements in preparing the consolidated financial statements to ensure conformity with the group's accounting policies.
Financial Statements - Consolidated
Notes to the consolidated financial statements for the year ended March 31, 2019

Annual Report 2018-19 163
The financial statements of all entities used for the purpose of consolidation are drawn up to same reporting date as that of the parent company, i.e., year ended on 31 March. When the end of the reporting period of the parent is different from that of a subsidiary, the subsidiary prepares, for consolidation purposes, additional financial information as of the same date as the financial statements of the parent to enable the parent to consolidate the financial information of the subsidiary, unless it is impracticable to do so.
(i) Subsidiaries
Subsidiaries are all entities over which the group has control. The group combines the financial statements of the parent and its subsidiaries line by line adding together like items of assets, liabilities, equity, income and expenses. Intercompany transactions, balances and unrealized gains on transactions between group companies are eliminated. Unrealized losses are also eliminated unless the transaction provides evidence of an impairment of the transferred asset. Accounting policies of subsidiaries have been changed where necessary to ensure consistency with the policies adopted by the group.
Non-controlling interests in the results and equity of subsidiaries are shown separately in the consolidated statement of profit and loss, consolidated statement of changes in equity and balance sheet respectively.
(ii) Joint arrangements
Under Ind AS 111 Joint Arrangements, investments in joint arrangements are classified as either joint operations or joint ventures. The classification depends on the contractual rights and obligations of each investor, rather than the legal structure of the joint arrangement.
a) Joint ventures
Interests in joint ventures are accounted for using the equity method (see (iii) below), after initially being recognized at cost in the Consolidated Financial Statements.
b) Joint operations
The Group recognises its direct right to the assets, liabilities, revenues and expenses of joint operations and its share of any jointly held or incurred assets, liabilities, revenues and expenses. These are incorporated in the financial statements under the appropriate headings.
(iii) Equity Method
Under the equity method of accounting, the investments are initially recognized at cost and adjusted thereafter to recognize the group’s share of the post-acquisition profits or losses of the investee in profit and loss and the group’s share of other comprehensive income of the investee in other comprehensive income. Dividends received or receivable from joint ventures are recognized as a reduction in the carrying amount of the investment.
When the group’s share of losses in an equity-accounted investment equals or exceeds its interest in the entity, including any other unsecured long-term receivables, the group does not recognize further losses, unless it has incurred obligations or made payments on behalf of the other entity.
Unrealized gains on transactions between the group and its joint ventures are eliminated to the extent of the group’s interest in these entities. Unrealized losses are also eliminated unless the transaction provides evidence of an impairment of the asset transferred.
The carrying amount of equity accounted investments are tested for impairment in accordance with the policy described in note 2(i) below.
(iv) Changes in ownership interests The group treats transactions with non-controlling interests that do not result in a loss of control as transactions with equity owners of the group.
A change in ownership interest results in an adjustment between the carrying amounts of the controlling and non-controlling interests to reflect their relative interests in the subsidiary. Any difference between the amount of the adjustment to non-controlling interests and any consideration paid or received is recognized within equity.
When the group ceases to consolidate or equity account for an investment because of a loss of control, joint control or significant influence,
any retained interest in the entity is remeasured to its fair value with the change in carrying amount recognized in profit or loss. This fair value becomes the initial carrying amount for the purposes of subsequently accounting for the retained interest as an associate, joint venture or financial asset. In addition, any amounts previously recognized in other comprehensive income in respect of that entity are accounted for as if the group had directly disposed of the related assets or liabilities. This may mean that amounts previously recognized in other comprehensive income are reclassified to profit or loss.
If the ownership interest in a joint venture or an associate is reduced but joint control or significant influence is retained, only a proportionate
share of the amounts previously recognized in other comprehensive income are reclassified to profit or loss where appropriate.
(v) The difference between the cost of investment in the subsidiaries and jointly controlled entities, over the net assets at the time of acquisition of investment is recognised in the financial statements as Goodwill or Capital Reserve on consolidation as the case may be.
(vi) The list of subsidiaries and joint ventures considered in the Consolidated Financial Statements is given in Note 48.
Financial Statements - Consolidated
Notes to the consolidated financial statements for the year ended March 31, 2019

164 Varroc Engineering Limited
(c) Foreign currency translation
The Group’s Consolidated Financial Statements are presented in INR, which is also the parent company’s functional currency. For each entity, the Group determines the functional currency and items included in the financial statements of each entity are measured using that functional currency.
Transactions and balances Transactions in foreign currencies are initially recorded by the Group’s entities at their respective functional currency spot rates at the date the
transaction first qualifies for recognition.
Monetary assets and liabilities denominated in foreign currencies are translated at the functional currency spot rates of exchange at the reporting date.
Exchange differences arising on settlement or translation of monetary items are recognized in profit or loss with the exception of the following:
- Exchange differences arising on monetary items that forms part of a reporting entity’s net investment in a foreign operation are recognized in profit or loss in the separate financial statements of the reporting entity or the individual financial statements of the foreign operation, as appropriate. In the financial statements that include the foreign operation and the reporting entity (e.g., Consolidated Financial Statements when the foreign operation is a subsidiary), such exchange differences are recognized initially in OCI. These exchange differences are reclassified from equity to profit or loss on disposal of the net investment.
- Exchange differences arising on monetary items that are designated as part of the hedge of the Group’s net investment of a foreign operation. These are recognized in OCI until the net investment is disposed of, at which time, the cumulative amount is reclassified to profit or loss.
- Tax charges and credits attributable to exchange differences on those monetary items are also recorded in OCI.
Non-monetary items that are measured in terms of historical cost in a foreign currency are translated using the exchange rates at the dates of the initial transactions. Non-monetary items measured at fair value in a foreign currency are translated using the exchange rates at the date when the fair value is determined. The gain or loss arising on translation of non-monetary items measured at fair value is treated in line with the recognition of the gain or loss on the change in fair value of the item (i.e., translation differences on items whose fair value gain or loss is recognized in OCI or profit or loss are also recognized in OCI or profit or loss, respectively).
Group companies
On consolidation, the assets and liabilities of foreign operations are translated into INR at the rate of exchange prevailing at the reporting date and their statements of profit or loss are translated at exchange rates prevailing at the dates of the transactions. For practical reasons, the group uses an average rate to translate income and expense items, if the average rate approximates the exchange rates at the dates of the transactions. The exchange differences arising on translation for consolidation are recognized in OCI. On disposal of a foreign operation, the component of OCI relating to that particular foreign operation is recognized in profit or loss.
Any goodwill arising in the acquisition/ business combination of a foreign operation on or after 1 April 2015 and any fair value adjustments to the carrying amounts of assets and liabilities arising on the acquisition are treated as assets and liabilities of the foreign operation and translated at the spot rate of exchange at the reporting date.
Any goodwill or fair value adjustments arising in business combinations/ acquisitions, which occurred before the date of transition to Ind AS (1 April 2015), are treated as assets and liabilities of the entity rather than as assets and liabilities of the foreign operation. Therefore, those assets and liabilities are non-monetary items already expressed in the functional currency of the parent and no further translation differences occur.
Gain or loss on a subsequent disposal of any foreign operation excludes translation differences that arose before the date of transition but includes only translation differences arising after the transition date.
Foreign exchange differences regarded as an adjustment to borrowing costs are presented in the statement of profit and loss, within finance costs. All other foreign exchange gains and losses are presented in the statement of profit and loss on a net basis within other gains/(losses).
(d) Revenue Recognition
Revenue from contracts with customers
Revenue from contracts with customers is recognised when control of the goods or services are transferred to the customer at an amount that reflects the consideration to which the Group expects to be entitled in exchange for those goods or services. The Group has generally concluded that it is the principal in its revenue arrangements because it typically controls the goods or services before transferring them to the customer. Amounts disclosed as revenue are net of goods and service tax (GST).
The disclosures of significant accounting judgements, estimates and assumptions relating to revenue from contracts with customers are provided in Note 2A.
Sale of goods
Revenue from sale of goods is recognised at the point in time when control of the goods is transferred to the customer, generally on delivery of the goods. The normal credit term is 30 to 90 days upon delivery.
Financial Statements - Consolidated
Notes to the consolidated financial statements for the year ended March 31, 2019
Annual Report 2018-19 165
Product development/Engineering services primarily pertainaing to global automotive lighting business are considered as relating to sale of parts rather than a separate performance obligation. As a result, revenue from product development/engineering services is recognised over the period of production from the start of production date and is included in the revenue from sale of finished goods.
The Group considers whether there are other promises in the contract that are separate performance obligations to which a portion of the transaction price needs to be allocated (e.g.,warranties). In determining the transaction price for the sale of goods, the Group considers the effects of variable consideration, the existence of significant financing components, noncash consideration, and consideration payable to the customer (if any).
Variable consideration If the consideration in a contract includes a variable amount (like volume rebates/incentives, cash discounts etc.), the Group estimates the amount of
consideration to which it will be entitled in exchange for transferring the goods to the customer. The variable consideration is estimated at contract inception and constrained until it is highly probable that a significant revenue reversal in the amount of cumulative revenue recognised will not occur when the associated uncertainty with the variable consideration is subsequently resolved. The estimate of variable consideration for expected future volume rebates/incentives, cash discounts etc. are made on the most likely amount method. Revenue is disclosed net of such amounts.
Significant financing component Generally, the Group receives short-term advances from its customers. Using the practical expedient in Ind AS 115, the Company does not adjust
the promised amount of consideration for the effects of a significant financing component if it expects, at contract inception, that the period between the transfer of the promised good or service to the customer and when the customer pays for that good or service will be one year or less.
Warranty obligations
The Company typically provides warranties for general repairs of defects as per terms of the contract with customers, These assurance-type warranties are accounted for under Ind AS 37 Provisions, Contingent Liabilities and Contingent Assets. Refer to the accounting policy on warranty provisions in section (t) Provisions
Customer prepayments are amortised in Revenue over the life of the respective project
Sale of services
Income from services is recognised on the basis of time/work completed as per contract with the customers. The Group collects taxes on services (where applicable) on behalf of the government and, therefore, they are not economic benefits flowing to the Group. Hence, they are excluded from revenue.
Tooling Revenue
Development of toolings for customers is considered as a separate performance obligation. Revenue from toolings primarily pertainaing to global automotive lighting business is recognised over time based on the progress towards complete satisfaction of that performance obligation. Such progress is measured based on the proportion that the aggregate costs incurred for work done till the balance sheet date bear to the estimated total costs.
Determination of toolings revenues to be recognised over time necessarily involves making estimates by the Management (some of which are a technical nature) of the costs of completion, the expected revenues from each contract and the foreseeable losses to completion.
Foreseeable losses, if any, on the contracts are recognised as an expense in the period in which they are foreseen, irrespective of the stage of completion of the contract.
Contract balances Trade receivables A receivable represents the Group’s right to an amount of consideration that is unconditional (i.e., only the passage of time is required before payment
of the consideration is due). Refer to accounting policy (l) Financial instruments – Financial assets at amortised cost.
Contract assets A contract asset is the right to consideration in exchange for goods or services transferred to the customer. If the Group performs by transferring
goods or services to a customer before the customer pays consideration or before payment is due, a contract asset is recognised for the earned consideration that is conditional.
Contract liabilities A contract liability is the obligation to transfer goods to a customer for which the Group has received consideration (or an amount of consideration
is due) from the customer. If a customer pays consideration before the Group transfers goods or services to the customer, a contract liability is recognised when the payment is made. Contract liabilities are recognised as revenue when the Group performs under the contract.
Refund liabilities A refund liability is the obligation to refund some or all the consideration received (or receivable) from the customer and is measured at the amount the
Group ultimately expects it will have to return to the customer. The Group updates its estimates of refund liabilities (and the corresponding change in the transaction price) at the end of each reporting period.
Financial Statements - Consolidated
Notes to the consolidated financial statements for the year ended March 31, 2019

166 Varroc Engineering Limited
Wind/solar power generation Income from the wind / solar power generation is recognised when earned on the basis of contractual arrangements with the buyers.
Export Incentives Income from duty drawback and export incentives is recognised on an accrual basis.
(e) Government Grants Grants from the government are recognised at their fair value where there is a reasonable assurance that the grant will be received and the group will
comply with all attached conditions.
Government grants relating to income are deferred and recognised in the profit or loss over the period necessary to match them with the costs that they are intended to compensate and presented within other income.
Government grants relating to purchase of property plant and equipment are included in current and non current liabilities as deferred income and are credited to profit or loss on straight-line basis over the expected lives of the related assets and presented within other income.
(f) Income tax Current income-tax
Current income tax assets and liabilities are measured at the amount expected to be recovered from or paid to the taxation authorities. The tax rates and tax laws used to compute the amount are those that are enacted or substantively enacted, at the reporting date in the countries where the Group operates and generates taxable income.
Current income tax relating to items recognized outside profit or loss is recognized outside profit or loss (either in other comprehensive income or in equity). Current tax items are recognized in correlation to the underlying transaction either in OCI or directly in equity. Management periodically evaluates positions taken in the tax returns with respect to situations in which applicable tax regulations are subject to interpretation and establishes provisions where appropriate.
Deferred tax
Deferred tax is provided using the liability method on temporary differences between the tax bases of assets and liabilities and their carrying amounts for financial reporting purposes at the reporting date.
Deferred tax liabilities are recognized for all taxable temporary differences, except:
- When the deferred tax liability arises from the initial recognition of goodwill or an asset or liability in a transaction that is not a business combination and, at the time of the transaction, affects neither the accounting profit nor taxable profit or loss
- In respect of taxable temporary differences associated with investments in subsidiaries, associates and interests in joint ventures, when the timing of the reversal of the temporary differences can be controlled and it is probable that the temporary differences will not reverse in the foreseeable future
Deferred tax assets are recognized for all deductible temporary differences, the carry forward of unused tax credits and any unused tax losses. Deferred tax assets are recognized to the extent that it is probable that taxable profit will be available against which the deductible temporary differences, and the carry forward of unused tax credits and unused tax losses can be utilized, except:
- When the deferred tax asset relating to the deductible temporary difference arises from the initial recognition of an asset or liability in a transaction that is not a business combination and, at the time of the transaction, affects neither the accounting profit nor taxable profit or loss
- In respect of deductible temporary differences associated with investments in subsidiaries, associates and interests in joint ventures, deferred tax assets are recognized only to the extent that it is probable that the temporary differences will reverse in the foreseeable future and taxable profit will be available against which the temporary differences can be utilised
Minimum alternate tax (MAT) paid in a year is charged to the statement of profit and loss as current tax for the year. The deferred tax asset is recognised for MAT credit available only to the extent that it is probable that the concerned company will pay normal income tax during the specified period, i.e., the period for which MAT credit is allowed to be carried forward. In the year in which the company recognizes MAT credit as an asset, it is created by way of credit to the statement of profit and loss and shown as part of deferred tax asset. The company reviews the “MAT credit entitlement” asset at each reporting date and writes down the asset to the extent that it is no longer probable that it will pay normal tax during the specified period.
The carrying amount of deferred tax assets is reviewed at each reporting date and reduced to the extent that it is no longer probable that sufficient taxable profit will be available to allow all or part of the deferred tax asset to be utilised. Unrecognized deferred tax assets are re-assessed at each reporting date and are recognized to the extent that it has become probable that future taxable profits will allow the deferred tax asset to be recovered.
Deferred tax assets and liabilities are measured at the tax rates that are expected to apply in the year when the asset is realised or the liability is settled, based on tax rates (and tax laws) that have been enacted or substantively enacted at the reporting date.
Financial Statements - Consolidated
Notes to the consolidated financial statements for the year ended March 31, 2019
Annual Report 2018-19 167
Deferred tax relating to items recognized outside profit or loss is recognized outside profit or loss (either in other comprehensive income or in equity). Deferred tax items are recognized in correlation to the underlying transaction either in OCI or directly in equity.
Deferred tax assets and deferred tax liabilities are offset if a legally enforceable right exists to set off current tax assets against current tax liabilities and the deferred taxes relate to the same taxable entity and the same taxation authority.
Tax benefits acquired as part of a business combination, but not satisfying the criteria for separate recognition at that date, are recognized subsequently if new information about facts and circumstances change. Acquired deferred tax benefits recognized within the measurement period reduce goodwill related to that acquisition if they result from new information obtained about facts and circumstances existing at the acquisition date. If the carrying amount of goodwill is zero, any remaining deferred tax benefits are recognized in OCl/ capital reserve depending on the principle explained for bargain purchase gains. All other acquired tax benefits realised are recognized in profit or loss.
Sales/value added taxes paid on acquisition of assets or on incurring expenses-
Expenses and assets are recognised net of the amount of sales/value added taxes paid, except: - When the tax incurred on a purchase of assets or services is not recoverable from the taxation authority, in which case, the tax paid is recognised
as part of the cost of acquisition of the asset or as part of the expense item, as applicable; - When receivables and payables are stated with the amount of tax included The net amount of tax recoverable from, or payable to, the taxation authority is included as part of receivables or payables in the balance sheet.
(g) Leases
The determination of whether an arrangement is (or contains) a lease is based on the substance of the arrangement at the inception of the lease. The arrangement is, or contains, a lease if fulfilment of the arrangement is dependent on the use of a specific asset or assets and the arrangement conveys a right to use the asset or assets, even if that right is not explicitly specified in an arrangement.
As a lessee
Leases where the group, as lessee, has substantially all the risks and rewards of ownership are classified as finance leases. Finance leases are capitalized at the lease’s inception at the fair value of the leased property or, if lower, the present value of the minimum lease payments. The corresponding rental obligations, net of finance charges, are included in borrowings or other financial liabilities as appropriate. Each lease payment is allocated between the liability and finance cost. The finance cost is charged to the profit or loss over the lease period so as to produce a constant periodic rate of interest on the remaining balance of the liability for each period. Contingent rentals are recognized as expenses in the periods in which they are incurred.
Leases in which a significant portion of the risks and rewards of ownership are not transferred to the group as lessee are classified as operating leases. Payments made under operating leases (net of any incentives received from the lessor) are charged to profit or loss on a straight-line basis over the period of the lease unless the payments are structured to increase in line with expected general inflation to compensate for the lessor’s expected inflationary cost increases.
As a lessor
Leases in which the Group does not transfer substantially all the risks and rewards of ownership of an asset are classified as operating leases. Rental income from operating lease is recognized on a straight-line basis over the term of the relevant lease unless the payments are structured to increase in line with expected general inflation to compensate for the lessor’s expected inflationary cost increases. Initial direct costs incurred in negotiating and arranging an operating lease are added to the carrying amount of the leased asset and recognized over the lease term on the same basis as rental income. Contingent rents are recognized as revenue in the period in which they are earned.
Leases are classified as finance leases when substantially all of the risks and rewards of ownership transfer from the Group to the lessee. Amounts due from lessees under finance leases are recorded as receivables at the Group's net investment in the leases. Finance lease income is allocated to accounting periods so as to reflect a constant periodic rate of return on the net investment outstanding in respect of the lease.
(h) Business combinations Business combinations are accounted for using the acquisition method. The cost of an acquisition is measured as the aggregate of the consideration
transferred measured at acquisition date fair value and the amount of any non-controlling interests in the acquiree. For each business combination, the Group elects whether to measure the non-controlling interests in the acquiree at fair value or at the proportionate share of the acquiree's identifiable net assets. Acquisition-related costs are expensed as incurred.
At the acquisition date, the identifiable assets acquired and the liabilities assumed are recognized at their acquisition date fair values. For this purpose, the liabilities assumed include contingent liabilities representing present obligation and they are measured at their acquisition fair values irrespective of the fact that outflow of resources embodying economic benefits is not probable.
When the Group acquires a business, it assesses the financial assets and liabilities assumed for appropriate classification and designation in accordance with the contractual terms, economic circumstances and pertinent conditions as at the acquisition date. This includes the separation of embedded derivatives in host contracts by the acquiree.
Financial Statements - Consolidated
Notes to the consolidated financial statements for the year ended March 31, 2019

168 Varroc Engineering Limited
If the business combination is achieved in stages, any previously held equity interest is re-measured at its acquisition date fair value and any resulting gain or loss is recognized in profit or loss or OCI, as appropriate.
Any contingent consideration to be transferred by the acquirer is recognized at fair value at the acquisition date. Contingent consideration classified as an asset or liability that is a financial instrument and within the scope of Ind AS 109 Financial Instruments, is measured at fair value with changes in fair value recognized in profit or loss. If the contingent consideration is not within the scope of Ind AS 109, it is measured in accordance with the appropriate Ind AS. Contingent consideration that is classified as equity is not re-measured at subsequent reporting dates and subsequent its settlement is accounted for within equity.
Goodwill is initially measured at cost, being the excess of the aggregate of the consideration transferred and the amount recognized for non-controlling interests, and any previous interest held, over the net identifiable assets acquired and liabilities assumed. If the fair value of the net assets acquired is in excess of the aggregate consideration transferred, the Group re-assesses whether it has correctly identified all of the assets acquired and all of the liabilities assumed and reviews the procedures used to measure the amounts to be recognized at the acquisition date. If the reassessment still results in an excess of the fair value of net assets acquired over the aggregate consideration transferred, then the gain is recognized in OCI and accumulated in equity as capital reserve. However, if there is no clear evidence of bargain purchase, the entity recognizes the gain directly in equity as capital reserve, without routing the same through OCI.
After initial recognition, goodwill is measured at cost less any accumulated impairment losses. For the purpose of impairment testing, goodwill acquired in a business combination is, from the acquisition date, allocated to each of the Group's cash-generating units that are expected to benefit from the combination, irrespective of whether other assets or liabilities of the acquiree are assigned to those units.
If the initial accounting for a business combination is incomplete by the end of the reporting period in which the combination occurs, the Group reports provisional amounts for the items for which the accounting is incomplete. Those provisional amounts are adjusted through goodwill during the measurement period, or additional assets or liabilities are recognized, to reflect new information obtained about facts and circumstances that existed at the acquisition date that, if known, would have affected the amounts recognized at that date. These adjustments are called as measurement period adjustments. The measurement period does not exceed one year from the acquisition date.
(i) Impairment of non-financial assets
The Group assesses, at each reporting date, whether there is an indication that an asset may be impaired. If any indication exists, or when annual impairment testing for an asset is required, the Group estimates the asset's recoverable amount. An asset's recoverable amount is the higher of an asset's or cash-generating unit's (CGU) fair value less costs of disposal and its value in use. Recoverable amount is determined for an individual asset, unless the asset does not generate cash inflows that are largely independent of those from other assets or groups of assets. When the carrying amount of an asset or CGU exceeds its recoverable amount, the asset is considered impaired and is written down to its recoverable amount.
In assessing value in use, the estimated future cash flows are discounted to their present value using a pre-tax discount rate that reflects current market assessments of the time value of money and the risks specific to the asset. In determining fair value less costs of disposal, recent market transactions are taken into account. If no such transactions can be identified, an appropriate valuation model is used. These calculations are corroborated by valuation multiples, quoted share prices for publicly traded companies or other available fair value indicators.
The Group bases its impairment calculation on detailed budgets and forecast calculations, which are prepared separately for each of the Group's CGUs to which the individual assets are allocated. These budgets and forecast calculations generally cover a period of five years. For longer periods, a long-term growth rate is calculated and applied to project future cash flows after the fifth year. To estimate cash flow projections beyond periods covered by the most recent budgets/forecasts, the Group extrapolates cash flow projections in the budget using a steady or declining growth rate for subsequent years, unless an increasing rate can be justified. In any case, this growth rate does not exceed the long-term average growth rate for the products, industries, or country or countries in which the entity operates, or for the market in which the asset is used.
Impairment losses of continuing operations, including impairment on inventories, are recognized in the statement of profit or loss.
Goodwill is tested for impairment annually as at the year-end and when circumstances indicate that the carrying value may be impaired.
Impairment is determined for goodwill by assessing the recoverable amount of each CGU (or group of CGUs) to which the goodwill relates. When the recoverable amount of the CGU is less than its carrying amount, an impairment loss is recognized. Impairment losses relating to goodwill cannot be reversed in future periods.
Intangible assets with indefinite useful lives are tested for impairment annually as at the year-end at the CGU level, as appropriate, and when circumstances indicate that the carrying value may be impaired.
(j) Cash and cash equivalents
Cash and cash equivalent in the balance sheet comprise cash at banks and on hand and short-term deposits with an original maturity of three months or less, which are subject to an insignificant risk of changes in value.
For the purpose of the consolidated statement of cash flows, cash and cash equivalents consist of cash and short-term deposits, as defined above, net of outstanding bank overdrafts as they are considered an integral part of the Group's cash management. Bank overdraft are shown within borrowings in current liabilities in the Balance sheet.
Financial Statements - Consolidated
Notes to the consolidated financial statements for the year ended March 31, 2019

Annual Report 2018-19 169
(k) Inventories
Inventories are valued at the lower of cost and net realisable value.
Costs incurred in bringing each product to its present location and condition are accounted for as follows:
- Raw materials, Stores and spare-parts, Loose tools and Packing materials: cost includes cost of purchase and other costs incurred in bringing the inventories to their present location and condition. Cost is determined on weighted average basis.
- Finished goods and work in progress: cost includes cost of direct materials and labour and a proportion of manufacturing overheads based on the normal operating capacity, but excluding borrowing costs. Cost is determined on weighted average basis.
Initial cost of inventories includes the transfer of gains and losses on qualifying cash flow hedges, recognized in OCI, in respect of the purchases of raw materials.
Net realisable value is the estimated selling price in the ordinary course of business, less estimated costs of completion and the estimated costs necessary to make the sale.
Duties and other taxes (other than those subsequently recoverable by the entity from the taxing authorities) are included in the value of inventory.
(l) Financial instruments
Financial Assets
Initial Recognition and measurement All financial assets are recognized initially at fair value plus, in the case of financial assets not recorded at fair value through profit and loss, transactions
costs that are attributable to the acquisition of the financial asset. Transaction costs of financial assets carried at fair value through profit or loss are expensed in profit or loss.
Subsequent measurement For purposes of subsequent measurement, financial assets are classified in four categories:
- Debt instruments at amortized cost
- Debt instruments at fair value through other comprehensive income (FVTOCI)
- Debt instruments, derivatives and equity instruments at fair value through profit or loss (FVTPL)
- Equity instruments measured at fair value through other comprehensive income (FVTOCI)
- Debt instruments at amortized cost A 'debt instrument' is measured at the amortized cost if both the following conditions are met:
(a) The asset is held within a business model whose objective is to hold assets for collecting contractual cash flows, and
(b) Contractual terms of the asset give rise on specified dates to cash flows that are solely payments of principal and interest (SPPI) on the principal amount outstanding.
This category is the most relevant to the Group. After initial measurement, such financial assets are subsequently measured at amortized cost using
the effective interest rate (EIR) method. Amortized cost is calculated by taking into account any discount or premium on acquisition and fees or costs that are an integral part of EIR. The EIR amortization is included in finance costs/income in the Statement of Profit or Loss. The losses arising from impairment are recognized in the profit or loss. This category generally applies to trade and other receivables.
- Debt instrument at FVTOCI A 'debt instrument' is classified as at FVTOCI if both of the following criteria are met:
(a) The objective of the business model is achieved both by collecting contractual cash flows and selling the financial assets, and
(b) The asset's contractual cash flows represent SPPI. Debt instruments included within the FVTOCI category are measured initially as well as at each reporting date at fair value. Fair value movements
are recognized in the other comprehensive income (OCI). However, the Group recognizes interest income, impairment losses and reversals and foreign exchange gain or loss in the P&L. On de-recognition of the asset, cumulative gain or loss previously recognized in OCI is reclassified from the equity to P&L. Interest earned whilst holding FVTOCI debt instrument is reported as interest income under EIR method.
Financial Statements - Consolidated
Notes to the consolidated financial statements for the year ended March 31, 2019

170 Varroc Engineering Limited
- Debt instrument at FVTPL FVTPL is a residual category for debt instruments. Any debt instrument, which does not meet the criteria for categorization as at amortized cost or as
FVTOCI is classified as FVTPL. In addition, the Group may elect to designate a debt instrument, which otherwise meets amortized cost or FVTOCI criteria, as at FVTPL. However,
such election is allowed only if doing so reduces or eliminates a measurement or recognition inconsistency (referred to as 'accounting mismatch'). The Group has not designated any debt instruments as at FVTPL.
Debt instruments included within the FVTPL category are measured at fair value with all changes recognized in P&L.
- Equity investments All equity investments in scope of Ind-AS 109 are measured at fair value. Equity instruments which are held for trading and contingent consideration
recognized by an acquirer in a business combination to which Ind-AS 103 applies are classified as at FVTPL. For all other equity instruments, the Group may make an irrevocable election to present in other comprehensive income subsequent changes in the fair value. The Group makes such an election on an instrument-by-instrument basis. This classification is made on initial recognition and is irrevocable.
If the Group decides to classify an equity instrument at FVTOCI, then all fair value changes on the instrument, excluding dividends, are recognized in the OCI. There is no recycling of the amounts from OCI to P&L, even on the sale of the investment. However, the Group may transfer the cumulative gain or loss within equity.
Equity instruments included within the FVTPL category are measured at fair value with all changes recognized in P&L.
Derecognition A financial asset (or, where applicable, a part of a financial asset or part of a group of similar financial assets) is primarily derecognized (i.e. removed
from the Group's balance sheet) when: - The rights to receive cash flows from the asset have expired, or
- The Group has transferred its rights to receive cash flows from the asset or has assumed an obligation to pay the received cash flows in full without material
delay to a third party under a "pass-through" arrangement; and either (a) the Group has transferred substantially all the risks and rewards of the asset, or (b) the Group has neither transferred nor retained substantially all the risks and rewards of the asset, but has transferred control of the asset.
When the Group has transferred its rights to receive cash flows from an asset or has entered into a pass-through arrangement, it evaluates if and to what extent it has retained the risks and rewards of ownership. When it has neither transferred nor retained substantially all of the risks and rewards of the asset, nor transferred control of the asset, the Group continues to recognize the transferred asset to the extent of the Group's continuing involvement. In that case, the Group also recognizes an associated liability. The transferred asset and the associated liability are measured on a basis that reflects the rights and obligations that the Group has retained.
Continuing involvement that takes the form of a guarantee over the transferred asset is measured at the lower of the original carrying amount of the asset and the maximum amount of consideration that the Group could be required to repay.
Impairment of financial assets In accordance with Ind-AS 109, the Group applies expected credit loss (ECL) model for measurement and recognition of impairment loss on the
following financial assets and credit risk exposure:-
(a) Financial assets that are debt instruments, and are measured at amortized cost e.g. loans, debt securities, deposits, trade receivables and bank balance
(b) Financial assets that are debt instruments and are measured at FVTOCI
(c) Lease receivables under Ind-AS 17
(d) Trade receivables or any contractual right to receive cash or another financial asset that result from transactions that are within the scope of Ind AS 115
(e) Loan commitments which are not measured as at FVTPL
(f) Financial guarantee contracts which are not measured as at FVTPL
The Group follows 'simplified approach' for recognition of impairment loss allowance on:
- Trade receivables or contract assets ; and - All lease receivables resulting from transactions within the scope of Ind AS 17
The application of simplified approach does not require the Group to track changes in credit risk. Rather, it recognizes impairment loss allowance
based on lifetime ECLs at each reporting date, right from its initial recognition.
Financial Statements - Consolidated
Notes to the consolidated financial statements for the year ended March 31, 2019

Annual Report 2018-19 171
For recognition of impairment loss on other financial assets and risk exposure, the Group determines that whether there has been a significant increase in the credit risk since initial recognition. If credit risk has not increased significantly, 12-month ECL is used to provide for impairment loss. However, if credit risk has increased significantly, lifetime ECL is used. If, in a subsequent period, credit quality of the instrument improves such that there is no longer a significant increase in credit risk since initial recognition, then the entity reverts to recognizing impairment loss allowance based on 12-month ECL.
Lifetime ECL are the expected credit losses resulting from all possible default events over the expected life of a financial instrument. The 12-month ECL
is a portion of the lifetime ECL which results from default events on a financial instrument that are possible within 12 months after the reporting date.
ECL is the difference between all contractual cash flows that are due to the Group in accordance with the contract and all the cash flows that the entity expects to receive (i.e. all cash shortfalls), discounted at the original EIR. When estimating the cash flows, an entity is required to consider:
- All contractual terms of the financial instrument (including prepayment, extension, call and similar options) over the expected life of the financial instrument. However, in rare cases when the expected life of the financial instrument cannot be estimated reliably, then the entity is required to use the remaining contractual term of the financial instrument.
- Cash flows from the sale of the collateral held or other credit enhancements that are integral to the contractual terms.
As a practical expedient, the Group uses a provision matrix to determine impairment loss allowance on portfolio of its trade receivables. The provision
matrix is based on its historically observed default rates over the expected life of the trade receivables and is adjusted for forward-looking estimates. At every reporting date, the historical observed default rates are updated and changes in the forward-looking estimates are analyzed.
ECL impairment loss allowance (or reversal) recognized during the period is recognized as income/expense in the statement of profit and loss (P&L). This amount is reflected under the head 'other expenses' in the P&L. The balance sheet presentation for various financial instruments is described below:
- Financial assets measured at amortized cost, contract assets and lease receivables: ECL is presented as an allowance, i.e. as an integral part of the measurement of those assets in the balance sheet. The allowance reduces the net carrying amount. Until the asset meets write-off criteria, the Group does not reduce impairment allowance from the gross carrying amount.
- Loan commitments and financial guarantee contracts: ECL is presented as a provision in the balance sheet i.e. as a liability.
- Debt instruments measured at FVTOCI: Since financial assets are already reflected at fair value, impairment allowance is not further reduced from its value. Rather, ECL amount is presented as 'accumulated impairment amount' in the OCI.
For assessing increase in credit risk and impairment loss, the Group combines financial instruments on the basis of shared credit risk characteristics
with the objective of facilitating an analysis that is designed to enable significant increases in credit risk to be identified on a timely basis.
The Group does not have any purchased or originated credit-impaired (POCI) financial assets, i.e., financial assets which are credit impaired on purchase/origination.
Financial liabilities
Initial recognition and measurement
Financial liabilities are classified, at initial recognition, as financial liabilities at fair value through profit or loss, loans and borrowings, payables, or as derivatives designated as hedging instruments in an effective hedge, as appropriate.
All financial liabilities are recognized initially at fair value and, in the case of loans and borrowings and payables, net of directly attributable transaction costs.
The Group's financial liabilities include trade and other payables, loans and borrowings including bank overdrafts, financial guarantee contracts and derivative financial instruments.
Subsequent measurement The measurement of financial liabilities depends on their classification, as described below:
- Financial liabilities at fair value through profit or loss Financial liabilities at fair value through profit or loss include financial liabilities held for trading and financial liabilities designated upon initial recognition
as at fair value through profit or loss. Financial liabilities are classified as held for trading if they are incurred for the purpose of repurchasing in the near term. This category also includes derivative financial instruments entered into by the Group that are not designated as hedging instruments in hedge relationships as defined by Ind-AS 109. Separated embedded derivatives are also classified as held for trading unless they are designated as effective hedging instruments. Gains or losses on liabilities held for trading are recognized in the profit or loss.
Financial liabilities designated upon initial recognition at fair value through profit or loss are designated at the initial date of recognition, and only if the criteria in Ind-AS 109 are satisfied. For liabilities designated as FVTPL, fair value gains/losses attributable to changes in own credit risk are recognized in OCI. These gains/losses are not subsequently transferred to P&L. However, the Group may transfer the cumulative gain or loss within equity. All other changes in fair value of such liability are recognized in the statement of profit or loss. The Group has not designated any financial liability as at fair value through profit and loss.
Financial Statements - Consolidated
Notes to the consolidated financial statements for the year ended March 31, 2019

172 Varroc Engineering Limited
- Loans and borrowings
This is the category most relevant to the Group. After initial recognition, interest-bearing loans and borrowings are subsequently measured at amortized cost using the EIR method. Gains and losses are recognized in profit or loss when the liabilities are derecognized as well as through the EIR amortization process.
Amortized cost is calculated by taking into account any discount or premium on acquisition and fees or costs that are an integral part of the EIR. The EIR amortization is included as finance costs in the statement of profit or loss. This category generally applies to interest bearing loans and borrowings.
- Financial guarantee contracts Financial guarantee contracts issued by the Group are those contracts that require a payment to be made to reimburse the holder for a loss it
incurs because the specified debtor fails to make a payment when due in accordance with the terms of the debt instrument. Financial guarantee contracts are recognized initially as a liability at fair value, adjusted for transaction costs that are directly attributable to the issuance of the guarantee. Subsequently, the liability is measured at the higher of the amount of loss allowance determined as per the impairment requirements of Ind-AS 109 and the amount recognized less cumulative amortization.
Derecognition A financial liability is derecognized when the obligation under the liability is discharged or cancelled or expires when an existing financial liability
is replaced by another from the same lender on substantially different terms, or the terms of an existing liability are substantially modified, such an exchange or modification is treated as the derecognition of the original liability and the recognition of a new liability. The difference in the respective carrying amounts is recognized in the statement of profit or loss.
Embedded Derivatives If the hybrid contract contains a host that is a financial asset within the scope of Ind-AS 109, the Group does not separate embedded derivatives.
Rather, it applies the classification requirements contained in Ind-AS 109 to the entire hybrid contract.
Derivatives embedded in all other host contracts are accounted for as separate derivatives and recorded at fair value if their economic characteristics and risks are not closely related to those of the hose contracts and the host contracts are not held for trading or designated at fair value through profit or loss. These embedded derivatives are measured at fair value with changes in fair value recognized in profit or loss, unless designated as effective hedging instruments. Reassessment only occurs if there is either a change in the terms of the contract that significantly modifies the cash flows that would otherwise be required or a reclassification of a financial asset out of the fair value through profit or loss.
Embedded derivatives closely related to the host contracts are not separated.
Embedded foreign currency derivatives Embedded foreign currency derivatives are not separated from the host contract if they are closely related. Such embedded derivatives are closely related to
the host contract, if the host contract is not leveraged, does not contain any option feature and requires payments in one of the following currencies:
- the functional currency of any substantial party to that contract,
- the currency in which the price of the related good or service that is acquired or delivered is routinely denominated in commercial transactions around the world,
- a currency that is commonly used in contracts to purchase or sell non-financial items in the economic environment in which the transaction takes
place (i.e. relatively liquid and stable currency) Foreign currency embedded derivatives which do not meet the above criteria are separated and the derivative is accounted for at fair value through
profit and loss. The group currently does not have any such derivatives which are not closely related.
Reclassification of financial assets and liabilities The Group determines classification of financial assets and liabilities on initial recognition. After initial recognition, no reclassification is made for
financial assets which are equity instruments and financial liabilities.
For financial assets which are debt instruments, a reclassification is made only if there is a change in the business model for managing those assets. Changes to the business model are expected to be infrequent.
The Group's Senior Management determines changes in the business model as result of external or internal changes which are significant to the Group's operations. Such changes are evident to external parties. A change in the business model occurs when the Group either begins or ceases to perform an activity that is significant to the operations.
If the Group reclassifies financial assets, it applies the reclassification prospectively from the reclassification date which is the first day of the
immediately next reporting period following the change in business model. The Group does not restate any previously recognized gains, losses (including impairment gains or losses) or interest.
Financial Statements - Consolidated
Notes to the consolidated financial statements for the year ended March 31, 2019

Annual Report 2018-19 173
The following table shows various reclassifications and how they are accounted for:
Original Classification
Revised Classification
Accounting Treatment
Amortized cost FVTPL Fair value is measured at reclassification date. Difference between previous amortized cost and fair value is recognized in P&L.
FVTPL Amortized cost Fair value at reclassification date becomes its new gross carrying amount. EIR is calculated based on the new gross carrying amount.
Amortized cost FVTOCI Fair value is measured at reclassification date. Difference between previous amortized cost and fair value is recognized in OCI. No change in EIR due to reclassification.
FVTOCI Amortized cost Fair value at reclassification date becomes its new amortized cost carrying amount. However, cumulative gain or loss in OCI is adjusted against fair value. Consequently, the asset is measured as if it had always been measured at amortized cost.
FVTPL FVTOCI Fair value at reclassification date becomes its new carrying amount. No other adjustment is required.
FVTOCI FVTPL Assets continue to be measured at fair value. Cumulative gain or loss previously recognized in OCI is reclassified to P&L at the reclassification date.
(m) Offsetting of financial instruments Financial assets and financial liabilities are offset and the net amount is reported in the balance sheet where there is a currently enforceable legal right
to offset the recognized amounts and there is an intention to settle on a net basis, to realize the asset and settle the liability simultaneously.
(n) Fair value measurement The Group measures financial instruments, such as, derivatives at fair value at each balance sheet date.
Fair value is the price that would be received to sell an asset or paid to transfer a liability in an orderly transaction between market participants at the
measurement date. The fair value measurement is based on the presumption that the transaction to sell the asset or transfer the liability takes place either:
- In the principal market for the asset or liability, or - In the absence of a principal market, in the most advantageous market for the asset or liability
The principal or the most advantageous market must be accessible by the Group. The fair value of an asset or a liability is measured using the assumptions that
market participants would use when pricing the asset or liability, assuming that market participants act in their economic best interest.
A fair value measurement of a non-financial asset takes into account a market participant’s ability to generate economic benefits by using the asset in its highest and best use or by selling it to another market participant that would use the asset in its highest and best use.
The Group uses valuation techniques that are appropriate in the circumstances and for which sufficient data are available to measure fair value, maximizing the use of relevant observable inputs and minimizing the use of unobservable inputs. All assets and liabilities for which fair value is measured or disclosed in the financial statements are categorized within the fair value hierarchy, described as follows, based on the lowest level input that is significant to the fair value measurement as a whole:
Level 1 — Quoted (unadjusted) market prices in active markets for identical assets or liabilities
Level 2 — Valuation techniques for which the lowest level input that is significant to the fair value measurement is directly or indirectly observable
Level 3 — Valuation techniques for which the lowest level input that is significant to the fair value measurement is unobservable
For assets and liabilities that are recognized in the financial statements on a recurring basis, the Group determines whether transfers have occurred between levels in the hierarchy by re-assessing categorisation (based on the lowest level input that is significant to the fair value measurement as a whole) at the end of each reporting period.
For the purpose of fair value disclosures, the Group has determined classes of assets and liabilities on the basis of the nature, characteristics and risks of the asset or liability and the level of the fair value hierarchy as explained above.
This note summarizes accounting policy for fair value. Other fair value related disclosures are given in the relevant notes.
- Disclosures for valuation methods, significant estimates and assumptions (note 43)
- Quantitative disclosures of fair value measurement hierarchy (note 43)
- Financial instruments (including those carried at amortized cost) (note 43)
Financial Statements - Consolidated
Notes to the consolidated financial statements for the year ended March 31, 2019
174 Varroc Engineering Limited
(o) Derivative financial instruments and hedge accounting
The Group uses derivative financial instruments, such as forward currency contracts and interest rate swaps, to hedge its foreign currency risks and interest rate risks, respectively. Such derivative financial instruments are initially recognized at fair value on the date on which a derivative contract is entered into and are subsequently re-measured at fair value. Derivatives are carried as financial assets when the fair value is positive and as financial liabilities when the fair value is negative.
Any gains or losses arising from changes in the fair value of derivatives are taken directly to profit or loss, except for the effective portion of cash flow
hedges, which is recognized in OCI and later reclassified to profit or loss when the hedge item affects profit or loss or treated as basis adjustment if a hedged forecast transaction subsequently results in the recognition of a non-financial asset or non-financial liability.
For the purpose of hedge accounting, hedges are classified as:
- Fair value hedges when hedging the exposure to changes in the fair value of a recognized asset or liability or an unrecognized firm commitment
- Cash flow hedges when hedging the exposure to variability in cash flows that is either attributable to a particular risk associated with a recognized asset or liability or a highly probable forecast transaction or the foreign currency risk in an unrecognized firm commitment
- Hedges of a net investment in a foreign operation At the inception of a hedge relationship, the Group formally designates and documents the hedge relationship to which the Group wishes to
apply hedge accounting and the risk management objective and strategy for undertaking the hedge. The documentation includes the group's risk management objective and strategy for undertaking hedge, the hedging/ economic relationship, the hedged item or transaction, the nature of the risk being hedged, hedge ratio and how the entity will assess the effectiveness of changes in the hedging instrument's fair value in offsetting the exposure to changes in the hedged item's fair value or cash flows attributable to the hedged risk. Such hedges are expected to be highly effective in achieving offsetting changes in fair value or cash flows and are assessed on an ongoing basis to determine that they actually have been highly effective throughout the financial reporting periods for which they were designated.
Hedges that meet the strict criteria for hedge accounting are accounted for, as described below:
Cash flow hedges that qualify for hedge accounting The effective portion of the gain or loss on the hedging instrument is recognized in OCI in the cash flow hedge reserve, while any ineffective portion is
recognized immediately in the statement of profit or loss. The Group uses derivative contracts as hedges of its exposure to foreign currency risk in forecast transactions and firm commitments. The ineffective
portion relating to foreign currency contracts is recognized in finance costs
Amounts recognized as OCI are transferred to profit or loss when the hedged transaction affects profit or loss, such as when the hedged financial income or financial expense is recognized or when a forecast sale occurs. When the hedged item is the cost of a non-financial asset or non-financial liability, the amounts recognized as OCI are transferred to the initial carrying amount of the non-financial asset or liability.
If the hedging instrument expires or is sold, terminated or exercised without replacement or rollover (as part of the hedging strategy), or if its designation as a hedge is revoked, or when the hedge no longer meets the criteria for hedge accounting, any cumulative gain or loss previously recognized in OCI remains separately in equity until the forecast transaction occurs or the foreign currency firm commitment is met.
The Group does not use hedges of fair value and net investment.
(p) Property, plant and equipment Freehold land is carried at historical cost except in case of certain freehold land which are at revalued amounts. All other items of property, plant and
equipment are stated at historical cost less depreciation except in case of certain assets which are at revalued amounts.. Historical cost includes expenditure that is directly attributable to the acquisition of the items.
Subsequent costs are included in the asset’s carrying amount or recognised as a separate asset, as appropriate, only when it is probable that future economic benefits associated with the item will flow to the group and the cost of the item can be measured reliably. The carrying amount of any component accounted for as a separate asset is derecognised when replaced. All other repairs and maintenance are charged to profit or loss during the reporting period in which they are incurred.
Depreciation methods, estimated useful lives and residual value
Depreciation is calculated using the straight-line method to allocate their cost, net of their residual values, over their estimated useful lives or, in the case of certain leased furniture, fittings and equipment, the shorter lease term as follows:
Financial Statements - Consolidated
Notes to the consolidated financial statements for the year ended March 31, 2019

Annual Report 2018-19 175
Class of Assets Estimated useful life (Years) (on single shift basis) • Leasehold Land Amortised over the period of lease • Buildings 30- 50 years • Plant and Machinery 8-20 years • Moulds and Dies 4-7 years • Computers 3-7 years • Vehicles 4-7 years • Furniture and Fixtures 5-15 years • Other Assets 4-10 years
The property, plant and equipment acquired under finance leases is depreciated over the asset’s useful life or over the shorter term of the asset’s useful life and lease term if there is no reasonable certainty that the group will obtain ownership at the end of the lease term.
The useful lives have been determined based on technical evaluation done by the Management's expert which are different than those specified by Schedule II to the Companies Act; 2013, in order to reflect the actual usage of the assets. The residual values are not more than 5% of the original cost of the asset.
An asset’s carrying amount is written down immediately to its recoverable amount if the asset’s carrying amount is greater than its estimated recoverable amount.
Gains and losses on disposals are determined by comparing proceeds with carrying amount. These are included in profit or loss within other gains/ (losses).
Capital work in progress is stated at cost, net of accumulated impairment loss, if any.
The present value of the expected cost for the decommissioning of an asset after its use is included in the cost of the respective asset if the recognition criteria for a provision are met.
The residual values, useful lives and methods of depreciation of property, plant and equipment are reviewed at each financial year end and adjusted prospectively, if appropriate
(q) Investment properties Property that is held for long-term rental yields or for capital appreciation or both, and that is not occupied by the group, is classified as investment
property. Investment property is measured initially at its cost, including related transaction costs and where applicable borrowing costs. Subsequent expenditure is capitalised to the asset’s carrying amount only when it is probable that future economic benefits associated with the expenditure will flow to the group and the cost of the item can be measured reliably. All other repairs and maintenance costs are expensed when incurred. When part of an investment property is replaced, the carrying amount of the replaced part is derecognised.
Investment properties are depreciated using the straight-line method over their estimated useful lives. Investment properties generally have a useful life of 30-50 years. The useful life has been determined based on technical evaluation performed by the Management’s expert.
(r) Intangible assets Intangible assets acquired separately are measured on initial recognition at cost. Following initial recognition, intangible assets are carried at cost less
any accumulated amortisation and accumulated impairment losses. Internally generated intangibles, excluding capitalised development costs, are not capitalised and the related expenditure is reflected in profit or loss in the period in which the expenditure is incurred. (i) Goodwill Goodwill on acquisitions of subsidiaries is included in intangible assets. Goodwill is not amortised but it is tested for impairment annually, or
more frequently if events or changes in circumstances indicate that it might be impaired, and is carried at cost less accumulated impairment losses. Gains and losses on the disposal of an entity include the carrying amount of goodwill relating to the entity sold.
Goodwill is allocated to cash-generating units for the purpose of impairment testing. The allocation is made to those cash-generating units or groups of cash-generating units that are expected to benefit from the business combination in which the goodwill arose. The units or groups of units are identified at the lowest level at which goodwill is monitored for internal Management purposes.
(ii) Computer software Costs associated with maintaining software programmes are recognised as an expense as incurred.
Separately acquired software are shown at transaction cost, software acquired in a business combination are recognised at fair value at the acquisition date. They are subsequently carried at cost less accumulated amortisation. Computer software are amortised on a straight line basis over a period of 3 to 5 years"
Financial Statements - Consolidated
Notes to the consolidated financial statements for the year ended March 31, 2019

176 Varroc Engineering Limited
(iii) Research and development Research costs are expensed as incurred. Development expenditures on an individual project are recognised as an intangible asset when the
Group can demonstrate: - The technical feasibility of completing the intangible asset so that the asset will be available for use or sale - Its intention to complete and its ability and intention to use or sell the asset - How the asset will generate future economic benefits - The availability of resources to complete the asset - The ability to measure reliably the expenditure during development Development costs previously recognised as an expense are not recognised as an asset in a subsequent period. During the period of
development, the asset is tested for impairment annually. Capitalised development expenditure is amortised on a straight line basis from the start of production over a period of 3 years or project life
whichever is lower.
(iv) Technical know-how fees Expenditure on acquiring Technical Know-how (including Income Tax and R & D Cess) is capitalised and amortised on a straight line basis over
a period of six years (v) Customer relationships: Customer relationships acquired in a business combination are recognised at fair value at the acquisition date. They have a finite useful life and
are subsequently carried at cost less accumulated amortisation and impairment losses. Customer relationships are amortised on a straight line basis over a period of 10-12 years
(vi) Patents and others Costs of intangible assets other than those internally generated, including patents and licenses, are valued at acquisition cost and amortized on
a straight-line basis over their estimated future useful lives being 10 years.
(s) Borrowing costs General and specific borrowing costs that are directly attributable to the acquisition, construction or production of a qualifying asset are capitalised
during the period of time that is required to complete and prepare the asset for its intended use or sale. Qualifying assets are assets that necessarily take a substantial period of time to get ready for their intended use or sale.
Investment income earned on the temporary investment of specific borrowings pending their expenditure on qualifying assets is deducted from the borrowing costs eligible for capitalisation.
Other borrowing costs are expensed in the period in which they are incurred.
(t) Provisions General Provisions are recognized when the Group has a present obligation (legal or constructive) as a result of a past event, it is probable that an outflow of
resources embodying economic benefits will be required to settle the obligation and a reliable estimate can be made of the amount of the obligation. When the Group expects some or all of a provision to be reimbursed, for example, under an insurance contract, the reimbursement is recognized as a separate asset, but only when the reimbursement is virtually certain. The expense relating to a provision is presented in the statement of profit or loss net of any reimbursement.
If the effect of the time value of money is material, provisions are discounted using a current pre-tax rate that reflects, when appropriate, the risks
specific to the liability. When discounting is used, the increase in the provision due to the passage of time is recognized as a finance cost.
Warranty provisions Provisions for warranty-related costs are recognized when the product is sold or service provided to the customer. Initial recognition is based on
historical experience. The initial estimate of warranty-related costs is revised annually.
Provision for onerous contracts
A provision for onerous contracts is recognized when the expected benefits to be derived by the Group from a contract are lower than the unavoidable cost of meeting its obligations under the contract. The provision is measured at the present value of the expected net cost of continuing with the contract. Before a provision is established, the Group recognizes any impairment loss on the assets associated with that contract.
Financial Statements - Consolidated
Notes to the consolidated financial statements for the year ended March 31, 2019

Annual Report 2018-19 177
Contingent liabilities recognized in a business combination
A contingent liability recognized in a business combination is initially measured at its fair value. Subsequently, it is measured at the higher of the amount that would be recognized in accordance with the requirements for provisions above or the amount initially recognized less, when appropriate, cumulative amortization recognized in accordance with the requirements for revenue recognition.
(u) Employee benefits
(i) Short-term obligations Liabilities for wages and salaries, including non-monetary benefits that are expected to be settled wholly within 12 months after the end of the
period in which the employees render the related service are recognized in respect of employees’ services up to the end of the reporting period and are measured at the amounts expected to be paid when the liabilities are settled. The liabilities are presented as current employee benefit obligations in the balance sheet.
(ii) Other long-term employee benefit obligations
The liabilities for earned leaves are not expected to be settled wholly within 12 months after the end of the period in which the employees render the related service. They are therefore measured as the present value of expected future payments to be made in respect of services provided by employees up to the end of the reporting period using the projected unit credit method. The benefits are discounted using the market yields at the end of the reporting period that have terms approximating to the terms of the related obligation. Remeasurements as a result of experience adjustments and changes in actuarial assumptions are recognised in profit or loss.
The obligations are presented as current liabilities in the balance sheet if the entity does not have an unconditional right to defer settlement for at least twelve months after the reporting period, regardless of when the actual settlement is expected to occur.
(iii) Post-employment obligations The group operates the following post-employment schemes:
(a) defined benefit plans such as gratuity, pension; and
(b) defined contribution plans such as provident fund
Pension and Gratuity obligations The liability or asset recognised in the balance sheet in respect of defined benefit pension and gratuity plans is the present value of the defined
benefit obligation at the end of the reporting period less the fair value of plan assets. The defined benefit obligation is calculated annually by actuaries using the projected unit credit method.
The present value of the defined benefit obligation denominated in INR is determined by discounting the estimated future cash outflows by
reference to market yields at the end of the reporting period on government bonds that have terms approximating to the terms of the related obligation. The benefits which are denominated in currency other than INR, the cash flows are discounted using market yields determined by reference to high-quality corporate bonds that are denominated in the currency in which the benefits will be paid, and that have terms approximating to the terms of the related obligation.
The net interest cost is calculated by applying the discount rate to the net balance of the defined benefit obligation and the fair value of plan
assets. This cost is included in employee benefit expense in the statement of profit and loss.
Remeasurement gains and losses arising from experience adjustments and changes in actuarial assumptions are recognised in the period in which they occur, directly in other comprehensive income. They are included in retained earnings in the statement of changes in equity and in the balance sheet.
Changes in the present value of the defined benefit obligation resulting from plan amendments or curtailments are recognised immediately in
profit or loss as past service cost. Defined contribution plans The Group makes contributions to funds for certain employees to the regulatory authorities. The group has no further payment obligations once
the contributions have been paid. The contributions are accounted for as defined contribution plans and the contributions are recognised as employee benefit expense when an employee renders the related service. Prepaid contributions are recognised as an asset to the extent that a cash refund or a reduction in the future payments is available.
(iv) Bonus plans The group recognises a liability and an expense for bonuses. The group recognises a provision where contractually obliged or where there is a
past practice that has created a constructive obligation.
Financial Statements - Consolidated
Notes to the consolidated financial statements for the year ended March 31, 2019
178 Varroc Engineering Limited
(v) Termination benefits Termination benefits are payable when employment is terminated by the group before the normal retirement date, or when an employee accepts
voluntary redundancy in exchange for these benefits. The group recognises termination benefits at the earlier of the following dates: (a) when the group can no longer withdraw the offer of those benefits; and (b) when the entity recognises costs for a restructuring that is within the scope of Ind AS 37 and involves the payment of terminations benefits. In the case of an offer made to encourage voluntary redundancy, the termination benefits are measured based on the number of employees expected to accept the offer. Benefits falling due more than 12 months after the end of the reporting period are discounted to present value.
(v) Dividends Provision is made for the amount of any dividend declared, being appropriately authorised and no longer at the discretion of the entity, on or before
the end of the reporting period but not distributed at the end of the reporting period. (w) Earnings per share
(i) Basic earnings per share Basic earnings per share is calculated by dividing the profit attributable to owners of the parent company by the weighted average number of
equity shares outstanding during the reporting period. The weighted average number of equity shares outstanding during the period and for all periods presented is adjusted for events, such as bonus shares, other than the conversion of potential equity shares that have changed the number of equity shares outstanding, without a corresponding change in resources.
(ii) Diluted earnings per share Diluted earnings per share adjusts the figures used in the determination of basic earnings per share to take into account:
• the after income tax effect of interest and other financing costs associated with dilutive potential equity shares, and
• the weighted average number of additional equity shares that would have been outstanding assuming the conversion of all dilutive potential
equity shares. Dilutive potential equity shares are deemed converted as at the beginning of the period, unless issued at a later date. Dilutive potential equity
shares are determined independently for each period presented.
The number of equity shares and potentially dilutive equity shares are adjusted retrospectively for all years presented for any share splits and bonus shares issues including for changes effected prior to the authorization for issue of the Consolidated Financial Statements by the Board of Directors.
(x) Contingent liabilities A disclosure for a contingent liability is made where there is a possible obligation that arises from past events and the existence of which will be
confirmed only by the occurrence or non-occurrence of one or more uncertain future events not wholly within the control of the Group or a present obligation that arises from the past events where it is either not probable that an outflow of resources will be required to settle the obligation or a reliable estimate of the amount cannot be made.
(y) Treasury Shares Own equity instruments that are reacquired (treasury shares) are recognized at cost and deducted from equity. No gain or loss is recognized in profit
or loss on the purchase, sale, issue or cancellation of the Group's own equity instruments. Any difference between the carrying amount and the consideration, if reissued, is recognized in capital reserve.
(z) Segment reporting Operating segments are reported in a manner consistent with the internal reporting provided to the chief operating decision maker ('CODM'). The
CODM is responsible for allocating resources and assessing performance of the operating segments.
Financial Statements - Consolidated
Notes to the consolidated financial statements for the year ended March 31, 2019
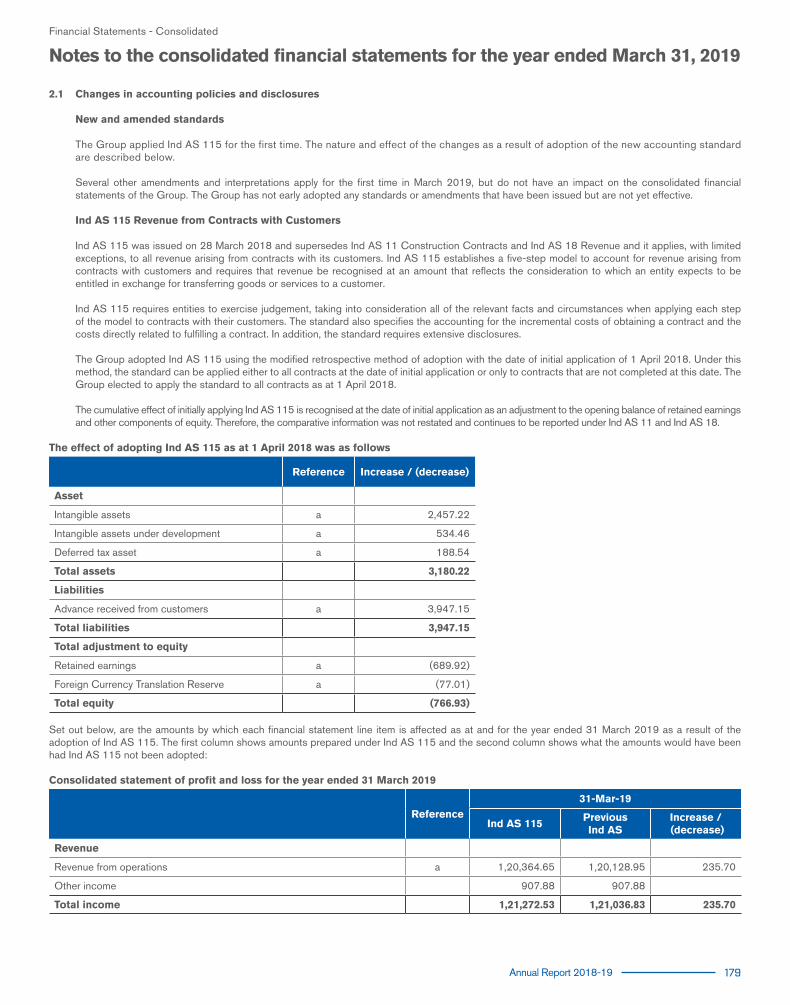
Annual Report 2018-19 179
2.1 Changes in accounting policies and disclosures New and amended standards The Group applied Ind AS 115 for the first time. The nature and effect of the changes as a result of adoption of the new accounting standard
are described below.
Several other amendments and interpretations apply for the first time in March 2019, but do not have an impact on the consolidated financial statements of the Group. The Group has not early adopted any standards or amendments that have been issued but are not yet effective.
Ind AS 115 Revenue from Contracts with Customers
Ind AS 115 was issued on 28 March 2018 and supersedes Ind AS 11 Construction Contracts and Ind AS 18 Revenue and it applies, with limited exceptions, to all revenue arising from contracts with its customers. Ind AS 115 establishes a five-step model to account for revenue arising from contracts with customers and requires that revenue be recognised at an amount that reflects the consideration to which an entity expects to be entitled in exchange for transferring goods or services to a customer.
Ind AS 115 requires entities to exercise judgement, taking into consideration all of the relevant facts and circumstances when applying each step
of the model to contracts with their customers. The standard also specifies the accounting for the incremental costs of obtaining a contract and the costs directly related to fulfilling a contract. In addition, the standard requires extensive disclosures.
The Group adopted Ind AS 115 using the modified retrospective method of adoption with the date of initial application of 1 April 2018. Under this
method, the standard can be applied either to all contracts at the date of initial application or only to contracts that are not completed at this date. The Group elected to apply the standard to all contracts as at 1 April 2018.
The cumulative effect of initially applying Ind AS 115 is recognised at the date of initial application as an adjustment to the opening balance of retained earnings
and other components of equity. Therefore, the comparative information was not restated and continues to be reported under Ind AS 11 and Ind AS 18.
The effect of adopting Ind AS 115 as at 1 April 2018 was as follows
Reference Increase / (decrease)
Asset
Intangible assets a 2,457.22
Intangible assets under development a 534.46
Deferred tax asset a 188.54
Total assets 3,180.22
Liabilities
Advance received from customers a 3,947.15
Total liabilities 3,947.15
Total adjustment to equity
Retained earnings a (689.92)
Foreign Currency Translation Reserve a (77.01)
Total equity (766.93)
Set out below, are the amounts by which each financial statement line item is affected as at and for the year ended 31 March 2019 as a result of the adoption of Ind AS 115. The first column shows amounts prepared under Ind AS 115 and the second column shows what the amounts would have been had Ind AS 115 not been adopted:
Consolidated statement of profit and loss for the year ended 31 March 2019
Reference31-Mar-19
Ind AS 115Previous Ind AS
Increase / (decrease)
Revenue
Revenue from operations a 1,20,364.65 1,20,128.95 235.70
Other income 907.88 907.88
Total income 1,21,272.53 1,21,036.83 235.70
Financial Statements - Consolidated
Notes to the consolidated financial statements for the year ended March 31, 2019
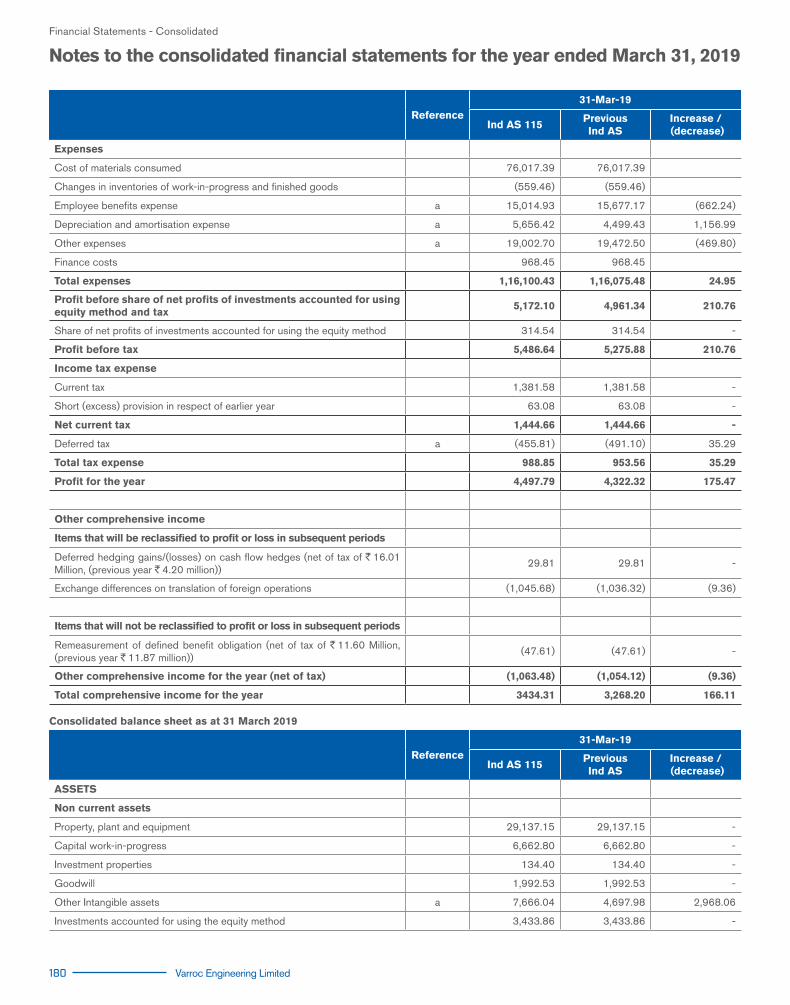
180 Varroc Engineering Limited
Reference31-Mar-19
Ind AS 115Previous Ind AS
Increase / (decrease)
Expenses
Cost of materials consumed 76,017.39 76,017.39
Changes in inventories of work-in-progress and finished goods (559.46) (559.46)
Employee benefits expense a 15,014.93 15,677.17 (662.24)
Depreciation and amortisation expense a 5,656.42 4,499.43 1,156.99
Other expenses a 19,002.70 19,472.50 (469.80)
Finance costs 968.45 968.45
Total expenses 1,16,100.43 1,16,075.48 24.95
Profit before share of net profits of investments accounted for using equity method and tax
5,172.10 4,961.34 210.76
Share of net profits of investments accounted for using the equity method 314.54 314.54 -
Profit before tax 5,486.64 5,275.88 210.76
Income tax expense
Current tax 1,381.58 1,381.58 -
Short (excess) provision in respect of earlier year 63.08 63.08 -
Net current tax 1,444.66 1,444.66 -
Deferred tax a (455.81) (491.10) 35.29
Total tax expense 988.85 953.56 35.29
Profit for the year 4,497.79 4,322.32 175.47
Other comprehensive income
Items that will be reclassified to profit or loss in subsequent periods
Deferred hedging gains/(losses) on cash flow hedges (net of tax of `16.01 Million, (previous year `4.20 million))
29.81 29.81 -
Exchange differences on translation of foreign operations (1,045.68) (1,036.32) (9.36)
Items that will not be reclassified to profit or loss in subsequent periods
Remeasurement of defined benefit obligation (net of tax of `11.60 Million, (previous year `11.87 million))
(47.61) (47.61) -
Other comprehensive income for the year (net of tax) (1,063.48) (1,054.12) (9.36)
Total comprehensive income for the year 3434.31 3,268.20 166.11
Consolidated balance sheet as at 31 March 2019
Reference31-Mar-19
Ind AS 115Previous Ind AS
Increase / (decrease)
ASSETS
Non current assets
Property, plant and equipment 29,137.15 29,137.15 -
Capital work-in-progress 6,662.80 6,662.80 -
Investment properties 134.40 134.40 -
Goodwill 1,992.53 1,992.53 -
Other Intangible assets a 7,666.04 4,697.98 2,968.06
Investments accounted for using the equity method 3,433.86 3,433.86 -
Financial Statements - Consolidated
Notes to the consolidated financial statements for the year ended March 31, 2019

Annual Report 2018-19 181
Reference31-Mar-19
Ind AS 115Previous Ind AS
Increase / (decrease)
Financial assets
Investments 0.20 0.20 -
Loans 127.88 127.88 -
Other financial assets 374.90 374.90 -
Income tax assets (Net) 152.03 152.03 -
Deferred tax assets (Net) a 1,755.02 1,599.89 155.13
Other non-current assets 2,422.09 2,422.09 -
Total non-current assets 53,858.90 50,735.70 3,123.20
Current assets
Inventories 9,199.24 9,199.24 -
Financial assets
Investments 186.41 186.41 -
Trade receivables 13,495.13 13,495.13 -
Cash and cash equivalents 1,608.42 1,608.42 -
Other bank balances 25.86 25.86 -
Loans 179.48 179.48 -
Other financial assets 18.72 18.72 -
Other current assets 8,958.20 8,958.20 -
Total current assets 33,671.46 33,671.46 -
Total Assets 87,530.36 84,407.16 3,123.20
EQUITY AND LIABILITIES
Equity
Equity share capital 134.81 134.81 -
Other equity a 30,736.21 31,337.03 (600.82)
Equity attributable to owners 30,871.02 31,471.84 (600.82)
Non-controlling interests 241.31 241.31
Total equity 31,112.33 31,713.15 (600.82)
LIABILITIES
Non-current liabilities
Financial Liabilities
Borrowings 4,571.96 4,571.96 -
Other financial liabilities 127.17 127.17 -
Provisions 978.19 978.19 -
Deferred tax liabilities (Net) 913.31 913.31 -
Other non-current liabilities 328.22 328.22 -
Total non-current liabilities 6,918.85 6,918.85 -
Current liabilities
Financial liabilities
Borrowings 12,014.65 12,014.65 -
Trade payables
Financial Statements - Consolidated
Notes to the consolidated financial statements for the year ended March 31, 2019
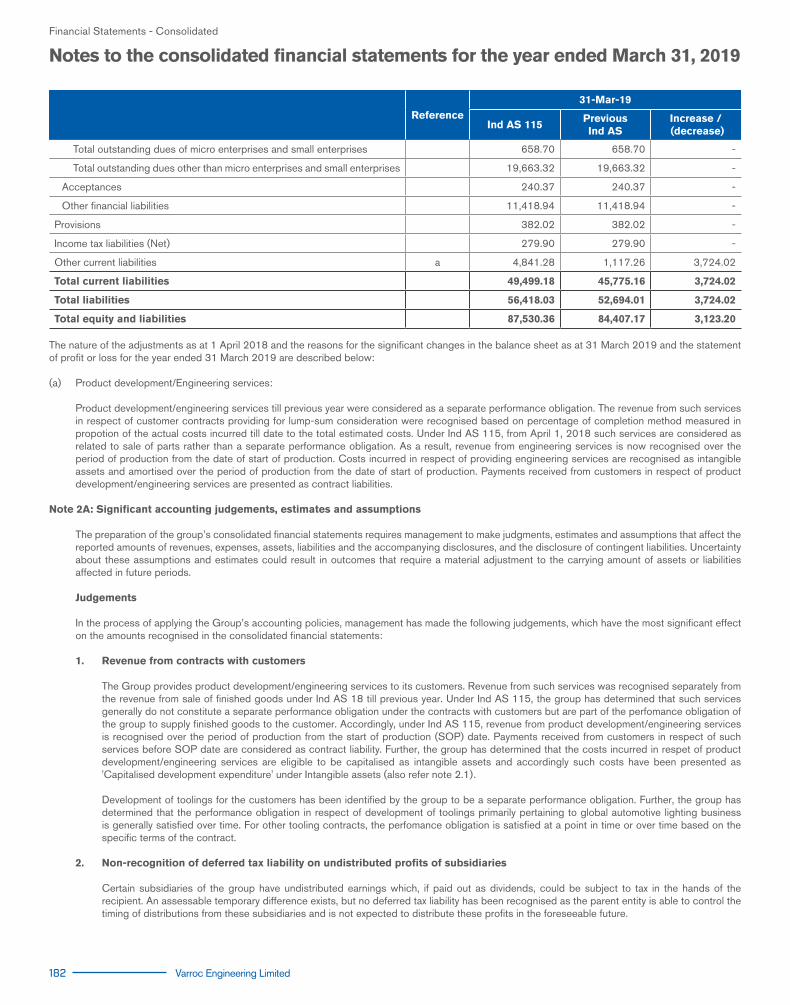
182 Varroc Engineering Limited
Reference31-Mar-19
Ind AS 115Previous Ind AS
Increase / (decrease)
Total outstanding dues of micro enterprises and small enterprises 658.70 658.70 -
Total outstanding dues other than micro enterprises and small enterprises 19,663.32 19,663.32 -
Acceptances 240.37 240.37 -
Other financial liabilities 11,418.94 11,418.94 -
Provisions 382.02 382.02 -
Income tax liabilities (Net) 279.90 279.90 -
Other current liabilities a 4,841.28 1,117.26 3,724.02
Total current liabilities 49,499.18 45,775.16 3,724.02
Total liabilities 56,418.03 52,694.01 3,724.02
Total equity and liabilities 87,530.36 84,407.17 3,123.20
The nature of the adjustments as at 1 April 2018 and the reasons for the significant changes in the balance sheet as at 31 March 2019 and the statement of profit or loss for the year ended 31 March 2019 are described below:
(a) Product development/Engineering services:
Product development/engineering services till previous year were considered as a separate performance obligation. The revenue from such services in respect of customer contracts providing for lump-sum consideration were recognised based on percentage of completion method measured in propotion of the actual costs incurred till date to the total estimated costs. Under Ind AS 115, from April 1, 2018 such services are considered as related to sale of parts rather than a separate performance obligation. As a result, revenue from engineering services is now recognised over the period of production from the date of start of production. Costs incurred in respect of providing engineering services are recognised as intangible assets and amortised over the period of production from the date of start of production. Payments received from customers in respect of product development/engineering services are presented as contract liabilities.
Note 2A: Significant accounting judgements, estimates and assumptions
The preparation of the group’s consolidated financial statements requires management to make judgments, estimates and assumptions that affect the reported amounts of revenues, expenses, assets, liabilities and the accompanying disclosures, and the disclosure of contingent liabilities. Uncertainty about these assumptions and estimates could result in outcomes that require a material adjustment to the carrying amount of assets or liabilities affected in future periods.
Judgements
In the process of applying the Group’s accounting policies, management has made the following judgements, which have the most significant effect on the amounts recognised in the consolidated financial statements:
1. Revenue from contracts with customers
The Group provides product development/engineering services to its customers. Revenue from such services was recognised separately from the revenue from sale of finished goods under Ind AS 18 till previous year. Under Ind AS 115, the group has determined that such services generally do not constitute a separate performance obligation under the contracts with customers but are part of the perfomance obligation of the group to supply finished goods to the customer. Accordingly, under Ind AS 115, revenue from product development/engineering services is recognised over the period of production from the start of production (SOP) date. Payments received from customers in respect of such services before SOP date are considered as contract liability. Further, the group has determined that the costs incurred in respet of product development/engineering services are eligible to be capitalised as intangible assets and accordingly such costs have been presented as 'Capitalised development expenditure' under Intangible assets (also refer note 2.1).
Development of toolings for the customers has been identified by the group to be a separate performance obligation. Further, the group has
determined that the performance obligation in respect of development of toolings primarily pertaining to global automotive lighting business is generally satisfied over time. For other tooling contracts, the perfomance obligation is satisfied at a point in time or over time based on the specific terms of the contract.
2. Non-recognition of deferred tax liability on undistributed profits of subsidiaries
Certain subsidiaries of the group have undistributed earnings which, if paid out as dividends, could be subject to tax in the hands of the recipient. An assessable temporary difference exists, but no deferred tax liability has been recognised as the parent entity is able to control the timing of distributions from these subsidiaries and is not expected to distribute these profits in the foreseeable future.
Financial Statements - Consolidated
Notes to the consolidated financial statements for the year ended March 31, 2019

Annual Report 2018-19 183
Estimates and assumptions
1. Business combination - Purchase price allocation
Accounting for business combinations is complex and requires the management to make estimates/assumptions in identification, valuation and recognition of assets acquired and liabilities assumed. Business combinations also involve determining goodwill, the future evaluation of which requires estimates with significant effects for the Group.
The recognition at fair value of the assets acquired and liabilities assumed requires the use of valuation methodologies that require significant judgments and estimates and the involvement of the Group’s external experts.
During the year ended March 31, 2019, the Group carried out the acquisition of SA-BA Endustriyel Urunler Imalat ve Ticaret Anonim Sirketi (now Varroc Lighting Systems Endüstriyel Ürünler lmalat ve Ticaret Anonim Sirketi) in Turkey (“Turkey subsidiary”) that resulted in the inclusion and measurement of assets acquired and liabilities assumed in the consolidated financial statements. The valuation criteria and judgements and estimates made have a significant impact on the consolidated financial statements for the year ended March 31, 2019 and for future years. Refer note 54 (a)for details.
2. Goodwill Impairment Test: Key assumptions used for value-in-use calculations
The group tests whether goodwill has suffered any impairment atleast on an annual basis irrespective of whether there is any indication of impairment. The recoverable amount of a cash generating unit (CGU) to which goodwill balance is allocated is determined based on value-in-use calculations which require the use of assumptions. The calculations use cash flow projections based on financial budgets approved by management covering a five-year period. Cash flows beyond the five-year period are extrapolated using the estimated growth, consistent with industry forecasts. The growth rates are consistent with forecasts included in industry reports specific to the industry in which each CGU operates.The key assumptions used to determine the recoverable amounts for the different CGUs to which goodwill amounts have been allocated, including a sensitivity analysis, are disclosed and further explained in Note 5 (b).
3. Defined benefit plans
The liability or asset recognised in the balance sheet in respect of defined benefit pension and gratuity plans is the present value of the defined benefit obligation at the end of the reporting period less the fair value of plan assets. The defined benefit obligation is calculated annually by actuaries using the projected unit credit method.
An actuarial valuation involves making various assumptions that may differ from actual developments in the future. These include the determination of the discount rate, future salary increases and mortality rates. Due to the complexities involved in the valuation and its long-term nature, a defined benefit obligation is highly sensitive to changes in these assumptions. All assumptions are reviewed at each reporting date.
The present value of the defined benefit obligation denominated in INR is determined by discounting the estimated future cash outflows by reference to market yields at the end of the reporting period on government bonds that have terms approximating to the terms of the related obligation. The benefits which are denominated in currency other than INR, the cash flows are discounted using market yields determined by reference to high-quality corporate bonds that are denominated in the currency in which the benefits will be paid, and that have terms approximating to the terms of the related obligation.
The mortality rate is based on publicly available mortality tables based on the country where the entity operates.
Those mortality tables tend to change only at interval in response to demographic changes.
Future salary increases and gratuity increases are based on expected future inflation rates of the respective country.
Further details about defined benefit plans are given in Note 42.
4. Deferred taxes
Deferred tax assets are recognised when it is probable that these amounts can be utilised against future taxable surpluses and against fiscal, temporary differences. At each balance sheet date, the group assesses whether the realization of future tax benefits is sufficiently probable to recognize/carry forward deferred tax assets (including MAT credit). This assessment requires the use of significant estimates with respect to assessment of future taxable income. The recorded amount of total deferred tax assets could change if estimates of projected future taxable income or if changes in current tax regulations are enacted. Refer note 22 for details.
5. Recognition of tooling revenue over time
In respect of tooling contracts where revenue is recognised over time, the measurement of progress towards completion requires the group to estimate the services performed to date as a proportion of the total services to be performed which is based on the proportion of actual costs incurred to total estimated costs. Such estimates are continually evaluated. They are based on historical experience and other factors, including expectations of future events that may have a financial impact on the group and that are believed to be reasonable under the circumstances.
Financial Statements - Consolidated
Notes to the consolidated financial statements for the year ended March 31, 2019

184 Varroc Engineering Limited
Notes to the consolidated financial statements for the year ended March 31, 2019
Note 2B: Standards issued but not yet effective:
1. Ind AS 116 – Leases:
Ind AS 116 - Leases was notified by MCA on 30 March 2019 and it replaces Ind AS 17 - Leases, including appendices thereto. Ind AS 116 is effective for annual periods beginning on or after 1 April 2019. Ind AS 116 sets out the principles for the recognition, measurement, presentation and disclosure of leases and requires lessees to account for all leases under a single on-balance sheet model similar to the accounting for finance leases under Ind AS 17. The standard includes two recognition exemptions for lessees – leases of ‘low-value’ assets (e.g., personal computers) and short-term leases (i.e., leases with a lease term of 12 months or less). At the commencement date of a lease, a lessee will recognise a liability to make lease payments (i.e., the lease liability) and an asset representing the right to use the underlying asset during the lease term (i.e., the right-of-use asset). Lessees will be required to separately recognise the interest expense on the lease liability and the depreciation expense on the right-of-use asset.
Lessees will be also required to remeasure the lease liability upon the occurrence of certain events (e.g., a change in the lease term, a change in future lease payments resulting from a change in an index or rate used to determine those payments). The lessee will generally recognise the amount of the remeasurement of the lease liability as an adjustment to the right-of-use asset.
Lessor accounting under Ind AS 116 is substantially unchanged from the current accounting under Ind AS 17. Lessors will continue to classify all leases using the same classification principle as in Ind AS 17 and distinguish between two types of leases: operating and finance leases.
The group intends to adopt Ind AS 116 from 1 April 2019. The group continues to evaluate the available transition methods and its contractual arrangements. A reliable estimate of the quantitative impact of Ind AS 116 on the consolidated financial statements will only be possible once the implementation has been completed.
2. Other Amendments to Standards, issued but not effective, which are either not applicable to the Group or the impact is not expected to be material:
(a) Appendix C to Ind AS 12 Uncertainty over Income Tax Treatment(b) Amendments to Ind AS 109: Prepayment Features with Negative Compensation(c) Amendments to Ind AS 19: Plan Amendment, Curtailment or Settlement(d) Amendments to Ind AS 28: Long-term interests in associates and joint ventures(e) Annual improvement to Ind AS (2018):
- Amendments to Ind AS 103: Party to a Joint Arrangements obtains control of a business that is a Joint Operation- Amendments to Ind AS 111: Joint Arrangements- Amendments to Ind AS 12: Income Taxes- Amendments to Ind AS 23: Borrowing Costs
Financial Statements - Consolidated

Annual Report 2018-19 185
No
tes
to t
he c
ons
olid
ated
fin
anci
al s
tate
men
ts f
or
the
year
end
ed M
arch
31,
201
9
No
te 3
: P
rop
ert
y, p
lan
t an
d e
qu
ipm
en
t
(`in
mill
ion)
Par
ticu
lars
Gro
ss c
arry
ing
amo
unt
Acc
um
ula
ted
dep
reci
ati
on
Net
Carr
yin
g a
mo
un
t
Ass
et C
lass
As
at
Ap
ril
1, 2
018
Bu
sin
ess
co
mb
inat
ion
(R
efe
r N
ote
54
(a))
Ad
dit
ion
s*Tr
an
slati
on
ad
just
men
tD
educ
tio
ns/
ad
just
men
ts
As
at
Marc
h
31, 2
019
As
at
Ap
ril
1, 2
018
Dep
reci
atio
n
for
the
year
Tran
slati
on
ad
just
men
t
On
D
educ
tio
ns/
adju
stm
ents
As
at
Marc
h
31, 2
019
As
at
Marc
h
31, 2
019
As
at
Marc
h
31, 2
018
Ow
ned
ass
ets
Free
hold
Lan
d 9
50.5
4 5
3.83
8
.99
(17.
25)
15.
40
980
.71
-
-
980
.71
950
.54
Fact
ory
Bui
ldin
g 5
,880
.04
116
.03
1,4
13.9
1 (1
96.7
8) 2
.58
7,2
10.6
2 5
80.8
0 2
50.7
3 (1
0.63
) 0
.18
820
.72
6,3
89.9
0 5
,299
.24
Offi
ce B
uild
ing
949
.22
-
167
.78
(8.6
5) 1
,108
.35
82.
95
22.
13
0.0
3 1
05.1
1 1
,003
.24
866
.27
Pla
nt &
Mac
hine
ry
19,
220.
56
411
.74
4,2
02.7
2 (4
37.1
9) 1
49.9
9 2
3,24
7.84
5
,339
.80
2,3
17.7
4 (1
20.8
0) 7
9.18
7
,457
.56
15,
790.
28
13,
880.
76
Fact
ory
Equ
ipm
ent
2,2
03.6
3 -
4
23.5
5 (5
2.05
) 1
1.62
2
,563
.51
717
.56
273
.01
(17.
94)
9.8
3 9
62.8
0 1
,600
.71
1,4
86.0
7
Ele
ctric
al In
stal
latio
n 4
17.0
8 -
4
6.98
(0
.12)
1.4
2 4
62.5
2 1
48.1
2 4
3.74
(0
.06)
1.3
6 1
90.4
4 2
72.0
8 2
68.9
6
Mou
ld &
Die
s 5
89.5
7 -
1
64.1
3 (1
.88)
0.2
2 7
51.6
0 2
39.6
8 1
17.3
6 (1
.18)
0.2
2 3
55.6
4 3
95.9
6 3
49.8
9
Ele
ctric
al F
ittin
g 6
2.81
-
2
.34
-
65.
15
25.
62
7.4
3 -
-
3
3.05
3
2.10
3
7.19
Offi
ce E
quip
men
t 1
73.5
6 -
2
5.59
(2
.06)
0.5
5 1
96.5
4 9
3.81
2
6.52
(1
.25)
0.4
7 1
18.6
1 7
7.93
7
9.75
Tool
s &
Inst
rum
ent
1,2
69.4
0 -
2
53.6
1 (5
4.08
) 1
.51
1,4
67.4
2 7
05.5
5 3
13.9
1 (3
8.26
) 1
.34
979
.86
487
.56
563
.85
Furn
iture
and
fixt
ures
296
.78
31.
10
61.
24
(11.
59)
0.1
2 3
77.4
1 8
1.16
6
3.05
(2
.87)
0.0
4 1
41.3
0 2
36.1
1 2
15.6
2
Com
pute
rs 5
38.3
6 -
2
68.1
1 (1
0.07
) 4
.20
792
.20
258
.76
146
.87
(4.5
8) 4
.20
396
.85
395
.35
279
.60
Vehi
cles
92.
32
4.3
1 6
.18
(0.7
0) 1
2.11
9
0.00
3
7.71
1
6.49
(0
.06)
8.3
3 4
5.81
4
4.19
5
4.61
Lease
d a
ssets
Leas
ehol
d La
nd 8
52.7
5 -
-
(2
.15)
-
850
.60
53.
72
22.
93
-
-
76.
65
773
.95
799
.03
Bui
ldin
gs 6
93.9
9 6
3.80
-
(4
0.81
) -
7
16.9
8 2
35.1
5 7
8.77
(1
8.36
) -
2
95.5
6 4
21.4
2 4
58.8
4
Pla
nt &
Mac
hine
ry 3
40.4
0 -
-
(1
9.51
) -
3
20.8
9 6
7.41
2
5.40
(5
.14)
-
87.
67
233
.22
272
.99
Offi
ce E
quip
men
t -
-
4
.06
(0.2
2) -
3
.84
-
1.4
8 (0
.08)
-
1.4
0 2
.44
-
Gra
nd
To
tal
34,
531.
01
680
.80
7,0
49.1
9 (
855.
11)
199
.72
41,
206.
18
8,6
67.8
0 3
,727
.56
(22
1.18
) 1
05.1
5 1
2,06
9.03
2
9,13
7.15
2
5,86
3.21
* A
dditi
ons
incl
ude
finan
ce c
ost c
apita
lised
am
ount
ing
to `
13.4
0 m
illio
n (3
1 M
arch
201
8 : N
il)
(i)
Cap
ital w
ork
-in
-pro
gre
ss(`
in m
illio
n)
Ope
ning
cap
ital w
ork-
in-p
rogr
ess
2,4
40.4
7
Add
: Acq
uire
d th
roug
h bu
sine
ss c
ombi
natio
n (r
efer
not
e 54
(a))
30.
54
Add
ition
dur
ing
the
year
end
ed M
arch
31,
201
9 1
1,24
0.98
Cap
italis
ed d
urin
g th
e ye
ar e
nded
Mar
ch 3
1, 2
019
7,0
49.1
9
Clo
sin
g c
ap
ital w
ork
-in
-p
rog
ress
6,6
62.8
0
(ii)
Con
trac
tual
obl
igat
ions
Ref
er to
not
e 50
(a)
for d
iscl
osur
e of
con
trac
tual
com
mitm
ents
for t
he a
cqui
sitio
n of
pro
pert
y, p
lant
and
equ
ipm
ent.
(ii
i) O
ffice
Bui
ldin
g in
clud
es p
rem
ises
on
owne
rshi
p ba
sis
in a
Co-
Ope
rativ
e S
ocie
ty `
6.3
Mill
ion,
incl
udin
g co
st o
f sha
res
ther
ein
`12
5.
Financial Statements - Consolidated

186 Varroc Engineering Limited
Financial Statements - Consolidated
No
te 3
: P
rop
ert
y, p
lan
t an
d e
qu
ipm
en
t
(`in
mill
ion)
Par
ticu
lars
Gro
ss c
arry
ing
amo
unt
Acc
um
ula
ted
dep
reci
ati
on
Net
Carr
yin
g a
mo
un
t
Ass
et C
lass
As
at
Ap
ril
1, 2
017
Bu
sin
ess
co
mb
inat
ion
(R
efe
r N
ote
54
(b
))
Ad
dit
ion
s*Tr
an
slati
on
ad
just
men
tD
educ
tio
ns/
ad
just
men
ts
As
at
Marc
h
31, 2
018
As
at
Ap
ril
1, 2
017
Dep
reci
atio
n
for
the
year
Tran
slati
on
ad
just
men
t
On
D
educ
tio
ns/
adju
stm
ents
As
at
Marc
h
31, 2
018
As
at
Marc
h
31, 2
018
As
at
Marc
h
31, 2
017
Ow
ned
ass
ets
Free
hold
Lan
d 9
01.7
0 -
-
5
3.38
4
.54
950
.54
-
-
-
-
-
950
.54
901
.70
Fact
ory
Bui
ldin
g 4
,604
.60
40.
62
943
.26
291
.92
0.3
6 5
,880
.04
359
.30
206
.16
15.
61
0.2
7 5
80.8
0 5
,299
.24
4,2
45.3
0
Offi
ce B
uild
ing
883
.10
-
147
.04
5.0
8 8
6.00
9
49.2
2 6
1.02
2
1.96
3
.29
3.3
2 8
2.95
8
66.2
7 8
22.0
8
Pla
nt &
Mac
hine
ry 1
5,24
0.80
4
5.16
3
,086
.39
971
.72
123
.51
19,
220.
56
3,1
04.1
4 2
,030
.96
269
.69
64.
99
5,3
39.8
0 1
3,88
0.76
1
2,13
6.66
Fact
ory
Equ
ipm
ent
1,7
60.0
0 5
.58
338
.75
120
.69
21.
39
2,2
03.6
3 4
31.7
0 2
64.0
6 3
1.10
9
.30
717
.56
1,4
86.0
7 1
,328
.30
Ele
ctric
al In
stal
latio
n 4
06.4
0 -
1
1.55
0
.45
1.3
2 4
17.0
8 1
01.3
0 4
7.38
0
.17
0.7
3 1
48.1
2 2
68.9
6 3
05.1
0
Mou
ld &
Die
s 4
77.6
0 5
.94
117
.14
3.6
4 1
4.75
5
89.5
7 1
45.2
1 9
3.38
2
.24
1.1
5 2
39.6
8 3
49.8
9 3
32.3
9
Ele
ctric
al F
ittin
g 6
1.10
-
1
.76
-
0.0
5 6
2.81
1
7.40
8
.25
-
0.0
3 2
5.62
3
7.19
4
3.70
Offi
ce E
quip
men
t 1
35.3
0 0
.33
31.
91
6.5
5 0
.53
173
.56
57.
60
33.
51
3.1
7 0
.47
93.
81
79.
75
77.
70
Tool
s &
Inst
rum
ent
845
.30
0.1
6 2
83.1
5 1
45.9
9 5
.20
1,2
69.4
0 3
68.2
7 2
62.3
3 7
7.31
2
.36
705
.55
563
.85
477
.03
Furn
iture
and
fixt
ures
222
.70
1.6
6 6
2.39
1
0.03
-
2
96.7
8 4
7.08
3
2.59
1
.49
-
81.
16
215
.62
175
.62
Com
pute
rs 3
45.3
0 0
.35
178
.93
25.
23
11.
45
538
.36
133
.69
118
.24
8.6
3 1
.80
258
.76
279
.60
211
.61
Vehi
cles
63.
22
3.2
4 3
7.05
1
.19
12.
38
92.
32
32.
10
15.
44
0.3
9 1
0.22
3
7.71
5
4.61
3
1.12
Lease
d a
ssets
Leas
ehol
d La
nd 7
84.8
1 2
5.04
3
5.99
6
.91
-
852
.75
39.
10
14.
62
*
-
53.
72
799
.03
745
.71
Bui
ldin
gs 5
62.7
0 -
-
1
31.2
9 -
6
93.9
9 1
26.9
7 7
1.41
3
6.77
-
2
35.1
5 4
58.8
4 4
35.7
3
Pla
nt &
Mac
hine
ry 2
75.4
0 -
-
6
5.00
-
3
40.4
0 3
3.10
2
4.96
9
.35
-
67.
41
272
.99
242
.30
Gra
nd
To
tal
27,
570.
03
128
.08
5,2
75.3
1 1
,839
.07
281
.48
34,
531.
01
5,0
57.9
8 3
,245
.25
459
.21
94.
64
8,6
67.8
0 2
5,86
3.21
2
2,51
2.05
(i)
Cap
ital w
ork
-in
-pro
gre
ss(`
in m
illio
n)
Ope
ning
cap
ital w
ork-
in-p
rogr
ess
2,4
64.5
8
Add
ition
dur
ing
the
year
5
,251
.20
Cap
italis
ed d
urin
g th
e ye
ar
5,2
75.3
1
Clo
sin
g c
ap
ital w
ork
-in
-p
rog
ress
as
at
Marc
h 3
1, 2
018
2,4
40.4
7
(ii)
Con
trac
tual
obl
igat
ions
Ref
er to
not
e 50
(a)
for d
iscl
osur
e of
con
trac
tual
com
mitm
ents
for t
he a
cqui
sitio
n of
pro
pert
y, p
lant
and
equ
ipm
ent.
(ii
i) O
ffice
Bui
ldin
g in
clud
es p
rem
ises
on
owne
rshi
p ba
sis
in a
Co-
Ope
rativ
e S
ocie
ty `
6.3
Mill
ion,
incl
udin
g co
st o
f sha
res
ther
ein
`12
5.
*Am
ount
bel
ow ro
undi
ng o
ff no
rms
adop
ted
by th
e gr
oup
No
tes
to t
he c
ons
olid
ated
fin
anci
al s
tate
men
ts f
or
the
year
end
ed M
arch
31,
201
9
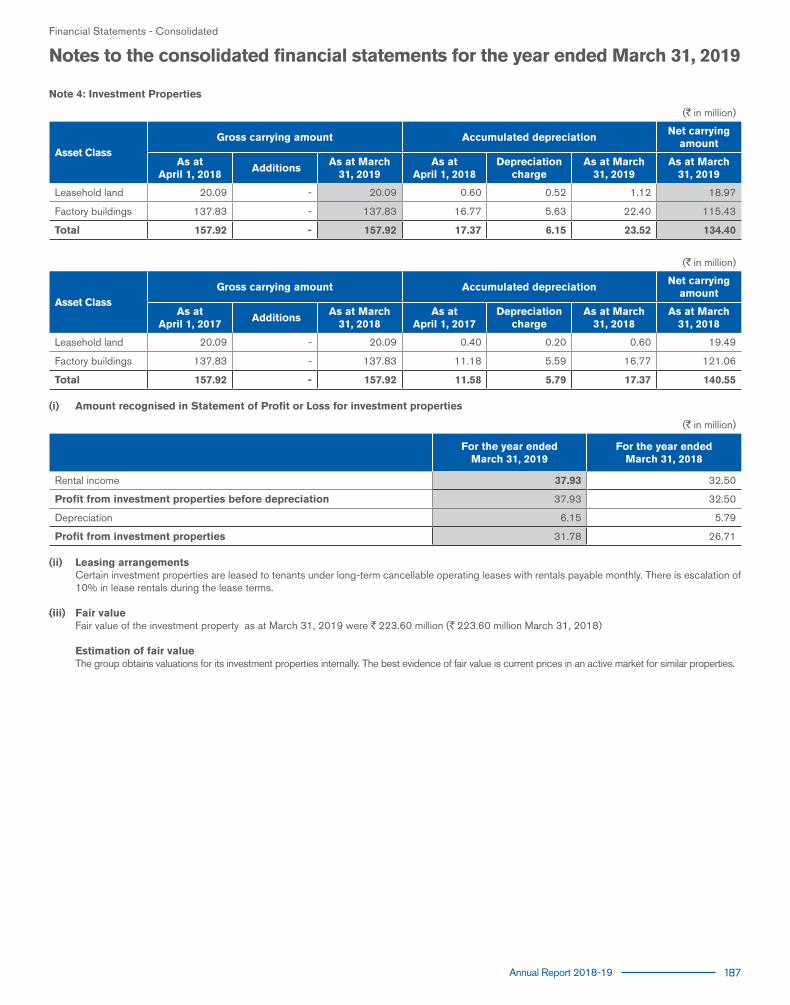
Annual Report 2018-19 187
Note 4: Investment Properties
(`in million)
Asset ClassGross carrying amount Accumulated depreciation
Net carrying amount
As atApril 1, 2018
AdditionsAs at March
31, 2019As at
April 1, 2018Depreciation
chargeAs at March
31, 2019As at March
31, 2019
Leasehold land 20.09 - 20.09 0.60 0.52 1.12 18.97
Factory buildings 137.83 - 137.83 16.77 5.63 22.40 115.43
Total 157.92 - 157.92 17.37 6.15 23.52 134.40
(`in million)
Asset ClassGross carrying amount Accumulated depreciation
Net carrying amount
As atApril 1, 2017
AdditionsAs at March
31, 2018As at
April 1, 2017Depreciation
chargeAs at March
31, 2018As at March
31, 2018
Leasehold land 20.09 - 20.09 0.40 0.20 0.60 19.49
Factory buildings 137.83 - 137.83 11.18 5.59 16.77 121.06
Total 157.92 - 157.92 11.58 5.79 17.37 140.55
(i) Amount recognised in Statement of Profit or Loss for investment properties
(`in million)
For the year endedMarch 31, 2019
For the year endedMarch 31, 2018
Rental income 37.93 32.50
Profit from investment properties before depreciation 37.93 32.50
Depreciation 6.15 5.79
Profit from investment properties 31.78 26.71
(ii) Leasing arrangements Certain investment properties are leased to tenants under long-term cancellable operating leases with rentals payable monthly. There is escalation of
10% in lease rentals during the lease terms. (iii) Fair value Fair value of the investment property as at March 31, 2019 were `223.60 million (`223.60 million March 31, 2018)
Estimation of fair value The group obtains valuations for its investment properties internally. The best evidence of fair value is current prices in an active market for similar properties.
Financial Statements - Consolidated
Notes to the consolidated financial statements for the year ended March 31, 2019

188 Varroc Engineering Limited
No
te 5
(a):
Oth
er
Inta
ng
ible
Ass
ets
(`in
mill
ion)
Par
ticu
lars
Gro
ss c
arry
ing
amo
unt
Acc
um
ula
ted
am
ort
isati
on
Net
Carr
yin
g a
mo
un
t
Ass
et C
lass
As
at
Ap
ril
1, 2
018
Eff
ect
of
chan
ge i
n
acc
ou
nti
ng
p
oli
cy (
refe
r n
ote
2.1
)
Bu
sin
ess
co
mb
inat
ion
(R
efe
r N
ote
54
(a))
Ad
dit
ion
sTr
an
slati
on
ad
just
men
tD
educ
tio
ns/
ad
just
men
ts
As
at
Marc
h
31, 2
019
As
at
Ap
ril
1, 2
018
Am
ort
isat
ion
fo
r th
e ye
arTr
an
slati
on
ad
just
men
t
On
D
educ
tio
ns/
adju
stm
ents
As
at
Marc
h
31, 2
019
As
at
Marc
h
31, 2
019
As
at
Marc
h
31, 2
018
Com
pute
r sof
twar
e 1
,528
.65
-
-
283
.46
7.1
2 1
,819
.23
992
.49
263
.59
(4.4
7) 1
,251
.61
567
.62
536
.16
Tech
nica
l kno
w h
ow 5
97.8
8 -
-
4
0.11
(3
1.96
) 2
7.89
5
78.1
4 2
37.6
6 1
16.2
2 (1
9.40
) 3
34.4
8 2
43.6
6 3
60.2
2
Cus
tom
er re
latio
nshi
p 1
90.3
0 -
8
02.5
0 (1
42.0
8) 8
50.7
2 1
2.69
4
8.00
(4
.01)
56.
68
794
.04
177
.61
Pat
ents
and
oth
ers
84.
13
-
24.
08
3.6
3 (1
0.10
) 7
.62
94.
12
6.5
7 5
1.05
(0
.15)
2.4
8 5
4.99
3
9.13
7
7.56
Cap
italis
ed
deve
lopm
ent c
osts
935
.03
2,4
57.2
2 -
1
,196
.02
(153
.25)
-
4,4
35.0
2 3
85.5
3 1
,443
.85
(84.
05)
1,7
45.3
3 2
,689
.69
549
.50
Gra
nd
To
tal
3,3
35.9
9 2
,457
.22
826
.58
1,5
23.2
2 (
330.
27)
35.
51
7,7
77.2
3 1
,634
.94
1,9
22.7
1 (
112.
08)
2.4
8 3
,443
.09
4,3
34.1
4 1
,701
.05
Inta
ng
ible
ass
ets
un
der
deve
lop
men
t(`
in m
illio
n)
Ope
ning
bal
ance
1000
.25
Add
: Effe
ct o
f cha
nge
in a
ccou
ntin
g po
licy
(ref
er n
ote
2.1)
532
.50
Add
ition
dur
ing
the
year
end
ed M
arch
31,
201
9 3
,322
.37
Cap
italis
ed d
urin
g th
e ye
ar e
nded
Mar
ch 3
1, 2
019
1,5
23.2
2
Clo
sin
g b
ala
nce
3,3
31.9
0
(`in
mill
ion)
Par
ticu
lars
Gro
ss c
arry
ing
amo
unt
Acc
um
ula
ted
am
ort
isati
on
Net
Carr
yin
g a
mo
un
t
Ass
et C
lass
As
at
Ap
ril
1, 2
017
Bu
sin
ess
co
mb
inat
ion
(R
efe
r N
ote
54
(b
))
Ad
dit
ion
sTr
an
slati
on
ad
just
men
tD
educ
tio
ns/
ad
just
men
ts
As
at
Marc
h
31, 2
018
As
at
Ap
ril
1, 2
017
Am
ort
isat
ion
fo
r th
e ye
arTr
an
slati
on
ad
just
men
t
On
D
educ
tio
ns/
adju
stm
ents
As
at
Marc
h
31, 2
018
As
at
Marc
h
31, 2
018
As
at
Marc
h
31, 2
017
Com
pute
r sof
twar
e 1
,150
.31
0.1
0 2
77.3
3 1
01.0
0 0
.09
1,5
28.6
5 6
28.1
9 2
89.8
6 7
4.52
0
.08
992
.49
536
.16
522
.12
Tech
nica
l kno
w h
ow 4
66.8
4 0
.14
19.
56
111
.50
0.1
6 5
97.8
8 1
26.0
4 7
5.28
3
6.34
*
2
37.6
6 3
60.2
2 3
40.8
0
Cus
tom
er re
latio
nshi
p -
1
90.3
0 -
-
-
1
90.3
0 -
1
2.69
-
-
1
2.69
1
77.6
1 -
Pat
ents
and
oth
ers
41.
61
39.
77
2.3
0 2
.85
2.4
0 8
4.13
1
.83
4.5
7 0
.17
*
6.5
7 7
7.56
3
9.78
Cap
italis
ed d
evel
opm
ent c
ost
358
.72
464
.73
111
.58
935
.03
115
.42
231
.21
38.
90
385
.53
549
.50
243
.30
Gra
nd
To
tal
2,0
17.4
8 2
30.3
1 7
63.9
2 3
26.9
3 2
.65
3,3
35.9
9 8
71.4
8 6
13.6
1 1
49.9
3 0
.08
1,6
34.9
4 1
,701
.05
1,1
46.0
0
Inta
ng
ible
ass
ets
un
der
deve
lop
men
t(`
in m
illio
n)
Ope
ning
bal
ance
460
.80
Add
ition
dur
ing
the
year
1
,303
.37
Cap
italis
ed d
urin
g th
e ye
ar
763
.92
Clo
sin
g b
ala
nce
1,0
00.2
5 *A
mou
nt b
elow
roun
ding
off
norm
s ad
opte
d by
the
grou
p
Financial Statements - Consolidated
No
tes
to t
he c
ons
olid
ated
fin
anci
al s
tate
men
ts f
or
the
year
end
ed M
arch
31,
201
9
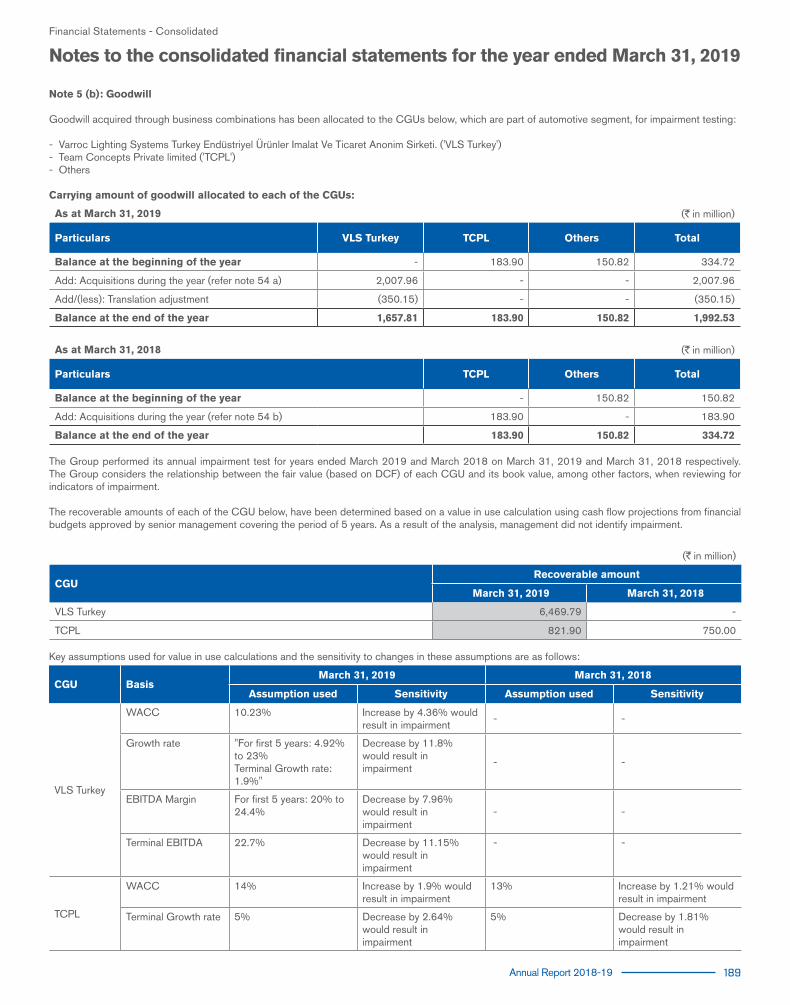
Annual Report 2018-19 189
Financial Statements - Consolidated
Note 5 (b): Goodwill
Goodwill acquired through business combinations has been allocated to the CGUs below, which are part of automotive segment, for impairment testing:
- Varroc Lighting Systems Turkey Endüstriyel Ürünler Imalat Ve Ticaret Anonim Sirketi. ('VLS Turkey')- Team Concepts Private limited ('TCPL')- Others
Carrying amount of goodwill allocated to each of the CGUs:
As at March 31, 2019 (`in million)
Particulars VLS Turkey TCPL Others Total
Balance at the beginning of the year - 183.90 150.82 334.72
Add: Acquisitions during the year (refer note 54 a) 2,007.96 - - 2,007.96
Add/(less): Translation adjustment (350.15) - - (350.15)
Balance at the end of the year 1,657.81 183.90 150.82 1,992.53
As at March 31, 2018 (`in million)
Particulars TCPL Others Total
Balance at the beginning of the year - 150.82 150.82
Add: Acquisitions during the year (refer note 54 b) 183.90 - 183.90
Balance at the end of the year 183.90 150.82 334.72
The Group performed its annual impairment test for years ended March 2019 and March 2018 on March 31, 2019 and March 31, 2018 respectively. The Group considers the relationship between the fair value (based on DCF) of each CGU and its book value, among other factors, when reviewing for indicators of impairment.
The recoverable amounts of each of the CGU below, have been determined based on a value in use calculation using cash flow projections from financial budgets approved by senior management covering the period of 5 years. As a result of the analysis, management did not identify impairment.
(`in million)
CGURecoverable amount
March 31, 2019 March 31, 2018
VLS Turkey 6,469.79 -
TCPL 821.90 750.00
Key assumptions used for value in use calculations and the sensitivity to changes in these assumptions are as follows:
CGU BasisMarch 31, 2019 March 31, 2018
Assumption used Sensitivity Assumption used Sensitivity
VLS Turkey
WACC 10.23% Increase by 4.36% would result in impairment
- -
Growth rate "For first 5 years: 4.92% to 23% Terminal Growth rate: 1.9%"
Decrease by 11.8% would result in impairment
- -
EBITDA Margin For first 5 years: 20% to 24.4%
Decrease by 7.96% would result in impairment
- -
Terminal EBITDA 22.7% Decrease by 11.15% would result in impairment
- -
TCPL
WACC 14% Increase by 1.9% would result in impairment
13% Increase by 1.21% would result in impairment
Terminal Growth rate 5% Decrease by 2.64% would result in impairment
5% Decrease by 1.81% would result in impairment
Notes to the consolidated financial statements for the year ended March 31, 2019

190 Varroc Engineering Limited
(`in million)
As at March31, 2019
As at March31, 2018
6 Non-current investments
Investment in equity instruments at FVPL (unquoted)
Face value per share
Number of Shares
As at March
31, 2019
As at March
31, 2018
The Saraswat Co-Operative bank limited `10.00 13,500 13,500 0.14 0.14
Investment in Government securities at amortised cost (unquoted)
National saving certificates 0.06 0.06
Total non current investment 0.20 0.20
Aggregate amount of unquoted investments 0.20 0.20
7 Non Current - Loans
Security deposits (considered good) 127.88 106.81
Total Non Current loans 127.88 106.81
8 Non current - Other financial assets
Bank deposits with maturity of more than 12 months from balance sheet date [lien with bank is `244.92 Million (March 31,2018 `138.13 Million)]
244.95 138.33
Surrender value of keyman Insurance Receivable 110.04 -
Others 19.91 0.38
Total non current other financial assets 374.90 138.71
9 Other non current assets
Capital advances 334.65 194.19
Provision for capital advance (2.41) (1.57)
332.24 192.62
Contract assets 175.21 177.56
Advance to suppliers 670.64 198.64
Government grant receivable 352.02 275.71
Prepaid expenses 19.55 3.41
Balances with Government Authorities 90.81 84.29
Customer prepayments 765.94 520.21
Others 15.68 21.82
Total other non current assets 2,422.09 1,474.26
10 Inventories
Raw materials [Includes material in transit of `287.64 Million (March 31, 2018 `139.50 Million)] 4,457.35 4,625.24
Work-in-progress 2,468.46 1,957.75
Finished goods [Includes finished goods in transit of `336.55 Million (March 31, 2018 `327.38 Million)] 1,446.87 1,398.12
Stores and spares [Includes stores and spares in transit of `0.43 Million (March 31, 2018 `0.27 Million)] 465.26 433.54
Loose tools [Includes loose tools in transit of Nil (March 31, 2018 `2.81 Million)] 325.23 194.16
Packing material 36.07 31.41
Financial Statements - Consolidated
Notes to the consolidated financial statements for the year ended March 31, 2019

Annual Report 2018-19 191
(`in million)
As at March31, 2019
As at March31, 2018
Renewable energy certificates - 0.75
Total Inventories 9,199.24 8,640.97
11 Current investment
Investment in mutual funds (valued at fair value through profit or loss) (quoted)
Reliance Liquid Fund-Direct Plan Growth Plan - Growth Option (31 March 2019: 23,120.099 units; 31 March 2018: Nil units) 105.47 -
Reliance Fixed Horizon Fund - XII - Series 2-Direct Growth Plan (31 March 2019: 2,000,000 units ; 31 March 2018 : Nil units) 20.09 -
Reliance Monthly Interval Fund - Series II-Direct Growth Plan Growth Option (31 March 2019: 434,453.935 units ; 31 March 2018 : 434,453.935 units)
10.80 10.06
Reliance Liquid Fund - Series IV Direct Growth Plan (March 31, 2019: Nil Units and March 31, 2018: 2,000,000 Units) - 20.16
LIC MF Liquid Fund - Direct Plan - Growth (March 31, 2019: 14,769.292 units and March 31, 2018: 31.777 Units) 50.05 0.10
Aggregate fair value of quoted investment 186.41 30.32
12 Trade receivables
Current
Trade receivables 13,329.53 13,873.98
Receivable from related parties (refer note 49) 165.60 153.36
Total 13,495.13 14,027.34
Break-up of trade receivables
Unsecured, considered good* 13,495.13 14,027.34
Trade Receivables credit impaired 136.60 151.77
Total 13,631.73 14,179.11
Less: Impairment Allowance (Allowance for doubtful debts) (136.60) (151.77)
Total 13,495.13 14,027.34
* There are no trade receivables which have significant increase in credit risk.
Non-Current Portion - -
Current Portion 13,495.13 14,027.34
Credit periodTrade receivables are non-interest bearing and are generally on terms of 45 to 120 days.No trade or other receivable are due from directors or other officers of the company either severally or jointly with any other person. Nor any trade or other receivable are due from firms or private companies respectively in which any director is a partner, a director or a member.Transferred receivablesThe carrying amounts of trade receivables include receivable which are subject to a factoring arrangement. Under the arrangement, the Group has transferred the relevant receivables to the factor in exchange for cash and is prevented from selling or pledging the receivables. However, the Group has retained credit risk and late payment risk. The Group therefore continues to recognise the transferred assets in its balance sheet. The amount repayable under the factoring agreement is presented as secured/unsecured borrowing.
The relevant carrying amounts are as follows:
Total transferred receivables (Refer note 24) 283.50 1,874.28
13(a) Cash and cash equivalents
Cash in hand 2.26 2.19
Bank balances
In current accounts 1,517.69 3,260.30
Deposit with maturity of less than three months 88.47 3.29
Total Cash and cash equivalents 1,608.42 3,265.78
There are no repatriation restrictions with regard to cash and cash equivalents as at the end of the reporting period and prior period
Financial Statements - Consolidated
Notes to the consolidated financial statements for the year ended March 31, 2019

192 Varroc Engineering Limited
(`in million)
As at March31, 2019
As at March31, 2018
13(b) Other bank balances
Deposits with original maturity more than three months but less than twelve months 25.86 23.59
Total other bank balances 25.86 23.59
14 Current - Loans
Unsecured, considered good
Loans to employees 11.33 9.12
Security deposit 168.15 30.95
Total Current loans 179.48 40.07
15 Other financial assets (Current)
Derivative instruments at fair value through OCI (Cash Flow Hedge)
Foreign exchange forward contracts and cross currency interest swaps 17.55 38.25
Non-derivative financial assets at amortised cost
Interest receivable other than on fixed deposits 1.15 0.65
Initial Public Offering expenses receivable* - 136.98
Others 0.02 46.68
Total other current financial assets 18.72 222.56
*During the previous year, Initial Public Offer expenses receivable comprise share issue expenses incurred in connection with the proposed Initial Public offer (IPO) by way of offer for sale by existing shareholders of the Company. These receivables include fees paid to stock exchanges, SEBI, lawyers, auditors etc., in connection with the IPO of the Company. As per the offer agreement between the Company and the selling shareholders, upon successful completion of the Offer, these expenses will be reimbursed by the selling shareholders in proportion to their respective Offered Shares sold pursuant to the Offer. Accordingly, the Company has classified these expenses as receivable from selling shareholders under Other Financial Assets. Initial Public Offer expenses includes receivable from related parties refer note 49. subsequently the above amount has been received from selling shareholders after listing date i.e. July 6, 2018.
16 Other current assets
Advance to suppliers 2,201.76 558.12
Contract assets * 4,776.44 2,390.21
Prepaid expenses 397.82 387.59
Export and other incentives 101.49 13.09
Balance with government authorities 963.69 716.77
Government grant receivable 229.04 141.58
Customer prepayments 186.23 54.27
Insurance claim receivable - 0.02
Others 101.73 92.10
Total other current assets 8,958.20 4,353.75
* Pertains to revenue recognised in respect of tooling contracts
17 Share capital
Number of Shares
Authorized:As at March
31, 2019As at March
31, 2018
Equity shares of `1 each (previous year `1 each) 25,00,00,000 25,00,00,000 250.00 250.00
Preference shares of `1 each (previous year `1 each) 25,00,00,000 25,00,00,000 250.00 250.00
500.00 500.00
Financial Statements - Consolidated
Notes to the consolidated financial statements for the year ended March 31, 2019

Annual Report 2018-19 193
(`in million)
As at March31, 2019
As at March31, 2018
Issued, subscribed and paid-up:
Equity shares of `1 each (previous year `1 each) fully paid up 13,48,11,530 12,31,27,760 134.81 123.13
0.0001% Series "C"compulsorily convertible preference shares ("Series C CCPS") of `1 each (previous year `1 each) fully paid up
- 1,16,83,770 - 11.68
134.81 134.81
(a) Movement in share capital Nos ̀ in Million Nos ̀ in Million
As atMarch
31, 2019
As atMarch
31, 2019
As atMarch
31, 2018
As atMarch
31, 2018Equity shares
Outstanding at the beginning of the year 12,31,27,760 123.13 1,14,60,417 114.61
Add: 0.001% series C CCPS 11,683,770 shares converted into equity shares 1,16,83,770 11.68
Add:- 0.0001% series B CCPS 8,52,359 shares converted into equity shares - 8,52,359 8.52
Outstanding number of shares before considering the impact of sub division of equity shares 13,48,11,530 134.81 1,23,12,776 123.13
Adjusted closing number of shares on account of sub-division of equity shares (Refer Note 17 (e)) 12,31,27,760
Outstanding at the end of the year 13,48,11,530 134.81 12,31,27,760 123.13
Preference shares
Outstanding at the beginning of the year 1,16,83,770 11.68 20,20,736 20.20
Add/(Less) :- 0.0001% Series B CCPS 8.52359 shares converted in to equity shares during the year (8,52,359) (8.52)
Less:- 0.0001% series C CCPS 11,683,770 shares converted into equity shares during the year (1,16,83,770) (11.68)
Outstanding number of shares before considering the impact of sub division of equity shares - - 11,68,377 11.68
Adjusted closing number of shares on account of sub-division of equity shares (Refer Note 17 (e)) 1,16,83,770 11.68
Outstanding at the end of the year - - 1,16,83,770 11.68
(b) Rights, preferences and restrictions attached to equity sharesThe Company has equity shares having a par value of `1 per share (previous year `1- per share). In the event of liquidation, the equity shareholders are eligible to receive the remaining assets of the Company after distribution of all preferential amounts, in proportion to their shareholding. The dividend proposed by the Board of Directors is subject to the approval of the shareholders in the ensuing Annual General Meeting, except in case of interim dividend.
(c) Bonus issue of series C CCPSDuring the year ended March 31, 2017, the Company issued and allotted 1,168,377 Series C CCPS of ̀ 10/- each fully paid as bonus to eligible equity shareholders of the Company in the ratio of 57 fully paid up Series C CCPS for every 469 equity shares of the Company held by them. The Series C CCPS were non-cumulative, participating preference shares, mandatorily and fully convertible into equity shares on occurrence of the trigger event. The holder of each Series C CCPS were entitled to preferential dividend at the rate of 0.0001% per year on the face value. The Series C CCPS were entitled to participate, on a pari passu basis with Equity Shares, in any dividend distribution to the holders of Equity Shares on an ‘as if converted’ basis. For the purpose of dividend distribution, the Series C CCPS prior to their conversion would constitute 1.3% of the Equity Share Capital on a fully diluted basis. Under Ind AS, Series C CCPS were classified as an equity instrument based on the terms of the agreement and trigger event, which is earlier of:(i) the date on which the Company files a red herring prospectus with the SEBI for undertaking an IPO or (ii) IPO Veto Date; (iii) the Conversion Deadline, as defined in the terms of the agreement.
(d) During the previous year, the Company, pursuant to the provisions of Section 66 of the Companies Act, 2013 and the rules made thereunder, had filed a petition for reduction of 852,349 equity shares of `10 each held by wholly owned subsidiary Varroc Polymers Private Limited (VPPL) without any consideration. This scheme was approved by the National Company Law Tribunal (NCLT) and was filed with the Registrar of Companies (ROC) on December 18, 2017. The ROC registered the order on January 15, 2018 and the Company took on record this transaction at the Board Meeting on January 16, 2018.
(e) During the previous year, face value per Equity Share and Preference Share have been sub divided from `10 to `1. Further authorised share capital of the Company was reclassified from `500 Million consisting of `165 Million (165,000,000 Equity Shares of `1/- each) and `335 Million (335,000,000 Preference Shares of `1/- each) to `250 Million (250,000,000 Equity Shares of `1/- each) and `250 Million (Consisting of 250,000,000 Preference Shares of `1/- each).
Financial Statements - Consolidated
Notes to the consolidated financial statements for the year ended March 31, 2019

194 Varroc Engineering Limited
(`in million)
As at March31, 2019
As at March31, 2018
(f) Details of shares held by shareholders holding more than 5% of the aggregate shares in the Company
As at March 31, 2019 As at March 31, 2018
Name of the Shareholder
Numbersof shares % of
shareholding
Numbersof shares % of
shareholdingFace value `1
Face value `1
Equity Shares
Mr. Tarang Jain 6,07,29,800 45.05% 5,07,98,590 41.26%
TJ Holdings Trust 3,38,50,000 25.11% 3,38,50,000 27.49%
Omega TC Holdings PTE LTD - Nil 1,69,17,130 13.74%
Naresh Chandra Holdings Trust 1,00,00,000 7.42% 1,00,00,000 8.12%
Suman Jain Holdings Trust 1,00,00,000 7.42% 1,00,00,000 8.12%
Preference Shares
Mr. Tarang Jain - - 1,16,83,770 100.00%
(g) Aggregate number of bonus shares issued during the five years immediately preceding March 31, 2019 No of Shares
0.0001% Series B CCPS and Series C CCPS allotted as fully paid up bonus shares out of securities premium during the year ended March 31, 2017.
20,20,736
The Company during the preceding 5 years:i. Has not allotted shares pursuant to contracts without payment received in cash. ii. Has not issued shares by way of bonus shares except as mentioned above. iii. Has not bought back any shares.
18 Other equity
Reserves and surplus
Retained earnings
Balance at the beginning of the year 9,639.98 5,135.42
Less:- Impact of change in accounting policy (refer note 2.1) (689.92) -
Add:- Profit for the year 4,463.20 4,502.58
Less:- Remeasurement of post-employment benefit obligation (net of tax) (46.84) (4.89)
Less:- Dividend paid (including dividend distribution tax `2.25 Million (March 31,2018 `12.52 Million)) (8.39) (74.08)
Add: Adjustment on account of capital reduction (Refer note 17 (d)) - 205.95
Less:- Transfer to debenture redemption reserve - (125.00)
Balance at the end of the year 13,358.03 9,639.98
General reserve
Balance at the beginning of the year 4,194.73 3,747.14
Add: Adjustment on account of capital reduction (Refer note 17 (d)) - 447.59
Balance at end of the year 4,194.73 4,194.73
Debenture redemption reserve
Balance at the beginning of the year 325.00 200.00
Add:-Transfer from retained earnings - 125.00
Balance at the end of the year 325.00 325.00
Financial Statements - Consolidated
Notes to the consolidated financial statements for the year ended March 31, 2019

Annual Report 2018-19 195
(`in million)
As at March31, 2019
As at March31, 2018
Capital Redemption Reserve
Balance at the beginning and at end of the year 11.30 11.30
Capital Reserve
Balance at the beginning of the year 5,335.08 6,095.34
Add: Adjustment on account of capital reduction (Refer note 17 (d)) - (760.26)
Balance at the end of the year 5,335.08 5,335.08
Statutory reserves
Balance as at beginning of the year 410.80 365.50
Add: Adjustment on account of capital reduction (Refer note 17 (d)) - 45.30
Balance at the end of the year 410.80 410.80
Securities premium
Balance at the beginning of the year 6,190.08 6,128.66
Add: Adjustment on account of capital reduction (Refer note 17 (d)) - 61.42
Balance at the end of the year 6,190.08 6,190.08
Total Reserves and surplus 29,825.02 26,106.97
Other reserves
Foreign Currency Translation Reserve
Balance at the beginning of the year 2,040.53 44.52
Add / (Less) : Exchange differences in translating the financial statements of foreign operations (1,045.68) 1,996.01
Add / (Less) : Impact of change in accounting policy (refer note 2.1) (77.01) -
Balance at the end of the year 917.84 2,040.53
Cash flow hedge reserve
Balance at the beginning of the year (2.26) (8.94)
Gain on changes in fair value of hedging instruments 45.82 12.02
Income tax relating to gains/loss reclassified to profit and loss (16.01) (4.20)
Reclassification to Statement of Profit and Loss (34.20) (1.14)
Balance at the end of the year (6.65) (2.26)
Total other reserves 911.19 2,038.27
Total other equity 30,736.21 28,145.24
Nature and purpose of other reservesGeneral reserve General reserve is the retained earning of the Group which is kept aside out of the Group's profits to meet future (known or unknown) obligations. Debenture redemption reserve The Group is required to create a debenture redemption reserve in respect of Indian entities out of the profits which is available for payment of dividend for the purpose of redemption of debentures. Capital redemption reserve Capital redemption reserve is not available for distribution as dividend. Capital Reserve Capital reserve is not available for distribution as dividend.
Statutory reserves Statutory reserves are created based on statutory requirements of respective region and hence is not available for distribution as dividend.
Financial Statements - Consolidated
Notes to the consolidated financial statements for the year ended March 31, 2019

196 Varroc Engineering Limited
(`in million)
As at March31, 2019
As at March31, 2018
Securities premium Securities premium is used to record the premium on issue of shares. It is utilised in accordance with the provisions of the Companies Act, 2013. Foreign Currency Translation Reserve Exchange differences arising on translation of foreign operations are recognised in other comprehensive income and accumulated in a separate reserve within equity. The cumulative amount is reclassified to profit or loss when the net investment is disposed-off. Cash flow hedge reserve The Group uses hedging instruments to hedge its exposure to movements in foreign exchange rates and interest rates, which are designated as cash flow hedges. To the extent these hedges are effective, the change in fair value of the hedging instrument is recognised in the cash flow hedge reserve. Amounts recognised in cash flow hedge reserve are reclassified to profit or loss when the hedged item affects profit or loss.
19 Non current - Borrowings
Secured
Debentures
500 (31 March 2018: 1,300) Non convertible debentures of `1,000,000 each 500.00 1,300.00
Term loans
From banks
Rupee loans from banks 1,245.10 414.17
Foreign currency loans from bank 2,508.35 3,907.55
From Financial Institutions
Rupee loans from financial institution 121.73 296.99
Finance lease obligations (Refer note 52) 79.40 122.93
Buyers credit (capital nature) - 145.35
Unsecured
Deferred sales tax loan 117.38 174.47
Total non current borrowing 4,571.96 6,361.46
Maturity profile of non current borrowings
ParticularsEffective Interest
Rate
Current (refer
note 26)
Non CurrentTotal of
Non current2020-21 2021-22 2022-23 2023-24More than
5 years
Rupee loans from banks and financial institutions
8% to 10% 389.26 496.71 377.06 305.56 187.50 - 1,366.83
Foreign currency loans from bank (Indian entities)
9% to 11%(fully hedged)
422.70 219.84 13.00 - - - 232.83
Foreign currency loans from bank (Overseas entities)
See note below
6,066.04 539.21 729.69 252.45 154.96 599.22 2,275.52
Debentures8.0% to
8.1% 800.00 - - 500.00 - - 500.00
Deferred Sales Tax Loan 57.10 44.46 33.28 20.44 14.04 5.16 117.38
Note: Czech Republic : EURIBOR (1M/3M)+0.9% to 1.4% ; Morocco: EURIBOR (6M)+1.6% ; Netherlands: EURIBOR (3M/6M) + 1.6% to 1.75% ; Italy EURIBOR (3M/6M/12M)+0,95% to 3%
Nature of SecurityIndian entities1) Secured borrowings of entities based in India are secured by way of first charge on pari-passu basis on movable and immovable fixed assets of these entities, both present and future, subject to certain exclusions.
2) a) Foreign currency loan ( FCNR loan USD 0.72 crores) from Citi Bank N.A. is secured by first pari-passu charge on movable fixed assets of Crankshaft unit both present and future located at M-191/3, MIDC, Waluj, Aurangabad - 431136.
b) Foreign currency loan ( FCNR loan USD 0.22 crores ) from Citi Bank N.A. is secured by first pari-passu charge on movable fixed assets of solar unit both present and future located at Sakri, Dhule.
Financial Statements - Consolidated
Notes to the consolidated financial statements for the year ended March 31, 2019

Annual Report 2018-19 197
(`in million)
As at March31, 2019
As at March31, 2018
3) a) Rupee Term loan from financial institution of `75 Crores availed from Bajaj Finance Limited is secured by way of second charge on movable fixed assets of the Company both present and future.
b) Rupee Term loan from financial institution of `50 crores availed from Bajaj Finance Limited is secured by first pari-passu charge on movable fixed assets both present and future of crankshaft unit located at M-191/3 MIDC, Waluj, Aurangabad - 431136.
c) Rupee Term Loan from Kotak Mahindra Bank Limited is secured by way of first pari passu charge on movable fixed assets both present and future of unit V located at L-6/2, MIDC, Waluj, Aurangabad -431136.
d) 8.10% Non convertible debentures from Kotak Bank Limited is secured by way of first pari passu charge on movable fixed assets both present and future of unit III located at B-24 & 25, MIDC, Chakan, Pune - 410501 and unit VII (Valves and Forging) located at L-4, MIDC, Waluj, Aurangabad - 431136.
Overseas entities
1) Secured borrowings of the foreign entities located in Morroco and Czech Republic are secured by way of charge on tangible and Intangible assets of the respective entities. 2) In case of Foreign subsidiaries located in Netherlands, loans are secured by way of Standby letter of credit issued by Indian banks which is secured by certain assets specified in point (1) above and corporate gurantee given by Varroc Engineering Limited. 3) In case of Foreign subsidiary located in Italy, loans are secured by way of specific charge on assets purchased from these loans
20 Non current - Other financial liabilities
Security deposits - 5.64
Payable for capital goods 0.40 0.39
Employee benefits payable 126.77 70.11
Redemption liability related to non controlling interest - 46.67
Total non-current other financial liabilities 127.17 122.81
21 Non current - Provisions
Provision for employee benefits
Employee defined benefit obligation (refer note 42) 616.48 600.55
Compensated absences 65.62 59.53
Others
Provision for warranties* 261.37 293.05
Others# 34.72 49.29
Total non current provisions 978.19 1,002.42
Warranties Others
March 31, 2019
March 31,2018
March 31, 2019
March 31, 2018
Balance as at the beginning of the year 531.13 342.42 89.89 290.64
Additions 458.64 364.76 20.39 60.22
Utilization/Reversed during the year (414.57) (231.74) (22.04) (292.71)
Foreign exchange translation difference (17.06) 55.69 (1.41) 31.74
Balance as at the end of the year 558.14 531.13 86.83 89.89
Current Portion 296.77 238.08 52.11 40.60
Non Current Portion 261.37 293.05 34.72 49.29
Total 558.14 531.13 86.83 89.89
Financial Statements - Consolidated
Notes to the consolidated financial statements for the year ended March 31, 2019

198 Varroc Engineering Limited
(`in million)
As at March31, 2019
As at March31, 2018
* Provision for warranties :- The Group provides warranties on applicable products, for their satisfactory performance during the warranty period as per the contracts with buyers. Provision for warranty claims arising out of such obligation is made based on such warranty period. The impact of discounting of these provisions is not material.
# Other provision includes provision for coupon schemes and customer claims related to tooling contract .These claims are expected to be settled within 2-3 years. Management estimates these provision based on historical claim information and any recent trends. The impact of discounting of these provisions is not material.
22 Deferred tax
Deferred tax liabilities (Gross)
Depreciation and amortization 1,897.35 1,669.19
Revenue recognised under percentage of completion method 82.65 105.24
Government grants 71.30 25.67
Others 116.56 12.93
2,167.86 1,813.03
Offset with deferred tax asset to the extent they relate to same governing law (1,254.55) (1,304.16)
Deferred tax liabilities (net) 913.31 508.87
Deferred tax assets (Gross)
Revenue recognised under percentage of completion method 101.37 -
Expenses allowable under Income Tax on payment basis 454.41 297.04
Provision for doubtful debts and advances 41.07 13.01
Unabsorbed tax depreciation and losses 160.70 169.31
Provision for employee benefits 238.69 234.50
Investment Allowance * 1,453.23 1,006.29
MAT Credit Entitlement 460.01 585.46
Others 100.09 28.54
3,009.57 2,334.15
Offset with deferred tax liabilities to the extent they relate to same governing law (1,254.55) (1,304.16)
Deferred tax Assets (net) 1,755.02 1,030.00
* pertains to deferred tax asset recognised on tax incentive on eligible investments by the subsidiary in Czech Republic which can be utilised against future taxable income over the next 10 years.
Movements in deferred tax assets
Opening deferred tax assets (net) 521.13 0.27
Recognised in the Statement of Profit and Loss 455.81 543.19
Exchange Differences (30.53) 71.07
Charged to other comprehensive income (27.61) (16.07)
Effect of change in accounting policy (refer note 2.1) 188.54 -
Deferred tax liability acquired on business combination (refer note 54) (283.42) (77.33)
Closing deferred tax assets (net) 841.71 521.13
23 Other non current liabilities
Advance received from customer 10.26 17.87
Deferred government grant (refer note 28) 317.96 292.46
Total other non current liabilities 328.22 310.33
Financial Statements - Consolidated
Notes to the consolidated financial statements for the year ended March 31, 2019

Annual Report 2018-19 199
(`in million)
As at March31, 2019
As at March31, 2018
24 Current borrowingsMaturity
DateTerms of
RepaymentInterest
rate
Secured
Cash Credit Various Various8% to
11.80% 153.13 148.73
Working capital facilities
Working Capital Loans Various Various0.85% to
7.7% 10,275.00 728.49
Factored Receivables (Refer note 12) Various Various 1.5% to 6% 283.50 359.48
Unsecured
Factored Receivables (Refer note 12) Various Various 8.30% - 1,514.80
Pre-shipment credit in foreign currency (PCFC) Various Various 5.15% 200.00 47.77
Short term loan from financial institutions Various Various 8.45% 20.00 640.00
Commercial Papers Various Various6.75%-7.93%
1,083.02 -
Total current borrowings 12,014.65 3,439.27
Working capital facilities availed from banks, are secured by charge by way of hypothecation of stocks of raw materials, work in process, finished goods, consumables, stores and spares, packing materials, receivables and mortgage of certain land and buildings of the group.
Net DebtMarch
31, 2019March
31, 2018
Cash and Cash equivalents (refer note 13 (a) 1,455.29 3,117.05
Liquid Investments 186.41 30.32
Current borrowings (11,861.52) (3,290.54)
Non-current borrowings (includes current maturities of non-current borrowings (refer note 19 and 26 ) (12,378.37) (8,550.91)
Interest accrued but not due (refer note 26) (71.04) (52.26)
Net debt (22,669.23) (8,746.34)
Reconciliation of Net Debt for the year ended March 31, 2019
ParticularsAs on
April 1, 2018
CashflowsAcquired on purchase of
business
Interest Expenses
Interest Paid
Cash flow hedge
Reserve
Translation Difference
Gain on sale of
investments
As at March 31,
2019
Non-current borrowings
8,550.91 3,568.87 373.46 (34.20) 149.06 12,608.10
Liquid Investment 30.32 149.18 6.91 186.41
Current borrowings 3,290.54 8,681.79 110.81 12,083.14
Cash and cash equivalent
3,117.05 (1,543.12) (118.64) 1,455.29
Interest accrued but not due
52.26 968.45 (952.83) 3.16 71.04
Reconciliation of Net Debt for the year ended March 31, 2018
ParticularsAs on April
1, 2017Cashflows
Interest Expenses
InterestPaid
Cash flow hedge
Reserve
Translation Difference
Gain on sale of
investments
As at March 31,
2018
Non-current borrowings 9,138.54 (1,318.07) 730.44 8,550.91
Liquid Investment - 27.62 2.70 30.32
Current borrowings 5,544.84 (2,980.43) 1.14 724.99 3,290.54
Cash and cash equivalent 3,053.21 (496.19) 560.04 3,117.06
Interest accrued but not due 49.74 861.70 859.18 52.26
Financial Statements - Consolidated
Notes to the consolidated financial statements for the year ended March 31, 2019

200 Varroc Engineering Limited
(`in million)
As at March31, 2019
As at March31, 2018
25 Trade payables
Total outstanding dues of micro enterprises and small enterprises* (refer note 41) 658.70 27.22
Total outstanding dues other than micro enterprises and small enterprises
Trade payables to Related Parties (refer note 49) 51.91 31.52
Others 19,611.41 19,735.05
Total trade payables 20,322.02 19,793.79
* Pertains to Indian Entities
26 Current - Other financial liabilities
Current maturities of non-current borrowings (refer note 19)
Debentures
800 (31 March 2018: Nil) Non convertible debentures of `1,000,000 each 800.00 -
Term loans
From banks
Rupee loans from banks 213.62 171.38
Foreign currency loans from banks* 6,488.74 1,734.18
From financial institution
Rupee loans from financial institution 175.64 159.44
Deferred sales tax loan 57.10 65.48
Finance lease obligations (refer note 52) 71.31 58.97
7,806.41 2,189.45
Interest accrued but not due on borrowings 71.04 52.26
Payable for capital goods 1,732.85 1,468.21
Customer security deposits 49.43 36.75
Employee benefits payable 1,726.72 1,844.56
Financial liabilities at fair value through OCI (cash flow hedges)
Cross currency interest rate swap 6.98 48.80
Redemption liability related to non controlling interest 25.51 143.84
Others - 1.50
Total other financial liabilities 11,418.94 5,785.37
* Includes amount of `3707.58 Million classified as current as one of the debt covenants has not been complied as at March 31, 2019.
27 Current - Provisions
Provision for Employee benefits
Employee defined benefit obligation (refer note 42) 24.19 28.36
Compensated absences 8.95 9.13
Others
Provision for warranties (refer note 21) 296.77 238.08
Others (refere note 21) 52.11 40.60
Total current provision 382.02 316.17
Financial Statements - Consolidated
Notes to the consolidated financial statements for the year ended March 31, 2019
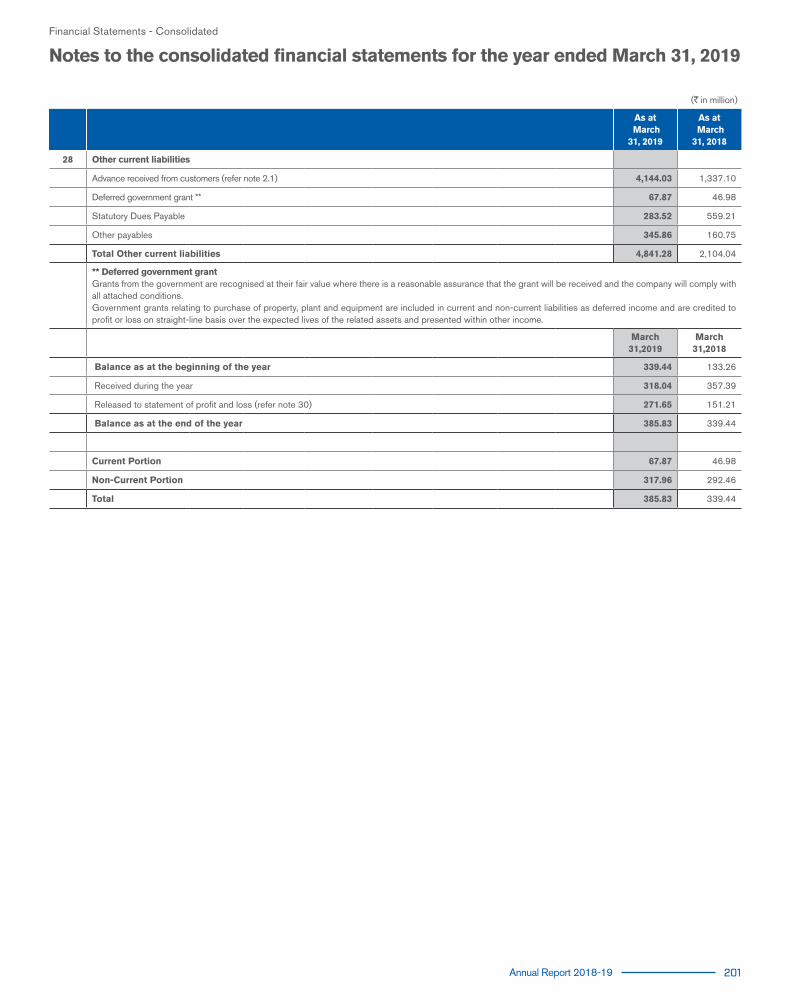
Annual Report 2018-19 201
(`in million)
As at March31, 2019
As at March31, 2018
28 Other current liabilities
Advance received from customers (refer note 2.1) 4,144.03 1,337.10
Deferred government grant ** 67.87 46.98
Statutory Dues Payable 283.52 559.21
Other payables 345.86 160.75
Total Other current liabilities 4,841.28 2,104.04
** Deferred government grantGrants from the government are recognised at their fair value where there is a reasonable assurance that the grant will be received and the company will comply with all attached conditions.Government grants relating to purchase of property, plant and equipment are included in current and non-current liabilities as deferred income and are credited to profit or loss on straight-line basis over the expected lives of the related assets and presented within other income.
March 31,2019
March 31,2018
Balance as at the beginning of the year 339.44 133.26
Received during the year 318.04 357.39
Released to statement of profit and loss (refer note 30) 271.65 151.21
Balance as at the end of the year 385.83 339.44
Current Portion 67.87 46.98
Non-Current Portion 317.96 292.46
Total 385.83 339.44
Financial Statements - Consolidated
Notes to the consolidated financial statements for the year ended March 31, 2019
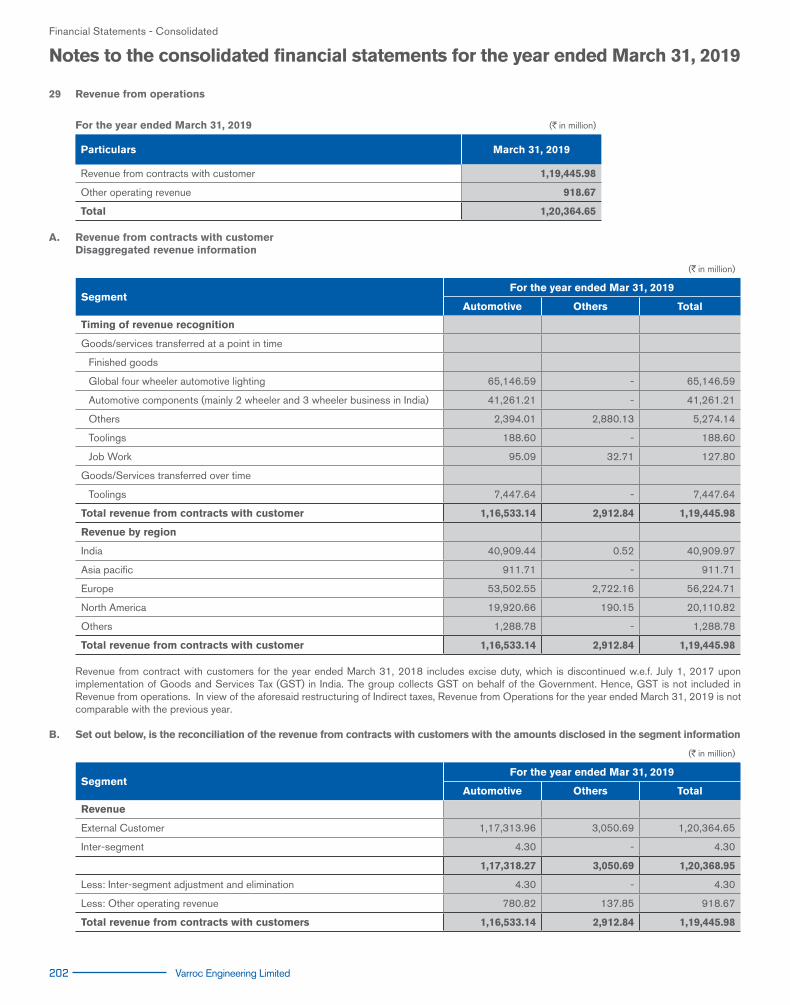
202 Varroc Engineering Limited
29 Revenue from operations
For the year ended March 31, 2019 (`in million)
Particulars March 31, 2019
Revenue from contracts with customer 1,19,445.98
Other operating revenue 918.67
Total 1,20,364.65 A. Revenue from contracts with customer Disaggregated revenue information
(`in million)
SegmentFor the year ended Mar 31, 2019
Automotive Others Total
Timing of revenue recognition
Goods/services transferred at a point in time
Finished goods
Global four wheeler automotive lighting 65,146.59 - 65,146.59
Automotive components (mainly 2 wheeler and 3 wheeler business in India) 41,261.21 - 41,261.21
Others 2,394.01 2,880.13 5,274.14
Toolings 188.60 - 188.60
Job Work 95.09 32.71 127.80
Goods/Services transferred over time
Toolings 7,447.64 - 7,447.64
Total revenue from contracts with customer 1,16,533.14 2,912.84 1,19,445.98
Revenue by region
India 40,909.44 0.52 40,909.97
Asia pacific 911.71 - 911.71
Europe 53,502.55 2,722.16 56,224.71
North America 19,920.66 190.15 20,110.82
Others 1,288.78 - 1,288.78
Total revenue from contracts with customer 1,16,533.14 2,912.84 1,19,445.98
Revenue from contract with customers for the year ended March 31, 2018 includes excise duty, which is discontinued w.e.f. July 1, 2017 upon implementation of Goods and Services Tax (GST) in India. The group collects GST on behalf of the Government. Hence, GST is not included in Revenue from operations. In view of the aforesaid restructuring of Indirect taxes, Revenue from Operations for the year ended March 31, 2019 is not comparable with the previous year.
B. Set out below, is the reconciliation of the revenue from contracts with customers with the amounts disclosed in the segment information
(`in million)
SegmentFor the year ended Mar 31, 2019
Automotive Others Total
Revenue
External Customer 1,17,313.96 3,050.69 1,20,364.65
Inter-segment 4.30 - 4.30
1,17,318.27 3,050.69 1,20,368.95
Less: Inter-segment adjustment and elimination 4.30 - 4.30
Less: Other operating revenue 780.82 137.85 918.67
Total revenue from contracts with customers 1,16,533.14 2,912.84 1,19,445.98
Financial Statements - Consolidated
Notes to the consolidated financial statements for the year ended March 31, 2019

Annual Report 2018-19 203
Financial Statements - Consolidated
C. Contract balances
Particulars March 31, 2019
Trade receivables 13,495.13
Contract asset 4,951.65
Contract liabilities 4,154.29 Trade receivables are non-interest bearing and are generally on terms of 30 to 120 days. The acquisition of a subsidiary resulted in increase in trade
receivables of ` 406.63 Million in 2018-19 (refer note 54(a))
A contract asset is the right to consideration in exchange for goods or services transferred to the customer. If the Group performs by transferring goods or services to a customer before the customer pays consideration or before payment is due, a contract asset is recognised for the earned consideration that is conditional.
Contract liabilities include advances received from customers for performing engineering design and development services. The outstanding balances of these accounts increased in 2018-19 due to the continuous increase in the Group’s customer base.
Set out below is the amount of revenue recognised from:
Particulars March 31, 2019
Amount of revenue recognised from amounts included in contract liabilities at the beginning of the year 1532.56
E. Reconciling the amount of revenue recognised in the statement of profit and loss with the contracted price
(`in million)
Particulars March 31, 2019
Revenue as per contracted price 1,19,619.05
Adjustments
Discount (114.86)
Amortisation of customer prepayment (58.2)
Revenue from contract with customers 1,19,445.98
F. Performance obligation
Revenue from contracts with customers include revenue from finished goods, tooling and job work services.
Information about the above Group’s performance obligations are summarised below:
Finished goods: For the sale of finished goods the performance obligation is generally satisfied upon its delivery and payment is generally due within 30 to 120 days
from delivery. Revenue from the sale of goods is measured at the fair value of the consideration received or receivable, net of returns and allowances, trade discounts and volume rebates.
The Group provides normal warranty provisions on some of its products sold, in line with the industry practice. The Group considers that the contractual promise made to the automaker in the form of warranties for the parts supplied does not meet the definition of separate performance obligation as it does not give rise to additional service.
Product development/engineering services are considered as related to sale of parts rather than a separate performance obligation. As a result, revenue from engineering services is recognised over the period of production from the date of start of production. Costs incurred in respect of providing engineering services are recognised as intangible assets and amortised over the period of production from the date of start of production. Payments received from customers in respect of product development/engineering services are presented as contract liabilities.
Supply of toolings Development of toolings for the customers has been identified by the group to be a separate performance obligation. Further, the group has determined
that the performance obligation in respect of development of toolings primarily pertaining to global automotive lighting business is generally satisfied over time. For other tooling contracts, the perfomance obligation is satisfied at a point in time or over time based on the specific terms of the contract.
Notes to the consolidated financial statements for the year ended March 31, 2019

204 Varroc Engineering Limited
Job work revenue is recognised when the work is completed and billed to customer.
Other operating revenue (`in million)
Particulars For the period ended Mar 31, 2019
Scrap sales 419.67
Wind and solar power generation 111.14
Export Incentives 182.55
Royalty (refer note 49) 121.45
Others 83.86
Total other operating revenue 918.67
For the year ended March 31, 2018 (`in million)
Particulars For the period ended Mar 31, 2018
Revenue from operations
Sale of products
Finished goods 96,145.90
Sale of engineering services 1,650.58
Other operating revenue
Tooling revenue 4,383.05
Wind and solar power generation 106.30
Prototype sale 722.65
Job work receipts 157.05
Scrap sales 340.56
Export Incentives 82.65
Royalty (refer note 49) 153.63
Others 42.20
Total revenue from operations 1,03,784.57
Financial Statements - Consolidated
Notes to the consolidated financial statements for the year ended March 31, 2019

Annual Report 2018-19 205
(`in million)
For the yearended March
31, 2019
For the yearended March
31, 2018
30 Other income
Rent Income
- from Investment properties 37.93 32.50
- from Others 9.47 9.56
Dividend Income from equity investments carried at cost 0.01 0.02
Dividend Income from investments measured at fair value through profit or loss - 0.01
Interest Income
- from financial assets measured at amortised cost 1.36 2.62
- Others 11.62 8.52
Unwinding of discount on security deposit 1.94 1.49
Net gain on disposal of property, plant and equipment 40.91 -
Net gain on sale of investments 6.91 2.70
Government grants 271.65 151.21
Liabilities no longer required written back 124.54 27.38
Increase in surrender value of keyman insurance policy 110.04 -
Recovery of obsolete Material 93.88 18.96
Miscellaneous income 197.62 131.13
Total Other income 907.88 386.10
31 Cost of materials consumed
Raw material at the beginning of the year 4,625.24 3,860.99
Add:- On account of business acquisition (refer note 54) 259.02 26.49
Add: Purchases 75,590.48 64,864.93
80,474.74 68,752.41
Less: Raw material at the end of the year 4,457.35 4,625.24
Total cost of materials consumed 76,017.39 64,127.17
32 Changes in Inventories of work-in-progress and finished goods
Opening balance
Work-in-progress 1,957.75 1,795.04
Finished goods 1,398.12 1,257.07
Total opening balance 3,355.87 3,052.11
Add:- On account of business acquisition (refer note 54) - 3.45
Closing balance
Work-in-progress 2,468.46 1,957.75
Finished goods 1,446.87 1,398.12
Total closing balance 3,915.33 3,355.87
Total changes in inventories of work-in-progress and finished goods (559.46) (300.31)
33 Employee benefit expense
Salaries, wages and bonus (refer note 2.1) 11,620.22 10,374.59
Contribution to Gratuity and other funds (Refer Note 42) 1,068.18 939.66
Financial Statements - Consolidated
Notes to the consolidated financial statements for the year ended March 31, 2019
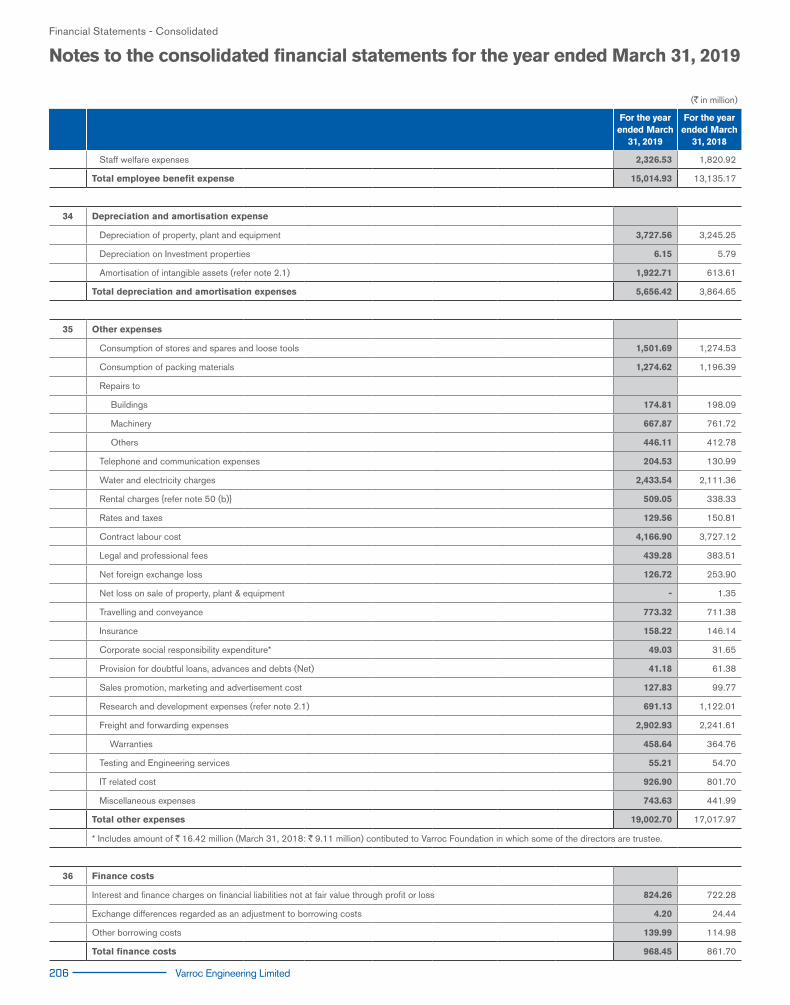
206 Varroc Engineering Limited
(`in million)
For the yearended March
31, 2019
For the yearended March
31, 2018
Staff welfare expenses 2,326.53 1,820.92
Total employee benefit expense 15,014.93 13,135.17
34 Depreciation and amortisation expense
Depreciation of property, plant and equipment 3,727.56 3,245.25
Depreciation on Investment properties 6.15 5.79
Amortisation of intangible assets (refer note 2.1) 1,922.71 613.61
Total depreciation and amortisation expenses 5,656.42 3,864.65
35 Other expenses
Consumption of stores and spares and loose tools 1,501.69 1,274.53
Consumption of packing materials 1,274.62 1,196.39
Repairs to
Buildings 174.81 198.09
Machinery 667.87 761.72
Others 446.11 412.78
Telephone and communication expenses 204.53 130.99
Water and electricity charges 2,433.54 2,111.36
Rental charges {refer note 50 (b)} 509.05 338.33
Rates and taxes 129.56 150.81
Contract labour cost 4,166.90 3,727.12
Legal and professional fees 439.28 383.51
Net foreign exchange loss 126.72 253.90
Net loss on sale of property, plant & equipment - 1.35
Travelling and conveyance 773.32 711.38
Insurance 158.22 146.14
Corporate social responsibility expenditure* 49.03 31.65
Provision for doubtful loans, advances and debts (Net) 41.18 61.38
Sales promotion, marketing and advertisement cost 127.83 99.77
Research and development expenses (refer note 2.1) 691.13 1,122.01
Freight and forwarding expenses 2,902.93 2,241.61
Warranties 458.64 364.76
Testing and Engineering services 55.21 54.70
IT related cost 926.90 801.70
Miscellaneous expenses 743.63 441.99
Total other expenses 19,002.70 17,017.97
* Includes amount of `16.42 million (March 31, 2018: `9.11 million) contibuted to Varroc Foundation in which some of the directors are trustee.
36 Finance costs
Interest and finance charges on financial liabilities not at fair value through profit or loss 824.26 722.28
Exchange differences regarded as an adjustment to borrowing costs 4.20 24.44
Other borrowing costs 139.99 114.98
Total finance costs 968.45 861.70
Financial Statements - Consolidated
Notes to the consolidated financial statements for the year ended March 31, 2019
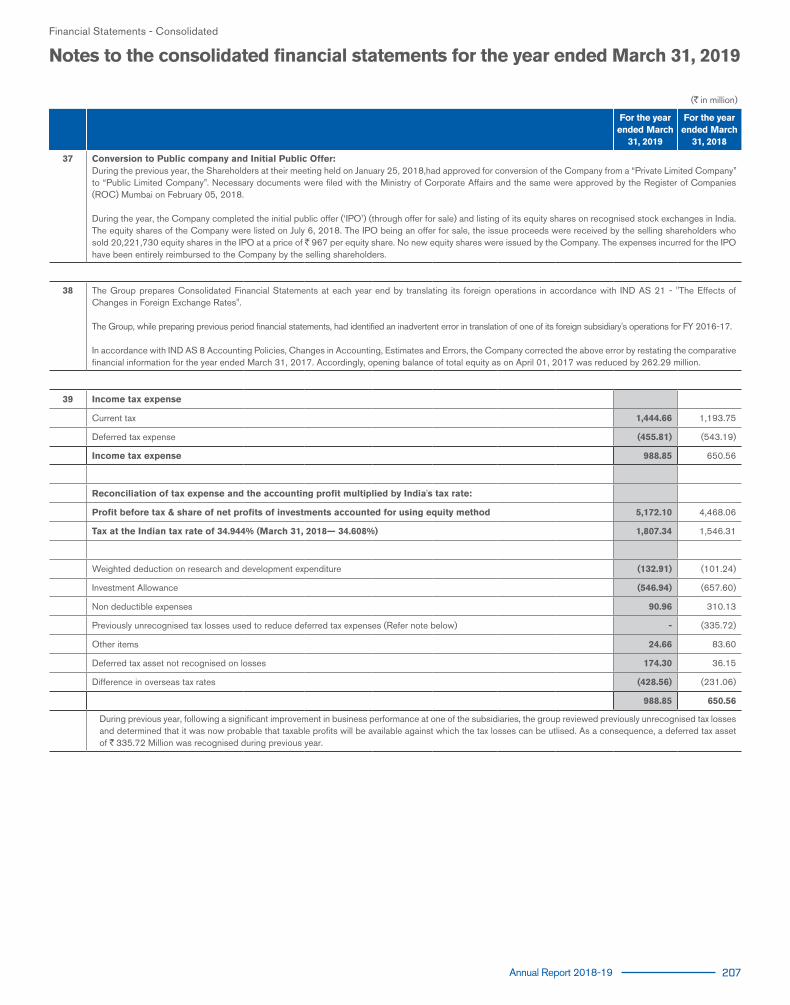
Annual Report 2018-19 207
(`in million)
For the yearended March
31, 2019
For the yearended March
31, 2018
37 Conversion to Public company and Initial Public Offer:During the previous year, the Shareholders at their meeting held on January 25, 2018,had approved for conversion of the Company from a “Private Limited Company” to “Public Limited Company”. Necessary documents were filed with the Ministry of Corporate Affairs and the same were approved by the Register of Companies (ROC) Mumbai on February 05, 2018.
During the year, the Company completed the initial public offer (‘IPO’) (through offer for sale) and listing of its equity shares on recognised stock exchanges in India. The equity shares of the Company were listed on July 6, 2018. The IPO being an offer for sale, the issue proceeds were received by the selling shareholders who sold 20,221,730 equity shares in the IPO at a price of `967 per equity share. No new equity shares were issued by the Company. The expenses incurred for the IPO have been entirely reimbursed to the Company by the selling shareholders.
38 The Group prepares Consolidated Financial Statements at each year end by translating its foreign operations in accordance with IND AS 21 - "The Effects of Changes in Foreign Exchange Rates".
The Group, while preparing previous period financial statements, had identified an inadvertent error in translation of one of its foreign subsidiary's operations for FY 2016-17.
In accordance with IND AS 8 Accounting Policies, Changes in Accounting, Estimates and Errors, the Company corrected the above error by restating the comparative financial information for the year ended March 31, 2017. Accordingly, opening balance of total equity as on April 01, 2017 was reduced by 262.29 million.
39 Income tax expense
Current tax 1,444.66 1,193.75
Deferred tax expense (455.81) (543.19)
Income tax expense 988.85 650.56
Reconciliation of tax expense and the accounting profit multiplied by India's tax rate:
Profit before tax & share of net profits of investments accounted for using equity method 5,172.10 4,468.06
Tax at the Indian tax rate of 34.944% (March 31, 2018— 34.608%) 1,807.34 1,546.31
Weighted deduction on research and development expenditure (132.91) (101.24)
Investment Allowance (546.94) (657.60)
Non deductible expenses 90.96 310.13
Previously unrecognised tax losses used to reduce deferred tax expenses (Refer note below) - (335.72)
Other items 24.66 83.60
Deferred tax asset not recognised on losses 174.30 36.15
Difference in overseas tax rates (428.56) (231.06)
988.85 650.56
During previous year, following a significant improvement in business performance at one of the subsidiaries, the group reviewed previously unrecognised tax lossesand determined that it was now probable that taxable profits will be available against which the tax losses can be utlised. As a consequence, a deferred tax asset of `335.72 Million was recognised during previous year.
Financial Statements - Consolidated
Notes to the consolidated financial statements for the year ended March 31, 2019

208 Varroc Engineering Limited
Note 40: Contingent liabilities
(`in million)
Contingent liabilities not provided for March 31, 2019 March 31, 2018
a) Claim against the group not acknowledged as debt
Disputed Excise and Service Tax matters 285.54 160.65
Income Tax matters 24.14 124.59
Sales Tax matters 5.30 43.11
b) Other money for which the Company is contingently liable/Employees Related Disputes 55.10 151.53
c) Export promotion capital goods (EPCG) Export obligation 203.58 342.69
d) Provident fund liability See note (ii)below
(i) The Group is contesting excise and service tax demand and the management, including its tax advisors, believe that it's position will likely be upheld in the appellate process. No expense has been accrued in the financial statements for the tax demands raised. The management believes that the ultimate outcome of this proceeding will not have a material adverse effect on the Group's financial position and results of the operations.
(ii) There are numerous interpretative issues relating to the Supreme Court (SC) judgement on PF dated 28th February, 2019. As a matter of caution, the company has made a provision on a prospective basis from the date of the SC order. The company will update its provision, on receiving further clarity on the subject.
Note 41: Dues to micro and small enterprises
The Group has certain dues to suppliers registered under Micro, Small and Medium Enterprises Development Act, 2006 (‘MSMED Act’). The disclosures pursuant to the said MSMED Act are as follows:
(`in million)
March 31, 2019 March 31, 2018
a) Principal amount due to suppliers registered under the MSMED Act and remaining unpaid as at year end 658.70 17.97
b) Interest due to suppliers registered under the MSMED Act and remaining unpaid as at year end 1.68 0.02
c) Principal amounts paid to suppliers registered under the MSMED Act, beyond the appointed day during the year
4,475.46 77.96
d) Interest paid, other than under Section 16 of MSMED Act, to suppliers registered under the MSMED Act, beyond the appointed day during the year
- -
e) Interest paid, under Section 16 of MSMED Act, to suppliers registered under the MSMED Act, beyond the appointed day during the year
- -
f) Interest due and payable towards suppliers registered under MSMED Act, for payments already made* 16.98 0.84
g) Further interest remaining due and payable for earlier years 9.03 8.39
* The above interest has not been provided for in the books of accounts.** The information has been given in respect of such vendors to the extend they could be indentified as Mirco and Small Enterprises on the basis of information available with the Group.
Note 42: Employee benefit obligation
A. Defined contribution plans:
The Group has certain defined contribution plans for Indian and Foreign entities. Contributions are made to provident fund in India for employees at the rate of 12% of basic salary as per regulations. The contributions are made to registered provident fund administered by the government. Contributions are made to defined contribution plans in foreign entities based on regulations of the respective region. The obligation of the group is limited to the amount contributed and it has no further contractual nor any constructive obligation. The expense recognised during the year towards defined contribution plan is as under:
The expense recognised during the year towards defind contribution plant of are as under:
(`in million)
March 31, 2019 March 31, 2018
(a) Indian Entities
(I) Contribution to Employees' provident fund 98.22 78.67
(II) Contribution to Employees' family pension fund 64.56 62.14
Total 162.78 140.81
Financial Statements - Consolidated
Notes to the consolidated financial statements for the year ended March 31, 2019

Annual Report 2018-19 209
(`in million)
March 31, 2019 March 31, 2018
(b) Foreign Entities
Contribution to defined employees contribution plan 146.27 106.24
146.27 106.24
B. Defined Benefit Plan (Gratuity) (Indian entities)
The Group provides for gratuity for employees in India as per the Payment of Gratuity Act, 1972. Employees who are in continuous service for a period of 5 years are eligible for gratuity. The amount of gratuity payable on retirement/termination is the employees last drawn basic salary plus Dearness Allowance per month computed proportionately for 15 days salary multiplied for the number of years of service. The gratuity plan is a funded plan and the Group makes contributions to recognised funds in India. The Group does not fully fund the liability and maintains a target level of funding to be maintained over a period of time based on estimations of expected gratuity payments.
The amounts recognised in the balance sheet and the movements in the net defined benefit obligation over the year are as follows:
(`in million)
ParticularsAs at
March 31, 2019As at
March 31, 2018
(a) Change in present value of benefit obligations
Liability at the beginning of the year 320.86 297.28
Service cost 53.00 60.81
Interest expense 24.51 20.34
Remeasurements - Actuarial (gains)/ losses (refer note (e) below) 30.01 (27.82)
Benefits paid (21.07) (29.75)
Liability at the end of the year 407.29 320.86
(b) Change in fair value of plan assets
Fair value of plan assets at the beginning of the year 307.19 262.72
Interest income 26.31 19.90
Remeasurements- Return on plan assets excluding amounts recognised in interest income (refer note (e) below)
(1.30) 0.23
Contributions 72.84 57.07
Mortality Charges and Taxes (3.32) (2.98)
Benefits paid (21.07) (29.75)
Fair value of plan assets at the end of the year 380.65 307.19
(c) The net liability disclosed above relates to funded plan is as follows:
ParticularsAs at
March 31, 2019As at
March 31, 2018
Present value of funded obligations 407.29 320.86
Fair value of plan assets 380.65 307.19
Deficit of funded plan 26.64 13.67
(d) Expenses to be recognized in the Statement of Profit and Loss under employee benefit expenses.
ParticularsYear ended
March 31, 2019Year ended
March 31, 2018
Service cost 53.00 60.81
Net interest (income)/expense (1.81) 0.44
Net gratuity cost 51.19 61.25
Financial Statements - Consolidated
Notes to the consolidated financial statements for the year ended March 31, 2019

210 Varroc Engineering Limited
(e) Expenses to be recognized in statement of other comprehensive income:
(`in million)
ParticularsYear ended
March 31, 2019Year ended
March 31, 2018
Remeasurment
Experience (Gain)/ Losses on plan liabilities 20.43 (6.22)
Financial (Gain)/ Losses on plan liabilities 9.45 (21.61)
(Gain)/loss from change in demographic assumptions 0.13 -
Experience (Gain)/ Losses on plan assets 3.60 (2.45)
(Gain)/loss from change in financial assumptions (0.01) -
Financial(Gain)/ Losses on plan assets (2.29) 2.22
31.32 (28.06)
(f) Valuation in respect of gratuity plan has been carried out by independent actuary, as at the balance sheet date, based on the following assumptions:
ParticularsAs of
March 31, 2019As of
March 31, 2018
Discount rate 7.60% 7.60%- 7.90%
Salary growth rate 7.00% - 9.50 % 7.00% -10.5 %
Weighted average duration of defined benefit obligation 7.89- 12.8 7.56-13.11 As per actuary report, the group assesses these assumptions with its projected long-term plans of growth and prevalent industry standards. The discount rate is based on the government bonds.
Quantitative sensitivity analysis for significant assumptions are as follows:
March 31, 2019 March 31, 2018
Increase/(decrease) in present value of defined benefit obligation as at the end of the year
(i) 1% increase in discount rate -10.93% -10.81%
(ii) 1% decrease in discount rate 13.06% 13.45%
(iii) 1% increase in rate of salary escalation 11.67% 12.06%
(iv) 1% decreasing rate of salary escalation -10.09% -9.98%
Sensitivity for significant actuarial assumptions is computed by varying one actuarial assumption used for the valuation of the defined benefit obligation by 1%, keeping all other actuarial assumptions constant. When calculating the sensitivity of the defined benefit obligation to significant actuarial assumptions the same method(present value of defined benefit obligation calculated with the projected unit credit method at the end of reporting period) has been applied while calculating the defined benefit liability recognised in the balance sheet. The methods and types of assumptions used in preparing the sensitivity analysis did not change compared to the prior period.
Maturity profile of defined benefit obligation:
March 31, 2019 March 31, 2018
Within 1 year 18.59 12.21
1-2 year 17.58 12.40
2-3 year 23.18 21.03
3-4 year 32.24 24.16
4-5 year 36.24 31.63
5-10 years 278.11 225.62
Financial Statements - Consolidated
Notes to the consolidated financial statements for the year ended March 31, 2019

Annual Report 2018-19 211
C. Pension Plans (Overseas Entities) The group operates defined benefit pension plans in Mexico, Germany and Italy under broadly similar regulatory frameworks. All of the plans are salary
pension plans, which provide benefits to members in the form of a guaranteed level of pension payable for life. The level of benefits provided depends on members length of services and their salary in the final years leading up to retirement.
The group funds the pension liability as per legal requirements of respective countries. Plan assets are governed by local regulations and practice in each country, as is the nature of the relationship between the group and the trustees (or equivalent) and their composition.
The amounts recognised in the balance sheet and the movements in the net defined benefit obligation over the year are as follows:
(`in million)
ParticularsAs at
March 31, 2019As at
March 31, 2018
(a) Change in present value of benefit obligations
Liability at the beginning of the year 1,054.31 845.04
Service cost 67.08 63.05
Interest expense 35.60 31.35
Remeasurements - Actuarial (gains)/ losses (refer note (e) below) (6.32) 15.86
Benefits paid (37.32) (18.55)
Effect of Foreign exchange rate (38.41) 117.56
Liability at the end of the year 1,074.93 1,054.31
(b) Change in fair value of plan assets
Fair value of plan assets at the beginning of the year 511.67 395.08
Interest income 12.74 12.02
Transfer of assets 8.06 -
Remeasurements- Return on plan assets excluding amounts recognised in interest income(refer note (e) below)
(11.12) (6.96)
Contributions 94.70 59.52
Benefits paid (26.23) (12.03)
Effect of Foreign exchange rate (25.55) 64.04
Fair value of plan assets at the end of the year 564.28 511.67
(c) The net liability disclosed above relates to funded plan is as follows:
ParticularsAs at
March 31, 2019As at
March 31, 2018
Present value of funded obligations 1,074.93 1,054.31
Fair value of plan assets 564.28 511.67
Deficit of funded plan 510.66 542.64
(d) Expenses to be recognized in the Statement of Profit and Loss under employee benefit expenses.
ParticularsYear ended
March 31, 2019Year ended
March 31, 2018
Service cost 68.18 63.05
Net interest (income)/expense 22.86 19.33
Net gratuity cost 91.04 82.38
Financial Statements - Consolidated
Notes to the consolidated financial statements for the year ended March 31, 2019

212 Varroc Engineering Limited
(e) Expenses to be recognized in statement of other comprehensive income:
(`in million)
ParticularsYear ended
March 31, 2019Year ended
March 31, 2018
Remeasurment
Experience (Gain)/ Losses on plan liabilities 13.51 12.26
Financial (Gain)/ Losses on plan liabilities (50.06) (8.11)
(Return) / loss on plan assets excluding amounts recognised in interest (income)/expenses 4.76 6.46
(Gain)/loss from change in demographic assumptions 13.13 -
Experience (Gain)/ Losses on plan assets (1.64) 0.50
(Gain)/loss from change in financial assumptions 24.33 11.71
Financial(Gain)/ Losses on plan assets 0.66 -
4.69 22.82
(f) Valuation in respect of above pension plan has been carried out by independent actuary, as at the balance sheet date, based on the following assumptions:
MexicoQuantitative sensitivity analysis for significant assumptions are as follows:
ParticularsAs of
March 31, 2019As of
March 31, 2018
Discount rate 8.75% 8.00%
Salary growth rate 4% 4%
Weighted average duration of defined benefit obligation 19 20
As per actuary report, the group assesses these assumptions with its projected long-term plans of growth and prevalent industry standards. The discount rate is based on the government bonds.
Change in Assumption March 31, 2019 March 31, 2018
Increase/(decrease) in present value of defined benefit obligation as at the end of the year
(i) 1% increase in discount rate 8.77% 9.59%
(ii) 1% decrease in discount rate 9.92% 10.26%
(iii) 1% increase in rate of salary escalation 10.69% 11.09%
(iv) 1% decreasing rate of salary escalation 6.27% 10.10%
Sensitivity for significant actuarial assumptions is computed by varying one actuarial assumption used for the valuation of the defined benefit obligation by 1%, keeping all other actuarial assumptions constant. When calculating the sensitivity of the defined benefit obligation to significant actuarial assumptions the same method(present value of defined benefit obligation calculated with the projected unit credit method at the end of reporting period) has been applied while calculating the defined benefit liability recognised in the balance sheet. The methods and types of assumptions used in preparing the sensitivity analysis did not change compared to the prior period.
GermanyQuantitative sensitivity analysis for significant assumptions are as follows:
ParticularsAs of
March 31, 2019As of
March 31, 2018
Discount rate 1.90% 2.00%
Salary growth rate 3% 3%
Weighted average duration of defined benefit obligation 20.82 20.82
Financial Statements - Consolidated
Notes to the consolidated financial statements for the year ended March 31, 2019

Annual Report 2018-19 213
Change in Assumption March 31, 2019 March 31, 2018
Increase/(decrease) in present value of defined benefit obligation as at the end of the year
(i) 0.5 % increase in discount rate 0.96% 0.97%
(ii) 0.5 % decrease in discount rate 1.10% 1.09%
(iii) 0.5 % increase in rate of salary escalation 0.23% 0.36%
(iv) 0.5 % decreasing rate of salary escalation 0.37% 0.24%
Sensitivity for significant actuarial assumptions is computed by varying one actuarial assumption used for the valuation of the defined benefit obligation by 0.5 %, keeping all other actuarial assumptions constant. When calculating the sensitivity of the defined benefit obligation to significant actuarial assumptions the same method(present value of defined benefit obligation calculated with the projected unit credit method at the end of reporting period) has been applied while calculating the defined benefit liability recognised in the balance sheet. The methods and types of assumptions used in preparing the sensitivity analysis did not change compared to the prior period.
Italy Quantitative sensitivity analysis for significant assumptions are as follows:
ParticularsAs of
March 31, 2019As of
March 31, 2018
Discount rate 2.80% 1.80%
Salary growth rate 1% 1%
Weighted average duration of defined benefit obligation 9.63-15.43 10.27-15.43
Change in Assumption March 31, 2019 March 31, 2018
Increase/(decrease) in present value of defined benefit obligation as at the end of the year
(i) 0.1% increase in discount rate 0.90% 1.22%
(ii) 0.1% decrease in discount rate 1.30% 1.24%
(iii) 0.1% increase in rate of salary escalation 1.00% 1.12%
(iv) 0.1% decreasing rate of salary escalation 0.99% 1.11%
Sensitivity for significant actuarial assumptions is computed by varying one actuarial assumption used for the valuation of the defined benefit obligation by 0.1%, keeping all other actuarial assumptions constant. When calculating the sensitivity of the defined benefit obligation to significant actuarial assumptions the same method(present value of defined benefit obligation calculated with the projected unit credit method at the end of reporting period) has been applied while calculating the defined benefit liability recognised in the balance sheet. The methods and types of assumptions used in preparing the sensitivity analysis did not change compared to the prior period.
Maturity profile of defined benefit obligation for foreign operations are below:
Change in AssumptionAs at
March 31, 2019As at
March 31, 2018
Within 1 year 23.21 19.00
1-2 year 19.27 18.95
2-3 year 29.29 24.55
3-4 year 35.07 32.17
4-5 year 46.11 38.06
5-10 years 359.15 320.80
RISK EXPOSURE AND ASSET LIABILITY MATCHING
Provision of a defined benefit scheme poses certain risks, some of which are detailed here under as companies take on uncertain long-term obligations to make future benefit payments.
Financial Statements - Consolidated
Notes to the consolidated financial statements for the year ended March 31, 2019
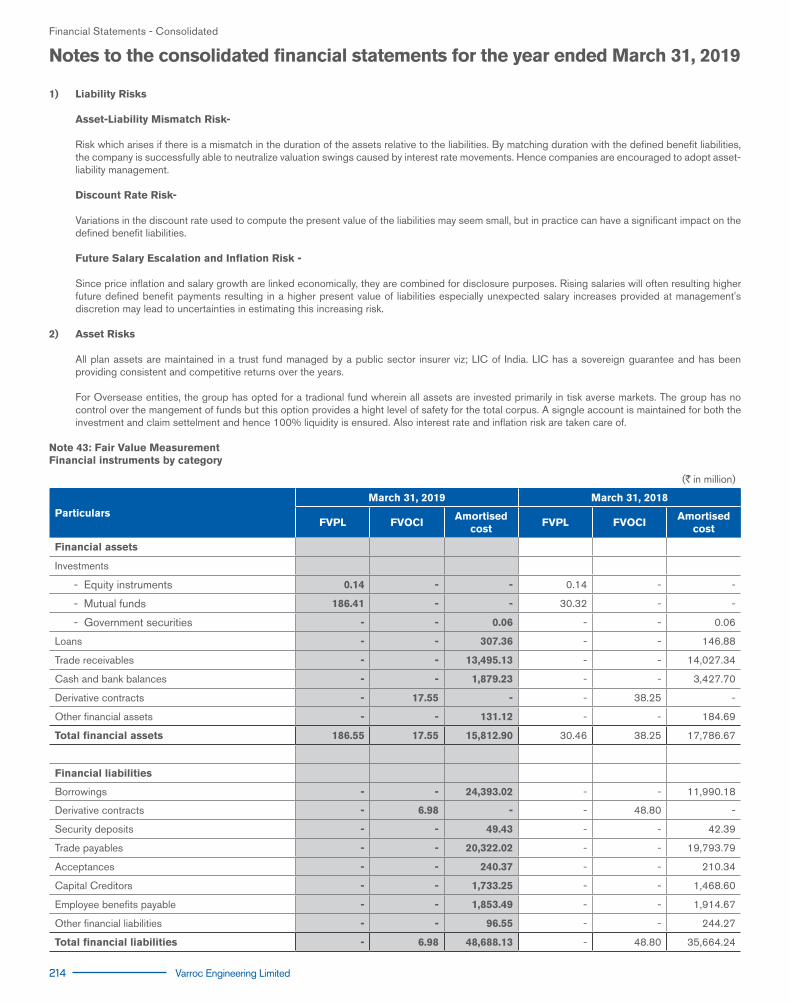
214 Varroc Engineering Limited
Financial Statements - Consolidated
1) Liability Risks
Asset-Liability Mismatch Risk- Risk which arises if there is a mismatch in the duration of the assets relative to the liabilities. By matching duration with the defined benefit liabilities,
the company is successfully able to neutralize valuation swings caused by interest rate movements. Hence companies are encouraged to adopt asset-liability management.
Discount Rate Risk- Variations in the discount rate used to compute the present value of the liabilities may seem small, but in practice can have a significant impact on the
defined benefit liabilities. Future Salary Escalation and Inflation Risk - Since price inflation and salary growth are linked economically, they are combined for disclosure purposes. Rising salaries will often resulting higher
future defined benefit payments resulting in a higher present value of liabilities especially unexpected salary increases provided at management's discretion may lead to uncertainties in estimating this increasing risk.
2) Asset Risks All plan assets are maintained in a trust fund managed by a public sector insurer viz; LIC of India. LIC has a sovereign guarantee and has been
providing consistent and competitive returns over the years. For Oversease entities, the group has opted for a tradional fund wherein all assets are invested primarily in tisk averse markets. The group has no
control over the mangement of funds but this option provides a hight level of safety for the total corpus. A signgle account is maintained for both the investment and claim settelment and hence 100% liquidity is ensured. Also interest rate and inflation risk are taken care of.
Note 43: Fair Value Measurement Financial instruments by category
(`in million)
ParticularsMarch 31, 2019 March 31, 2018
FVPL FVOCIAmortised
costFVPL FVOCI
Amortised cost
Financial assets
Investments
- Equity instruments 0.14 - - 0.14 - -
- Mutual funds 186.41 - - 30.32 - -
- Government securities - - 0.06 - - 0.06
Loans - - 307.36 - - 146.88
Trade receivables - - 13,495.13 - - 14,027.34
Cash and bank balances - - 1,879.23 - - 3,427.70
Derivative contracts - 17.55 - - 38.25 -
Other financial assets - - 131.12 - - 184.69
Total financial assets 186.55 17.55 15,812.90 30.46 38.25 17,786.67
Financial liabilities
Borrowings - - 24,393.02 - - 11,990.18
Derivative contracts - 6.98 - - 48.80 -
Security deposits - - 49.43 - - 42.39
Trade payables - - 20,322.02 - - 19,793.79
Acceptances - - 240.37 - - 210.34
Capital Creditors - - 1,733.25 - - 1,468.60
Employee benefits payable - - 1,853.49 - - 1,914.67
Other financial liabilities - - 96.55 - - 244.27
Total financial liabilities - 6.98 48,688.13 - 48.80 35,664.24
Notes to the consolidated financial statements for the year ended March 31, 2019
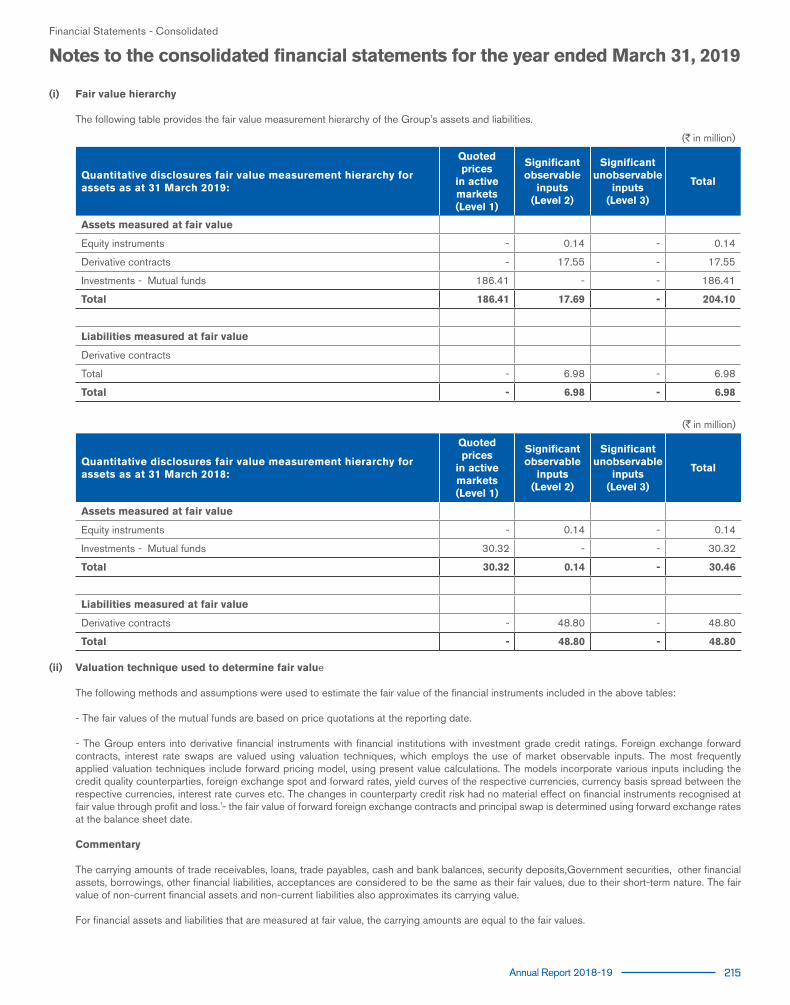
Annual Report 2018-19 215
(i) Fair value hierarchy
The following table provides the fair value measurement hierarchy of the Group's assets and liabilities.
(`in million)
Quantitative disclosures fair value measurement hierarchy for assets as at 31 March 2019:
Quoted prices
in active markets(Level 1)
Significant observable
inputs (Level 2)
Significant unobservable
inputs(Level 3)
Total
Assets measured at fair value
Equity instruments - 0.14 - 0.14
Derivative contracts - 17.55 - 17.55
Investments - Mutual funds 186.41 - - 186.41
Total 186.41 17.69 - 204.10
Liabilities measured at fair value
Derivative contracts
Total - 6.98 - 6.98
Total - 6.98 - 6.98
(`in million)
Quantitative disclosures fair value measurement hierarchy for assets as at 31 March 2018:
Quoted prices
in active markets(Level 1)
Significant observable
inputs (Level 2)
Significant unobservable
inputs(Level 3)
Total
Assets measured at fair value
Equity instruments - 0.14 - 0.14
Investments - Mutual funds 30.32 - - 30.32
Total 30.32 0.14 - 30.46
Liabilities measured at fair value
Derivative contracts - 48.80 - 48.80
Total - 48.80 - 48.80
(ii) Valuation technique used to determine fair value
The following methods and assumptions were used to estimate the fair value of the financial instruments included in the above tables:
- The fair values of the mutual funds are based on price quotations at the reporting date.
- The Group enters into derivative financial instruments with financial institutions with investment grade credit ratings. Foreign exchange forward contracts, interest rate swaps are valued using valuation techniques, which employs the use of market observable inputs. The most frequently applied valuation techniques include forward pricing model, using present value calculations. The models incorporate various inputs including the credit quality counterparties, foreign exchange spot and forward rates, yield curves of the respective currencies, currency basis spread between the respective currencies, interest rate curves etc. The changes in counterparty credit risk had no material effect on financial instruments recognised at fair value through profit and loss.'- the fair value of forward foreign exchange contracts and principal swap is determined using forward exchange rates at the balance sheet date.
Commentary
The carrying amounts of trade receivables, loans, trade payables, cash and bank balances, security deposits,Government securities, other financial assets, borrowings, other financial liabilities, acceptances are considered to be the same as their fair values, due to their short-term nature. The fair value of non-current financial assets and non-current liabilities also approximates its carrying value.
For financial assets and liabilities that are measured at fair value, the carrying amounts are equal to the fair values.
Financial Statements - Consolidated
Notes to the consolidated financial statements for the year ended March 31, 2019
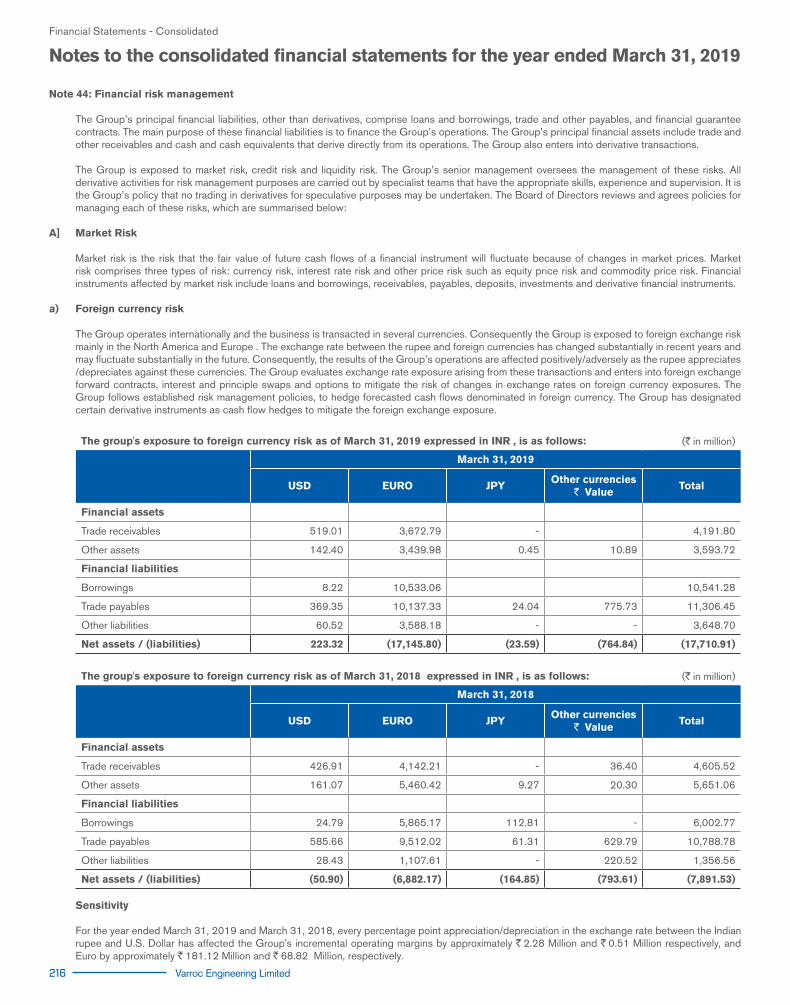
216 Varroc Engineering Limited
Note 44: Financial risk management
The Group’s principal financial liabilities, other than derivatives, comprise loans and borrowings, trade and other payables, and financial guarantee contracts. The main purpose of these financial liabilities is to finance the Group’s operations. The Group’s principal financial assets include trade and other receivables and cash and cash equivalents that derive directly from its operations. The Group also enters into derivative transactions.
The Group is exposed to market risk, credit risk and liquidity risk. The Group’s senior management oversees the management of these risks. All derivative activities for risk management purposes are carried out by specialist teams that have the appropriate skills, experience and supervision. It is the Group’s policy that no trading in derivatives for speculative purposes may be undertaken. The Board of Directors reviews and agrees policies for managing each of these risks, which are summarised below:
A] Market Risk Market risk is the risk that the fair value of future cash flows of a financial instrument will fluctuate because of changes in market prices. Market
risk comprises three types of risk: currency risk, interest rate risk and other price risk such as equity price risk and commodity price risk. Financial instruments affected by market risk include loans and borrowings, receivables, payables, deposits, investments and derivative financial instruments.
a) Foreign currency risk The Group operates internationally and the business is transacted in several currencies. Consequently the Group is exposed to foreign exchange risk
mainly in the North America and Europe . The exchange rate between the rupee and foreign currencies has changed substantially in recent years and may fluctuate substantially in the future. Consequently, the results of the Group’s operations are affected positively/adversely as the rupee appreciates /depreciates against these currencies. The Group evaluates exchange rate exposure arising from these transactions and enters into foreign exchange forward contracts, interest and principle swaps and options to mitigate the risk of changes in exchange rates on foreign currency exposures. The Group follows established risk management policies, to hedge forecasted cash flows denominated in foreign currency. The Group has designated certain derivative instruments as cash flow hedges to mitigate the foreign exchange exposure.
The group's exposure to foreign currency risk as of March 31, 2019 expressed in INR , is as follows: (`in million)
March 31, 2019
USD EURO JPYOther currencies
` ValueTotal
Financial assets
Trade receivables 519.01 3,672.79 - 4,191.80
Other assets 142.40 3,439.98 0.45 10.89 3,593.72
Financial liabilities
Borrowings 8.22 10,533.06 10,541.28
Trade payables 369.35 10,137.33 24.04 775.73 11,306.45
Other liabilities 60.52 3,588.18 - - 3,648.70
Net assets / (liabilities) 223.32 (17,145.80) (23.59) (764.84) (17,710.91)
The group's exposure to foreign currency risk as of March 31, 2018 expressed in INR , is as follows: (`in million)
March 31, 2018
USD EURO JPYOther currencies
` ValueTotal
Financial assets
Trade receivables 426.91 4,142.21 - 36.40 4,605.52
Other assets 161.07 5,460.42 9.27 20.30 5,651.06
Financial liabilities
Borrowings 24.79 5,865.17 112.81 - 6,002.77
Trade payables 585.66 9,512.02 61.31 629.79 10,788.78
Other liabilities 28.43 1,107.61 - 220.52 1,356.56
Net assets / (liabilities) (50.90) (6,882.17) (164.85) (793.61) (7,891.53)
Sensitivity For the year ended March 31, 2019 and March 31, 2018, every percentage point appreciation/depreciation in the exchange rate between the Indian
rupee and U.S. Dollar has affected the Group's incremental operating margins by approximately `2.28 Million and `0.51 Million respectively, and Euro by approximately `181.12 Million and `68.82 Million, respectively.
Financial Statements - Consolidated
Notes to the consolidated financial statements for the year ended March 31, 2019

Annual Report 2018-19 217
Sensitivity analysis is computed based on the changes in the income and expenses in foreign currency upon conversion into functional currency, due to exchange rate fluctuations between the previous reporting period and the current reporting period."
b) Interest rate risk Interest rate risk is the risk that the fair value or future cash flows of a financial instrument will fluctuate because of change in market interest rates. The Group’s
exposure to the risk of changes in market interest rates relates primarily to the Group’s long term debt obligations with floating interest rates.
Interest rate sensitivity
The sensitivity analysis below have been determined based on exposure to interest rate. For floating rate liabilities, analysis is prepared assuming the amount of liability outstanding at the end of the reporting period was outstanding for the whole year. With all other variables held constant, the group profit before tax is affected through the impact on floating rate borrowings, as follows:
(`in million)
For the year ended CurrencyIncrease/ decrease
in basis pointsEffect on profit
before tax
Variable rateCash Credit and
Term loans balances
March 31, 2019 ` +100 (183.24) 18,323.82
March 31, 2019 ` -100 183.24 18,323.82
March 31, 2018 ` +100 (61.52) 6,152.09
March 31, 2018 ` -100 61.52 6,152.09
c) Other price risk The Group does not have material investments in equity securities other than investments in Joint Ventures. Hence equity price risk is considered to
be low. Further, the Group's operating activities require the ongoing purchase of various commodities for manufacture of automotive parts. However, the movement is commodity prices are substantially adjusted through price differences as per customer contracts and hence commodity price risk for the Group is also considered to be low.
B] Credit Risk Management Credit risk arises when a customer or counterparty does not meet its obligations under a financial instrument or customer contract, leading to a
financial loss. The Group is exposed to credit risk from its operating activities (primarily trade receivables) and from its investing activities, including deposits with banks and financial institutions, foreign exchange transactions and other financial instruments. The Group only deals with parties which have good credit rating/worthiness given by external rating agencies or based on the Group's internal assessment.
Trade receivables Customer credit risk is managed by the Group’s established policy, procedures and control relating to customer credit risk management. Further,
Group’s customers includes marquee OEMs and Tier I companies, having long standing relationship with the Group. Outstanding customer receivables are regularly monitored and reconciled. At March 31, 2019, receivable from Group’s top 11 customers accounted for approximately 84% (March 31, 2018: 71.20%) of all the receivables outstanding. An impairment analysis is performed at each reporting date on an individual basis based on historical data. The maximum exposure to credit risk at the reporting date is the carrying value of trade receivables disclosed in Note 12.
Financial instruments and cash deposits Credit risk from balances with banks and financial institutions is managed by the Group’s corporate treasury department in accordance with the
Group’s policy. Investments of surplus funds are made only with approved counterparties. Credit limits are set to minimise the concentration of risks and therefore mitigate financial loss through counterparty’s potential failure to make payments.
The Group’s maximum exposure to credit risk for the components of the balance sheet at 31 March 2019 and 31 March 2018 is the carrying amounts
as disclosed in Note 13. C] Liquidity risk
Liquidity risk is defined as the risk that the Group will not be able to settle or meet its obligations on time or at a reasonable price. The Group’s corporate treasury department is responsible for liquidity and funding as well as settlement management. In addition, processes and policies related to such risks are overseen by senior management. Management monitors the Group’s net liquidity position through rolling forecasts on the basis of expected cash flows. As of March 31, 2019, cash and cash equivalents are held with major banks.
Financial Statements - Consolidated
Notes to the consolidated financial statements for the year ended March 31, 2019

218 Varroc Engineering Limited
Maturities of financial liabilities The table below summarises the maturity profile of the company’s financial liabilities based on contractual payments.
(`in million)
March 31, 2019 On demand < 1 year 1 to 5 years > 5 years
Non- derivative
Borrowings 16,154.85 3,666.21 3,967.58 604.38
Trade Payables - 20,322.02 - -
Acceptances - 240.37 - -
Other financial liabilities 49.43 3,556.12 127.17 -
Derivative liabilities pending settlement - 6.98 - -
March 31, 2018 On demand < 1 year 1 to 5 years > 5 years
Non- derivative
Borrowings 877.22 4,751.50 6,361.46 -
Trade Payables - 19,793.80 - -
Acceptances - 210.34 - -
Other financial liabilities 36.75 3,510.37 123.17 -
Derivative liabilities pending settlement - 48.80 - -
- The amount disclosed in the table are the contractual undiscounted cash flows. Balances due within 12 months equal their carrying balances as the impact of discounting is not significant.
Note 45: Capital Management (a) Risk management The group's capital comprises equity share capital, preference share capital, security premium, retained earnings and other equity attributable to
shareholders. The group's objectives when managing capital are to: - Safeguard their ability to continue as a going concern, so that they can continue to provide returns for shareholders and for other stakeholders, and
- Maintain an optimal capital structure to reduce the cost of capital." In order to maintain or adjust the capital structure, the group may adjust the amount of dividends paid to shareholders, return capital to shareholders
or issue new shares . The Group monitors debt-equity ratio, which is net debt divided by total equity. Net debt comprises of long term and short term borrowings less
cash and bank balances. Equity includes equity share capital, preference share capital (classified as equity) and other equity attributable to equity shareholders. The debt-equity ratio at the end of the reporting period was as follows.
The group's strategy is to maintain a debt equity ratio below 1:1
(`in million)
ParticularsAs at March
31, 2019As at March
31, 2018
Net debt 22,758.74 8,700.81
Total Equity* 30,871.02 28,280.05
Net debt to equity ratio 0.74 0.31
*Total equity does not include share of non controlling interest. No changes were made in the objectives, policies or processes for managing capital of the Group during the year.
(i) Loan covenant
The group capital management aims to ensure that it meets financial covenants attached to the interest-bearing loans and borrowings that define capital structure requirements. There has been no breach of covenants for the loan obtained by the Group except as disclosed in note 26
Financial Statements - Consolidated
Notes to the consolidated financial statements for the year ended March 31, 2019

Annual Report 2018-19 219
(b) Dividends
(`in million)
ParticularsAs at March
31, 2019As at March
31, 2018
Interim dividend for the year ended March 31, 2018 of `0.50 per equity share declared and paid - 61.56
Interim dividend for the year ended March 31, 2018 of `0.50 per preference share paid on April 30, 2018
5.84 -
Dividend Distribution tax 2.55 12.52
Dividend not recognised at the end of reporting period
Directors have recommended the payment of a final dividend of `4 Per equity share (March 31, 2018 Nil). This proposed dividend is subject to the approval of the shareholders in ensuing annual general meeting.
Financial Statements - Consolidated
Notes to the consolidated financial statements for the year ended March 31, 2019
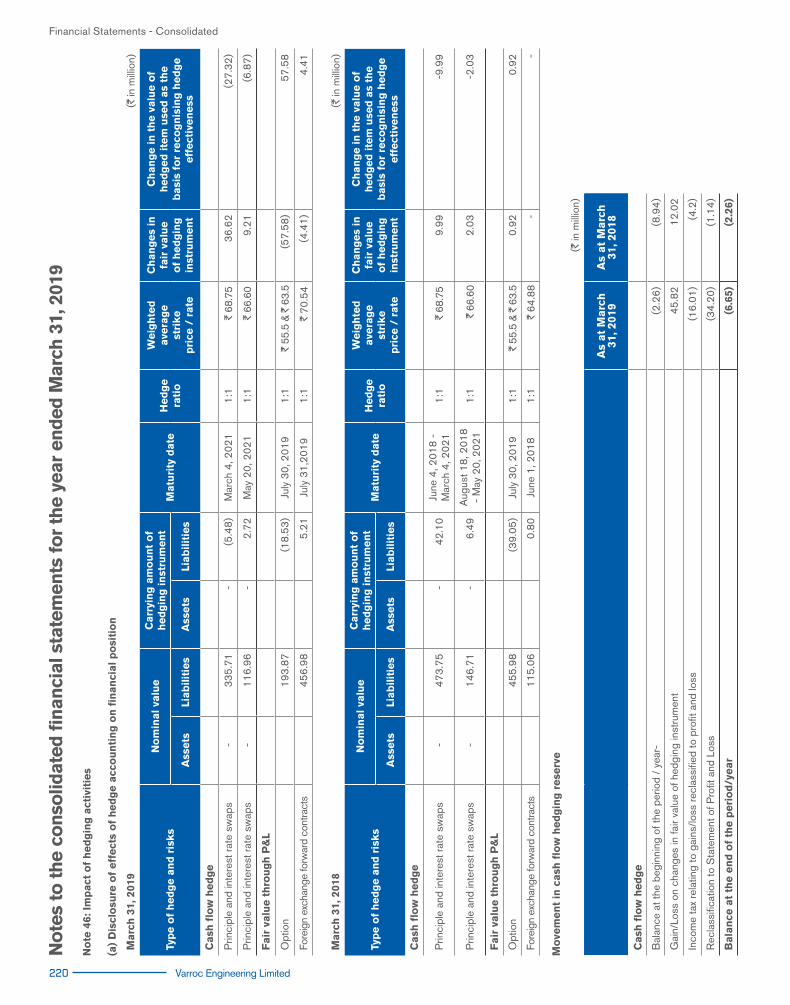
220 Varroc Engineering Limited
No
te 4
6: I
mp
act
of
hed
gin
g a
ctiv
itie
s (a
) D
iscl
osu
re o
f eff
ect
s o
f h
ed
ge a
cco
un
tin
g o
n f
inan
cial p
osi
tio
n
Marc
h 3
1, 2
019
(`
in m
illio
n)
Typ
e o
f h
ed
ge a
nd
ris
ks
No
min
al va
lue
Carr
yin
g a
mo
un
t o
f h
ed
gin
g in
stru
men
tM
atu
rity
date
Hed
ge
rati
o
Weig
hte
d
ave
rag
est
rike
pri
ce /
rate
Ch
an
ges
in
fair
valu
e
of
hed
gin
g
inst
rum
en
t
Ch
an
ge in
th
e v
alu
e o
f h
ed
ged
ite
m u
sed
as
the
basi
s fo
r re
cog
nis
ing
hed
ge
eff
ect
iven
ess
Ass
ets
Li
ab
ilit
ies
Ass
ets
Li
ab
ilit
ies
Cash
flo
w h
ed
ge
Prin
cipl
e an
d in
tere
st ra
te s
wap
s -
3
35.7
1 -
(5
.48)
M
arch
4, 2
021
1:1
`68
.75
36.
62
(27.
32)
Prin
cipl
e an
d in
tere
st ra
te s
wap
s -
1
16.9
6 -
2
.72
May
20,
202
11:
1`
66.6
0 9
.21
(6.8
7)
Fair
valu
e t
hro
ug
h P
&L
Opt
ion
193
.87
(18.
53)
July
30,
201
91:
1`
55.5
& `
63.5
(57.
58)
57.
58
Fore
ign
exch
ange
forw
ard
cont
ract
s 4
56.9
8 5
.21
July
31,
2019
1:1
`70
.54
(4.4
1) 4
.41
Marc
h 3
1, 2
018
(`in
mill
ion)
Typ
e o
f h
ed
ge a
nd
ris
ks
No
min
al va
lue
Carr
yin
g a
mo
un
t o
f h
ed
gin
g in
stru
men
tM
atu
rity
date
Hed
ge
rati
o
Weig
hte
d
ave
rag
est
rike
pri
ce /
rate
Ch
an
ges
in
fair
valu
e
of
hed
gin
g
inst
rum
en
t
Ch
an
ge in
th
e v
alu
e o
f h
ed
ged
ite
m u
sed
as
the
basi
s fo
r re
cog
nis
ing
hed
ge
eff
ect
iven
ess
Ass
ets
Li
ab
ilit
ies
Ass
ets
Li
ab
ilit
ies
Cash
flo
w h
ed
ge
Prin
cipl
e an
d in
tere
st ra
te s
wap
s -
4
73.7
5 -
4
2.10
Ju
ne 4
, 201
8 -
Mar
ch 4
, 202
11:
1`
68.7
5 9
.99
-9.
99
Prin
cipl
e an
d in
tere
st ra
te s
wap
s -
1
46.7
1 -
6
.49
Aug
ust 1
8, 2
018
- M
ay 2
0, 2
021
1:1
`66
.60
2.0
3 -
2.03
Fair
valu
e t
hro
ug
h P
&L
Opt
ion
455
.98
(39.
05)
July
30,
201
91:
1`
55.5
& `
63.5
0.9
2 0
.92
Fore
ign
exch
ange
forw
ard
cont
ract
s 1
15.0
6 0
.80
June
1, 2
018
1:1
`64
.88
-
-
Mo
vem
en
t in
cash
flo
w h
ed
gin
g r
ese
rve
(`in
mill
ion)
As
at
Marc
h
31, 2
019
As
at
Marc
h
31, 2
018
Cash
flo
w h
ed
ge
Bal
ance
at t
he b
egin
ning
of t
he p
erio
d /
year
- (2
.26)
(8.9
4)
Gai
n/Lo
ss o
n ch
ange
s in
fair
valu
e of
hed
ging
inst
rum
ent
45.8
212
.02
Inco
me
tax
rela
ting
to g
ains
/loss
recl
assi
fied
to p
rofit
and
loss
(16.
01)
(4.2
)
Rec
lass
ifica
tion
to S
tate
men
t of P
rofit
and
Los
s(3
4.20
)(1
.14)
Bala
nce
at
the e
nd
of
the p
eri
od
/year
(6.6
5)(2
.26)
Financial Statements - Consolidated
No
tes
to t
he c
ons
olid
ated
fin
anci
al s
tate
men
ts f
or
the
year
end
ed M
arch
31,
201
9
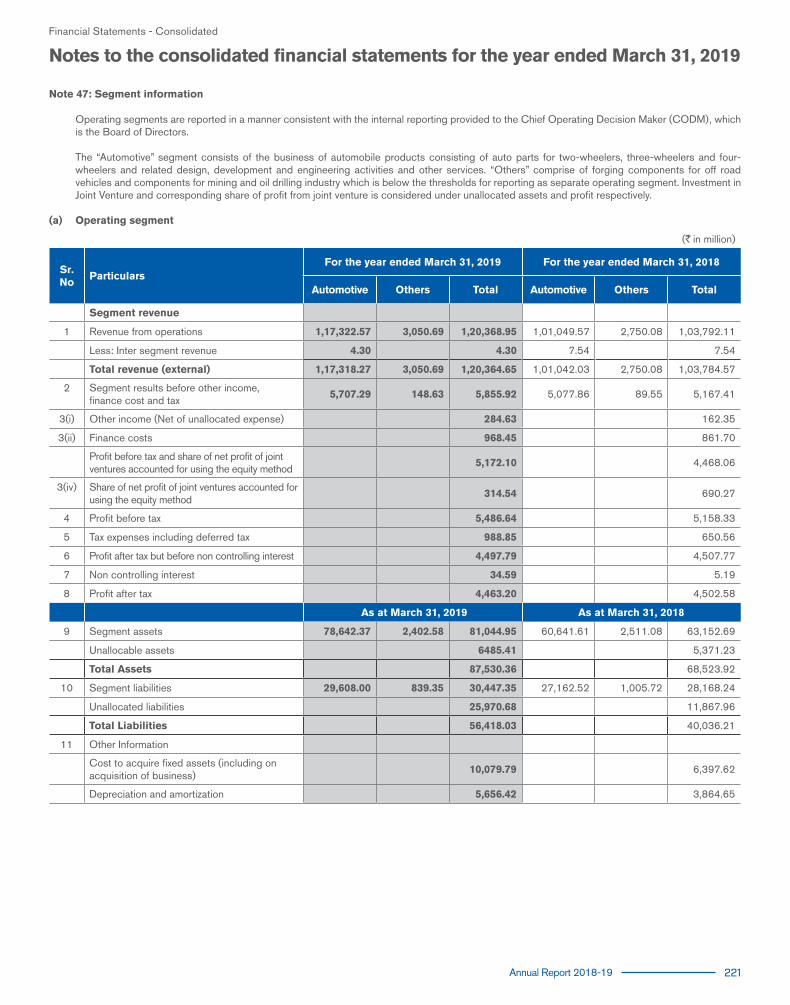
Annual Report 2018-19 221
Note 47: Segment information
Operating segments are reported in a manner consistent with the internal reporting provided to the Chief Operating Decision Maker (CODM), which is the Board of Directors.
The “Automotive” segment consists of the business of automobile products consisting of auto parts for two-wheelers, three-wheelers and four-wheelers and related design, development and engineering activities and other services. “Others” comprise of forging components for off road vehicles and components for mining and oil drilling industry which is below the thresholds for reporting as separate operating segment. Investment in Joint Venture and corresponding share of profit from joint venture is considered under unallocated assets and profit respectively.
(a) Operating segment
(`in million)
Sr. No
ParticularsFor the year ended March 31, 2019 For the year ended March 31, 2018
Automotive Others Total Automotive Others Total
Segment revenue
1 Revenue from operations 1,17,322.57 3,050.69 1,20,368.95 1,01,049.57 2,750.08 1,03,792.11
Less: Inter segment revenue 4.30 4.30 7.54 7.54
Total revenue (external) 1,17,318.27 3,050.69 1,20,364.65 1,01,042.03 2,750.08 1,03,784.57
2 Segment results before other income, finance cost and tax
5,707.29 148.63 5,855.92 5,077.86 89.55 5,167.41
3(i) Other income (Net of unallocated expense) 284.63 162.35
3(ii) Finance costs 968.45 861.70
Profit before tax and share of net profit of joint ventures accounted for using the equity method
5,172.10 4,468.06
3(iv) Share of net profit of joint ventures accounted for using the equity method
314.54 690.27
4 Profit before tax 5,486.64 5,158.33
5 Tax expenses including deferred tax 988.85 650.56
6 Profit after tax but before non controlling interest 4,497.79 4,507.77
7 Non controlling interest 34.59 5.19
8 Profit after tax 4,463.20 4,502.58
As at March 31, 2019 As at March 31, 2018
9 Segment assets 78,642.37 2,402.58 81,044.95 60,641.61 2,511.08 63,152.69
Unallocable assets 6485.41 5,371.23
Total Assets 87,530.36 68,523.92
10 Segment liabilities 29,608.00 839.35 30,447.35 27,162.52 1,005.72 28,168.24
Unallocated liabilities 25,970.68 11,867.96
Total Liabilities 56,418.03 40,036.21
11 Other Information
Cost to acquire fixed assets (including on acquisition of business)
10,079.79 6,397.62
Depreciation and amortization 5,656.42 3,864.65
Financial Statements - Consolidated
Notes to the consolidated financial statements for the year ended March 31, 2019
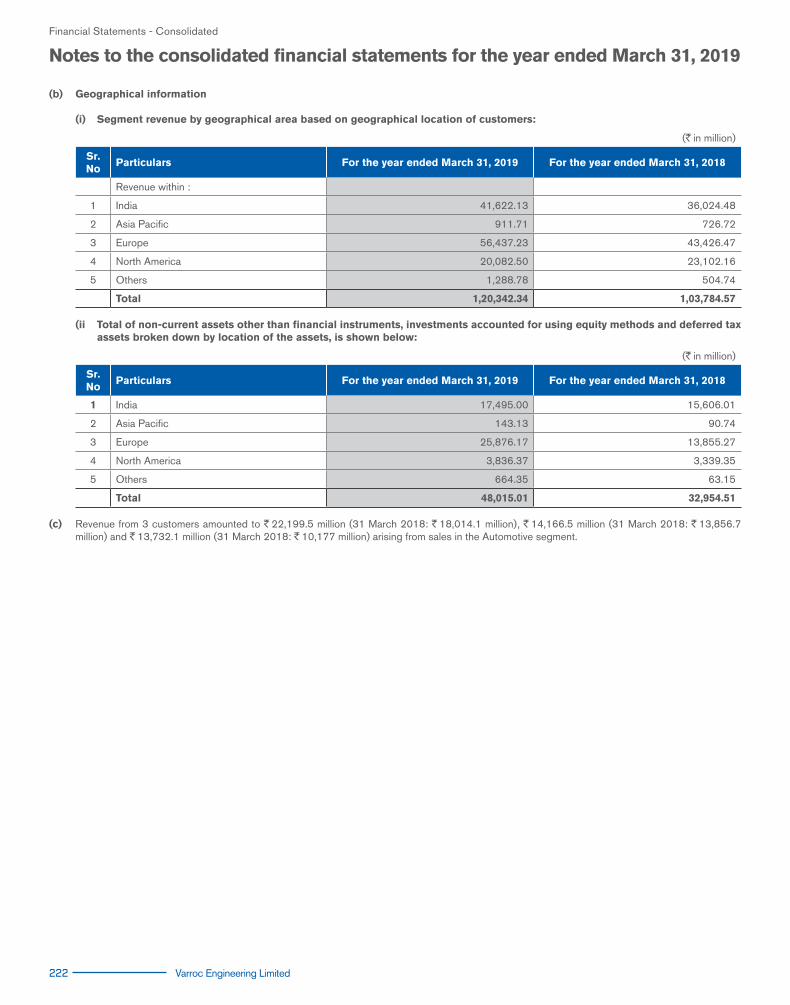
222 Varroc Engineering Limited
(b) Geographical information (i) Segment revenue by geographical area based on geographical location of customers:
(`in million)
Sr. No
Particulars For the year ended March 31, 2019 For the year ended March 31, 2018
Revenue within :
1 India 41,622.13 36,024.48
2 Asia Pacific 911.71 726.72
3 Europe 56,437.23 43,426.47
4 North America 20,082.50 23,102.16
5 Others 1,288.78 504.74
Total 1,20,342.34 1,03,784.57
(ii Total of non-current assets other than financial instruments, investments accounted for using equity methods and deferred tax assets broken down by location of the assets, is shown below:
(`in million)
Sr. No
Particulars For the year ended March 31, 2019 For the year ended March 31, 2018
1 India 17,495.00 15,606.01
2 Asia Pacific 143.13 90.74
3 Europe 25,876.17 13,855.27
4 North America 3,836.37 3,339.35
5 Others 664.35 63.15
Total 48,015.01 32,954.51
(c) Revenue from 3 customers amounted to `22,199.5 million (31 March 2018: `18,014.1 million), `14,166.5 million (31 March 2018: `13,856.7 million) and `13,732.1 million (31 March 2018: `10,177 million) arising from sales in the Automotive segment.
Financial Statements - Consolidated
Notes to the consolidated financial statements for the year ended March 31, 2019
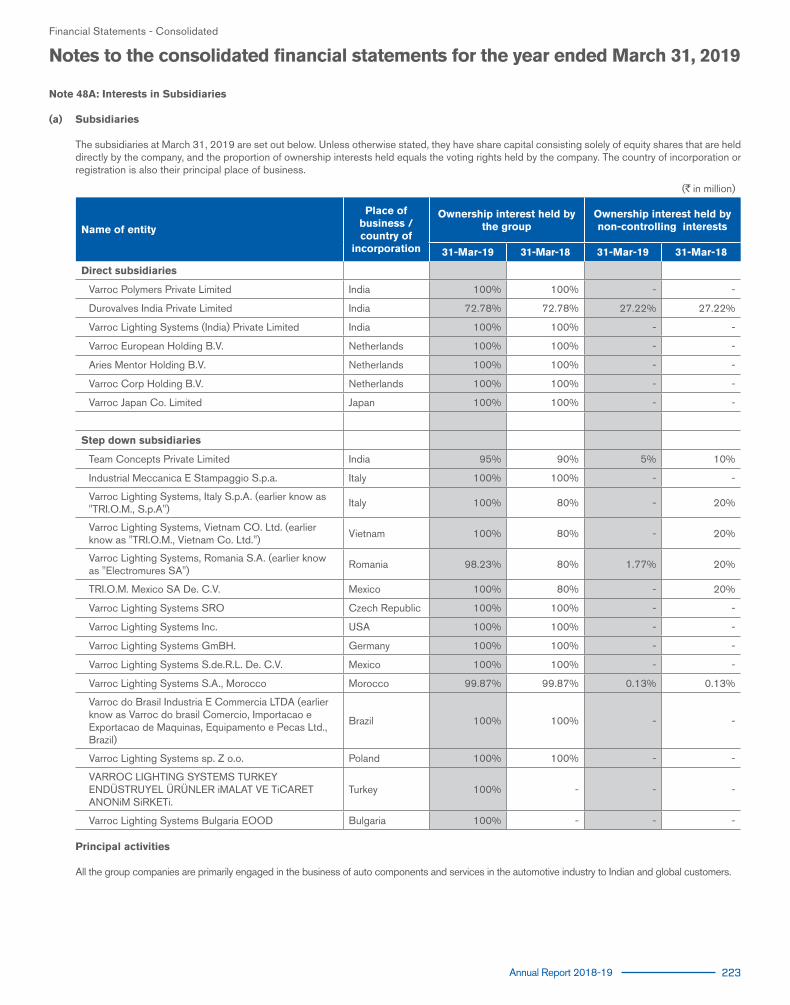
Annual Report 2018-19 223
Note 48A: Interests in Subsidiaries
(a) Subsidiaries The subsidiaries at March 31, 2019 are set out below. Unless otherwise stated, they have share capital consisting solely of equity shares that are held
directly by the company, and the proportion of ownership interests held equals the voting rights held by the company. The country of incorporation or registration is also their principal place of business.
(`in million)
Name of entity
Place of business / country of
incorporation
Ownership interest held by the group
Ownership interest held by non-controlling interests
31-Mar-19 31-Mar-18 31-Mar-19 31-Mar-18
Direct subsidiaries
Varroc Polymers Private Limited India 100% 100% - -
Durovalves India Private Limited India 72.78% 72.78% 27.22% 27.22%
Varroc Lighting Systems (India) Private Limited India 100% 100% - -
Varroc European Holding B.V. Netherlands 100% 100% - -
Aries Mentor Holding B.V. Netherlands 100% 100% - -
Varroc Corp Holding B.V. Netherlands 100% 100% - -
Varroc Japan Co. Limited Japan 100% 100% - -
Step down subsidiaries
Team Concepts Private Limited India 95% 90% 5% 10%
Industrial Meccanica E Stampaggio S.p.a. Italy 100% 100% - -
Varroc Lighting Systems, Italy S.p.A. (earlier know as "TRI.O.M., S.p.A")
Italy 100% 80% - 20%
Varroc Lighting Systems, Vietnam CO. Ltd. (earlier know as "TRI.O.M., Vietnam Co. Ltd.")
Vietnam 100% 80% - 20%
Varroc Lighting Systems, Romania S.A. (earlier know as "Electromures SA")
Romania 98.23% 80% 1.77% 20%
TRI.O.M. Mexico SA De. C.V. Mexico 100% 80% - 20%
Varroc Lighting Systems SRO Czech Republic 100% 100% - -
Varroc Lighting Systems Inc. USA 100% 100% - -
Varroc Lighting Systems GmBH. Germany 100% 100% - -
Varroc Lighting Systems S.de.R.L. De. C.V. Mexico 100% 100% - -
Varroc Lighting Systems S.A., Morocco Morocco 99.87% 99.87% 0.13% 0.13%
Varroc do Brasil Industria E Commercia LTDA (earlier know as Varroc do brasil Comercio, Importacao e Exportacao de Maquinas, Equipamento e Pecas Ltd., Brazil)
Brazil 100% 100% - -
Varroc Lighting Systems sp. Z o.o. Poland 100% 100% - -
VARROC LIGHTING SYSTEMS TURKEY ENDÜSTRUYEL ÜRÜNLER iMALAT VE TiCARET ANONiM SiRKETi.
Turkey 100% - - -
Varroc Lighting Systems Bulgaria EOOD Bulgaria 100% - - -
Principal activities All the group companies are primarily engaged in the business of auto components and services in the automotive industry to Indian and global customers.
Financial Statements - Consolidated
Notes to the consolidated financial statements for the year ended March 31, 2019

224 Varroc Engineering Limited
No
te 4
8 B
: A
dd
itio
nal in
form
ati
on
as
on
Marc
h 3
1, 2
019
req
uir
ed
by
Sch
ed
ule
III
(`in
mill
ion)
Sr.
N
o.
Nam
e o
f th
e e
nti
ty i
n t
he g
rou
p
Net
ass
ets
(T
ota
l ass
ets
min
us
tota
l li
ab
ilit
ies)
Sh
are
in
pro
fit
or
(lo
ss)
Sh
are
in
oth
er
com
pre
hen
sive
in
com
eS
hare
in
to
tal
com
pre
hen
sive
in
com
e
as
% o
f co
nso
lid
ate
d
net
ass
ets
Am
ou
nt
as
% o
f co
nso
lid
ate
d
pro
fit
or
loss
Am
ou
nt
as
% o
f co
nso
lid
ate
d
oth
er
com
pre
hen
sive
in
com
e
Am
ou
nt
as
% o
f co
nso
lid
ate
d
tota
l co
mp
reh
en
sive
in
com
e
Am
ou
nt
Pare
nt
Varr
oc E
ngin
eerin
g P
rivat
e Li
mite
d36
.28%
11,
288.
00
26.6
% 1
,195
.41
1.11
% (1
1.81
)34
.46%
1,1
83.5
9
Ind
ian
Su
bsi
dia
ries
1Va
rroc
Pol
ymer
s P
rivat
e Li
mite
d16
.02%
4,9
84.0
9 8.
8% 3
95.3
2 0.
61%
(6.4
5)11
.32%
388
.87
2D
urov
alve
s In
dia
Priv
ate
Lim
ited
2.78
% 8
63.4
0 2.
0% 9
2.15
0.
19%
(2.0
6)2.
62%
90.
08
3Va
rroc
Lig
htin
g S
yste
ms
(Indi
a) P
rivat
e Li
mite
d1.
91%
592
.82
3.0%
133
.35
-0.0
4% 0
.41
3.89
% 1
33.7
6
4Te
am C
once
pts
Priv
ate
Lim
ited
0.94
% 2
93.7
7 1.
9% 8
4.62
-0
.02%
0.1
9 2.
47%
84.
81
Fo
reig
n S
ub
sid
iari
es
-
1Va
rroc
Cor
p H
oldi
ng B
.V.
12.9
3% 4
,022
.72
15.5
% 6
98.7
2 0.
00%
-
20.3
5% 6
98.7
2
2Va
rroc
Lig
htin
g S
yste
ms
S.R
.O.
38.7
2% 1
2,04
8.05
26
.1%
1,1
74.7
3 0.
00%
-
34.2
1% 1
,174
.73
3Va
rroc
Lig
htin
g S
yste
ms
S.d
e.R
.L.d
e.C
.V.
4.53
% 1
,409
.54
12.8
% 5
73.9
7 -4
.36%
46.
32
18.0
6% 6
20.2
9
4Va
rroc
Lig
htin
g S
yste
ms
INC
12.2
7% 3
,817
.00
13.2
% 5
93.9
5 0.
00%
-
17.2
9% 5
93.9
5
5Va
rroc
Lig
htin
g S
yste
ms
Gm
BH
-0.1
6% (4
9.47
)3.
9% 1
74.7
5 8.
70%
(92.
56)
2.39
% 8
2.19
6Va
rroc
Lig
htin
g S
yste
ms
S.A
., M
oroc
co-0
.71%
(221
.83)
-4.8
% (2
14.0
4)0.
00%
-
-6.2
3% (2
14.0
4)
7Va
rroc
do
Bra
sil I
ndus
tria
E C
omm
erci
a LT
DA
-0.0
1% (4
.45)
-5.7
% (2
57.3
0)0.
00%
-
-7.4
9% (2
57.3
0)
8Va
rroc
Lig
htin
g S
yste
ms
sp. Z
o.o
.-0
.21%
(64.
95)
-1.3
% (5
8.12
)0.
00%
-
-1.6
9% (5
8.12
)
9VA
RR
OC
LIG
HTI
NG
SYS
TEM
S T
UR
KE
Y
EN
DÜ
STR
IYE
L Ü
RÜ
NLE
R iM
ALA
T V
E T
iCA
RE
T A
NO
NiM
SiR
KE
Ti.
4.72
% 1
,469
.87
6.5%
291
.45
- -
8.
49%
291
.45
10Va
rroc
Lig
htin
g S
yste
ms
Bul
garia
EO
OD
-0.0
1% (3
.00)
0.2%
8.6
5 -
-
0.25
% 8
.65
11Va
rroc
Jap
an C
o. L
td0.
02%
5.4
8 0.
1% 4
.14
0.00
% -
0.
12%
4.1
4
12Va
rroc
Eur
opea
n H
oldi
ng B
.V.
-2.5
8% (8
02.9
9)-0
.1%
(6.5
0)0.
00%
-
-0.1
9% (6
.50)
13In
dust
ria M
ecca
nica
e S
tam
pagg
io S
.p.A
.-0
.01%
(1.6
6)1.
8% 8
0.42
-1
.26%
13.
43
2.73
% 9
3.85
14A
ries
Men
tor H
oldi
ng B
V1.
26%
391
.31
-0.2
% (9
.89)
0.00
% -
-0
.29%
(9.8
9)
15Va
rroc
Lig
htin
g S
yste
ms,
Ital
y S
.p.A
.2.
43%
754
.57
1.1%
50.
86
-0.5
4% 5
.70
1.65
% 5
6.56
16Va
rroc
Lig
htin
g S
yste
ms,
Rom
ania
S.A
.0.
63%
197
.01
0.2%
7.0
5 0.
00%
-
0.21
% 7
.05
17Va
rroc
Lig
htin
g S
yste
ms,
Vie
tnam
CO
. Ltd
.0.
78%
241
.32
2.4%
110
.18
0.00
% -
3.
21%
110
.18
18Tr
iom
Mex
ico
SA
DE
CV
0.00
% 0
.04
0.0%
-
0.00
% -
0.
00%
-
Financial Statements - Consolidated
No
tes
to t
he c
ons
olid
ated
fin
anci
al s
tate
men
ts f
or
the
year
end
ed M
arch
31,
201
9

Annual Report 2018-19 225
(`in
mill
ion)
Sr.
N
o.
Nam
e o
f th
e e
nti
ty i
n t
he g
rou
p
Net
ass
ets
(T
ota
l ass
ets
min
us
tota
l li
ab
ilit
ies)
Sh
are
in
pro
fit
or
(lo
ss)
Sh
are
in
oth
er
com
pre
hen
sive
in
com
eS
hare
in
to
tal
com
pre
hen
sive
in
com
e
as
% o
f co
nso
lid
ate
d
net
ass
ets
Am
ou
nt
as
% o
f co
nso
lid
ate
d
pro
fit
or
loss
Am
ou
nt
as
% o
f co
nso
lid
ate
d
oth
er
com
pre
hen
sive
in
com
e
Am
ou
nt
as
% o
f co
nso
lid
ate
d
tota
l co
mp
reh
en
sive
in
com
e
Am
ou
nt
Join
t V
en
ture
(Inve
stm
ent a
ccou
nted
as
per e
quity
met
hod)
1Va
rroc
TYC
Cor
pora
tion,
BV
I10
.70%
3,3
29.4
8 6.
7% 3
02.7
0 0.
00%
-
8.81
% 3
02.7
0
2N
uova
CTS
S.r.
l0.
27%
82.
69
0.3%
11.
68
0.00
% -
0.
34%
11.
68
3Va
rroc
ELB
A E
lect
roni
cs S
RL,
Rom
ania
0.
07%
21.
45
0.0%
-
0.00
% -
0.
00%
-
4Va
rroc
Del
l'Ort
o P
rivat
e Li
mite
d0.
00%
0.2
5 0.
0% -
0.
00%
-
0.00
% -
Non
-con
trol
ling
inte
rest
s in
sub
sidi
arie
s0.
78%
241
.31
0.77
% 3
4.59
0.
07%
(0.7
7)0.
98%
33.
82
Su
bto
tal
44,
905.
81
5,4
72.8
3 (
47.6
1) 5
,425
.22
Adj
ustm
ent a
risin
g ou
t of c
onso
lidat
ion
-44.
33%
(13,
793.
47)
-21.
68%
(975
.04)
95.5
2% (1
,015
.87)
-57.
97%
(1,9
90.9
1)
Tota
l10
0% 3
1,11
2.33
10
0.00
% 4
,497
.79
100.
00%
(1,
063.
48)
100.
00%
3,4
34.3
1
Financial Statements - Consolidated
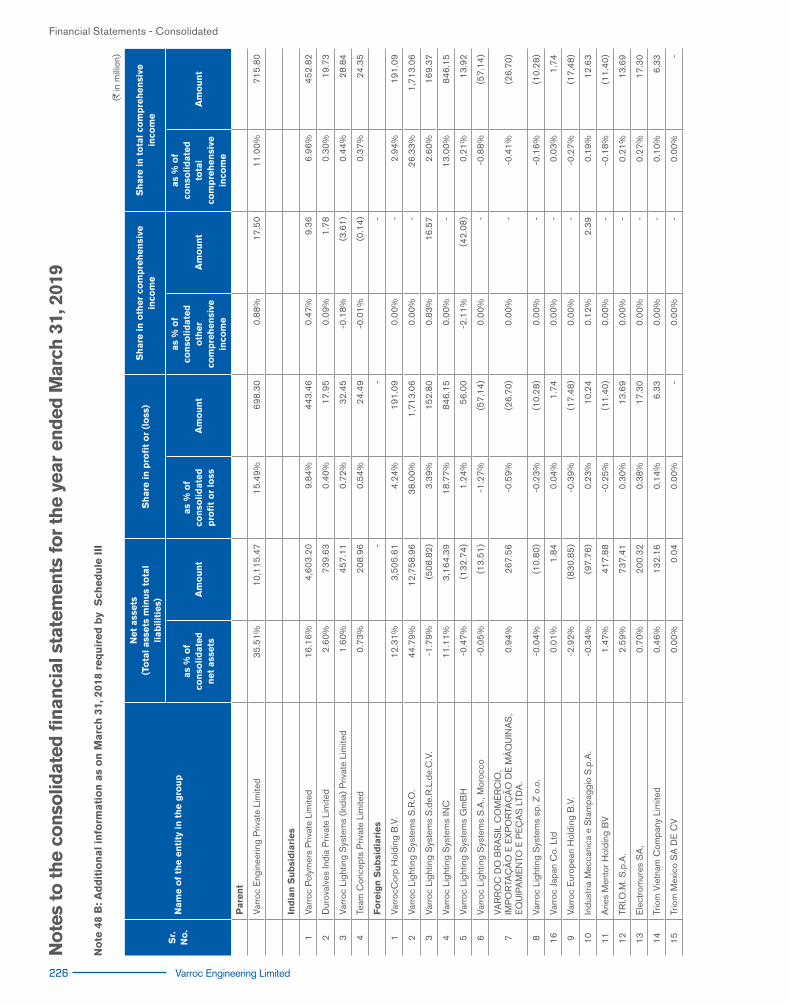
226 Varroc Engineering Limited
No
te 4
8 B
: A
dd
itio
nal in
form
ati
on
as
on
Marc
h 3
1, 2
018
req
uir
ed
by
Sch
ed
ule
III
(`in
mill
ion)
Sr.
N
o.
Nam
e o
f th
e e
nti
ty i
n t
he g
rou
p
Net
ass
ets
(T
ota
l ass
ets
min
us
tota
l li
ab
ilit
ies)
Sh
are
in
pro
fit
or
(lo
ss)
Sh
are
in
oth
er
com
pre
hen
sive
in
com
eS
hare
in
to
tal
com
pre
hen
sive
in
com
e
as
% o
f co
nso
lid
ate
d
net
ass
ets
Am
ou
nt
as
% o
f co
nso
lid
ate
d
pro
fit
or
loss
Am
ou
nt
as
% o
f co
nso
lid
ate
d
oth
er
com
pre
hen
sive
in
com
e
Am
ou
nt
as
% o
f co
nso
lid
ate
d
tota
l co
mp
reh
en
sive
in
com
e
Am
ou
nt
Pare
nt
Varr
oc E
ngin
eerin
g P
rivat
e Li
mite
d35
.51%
10,
115.
47
15.4
9% 6
98.3
0 0.
88%
17.
50
11.0
0% 7
15.8
0
Ind
ian
Su
bsi
dia
ries
1Va
rroc
Pol
ymer
s P
rivat
e Li
mite
d16
.16%
4,6
03.2
0 9.
84%
443
.46
0.47
% 9
.36
6.96
% 4
52.8
2
2D
urov
alve
s In
dia
Priv
ate
Lim
ited
2.60
% 7
39.6
3 0.
40%
17.
95
0.09
% 1
.78
0.30
% 1
9.73
3Va
rroc
Lig
htin
g S
yste
ms
(Indi
a) P
rivat
e Li
mite
d1.
60%
457
.11
0.72
% 3
2.45
-0
.18%
(3.6
1)0.
44%
28.
84
4Te
am C
once
pts
Priv
ate
Lim
ited
0.73
% 2
08.9
6 0.
54%
24.
49
-0.0
1% (0
.14)
0.37
% 2
4.35
Fo
reig
n S
ub
sid
iari
es
-
-
-
1Va
rroc
Cor
p H
oldi
ng B
.V.
12.3
1% 3
,505
.61
4.24
% 1
91.0
9 0.
00%
-
2.94
% 1
91.0
9
2Va
rroc
Lig
htin
g S
yste
ms
S.R
.O.
44.7
9% 1
2,75
8.96
38
.00%
1,7
13.0
6 0.
00%
-
26.3
3% 1
,713
.06
3Va
rroc
Lig
htin
g S
yste
ms
S.d
e.R
.L.d
e.C
.V.
-1.7
9% (5
08.8
2)3.
39%
152
.80
0.83
% 1
6.57
2.
60%
169
.37
4Va
rroc
Lig
htin
g S
yste
ms
INC
11.1
1% 3
,164
.39
18.7
7% 8
46.1
5 0.
00%
-
13.0
0% 8
46.1
5
5Va
rroc
Lig
htin
g S
yste
ms
Gm
BH
-0.4
7% (1
32.7
4)1.
24%
56.
00
-2.1
1% (4
2.08
)0.
21%
13.
92
6Va
rroc
Lig
htin
g S
yste
ms
S.A
., M
oroc
co-0
.05%
(13.
51)
-1.2
7% (5
7.14
)0.
00%
-
-0.8
8% (5
7.14
)
7VA
RR
OC
DO
BR
AS
IL C
OM
ÉR
CIO
, IM
PO
RTA
ÇÃ
O E
EX
PO
RTA
ÇÃ
O D
E M
ÁQ
UIN
AS
, E
QU
IPA
ME
NTO
E P
EÇ
AS
LTD
A.
0.94
% 2
67.5
6 -0
.59%
(26.
70)
0.00
% -
-0
.41%
(26.
70)
8Va
rroc
Lig
htin
g S
yste
ms
sp. Z
o.o
.-0
.04%
(10.
80)
-0.2
3% (1
0.28
)0.
00%
-
-0.1
6% (1
0.28
)
16Va
rroc
Jap
an C
o. L
td0.
01%
1.8
4 0.
04%
1.7
4 0.
00%
-
0.03
% 1
.74
9Va
rroc
Eur
opea
n H
oldi
ng B
.V.
-2.9
2% (8
30.8
5)-0
.39%
(17.
48)
0.00
% -
-0
.27%
(17.
48)
10In
dust
ria M
ecca
nica
e S
tam
pagg
io S
.p.A
.-0
.34%
(97.
76)
0.23
% 1
0.24
0.
12%
2.3
9 0.
19%
12.
63
11A
ries
Men
tor H
oldi
ng B
V1.
47%
417
.88
-0.2
5% (1
1.40
)0.
00%
-
-0.1
8% (1
1.40
)
12TR
I.O.M
. S.p
.A.
2.59
% 7
37.4
1 0.
30%
13.
69
0.00
% -
0.
21%
13.
69
13E
lect
rom
ures
SA
,0.
70%
200
.32
0.38
% 1
7.30
0.
00%
-
0.27
% 1
7.30
14Tr
iom
Vie
tnam
Com
pany
Lim
ited
0.46
% 1
32.1
6 0.
14%
6.3
3 0.
00%
-
0.10
% 6
.33
15Tr
iom
Mex
ico
SA
DE
CV
0.00
% 0
.04
0.00
% -
0.
00%
-
0.00
% -
Financial Statements - Consolidated
No
tes
to t
he c
ons
olid
ated
fin
anci
al s
tate
men
ts f
or
the
year
end
ed M
arch
31,
201
9

Annual Report 2018-19 227
(`in
mill
ion)
Sr.
N
o.
Nam
e o
f th
e e
nti
ty i
n t
he g
rou
p
Net
ass
ets
(T
ota
l ass
ets
min
us
tota
l li
ab
ilit
ies)
Sh
are
in
pro
fit
or
(lo
ss)
Sh
are
in
oth
er
com
pre
hen
sive
in
com
eS
hare
in
to
tal
com
pre
hen
sive
in
com
e
as
% o
f co
nso
lid
ate
d
net
ass
ets
Am
ou
nt
as
% o
f co
nso
lid
ate
d
pro
fit
or
loss
Am
ou
nt
as
% o
f co
nso
lid
ate
d
oth
er
com
pre
hen
sive
in
com
e
Am
ou
nt
as
% o
f co
nso
lid
ate
d
tota
l co
mp
reh
en
sive
in
com
e
Am
ou
nt
Join
t V
en
ture
(Inve
stm
ent a
s pe
r equ
ity m
etho
d)
1Va
rroc
TYC
Cor
pora
tion,
BV
I12
.21%
3,4
77.1
0 14
.93%
672
.91
0.00
% -
10
.34%
672
.91
2N
uova
CTS
S.r.
l0.
31%
87.
86
0.39
% 1
7.37
0.
00%
-
0.27
% 1
7.37
Non
-con
trol
ling
inte
rest
s in
sub
sidi
arie
s0.
73%
207
.67
0.12
% 5
.19
0.02
% 0
.48
0.09
% 5
.67
Su
bto
tal
139%
39,
488.
69
106%
4,7
97.5
2 0.
11%
2.2
5 73
.77%
4,7
99.7
7
Adj
ustm
ent a
risin
g ou
t of c
onso
lidat
ion
-38.
62%
(11,
000.
97)
-6.4
3% (2
89.7
5)99
.89%
1,9
96.4
3 26
.23%
1,7
06.2
8
Tota
l10
0% 2
8,48
7.72
10
0.00
% 4
,507
.77
100.
00%
1,9
98.6
8 10
0.00
% 6
,506
.05
Financial Statements - Consolidated

228 Varroc Engineering Limited
Note 49: Related Party Disclosure.
a. Related parties and their relationships
1 Jointly Controlled Entities Nuova CTS S.r.l, Italy Varroc TYC Corporation, British Virgin Islands Varroc TYC Auto Lamps Co. Ltd., China (Subsidiary of Varroc TYC Corporation, BVI) Varroc TYC Auto Lamps Co. Ltd. CQ, China (Subsidiary of Varroc TYC Auto Lamps Co Ltd China ) Varroc Dell'Orto Private Limited ( w.e.f. Jan 10, 2019) Varroc ELBA Electronics SRL, Romania ( w.e.f. Jan 14, 2019)
2 Key Management Personnel Mr. Tarang Jain - Managing Director Whole time Directors Mr. Arjun Jain (w.e.f. August 07.2018) Mr. Ashwani Maheshwari Non-executive Directors Mr. Naresh Chandra Independent Directors Mr. Gautam Khandelwal Mr. Marc Szulewicz Mrs. Vijaya Sampath Mr. Vinish Kathuria
3 Relatives of Key Management Personnelwith whom transactions have taken place
Mrs. Rochana Jain Mr. Dhruv Jain
4 Enterprises Owned or controlled by key management personnel and/or their relatives with whom transactions have taken place
Endurance Technologies Limited TJ Holdings Trust Naresh Chandra Holdings Trust Suman Jain Holdings TrustMS Consulting services
b. Transactions with related parties
(`in million)
Description of the nature of transactions
Volume of transactions As at March 31, 2019 As at March 31, 2018
For the year ended
March31, 2019
For the year ended
March31, 2018
Receivable Payable Receivable Payable
A] Sale of goods, services and fixed assets*
Endurance Technologies Limited 90.14 91.35 12.58 8.11 -
Varroc TYC Auto Lamps Co. Limited 25.36 45.46 89.86 74.12 -
Nuova CTS S.r.l 0.79 2.97 0.11 0.23 -
Tarang Jain (refer note below) - 83.00 - - -
B] Purchase of goods, services and fixed assets *
Nuova CTS S.r.l 67.52 142.39 22.38 25.12
Varroc TYC Auto Lamps Co. Limited. 12.42 6.96 1.12 0.48
C] Royalty received
Varroc TYC Auto Lamps Co. Limited. 121.45 153.63 63.04 70.90
D] Professional charges paid
Mr. Naresh Chandra 0.57 0.57 - -
Mr. Gautam Khandelwal 1.90 2.70 1.80 2.70
Mr. Marc Szulewicz 3.37 3.70 3.37 3.70
Mrs. Vijaya Sampath 2.30 2.90 2.16 2.90
Financial Statements - Consolidated
Notes to the consolidated financial statements for the year ended March 31, 2019

Annual Report 2018-19 229
(`in million)
Description of the nature of transactions
Volume of transactions As at March 31, 2019 As at March 31, 2018
For the year ended
March31, 2019
For the year ended
March31, 2018
Receivable Payable Receivable Payable
Mr. Vinish Kathuria 2.58 0.68 2.33 0.68
MS Consulting services 4.05 - - -
E] Interest paid
Nuova CTS S.r.l - - 2.46 2.44
F] Directors fees paid
Mr. Naresh Chandra 0.22 0.21 - -
Mr. Gautam Khandelwal 1.60 0.80 - -
Mr. Marc Szulewicz 0.92 0.30 - -
Mrs. Vijaya Sampath 1.20 0.60 - -
Mr. Vinish Kathuria (w.e.f. February 06, 2018) 0.92 0.20 - -
G]Reimburesement of Initial Public Offer expenses (Receivable)
Mr. Tarang Jain 59.45 12.94 - 12.94
H] Dividend paid
Mr. Tarang Jain 5.84 25.40 - -
Mr. Arjun Jain - ** - -
Mr. Dhruv Jain - ** - -
TJ Holdings Trust - 16.93 - -
Naresh Chandra Holdings Trust - 5.00 - -
Suman Jain Holdings Trust - 5.00 - -
I] Managerial remuneration #
Mr. Tarang Jain 84.58 76.92 - -
Mr. Arjun Jain (From August 7,2018) 6.89 4.64 - -
Mr. Ashwani Maheshwari 19.95 14.74 - -
J] Remuneration #
Mr. Arjun Jain (until August 6,2018) 4.51 0.96 - -
Mrs. Rochana Jain 7.93
K] Loan taken/repaid net
Nuova CTS S.r.l - 7.42 -
L] Dividend received
Varroc TYC Auto Lamps Co. Limited. 388.74 243.87 - -
Nuova CTS S.r.l 16.19 7.54 - -
M] Reimbursement of expenses - received
Varroc TYC Auto Lamps Co. Limited. 0.25 - - -
MS Consulting services 1.08 - - -
Financial Statements - Consolidated
Notes to the consolidated financial statements for the year ended March 31, 2019
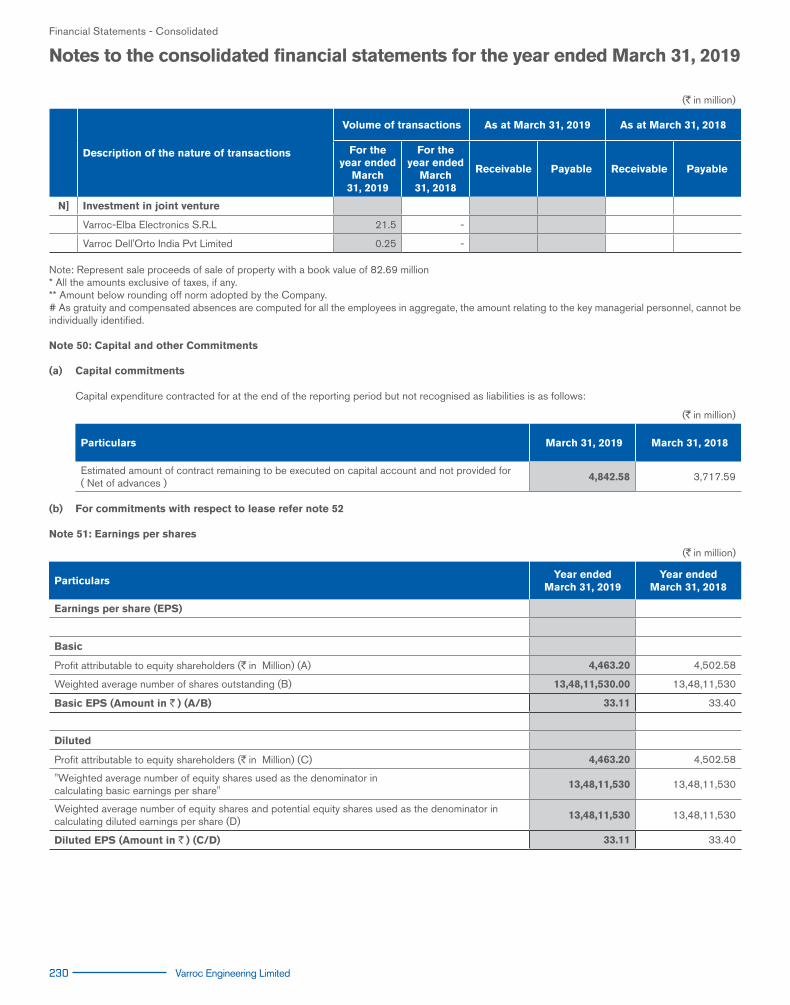
230 Varroc Engineering Limited
(`in million)
Description of the nature of transactions
Volume of transactions As at March 31, 2019 As at March 31, 2018
For the year ended
March31, 2019
For the year ended
March31, 2018
Receivable Payable Receivable Payable
N] Investment in joint venture
Varroc-Elba Electronics S.R.L 21.5 -
Varroc Dell'Orto India Pvt Limited 0.25 -
Note: Represent sale proceeds of sale of property with a book value of 82.69 million * All the amounts exclusive of taxes, if any. ** Amount below rounding off norm adopted by the Company. # As gratuity and compensated absences are computed for all the employees in aggregate, the amount relating to the key managerial personnel, cannot be individually identified.
Note 50: Capital and other Commitments (a) Capital commitments Capital expenditure contracted for at the end of the reporting period but not recognised as liabilities is as follows:
(`in million)
Particulars March 31, 2019 March 31, 2018
Estimated amount of contract remaining to be executed on capital account and not provided for ( Net of advances )
4,842.58 3,717.59
(b) For commitments with respect to lease refer note 52
Note 51: Earnings per shares
(`in million)
ParticularsYear ended
March 31, 2019Year ended
March 31, 2018
Earnings per share (EPS)
Basic
Profit attributable to equity shareholders (`in Million) (A) 4,463.20 4,502.58
Weighted average number of shares outstanding (B) 13,48,11,530.00 13,48,11,530
Basic EPS (Amount in `) (A/B) 33.11 33.40
Diluted
Profit attributable to equity shareholders (`in Million) (C) 4,463.20 4,502.58
"Weighted average number of equity shares used as the denominator in calculating basic earnings per share"
13,48,11,530 13,48,11,530
Weighted average number of equity shares and potential equity shares used as the denominator in calculating diluted earnings per share (D)
13,48,11,530 13,48,11,530
Diluted EPS (Amount in `) (C/D) 33.11 33.40
Financial Statements - Consolidated
Notes to the consolidated financial statements for the year ended March 31, 2019

Annual Report 2018-19 231
Note 52: Disclosures as required as per Ind AS 17 – ‘Accounting for Leases’
Group as lessee (A) Operating leases : The group has obtained various offices and warehouses under non-cancellable operating leases expiring within two to eight years. The leases have
varying terms, escalation clauses and renewal rights. On renewal, the terms of the leases are renegotiated. Lease payments in respect of operating leases included in the Statement of Profit and Loss for the year ended March 31, 2019 `509.05 Million (March 31, 2018 `338.33 Million).
(`in million)
As at March 31, 2019
As at March 31, 2018
Commitments for minimum lease payments in relation to non-cancellable operating leases are payable as follows:
Not Later than one year 397.93 96.24
Later than one year and not later than five years 1,653.39 262.82
Later than five years 1,330.84 88.40
Total ( A ) 3,382.16 447.46
(B) Finance leases : The Group has taken certain plant and machinery on finance lease. The disclosure as required by Ind AS 17 is as follows:
(a) Minimum future Finance lease payments
Not Later than one year 73.91 62.41
Later than one year and not later than five years 83.49 129.14
Total (a) 157.40 191.55
(b) Present value of minimum lease rentals payable
Not later than one year 71.31 58.97
Later than one year but not later than five years 79.40 122.93
Total (b) 150.71 181.90
c) Reconciliation of minimum lease payments and present value
Minimum lease rentals payable as per (a) above 157.40 191.55
Less: Finance charges to be recognized in subsequent years. 6.69 9.65
Present value of minimum lease rentals payable as per (b) above. 150.71 181.90
Apart from the above, some of land and building located in Czech Republic and India is taken on finance lease. The total obligation towards the lease payments has been made in advance as on the date of Balance Sheet.
Group as lessor Operating lease The Group has entered into operating lease on certain premise, with lease term for three years. The Group has recognised income of `37.93 million (March 31, 2018 35.20 million ) towards minium lease payment. Future minimum rentals receivable under non-cancellable operating leases as at March 31, 2019 as follows.
(`in million)
ParticularsAs at
March 31, 2019As at
March 31, 2018
Within one year - 37.93
Financial Statements - Consolidated
Notes to the consolidated financial statements for the year ended March 31, 2019

232 Varroc Engineering Limited
No
te 5
3 : In
tere
sts
in jo
int
ven
ture
s
Set
out
bel
ow a
re th
e jo
int v
entu
res
of th
e gr
oup
as a
t Mar
ch 3
1, 2
019
:
(`in
mill
ion)
Nam
e o
f en
tity
Pla
ce o
f b
usi
ness
% o
f o
wn
ers
hip
Rela
tio
nsh
ipA
cco
un
tin
g
meth
od
Carr
yin
g V
alu
e
As
at
Marc
h
31, 2
019
As
at
Marc
h
31, 2
018
Varr
oc T
YC C
orpo
ratio
n, B
VI a
nd it
s su
bsid
iarie
sC
hin
a/B
riti
sh
Virg
in Is
land
s50
%Jo
int V
entu
reE
quity
Met
hod
3,3
29.4
8 3
,477
.10
Nuo
va C
TS S
.r.l
Italy
50%
Join
t Ven
ture
Equ
ity M
etho
d 8
2.69
8
7.86
Varr
oc-E
lba
Ele
ctro
nics
S.R
.LR
oman
ia70
%Jo
int V
entu
reE
quity
Met
hod
21.
45
-
Varr
oc D
ell'O
rto
Priv
ate
Lim
ited
Indi
a50
%Jo
int V
entu
reE
quity
Met
hod
0.2
5 -
Tota
l 3
,433
.86
3,5
64.9
6
The
join
t ven
ture
ent
ities
are
prim
arily
eng
aged
in th
e bu
sine
ss o
f aut
o co
mpo
nent
s an
d se
rvic
es in
the
auto
mot
ive
indu
stry
.
Com
mitm
ents
and
con
tinge
nt li
abili
ties
in re
spec
t of j
oint
ven
ture
s
(`in
mill
ion)
Part
icu
lars
As
at
Marc
h 3
1, 2
019
As
at
Marc
h 3
1, 2
018
Com
mitm
ents
– jo
int v
entu
res
Varr
oc T
YC C
orpo
ratio
n, B
VI a
nd it
s su
bsid
iarie
s 6
3.68
6
4.57
Su
mm
ari
sed
fin
an
cial in
form
ati
on
fo
r jo
int
ven
ture
s Th
e su
mm
aris
ed fi
nanc
ial i
nfor
mat
ion
for j
oint
ven
ture
s di
sclo
sed
belo
w, r
efle
cts
the
amou
nts
pres
ente
d in
the
finan
cial
sta
tem
ents
of t
he re
leva
nt jo
int v
entu
res
and
not V
arro
c's
shar
e of
thos
e am
ount
s.
(i)
Su
mm
ari
sed
bala
nce
sh
eet
(`in
mill
ion)
Varr
oc
TYC
Co
rpo
rati
on
, BV
I (C
on
soli
date
d)
No
va C
TS s
rlV
arr
oc-
Elb
a E
lect
ron
ics
S.R
.L
w.e
.f
14.0
1.20
19
Varr
oc
Dell
'Ort
o P
vt. L
td.
W.e
.f 1
0-01
-201
9
As
at
Marc
h31
, 201
9A
s at
Marc
h31
, 201
8A
s at
Marc
h31
, 201
9A
s at
Marc
h31
, 201
8A
s at
Marc
h31
, 201
9A
s at
Marc
h31
, 201
8A
s at
Marc
h31
, 201
9A
s at
Marc
h31
, 201
8
Cu
rren
t ass
ets
Cas
h an
d ca
sh e
quiv
alen
ts 4
02.9
8 1
,204
.76
18.
11
47.
09
30.
64
-
0.5
0 -
Oth
er a
sset
s 5
,523
.08
6,3
36.3
2 4
2.73
3
9.94
-
-
-
-
Tota
l cu
rren
t ass
ets
5,9
26.0
6 7
,541
.08
60.
84
87.
03
30.
64
-
0.5
0 -
Tota
l n
on
-cu
rren
t ass
ets
5,8
31.4
4 4
,372
.42
1.5
7 1
.76
-
-
-
-
Cu
rren
t liab
ilit
ies
Fina
ncia
l lia
bilit
ies
1,2
54.8
2 1
,552
.88
-
-
-
-
-
-
Oth
er li
abili
ties
3,4
34.2
4 3
,246
.46
25.
34
35.
26
-
-
-
-
Tota
l cu
rren
t liab
ilit
ies
4,6
89.0
6 4
,799
.34
25.
34
35.
26
-
-
-
-
Financial Statements - Consolidated
No
tes
to t
he c
ons
olid
ated
fin
anci
al s
tate
men
ts f
or
the
year
end
ed M
arch
31,
201
9
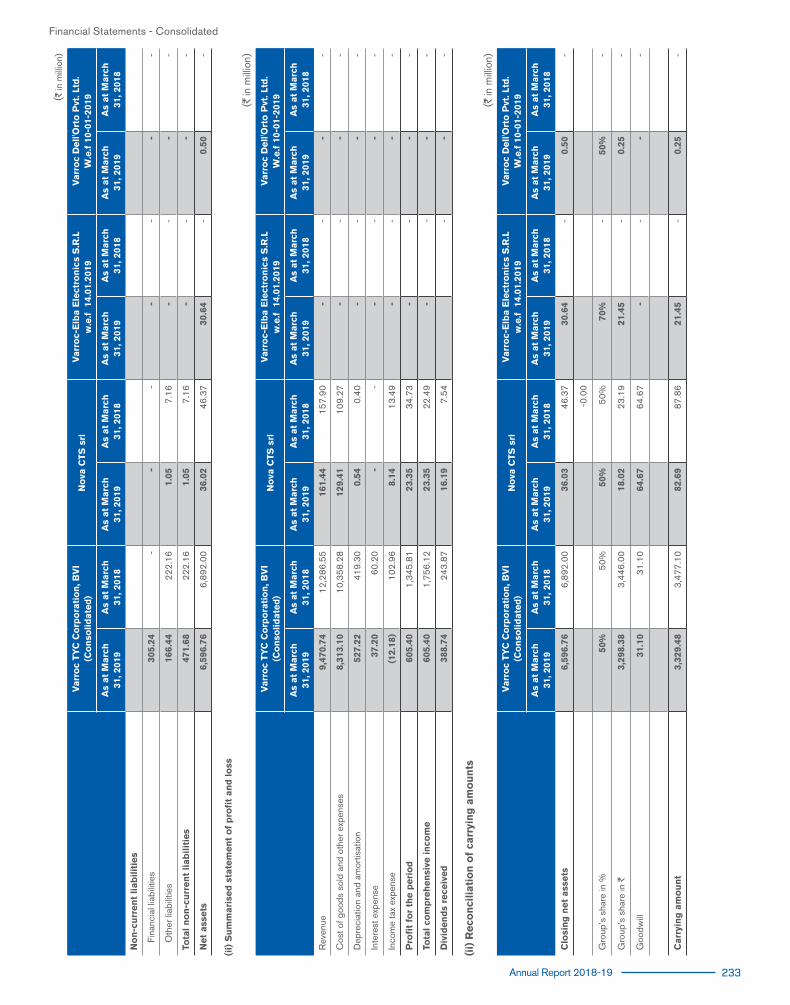
Annual Report 2018-19 233
Financial Statements - Consolidated
(`in
mill
ion)
Varr
oc
TYC
Co
rpo
rati
on
, BV
I (C
on
soli
date
d)
No
va C
TS s
rlV
arr
oc-
Elb
a E
lect
ron
ics
S.R
.L
w.e
.f
14.0
1.20
19
Varr
oc
Dell
'Ort
o P
vt. L
td.
W.e
.f 1
0-01
-201
9
As
at
Marc
h31
, 201
9A
s at
Marc
h31
, 201
8A
s at
Marc
h31
, 201
9A
s at
Marc
h31
, 201
8A
s at
Marc
h31
, 201
9A
s at
Marc
h31
, 201
8A
s at
Marc
h31
, 201
9A
s at
Marc
h31
, 201
8
No
n-c
urr
en
t liab
ilit
ies
Fina
ncia
l lia
bilit
ies
305
.24
-
-
-
-
-
-
-
Oth
er li
abili
ties
166
.44
222
.16
1.0
5 7
.16
-
-
-
-
Tota
l n
on
-cu
rren
t liab
ilit
ies
471
.68
222
.16
1.0
5 7
.16
-
-
-
-
Net
ass
ets
6,5
96.7
6 6
,892
.00
36.
02
46.
37
30.
64
-
0.5
0 -
(ii)
Su
mm
ari
sed
sta
tem
en
t o
f p
rofi
t an
d l
oss
(`in
mill
ion)
Varr
oc
TYC
Co
rpo
rati
on
, BV
I (C
on
soli
date
d)
No
va C
TS s
rlV
arr
oc-
Elb
a E
lect
ron
ics
S.R
.L
w.e
.f
14.0
1.20
19V
arr
oc
Dell
'Ort
o P
vt. L
td.
W.e
.f 1
0-01
-201
9
As
at
Marc
h31
, 201
9A
s at
Marc
h31
, 201
8A
s at
Marc
h31
, 201
9A
s at
Marc
h31
, 201
8A
s at
Marc
h31
, 201
9A
s at
Marc
h31
, 201
8A
s at
Marc
h31
, 201
9A
s at
Marc
h31
, 201
8
Rev
enue
9,4
70.7
4 1
2,28
6.55
1
61.4
4 1
57.9
0 -
-
-
-
Cos
t of g
oods
sol
d an
d ot
her e
xpen
ses
8,3
13.1
0 1
0,35
8.28
1
29.4
1 1
09.2
7 -
--
-
Dep
reci
atio
n an
d am
ortis
atio
n 5
27.2
2 4
19.3
0 0
.54
0.4
0 -
-
-
-
Inte
rest
exp
ense
37.
20
60.
20
-
-
-
-
-
-
Inco
me
tax
expe
nse
(12
.18)
102
.96
8.1
4 1
3.49
-
-
-
-
Pro
fit
for
the p
eri
od
605
.40
1,3
45.8
1 2
3.35
3
4.73
-
-
-
-
Tota
l co
mp
reh
en
sive
in
com
e 6
05.4
0 1
,756
.12
23.
35
22.
49
-
-
-
-
Div
iden
ds
rece
ived
388
.74
243
.87
16.
19
7.5
4 -
-
-
(ii)
Reco
nci
liati
on
of
carr
yin
g a
mo
un
ts
(`in
mill
ion)
Varr
oc
TYC
Co
rpo
rati
on
, BV
I (C
on
soli
date
d)
No
va C
TS s
rlV
arr
oc-
Elb
a E
lect
ron
ics
S.R
.L
w.e
.f
14.0
1.20
19V
arr
oc
Dell
'Ort
o P
vt. L
td.
W.e
.f 1
0-01
-201
9
As
at
Marc
h31
, 201
9A
s at
Marc
h31
, 201
8A
s at
Marc
h31
, 201
9A
s at
Marc
h31
, 201
8A
s at
Marc
h31
, 201
9A
s at
Marc
h31
, 201
8A
s at
Marc
h31
, 201
9A
s at
Marc
h31
, 201
8
Clo
sin
g n
et
ass
ets
6,5
96.7
6 6
,892
.00
36.
03
46.
37
30.
64
-
0.5
0 -
-0.
00
Gro
up’s
sha
re in
%50
%50
%50
%50
%70
% -
50
% -
Gro
up’s
sha
re in
` 3
,298
.38
3,4
46.0
0 1
8.02
2
3.19
2
1.45
-
0
.25
-
Goo
dwill
31.
10
31.
10
64.
67
64.
67
-
-
-
-
Carr
yin
g a
mo
un
t 3
,329
.48
3,4
77.1
0 8
2.69
8
7.86
2
1.45
-
0
.25
-

234 Varroc Engineering Limited
Note 54 (a): Business combination
Summary of acquisition
On July 02, 2018, the Group acquired "SA-BA Endustriyel Urunler Imalat ve Ticaret Anonim Sirketi " ("Turkey Subsidiary"), a Turkey based company engaged in the manufacture and supply of interior and exterior lighting products mainly for the automotive sector for a purchase consideration of `3,453.07 million (Eur 43.30 Million) paid in cash.
The assets and liabilities recognised at fair value as a result of the acquisition as at the acquisition date are as follows:
(`in million)
Non Current Assets
Property plant & equipment 680.80
Intangible assets 826.58
Capital work-in-progress 30.54
Non Current Financial Assets
Other financial assets 126.32
Current Asset
Inventories 259.02
Financial Assets
Trade receivables 406.63
Cash and cash equivalents 8.29
Other current assets 209.98
Total Asset 2,548.17
Non-current liabilities
Provisions 91.79
Deferred tax liabilities (Net) 283.42
Borrowings 373.46
Financial liabilities
Trade payables 262.69
Provisions
Current tax liabilities (Net) 67.55
Other current liabilities 24.16
Total Liabilities 1,103.07
Net identifiable asset acquired 1,445.10
Calculation of Goodwill
Fair value of consideration 3,453.07
Less: Net identifiable assets acquired (1,445.10)
Goodwill on acquisition 2,007.96
As part of the purchase price allocation, the Group has recognised Customer relationships and Brand (presented under Patents and others in note 5(a)) at their acquisition date fair values which assets were not recognised in the acquiree's books before the acquisition. (Refer note 5(a) for details)
From the date of acquisition, Turkey Subsidiary has contributed `2,037.6 Million of revenue and `376.96 Million to the profit before tax from continuing operations of the Group. If the combination had taken place at the beginning of the year, revenue from continuing operations would have been `2,593.6 Million and the profit before tax from continuing operations for the Group would have been `505.75 Million.
Financial Statements - Consolidated
Notes to the consolidated financial statements for the year ended March 31, 2019
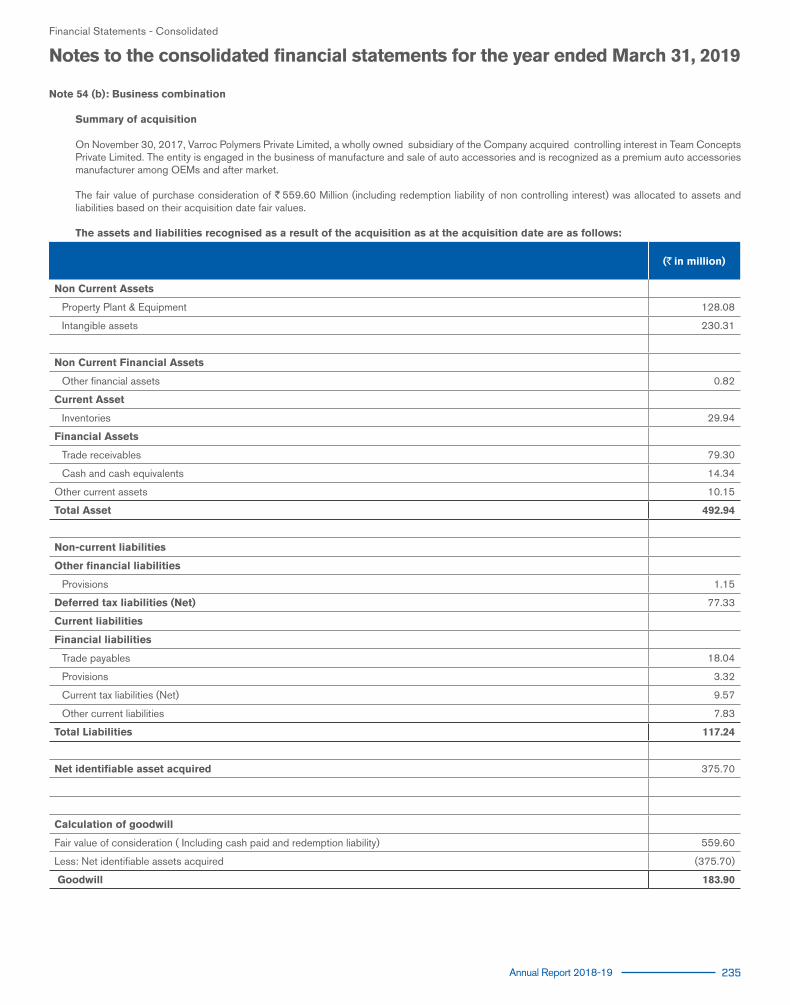
Annual Report 2018-19 235
Note 54 (b): Business combination
Summary of acquisition On November 30, 2017, Varroc Polymers Private Limited, a wholly owned subsidiary of the Company acquired controlling interest in Team Concepts
Private Limited. The entity is engaged in the business of manufacture and sale of auto accessories and is recognized as a premium auto accessories manufacturer among OEMs and after market.
The fair value of purchase consideration of `559.60 Million (including redemption liability of non controlling interest) was allocated to assets and liabilities based on their acquisition date fair values.
The assets and liabilities recognised as a result of the acquisition as at the acquisition date are as follows:
(`in million)
Non Current Assets
Property Plant & Equipment 128.08
Intangible assets 230.31
Non Current Financial Assets
Other financial assets 0.82
Current Asset
Inventories 29.94
Financial Assets
Trade receivables 79.30
Cash and cash equivalents 14.34
Other current assets 10.15
Total Asset 492.94
Non-current liabilities
Other financial liabilities
Provisions 1.15
Deferred tax liabilities (Net) 77.33
Current liabilities
Financial liabilities
Trade payables 18.04
Provisions 3.32
Current tax liabilities (Net) 9.57
Other current liabilities 7.83
Total Liabilities 117.24
Net identifiable asset acquired 375.70
Calculation of goodwill
Fair value of consideration ( Including cash paid and redemption liability) 559.60
Less: Net identifiable assets acquired (375.70)
Goodwill 183.90
Financial Statements - Consolidated
Notes to the consolidated financial statements for the year ended March 31, 2019

236 Varroc Engineering Limited
The goodwill recognized in connection with the acquisition is primarily attributable to anticipated synergies from future growth. From the date of acquisition, Entity contributed ̀ 93 Million of revenue and ̀ 24.29 Million to the profit before tax from continuing operations of the Group for the previous year. If the combination had taken place at the beginning of the previous year, revenue from continuing operations would have been `332.74 Million and the profit before tax from continuing operations for the Group would have been `72.85 Million for the year ended March 31, 2018. The accompanying notes are an integral part of these consolidated financial statements
As per our report of even date For and on behalf of the Board of Directors
For S R B C & CO LLP TARANG JAIN GAUTAM KHANDELWAL Chartered Accountants Managing Director Director ICAI Firm Registration Number: 324982E/E300003 (DIN 00027505) (DIN 00270717)
ASHWANI MAHESHWARI CEO and Whole Time Director (DIN 07341295) per Paul Alvares THARUVAI R. SRINIVASAN RAKESH M.DARJI Partner Group CFO Company Secretary Membership No: 105754 (Membership No: ACS13085)
Place: Mumbai Place: Mumbai Date: May 24, 2019 Date: May 24, 2019
Financial Statements - Consolidated
Notes to the consolidated financial statements for the year ended March 31, 2019

Annual Report 2018-19 237
FO
RM
AO
C-1
STA
TEM
EN
T C
ON
TAIN
ING
SA
ILE
NT
FE
ATU
RE
S O
F T
HE
FIN
AN
CIA
L S
TATE
ME
NT
OF
SU
BS
IDIA
RIE
S /
AS
SO
CIA
TES
CO
MP
AN
IES
/
JOIN
T V
EN
TUR
ES
[Pu
rsu
an
t to
fir
st
pro
visi
o o
f S
ub
-Sect
ion
(3)
of
Sect
ion
129
read
wit
h R
ule
5 o
f C
om
pan
ies
(Acc
ou
nts
) R
ule
s,20
14]
(A)
SU
BS
IDIA
RY
CO
MP
AN
IES
(`in
mill
ion)
Nam
e o
f S
ub
sid
iary
C
om
pan
yR
ep
ort
ing
C
urr
en
cyA
mo
un
t in
E
xch
an
ge
Rate
Cap
ital
Sha
re
App
licat
ion
M
one
y R
ecei
ved
Rese
rves
Tota
l A
ssets
Tota
l Li
ab
ilit
ies
Inve
stm
ent
(Ref
erno
te 2
)Tu
rno
ver
Pro
fit
Befo
re
Tax
Pro
visi
on
F
or
Tax
(Net
of
Wri
te
back
)
Pro
fit
aft
er
Tax
Pro
po
sed
D
ivid
en
d %
Sh
are
H
old
ing
Varr
oc P
olym
ers
Priv
ate
Lim
ited
``
in M
illio
ns -
5
.29
-
4,9
78.8
0 9
,460
.78
4,4
76.6
9 5
43.5
4 16
,002
.74
588
.16
192
.85
395
.32
-
100%
Dur
oval
ves
Indi
a P
rivat
e Li
mite
d`
`in
Mill
ions
-
43.
21
-
820
.19
1,2
65.7
7 4
02.3
7 0
.03
1,3
12.1
3 1
73.0
0 4
6.39
1
26.6
1 -
72
.78%
Varr
oc L
ight
ing
Sys
tem
s (In
dia)
P
rivat
e Li
mite
d`
`in
Mill
ions
-
4.4
0 -
5
88.4
2 1
,855
.58
1,2
62.7
6 0
.03
2,4
71.2
9 1
94.5
7 6
1.22
1
33.3
5 -
10
0%
Team
Con
cept
s P
rivat
e Li
mite
d`
`in
Mill
ions
-
3.0
6 -
2
90.7
1 3
25.6
1 3
1.85
0
.01
323
.70
119
.30
34.
69
84.
62
-
95%
Varr
ocC
orp
Hol
ding
B.V
. €
`in
Mill
ions
76.
62
2,8
37.8
0 -
1
,184
.92
8,8
24.9
6 4
,802
.24
7,3
28.4
7 -
7
58.4
5 5
9.74
6
98.7
2 -
10
0%
Varr
oc L
ight
ing
Sys
tem
s S
.R.O
. C
zk`
in M
illio
ns 2
.97
892
.78
-
11,1
55.2
7 36
,706
.50
24,6
58.4
5 2
,106
.36
49,4
38.4
9 7
54.5
8 (4
20.1
5) 1
,174
.73
-
99.9
9%
Varr
oc L
ight
ing
Sys
tem
s S
.de.
R.L
.de.
C.V
. U
S$
`
in M
illio
ns 6
8.52
1
,590
.20
-
(180
.66)
5,9
17.9
7 4
,508
.43
-
16,7
54.9
5 8
55.6
2 2
81.6
4 5
73.9
7 -
10
0%
Varr
oc L
ight
ing
Sys
tem
s IN
CU
S$
`in
Mill
ions
68.
52
2,0
70.7
9 1
,746
.21
7,8
45.8
1 4
,028
.81
-
19,5
40.7
5 8
12.4
7 2
18.5
2 5
93.9
5 -
10
0%
Varr
oc L
ight
ing
Sys
tem
s G
mB
H€
`in
Mill
ions
76.
62
1.9
2 (5
1.38
) 2
38.6
9 2
88.1
6 8
44.1
2 9
8.94
(7
5.81
) 1
74.7
5 -
10
0%
Varr
oc L
ight
ing
Sys
tem
s S
.A.,
Mor
occo
MA
D`
in M
illio
ns 7
.18
47.
20
(269
.04)
3,1
50.5
3 3
,372
.36
278
.85
(214
.04)
-
(214
.04)
-
100%
VAR
RO
C D
O B
RA
SIL
C
OM
ÉR
CIO
, IM
PO
RTA
ÇÃ
O E
E
XP
OR
TAÇ
ÃO
DE
MÁ
QU
INA
S,
EQ
UIP
AM
EN
TO E
PE
ÇA
S L
TDA
.
BR
L`
in M
illio
ns17
.404
6 2
61.0
7 (2
65.5
2) 1
,379
.13
1,3
83.5
9 2
40.8
4 (2
57.3
0) -
(2
57.3
0) -
10
0%
Varr
oc L
ight
ing
Sys
tem
s sp
. Z o
.o.
€`
in M
illio
ns 7
6.62
0
.09
-
(65.
04)
298
.00
362
.95
-
175
.27
(58.
12)
-
(58.
12)
-
100%
VAR
RO
C L
IGH
TIN
G S
YSTE
MS
TU
RK
EY
EN
DÜ
STR
iYE
L Ü
RÜ
NLE
R iM
ALA
T V
E T
iCA
RE
T A
NO
NiM
SiR
KE
Ti
TRY
`in
Mill
ions
12.2
75 1
5.34
-
1
,454
.53
2,2
53.3
4 7
83.4
6 -
2
,017
.47
367
.86
76.
41
291
.45
-
100%
Varr
oc L
ight
ing
Sys
tem
s B
ulga
ria
EO
OD
€`
in M
illio
ns 7
6.62
0
.04
-
(3.0
4) 4
92.3
4 4
95.3
4 -
2
0.13
9
.10
0.4
6 8
.65
-
100%
Varr
oc J
apan
Co.
Ltd
Y`
in M
illio
ns0.
6249
0.0
6 -
5
.41
6.9
7 1
.49
-
25.
61
4.1
4 -
4
.14
-
100%
Varro
c Eu
rope
an H
oldi
ng B
.V.
€`
in M
illio
ns 7
6.62
1
,591
.17
-
(2,3
94.1
6) 1
,533
.03
2,3
36.0
2 -
1
2.14
(6
.50)
-
(6.5
0) -
10
0%
Indu
stria
Mec
cani
ca e
Sta
mpa
ggio
S
.p.A
.€
`in
Mill
ions
76.
62
444
.60
-
(446
.26)
2,4
97.0
9 2
,490
.93
92.
11
3,0
50.6
9 7
3.85
(6
.57)
80.
42
-
100%
Arie
s M
ento
r Hol
ding
BV
€`
in M
illio
ns 7
6.62
7
85.1
6 -
(3
93.8
5) 7
06.6
0 3
15.2
8 7
05.0
8 -
(9
.89)
-
(9.8
9) -
10
0%
Varro
c Li
ghtin
g S
yste
ms
Italy
S.p
.A.
€`
in M
illio
ns 7
6.62
2
71.9
2 -
4
82.6
4 1
,761
.44
1,0
06.8
7 4
20.9
1 1
,671
.97
64.
50
13.
64
50.
86
-
100%
Varr
oc L
ight
ing
Sys
tem
s R
oman
ia
S.A
LEU
`in
Mill
ions
16.3
0 1
10.5
3 -
8
6.48
5
17.2
0 3
20.2
0 -
3
81.1
8 9
.22
2.0
5 7
.17
100%
Varr
oc L
ight
ing
Sys
tem
s V
iet N
am
Co.
Ltd
.V
ND
`in
Mill
ions
0.00
3 6
3.25
-
1
78.0
6 5
21.9
8 2
80.6
6 -
7
32.4
1 1
25.4
6 1
5.28
1
10.1
8 -
10
0%
Trio
m M
exic
o S
A D
E C
VM
ex$
`in
Mill
ions
3.51
0.0
35
-
-
15.
48
15.
44
-
-
-
-
-
-
100%
Not
e: 1
) R
epor
ting
perio
d fo
r Var
roc
Ligh
ting
Sys
tem
es S
.de.
R.L
.de.
C.V
. is
Janu
ary
to D
ecem
ber.
For a
ll ot
her e
ntiti
es, t
he s
ame
is A
pril-
Mar
ch.
2
) In
vest
men
t sho
wn
at fa
ir va
lue
net o
f pro
visi
on, w
here
app
licab
le.

238 Varroc Engineering Limited
(B)
AS
SO
CIA
TES
AN
D J
OIN
T V
EN
TUR
ES
(`in
mill
ion)
Nam
e o
f A
sso
ciate
s/ J
oin
t V
en
ture
s
Late
stA
ud
ited
B
ala
nce
S
heet
Date
Sh
are
of
Ass
oci
ate
s /
Join
t V
en
ture
s h
eld
by
the
Co
mp
an
y ye
ar
en
dN
etw
ort
h
Att
rib
utab
le t
o
Sha
reho
ldin
g
as p
er la
test
B
alan
ce s
heet
(`
In m
illio
n)
PR
OF
IT/L
OS
SS
FO
R T
HE
Y
EA
RD
esc
rip
tio
n
of
ho
w
there
is
sig
nif
ican
t in
flu
en
ce
Reaso
n w
hy
the A
sso
ciate
/jo
int
Ven
ture
is
no
t co
nso
lid
ate
dN
o.
Am
ou
nt
of
Inve
stm
en
t in
A
sso
ciate
s/jo
int
ven
ture
(`
in m
illi
on
)
Ext
ent
of
Ho
ldin
g %
Co
nsid
er in
co
nso
lidat
ion
(`
In m
illio
n)
No
t C
ons
ider
in
Co
nso
lidat
ion
(`
In m
illio
n)
1N
uova
CTS
Ital
y31
/03/
19`
in c
rore
s25
000
76.
62
50%
18.
02
11.
68
11.
68
-
Con
solid
ated
as
per e
quity
met
hod
2Va
rroc
TYC
,BV
I`
in c
rore
s0
-
-
-
-
-
NA
R
efer
not
e-2
3Va
rroc
TYC
Aut
o La
mps
Co.
Ltd
., C
hina
31/1
2/18
`in
cro
res
1094
5942
7 1
,072
.54
50%
3,2
98.3
8 3
02.7
0 3
02.7
0 -
C
onso
lidat
ed a
s pe
r equ
ity m
etho
d
4Va
rroc
-Elb
a E
lect
roni
cs S
.R.L
NA
`in
cro
res
2800
0 2
1.45
70
% -
-
-
-
C
onso
lidat
ed a
s pe
r equ
ity m
etho
d
5Va
rroc
Del
l'Ort
o P
rivat
e Li
mite
d N
A`
in c
rore
s25
000
0.2
5 50
% -
-
-
-
C
onso
lidat
ed a
s pe
r equ
ity m
etho
d
Not
e: 1
) R
epor
ting
perio
d fo
r Var
roc
TYC
Aut
o La
mps
Co.
Ltd
., Va
rroc
TYC
, BV
I and
Var
roc
TYC
Aut
o La
mps
CQ
Chi
na,
is J
anua
ry to
Dec
embe
r. Fo
r all
othe
r ent
ities
, the
sam
e is
Apr
il- M
arch
.
2)
Ther
e is
no
sign
ifica
nt o
pera
tion
base
d on
mat
eria
lity.
For a
nd o
n be
half
of th
e B
oard
of D
irect
ors
TAR
AN
G J
AIN
GA
UTA
M K
HA
ND
ELW
AL
Man
agin
g D
irect
or
D
irect
or
(DIN
000
2750
5)
(D
IN 0
0270
717)
AS
HW
AN
I M
AH
ES
HW
AR
I
C
EO
and
Who
le T
ime
Dire
ctor
(DIN
073
4129
5)
TH
AR
UV
AI
R. S
RIN
IVA
SA
N
RA
KE
SH
M.D
AR
JI
Gro
up C
FO
C
ompa
ny S
ecre
tary
(Mem
bers
hip
No:
AC
S13
085)
Pla
ce: M
umba
i D
ate:
May
24,
201
9

Annual Report 2018-19 239
Notice to Shareholders
NOTICE is hereby given that the 31st Annual General Meeting of the Members of Varroc Engineering Limited will be held at the Auditorium Hall located at the Registered Office of the Company situated at L-4, MIDC Industrial Area, Waluj, Aurangabad-431136, Maharashtra, India on Friday, 9th day of August, 2019 at 10:00 a.m.to transact, the following businesses:
ORDINARY BUSINESS:
1. To receive, consider and adopt:
(a) the Audited Standalone Financial Statements of the Company for the Financial Year ended March 31, 2019 and the reports of the Board of Directors and Auditors thereon;
(b) the Audited Consolidated Financial Statements of the Company for the Financial Year ended March 31, 2019 and the report of the Auditors thereon;
and in this regard, to pass the following resolution as an Ordinary Resolution: “RESOLVED THAT the audited Financial Statements (Standalone and Consolidated) of the Company for the financial year ended March 31, 2019
along with reports of the Board of Directors and Independent Auditors thereon as laid before the meeting, be and are hereby received, considered, approved and adopted.”
2. To declare a dividend on Ordinary (Equity) Shares.
3. To appoint a Director in the place of Mr. Naresh Chandra who retires by rotation and being eligible, offers himself for re-appointment and in this regard, to pass the following resolution as an Ordinary Resolution:
“RESOLVED THAT pursuant to the provisions of Section 152 of the Companies Act, 2013, Mr. Naresh Chandra (DIN 00027696), who retires by rotation at this annual general meeting and being eligible offers himself for re-appointment, be and is hereby re-appointed as Director of the Company, liable to retire by rotation.”
SPECIAL BUSINESS:
4. To Increase borrowing limits of the Company To consider, and if thought fit, to pass with or without modifications, the following resolution as a Special Resolution: "RESOLVED THAT in supersession of the earlier Resolution passed by the Members at their Extra-ordinary General Meeting held on November 2,
2013 and pursuant to the provisions of Section 180 (1)(c) and other applicable provisions, if any, of the Companies Act, 2013 (“the Act”) (including any modification or re-enactment thereof for the time being in force) read with Rules made thereunder, the Memorandum and Articles of Association of the Company and subject to such other approvals and permissions as may be required, consent of the Members be and is hereby accorded to the Board of Directors (hereinafter referred to as “the Board”, which term shall be deemed to include, unless the context otherwise requires, any committee of the Board or any officer(s) authorized by the Board to exercise the powers conferred on the Board under this resolution), to borrow from time to time any sum or sums of monies (exclusive of interest) on such terms and conditions as may be determined, from anyone or more of the Company's bankers and/or from other banks, persons, firms, companies/bodies corporate, financial institutions, institutional investor(s), mutual funds, insurance companies, pension funds and/or any entity/entities or authority/authorities, whether in India or abroad, and whether by way of cash credit, advance or deposits, loans or bill discounting, issue of debentures, long term loans, suppliers' credit, securitized instruments such as floating rate notes, fixed rate notes, syndicated loans, commercial borrowing from the private sector window of multilateral financial institution, either in rupees and/or in such other foreign currencies as may be permitted by law from time to time, and/or any other instruments/securities or otherwise and whether unsecured or secured by mortgage, charge, hypothecation or lien or pledge of the Company's assets, licences and properties, whether immovable or movable and all or any of the undertaking of the Company, notwithstanding that the moneys to be borrowed together with the moneys already borrowed by the Company (apart from temporary loans obtained from the Company's bankers in the ordinary course of business) will or may exceed the aggregate of the paid-up capital of the Company and its free reserves and securities premium account of the Company, that is to say, reserves not set apart for any specific purpose, so that the total amount upto which the moneys may be borrowed by the Company and outstanding at any time shall not exceed the sum of `2,000 Crore (Rupees Two Thousand Crore Only).”
“RESOLVED FURTHER THAT in connection with the aforesaid, the Board of Directors be and is hereby authorized to do all such acts, deeds, matters and things as may be deemed necessary, desirable, proper or expedient for the purpose of giving effect to this Resolution and for matters connected therewith or incidental thereto."
5. Creation of Mortgage/Charge on the assets of the Company
To consider, and if thought fit, to pass with or without modifications, the following resolution as a Special Resolution:
"RESOLVED THAT in supersession of the earlier Resolution passed by the Members at their Extra-ordinary General Meeting held on August 30, 2014 and pursuant to the provisions of Section 180(1)(a) and other applicable provisions, if any, of the Companies Act, 2013 (“the Act”) (including any modification or re-enactment thereof for the time being in force) read with Rules made thereunder, the Memorandum and Articles of Association of the Company and subject to such other approvals and permissions as may be required, consent be and is hereby accorded to the Board of Directors (hereinafter referred to as “the Board”, which term shall be deemed to include, unless the context otherwise requires, any committee of the Board or any officer(s) authorized by the Board to exercise the powers conferred on the Board under this resolution), to sell, mortgage and / or charge, in addition to the mortgages / charges already created / to be created by the Company in such form and manner and with such ranking and at such time and on such terms and conditions as may be determined, on all or any of the movable and / or immovable properties of the Company, and / or

240 Varroc Engineering Limited
the interest held by the Company in all or any of the movable and / or immovable properties, both present and future and / or the whole or any part of the undertaking(s) of the Company, together with the power to take over the management of business and concern of the Company in certain events of default, in favour of the Company's bankers and/or other banks, persons, firms, companies/bodies corporate, trustee(s), financial institution(s), institutional investor(s), mutual fund(s), insurance company/ies, pension fund(s) and/or any entity/entities or authority/authorities, whether in India or abroad, for securing the borrowings of the Company already availed/to be availed, from time to time, PROVIDED THAT the total outstanding amount at any time so secured shall not exceed `2,000 crores (exclusive of interest and other charges) or upto such higher amount/s as may be so consented by the members of the Company from time to time, in future pursuant to Section 180(1)(c) of the Act.”
“RESOLVED FURTHER THAT the Board of Directors be and is hereby authorized to and cause to prepare, finalise, approve and execute on behalf of the Company, all documents, deeds, agreements, declarations, undertakings and writings as may be necessary and/or expedient for giving effect to the foregoing resolution and to vary and /or alter the terms and conditions of the security created/to be created as aforesaid as it may deem fit and generally to do and/or cause to do all acts, deeds matters and things as may be necessary, proper, expedient or incidental for the purpose of giving effect to this resolution.”
6. Increase in the limits applicable for making investments / extending loans and giving guarantees or providing securities in connection with loans to Persons / Bodies Corporate
To consider, and if thought fit, to pass with or without modifications, the following resolution as a Special Resolution:
“RESOLVED THAT in supersession of the earlier Resolution passed by the Members at their Annual General Meeting held on November 1, 2016 and pursuant to the provisions of Section 186 and other applicable provisions, if any, of the Companies Act, 2013 (“the Act”) (including any modification or re-enactment thereof for the time being in force) read with Rules made thereunder, the Memorandum and Articles of Association of the Company and subject to such other approvals and permissions as may be required, consent of the Members of the Company be and is hereby accorded to the Board of Directors of the Company (hereinafter referred to as “the Board”, which term shall be deemed to include, unless the context otherwise requires, any committee of the Board or any officer(s) authorized by the Board to exercise the powers conferred on the Board under this resolution), to (i) give any loan to any person or other body corporate; (ii) give any guarantee or provide any security in connection with a loan to any other body corporate or person and (iii) acquire by way of subscription, purchase or otherwise, the securities of any other body corporate, as they may in their absolute discretion deem beneficial and in the interest of the Company, subject however that the aggregate of the loans and investments so far made in and the amount for which guarantees or securities have so far been provided to all persons or bodies corporate along with the additional investments, loans, guarantees or securities proposed to be made or given or provided by the Company, from time to time, in future and outstanding at any time shall not exceed a sum of `1,800 Crores (Rupees One Thousand Eight Hundred Crores only) over and above the limit of 60% of the paid-up share capital, free reserves and securities premium account of the Company or 100% of free reserves and securities premium account of the Company, whichever is more, as prescribed under Section 186 of the Act.”
“RESOLVED FURTHER THAT in connection with the aforesaid, the Board of Directors be and is hereby authorized to do all such acts, deeds, matters and things as may be deemed necessary, desirable, proper or expedient for the purpose of giving effect to this Resolution and for matters connected therewith or incidental thereto."
7. Ratification of remuneration of Cost Auditor
To consider and if thought fit, to pass, with or without modification(s), the following resolution as an Ordinary Resolution:
“RESOLVED THAT pursuant to the provisions of Section 148 and other applicable provisions, if any, of the Companies Act, 2013 (“the Act”) (including any modification or re-enactment thereof for the time being in force) read with Rules made thereunder, the remuneration of `3,00,000 (Rupees Three Lakh only) plus applicable taxes thereon and reimbursement of out of pocket expenses, if any, as approved by the Board of Directors for conducting Audit of the Cost Accounting Records of the Company for the financial year commencing from April 01, 2019 till March 31, 2020 or extended financial year as may be decided by the Board, payable to M/s. S. R. Bhargave & Co., Cost Accountants (Firm Registration No M - 000218), be and is hereby ratified and confirmed.”
“RESOLVED FURTHER THAT the Managing Director, Gr. CFO or Company Secretary of the Company be and are hereby severally authorised to do all acts, deeds, maters and things as may be necessary, proper, expedient or incidental for the purpose of giving effect to the aforesaid resolution.”
Place: MumbaiDate: May 24, 2019
By Order of the Board of DirectorsFor Varroc Engineering Limited
Rakesh DarjiCompany Secretary
ACS: 13085
Notice to Shareholders

Annual Report 2018-19 241
Notice to Shareholders
NOTES:
1) A MEMBER ENTITLED TO ATTEND AND VOTE AT THE ANNUAL GENERAL MEETING (THE “MEETING”/”AGM”) IS ENTITLED TO APPOINT A PROXY TO ATTEND AND VOTE ON A POLL INSTEAD OF HIMSELF/HERSELF AND THE PROXY NEED NOT BE A MEMBER OF THE COMPANY. THE INSTRUMENT APPOINTING THE PROXY SHOULD, HOWEVER, BE DEPOSITED AT THE REGISTERED OFFICE OF THE COMPANY NOT LESS THAN FORTY-EIGHT HOURS BEFORE THE COMMENCEMENT OF THE MEETING.
A PERSON CAN ACT AS A PROXY ON BEHALF OF MEMBERS NOT EXCEEDING FIFTY AND HOLDING IN THE AGGREGATE NOT MORE THAN TEN PERCENT OF THE TOTAL SHARE CAPITAL OF THE COMPANY CARRYING VOTING RIGHTS. A MEMBER HOLDING MORE THAN TEN PERCENT OF THE TOTAL SHARE CAPITAL OF THE COMPANY CARRYING VOTING RIGHTS MAY APPOINT A SINGLE PERSON AS PROXY AND SUCH PERSON SHALL NOT ACT AS A PROXY FOR ANY OTHER PERSON OR SHAREHOLDER. THE HOLDER OF PROXY SHALL PROVE HIS IDENTITY AT THE TIME OF ATTENDING THE MEETING.
2) During the period beginning 24 hours before the time fixed for the commencement of the meeting and ending with the conclusion of the meeting, members would be entitled to inspect the proxies lodged, at any time during the business hours of the Company, provided not less than 3 days’ written notice is given to the Company.
3) Explanatory statement pursuant to Section 102(1) of the Companies Act, 2013 forms part of this notice.
4) Corporate members are requested to send in advance a duly certified copy of board resolution/power of attorney authorising their representative to attend and vote on their behalf in the meeting.
5) Brief details of Mr. Naresh Chandra, (DIN 00027696) who retires by rotation and is seeking re-appointment, are given in the annexure hereto as per requirements of the Companies Act, 2013 and Regulation 36 of the Securities and Exchange Board of India (Listing Obligations and Disclosure Requirements) Regulations, 2015 (the Listing Regulations) and SS – 2 (Secretarial Standards on General Meetings).
6) Dividend on equity shares when declared at the Meeting, will be paid to the members on or before 30th day from date of declaration.
7) Sections 101 and 136 of the Companies Act, 2013 read with the rules made thereunder, permit the listed companies to send the notice of Annual General Meeting and the Annual Report, including financial statements, Board’s Report, etc. by electronic mode. The Company, is accordingly, forwarding soft copies of the above referred documents to all those members who have registered their email IDs with their respective depository participants or with Link Intime India Pvt Ltd. or with the Company.
8) To receive communications through electronic means, including Annual Reports and notice, members are requested to kindly register/update their email IDs with their respective depository participants, where shares are held in electronic form.
9) Documents referred to in the notice and the explanatory statement will be kept open for inspection by the members at the registered office of the Company at Plot No: L-4, MIDC Industrial Area, Waluj, Aurangabad 431136 from Monday to Friday from 10:00 a.m. to 12:00 Noon, except holidays, up to the date of the meeting and also at the meeting.
10) The following statutory registers are open for inspection by the members and others at the registered office of the Company as prescribed in the respective sections of the Companies Act, 2013 as specified below on all working days during 10:00 a.m. to 12:00 noon and at the Annual General Meeting:
a) Register of contracts with related parties and bodies, etc. in which directors are interested under Section 189 of the Companies Act, 2013; and
b) Register of Directors and Key Managerial Personnel and their shareholding under Section 170 of the Companies Act, 2013.
11) Pursuant to section 72 of the Companies Act, 2013, members holding shares in electronic mode, the nomination form may be filed with the respective depository participants.
12) Members/proxies are requested to bring the attendance slip/proxy form duly filled and signed for attending the meeting. Proxies are requested to
bring their ID proof to the meeting for the purpose of identification.
13) Members/proxies are requested to bring their copy of the annual reports to the meeting.
14) For security reasons, no article/baggage will be allowed at the venue of the meeting.
15) Route map for directions to the venue of the meeting is attached here with & is also available on the Company’s website https://www.varrocgroup.com under the tab investor relations.
16) Members are requested to send their queries, if any, on the matter referred to in this Annual Report, at least seven (7) days in advance of the meeting so that the information can be made available at the meeting.
17) Members who have not registered their e-mail addresses so far are requested to register their e-mail address for receiving all communication including Annual Report, Notices, Circulars, etc. from the Company electronically.
18) For more details on shareholders’ matters, please refer to the section on General Shareholder Information, included in the Annual Report.
19) Voting through electronic means –
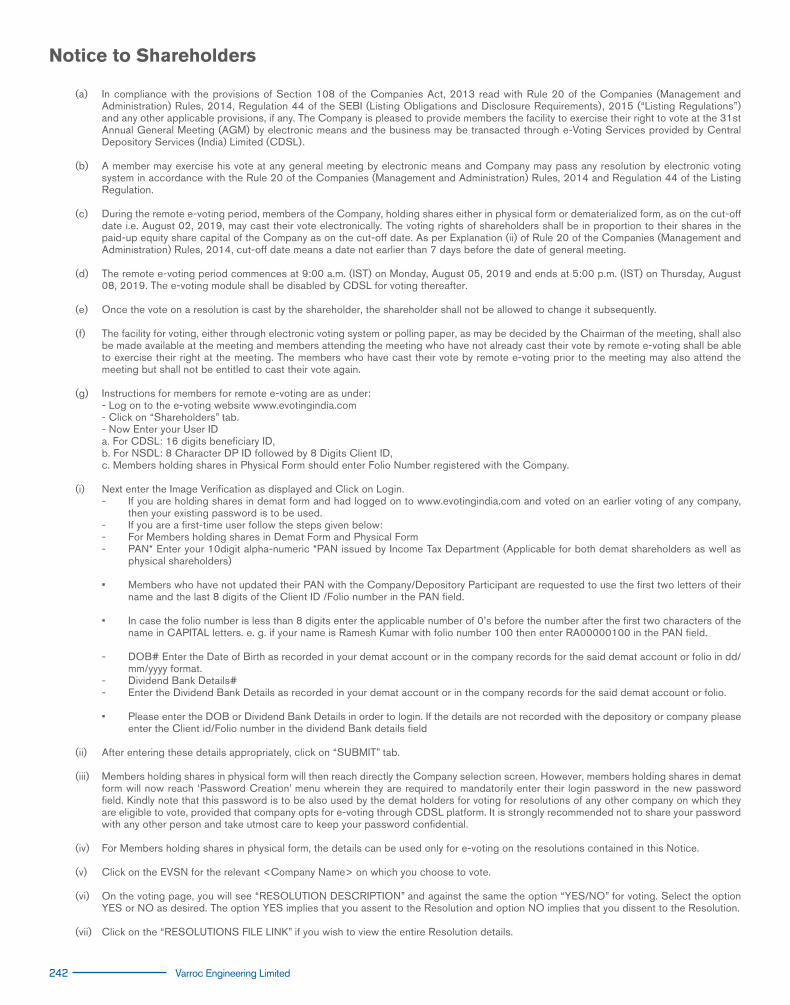
242 Varroc Engineering Limited
(a) In compliance with the provisions of Section 108 of the Companies Act, 2013 read with Rule 20 of the Companies (Management and Administration) Rules, 2014, Regulation 44 of the SEBI (Listing Obligations and Disclosure Requirements), 2015 (“Listing Regulations”) and any other applicable provisions, if any. The Company is pleased to provide members the facility to exercise their right to vote at the 31st Annual General Meeting (AGM) by electronic means and the business may be transacted through e-Voting Services provided by Central Depository Services (India) Limited (CDSL).
(b) A member may exercise his vote at any general meeting by electronic means and Company may pass any resolution by electronic voting system in accordance with the Rule 20 of the Companies (Management and Administration) Rules, 2014 and Regulation 44 of the Listing Regulation.
(c) During the remote e-voting period, members of the Company, holding shares either in physical form or dematerialized form, as on the cut-off date i.e. August 02, 2019, may cast their vote electronically. The voting rights of shareholders shall be in proportion to their shares in the paid-up equity share capital of the Company as on the cut-off date. As per Explanation (ii) of Rule 20 of the Companies (Management and Administration) Rules, 2014, cut-off date means a date not earlier than 7 days before the date of general meeting.
(d) The remote e-voting period commences at 9:00 a.m. (IST) on Monday, August 05, 2019 and ends at 5:00 p.m. (IST) on Thursday, August 08, 2019. The e-voting module shall be disabled by CDSL for voting thereafter.
(e) Once the vote on a resolution is cast by the shareholder, the shareholder shall not be allowed to change it subsequently.
(f) The facility for voting, either through electronic voting system or polling paper, as may be decided by the Chairman of the meeting, shall also be made available at the meeting and members attending the meeting who have not already cast their vote by remote e-voting shall be able to exercise their right at the meeting. The members who have cast their vote by remote e-voting prior to the meeting may also attend the meeting but shall not be entitled to cast their vote again.
(g) Instructions for members for remote e-voting are as under:- Log on to the e-voting website www.evotingindia.com- Click on “Shareholders” tab.- Now Enter your User IDa. For CDSL: 16 digits beneficiary ID,b. For NSDL: 8 Character DP ID followed by 8 Digits Client ID,c. Members holding shares in Physical Form should enter Folio Number registered with the Company.
(i) Next enter the Image Verification as displayed and Click on Login. - If you are holding shares in demat form and had logged on to www.evotingindia.com and voted on an earlier voting of any company,
then your existing password is to be used.- If you are a first-time user follow the steps given below:- For Members holding shares in Demat Form and Physical Form- PAN* Enter your 10digit alpha-numeric *PAN issued by Income Tax Department (Applicable for both demat shareholders as well as
physical shareholders)
• Members who have not updated their PAN with the Company/Depository Participant are requested to use the first two letters of their name and the last 8 digits of the Client ID /Folio number in the PAN field.
• In case the folio number is less than 8 digits enter the applicable number of 0’s before the number after the first two characters of the name in CAPITAL letters. e. g. if your name is Ramesh Kumar with folio number 100 then enter RA00000100 in the PAN field.
- DOB# Enter the Date of Birth as recorded in your demat account or in the company records for the said demat account or folio in dd/mm/yyyy format.
- Dividend Bank Details#- Enter the Dividend Bank Details as recorded in your demat account or in the company records for the said demat account or folio.
• Please enter the DOB or Dividend Bank Details in order to login. If the details are not recorded with the depository or company please enter the Client id/Folio number in the dividend Bank details field
(ii) After entering these details appropriately, click on “SUBMIT” tab.
(iii) Members holding shares in physical form will then reach directly the Company selection screen. However, members holding shares in demat form will now reach ‘Password Creation’ menu wherein they are required to mandatorily enter their login password in the new password field. Kindly note that this password is to be also used by the demat holders for voting for resolutions of any other company on which they are eligible to vote, provided that company opts for e-voting through CDSL platform. It is strongly recommended not to share your password with any other person and take utmost care to keep your password confidential.
(iv) For Members holding shares in physical form, the details can be used only for e-voting on the resolutions contained in this Notice.
(v) Click on the EVSN for the relevant <Company Name> on which you choose to vote.
(vi) On the voting page, you will see “RESOLUTION DESCRIPTION” and against the same the option “YES/NO” for voting. Select the option YES or NO as desired. The option YES implies that you assent to the Resolution and option NO implies that you dissent to the Resolution.
(vii) Click on the “RESOLUTIONS FILE LINK” if you wish to view the entire Resolution details.
Notice to Shareholders
Annual Report 2018-19 243
Notice to Shareholders
(viii) After selecting the resolution, you have decided to vote on, click on “SUBMIT”. A confirmation box will be displayed. If you wish to confirm your vote, click on “OK”, else to change your vote, click on “CANCEL” and accordingly modify your vote.
(ix) Once you “CONFIRM” your vote on the resolution, you will not be allowed to modify your vote.
(x) You can also take out print of the voting done by you by clicking on “Click here to print” option on the Voting page.
(xi) If Demat account holder has forgotten the changed password then Enter the User ID and the image verification code and click on Forgot Password & enter the details as prompted by the system.
(xii) Shareholders can also cast their vote using CDSL’s mobile app m-Voting available for all mobile users. The m-Voting app can be downloaded from Google Play Store. iPhone and Windows phone users can download the app from the App Store and the Windows Phone Store respectively. Please follow the instructions as prompted by the mobile app while voting on your mobile.
(xiii) Note for Non–Individual Shareholders and Custodians Institutional shareholders (i.e. other than Individuals, HUF, NRI etc.) and Custodian are required to log on to https://www.evotingindia.co.in and register themselves as Corporates. They should submit a scanned copy of the Registration Form bearing the stamp and sign of the entity to [email protected]. After receiving the login details they have to create a user who would be able to link the account (s) which they wish to vote on. The list of accounts should be mailed to [email protected] and on approval of the accounts they would be able to cast their vote. They should upload a scanned copy of the Board Resolution and Power of Attorney (POA) which they have issued in favour of the Custodian, if any, in PDF format in the system for the scrutinizer to verify the same.
In case you have any queries or issues regarding e-voting, you may refer the Frequently Asked Questions (“FAQs”) and e-voting manual
available at www.evotingindia.co.in under help section or write an email to [email protected] or you may also contact CDSL on Toll Free 1800-200-5533 (10.00 am to 6.15 pm Monday – Friday and 10.00 am to 2.00 pm on Saturday)
20) The members would be able to cast their votes at the Meeting through ballot paper if they have not availed the remote e-voting facility. If the vote is cast through remote e-voting facility then the members cannot exercise their voting rights at the Meeting. However, the members who have cast their vote by remote e-voting prior to the AGM may also attend the AGM but shall not be entitled to cast their vote again.
21) Mrs. Uma Lodha, Practicing Company Secretary (Membership No. FCS 5363) has been appointed as the Scrutinizer to scrutinize the e-voting process and voting through ballot paper at the AGM in a fair and transparent manner.
22) The Scrutinizer shall within 48 hours of the conclusion of the AGM, submit a consolidated Scrutinizer’s report of the votes cast in favour or against, to the Chairman of the AGM (‘Chairman’) or to any Director or any person authorized by the Chairman for this purpose, who shall countersign the same.
23) The Results declared along with the Scrutinizer’s Report shall be placed on the Company’s website http://www.varrocgroup.com/ and on the website of CDSL and communicated to the Stock Exchanges.
EXPLANATORY STATEMENT IN RESPECT OF THE SPECIAL BUSINESSES PURSUANT TO SECTION 102 OF THE COMPANIES ACT, 2013
Item No.4
To increase borrowing limits of the Company
The Members of the Company vide their resolution passed at the Extra-ordinary General Meeting held on November 2, 2013 had authorized the Board of Directors of the Company to borrow from time to time a sum not exceeding `1,500 Crore (Rupees One Thousand Five Hundred Crore) on such terms and conditions as it may deem fit under Section 180(1)(c) of the Companies Act, 2013.
Considering the business plans and the growing fund requirements of the Company, it is proposed to increase the existing borrowing limit of the Company from `1,500 Crores (Rupees One Thousand Five Crores) to `2,000 Crore (Rupees Two Thousand Crore).
As per the provisions of Section 180(1)(c) of the Companies Act, 2013, a company shall not borrow money, where the money to be borrowed, together with the money already borrowed by the company will exceed aggregate of its paid-up share capital, free reserves and securities premium, apart from temporary loans obtained from the company’s bankers in the ordinary course of business, unless prior approval of the Members is obtained by way of a Special Resolution.
The Board accordingly recommends for approval of revised Borrowing limit of `2,000 Crore (Rupees Two Thousand Crore) outstanding at any point of time under 180(1)(c) of the Companies Act, 2013 as set forth in Item No.4 for approval of the Members by way of special resolution.
None of the Directors or Key Managerial Personnel of the Company including their relatives is interested or concerned in the Resolution except to the extent of their shareholding, if any, in the Company.
Item No. 5
Creation of Mortgage/Charge on the assets of the Company
The Members of the Company vide their resolution passed at the Extra-ordinary General Meeting held on August 30, 2014 had authorized the Board of Directors of the Company to create charges over its assets, properties and licenses by way of hypothecation, mortgage, lien, pledge etc. in favour of its lenders from time to time, for an amount not exceeding `1,000 Crores (Rupees One Thousand Crores) on such terms and conditions as it may deem fit under Section 180(1)(a) of the Companies Act, 2013 (“the Act”).

244 Varroc Engineering Limited
In connection with the loan/credit facilities to be availed by the Company, as and when required, through various sources for business purposes, the Company might be required to create charges over its assets, properties and licenses by way of hypothecation, mortgage, lien, pledge etc. in favour of its lenders (up to the limits approved under Section 180(1)(c) of the Act), for the purposes of securing the loan/credit facilities extended by them to the Company or its subsidiary or associate companies. As per the resolution proposed at Item No.4 the Company intends to increase its borrowing limits and in line with the same it is necessary to increase the amount upto which the Company can create charge on its assets.
As per the provisions of Section 180(1)(a) of the Act, a company shall not sell, lease or otherwise dispose of the whole or substantially the whole of the undertaking of the company or where the company owns more than one undertaking, of the whole or substantially the whole of any of such undertakings, unless prior approval of the Members is obtained by way of a Special Resolution.
Accordingly, the Board recommends the Special Resolution for approval of limit of `2,000 Crore (exclusive of interest and other charges) for creation of Mortgage/Charge on the assets of the Company, to be consented by the shareholders to be passed at this Annual General Meeting of the Company or upto such higher amount/s as may be so consented by the members of the Company from time to time, in future pursuant to Section 180(1)(c) of the Act, as set forth in Item No.5 for approval of the Members by way of special resolution.
None of the Promoter, Directors or Key Managerial Personnel of the Company including their relatives is interested or concerned in the Resolution except to the extent of their shareholding, if any, in the Company.
Item No. 6
Increase in the limits applicable for making investments / extending loans and giving guarantees or providing securities in connection with loans to Persons / Bodies Corporate
The Members of the Company vide their special resolution passed at the Annual General Meeting held on November 1, 2016 had authorized the Board of Directors of the Company for making investments/ extending loans and giving guarantees or providing securities in connection with loans to Persons / Bodies Corporate from time to time for an amount not exceeding `1,200 Crores (Rupees One Thousand Two Hundred Crores) on such terms and conditions as it may deem fit under Section 186 of the Companies Act, 2013 (“the Act”).
The Company has been making investments in, giving loans and guarantees to and providing securities in connection with loans to various persons and bodies corporate (including its subsidiaries) from time to time, in compliance with the applicable provisions of the Act.
The provisions of Section 186 of the Act read with the Companies (Meetings of Board and its Powers) Rules, 2014, as amended to date, provides that no company shall, directly or indirectly, (a) give any loan to any person or other body corporate; (b) give any guarantee or provide security in connection with a loan to any other body corporate or person; and (c) acquire by way of subscription, purchase or otherwise, the securities of any other body corporate, exceeding sixty percent of its paid-up share capital, free reserves and securities premium account or one hundred per cent of its free reserves and securities premium account, whichever is more, unless prior approval of the Members is obtained by way of a Special Resolution.
As per the latest audited Balance Sheet of the Company as on March 31, 2019, 60% of the paid-up share capital, free reserves and securities premium account amounts to `665.17 Crore while 100% of its free reserves and securities premium account amounts to `1,095.10 Crore. Therefore, the maximum limit available to the Company under Section 186(2) of the Act for making investments or giving loans or providing guarantees / securities in connection with a loan, as the case may be, is `1,095.10 Crore. It is now proposed to increase the seid limit to `1,800 Crore.
During the previous year, the Global Lighting Business carried through subsidiaries of the Company (“VLS”) expanded its production capacity through various investments, joint ventures and acquisitions. To capitalize on emerging market growth and increase the global presence Turkey-based interior and exterior lighting manufacturer viz. Sa-Ba, Turkey was acquired in June 2018. VLS has completed green-field expansion by completing the construction of Phase I of the Morocco Plant and setting up new Plant at Brazil. Both these facilities have started commercial production during the last year. VLS has also completed and started operations at new R&D Centre set-up at Krakow, Poland. VLS is in the process of setting up a new manufacturing plant in Poland, to serve key customers in European markets, in Romania (through JV) for manufacturing of electronics components and sub-assemblies(modules) and in Chennai, to serve some of the key global OEMs. To fund these activities and to meet additional working capital for expanded business, the Company will be required to infuse the funds in the form of additional investment, loan or providing corporate guarantee for the funds raised by subsidiary companies.
To undertake such activities, the Board recommends the Special Resolution set forth in Item No.6 of the Notice for approval of the Members, notwithstanding the fact that the same exceeds the limits provided under Section 186 of the Act.
None of the Promoter, Directors or Key Managerial Personnel of the Company including their relatives is interested or concerned in the Resolution except to the extent of their shareholding, if any, in the Company.
Item No. 7
Ratification of remuneration payable to Cost Auditors
The Board of Directors, on the recommendation of the Audit Committee has approved the appointment of M/s. S. R. Bhargave & Co., Cost Accountants, as Cost Auditors of the Company for auditing the cost accounts of the Company relating to the products of the Company, as applicable, for the financial year 2019 - 20 at a remuneration of `3,00,000/- and applicable rate of taxes and reimbursement of out of pocket expenses at actuals. In terms of Section 148 of the Companies Act, 2013 read with the Companies (Audit and Auditors) Rules, 2014, the remuneration payable to the Cost Auditors is to be ratified by the Shareholders of the Company.
The Board of Directors recommends Ordinary Resolution as proposed at item no.7 of the notice for approval by the shareholders.
None of the Promoter, Directors or Key Managerial Personnel of the Company including their relatives is interested or concerned in the Resolution except to the extent of their shareholding, if any, in the Company.
Notice to Shareholders
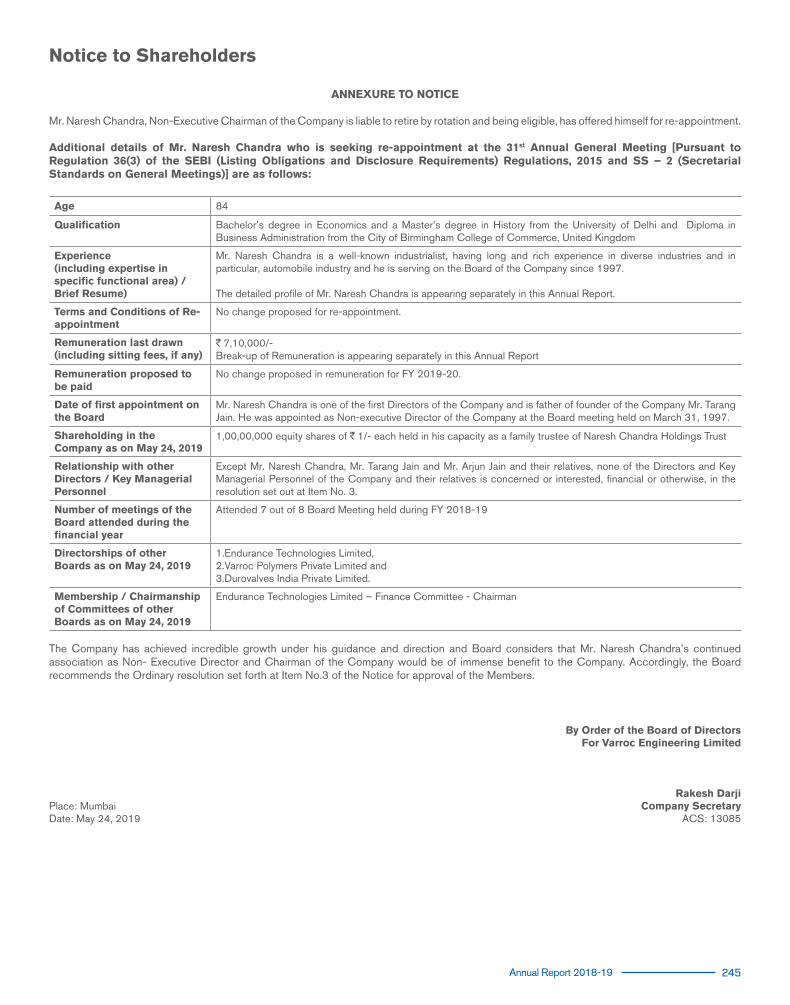
Annual Report 2018-19 245
ANNEXURE TO NOTICE
Mr. Naresh Chandra, Non-Executive Chairman of the Company is liable to retire by rotation and being eligible, has offered himself for re-appointment.
Additional details of Mr. Naresh Chandra who is seeking re-appointment at the 31st Annual General Meeting [Pursuant to Regulation 36(3) of the SEBI (Listing Obligations and Disclosure Requirements) Regulations, 2015 and SS – 2 (Secretarial Standards on General Meetings)] are as follows:
Age 84
Qualification Bachelor’s degree in Economics and a Master’s degree in History from the University of Delhi and Diploma in Business Administration from the City of Birmingham College of Commerce, United Kingdom
Experience (including expertise in specific functional area) / Brief Resume)
Mr. Naresh Chandra is a well-known industrialist, having long and rich experience in diverse industries and in particular, automobile industry and he is serving on the Board of the Company since 1997.
The detailed profile of Mr. Naresh Chandra is appearing separately in this Annual Report.
Terms and Conditions of Re-appointment
No change proposed for re-appointment.
Remuneration last drawn(including sitting fees, if any)
`7,10,000/-Break-up of Remuneration is appearing separately in this Annual Report
Remuneration proposed to be paid
No change proposed in remuneration for FY 2019-20.
Date of first appointment on the Board
Mr. Naresh Chandra is one of the first Directors of the Company and is father of founder of the Company Mr. Tarang Jain. He was appointed as Non-executive Director of the Company at the Board meeting held on March 31, 1997.
Shareholding in the Company as on May 24, 2019
1,00,00,000 equity shares of `1/- each held in his capacity as a family trustee of Naresh Chandra Holdings Trust
Relationship with other Directors / Key Managerial Personnel
Except Mr. Naresh Chandra, Mr. Tarang Jain and Mr. Arjun Jain and their relatives, none of the Directors and Key Managerial Personnel of the Company and their relatives is concerned or interested, financial or otherwise, in the resolution set out at Item No. 3.
Number of meetings of the Board attended during the financial year
Attended 7 out of 8 Board Meeting held during FY 2018-19
Directorships of other Boards as on May 24, 2019
1.Endurance Technologies Limited,2.Varroc Polymers Private Limited and 3.Durovalves India Private Limited.
Membership / Chairmanship of Committees of other Boards as on May 24, 2019
Endurance Technologies Limited – Finance Committee - Chairman
The Company has achieved incredible growth under his guidance and direction and Board considers that Mr. Naresh Chandra’s continued association as Non- Executive Director and Chairman of the Company would be of immense benefit to the Company. Accordingly, the Board recommends the Ordinary resolution set forth at Item No.3 of the Notice for approval of the Members.
Notice to Shareholders
Place: MumbaiDate: May 24, 2019
By Order of the Board of DirectorsFor Varroc Engineering Limited
Rakesh DarjiCompany Secretary
ACS: 13085

246 Varroc Engineering Limited
NOTES

Annual Report 2018-19 247
VARROC ENGINEERING LIMITEDRegd. Office: Plot No. L-4, MIDC Industrial Area, Waluj, Aurangabad 431136
ADMISSION SLIP
DP ID No. & Client ID No.*
No. of Equity Shares held
I hereby record my presence at the Annual General Meeting of VARROC ENGINEERING LIMITED held on Friday, August 9, 2019 at 10:00 am at the Auditorium Hall, Plot No L-4, MIDC Industrial Area, Waluj, Aurangabad-431136.
Name of Shareholder (In Block Letters)
Name of the Proxy holder / Authorised Representative *
* Applicable for investors holding shares in Electronic Mode
_____________________________________________________ Signature of the Shareholder/Proxy/Authorised RepresentativeNOTE:
1. A member / proxy / authorised representative wishing to attend the Meeting must complete this Admission Slip before coming to the Meeting and hand it over at the entrance.
2. If you intend to appoint a proxy, please complete, stamp, sign and deposit the Proxy Form given below at the Company’s Registered Office at least 48 hours before the Meeting.
VARROC ENGINEERING LIMITEDRegd. Office: Plot No. L-4, MIDC Industrial Area, Waluj, Aurangabad 431136
PROXY FORM
I/We............................................................................................................................................................................of...................................................................................................
.......................................................................................................................................being a member/members of VARROC ENGINEERING LIMITED hereby appoint
Shri./Smt./Kum........................................................................................................................................................of.....................................................................or failing him/her
Shri./Smt./Kum........................................................................................................................................................of.....................................................................or failing him/her
Shri./Smt./Kum........................................................................................................................................................of.................................................................................as my/ our
Proxy in my/our absence to attend and vote for me/us and on my/our behalf at the Annual General Meeting of VARROC ENGINEERING LIMITED to be
held on Friday, August 9, 2019 at 10:00 am at the Auditorium Hall, L-4, MIDC Industrial Area, Waluj, Aurangabad-431136 and at any adjournment thereof.
Signed this..........................................................day of....................................2019.
DP ID No. & Client ID * SignatureAffix Revenue
StampNo. of Equity Shares held
*Note: The proxy, in order to be effective, should be duly completed, stamped, signed and must be deposited at the Registered
Office of the Company not less than 48 hours before the time fixed for the Meeting.

248 Varroc Engineering Limited
Route Map for reaching the venue of Annual General Meeting
Note : The Company has arranged transportation facility for reaching the venue of Annual General Meeting from Aurangabad city. The transportation route is as under:
START from CIDCO Bus Stand ► Kranti Chowk ► Railway Station ► Baba Petrol Pump ► Oasis Chowk ► MIDC Road ► Simens Chowk ► MSEDCL Office ► Varroc Registered Office (END)
Start Time : 8.30 A. M.
Varroc EngineeringLtd. Registered Office
Hospira Healthcare IndiaPvt. Ltd. Aurangabad
Shahajapur
Siddhivinayak Lawns
South City
Garden
Waluj WadgaonKolhati
Pandharpur
Khandoba Temple
KamalnayanBajaj Hospital
Karnpura
Krishi Vigyan Kendra
NewUsmanpura
Haj houseAurangabad
KasliwaliTarangan
Karodi Sai Baba Mandir
Bhangsigad
Aurangabad R
d
Nag
ar R
d
GhanegaonNan
deda
Aurangabad


www.varrocgroup.com