we appreciate the opportunity to comment on duke … · throughout the catawba-wateree river basin....
TRANSCRIPT

A WATERKEEPER ALLIANCE® Member
715 N Church St, # 120 Charlotte NC 28202
Phone: 704-679-9494 Fax: 704-679-9559
www.catawbariverkeeper.org
August 18, 2017
Secretary Kimberly D. Bose
Federal Energy Regulatory Commission
888 First Street NE
Washington, DC 20426
COMMENTS Re: Project Docket P-2232-522 Duke Energy Carolinas, LLC; Notice of Application
for Amendment of Project License
To the Federal Energy Regulatory Commission:
We appreciate the opportunity to comment on Duke Energy’s application to amend its FERC
project license. The Catawba Riverkeeper Foundation (“CRF”) is a 501(c)3 nonprofit established in 1997
at the recommendation of the region’s county governments. Our mission is to advocate and educate
for the protection of the Catawba-Wateree River, which more than two million people in the Carolinas
enjoy and depend on. In pursuit of this mission, we also perform our own research, monitoring and
sampling with a network of hundreds of volunteers every year. Our five full-time staff are supported by
approximately 700 annually renewed memberships from individuals, families and businesses
throughout the Catawba-Wateree River basin.
The amendment application is based on Duke’s work in the Catawba-Wateree Water
Management Group (CWWMG) in the development of a Water Supply Master Plan (WSMP), which we
have followed closely. The CWWMG is itself a 501(c)3 consisting of Duke and 18 public water utilities.
Our comments here are to express concern with strategies and implications around and including the
proposal to hold Lake James, Lake Norman and Lake Wylie six inches higher between May 1 and
October 1. More than anything, we have questions that have never been answered in full or even in
part but should be in the critical long-term water planning the Catawba-Wateree River basin needs.

August 15, 2017 Page 2 of 14
Water Supply in the Catawba-Wateree River Basin
The proposal to raise target elevations of three of the largest reservoirs by six inches generates
a lot of questions and concerns on its own, but the proposal must be considered in the larger context
of the strategies (of which this proposal is one) and structure of the WSMP as well as the unique
situation of the relatively small, densely populated and constantly impounded Catawba-Wateree River
basin.
The Catawba River is mostly dammed inline into 11 slackwater reservoirs (Appendix A). As part
of Duke’s privilege to profit off of and to manage the river under its FERC license, the reservoirs are
recreation havens and have lakefront residential development that provides a major portion of
property tax base and revenue from only a few percent of a county’s acreage. A GIS analysis of
property record databases reveals that tens of billions of dollars of property tax base and ultimately
local economies are dependent upon high quality, desirable water for which people are willing to pay a
premium to live near.
These reservoirs, originally created for hydroelectric generation, also provide cooling water for
the two active coal-fired power plants and two active nuclear power plants in a 39-mile span of the
Catawba River around Charlotte. These four power plants – two on Lake Norman and two on Lake
Wylie – have 7.75 GW of generation capacity, and the power they generate does not stop at basin lines
but also feeds the larger region at the heart of the Carolinas.
Multiple inter-basin transfers (IBTs) in the middle of the basin send drinking water to the
Yadkin-Pee Dee River basin. This happens in three ways: public water utilities that withdraw from the
Catawba-Wateree River but have customers who use water (e.g., irrigation) in the Yadkin-Pee Dee
River basin; wastewater treatment plants that discharge into the Yadkin-Pee Dee River basin but
receive water from customers supplied by water from the Catawba-Wateree River; and wholesale to
municipalities in the Yadkin-Pee Dee River basin. These IBTs are significant as demand within the basin
alone is already high, and our already limited water supply is even less available for downstream users
within the Catawba-Wateree River basin. IBT allotments have been set aside but have not yet been
fully utilized. The current estimate (according to the WSMP) is that at least 32 MGD is currently lost via
IBTs, but an estimated 73 MGD will be lost via IBTs in 2065.
Water quantity has long been an issue in this region, which has some of the nation’s highest
rates of growth. Water demands are increasing, including on a per capita basis. This region had a
drought of record in 2002 that was surpassed by drought in 2007-2008 that also led to a U.S. Supreme
Court case when South Carolina (downstream) filed against North Carolina. There was an obvious need
to better plan and coordinate for the future water supply. In 2008, the water conservation nonprofit
August 15, 2017 Page 3 of 14
American Rivers named the Catawba-Wateree River the #1 Most Endangered River in America because
of the drought and ensuing crisis because of such densely situated demand in a basin with limited
supply.
At about this time, Duke started its relicensing process with FERC. In April 2006, Duke and HDR
Engineering released the Water Supply Study. It analyzed safe yields and potential failures of the water
supply and found that there could be failures as soon as 2038. Failure is defined as demand exceeding
supply and water elevation falling below the critical intake elevation in a reservoir. This study also
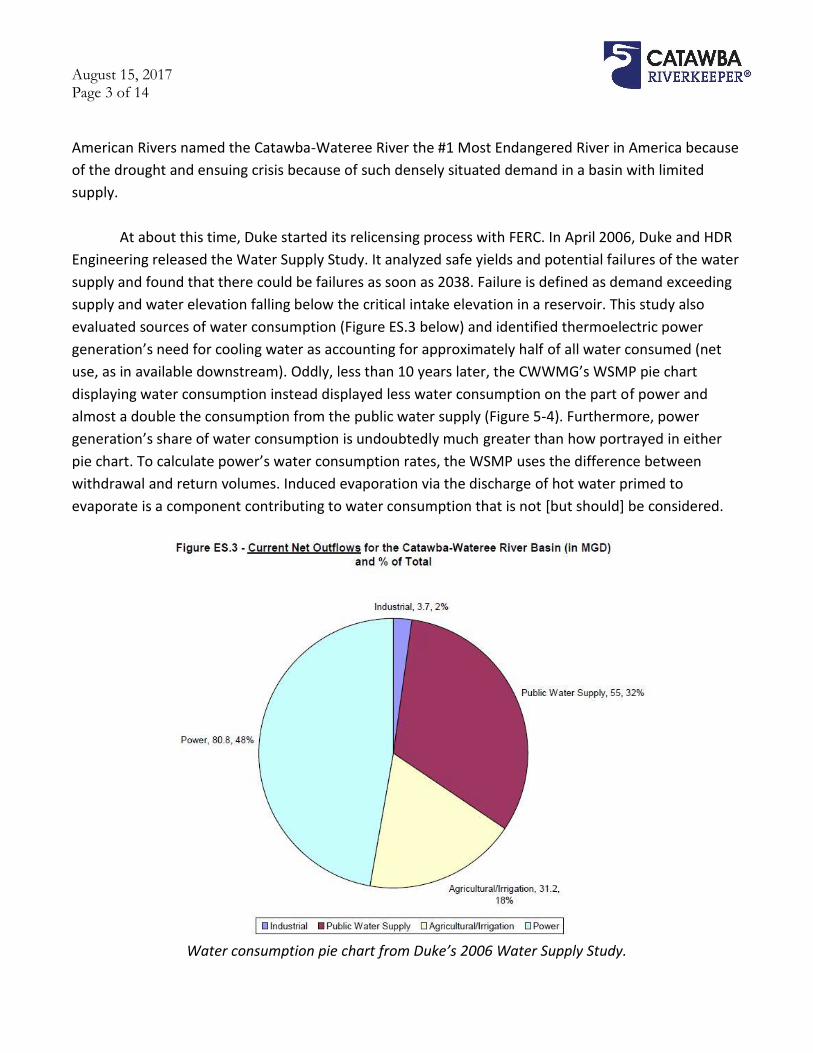
evaluated sources of water consumption (Figure ES.3 below) and identified thermoelectric power
generation’s need for cooling water as accounting for approximately half of all water consumed (net
use, as in available downstream). Oddly, less than 10 years later, the CWWMG’s WSMP pie chart
displaying water consumption instead displayed less water consumption on the part of power and
almost a double the consumption from the public water supply (Figure 5-4). Furthermore, power
generation’s share of water consumption is undoubtedly much greater than how portrayed in either
pie chart. To calculate power’s water consumption rates, the WSMP uses the difference between
withdrawal and return volumes. Induced evaporation via the discharge of hot water primed to
evaporate is a component contributing to water consumption that is not [but should] be considered.
Water consumption pie chart from Duke’s 2006 Water Supply Study.

August 15, 2017 Page 4 of 14
Water consumption pie chart from the 2014 WSMP.
The CWWMG’s WSMP was released in May 2014. During development, the CWWMG
considered multiple strategies for prolonging the limited water supply in the Catawba-Wateree River
basin. These strategies were assembled in different scenarios for runs of Duke’s CHEOPS
(Computerized Hydroelectric Operations and Planning Software) computer model. The strategies
considered everything from lowering existing critical intake elevations and raising target operating
elevations in the reservoirs (part of the application currently before FERC) to cloud seeding and
covering the lakes to reduce evaporation (Appendix B). Nowhere in their strategies was there
consideration of reducing thermoelectric power’s consumption of water, which could occur at the
customer level, through other power generation technologies (e.g., solar) that do not consume water
and/or by investigating and supporting research into alternative cooling technologies. The WSMP
should have granted at least some consideration to slowing consumption rates that lead to failure
during drought.
It is important to note that the Low Inflow Protocol (LIP) also fails to address thermoelectric
power generation as a major source of water consumption. Reducing electrical consumption – and
thereby water consumption via thermoelectric power generation and cooling – would seem to be a
logical component of any water conservation plan. Yet, the crux of the strategy appears to be creating
more accessible storage at the tops and bottoms of reservoirs while also asking citizens to reduce their
August 15, 2017 Page 5 of 14
public water supply consumption but not their electrical consumption. Consequently, this will also
force public water supply utilities (not Duke) to increase their rates.
The WSMP has multiple other oddities, such as notes of Duke’s plans to install eight combined
cycle (natural gas) and two two-unit nuclear power plants in the Catawba-Wateree River basin
between 2026 and 2065 (the two coal power plants would come offline by 2040). This seems to be an
ambitious plan. These are just some of our concerns with the overall WSMP and suffice to lend some
context to our concerns and questions regarding the WSMP’s ultimate efficacy, including with this
specific proposed strategy of raising reservoir target elevations six inches.
Direct Concerns About Raising Reservoir Elevations
The proposal to raise three of the Catawba-Wateree River’s largest reservoirs by six inches does
raise multiple concerns and thus far unanswered questions, which should be addressed prior to any
approval from FERC.
The Catawba-Wateree River basin, increasingly populated and developed, has a history of
flooding problems, particularly at the reservoirs. Hurricanes and tropical storm remnants can inundate
the Catawba-Wateree River basin with significant rain, as has been seen with major flooding events in
1989, 2004, 2013, and the Great Flood of 1916, which even wiped out dams. Duke’s general practice
during high-flow events is to not allow reservoirs with flood gates to exceed full pond, but not all
reservoirs have gates that can be opened to pass water through the system. This means that some
reservoirs already experience major flooding events.
Mountain Island Lake is immediately downstream of the 12-time-larger Lake Norman, which is
one of the reservoirs Duke would like to hold six inches higher. But dropping Lake Norman one inch
adds one foot of water to Mountain Island Lake, which does not have flood gates (only a spillway). Not
only is Mountain Island Lake the drinking water reservoir for approximately one million people in
Mecklenburg and Gaston Counties, there are hundreds of homes on Mountain Island Lake. Flooding
over the spillway of Mountain Island Lake’s impounding dam also causes significant flooding for homes
downstream; emergency evacuations have been required. Duke does not – but should – operate a
notification system where residents can receive an alert when Lake Norman’s flood gates are going to
be opened and cause extreme flooding. In May 2013, residents complained after upstream
precipitation and Duke’s middle-of-the-night opening of Lake Norman’s floodgates caused extreme and
surprising flooding.
Another lake with frequent flooding issues is Lake Wateree, which is the last reservoir in the
chain. It has no flood gates. However, the proposed installation of a bladder dam could mitigate this
August 15, 2017 Page 6 of 14
issue. For Mountain Island Lake, Lake Wateree and others, the key question is, what is the increased
flooding impact to these reservoirs if three of the largest are held six inches higher?
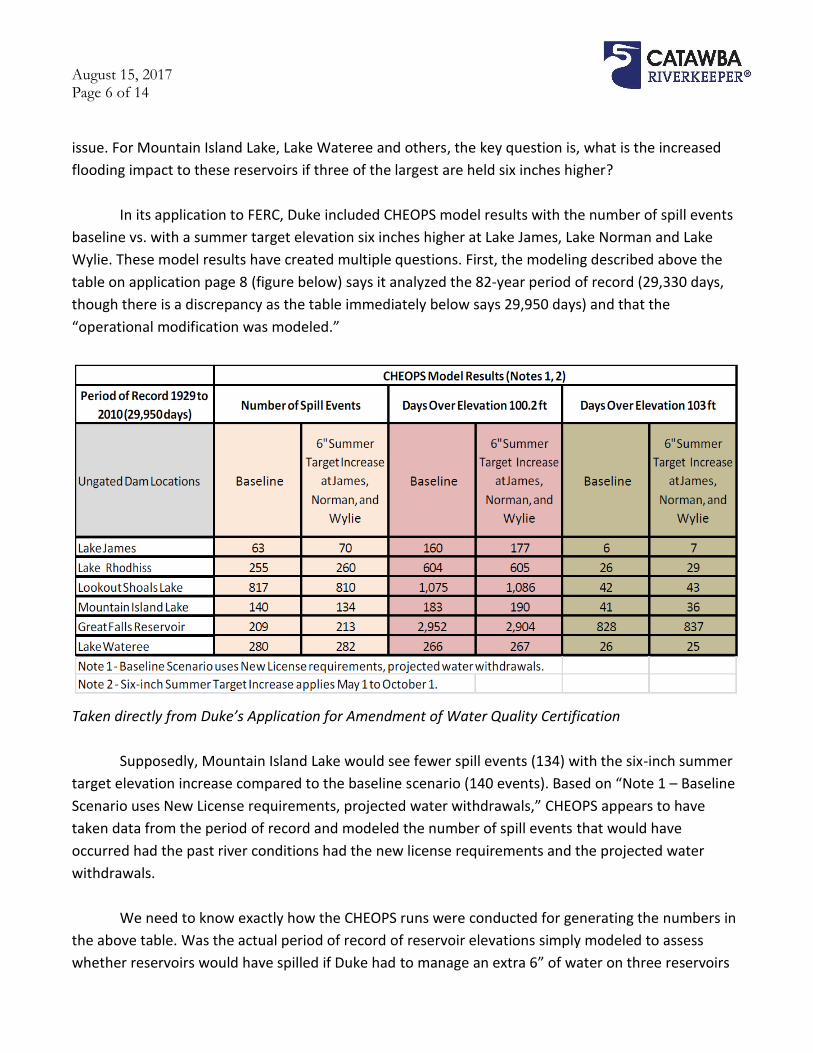
In its application to FERC, Duke included CHEOPS model results with the number of spill events
baseline vs. with a summer target elevation six inches higher at Lake James, Lake Norman and Lake
Wylie. These model results have created multiple questions. First, the modeling described above the
table on application page 8 (figure below) says it analyzed the 82-year period of record (29,330 days,
though there is a discrepancy as the table immediately below says 29,950 days) and that the
“operational modification was modeled.”
Taken directly from Duke’s Application for Amendment of Water Quality Certification
Supposedly, Mountain Island Lake would see fewer spill events (134) with the six-inch summer
target elevation increase compared to the baseline scenario (140 events). Based on “Note 1 – Baseline
Scenario uses New License requirements, projected water withdrawals,” CHEOPS appears to have
taken data from the period of record and modeled the number of spill events that would have
occurred had the past river conditions had the new license requirements and the projected water
withdrawals.
We need to know exactly how the CHEOPS runs were conducted for generating the numbers in
the above table. Was the actual period of record of reservoir elevations simply modeled to assess
whether reservoirs would have spilled if Duke had to manage an extra 6” of water on three reservoirs
August 15, 2017 Page 7 of 14
during the summer? Or was CHEOPS run off actual period of record inflow data (rather than reservoir
elevation data) with model results for both baseline number of spill events and elevated reservoir level
spill events? More simply put, are the baseline scenario numbers generated by actually looking at the
period of record and counting spill events, or are the baseline scenario numbers a product of CHEOPS
modeling what it calculates spill events to have been? If it is the latter, there needs to be an analysis of
how many spill events have actually occurred. This is because we have concerns about the accuracy of
CHEOPS’ results, especially given some modeling results for Lake Norman (one of the three reservoirs
Duke would like to raise the target summer elevation for) and history of flooding on immediately
downstream Mountain Island Lake.
During the development of the WSMP, we and others engaged in training for how to use
CHEOPS but were never able to recreate the results in the format presented in the WSMP. This is
something FERC and the general public should have the documentation and ability to do. We and
others wanted to see the results in a different format -- how CHEOPS’ modeling results looked in terms
of lake levels over time so we could compare them to FERC-regulated reservoir elevations. We
requested this format directly from the CWWMG (namely Duke and HDR Engineering). They generated
charts for Lake Norman, but these raised significant concerns about CHEOPS’ ability to model the
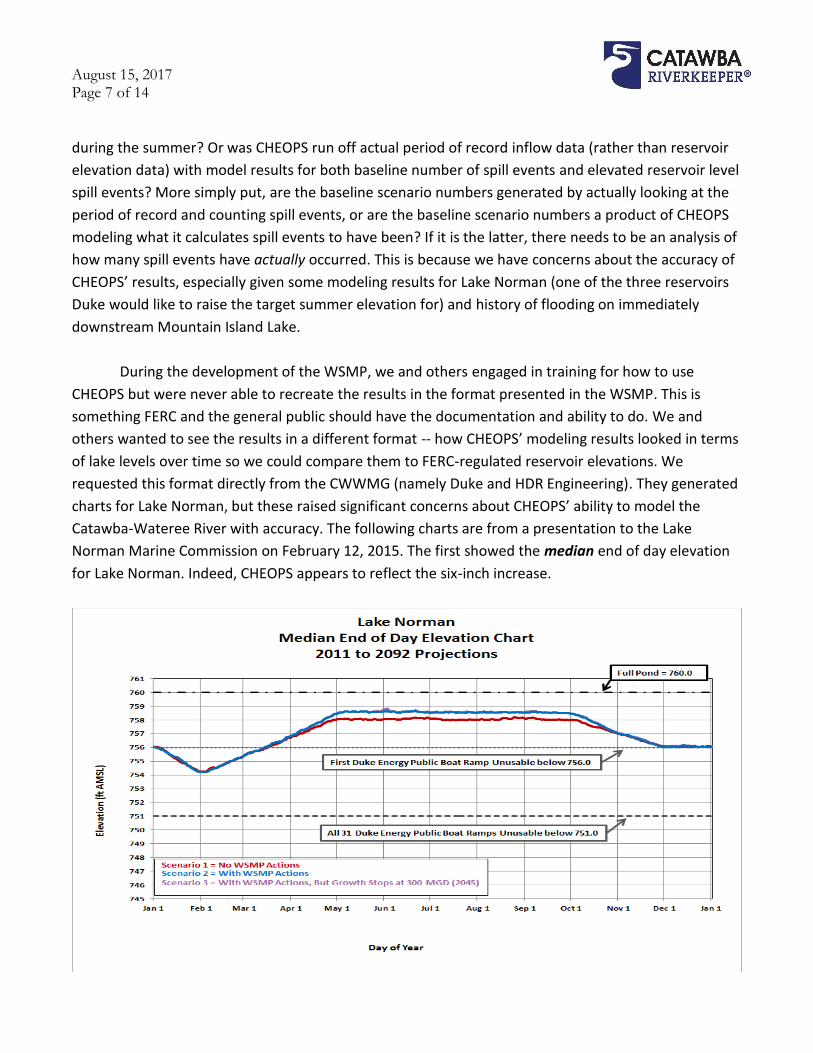
Catawba-Wateree River with accuracy. The following charts are from a presentation to the Lake
Norman Marine Commission on February 12, 2015. The first showed the median end of day elevation
for Lake Norman. Indeed, CHEOPS appears to reflect the six-inch increase.

August 15, 2017 Page 8 of 14
The subsequent chart illustrates end of day elevation exceedance. What it reflects is that Lake
Norman will be held at full pond 25-30% of the time. Perhaps even more concerning is that its display
of Scenario 1 (No WSMP Actions), which should reflect current reservoir management practices
(including elevation management) with additional consumption in future years, indicates Lake Norman
would still be at full pond 25% of the time.
Lake Norman has never been managed at full pond 25% of the time. The median value chart
hides a long duration at the extreme of full pond, where even the smallest rains would mean
significant downstream water passage to Mountain Island Lake, for which one inch of water dropped
from Lake Norman equates to one foot of elevation on Mountain Island Lake because Mountain Island
Lake is one-twelfth the surface area and does not have flood gates. The same presentation contains
actual lake levels for Lake Norman (Appendix C), and these charts show that Lake Norman is rarely
(what appears to be less than 1% of the time) at full pond. So, why the discrepancy between what we
historically know to be true and what CHEOPS shows? How does this information fit with the
calculations for flooding implications?
In terms of long-term water quantity planning, this is concerning for trying to accurately predict
whether or not the strategies of the WSMP will prove helpful and safe. But these charts are especially
troubling for the much smaller, downstream, and flood-prone Mountain Island Lake. If CHEOPS is right
and Lake Norman is going to be held at full pond 25-30% of the time, this would seem to be possibly

August 15, 2017 Page 9 of 14
conflict with the current target elevations defined in Duke’s recently issued FERC license. If CHEOPS is
wrong – which it would seem to be given that ‘business as usual’ would have Lake Norman held at full
pond 25% of the time – there is a long list of concerns with the model, the WSMP developed off of it
and any other project management decisions Duke makes with the model.
Most notably as it pertains to the application proposal to increase the summer target elevation
of Lake Norman by six inches, the modeled results of flooding implications for Mountain Island Lake
cannot be trusted as there are conflicting conclusions and a lack of clarity with regard to details on the
CHEOPS runs in the application. FERC needs more credible, accurate, and consistent information about
the implications from an extra six inches of storage immediately upstream on a reservoir (Lake
Norman) that is 12 times larger. This is also important for evaluating increased stress on Mountain
Island Lake’s impounding dam, which was built almost a century ago (early 1920s).
We do not know how CHEOPS models the percent of time elevations are met or exceeded on
other reservoirs. We have requested but never received those runs. There is particular concern about
water levels on Lake James, though not for the desired increase in summer target elevation.
Lake James is a beautiful mountain lake and the first reservoir in the Catawba-Wateree chain.
While other reservoirs have public water supply and power plant intakes, Lake James’ critical reservoir
elevation is simply that of the hydroelectric unit. This elevation is 50 feet below full pond and
significantly lower than the critical reservoir elevation for any other reservoir. The next lowest critical
reservoir elevation is 25.1 feet below full pond (Lookout Shoals Lake). The remaining nine critical
reservoir elevations are an average of 10 feet below full pond.
Our concern with Lake James is that it could become disproportionately drained at the expense
of other reservoirs. During low-inflow conditions, Lake James’ normal minimum elevation is dropped
significantly and more than other reservoirs throughout the stages. By Stage 3 of low-inflow
conditions, the licensee reduces Lake James’ minimum elevation by 10 feet while Lake Norman is only
five feet below normal minimum elevation and other reservoirs are dropped to only three feet below
their normal minimum elevations. In Stage 4, the licensee is allowed to use its discretion for setting
reservoir elevations. This has significant implications for aquatic life, recreation, property tax base and
water quality on Lake James, which is anticipated to soon be utilized for drinking water, though
discussions by the CWWMG have said the intake will have to be installed at least 50 feet below full
pond.

August 15, 2017 Page 10 of 14
Summary
The Catawba-Wateree River basin is heavily utilized for power generation, drinking water,
recreation, property tax base and much more. We need good long-term planning to ensure water is as
clean, plentiful, inexpensive and unthreatened as possible for the more than two million people who
enjoy and depend on it. Perhaps nowhere else in the U.S. is water supply planning more critical than it
is in the densely populated Catawba-Wateree River basin and region outside its basin lines that still
depend on it for electrical generation and drinking water.
The proposal before FERC raises questions not just about the specific implications of increasing
the elevations of three reservoirs by six inches but also about the larger WSMP and the CHEOPS model.
At this stage, the WSMP appears not to be a “Master Plan” but rather a chapter in what would be a
more comprehensive, well-rounded and balanced master plan. This current WSMP focuses on creating
more accessible volume and deterring consumption through the public water supply. The Catawba-
Wateree needs a master plan with more strategies and chapters, including reliable, consistent
modeling and due diligence regarding efficacy and other impacts, such as increased flooding caused by
raising reservoir elevations as proposed in this application.
We still have too many questions about the flooding implications for those downstream of
potentially elevated reservoirs. The current application should not be approved without additional
information and conditions:
Demonstrated improvements to the accuracy CHEOPS, especially in its portrayal of lake levels in
compliance with reservoir elevations prescribed by Duke’s FERC license (i.e., not showing a
reservoir being held at full pond 25-30% of the time)
o New elevation duration charts need to be generated once CHEOPS can demonstrate an
ability to accurately model water throughout the basin
o Clear documentation for how FERC and the public can recreate CHEOPS’ results when
CHEOPS is applied for various calculations
New analysis and more details on the analysis for additional days of spillover that could be
caused by an additional six inches in Lakes James, Norman and Wylie from May 1 to October 1
o Clarification on how additional spillover days are being calculated/modeled
o Acceptance of CHEOPS modeling for additional spillover days only if CHEOPS is proven
accurate and consistent
In the CHEOPS model, thorough consideration of changes to hydrologic runoff response from
increasing impervious surface area (likely to exacerbate flooding and spillover)

August 15, 2017 Page 11 of 14
Are the WSMP and its strategies balanced and likely to be effective? Is CHEOPS accurate
enough to model the basin? Raising target elevations might not exacerbate flooding issues, but based
on current issues with CHEOPS, we have concern that there is no way to reliably know for sure. FERC
needs reliable, accurate information – that it can also recreate and validate – on lake levels and
flooding impacts before it can truly assess the impacts and appropriateness of raising target elevations.
We hope FERC will pursue well-supported answers to the questions and concerns we have
discussed here, including the larger questions and issues regarding the composition of the WSMP. The
purported efficacy of the WSMP is based on the implementation of various strategies, including the
holding reservoir elevations higher – the very application now in front of FERC.
Thank you for the opportunity to comment on this matter. Please do not hesitate to contact me
by phone (704-679-9494) or email ([email protected]) if you have any questions or would
like to discuss this further.
Sincerely,
Sam Perkins, Catawba RIVERKEEPER® Catawba RIVERKEEPER® is a member of Waterkeeper Alliance, Inc. Riverkeeper is a registered trademark of Riverkeeper, Inc., and is licensed for use herein.

August 15, 2017 Page 12 of 14
Appendix A: Catawba-Wateree River and reservoirs

August 15, 2017 Page 13 of 14
Appendix B: Table 6-1 Prioritized List of Potential Yeidl Enhancement Strategies from 2013 Safe Yield Study; taken from Water Supply Master Plan

August 15, 2017 Page 14 of 14
Appendix C: Additional charts showing historical Lake Norman reservoir elevation and normal operating range