wcrf/aicr systematic literature review continuous update
TRANSCRIPT
1
WCRF/AICR Systematic Literature Review Continuous Update Report
The Associations between Food, Nutrition and Physical Activity and the Risk of Breast Cancer
Imperial College London Continuous Update Team Members
Teresa Norat Doris Chan Rosa Lau Rui Vieira
WCRF Coordinator: Rachel Thompson
Date completed: 7th November 2008
2
Table of contents List of tables of included and excluded studies from the meta-analyses by exposure and reasons for exclusions ................................................................................................................ 5 List of figures from dose-response meta-analyses and high vs. low forest plots ....................... 6 1. Research question................................................................................................................. 12 2. Review team......................................................................................................................... 12 3. Timeline ............................................................................................................................... 12 4. Search strategy ..................................................................................................................... 12 5. Selection of articles .............................................................................................................. 12
5.1 Inclusion criteria............................................................................................................. 13 5.2 Exclusion criteria............................................................................................................ 13
6. Exposures ............................................................................................................................. 15 7. Outcome ............................................................................................................................... 16 8. Databases.............................................................................................................................. 16 9. Hand searching for cited references ..................................................................................... 16 10. Retrieving papers................................................................................................................ 16 11. Labelling of references....................................................................................................... 16 12. Reference Manager Files.................................................................................................... 16 13. Data extraction ................................................................................................................... 17
13.1 Choice of Result ........................................................................................................... 17 13.2 Effect modification....................................................................................................... 17 13.3 Gene-nutrient interaction.............................................................................................. 18 13.4 Multiple articles............................................................................................................ 18
14. Report ................................................................................................................................. 18 14.1 Data presentation.......................................................................................................... 18 14.2 Dose-response meta-analysis ....................................................................................... 19
14.2.1 Missing values....................................................................................................... 19 15. Results of the update .......................................................................................................... 20
1. Patterns of diet.................................................................................................................. 23 1.3.1 Vegetarianism.......................................................................................................... 23 1.4a Individual level dietary patterns................................................................................ 24 1.4b Diet low in fat, high in fibre, fruits, and vegetables ................................................. 24 1.4c Dietary guideline index score ................................................................................... 25 1.6 Lactation ..................................................................................................................... 26 1.6.1 Breastfeeding, Mother ............................................................................................. 26 1.6.1 Total duration of breastfeeding................................................................................ 27
2. Foods ................................................................................................................................ 28 2.1.1 Cereals ..................................................................................................................... 28 2.2. Fruit and (non-starchy) vegetables ............................................................................ 28 2.2.1 Non-starchy vegetables............................................................................................ 29 Vegetables- unspecified............................................................................................... 29 Green leafy vegetables (excluding cruciferous vegetables) ........................................ 30 Cruciferous vegetables................................................................................................. 31 2.2.2.1.1 Grapefruit........................................................................................................... 31 2.3.1 Soy products ............................................................................................................ 32 2.3.1.1 Miso, soya paste soup ........................................................................................... 33 2.3.2.2 Tofu....................................................................................................................... 34 2.5.1 Meat (Unspecified) .................................................................................................. 35

3
2.5.1.2 Processed meat...................................................................................................... 39 2.5.1.3 Red meat ............................................................................................................... 42 2.1.1.4 Poultry................................................................................................................... 46 2.5.1.5 Liver...................................................................................................................... 46 Fish liver ...................................................................................................................... 46 2.5.1.5 Offals .................................................................................................................... 47 2.5.2 Fish .......................................................................................................................... 47 2.6.2 Plant oils (refer to 5.2 total fat section, page 75)..................................................... 52 2.7 Milk and dairy products.............................................................................................. 52 2.7.1 Milk.......................................................................................................................... 53 2.7.2 Cheese, fresh cheese ................................................................................................ 54 2.7.3 Yoghurt .................................................................................................................... 55
3. Beverages ......................................................................................................................... 56 3.5 Fruit juices .................................................................................................................. 56 3.6.1 Coffee ...................................................................................................................... 56 3.6.2 Tea ........................................................................................................................... 57 3.7.1 Alcoholic drinks (refer to 5.4 alcohol as ethanol, page 83)..................................... 57 3.7.1.1 Beer....................................................................................................................... 59 3.7.1.2 Wines .................................................................................................................... 60 3.7.1.3 Spirits/liquors........................................................................................................ 61
4. Food production, preservation, processing and preparation ............................................ 62 4.4.2 Acrylamide .............................................................................................................. 62 4.4.2.6. Broiled food ......................................................................................................... 62
5. Dietary constituents.......................................................................................................... 62 5.1.2. Dietary fibre............................................................................................................ 62 5.1.2 Vegetable fibre......................................................................................................... 71 5.1.2.1 Cereal fibre ........................................................................................................... 71 5.1.2.3 Fruit fibre .............................................................................................................. 72 5.1.5 Glycemic index........................................................................................................ 73 5.1.5 Glycemic load.......................................................................................................... 74 5.2 Total fat (Lipids, as nutrients in the Global Report)................................................... 75 5.2.2 Saturated fatty acids................................................................................................. 81 5.2.3 Monounsaturated fatty acids.................................................................................... 81 5.2.4 Polyunsaturated fatty acids ...................................................................................... 82 5.4 Alcohol (as ethanol).................................................................................................... 83 5.5. Vitamin B................................................................................................................... 93 5.5 Multivitamin supplements .......................................................................................... 94 5.5.10 Vitamin D .............................................................................................................. 94 5.5.3 Folate ....................................................................................................................... 96 5.6.2. Iron........................................................................................................................ 103 5.6.3 Calcium.................................................................................................................. 103 5.6.4 Selenium ................................................................................................................ 105 5.6.7 Zinc ........................................................................................................................ 105 5.7.5 Phytoestrogens....................................................................................................... 105
6. Physical activity ............................................................................................................. 108 6.1.1.3 Household activity .............................................................................................. 117
7. Energy balance ............................................................................................................... 117 7.1 Energy intake ............................................................................................................ 117 7.1.1 Energy from fat...................................................................................................... 121

4
7.1.2 Energy from carbohydrates (also known as calories from carbohydrates, in the Global Report) ................................................................................................................ 121
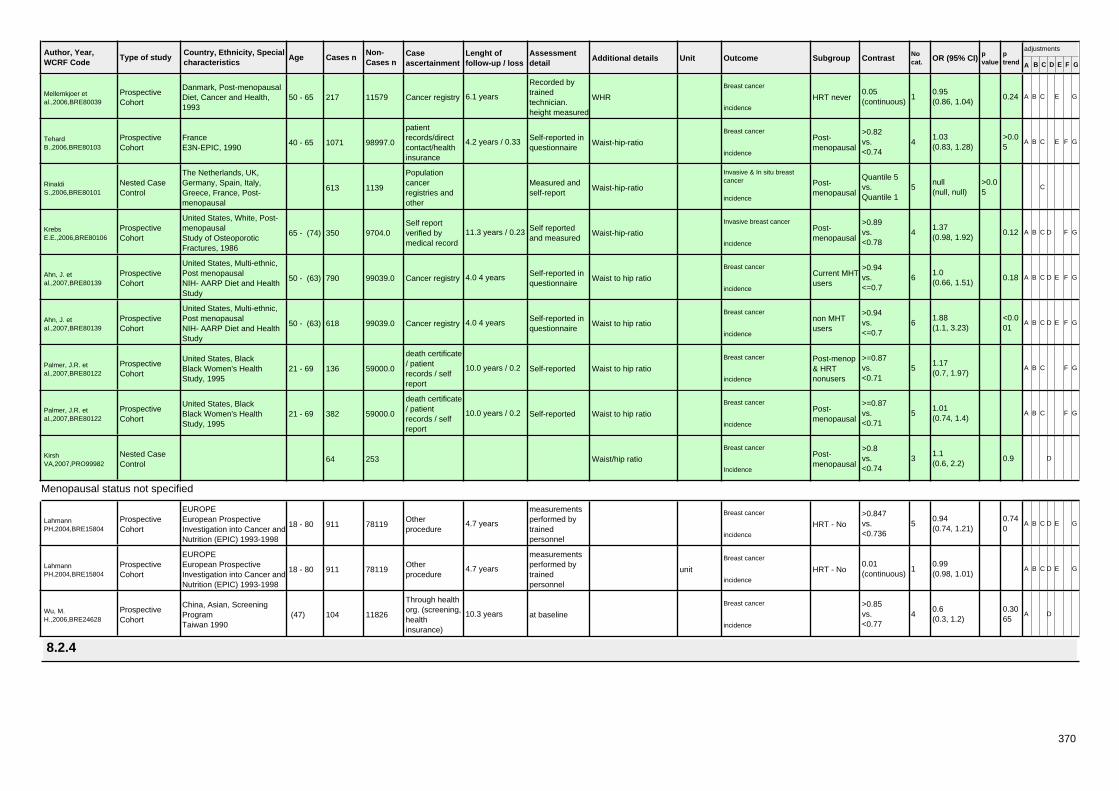
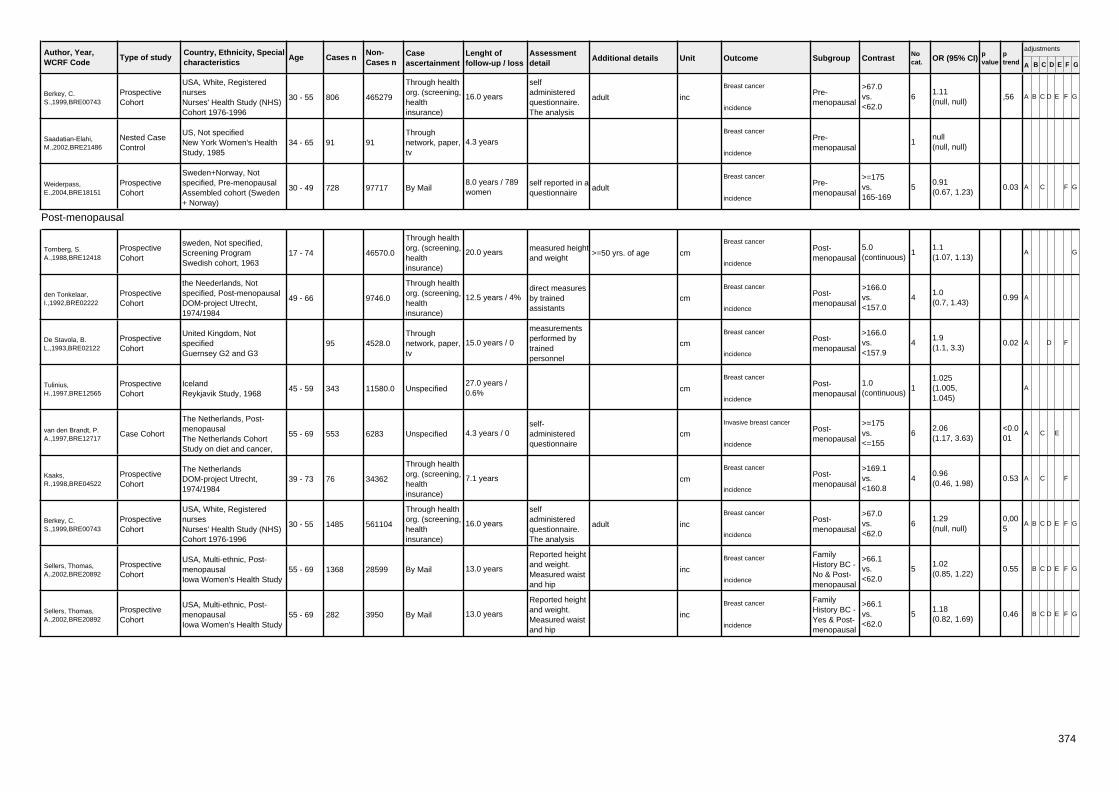
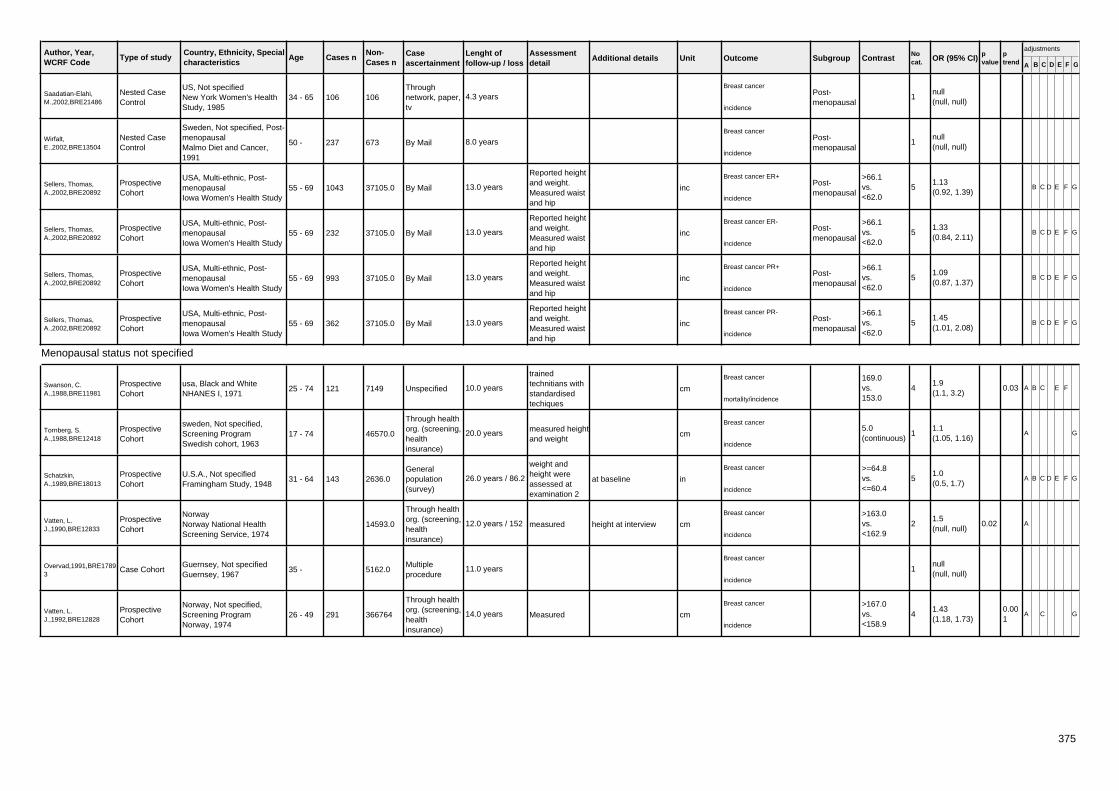
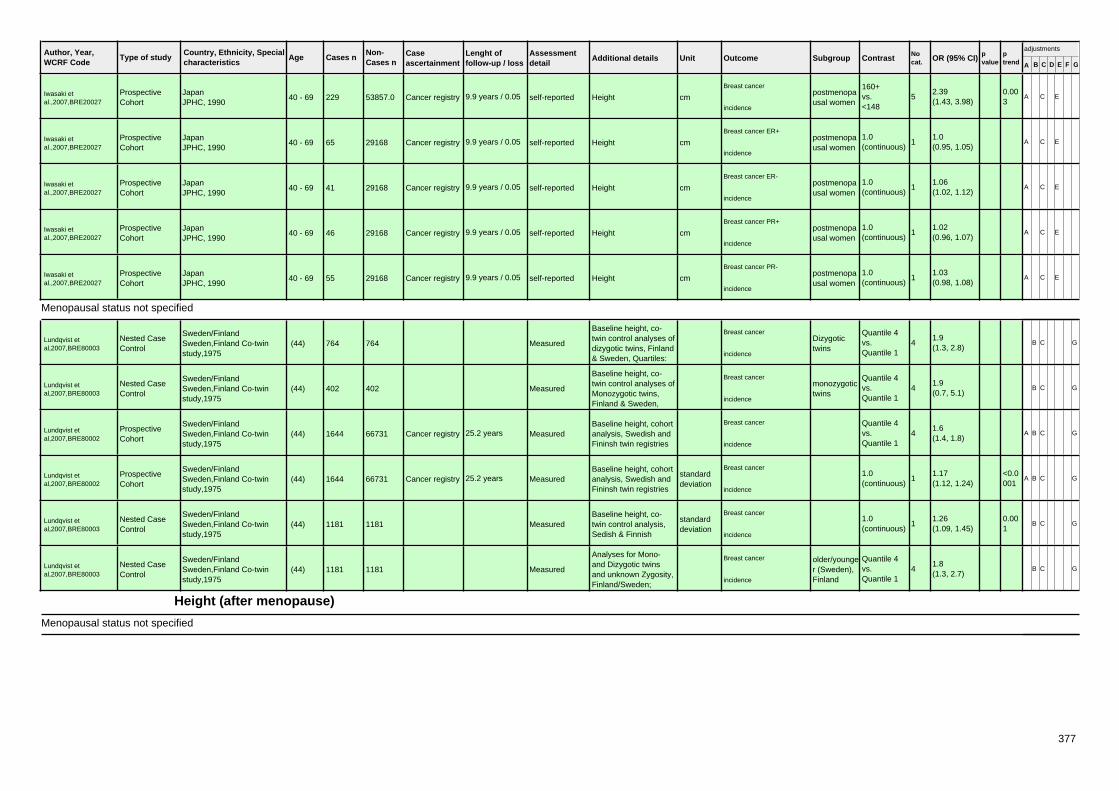
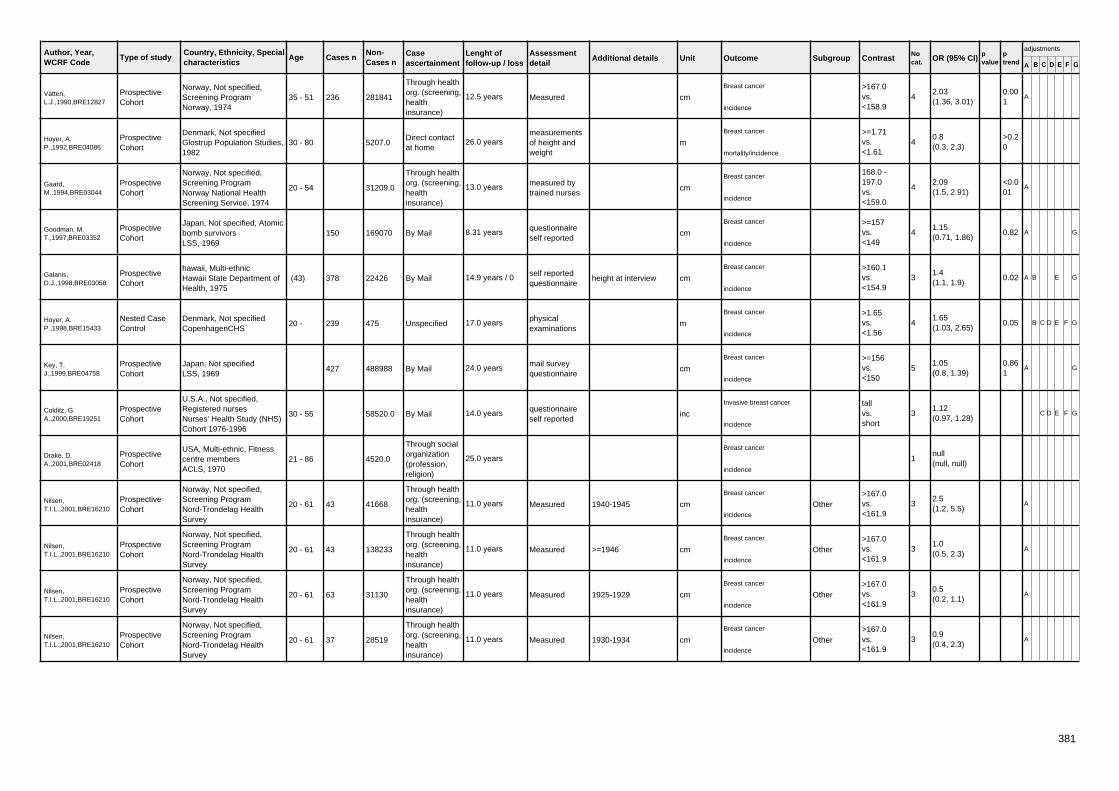
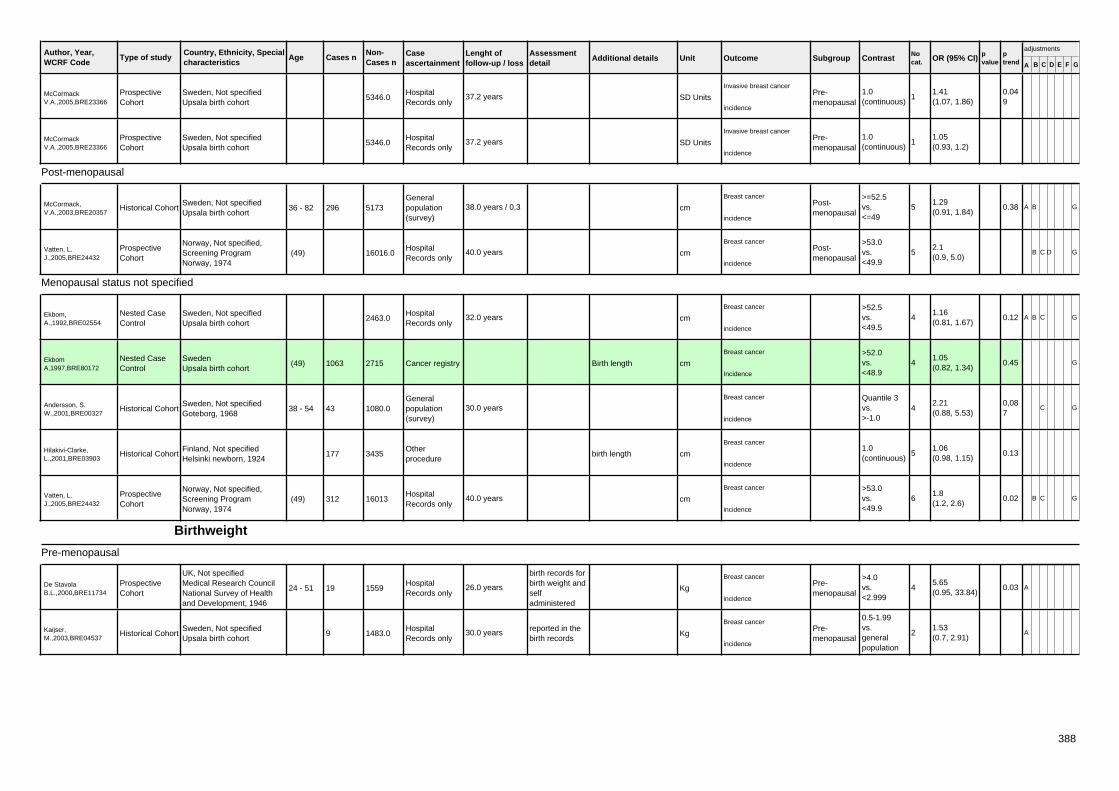
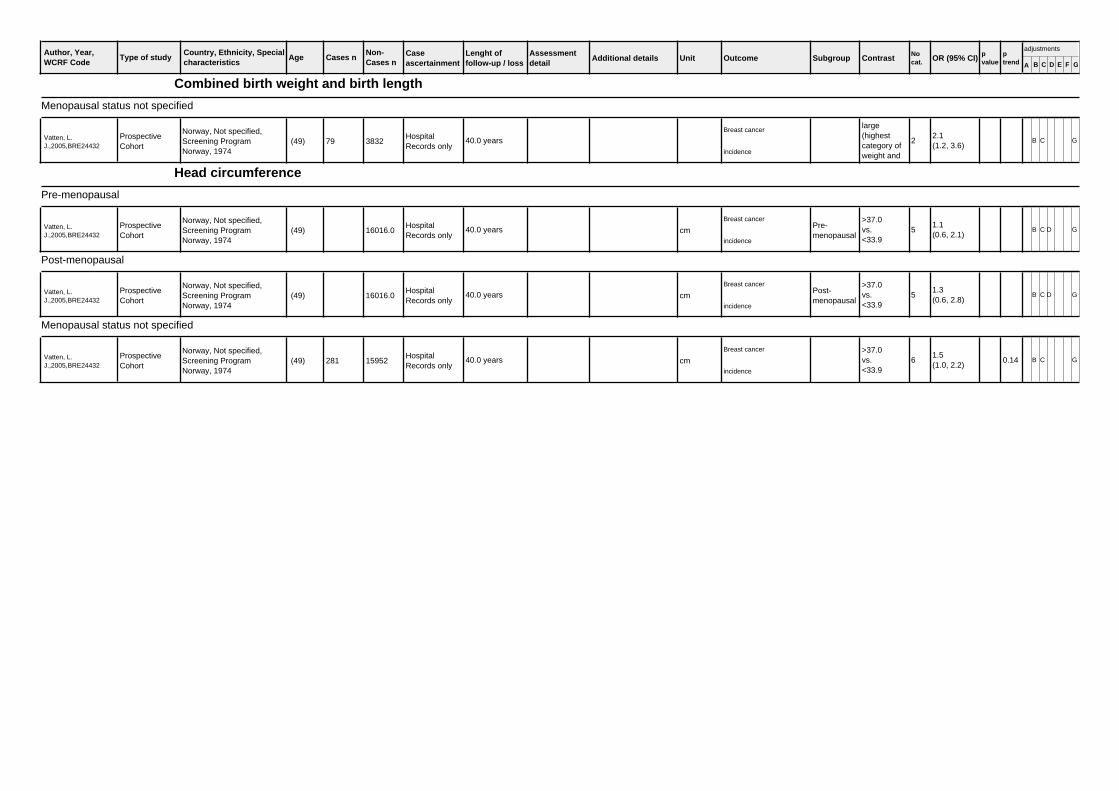
8. Anthropometry ............................................................................................................... 122 8.1.1 Body Mass Index ................................................................................................... 122 8.1.6 Weight Change ...................................................................................................... 157 8.2.1 Waist Circumference ............................................................................................. 160 8.2.3 Waist to hip ratio ................................................................................................... 178 8.3.1 Height (and proxy measure) .................................................................................. 198 8.4.1 Birthweight ............................................................................................................ 213
16 References ......................................................................................................................... 217
16.1 Additional references cited in the report .................................................................... 217 16.2 List of included studies .............................................................................................. 220
Appendix 1 Breast cancer continuous update protocol .......................................................... 240 Appendix 2 Search Strategy................................................................................................... 249 Appendix 3 Exposure codes................................................................................................... 252 Appendix 4 List of abbreviations ........................................................................................... 266 Appendix 5 List of articles awaiting data extraction.............................................................. 269 Appendix 6 Dose-response curves for the studies included in the meta-analyses ................. 270 RESULTS TABLES Best models – randomised controlled trials…………………………………………………285 Best models – cohort studies………………………………………………………………...287

5
List of tables of included and excluded studies from the meta-analyses by exposure and reasons for exclusions a)Table FI 1 Inclusion and exclusion of cohort studies on dietary fibre and postmenopausal breast cancer............................................................................................................................. 66
b)Table A1 Inclusion and exclusion of cohort studies on alcohol (as ethanol) and postmenopausal breast cancer .................................................................................................. 87
c)Table BMI1 Inclusion and exclusion of cohort studies on body mass index and breast cancer (menopause age unspecified) ................................................................................................. 126
d)Table BMI2 Inclusion and exclusion of cohort studies on body mass index and premenopausal breast cancer.................................................................................................. 135
e)Table BMI3 Inclusion and exclusion of cohort studies on body mass index and postmenopausal breast cancer ................................................................................................ 145
f)Table W1 Inclusion and exclusion of cohort studies on waist circumference and premenopausal breast cancer.................................................................................................. 163
g)Table W2 Inclusion and exclusion of cohort studies on waist circumference and postmenopausal breast cancer ................................................................................................ 169
h)Table WHR1 Inclusion and exclusion of cohort studies on waist to hip ratio and premenopausal breast cancer.................................................................................................. 181
i)Table WHR2 Inclusion and exclusion of cohort studies on waist to hip ratio and postmenopausal breast cancer ................................................................................................ 189
j)Table Ht1 Inclusion and exclusion of cohort studies on height and premenopausal breast cancer ..................................................................................................................................... 201
k)Table Ht2 Inclusion and exclusion of cohort studies on height and postmenopausal breast cancer ..................................................................................................................................... 207

6
List of figures from dose-response meta-analyses and high vs. low forest plots
i. Fig. TM1 Highest versus lowest forest plot on meat (unspecified) and breast cancer, by menopausal status..................................................................................................................... 38
ii. Fig. PM1 Highest versus lowest forest plot on processed meat and breast cancer, by menopausal status..................................................................................................................... 41
iii. Fig RM1 Highest vs. lowest forest plot on red meat and breast cancer, by menopausal status......................................................................................................................................... 45
iv. Fig F1 Highest vs. lowest forest plot on fish intake and risk of breast cancer, by menopausal status..................................................................................................................... 51
v. Fig. FI1 Dose-response meta-analysis on dietary fibre and postmenopausal breast cancer 68
vi. Fig. FI2 Funnel plot for dietary fibre and postmenopausal breast cancer........................... 69
vii. Fig. FI3 Highest versus lowest forest plot on dietary fibre and postmenopausal breast cancer ....................................................................................................................................... 70
viii. Fig TF1. Highest vs. lowest forest plot on total fat and breast cancer, by menopausal status......................................................................................................................................... 80
ix. Fig.A1 Dose-response meta-analysis on alcohol (as ethanol) and postmenopausal breast cancer ....................................................................................................................................... 90
x. Fig. A2 Funnel plot for alcohol (as ethanol) and postmenopausal breast cancer................. 91
xi. Fig.A3 Highest versus lowest forest plot on alcohol (as ethanol) and postmenopausal breast cancer............................................................................................................................. 92
xii. Fig FO1 Highest versus lowest forest plot on dietary folate only and postmenopausal breast cancer........................................................................................................................... 102
xiii. Fig P1 Highest vs. lowest forest plot on physical activity and postmenopausal breast cancer ..................................................................................................................................... 112
xiv. Fig P2 Highest vs. lowest forest plot on physical activity-related variables and premenopausal breast cancer.................................................................................................. 113
xv. Fig P3 Highest vs. lowest forest plot on physical activity and breast cancer (menopause age unspecified)...................................................................................................................... 116
xvi. Fig E1 Highest versus lowest forest plot on energy intake and postmenopausal breast cancer ..................................................................................................................................... 120
xvii. Fig. BMI1 Dose-response meta-analysis on BMI and breast cancer (menopause age unspecified) ............................................................................................................................ 129
xviii. Fig. BMI2 Funnel plot for BMI and breast cancer (menopause age unspecified)........ 130
xix. Fig. BMI3 Highest versus lowest forest plot on BMI and breast cancer (menopause age unspecified) ............................................................................................................................ 131
xx. Fig. BMI4 Dose-response meta-analysis on BMI and premenopausal breast cancer ...... 138
xxi. Fig. BMI5 Funnel plot for BMI and premenopausal breast cancer ................................ 139
xxii. Fig. BMI6 Highest versus lowest forest plot on BMI and premenopausal breast cancer................................................................................................................................................ 140
7
xxiii. Fig. BMI7 Dose-response meta-analysis on BMI and postmenopausal breast cancer . 152
xxiv. Fig. BMI8 Funnel plot for BMI and postmenopausal breast cancer............................. 153
xxv. Fig. BMI9 Highest versus lowest forest plot on BMI and postmenopausal breast cancer................................................................................................................................................ 154
xxvi. Fig.BMI10 Dose-response meta-analysis on BMI and postmenopausal breast cancer by HRT use.................................................................................................................................. 155
xxvii. Fig.BMI11 Highest versus lowest forest plot on BMI and pre- and postmenopausal breast cancer by HRT use....................................................................................................... 156
xxviii. Fig.Wtchange1 Highest versus lowest forest plot on weight change and postmenopausal breast cancer ................................................................................................ 159
xxix. Fig. W1 Dose-response meta-analysis on waist circumference and premenopausal breast cancer, results unadjusted for BMI ........................................................................................ 164
xxx. Fig. W2 Dose-response meta-analysis on waist circumference and premenopausal breast cancer, results adjusted for BMI ............................................................................................ 165
xxxi. Fig. W3 Highest versus lowest forest plot on waist circumference and premenopausal breast cancer, results unadjusted for BMI.............................................................................. 166
xxxii. Fig. W4 Highest versus lowest forest plot on waist circumference and premenopausal breast cancer, results adjusted for BMI.................................................................................. 167
xxxiii. Fig. W5 Dose-response meta-analysis on waist circumference and postmenopausal breast cancer, results unadjusted for BMI.............................................................................. 173
xxxiv. Fig. W6 Dose-response meta-analysis on waist circumference and postmenopausal breast cancer, results adjusted for BMI.................................................................................. 174
xxxv. Fig. W7 Funnel plot for waist circumference and postmenopausal breast cancer, results unadjusted for BMI ................................................................................................................ 175
xxxvi. Fig. W8 Highest versus lowest forest plot on waist circumference and postmenopausal breast cancer, results unadjusted for BMI.............................................................................. 176
xxxvii. Fig. W9 Highest versus lowest forest plot on waist circumference and postmenopausal breast cancer, results adjusted for BMI.................................................................................. 177
xxxviii. Fig. WHR1 Dose-response meta-analysis on waist-hip ratio and premenopausal breast cancer, results unadjusted for BMI.............................................................................. 182
xxxix. Fig. WHR2 Dose-response meta-analysis on waist-hip ratio and premenopausal breast cancer, results adjusted for BMI ............................................................................................ 183
xl. Fig. WHR3 Funnel plot for waist-hip ratio and premenopausal breast cancer, results unadjusted for BMI ................................................................................................................ 184
xli. Fig. WHR4 Highest versus lowest forest plot on waist-hip ratio and premenopausal breast cancer, results unadjusted for BMI ........................................................................................ 185
xlii. Fig. WHR5 Highest versus lowest forest plot on waist-hip ratio and premenopausal breast cancer, results adjusted for BMI.................................................................................. 186
xliii. Fig. WHR6 Dose-response meta-analysis on waist-hip ratio and postmenopausal breast cancer, results unadjusted for BMI ........................................................................................ 193

8
xliv. Fig. WHR7 Dose-response meta-analysis on waist-hip ratio and postmenopausal breast cancer, results adjusted for BMI ............................................................................................ 194
xlv. Fig. WHR8 Funnel plot for waist-hip ratio and postmenopausal breast cancer, results unadjusted for BMI ................................................................................................................ 195
xlvi. Fig. WHR9 Highest versus lowest forest plot on waist-hip ratio and postmenopausal breast cancer, results unadjusted for BMI.............................................................................. 196
xlvii. Fig. WHR10 Highest versus lowest forest plot on waist-hip ratio and postmenopausal breast cancer, results adjusted for BMI.................................................................................. 197
xlviii. Fig. Ht1 Dose-response meta-analysis on height and premenopausal breast cancer... 203
xlix. Fig. Ht2 Funnel plot for height and premenopausal breast cancer ................................ 204
l. Fig. Ht3 Highest versus lowest forest plot on height and premenopausal breast cancer .... 205
li. Fig. Ht4 Dose-response meta-analysis on height and postmenopausal breast cancer ....... 210
lii. Fig. Ht5 Funnel plot for height and postmenopausal breast cancer.................................. 211
liii. Fig. Ht6 Highest versus lowest forest plot on height and postmenopausal breast cancer212
liv. Fig. BW1 Highest versus lowest forest plot on birthweight by menopausal status......... 216

9
World Cancer Research Fund/ American Institute Continuous update report
The Associations between Food, Nutrition and Physical Activity and the Risk of Breast Cancer
Breast Cancer
Prepared by: Continuous Update Team, Imperial College London
Introduction
The World Cancer Research Fund/American Institute for Cancer Research (WCRF/AICR) Continuous Update is an ongoing project to follow the Second Expert Report. In the same way that the report was informed by a process of systematically reviewing the literature and evidence, the Continuous Update will systematically review the epidemiological evidence and have the results of that review considered by a panel of experts that will draw conclusions. The report reviews the results of cohort studies and controlled trials on diet, nutrition, physical activity and breast cancer published from Jan 2006 till Dec 2007. The number of reports included is 100, from which 1 is a randomised controlled trial, 74 are reports based on prospective cohort designs, 4 are historical cohorts, 1 report has a case cohort design, and 21 are case-control studies nested in cohorts (see Figure 1 Flow Chart of Search). The continuous update should ensure consistency of approach to the evidence, common approach to the analysis and format for displaying the evidence used as in the literature reviews for the Global Report, 2007.
The starting point for this protocol are:
• The convention for conducting systematic reviews developed by WCRF International for the Global Report, 2007 (See 16.1 Aditional references)
• The protocol developed by the Continuous Update - Imperial College group on breast cancer (Appendix 1).

10
In the judgment of the Panel of the WCRF-AICR Global Report, 2007, the factors listed below modify the risk of breast cancer. Judgments are graded according to the strength of the evidence.
CANCER OF THE BREAST (PREMENOPAUSE)
DECREASES RISK INCREASES RISK
Convincing Lactation Alcoholic drinks
Probable Body fatness
Adult attained height Greater birth weight
Limited –suggestive Physical activity
Limited –no conclusion
Cereals (grains) and their products; (grains) and their products; potatoes; vegetables; fruits; pulses (legumes); soya and soya products; meat; poultry; fish; eggs; fats and oils; vegetable fat; sugar; sugary foods and drinks; milk and dairy products; coffee; tea; carbohydrate; starch; dietary fibre; sugars; total fat; fatty acid composition; trans-fatty acids; cholesterol; protein; vitamin A; carotenoids; folate; riboflavin; vitamin B6; cobalamin; vitamin C; vitamin D; vitamin E; iron; calcium; selenium; isoflavones; dieldrin; trans-nonachlor; dichlorodiphenyltrichloroethane; dichlorodiphenyldichloroethylene; polychlorinated biphenyls; hexachlorocyclohexane; hexachlorobenzene; energy intake; adult weight gain; adult attained height; dietary patterns; culturally defined diets; glycaemic index; and being breastfed.
Substantial effect on risk unlikely
None identified

11
CANCER OF THE BREAST (POSTMENOPAUSE)
DECREASES RISK INCREASES RISK
Convincing Lactation Alcoholic drinks Body fatness Adult attained height
Probable Physical activity
Abdominal fatness Adult weight gain
Limited –suggestive Total fat
Limited –no conclusion
Cereals (grains) and their products; potatoes; vegetables and fruits; pulses; soya and soya products; meat; poultry; fish; eggs; fats and oils; sugar; sugary drinks and foods; milk and dairy products; coffee; tea; carbohydrate; starch; dietary fibre; vegetable fat; fatty acid composition; cholesterol; protein; vitamin A and carotenoids; riboflavin; vitamin B6; vitamin B12; folate; vitamin C; vitamin D; vitamin E; isoflavones; iron; calcium; selenium; dieldrin; trans-nonachlor; dichlorodiphenyltrichloroethane; dichlorodiphenyldichloroethylene; polychlorinated biphenyls; hexachlorocyclohexane; hexachlorobenzene; energy intake; birth length; culturally defined diets; dietary patterns; glycaemic index; being breastfed; and birth weight.
Substantial effect on risk unlikely
None identified

12
1. Research question The research topic is:
The associations between food, nutrition, physical activity and the risk of breast cancer. 2. Review team
Name Current position at ICL Role within team
Teresa Norat Research Fellow Principal investigator
Rui Vieira Data manager Responsible of the data management, the design and architecture of the database
Doris Chan Research Assistant Nutritional epidemiologist, reviewer
Rosa Lau Research Assistant Nutritional epidemiologist, reviewer
Review coordinator, WCRF: Rachel Thompson 3. Timeline Literature search for the continuous update was performed in PubMed for the period from January 2006 to May 2008 using the same search strategy developed for the Global Report, 2007.
The review for the Global Report, 2007 ended in December 30th 2005. A pre-publication update extended the search to May 30th 2006 for exposures and cancer sites with suggestive, probable, convincing associations with the exposure of interest. In order to ensure the completeness of the literature search, the search period of the continuous update overlapped with that in the pre-publication update.
Data extraction was conducted until the end of December 2007 and further relevant articles published in 2008 are awaiting data extraction (see Figure 1. Flowchart of search, p.14 and Appendix 5). Pooled analysis and meta-analysis published during the update were used as supporting evidence in this report.
4. Search strategy The Continuous update team used the search strategy established in the SLR Guidelines with the modifications implemented by the SLR centre (Milan) for the Global Report, 2007, as explained in the protocol presented to the CUP on March 5th 2007. The complete search strategy and the modifications can be found in Appendix 2. 5. Selection of articles Only articles that match the inclusion criteria (see 5.1) were updated in the database.
3829 articles were identified through the PubMed search between January 2006 and May 2008. Of these articles, 99 were reports of cohort studies or case-control studies nested within a cohort on diet, physical activity, nutrition and breast cancer, and one report was a controlled
13
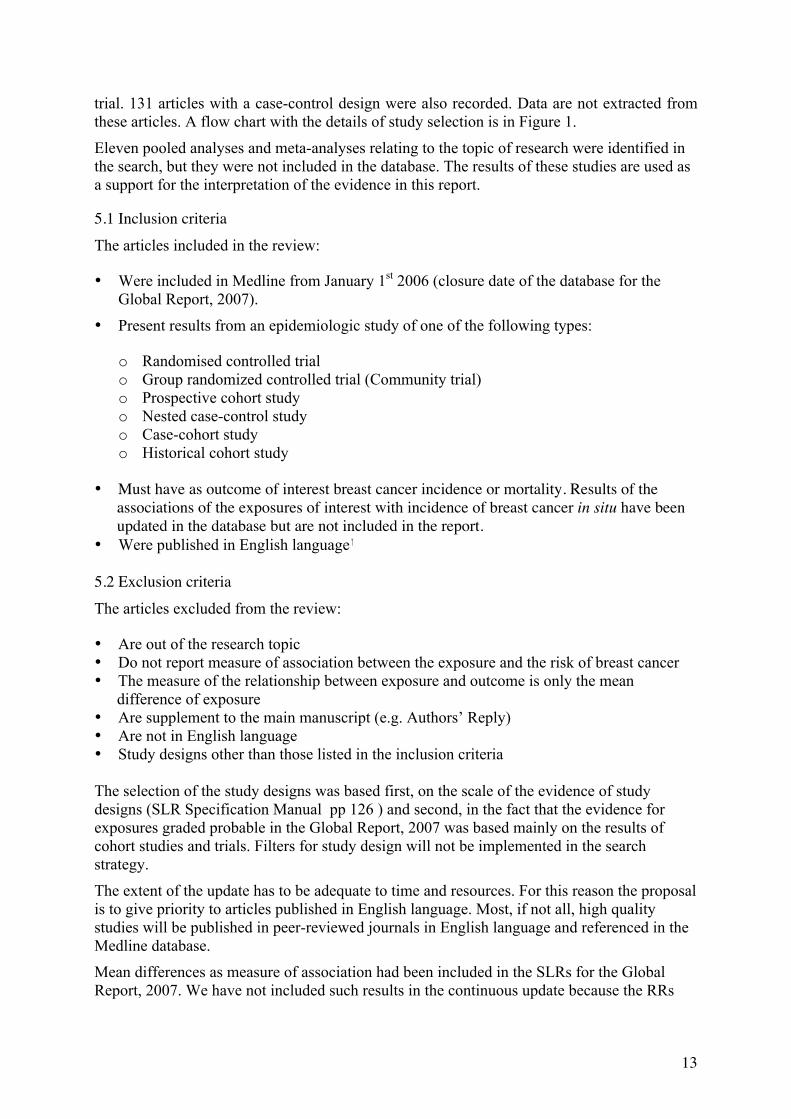
trial. 131 articles with a case-control design were also recorded. Data are not extracted from these articles. A flow chart with the details of study selection is in Figure 1.
Eleven pooled analyses and meta-analyses relating to the topic of research were identified in the search, but they were not included in the database. The results of these studies are used as a support for the interpretation of the evidence in this report.
5.1 Inclusion criteria
The articles included in the review:
• Were included in Medline from January 1st 2006 (closure date of the database for the Global Report, 2007).
• Present results from an epidemiologic study of one of the following types:
o Randomised controlled trial o Group randomized controlled trial (Community trial) o Prospective cohort study o Nested case-control study o Case-cohort study o Historical cohort study
• Must have as outcome of interest breast cancer incidence or mortality. Results of the
associations of the exposures of interest with incidence of breast cancer in situ have been updated in the database but are not included in the report.
• Were published in English language 5.2 Exclusion criteria
The articles excluded from the review:
• Are out of the research topic • Do not report measure of association between the exposure and the risk of breast cancer • The measure of the relationship between exposure and outcome is only the mean
difference of exposure • Are supplement to the main manuscript (e.g. Authors’ Reply) • Are not in English language • Study designs other than those listed in the inclusion criteria The selection of the study designs was based first, on the scale of the evidence of study designs (SLR Specification Manual pp 126 ) and second, in the fact that the evidence for exposures graded probable in the Global Report, 2007 was based mainly on the results of cohort studies and trials. Filters for study design will not be implemented in the search strategy.
The extent of the update has to be adequate to time and resources. For this reason the proposal is to give priority to articles published in English language. Most, if not all, high quality studies will be published in peer-reviewed journals in English language and referenced in the Medline database.
Mean differences as measure of association had been included in the SLRs for the Global Report, 2007. We have not included such results in the continuous update because the RRs

14
estimated from the mean differences are not adjusted and are thus not comparable to adjusted relative risks estimated. Figure 1. Flowchart of search
3829 Articles identified in PubMed during
Jan 2006 and May 2008
231 Relevant articles
74 Articles with a prospective
cohort design3
1 Article with a case-cohort
design
131 Articles with
a case-control design
21 Articles with
a nested-case-control
design3
81 Articles extracted up to Dec 2007
20 Articles published in 2008
awaiting extraction5
27 Hospital-
based case-control studies
48 Population-based case-
control studies
56 Case-control studies (type
undetermined4)
1 Included mechanistic studies, animal studies and studies on breast cancer survival 2 Included 4 case-control studies and 1 prospective cohort study 3 One article had a prospective cohort and a nested case-control design 4 Abstract alone was insufficient to determine the type of case-control study 5 Included 2 articles pending from 2007
3598 excluded articles
2887 out of the research topic1, 392 review, 105 no specific outcome, 102 no exposure of interest, 64 commentary, 12 no measure of relationship, 12 meta-analysis, 10 duplicates/extracted, 5 articles in foreign language2, 4 ecological studies, 2 case series, , 2 cross-sectional studies, 1 no report of analytical result
4 Articles with a historical
cohort design
1 Randomised controlled
trial
Exclusion
Inclusion
Extraction

15
6. Exposures The continuous update used the exposure labels and codes listed in the SLR Guidelines for the Global Report, 2007.
During the SLR for the Global Report, 2007, the SLR centres assigned new sub-codes for exposures that were more detailed than the WCRF list of exposures. When all the databases produced in the SLR for the Global Report were merged, it became evident that all the sub-codes used were not the same in all centres and that several sub-exposures were not grouped under the same main exposure in all centres. With all databases merged into one, it was necessary to recode the exposures to ensure the identity of exposure codes with the corresponding exposure labels in the merged database. The process of recodification of sub-exposures for its “harmonisation” was carried out at ICL. First, all the codes and labels in the merged database were reviewed by Teresa Norat (ICL), Doris Chan (ICL) and Rachel Thompson (WCRF). Second, a comparison of subcodes used in different centres was done and the final code was the one used by the highest number of centres.
The updated list of sub-exposures and codes is in Appendix 3. The codes defined in the SLR Guidelines remained the same. Originally, there were 4 509 distinct sub-exposures. After the “harmonisation”, the number was reduced to 3930 by merging of redundant sub-exposures. The changes affected a total of 34 537 results (for a comparison term, the total number of individual breast results is 11 765).
The table below shows the number of sub-exposures by main exposure in the original Access database and in the last version of the MySQL database.
Main exposure Number of sub-exposures under the main exposure in the Access databases
Number of sub-exposures under the main exposure in the MySQL merged database
1. Patterns of diet 221 210
2. Foods 1335 1191
3. Beverages 307 242
4. Food production, preservation, processing and preparation
557 512
5. Dietary constituents 1446 1236
6. Physical activity 273 225
7. Energy balance 96 66
8. Anthropometry 274 248
Total 4509 3930
The actualisation of the database with the new sub-exposure codes was implemented by Rui Vieira (Data manager ICL) and the new exposure list incorporated in the interface for data

16
entry. The ICL team keeps a copy of the merged database containing the original information generated by the SLR centres. All the modifications of the database can be traced in a log file. The log file contains 12 548 changes recorded. 7. Outcome The outcome of interest is breast cancer encompassing incidence and mortality. Results of studies on premenopausal, postmenopausal and all breast cancers combined (or menopausal status not specified) are presented separately.
8. Databases Only the Medline database was searched. Data from the SLR for the Global Report, 2007 indicates that 95% of the articles included in the review have been retrieved from the Medline database. PubMed was used as interface to access Medline.
9. Hand searching for cited references For feasibility reasons, journals have not been hand searched systematically in the continuous update. Hand searching and searching in other databases will be done if there is some evidence that an important study has been missed by the search strategy. The references of the published meta-analyses and pooled analyses were checked to verify the completeness of the search. Six relevant studies published before 2006 were identified through checking the reference lists of reviews and the Global Report. Data from these studies were either not available for the 2005 SLR analysis (Ekbom, A. et al., 1997 , BRE80172;Folsom, A. R. and Demissie, Z. 2004 , BRE80171;Van Gils, C. H. et al., 2005 , BRE80167; Muti, P. et al., 2000, BRE80180) or were only cited in the Global Report (Macinnis, R. J. et al., 2004 , BRE80159;Olsen, A. et al., 2004 , BRE80170). These studies had been extracted to the WCRF/AICR database and were included in the present report. 10. Retrieving papers The abstracts of the articles retrieved with the search strategy in PubMed were reviewed to assess whether each reference was relevant or potentially relevant.
The articles of relevant and potentially relevant references and of references that could not be excluded upon reading the title and abstracts were downloaded. A second assessment was done after review of the complete article. 11. Labelling of references For consistency with the previous data collected during the SLR process for the Global Report, 2007, the Continuous Update team used the same labelling of references: the unique identifier for a particular reference was constructed using a 3-letter code to represent the cancer site (e.g. BRE for breast cancer), followed by a 5-digit number that was allocated in sequence. 12. Reference Manager Files All the references retrieved with the PubMed search strategy are stored in Reference Manager databases with the following additional customized fields:

17
1) One of the customized fields (User Def 1) is named ‘inclusion’ and this field is marked ‘included’, ‘excluded’ for each paper, thereby indicating which papers are deemed potentially relevant based on an assessment of the title and abstract.
2) One of the customized fields (User Def 2) is named ‘reasons’ and this field include the reason for exclusion for each paper.
3) The study identifier was entered under the field titled ‘label’. 4) One of the customized fields (User Def 3) is named “study design”. This field
indicates the study design of each paper: 13. Data extraction The Access databases generated during the SLR for the Global Report, 2007 have been merged into one database at Imperial College and upgraded to MySQL.
The Continuous Update team has updated the merged database using an interface created at Imperial College. The interface allows the update of all variables included in the Access databases for the SLR for the Global Report. Several facilities have been implemented to facilitate data entry, retrieval and reporting.
The study design algorithm devised for use of the SLR centres for the Global Report, 2007 was used to allocate study designs to papers (SLR specification manual –version 15 pp 123). In some cases it was needed to assign more than one design to a particular paper because the data were analysed in the entire cohort and using a case-control design nested in the cohort. 13.1 Choice of Result All the relative risks estimates reported in each paper have been extracted. The results should be labelled as not adjusted, minimally adjusted, intermediately adjusted and maximally adjusted, according to the model used for its estimation. In addition, the reviewer should indicate a “best model” for inclusion in reports. Unadjusted results were extracted but not used in the reports. The best model has to be controlled for confounding by age, either by adjustment or by matching. Where there was more than one model adjusting for age, the most adjusted one was considered to be the best model. Exception to this criterion is “mechanistic” models, adjusting for variables likely to be in the causal pathway. Examples of mechanistic models are results for BMI adjusted for height or weight (or other similar combinations) and results for waist-to-hip ratio adjusted for either waist or hip circumference.
When such results (over adjusted results) were reported, the most adjusted results that were not over-adjusted were considered as “best models”, while the over-adjusted results were identified as “maximally adjusted”, but not as “best models”.
Sometimes, some of the potential risk factors are not kept in the final model because their inclusion does not modify the risk estimates. If this is specified in the article text, this model was also considered the “best model”. 13.2 Effect modification
Although one of the aims of the Continuous update is to report whether effect modification has been investigated for a particular association, this information has not been included into the database in a standardized way. The Continuous Update team is developing a module for data entry of data on effect modification and interactions. This module is at its early stage of development. Some interactions are described in the report but the completeness of the data requires further improvement.

18
13.3 Gene-nutrient interaction No attempt was made to critically appraise or analyse the studies that reported gene-nutrient interactions in the Global Report, 2007. The results of these studies were described in the narrative review under the relevant exposures and the same approach is followed in the Continuous update. A separate protocol to handle gene-nutrient interactions is in the process of being developed by the ICL. 13.4 Multiple articles Data has been extracted for each individual paper, even if there is more than one paper from any one cohort study or trial. For report purposes, the most appropriate data set was selected amongst the papers published from a study on a particular exposure to ensure there was no duplication of data from the same study in an analysis. The selection of the most appropriate data set was approached in the following way:
a) The result has to be the “Best adjusted” b) The results are of the analysis based on the larger number of cases compared to other
results of the same study. Often, it is equivalent to use the most recently published article.
c) The data set is the most complete result from that study regarding the data needed for the meta-analysis.
14. Report 14.1 Data presentation.
This report contains the results of the study of the association of food, nutrition, physical activity and breast cancer risk in cohort studies and trials, that has been published from January 2006 to Dec 2007 studies and with the inclusion criteria listed under 5.1. The Continuous Update report present results only for the exposures investigated in the articles published in the update period. The exposures for which no new results have been published from January 2006 are not included in the Continuous Update report. The presentation of updated results is ordered by exposure code. This report does not repeat the results of the SLR for the Global Report 2007. A short summary of the results of the SLR is given for each updated exposure. The summary is followed by a description of the study results published in the update period.
As in the SLR, the results are displayed graphically in forest plots comparing the highest vs. the lowest category of exposure in each study, together with the name of the cohort study, its specific WCRF code and the exposure categories used. The Continuous update team has developed a new interface equipped with a facility to export the data needed to generate the forest plots. However, it was necessary to visually check the data exported for verification of the process, the consistency of the exposure and to detect study duplicity. It was therefore not possible for the team to present in this report forest plots for all the exposures and it was done for selected exposures. Exposures to be presented graphically were selected using the same criteria for performing dose-response meta-analysis, i.e. when 3 or more cohort studies were published from January 2006 to Dec 2007 and if the total number of study results retrieved during the SLR and the continuous update totalised to more than 3 trials or 5 cohort studies.

19
In forest plots, studies are presented by descending year of publication. The list of exposures for which forest plots are displayed is in “15. Results of the update”. 14.2 Dose-response meta-analysis Dose-response meta-analysis were conducted when 3 or more cohort studies were published from January 2006 to Dec 2007 and if the total number of study results retrieved during the SLR and the continuous update totalised to more than 3 trials or 5 cohort studies. The list of exposures for which meta-analyses have been conducted is in “15. Results of the update”. Special care was taken to avoid including more than once the results of the same study (e.g. previous analyses and re-analyses after a longer follow-up). For that reason, some studies included in meta-analyses in the SLR have been replaced by updated results. A few studies that were duplicated have been removed. Studies included in the previous meta-analyses that reported only mean differences between cases and non-cases as measure of association have been removed from the updated meta-analysis. The list of studies included and excluded from the meta-analysis as well as the reasons for exclusions are tabulated in each section under the exposure heading. The statistical methods used in the meta-analyses are the same described in the WCRF Guidelines for the SLR. To investigate the dose-response relationship, the relative risk (RR) associated with a unit of increase in exposure was estimated from the category-specific risk estimates using the method of generalised least-squares for trend estimation (Orsini N et al, 2006). The unit of increment was the same unit used in the SLR. Summary RR estimates with their corresponding 95% CIs has been derived by the method of DerSimonian and Laird, 1986 using the assumption of a random effects model. The current dose-response meta-analysis assumes linear relationship between the exposure and breast cancer. Heterogeneity between studies was assessed with the I2 statistic as a measure of the proportion of total variation in estimates that is due to heterogeneity, where I2 values of 25%, 50%, and 75% correspond to cut-off points for low, moderate, and high degrees of heterogeneity (Higgins and Thompsosn, 2002). As usual method of assessing and displaying heterogeneity, we also examined forest plots. We attempted to assess the sources of heterogeneity by meta-regression. However, the number of studies was often limited. The main variables examined were geographic area, year of publication, length of follow-up and exposure assessment methods. Publication bias was examined in funnel plots.
All analyses were conducted using STATA version 9.2 (College Station, TX, USA).
14.2.1 Missing values
The data needed to estimate the dose-response associations are often incompletely reported, which may result in exclusion of results from meta-analyses.
A recent review published by the SLR Bristol showed that only 64% of the results of cohort studies provide enough data to be included in dose-response meta-analyses (Bekkering et al, 2008) and that the results that showed evidence of an association were more likely to be usable in dose-response meta-analysis than results that found no such evidence. Insufficient detail in reporting of results of observational studies can lead to exclusion of these results from meta-analyses.
Failure to include all available evidence will reduce precision of summary estimates and may also lead to bias if propensity to report results in sufficient detail is associated with the magnitude and/or direction of associations.We therefore computed missing data using the

20
assumptions recently reviewed by participants of the SLR Bristol (Bekkering et al, 2008) and listed below: Type of data
Missing data Assumptions
Dose-response data
Standard error The p value (either exact or the upper bound) was used to estimate the standard error
Quantile-based data
Numbers of controls (or the denominator in cohort studies)
Group sizes are assumed to be approximately equal
Confidence interval Standard error were calculated from raw numbers (although doing so may result in a somewhat smaller standard error than would be obtained in an adjusted analysis)
Group mean are missing This information was estimated by using the method of Chene and Thompson (Chene G et al., 1996) with a normal or lognormal distribution in unbounded groups or by taking midpoints in bounded groups.
Category data Numbers of cases and controls (or the denominator in cohort studies) is missing
These numbers may be inferred based on numbers of cases and the reported odds ratio (proportions will be correct unless adjustment for confounding factors considerably alter the crude odds ratios)
Methods proposed in the literature allows the computation of unadjusted odds ratios by using numbers of cases and comparison subjects (controls) or person-years in each group, or from the mean difference between cases and controls (Chene G, Thompson SG, 1996). Since “best models” are included in the meta-analysis, unadjusted odds ratios were not imputed to replace missing odds ratios. 15. Results of the update Highest vs. lowest forest plots are presented for the following exposures: 2.5 Total meat
2.5.1.2 Processed meat
2.5.1.3 Red meat
2.5.2 Fish
5.1.2 Dietary fibre
5.2 Total fat
5.4 Alcohol (as ethanol)
5.5.3 Dietary folate
6 Physical activity
7.1 Energy

21
8.1.1 BMI
8.1.6 Weight change
8.2.1 Waist circumference
8.2.3 Waist-hip ratio
8.3.1 Height
8.4.1 Birthweight
Dose-response meta-analyses were conducted for the following exposures: 5.1.2 Dietary fibre
5.4 Alcohol (as ethanol)
8.1.1 BMI
8.2.1 Waist circumference
8.2.3 Waist-hip ratio
8.3.1 Height
The number of cohort studies by exposure are in Table 1. Table 1. Number of cohort studies by exposure (updates of previously published cohort studies are in brackets) * the same cohort has 2 or more articles cited in the text Code Name Total SLR CU 1. Patterns of diet 1.3.1 Vegetarianism 3 2* 1 1.4a Dietary guideline index score 3 2 1 1.4b Individual level dietary patterns 1 0 1 1.6.1 Breastfeeding, Mother 3 1 2 1.6.1 Total duration of breastfeeding 8 5* 3 2. Foods 2.1.1.0.4 Cold cereals (breaskfast) 3 2 1 2.2 Fruit and (non-starchy) vegetables 4 4 (2) 2.2.1 Non-starchy vegetables 5 5 (1) Green-leafy vegetables (excluding cruciferous) 4 4 (1) Cruciferous vegetables 2 2* (1) 2.2.2.1.1 Grapefruit 2 0 2 2.3.1 Soy products 3 2 1 2.3.1.1 2.3.2.2 2.5.1
Miso, soy paste soup Tofu Meat (unspecified)
3 3 10
2 2 8*
1 1 2
2.5.1.2 Processed meat 6 3* 3 2.5.1.3 Red meat 8 5* 3+(1) 2.5.1.4 Poultry 6 4* 2 2.5.1.5 Liver (fish) 1 0 1 2.5.1.5 Offals 1 0 1 2.5.2 Fish 10 9* 1*

22
2.6.2 Plant oils 3 2 1 2.7 Milk and dairy products 9 6 3 Milk 9 8 1 2.7.2 Cheese, fresh cheese 6 5 1 2.7.3 Yoghurt 3 2 1 3. Beverages 3.5 Fruit juices 6 3 3 3.6.1 Coffee 6 4 2 3.6.2 Tea 7 6 1+(1) 3.7.1 Alcoholic drinks 14 12 2+(3) 3.7.1.1 Beers 14 11* 3 3.7.1.2 Wines 14 10* 4 3.7.1.3 Spirits/liquor 14 11* 3 4. Food production, preservation, processing and preparation 4.4.2 Acrylamide 2 1 1 4.4.2.6 Broiled 2 1 1 5. Dietary constituents 5.1.2 Dietary fibre 12 10* 2+(1) 5.1.2 5.1.2.1 5.1.2.3 5.1.5
Vegetable fibre Cereal fibre Fruit fibre Glycemic index
5 5 5 8
3* 3* 3* 7*
2 2 2 1
5.1.5 Glycemic load 8 7* 1 5.2 Total fat 8 7* 1+(1) 5.2.2 Saturated fatty acids 20 19 1 5.2.3 Monounsaturated fatty acids 17 15 2 5.2.4 Polyunsaturated fatty acids 15 13 2 5.5.2 Vitamin B 5 4 1 5.5.10 Vitamin D 6 4 2+(1) 5.5.0 Multivitamin supplement 5 3* 2 5.5.3 Folate 10 8 2+(3) 5.6.2 Iron 1 0 1 5.6.3 Calcium 8 3 5+(1) 5.6.4 Selenium 9 7 2 5.6.7 Zinc 1 0 1 5.7.5 Phytoestrogens 12 9 3 6. Physical activity 6.1 6.1.1.1
Total physical activity Occupational physical activity
8 6
7 5*
1 1
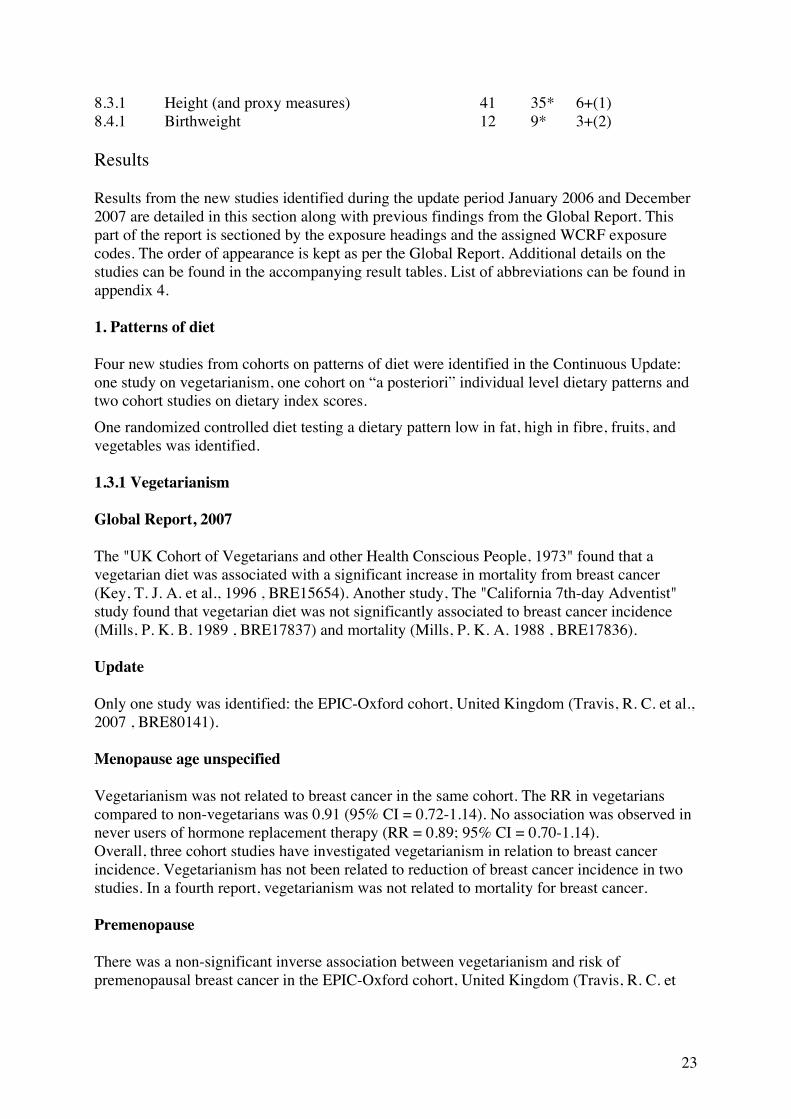
6.1.1.2 Recreational activity 14 12 2+(1) 6.1.3 Vigorous physical activity 10 9 1 7. Energy balance 7.1 Energy intake 15 14* 1+(1) 7.1.1 Energy from fat 8 7* 1+(1) 7.1.2 Energy from carbohydrate 4 3 1 8. Anthropometry 8.1.1 BMI 57 44* 13+(6) 8.1.6 Weight change 11 8* 3+(2) 8.2.1 Waist circumference 13 8 5+(2) 8.2.3 Waist to hip ratio 15 10 5+(1)
23
8.3.1 Height (and proxy measures) 41 35* 6+(1) 8.4.1 Birthweight 12 9* 3+(2) Results Results from the new studies identified during the update period January 2006 and December 2007 are detailed in this section along with previous findings from the Global Report. This part of the report is sectioned by the exposure headings and the assigned WCRF exposure codes. The order of appearance is kept as per the Global Report. Additional details on the studies can be found in the accompanying result tables. List of abbreviations can be found in appendix 4. 1. Patterns of diet Four new studies from cohorts on patterns of diet were identified in the Continuous Update: one study on vegetarianism, one cohort on “a posteriori” individual level dietary patterns and two cohort studies on dietary index scores. One randomized controlled diet testing a dietary pattern low in fat, high in fibre, fruits, and vegetables was identified. 1.3.1 Vegetarianism Global Report, 2007 The "UK Cohort of Vegetarians and other Health Conscious People, 1973" found that a vegetarian diet was associated with a significant increase in mortality from breast cancer (Key, T. J. A. et al., 1996 , BRE15654). Another study, The "California 7th-day Adventist" study found that vegetarian diet was not significantly associated to breast cancer incidence (Mills, P. K. B. 1989 , BRE17837) and mortality (Mills, P. K. A. 1988 , BRE17836). Update Only one study was identified: the EPIC-Oxford cohort, United Kingdom (Travis, R. C. et al., 2007 , BRE80141). Menopause age unspecified Vegetarianism was not related to breast cancer in the same cohort. The RR in vegetarians compared to non-vegetarians was 0.91 (95% CI = 0.72-1.14). No association was observed in never users of hormone replacement therapy (RR = 0.89; 95% CI = 0.70-1.14). Overall, three cohort studies have investigated vegetarianism in relation to breast cancer incidence. Vegetarianism has not been related to reduction of breast cancer incidence in two studies. In a fourth report, vegetarianism was not related to mortality for breast cancer. Premenopause There was a non-significant inverse association between vegetarianism and risk of premenopausal breast cancer in the EPIC-Oxford cohort, United Kingdom (Travis, R. C. et

24
al., 2007 , BRE80141). The RR of breast cancer in vegetarians compared to non-vegetarians was 0.95 (95% CI = 0.68-1.32) (196 cancer cases). Postmenopause In the same cohort study (Travis, R. C. et al., 2007 , BRE80141) vegetarianism was non-significantly inversely related to risk of postmenopausal breast cancer. The RR of breast cancer in vegetarians compared to non- vegetarians was 0.79 (95% CI = 0.54-1.16) (290 cancer cases). 1.4a Individual level dietary patterns No cohort study was identified in the SLR. Update The ORDET study, Italy (Sant, M. et al., 2007 , BRE80036) was the only cohort study identified. The following patterns were derived from factor analysis in a population including 40 breast cancer cases HER2 – and 198 HER2+: -Salad vegetables score (highest factor loadings on raw vegetables and olive oil) -Western diet score (highest factor loadings on potatoes, ravioli, red and processed meat) -Canteen diet score (highest factor loading on pasta, tomato sauce, olive oil, wine) -Prudent diet score (highest factor loading, on cooked vegetables, rice poultry fish low) The analyses were stratified according to HER2 status. No significant association was observed in most analyses. The only significant result was an inverse relationship associated with highest value of the salad score in HER-2+ women (RR Q3
vs Q1= 0.25 (95% CI = 0.1-0.64)). The authors conducted exploratory factor analysis to reduce the food groups to a small number of factors that explained the maximum fraction of the variance. The Scree test was employed to determine the number of factors to retain (4 factors). 1.4b Diet low in fat, high in fibre, fruits, and vegetables Update One clinical trial was identified. The results of the Women’s Health Initiative Dietary Modification Randomised Controlled Trial (WHI DM trial) were published in the update period (Prentice, R. L. et al., 2006 , BRE80155). In this trial, women were randomly assigned to the dietary modification intervention group (40%, n = 19 541) or the comparison group (60%, n = 29 294). The intervention was designed to promote dietary change with the goals of reducing intake of total fat to 20% of energy and increasing consumption of vegetables and fruit to at least 5 servings daily and grains to at least 6 servings daily. Comparison group participants were not asked to make dietary changes. The low-fat dietary pattern did not result in a statistically significant reduction in invasive breast cancer risk over an 8.1- year average follow-up period (655 breast cancer cases in the

25
intervention group and 1072 in the comparison group; RR = 0.91, 95% CI = 0.83-1.01 for the comparison between the two groups). On average, the target of reducing intake of dietary fat to 20% of energy was not achieved. The low-fat dietary pattern did not result in a statistically significant reduction in invasive breast cancer risk over an 8.1- year average follow-up period (655 breast cancer cases in the intervention group and 1072 in the comparison group; RR = 0.91, 95% CI = 0.83-1.01 for the comparison between the two groups). Women in the upper quartile of percent energy from fat at baseline (>36.8% of total energy from fat) had a larger estimated reduction in risk with the intervention (HR = 0.78, 95% CI = 0.64-0.95). Similar results were reported in women with more than or equal to 76 g/day total fat intake at baseline (RR = 0.79, 95% CI = 0.64-0.96). The hazard ratio estimate was lower for tumors negative for the progesterone receptor(PR) than for tumors positive for the progesterone receptor (P=0.04) but did not depend on estrogen receptor (ER) status. When tumors were classified by both ER and PR status, there was an indication (P=0.04) of hazard ratio variation with stronger evidence for a reduction in the occurrence of tumors that are positive for the estrogen receptor and negative for the progesterone receptor. 1.4c Dietary guideline index score Global Report, 2007 One study showed an inverse association of breast cancer risk with increasing levels of a score of compliance with the Dietary Guidelines for Americans in the Iowa Women’s Health Study (Harnack, Lisa et al., 2002 , BRE19762). In the BCDDP study, the Recommended Foods Score (RFS), a measure of overall diet quality was inversely but not related to breast cancer incidence (RR = 0.75; P < 0.06) (Mai, V. et al., 2005 , BRE23275). Update Only one cohort study had been identified, the Nurses’ Health Study, USA (3580 postmenopausal cancer cases) (Fung, T. T. et al., 2006 , BRE80107). Postmenopause The Nurses’ Health Study, USA (3580 postmenopausal cancer cases) investigated the relationship of the following diet indexes: Healthy Eating Index (HEI), Alternative Healthy Eating Index (AHEI), Diet Quality Index-Revised (DQI-R), Recommended Food Score (RFS) and Alternate Mediterranean Diet Score (A-MDS), in relation to postmenopausal breast cancer. No significant association was observed with any of the indexes. In stratified analysis, none of the indexes was significantly related to risk of ER+ postmenopausal breast cancer. However, several significant results emerged in the analyses for ER- postmenopausal breast cancer. The RRs associated to the highest vs. the lowest quintile of the score are presented in Table 1.4.

26
Table 1.4 Relative risks (95% Confidence Intervals) of ER+ and ER- postmenopausal breast cancer for the highest vs. the lowest quintile of dietary index score in the Nurses’ Health Study (Fung, T. T. et al., 2006 , BRE80107). RR (95% CI, Q5 vs. Q1)
Index ER+ (n=2367 cases) ER- (n=575 cases)
HEI 1.1 (0.95 - 1.28) 0.92 (0.68 - 1.24)
AHEI 1.05 (0.91 - 1.21) 0.78 (0.59 - 1.04), p=0.01
DQI-R 1.09 (0.94 - 1.27) 0.97 (0.72 - 1.31)
RFS 1.06 (0.92 - 1.23) 0.69 (0.51 - 0.94) p=0.003
A-MDS 1.05 (0.91 - 1.18) 0.79 (0.6 - 1.03) p=0.03
The inverse association of ER- breast cancer with higher scores of the Alternative Healthy Eating Index was explained by the vegetable component (RR Q5 vs Q1 =0.68; 95% CI = 0.51-0.91) and the polyunsaturated:saturated fat ratio component (RR Q5 vs Q1=0.75; 95% CI = 0.58-0.98) of the Alternative Healthy Eating Index. The inverse association of ER- breast cancer with the Alternate Mediterranean Diet Score was explained by the component of the ratio monounsaturated: saturated fat (RR Q5 vs. Q1 = 0.79; 95% CI = 0.63-0.99). No association was observed with the nuts and soy component, the cereal fibre component, the white: red meat ratio component, the trans-fat component, the multivitamin use component and the alcohol components of the A-MDS. The inverse association of ER- breast cancer with the Recommended Food Score was explained by the vegetable component. The RR of yellow/orange vegetable was 0.76 (95% CI = 0.57-0.99; Ptrend=0.04) with ER-breast cancer for 1+/day vs. <2/week intake. The RR of other vegetable (eggplant, green peppers, celery) was 0.67 (95% CI = 0.53-0.87; Ptrend=0.03) and the RR of leafy vegetable was 0.71 (95% CI = 0.55-0.90; Ptrend=0.13) with ER-breast cancer for the same comsumption comparison. 1.6 Lactation 1.6.1 Breastfeeding, Mother Global Report, 2007 A case-control study nested in the Icelandic cohort showed that breastfeeding significantly lowered breast cancer risk in parous women (Tryggvadottir, L. et al., 2002 , BRE12507;Tryggvadottir, L. et al., 2001 , BRE12506). This was particularly evident for early breast cancers (<40 yrs). No significant protective association was shown with postmenopausal breast cancer. Update Two studies were identified in the Continuous Update. The retrospective international cohort study in BRCA carriers from United Kingdom, France, Netherlands and Canada reported no significant association between breastfeeding (ever vs. never) and breast cancer risk (797

27
breast cancer cases) (Andrieu, N. et al., 2006 , BRE80136). Subgroup analyses showed a relative risk estimate of 0.70 (95% CI = 0.44-1.39, 215 cases) in BRCAII carriers and 1.07 (95% CI = 0.81-1.4, 582 cases) in BRCAI carriers respectively when comparing ever vs. never breastfeeding. The Japan Public Health Center-based prospective study (JPHC) reported a non-significant moderate inverse association between breastfeeding and breast cancer among premenopausal women (RR breastfeeding yes vs. no = 0.80, 95% CI = 0.55-1.17) (176 cases) (Iwasaki, M. et al., 2007 , BRE20027). For postmenopausal women, a small non-significant protective effect was observed (RR breastfeeding yes vs. no = 0.94, 95% CI = 0.60-1.47) (193cases). Published meta-analysis The relationship of breastfeeding and breast cancer by hormone receptor status was investigated in a meta-analysis that included five population-based case-control studies. The RR > 6 months vs. never was 0.78 (95% CI = 0.64-0.94) in ER+/PR+ and 0.74 (95% CI = 0.61-0.89) in ER-/PR- (Ma, H. et al., 2006). 1.6.1 Total duration of breastfeeding Global Report, 2007 The meta-analysis performed on four prospective studies (Goodman, M. T. et al., 1997 , BRE03352;Kvale, G. H. 1988 , BRE17728;Li, W. et al., 2005 , BRE23123;Michels, K. B. W. 1996 , BRE17829) showed a borderline significant negative association with breast cancer (RR = 0.98, 95% CI = 0.97-1.00) for a total increase of 5 months of breastfeeding during life. The Nurses’ Health Study has two reports (London, S. J. et al., 1990 , BRE15914;Michels, K. B. W. 1996 , BRE17829). The most recent report was included in the SLR meta-analysis. In a cohort of premenopausal parous Korean women (360 incident cases of breast cancer), a period of lactation of 13-24 months compared to no history of lactation was related to a non-significant decreased risk of breast cancer (RR = 0.7, 95% CI = 0.5-1.1). The association was slightly stronger for breastfeeding of more than 24 months (RR = 0.6, 95% CI = 0.3-1.0) (Lee, S. Y. K. 2003 , BRE17745). Update Three studies were identified during the update. One of them involved women who carried a mutation in BRCA1 or BRCA2 (Andrieu, N. et al., 2006 , BRE80136). The International BRCA1/2 Carrier Cohort Study (IBCCS), a historical cohort study including 1601 pre- and postmenopausal breast cancer cases from United Kingdom, France, Netherlands and Canada in BRCAI and II carriers reported no association (RR>24 months vs nil =1.08 ; 95% CI = 0.62-1.89) (Andrieu, N. et al., 2006 , BRE80136). While the CLUE II study reported an OR for > 6 versus 0 months breast feeding of 0.79 (95% CI = 0.45-1.41) (67 cases, excluding 33 cases with missing data) (Visvanathan, K. et al., 2007 , BRE80020). A non-significant relationship between duration of breastfeeding and breast cancer risk was reported in a nested case-control study including 237 postmenopausal breast cancer cases from the Malmo, Cancer and Diet study (RR >7 months vs nill= 0.72; 95% CI = 0.5-1.05) (Wirfalt, E. et al., 2005 , BRE11111).

28
2. Foods 2.1.1 Cereals Cold cereals (breakfast) Global Report, 2007 No significant association between breast cancer and adolescent consumption of cold cereals (breakfast) was observed in a nested case-control study on premenopausal women (Frazier, A. L. et al., 2003 , BRE02941). An Australian cohort on postmenopausal women reported no association between breast cancer and intake of breakfast cereals (Giles, G. G. et al., 2006 , BRE22430). Update A report of the PLCO Cancer Screening Trial cohort study (Stolzenberg-Solomon, R. Z. et al., 2006 , BRE80113) did not find a significant association of breast cancer risk with intake of cereals fortified with 25% Recommended Dietary Allowance (RDA) (RR >0.95 vs. <0.01 g/day = 1.15; 95% CI = 0.64-2.07) or 100% RDA (RR>0.65g/day vs. no consumption= 1.69; 95% CI = 1.69; 95% CI 0.92-3.1) in women who never took multivitamins. 2.2. Fruit and (non-starchy) vegetables Global Report, 2007 Menopause age unspecified One nested case-control study from China (Shannon, J. et al., 2003 , BRE18714) reported an RR of 0.46 (95% CI = 0.28-0.75) for highest versus lowest intake of fruit and vegetables (unspecified). Premenopause One report from the Nurses' Health Study (Zhang, S. et al., 1999 , BRE13953) was identified. Women who consumed five or more servings per day of fruits and vegetables had modestly lower risk of breast cancer than those who had less than two servings per day (RR = 0.77, 95% CI = 0.58-1.02); this association was stronger among women with a positive family history of breast cancer (RR = 0.29, 95% CI = 0.13-0.62) or those who consumed 15g or more of alcohol per day (RR = 0.53, 95% CI = 0.27-1.04). Postmenopause No association was observed in the Diet, Cancer and Health Study, Denmark (Olsen, A. T. 2003 , BRE17890). (IRR= 1.02, 95% CI = 0.98-1.06) per 100 g/d increment of total intake of fruits, vegetables and juice). Olsen 2003 reported for ER+ breast cancer, a borderline significant increase, IRR: 1.05 (95% CI = 1.00-1.10), whereas a preventive effect was seen for ER- breast cancers, IRR= 0.90 (95% CI = 0.81-0.99). A prospective study in the Malmo Diet and Cancer cohort (Mattisson, I. et al., 2004 , BRE16042) and the Nurses' Health Study did not find any association (Zhang, S. et al., 1999 , BRE13953).

29
Update Two cohort studies (previous reports of the same studies were included in the SLR) published updated results on intake of fruits and vegetables and breast cancer risk. Postmenopause The intake of fruit and vegetables was not related to postmenopausal breast cancer in the update of the Diet, Cancer and Health Study, Denmark (377 cases) (Ravn-Haren, G. et al., 2006 , BRE80151). In the update of the Malmo Diet and Cancer Study, Sweden (Sonestedt, E. et al., 2007 , BRE80147) (428 cases), the intake of fruits, berries and vegetables was not significantly related to postmenopausal breast cancer (RR 626 vs 190g/d=0.78; 95% CI = 0.57-1.05). However, a significant inverse association was observed in women with BMI<27 kg/m2 (RR 626 vs 190g/d=0.66; 95% CI = 0.46-0.97) and in women who did not modify dietary habits before recruitment (RR 626 vs 190g/d=0.59; 95% CI = 0.40-0.87). 2.2.1 Non-starchy vegetables Global Report, 2007 Menopause age unspecified In the EPIC study (3 659 cases), the intake of total vegetables was not related to breast cancer (RR = 0.98, 95% CI = 0.84-1.14) (Van Gils, C. H. et al., 2005 , BRE80167). This paper by van Gils CH et al., 2005 was not included in the previous SLR and Global Report. It was not on the SLR database. Postmenopause A prospective study on postmenopausal breast cancer (Olsen, A. T. 2003 , BRE17890) did not find any significant association (RR = 0.98, 95% CI = 0.89-1.09) with consumption of non-starchy vegetables. The analysis by ER status in this cohort did not show any significant associations. The RR for ER+ was 1.01 (95% CI = 0.9-1.13) and for ER- was 0.92 (95% CI = 0.73-1.16) for highest versus lowest intake. Vegetables- unspecified Menopause age unspecified Two studies were included in the meta-analysis. The summary estimate was 0.95 (95% CI = 0.88-1.03) per 100g/d (I² = 90%). (Li, W. et al., 2005 , BRE23123;Rohan, T. E. H. 1993 , BRE17965) . Premenopause In the Nurses’ Health Study, intake of vegetables was inversely related to premenopausal breast cancer after 14 years of follow-up (Zhang, S. et al., 1999 , BRE13953). No association with vegetables was observed in the Pooling project of cohort studies (RR = 0.99, 95% CI = 0.93-1.06) per 100g/d) (Smith-Warner et al. 2001)

30
Postmenopause In the Nurses’ Health Study (Zhang, S. et al., 1999 , BRE13953) and the Netherlands’ cohort study (Verhoeven, D. T. et al., 1997 , BRE12868) postmenopausal breast cancer was not associated with the intake of vegetables. In the Pooling Project of Cohort Studies, no association was observed. The overall estimate was 1.00 (95% CI = 0.97-1.02) per 100g/d (Smith-Warner et al. 2001) Update Postmenopause The only report identified identified was the update of the association of postmenopausal breast cancer and vegetable intake in the Nurses' Health Study, USA (Fung, T. T. et al., 2006 , BRE80107) (575 cancer cases). In this analysis the risk of postmenopausal breast cancer was significantly inversely related to the score of vegetable intake of the RFS index (reviewed in “1.4 Dietary guideline index score”)(RR 7 or more times/week vs. less than 2 times/week= 0.67; 95% CI = 0.53-0.87). ER+ breast cancer was not related to any of the diet quality scores investigated in this study. All diet quality scores included fruits and vegetables, but they contributed only 10–20% of the total score except for the RFS to which they contribute 80% of the total score (See also 1.4c Dietary guideline index score, p.25). Green leafy vegetables (excluding cruciferous vegetables) Global Report, 2007 No significant association with adolescent consumption of spinach was observed in a case control study nested in the Nurse’ Health Study (Frazier, A. L. et al., 2003 , BRE02941). In a Chinese nested case-control study the intake of lettuce was inversely but non-significantly related to breast cancer (Li, W. et al., 2005 , BRE23123).The intake of salad vegetables was not related to breast cancer in a prospective cohort on vegetarians (Key, T. J. A. et al., 1996 , BRE15654). The EPIC study (Van Gils, C. H. et al., 2005 , BRE80167) (609 cases) showed no evidence of association between leafy vegetables intake (excluding cabbages) and the risk of breast cancer. The EPIC paper by van Gils CH et al., 2005 was not included or cited in the previous SLR and Global Report. Update Postmenopause In the updated analysis in the Nurses' Health Study, USA (Fung, T. T. et al., 2006 , BRE80107) (575 cancer cases) the risk of postmenopausal breast cancer was significantly inversely related to the intake of leafy vegetables (RR >7 vs <2 times/week= 0.71; 95% CI = 0.55- 0.90).

31
Cruciferous vegetables Global Report, 2007 Menopause age unspecified In a Chinese nested case-control study the intake of cruciferous vegetables was not associated with breast cancer (Li, W. et al., 2005 , BRE23123). Breast cancer in adulthood was not related with the intake of cabbage or broccoli during adolescence in a case-control study nested in the Nurse’s Health Study (Frazier, A. L. et al., 2003 , BRE02941). The EPIC study (Van Gils, C. H. et al., 2005 , BRE80167) reported no evidence of association between cabbage intake and the risk of breast cancer (RR Quintle 5 vs. quintile 1 = 1.18, 95% CI = 1.01-1.38, Ptrend = 0.11). The EPIC paper by van Gils CH et al., 2005 was not included or cited in the previous SLR and Global Report. Premenopause In the Nurses’ Health Study the RR of breast cancer in premenopausal women was 0.83 (95% CI = 0.52-1.32) for 1.00 vs 0.24 servings per day of cruciferous vegetables (Zhang, S. et al., 1999 , BRE13953). Postmenopause In the Nurses’ Health Study the RR of breast cancer in postmenopausal women was 0.98 (95% CI = 0.77-1.25) for 1.00 vs 0.24 servings per day of cruciferous vegetables (Zhang, S. et al., 1999 , BRE13953). Update Postmenopause In the update of the Nurses' Health Study, USA (Fung, T. T. et al., 2006 , BRE80107), postmenopausal breast cancer risk was inversely but not significantly related to the intake of cruciferous vegetables (RR >5 vs <2 times/week= 0.88, 95% CI = 0.68- 1.15). 2.2.2.1.1 Grapefruit The two studies identified in the update are the first studies investigating grapefruit intake and breast cancer risk. Update Postmenopause Grapefruit intake was associated with a significant increased risk of postmenopausal breast cancer in the Multi-ethnic Cohort Study, USA (Monroe, K. R. et al., 2007 , BRE80126) (1657 cases; RR>60 g/day vs never= 1.3; 95% CI = 1.06-1.58). The association between grapefruit intake and breast cancer risk was clearly seen in never hormone therapy users, as well as current

32
estrogen treatment users. The risk of breast cancer associated with consumption of grapefruit was 32% higher among lean/normal weight women and 26% higher among overweight/obese women. There was also a positive cross-sectional relationship between grapefruit intake and serum oestrogen levels. These results were not replicated in the Nurses’Health Study (Kim, E. H. et al., 2008 , BRE80156) (3570 cases; RR >1/4 portion/day vs. none= 0.97; 95% CI = 0.83-1.14). Moreover, a protective effect was observed in women with ER-PR- tumours who had never used hormone replacement therapy (RR >1/4 portion/day vs. none= 0.60; 95% CI = 0.37- 0.98) in this study. There was no cross-sectional relationship between consumption of grapefruit and grapefruit juice and plasma levels of oestrogens among these 701 postmenopausal women not using hormone replacement. It is not clear if the discordant results might be explained by differences in serum oestrogens levels and BMI (higher prevalence of overweight women in the Nurses’ Health Study compared to the women in the MEC) amongst populations of the two cohort studies. Possible mechanism In vitro and in vivo studies have shown that cytochrome P450 3A4 (CYP3A4) is involved in the metabolism of oestrogens. There is evidence that grapefruit, an inhibitor of CYP3A4, increases plasma oestrogen concentrations. Since it is well established that oestrogen is associated with breast cancer risk, it is plausible that regular intake of grapefruit would increase a woman’s risk of breast cancer. 2.3.1 Soy products Global Report, 2007 Only two cohort studies had reported data on soy products (the Japanese study included soybeans, tofu, deep-fried tofu and natto; the Chinese study included soybean milk, fried bean curd puff, fresh bean curd, soybeans and other soybean foods) (Li, W. et al., 2005 , BRE23123;Yamamoto, S. et al., 2003 , BRE17122). Menopause age unspecified A Japanese cohort study (Yamamoto, S. et al., 2003 , BRE17122) and a Chinese nested case-control study (Li, W. et al., 2005 , BRE23123) did not show evidence of association of intake of soy products with breast cancer. The overall relative risk estimate in both studies was 1.00 (95% CI = 0.94-1.06) per 1 time/week increase. Update Only the Japan Collaborative Cohort study was identified during the update (Nishio, K. et al., 2007 , BRE80129). Menopause age unspecified In the Japan Collaborative Cohort Study (JACC) (Nishio, K. et al., 2007 , BRE80129) no significant association was observed between soy products and breast cancer risk (RR highest

33
intake vs other= 1.42, 95% CI = 0.84-2.4) (145 breast cancer cases). Results for premenopausal women were not reported separately. Postmenopause In the same cohort (Nishio, K. et al., 2007 , BRE80129) an inverse but not significant association was observed in postmenopausal women (RR highest intake vs other = 0.88, 95% CI = 0.41-1.89) (92 cases). 2.3.1.1 Miso, soya paste soup Global Report, 2007 Two cohorts (Key, T. J. et al., 1999 , BRE04758;Yamamoto, S. et al., 2003 , BRE17122) were identified. Results from the Japan Nurses’ Health Study were also reviewed in the Global Report, but this study analysed baseline miso soup intake and history of breast cancer in postmenopausal women cross-sectionally only (Fujimaki, S. and Hayashi, K. 2003 , BRE03015). Also the Shanghai study reviewed here were misclassified, the exposure should be fermentated beancurd instead of miso soup (Li, W. et al., 2005 , BRE23123). Menopause age unspecified The Japan Public Health Centre-Based Prospective Study on Cancer and Cardiovascular Diseases Cohort (JPHC) (Yamamoto, S. et al., 2003 , BRE17122) and the Japanese cohort in Hiroshima and Nagasaki (Key, T. J. et al., 1999 , BRE04758) were included in a dose-response meta-analysis of miso soup. The meta-analysis with an increment of 0.5 serving/week showed a borderline significant protection (summary RR 0.98, 95% CI = 0.96-1.00). Note: The suggestive 20% reduction in risk observed in a Chinese cohort study from Shanghai reported in the Global Report was on fermentated beancurd, not miso soup(Li, W. et al., 2005 , BRE23123). This study was not included in the dose-response meta-analysis. Postmenopause A significant inverse association of intake of miso soup 6 days/week vs. 1.9 days/week and breast cancer in postmenopausal women was observed in a Japan Nurses’ Health Study from a cross-sectional analysis (Fujimaki, S. and Hayashi, K. 2003 , BRE03015). Update Only the JACC study had reported data on miso soup during the update (Nishio, K. et al., 2007 , BRE80129). For miso soup, the JACC study (Nishio, K. et al., 2007 , BRE80129) reported similar results. No significant associations were found for postmenopausal women at baseline (RR >=2 vs. <1
cup/day = 0.92, 95% CI = 0.52-1.62) (92 cases) and the overall group (pre and post menopausal women; 145 cases) (RR >=2 vs. <1 cup/day = 0.80, 95% CI = 0.46-1.39).

34
2.3.2.2 Tofu Global Report, 2007 Overall, two studies (Fujimaki, S. and Hayashi, K. 2003 , BRE03015;Key, T. J. et al., 1999 , BRE04758) were identified with one on postmenopausal women only (Fujimaki, S. and Hayashi, K. 2003 , BRE03015). Menopause age unspecified No association was observed in the Japanese cohort in Hiroshima and Nagasaki (Key, T. J. et al., 1999 , BRE04758). Postmenopause A Japanese cohort study (Fujimaki, S. and Hayashi, K. 2003 , BRE03015) of registered nurses found a significant increased risk of postmenopausal breast cancer risk with an increasing tofu intake. Update Only the JACC study had reported data (Nishio, K. et al., 2007 , BRE80129). Menopause age unspecified The JACC (Nishio, K. et al., 2007 , BRE80129) found tofu intake was not significantly associated with the risk of breast cancer (RR almost daily vs. <3times/week = 1.14, 95% CI = 0.74-1.77) (145 cases). Postmenopause When the analysis was limited to only postmenpausal women (92 cases) at baseline, no significant association was found (Nishio, K. et al., 2007 , BRE80129). Published meta-analysis Two meta-analyses on soy products were recently published (Qin, L.Q. et al., 2006; Trock, B.J. et al., 2006.). In the meta-analysis of six case-control and three cohort studies of Qin et al., the overall estimate for soy products was 0.75 (95% CI = 0.59-0.95). One of the cohort studies was reviewed in the SLR (Key, T. J. et al., 1999 , BRE04758) while the other two cohort studies were either not reviewed in the SLR under the soy products section: a study on the Nurses’ Health Study II reporting data on beans and lentils (Adebamowo, C. A. et al., 2005 , BRE21537), or not reviewed: an American study (Greenstein, J. et al., 1996) that reported a relative risk of 0.76 (95% CI = 0.51-1.18) for highest vs lowest intake of soy or tofu. In the same meta-analysis (Qin, L.Q. et al., 2006), the results for miso soup are consistent with the results of the SLR (RR highest vs. lowest=0.88, 95% CI = 0.78-1.00). This analysis included three case-control and three cohort studies. Two of the cohorts were reviewed in the

35
SLR: (Yamamoto, S. et al., 2003 , BRE17122), but the remaining cohort published by Hirayama in 1990 was not reviewed in the SLR (RR daily vs. non-daily was 0.85 (95% CI = 0.68-1.06) reported in Hirayama T: Life style and mortality: A large scale census-based cohort study in Japan. In: Contributions to Epidemiology and Statistics (Wahrendorf J, Ed) Vol 6 Karger, Basel, Switzerland, 1990. One of the studies included in the SLR as miso soup was not included in this meta-analysis (Li, W. et al., 2005 , BRE23123). The exposure should be fermented beancurd instead of miso soup as included in the SLR. Finally, in this meta-analysis the overall relative risk estimate for tofu was 0.78 (95% CI = 0.70- 0.88). Only two out of nine studies were cohort studies . The second meta-analysis was published in the Journal of the National Cancer Institute by Trock B.J. et al., 2006 using data from 12 case-control and six cohort studies. The exposure variable was the intake of soy protein estimated from the intake of soy food and dietary isoflavones. Trock et al. reported an OR highest vs. lowest of 0.86 (95% CI = 0.75-0.99). Cohort or nested case-control studies exhibited somewhat larger pooled odds ratios (OR = 0.93) than retrospective case-control studies (OR = 0.83), but the difference was not statistically significant. One meta-analysis on estimated intake of isoflavones (Wu, A. H. et al., 2008) reported an overall relative risk of 0.88 (95% CI = 0.78-0.98) combining case-control and cohort studies. The subgroup analysis showed a non-significant association (RR highest vs lowest consumption of
isoflavones =1.08, 95% CI = 0.95-1.24) in cohort/nested case-control studies from Western populations. In the analysis restricted to Asian populations (seven case-control and one cohort studies), the overall RR was 0.71 (95% CI = 0.60-0.85). These meta-analyses are limited by the difficulty in the standardisation of measure of soy intake. The quantity and type of soy consumed varied greatly across the studies, such that the contrasts in intake levels for the reported risk estimates differed widely. Additional variability is introduced by issues such as fermented versus nonfermented soy foods, total soy versus soy protein, or soy versus urinary isoflavone estimates. Although results of these meta-analyses suggest that soy intake is associated with a modest reduction in breast cancer risk, heterogeneity across studies limits the ability to interpret the findings. 2.5.1 Meat (Unspecified) Global Report, 2007 Menopause age unspecified Six cohort studies on meat intake and cancer incidence and two on cancer mortality were identified. Three studies were included in a SLR meta-analysis (Key, T. J. et al., 1999 , BRE04758;van der Hel, O. L. et al., 2004 , BRE12728). The summary estimate (per increase of 1 time/week) was 1.02 (95% CI = 0.99-1.06). Two other studies not included in the meta-analysis showed an increased risk (Gaard, M. T. 1995 , BRE17516;Taylor, E. F. et al., 2007 , BRE80008;Toniolo, P. et al., 1994 , BRE12398) and the third showed non-significant inverse association (RR = 0.89, 95% CI = 0.79-1.00). (Holmes, M. D. et al., 2003 , BRE15400).

36
In the case-cohort analysis in the MPCDRF study from the Netherlands (van der Hel, O. L. et al., 2004 , BRE12728), neither presence of NAT1 or NAT2 rapid genotype, or GSTT1 null genotype, alone or in combination with meat consumption affected breast cancer risk. Two studies investigated cancer mortality (Kinlen, L. J. 1982 , BRE17702;Mills, P. K. A. 1988 , BRE17836). Premenopause No association in the Nurses’ Health Study (Holmes, M. D. et al., 2003 , BRE15400) Postmenopause No association in the Nurses’ Health Study (Holmes, M. D. et al., 2003 , BRE15400) No meta-analysis was done in both pre- and postmenopausal breast cancer in the Global Report. Update Two studies were identified during the update period – the UK Women’s Cohort Study (UKWCS) (Taylor, E. F. et al., 2007 , BRE80008) and the Diet, Cancer and Health Study from Denmark (Egeberg, R. et al., 2008 , BRE80153). Menopause age unspecified One study reporting an increased risk (RR more than 103 g/day vs none = 1.34 (1.05-1.71)) (UKWCS) (Taylor, E. F. et al., 2007 , BRE80008) was identified during the update period. A total of six studies on breast cancer with unspecified menopausal status were included in the highest versus lowest forest plot (Fig. TM1). Two other studies from the SLR also reported an increased risk, the New York Women’s Health Study (Toniolo, P. et al., 1994 , BRE12398) and a Norwegian study (Toniolo, P. et al., 1994 , BRE12398). No significant association was observed in the remaining three studies, one from the Netherlands (van der Hel, O. L. et al., 2004 , BRE12728); the Nurses’ Health Study (Holmes, M. D. et al., 2003 , BRE15400),and the LSS (Key, T. J. et al., 1999 , BRE04758). Premenopause The UKWCS reported no significant association (Taylor, E. F. et al., 2007 , BRE80008). The RR for more than 103 g/day vs none was 1.20 (95% CI = 0.86-1.68). This result together with that of the Nurses’ Health Study (Holmes, M. D. et al., 2003 , BRE15400) are presented in the highest versus lowest plot (Fig. TM1, premenopausal). No significant association was observed in any of the two studies. Postmenopause Two studies were identified. In the UK Women’s Cohort Study (Taylor, E. F. et al., 2007 , BRE80008) (395 cases) intake of red meat, offals, poultry and processed meat was related to increased risk of breast cancer (RR=1.1; 95% CI = 1.01-1.2 for an increase of 50 g of meat

37
intake). The RR associated to intake of meat excluding processed meat was 1.09 (95% CI = 0.99-1.2 for an increase of 50 g/day). These results are consistent with the findings of the Diet, Cancer and Health Study, Denmark (Egeberg, R. et al., 2008 , BRE80153) (378 postmenopausal cases) that reported a relative risk of 1.09 (95% CI = 1.02-1.17 for 25 g increase of intake of red meat, poultry, fish and processed meat. The increased risk in the Danish study was observed in NAT2 intermediate and fast acetylator genotypes (RR per 25 g 1.20; 95% CI = 1.05-1.37) but not in NAT2 slow acetylator genotypes (RR 1.01; 95% CI = 0.93-1.10) (Pinteractions = 0.03). No statistical significance association with meat intake was observed in subgroup analysis according to NAT1 genotype (Pinteractions = 0.63). These results are presented in a forest plot with the results of a previously published study (the Nurses’ Health Study (Holmes, M. D. et al., 2003 , BRE15400)) that reported a non-significant decreased risk (RR = 0.88, 95% CI = 0.76-1.01) (Fig. TM1, postmenopausal).

38
i. Fig. TM1 Highest versus lowest forest plot on meat (unspecified) and breast cancer, by menopausal status (** = new studies identified during the update)
.
.
.
Menopausal age unspecified ** Taylor et al. (2007) van der Hel, O. L. (2004) Holmes, M.D. (2003) Key, T. J. (1999) Gaard, (1995) Toniolo, P. (1994)
Premenopausall ** Taylor et al. (2007) Holmes, M.D. (2003)
Postmenopausall ** Egeberg, R. et al. (2008) ** Taylor et al. (2007) Holmes, M.D. (2003)
ID Study
1.34 (1.05, 1.71) 0.93 (0.59, 1.47) 0.89 (0.79, 1.00) 1.12 (0.85, 1.48) 2.28 (1.29, 4.03) 1.87 (1.09, 3.21)
1.20 (0.86, 1.68) 0.90 (0.69, 1.18)
2.24 (1.43, 3.50) 1.63 (1.13, 2.35) 0.88 (0.76, 1.01)
Low RR (95% CI)
High vs.
BRE80008 BRE12728 BRE15400 BRE04758 BRE17516 BRE12398
BRE80008 BRE15400
BRE80153 BRE80008 BRE15400
WCRF_Code
UK Women's Cohort Study MPCDRF Nurses' Health Study LSS, 1969 Norway National Health Screening Service New York Women's Health Study
UK Women's Cohort Study Nurses' Health Study
Diet, Cancer and Health UK Women's Cohort Study Nurses' Health Study
StudyDescription
> 103.1 vs. 0 > 100.0 vs. < 74.0 > 2.0 vs. < 1.11 > 5.0 vs. < 1.0 > 6.0 vs. < 2.0 >=79.0 vs. <=4.0
> 103.0 vs. 0 > 2.0 vs. < 1.11
> 180.0 vs. < 114.0 > 103.0 vs. 0 > 2.0 vs. < 1.11
contrast
g/day g/day serving/day times/week Unit/week g/day
g/day serving/day
g/day g/day serving/day
units
1.34 (1.05, 1.71) 0.93 (0.59, 1.47) 0.89 (0.79, 1.00) 1.12 (0.85, 1.48) 2.28 (1.29, 4.03) 1.87 (1.09, 3.21)
1.20 (0.86, 1.68) 0.90 (0.69, 1.18)
2.24 (1.43, 3.50) 1.63 (1.13, 2.35) 0.88 (0.76, 1.01)
Low RR (95% CI)
High vs.
BRE80008 BRE12728 BRE15400 BRE04758 BRE17516 BRE12398
BRE80008 BRE15400
BRE80153 BRE80008 BRE15400
WCRF_Code
1 .248 1 4.0
3

39
2.5.1.2 Processed meat Global Report, 2007 A pooled estimate of two studies (Gertig, D. M. et al., 1999 , BRE03215;van der Hel, O. L. et al., 2004 , BRE12728) showed a non-significant increased risk of invasive breast cancer with an increase of processed meat consumption of 20 g/day. Overall, five reports that were published by three cohort studies were retrieved from the SLR database. The Nurses’ Health Study had published three reports (Fung, T. T. et al., 2005 , BRE22370;Gertig, D. M. et al., 1999 , BRE03215;Holmes, M. D. et al., 2003 , BRE15400). The Netherlands Cohort Study on Diet and Cancer (Voorrips, L. E. et al., 2002 , BRE13011) and the Monitoring Project on Cardiovascular Disease Risk Factors, also from the Netherlands (van der Hel, O. L. et al., 2004 , BRE12728), had each published one report. The Netherland cohort study (Voorrips, L. E. et al., 2002 , BRE13011) not included in the meta-analysis found no evidence of association between breast cancer risk and intake of processed meat. Update Data from three new reports – the Nurses’ Health Study II on premenopausal women (Cho, E. et al., 2006 , BRE80034), the Diet, Cancer and Health study on postmenopausal women (Egeberg, R. et al., 2008 , BRE80153) and the UK Women’s Cohort Study (UKWCS) (Taylor, E. F. et al., 2007 , BRE80008) on breast cancer were identified during the update period. Menopause age unspecified Only the UK Women’s Cohort Study had reported data during the update period (Taylor, E. F. et al., 2007 , BRE80008). A significant increased risk was reported (678 cases) (RR for >=20 vs. 0g/day was 1.39 (95%CI = 1.09-1.78). Three other studies had presented results previously (Holmes, M. D. et al., 2003 , BRE15400;van der Hel, O. L. et al., 2004 , BRE12728;Voorrips, L. E. et al., 2002 , BRE13011), but the results were inconsistent and only this result from the UKWCS was statistically significant (95% CI = 1.09-1.78). The results are presented in the Figure PM1. Only one report was included from the Nurses’ Health Study. The publication by Holmes et al. (Holmes, M. D. et al., 2003 , BRE15400) was selected instead of Gertig et al. (Gertig, D. M. et al., 1999 , BRE03215) as in the Global Report because there were more cases with unspecified menopause age (4107 cases vs. 455 cases) ascertained after 18 years of follow-up. The publication by Gertig et al. was a case-control study nested within the Nurses’ Health Study cohort of 8 years follow up. The change in report selection for the Nurses’ Health Study (Holmes et al., 2003 vs. Gertig et al.. 1999) had resulted to a lower risk estimate from 1.3 (95% CI = 1-1.8) to 0.94 (95% CI = 0.85-1.05) for the highest versus lowest comparison (Gertig, D. M. et al., 1999 , BRE03215;Holmes, M. D. et al., 2003 , BRE15400) compared to the SLR.

40
Premenopause A positive association that did not reach statistical significance was observed for premenopausal breast cancers in the UK Women’s Cohort Study (Taylor, E. F. et al., 2007 , BRE80008) (283 cases) (RR for >=20 vs. 0g/day=1.20; 95% CI = 0.85-1.70). Similarly, non-significant positive association was observed in the Nurses’ Health Study II (RR for ≥13 vs. ≤0.9serving/month = 1.28, 95% CI = 0.87-1.88) (Cho, E. et al., 2006 , BRE80034). In the Nurses’ Health Study II, a significant increased risk of premenopausal breast cancer with processed meat consumption was observed in women with ER+PR+ breast tumours (RR >12.9 vs <1
servings/month= 2.34; 95% CI = 1.47-3.71) but not in women with ER-PR- tumours (RR >12.9 vs <1
servings/month= 0.79; 95% CI = 0.24-2.61). An inverse association was observed with higher intakes of bacon (RR>4.3 servings/month vs <1 serving/month=0.23; 95% CI = 0.06-0.93) in premenopausal women with ER-PR- tumours. This is likely a chance result due to multiple testing. The results of the updated studies are shown in the highest versus lowest plot (Fig. PM1) together with the report from the Nurses’ Health Study (Holmes, M. D. et al., 2003 , BRE15400) retrieved in the SLR (RR highest vs lowest=0.86, 95%CI = 0.67-1.10) (Figure PM1). Postmenopause Two studies were retrieved during the update. In the UK Women’s Cohort Study (Taylor, E. F. et al., 2007 , BRE80008) (395 cases) intake of processed meat was related to increased risk of breast cancer (RR for >=20 vs. 0g/day=1.64; 95% CI = 1.14-2.36 ). These results are consistent with those of the Diet, cancer and Health Study, Denmark (378 postmenopausal cases) (Egeberg, R. et al., 2008 , BRE80153) that found a relative risk of 1.59 (95% CI = 1.02-2.47 for the comparison of >=45 vs. <=20g/day). Statistical significance was lost in subgroup analyses by NAT1 and NAT2 genotypes. The association of postmenopausal breast cancer with processed meat was positive but not significant in the groups with NAT1 fast and intermediate, NAT1 slow, NAT2 fast and intermediate, and NAT2 slow genotypes. The results, together with a report from the Nurses’ Health Study (Holmes, M. D. et al., 2003 , BRE15400) retrieved during the SLR are presented in highest versus lowest forest plots in Fig. PM1.

41
ii. Fig. PM1 Highest versus lowest forest plot on processed meat and breast cancer, by menopausal status (** = new studies identified during the update)
.
.
.
Post-menopausal ** Egeberg, R. et al. (2008) ** Taylor et al. (2007) Holmes, M.D. (2003)
Pre-menopausal ** Taylor et al. (2007) ** Cho et al. (2006) Holmes, M.D. (2003)
Menopause age unspecified ** Taylor et al. (2007) van der Hel, O. L. (2004) Holmes, M.D. (2003) Voorrips, L. E. (2002)
ID Study
1.59 (1.02, 2.47) 1.64 (1.14, 2.36) 1.00 (0.88, 1.13)
1.20 (0.85, 1.70) 1.28 (0.87, 1.88) 0.86 (0.67, 1.10)
1.39 (1.09, 1.78) 1.05 (0.67, 1.64) 0.94 (0.85, 1.04) 0.93 (0.67, 1.29)
Low RR (95% CI)
High vs.
BRE80153 BRE80008 BRE15400
BRE80008 BRE80034 BRE15400
BRE80008 BRE12728 BRE15400 BRE13011
wcrf_code
Diet, Cancer and Health, 1993 UK Women's Cohort Study (UKWCS), 1993 Nurses' Health Study (NHS) Cohort 1976-1996
UK Women's Cohort Study (UKWCS), 1993 NHS II, 1989 Nurses' Health Study (NHS) Cohort 1976-1996
UK Women's Cohort Study (UKWCS), 1993 MPCDRF Nurses' Health Study (NHS) Cohort 1976-1996 The Netherlands Cohort Study on diet and cancer, 1986-1993
studydescription
>45 vs<20g/day >=20 vs 0g/day >=0.46 vs<=0.1serving/day
>=20 vs 0g/day >=13 vs <=0.9servings/month >=0.46 vs <=0.1serving/day
>=20 vs 0g/day >=35 vs <20g/day >=0.46 vs <=0.1serving/day >=13 vs 0g/day
contrast
1.59 (1.02, 2.47) 1.64 (1.14, 2.36) 1.00 (0.88, 1.13)
1.20 (0.85, 1.70) 1.28 (0.87, 1.88) 0.86 (0.67, 1.10)
1.39 (1.09, 1.78) 1.05 (0.67, 1.64) 0.94 (0.85, 1.04) 0.93 (0.67, 1.29)
Low RR (95% CI)
High vs.
BRE80153 BRE80008 BRE15400
BRE80008 BRE80034 BRE15400
BRE80008 BRE12728 BRE15400 BRE13011
wcrf_code
1 .404 1 2.4
7

42
2.5.1.3 Red meat Global Report, 2007 A meta-analysis was performed combining three prospective studies (Gaard, M. T. 1995 , BRE17516;Gertig, D. M. et al., 1999 , BRE03215;van der Hel, O. L. et al., 2004 , BRE12728). The results showed a pooled RR = 1.02 (95% CI = 0.98-1.06) for an increase of meat consumption of 5 times/months. The great significant heterogeneity (I2 = 74%) was partially explained by different adjustment for confounders. The study of Gaard et al. (Gaard, M. et al., 1994 , BRE03044;Gaard, M. T. 1995 , BRE17516) controlled only for age. Two studies that could not be included in the dose-response meta-analysis did not find any association of red meat with breast cancer: the Seventh-day Adventists Cohort Study (Mills, P. K. A. 1988 , BRE17836) on cancer mortality and the Nurses' Health Study II (Cho, E. S. 2003 , BRE17370). Two other reports of the Nurses’ Health Study were also not included (Fung, T. T. et al., 2005 , BRE22370;Holmes, M. D. et al., 2003 , BRE15400). In addition, the Nurses’ Health Study reported that rapid acetylators with the highest red meat intake were not at increased risk of breast cancer compared with slow acetylators with the lowest red meat intake (OR ≥1 & rapid acetylators vs. ≤0.5 servings/day & slow acetylators=1.1, 95% CI = 0.7-1.8). In this study, individuals were classified as rapid acetylators if they were wild-type or heterozygous for the NAT2 slow-acetylator alleles (Gertig, D. M. et al., 1999 , BRE03215). Update Four reports on red meat intake were identified during the update period. The Canadian National Breast Screening Study (Kabat, G. C. et al., 2007 , BRE80138) and the UK Women’s Cohort Study (Taylor, E. F. et al., 2007 , BRE80008) both investigated pre- and postmenopausal breast cancers while the Nurses’ Health Study II investigated risk of premenopausal breast cancer (Cho, E. et al., 2006 , BRE80034) and the Diet, Cancer and Health study investigated postmenopausal breast cancer (Egeberg, R. et al., 2008 , BRE80153). The results are displayed in Fig RM1. Menopause age unspecified Two prospective cohort studies with inconsistent results were identified over the period Jan 2006 and Jun 2008: the Canadian National Breast Screening Study (Kabat, G. C. et al., 2007 , BRE80138) (RR >108.9 vs <48.4 g/day was 0.98 (95% CI = 0.86-1.12) and the UK Women’s Cohort Study (Taylor, E. F. et al., 2007 , BRE80008) (RR >57 g/day vs none was 1.41 (95% CI = 1.10- 1.81). In total, six studies were included in the high vs. low plot (Fig RM1) on red meat and unspecified breast cancer (Gaard, M. T. 1995 , BRE17516;Gertig, D. M. et al., 1999 , BRE03215;Kabat, G. C. et al., 2007 , BRE80138;Li, W. et al., 2005 , BRE23123;Mills, P. K. A. 1988 , BRE17836;Taylor, E. F. et al., 2007 , BRE80008;van der Hel, O. L. et al., 2004 , BRE12728). One report of the Nurses’ Health Study (Gertig, D. M. et al., 1999 , BRE03215) was not included because it was superseded by Holmes et al. 2003 (Gertig, D. M. et al., 1999 , BRE03215); whereas the Seventh-day Adventist Cohort (Mills, P. K. A. 1988 , BRE17836) only reported mortality data, therefore it was also excluded from the meta-analysis.

43
In two studies red meat was found to be associated with an increased risk of breast cancer in women with unspecified menopausal status (Gaard, M. T. 1995 , BRE17516;Li, W. et al., 2005 , BRE23123;Mills, P. K. A. 1988 , BRE17836;Taylor, E. F. et al., 2007 , BRE80008;van der Hel, O. L. et al., 2004 , BRE12728). In two studies the association was positive but not significant and in two studies there was no association. Premenopause Three prospective cohort studies were identified over the period Jan 2006 and Jun 2008 (Cho, E. et al., 2006 , BRE80034) Nurses’ Health Study II; (Kabat, G. C. et al., 2007 , BRE80138) Canadian National Breast Screening Study and (Taylor, E. F. et al., 2007 , BRE80008) the UK Women’s Cohort Study. The Nurses’ Health Study II (Cho, E. et al., 2006 , BRE80034) (1021 premenopausal breast cancer cases) reported a significant dose-response relationship(RR = 1.44; 95% CI = 1.18-1.77 for an increase of 1 serving/day of red meat – cumulative updated consumption, questionnaires years 1991, 1995, 1999). The RR of the highest vs. the lowest category of consumption was 1.27 (95% CI = 0.96-1.67). In subgroup analysis, the positive significant association was observed for ER+PR+ breast tumors (512 cases; RR = 1.97; 95% CI = 1.35-2.88 for an increase of 1 serving/day) but not for ER-PR- breast tumours (167 cases) (RR = 0.89; 95% CI = 0.43-1.84 for an increase of 1 serving/day). In the UK Women’ Cohort Study (Taylor, E. F. et al., 2007 , BRE80008) the dose-response relationship was borderline significant (RR per 50g/day increase =1.13; 95% CI = 0.99-1.29; 283 cases). In the Canadian National Breast Screening Study (Kabat, G. C. et al., 2007 , BRE80138), red meat intake was not related to premenopausal breast cancer risk (RR>109 vs <48 g/day =0.87; 95% CI = 0.71-1.06) In total, results of four cohort studies (Cho, E. et al., 2006 , BRE80034;Holmes, M. D. et al., 2003 , BRE15400;Kabat, G. C. et al., 2007 , BRE80138;Taylor, E. F. et al., 2007 , BRE80008) were included in the highest vs. lowest forest plot on red meat and premenopausal breast cancer. A previous report of the Nurses’ Health Study II (Cho, E. S. 2003 , BRE17370) was superseded by the more recent report (Cho, E. et al., 2006 , BRE80034). No high vs. low plot was conducted on red meat and premenopausal breast cancer in the Global Report. Postmenopause Three prospective cohort studies were identified over the update period Jan 2006 and Dec 2007 (Egeberg, R. et al., 2008 , BRE80153;Kabat, G. C. et al., 2007 , BRE80138;Taylor, E. F. et al., 2007 , BRE80008). No association with red meat was observed in the Canadian National Breast Screening Study (Kabat, G. C. et al., 2007 , BRE80138). The RR was 1.13 (95% CI = 0.99-1.29) for an increase of 50 g of red meat intake. In the UK Women’ Cohort Study (Taylor, E. F. et al., 2007 , BRE80008) the association of postmenopausal breast cancer with intake of red meat was statistically significant (RR per 50g/day
increase =1.12; 95% CI = 1.01-1.26; 395 cases).

44
A significant positive association was also observed in in a case-control study nested in the Diet and Cancer Health Study, Denmark (Egeberg, R. et al., 2008 , BRE80153) (RR per 25g/day
increase =1.15; 95% CI = 1.01-1.31; 378 cases). In this study, the association of breast cancer risk with red meat intake was significant in the group of women with NAT2 intermediate and fast acetylator genotype (RR per 25g/day increase =1.37; 95% CI = 1.07-1.76; 147 cases), but not in the group with NAT2 slow genotype. In subgroup analyses defined by NAT1 genotype, the RR per
25g/day increase was 1.27; 95% CI = 0.98-1.64 (137 cases) in the fast or intermediate acetylator genotype while intake of red meat was not associated with breast cancer risk in the group with the NAT1 slow genotype. The RRs for the highest vs the lowest category of consumption reported by four studies are displayed in a forest plot in Fig RM1 (Egeberg, R. et al., 2008 , BRE80153;Holmes, M. D. et al., 2003 , BRE15400;Kabat, G. C. et al., 2007 , BRE80138;Mills, P. K. A. 1988 , BRE17836;Taylor, E. F. et al., 2007 , BRE80008). The 2003 Nurses’ Health Study report (Holmes, M. D. et al., 2003 , BRE15400) was included instead of the analysis published in 2005 (Fung, T. T. et al., 2005 , BRE22370) because the latter report only provided continuous data. In one of the analysis of the Nurses’ Health Study (Fung, T. T. et al., 2005 , BRE22370) ER- breast cancers were not significantly associated with the intake of red meat. The Seventh-day Adventists Cohort (Mills, P. K. A. 1988 , BRE17836) only reported on mortality, therefore it was excluded from the highest vs. lowest plot. High vs. low plot was not conducted on red meat and postmenopausal breast cancer in the Global Report. Pooled analysis of cohort studies In 2002, Missmer et al. performed a pooled analysis using primary data of eight cohort studies with 7379 invasive breast cancers. Three of the participating cohorts are included in the figure RM1 (Nurses’ Health Study, Canadian National Breast Screening Study, Adventists Health Study). The other cohort studies in the pooled analysis are the Iowa Women’s Health Study, the Netherlands Cohort Study, New York State Cohort, New York University Women’s Study, Sweden Mammography Cohort. None of the studies showed a significant association of red meat with breast cancer risk. Positive associations had been observed only in the New York University Women’s Study and the Adventists Health Study, but none of them were statistically significant. The pooled relative risk estimate was 0.94 (95% CI = 0.87-1.02) –quartile 4 vs. quartile 1 (Missmer et al, 2002).

45
iii. Fig RM1 Highest vs. lowest forest plot on red meat and breast cancer, by menopausal status (**=new studies identified during the update)
.
.
.
Menopausal age unspecified ** Kabat GC. et al. (2007) ** Taylor et al. (2007) Li, W. (2005) van der Hel, O. L. (2004) Holmes, M.D. (2003) Gaard, (1995)
Premenopausal ** Kabat GC. et al. (2007) ** Taylor et al. (2007) ** Cho et al. (2006) Holmes, M.D. (2003)
Postmenopausal ** Egeberg, R. et al. (2008) ** Kabat GC. et al. (2007) ** Taylor et al. (2007) Holmes, M.D. (2003)
ID Study
0.98 (0.86, 1.12) 1.41 (1.10, 1.81) 1.30 (0.69, 2.46) 1.30 (0.83, 2.03) 0.94 (0.84, 1.05) 2.28 (1.29, 4.03)
0.87 (0.71, 1.06) 1.32 (0.93, 1.88) 1.27 (0.96, 1.68) 0.94 (0.72, 1.22)
1.65 (1.09, 2.50) 1.08 (0.88, 1.33) 1.56 (1.09, 2.23) 0.99 (0.86, 1.13)
intake RR (95% CI)
vs.Low Red meat
High
BRE80138 BRE80008 BRE23123 BRE12728 BRE15400 BRE17516
BRE80138 BRE80008 BRE80034 BRE15400
BRE80153 BRE80138 BRE80008 BRE15400
WCRF_Code
Canadian National Breast Screening Study UK Women's Cohort Study Shanghai BSE MPCDRF Nurses' Health Study Cohort Norway National Health Screening Service
Canadian National Breast Screening Study UK Women's Cohort Study NHS II Nurses' Health Study Cohort
Diet, Cancer and Health Canadian National Breast Screening Study UK Women's Cohort Study Nurses' Health Study Cohort
StudyDescription
> 108.99 vs. < 48.48 > 57.0 vs. 0 > 303.0 vs. < 148.0 > 45.0 vs. < 29.0 > 1.32 vs. < 0.55 >=6 vs. <=2
> 108.99 vs. < 48.48 > 57.0 vs. 0 > 10.6 vs. < 3.0 > 1.32 vs. < 0.55
> 80.0 vs. < 49.0 > 108.99 vs. < 48.48 > 57.0 vs. 0 > 1.32 vs. < 0.55
contrast
g/day g/day times/year g/day servings/day Unit/week
g/day g/day servings/week servings/day
g/day g/day g/day servings/day
Units
0.98 (0.86, 1.12) 1.41 (1.10, 1.81) 1.30 (0.69, 2.46) 1.30 (0.83, 2.03) 0.94 (0.84, 1.05) 2.28 (1.29, 4.03)
0.87 (0.71, 1.06) 1.32 (0.93, 1.88) 1.27 (0.96, 1.68) 0.94 (0.72, 1.22)
1.65 (1.09, 2.50) 1.08 (0.88, 1.33) 1.56 (1.09, 2.23) 0.99 (0.86, 1.13)
intake RR (95% CI)
vs.Low Red meat
High
BRE80138 BRE80008 BRE23123 BRE12728 BRE15400 BRE17516
BRE80138 BRE80008 BRE80034 BRE15400
BRE80153 BRE80138 BRE80008 BRE15400
WCRF_Code
1 .248 1 4.0
3

46
2.1.1.4 Poultry Global Report, 2007 Poultry intake was not associated with breast cancer in the Nurses’ Health Study (Fung, T. T. et al., 2005 , BRE22370;Holmes, M. D. et al., 2003 , BRE15400)]; the Seventh-day Adventist Cohort Study (Mills, P. K. B. 1989 , BRE17837), the New York University Women’s Health Study (Toniolo, P. et al., 1994 , BRE12398) and in a Chinese nested case-control study (Li, W. et al., 2005 , BRE23123). Update Two cohort studies were identified, the UK Women’ Cohort Study (Taylor, E. F. et al., 2007 , BRE80008) and the Diet and Cancer Health Study, Denmark (Egeberg, R. et al., 2008 , BRE80153). Premenopause Poultry intake was not associated with breast cancer in the UK Women’ Cohort Study (Taylor, E. F. et al., 2007 , BRE80008) (RR high vs low = 1.28, 95% CI = 0.93-1.75). Postmenopause No association with breast cancer was observed in the UK Women’ Cohort Study (Taylor, E. F. et al., 2007 , BRE80008) (RR high vs low = 1.00, 95% CI = 0.78-1.28) and the Diet and Cancer Health Study, Denmark (Egeberg, R. et al., 2008 , BRE80153) (RR >25 vs <10 g/day= 1.33, 95% CI =0.85–2.07). The associations between poultry intake and risk of postmenopausal breast cancer did not vary statistically significantly by NAT2 phenotypes, however intermediate/fast NAT2 acetylators was associated with a stronger effect than slow NAT2 acetylators (RRfor a 25g
increment = 1.12, 95% CI = 0.77-1.63; RR = 0.97, 95% CI = 0.75-1.25 respectively; Pinteractions = 0.53). The opposite was observed in NAT1 polymorphism (RRfor a 25g increment = 0.85, 95% CI = 0.57-1.27; RR = 1.06, 95% CI = 0.82-1.36 respectively for fast and slow NAT1 acetylators; Pinteractions = 0.37) (Egeberg, R. et al., 2008 , BRE80153). 2.5.1.5 Liver Global Report, 2007 No cohort study was identified. Update Fish liver No significant associations were observed in the Norwegian Women and Cancer Study(NOWAC) (Brustad, M. et al., 2007 , BRE80127). The relative risk of breast cancer

47
(menopausal age unspecified) was 0.82 (95% CI = 0.63-1.07) comparing ever vs. never consumption. 2.5.1.5 Offals Premenopause Breast cancer in premenospausal women was not related to offal intake in UK Women’ Cohort Study (Taylor, E. F. et al., 2007 , BRE80008) (RR high vs low = 1.66 (95% CI = 0.22-11.9). Postmenopause Breast cancer in postmenospausal women was not related to offal intake in the UK Women’ Cohort Study (Taylor, E. F. et al., 2007 , BRE80008) (RR high vs low = 1.62, 95% CI = 0.57-4.59). 2.5.2 Fish Gobal Report, 2007 Eight cohort studies (Frazier, A. L. et al., 2004 , BRE02942;Gago-Dominguez, M. Y. 2003 , BRE17518;Gertig, D. M. et al., 1999 , BRE03215;Holmes, M. D. et al., 2003 , BRE15400;Key, T. J. et al., 1999 , BRE04758;Mills, P. K. B. 1989 , BRE17837;Stripp, C. et al., 2003 , BRE11883;Vatten, L. J. et al., 1990 , BRE12832) were identified, in which four of them are from the Nurses’ Health Study (Frazier, A. L. et al., 2004 , BRE02942;Gertig, D. M. et al., 1999 , BRE03215;Holmes, M. D. et al., 2003 , BRE15400). In addition, there were three nested case-control studies (Frazier, A. L. et al., 2003 , BRE02941;Li, W. et al., 2005 , BRE23123;Toniolo, P. et al., 1994 , BRE12398); so altogether there were eleven reports identified in the Global Report. Menopause age unspecified Eight cohort studies were identified. Four studies were included in the meta-analysis (Gertig, D. M. et al., 1999 , BRE03215;Key, T. J. et al., 1999 , BRE04758;Li, W. et al., 2005 , BRE23123;Mills, P. K. B. 1989 , BRE17837) and it showed a non-significant positive association between breast cancer and fish intake (RR for 70 gr/day increase= 1.11 (95% CI = 0.98-1.26) with no significant heterogeneity). Regarding the studies not included in the meta-analysis due to inadequate data, the intake of fish was not related to breast cancer in in the Norwegian NHSS cohort (Vatten, L. J. et al., 1990 , BRE12832) , in the Danish Diet and Cancer health Study (Egeberg, R. et al., 2008 , BRE80153;Stripp, C. et al., 2003 , BRE11883) and in the New York Health Study (Toniolo, P. et al., 1994 , BRE12398) An inverse non-significant association was shown in the Singapore Chinese Health Study (Gago-Dominguez, M. Y. 2003 , BRE17518). No association was observed in a report of the Nurses’ Health Study (Holmes, M. D. et al., 2003 , BRE15400) . The intake of fish in adolescence was not related to breast cancer in a case-control study nested in this cohort (Frazier, A. L. et al., 2003 , BRE02941) (RR 3-5 onces = 0.94, 95% CI = 0.64-1.37).

48
Premenopause Fish intake was not related to breast cancer in premenopausal women in the Nurses’ Health Study (Cho, E. S. 2003 , BRE17370), in a Norwegian cohort (Vatten, L. J. et al., 1990 , BRE12832), in a Danish cohort (Egeberg, R. et al., 2008 , BRE80153;Stripp, C. et al., 2003 , BRE11883)and in another report of Nurses’ Health Study after 18 years of follow up (Holmes, M. D. et al., 2003 , BRE15400). In addition, adolescent intake of fish was not related to risk in premenopausal breast cancer (RRQ5 vs. Q1=0.94, 95% CI = 0.67-1.31) (Frazier, A. L. et al., 2004 , BRE02942). Postmenopause Fish intake was not related to breast cancer in postmenopausal women in the Nurses’ Health Study (Holmes, M. D. et al., 2003 , BRE15400), in the Iowa Women’s Health Study (Folsom, A. R. and Demissie, Z. 2004 , BRE80171), in a Norwegian cohort (Vatten, L. J. et al., 1990 , BRE12832) and in a Danish cohort (Egeberg, R. et al., 2008 , BRE80153;Stripp, C. et al., 2003 , BRE11883). High intake of fish was inversely associated with breast cancer risk in the Singapore Chinese Health Study (Gago-Dominguez, M. Y. 2003 , BRE17518). Update Two cohort studies have been published during the Continuous Update, the EPIC study (Engeset, D. et al., 2006 , BRE80109) and one of the cohorts participating in the EPIC study, the Diet, Cancer and Health Study from Denmark (Egeberg, R. et al., 2008 , BRE80153). No association was observed in the Diet and Cancer Health Study (Egeberg, R. et al., 2008 , BRE80153) (included in EPIC). Menopause age unspecified The only study identified was the European Prospective Investigation into Cancer (EPIC) (Engeset, D. et al., 2006 , BRE80109) (4776 cases) . No association between fish intake and breast cancer risk was observed (RR>96.7 vs. <5.5 g/day =1.07 (95% CI = 0.95-1.12). In this study, breast cancer risk was positively associated with the intake of fatty fish (RR 36 vs0.28 g/day = 1.13; 95% CI = 1.01- 1.26) but not with the intake of lean fish (RR >61.2 vs. <0.3 g/day= 1.07 (95% CI = 0.95-1.21). Overall, nine studies on the relationship of fish intake with risk of breast cancer (menopausal age unspecified) had been identified during the SLR and the Continuous Update. Six of them had a prospective cohort design and three were nested case-control studies. Only one out of the nine studies was identified during the update period (Engeset, D. et al., 2006 , BRE80109). Eight studies were included in the highest vs. lowest forest plot (Engeset, D. et al., 2006 , BRE80109;Gago-Dominguez, M. Y. 2003 , BRE17518;Holmes, M. D. et al., 2003 , BRE15400;Key, T. J. et al., 1999 , BRE04758;Li, W. et al., 2005 , BRE23123;Mills, P. K. B. 1989 , BRE17837;Toniolo, P. et al., 1994 , BRE12398;Vatten, L. J. et al., 1990 , BRE12832) (Fig F1). One study was excluded (Gertig, D. M. et al., 1999 , BRE03215) as it was superseded by Holmes et al.2003.
49
The Singapore Chinese Health Study reported a non-significant inverse association (RR Quantile
4 vs. Quantile 1 = 0.74, 95% CI = 0.54-1.01) (314 cases) (Gago-Dominguez, M. Y. 2003 , BRE17518). Four other studies have reported non-significant positive associations (including the EPIC, Norway National Health Screening Service study, Shanghai BSE and LSS) (Engeset, D. et al., 2006 , BRE80109;Key, T. J. et al., 1999 , BRE04758;Li, W. et al., 2005 , BRE23123;Vatten, L. J. et al., 1990 , BRE12832). No association was observed in the Nurses’ Health Study (Holmes, M. D. et al., 2003 , BRE15400) and New York Women’s Health Study (Toniolo, P. et al., 1994 , BRE12398). The California Seventh-day Adentists Cohort showed a significant increased risk associated with increasing levels with fish intake (Mills, P. K. B. 1989 , BRE17837) (RR >=1 vs. 0.0 times/week =1.54, 95% CI = 1.14-2.07). Premenopause Only the EPIC study was identified during the update. No association was observed (RR 96.77
vs. 5.54 g/day = 1.11, 95% CI = 0.84-1.46). The four studies identified during the SLR and the Continuous Update have been included in the forest plot (Cho, E. S. 2003 , BRE17370;Engeset, D. et al., 2006 , BRE80109;Gago-Dominguez, M. Y. 2003 , BRE17518;Holmes, M. D. et al., 2003 , BRE15400) (Fig F1). A non-significant weak positive association was observed in the Nurses’ Health Study (RR >0.4
vs. <0.13 serving/day = 1.17, 95% CI = 0.92- 1.49) and the EPIC, while the Nurses’ Health Study II and the Singapore Chinese Health Study provided results in the opposite direction (RR 0.4 vs. 0.07
serving/day = 0.92, 95% CI = 0.73-1.15; RR Quantile 4 vs. Quantile 1 = 0.89, 95% CI = 0.48-1.66, respectively). Postmenopause The EPIC study and one of its component cohort, the Diet, Cancer and Health study from Denmark investigated fish intake on relation to postmenopause breast cancer in the period. The EPIC study reported a non-significant positive association (RR 96.77 vs. 5.54g/day = 1.10, 95% CI = 0.95-1.28). Three studies are included in a forest plot showing the results of the highest vs. lowest exposure comparison – the EPIC study (Engeset, D. et al., 2006 , BRE80109), Nurses’ Health Study (Holmes, M. D. et al., 2003 , BRE15400) and the Singapore Chinese Health Study (Gago-Dominguez, M. Y. 2003 , BRE17518) (Fig F1). Three other studies were excluded because two of them are from the Diet, Cancer and Health study, a component of the EPIC study (Egeberg, R. et al., 2008 , BRE80153;Stripp, C. et al., 2003 , BRE11883) and the Nurses’ Health Study only provided continuous data (Fung, T. T. et al., 2005 , BRE22370). The results were inconsistent for all three studies: the Nurses’ Health Study showed no association, the EPIC study reported an increased cancer risk but the risk estimate was not significant (RR 96.77 vs. 5.54g/day = 1.10, 95% CI = 0.95-1.28), the Singapore Chinese Health Study reported a non-significant decreased risk in breast cancer (RR Quantile 4 vs. Quantile 1 = 0.71, 95% CI = 0.49-1.02). The associations between fish intake and risk of postmenopausal breast cancer did not vary statistically significantly by NAT2 phenotypes, however intermediate/fast NAT2 acetylators was associated with a stronger effect than slow NAT2 acetylators (RRfor a 25g increment = 1.39, 95% CI = 0.87-2.22; RR = 1.03, 95% CI = 0.82-1.30 respectively; Pinteractions = 0.27). RR was
50
1.09 (95% CI = 0.67-1.78) and 1.11 (95% CI = 0.87-1.41) for fast and slow NAT1 acetylators respectively (Pinteractions = 0.96) (Egeberg, R. et al., 2008 , BRE80153).

51
iv. Fig F1 Highest vs. lowest forest plot on fish intake and risk of breast cancer, by menopausal status (** = new studies)
.
.
.
Menopause age unspecified ** Engeset D. (2006) Li, W. (2005) Gago-Dominguez, M. (2003) Holmes, M.D. (2003) Key, T. J. (1999) Toniolo, P. (1994) Vatten, L. J. (1990) Mills, P. K. (1989)
Premenopausal ** Engeset D. (2006) Cho, E. (2003) Gago-Dominguez, M. (2003) Holmes, M.D. (2003)
Postmenopausal ** Engeset D. (2006) Gago-Dominguez, M. (2003) Holmes, M.D. (2003)
ID Study
1.07 (0.95, 1.20) 1.30 (0.67, 2.51) 0.74 (0.54, 1.01) 1.04 (0.94, 1.15) 1.17 (0.89, 1.53) 1.02 (0.61, 1.71) 1.20 (0.82, 1.75) 1.54 (1.14, 2.07)
1.11 (0.84, 1.46) 0.92 (0.73, 1.15) 0.89 (0.48, 1.66) 1.17 (0.92, 1.49)
1.10 (0.95, 1.28) 0.71 (0.49, 1.02) 1.00 (0.89, 1.12)
RR (95% CI)
High vs.Low
BRE80109 BRE23123 BRE17518 BRE15400 BRE04758 BRE12398 BRE12832 BRE17837
BRE80109 BRE17370 BRE17518 BRE15400
BRE80109 BRE17518 BRE15400
WCRF_Code
EPIC Shanghai BSE The Singapore Chinese Health Study Nurses' Health Study LSS, 1969 New York Women's Health Study Norway National Health Screening Service California Seventh-day Adventists Cohort
EPIC NHS II The Singapore Chinese Health Study Nurses' Health Study
EPIC The Singapore Chinese Health Study Nurses' Health Study
StudyDescription
96.77 vs. 5.54 > 169.0 vs. < 65.0 Quantile 4 vs. Quantile 1 > 0.4 vs. < 0.13 > 5.0 vs. < 1.0 73.0 vs. 4.0 > 2.1 vs. < 2.0 > 1.0 vs. < 0.0
96.77 vs. 5.54 0.4 vs. 0.07 Quantile 4 vs. Quantile 1 > 0.4 vs. < 0.13
96.77 vs. 5.54 Quantile 4 vs. Quantile 1 > 0.4 vs. < 0.13
contrast
g/day times/year
serving/day times/week g/day times/week times/week
g/day serving/day
serving/day
g/day
serving/day
units
1.07 (0.95, 1.20) 1.30 (0.67, 2.51) 0.74 (0.54, 1.01) 1.04 (0.94, 1.15) 1.17 (0.89, 1.53) 1.02 (0.61, 1.71) 1.20 (0.82, 1.75) 1.54 (1.14, 2.07)
1.11 (0.84, 1.46) 0.92 (0.73, 1.15) 0.89 (0.48, 1.66) 1.17 (0.92, 1.49)
1.10 (0.95, 1.28) 0.71 (0.49, 1.02) 1.00 (0.89, 1.12)
RR (95% CI)
High vs.Low
BRE80109 BRE23123 BRE17518 BRE15400 BRE04758 BRE12398 BRE12832 BRE17837
BRE80109 BRE17370 BRE17518 BRE15400
BRE80109 BRE17518 BRE15400
WCRF_Code
1 .399 1 2.5
1

52
2.6.2 Plant oils (refer to 5.2 total fat section, page 75) Global Report, 2007 Breast cancer was not related to the consumption of seed and olive oils in the French EPIC-E3N cohort (Thiebaut, A. C. and Clavel-Chapelon, F. 2001 , BRE12244). In addition, the intake of sesame oil and soy oil was not related to breast cancer in a Chinese nested case-control study (Li, W. et al., 2005 , BRE23123). Update Postmenopause The Malmo Diet and Cancer Study (Wirfalt, E. et al., 2005 , BRE11111) reported an increased risk of postmenopausal breast cancer related to vegetable oil intake (RR 28.0 vs 4.2 g/day = 1.65; 95% CI = 1.05-2.58) No new studies were identified on premenopause and menopause age unspecified during the update period.
2.7 Milk and dairy products Global Report, 2007 Six cohort studies were identified. Menopause age unspecified Milk and dairy products were not associated with breast cancer in the Nurses' Health Study (Cho, E. S. 2003 , BRE17370;Shin, M. H. et al., 2002 , BRE16658) and in the Netherlands Cohort Study on Diet and Cancer (Voorrips, L. E. et al., 2002 , BRE13011). There was no significant association with adolescent consumption in a case-control study nested in the Nurses’ Health Study (Frazier, A. L. et al., 2003 , BRE02941). Two other studies included in the SLR database, but not mentioned in the SLR reported significant inverse association of breast cancer and intake of dairy products. In the New York Cohort Study (Toniolo, P. et al., 1994 , BRE12398) the RR >675 vs. < 37 g/day was 0.59 (95% CI = 0.35-0.99; Ptrend = 0.10) and in a Finnish cohort (Knekt, P. et al., 1996 , BRE04900) the RR Q3
vs. < Q1 was 0.42 (95% CI = 0.23-0.78; Ptrend = 0.02). Premenopause Milk and dairy products were not associated with breast cancer in the Nurses' Health Study II (Cho, E. S. 2003 , BRE17370;Shin, M. H. et al., 2002 , BRE16658). Postmenopause A significant inverse relationship was found in a cohort of postmenopausal women (McCullough, M. L. et al., 2005 , BRE23368).

53
Update Three studies investigated intake of dairy products and breast cancer risk. Menopausal age unspecified The SUVIMAX study (France) (Kesse-Guyot, E. et al., 2007 , BRE11112) (92 cases) reported a significant inverse trend of risk of breast cancer with increasing intake of dairy products (RR>401.0 vs.<164.0 g/day = 0.55; 95% CI = 0.29- 1.03, Ptrend = 0.03). The Boyd Orr Cohort (van der Pols, J. C. et al., 2007 , BRE80154) (97 cases) reported non-significant inverse associations of breast cancer risk with intake of dairy products during childhood (RR >471 vs. <89
g/day =0.89 (95% CI = 0.45-1.75). Premenopause The SUVIMAX study (France) (Kesse-Guyot, E. et al., 2007 , BRE11112) (92 cases) reported a significant inverse trend of risk of breast cancer with increasing intake of dairy products (RR>401.0 vs.<164.0 g/day = 0.35; 95% CI = 0.12- 0.95). In the Women’s Health Study (Lin, J. et al., 2007 , BRE80165) the intake of dairy products was significantly inversely associated with premenopausal breast cancer (RR >=3.13 vs. <0.93 serving/day = 0.64, 95% CI = 0.42-0.95, Ptrend = 0.09). Postmenopause The SUVIMAX study (France) (Kesse-Guyot, E. et al., 2007 , BRE11112) (92 cases) reported no association between dairy poduct intake and breast cancer after menopause (RR>401.0 vs.<164.0 g/day = 0.72; 95% CI = 0.32- 1.66). Similar results were reported in the Women’s Health Study (Lin, J. et al., 2007 , BRE80165) (RR >=3.13 vs. <0.93 serving/day = 1.07, 95% CI = 0.82-1.39). 2.7.1 Milk Global Report, 2007 Eight studies investigated milk intake in relation to breast cancer. (Voorrips, L. E. et al., 2002 , BRE13011) (Cho, E. S. 2003 , BRE17370;Shin, M. H. et al., 2002 , BRE16658) (Knekt, P. et al., 1996 , BRE04900) (McCullough, M. L. et al., 2005 , BRE23368) (Mills, P. K. A. 1988 , BRE17836). Menopause age unspecified Four studies on breast cancer incidence and one study on fatal breast cancer were identified. No association with breast cancer was observed in a meta-analysis that included two studies (RR = 1.00 (95% CI = 0.99-1.01) per 1 time/week) (Gaard, M. T. 1995 , BRE17516;Key, T. J. et al., 1999 , BRE04758). Of the two studies not included in the meta-analysis one reported a significant inverse (Knekt, P. et al., 1996 , BRE04900)and the study on mortality reported no association (Mills, P. K. A. 1988 , BRE17836).

54
Premenopause Two studies were identified. In one study, milk intake was significantly inversely related to premenopausal breast cancer risk (Nurses’ Health Study, (Cho, E. S. 2003 , BRE17370;Shin, M. H. et al., 2002 , BRE16658)), while in the other the association was inverse but not statistically significant (Hjartaker, A. et al., 2001 , BRE03955). Postmenopause A meta-analysis of two studies (Nurses’ Health Study and CPS II) did not show any association (RR = 1.00 (95% CI = 0.99-1.00) (McCullough, M. L. et al., 2005 , BRE23368;Shin, M. H. et al., 2002 , BRE16658). Update The French study SUVIMAX investigated milk intake during adulthood in relation to breast cancer incidence (Kesse-Guyot, E. et al., 2007 , BRE11112). The Boyd Orr Cohort (van der Pols, J. C. et al., 2007 , BRE80154) (97 cases) reported non- significant inverse associations of breast cancer risk with intake of milk during childhood (RR >1.2 vs. <0.5 cups/day =0.83 (95% CI = 0.41-1.69). Premenopause In the SUVIMAX study (France) (Kesse-Guyot, E. et al., 2007 , BRE11112) the relationship of milk intake with premenopausal breast cancer (44 cases) was inverse although non-significant (RR>249 vs.<24 g/day = 0.41; 95% CI = 0.16-1.04), opposite to what was observed for postmenopausal cancer in the same cohort. Postmenopause The SUVIMAX study (France) (Kesse-Guyot, E. et al., 2007 , BRE11112) reported a non-significant positive association of risk of postmenopausal breast cancer risk (48 cases) with increasing intake of milk (RR>249 vs.<24 g/day = 1.82; 95% CI = 0.79- 4.17). No new studies were identified in relation to milk intake and women with menopause age unspecified. 2.7.2 Cheese, fresh cheese Global Report, 2007 Five studies were retrieved. Menopause age unspecified Two studies on breast cancer incidence (Knekt, P. et al., 1996 , BRE04900;Thiebaut, A. C. and Clavel-Chapelon, F. 2001 , BRE12244) and one study on fatal breast cancer reported no association (Mills, P. K. A. 1988 , BRE17836).

55
Premenopause One study reported no association with intake of hard cheese (Nurses’ Health Study, (Cho, E. S. 2003 , BRE17370;Shin, M. H. et al., 2002 , BRE16658), while in the other the association was inverse but not statistically significant (Hjartaker, Laake et al., 2001, BRE03955). Postmenopause One study reported no association with intake of hard cheese (Nurses’ Health Study, (Cho, E. S. 2003 , BRE17370;Shin, M. H. et al., 2002 , BRE16658). Update Premenopause In the same cohort (SUVIMAX ) (Kesse-Guyot, E. et al., 2007 , BRE11112) intake of cheese and fresh cheese were not related to premenopausal breast cancer (44 cases). The relative risks were RR>49 vs.<14 g/day = 1.16(95% CI = 0.46-2.91) for cheese and RR>51 g/day vs.<14 = 0.5 (95% CI = 0.17-1.44) for fresh cheese. Postmenopause The SUVIMAX study (France) (Kesse-Guyot, E. et al., 2007 , BRE11112) reported non-significant association of breast cancer with cheese intake. The relative risks were RR>49 vs.<14
g/day = 1.05 (95% CI = 0.44-2.55) for cheese and RR>51 g/day vs.<14 = 1.23 (95% CI = 0.59-2.57) for fresh cheese. 2.7.3 Yoghurt Global Report, 2007 Menopause age unspecified Yoghurt intake was not related to breast cancer in a Finnish cohort (Knekt, P. et al., 1996 , BRE04900). Premenopause No association with yoghurt consumption was found in the Nurses' Health Study ((Cho, E. S. 2003 , BRE17370;Shin, M. H. et al., 2002 , BRE16658). Postmenopause No association with yoghurt consumption was found in the Nurses' Health Study ((Cho, E. S. 2003 , BRE17370;Shin, M. H. et al., 2002 , BRE16658). Update Premenopause

56
In the SUVIMAX study (France) (Wirfalt, E. et al., 2005 , BRE11111) the RR was 1.01 (95% CI = 0.40-2.58) for premenopausal breast cancer (44 cases). Postmenopause The SUVIMAX study (France) (Wirfalt, E. et al., 2005 , BRE11111) reported a non-significant association of breast cancer with yoghurt intake. The relative risk was RR>126 vs.<24
g/day = 0.59 (95% CI = 0.22-1.54) for postmenopausal breast cancer risk (48 cases). 3. Beverages 3.5 Fruit juices Global Report, 2007 Intake of fruit and vegetable juice (Olsen, A. T. 2003 , BRE17890) or tomato juice (Sesso, H. D. et al., 2005 , BRE24061) was not related to breast cancer. No significant association was observed with adolescent consumption of orange juice in a case control study nested in the Nurses’ Health Study cohort (Frazier, A. L. et al., 2003 , BRE02941). Update Menopause age unspecified Intake of fruit juices was not related to breast cancer risk in the SUVIMAX Study (Hirvonen, T. et al., 2006 , BRE80105) (95 cases) (RR>150 g/day vs. none = 1.29 (95% CI = 0.8-2.09). Two cohort studies investigated citrus fruits in relation to breast cancer. The PLCO Cancer Screening Trial cohort, USA (Stolzenberg-Solomon, R. Z. et al., 2006 , BRE80113) reported a relative risk of 0.86 (95% CI = 0.43-1.72) associated with more of 180 g/day of juice of orange or grapefruit compared to none in non-vitamin users. Grapefruit juice intake was investigated in the Nurses’ Health Study (Kim, E. H. et al., 2008 , BRE80156). No association with breast cancer risk was observed (RR>1/2 glass/day vs. none = 1.02 (95% CI = 0.85-1.22). 3.6.1 Coffee Global Report, 2007 Three studies were combined in a meta-analysis (Key, T. J. et al., 1999 , BRE04758;Michels, Karin et al., 2002 , BRE20406;Vatten, L. J. et al., 1990 , BRE12833).. No association was observed (RR for 1 cup/day=0.97 (95% CI = 0.93-1.01)). A positive non- significant association was observed in one excluded cohort study.(Hoyer, A. P. and Engholm, G. 1992 , BRE04086). Note: One eight ounce cup is approximately 230 milliliters. Premenopause

57
A meta-analysis combinig two studies did not find any association (Michels, Karin et al., 2002 , BRE20406;Vatten, L. J. et al., 1990 , BRE12833). Postmenopause A meta-analysis combinig two studies did not find any association (Michels, Karin et al., 2002 , BRE20406;Vatten, L. J. et al., 1990 , BRE12833). Update Menopause age unspecified Coffee intake was not related to breast cancer risk in the SUVIMAX study (Hirvonen, T. et al., 2006 , BRE80105) (95 cases) (RR >253 vs. <111 ml/day = 1.1 (95% CI = 0.66-1.84) and in the Nurses' Health Study (Ganmaa, D. et al., 2008 , BRE80158) (5272 cases) (RR >4 cups/day vs. <1
cup/month = 0.92 (95% CI = 0.82-1.03). In the latter study, BMI did not modify the relationship of coffee intake with BMI. 3.6.2 Tea Global Report, 2007 Intake of tea was not associated with breast cancer in three cohort studies (The Sweden Mammography Screening Cohort (Michels, Karin et al., 2002 , BRE20406), the Iowa cohort (Zheng, W. et al., 1999 , BRE17172), the Nurses’ Health Study (Adebamowo, C. A. et al., 2005 , BRE21537) and a Chinese nested case-control study (Li, W. et al., 2005 , BRE23123). Black tea was not shown to be related to breast cancer in the meta-analysis of three studies (Goldbohm, R. A. et al., 1996 , BRE03308;Key, T. J. et al., 1999 , BRE04758;Yuan, J. M. et al., 2005 , BRE24717). Green tea was not related to breast cancer in two studies (Key, T. J. et al., 1999 , BRE04758;Yuan, J. M. et al., 2005 , BRE24717). Update Menopause age unspecified Breast cancer risk was inversely but not significantly related to intake of tea in the SUVIMAX study (RR >350 ml/day vs. none = 0.75 (95% CI = 0.45-1.28)) (Hirvonen, T. et al., 2006 , BRE80105) (95 cases) and in the Nurses' Health Study (RR >4 cups/month vs. none = 0.94 (95% CI= 0.77-1.14)) (Ganmaa, D. et al., 2008 , BRE80158) (5272 cases). Intake of herbal tea was inversely related to breast cancer risk in the SUVIMAX cohort (RR >150 ml/day vs. none = 0.43 (95% CI = 0.20-0.94), p=0.05). 3.7.1 Alcoholic drinks (refer to 5.4 alcohol as ethanol, page 83) Global Report, 2007 Menopause age unspecified

58
Twelve cohort studies (two studies were reported in one article) on alcoholic drinks were identified during the SLR; 25 cohort studies investigated ethanol intake and all-age breast cancer (see Section 5.4) The meta-analysis of 3 studies showed non-significant increased association between alcoholic drinks and breast cancer risk (RR per 5 times a week was 1.07 (95% CI = 0.89-1.29). There was no consistent dose response effect. Of the studies not included in the meta-analysis, four reported significant increased risk, two a non-significant increased risk, one reported no effect and two non-significant decreased risk. Premenopause Two cohort studies reported increased risk, one was statistically significant. Postmenopause Of three cohort studies, one reported a significant increased risk, one a non-significant increased risk and the other a non-significant decreased risk. Update Menopause age unspecified In the study of Danish Registered Nurses’, the intake of alcoholic drinks was associated with an increased risk of breast cancer (365 cases) (RR 1 drink/week = 1.02; 95% CI = 1.01-1.03) (Morch L.S. et al, 2007, BRE80004). New data from the CLUE II study showed a statistically non-significant increased risk in drinkers compared to non-drinkers (262 cases) (RR = 1.40, 95% CI = 0.97-2.03) (Visvanathan, K. et al., 2007 , BRE80020). Premenopause The CLUE II study reported an increased risk with a wide confidence intervals (41 cases) (RR drinkers vs nondrinkers = 2.69, 95% CI = 1.00-7.26) (Visvanathan, K. et al., 2007 , BRE80020). Postmenopause Four studies were identified during the update. All showed positive associations, but statistical significance was only attained in one study. Significant positive associations were observed in the Malmo Cancer and Diet Study (Wirfalt, E. et al., 2005 , BRE11111) (RR high vs
none=3.14; 95% CI = 1.17-8.39). In the Diet Cancer and Health Study, Denmark, increased risk that was not statistically significant was observed when comparing drinkers with abstainers (RR=1.23, 95% CI = 0.47-3.21) (Vogel, U. et al., 2007 , BRE80150). The CLUE II study reported similar results (RR drinkers vs nondrinkers = 1.25, 95% CI = 0.84-1.87) (Visvanathan, K. et al., 2007 , BRE80020). In the Copenhagen City Heart Study, Denmark (Nielsen, N. R. and Gronbaek, M. 2007 , BRE80143), with a nested case-control design, a positive but not significant association was observed with intake of alcoholic drinks (RR>21 vs <1 drinks/weeks= 1.54; 95% CI = 0.77-3.1). In this latter study, subgroup analyses by use of hormone replacement therapy resulted in a significant increasing trend in users of hormone replacement therapy

59
(RR>21 vs <1 drinks/weeks= 2.17; 95% CI = 0.79-5.9; Ptrend = 0.004) while no significant result was observed in non-users of hormone replacement therapy. Published meta-analysis In 2006, Key et al. conducted a comprehensive meta-analysis involving 98 unique observational studies (> 75 000 cases) on the relation of alcohol and breast cancer; with particular attentions drawn to study quality issues including treatment of confounders and data reporting and the methodology in meta-analysis. For the studies judged high quality, by a simple index developed by the authors, and adjusted for appropriate confounders, excess risk associated with alcohol drinking was 22% (95% CI = 9-37%; Q = 54, 18 d.f). In the dose-response meta-analysis among the drinkers, a 10% increased risk (95% CI = 5 – 15%; Q = 56, 32 d.f) for each additional 10g of ethanol consumption was observed. Findings were robust to study design and analytic approaches in the meta-analyses. There was no significant difference in risk by menopauseal status and alcoholic type. There was no evidence of publication bias (Key, J. et al., 2006). 3.7.1.1 Beer Global Report, 2007 Overall eleven cohort studies were identified, of which one study published three articles. Menopause age unspecified Seven studies were identified. A meta-analysis of three prospective studies showed a non- significant increased risk of invasive breast cancer, all menopausal status together (RR= 1.02 (95% CI = 0.99-1.06) per 100 g/day of beer consumption). No significant heterogeneity and no publication bias were found. Of the four studies were not included in the meta-analysis, one study showed a non-significant incrased risk, one showed a null association and one study showed a non-significnt inverse association with beer intake. Premenopause Two studies were identified. A meta-analysis of two prospective studies showed a similar result as for all menopausal status combined (RR= 1.04, 95%CI = 0.96-1.13) per 100 g/day of beer consumption). Postmenopause Eight studies were identified. A meta-analysis of five prospective studies did not provide evidence of association (RR= 1.00, 95% CI = 0.96-1.04, per 100 g/day of beer consumption). Three studies were not included in the meta-analysis; 2 studies reported non-significant positive associations and one study reported a null association. Update

60
Only three studies were identified (Tjonneland, A. et al., 2007 , BRE80013;Visvanathan, K. et al., 2007 , BRE80020;Zhang, S. M. et al., 2007 , BRE20023). All studies presented results for pre- and postmenopausal breast cancer combined. Menopause age unspecified Beer intake was not associated with increased risk of breast cancer in the CLUE II Study (Visvanathan, K. et al., 2007 , BRE80020) and the EPIC study (Tjonneland, A. et al., 2007 , BRE80013), while it was related to a significant increase of breast cancer risk in the Women’s Health Study (Zhang, S. M. et al., 2007 , BRE20023). A highest versus lowest forest plot was not performed, as the Women’s Health Study (Zhang, S. M. et al., 2007 , BRE20023) and the EPIC study (Tjonneland, A. et al., 2007 , BRE80013) had only performed dose-response analysis; and since the CLUE II study (Visvanathan, K. et al., 2007 , BRE80020) had only compared between drinkers and non-drinkers, a dose-response meta-analysis was also not performed. 3.7.1.2 Wines Global Report, 2007 Overall ten cohort studies had published 12 articles. One study reported three articles. Menopause age unspecified Six studies were identified. A meta-analysis on three prospective studies showed a non- significant increased risk of breast cancer, pre-and postmenopausal status combined (RR per one
time/day = 1.08, 95% CI= 0.96-1.22). No publication bias was found. Of the three studies not included in the meta-analysis, two studies showed positive associations (one significant) and one study reported no association. Wine intake was significantly positively related to mortality for breast cancer in one study. Premenopause A non-significant positive association with invasive breast cancer appeared in the subgroup meta-analyses of two studies (RR per 1 time/day= 1.36, 95% CI= 0.98-1.88). Postmenopause Six studies were identified. The meta-analysis of five studies showed a non-significant positive association (RR per 1 time /day= 1.14, 95% CI = 1.06-1.23). Non-significant positive association was observed in one study that was not included in the meta-analysis. Update Four studies were identified (Hirvonen, T. et al., 2006 , BRE80105;Tjonneland, A. et al., 2007 , BRE80013;Visvanathan, K. et al., 2007 , BRE80020;Zhang, S. M. et al., 2007 , BRE20023). Wine intake was positively associated with increased risk of breast cancer in the CLUE II Study (Visvanathan, K. et al., 2007 , BRE80020). No significant positive associations with intake of red or white wine were observed in the French SUVIMAX study (Hirvonen, T. et al., 2006 , BRE80105) and in the Women’s Health Study (Zhang, S. M. et

61
al., 2007 , BRE20023). The EPIC study reported no association (Tjonneland, A. et al., 2007 , BRE80013). A highest versus lowest forest plot was not performed, as the Women’s Health Study (Zhang, S. M. et al., 2007 , BRE20023) and the EPIC study (Tjonneland, A. et al., 2007 , BRE80013) had only performed dose-response analysis; in addition since the exposure was captured specifically as red and white wine in two studies, a dose-response meta-analysis was also not performed. 3.7.1.3 Spirits/liquors Global Report, 2007 Eleven cohorts had published 13 reports on spirits or liquors. Menopause age unspecified Six studies, eight reports were identified (Hiatt, R. A. et al., 1988 , BRE03888;Horn-Ross, P. L. et al., 2002 , BRE15412;Morch, L. S. et al., 2005 , BRE23480;Rohan, T. E. et al., 2000 , BRE16489;Willett, W. C. et al., 1987 , BRE13441;Zhang, Y. et al., 1999 , BRE13965). The NBSS had published three reports (Friedenreich, C. M. H. 1993 , BRE17508;Jain, M. G. F. 2000 , BRE17653;Rohan, T. E. et al., 2000 , BRE16489). A meta-analysis of three prospective studies (Friedenreich, C. M. H. 1993 , BRE17508;Rohan, T. E. et al., 2000 , BRE16489;Willett, W. C. et al., 1987 , BRE13441) showed a significant increased risk in breast cancer per 1 time/day consumption of spirits/liquor (RR= 1.18 (95% CI = 1.06-1.32). No significant heterogeneity and no publication bias were found. However, two of these three studies were from the same NBSS cohort (Friedenreich, C. M. H. 1993 , BRE17508;Rohan, T. E. et al., 2000 , BRE16489). Rohan et al. should have been selected instead as there were more cases in the analysis (1336 vs. 519 cases) (RR=1.09 vs. 1.14, both non-significant). Two of the four remaining studies reported significant positive associations (Horn-Ross, P. L. et al., 2002 , BRE15412;Morch, L. S. et al., 2005 , BRE23480), one study reported a significant inverse association (Zhang, Y. et al., 1999 , BRE13965) and one reported a non-significant increased risk (Hiatt, R. A. et al., 1988 , BRE03888). The NBSS also reported a significant negative association of spirits intake with breast cancer mortality (Jain, M. G. F. 2000 , BRE17653). Premenopause The meta-analysis of two studies (Friedenreich, C. M. H. 1993 , BRE17508;Petri, A. L. et al., 2004 , BRE16325) showed a positive but not significant association of premenopausal breast cancer with spirits/liquor intake (RR for increment of 1time/day= 1.17 (95% CI = 0.86-1.58)). Postmenopause The meta-analysis of five studies (Friedenreich, C. M. H. 1993 , BRE17508;Mattisson, I. W. 2004 , BRE17807;Petri, A. L. et al., 2004 , BRE16325;Tjonneland, A. et al., 2003 , BRE12350;van den Brandt, P. A. et al., 1995 , BRE12719) showed no association of
62
postmenopausal breast cancer with spirits/liquor intake (RR for increment of 1 time/day= 1.03, 95% CI = 0.94-1.13). The CPS- II cohort that was not included in the meta-analysis showed a significant positive association in the highest versus lowest comparison (RR for >=3 vs. 0
drinks/day=1.66, 95% CI = 1.12-2.46, Ptrend=0.51) (Feigelson, Heather et al., 2001 , BRE19514). Update All three studies identified during the update reported no associations - the CLUE II Study (Visvanathan, K. et al., 2007 , BRE80020), the Women’s Health Study (Zhang, S. M. et al., 2007 , BRE20023) and the EPIC study (Tjonneland, A. et al., 2007 , BRE80013). A highest versus lowest forest plot was not generated as two results were presented as dose-response slopes (Tjonneland, A. et al., 2007 , BRE80013;Zhang, S. M. et al., 2007 , BRE20023); and since the remaining study (Visvanathan, K. et al., 2007 , BRE80020) compared between drinkers and non-drinkers only, a dose-response meta-anaylsis was also not performed. 4. Food production, preservation, processing and preparation 4.4.2 Acrylamide Global Report, 2007 No association in a Sweden Cohort Study (Mucci, L. A. et al., 2005 , BRE23500). Update Breast cancer was not related with acrylamide intake in the Netherlands Cohort Study on Diet and Cancer (Hogervorst, J. G. et al., 2007 , BRE80145). Results were similar in the subgroup of non-smokers women compared to the entire population. 4.4.2.6. Broiled food Global Report, 2007 No association with broiled red meat consumption in a case-control study nested in the Nurses’ Health Cohort study (Gertig, D. M. et al., 1999 , BRE03215). Update Results from the cohort CLUE II (Gallicchio, L. et al., 2006 , BRE80112), Unites States suggested an increased risk of breast cancer in women with fast/intermediate phenotype related to the consumption of broiled food (RR ever vs never = 2.62; 95% CI = 1.06-6.46). 5. Dietary constituents 5.1.2. Dietary fibre Global Report, 2007

63
In the Global Report, a dose-response meta-analysis of two cohorts of women with unspecified menopausal age (Rohan, T. E. H. 1993 , BRE17965;Willett, W. C. et al., 1992 , BRE13438) did not show an association between fiber intake and breast cancer risk . Two other studies included in the highest vs. lowest forest plot showed non-significant inverse associations (Horn-Ross, P. L. et al., 2002 , BRE15412;Terry, P. et al., 2002 , BRE12199). Neither the dose-response (Graham, S. et al., 1992 , BRE03424;Kushi, L. H. et al., 1992 , BRE05141;Mattisson, I. et al., 2004 , BRE16042;Verhoeven, D. T. et al., 1997 , BRE12868) (RR = 0.94 (95% CI = 0.86-1.03) for 10g/day) nor the dicotomic analysis (Graham, S. et al., 1992 , BRE03424;Holmes, M. D. et al., 2004 , BRE04010;Kushi, L. H. et al., 1992 , BRE05141;Mattisson, I. et al., 2004 , BRE16042;Verhoeven, D. T. et al., 1997 , BRE12868) showed an association in the postmenopausal cohorts. The Nurses’ Health Study and Nurses’ Health Study II (NHS II) had also investigated the relation of adolescent dietary fibre consumption and breast cancer (Frazier, A. L. et al., 2003 , BRE02941;Frazier, A. L. et al., 2004 , BRE02942). A statistically non-significant decreased risk in premenopausal breast cancer for the highest versus lowest comparison was observed in NHS II (Frazier, A. L. et al., 2004 , BRE02942). Summary of results of the dose-response meta-analysis
Overall summary Overall 12 studies had published 20 reports on dietary fibre/crude fibre/non-starch polysaccharides. The Nurses’ Health Study and the Nurses’ Health Study II had respectively published five (Cho, E. et al., 2003 , BRE01651;Frazier, A. L. et al., 2003 , BRE02941;Giovannucci, E. et al., 1993 , BRE03262;Holmes, M. D. et al., 2004 , BRE04010;Willett, W. C. et al., 1992 , BRE13438) and one (Frazier, A. L. et al., 2004 , BRE02942) reports. The Iowa Women’s Health Study (Kushi, L. H. et al., 1992 , BRE05141;Kushi, L. H. et al., 1995 , BRE05142), the Canadian National Breast Screening Study (Rohan, T. E. H. 1993 , BRE17965;Terry, P. et al., 2002 , BRE12199) and the Malmo Diet and Cancer study (Mattisson, I. et al., 2004 , BRE16042;Sonestedt, E. et al., 2007 , BRE80147) had two reports each. In addition, one report each was published by the New York State Cohort (Graham, S. et al., 1992 , BRE03424), the Netherlands Cohort Study on Diet and Cancer (Verhoeven, D. T. et al., 1997 , BRE12868), the California Teachers Study (Horn-Ross, P. L. et al., 2002 , BRE15412), the ORDET study (Sieri, S. et al., 2002 , BRE20941), the Shanghai Breast Self-Examination study (Li, W. et al., 2005 , BRE23123), the Melbourne Collaborative Cohort Study (Giles, G. G. et al., 2006 , BRE22430), the UK Women’s Cohort Study (Cade, J. E. et al., 2007 , BRE20021) and the Swedish Mammography Cohort (Suzuki, R. et al., 2008 , BRE80148). Only three reports (Cade, J. E. et al., 2007 , BRE20021;Sonestedt, E. et al., 2007 , BRE80147;Suzuki, R. et al., 2008 , BRE80148) were newly identified during the update period. The remaining 17 reports were retrieved from the SLR database.
Postmenopausal breast cancer 2nd Report Updated meta-analysis Studies (n) 4 7 Cases (n) - 3340 RR (95% CI) for 10g/day 0.94 (0.86-1.03) 0.96 (0.91-1.01) Heterogeneity (I2) 47.1% (0-82.4%) 0%, p=0.577

64
Update Menopause age unspecified No new study found during the update period. Premenopause Only the UK Women’s Cohort Study (Cade, J. E. et al., 2007 , BRE20021) had reported new data during the update period. An inverse significant association with premenopausal breast cancer was observed in this study (232 cases; RR = 0.48, 95% CI = 0.24-0.96). Postmenopause Three cohort studies: the Swedish Mammography Cohort (Suzuki, R. et al., 2008 , BRE80148), the Malmo Diet and Cancer Study (Sonestedt, E. et al., 2007 , BRE80147) and the UK Women’s Cohort Study (Cade, J. E. et al., 2007 , BRE20021) had reported new data on dietary fibre and postmenopausal breast cancer during the update period. Studies selected for the dose-response meta-analysis All three new reports had provided appropriate format of data to be included in the dose-response meta-analysis. Among these was a report published by Sonestedt et al. in 2007 on the Malmo Diet and Cancer Study (Sonestedt, E. et al., 2007 , BRE80147). This report had replaced an older report published by Mattisson et al. in 2004 on the same study that was included in the previous analysis in 2005 (Mattisson, I. et al., 2004 , BRE16042) (RR = 0.94 vs. RR = 0.73). In addition, four (Graham, S. et al., 1992 , BRE03424;Kushi, L. H. et al., 1992 , BRE05141;Sieri, S. et al., 2002 , BRE20941;Verhoeven, D. T. et al., 1997 , BRE12868) out of the ten reports retrieved from the SLR database were also appropriate to include in the present analysis. Three reports were included previously in the SLR meta-analysis from the Global Report. The fourth study, the ORDET study (Sieri, S. et al., 2002 , BRE20941), was not included in the meta-analysis because dietary fiber was measured as non-starch polysaccharides; which was kept separate before has now been included in this analysis. Details on the inclusion and exclusion of studies for the analysis are provided in Table FI 1. Results As shown in Fig. FI 1, majority of the studies either observed a small decreased risk (Sieri, S. et al., 2002 , BRE20941;Sonestedt, E. et al., 2007 , BRE80147;Suzuki, R. et al., 2008 , BRE80148;Verhoeven, D. T. et al., 1997 , BRE12868) or no association (Graham, S. et al., 1992 , BRE03424;Kushi, L. H. et al., 1992 , BRE05141). Only the UK Women’s Cohort study reported an increased risk (Cade, J. E. et al., 2007 , BRE20021). Apart from the Swedish Mammography Cohort (Suzuki, R. et al., 2008 , BRE80148) with a borderline significant result, none of these studies had reported statistically significant results. Risk estimates ranged from 0.71 – 1.10 and the summary risk estimate was 0.96 (95% CI = 0.91-1.01) for each 10g/day increase in dietary fibre intake – very similar to the summary risk estimate 0.94 (95% CI = 0.86-1.03) in the Global Report. There is no suggestion of heterogeneity between the studies (I2 = 0%, P=0.577), which is different to the previous

65
analysis of four studies (I2 = 47.1%, 95% CI = 0-82.4%). There is also no suggestion of publication bias (Fig. FI 2) and none of the individual studies had any strong influence on the pooled result. The highest versus lowest forest plot also shows inconsistent results (Fig. FI3). Compared to the dose-response meta-analysis, one more report was included from the Nurses’ Health Study. It showed a small non-significant decreased risk (Holmes, M. D. et al., 2004 , BRE04010). None of the studies reported statistical significant results but similar to the dose-response analysis, majority of the studies had either observed a small decreased risk or no association. Only two studies (Cade, J. E. et al., 2007 , BRE20021;Graham, S. et al., 1992 , BRE03424) had reported an increased risk. For the studies that were not included in the meta-analysis, the Melbourne Collaborative Cohort Study (Giles, G. G. et al., 2006 , BRE22430) presented a RR of 1.08 (95% CI = 0.92-1.26) for an increase of one standard deviation in fibre intake. This study had also reported results by hormone receptor type. The relative risks were 1.36 in ER+/PR+ and 0.65 in ER-/PR- breast cancers, both statistically significant, while no association was shown in the tumour type of ER+/PR-. Non- statistically significant associations were reported by the Iowa Women’s Health Study (Kushi, L. H. et al., 1995 , BRE05142) (RR = 0.92 in ER+/PR+; RR = 0.98 in ER-/PR-; RR = 1.24 in ER+/PR-; RR = 1.48 in ER-/PR+). Subgroup analyses defined by alcohol intake, ER status and family history of breast cancer were conducted in the Swedish Mammography Cohort (Suzuki, R. et al., 2008 , BRE80148).The only significant result was the inverse association observed in ever users of postmenopausal hormones with ER+/PR+ breast cancer (243 cases RR Q4 vs. Q1=0.50; 95% CI = 0.31-0.80). In the Malmo Diet and Cancer Study, Sweden (Sonestedt, E. et al., 2007 , BRE80147), analyses were stratified by dietary modification before recruitment in the cohort and BMI. Significant inverse associations were observed only in the subgroup of women with BMI< 27 kg/m2 and in women that did not modify diet before baseline.

66
a)Table FI 1 Inclusion and exclusion of cohort studies on dietary fibre and postmenopausal breast cancer Author
Year WCRF Code Study name Study type
Included in the 2005
dose-response meta-analysis
Included in the 2008 dose-
response meta-analysis
Estimated values for meta-analysis Exclusion reasons
Included in the 2008 high vs. low
forest plot Remarks
Suzuki, R. et al. 2008 BRE80148
The Swedish Mammography Cohort
Prospective Cohort New Study Yes mean exposures Yes
Cade et al. 2007 BRE20021 UK Women's Cohort Study
Prospective Cohort New Study Yes mean exposures Yes
Sonestedt, E. et al. 2007 BRE80147
Malmo Diet and Cancer
Prospective Cohort New Study Yes Yes
mean/median exposure values were provided - used directly in estimating the dose-response slope
Giles, G. G. 2006 BRE22430
Melbourne Callaborative Cohort Study
Prospective Cohort No No
unknown unit of increment for the dietary fibre intake; only dose-response slope was provided - unable to include in the high/low plot No
Holmes, M. D. 2004 BRE04010
Nurses' Health Study
Prospective Cohort No No
missing no. of cases and non-cases and exposure levels; dose-response analysis was not conducted Yes
Mattisson, I. 2004 BRE16042 Malmo Diet and Cancer
Prospective Cohort Yes No
superceded by Sonestedt 2007, BRE80147; both high/low & dose-response plots were not done No
Sieri, Sabina 2002 BRE20941 ORDET study Nested Case Control No Yes
mean exposures, number of cases and controls Yes
exposure is NSP/dietary fibre, was able to estimate nos. of cases and controls as tertile of exposure was defined in the controls
Verhoeven, D. T. 1997 BRE12868
The Netherlands Cohort Study on diet and cancer Case Cohort Yes Yes Yes
mean/median exposure values were provided - used directly in estimating the dose-response slope

67
Kushi, L. H. 1995 BRE05142 Iowa Women's Health Study
Prospective Cohort No No
Cancer outcome by hormone receptor type only No
Graham, S. 1992 BRE03424 New York State Cohort, 1980
Prospective Cohort Yes Yes mean exposures Yes
Kushi L. H. 1992 BRE05141 Iowa Women's Health Study
Prospective Cohort Yes Yes Yes
mean/median exposure values were provided - used directly in estimating the dose-response slope
Willett, W. C. 1992 BRE13438
Nurses' Health Study
Prospective Cohort No No
missing nos. of cases and non-cases & superceded by Holmes 2004, BRE04010; both high/low & dose-response plots were not done No
Total no. of articles = 12
Total no. of cohort studies = 10
Total no. of studies included = 4
Total no. of studies included = 7
Total no. of studies included = 8
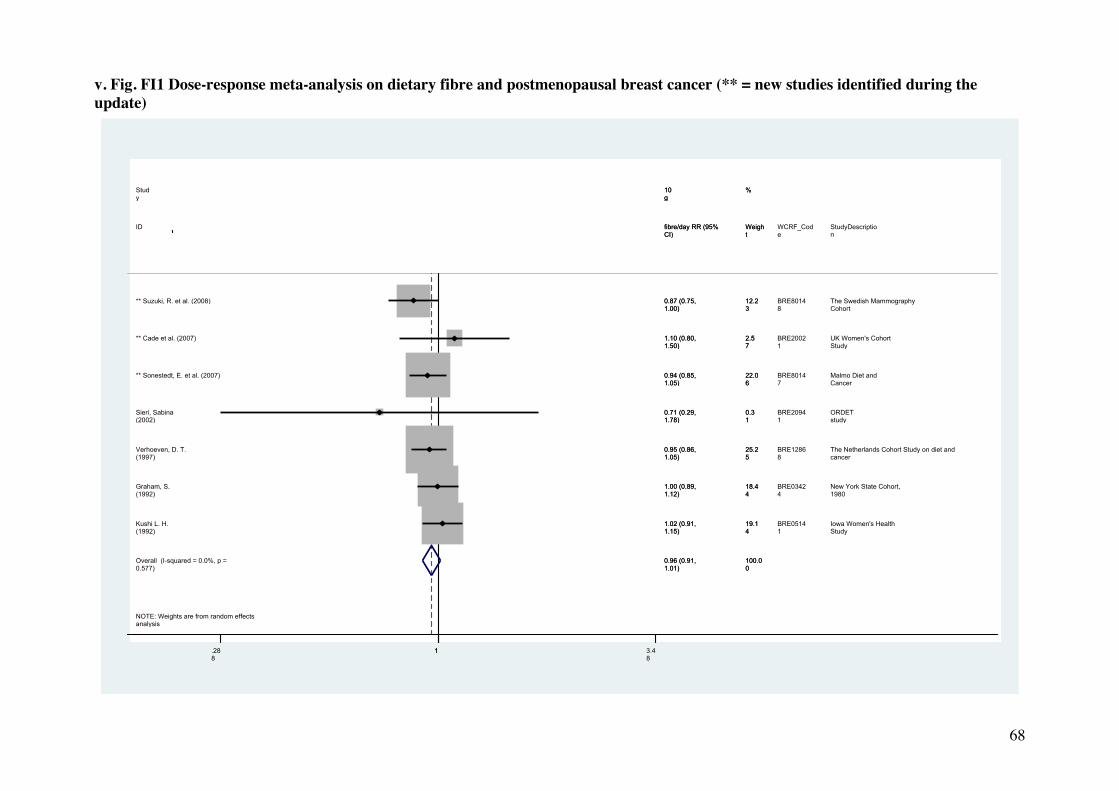
68
v. Fig. FI1 Dose-response meta-analysis on dietary fibre and postmenopausal breast cancer (** = new studies identified during the update)
NOTE: Weights are from random effects analysis
Overall (I-squared = 0.0%, p = 0.577)
Graham, S. (1992)
ID
** Suzuki, R. et al. (2008)
Kushi L. H. (1992)
** Cade et al. (2007)
Sieri, Sabina (2002)
** Sonestedt, E. et al. (2007)
Verhoeven, D. T. (1997)
Study
0.96 (0.91, 1.01)
1.00 (0.89, 1.12)
fibre/day RR (95% CI)
0.87 (0.75, 1.00)
1.02 (0.91, 1.15)
1.10 (0.80, 1.50)
0.71 (0.29, 1.78)
0.94 (0.85, 1.05)
0.95 (0.86, 1.05)
10g
100.00
18.44
Weight
12.23
19.14
2.57
0.31
22.06
25.25
%
BRE03424
WCRF_Code
BRE80148
BRE05141
BRE20021
BRE20941
BRE80147
BRE12868
New York State Cohort, 1980
StudyDescription
The Swedish Mammography Cohort
Iowa Women's Health Study
UK Women's Cohort Study
ORDET study
Malmo Diet and Cancer
The Netherlands Cohort Study on diet and cancer
0.96 (0.91, 1.01)
1.00 (0.89, 1.12)
fibre/day RR (95% CI)
0.87 (0.75, 1.00)
1.02 (0.91, 1.15)
1.10 (0.80, 1.50)
0.71 (0.29, 1.78)
0.94 (0.85, 1.05)
0.95 (0.86, 1.05)
10g
100.00
18.44
Weight
12.23
19.14
2.57
0.31
22.06
25.25
%
1 .288 1 3.4
8
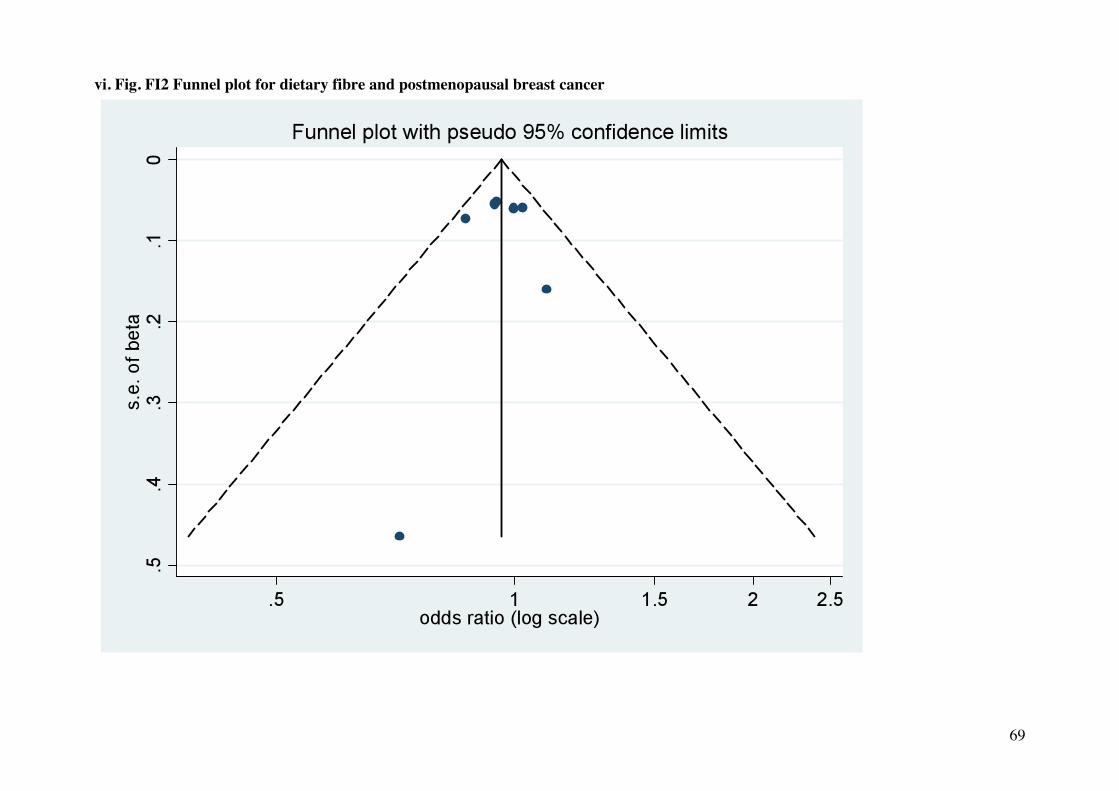
69
vi. Fig. FI2 Funnel plot for dietary fibre and postmenopausal breast cancer
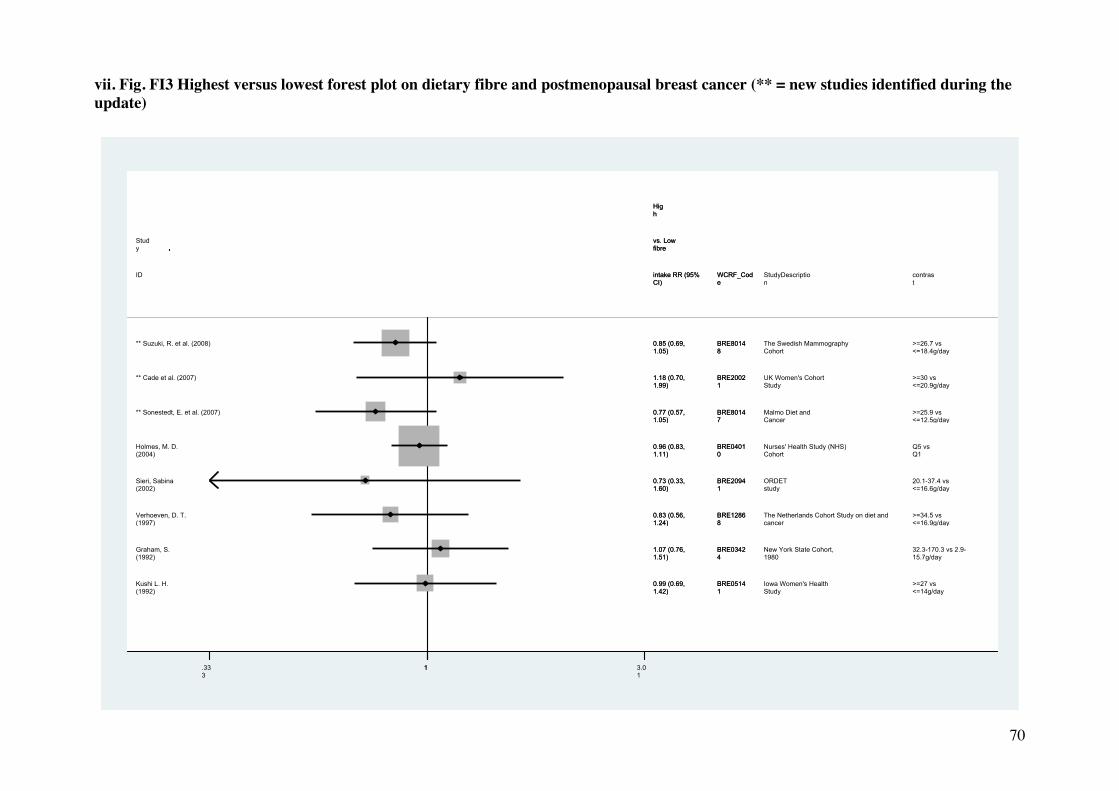
70
vii. Fig. FI3 Highest versus lowest forest plot on dietary fibre and postmenopausal breast cancer (** = new studies identified during the update)
** Suzuki, R. et al. (2008)
** Cade et al. (2007)
** Sonestedt, E. et al. (2007)
Holmes, M. D. (2004)
Sieri, Sabina (2002) Verhoeven, D. T. (1997) Graham, S. (1992) Kushi L. H. (1992)
ID
Study
0.85 (0.69, 1.05) 1.18 (0.70, 1.99)
0.77 (0.57, 1.05)
0.96 (0.83, 1.11)
0.73 (0.33, 1.60) 0.83 (0.56, 1.24) 1.07 (0.76, 1.51) 0.99 (0.69, 1.42)
intake RR (95% CI)
vs. Low fibre
High
BRE80148 BRE20021
BRE80147
BRE04010
BRE20941 BRE12868 BRE03424 BRE05141
WCRF_Code
The Swedish Mammography Cohort UK Women's Cohort Study
Malmo Diet and Cancer
Nurses' Health Study (NHS) Cohort
ORDET study The Netherlands Cohort Study on diet and cancer New York State Cohort, 1980 Iowa Women's Health Study
StudyDescription
>=26.7 vs <=18.4g/day >=30 vs <=20.9g/day
>=25.9 vs <=12.5g/day
Q5 vs Q1
20.1-37.4 vs <=16.6g/day >=34.5 vs <=16.9g/day 32.3-170.3 vs 2.9-15.7g/day >=27 vs <=14g/day
contrast
0.85 (0.69, 1.05) 1.18 (0.70, 1.99)
0.77 (0.57, 1.05)
0.96 (0.83, 1.11)
0.73 (0.33, 1.60) 0.83 (0.56, 1.24) 1.07 (0.76, 1.51) 0.99 (0.69, 1.42)
intake RR (95% CI)
vs. Low fibre
High
BRE80148 BRE20021
BRE80147
BRE04010
BRE20941 BRE12868 BRE03424 BRE05141
WCRF_Code
1 .333 1 3.0
1
71
5.1.2 Vegetable fibre Global Report, 2007 No association was reported in the Canadian National Breast Screening Study (menopause age unspecified) (Terry, P. et al., 2002 , BRE12199), the Nurses’ Health Study (premenopause and menopause age unspecified respectively in two reports) (Cho, E. et al., 2003 , BRE01651;Holmes, M. D. et al., 2004 , BRE04010) and the Melbourne Collaborative Cohort Study on postmenopausal women (Giles, G. G. et al., 2006 , BRE22430). RR ranged from 0.9 - 1.07 for the highest versus lowest comparisons and none of these results reached statistical significance. The Melbourne Collaborative Cohort Study (Giles, G. G. et al., 2006 , BRE22430) stratified the results by hormone receptor status. For ER-PR- group, they gave a RR of 0.83 but the result was not significant (95% CI = 0.58-1.19). For the other two groups (ER+PR+ and ER+PR-), they provided RRs of 1.13 and 1.14, respectively and both results were not statistically significant. Update Two prospective cohort studies were identified during the update period (Cade, J. E. et al., 2007 , BRE20021;Suzuki, R. et al., 2008 , BRE80148). In the Swedish Mammorgraphy Cohort (Suzuki, R. et al., 2008 , BRE80148), they did not observe any inverse association of vegetable fibre intake with the overall risk (Ptrend = 0.31) or any subtypes of breast cancer. However among postmenopausal hormone never users, they found a statistically significant inverse association of vegetable fibre with all breast tumours (Pinteractions = 0.006). In addition, there was a statistically significant inverse association with vegetable fibre with ER+PR+ tumours only (Ptrend = 0.023). The UK Women’s Health Study (Cade, J. E. et al., 2007 , BRE20021) reported no significant relationships between breast cancer and fibre from vegetables among pre- and postmenopausal women (RR >7 vs. <3 g/day = 1.26, 95% CI = 0.73-2.18; RR >7 vs. <3 g/day = 1.20, 95% CI = 0.74-1.94, respectively). 5.1.2.1 Cereal fibre Global Report, 2007 No association was reported in the Canadian National Breast Screening Study (menopause age unspecified) (Terry, P. et al., 2002 , BRE12199), the Nurses’ Health Study (premenopausal and menopause age unspecified respectively in two reports) (Cho, E. et al., 2003 , BRE01651;Holmes, M. D. et al., 2004 , BRE04010) and the Melbourne Collaborative Cohort Study on postmenopausal women (Giles, G. G. et al., 2006 , BRE22430). RR ranged from 0.9 - 1.08 for the highest versus lowest comparisons and none of these results reached statistical significance. The Melbourne Collaborative Study had also observed a non-significant increased risk in the ER+/PR+ and ER+/PR- tumour type (RR for 1S.D increase=1.17, 95% CI = 0.98-1.39; RR for 1 S.D. increase =1.24, 95% CI = 0.83-1.86 respectively), but the opposite was reported in the ER-/PR- tumour type (RR for 1S.D increase=0.78, 95% CI = 0.55-1.11). Update

72
Two prospective cohort studies were identified during the update period (Cade, J. E. et al., 2007 , BRE20021;Suzuki, R. et al., 2008 , BRE80148). The UK Women’s Cohort Study observed an approximately 40% decreased risk in premenopausal women (232 cases) and a small increased risk in postmenopausal women. The results were not statistically significant (RR for >=13 vs. <=3.9g/day=0.59, 95% CI = 0.32-1.1; RR for
>=13 vs. <=3.9g/day=1.15, 95% CI = 0.68-1.94 respectively, but in the former association, a negative dose-response relationship was presented (Ptrend=0.05) (Cade, J. E. et al., 2007 , BRE20021). The Swedish Mammography Screening Cohort (Suzuki, R. et al., 2008 , BRE80148) examined the relationship between cereal fibre and postmenopausal breast cancer risk by receptor-defined subtype. They observed a non-significant inverse association between cereal fibre intake and overall invasive breast cancer risk, with a RR >19 vs. <12g/day = 0.91 (95% CI = 0.75-1.11). For ER+PR+, ER+PR- and ER-PR-, they obtained RRs of 0.99 (95% CI = 0.77-1.29), 0.86 (95% CI = 0.56-1.32) and 0.69 (95% CI = 0.39-1.24), respectively. When the result was stratified by postmenopausal hormone (PMH) use, the statistically significant inverse association of cereal fibre with all breast cancer was confined to PMH users (RR = 0.44, 95% CI = 0.31-0.63, Ptrend = <0.0001). In addition, although the inverse dose-response association was strongly statistically significant for ER+PR+ tumours only (Ptrend = 0.001), non-significant decreased risk was observed in the ER+/PR- and the ER-/PR- tumour type (RR for >=19.1 vs. <=11.9g/day=0.86, 95% CI=0.56-1.32; RR for >=19.1 vs. <=11.9g/day=0.69, 95% CI=0.39-1.24 respectively). No statistically significant heterogeneity across tumour subtypes was found. 5.1.2.3 Fruit fibre Global Report, 2007 No association was reported in the Canadian National Breast Screening Study (menopause age unspecified) (Terry, P. et al., 2002 , BRE12199), the Nurses’ Health Study (premenopausal and menopause age unspecified repectively in two reports) (Cho, E. et al., 2003 , BRE01651;Holmes, M. D. et al., 2004 , BRE04010) and the Melbourne Collaborative Cohort Study on postmenopausal women (Giles, G. G. et al., 2006 , BRE22430). Update Two prospective cohort studies were identified during the update period (Cade, J. E. et al., 2007 , BRE20021;Suzuki, R. et al., 2008 , BRE80148). The Swedish Mammography Screening Cohort (Suzuki, R. et al., 2008 , BRE80148) reported statistically significant associations between fruit fibre intake and the risk of overall invasive cancer and of ER+PR+ cancer; the multivariate-adjusted RRs for the highest vs. lowest quintile for all tumours was 0.66 (95% CI = 0.47-0.93, Ptrend = 0.007) and for ER+PR+ tumours it was 0.62 (95% CI = 0.39-0.97), Ptrend = 0.022). Among PMH never users, it showed a statistically significant inverse association of fruit fibre with ER+PR+ tumours only (RR >5.1
vs. <1.7g/day = 0.45, 95% CI = 0.25-0.81, Ptrend = 0.010) and there was no significant heterogeneity across the tumour subtypes.

73
The results from the UK Women’s Health Cohort Study (Cade, J. E. et al., 2007 , BRE20021) showed that fibre from fruit had a borderline statistically significant inverse relationship with premenopausal breast cancer (RR >6 vs. <2 g/day = 0.81, 95% CI = 0.44-1.49, Ptrend = 0.09). No association was found in postmenopausal women.
5.1.5 Glycemic index Global Report, 2007 Seven prospective cohort studies were reported previously in the Global Report, 2007 (Cho, E. et al., 2003 , BRE01651;Giles, G. G. et al., 2006 , BRE22430;Higginbotham, S. et al., 2004 , BRE15353;Holmes, M. D. et al., 2004 , BRE04010;Jonas, C. R. et al., 2003 , BRE04456;Nielsen, T. G. et al., 2005 , BRE23581;Silvera, S. A. et al., 2005 , BRE24119); from which one, four and six studies reported results in menopause age unspecified, pre- and postmenopausal women respectively. In addition, the Nurses’ Health Study II had published an article on adolescent glycemic index and breast cancer (Frazier, A. L. et al., 2004 , BRE02942). Menopause age unspecified A statistically non-significant decreased risk was reported by the Canadian National Breast Screening Study (NBSS) (Silvera, S. A. et al., 2005 , BRE24119). Premenopause No association was observed between glycemic index and premenopausal breast cancer in the Nurses’ Health Study (Holmes, M. D. et al., 2004 , BRE04010); while the Women’s Health Study (Higginbotham, S. et al., 2004 , BRE15353) reported a non-significant increased risk (RR highest vs. lowest=1.29, 95% CI = 0.92-1.81) and the NBSS observed a non-significant protective effect (RR for >=96.1 vs. <=63 = 0.78, 95% CI = 0.52-1.16) (Silvera, S. A. et al., 2005 , BRE24119). No association was observed in neither lean nor overweight premenopausal women in the Nurses’ Health Study and Nurses’ Health Study II (Cho, E. et al., 2003 , BRE01651;Holmes, M. D. et al., 2004 , BRE04010) after stratification by BMI. In the Nurses’ Health study II, it showed an increased risk of premenopausal breast cancer was associated with high glycemic index diets during adolescence (Frazier, A. L. et al., 2004 , BRE02942). Postmenopause A statistically significant positive association of glycemic index with postmenopausal breast cancer was reported in the Nurses’ Health Study (Holmes, M. D. et al., 2004 , BRE04010) and the NBSS (Silvera, S. A. et al., 2005 , BRE24119) (RR for highest vs. lowest =1.15, 95%CI=1.02-1.30; RR for highest vs. lowest =1.87, 95%CI = 1.18-2.97 respectively), whereas an non-significant inverse association was observed in the WHS (Higginbotham, S. et al., 2004 , BRE15353) and the Diet, Cancer and Health Study from Denmark (Nielsen, T. G. et al., 2005 , BRE23581). The remaining two studies showed no association (Giles, G. G. et al., 2006 , BRE22430;Jonas, C. R. et al., 2003 , BRE04456). Update

74
One study investigated glycemic index in relation to breast cancer in pre- and postmenopausal breast cancer, namely the ORDET study (Sieri, S. et al., 2007 , BRE80142). In the ORDET study (Sieri, S. et al., 2007 , BRE80142) (289 cases) high glycemic index was related to an increased risk of breast cancer in premenopausal women (RR>57.6 vs <53.4=1.82, 95% CI = 1.01-3.27) but not in postmenopausal women. 5.1.5 Glycemic load The seven prospective cohort studies reported data previously in the Global Report, 2007 on glycemic index, as well as glycemic load (Cho, E. et al., 2003 , BRE01651;Giles, G. G. et al., 2006 , BRE22430;Higginbotham, S. et al., 2004 , BRE15353;Holmes, M. D. et al., 2004 , BRE04010;Jonas, C. R. et al., 2003 , BRE04456;Nielsen, T. G. et al., 2005 , BRE23581;Silvera, S. A. et al., 2005 , BRE24119); from which one, four and six studies reported results in menopause age unspecified, pre- and postmenopausal women respectively. In addition, the Nurses’ Health Study II had published an article on adolescent glycemic load and breast cancer (Frazier, A. L. et al., 2004 , BRE02942). Menopause age unspecified No association was observed in the NBSS with glycemic load (RR highest vs. lowest = 0.95, 95% CI = 0.79-1.14) (Silvera, S. A. et al., 2005 , BRE24119). Premenopause Four studies reported lack of association: the Nurses’ Health Study (Holmes, M. D. et al., 2004 , BRE04010), the Nurses’ Health Study II (Cho, E. et al., 2003 , BRE01651), the WHS (Higginbotham, S. et al., 2004 , BRE15353) and the NBSS study (Silvera, S. A. et al., 2005 , BRE24119). Risk estimates ranged from 0.87 to 1.27 but none of the results were statistically significant. No association was reported in the Nurses’ Health Study II with high glycemic load diets during adolescence (RR highest vs. lowest = 1.23, 95% CI = 0.91-1.67 respectively) (Frazier, A. L. et al., 2004 , BRE02942). Postmenopause Six studies reported no association: the Nurses’ Health Study (Holmes, M. D. et al., 2004 , BRE04010), the Diet, Cancer and Health Study from Denmark (Nielsen, T. G. et al., 2005 , BRE23581), the WHS (Higginbotham, S. et al., 2004 , BRE15353), the NBSS study (Silvera, S. A. et al., 2005 , BRE24119), the CPS-II (Jonas, C. R. et al., 2003 , BRE04456) and the MCCS (Giles, G. G. et al., 2006 , BRE22430). Risk estimates ranged from 0.81 to 1.19 but all the results were statistically non-significant. Update One study investigated glycemic load in relation to breast cancer (Sieri, S. et al., 2007 , BRE80142).

75
Glycemic load was significantly positively related to premenopausal breast cancer risk (RR>138.8 vs <103.25=3.89, 95% CI = 1.81-8.34) and the risk estimate almost reached statistical significance among postmenopausal women (RR>133.8 vs <103.25=1.67, 95% CI = 0.80-3.46). Published meta-analysis A meta-analysis including results of eight cohort studies investigating the relationship of glycemic index/glycemic load and breast cancer was published in March 2008. The authors reported an overall RR highest vs. lowest of 1.06 (95% CI = 0.98-1.15) for glycemic index and 0.99 (95% CI = 0.94-1.06) for glycemic load (Barclay, A. W. et al., 2008). 5.2 Total fat (Lipids, as nutrients in the Global Report) Global Report, 2007 Menopause age unspecified Fourteen reports were retrieved during the SLR (Bingham, S. A. et al., 2003 , BRE14387;Byrne, C. et al., 1996 , BRE05719;Gaard, M. T. 1995 , BRE17516;Giovannucci, E. et al., 1993 , BRE03262;Horn-Ross, P. L. et al., 2002 , BRE15412;Howe, G. R. F. 1991 , BRE17622;Jones, D. Y. et al., 1987 , BRE04461;Kinlen, L. J. 1982 , BRE17702;Knekt, P. et al., 1990 , BRE04898;Kushi, L. H. et al., 1995 , BRE05142;Thiebaut, A. C. and Clavel-Chapelon, F. 2001 , BRE12244;Toniolo, P. et al., 1994 , BRE12398;Willett, W. C. et al., 1987 , BRE13442;Wolk, A. et al., 1998 , BRE13548). The dose- response meta-analysis of 4 cohort studies found an overall RR of 1.01 (95% CI = 0.96-1.07) for 20 g/day increase of lipid intake, but results were heterogeneous (Gaard, M. T. 1995 , BRE17516;Howe, G. R. F. 1991 , BRE17622;Jones, D. Y. et al., 1987 , BRE04461;Willett, W. C. et al., 1992 , BRE13438). Ten did not enter the meta-analysis with half showing no association and half showing non-significant positive associations (Bingham, S. A. et al., 2003 , BRE14387;Byrne, C. et al., 1996 , BRE05719;Giovannucci, E. et al., 1993 , BRE03262;Horn-Ross, P. L. et al., 2002 , BRE15412;Kinlen, L. J. 1982 , BRE17702;Knekt, P. et al., 1990 , BRE04898;Thiebaut, A. C. and Clavel-Chapelon, F. 2001 , BRE12244;Toniolo, P. et al., 1994 , BRE12398;van den Brandt, P. A. et al., 1993 , BRE16919;Wolk, A. et al., 1998 , BRE13548). The study of Bingham et al. (Bingham, S. A. et al., 2003 , BRE14387) showed a significant increased risk when analysed data that were collected from food diaries but no association when data were collected from food frequency questionnaire, suggesting a major misclassification problem when using only FFQ.
One study from Britain (Kinlen, L. J. 1982 , BRE17702) reported a standardised mortality ratio of 1.33 when comparing not known vs. 70g/week.
The analysis was stratified by hormone receptor status in a multiethnic cohort study. Non-significant positive associations was observed in ER+/PR+ tumours (Kushi, L. H. et al., 1995 , BRE05142). Non-significant inverse associations were observed among ER-/PR- and ER-/PR+ tumours. The association with ER+/PR- tumors was null.
Eleven studies were included in the highest versus lowest forest plot (Bingham, S. A. et al., 2003 , BRE14387;Byrne, C. et al., 1996 , BRE05719;Gaard, M. T. 1995 , BRE17516;Horn-Ross, P. L. et al., 2002 , BRE15412;Howe, G. R. F. 1991 , BRE17622;Jones, D. Y. et al., 1987 , BRE04461;Thiebaut, A. C. and Clavel-Chapelon, F. 2001 , BRE12244;Toniolo, P. et

76
al., 1994 , BRE12398;Willett, W. C. et al., 1992 , BRE13438;Wolk, A. et al., 1998 , BRE13548). Six of them showed non-significant increased risk in breast cancer, three showed non-significant decreased risk (Horn-Ross, P. L. et al., 2002 , BRE15412;Jones, D. Y. et al., 1987 , BRE04461;Willett, W. C. et al., 1992 , BRE13438) and two showed no association (Byrne, C. et al., 1996 , BRE05719;Wolk, A. et al., 1998 , BRE13548). Premenopause No association was reported in the Nurses’ Health Study (Willett, W. C. et al., 1987 , BRE13442). Postmenopause Twelve reports reported specifically on postmenopausal breast cancer and total fat intake (Barrett-Connor, E. and Friedlander, N. J. 1993 , BRE00581;Byrne, C. et al., 2002 , BRE01315;Graham, S. et al., 1992 , BRE03424;Howe, G. R. F. 1991 , BRE17622;Kushi, L. H. et al., 1992 , BRE05141;Mattisson, I. W. 2004 , BRE17807;Sieri, S. et al., 2002 , BRE20941;van den Brandt, P. A. et al., 1993 , BRE16919;Voorrips, L. E. et al., 2002 , BRE13011;Willett, W. C. et al., 1987 , BRE13442;Willett, W. C. et al., 1992 , BRE13438;Wirfalt, E. et al., 2002 , BRE13504). No association was observed in a dose-response meta-analysis of five cohort studies (RR= 1.06, 95% CI=0.99-1.14) (Barrett-Connor, E. and Friedlander, N. J. 1993 , BRE00581;Graham, S. et al., 1992 , BRE03424;Howe, G. R. F. 1991 , BRE17622;Kushi, L. H. et al., 1992 , BRE05141;Mattisson, I. W. 2004 , BRE17807) with moderate heterogeneity. Not included in the meta-analysis were the Italian small ORDET study (Sieri, S. et al., 2002 , BRE20941) (reported a significant increasing risk associated to higher intake of total fats) and three reports of the Nurses’ Health Study that reported no association (Byrne, C. et al., 2002 , BRE01315;Willett, W. C. et al., 1987 , BRE13442;Willett, W. C. et al., 1992 , BRE13438). In the Iowa cohort study (Kushi, L. H. et al., 1992 , BRE05141) non-significant decreased risk for ER-/PR+ and ER-/PR- and non-significant increased risk for ER+/PR- and ER+/PR+ were reported. Two reports of the Netherlands Cohort Study on Diet and Cancer gave RRs of 1.08 (95% CI = 0.73-1.59) and 1.16 (95% CI = 0.87-1.56) respectively (van den Brandt, P. A. et al., 1993 , BRE16919;Voorrips, L. E. et al., 2002 , BRE13011). Seven cohort studies were included in the highest vs. lowest forest plot (Byrne, C. et al., 2002 , BRE01315;Graham, S. et al., 1992 , BRE03424;Kushi, L. H. et al., 1992 , BRE05141;Mattisson, I. W. 2004 , BRE17807;Sieri, S. et al., 2002 , BRE20941;Voorrips, L. E. et al., 2002 , BRE13011;Willett, W. C. et al., 1992 , BRE13438), with four showed positive associations (one of which being statistically significant (Kushi, L. H. et al., 1992 , BRE05141)). Two studies reported negative associations and one reported no association. Update Two new prospective cohort studies had been identified during the update period: the Women’s Lifestyle and Health Study (Lof, M. et al., 2007 , BRE80144) (974 cases) and Malmo Diet and Cancer Cohort from Sweden (component study of the EPIC) (Sonestedt, E. et al., 2007 , BRE80147) (428cases). Both articles reported results on breast cancer with menopausal age unspecified; the Malmo Diet and Cancer Cohort had also reported results on postmenopausal women. For menopausal age unspecified group, 16 reports in total were retrieved from both the SLR and update; whereas for pre- and postmenopausal group, there were three reports and fourteen reports retrieved from the SLR and update, respectively. No

77
dose-response meta-analysis was conducted due to the lack of new studies identified during the update period. Menopause age unspecified There were sixteen reports in total (from both the SLR and update). Of those sixteen reports, twelve were included in the highest vs. lowest forest plot (see Fig. F1): the Women’s Lifestyle and Health Study (Lof, M. et al., 2007 , BRE80144) (974 cases); the EPIC-UK nested case-control study (Bingham, S. A. et al., 2003 , BRE14387) (168 cases); California Teachers Study (Horn-Ross, P. L. et al., 2002 , BRE15412) (711 cases); E3N-EPIC from France (Thiebaut, A. C. and Clavel-Chapelon, F. 2001 , BRE12244) (838 cases); the Swedish Mammography Cohort (Wolk, A. et al., 1998 , BRE13548) (674 cases); Norway National Health Screening Service Cohort (Gaard, M. T. 1995 , BRE17516) (248 cases); New York Women’s Health nested case-control study (Toniolo, P. et al., 1994 , BRE12398) (180 cases); the Nurses’ Health Study (Willett, W. C. et al., 1992 , BRE13438) (1439 cases); Mobile Clinic Health Examination Survey from Finland (Knekt, P. et al., 1990 , BRE04898) (54 cases); NHANES I (Jones, D. Y. et al., 1987 , BRE04461) (99 cases); The NHEFS cohort (Byrne, C. et al., 1996 , BRE05719) (53 cases) and the NBSS nested case-control study (Howe, G. R. F. 1991 , BRE17622) (519 cases). Four were excluded from the analysis due to the following reasons: one historical cohort study provided data on mortality (Kinlen, L. J. 1982 , BRE17702); two were Nurses’ Health Study (Giovannucci, E. et al., 1993 , BRE03262;Willett, W. C. et al., 1987 , BRE13442) and superseded by Willett WC et al. (Willett, W. C. et al., 1992 , BRE13438) as it had larger number of cases; the Iowa Women’s Health Study only provided data on ER/PR subgroups (Kushi, L. H. et al., 1995 , BRE05142). Six studies showed an increased risk of breast cancer with high total fat intake (Bingham, S. A. et al., 2003 , BRE14387;Gaard, M. T. 1995 , BRE17516;Howe, G. R. F. 1991 , BRE17622;Knekt, P. et al., 1990 , BRE04898;Thiebaut, A. C. and Clavel-Chapelon, F. 2001 , BRE12244;Toniolo, P. et al., 1994 , BRE12398); however none of them was significant. A decreased risk was observed in three studies (Horn-Ross, P. L. et al., 2002 , BRE15412;Jones, D. Y. et al., 1987 , BRE04461;Willett, W. C. et al., 1992 , BRE13438) with one study showed significant result (Jones, D. Y. et al., 1987 , BRE04461) (RR >74.0 g/day vs.<37.9 g/day = 0.34, 95% CI = 0.16-0.73). The remaining three studies showed no associations between total fat and breast cancer (Byrne, C. et al., 1996 , BRE05719;Lof, M. et al., 2007 , BRE80144;Wolk, A. et al., 1998 , BRE13548), including the new study identified during the update period (Lof, M. et al., 2007 , BRE80144). Premenopause In total, there were three studies (from the SLR: (Willett, W. C. et al., 1987 , BRE13442;Willett, W. C. et al., 1992 , BRE13438) and update: (Lof, M. et al., 2007 , BRE80144)). Of those three studies, two were included in the highest vs. lowest plot (see Fig. F1) (Lof, M. et al., 2007 , BRE80144;Willett, W. C. et al., 1992 , BRE13438). One was excluded (Willett, W. C. et al., 1987 , BRE13442) as it was a duplicate of the Nurses’ Health Study and replaced by a more recent report in 1992 (Willett, W. C. et al., 1992 , BRE13438). The Women’s Lifestyle and Health Study (Lof, M. et al., 2007 , BRE80144) reported a non-significant increased risk in premenopausal breast cancer. However, the Nurses’ Health Study

78
reported a small statistically non-significant negative association (Willett, W. C. et al., 1992 , BRE13438). Postmenopause Altogether there were fourteen reports (from both SLR and update). Seven out of fourteen articles were included in the highest vs. lowest forest plot (see Fig. F1), including the two new articles (Lof, M. et al., 2007 , BRE80144;Sonestedt, E. et al., 2007 , BRE80147) (974 cases and 428 cases), the Nurses’ Health Study (Byrne, C. et al., 2002 , BRE01315) (1071 cases), the ORDET nested case-control study from Italy (Sieri, S. et al., 2002 , BRE20941) (56 cases), the Netherlands Cohort Study on diet and cancer (Voorrips, L. E. et al., 2002 , BRE13011) (1812 cases), New York State Cohort (Graham, S. et al., 1992 , BRE03424) (395 cases) and the Iowa Women’s Health Study (Kushi, L. H. et al., 1992 , BRE05141) (459 cases). Seven reports were excluded: two were the Malmo Diet and Cancer cohort (Mattisson, I. W. 2004 , BRE17807;Wirfalt, E. et al., 2002 , BRE13504) and they were replaced by a more recent article (Sonestedt, E. et al., 2007 , BRE80147); two reports were from the Nurses’ Health Study (Willett, W. C. et al., 1987 , BRE13442;Willett, W. C. et al., 1992 , BRE13438) and they were replaced by Bryne C (Byrne, C. et al., 2002 , BRE01315) which is a more recent article; two articles reported on continuous data only: the NBSS nested case-control study (Howe, G. R. F. 1991 , BRE17622) and Rancho Bernardo cohort from the US (Barrett-Connor, E. and Friedlander, N. J. 1993 , BRE00581). The Netherlands Cohort Study on Diet and cancer published in 1993 (van den Brandt, P. A. et al., 1993 , BRE16919) was also replaced by Voorips L et al. (Voorrips, L. E. et al., 2002 , BRE13011) which is a more recent article. Four studies reported an elevated risk in breast cancer with an increased intake of total fat among postmenopausal women (Kushi, L. H. et al., 1992 , BRE05141;Sieri, S. et al., 2002 , BRE20941;Sonestedt, E. et al., 2007 , BRE80147;Voorrips, L. E. et al., 2002 , BRE13011) and one of them was significant (which came from the ORDET study) (RR <=146.6 vs. <54.3 g/day = 3.47, 95% CI = 1.43-8.43) (Sieri, S. et al., 2002 , BRE20941). The Women’s Lifestyle and Health Study (Lof, M. et al., 2007 , BRE80144) showed a non-significant negative relationship between total fat and breast cancer. The Nurses’ Health Study reported a small statistically non-significant decreased risk in breast cancer (Byrne, C. et al., 2002 , BRE01315) and the New York State Cohort showed no association (Graham, S. et al., 1992 , BRE03424). In the Malmo Diet and Cancer study (Sonestedt, E. et al., 2007 , BRE80147) (428 cases), an increased risk associated with high fat intake was observed in women with BMI<27 kg/m2 (Sonestedt, E. et al., 2007 , BRE80147) (276 cases) (RR 96 vs 62 g/day=1.59; 95% CI = 1.09-2.32). Regarding n-6 fatty acids intake, it was found to be positively related to breast cancer risk only in postmenopausal women with BMI<27kg/m2 (RR 14.1 vs 6.6 g/day =1.84; 95% CI = 1.4-2.71) and in women who did not modified dietary habits before baseline.
Change in fat intake and breast cancer The Women’s Health Initiative Dietary Modification Randomised Controlled Trial (Prentice, R. L. et al., 2006 , BRE80155) was designed to promote dietary change with the goals of reducing intake of total fat to 20% of energy and increasing consumption of vegetables and

79
fruit to at least 5 servings daily and grains to at least 6 servings daily. The low-fat dietary pattern did not result in a statistically significant reduction in invasive breast cancer risk over an 8.1- year average follow-up period (655 breast cancer cases in the intervention group and 1072 in the comparison group; RR = 0.91, 95% CI = 0.83-1.01 for the comparison between the 2 groups). For women with more than or equal to 36.8% energy from fat at baseline, a statistically significant decreased in breast cancer risk was observed in the intervention group versus the comparison group (RR = 0.78, 95% CI = 0.64-0.95). Similar results were reported in women with more than or equal to 76 g/day total fat intake at baseline (RR = 0.79, 95% CI = 0.64-0.96). See point 1.4b Diet low in fat, high in fibre, fruits, and vegetables for more detailed results.

80
viii. Fig TF1. Highest vs. lowest forest plot on total fat and breast cancer, by menopausal status (** = new studies identified during the update)_
.
.
.
Menopausal age unspecified ** Löf, M. et al. (2007) Bingham, S.A. (2003) Horn-Ross, P.L. (2002) Thiebaut, A. C. (2001) Wolk, A. (1998) Byrne, C. (1996) Gaard, (1995) Toniolo, P. (1994) Willett, W. C. (1992) Howe, G. R. (1991) Knekt, P. (1990) Jones, D. Y. (1987) Premenopausal ** Löf, M. et al. (2007) Willett, W. C. (1992) Post menopausal ** Löf, M. et al. (2007) ** Sonestedt, E. et al. (2007) Byrne, C. (2002) Sieri, Sabina (2002) Voorrips, L. E. (2002) Graham, S. (1992) Kushi L. H. (1992)
ID Study
1.02 (0.72, 1.45) 1.79 (0.89, 3.58) 0.80 (0.57, 1.13) 1.37 (0.99, 1.89) 1.00 (0.76, 1.32) 0.98 (0.42, 2.30) 1.25 (0.86, 1.81) 1.49 (0.89, 2.49) 0.90 (0.76, 1.06) 1.30 (0.90, 1.88) 1.72 (0.61, 4.83) 0.34 (0.16, 0.73)
1.46 (0.87, 2.46) 0.96 (0.73, 1.26)
0.76 (0.47, 1.22) 1.21 (0.90, 1.63) 0.94 (0.77, 1.15) 3.47 (1.43, 8.43) 1.16 (0.87, 1.55) 0.99 (0.69, 1.42) 1.38 (0.86, 2.21)
Total Fat RR (95% CI) High vs.Low
BRE80144 BRE14387 BRE15412 BRE12244 BRE13548 BRE05719 BRE17516 BRE12398 BRE13438 BRE17622 BRE04898 BRE04461
BRE80144 BRE13438
BRE80144 BRE80147 BRE01315 BRE20941 BRE13011 BRE03424 BRE05141
WCRF_Code
Women's Lifestyle and Health Study EPIC-UK, 1993 California Teachers Study, 1995 E3N-EPIC, 1990 The Swedish Mammography Cohort, 1987 NHEFS, 1981/82 Norway National Health Screening Service, 1974 New York Women's Health Study, 1985 Nurses' Health Study (NHS) Cohort 1976-1996 NBSS, 1980 Mobile Clinic Health Examination Survey, 1973 NHANES I, 1971
Women's Lifestyle and Health Study Nurses' Health Study (NHS) Cohort 1976-1996
Women's Lifestyle and Health Study Malmo Diet and Cancer, 1991 Nurses' Health Study (NHS) Cohort 1976-1996 ORDET study, 1987 The Netherlands Cohort Study on diet and cancer, 1986-1993 New York State Cohort, 1980 Iowa Women's Health Study
StudyDescription
80.7 vs. 30.8 92.4 vs. 37.14 < 75.0 vs. < 34.0 Quantile 2 vs. Quantile 1 > 50.21 vs. < 40.29 Quantile 4 vs. Quantile 1 > 61.0 vs. < 49.9 123.0 vs. 28.0 > 82.0 vs. < 57.9 Quartile 4 vs. Quartile 1 > 97.3 vs. < 71.1 > 74.0 vs. < 37.9
80.7 vs. 30.8 Quantile 5 vs. Quantile 1
80.2 vs. 30.8 96.1 vs. 62.5 Quantile 5 vs. Quantile 1 62.8 - 146.6 vs. < 54.3 86.0 vs. 61.0 2344.0 - 13422.0 vs. 0 - 1268.0 80.7 vs. 56.6
contrast
g/day g/day g/day g/day g/day g/day g/day g/day g/day g/day g/day
g/day g/day
g/day g/day g/day g/day g/day g/month g/day
Units
1.02 (0.72, 1.45) 1.79 (0.89, 3.58) 0.80 (0.57, 1.13) 1.37 (0.99, 1.89) 1.00 (0.76, 1.32) 0.98 (0.42, 2.30) 1.25 (0.86, 1.81) 1.49 (0.89, 2.49) 0.90 (0.76, 1.06) 1.30 (0.90, 1.88) 1.72 (0.61, 4.83) 0.34 (0.16, 0.73)

81
5.2.2 Saturated fatty acids Global Report, 2007 19 articles were retrieved from the SLR (Barrett-Connor, E. and Friedlander, N. J. 1993 , BRE00581;Byrne, C. et al., 2002 , BRE01315;Gaard, M. T. 1995 , BRE17516;Giovannucci, E. et al., 1993 , BRE03262;Horn-Ross, P. L. et al., 2002 , BRE15412;Howe, G. R. F. 1991 , BRE17622;Jones, D. Y. et al., 1987 , BRE04461;Knekt, P. et al., 1990 , BRE04898;Kushi, L. H. et al., 1992 , BRE05141;Kushi, L. H. et al., 1995 , BRE05142;Sieri, S. et al., 2002 , BRE20941;Thiebaut, A. C. and Clavel-Chapelon, F. 2001 , BRE12244;Toniolo, P. et al., 1994 , BRE12398;van den Brandt, P. A. et al., 1993 , BRE16919;Voorrips, L. E. et al., 2002 , BRE13011;Willett, W. C. et al., 1987 , BRE13442;Willett, W. C. et al., 1992 , BRE13438;Wirfalt, E. et al., 2002 , BRE13504;Wolk, A. et al., 1998 , BRE13548). Menopause age unspecified No association in the meta-analysis of four studies (RR = 0.97, 95% CI=0.91-1.03 for 10 g /day) (Gaard, M. T. 1995 , BRE17516;Howe, G. R. F. 1991 , BRE17622;Jones, D. Y. et al., 1987 , BRE04461;Willett, W. C. et al., 1992 , BRE13438), with no significant heterogeneity. The highest versus lowest forest plot, however, shows 5 other studies, 1 of which only with non-significant negative association (Gaard, M. T. 1995 , BRE17516;Horn-Ross, P. L. et al., 2002 , BRE15412;Howe, G. R. F. 1991 , BRE17622;Jones, D. Y. et al., 1987 , BRE04461;Knekt, P. et al., 1990 , BRE04898;Thiebaut, A. C. and Clavel-Chapelon, F. 2001 , BRE12244;Toniolo, P. et al., 1994 , BRE12398;Wolk, A. et al., 1998 , BRE13548). Postmenopause The summary RR of four post-menopausal studies was 1.12 (95% CI = 1.01-1.24), no heterogeneity (Barrett-Connor, E. and Friedlander, N. J. 1993 , BRE00581;Kushi, L. H. et al., 1992 , BRE05141;van den Brandt, P. A. et al., 1993 , BRE16919;Wirfalt, E. et al., 2002 , BRE13504). Two other studies (of three) in the highest versus lowest forest plot did not confirm this positive association. Update Menopause age unspecified One study was identified during the update: the Swedish Women’s Lifestyle and Health Cohort (Lof, M. et al., 2007 , BRE80144). The results showed no association between saturated fatty acid intake and the overall risk of breast cancer, or with ER or PR status (974 cases).
5.2.3 Monounsaturated fatty acids Global Report, 2007 15 articles were retrieved from the SLR, in which two were reports of the Iowa Women Health Study (Kushi, L. H. et al., 1992 , BRE05141;Kushi, L. H. et al., 1995 , BRE05142), two reports of the Nurses’ Health Study (Giovannucci, E. et al., 1993 , BRE03262;Willett, W.

82
C. et al., 1992 , BRE13438), two reports of the Netherlands Cohort Study (van den Brandt, P. A. et al., 1993 , BRE16919;Voorrips, L. E. et al., 2002 , BRE13011), French E3N-EPIC (Thiebaut, A. C. and Clavel-Chapelon, F. 2001 , BRE12244), Malmo Diet and Cancer (Wirfalt, E. et al., 2002 , BRE13504), the NBSS (Howe, G. R. F. 1991 , BRE17622), NHANES (Jones, D. Y. et al., 1987 , BRE04461), Norway NHSS (Gaard, M. T. 1995 , BRE17516), ORDET (Sieri, S. et al., 2002 , BRE20941), Rancho Bernardo (Barrett-Connor, E. and Friedlander, N. J. 1993 , BRE00581), Mobile Clinic Health Examination Survey (Knekt, P. et al., 1990 , BRE04898) and Swedish Mammography Cohort (Wolk, A. et al., 1998 , BRE13548). Menopause age unspecified No association in the meta-analysis of four studies (RR = 1.00, 95% CI = 0.94-1.07), with significant heterogeneity (different age adjustment) but no major change upon excluding studies in sensitivity analysis (Gaard, M. T. 1995 , BRE17516;Howe, G. R. F. 1991 , BRE17622;Jones, D. Y. et al., 1987 , BRE04461;Willett, W. C. et al., 1992 , BRE13438). Four further studies with RR ranging from 0.95 to 2.70 (non-significant) were found in the highest versus lowest forest plot. Postmenopause No significant positive significant association in the meta-analysis of four studies in post-menopausal women (RR = 1.10, 95% CI = 0.96-1.25) with significant heterogeneity (I2 = 86%) possibly explained by differential adjustment for energy and reproductive factors (Barrett-Connor, E. and Friedlander, N. J. 1993 , BRE00581;Kushi, L. H. et al., 1992 , BRE05141;van den Brandt, P. A. et al., 1993 , BRE16919;Wirfalt, E. et al., 2002 , BRE13504). Update Two articles were identified during the update (Gallicchio, L. et al., 2007 , BRE80006;Lof, M. et al., 2007 , BRE80144). Menopause age unspecified In the BBD cohort-CLUE II, only mean differences were presented (Gallicchio, L. et al., 2007 , BRE80006). The Swedish Women’s Lifestyle and Health Cohort (Lof, M. et al., 2007 , BRE80144) (974 cases) reported that monounsaturated fatty acid (MUFA) was not associated with the risk of breast cancer overall. However, women in the highest MUFA quintile intake had a reduced breast cancer risk after age 50 years (HR = 0.45, 95% CI = 0.25-0.99) compared to women in the lowest quintile. The association did not differ by oestrogen or progesterone receptor status.
5.2.4 Polyunsaturated fatty acids Global Report, 2007 13 articles were retrieved from the SLR (Barrett-Connor, E. and Friedlander, N. J. 1993 , BRE00581;Giovannucci, E. et al., 1993 , BRE03262;Howe, G. R. F. 1991 , BRE17622;Jones, D. Y. et al., 1987 , BRE04461;Knekt, P. et al., 1990 , BRE04898;Kushi, L. H. et al., 1992 ,

83
BRE05141;Kushi, L. H. et al., 1995 , BRE05142;Sieri, S. et al., 2002 , BRE20941;Thiebaut, A. C. and Clavel-Chapelon, F. 2001 , BRE12244;van den Brandt, P. A. et al., 1993 , BRE16919;Voorrips, L. E. et al., 2002 , BRE13011;Wirfalt, E. et al., 2002 , BRE13504;Wolk, A. et al., 1998 , BRE13548). Postmenopause The meta-analysis of three studies (Barrett-Connor, E. and Friedlander, N. J. 1993 , BRE00581;Kushi, L. H. et al., 1992 , BRE05141;Wirfalt, E. et al., 2002 , BRE13504) showed a significant positive association with postmenopausal breast cancer (summary RR = 1.56, 95% CI = 1.33-1.84, for 5 g/day), and each study was significantly associated in the same direction. The above three studies were included in the highest versus lowest forest plot, along with the fourth study (Sieri, S. et al., 2002 , BRE20941). It was the Italian ORDET and it showed a non-significant positive association (OR =2.03) Update Two prospective studies had been identified during the update. The BBD cohort-CLUE II only presented mean differences (Gallicchio, L. et al., 2007 , BRE80006). In the Swedish Women’s Lifestyle and Health Cohort (Lof, M. et al., 2007 , BRE80144) (974 cases), it reported a non-significant association between polyunsaturated fatty acids (PUFA) intake and the risk of breast cancer (HR=0.72, 95% CI = 0.52-1.00; Ptrend = 0.08). Women in the highest PUFA quintile intake had a reduced breast cancer risk after age 50 years compared to women in the lowest quintile (HR=0.54, 95% CI = 0.35-0.85, Ptrend = 0.08). 5.4 Alcohol (as ethanol) Global Report, 2007 The meta-analysis including studies on women with unspecified menopausal age shows a significant positive association (RR= 1.10, 95% CI = 1.06-1.14, for 10g/day, with significant heterogeneity (I2 = 82%, partly explained by differential adjustment for age and reproductive history). There was a significant positive association with premenopausal breast cancer (5 studies: RR = 1.09, 95% CI = 1.01-1.17, with significant heterogeneity (I2 = 66%, possibly explained by differential adjustment for age, anthropometry and genetic factors) and postmenopausal breast cancer (11 studies: RR =1.08, 95% CI = 1.05-1.10, no heterogeneity). The highest versus lowest forest plots show several other studies that did not enter the dose-response meta-analysis: most of them show a positive association, thus confirming the overall positive pattern emerging from the meta-analysis. To our knowledge, the Iowa Women’s Health Study and the Swedish Mammography Cohort study are the only two other large prospective studies that have examined the association of alcohol intake with joint ER and PR status, and the results were mixed. In the Swedish Mammography Cohort, alcohol intake was associated with an elevated risk of both ER+PR+ and ER+PR– breast tumors, but not with ER– PR+ and ER–PR– breast tumors. In contrast, alcohol intake was most strongly associated with ER–PR– tumors in the Iowa Women’s Health Study. Our findings that alcohol was associated with ER+PR+ tumors, but not with ER–PR– and ER+PR– tumors, are in general consistent with the results from the Swedish Mammography Cohort. The small number of cases in the present analysis, however, precluded us from calculating precise estimates of the association between alcohol and

84
ER+PR– tumors. We also did not have enough cases to evaluate the association between alcohol and ER–PR+ tumors. Overall pooled estimates from these three prospective studies showed a significant positive association for ER+PR+ tumors, but not for ER–PR– and ER+PR– tumors (table 5). Although our data on the presence or absence of hormone receptors were determined from laboratories affiliated with hospitals in which breast cancer cases were diagnosed and not from a single reference laboratory, the measurement of hormone receptors has been standardized, and the distribution of hormone receptors in the Women’s Health Study is comparable to those reported in previous studies for postmenopausal women . Update Five prospective cohort or nested case-control studies have published seven reports in the relation to alcohol (as ethanol) consumption and risk of breast cancer between Jan 2006 and Dec 2007, which include the Women’s Health Study (Zhang, S. M. et al., 2007 , BRE20023), the PLCO Cancer Screening Trial (Stolzenberg-Solomon, R. Z. et al., 2006 , BRE80113) and the EPIC study (Tjonneland, A. et al., 2007 , BRE80013). The four remaining reports were components of the EPIC: three of them were the Diet, Cancer and Health Study from Denmark (Mellemkjaer, L. et al., 2006 , BRE80039;Ravn-Haren, G. et al., 2006 , BRE80151;Vogel, U. et al., 2007 , BRE80150) and one was Malmo Diet and Cancer study from Sweden (Ericson, U. et al., 2007 , BRE80128). We conducted a dose-response meta-analysis of the relationship of alcohol intake with postmenopausal breast cancer. No meta-analysis was performed on women with menopausal age unspecified or premenopausal status as only two (Tjonneland, A. et al., 2007 , BRE80013;Zhang, S. M. et al., 2007 , BRE20023) and one (Zhang, S. M. et al., 2007 , BRE20023) studies had reported data respectively. Menopause age unspecified The EPIC study (Tjonneland, A. et al., 2007 , BRE80013) and the Women’s Health study (Zhang, S. M. et al., 2007 , BRE20023) published data on the relationship of alcohol and breast cancer (women with pre- or postmenopausal status combined). Both studies reported a statistically significant increased risk of breast cancer with an increased alcohol intake. For 10g/day increase in consumption, the EPIC study (Tjonneland, A. et al., 2007 , BRE80013) reported a 3% increase risk (95% CI = 1.01-1.05); while the Women’s Health Study (Zhang, S. M. et al., 2007 , BRE20023) reported a 7% increase risk (95% CI = 1.01-1.14). The EPIC study had also examined the association between alcohol intake and breast cancer risk by level of dietary folate intake. No significant interaction was observed (Pinteractions = 0.59). Premenopause A statistically non-significant increase risk in premenopausal breast cancer was reported in the Women’s Health study (Zhang, S. M. et al., 2007 , BRE20023) (RR for 10g/day increase = 1.08, 95% CI = 0.96-1.22). Postmenopause Six reports published by four cohort studies were identified during the update period: one report each from the Women’s Health Study (Zhang, S. M. et al., 2007 , BRE20023), the

85
PLCO Cancer Screening Trial (Stolzenberg-Solomon, R. Z. et al., 2006 , BRE80113) and the Malmo Diet and Cancer study (Ericson, U. et al., 2007 , BRE80128) and 3 separate reports from the Diet, Cancer and Health Study in Denmark (Mellemkjaer, L. et al., 2006 , BRE80039;Ravn-Haren, G. et al., 2006 , BRE80151;Vogel, U. et al., 2007 , BRE80150). We conducted a meta-analysis that confirms the results of the meta-analysis conducted in the SLR with less heterogeneity between study results. A summary comparing the results of the meta-analysis in the SLR and the updated meta-analysis is shown below: Summary of results of the dose-response meta-analysis
Postmenopausal breast cancer
2nd Report Continuous update
Studies (n) 11 13
Cases (n) - 10915
RR (95% CI) (10g/day increase) 1.08 (1.05-1.10) 1.08 (1.05-1.11)
Heterogeneity (I2) 39.5% (0.0-70.2%) 21.0%, p=0.231
Studies selected for the dose-response meta-analysis 13 out of 28 studies with appropriate format of data on postmenopausal women were included in the dose-response meta-analysis for this update report. The four cohort studies identified during the update (Ericson, U. et al., 2007 , BRE80128;Mellemkjaer, L. et al., 2006 , BRE80039;Stolzenberg-Solomon, R. Z. et al., 2006 , BRE80113;Zhang, S. M. et al., 2007 , BRE20023) had contributed new data in the dose-response meta-analysis. Some previous reports published by these cohort studies were superseded in the selection process: one each from the Malmo Diet and Cancer study (Mattisson, I. W. 2004 , BRE17807) and PLCO Screening Trial (Stolzenberg-Solomon, R. Z. et al., 2004 , BRE18746); four reports from the Diet, Cancer and Health study (Ravn-Haren, G. et al., 2006 , BRE80151;Tjonneland, A. et al., 2003 , BRE12350;Tjonneland, A. et al., 2004 , BRE12349;Vogel, U. et al., 2007 , BRE80150). In addition, nine studies (Barrett-Connor, E. and Friedlander, N. J. 1993 , BRE00581;Chen, Wendy et al., 2002 , BRE19205;Feigelson, H. S. et al., 2003 , BRE02720;Holmberg, L. et al., 1995 , BRE15392;Horn-Ross, P. L. et al., 2004 , BRE15413;Rohan, T. E. et al., 2000 , BRE16489;Sellers, T. A. G. 2004 , BRE18027;Suzuki, R. et al., 2005 , BRE24245;van den Brandt, P. A. et al., 1995 , BRE12719) were retrieved from the SLR, giving a total of 13 studies (10915 cases) for the meta-analysis. Details of these studies and their selection are given in Table A1. Results The summary estimate obtained in the meta-analysis was 1.08 (95% CI = 1.05-1.11) for 10g/day increase in alcohol consumption, which is the same as reported in 2007 (RR=1.08, 95% CI = 1.05-1.10) (Fig A1).

86
There was no suggestion of excess heterogeneity between the studies (I2=21.0%, P=0.231) and no indication of any strong influence from each individual study on the summary estimate. The funnel plot did not suggest any publication bias (Fig A2). Overall, the categorical results are consistent with a positive significant association as shown in the forest plot of relative risks comparing highest versus lowest category of intake in each study (Fig A3). Three studies not included in the dose-repsonse meta-analysis – the Women’s Health Initiative Study (Duffy, C. et al., 2004 , BRE18359), the CPS-II Cohort (Feigelson, H. S. et al., 2003 , BRE02720) and the ORDET study (Sieri, S. et al., 2002 , BRE20941) - were included in the highest versus lowest forest plot. All three studies showed significant positive associations, with two results (Duffy, C. et al., 2004 , BRE18359;Feigelson, H. S. et al., 2003 , BRE02720) being statistically significant. The Danish Diet, Cancer and Health Study reported statistically significant interaction between alcohol consumption and PPARγ2 Pro12Ala genotype in relation to postmenopausal breast cancer. Among homozygous wild-type carriers, the RR for an increment of 10g/day alcohol was 1.21 (95% CI = 1.06-1.35); but no association was observed in variant allele carriers (Pinteraction = 0.005). No effects were reported for IL6 G-174C, IL8 T-251A and COX2 T8473C genotypes. (Vogel, U. et al., 2007 , BRE80150). Published meta-analyses In 2006, Key et al. conducted a comprehensive meta-analysis involving 98 unique observational studies (> 75 000 cases) on the relation of alcohol and breast cancer; with particular attentions drawn to study quality issues including treatment of confounders and data reporting and the methodology in meta-analysis. For the studies judged high quality, by a simple index developed by the authors, and adjusted for appropriate confounders, excess risk associated with alcohol drinking was 22% (95% CI = 9-37%; Q = 54, 18 d.f). In the dose-response meta-analysis among the drinkers, a 10% increased risk (95% CI = 5 – 15%; Q = 56, 32 d.f) for each additional 10g of ethanol consumption was observed. Findings were robust to study design and analytic approaches in the meta-analyses. There was no significant difference in risk by menopauseal status and alcoholic type. There was no evidence of publication bias (Key, J. et al., 2006). A meta-analysis assessed the association between alcohol intake and the risk of ER-/PR-defined breast cancer (Suzuki et al., 2008). It included cohort and case-control studies published through April 2007. The number of cohort studies included was three and the number of case-control studies varied from three to seven depending on the analysis. The dose-response meta-analysis showed that an increase in alcohol consumption of 10 g of ethanol per day was associated with statistically significant increased risks for all ER+ (12%), all ER- (7%), ER+PR+ (11%) and ER+PR- (15%), but not ER-PR-. A statistically significant heterogeneity of the results across all ER+ versus ER-PR- was observed (Pheterogeneity = 0.02).

87
b)Table A1 Inclusion and exclusion of cohort studies on alcohol (as ethanol) and postmenopausal breast cancer Author Year WCRF
Code Study name Study type Included in
the 2005 dose-
response meta-analysis
Included in the 2008 dose-
response meta-
analysis
Estimated values for meta-analysis
Exclusion reasons Included in the 2008 high vs. low
forest plot
Remarks
Ericson, U. et al.
2007 BRE80128 Malmo Diet and Cancer
Prospective Cohort
New study Yes Mean exposure values
Yes Component study of EPIC
Vogel, U. et al.
2007 BRE80150 Diet, Cancer and Health
Nested Case Control
New study No Although more recent than Mellemkjoer, 2006 BRE80039, less number of cases (361 cases)
No Component study of EPIC
Zhang et al. 2007 BRE20023 Women's Health Study
Prospective Cohort
New study Yes Not included in H vs L as they only
provided continuous data
Mellemkjoer et al.
2006 BRE80039 Diet, Cancer and Health
Prospective Cohort
New study Yes Continuous data only - not included
in high vs. low analysis
Increment converted to 10g/day; component study of EPIC
Ravn-Haren, G. et al.
2006 BRE80151 Diet, Cancer and Health
Nested Case Control
New study No Superseded by Mellemkjoer 2006, BRE80039
No Component study of EPIC
Stolzenberg-Solomon, R.Z.
2006 BRE80113 PLCO Cancer Screening Trial cohort
Prospective Cohort
New study Yes Mean exposure values
Yes
Suzuki R. 2005 BRE24245 Sweden, 1987 Prospective Cohort
Yes Yes Mean exposure values
Yes
Colditz, G. A.
2004 BRE01783 Nurses' Health Study
Prospective Cohort
No No Stratified by ER breast cancer status
No
Duffy, C. 2004 BRE18359 Women's Health Initiative Study
Prospective Cohort
No No Number of non-cases and cases missing; can't estimate
Yes
Horn-Ross, P.L.
2004 BRE15413 California Teachers Study
Prospective Cohort
Yes Yes Mean exposure values
Yes
Mattisson, I. 2004 BRE17807 Malmo Diet and Cancer
Prospective Cohort
No No Superseded by Ericson, 2007 BRE80128
No Component study of EPIC

88
Sellers, T. A. 2004 BRE18027 Iowa Women's Health Study
Prospective Cohort
Yes Yes Mean exposure values
Yes
Stolzenberg-Solomon, R. Z.
2004 BRE18746 PLCO Cancer Screening Trial cohort
Prospective Cohort
No No Superseded by Stolzenberg-Solomon 2006 BRE80113
No
Tjonneland, A.
2004 BRE12349 Diet, Cancer and Health
Prospective Cohort
Yes No Superseded by Mellemkjoer 2006, BRE80039
No Component study of EPIC
Feigelson, H. S.
2003 BRE02720 CPS-II US cohort Prospective Cohort
Yes Yes Mean exposure values
Yes
Rissanen, H. 2003 BRE17954 Mobile Clinic Health Examination Survey
Nested Case Control
Yes No Mean difference No
Tjonneland, A.
2003 BRE12350 Diet, Cancer and Health
Prospective Cohort
No No Dose-response slope provided by Mellemkjoer 2006, BRE80039
Yes, selected for HvL plot as this
was the only categorical analysis performed in Diet, Cancer and Health
study
Component study of EPIC
Chen, Wendy, Y.
2002 BRE19205 Nurses' Health Study
Prospective Cohort
Yes Yes Mean exposure values
Yes
Sieri, Sabina 2002 BRE20941 ORDET study Nested Case Control
No No Number of cases and non-cases not provided, can't estimate as quantiles were only calculated from the non-cases
Yes
Jain, M.G. 2000 BRE17653 NBSS Prospective Cohort
No No Outcome was mortality No
Rohan, T.E. 2000 BRE16489 NBSS Case Cohort
No Yes
Continuous data only - not included in high vs. low analysis
No
Holmberg, L. 1995 BRE15392 The Swedish Mammography Cohort
Nested Case Control
Yes Yes Mean exposure values
Yes
van den Brandt, P. A.
1995 BRE12719 The Netherlands Cohort Study on diet and cancer
Case Cohort
Yes Yes Mean exposure values
Yes
Barrett-Connor, E.
1993 BRE00581 Rancho Bernardo, 1972
Prospective Cohort
Yes Yes Continuous data only - not included in high vs. low analysis
No Increment converted to 10g/day

89
Friedenreich, C. M.
1993 BRE17508 NBSS Nested Case Control
Yes No Superseded by Rohan 2000 BRE16489
Yes, included in HvL plot as this
was the only categorical analysis performed in NBSS
Gapstur, S. M.
1992 BRE03101 Iowa Women's Health Study
Prospective Cohort
No No Superseded by Sellers 2004; missing cases and non-cases, can't estimate
No
Schatzkin, A. 1987 BRE18010 NHEFS Prospective Cohort
No No 2 categories: drinkers and non-drinkers only
No
Willett, W. C. 1987 BRE13441 Nurses' Health Study
Prospective Cohort
No No Superseded by Chen 2002 BRE19205
No
Total no. of articles = 28
Total no. of cohort studies = 17
Total no. of studies
included = 11
Total no. of
studies included
= 13
Total no. of studies included =
13

90
ix. Fig.A1 Dose-response meta-analysis on alcohol (as ethanol) and postmenopausal breast cancer (**=new studies identified during the update)
NOTE: Weights are from random effects analysis
Overall (I-squared = 21.0%, p = 0.231)
Holmberg, L. (1995)
Horn-Ross, P.L. (2004)
Rohan, T.E. (2000)
Study
Barrett-Connor, E. (1993)
** Ericson, U. et al. (2007) ** Zhang et al. (2007)
Chen, Wendy, Y. (2002)
Feigelson, H. S. (2003)
van den Brandt, P. A. (1995)
** Stolzenberg-Solomon, R.Z. (2006)
** Mellemkjoer et al. (2006)
Suzuki R. (2005)
Sellers, T. A. (2004)
ID
1.08 (1.05, 1.11)
5.80 (1.71, 19.64)
1.05 (0.99, 1.11)
1.05 (0.99, 1.12)
10g/day
0.85 (0.56, 1.31)
1.18 (1.00, 1.39) 1.07 (0.99, 1.15)
1.09 (1.04, 1.14)
1.06 (1.00, 1.13)
1.12 (0.99, 1.26)
1.14 (0.94, 1.38)
1.08 (1.03, 1.13)
1.21 (1.06, 1.37)
1.09 (0.99, 1.21)
Alcohol RR (95% CI)
100.00
0.04
13.65
11.97
%
0.36
2.35 9.12
17.01
12.57
4.24
1.68
17.79
3.80
5.41
Weight
BRE15392
BRE15413
BRE16489
BRE00581
BRE80128 BRE20023
BRE19205
BRE02720
BRE12719
BRE80113
BRE80039
BRE24245
BRE18027
WCRF_Code
The Swedish Mammography Cohort
California Teachers Study
NBSS
Rancho Bernardo, 1972
Malmo Diet and Cancer Women's Health Study
Nurses' Health Study
CPS-II US cohort
The Netherlands Cohort Study on diet and cancer
PLCO Cancer Screening Trial cohort
Diet, Cancer and Health
Sweden, 1987
Iowa Women's Health Study
StudyDescription
1.08 (1.05, 1.11)
5.80 (1.71, 19.64)
1.05 (0.99, 1.11)
1.05 (0.99, 1.12)
10g/day
0.85 (0.56, 1.31)
1.18 (1.00, 1.39) 1.07 (0.99, 1.15)
1.09 (1.04, 1.14)
1.06 (1.00, 1.13)
1.12 (0.99, 1.26)
1.14 (0.94, 1.38)
1.08 (1.03, 1.13)
1.21 (1.06, 1.37)
1.09 (0.99, 1.21)
Alcohol RR (95% CI)
100.00
0.04
13.65
11.97
%
0.36
2.35 9.12
17.01
12.57
4.24
1.68
17.79
3.80
5.41
Weight
1 .0509 1 19.
6

91
x. Fig. A2 Funnel plot for alcohol (as ethanol) and postmenopausal breast cancer

92
xi. Fig.A3 Highest versus lowest forest plot on alcohol (as ethanol) and postmenopausal breast cancer (**=new studies identified during the update)
** Ericson, U. et al. (2007) ** Stolzenberg-Solomon, R.Z. (2006) Suzuki R. (2005) Duffy, C. (2004) Horn-Ross, P.L. (2004) Sellers, T. A. (2004) Feigelson, H. S. (2003) Tjonneland, A. (2003) Chen, Wendy, Y. (2002) Sieri, Sabina (2002) Holmberg, L. (1995) van den Brandt, P. A. (1995) Friedenreich, C. M. (1993)
ID Study
2.52 (1.33, 4.77) 1.30 (1.02, 1.66) 1.43 (1.16, 1.76) 1.26 (1.07, 1.48) 1.32 (1.06, 1.64) 1.11 (0.98, 1.26) 1.26 (1.04, 1.53) 1.35 (0.68, 2.67) 1.33 (1.12, 1.58) 1.04 (0.46, 2.34) 1.80 (1.11, 2.92) 1.72 (0.90, 3.28) 0.86 (0.46, 1.60)
Ethanol RR (95% CI)
High vs. Low
BRE80128 BRE80113 BRE24245 BRE18359 BRE15413 BRE18027 BRE02720 BRE12350 BRE19205 BRE20941 BRE15392 BRE12719 BRE17508
WCRF_Code
Malmo Diet and Cancer PLCO Cancer Screening Trial cohort Sweden, 1987 Women's Health Initiative Study California Teachers Study Iowa Women's Health Study CPS-II US cohort Diet, Cancer and Health Nurses' Health Study ORDET study The Swedish Mammography Cohort The Netherlands Cohort Study on diet and cancer NBSS
StudyDescription
>30 vs 0g/day >=7.63 vs <=0.01g/day >=10.0 vs 0g/day >15 vs 0g/day >=20 vs 0g/day >4 vs 0g/day >=15 vs 0g/day >60 vs >0-<=6g/day >=20 vs 0g/day >=52.7 vs <=0.75g/day >=2 vs 0g/day >=30 vs 0g/day >=30 vs 0g/day
Contrast
2.52 (1.33, 4.77) 1.30 (1.02, 1.66) 1.43 (1.16, 1.76) 1.26 (1.07, 1.48) 1.32 (1.06, 1.64) 1.11 (0.98, 1.26) 1.26 (1.04, 1.53) 1.35 (0.68, 2.67) 1.33 (1.12, 1.58) 1.04 (0.46, 2.34) 1.80 (1.11, 2.92) 1.72 (0.90, 3.28) 0.86 (0.46, 1.60)
Ethanol RR (95% CI)
High vs. Low
BRE80128 BRE80113 BRE24245 BRE18359 BRE15413 BRE18027 BRE02720 BRE12350 BRE19205 BRE20941 BRE15392 BRE12719 BRE17508
WCRF_Code
1 .21 1 4.7
7

93
5.5.2 Vitamin B Global Report, 2007 Four articles were retrieved from the SLR (Goodman, J. E. et al., 2001 , BRE03354;Wu, K. et al., 1999 , BRE13618;Wu, K. et al., 1999 , BRE63618;Zhang, S. M. et al., 2003 , BRE13958). The Nurses’ Health Study reported on plasma cobalamin and plasma pyridoxine (Zhang, S. M. et al., 2003 , BRE13958). CLUE I (Wu, K. et al., 1999 , BRE13618) and II (Wu, K. et al., 1999 , BRE63618) study cohorts reported on vitamin B supplement, plasma/serum cobalamin (B12), and serum pyridoxal 5’-Phosphate (B6) and they presented the result by menopausal status. For B-vitamin use, they gave matched ORs of 1.06 (95% CI = 0.47-2.38) and 0.57 (95% CI = 0.27- 1.21) for CLUE I (133 cases) and CLUE II (110 cases) cohorts (overall breast cancer risks), respectively, when comparing never users with ever users. In the total 1974 population (CLUE I), women in the lowest fifth of B12 concentration had a significantly increased risk of breast cancer compared to those in the highest fifth B12 concentration (OR = 2.54, 95% CI = 1.11–5.80; median B12 concentration in the lowest fifth group 5 280 pg/ml). The observed increased risk in the lowest fifth B12 concentration was primarily due to increased risk of breast cancer among women in the lowest fifth of B12 who were postmenopausal at donation. For CLUE II study, no significant association were found for total population, pre- and postmenopausal women.
Plasma cobalamin (vitamin B12) was not significantly inversely related to breast cancer risk in the Nurses’ Health Study (RR = 0.76) (Zhang, S. M. et al., 2003 , BRE13958). For plasma pyridoxine (B6), the Nurses’ Health Study also did not show any significant protective association (Zhang, S. M. et al., 2003 , BRE13958). A study from Washington US (Goodman, J. E. et al., 2001 , BRE03354) investigated COMT genotype, serum cobalamin (B12) and breast cancer. However, only mean differences were given. Update Only one study on premenopausal women was identified – Nurses’ Health Study [Cho, E. et al., 2007, BRE80152]. They investigated total vitamin B6 (from foods and supplements) (RR = 1.11, 95% CI = 0.91-1.35), vitamin B6 from foods only (RR = 1.18, 95% CI = 0.96-1.44), total vitamin B12 (from foods and supplements) (RR = 0.92, 95% CI = 0.76-1.12), vitamin B12 from foods only (RR = 0.96, 95% CI = 0.78-1.19), total choline (RR = 0.88, 95% CI = 0.72-1.07) and total betaine (RR = 0.99, 95% CI = 0.79-1.22) in relation to the risk of breast cancer; and all of them showed non-significant positive/negative associations (221 cases). In the ER- subgroup, no association was found between vitamin B6 (total vitamin B6 and vitamin B6 from foods only), B12 (total vitamin B12 and vitamin B12 from foods only), total choline and betaine and breast cancer. No inverse associations were observed when stratified by levels of alcohol consumption and total folate intake. Interactions between B vitamins and folate on the risk of breast cancer The E3N EPIC-French study reported stronger inverse associations of folate intake and postmenopausal breast cancer in the two highest tertiles as compared to the first tertile of

94
vitamin B12 intake (RRQ5 vs. Q1 = 0.62, 95% CI = 0.47-0.81, Ptrend = 0.02 for 11.6 μg/day vitamin B12 intake; RRQ5 vs. Q1 = 0.73, 95% CI = 0.56-0.97, Ptrend = 0.01 for 6.7μg/day vitamin B12 intake; RRQ5 vs. Q1 = 0.92, 95% CI = 0.70-1.20, Ptrend = 0.44 for 4.2 μg/day vitamin B12 intake), although the test for interaction did not yield statistically significant results (Pinteractions = 0.28). There was no evidence to support effect modification by Vitamin B2 intake (Lajous, M. et al., 2006 , BRE80135). 5.5.0 Multivitamin supplements Global Report, 2007 No association was found in the ACS Cancer Prevention II (Feigelson, H. S. et al., 2003 , BRE02720), nor in the Nurses’ Health Study (Hunter, D. J. et al., 1993 , BRE04168;Zhang, S. et al., 1999 , BRE13953). CLUE I Study Cohort (Wu, K. et al., 1999 , BRE13618) reported RRs of 0.77 (95% CI = 0.42-1.43) and 1.25 (95% CI = 0.67-2.36) when comparing multivitamin never users with ever users in the 1974 cohort and 1989 cohort, respectively. Update The relative risk of postmenopausal breast cancer was 1.18 (95% CI = 0.95-1.48) in ever users of multivitamin supplements compared to never users in the PLCO Cancer Screening Trial Cohort, USA (Stolzenberg-Solomon, R. Z. et al., 2006 , BRE80113) (691 cases). The Malmo Diet and Cancer study reported a non-signficant decreased risk in postmenopausal breast cancer in multivitamin supplements users compared to non-users (OR = 0.80, 95% CI = 0.57-1.12) (Wirfalt, E. et al., 2005 , BRE11111) (237 cases). 5.5.10 Vitamin D Global Report, 2007 Dietary vitamin D There were four studies identified in the SLR. The Nurses’ Health Study (Nurses’ Health Study) (Shin, M. H. et al., 2002 , BRE16658) gave adjusted RRs of 0.84 (95% CI = 0.59-1.18) and 0.86 (95% CI = 0.70-1.05) for pre- and postmenopausal breast cancer. The NBSS study (Simard, A. V. 1991 , BRE18039) also reported results on dietary vitamin D but risk estimate was not provided. In the NHANES I cohort, they reported an adjusted RR (>=200 IU vs. <100 IU) of 0.85 (95% CI = 0.59-1.24) (John, E. M. et al., 1999 , BRE04433). The CPS II Nutrition Cohort gave an adjusted RR (>300 IU/day vs. <=100 IU/day) of 0.95 (95% CI = 0.81-1.13) (McCullough, M. L. et al., 2005 , BRE23368). Vitamin D from diet or/and supplements or total vitamin D Three prospective studies had been identified in the SLR. The CPS-II US cohort (McCullough, M. L. et al., 2005 , BRE23368) investigated total vitamin D (dietary plus multivitamins) and gave an adjusted RR (comparing >700 IU/day vs. <=100 IU/day) of 0.95 (95% CI = 0.81-1.13). The Nurses’ Health Study cohort reported RRs (>500 vs. <=150 IU/day) of 0.89 (95% CI = 0.68-1.15) and 0.93 (95% CI = 0.80-1.08) for pre- and postmenopausal breast cancer (Shin, M. H. et al., 2002 , BRE16658). In the NHANES I

95
cohort (John, E. M. et al., 1999 , BRE04433), they observed an adjusted RR (>=200 IU or daily supplements vs. <100 IU without daily supplements) of 0.86 (95% CI = 0.61-1.20). Vitamin D from supplements Vitamin D from supplements was not related to invasive breast cancer in the NHANES I (John, E. M. et al., 2003 , BRE04434). Blood 1,25-dihydroxyvitamin D The Nurses’ Health Study cohort investigated plasma 25(OH)D and 1,25 (OH)2D and breast cancer risk. They reported adjusted RRs of 0.73 (95% CI = 0.49-1.07; Ptrend = 0.06) and 0.76 (95% CI = 0.47-1.21; Ptrend = 0.28) (Bertone-Johnson, E. R. et al., 2005 , BRE21759). Update Two prospective studies and one case-control study nested within a cohort were identified during the update period (Lin, J. et al., 2007 , BRE80165;Robien, K. et al., 2007 , BRE80130; McCullough, M. L. et al., 2007 , BRE20022). Dietary vitamin D The Women’s Health Study (Lin, J. et al., 2007 , BRE80165) (1019 cases) observed no association between dietary vitamin D and premenopausal breast cancer risk (RR Q5vs.Q1 = 1.02, 95% CI = 0.69-1.53) but found a non-significant increased risk among postmenopausal women (RR Q5 vs. Q1 = 1.22, 95% CI = 0.95-1.55; Ptrend = 0.09). Whereas in the Iowa Women’s Health Study (Robien, K. et al., 2007 , BRE80130) (2440 postmenopausal cases), it gave an adjusted RR of 0.55 (>=800 vs. <400 IU/day) (95% CI = 0.24-1.22). Gene-diet interactions The CPS II Nutrition Cohort reported no effect modification with dietary vitamin D in the asscications between polymorphisms of the VDR (vitamin D receptor) genes (Fok1, Taq1, Apa1, Bsm1, Poly(A) tail SNPs) and risk of postmenopausal breast cancer (McCullough, M. L. et al., 2007 , BRE20022). Vitamin D from diet and supplements or total vitamin D In the Women’s Health Study (Lin, J. et al., 2007 , BRE80165), they reported a borderline significant inverse association between vitamin D from diet and supplements and premenopausal breast cancer (276 cases) (RR Q5 vs. Q1=0.65, 95% CI = 0.42-1.00, Ptrend = 0.07) and a non-significant increased risk in postmenopausal women (743 cases) (RR Q5 vs. Q1 = 1.30, 95% CI = 0.97-1.73). In addition, an inverse association was observed between total vitamin D and risk of estrogen receptor positive (ER+) and progesterone receptor positive (PR+) breast cancer (RR>=548 vs. <162 IU/day = 0.53, 95% CI = 0.31-0.88, Ptrend = 0.03; RR >=548 vs. <162
IU/day = 0.55, 95% CI = 0.32-0.94, Ptrend = 0.04, respectively). Whereas in the Iowa Women’s Health Study (Robien, K. et al., 2007 , BRE80130) (2440 postmenopausal cases), the adjusted RR of breast cancer for women consuming >800 IU/day vs. <400 IU/day total vitamin D was 0.89 (95% CI = 0.77-1.03). RRs were stronger among women with negative (ER-PR- subgroup RR = 0.77, 95% CI = 0.48-1.25) than positive ER or
96
PR status. In addition, the association of high vitamin D intake with breast cancer was strongest in the first 5 years after baseline dietary assessment (RR = 0.66, 95% CI = 0.46-0.94 compared with lowest intake group). Vitamin D from supplements In the Women’s Health Study (Lin, J. et al., 2007 , BRE80165), it showed non-significant inverse associations in both pre and postmenopausal breast cancer (RR = 0.78, 95% CI = 0.50-1.17 and 0.87, 95% CI = 0.68-1.12, respectively). The Iowa Women’s Health Study observed a small non-significant inverse association (RR = 0.89; 95% CI = 0.74-1.08). Blood 1,25-dihydroxyvitamin D No new study was found during the update. Published meta-analysis Vitamin D intake (total intake from foods and supplements combined) was not related to breast cancer risk in a meta-analysis including five cohort studies and one case-control study (RR high versus low=0.98, 95% CI = 0.93-1.03; Pheterogeneity = 0.01) (Gissel, T. et al., 2008;Phipps, A. I. et al., 2008). However, most studies reported on very low intakes of vitamin D (typically in the range 100-400 IU/day). The analysis was then restricted to intakes of >=400 IU/day and this yielded a more homogenous result with a trend towards less breast cancer >=400 IU/day vs. the lowest intake (typically <50-150 IU/day), RR = 0.92, 95% CI = 0.87-0.97, Pheterogeneity = 0.14, three studies. For studies with a vitamin D intake <400 IU/day, the RR was 1.01 (95% CI = 0.94-1.07, Pheterogeneity 0.01, six studies with data). 5.5.3 Folate Global Report, 2007 Folate intake was not significantly associated with breast cancer in premenopausal women in the Nurses’ Health Study II(Cho, E. et al., 2003 , BRE01652); and in postmenopausal women in the ACS Cancer Prevention Study II (Feigelson, H. S. et al., 2003 , BRE02720); in the Iowa Cohort Study (Sellers, T. A. G. 2004 , BRE18027), in which however, there was a significant protective association for women with family history of BC; and in the Malmo Diet and Cancer cohort (Mattisson, I. W. 2004 , BRE17807). Two studies found a significant protective association confined to women consuming over 14-15 g of alcohol per day (Rohan, T. E. J. 2000 , BRE17968;Zhang, S. et al., 1999 , BRE13954). Four studies on postmenopausal breast cancer were included in the meta-analysis (Feigelson, H. S. et al., 2003 , BRE02720;Mattisson, I. W. 2004 , BRE17807;Rohan, T. E. J. 2000 , BRE17968;Sellers, T. A. G. 2004 , BRE18027), with a non-significant overall estimate RR = 0.90 (95% CI = 0.59-1.39) per 1mg/day, with no significant heterogeneity. Update Five new reports examined folate intake and breast cancer: the French EPIC-E3N study (Lajous, M. et al., 2006 , BRE80135) (1812 cases), the Diet, Cancer and Health Study, Denmark (Tjonneland, A. et al., 2006 , BRE80104) (388 cases), the PLCO Cancer Screening Trial cohort (Stolzenberg-Solomon, R. Z. et al., 2006 , BRE80113) (700 cases), the Nurses’

97
Health Study II [Cho, 2007 3763 /id] (1032 cases) and the Malmo Diet and Cancer Study (392 cases). The PLCO Cancer Screening Trial cohort, the Nurses’ Health Study II and the Malmo Diet and Cancer Study have published before and were included in the Global Report (Cho, E. et al., 2003 , BRE01652;Mattisson, I. W. 2004 , BRE17807;Stolzenberg-Solomon, R. Z. et al., 2004 , BRE18746). Of these five reports, four provided data on postmenopausal breast cancer (Ericson, U. et al., 2007 , BRE80128;Lajous, M. et al., 2006 , BRE80135;Stolzenberg-Solomon, R. Z. et al., 2006 , BRE80113;Tjonneland, A. et al., 2006 , BRE80104), one reported on premenopausal breast cancer [Cho, 2007 3763 /id] and none reported on breast cancer with menopausal age unspecified. Premenopause Folate from foods and supplements were not related to premenopausal breast cancer in the Nurses’ Health Study II [Cho, 2007 3763 /id] (1032 cases, RR 822 vs. 237mcg/day =1.09 (95% CI = 0.88-1.34)). The associations were similar across levels of alcohol intake and in the subgroup of women with ER- breast cancer. Postmenopause In total seven reports had been included in the highest versus lowest forest plot. The 2007 Malmo Diet and Cancer Study report (Ericson, U. et al., 2007 , BRE80128) was included in the analysis and replaced the one in 2004 (Mattisson, I. W. 2004 , BRE17807) as it is more recent, had longer follow-up and provided risk estimates and 95% confidence intervals. Dietary folate was significantly inversely related to postmenopausal breast cancer only in one of the three cohort studies identified during the update (Fig FO1). In the French EPIC-E3N study (Lajous, M. et al., 2006 , BRE80135) (1812 cases) the RR 522 vs 296 mcg/day was 0.78(95% CI = 0.67-0.90). In the Diet, Cancer and Health Study, Denmark (Tjonneland, A. et al., 2006 , BRE80104) (388 cases) the RR >400 vs <=250 was 0.80 (95% CI= 0.37-1.69); in the PLCO Cancer Screening Trial cohort (Stolzenberg-Solomon, R. Z. et al., 2006 , BRE80113) (700 cases) the RR>412.0 vs <261.3= 1.04 (95% CI = 0.83-1.31). Folate from supplement was related to an increased risk of breast cancer in the PLCO Cancer Screening Trial cohort (Stolzenberg-Solomon, R. Z. et al., 2006 , BRE80113) (700 cases) (RR>400 vs none= 1.19, 95% CI = 1.01-1.41), but it was not related to breast cancer in the Diet, Cancer and Health Study (RR>100 vs none= 0.74, 95% CI = 0.47-1.17), where the highest category of intake was one fourth of the highest intake in the American cohort. The results for total intake of folate from foods and supplements are inconsistent. In the PLCO Cancer Screening Trial cohort (Stolzenberg-Solomon, R. Z. et al., 2006 , BRE80113) (700 cases) high consumers were at increased risk (RR>853.1vs <335.5= 1.32, 95% CI = 1.04-1.68). The increased risk was attributable to supplement use. In the Diet, Cancer and Health Study, Denmark (Tjonneland, A. et al., 2006 , BRE80104) (388 cases) the RR >400 vs <=300 was 0.80 (95% CI = 0.37-1.69). Published meta-analysis In a meta-analysis of studies published in any language from 1st January,1966, through 1st November, 2006 folate intake in increments of 200 mg/day was not associated with the risk of breast cancer in prospective studies. For dietary folate, the meta-analysis gave an estimated summary RR of 0.97, 95% CI = 0.88 -1.07 and it included eight studies, 302,959 participants

98
and 8367 patients with breast cancer. For total folate, estimated summary RR was 1.01 (95% CI = 0.97-1.05) (included six studies; 306,209 participants and 8165 patients with breast cancer). However in case-control studies, it showed a statistically significant inverse association for dietary folate with an estimated summary OR of 0.80 (95% CI = 0.72 to 0.89) (13 studies; 8558 case patients and 10,812 control subjects), and OR of 0.93 (95% CI = 0.81-1.07) for total folate (three studies; 2184 case patients and 3233 control subjects) (Larsson S.C et al., 2007). High blood folate levels versus low levels were not statistically significantly associated with the risk of breast cancer in prospective studies (OR = 0.81, 95% CI = 0.59-1.10; three studies) or in case-control studies (OR = 0.41, 95% CI = 0.15=1.10; two studies). Among the two prospective studies and two case-control studies that were stratified by alcohol consumption, high folate intake (comparing the highest with the lowest category) was associated with a statistically significant decreased risk of breast cancer among women with moderate or high alcohol consumption (summary estimate = 0.51, 95% CI = 0.41-0.63) but not among women with low or no alcohol consumption (summary estimate = 0.95, 95% CI = 0.78 - 1.15). Few studies examined whether the relation between folate intake and breast cancer was modified by intakes of methionine or vitamins B6 and B12, and the findings were inconsistent. The meta-analysis did not present separate results on pre- or post- menopausal breast cancer. Interaction between folate and alcohol on the risk of breast cancer Five cohort studies, namely the Nurses’ Health Study (Zhang, S. et al., 1999 , BRE13954; Zhang, S. M. et al., 2005, BRE24752), the Iowa Women’s Health Study (Sellers, T.A et al., 2001; Sellers, T.A et al., 2002; Sellers, T.A et al., 2004, BRE18027), the Melbourne collaborative cohort study (Baglietto, L. et al., 2005 , BRE21669), the Canadian National Breast Screening Study (Rohan T.E et al., 2000, BRE17968) and the Cancer Prevention Study II (Feigelson, H. S. et al., 2003 , BRE02720) had published data on the interactions between folate and alcohol intake on the risk of breast cancer. In addition was the Prostate, Lung, Colorectal and Ovarian Cancer Screening Trial (Stolzenberg-Solomon, R. Z. et al., 2006 , BRE80113) identified during the update. In the Nurses’ Health Study (Zhang, S. et al., 1999 , BRE13954), it showed among women consuming >=15g/day of alcohol, for total folate intake of at least 600 µg/day compared with 150-299 µg/day, the multivariate RR was 0.55 (95% CI = 0.39-0.76; Ptrend = 0.001). Although women who consumed more folate were likely to have larger intakes of beta carotene, lutein/zeaxanthin, preformed vitamin A, total vitamin C and E, including supplements, the study showed the RR remained the same after adjusting for these variables. This inverse association is also observed among both pre- (RR =0.65; 95% CI = 0.33-1.28) and postmenopausal women (RR = 0.49; 95% CI = 0.33-0.74); however the RR among premenopausal women was not significant. No association was shown between total folate intake and breast cancer risk among women who consumed <15g/day of alcohol. When the analysis was stratified by multivitamin supplement use (major source of folate intake), it showed among women who consumed at least 15g/day of alcohol, the multivariate RRs were 0.77 (95% CI = 0.59-0.93) for past multivitamin users and 0.74 (95% CI = 0.59-0.93) for current multivitamin users compared with never users. They could not exclude the possibility that other constituents of multivitamin supplements contribute to lower breast cancer among regular alcohol consumers as the analysis only adjusted for vitamin A, C and E.
99
Another report of the Nurses’ Health Study (Zhang, S. M. et al., 2005, BRE24752) stratified the results by hormone receptor status. The multivariable RRs and 95% CIs of ER- tumors comparing the highest to the lowest quintile of total folate intake were 0.46 (95% CI = 0.25-0.86) among women consuming at least 15 g/d of alcohol and 0.88 (95% CI = 0.71-1.10) among women consuming less than 15 g/d of alcohol. Results reported by the NBSS (Rohan T.E et al., 2000, BRE17968) on the same association were very similar to those observed by the Nurses’ Health Study (Zhang, S. et al., 1999 , BRE13954). This Canadian study reported a protective effect of folate intake among women who consumed > 14g alcohol per day (76 cases) (IRR Q5 vs Q1 = 0.34, 95% CI = 0.18-0.61, Ptrend = 0.004), and the inverse association remained within subgroups of premenpausal women (22 cases) (IRR Q5 vs Q1 = 0.47, 95% CI = 0.04-6.01, Ptrend = 0.65) and postmenopausal women (43 cases) (IRR Q5 vs Q1 = 0.28, 95% CI = 0.14-0.55, Ptrend = 0.003). The same protective effect was not observed in women with ≤14g/day alcohol intake. Evidence supporting the protective effect of folate among drinkers was also published by the Iowa Women’s Health Study (Sellers, T.A et al., 2001). Compared to nondrinkers with high dietary folate intake of >294 μg/day (432 cases), the RRs of postmenopausal breast cancer associated with low dietary folate intake (≤ 172 μg/day) were 1.33 (95% CI = 0.86-2.05) (35 cases) among drinkers of ≤4 g/day and 1.59 (95% CI = 1.05-2.41) among drinkers of >4 g/day (41 cases). The RR was 1.08 (95% CI = 0.78-1.49) (99 cases) among nondrinkers. When stratified by tumour receptor status, the RRs for the comparison of ≤251 μg/day total folate and >4g/day alcohol intake versus >351 μg/day total folate and zero alcohol intake were 2.14 (95% CI = 1.18-3.85), 1.04 (95% CI = 0.76-1.42), 1.22 (95% CI = 0.88-1.70) and 1.18 (95% CI = 0.69-2.02) respectively in ER-, ER+, PR+ and PR- tumours (Sellers, T.A et al., 2002). Note: Sellers T.A. et al., 2001 and 2002 were not included in the Global Report. A further report published by the Iowa Women’s Health Study (1823 cases) in 2004 suggested that among women with no family history of breast cancer, low folate was not a risk factor among non-drinkers (RR=0.96, 95% CI = 0.73–1.26), but was among drinkers (RR=1.40, 95% CI = 1.05–1.86). Drinkers with high folate were not at elevated risk (RR=1.03, 95% CI = 0.89–1.19). Among women with family history, low folate was a risk factor among drinkers (RR=2.21, 95% CI = 1.43–3.41) and non-drinkers (RR=2.39, 95% CI = 1.36–4.20). Further, drinkers with high folate remained at increased risk (RR=1.67, 95% CI = 1.30–2.14). However, women with family history and high folate who did not drink alcohol had no elevated risk (Sellers, T. A. G. 2004 , BRE18027). The Cancer Prevention Study II Nutrition Cohort (Feigelson, H. S. et al., 2003 , BRE02720) (1303 cases) found no evidence of an interaction between levels of dietary folate (Pinteraction = 0.10) or total folate (Pinteraction = 0.61) and alcohol. The Melbourne collaborative cohort study (Baglietto, L. et al., 2005 , BRE21669) found that women who had high alcohol consumption and low intake of folate intake (folic acid = 200µg/day) had a non-significant increased risk of breast cancer (folic acid = 200µg/day RR >=40g/day alcohol vs. abstainers = 2.00; 95% CI = 1.14-3.49), but those women who had high alcohol consumption and moderate to high levels of folate intake had no increased risk. However among those who consumed 400µg of folate per day and also consumed high levels of alcohol (>=40g/day), the multivariate RR was 0.77 (95% CI = 0.33-1.80) compared with abstainers.
100
Alcohol consumption did not significantly modify the association of any of the folate variables (folate from food/supplements/natural folate in foods) in the PLCO cohort (Stolzenberg-Solomon, R. Z. et al., 2006 , BRE80113) (691 cases); however, total folate intake qualitatively modified the association with alcohol intake. The greater risk with greater alcohol intake tended to be stronger in postmenopausal women with low total folate intake (<=335.5µg/day); those in the highest quintile of alcohol use had a risk of breast cancer about twice that of those in the lowest quintile (RR alcohol intake >7.61 g/day vs. <=0.01g/day = 2.10; 95% CI = 1.08-4.07; Ptrend=0.004). Interactions between folate and B vitamins on the risk of breast cancer The E3N EPIC-French study reported stronger inverse associations of folate intake and postmenopausal breast cancer in the two highest tertiles as compared to the first tertile of vitamin B12 intake (RRQ5 vs. Q1 = 0.62, 95% CI = 0.47-0.81, Ptrend = 0.02 for 11.6 μg/day vitamin B12 intake; RRQ5 vs. Q1 = 0.73, 95% CI = 0.56-0.97, Ptrend = 0.01 for 6.7μg/day vitamin B12 intake; RRQ5 vs. Q1 = 0.92, 95% CI = 0.70-1.20, Ptrend = 0.44 for 4.2 μg/day vitamin B12 intake), although the test for interaction did not yield statistically significant results (Pinteractions = 0.28). There was no evidence to support effect modification by Vitamin B2 intake (Lajous, M. et al., 2006 , BRE80135). Food fortification with folate In the US, the Food and Drug Administration now requires mandatory fortification of grain products with folic acid (140µg folic acid/100g grain products), which is estimated to increase average folate intake by about 100µg/day. Whereas in Australia, more than 100 foods have been approved for fortification with folate since 1995 and changes in serum folate concentration following the voluntary fortification have been shown to be very small. The PLCO cohort (Stolzenberg-Solomon, R. Z. et al., 2006 , BRE80113) examined the relationship between total folate intake (foods and supplements combined)/folate from foods/supplemental folic acid intake/ natural folate in foods (such as green vegetables and oranges) and the risk of breast cancer among postmenopausal women (691 cases). They also looked at both prefortification and postfortification period. Unfortunately, they showed only results using the prefortification folate values as most of their population’s exposure occurred before fortification in 1998. In women who remained in the cohort after 1997 and thus were exposed t o and using postfortification folic acid concentrations (592 cases), food folate was not positively associated with breast cancer; whereas total folate was positively but marginally not significantly associated (RR highest vs. lowest quintile = 1.29; 95% CI = 0.99-1.68; Ptrend = 0.22) In addition, an increased intake of fortified cereal (100% RDA fortified) was shown to be associated with an increased risk (RR >0.64 vs. 0g = 1.66; 95% CI = 0.90-3.06; Ptrend = 0.04). Stolzenberg-Solomon (Stolzenberg-Solomon, R. Z. et al., 2006 , BRE80113) stated that the postmenopausal women from the PLCO trial have considerably higher total folate intake (median intake: 660µg/d) than do other cohorts (about 300-500µg/d), particularly from folic acid which is the more biologically available form. Therefore, their population may have not had sufficiently low folate range to allow the observation of protective associations if they exist. Dietary folate equivalent (DFE)

101
Dietary folate equivalents (DFEs) were calculated in the Malmo Diet and Cancer cohort (Ericson, U. et al., 2007 , BRE80128) and the EURAMIC Berlin study (case-control study) (Thorand, B. et al., 1998 , BRE12297) and DFEs were based on the assumption that the bioavailability of synthetic folic acid consumed in a meal is 1.7 times the bioavailability of food folate, i.e. DFEs = µg food folate + 1.7 x µg folic acid from supplements. However, the majority of the studies combined folic acid and folate as total folate intake and that could be a substantial limitation.

102
xii. Fig FO1 Highest versus lowest forest plot on dietary folate only and postmenopausal breast cancer (**=new studies identified during the update)
NOTE: Weights are from random effects analysis
**Ericson, U. et al. (2007)
**Lajous, M. et al. (2006)
**Stolzenberg-Solomon, R.Z. (2006)
**Tjonneland A. (2006)
Sellers, T. A. (2004)
Feigelson, H. S. (2003)
Rohan, T. E. (2000)
ID
Study
0.56 (0.35, 0.90)
0.78 (0.67, 0.90)
0.98 (0.78, 1.24)
0.80 (0.37, 1.71)
0.84 (0.69, 1.02)
1.07 (0.91, 1.26)
0.92 (0.71, 1.20)
mcg/day RR (95% CI)
Dietary folate only
High vs. Low
BRE80128
BRE80135
BRE80113
BRE80104
BRE18027
BRE02720
BRE17968
WCRF_Code
Malmo Diet and Cancer
E3N-EPIC
PLCO Cancer Screening Trial cohort
Diet, Cancer and Health
Iowa Women's Health Study
CPS-II US cohort
Canadian National Breast Screening Study
StudyDescription
302.0 vs. 153.0
522.0 vs. 296.0
> 337.1 vs. < 233.6
> 400.1 vs. < 250.0
>=295.0 vs <=172.0
> 294.3 vs. < 178.7
> 354.28 vs. < 224.77
mcg/day
contrast
0.56 (0.35, 0.90)
0.78 (0.67, 0.90)
0.98 (0.78, 1.24)
0.80 (0.37, 1.71)
0.84 (0.69, 1.02)
1.07 (0.91, 1.26)
0.92 (0.71, 1.20)
mcg/day RR (95% CI)
Dietary folate only
High vs. Low
BRE80128
BRE80135
BRE80113
BRE80104
BRE18027
BRE02720
BRE17968
WCRF_Code
1 .349 1 2.8
6

103
5.6.2. Iron Global Report, 2007 No cohort study on iron and breast cancer was identified. The meta-analysis of five case-control studies gave a combined RR of 0.92 (95% CI = 0.84-0.99) for a daily intake of 5mg, suggesting a protective effect. Update The relationship of iron intake (total dietary iron intake, iron from meat and heme iron) with breast cancer risk was examined in the Canadian National Breast Screening Study (Kabat, G. C. et al., 2007 , BRE80138). None of the results was statistically significant. For total dietary iron, the RR>14.99 vs<11.89 mg/day was 1.07 (95% CI = 0.89-1.30) in premenopausal women (1171 cases) and 0.87 (95% CI = 0.71-1.06) (993 cases) in postmenopausal women. For iron from meat (heme and nonheme iron from 22 meat items and 2 mixed dishes containing meat), the RR>6.11 vs<3.3 mg/day was 1.13 (95% CI = 0.93-1.37) in premenopausal women (1171 cases) and 1.03 (95% CI = 0.83-1.27) (993 cases) in postmenopausal women. For heme iron (computed by using different proportions for heme iron from different types of meat: 69% for beef; 39% for pork, ham, bacon, pork-based luncheon meats, and veal; 26% for chicken and fish; and 21% for liver), the RR>2.95 vs<1.57mg/day was 1.03 (95% CI = 0.84-1.25) in premenopausal women (1171 cases) and 0.97 95% CI = (0.98-1.20) in postmenopausal women (993 cases). Iron from breast cancer tissue was investigated in high risk population in a case-control nested in the cohort of the Kaiser Permanente Centre (Cui, Y. et al., 2007 , BRE80149) (248 cases). Breast cancer risk was positively related to iron levels in breast tissue. The RR Q5 vs Q1 was 1.56 (95% CI = 1.01-2.41); Ptrend = 0.08. In the subgroup of postmenopausal women the RR was 2.77 (95% CI = 1.25-6.13); Ptrend = 0.008. 5.6.3 Calcium Global Report, 2007 A meta-analysis of two studies on postmenopausal breast cancer showed no significant association (RR for 300 mg increase was 0.98, 95% CI = 0.96-1.01) (McCullough, M. L. et al., 2005 , BRE23368;Shin, M. H. et al., 2002 , BRE16658). In addition to these results, the Finnish cohort that was not included in the meta-analysis reported an inverse association of calcium intake with breast cancer (Jarvinen, R. et al., 1997 , BRE04383). An inverse significant association was also observed in the premenopausal women in the Nurses’ Health Study (Shin, M. H. et al., 2002 , BRE16658). Update Five new studies in relation to calcium were identified during the update, including the SUVIMAX study (Kesse-Guyot, E. et al., 2007 , BRE11112), Kaiser Permanente Northwest study (Cui, Y. et al., 2007 , BRE80149), Malmo Diet and Cancer study (Almquist, M. et al.,

104
2007 , BRE80007) and the Women’s Health Study (Lin, J. et al., 2007 , BRE80165) and the Boyd Orr Cohort (van der Pols, J. C. et al., 2007 , BRE80154). In addition, the CPS II Nutrition Cohort had also produced a new report (McCullough, M. L. et al., 2007 , BRE20022). Calcium from diet and/or supplements or total calcium A protective effect of dietary calcium was observed in the SUVIMAX study (Kesse-Guyot, E. et al., 2007 , BRE11112) (92 cases) The RR >1145 vs <806 mg/day was 0.50 (95% CI = 0.27- 0.91). The protective effect was both explained by calcium from dairy RR >734 vs. <421 mg/day = 0.58 (95% CI = 0.32-1.04) and non-dairy sources (RR >452 vs. <307 mg/day = 0.76, 95% CI = 0.42- 1.36). In the Women’s Health Study (Lin, J. et al., 2007 , BRE80165), a high intake of total calcium was associated with a lower risk of premenopausal breast cancer and the point estimate was statistically significant (RR >=1366 vs <617 mg/day = 0.61, 95% CI = 0.40-0.92). However, the results for postmenopausal women did not show any association between total calcium (also calcium from diet and calcium supplement) and breast cancer. Separate analysis of calcium intake from diet or from supplements showed a non-significant inverse association with premenopausal breast cancer. They also examined the relationship between total calcium and breast cancer by hormone receptor status but no association was found. In the Boyd Orr Cohort from the United Kingdom (van der Pols, J. C. et al., 2007 , BRE80154), dietary calcium intake during childhood was not related to breast cancer risk in adulthood. Gene-diet interactions The CPS II Nutrition Cohort reported postmenopausal women with the Bsm1 bb SNP in their VDR (vitamin D receptor) gene and consumed greater than the median intake of total calcium (≥902 mg/day) had lower odds of breast cancer compared to women with the Bb or BB genotype and less than the median intake (OR = 0.61, 95% CI = 0.38-0.96, P interaction = 0.01). Effect modifications with total calcium were also observed in Taq1 TT and the poly(a) LL tail (McCullough, M. L. et al., 2007 , BRE20022). Calcium level in tissue A positive non-significant association was observed between calcium in breast tissue and breast cancer risk in a study in the Kaiser Permanente Northwest (Cui, Y. et al., 2007 , BRE80149) (248 cases) (RR Q5 vs Q1= 1.44, 95% CI = 0.96-2.14). Calcium level in blood Serum calcium levels were inversely but not significantly related to breast cancer in a study in the Malmo Preventive Project, Sweden (Almquist, M. et al., 2007 , BRE80007) with 437 cases. The RR <2.28 vs >2.41mmol/liter was 0.89 (95% CI = 0.67-1.19). An inverse association was observed in women with BMI<25 kg/m2 (261 cases; RR <2.28 vs >2.41mmol/liter= 0.82, 95% CI = 0.56-2.28) but not in women with BMI≥25 kg/m2 (176 cases; RR <2.28 vs >2.41mmol/liter= 1.09, 95% CI = 0.68-1.74).

105
Due to the differences between the exposures, neither dose-response meta-analysis nor highest versus lowest forest plot are generated. 5.6.4 Selenium Global Report, 2007 Breast cancer was not related to blood levels of selenium (Criqui, M. H. et al., 1991 , BRE01946;Dorgan, J. F. et al., 1998 , BRE14889;Overvad, K. W. 1991 , BRE17893) or selenium in nail (Hunter, D. J. et al., 1990 , BRE04166;van den Brandt, P. A. et al., 1994 , BRE12721;van Noord, P. A. et al., 1987 , BRE12755;Van Noord, P. A. H. et al., 1993 , BRE16938). Update Intake of selenium was not related to postmenopausal breast cancer in a case-control study nested in the Diet, Cancer and Health study, Denmark (Ravn-Haren, G. et al., 2006 , BRE80151) (377 cases). The RR for 10 mg increase of intake of selenium was 1.01 (95% CI = 0.97-1.06). Selenium in breast tissue was not related to breast cancer risk in a study in the Kaiser Permanente Northwest, USA (Cui, Y. et al., 2007 , BRE80149) (248 cases). The RR Q5 vs Q1 was 1.06 (95 % CI = 0.7-1.62). 5.6.7 Zinc Global Report, 2007 No cohort study was identified. Significant protection was found in a German hospital based case-control study (Adzersen, K. H. et al., 2003 , BRE00180) and a significantly increased risk was observed in a Swiss hospital based case-control study (Levi, F. P. 2001 , BRE17747). Update Zinc in breast tissue was not related to breast cancer risk in a study in the Kaiser Permanente Northwest, USA (Cui, Y. et al., 2007 , BRE80149) (248 cases) (RR Q5 vs. Q1=1.32 (95% CI = 0.89-1.98). No study on zinc levels in breast tissue was identified during the SLR. 5.7.5 Phytoestrogens Global Report, 2007 Dietary phytoestrogens Only three cohort studies – the EPIC-Utrecht (Keinan-Boker, L. et al., 2004 , BRE04713), the California teachers cohort (Horn-Ross, P. L. et al., 2002 , BRE15412) and the JPHC study (Yamamoto, S. et al., 2003 , BRE17122) had reported dietary phytoestrogen data. Menopause age unspecified

106
In the California teachers cohort (Horn-Ross, P. L. et al., 2002 , BRE15412), no association was observed with intake of genistein, daidzein, biochanin A, formononentin, coumestrol, matairesinol or secoislariciresinol. Premenopause A statistically non-signficant inverse association with dietary isoflavone in the premenopausal women was reported by the JPHC sudy (RR for >=25 vs. <=6.9mg/day=0.66, 95% CI = 0.25-1.7, P
trend=0.97) (Yamamoto, S. et al., 2003 , BRE17122). Postmenopause The statistically signficant protective effect of dietary isoflavone remained among the postmenopausal Japanese women in the JPHC study (RR for >=25 vs. <=6.9mg/day=0.32, 95% CI 0.14-0.71, P trend=0.006) (Yamamoto, S. et al., 2003 , BRE17122). The dose-response meta-anaylsis of the JPHC study (Yamamoto, S. et al., 2003 , BRE17122) and the EPIC-Utrecht study from the Netherlands (Keinan-Boker, L. et al., 2004 , BRE04713) showed a borderline significant decreased risk with dietary isoflavone (summary RR for 1mg/day = 0.97, 95% CI = 0.95-1.00), but the result was contributed mostly by the significant effect observed in the Japanese study (weight = 99.8%). The Netherlands study also observed a statistically non-significant decreased risk with lignans (matairesinol and secoisolariciresinol) (RR for 0.77 vs. 0.59mg/day=0.7, 95% CI = 0.46-1.09) (Keinan-Boker, L. et al., 2004 , BRE04713). Biomarkers – serum and urinary phytoestrogen Six cohorts had investigated phytoestrogens using biomarkers – the New York Women’s Health Study (Zeleniuch-Jacquotte, A. et al., 2004 , BRE13929), the EPIC-Norfolk (Grace, Philip et al., 2004 , BRE19680), the Danish Diet, Cancer and Health study (another component of the EPIC study) (Olsen, A. et al., 2004 , BRE80170), the Dom project from Utrecht (Den Tonkelaar, I. et al., 2001 , BRE14840), one Finnish cohort (Kilkkinen, A. V. 2004 , BRE17698) and one Italian cohort (Boccardo, F. et al., 2004 , BRE05549). In addition, a pooling study was performed using data from the Västerbotten Intervention Project, the Monitoring of Trends and Cardiovascular Disease study and the Mammary Screening Project (Hulten, K. et al., 2002 , BRE04156). Breast cancer was not associated with serum levels of phytoestrogens in a Finnish study nor in a New York study, neither in pre- nor in postmenopausal women (Kilkkinen, A. V. 2004 , BRE17698;Zeleniuch-Jacquotte, A. et al., 2004 , BRE13929). Plasma enterolactone was investigated in the Diet, Cancer and Health study, Denmark (Olsen, A. et al., 2004 , BRE80170). No association was observed with postmenopausal breast cancer and ER+ cancers. The study showed a protective effect of plasma enterolactone in ER– breast cancers. While the Swedish study that pooled together data from 3 cohort studies found a significant positive association with plasma enterolactone (RR for 39.1-143.5 vs. 10.2-27.39 µmol/L=1.8, 95% CI = 1.4-4.3) (Hulten, K. et al., 2002 , BRE04156).

107
In the EPIC Norfolk cohort (Grace, Philip et al., 2004 , BRE19680) significant positive associations were observed with serum and urine levels of equol and with serum daidzen levels. No significant associations were observed with both serum and urine levels of O-DMA, genistein, glycitein, enterodiol and enterolactone and with urinary daidzein. Serum enterolactone was inversely related to breast cancer in women with breast cyst disease in the same cohort (Boccardo, F. et al., 2004 , BRE05549). In the DOM Dutch cohort, urinary excretion of genistein and enterolactone were not related to postmenopausal breast cancer risk (Den Tonkelaar, I. et al., 2001 , BRE14840). Update Dietary phytoestrogens Two cohort studies had published three reportes on dietary phytoestrogen during the update. Both are component cohorts of the EPIC study – the Oxford centre (Travis, R. C. et al., 2007 , BRE80141) and the centre from France (Touillaud, M. S. et al., 2007 , BRE80015;Touillaud, M. S. et al., 2006 , BRE80111). Menopause age unspecified The EPIC – Oxford study found no evidence for a strong association with dietary isoflavone (RR for >=20 vs. <10mg/day=1.10 (95% CI = 0.75-1.61) (Travis, R. C. et al., 2007 , BRE80141). Premenopause There was no evidence of an association between dietary intake of phytoestrogens and risk of premenopausal breast cancer in the French EPIC-E3N study (Touillaud, M. S. et al., 2006 , BRE80111). The relative risks for the highest vs. the lowest quartile of intake were 1.00 (95% CI = 0.76-1.31) for total isoflavones (sum of individual isoflavones, lignans and enterolignans); 1.22 (95% CI = 0.89-1.66) for coumestrol, 1.07 (95% CI = 0.81-1.41) and 0.94 (95% CI = 0.71-1.24) for total enterolignans. The EPIC-Oxford study also reported no association with dietary isoflavone in the premenopausal women (RR for >=10 vs. <10mg/day=1.31, 95% CI = 0.95-1.81) (Travis, R. C. et al., 2007 , BRE80141). Postmenopause The EPIC-Oxford study reported no association with dietary isoflavone in postmenopausal women (RR for >=10 vs. <10mg/day=0.95, 95% CI = 0.66-1.38) and HRT non-users (RR for >=10 vs.
<10mg/day=1.16, 95% CI = 0.92-1.48) (Travis, R. C. et al., 2007 , BRE80141). The dietary intake of four plant lignans (pinoresinol, lariciresinol, secoisolariciresinol, and matairesinol) and two enterolignans (enterodiol and enterolactone) estimated through dietary questionnaires was examined in relation to postmenopausal breast cancer in the French EPIC-E3N study (Touillaud, M. S. et al., 2007 , BRE80015). Total plant lignans were inversely related to postmenopausal breast cancer (RR >1395 vs. <878 µg/day =0.83 (95% CI = 0.71-0.96) Ptrend=0.02). Inverse but not significant associations were observed with enterodiol and enterolactone (Ptrend=0.07 and 0.08, respectively).

108
Further analyses stratified by hormone receptor status showed that the inverse associations between phytoestrogen intakes and postmenopausal breast cancer risk were limited to ER- and PR-positive disease (e.g., RR for highest versus lowest quartiles of total plant lignan intake = 0.72, 95% CI = 0.58-0.88, Ptrend = 0.01, 174 versus 214 cases per 100 000 person-years, and RR for highest versus lowest quartiles of total enterolignan level = 0.77, 95% CI = 0.62-0.95, Ptrend = 0.01, 164 versus 204 cases per 100 000 person-years). Biomarkers - plasma phytoestrogens
In the EPIC-Utrecht cohort study (Verheus, M. et al., 2007 , BRE20024) (388 cases), plasma samples were analysed for three isoflavones (daidzein, genistein, and glycitein), two metabolites of daidzein (O-DMA and equol), and two mammalian lignans (enterodiol and enterolactone). High genistein circulation levels are associated with reduced breast cancer risk in this Dutch population. The risk estimate for the highest versus the lowest tertile was 0.68 (95% CI = 0.47-0.98). Similar inverse associations, although not statistically significant, were seen for the other isoflavones. No effects of lignans on breast cancer risk were observed. Results were the same in pre- or perimenopausal women, and in postmenopausal women.
6. Physical activity Global Report, 2007 In the 2007 Global Report, dose-response meta-analysis and highest versus lowest forest plot was conducted only on recreational physical activity and postmenopausal breast cancer mainly because of the lack of consistency on exposure definition. The wide variability in the measurement methods of physical activity-related exposures between studies, made it difficult to pool the results together. In this report, we have presented forest plots for four types of physical activities. Below shows a list of the groups of physical activities used and their definitions in the articles: 1. Total physical activity (total PA): variables that include several kinds of activities combined, e.g. combined occupational, recreational and household activities; or combined recreational and household activities; or recreational activity when it includes sitting/walking time, stair climbing and city block walking, since these activities are not considered as recreational activity but more like daily routine physical activities. Seven studies were retrieved from the SLR database, with six of them measured total physical activity (overall summary measures) (Cerhan, J. R. et al., 1998 , BRE14588;Colditz, G. A. et al., 2003 , BRE01782;Dorgan, J. F. et al., 1994 , BRE02385;Hoyer, A. P. et al., 1998 , BRE15433;Lee, S. Y. K. 2003 , BRE17745;Wyrwich, K. W. and Wolinsky, F. D. 2000 , BRE13664) and one measured recreational physical activity (Margolis, K. L. et al., 2005 , BRE23306) (Women’s Lifestyle and Health Study); however, because their measure included daily routine activities such as sitting we had re-classified the exposure as “total physical activity”. 2. Recreational physical activity (recreational PA): variables that include physical activity in leisure time. Twelve studies were retrieved from the SLR database (Albanes, D. et al., 1989 , BRE00236;Colditz, G. A. et al., 2003 , BRE01782;Dirx, M. J. et al., 2001 , BRE02326;Drake,

109
D. A. 2001 , BRE02418;Lee, I. M. et al., 2001 , BRE15848;Margolis, K. L. et al., 2005 , BRE23306;Mertens, A. J. et al., 2005 , BRE23405;Moore, D. B. et al., 2000 , BRE16124;Patel, A. V. et al., 2003 , BRE16299;Schnohr, P. et al., 2005 , BRE24028;Sesso, H. D. et al., 1998 , BRE16626;Thune, I. et al., 1997 , BRE12313). 3. Occupational physical activity (occupational PA): variables that include work-related physical activity. Five prospective studies (seven reports) were retrieved from the SLR database (Albanes, D. et al., 1989 , BRE00236;Byrne, C. et al., 1996 , BRE05719;Dirx, M. J. et al., 2001 , BRE02326;Mertens, A. J. et al., 2005 , BRE23405;Moradi, T. et al., 1999 , BRE16127;Steenland, K. et al., 1995 , BRE11742;Thune, I. et al., 1997 , BRE12313). Two of them were the NHANES I (Albanes, D. et al., 1989 , BRE00236;Steenland, K. et al., 1995 , BRE11742) and one was the NHEFS (Byrne, C. et al., 1996 , BRE05719) – a follow up study of the NHANES. 4. Vigorous physical activity (vigorous PA): any type of vigorous activity, e.g. vigorous recreational activity and total vigorous physical/recreational activity. Nine prospective studies were retrieved from the SLR database (Chang, S. C. et al., 2003 , BRE18295;Dallal, C. M. et al., 2007 , BRE80016;Dorgan, J. F. et al., 1994 , BRE02385;Drake, D. A. 2001 , BRE02418;Lee, I. M. et al., 2001 , BRE15848;McTiernan, A. K. 2003 , BRE17819;Moore, D. B. et al., 2000 , BRE16124;Silvera, S. A. et al., 2006 , BRE24118;Vena, J. E. et al., 1987 , BRE12852). Two of them measured specific types of vigorous physical activity: the ACLS cohort (Drake, D. A. 2001 , BRE02418) assessed vigorous racquet sports and the Washington State Study (Vena, J. E. et al., 1987 , BRE12852) assessed vigorous occupational physical activity. Therefore, both were excluded. Update Six prospective cohort studies have been published over the period Jan 2006 and Dec 2007 in relation to physical activity and breast cancer (Bardia, A. et al., 2006 , BRE20028;Chang, S. C. et al., 2006 , BRE80110;Dallal, C. M. et al., 2007 , BRE80016;Ericson, U. et al., 2007 , BRE80128;Lahmann, P. H. et al., 2007 , BRE20026;Tehard, B. et al., 2006 , BRE80108). Overall, thirty-seven reports on physical activity in relation to breast cancer have been identified during the SLR and the Continuous Update. Fourteen reports are not included in the forest plots due to the following reasons:
One study that provided RR for a continuous variables (Dorgan, J. F. et al., 1994 , BRE02385).
Studies that used a specific population, e.g. former college athletes compared to non-athletes (Wyshak, G. and Frisch, R. E. 2000 , BRE13666) or elderly (age 70+) (Wyrwich, K. W. and Wolinsky, F. D. 2000 , BRE13664) or fitness centre members (Drake, D. A. 2001 , BRE02418).
EPIC component study (Ericson, U. et al., 2007 , BRE80128) also included in the report of the overall EPIC study.
Two or more studies reported on the same population (Breslow, R. A. et al., 2001 , BRE01123;Cerhan, J. R. et al., 1998 , BRE14588;Steenland, K. et al., 1995 , BRE11742).

110
Outcome was cancer mortality (Vena, J. E. et al., 1987 , BRE12852). Studies that measured physical activities during different periods of life, e.g. age 14 to
30 (Margolis, K. L. et al., 2005 , BRE23306) or high recreational PA in teens (Frisch, R. E. et al., 1985 , BRE02992;Frisch, R. E. et al., 1987 , BRE02995), which made it hard to compare with other study variables.
Uncommon exposure – e.g. sitting time index during working hours (Pukkala, E. et al., 1993 , BRE24790;Zheng, W. et al., 1993 , BRE13994).
Studies that provided a combined variable, for example in the AHS cohort, they measured “exercise” containing information relating to both occupational and leisure/recreational activities. In this case, it is difficult to determine which group this kind of variable should fit in (Fraser, G. E. and Shavlik, D. 1997 , BRE02940).
Postmenopause Five new studies on physical activity and postmenopausal breast cancer were identified during the update period: Iowa Women’s Health Study (Bardia, A. et al., 2006 , BRE20028), California Teachers Study (Dallal, C. M. et al., 2007 , BRE80016), Malmo Diet and Cancer Study (Ericson, U. et al., 2007 , BRE80128) EPIC Study (Lahmann, P. H. et al., 2007 , BRE20026) and PLCO Cancer Screening Trial Cohort (Chang, S. C. et al., 2006 , BRE80110). Of those five studies, the Iowa Women’s Health Study provided results for recreational physical activity; the NBSS study provided results for vigorous physical activity; the EPIC study provided results for total physical activity, occupational and recreational physical activity; the PLCO Cancer Screening Trial Cohort provided results for recreational physical activity. The Malmo Diet and Cancer Study was excluded because it is a component study of the EPIC. Fig P1 shows a high vs. low forest plot on physical activity-related variables and postmenopausal breast cancer. Total physical activity The two studies identified (Lahmann, P. H. et al., 2007 , BRE20026;Sesso, H. D. et al., 1998 , BRE16626) reported a significant inverse association between total physical activity and postmenopausal breast cancer (RR = 0.83, 95% CI = 0.73-0.95 and RR = 0.49, 95% CI = 0.28-0.86, respectively). Vigorous physical activity Two studies (Moore, D. B. et al., 2000 , BRE16124;Silvera, S. A. et al., 2006 , BRE24118) reported a non-significant inverse association between vigorous physical activity and postmenopausal breast cancer risk. Two studies showed no association (Moore, D. B. et al., 2000 , BRE16124;Silvera, S. A. et al., 2006 , BRE24118). Occupational activity Four out of five studies reported a non-significant decreased risk of breast cancer with high levels of occupational activity (Albanes, D. et al., 1989 , BRE00236;Dirx, M. J. et al., 2001 , BRE02326;Mertens, A. J. et al., 2005 , BRE23405;Thune, I. et al., 1997 , BRE12313). However, the EPIC reported a small non-significant increased disease risk (Lahmann, P. H. et al., 2007 , BRE20026).
111
Recreational activity Nine studies showed that recreational activity was associated with a decreased risk of breast cancer in postmenopausal women, in which three of them showed significant inverse associations (Chang, S. C. et al., 2006 , BRE80110;Dirx, M. J. et al., 2001 , BRE02326;McTiernan, A. K. 2003 , BRE17819). On the contrary, two studies reported a non-significant increased cancer risk (Mertens, A. J. et al., 2005 , BRE23405;Schnohr, P. et al., 2005 , BRE24028), including the Copenhagen Center for Prospective Studies and the Atherosclerosis risk in communities study. Premenopause Total physical activity The EPIC study was the only prospective cohort study on total physical activity and premenopausal breast cancer identified during the update period (Lahmann, P. H. et al., 2007 , BRE20026). It provided results for total physical activity, occupational physical activity and recreational physical activity. The results, together with those of the cohort studies retrieved during the SLR are included in a forest plot showing the relative risks of the highest vs. the lowest category of total physical activity, vigorous physical activity, occupational activity, and recreational physical activity. The EPIC study (Lahmann, P. H. et al., 2007 , BRE20026) showed a borderline significant inverse association of total physical activity level with risk of premenopausal breast cancer. Two studies reported no association (Colditz, G. A. et al., 2003 , BRE01782;Lee, S. Y. K. 2003 , BRE17745) and in two studies there was a non-significant increased risk associated with physical activity (Margolis, K. L. et al., 2005 , BRE23306;Sesso, H. D. et al., 1998 , BRE16626). One of these studies was on college alumni (Sesso, H. D. et al., 1998 , BRE16626). Vigorous physical activity The NBSS (Silvera, S. A. et al., 2006 , BRE24118) was the only study on vigorous physical activity and premenopausal breast cancer; therefore, high vs. low forest plots are not given. Occupational activity The Norway National Health Screening Service Study (Thune, I. et al., 1997 , BRE12313) showed that occupational activity was associated with significant decreased risk of cancer in premenopausal women (RR = 0.48, 95%CI = 0.24-0.95). On the other hand, the NHANES I (Albanes, D. et al., 1989 , BRE00236) reported a non-significant positive relationship with very wide confidence intervals (RR = 2.5, 95%CI = 0.59-10.60). The EPIC study and a Swedish cohort (Moradi, T. et al., 1999, BRE16127) both observed no association. Recreational physical activity Two out of three studies, including the EPIC study (Lahmann, P. H. et al., 2007 , BRE20026) reported a non-significant inverse association between recreational physical activity and premenopausal breast cancer risk. Again, the NHANES I observed a non-significant increased risk.

112
xiii. Fig P1 Highest vs. lowest forest plot on physical activity and postmenopausal breast cancer (**=new studies identified during the update)
.
.
.
.
Total Physical Activity ** Lahmann et al. (2007) Sesso, H.D. (1998) Vigorous Physical Activity ** Dallal et al. (2007) Silvera, S. A. N. (2005) McTiernan, A. (2003) Moore, D. B. (2000) Occupational Physical Activity ** Lahmann et al. (2007) Mertens, A. J. (2005) Dirx, M. J. (2001) Thune, I. (1997) Albanes (1989) Recreational Physical Activity ** Lahmann et al. (2007) ** Bardia et al. (2006) ** Chang S.C. (2006) Mertens, A. J. (2005) Schnohr P. (2005) McTiernan, A. (2003) Patel, A.V. (2003) Dirx, M. J. (2001) Lee, I.-M. (2001) Thune, I. (1997) Albanes (1989)
ID Study
0.83 (0.73, 0.95) 0.49 (0.28, 0.86)
0.90 (0.74, 1.10) 1.00 (0.78, 1.29) 0.91 (0.68, 1.22) 1.05 (0.72, 1.53)
1.08 (0.91, 1.29) 0.85 (0.57, 1.27) 0.83 (0.51, 1.35) 0.78 (0.52, 1.17) 0.67 (0.33, 1.34)
0.96 (0.85, 1.08) 0.91 (0.82, 1.01) 0.78 (0.61, 0.99) 1.06 (0.64, 1.75) 1.12 (0.82, 1.52) 0.78 (0.61, 0.99) 0.85 (0.49, 1.49) 0.76 (0.58, 0.99) 0.67 (0.44, 1.02) 0.67 (0.41, 1.10) 0.59 (0.31, 1.12)
RR (95% CI) High vs.Low
BRE20026 BRE16626
BRE80016 BRE24118 BRE17819 BRE16124
BRE20026 BRE23405 BRE02326 BRE12313 BRE00236
BRE20026 BRE20028 BRE80110 BRE23405 BRE24028 BRE17819 BRE16299 BRE02326 BRE15848 BRE12313 BRE00236
WCRF_Code
EPIC College Alumni Health Study
California Teachers Study NBSS Women's Health Initiative Observational Study Iowa Women's Health Study
EPIC Atherosclerosis Risk in Communities Study The Netherlands Cohort Study on diet and cancer Norway National Health Screening Service NHANES I
EPIC Iowa Women's Health Study PLCO Cancer Screening Trial Cohort Atherosclerosis Risk in Communities Study Copenhagen Center for Prospective Population Studies Women's Health Initiative Observational Study CPS-II US cohort The Netherlands Cohort Study on diet and cancer Women's Health Study Norway National Health Screening Service NHANES I
StudyDescription
> 127.0 vs. < 54.0 > 1000.0 vs. < 499.0
> 5.01 vs. 0 - 0.5 > 60.0 vs. < 0.0 > 4.0 vs. < 0.0 >4 vs. rarely/never
Manual & heavy manual vs. sedentary Quantile 4 vs. Quantile 1 > 12.1 vs. < 7.9 Lifting/heavy manual vs. sedentary Very active vs. quite inactive
> 43.0 vs. < 13.0 Quantile 3 vs. Quantile 1 > 4.0 vs. 0 Quantile 4 vs. Quantile 1 Vigorous vs. low > 40.1 vs. < 0.0 >31.5 vs. <0.0 > 91.0 vs. < 29.0 > 6300.0 vs. < 839.0 Regular exercise vs. sedentary Moderate vs. little/no exercise
contrast
MET-hour Kcal/week
hours/week min/day hours/week times/week
KJ/min
MET-hour/week hours/week
MET-hour/week MET-hour/week min/day KJ/week
Units
0.83 (0.73, 0.95) 0.49 (0.28, 0.86)
0.90 (0.74, 1.10) 1.00 (0.78, 1.29) 0.91 (0.68, 1.22) 1.05 (0.72, 1.53)
1.08 (0.91, 1.29) 0.85 (0.57, 1.27) 0.83 (0.51, 1.35) 0.78 (0.52, 1.17) 0.67 (0.33, 1.34)
0.96 (0.85, 1.08) 0.91 (0.82, 1.01) 0.78 (0.61, 0.99) 1.06 (0.64, 1.75) 1.12 (0.82, 1.52) 0.78 (0.61, 0.99) 0.85 (0.49, 1.49) 0.76 (0.58, 0.99) 0.67 (0.44, 1.02) 0.67 (0.41, 1.10) 0.59 (0.31, 1.12)
RR (95% CI) High vs.Low
BRE20026 BRE16626
BRE80016 BRE24118 BRE17819 BRE16124
BRE20026 BRE23405 BRE02326 BRE12313 BRE00236
BRE20026 BRE20028 BRE80110 BRE23405 BRE24028 BRE17819 BRE16299 BRE02326 BRE15848 BRE12313 BRE00236
WCRF_Code
1 .28 1 3.5
8

113
xiv. Fig P2 Highest vs. lowest forest plot on physical activity-related variables and premenopausal breast cancer (**=new studies identified during the update)
.
.
.
Total Physical Activity ** Lahmann et al. (2007) Margolis, K. L. (2005) Colditz, G. A. (2003) Lee, S. Y. (2003) Sesso, H.D. (1998)
Occupational Physical Activity ** Lahmann et al. (2007) Moradi, T. (1999) Thune, I. (1997) Albanes (1989)
Recreational Physical Activity ** Lahmann et al. (2007) Thune, I. (1997) Albanes (1989)
ID Study
0.82 (0.66, 1.02) 1.24 (0.85, 1.81) 1.04 (0.82, 1.32) 1.00 (0.73, 1.37) 1.83 (0.77, 4.33)
1.04 (0.78, 1.38) 1.00 (0.76, 1.32) 0.48 (0.24, 0.95) 2.50 (0.59, 10.60)
0.94 (0.76, 1.16) 0.53 (0.25, 1.13) 1.67 (0.83, 3.33)
RR (95% CI)
High vs.Low
BRE20026 BRE23306 BRE01782 BRE17745 BRE16626
BRE20026 BRE16127 BRE12313 BRE00236
BRE20026 BRE12313 BRE00236
WCRF_Code
EPIC Women's Lifestyle and Health Study NHS II Korean Women's Cohort (KWC), 1994/1995 College Alumni Health Study
EPIC Sweden, 1971 Norway National Health Screening Service NHANES I
EPIC Norway National Health Screening Service NHANES I
StudyDescription
> 127.0 vs. < 54.0 Vigorous vs. none > 27.0 vs. < 2.9 Quantile 2 vs. Quantile 1 > 1000.0 vs. < 499.0
Manual & heavy manual vs. sedentary Very high/high vs. sedentary Lifting/heavy manual vs. sedentary Very active vs. quite inactive
> 43.0 vs. < 13.0 Regular exercise vs. sedentary Moderate vs. little/no exercise
contrast
MET-hour
MET-hour
Kcal/week
MET-hour/week
Units
0.82 (0.66, 1.02) 1.24 (0.85, 1.81) 1.04 (0.82, 1.32) 1.00 (0.73, 1.37) 1.83 (0.77, 4.33)
1.04 (0.78, 1.38) 1.00 (0.76, 1.32) 0.48 (0.24, 0.95) 2.50 (0.59, 10.60)
0.94 (0.76, 1.16) 0.53 (0.25, 1.13) 1.67 (0.83, 3.33)
RR (95% CI)
High vs.Low
BRE20026 BRE23306 BRE01782 BRE17745 BRE16626
BRE20026 BRE16127 BRE12313 BRE00236
BRE20026 BRE12313 BRE00236
WCRF_Code
1 .0943 1 10.
6

114
Menopause age unspecified Update Two prospective cohort studies on physical activity and unspecified breast cancer were identified during the update period: The California Teachers Study (Dallal, C. M. et al., 2007 , BRE80016) and French EPIC-E3N study (Tehard, B. et al., 2006 , BRE80108). The California Teachers Study provided results for vigorous physical activity. The French EPIC-E3N study provided results for total physical activity, vigorous physical activity and recreational physical activity. The results for the highest vs. the lowest category of exposure are shown in forest plots, (Fig P3) including three studies for total physical activity, five studies for vigorous physical activity, four studies for occupational physical activity and five studies for recreational physical activity identified during the SLR and the Continuous Update. Total Physical Activity The French EPIC-E3N study, College Alumni Health Study and Copenhagen CHS (Hoyer, A. P. et al., 1998 , BRE15433;Sesso, H. D. et al., 1998 , BRE16626;Tehard, B. et al., 2006 , BRE80108) reported non-significant decreased risk of breast cancer with increasing levels of total physical activity. The Framingham Study (Dorgan, J. F. et al., 1994 , BRE02385) showed a non-significant increased risk. Vigorous Physical Activity Overall, four studies observed a protective effect of vigorous physical activity on breast cancer with unspecified menopausal status. In three of them, the results were statistically (RR = 0.62, 95%CI = 0.49-0.78; RR = 0.80, 95% CI = 0.69-0.93) (Dallal, C. M. et al., 2007 , BRE80016;Tehard, B. et al., 2006 , BRE80108) or borderline significant (RR = 0.83, 95% CI = 0.69-1.00) (Chang, S. C. et al., 2003 , BRE18295), respectively. The Women’s Health Study (Lee, I. M. et al., 2001 , BRE15848) did not show any association. Occupational Physical Activity The Norway National Health Screening Service Study (Thune, I. et al., 1997 , BRE12313) reported a significant inverse association between occupational activity and risk of unspecified breast cancer (RR = 0.48, 95%CI = 0.25-0.92). The Atherosclerosis Risk in Communities Study (Mertens, A. J. et al., 2005 , BRE23405) and the NHEFS (Byrne, C. et al., 1996 , BRE05719) also showed similar association but not significant. A Swedish cohort (Moradi, T. et al., 1999, BRE16127) has reported a borderline statistically significant protective effect against breast cancer with a RR of 0.91 (95%CI = 0.83-1.00). Recreational Physical Activity In two studies, increasing levels of recreational activity was associated with reduced risk of breast cancer in women with unspecified menopausal status (RR = 0.81, 95%CI = 0.72-0.92; RR = 0.63, 95% CI = 0.42-0.95, respectively) (Tehard, B. et al., 2006 , BRE80108;Thune, I. et al., 1997 , BRE12313). Two studies (NHANES I and ARIC Study) reported no association (Albanes, D. et al., 1989 , BRE00236;Mertens, A. J. et al., 2005 , BRE23405). The Womens’ Health Study and College Alumni Health Study observed a non-significant decreased breast

115
cancer risk (RR = 0.80; 95%CI = 0.58-1.11; RR = 0.73; 95%CI = 0.46-1.15, respectively) (Lee, I. M. et al., 2001 , BRE15848;Sesso, H. D. et al., 1998 , BRE16626). Published meta-analysis A systematic review provided qualitative summaries of the association of breast cancer and physical activity in a recently published review including nineteen cohort studies. There was evidence for an inverse association between physical activity and postmenopausal breast cancer, with risk reduction ranging from 20% to 80%. For premenopausal breast cancer, however, the evidence was much weaker (Monninkhof EM et al., 2007).

116
xv. Fig P3 Highest vs. lowest forest plot on physical activity and breast cancer (menopause age unspecified) (**=new studies)
.
.
.
.
Total Physical Activity ** Tehard B. (2006) Hoyer, A. P. (1998) Sesso, H.D. (1998) Dorgan, J. F. (1994)
Vigorous Physical Activity ** Dallal et al. (2007) ** Tehard B. (2006) Silvera, S. A. N. (2005) Chang, S. C. (2003) Lee, I.-M. (2001)
Occupational Physical Activity Mertens, A. J. (2005) Moradi, T. (1999) Thune, I. (1997) Byrne, C. (1996)
Recreational Physical Activity ** Tehard B. (2006) Mertens, A. J. (2005) Lee, I.-M. (2001) Sesso, H.D. (1998) Thune, I. (1997) Albanes (1989)
ID Study
0.90 (0.80, 1.02) 0.72 (0.44, 1.18) 0.73 (0.46, 1.15) 1.60 (0.89, 2.87)
0.80 (0.69, 0.93) 0.62 (0.49, 0.78) 0.93 (0.78, 1.10) 0.83 (0.69, 1.00) 0.98 (0.69, 1.40)
0.87 (0.61, 1.24) 0.91 (0.83, 1.00) 0.48 (0.25, 0.92) 0.45 (0.18, 1.12)
0.81 (0.72, 0.92) 1.00 (0.64, 1.55) 0.80 (0.58, 1.11) 0.73 (0.46, 1.15) 0.63 (0.42, 0.95) 1.00 (0.61, 1.63)
RR (95% CI) High vs.Low
BRE80108 BRE15433 BRE16626 BRE02385
BRE80016 BRE80108 BRE24118 BRE18295 BRE15848
BRE23405 BRE16127 BRE12313 BRE05719
BRE80108 BRE23405 BRE15848 BRE16626 BRE12313 BRE00236
WCRF_Code
E3N-EPIC, 1990 CopenhagenCHS College Alumni Health Study Framingham Study
California Teachers Study E3N-EPIC, 1990 NBSS BCDDP Women's Health Study
Atherosclerosis Risk in Communities Study Sweden, 1971 Norway National Health Screening Service NHEFS
E3N-EPIC, 1990 Atherosclerosis Risk in Communities (ARIC) Study, 1987 Women's Health Study, 1993 College Alumni Health Study Norway National Health Screening Service, 1974 NHANES I, 1971
StudyDescription
> 57.8 vs. < 28.2 Heavy vs. passive > 1000.0 vs. < 499.0 High vs. low physical activity index
> 5.01 vs. 0 - 0.5 > 5.0 vs. 0 > 60.0 vs. < 0.0 > 4.0 vs. < 3.9 > 4200.0 vs. < 0.0
Quantile 4 vs. Quantile 1 Very high/high vs. sedentary Lifting/heavy manual vs. sedentary Very active vs. quite inactive
> 33.8 vs. 0 Quantile 4 vs. Quantile 1 > 6300.0 vs. < 839.0 > 1000.0 vs. < 499.0 Regular exercise vs. sedentary Moderate vs. little/no exercise
contrast
MET-hour/week
Kcal/week
hours/week MET-hour/week min/day hours/week KJ/week
MET-hour/week
KJ/week Kcal/week
Units
0.90 (0.80, 1.02) 0.72 (0.44, 1.18) 0.73 (0.46, 1.15) 1.60 (0.89, 2.87)
0.80 (0.69, 0.93) 0.62 (0.49, 0.78) 0.93 (0.78, 1.10) 0.83 (0.69, 1.00) 0.98 (0.69, 1.40)
0.87 (0.61, 1.24) 0.91 (0.83, 1.00) 0.48 (0.25, 0.92) 0.45 (0.18, 1.12)
0.81 (0.72, 0.92) 1.00 (0.64, 1.55) 0.80 (0.58, 1.11) 0.73 (0.46, 1.15) 0.63 (0.42, 0.95) 1.00 (0.61, 1.63)
RR (95% CI) High vs.Low
BRE80108 BRE15433 BRE16626 BRE02385
BRE80016 BRE80108 BRE24118 BRE18295 BRE15848
BRE23405 BRE16127 BRE12313 BRE05719
BRE80108 BRE23405 BRE15848 BRE16626 BRE12313 BRE00236
WCRF_Code
1 .181 1 5.5
2

117
6.1.1.3 Household activity Global Report, 2007 One prospective study investigated the effect of household activity on breast cancer (Drake, D. A. 2001 , BRE02418) – the Aerobic Center Longitudinal Study, 1970 (ACLS, 1970, from the US). The study population was fitness centre members and the number of participants was 4520, in which 150 were incident cases. Relative risk and 95% confidence intervals were not given. Their results showed participants with breast cancer on average did 6.68 times/sessions of housework per week, compared to 7.04 times/sessions among those without breast cancer (t = 0.37, non-significant p-value). Update Three articles were identified during the update, in which one is the EPIC (Lahmann, P. H. et al., 2007 , BRE20026) and two are components of EPIC from Sweden and France (Ericson, U. et al., 2007 , BRE80128;Tehard, B. et al., 2006 , BRE80108). The EPIC had a study population of 218169 (3423 incident cases: 856 premenopausal women and 2547 postmenopausal cases) (Lahmann, P. H. et al., 2007 , BRE20026). Household activity was measured as MET-hour per week. Their result suggested a statistically significant inverse association between household physical activity and risk of both premenopausal and postmenopausal breast cancer. The RRs >90 vs. <28 MET-h/week were 0.71 (95% CI = 0.55-0.99; Ptrend = 0.003) and 0.81 (95% CI = 0.7-0.93; Ptrend = 0.001) for premenopausal and postmenopausal breast cancer, respectively. They also looked at combined recreational and household activity and found significant reduced risk in postmenopausal breast cancer (multivariate adjusted RR >126 vs. <55 MET-h/week = 0.83, 95%CI = 0.73-0.95; Ptrend = 0.002), but not in premenopausal breast cancer. In addition, they presented country-specific multivariate adjusted RRs (only presented for countries with >=50 cases) in relation to continuous household activity by 20MET-h/week. An increase of one increment of household activity (20MET-h/week) was associated with a pooled HR of 0.96 (95% CI = 0.92-1.00; Ptrend = 0.06) in premenopausal women and 0.97 (95% CI = 0.94-0.99; Ptrend = 0.008) in postmenopausal women. The paper stated that household activity is one of the main sources of physical activity for women in most developed countries. In addition, this evidence was supported by a number of case-control studies, including a Canadian population-based case-control study (Friedenreich, C. M. et al., 2001 , BRE02973). Because there were only two studies altogether, neither dose-response meta-analysis nor highest versus lowest forest plot was conducted. 7. Energy balance 7.1 Energy intake Global Report, 2007 Fourteen cohort studies had published a total of 23 reports on energy intake. One report each had been published by the Adventist Health Study (Fraser, G. E. and Shavlik, D. 1997 , BRE02940), the California Teachers Study (Horn-Ross, P. L. et al., 2002 , BRE15412), the Malmo Diet and Cancer study (Wirfalt, E. et al., 2004 , BRE17083), the Mobile Clinic Health

118
Examination Survey (Knekt, P. et al., 1990 , BRE04898), the New York State Cohort (Graham, S. et al., 1992 , BRE03424), the Norway National Health Screening Service (Gaard, M. T. 1995 , BRE17516), the ORDET study (Sieri, S. et al., 2002 , BRE20941) and the Rancho Bernardo Study (Barrett-Connor, E. and Friedlander, N. J. 1993 , BRE00581). And two reports each were from the BCDDP study (Chang, S. C. et al., 2003 , BRE18295;Velie, E. et al., 2000 , BRE12851), the National Breast Cancer Screening Study (Howe, G. R. F. 1991 , BRE17622;Silvera, S. A. et al., 2006 , BRE24118), the Netherlands Cohort Study on Diet and Cancer (van den Brandt, P. A. et al., 1993 , BRE16919;Voorrips, L. E. et al., 2002 , BRE13011), the Iowa Women’s Health Study (Kushi, L. H. et al., 1992 , BRE05141;Kushi, L. H. et al., 1995 , BRE05142) and NHANES I (Jones, D. Y. et al., 1987 , BRE04461) and its follow-up study (NHEFS) (Byrne, C. et al., 1996 , BRE05719). In addition, the Nurses’ Health Study had published five reports (Byrne, C. et al., 2002 , BRE01315;Frazier, A. L. et al., 2004 , BRE02942;Giovannucci, E. et al., 1993 , BRE03262;Holmes, M. D. et al., 1999 , BRE04008;Willett, W. C. et al., 1992 , BRE13438) Menopause age unspecified A meta-analysis of seven studies of women of any age indicated no association between energy intake and breast cancer risk (RR = 1.00, 95% CI= 0.98-1.02 for an increase of 300 kcal/day, non-significant heterogeneity) (Byrne, C. et al., 1996 , BRE05719;Gaard, M. T. 1995 , BRE17516;Holmes, M. D. et al., 1999 , BRE04008;Howe, G. R. F. 1991 , BRE17622;Silvera, S. A. et al., 2006 , BRE24118;van den Brandt, P. A. et al., 1993 , BRE16919;Willett, W. C. et al., 1992 , BRE13438). Three other studies gave RR point estimates of high versus low values around 1 (Fraser, G. E. and Shavlik, D. 1997 , BRE02940;Horn-Ross, P. L. et al., 2002 , BRE15412;Knekt, P. et al., 1990 , BRE04898) and one reported a significant positive association (Chang, S. C. et al., 2003 , BRE18295). Postmenopause No significant association was observed in the meta-analysis of five studies of postmenopausal breast cancer (OR increase of 300 kcal/day = 0.98, 95% CI = 0.98-1.01) with significant heterogeneity (I2 = 69%, not explained by meta-regression) (Barrett-Connor, E. and Friedlander, N. J. 1993 , BRE00581;Graham, S. et al., 1992 , BRE03424;Holmes, M. D. et al., 1999 , BRE04008;Kushi, L. H. et al., 1992 , BRE05141;Wirfalt, E. et al., 2004 , BRE17083). Five other studies reported no association (Giovannucci, E. et al., 1993 , BRE03262;Sieri, S. et al., 2002 , BRE20941;Silvera, S. A. et al., 2006 , BRE24118;Velie, E. et al., 2000 , BRE12851;Voorrips, L. E. et al., 2002 , BRE13011). The RR Q5 vs. Q1 was 0.81; 95% CI, 0.67-0.99 in women without history of benign breast disease in the Nurses’ Health Study (Byrne, C. et al., 2002 , BRE01315). Energy intake during adolescence was related with an increased risk of breast cancer in adulthood (Frazier, A. L. et al., 2004 , BRE02942). In the analyses stratified by hormone receptor status, energy intake was inversely although not significantly related to ER-/PR- breast cancers, and positively but not significantly related to other breast cancer (Kushi, L. H. et al., 1995 , BRE05142). Update Postmenopause

119
Two cohort studies have been identified during the update period. In the PLCO Cancer Screening Trial cohort (Chang, S. C. et al., 2006 , BRE80110) (764 cases), high energy intake was associated with increased risk of postmenopausal breast cancer (RR>2084 vs <1315 kcal/day =1.25 (95% CI = 1.02- 1.53). Energy intake was not related to postmenopausal breast cancer risk in the Nurses' Health Study (Kim, E. H. et al., 2006 , BRE80115) (3537 cases). The RR for an increase of 500 kcal was 1.01 (95% CI = 0.97-1.04). In the subgroup analysis by hormonal receptor status, energy intake was not related to breast cancer risk. Overall, twelve prospective studies have investigated energy intake in relation to postmenopausal breast cancer. The results of eight studies were included in a forest plot showing the relative risks of the highest versus lowest comparison on energy intake and postmenopausal breast cancer. One of them was identified during the update period (Chang, S. C. et al., 2006 , BRE80110). The reasons that the four studies were excluded are shown as follows:
• No risk ratio or confidence intervals were provided in their articles (Wirfalt, E. et al., 2004 , BRE17083)
• Two were reports for the Nurses’ Health Study with one being more recent (Kim, E. H. et al., 2006 , BRE80115) than the other (Holmes, M. D. et al., 1999 , BRE04008). However, both provided continuous data only; therefore not included in the analysis. The Rancho Bernado Study is another study that only reported continuous estimate. (Barrett-Connor, E. and Friedlander, N. J. 1993 , BRE00581;Holmes, M. D. et al., 1999 , BRE04008;Kim, E. H. et al., 2006 , BRE80115) .
Highest versus lowest forest plot was not done on premenopausal breast cancer because there was only one study (Silvera, S. A. et al., 2006 , BRE24118). It was also not done on breast cancer with menopause age unspecified as there had not been any studies published during the update period.

120
xvi. Fig E1 Highest versus lowest forest plot on energy intake and postmenopausal breast cancer (**=new studies identified during the update)
Note: Graham S. (1992) (BRE03424) contrast and units should read Quintile 5 (62-318 kcal*1000/month) vs. Quintile 1 (7-35kcal*1000/month)
** Chang S.C. (2006) Silvera, S. A. N. (2005) Byrne, C. (2002) Sieri, S. (2002) Voorrips, L. E. (2002) Velie, E. (2000) Graham, S. (1992) Kushi L. H. (1992)
ID
Study
1.25 (1.02, 1.53) 0.94 (0.72, 1.23) 0.81 (0.67, 0.98) 1.02 (0.48, 2.16) 1.04 (0.77, 1.40) 0.94 (0.77, 1.15) 0.91 (0.65, 1.28) 1.06 (0.80, 1.40)
Intake RR (95% CI)
vs.Low Energy
High
BRE80110 BRE24118 BRE01315 BRE20941 BRE13011 BRE12851 BRE03424 BRE05141
WCRF_Code
PLCO Cancer Screening Trial NBSS Nurses' Health Study ORDET study The Netherlands Cohort Study on diet and cancer BCDDP New York State Cohort Iowa Women's Health Study
StudyDescription
> 2084.0 vs.< 1315.0 > 2406.0 vs. < 1629.9 Quantile 5 vs. Quantile 1 >1786.4 vs.< 1410.6 2208 vs.1213 Q5 vs. Q1
62-318 vs.7-35 2264 vs. 1168
contrast
Kcal/day Kcal/day Kcal/day Kcal/day Kcal/day KJ/day 1000 kcal/month Kcal/day
Units
1.25 (1.02, 1.53) 0.94 (0.72, 1.23) 0.81 (0.67, 0.98) 1.02 (0.48, 2.16) 1.04 (0.77, 1.40) 0.94 (0.77, 1.15) 0.91 (0.65, 1.28) 1.06 (0.80, 1.40)
Intake RR (95% CI)
vs.Low Energy
High
BRE80110 BRE24118 BRE01315 BRE20941 BRE13011 BRE12851 BRE03424 BRE05141
WCRF_Code
1 .462 1 2.1
6

121
7.1.1 Energy from fat Global Report, 2007 Eight articles were retrieved during the SLR (Byrne, C. et al., 1996 , BRE05719;Cho, E. S. 2003 , BRE17370;Gago-Dominguez, M. Y. 2003 , BRE17518;Holmes, M. D. et al., 1999 , BRE04008;Jones, D. Y. et al., 1987 , BRE04461;Velie, E. et al., 2000 , BRE12851;Wakai, K. et al., 2005 , BRE24482;Wirfalt, E. et al., 2004 , BRE17083). The dose-response meta-analysis of two studies (Byrne, C. et al., 1996 , BRE05719;Holmes, M. D. et al., 1999 , BRE04008) suggested a significant negative association (RR = 0.96, 95% CI = 0.93-0.99, for 5% of energy from fat, no heterogeneity). These results were confirmed by the highest versus lowest forest plot adding one Japanese prospective study included in the Global Report prepublication update (Wakai, K. et al., 2005 , BRE24482). A dose-response meta-analysis was also performed to test the relationship with postmenopausal breast cancer (Holmes, M. D. et al., 1999 , BRE04008;Wirfalt, E. et al., 2004 , BRE17083). The summary RR was 0.95, 95% CI = 0.92-0.98, for 5% of energy from fat, without heterogeneity. The association was not confirmed by the highest versus lowest forest plot. Update There were two new studies identified during the update (Kim, E. H. et al., 2006 , BRE80115;Thiebaut, A. C. et al., 2007 , BRE80012).
The relationship of postmenopausal breast cancer with dietary fat was examined in the Nurses’ Health Study (Kim, E. H. et al., 2006 , BRE80115) (3, 537 incident cases prospectively followed for 20 years). The multivariable relative risk for an increment of 5% of energy from total dietary fat intake was 0.98 (95% CI = 0.95-1.00). Additionally, specific types of fat were not associated with an increased risk of breast cancer. Furthermore, secondary analyses indicated no differences in breast cancer risk by estrogen receptor or progesterone receptor status. However, stratification by waist circumference indicated a significant decreased in breast cancer risk for participants with a waist circumference of 88.9 cm or greater (Ptrend = 0.04). Fat intake before menopause was not related to risk of postmenopausal breast cancer.
In the NIH- AARP Diet and Health Study (Thiebaut, A. C. et al., 2007 , BRE80012) (3501 cases) the hazard ratio of breast cancer for the highest (median intake, 40.1% energy from total fat; 434 cases per 100 000 person-years) versus the lowest (median intake, 20.3% energy from total fat; 392 cases per 100 000 person-years) quintile of energy from fat intake was 1.11 (95% CI = 1.00-1.24, Ptrend = 0.017). Positive associations with percentage of energy from subtypes of fat were also observed (hazard ratio for a twofold increase in percentage of energy from saturated fat, HR = 1.13, 95% CI = 1.05-1.22; from monounsaturated fat, HR = 1.12, 95% CI = 1.03-1.21; from polyunsaturated fat, HR = 1.10, 95% CI = 1.01-1.20). Correction for measurement error in nutrient intakes, on the basis of a calibration sub-study that used two 24-hour dietary recalls, strengthened the associations, yielding an estimated hazard ratio for energy from total fat of 1.32 (95% CI = 1.11 to 1.58). Secondary analyses showed that associations between total, saturated, and monounsaturated fat intakes were confined to women who were not using menopausal hormone therapy at baseline. 7.1.2 Energy from carbohydrates (also known as calories from carbohydrates, in the Global Report)

122
Global Report, 2007 Three prospective studies were identified during the update (Cho, E. et al., 2003 , BRE01651;Velie, E. et al., 2000 , BRE12851;Wirfalt, E. et al., 2004 , BRE17083). In the Nurses' Health Study II, energy from carbohydrates was not related to risk of premenopausal breast cancer in the cohort. However, the associations differed by body mass index (BMI): among women with BMI < 25 kg/m2, the multivariate relative risks for the increasing quintiles of carbohydrate intake were 1.00 (referent), 0.87, 0.77, 0.66, and 0.62 (95% CI = 0.40–0.97, Ptrend = 0.02); and among women with BMI 25 kg/m2, the corresponding relative risks were 1.00 (referent), 1.30, 1.35, 1.50, and 1.47 (95% CI = 0.84–2.59, Ptrend = 0.14, Pinteraction = 0.02). Non-significant negative association (RR = 0.91, 95% CI = 0.73-1.12) was found among postmenopausal breast cancer in a cohort of women who attended at a mammography screening program conducted from 1973 through 1981 at 29 centres throughout the US (Velie, E. et al., 2000 , BRE12851). No risk estimates were given in the Swedish Malmo Diet and Cancer study (Wirfalt, E. et al., 2004 , BRE17083). Carbohydrate intake was not related to postmenopausal breast cancer in the Breast Cancer Detection Demonstration Project (BCDDP) Follow-up Cohort Study (Vecchia, C. l. T. 1986 , BRE18116). Update In the ORDET study (Sieri, S. et al., 2007 , BRE80142) (289 cases), the percentage of energy from carbohydrates was not related to breast cancer. There was a positive association with energy from carbohydrates from high glycemic index foods (RR for 5 % increase= 1.55 (95% CI = 1.07-2.26)), but not with energy from carbohydrates from low glycemic foods. 8. Anthropometry 8.1.1 Body Mass Index Dose-response meta-analyses were conducted to examine the association of BMI with risk of premenopausal and postmenopausal breast cancer, and with both combined. A comparison of the results of the updated meta-analyses and the meta-analyses conducted for the Global Report is given below. Summary of results of the dose-response meta-analysis
Menopausal status not specified
2nd Report Continuous update
Studies (n) 16 15
Cases (n) Not provided 7200
RR (95% CI) (2 kg/m2 increase) 1.01 (1.00-1.02) 1.02(0.99-1.05)
Heterogeneity (I2) 66.4% (43.2-80.1%) 68.4%, p=0.000
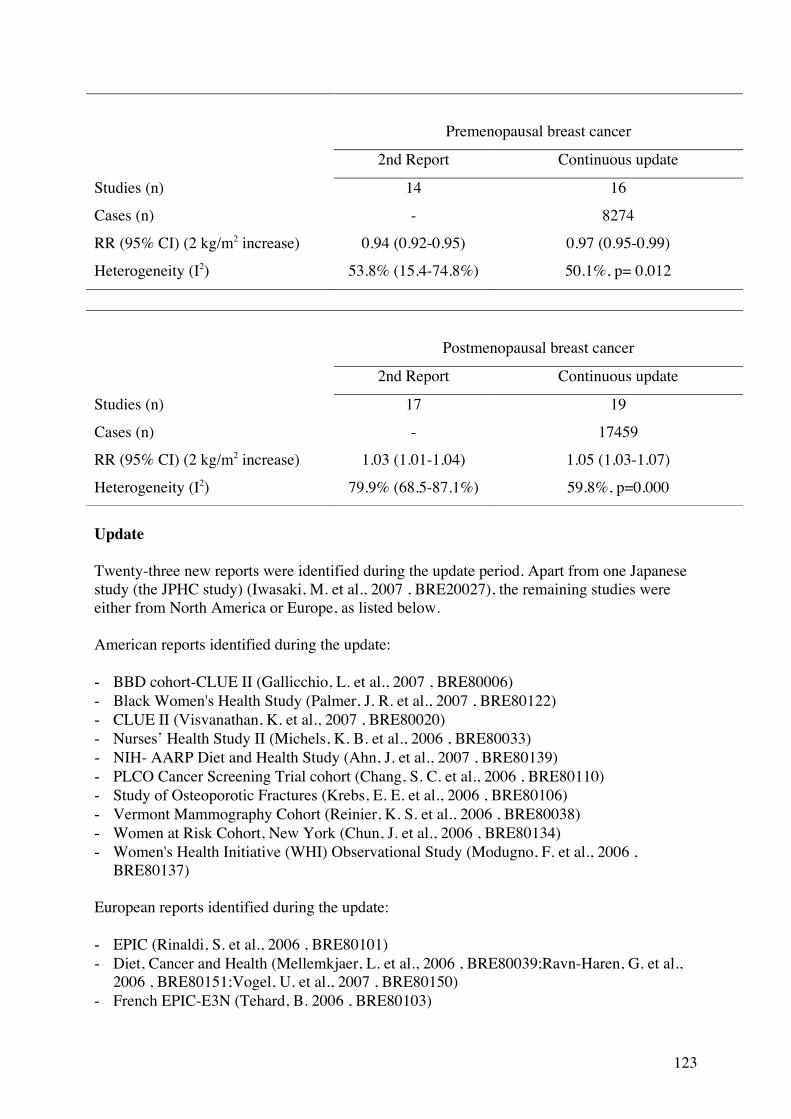
123
Premenopausal breast cancer
2nd Report Continuous update
Studies (n) 14 16
Cases (n) - 8274
RR (95% CI) (2 kg/m2 increase) 0.94 (0.92-0.95) 0.97 (0.95-0.99)
Heterogeneity (I2) 53.8% (15.4-74.8%) 50.1%, p= 0.012
Update Twenty-three new reports were identified during the update period. Apart from one Japanese study (the JPHC study) (Iwasaki, M. et al., 2007 , BRE20027), the remaining studies were either from North America or Europe, as listed below. American reports identified during the update: - BBD cohort-CLUE II (Gallicchio, L. et al., 2007 , BRE80006) - Black Women's Health Study (Palmer, J. R. et al., 2007 , BRE80122) - CLUE II (Visvanathan, K. et al., 2007 , BRE80020) - Nurses’ Health Study II (Michels, K. B. et al., 2006 , BRE80033) - NIH- AARP Diet and Health Study (Ahn, J. et al., 2007 , BRE80139) - PLCO Cancer Screening Trial cohort (Chang, S. C. et al., 2006 , BRE80110) - Study of Osteoporotic Fractures (Krebs, E. E. et al., 2006 , BRE80106) - Vermont Mammography Cohort (Reinier, K. S. et al., 2006 , BRE80038) - Women at Risk Cohort, New York (Chun, J. et al., 2006 , BRE80134) - Women's Health Initiative (WHI) Observational Study (Modugno, F. et al., 2006 ,
BRE80137) European reports identified during the update: - EPIC (Rinaldi, S. et al., 2006 , BRE80101) - Diet, Cancer and Health (Mellemkjaer, L. et al., 2006 , BRE80039;Ravn-Haren, G. et al.,
2006 , BRE80151;Vogel, U. et al., 2007 , BRE80150) - French EPIC-E3N (Tehard, B. 2006 , BRE80103)
Postmenopausal breast cancer
2nd Report Continuous update
Studies (n) 17 19
Cases (n) - 17459
RR (95% CI) (2 kg/m2 increase) 1.03 (1.01-1.04) 1.05 (1.03-1.07)
Heterogeneity (I2) 79.9% (68.5-87.1%) 59.8%, p=0.000

124
- Malmo Diet and Cancer (Ericson, U. et al., 2007 , BRE80128;Wirfalt, E. et al., 2005 , BRE11111)
- Sweden, Finland Co-twin study (1 article, 2 study designs) (Lundqvist, E. et al., 2007 , BRE80002;Lundqvist, E. et al., 2007 , BRE80003)
- Northern Sweden Health and Disease Cohort (Lukanova, A. et al., 2006 , BRE80100) - The Million Women Study (Reeves, G. K. et al., 2007 , BRE80146) - The Swedish Mammography Cohort (Suzuki, R. et al., 2006 , BRE80116). Overall summary Sixty-one reports were retrieved during the SLR. In addition, the Melbourne Collaborative Cohort Study (Macinnis, R. J. et al., 2004 , BRE80159) published in 2004, was referenced in the Global Report but not included in the database. Altogether 85 reports from 57 cohorts had provided data on body mass index (BMI) and breast cancer. The list of studies included and excluded from the meta-analyses by menopausal status and the reasons for exclusion are detailed in Tables BMI1, BMI2 and BMI3. Menopause age unspecified Table BMI1 shows both the included and excluded studies on body mass index (BMI) and breast cancer with unspecified menopausal status in the meta-analysis. A total of three new prospective cohort or nested case-control studies were identified (Chun, J. et al., 2006 , BRE80134;Lukanova, A. et al., 2006 , BRE80100;Visvanathan, K. et al., 2007 , BRE80020) over the update period. Studies selected for the dose-response meta-analysis Out of 26 individual studies, 15 studies (two studies retrieved in the update and 13 in the SLR) for a total of 7200 cases, with the appropriate format of data were included in the dose-response meta-analysis (the Northern Sweden Health and Disease Control (Lukanova, A. et al., 2006 , BRE80100), the Women at Risk Cohort, New York (Chun, J. et al., 2006 , BRE80134), the Canadian National Breast Screening Program (Silvera, S. A. et al., 2006 , BRE24118), a study in Taiwan (Wu, M. H. et al., 2006 , BRE24628), the VHM&PP(Vorarlberg Health Monitoring and Promotion Program) (Rapp, K. et al., 2005 , BRE23858), the LSS (Key, T. J. et al., 1999 , BRE04758), CLUEI (Wu, K. et al., 1999 , BRE13618), CLUEII (Wu, K. et al., 1999 , BRE63618), the Swedish Mammography Cohort (Wolk, A. et al., 1998 , BRE13548), the Hawaii State Department of Health (Galanis, D. J. et al., 1998 , BRE03058), a study from Finland (Knekt, P. et al., 1996 , BRE04900), the NHANESI/NHEFS (Byrne, C. et al., 1996 , BRE05719), a cohort from Sweden (Tornberg, S. A. and Carstensen, J. M. 1994 , BRE12417), a cohort from Norway (Vatten, L. J. and Kvinnsland, S. 1992 , BRE12828) and the California Seventh-day Adventist Cohort (Mills, P. K. B. 1989 , BRE17837)). Sixteen reports were excluded: CLUEII* (Visvanathan, K. et al., 2007 , BRE80020), a study in Miyagi, Japan (Kuriyama, S. et al., 2005 , BRE22995), two reports of the Nurses’ Health Study (Colditz, G. A. et al., 2004 , BRE01783;Zhang, S. M. et al., 2003 , BRE13958), a study in Helsinki and Oulu (Kilkkinen, A. V. 2004 , BRE17698), the Swedish Twin Cohort study (Jonsson, F. et al., 2003 , BRE04482), the Mobile Clinic Health Examination Survey (Rissanen, H. K. 2003 , BRE17954), the AHS (Fraser, G. E. and Shavlik, D. 1997 , BRE02940), the LSS (Goodman, M. T. et al., 1997 , BRE03352), three reports of the Norway National Health Screening Service (Gaard, M. et al., 1994 , BRE03044;Vatten, L. J. et al.,

125
1990 , BRE12833;Vatten, L. J. and Kvinnsland, S. 1990 , BRE12826), the Glostrup Population study (Hoyer, A. P. and Engholm, G. 1992 , BRE04086), the Guernsey study (Overvad, K. W. 1991 , BRE17893), the Framingham study (Schatzkin, A. C. 1989 , BRE18013) and a Swedish cohort (Tornberg, S. A. et al., 1988 , BRE12418). The reasons for exclusion are in Table BMI1. * Other results from the same cohort are included. Results No significant association was observed in the dose-response meta-analysis of 15 studies (RR = 1.02, 95% CI = 0.99-1.05 for 2 kg/m2 increase in BMI) (Fig BMI1). The result reported here is consistent with the risk estimate reported in the 2007 Global Report (RR for 2 kg/m
2 increase =
1.01, 95% CI = 1.00-1.02). Significant heterogeneity was reported (I2 = 68.4%, P = 0.000). We did not attempt to explore the sources of heterogeneity because these studies included both pre- and postmenopausal women, and the relationship of BMI with breast cancer risk is thought to be in opposite direction in both cancer types. Four studies (Fraser, G. E. and Shavlik, D. 1997 , BRE02940;Hoyer, A. P. and Engholm, G. 1992 , BRE04086;Jonsson, F. et al., 2003 , BRE04482;Kuriyama, S. et al., 2005 , BRE22995) not included in the dose-response meta-analysis reported an increase in risk that was not statistically significant in the extreme categories comparison, but the other two studies (Schatzkin, A. C. 1989 , BRE18013;Vatten, L. J. et al., 1990 , BRE12833) observed a significant opposite effect. In general, results from the highest versus lowest forest plot (Fig. BMI3) were consistent with the dose-response meta-analysis (Fig. BMI1).

126
c)Table BMI1 Inclusion and exclusion of cohort studies on body mass index and breast cancer (menopause age unspecified)
Author Year WCRF Code Study name Study type
Included in the 2005 dose-response meta-
analysis
Included in the 2008 dose-response meta-
analysis
Included in the 2008 high vs. low forest
plot Estimated values for
meta-analysis Exclusion reasons Remarks
Visvanathan et al. 2007 BRE80020 CLUE II Nested Case
Control New study No No Although more recent than
Wu 1999, BRE63618, less no. of cases
Chun, J. et al. 2006 BRE80134 Women at Risk Cohort,
New York Prospective
Cohort New study Yes Yes Mean exposure values
The 2nd exposure category (BMI=19-24, normal weight) was used as a reference group in this study
Lukanova A. 2006 BRE80100 Northern Sweden Health
and Disease Cohort Prospective
Cohort New study Yes Yes
For the close-ended exposure categories, mid-exposure was taken. For the upper open-ended category, middle exposure plus half the width of the last exposure range was taken in estimating the dose-response slope
Kuriyama, S. 2005 BRE22995 Miyagi, 1993 Prospective
Cohort No No Yes Number of non cases not
provided, categorical analysis
Rapp K. 2005 BRE23858 VHM&PP Prospective
Cohort Yes Yes Yes
For the close-ended exposure categories, mid-exposure was taken. For the upper open-ended category, middle exposure plus half the width of the last exposure range was taken in estimating the dose-response slope
Silvera, S. A. 2005 BRE24118 Canadian National Breast
Screening Study Prospective
Cohort Yes Yes Yes Mean exposure values
Wu, M. H. 2006 BRE24628 Taiwan 1990 Prospective
Cohort No Yes Yes Mean exposure values
Colditz, G. A. 2004 BRE01783 Nurses' Health Study
(NHS) Cohort Prospective
Cohort No No No
Nominal categories only, specific cancer outcome by
hormone type
Kilkkinen, A. 2004 BRE17698 Helsinki and Oulu Nested Case
Control Yes No No Mean difference only

127
Jonsson, F. 2003 BRE04482 Swedish twin cohort, 1969 Prospective
Cohort No No Yes Number of non cases not provided, can't estimate
Rissanen, H. 2003 BRE17954 Mobile Clinic Health Examination Survey
Nested Case Control Yes No No Mean difference only
Zhang, S. M. 2003 BRE13958 Nurses' Health Study
(NHS) Cohort Nested Case
Control Yes No No Mean difference only
Key, T. J. 1999 BRE04758 LSS Prospective
Cohort Yes Yes Yes Mean exposure values
Wu, K. 1999 BRE13618 CLUE I Nested Case
Control Yes Yes Yes Mean exposure values
Results on the CLUE I and II cohorts were presented in the same article
Wu, K. 1999 BRE63618 CLUE II Nested Case
Control Yes Yes Yes Mean exposure values
Results on the CLUE I and II cohorts were presented in the same article
Galanis, D.J. 1998 BRE03058 Hawaii State Department
of Health Prospective
Cohort Yes Yes Yes Mean exposure values
Wolk, A. 1998 BRE13548 The Swedish
Mammography Cohort Prospective
Cohort Yes Yes No
Only dose-response slope was provided in the study – not included in the highest vs. lowest forest plot
Fraser, G. E. 1997 BRE02940 AHS, 1974 Prospective
Cohort No No Yes
Only 2 categories - not included in dose-response
analysis
Goodman, M. T. 1997 BRE03352 LSS Prospective
Cohort No No No Superseded by Key 1999,
BRE04758
Byrne, C. 1996 BRE05719 NHEFS Prospective
Cohort Yes Yes Yes Mean exposure values
Knekt, P. 1996 BRE04900 Finland, 1966 Prospective
Cohort Yes Yes Yes Mean exposure values
Gaard, M. 1994 BRE03044 Norway National Health
Screening Service Prospective
Cohort No No No
A different kind of weight by height measurement, unit =
g/cm2
Tornberg, S. A. 1994 BRE12417 Sweden, 1971 Prospective
Cohort Yes Yes Yes Estimated C.I.
Hoyer, A. P. 1992 BRE04086 Glostrup Population
Studies Prospective
Cohort No No Yes Number of cases & controls not provided, can't estimate
Vatten, L. J. 1992 BRE12828 Norway, 1974 Prospective
Cohort Yes Yes Yes Mean exposure values
Overvad 1991 BRE17893 Guernsey, 1967 Case Cohort Yes No No Mean difference only

128
Vatten, L. J. 1990 BRE12833 Norway National Health
Screening Service Prospective
Cohort No No Yes Estimate C.I.
2 categories only - not included in dose-response
analysis
Vatten, L. J. 1990 BRE12826 Norway National Health
Screening Service Prospective
Cohort No No No
A different kind of weight by height measurement, unit =
g/cm2
Mills, P. K. 1989 BRE17837 California Seventh-day
Adventists Cohort Prospective
Cohort Yes Yes Yes Mean exposure values
Schatzkin, A. 1989 BRE18013 Framingham Study Prospective
Cohort No No Yes Missing no. of non cases, can't
estimate
Tornberg, S. A. 1988 BRE12418 Swedish cohort, 1963 Prospective
Cohort No No No Superseded by Tornberg
1994, BRE12418
Total no. of articles = 30
Total no. of cohort studies = 26
Total no. of studies included = 16
Total no. of studies included = 15
Total no. of studies included = 20
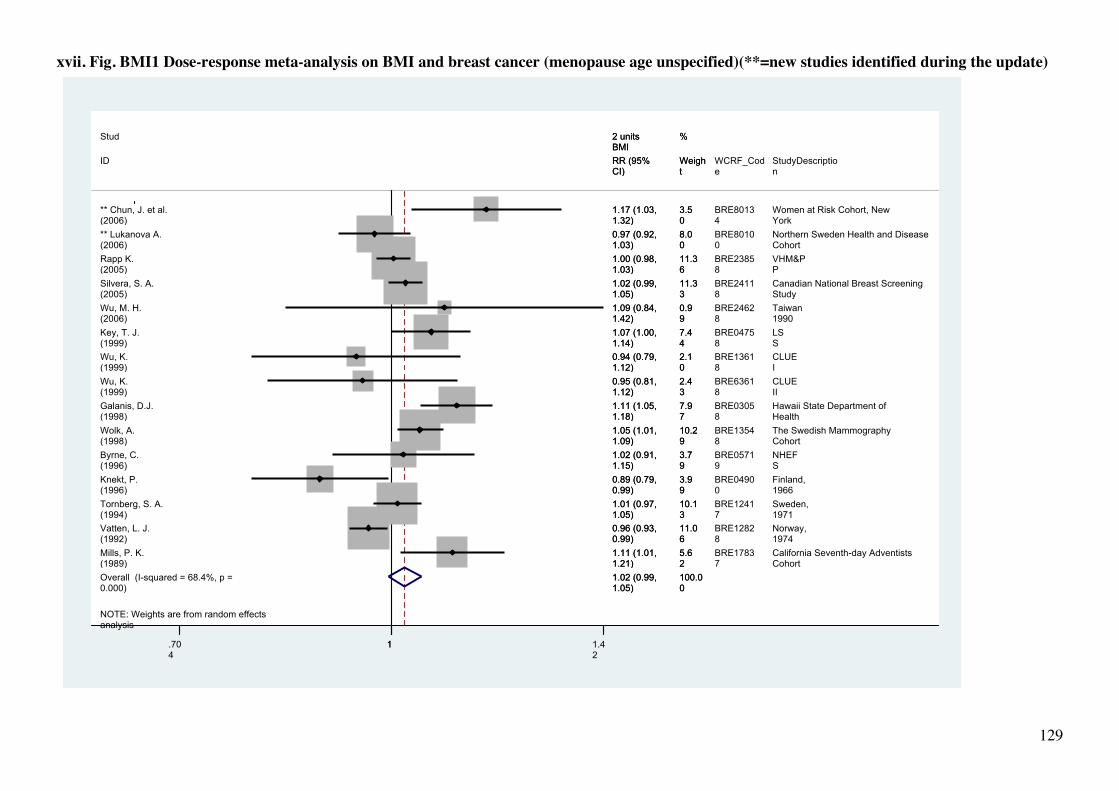
129
xvii. Fig. BMI1 Dose-response meta-analysis on BMI and breast cancer (menopause age unspecified)(**=new studies identified during the update)
NOTE: Weights are from random effects analysis
Overall (I-squared = 68.4%, p = 0.000)
Key, T. J. (1999)
** Lukanova A. (2006)
Byrne, C. (1996)
Galanis, D.J. (1998)
Wu, K. (1999)
Vatten, L. J. (1992)
Tornberg, S. A. (1994)
ID
Silvera, S. A. (2005)
Knekt, P. (1996)
Wolk, A. (1998)
Wu, M. H. (2006)
** Chun, J. et al. (2006)
Rapp K. (2005)
Mills, P. K. (1989)
Wu, K. (1999)
Study
1.02 (0.99, 1.05)
1.07 (1.00, 1.14)
0.97 (0.92, 1.03)
1.02 (0.91, 1.15)
1.11 (1.05, 1.18)
0.94 (0.79, 1.12)
0.96 (0.93, 0.99)
1.01 (0.97, 1.05)
RR (95% CI)
1.02 (0.99, 1.05)
0.89 (0.79, 0.99)
1.05 (1.01, 1.09)
1.09 (0.84, 1.42)
1.17 (1.03, 1.32)
1.00 (0.98, 1.03)
1.11 (1.01, 1.21)
0.95 (0.81, 1.12)
2 units BMI
100.00
7.44
8.00
3.79
7.97
2.10
11.06
10.13
Weight
11.33
3.99
10.29
0.99
3.50
11.36
5.62
2.43
%
BRE04758
BRE80100
BRE05719
BRE03058
BRE13618
BRE12828
BRE12417
WCRF_Code
BRE24118
BRE04900
BRE13548
BRE24628
BRE80134
BRE23858
BRE17837
BRE63618
LSS
Northern Sweden Health and Disease Cohort
NHEFS
Hawaii State Department of Health
CLUE I
Norway, 1974
Sweden, 1971
StudyDescription
Canadian National Breast Screening Study
Finland, 1966
The Swedish Mammography Cohort
Taiwan 1990
Women at Risk Cohort, New York
VHM&PP
California Seventh-day Adventists Cohort
CLUE II
1.02 (0.99, 1.05)
1.07 (1.00, 1.14)
0.97 (0.92, 1.03)
1.02 (0.91, 1.15)
1.11 (1.05, 1.18)
0.94 (0.79, 1.12)
0.96 (0.93, 0.99)
1.01 (0.97, 1.05)
RR (95% CI)
1.02 (0.99, 1.05)
0.89 (0.79, 0.99)
1.05 (1.01, 1.09)
1.09 (0.84, 1.42)
1.17 (1.03, 1.32)
1.00 (0.98, 1.03)
1.11 (1.01, 1.21)
0.95 (0.81, 1.12)
2 units BMI
100.00
7.44
8.00
3.79
7.97
2.10
11.06
10.13
Weight
11.33
3.99
10.29
0.99
3.50
11.36
5.62
2.43
%
1 .704
1 1.42
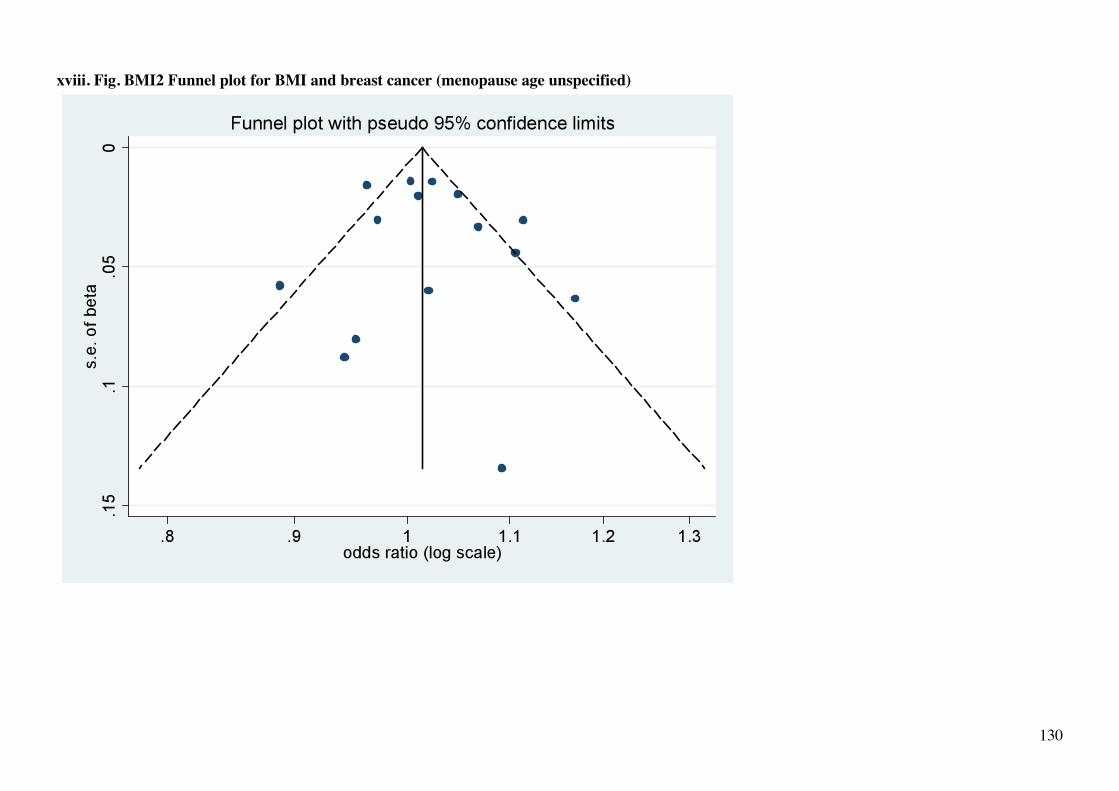
130
xviii. Fig. BMI2 Funnel plot for BMI and breast cancer (menopause age unspecified)

131
xix. Fig. BMI3 Highest versus lowest forest plot on BMI and breast cancer (menopause age unspecified)(**=new studies identified during the update)
**Chun, J. et al. (2006) **Lukanova A. (2006) Kuriyama, S. (2005) Rapp K. (2005) Silvera, S. A. (2005) Wu, M. H. (2006) Jonsson, F. (2003) Key, T. J. (1999) Wu, K. (1999) Wu, K. (1999) Galanis, D.J. (1998) Fraser, G. E. (1997) Byrne, C. (1996) Knekt, P. (1996) Tornberg, S. A. (1994) Hoyer, A. P. (1992) Vatten, L. J. (1992) Vatten, L. J. (1990) Mills, P. K. (1989) Schatzkin, A. (1989)
ID Study
2.22 (1.14, 4.34) 0.95 (0.74, 1.22) 1.90 (0.87, 4.15) 1.01 (0.72, 1.42) 1.14 (0.93, 1.40) 1.60 (0.50, 5.11) 1.20 (0.85, 1.70) 1.37 (1.02, 1.84) 0.77 (0.35, 1.70) 0.75 (0.32, 1.76) 1.80 (1.27, 2.55) 1.32 (0.99, 1.76) 1.30 (0.58, 2.91) 0.47 (0.21, 1.05) 0.92 (0.79, 1.08) 2.50 (0.83, 7.50) 0.78 (0.65, 0.94) 0.70 (0.51, 0.97) 1.56 (1.07, 2.27) 0.60 (0.36, 0.99)
BMI RR (95% CI)
High vs. Low
BRE80134 BRE80100 BRE22995 BRE23858 BRE24118 BRE24628 BRE04482 BRE04758 BRE63618 BRE13618 BRE03058 BRE02940 BRE05719 BRE04900 BRE12417 BRE04086 BRE12828 BRE12833 BRE17837 BRE18013
WCRF_Code
Women at Risk Cohort, New York Northern Sweden Health and Disease Cohort Miyagi, 1993 VHM&PP Canadian National Breast Screening Study Taiwan 1990 Swedish twin cohort, 1969 LSS CLUE II CLUE I Hawaii State Department of Health AHS, 1974 NHEFS Finland, 1966 Sweden, 1971 Glostrup Population Studies Norway, 1974 Norway National Health Screening Service California Seventh-day Adventists Cohort Framingham Study
StudyDescription
>=30 vs 19-24 >=27.1 vs 18.5-22.1 >30 vs 18.5-24.9 >=35 vs 18.5-24.9 >=30 vs <=24 >26.3 vs <21.6 >=30 vs 18.5-24.9 >=25 vs <20 >=26 vs <=22 >=26 vs <=22 >=26.1 vs <=19.5 >24.3 vs <=24.3 >=29.3 vs <=22.34 >=28.68 vs <=20.94 >=28 vs <22 >=33 vs <26 >=28 vs <=21 >=24 vs <=23.9 >=25.2 vs <=21.7 >=28.8 vs <=21.7
Contrast
2.22 (1.14, 4.34) 0.95 (0.74, 1.22) 1.90 (0.87, 4.15) 1.01 (0.72, 1.42) 1.14 (0.93, 1.40) 1.60 (0.50, 5.11) 1.20 (0.85, 1.70) 1.37 (1.02, 1.84) 0.77 (0.35, 1.70) 0.75 (0.32, 1.76) 1.80 (1.27, 2.55) 1.32 (0.99, 1.76) 1.30 (0.58, 2.91) 0.47 (0.21, 1.05) 0.92 (0.79, 1.08) 2.50 (0.83, 7.50) 0.78 (0.65, 0.94) 0.70 (0.51, 0.97) 1.56 (1.07, 2.27) 0.60 (0.36, 0.99)
BMI RR (95% CI)
High vs. Low
BRE80134 BRE80100 BRE22995 BRE23858 BRE24118 BRE24628 BRE04482 BRE04758 BRE63618 BRE13618 BRE03058 BRE02940 BRE05719 BRE04900 BRE12417 BRE04086 BRE12828 BRE12833 BRE17837 BRE18013
WCRF_Code
1 .133 1 7.
5

132
Premenopause Cohort studies identified in the Jan 2006- Dec 2007 update Nine new prospective cohort or nested case-control studies were identified (Iwasaki, M. et al., 2007 , BRE20027;Lukanova, A. et al., 2006 , BRE80100;Lundqvist, E. et al., 2007 , BRE80002;Lundqvist, E. et al., 2007 , BRE80003;Michels, K. B. et al., 2006 , BRE80033;Palmer, J. R. et al., 2007 , BRE80122;Reeves, G. K. et al., 2007 , BRE80146;Reinier, K. S. et al., 2006 , BRE80038;Tehard, B. 2006 , BRE80103) over the update period. Studies selected for the dose-response meta-analysis Sixteen out of a total of 27 studies with appropriate format of data were included in the dose-response meta-analysis. A total of 8274 cases were included. The studies included in the dose response meta-analysis are: the JPHC (Iwasaki, M. et al., 2007 , BRE20027), the Sweden, Finland Co-twin study (Lundqvist, E. et al., 2007 , BRE80002), the Black Women's Health Study (Palmer, J. R. et al., 2007 , BRE80122), The Million Women Study (Reeves, G. K. et al., 2007 , BRE80146), the Nurses’ Health Study II (Michels, K. B. et al., 2006 , BRE80033), the Northern Sweden Health and Disease Cohort (Lukanova, A. et al., 2006 , BRE80100), (Lahmann, P. H. et al., 2004 , BRE15804) the combined analysis of two cohorts (Sweden + Norway) (Weiderpass, E. B. 2004 , BRE18151), the Malmo Preventive Project (MPP) (Manjer, J. K. 2001 , BRE17790), the New York Women's Health Study (Sonnenschein, E. et al., 1999 , BRE11604) , the Hawaii State Department of Health (Galanis, D. J. et al., 1998 , BRE03058), the DOM-project Utrecht (Kaaks, R. et al., 1998 , BRE04522), the Reykjavik Study (Tulinius, H. et al., 1997 , BRE12565), the Nurses' Health Study (NHS) Cohort (Huang, Z. et al., 1997 , BRE04117), a cohort from Sweden, 1971 (Tornberg, S. A. and Carstensen, J. M. 1994 , BRE12417) and a cohort from Norway, 1974 (Vatten, L. J. and Kvinnsland, S. 1992 , BRE12828). Studies excluded from the dose-response meta-analysis Fifteen reports of 14 different cohort studies were excluded: the Canadian National Breast Screening Study (Silvera, S. A. et al., 2006 , BRE24118), the Danish Cohort, 1930 (Ahlgren, M. et al., 2004 , BRE14201), two reports of the French EPIC-E3N cohort, the French component of EPIC (Tehard, B. et al., 2004 , BRE12173;Tehard, B. 2006 , BRE80103), the Guernsey G2 and G3 study (De Stavola, B. L. et al., 1993 , BRE02122), a study from Hawaii 1942, 1960, 1972 (Le Marchand, L. et al., 1988 , BRE15836), the Korean Women's Cohort (KWC) (Lee, S. Y. K. 2003 , BRE17745) a cohort from Miyagi, Japan 1993 (Kuriyama, S. et al., 2005 , BRE22995), the Mobile Clinic Health Examination Survey (Rissanen, H. K. 2003 , BRE17954), two reports of the New York Women's Health Study (Saadatian-Elahi, M. et al., 2002 , BRE21486;Toniolo, P. et al., 1994 , BRE12398), the Norway National Health Screening Service (Vatten, L. J. and Kvinnsland, S. 1990 , BRE12826), the Sweden, Finland Co-twin study (Lundqvist, E. et al., 2007 , BRE80003), the Swedish cohort, 1963 (Tornberg, S. A. et al., 1988 , BRE12418) and the Vermont Mammography Cohort (Reinier, K. S. et al., 2006 , BRE80038). Results
133
BMI was inversely and significantly associated with breast cancer risk in premenopausal women (RR = 0.97, 95%CI = 0.95-0.99, for each 2 kg/m2 increase in BMI), although excess heterogeneity was reported (I2 = 50.1%, p = 0.012) (Fig BMI4). Only three studies reported non-significant increased risk (Galanis, D. J. et al., 1998 , BRE03058;Iwasaki, M. et al., 2007 , BRE20027;Tulinius, H. et al., 1997 , BRE12565). Risk estimate reported here was similar to that in the 2007 Global Report (RR = 0.94, 95% CI = 0.92-0.95).
134
Meta-regression was performed on each of the following factors: year of publication, geographic area, length of follow-up, anthropometric measurement method and number of exposure categories to explore heterogeneity between the 16 studies included in the dose-response meta-analysis. It was suggested that most recent publications and studies from Asia (Iwasaki, M. et al., 2007 , BRE20027) and Hawaii (Galanis, D. J. et al., 1998 , BRE03058) were more likely to associate with an increased risk than less recent studies and studies conducted in non-Asian populations (p = 0.009; p = 0.002 respectively). No publication bias was observed (Fig BMI5). None of the studies showed a strong influence on the pooled risk estimate as suggested by the sensitive tests. The highest versus lowest forest plot of 21 studies supported the previous results (Fig. BMI6). Five out of the six studies not included in the dose-response meta-analysis provided a RR that was less than one or around one in the extreme categories comparison (Kuriyama, S. et al., 2005 , BRE22995;Le Marchand, L. et al., 1988 , BRE15836;Lee, S. Y. K. 2003 , BRE17745;Reinier, K. S. et al., 2006 , BRE80038;Silvera, S. A. et al., 2006 , BRE24118). Only the Guernsey G2 and G3 study observed a 10% increase in risk but this result was not statistically significant (De Stavola, B. L. et al., 1993 , BRE02122). A recent dose-response meta-analysis on BMI and premenopausal breast cancer (Renehan AG et al., 2008) pooling results from 20 studies, reported an overall risk estimate of 0.92 (95% CI = 0.88-0.97; I2 = 38.7%, p = 0.04) for an increment of 5 kg/m2 in BMI. If we use the same increment used in this paper, our estimate is 0.93 (95% CI = 0.88-0.98). Renehan et al. suggested that the heterogeneity observed might be explained by the differences in study populations. When stratified by geographic area, they observed a positive association between increased BMI and premenopausal breast cancer in Asia-Pacific populations (p=0.009).
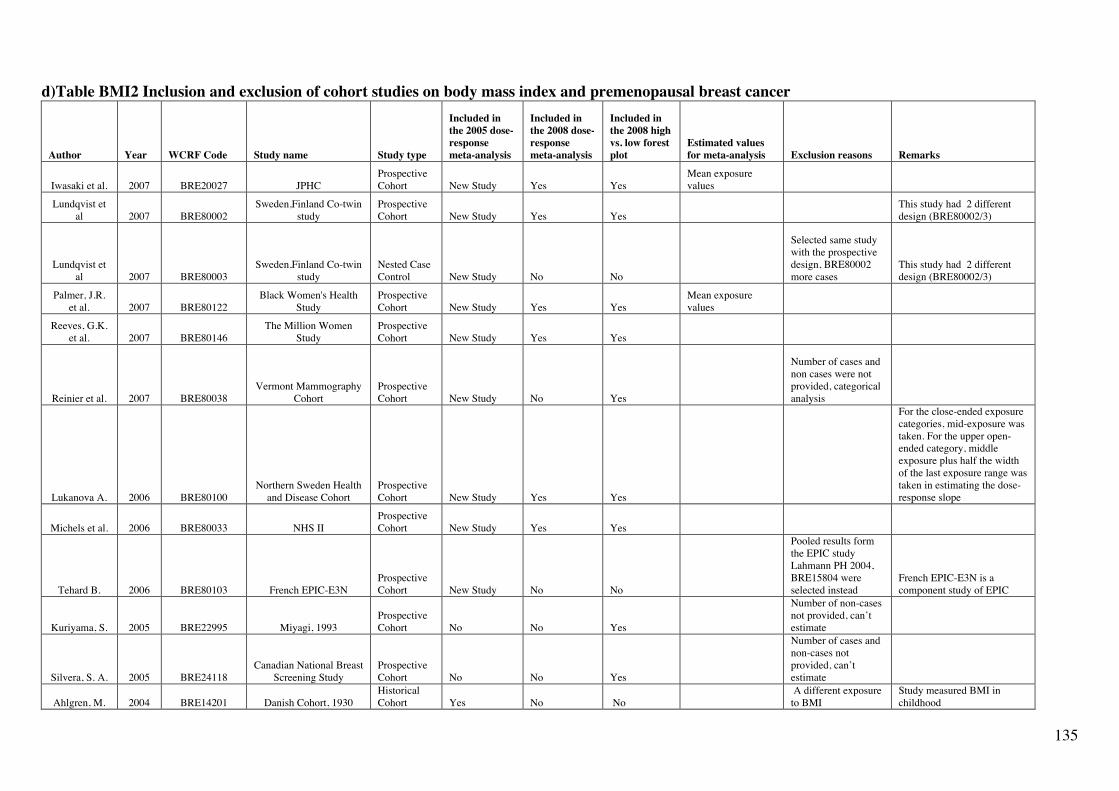
135
d)Table BMI2 Inclusion and exclusion of cohort studies on body mass index and premenopausal breast cancer
Author Year WCRF Code Study name Study type
Included in the 2005 dose-response meta-analysis
Included in the 2008 dose-response meta-analysis
Included in the 2008 high vs. low forest plot
Estimated values for meta-analysis Exclusion reasons Remarks
Iwasaki et al. 2007 BRE20027 JPHC Prospective Cohort New Study Yes Yes
Mean exposure values
Lundqvist et al 2007 BRE80002
Sweden,Finland Co-twin study
Prospective Cohort New Study Yes Yes
This study had 2 different design (BRE80002/3)
Lundqvist et al 2007 BRE80003
Sweden,Finland Co-twin study
Nested Case Control New Study No No
Selected same study with the prospective design, BRE80002 more cases
This study had 2 different design (BRE80002/3)
Palmer, J.R. et al. 2007 BRE80122
Black Women's Health Study
Prospective Cohort New Study Yes Yes
Mean exposure values
Reeves, G.K. et al. 2007 BRE80146
The Million Women Study
Prospective Cohort New Study Yes Yes
Reinier et al. 2007 BRE80038 Vermont Mammography
Cohort Prospective Cohort New Study No Yes
Number of cases and non cases were not provided, categorical analysis
Lukanova A. 2006 BRE80100 Northern Sweden Health
and Disease Cohort Prospective Cohort New Study Yes Yes
For the close-ended exposure categories, mid-exposure was taken. For the upper open-ended category, middle exposure plus half the width of the last exposure range was taken in estimating the dose-response slope
Michels et al. 2006 BRE80033 NHS II Prospective Cohort New Study Yes Yes
Tehard B. 2006 BRE80103 French EPIC-E3N Prospective Cohort New Study No No
Pooled results form the EPIC study Lahmann PH 2004, BRE15804 were selected instead
French EPIC-E3N is a component study of EPIC
Kuriyama, S. 2005 BRE22995 Miyagi, 1993 Prospective Cohort No No Yes
Number of non-cases not provided, can’t estimate
Silvera, S. A. 2005 BRE24118 Canadian National Breast
Screening Study Prospective Cohort No No Yes
Number of cases and non-cases not provided, can’t estimate
Ahlgren, M. 2004 BRE14201 Danish Cohort, 1930 Historical Cohort Yes No No
A different exposure to BMI
Study measured BMI in childhood

136
Lahmann PH 2004 BRE15804 EPIC Prospective Cohort No Yes Yes
Tehard, B. 2004 BRE12173 French EPIC-E3N Prospective Cohort Yes No No
Pooled results form the EPIC study Lahmann PH 2004, BRE15804 were selected instead
French EPIC-E3N is a component study of EPIC
Weiderpass, E. 2004 BRE18151
Assembled cohort (Sweden + Norway)
Prospective Cohort Yes Yes Yes
Lee, S. Y. 2003 BRE17745 Korean Women's Cohort
(KWC) Prospective Cohort No No Yes
Only 2 categories – not included in the dose-response meta-analysis
Rissanen, H. 2003 BRE17954 Mobile Clinic Health Examination Survey
Nested Case Control Yes No No Mean difference only
Saadatian-Elahi, M. 2002 BRE21486
New York Women's Health Study
Nested Case Control Yes No No Mean difference only
Manjer, J 2001 BRE17790 Malmo Preventive
Project (MPP) Prospective Cohort Yes Yes Yes
Mean exposure values
Sonnenschein, E. 1999 BRE11604
New York Women's Health Study
Prospective Cohort Yes Yes Yes
Mean exposure values
Galanis, D.J. 1998 BRE03058 Hawaii State Department
of Health Prospective Cohort Yes Yes Yes
Mean exposure values
Kaaks, R. 1998 BRE04522 DOM-project Utrecht Prospective Cohort Yes Yes Yes
Mean exposure values
Huang, Z. 1997 BRE04117 Nurses' Health Study
(NHS) Cohort Prospective Cohort Yes Yes Yes
Mean exposure values
Tulinius, H. 1997 BRE12565 Reykjavik Study Prospective Cohort Yes Yes No
Only dose-response slope was provided
Toniolo, P. 1994 BRE12398 New York Women's
Health Study Nested Case Control Yes No No
Supersede by Sonneschein 1999, BRE11604
Tornberg, S. A. 1994 BRE12417 Sweden, 1971
Prospective Cohort Yes Yes Yes
De Stavola, B. L. 1993 BRE02122 Guernsey G2 and G3
Prospective Cohort No No Yes
Missing no. of non cases, can't estimate
Vatten, L. J. 1992 BRE12828 Norway, 1974 Prospective Cohort Yes Yes Yes
Mean exposure values
Vatten, L. J. 1990 BRE12826 Norway National Health
Screening Service Prospective Cohort No No No
A different kind of weight by height measurement, unit = g/cm2

137
Le Marchand, L 1988 BRE15836 Hawaii 1942, 1960, 1972
Nested Case Control No No Yes
Details on exposure levels not provided
Tornberg, S. A. 1988 BRE12418 Swedish cohort, 1963
Prospective Cohort No No No
Superseded by Tornberg 1994, BRE12418
Total no. of articles = 30
Total no. of cohort studies = 27
Total no. of studies included = 14
Total no. of studies included = 16
Total no. of studies included = 21
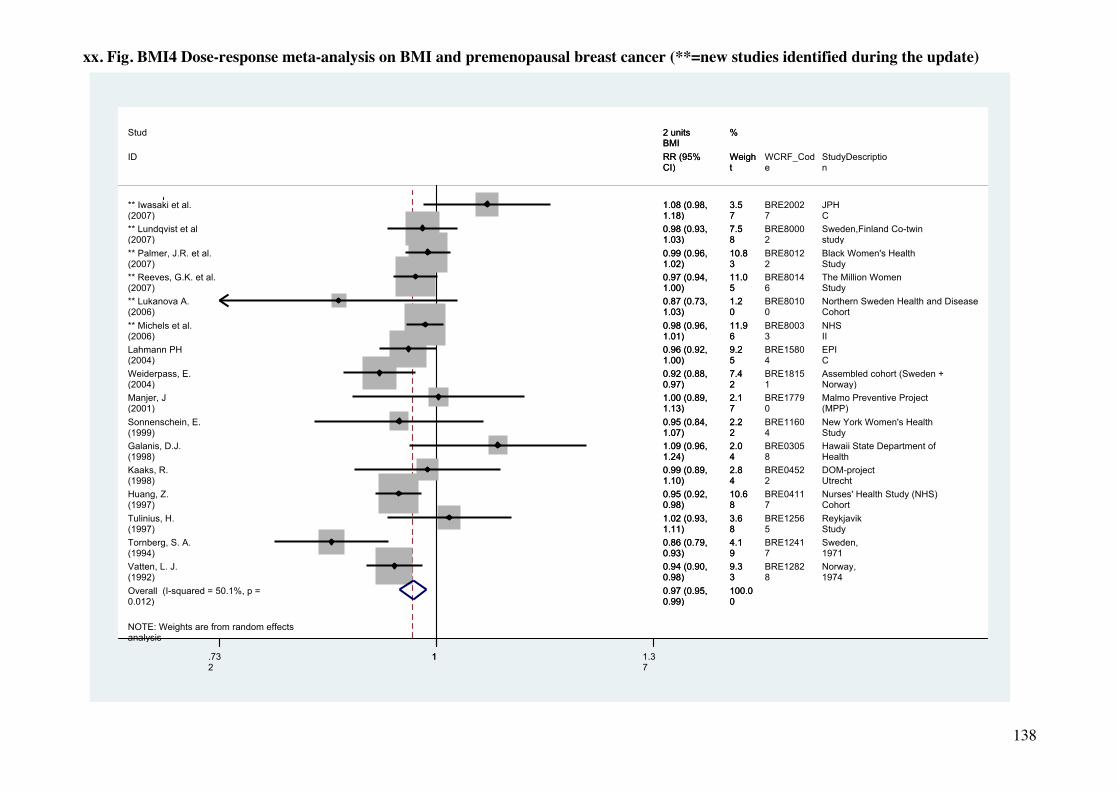
138
xx. Fig. BMI4 Dose-response meta-analysis on BMI and premenopausal breast cancer (**=new studies identified during the update)
NOTE: Weights are from random effects analysis
Overall (I-squared = 50.1%, p = 0.012)
Huang, Z. (1997)
ID
** Michels et al. (2006)
** Reeves, G.K. et al. (2007)
Tulinius, H. (1997)
Sonnenschein, E. (1999)
Manjer, J (2001)
Galanis, D.J. (1998)
** Lukanova A. (2006)
** Palmer, J.R. et al. (2007)
Vatten, L. J. (1992)
Tornberg, S. A. (1994)
Study
Weiderpass, E. (2004)
Kaaks, R. (1998)
** Lundqvist et al (2007)
Lahmann PH (2004)
** Iwasaki et al. (2007)
0.97 (0.95, 0.99)
0.95 (0.92, 0.98)
RR (95% CI)
0.98 (0.96, 1.01)
0.97 (0.94, 1.00)
1.02 (0.93, 1.11)
0.95 (0.84, 1.07)
1.00 (0.89, 1.13)
1.09 (0.96, 1.24)
0.87 (0.73, 1.03)
0.99 (0.96, 1.02)
0.94 (0.90, 0.98)
0.86 (0.79, 0.93)
2 units BMI
0.92 (0.88, 0.97)
0.99 (0.89, 1.10)
0.98 (0.93, 1.03)
0.96 (0.92, 1.00)
1.08 (0.98, 1.18)
100.00
10.68
Weight
11.96
11.05
3.68
2.22
2.17
2.04
1.20
10.83
9.33
4.19
%
7.42
2.84
7.58
9.25
3.57
BRE04117
WCRF_Code
BRE80033
BRE80146
BRE12565
BRE11604
BRE17790
BRE03058
BRE80100
BRE80122
BRE12828
BRE12417
BRE18151
BRE04522
BRE80002
BRE15804
BRE20027
Nurses' Health Study (NHS) Cohort
StudyDescription
NHS II
The Million Women Study
Reykjavik Study
New York Women's Health Study
Malmo Preventive Project (MPP)
Hawaii State Department of Health
Northern Sweden Health and Disease Cohort
Black Women's Health Study
Norway, 1974
Sweden, 1971
Assembled cohort (Sweden + Norway)
DOM-project Utrecht
Sweden,Finland Co-twin study
EPIC
JPHC
0.97 (0.95, 0.99)
0.95 (0.92, 0.98)
RR (95% CI)
0.98 (0.96, 1.01)
0.97 (0.94, 1.00)
1.02 (0.93, 1.11)
0.95 (0.84, 1.07)
1.00 (0.89, 1.13)
1.09 (0.96, 1.24)
0.87 (0.73, 1.03)
0.99 (0.96, 1.02)
0.94 (0.90, 0.98)
0.86 (0.79, 0.93)
2 units BMI
0.92 (0.88, 0.97)
0.99 (0.89, 1.10)
0.98 (0.93, 1.03)
0.96 (0.92, 1.00)
1.08 (0.98, 1.18)
100.00
10.68
Weight
11.96
11.05
3.68
2.22
2.17
2.04
1.20
10.83
9.33
4.19
%
7.42
2.84
7.58
9.25
3.57
1 .732
1 1.37

139
xxi. Fig. BMI5 Funnel plot for BMI and premenopausal breast cancer

140
xxii. Fig. BMI6 Highest versus lowest forest plot on BMI and premenopausal breast cancer (**=new studies)
I** wasaki et al. (2007) ** Lundqvist et al (2007) ** Palmer, J.R. et al. (2007) Reeves, G.K. et al. (2007) ** Reinier et al. (2007) ** Lukanova A. (2006) ** Michels et al. (2006) Kuriyama, S. (2005) Silvera, S. A. (2005) Lahmann PH (2004) Weiderpass, E. (2004) Lee, S. Y. (2003) Manjer, J (2001) Sonnenschein, E. (1999) Galanis, D.J. (1998) Kaaks, R. (1998) Huang, Z. (1997) Tornberg, S. A. (1994) De Stavola, B. L. (1993) Vatten, L. J. (1992) Le Marchand, L (1988)
ID Study
1.35 (0.53, 3.45) 0.80 (0.44, 1.44) 0.87 (0.62, 1.22) 0.79 (0.68, 0.92) 0.90 (0.61, 1.32) 0.58 (0.30, 1.13) 0.92 (0.76, 1.12) 0.84 (0.24, 2.91) 1.01 (0.74, 1.37) 0.82 (0.59, 1.14) 0.66 (0.40, 1.08) 1.00 (0.78, 1.27) 1.00 (0.57, 1.75) 0.81 (0.45, 1.45) 1.90 (0.91, 3.96) 1.04 (0.65, 1.67) 0.62 (0.45, 0.86) 0.41 (0.27, 0.63) 1.10 (0.59, 2.06) 0.63 (0.48, 0.82) 0.45 (0.23, 0.87)
BMI RR (95% CI)
High vs. Low
BRE20027 BRE80002 BRE80122 BRE80146 BRE80038 BRE80100 BRE80033 BRE22995 BRE24118 BRE15804 BRE18151 BRE17745 BRE17790 BRE11604 BRE03058 BRE04522 BRE04117 BRE12417 BRE02122 BRE12828 BRE15836
WCRF_Code
JPHC Sweden,Finland Co-twin study Black Women's Health Study The Million Women Study Vermont Mammography Cohort Northern Sweden Health and Disease Cohort NHS II Miyagi, 1993 Canadian National Breast Screening Study EPIC Assembled cohort (Sweden + Norway) Korean Women's Cohort (KWC) Malmo Preventive Project (MPP) New York Women's Health Study Hawaii State Department of Health DOM-project Utrecht Nurses' Health Study (NHS) Cohort Sweden, 1971 Guernsey G2 and G3 Norway, 1974 Hawaii 1942, 1960, 1972
StudyDescription
>=30 vs <19 >=30 vs 18.5-<25 >=35 vs <25 >=30 vs 22.5-24.9 >=30 vs <22 >=26 vs 18.5-21.5 >=30 vs 20-22.4 27.5-29.9 vs 18.5-24.9 >=30 vs <=24 >=28.8 vs <=21.5 >=30 vs 20-24.9 >=23 vs <23 >=25.47 vs <=20.61 >=26.37 vs <=21.4 >=26.1 vs <=19.5 >=27.15 vs <=22.5 >31 vs <=20 >=28 vs <22 >=26.5 vs <=21.9 >=28 vs <=21 Q3 vs Q1
Contrast
1.35 (0.53, 3.45) 0.80 (0.44, 1.44) 0.87 (0.62, 1.22) 0.79 (0.68, 0.92) 0.90 (0.61, 1.32) 0.58 (0.30, 1.13) 0.92 (0.76, 1.12) 0.84 (0.24, 2.91) 1.01 (0.74, 1.37) 0.82 (0.59, 1.14) 0.66 (0.40, 1.08) 1.00 (0.78, 1.27) 1.00 (0.57, 1.75) 0.81 (0.45, 1.45) 1.90 (0.91, 3.96) 1.04 (0.65, 1.67) 0.62 (0.45, 0.86) 0.41 (0.27, 0.63) 1.10 (0.59, 2.06) 0.63 (0.48, 0.82) 0.45 (0.23, 0.87)
BMI RR (95% CI)
High vs. Low
BRE20027 BRE80002 BRE80122 BRE80146 BRE80038 BRE80100 BRE80033 BRE22995 BRE24118 BRE15804 BRE18151 BRE17745 BRE17790 BRE11604 BRE03058 BRE04522 BRE04117 BRE12417 BRE02122 BRE12828 BRE15836
WCRF_Code
1 .233 1 4.
3

141
Postmenopause Cohort studies identified in the Jan 2006- Dec 2007 update Table BMI3 shows the included and excluded studies on body mass index (BMI) and breast cancer in postmenopausal women in the meta-analysis. A total of nineteen new prospective cohort, nested case-control and case cohort studies were identified over the update period. (Ahn, J. et al., 2007 , BRE80139;Chang, S. C. et al., 2006 , BRE80110;Ericson, U. et al., 2007 , BRE80128;Gallicchio, L. et al., 2007 , BRE80006;Iwasaki, M. et al., 2007 , BRE20027;Krebs, E. E. et al., 2006 , BRE80106;Lukanova, A. et al., 2006 , BRE80100;Lundqvist, E. et al., 2007 , BRE80002;Lundqvist, E. et al., 2007 , BRE80003;Mellemkjaer, L. et al., 2006 , BRE80039;Modugno, F. et al., 2006 , BRE80137;Palmer, J. R. et al., 2007 , BRE80122;Ravn-Haren, G. et al., 2006 , BRE80151;Reeves, G. K. et al., 2007 , BRE80146;Reinier, K. S. et al., 2006 , BRE80038;Rinaldi, S. et al., 2006 , BRE80101;Suzuki, R. et al., 2006 , BRE80116;Tehard, B. 2006 , BRE80103;Vogel, U. et al., 2007 , BRE80150). Studies selected for the dose-response meta-analysis Nineteen studies were included in the dose-response meta-analysis: the JPHC (Iwasaki, M. et al., 2007 , BRE20027), Sweden, the Finland Co-twin study (Lundqvist, E. et al., 2007 , BRE80002), the Black Women's Health Study (Palmer, J. R. et al., 2007 , BRE80122), The Million Women Study (Reeves, G. K. et al., 2007 , BRE80146), the Northern Sweden Health and Disease Cohort (Lukanova, A. et al., 2006 , BRE80100) , the Study of Osteoporotic Fractures (Krebs, E. E. et al., 2006 , BRE80106), the PLCO Cancer Screening Trial cohort/ BCDDP (Chang, S. C. et al., 2006 , BRE80110), The Swedish Mammography Cohort (Suzuki, R. et al., 2006 , BRE80116), EPIC (Lahmann, P. H. et al., 2004 , BRE15804), the Melbourne Collaborative Cohort Study (Macinnis, R. J. et al., 2004 , BRE80159), the Iowa Women's Health Study (Sellers, Thomas et al., 2002 , BRE20892), the Malmo Preventive Project (MPP) (Manjer, J. K. 2001 , BRE17790), the New York Women's Health Study (Sonnenschein, E. et al., 1999 , BRE11604), the Hawaii State Department of Health study (Galanis, D. J. et al., 1998 , BRE03058), the DOM-project Utrecht (Kaaks, R. et al., 1998 , BRE04522), a cohort in Sweden, 1971(Tornberg, S. A. and Carstensen, J. M. 1994 , BRE12417), The Netherlands Cohort Study on diet and cancer (van den Brandt, P. A. et al., 1997 , BRE12717), the Reykjavik Study (Tulinius, H. et al., 1997 , BRE12565) and the Nurses' Health Study (Huang, Z. et al., 1997 , BRE04117). Studies with appropriate format of data to allow inclusion in the subgroup analyses by HRT use were also listed in Table BMI3. Studies excluded from the dose-response meta-analysis Forty-one studies from twenty different cohort studies were excluded: BBD cohort-CLUE II (Gallicchio, L. et al., 2007 , BRE80006), Canadian National Breast Screening Study (Silvera, S. A. et al., 2006 , BRE24118), CPS-II US cohort (Calle, E. E. et al., 2003 , BRE01340;Feigelson, H. S. et al., 2004 , BRE02721;Patel, A. V. et al., 2003 , BRE16299;Petrelli, Jennifer et al., 2002 , BRE20653), Danish Cohort, 1930 (Ahlgren, M. et al., 2004 , BRE14201), Diet, Cancer and Health (Mellemkjaer, L. et al., 2006 , BRE80039;Ravn-Haren, G. et al., 2006 , BRE80151;Vogel, U. et al., 2007 , BRE80150), DOM-project Utrecht (Den Tonkelaar, I. et al., 1994 , BRE02222;Den Tonkelaar, I. et al.,

142
1995 , BRE02224), French EPIC-E3N (Tehard, B. et al., 2004 , BRE12173;Tehard, B. 2006 , BRE80103), EPIC (Rinaldi, S. et al., 2006 , BRE80101), Guernsey G2 and G3 (De Stavola, B. L. et al., 1993 , BRE02122), Hawaii 1942, 1960, 1972 (Le Marchand, L. et al., 1988 , BRE15836), Iowa Women's Health Study (Folsom, A. R. et al., 1990 , BRE02836;Gapstur, S. M. et al., 1992 , BRE03101), Malmo Diet and Cancer (Ericson, U. et al., 2007 , BRE80128;Lahmann, P. H. et al., 2003 , BRE20119;Wirfalt, E. et al., 2004 , BRE17083;Wirfalt, E. et al., 2005 , BRE11111;Wirfalt, E. et al., 2002 , BRE13504), Miyagi, 1993 (Kuriyama, S. et al., 2005 , BRE22995), Mobile Clinic Health Examination Survey (Rissanen, H. K. 2003 , BRE17954), New York State Cohort (Graham, S. et al., 1992 , BRE03424), New York Women's Health Study (Saadatian-Elahi, M. et al., 2002 , BRE21486;Toniolo, P. et al., 1994 , BRE12398), NIH- AARP Diet and Health Study (Ahn, J. et al., 2007 , BRE80139), Norway National Health Screening Service (Vatten, L. J. and Kvinnsland, S. 1990 , BRE12826), PLCO Cancer Screening Trial cohort/ BCDDP (Chang, S. C. et al., 2003 , BRE18295), Rancho Bernardo, 1972 (Barrett-Connor, E. and Friedlander, N. J. 1993 , BRE00581), Sweden, Finland Co-twin study (Lundqvist, E. et al., 2007 , BRE80003), Swedish cohort, 1963 (Tornberg, S. A. et al., 1988 , BRE12418), The Netherlands Cohort Study on diet and cancer (van den Brandt, P. A. et al., 1993 , BRE16919), The Swedish Mammography Cohort (Jumaan, A. O. et al., 1999 , BRE04514), Vermont Mammography Cohort (Reinier, K. S. et al., 2006 , BRE80038), Women's Health Initiative (WHI) Study (Modugno, F. et al., 2006 , BRE80137;Morimoto, Libby et al., 2002 , BRE20457). The BBD cohort-CLUE II study was not included in the meta-analysis because this study investigated possible effect modifications in selected obesity-related genetic polymorphisms in the association of body mass and breast cancer in postmenopausal women with benign breast disease. They reported no statistically significant associations for single nucleotide polymorphisms in PPARG, PON1, PON2, LPL, LEPR or TNF-α and BMI and breast cancer risk (Gallicchio, L. et al., 2007 , BRE80006). Subgroup analyses by Hormone Replacement Therapy (HRT) Use Only the EPIC study (494 cases) (Lahmann, P. H. et al., 2004 , BRE15804) had the appropriate format of data to be included in a potential dose-response meta-analysis of HRT users. Results from this study were displayed in Fig.BMI10, along with the summary risk estimate of HRT non users generated from three studies (6705 cases); namely the EPIC study (Lahmann, P. H. et al., 2004 , BRE15804), the Black Women’s Health Study (Palmer, J. R. et al., 2007 , BRE80122) and the Million Women Study (Reeves, G. K. et al., 2007 , BRE80146). A highest versus lowest forest plot subgrouped by menopausal status and HRT use was also generated from relevant studies (Fig. BMI11). Studies with premenopausal women were included in this plot for comparison. HRT use is classified as a dichotomous variable (users or non-users) for the present analysis. The definition could vary between the studies. HRT users could either be current users only (Ahn, J. et al., 2007 , BRE80139;Feigelson, H. S. et al., 2004 , BRE02721;Lahmann, P. H. et al., 2004 , BRE15804) or ever users (Morimoto, Libby et al., 2002 , BRE20457;Suzuki, R. et al., 2006 , BRE80116); while HRT non-users could either be never users (Morimoto, Libby et al., 2002 , BRE20457;Palmer, J. R. et al., 2007 , BRE80122;Reeves, G. K. et al., 2007 , BRE80146;Suzuki, R. et al., 2006 , BRE80116) or never or former users (Ahn, J. et al., 2007 , BRE80139;Feigelson, H. S. et al., 2004 , BRE02721;Lahmann, P. H. et al., 2004 , BRE15804).

143
Results The summary relative risk estimate from the dose-response meta-analysis of 19 studies was 1.05 (95% CI =1.03-1.07), for 2kg/m2 increase in BMI in postmenopausal women, which was similar to the RR of 1.03 (95% CI = 1.01-1.04) reported in 2007 by pooling 17 studies. Out of 19 studies, only two European studies (Kaaks, R. et al., 1998 , BRE04522;Manjer, J. K. 2001 , BRE17790) reported a decreased risk with confidence intervals included one. Excess heterogeneity was observed (I2 = 59.8%, p = 0.000). Meta-regression was performed on each of the following factors: year of publication, geographic area, length of follow-up, anthropometric measurement method and number of exposure categories, but none of these factors significantly explained the heterogeneity observed between the 19 studies included in the dose-response meta-analysis, as clarified below. Possible publication bias was observed in the funnel plot (Fig BMI8), but none of the studies showed a strong influence on the pooled risk estimate as suggested by the sensitive testing. The NIH-AARP Diet and Health Study (Ahn, J. et al., 2007 , BRE80139) and the Vermont Mammography Cohort (Reinier, K. S. et al., 2006 , BRE80038) were not included in the dose-response meta-analysis. In the NIH-AARP Diet and Health Study, a significant positive trend across BMI quantiles was reported in menopausal hormonal therapy (MHT) non-users (p <0.001), but not in current MHT users (p=0.22); whereas in the Vermont Mammography Cohort, they found increased BMI was associated with an increased risk of invasive breast cancer in postmenopausal women (RR = 1.9 for BMI ≥30 vs. BMI <22, 95% CI = 1.40-2.50). These two studies were included in the highest vs. lowest plot (Fig. BMI9). This highest vs. lowest plot on 27 studies presented results in BMI that were mostly positively associated with postmenopausal breast cancer, which supported the effect observed in the dose-response plot (Fig. BMI7). Overall our results were consistent with Renehan’s meta-analysis (Renehan A.G. et al., 2008). The authors reported a pooled RR from 31 studies of 1.12 (95% CI = 1.08-1.16; I2 = 63.9%, p = 0.0) per 5kg/m2 increase in BMI. Although the present analysis was generated from a smaller number of studies (31 vs 19 studies), when converted to the same unit of increment, the RR became very comparable (RR = 1.13, 95% CI = 1.08-1.18). As suggested in this paper, the association tended to be stronger in Asian-Pacific studies than in North American, European and Australian studies (p = 0.06). The same was not observed in the present meta-regression (p = 0.32) that included only two Asian-Pacific studies (Galanis, D. J. et al., 1998 , BRE03058;Iwasaki, M. et al., 2007 , BRE20027), as compared to five (Galanis, D. J. et al., 1998 , BRE03058;Iwasaki, M. et al., 2007 , BRE20027;Kuriyama, S. et al., 2005 , BRE22995;Wu, M. H. et al., 2006 , BRE24628) (Li H.L. et al., 2006) in Renehan’s analysis. Three Asian-Pacific studies were not included because the number of non-cases per exposure level was missing (Kuriyama, S. et al., 2005 , BRE22995), results were not provided by menopausal status (Wu, M. H. et al., 2006 , BRE24628) and one article was published in Chinese (Li H.L. et al., 2006). The summary risk estimate was 1.06 (95% CI = 1.05-1.08; I2 = 14.8%, p = 0.309) per 2 units increase in BMI in the HRT non users (Fig. BMI 10), which was almost the same as the RR of 1.05 (95% CI = 1.03-1.07) observed in the postmenopausal women in general (Fig. BMI7). As for the HRT users, the EPIC study (Lahmann, P. H. et al., 2004 , BRE15804) reported a RR of 0.98 (95% CI = 0.93-1.03) for the same unit of increment in a dose-response analysis. However, as shown in the highest versus lowest forest plot (Fig. BMI11), the association

144
between BMI and postmenopausal breast cancer was generally stronger (risk estimates ranged from 0.96-1.10) in the other studies with HRT users than in the EPIC study; in which the women generally had a lower BMI (for extreme categories comparison: RR >=28.8 vs <=21.5 = 0.71, 95% CI = 0.5-1.01). All the other studies had a maximum exposure category of greater or equal to 30. In general, the positive association between BMI and breast cancer for the highest versus lowest comparison was weaker in the HRT users than in the HRT non users, but an inverse association was not observed, as in the premenopausal women (Fig. BMI11). Published meta-analysis In addition to the meta-analysis on BMI and breast cancer by Renehan et al. (Renehan A.G. et al., 2008) cited before, a pooled analysis of two population-based case-control studies on body size, luminal, HER2-overexpression and triple negative breast cancer in postmenopausal women was published. The analysis included 1008 luminal (hormone receptor positive), 39 HER2-overexpressing (hormone receptor negative, HER2 positive), and 77 triple-negative (hormone receptor and HER2 negative) cases. Among women not currently using menopausal hormone therapy, body mass index (BMI) and weight were associated with the risk of luminal tumors (OR for highest versus lowest quartiles=1.7, 95% CI = 1.2-2.4 and OR = 1.7, 95% CI = 1.2-2.4, respectively) and suggestively associated with risk of triple-negative tumors (OR = 2.7, 95% CI = 1.0-7.5 and OR = 5.1, 95% CI = 1.1-23.0 respectively). Neither BMI nor weight was associated with the risk of any tumor subtype among hormone therapy users (Phipps, A. I. et al., 2008).

145
e)Table BMI3 Inclusion and exclusion of cohort studies on body mass index and postmenopausal breast cancer
Author Year WCRF Code Study name Study type
Sub-group description
Included in the 2005 dose-response meta-analysis
Included in the 2008 dose-response meta-analysis
Included in the 2008 high vs low forest plot
Estimated values for meta-analysis Exclusion reasons
Included in the dose-response1 or high vs. low2 meta-analysis subgrouped by HRT use Remarks
Ahn, J. et al. 2007 BRE80139 NIH- AARP Diet and Health Study
Prospective Cohort
non MHT users, postmenopausal New study No Yes
Missing no. of non cases, can't estimate Yes2
MHT subgroups were pooled by fixed effect meta-analysis before analysis with other studies
Ahn, J. et al. 2007 BRE80139 NIH- AARP Diet and Health Study
Prospective Cohort
Current MHT users, postmenopausal New study No Yes
Missing no. of non cases, can't estimate Yes2
MHT subgroups were pooled by fixed effect meta-analysis before analysis with other studies
Ericson, U. et al. 2007 BRE80128
Malmo Diet and Cancer
Prospective Cohort Postmenopausal New study No No
Selected result pooled by all EPIC centres instead, Lahmann PH 2004, BRE15804 N/A
Malmo Diet and Cancer is a component study of EPIC
Gallicchio et al. 2007 BRE80006
BBD cohort-CLUE II
Prospective Cohort
Genotype subgroups New study No No
Measured genes-diet interactions in subgroups N/A
Iwasaki et al. 2007 BRE20027 JPHC Prospective Cohort Postmenopausal New study Yes Yes
Mean exposure values N/A
Lundqvist et al 2007 BRE80003
Sweden,Finland Co-twin study
Nested Case Control older subjects New study No No
Results were selected from the same study with a prospective design - more cases N/A
This study had 2 study designs (BRE80003 & BRE80002)
Lundqvist et al 2007 BRE80002
Sweden,Finland Co-twin study
Prospective Cohort Postmenopausal New study Yes Yes N/A
This study had 2 study designs (BRE80003 & BRE80002
Palmer, J.R. et al. 2007 BRE80122
Black Women's Health Study
Prospective Cohort Postmenopausal New study Yes Yes
Mean exposure values Yes1,2
Additional analysis was only performed in HRT non users
Reeves, G.K. et al. 2007 BRE80146
The Million Women Study
Prospective Cohort
Post-menop & HRT nonusers New study Yes Yes Yes1,2

146
Reinier et al. 2007 BRE80038
Vermont Mammography
Cohort Prospective Cohort Postmenopausal New study No Yes
Missing no. of cases and non cases, can't estimate N/A
Vogel, U. et al. 2007 BRE80150
Diet, Cancer and Health
Nested Case Control Postmenopausal New study No No
Selected result pooled by all EPIC centres instead, Lahmann PH 2004, BRE15804 N/A
Diet, Cancer and Health study is a component study of EPIC
Chang S.C. 2006 BRE80110
PLCO Cancer Screening Trial cohort/ BCDDP
Prospective Cohort Postmenopausal New study Yes Yes
Mean exposure values N/A
Krebs E.E. 2006 BRE80106
Study of Osteoporotic
Fractures Prospective Cohort Postmenopausal New study Yes Yes
Mean exposure values, no. of cases, non-cases & person-years N/A
Lukanova A. 2006 BRE80100
Northern Sweden Health and
Disease Cohort Prospective Cohort Postmenopausal New study Yes Yes N/A
For the close-ended exposure categories, mid-exposure was taken. For the upper open-ended category, middle exposure plus half the width of the last exposure range was taken in estimating the dose-response slope
Mellemkjoer et al. 2006 BRE80039
Diet, Cancer and Health
Prospective Cohort
HRT never, postmenopausal New study No No
Selected result pooled by all EPIC centres instead, Lahmann PH 2004, BRE15804
No (pooled results from EPIC were selected instead)
Diet, Cancer and Health study is a component study of EPIC
Mellemkjoer et al. 2006 BRE80039
Diet, Cancer and Health
Prospective Cohort
HRT ever, postmenopausal New study No No
Selected result pooled by all EPIC centres instead, Lahmann PH 2004, BRE15804
No (pooled results from EPIC were selected instead)
Diet, Cancer and Health study is a component study of EPIC
Modugno, F. et al. 2006 BRE80137
Women's Health Initiative (WHI) Observational
Study
Nested Case Control
Post-menop & HRT users New study No No
Missing no. of non cases
No (format of data not appropriate)

147
Modugno, F. et al. 2006 BRE80137
Women's Health Initiative (WHI) Observational
Study
Nested Case Control
Post-menop & HRT non users New study No No
Missing no. of non cases
No (format of data not appropriate)
Ravn-Haren, G. et al. 2006 BRE80151
Diet, Cancer and Health
Nested Case Control Postmenopausal New study No No
Selected result pooled by all EPIC centres instead, Lahmann PH 2004, BRE15804 N/A
Diet, Cancer and Health study is a component study of EPIC
Rinaldi S. 2006 BRE80101 EPIC
Nested Case Control Postmenopausal New study No No
Although more recent, less no. of cases than Lahmann PH 2004, BRE15804 N/A
Suzuki, R. 2006 BRE80116
The Swedish Mammography
Cohort Prospective Cohort
Postmenopausal, also subgrouped by HRT use New study Yes Yes
Mean exposure values Yes2
The 2nd exposure category (BMI=18.5-24.9, normal weight) was used as a reference group in this study
Tehard B. 2006 BRE80103 French EPIC-E3N Prospective Cohort Postmenopausal New study No No
Selected result pooled by all EPIC centres instead, Lahmann PH 2004, BRE15804 N/A
French EPIC-E3N is a component study in EPIC
Kuriyama, S. 2005 BRE22995 Miyagi, 1993 Prospective Cohort Postmenopausal No No Yes
No. of non cases missing N/A
Silvera, S. A. 2005 BRE24118
Canadian National Breast Screening Study
Prospective Cohort Postmenopausal No No Yes
No. of cases & non-cases were not provided, can't estimate N/A
Wilfart, E et al. 2005 BRE11111
Malmo Diet and Cancer
Nested Case Control Postmenopausal New study No No
Selected result pooled by all EPIC centres instead, Lahmann PH 2004, BRE15804 N/A
Malmo Diet and Cancer study is a component study in EPIC
Tehard, B. 2004 BRE12173 French EPIC-E3N Prospective Cohort Postmenopausal Yes No No
Selected result pooled by all EPIC centres instead, Lahmann PH 2004, BRE15804 N/A
French EPIC-E3N is a component study in EPIC
Ahlgren, M. 2004 BRE14201 Danish Cohort,
1930 Historical Cohort Postmenopausal Yes No No
A different exposure to BMI N/A
Study measured BMI in childhood

148
Feigelson, H. S. 2004 BRE02721 CPS-II US cohort
Prospective Cohort
HRT - No, postmenopausal No No Yes
No. of non cases not provided, can't estimate (2686 cases), included in HvL plot Yes2
Pooled HRT subgroups by fixed effect meta-analysis
Feigelson, H. S. 2004 BRE02721 CPS-II US cohort
Prospective Cohort
HRT - Yes, postmenopausal No No Yes
No. of non cases not provided, can't estimate (2686 cases), included in HvL plot Yes2
Pooled HRT subgroups by fixed effect meta-analysis
Lahmann PH 2004 BRE15804 EPIC Prospective Cohort
HRT - No, postmenopausal No Yes Yes Yes1,2
Data from HRT subgroups were pooled by fixed effect meta-analysis before analysing with other studies
Lahmann PH 2004 BRE15804 EPIC Prospective Cohort
HRT - Yes, postmenopausal No Yes Yes Yes1,2
Data from HRT subgroups were pooled by fixed effect meta-analysis before analysing with other studies
Macinnis, R.J et al. 2004 BRE80159
Melbourne Collaborative Cohort Study
Prospective Cohort Postmenopausal
No, not in the database but was referenced in the text Yes Yes N/A
Wirfalt, E. 2004 BRE17083 Malmo Diet and
Cancer
Nested Case Control Postmenopausal Yes No No
Selected result pooled by all EPIC centres instead, Lahmann PH 2004, BRE15804 N/A
Malmo Diet and Cancer study is a component study in EPIC
Calle, E. E. 2003 BRE01340 CPS-II US cohort Prospective Cohort Postmenopausal No No No Mortality data N/A
Chang, S. 2003 BRE18295
PLCO Cancer Screening Trial cohort/ BCDDP
Prospective Cohort Postmenopausal No No No
Superseded by Chang 2006 BRE80110 N/A

149
Lahmann, P. H. 2003 BRE20119
Malmo Diet and Cancer
Prospective Cohort Postmenopausal No No No
Selected result pooled by all EPIC centres instead, Lahmann PH 2004, BRE15804 N/A
Malmo Diet and Cancer is a component study in EPIC
Patel, A.V. 2003 BRE16299 CPS-II US cohort Prospective Cohort
Postmenopausal & Lean No No No
No. of non cases not provided, can't estimate (1233 cases) N/A
Patel, A.V. 2003 BRE16299 CPS-II US cohort Prospective Cohort
Postmenopausal & Overweight No No No
No. of non cases not provided, can't estimate (1233 cases) N/A
Rissanen, H. 2003 BRE17954
Mobile Clinic Health
Examination Survey
Nested Case Control Postmenopausal Yes No No Mean difference only N/A
Morimoto, Libby, M. 2002 BRE20457
Women's Health Initiative (WHI) Observational
Study Prospective Cohort
HRT - No, postmenopausal No No Yes
missing no. of non cases, can't estimate Yes2
Data on HRT subgroups were pooled by a fixed effect meta-analysis before analysing with other studies
Morimoto, Libby, M. 2002 BRE20457
Women's Health Initiative (WHI) Observational
Study Prospective Cohort
HRT - Yes, postmenopausal No No Yes
missing no. of non cases, can't estimate Yes2
Data on HRT subgroups were pooled by a fixed effect meta-analysis before analysing with other studies
Petrelli, Jennifer, M. 2002 BRE20653 CPS-II US cohort
Prospective Cohort Postmenopausal No No No Mortality data N/A
Saadatian-Elahi, M. 2002 BRE21486
New York Women's Health
Study
Nested Case Control Postmenopausal Yes No No
Less no. of cases although more recent publication, mean difference only N/A
Sellers, Thomas, A. 2002 BRE20892
Iowa Women's Health Study
Prospective Cohort
Family history of BC - No No Yes Yes
Mean exposure values N/A
Family history of BC subgroups were pooled together by fixed effect meta-analysis
Sellers, Thomas, A. 2002 BRE20892
Iowa Women's Health Study
Prospective Cohort
Family history of BC - Yes No Yes Yes
Mean exposure values N/A
Family history of BC subgroups were pooled together by fixed effect meta-analysis
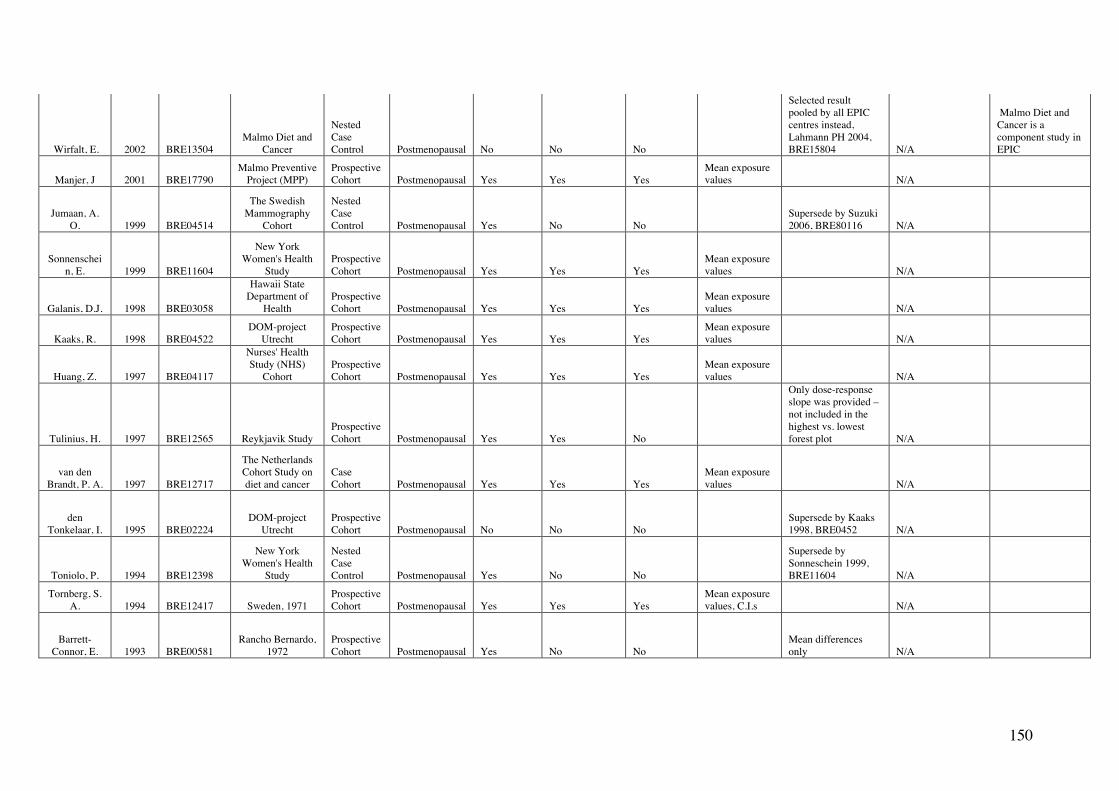
150
Wirfalt, E. 2002 BRE13504 Malmo Diet and
Cancer
Nested Case Control Postmenopausal No No No
Selected result pooled by all EPIC centres instead, Lahmann PH 2004, BRE15804 N/A
Malmo Diet and Cancer is a component study in EPIC
Manjer, J 2001 BRE17790 Malmo Preventive
Project (MPP) Prospective Cohort Postmenopausal Yes Yes Yes
Mean exposure values N/A
Jumaan, A. O. 1999 BRE04514
The Swedish Mammography
Cohort
Nested Case Control Postmenopausal Yes No No
Supersede by Suzuki 2006, BRE80116 N/A
Sonnenschein, E. 1999 BRE11604
New York Women's Health
Study Prospective Cohort Postmenopausal Yes Yes Yes
Mean exposure values N/A
Galanis, D.J. 1998 BRE03058
Hawaii State Department of
Health Prospective Cohort Postmenopausal Yes Yes Yes
Mean exposure values N/A
Kaaks, R. 1998 BRE04522 DOM-project
Utrecht Prospective Cohort Postmenopausal Yes Yes Yes
Mean exposure values N/A
Huang, Z. 1997 BRE04117
Nurses' Health Study (NHS)
Cohort Prospective Cohort Postmenopausal Yes Yes Yes
Mean exposure values N/A
Tulinius, H. 1997 BRE12565 Reykjavik Study Prospective Cohort Postmenopausal Yes Yes No
Only dose-response slope was provided – not included in the highest vs. lowest forest plot N/A
van den Brandt, P. A. 1997 BRE12717
The Netherlands Cohort Study on diet and cancer
Case Cohort Postmenopausal Yes Yes Yes
Mean exposure values N/A
den Tonkelaar, I. 1995 BRE02224
DOM-project Utrecht
Prospective Cohort Postmenopausal No No No
Supersede by Kaaks 1998, BRE0452 N/A
Toniolo, P. 1994 BRE12398
New York Women's Health
Study
Nested Case Control Postmenopausal Yes No No
Supersede by Sonneschein 1999, BRE11604 N/A
Tornberg, S. A. 1994 BRE12417 Sweden, 1971
Prospective Cohort Postmenopausal Yes Yes Yes
Mean exposure values, C.I.s N/A
Barrett-Connor, E. 1993 BRE00581
Rancho Bernardo, 1972
Prospective Cohort Postmenopausal Yes No No
Mean differences only N/A

151
De Stavola, B. L. 1993 BRE02122
Guernsey G2 and G3
Prospective Cohort Postmenopausal No No Yes
Missing no. of non cases, can't estimate N/A
Van den Brandt, P.A. 1993 BRE16919
The Netherlands Cohort Study on diet and cancer
Prospective Cohort Postmenopausal No No No
Superseded by Van den Brandt 1993, BRE12717 N/A
den Tonkelaar, I. 1992 BRE02222
DOM-project Utrecht
Prospective Cohort Postmenopausal No No No
Superseded by Kaaks 1998, BRE04522 N/A
Gapstur, S. M. 1992 BRE03101
Iowa Women's Health Study
Prospective Cohort Postmenopausal Yes No No
Superseded by Sellers 2002, BRE20892 N/A
Graham, S. 1992 BRE03424 New York State
Cohort Prospective Cohort Postmenopausal No No Yes
Only 2 categories – included in the highest vs. lowest forest plot N/A
Folsom, AR 1990 BRE02836 Iowa Women's Health Study
Nested Case Control Postmenopausal No No No
Superseded by Sellers 2002, BRE20892 N/A
Vatten, L. J. 1990 BRE12826
Norway National Health Screening
Service Prospective Cohort Postmenopausal No No No
A different measurement of weight to height index (g/cm2) N/A
Le Marchand, L 1988 BRE15836
Hawaii 1942, 1960, 1972
Nested Case Control Postmenopausal No No Yes
Missing exposure levels N/A
Tornberg, S. A. 1988 BRE12418
Swedish cohort, 1963
Prospective Cohort Postmenopausal No No No
Supersede by Tornberg 1994, BRE12418 N/A
Total number of
articles = 58
Total number of cohort studies =
37
Total number of studies included = 17
Total number of studies included = 19
Total number of studies included = 27
Total number of studies included: HRT users = 11 & 52 HRT non-users = 31 & 72
1 Studies included in the dose-response meta-analysis by HRT use 2 Studies included in the highest versus lowest forest plot by HRT use

152
xxiii. Fig. BMI7 Dose-response meta-analysis on BMI and postmenopausal breast cancer (**=new studies identified during the update)
NOTE: Weights are from random effects analysis
Overall (I-squared = 59.8%, p = 0.000)
** Palmer, J.R. et al. (2007)
Galanis, D.J. (1998)
Tulinius, H. (1997)
Study
Kaaks, R. (1998)
Lahmann PH (2004)
** Reeves, G.K. et al. (2007)
Sellers, Thomas, A. (2002)
van den Brandt, P. A. (1997)
ID
Tornberg, S. A. (1994)
** Lukanova A. (2006)
Sonnenschein, E. (1999)
Huang, Z. (1997)
Manjer, J (2001)
** Suzuki, R. (2006)
** Krebs E.E. (2006)
Macinnis, R.J et al. (2004)
** Lundqvist et al (2007) ** Iwasaki et al. (2007)
** Chang S.C. (2006)
1.05 (1.03, 1.07)
1.01 (0.97, 1.04)
1.09 (1.01, 1.17)
1.05 (1.00, 1.10)
2 units BMI
0.96 (0.83, 1.10)
1.03 (1.00, 1.06)
1.07 (1.06, 1.08)
1.10 (1.07, 1.13)
1.03 (0.97, 1.09)
RR (95% CI)
1.05 (1.01, 1.10)
1.00 (0.95, 1.06)
1.20 (1.08, 1.32)
1.02 (0.99, 1.05)
0.97 (0.88, 1.07)
1.07 (1.01, 1.14)
1.05 (0.99, 1.12)
1.05 (1.01, 1.10)
1.06 (1.02, 1.10) 1.07 (0.98, 1.17)
1.04 (1.00, 1.08)
100.00
6.70
3.24
5.34
%
1.08
7.63
10.27
8.42
4.38
Weight
5.97
4.40
1.93
8.32
2.09
4.26
4.18
5.83
6.49 2.54
6.94
BRE80122
BRE03058
BRE12565
BRE04522
BRE15804
BRE80146
BRE20892
BRE12717
WCRF_Code
BRE12417
BRE80100
BRE11604
BRE04117
BRE17790
BRE80116
BRE80106
BRE80159
BRE80002 BRE20027
BRE80110
Black Women's Health Study
Hawaii State Department of Health
Reykjavik Study
DOM-project Utrecht
EPIC
The Million Women Study
Iowa Women's Health Study
The Netherlands Cohort Study on diet and cancer
StudyDescription
Sweden, 1971
Northern Sweden Health and Disease Cohort
New York Women's Health Study
Nurses' Health Study (NHS) Cohort
Malmo Preventive Project (MPP)
The Swedish Mammography Cohort
Study of Osteoporotic Fractures
Melbourne Collaborative Cohort Study
Sweden,Finland Co-twin study JPHC
PLCO Cancer Screening Trial cohort
1.05 (1.03, 1.07)
1.01 (0.97, 1.04)
1.09 (1.01, 1.17)
1.05 (1.00, 1.10)
2 units BMI
0.96 (0.83, 1.10)
1.03 (1.00, 1.06)
1.07 (1.06, 1.08)
1.10 (1.07, 1.13)
1.03 (0.97, 1.09)
RR (95% CI)
1.05 (1.01, 1.10)
1.00 (0.95, 1.06)
1.20 (1.08, 1.32)
1.02 (0.99, 1.05)
0.97 (0.88, 1.07)
1.07 (1.01, 1.14)
1.05 (0.99, 1.12)
1.05 (1.01, 1.10)
1.06 (1.02, 1.10) 1.07 (0.98, 1.17)
1.04 (1.00, 1.08)
100.00
6.70
3.24
5.34
%
1.08
7.63
10.27
8.42
4.38
Weight
5.97
4.40
1.93
8.32
2.09
4.26
4.18
5.83
6.49 2.54
6.94
1 .757 1 1.3
2

153
xxiv. Fig. BMI8 Funnel plot for BMI and postmenopausal breast cancer

154
xxv. Fig. BMI9 Highest versus lowest forest plot on BMI and postmenopausal breast cancer (**=new studies identified during the update)
** Ahn, J. et al. (2007) ** Iwasaki et al. (2007) ** Lundqvist et al (2007) ** Palmer, J.R. et al. (2007) ** Reeves, G.K. et al. (2007) ** Reinier et al. (2007) ** Chang S.C. (2006) ** Krebs E.E. (2006) ** Lukanova A. (2006) ** Suzuki, R. (2006) Kuriyama, S. (2005) Silvera, S. A. (2005) Feigelson, H. S. (2004) Lahmann PH (2004) Macinnis, R.J et al. (2004) Morimoto, Libby, M. (2002) Sellers, Thomas, A. (2002) Manjer, J (2001) Sonnenschein, E. (1999) Galanis, D.J. (1998) Kaaks, R. (1998) Huang, Z. (1997) van den Brandt, P. A. (1997) Tornberg, S. A. (1994) De Stavola, B. L. (1993) Graham, S. (1992) Le Marchand, L (1988)
ID Study
1.70 (1.26, 2.30) 2.28 (0.94, 5.53) 1.30 (1.00, 1.69) 0.99 (0.72, 1.36) 1.29 (1.22, 1.36) 1.90 (1.42, 2.54) 1.29 (1.01, 1.64) 1.29 (0.92, 1.81) 1.04 (0.80, 1.36) 1.28 (1.07, 1.53) 2.67 (1.03, 6.92) 1.26 (0.95, 1.67) 1.43 (1.12, 1.82) 1.09 (0.89, 1.34) 1.40 (1.02, 1.93) 1.26 (1.00, 1.59) 1.82 (1.52, 2.18) 0.79 (0.51, 1.23) 2.40 (1.42, 4.07) 1.50 (0.99, 2.27) 0.81 (0.43, 1.52) 1.13 (0.87, 1.46) 0.98 (0.66, 1.45) 1.13 (0.93, 1.38) 1.10 (0.57, 2.11) 1.09 (0.88, 1.35) 0.72 (0.24, 2.17)
BMI RR (95% CI) High vs. Low
BRE80139 BRE20027 BRE80002 BRE80122 BRE80146 BRE80038 BRE80110 BRE80106 BRE80100 BRE80116 BRE22995 BRE24118 BRE02721 BRE15804 BRE80159 BRE20457 BRE20892 BRE17790 BRE11604 BRE03058 BRE04522 BRE04117 BRE12717 BRE12417 BRE02122 BRE03424 BRE15836
WCRF_Code
NIH- AARP Diet and Health Study JPHC Sweden,Finland Co-twin study Black Women's Health Study The Million Women Study Vermont Mammography Cohort PLCO Cancer Screening Trial cohort Study of Osteoporotic Fractures Northern Sweden Health and Disease Cohort The Swedish Mammography Cohort Miyagi, 1993 Canadian National Breast Screening Study CPS-II US cohort EPIC Melbourne Collaborative Cohort Study Women's Health Initiative (WHI) Observational Study Iowa Women's Health Study Malmo Preventive Project (MPP) New York Women's Health Study Hawaii State Department of Health DOM-project Utrecht Nurses' Health Study (NHS) Cohort The Netherlands Cohort Study on diet and cancer Sweden, 1971 Guernsey G2 and G3 New York State Cohort Hawaii 1942, 1960, 1972
StudyDescription
>=40 vs 18.5-22.4 >=30 vs <19 >=30 vs 18.5-<25 >=35 vs <25 >=30 vs 22.5-24.9 >=30 vs <22 >=30 vs <=22.4 >=29 vs <=23 >=27.9 vs 18.5-22.7 >=30 vs 18.5-24.9 >30 vs 18.5-24.9 >=30 vs <=24 >=35 vs <22 >=28.8 vs <=21.5 >=30 vs <=24 >=31.11 vs <=22.6 >=30.7 vs <=22.89 >=26.55 vs <=21.98 >=27.47 vs <=22.31 >=26.1 vs <=19.5 >=27.15 vs <=22.5 >31 vs <=20 >=30 vs <=22.9 >=28 vs <22 >=26.5 vs <=21.9 24-59 vs 13-23 Q3 vs Q1
Contrast
1.70 (1.26, 2.30) 2.28 (0.94, 5.53) 1.30 (1.00, 1.69) 0.99 (0.72, 1.36) 1.29 (1.22, 1.36) 1.90 (1.42, 2.54) 1.29 (1.01, 1.64) 1.29 (0.92, 1.81) 1.04 (0.80, 1.36) 1.28 (1.07, 1.53) 2.67 (1.03, 6.92) 1.26 (0.95, 1.67) 1.43 (1.12, 1.82) 1.09 (0.89, 1.34) 1.40 (1.02, 1.93) 1.26 (1.00, 1.59) 1.82 (1.52, 2.18) 0.79 (0.51, 1.23) 2.40 (1.42, 4.07) 1.50 (0.99, 2.27) 0.81 (0.43, 1.52) 1.13 (0.87, 1.46) 0.98 (0.66, 1.45) 1.13 (0.93, 1.38) 1.10 (0.57, 2.11) 1.09 (0.88, 1.35) 0.72 (0.24, 2.17)
BMI RR (95% CI) High vs. Low
BRE80139 BRE20027 BRE80002 BRE80122 BRE80146 BRE80038 BRE80110 BRE80106 BRE80100 BRE80116 BRE22995 BRE24118 BRE02721 BRE15804 BRE80159 BRE20457 BRE20892 BRE17790 BRE11604 BRE03058 BRE04522 BRE04117 BRE12717 BRE12417 BRE02122 BRE03424 BRE15836
WCRF_Code
1 .144 1 6.9
2

155
xxvi. Fig.BMI10 Dose-response meta-analysis on BMI and postmenopausal breast cancer by HRT use (**=new studies identified during the update)
NOTE: Weights are from random effects analysis
.
.
Overall (I-squared = 76.0%, p = 0.006)
**Palmer, J.R. et al. (2007)
ID
**Reeves, G.K. et al. (2007) Lahmann PH (2004)
HRT users
Subtotal (I-squared = 14.8%, p = 0.309)
Subtotal (I-squared = .%, p = .)
HRT non users
Lahmann PH (2004)
Study
1.04 (1.00, 1.08)
1.02 (0.96, 1.08)
RR (95% CI)
1.07 (1.06, 1.08) 1.06 (1.02, 1.10) 1.06 (1.05, 1.08)
0.98 (0.93, 1.03)
0.98 (0.93, 1.03)
2 units BMI
100.00
18.48
Weight
33.96 25.85 78.28
21.72
21.72
%
BRE80122
wcrf_code
BRE80146 BRE15804
BRE15804
Black Women's Health Study
studydescription
The Million Women Study EPIC
EPIC
1.04 (1.00, 1.08)
1.02 (0.96, 1.08)
RR (95% CI)
1.07 (1.06, 1.08) 1.06 (1.02, 1.10) 1.06 (1.05, 1.08)
0.98 (0.93, 1.03)
0.98 (0.93, 1.03)
2 units BMI
100.00
18.48
Weight
33.96 25.85 78.28
21.72
21.72
%
1 .907 1 1.
1

156
xxvii. Fig.BMI11 Highest versus lowest forest plot on BMI and pre- and postmenopausal breast cancer by HRT use (**=new studies)
.
.
.
Premenopause **Iwasaki et al. (2007) **Lundqvist et al (2007) **Palmer, J.R. et al. (2007) **Reeves, G.K. et al. (2007) **Reinier et al. (2007) **Lukanova A. (2006) **Michels et al. (2006) Kuriyama, S. (2005) Silvera, S. A. (2005) Lahmann PH (2004) Weiderpass, E. (2004) Lee, S. Y. (2003) Manjer, J (2001) Sonnenschein, E. (1999) Galanis, D.J. (1998) Kaaks, R. (1998) Huang, Z. (1997) Tornberg, S. A. (1994) De Stavola, B. L. (1993) Vatten, L. J. (1992) Le Marchand, L (1988) HRT users **Ahn, J. et al. (2007) **Suzuki, R. (2006) Feigelson, H. S. (2004) Lahmann PH (2004) Morimoto, Libby, M. (2002) HRT non users **Ahn, J. et al. (2007) **Palmer, J.R. et al. (2007) **Reeves, G.K. et al. (2007) **Suzuki, R. (2006) Feigelson, H. S. (2004) Lahmann PH (2004) Morimoto, Libby, M. (2002)
ID Study
1.35 (0.53, 3.45) 0.80 (0.44, 1.44) 0.87 (0.62, 1.22) 0.79 (0.68, 0.92) 0.90 (0.61, 1.32) 0.58 (0.30, 1.13) 0.92 (0.76, 1.12) 0.84 (0.24, 2.91) 1.01 (0.74, 1.37) 0.82 (0.59, 1.14) 0.66 (0.40, 1.08) 1.00 (0.78, 1.27) 1.00 (0.57, 1.75) 0.81 (0.45, 1.45) 1.90 (0.91, 3.96) 1.04 (0.65, 1.67) 0.62 (0.45, 0.86) 0.41 (0.27, 0.63) 1.10 (0.59, 2.06) 0.63 (0.48, 0.82) 0.45 (0.23, 0.87)
1.10 (0.64, 1.89) 1.04 (0.75, 1.45) 1.09 (0.70, 1.69) 0.71 (0.50, 1.01) 0.96 (0.73, 1.27)
2.08 (1.44, 3.00) 1.12 (0.66, 1.90) 1.29 (1.22, 1.36) 1.38 (1.07, 1.77) 1.61 (1.20, 2.15) 1.36 (1.06, 1.75) 2.52 (1.62, 3.92)
BMI RR (95% CI) High vs. Low
BRE20027 BRE80002 BRE80122 BRE80146 BRE80038 BRE80100 BRE80033 BRE22995 BRE24118 BRE15804 BRE18151 BRE17745 BRE17790 BRE11604 BRE03058 BRE04522 BRE04117 BRE12417 BRE02122 BRE12828 BRE15836
BRE80139 BRE80116 BRE02721 BRE15804 BRE20457
BRE80139 BRE80122 BRE80146 BRE80116 BRE02721 BRE15804 BRE20457
wcrf_code
JPHC Sweden,Finland Co-twin study Black Women's Health Study The Million Women Study Vermont Mammography Cohort Northern Sweden Health and Disease Cohort NHS II Miyagi, 1993 Canadian National Breast Screening Study EPIC Assembled cohort (Sweden + Norway) Korean Women's Cohort (KWC) Malmo Preventive Project (MPP) New York Women's Health Study Hawaii State Department of Health DOM-project Utrecht Nurses' Health Study (NHS) Cohort Sweden, 1971 Guernsey G2 and G3 Norway, 1974 Hawaii 1942, 1960, 1972
NIH- AARP Diet and Health Study The Swedish Mammography Cohort CPS-II US cohort EPIC Women's Health Initiative (WHI) Observational Study
NIH- AARP Diet and Health Study Black Women's Health Study The Million Women Study The Swedish Mammography Cohort CPS-II US cohort EPIC Women's Health Initiative (WHI) Observational Study
studydescription
>=30 vs <19 >=30 vs 18.5-<25 >=35 vs <25 >=30 vs 22.5-24.9 >=30 vs <22 >=26 vs 18.5-21.5 >=30 vs 20-22.4 27.5-29.9 vs 18.5-24.9 >=30 vs <=24 >=28.8 vs <=21.5 >=30 vs 20-24.9 >=23 vs <23 >=25.47 vs <=20.61 >=26.37 vs <=21.4 >=26.1 vs <=19.5 >=27.15 vs <=22.5 >31 vs <=20 >=28 vs <22 >=26.5 vs <=21.9 >=28 vs <=21 Q3 vs Q1
>=40 vs 18.5-22.4 >=30 vs <=24.9 >=35 vs <22 >=28.8 vs <=21.5 >=31.11 vs <=22.6
>=40 vs 18.5-22.4 >=35 vs <25 >=30 vs 22.5-24.9 >=30 vs <=24.9 >=35 vs <22 >=28.8 vs <=21.5 >=31.11 vs <=22.6
contrast
1.35 (0.53, 3.45) 0.80 (0.44, 1.44) 0.87 (0.62, 1.22) 0.79 (0.68, 0.92) 0.90 (0.61, 1.32) 0.58 (0.30, 1.13) 0.92 (0.76, 1.12) 0.84 (0.24, 2.91) 1.01 (0.74, 1.37) 0.82 (0.59, 1.14) 0.66 (0.40, 1.08) 1.00 (0.78, 1.27) 1.00 (0.57, 1.75) 0.81 (0.45, 1.45) 1.90 (0.91, 3.96) 1.04 (0.65, 1.67) 0.62 (0.45, 0.86) 0.41 (0.27, 0.63) 1.10 (0.59, 2.06) 0.63 (0.48, 0.82) 0.45 (0.23, 0.87)
1.10 (0.64, 1.89) 1.04 (0.75, 1.45) 1.09 (0.70, 1.69) 0.71 (0.50, 1.01)
2.08 (1.44, 3.00) 1.12 (0.66, 1.90) 1.29 (1.22, 1.36) 1.38 (1.07, 1.77) 1.61 (1.20, 2.15) 1.36 (1.06, 1.75) 2.52 (1.62, 3.92)
BMI RR (95% CI) High vs. Low
BRE20027 BRE80002 BRE80122 BRE80146 BRE80038 BRE80100 BRE80033 BRE22995 BRE24118 BRE15804 BRE18151 BRE17745 BRE17790 BRE11604 BRE03058 BRE04522 BRE04117 BRE12417 BRE02122 BRE12828 BRE15836
BRE80139 BRE80116 BRE02721 BRE15804 BRE20457
BRE80139 BRE80122 BRE80146 BRE80116 BRE02721 BRE15804 BRE20457
wcrf_code
1 .233 1 4.
3

157
8.1.6 Weight Change Global Report, 2007 Thirteen reports were retrieved. These included five reports from the Iowa Women’s Health Study (Barnes-Josiah, D. et al., 1995 , BRE00566;Folsom, A. R. et al., 1990 , BRE02836;French, S. A. et al., 1997 , BRE02957;Harvie, M. et al., 2005 , BRE22559;Parker, E. D. F. 2003 , BRE17900), two reports from the EPIC study (Lahmann, P. H. et al., 2004 , BRE18516;Lahmann, P. H. et al., 2005 , BRE23014) and one report each from the NHANES I (Breslow, R. A. et al., 2001 , BRE01123), CPS-II (Feigelson, H. S. et al., 2004 , BRE02721), the Nurses’ Health Study (Huang, Z. et al., 1997 , BRE04117), the Framingham Study (Radimer, K. L. et al., 2004 , BRE16401), the Swedish Twin Cohort (Jonsson, F. et al., 2003 , BRE04482) and the Netherlands Cohort Study on Diet and Cancer (van den Brandt, P. A. et al., 1997 , BRE12717). Update Five reports have been identified during the update period – the Study of Osteoporotic Fractures (Krebs, E. E. et al., 2006 , BRE80106), the NIH-AARP Diet and Health Study (Ahn, J. et al., 2007 , BRE80139), the Nurses’ Health Study (Eliassen, A. H. et al., 2006 , BRE80114), the CPS-II study (Feigelson, H. S. et al., 2006 , BRE80117) and the Black Women’s Health Study (Palmer, J. R. et al., 2007 , BRE80122). The exposures studied were weight change, weight gain, weight change since age 18 years or 25 years. Menopause age unspecified No new studies identified during the update period. Premenopause Only the Black Women’s Health study (Palmer, J. R. et al., 2007 , BRE80122) had presented data during the update period. A statistically non-significant increase risk in premenopausal breast cancer was reported (RR for >=25 vs. <10kg increase in wt since 18years =1.17, 95% CI = 0.90-1.52). Postmenopause Five cohort studies - the Study of Osteoporotic Fractures (Krebs, E. E. et al., 2006 , BRE80106), the NIH-AARP Diet and Health Study (Ahn, J. et al., 2007 , BRE80139), the Nurses’ Health Study (Eliassen, A. H. et al., 2006 , BRE80114), the CPS-II study (Feigelson, H. S. et al., 2006 , BRE80117) and the Black Women’s Health Study (Palmer, J. R. et al., 2007 , BRE80122) had reported new data on weight change and postmenopausal breast cancer. A dose-response meta-analysis was not generated as three out of four potentially included studies (Ahn, J. et al., 2007 , BRE80139;Eliassen, A. H. et al., 2006 , BRE80114;Krebs, E. E. et al., 2006 , BRE80106) had not provided appropriate data. The results of all but one new study are shown in the plot of highest vs. lowest comparisons (Fig. Wtchange1). The exception was the CPS-II study (Feigelson, H. S. et al., 2006 , BRE80117), which investigated weight gain from 18 years and specific cancer outcomes. However, the same study had reported data on weight change and breast cancer previously

158
(Feigelson, H. S. et al., 2004 , BRE02721) and the previous findings were included in the plot along with the results of five other cohort studies retrieved in the SLR (Breslow, R. A. et al., 2001 , BRE01123;Harvie, M. et al., 2005 , BRE22559;Lahmann, P. H. et al., 2005 , BRE23014;Radimer, K. L. et al., 2004 , BRE16401;van den Brandt, P. A. et al., 1997 , BRE12717). Note: The results on the menopausal hormone nonusers in the NIH-AARP Diet and Health Study were pooled from four sub-groups defined by age at menarche. Further grouping with the menopausal hormone nonusers in the same cohort was not performed as the exposure ranges were different. The Framingham study was included here as the cancer outcome investigated was late onset breast cancer.

159
xxviii. Fig.Wtchange1 Highest versus lowest forest plot on weight change and postmenopausal breast cancer (**=new studies identified during the update)
**Ahn, J. et al. (2007) **Ahn, J. et al. (2007) **Palmer, J.R. et al. (2007) **Eliassen, A.H. (2006) **Krebs E.E. (2006) Harvie M. (2005) Lahmann PH (2005) Feigelson, H. S. (2004) Radimer, K.L. (2004) Breslow, R. A. (2001) van den Brandt, P. A. (1997)
ID
Study
0.83 (0.43, 1.61) 1.73 (1.41, 2.13) 1.09 (0.81, 1.47) 1.45 (1.27, 1.66) 1.64 (1.15, 2.34) 2.86 (1.70, 4.79) 1.23 (0.96, 1.58) 1.70 (1.36, 2.12) 1.20 (0.52, 2.79) 1.74 (0.91, 3.31) 1.57 (0.99, 2.48)
change RR (95% CI)
H vs L wt
NIH- AARP Diet and Health Study NIH- AARP Diet and Health Study Black Women's Health Study Nurses' Health Study (NHS) Cohort Study of Osteoporotic Fractures Iowa Women's Health Study EPIC CPS-II US cohort Framingham Study NHNES I The Netherlands Cohort Study on diet and cancer
StudyDescription
BRE80139 BRE80139 BRE80122 BRE80114 BRE80106 BRE22559 BRE23014 BRE02721 BRE16401 BRE01123 BRE12717
WCRF_Code
Current MHT users, post-menopausal MHT non-users, post-menopausal Post-menopausal Post-menopausal Post-menopausal Post-menopausal Post-menopausal Post-menopausal No Sub-Group Post-menopausal Post-menopausal
SubGroupDesc
gained >=50 vs +/-1.9 kg gained >=30 vs -2 to +9.9kg gained >=25 vs <10kg gained >=25 vs +/-2kg gained 29.8+ vs <=5.1% wt gain vs nochange/loss gained >20 vs +/-2kg gained 71+ vs +/-5kg gained >25 vs +/-2kg gained 20+ vs +/- 4.9kg gained >=25 vs 0-4.9kg
Contrast
0.83 (0.43, 1.61) 1.73 (1.41, 2.13) 1.09 (0.81, 1.47) 1.45 (1.27, 1.66) 1.64 (1.15, 2.34) 2.86 (1.70, 4.79) 1.23 (0.96, 1.58) 1.70 (1.36, 2.12) 1.20 (0.52, 2.79) 1.74 (0.91, 3.31) 1.57 (0.99, 2.48)
change RR (95% CI)
H vs L wt
NIH- AARP Diet and Health Study NIH- AARP Diet and Health Study Black Women's Health Study Nurses' Health Study (NHS) Cohort Study of Osteoporotic Fractures Iowa Women's Health Study EPIC CPS-II US cohort Framingham Study NHNES I The Netherlands Cohort Study on diet and cancer
StudyDescription
1 .209 1 4.7
9

160
8.2.1 Waist Circumference Summary of results of the dose-response meta-analysis Premenopausal breast cancer
Results unadjusted for BMI Results adjusted for BMI
2nd Report Continuous update 2nd Report Continuous update
Studies (n) 2 4 - 2
Cases (n) 998 671
RR (95% CI)
(8 cm increase)
1.04(0.92-1.16) 0.97 (0.90-1.05) - 1.12 (1.00-1.25)
Heterogeneity 67.5 %(0-
92.7%)
39.9%,p=0.172 - 0%,p=0.578
Postmenopausal breast cancer
Results unadjusted for BMI Results adjusted for BMI
2nd Report Continuous update 2nd Report Continuous update
Studies (n) 4 7 - 3
Cases (n) 2856 4119
RR (95% CI)
(8 cm increase)
1.05(1.00-1.10) 1.07 (1.04-1.10) - 1.04 (1.00-1.06)
Heterogeneity 0 %(0-85.5%) 6.3%,p=0.380 - 16.7%,p=0.301
Note: In the 2nd report studies adjusted and not adjusted for BMI were pooled together. Overall summary During the update (closure date Dec 2007) seven articles from prospective cohort or case-control studies nested in cohorts investigating the relationship of waist circumference with breast cancer risk were published: the Black Women’s Health Study, USA (Palmer, J. R. et al., 2007 , BRE80122) the Study of Osteoporotic Fractures, USA (Krebs, E. E. et al., 2006 , BRE80106) the NIH- AARP Diet and Health Study, USA (Ahn, J. et al., 2007 , BRE80139), the European Prospective Investigation into Cancer (EPIC) (Rinaldi, S. et al., 2006 , BRE80101) and one report each from the three cohorts included in the EPIC study - the Malmo Diet and Cancer Study (Wirfalt, E. et al., 2005 , BRE11111), the Diet, Cancer and Health study (Mellemkjaer, L. et al., 2006 , BRE80039) and the French EPIC-E3N study (Tehard, B. 2006 , BRE80103). Overall, there are results from 19 reports of cohort studies (12 retrieved in the SLR and seven retrieved in the continuous update). All 19 reports present data on postmenopausal women but
161
only five have additionally reported results on premenopausal women. One Chinese study published in 2005 did not specify menopausal status (Wu, M. H. et al., 2006 , BRE24628). First, meta-analyses by menopausal status were performed using results from the models indicated as best-adjusted models, i.e. models that were maximially adjusted but without further adjustment of BMI. Second, we conducted further meta-analyses including only the results additionally adjusted for BMI. This is different from the meta-analysis performed in 2005, when the studies had been pooled regardless of the BMI adjustment. In the Global Report, two pre-menopausal studies were included in the dose-response meta-analysis. The model selected for Huang et al. (Huang, Z. et al., 1999 , BRE04118) was additionally adjusted for BMI, while Kaaks et al. (Kaaks, R. et al., 1998 , BRE04522) was not. For the post-menopausal analysis, three out of the four studies included did not have BMI accounted for (Folsom, A. R. et al., 1990 , BRE02836;Kaaks, R. et al., 1998 , BRE04522;Mattisson, I. W. 2004 , BRE17807); but the selected model for Huang et al. (Huang, Z. et al., 1999 , BRE04118) was.

162
Premenopause Cohort studies identified in the Jan 2006 – Dec 2007 update Only two studies had published waist circumference and premenopausal breast cancer data during the update period – the Black Women’s Health Study (Palmer, J. R. et al., 2007 , BRE80122) and the French EPIC-E3N study (Tehard, B. 2006 , BRE80103). Studies selected for the dose-response meta-analysis Four out of five studies (Huang, Z. et al., 1999 , BRE04118;Kaaks, R. et al., 1998 , BRE04522;Palmer, J. R. et al., 2007 , BRE80122;Tehard, B. 2006 , BRE80103) with data unadjusted for BMI had provided appropriate format of data to be included in the dose-response meta-analysis. The EPIC study (Lahmann, P. H. et al., 2004 , BRE15804) was excluded from this analysis because the number of non-cases women by category was not reported in the article and it could not be estimated from the data. Reasons for exclusions are in Table W1. Results Waist circumference was not significantly related to premenopausal breast cancer in the dose-response meta-analysis (RR for 8 cm increase =0.97, 95%CI = 0.90-1.05) (Fig W1). There was not significant evidence of heterogeneity (I2 = 39.9%, p = 0.172). The results are similar to what was observed in the SLR, where the overall estimate obtained by pooling two studies was 1.04 (95% CI = 0.92-1.16) for the same increment of waist circumference. The small number of studies did not allow the examination of publication bias. In sensitivity testings, there was no indication of strong influence from any of the four studies on the pooled risk estimate. Two studies presented results additionally adjusted for BMI, the EPIC study (Lahmann, P. H. et al., 2004 , BRE15804) and the Nurses’ Health Study (Huang, Z. et al., 1999 , BRE04118). The overall estimate of these two studies was borderline statistically significant (RR for 8 cm
increase =1.12, 95% CI = 1.00-1.25, I2 = 0%, p = 0.578). In both studies waist circumference was related to risk of premenopausal breast cancer only after accounting for overall obesity. In the EPIC study, the RR highest vs. lowest was 1.07 (95% CI = 0.77-1.48) before and 1.81 (95% CI = 1.11-2.97) after adjustment for BMI. In the Nurses’ the RR highest vs. lowest was 0.90 (95% CI = 0.52-1.55) before adjustment for BMI and 1.74 (95% CI = 0.74-4.07) after adjustment. The highest versus lowest forest plots supported the results of the dose-response meta-analysis (Figs W3 and W4).

163
f)Table W1 Inclusion and exclusion of cohort studies on waist circumference and premenopausal breast cancer
1Results from a model not adjusted for BMI 2Results from a model adjusted for BMI
Author Year WCRF Code Study name Study type
Included in the 2005 dose-response meta-anlaysis
Included in the 2008 dose-response meta-analysis
Included in the 2008 high vs low forest plot
Estimated values for meta-analysis
Exclusion reasons
Remarks
Palmer, J.R. et al. 2007 BRE80122
Black Women's Health Study
Prospective Cohort New study Yes1 Yes1 Mean exposure values
Tehard B. 2006 BRE80103 French EPIC-E3N Prospective Cohort New study Yes1 No Mean exposure values
Excluded from high vs. low plot as pooled results from EPIC was selected instead
French EPIC-E3N is a component study of EPIC; when appropriate, either data from this study or data pooled from all EPIC centres presented in the Lahmann PH 2004 BRE15804 paper were used
Lahmann PH 2004 BRE15804 EPIC
Prospective Cohort No Yes2 Yes1,2
No. of non-cases were not provided on the results not adjusted for BMI, can’t estimate
Huang, Z 1999 BRE04118 Nurses' Health Study (NHS) Cohort
Prospective Cohort Yes Yes1,2 Yes1,2
Mean exposure values
Kaaks, R. 1998 BRE04522 DOM-project Utrecht Prospective Cohort Yes Yes1 Yes1 Mean exposure values
Total no. of articles=5
Total no. of cohort studies=5
Total no. of studies included=2
Total no. of studies included=41& 22
Total no. of studies=41& 22

164
xxix. Fig. W1 Dose-response meta-analysis on waist circumference and premenopausal breast cancer, results unadjusted for BMI (**=new studies)
NOTE: Weights are from random effects analysis
Overall (I-squared = 39.9%, p = 0.172)
ID
Kaaks, R. (1998)
Huang, Z (1999)
**Tehard B. (2006)
Study
**Palmer, J.R. et al. (2007)
0.97 (0.90, 1.05)
RR (95% CI)
0.94 (0.81, 1.11)
1.00 (0.89, 1.12)
0.84 (0.70, 0.99)
8cm WC
1.02 (0.96, 1.10)
100.00
Weight
16.91
26.10
15.03
%
41.96
wcrf_code
BRE04522
BRE04118
BRE80103
BRE80122
studydescription
DOM-project Utrecht
Nurses' Health Study (NHS) Cohort
French EPIC-E3N
Black Women's Health Study
0.97 (0.90, 1.05)
RR (95% CI)
0.94 (0.81, 1.11)
1.00 (0.89, 1.12)
0.84 (0.70, 0.99)
8cm WC
1.02 (0.96, 1.10)
100.00
Weight
16.91
26.10
15.03
%
41.96
1 .705 1 1.4
2

165
xxx. Fig. W2 Dose-response meta-analysis on waist circumference and premenopausal breast cancer, results adjusted for BMI

166
xxxi. Fig. W3 Highest versus lowest forest plot on waist circumference and premenopausal breast cancer, results unadjusted for BMI
** Palmer, J.R. et al. (2007)
Lahmann PH (2004)
Huang, Z (1999)
Kaaks, R. (1998)
ID
Study
1.04 (0.73, 1.48)
1.07 (0.77, 1.48)
0.90 (0.52, 1.55)
0.92 (0.57, 1.49)
WC RR (95% CI)
High vs. Low
BRE80122
BRE15804
BRE04118
BRE04522
Black Women's Health Study
EPIC
Nurses' Health Study (NHS)
DOM-project Utrecht
studydescription
>=94 vs <68.6cm
>=89.3 vs <=70.9cm
91.4-139.7 vs 38.1-70.9cm
>=83.51 vs <=71cm
contrast
1.04 (0.73, 1.48)
1.07 (0.77, 1.48)
0.90 (0.52, 1.55)
0.92 (0.57, 1.49)
WC RR (95% CI)
High vs. Low
BRE80122
BRE15804
BRE04118
BRE04522
Wcrf_code
1 .52
1 1 1.9
2

167
xxxii. Fig. W4 Highest versus lowest forest plot on waist circumference and premenopausal breast cancer, results adjusted for BMI

168
Postmenopause Cohort studies identified in the Jan 2006 – Dec 2007 update Seven prospective cohort or nested case-control studies had published results on waist circumference and postmenopausal breast cancer during the update period (Ahn, J. et al., 2007 , BRE80139;Krebs, E. E. et al., 2006 , BRE80106;Mellemkjaer, L. et al., 2006 , BRE80039;Palmer, J. R. et al., 2007 , BRE80122;Rinaldi, S. et al., 2006 , BRE80101;Tehard, B. 2006 , BRE80103;Wirfalt, E. et al., 2005 , BRE11111). This included a report from the EPIC study (Rinaldi, S. et al., 2006 , BRE80101) and three other reports from its component study centres in Sweden (Wirfalt, E. et al., 2005 , BRE11111), Denmark (Mellemkjaer, L. et al., 2006 , BRE80039) and France (Tehard, B. 2006 , BRE80103). Studies selected for the dose-response meta-analysis Ten reports from six different cohort studies were excluded from the meta-analysis: the NIH-AARP Diet and Health Study (Ahn, J. et al., 2007 , BRE80139), the Women Health Initiative (Morimoto, Libby et al., 2002 , BRE20457), the Diet Cancer and Health study (Mellemkjaer, L. et al., 2006 , BRE80039), the E3N-EPIC study (Tehard, B. 2006 , BRE80103), five different reports of the Malmo Diet and Cancer (Lahmann, P. H. et al., 2003 , BRE20119;Mattisson, I. W. 2004 , BRE17807;Wirfalt, E. et al., 2002 , BRE13504;Wirfalt, E. et al., 2004 , BRE17083;Wirfalt, E. et al., 2005 , BRE11111) and one report of the DOM Project, Netherlands (Den Tonkelaar, I. et al., 1995 , BRE02224). Seven studies with appropriate format of data were included in the meta-analysis on BMI unadjusted results. Amongst them, a report of the EPIC study (3580 cases) (Rinaldi, S. et al., 2006 , BRE80101), a report of the Iowa’s Women Health Study (227 cases) (Folsom, A. R. et al., 1990 , BRE02836) and of the DOM Project (275 cases) (Kaaks, R. et al., 1998 , BRE04522). Reasons for exclusions are detailed in Table W2. Results The updated meta-analysis including results of seven studies confirms the results of the meta-analysis of four studies in the SLR for the 2007 Global Report (Fig W5). The estimates of the updated meta-analysis attained statistical significance (RR for 8 cm increase =1.07, 95% CI = 1.04-1.10). The association was borderline statistical significance in the 2007 Report (RR for 8 cm
increase =1.05, 95% CI = 1.00-1.10). There was no significant heterogeneity across study results (I2 = 6.3%, p = 0.380). Sensitivity testing performed by omitting one study at a time did not show strong influence of any of the seven studies on the pooled risk estimate. The meta-analysis of three studies reporting results adjusted for BMI showed similar results to the meta-analysis of studies not adjusted for BMI (Fig W6) (RR for 8 cm increase =1.04, 95% CI = 1.00-1.06). Although the number of studies is limited, these results suggest that body fat distribution may be related to breast cancer independently of overall adiposity in pre- but not in postmenopausal women. The results are supported by the highest versus.lowest forest plots (Figs W8, W9).

169
g)Table W2 Inclusion and exclusion of cohort studies on waist circumference and postmenopausal breast cancer
Author Year WCRF Code Study name
Sub-groups description Study type
Included in the 2005 dose-response meta-anlaysis
Included in the 2008 dose-response meta-analysis
Included in the 2008 high vs. low forest plot
Estimated values for meta-analysis Exclusion reasons Remarks
Ahn, J et al. 2007 BRE80139
NIH-AARP Diet and Health Study Current MHT users
Prospective Cohort New study No Yes1
Missing numbers of non-cases, categorical analysis
MHT users and non-users were pooled by fixed effect meta-analysis
Ahn, J et al. 2007 BRE80139
NIH-AARP Diet and Health Study Non MHT users
Prospective Cohort New study No Yes1
Missing numbers of non-cases, categorical analysis
MHT users and non-users were pooled by fixed effect meta-analysis
Palmer, J.R. et al. 2007 BRE80122
Black Women's Health Study Postmenopausal
Prospective Cohort New study Yes1 Yes1
Mean exposure values
Krebs E.E. 2006 BRE80106
Study of Osteoporotic Fractures Postmenopausal
Prospective Cohort New study Yes1 Yes1
Mean exposure values, no. of cases, non-cases & person-years
Rinaldi S. 2006 BRE80101 EPIC Postmenopausal Nested Case Control New study Yes1 Yes1
Only results unadjusted for BMI were provided
Mellemkjoer et al. 2006 BRE80039
Diet, Cancer and Health HRT never
Prospective Cohort New study No No
Pooled results on EPIC were selected instead from Rinaldi, 2006 BRE801011 & Lahmann PH, 2004 BRE158042
Mellemkjoer et al. 2006 BRE80039
Diet, Cancer and Health HRT ever
Prospective Cohort New study No No
Pooled results on EPIC were selected instead from Rinaldi, 2006 BRE801011 & Lahmann PH, 2004 BRE158042

170
Tehard B. 2006 BRE80103 French EPIC-E3N Postmenopausal Prospective Cohort New study No No
Pooled results on EPIC were selected instead from Rinaldi, 2006 BRE801011 & Lahmann PH, 2004 BRE158042
Wilfart, E et al. 2005 BRE11111
Malmo Diet and Cancer Postmenopausal
Nested Case Control New study No No
Pooled results on EPIC were selected instead from Rinaldi, 2006 BRE801011 & Lahmann PH, 2004 BRE158042 ; mean difference only
Lahmann PH 2004 BRE15804 EPIC HRT-yes
Prospective Cohort No Yes2 Yes2
Only results adjusted for BMI had the appropriate format to include in the dose-response meta-analysis; HRT – yes and no subgroups were pooled by a fixed effect meta-analysis
Lahmann PH 2004 BRE15804 EPIC HRT-no
Prospective Cohort No Yes2 Yes2
Only results adjusted for BMI had the appropriate format to include in the dose-response meta-analysis; HRT – yes and no subgroups were pooled by a fixed effect meta-analysis
Macinnis, R.J et al. 2004 BRE80159
Melbourne Collaborative Cohort Study Postmenopausal
Prospective Cohort
No, not in database but was referenced in the report Yes1 Yes1
Mattisson, I. 2004 BRE17807
Malmo Diet and Cancer Postmenopausal
Prospective Cohort Yes No No
Pooled results on EPIC were selected instead from Rinaldi, 2006 BRE801011 & Lahmann PH, 2004 BRE158042 ; mean difference

171
only
Wirfalt, E. 2004 BRE17083 Malmo Diet and Cancer Postmenopausal
Nested Case Control No No No
Pooled results on EPIC were selected instead from Rinaldi, 2006 BRE801011 & Lahmann PH, 2004 BRE158042 ; mean difference only
Lahmann, P H. 2003 BRE20119
Malmo Diet and Cancer Postmenopausal
Prospective Cohort No No No
Pooled results on EPIC were selected instead from Rinaldi, 2006 BRE801011 & Lahmann PH, 2004 BRE158042
Morimoto, Libby, M. 2002 BRE20457
Women's Health Initiative (WHI) Observational Study HRT-no
Prospective Cohort No No Yes1
Missing number of non-cases, can't estimate as anaylses were subgrouped by HRT status
HRT-no and yes users were grouped by fixed effect meta-analysis
Morimoto, Libby, M. 2002 BRE20457
Women's Health Initiative (WHI) Observational Study HRT-yes
Prospective Cohort No No Yes1
Missing number of non-cases, can't estimate as anaylses were subgrouped by HRT status
HRT-no and yes users were grouped by fixed effect meta-analysis
Sellers, Thomas, A. 2002 BRE20892
Iowa Women's Health Study
Family history BC – No, postmenopausal
Prospective Cohort No Yes2 Yes2
Mean exposure values
Combined with family history of breast cancer - yes using fixed effect meta-analysis, model was further adjusted for BMI
Sellers, Thomas, A. 2002 BRE20892
Iowa Women's Health Study
Family history BC – Yes, postmenopausal
Prospective Cohort No Yes2 Yes2
Mean exposure values
Combined with family history of breast cancer - no using fixed effect meta-analysis, model was further adjusted for BMI
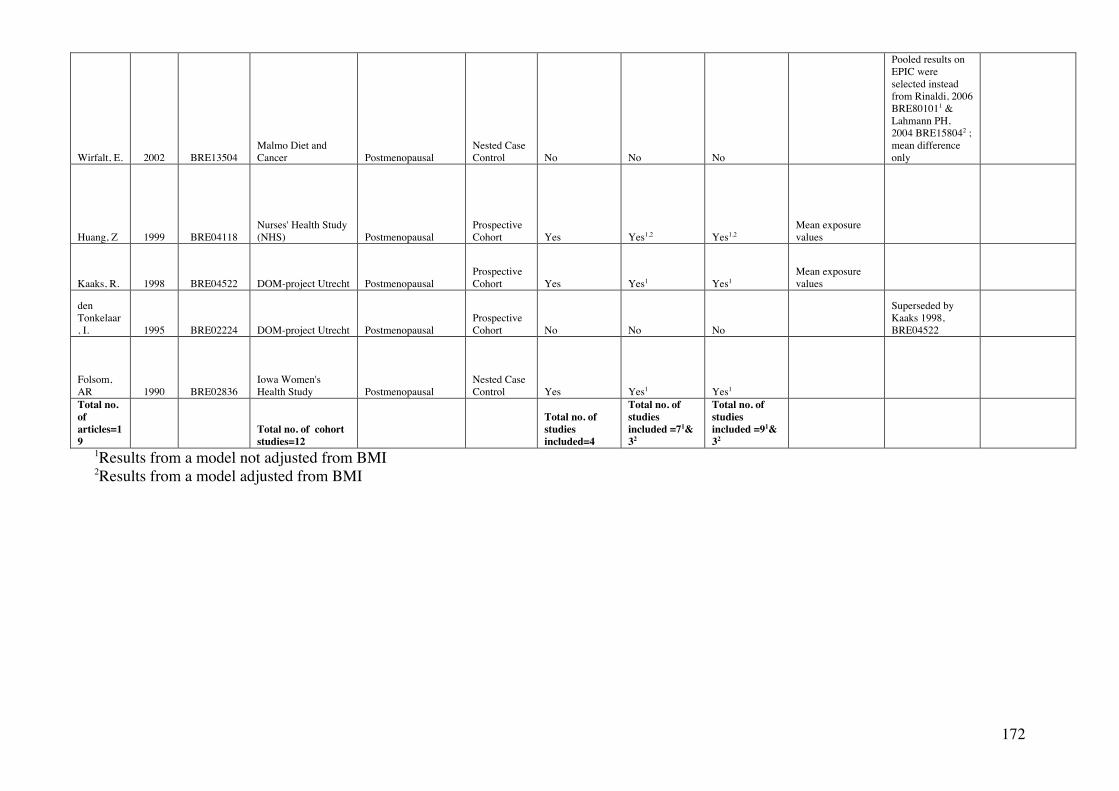
172
Wirfalt, E. 2002 BRE13504 Malmo Diet and Cancer Postmenopausal
Nested Case Control No No No
Pooled results on EPIC were selected instead from Rinaldi, 2006 BRE801011 & Lahmann PH, 2004 BRE158042 ; mean difference only
Huang, Z 1999 BRE04118 Nurses' Health Study (NHS) Postmenopausal
Prospective Cohort Yes Yes1,2 Yes1,2
Mean exposure values
Kaaks, R. 1998 BRE04522 DOM-project Utrecht Postmenopausal Prospective Cohort Yes Yes1 Yes1
Mean exposure values
den Tonkelaar, I. 1995 BRE02224 DOM-project Utrecht Postmenopausal
Prospective Cohort No No No
Superseded by Kaaks 1998, BRE04522
Folsom, AR 1990 BRE02836
Iowa Women's Health Study Postmenopausal
Nested Case Control Yes Yes1 Yes1
Total no. of articles=19
Total no. of cohort studies=12
Total no. of studies included=4
Total no. of studies included =71& 32
Total no. of studies included =91& 32
1Results from a model not adjusted from BMI 2Results from a model adjusted from BMI

173
xxxiii. Fig. W5 Dose-response meta-analysis on waist circumference and postmenopausal breast cancer, results unadjusted for BMI (**= new studies identified during the update)
NOTE: Weights are from random effects analysis
Overall (I-squared = 6.3%, p = 0.380)
Study
**Palmer, J.R. et al. (2007)
Macinnis, R.J et al. (2004)
Folsom, AR (1990)
**Rinaldi S. (2006)
Huang, Z (1999)
**Krebs E.E. (2006)
Kaaks, R. (1998)
ID
1.07 (1.04, 1.10)
8cm WC
1.01 (0.94, 1.09)
1.10 (1.02, 1.19)
1.01 (0.93, 1.10)
1.09 (1.01, 1.18)
1.08 (1.02, 1.14)
1.11 (1.01, 1.22)
1.19 (0.92, 1.55)
RR (95% CI)
100.00
%
17.23
16.27
13.06
14.79
26.63
10.60
1.41
Weight
BRE80122
BRE80159
BRE02836
BRE80101
BRE04118
BRE80106
BRE04522
wcrf_code
Black Women's Health Study
Melbourne Collaborative Cohort Study
Iowa Women's Health Study
EPIC
Nurses' Health Study (NHS) Cohort
Study of Osteoporotic Fractures
DOM-project Utrecht
studydescription
1.07 (1.04, 1.10)
8cm WC
1.01 (0.94, 1.09)
1.10 (1.02, 1.19)
1.01 (0.93, 1.10)
1.09 (1.01, 1.18)
1.08 (1.02, 1.14)
1.11 (1.01, 1.22)
1.19 (0.92, 1.55)
RR (95% CI)
100.00
%
17.23
16.27
13.06
14.79
26.63
10.60
1.41
Weight
1 .645 1 1.5
5
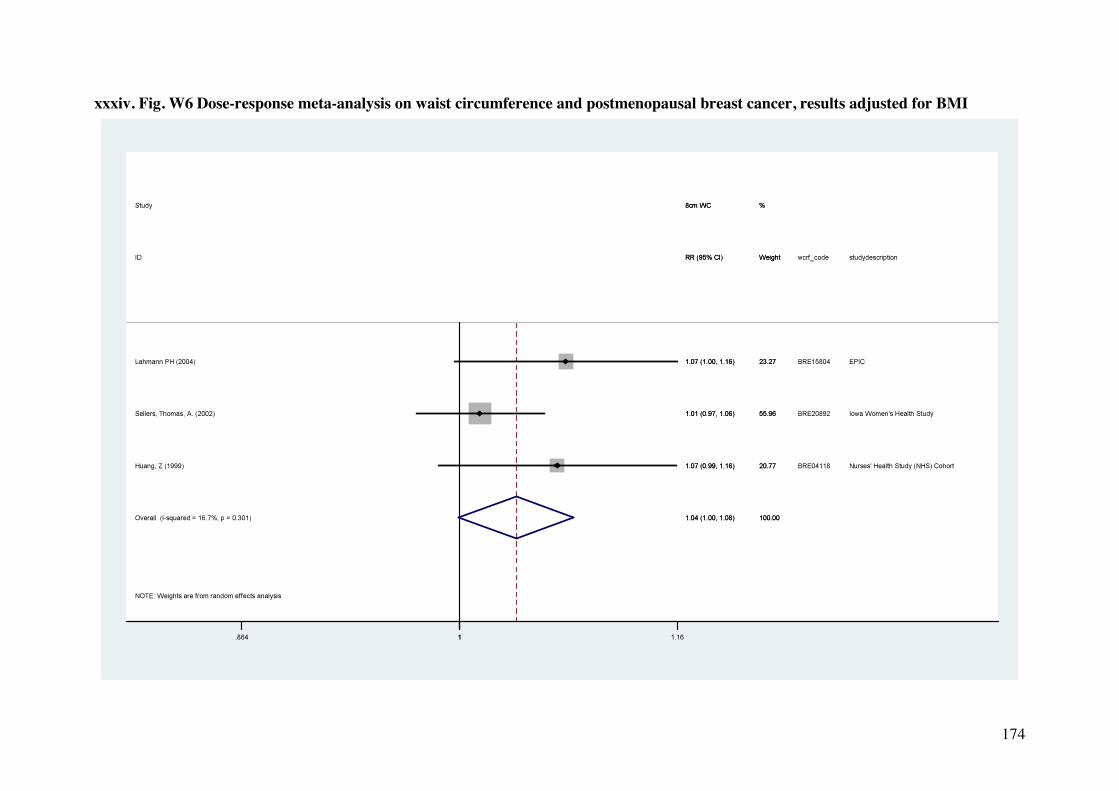
174
xxxiv. Fig. W6 Dose-response meta-analysis on waist circumference and postmenopausal breast cancer, results adjusted for BMI

175
xxxv. Fig. W7 Funnel plot for waist circumference and postmenopausal breast cancer, results unadjusted for BMI

176
xxxvi. Fig. W8 Highest versus lowest forest plot on waist circumference and postmenopausal breast cancer, results unadjusted for BMI (**=new studies identified during the update)
**Ahn, J. et al. (2007) **Palmer, J.R. et al. (2007) **Krebs E.E. (2006) **Rinaldi S. (2006) Macinnis, R.J et al. (2004) Morimoto, Libby, M. (2002) Huang, Z (1999) Kaaks, R. (1998) Folsom, AR (1990)
ID
Study
1.29 (1.05, 1.58) 1.05 (0.73, 1.51) 1.40 (0.98, 1.99) 1.58 (1.10, 2.27) 1.50 (1.09, 2.07) 1.13 (0.90, 1.43) 1.34 (1.05, 1.72) 1.99 (0.81, 4.87) 1.05 (0.73, 1.50)
WC RR (95% CI)
High vs. Low
BRE80139 BRE80122 BRE80106 BRE80101 BRE80159 BRE20457 BRE04118 BRE04522 BRE02836
wcrf_code
NIH- AARP Diet and Health Study Black Women's Health Study Study of Osteoporotic Fractures EPIC Melbourne Collaborative Cohort Study Women's Health Initiative (WHI) Observational Study Nurses' Health Study (NHS) Cohort DOM-project Utrecht Iowa Women's Health Study
studydescription
>103 vs <=75cm >=94 vs <68.6cm >=91.3 vs <=75.7cm >=93.1 vs <=75cm >=87 vs <=71cm >=95.1 vs <=73cm 91.4-139.7 vs 38.1-70.9cm >=83.51 vs <=71cm >=93 vs <=79.8cm
contrast
1.29 (1.05, 1.58) 1.05 (0.73, 1.51) 1.40 (0.98, 1.99) 1.58 (1.10, 2.27) 1.50 (1.09, 2.07) 1.13 (0.90, 1.43) 1.34 (1.05, 1.72) 1.99 (0.81, 4.87) 1.05 (0.73, 1.50)
WC RR (95% CI)
High vs. Low
BRE80139 BRE80122 BRE80106 BRE80101 BRE80159 BRE20457 BRE04118 BRE04522 BRE02836
wcrf_code
1 .205 1 4.8
7

177
xxxvii. Fig. W9 Highest versus lowest forest plot on waist circumference and postmenopausal breast cancer, results adjusted for BMI

178
8.2.3 Waist to hip ratio Summary of results of the dose-response meta-analysis
Note: In the 2nd report studies adjusted and not adjusted for BMI were pooled together. Overall summary Six cohort studies had provided data on waist to hip ratio (WHR) during the update period - the EPIC study (Rinaldi, S. et al., 2006 , BRE80101) and its component studies - Diet, Cancer and Health (Mellemkjaer, L. et al., 2006 , BRE80039) and French EPIC-E3N study (Tehard, B. 2006 , BRE80103); the Study of Osteoporotic Fractures (Krebs, E. E. et al., 2006 , BRE80106), the Black Women’s Health Study (Palmer, J. R. et al., 2007 , BRE80122) and the NIH-AARP Diet and Health Study (Ahn, J. et al., 2007 , BRE80139). In addition were the Melbourne Collaborative Cohort Study (Macinnis, R. J. et al., 2004 , BRE80159) published in 2004, which was referenced in the Global Report only and the ORDET study (Muti, P. et al.,
Premenopausal breast cancer
Results unadjusted for BMI Results adjusted for BMI
2nd Report Continuous update 2nd Report Continuous update
Studies (n) 3 6 - 4
Cases (n) 1169 844
RR (95% CI)
(0.1 unit
increase)
1.20(1.01-1.44) 1.07 (0.90-1.26) - 1.24(0.91-1.67)
Heterogeneity
(I2)
36.0%(0.0-
79.5%)
59.2%, p=0.031 - 75.6%, p=0.006
Postmenopausal breast cancer
Results unadjusted for BMI Results adjusted for BMI
2nd Report Continuous update 2nd Report Continuous update
Studies (n) 5 11 - 5
Cases (n) 4648 3857
RR (95% CI)
(0.1 unit
increase)
1.19(1.10-1.28) 1.09(1.00-1.19) - 1.03(0.95-1.12)
Heterogeneity
(I2)
45.5%(0.0-
80.0)
63.1%, p=0.003 - 30.3%, p=0.220

179
2000, BRE80180) published in 2000, which was missed in the Global Report. A total of 15 cohorts had provided 20 reports on WHR since the beginning of the WCRF/AICR review. First, meta-analyses by menopausal status were performed using results from the models indicated as best-adjusted models, i.e. models that were maximially adjusted but without further adjustment of BMI. Second, we conducted further meta-analyses including only the results additionally adjusted for BMI. This is different from the meta-analysis of the SLR-2006, when the studies had been pooled regardless of the BMI adjustment. In the Global Report, three pre-menopausal studies were included in the dose-response meta-analysis. The models selected for Huang et al. (Huang, Z. et al., 1999 , BRE04118) and Sonnenschein et al. (Sonnenschein, E. et al., 1999 , BRE11604) were additionally adjusted for BMI, while Kaaks et al. (Kaaks, R. et al., 1998 , BRE04522) was not. The same two studies with data that had BMI accounted for were also included in the post-menopausal analysis, but the remaining three studies were not (Gapstur, S. M. et al., 1992 , BRE03101;Kaaks, R. et al., 1998 , BRE04522;Wirfalt, E. et al., 2004 , BRE17083). Menopause age unspecified No new study had reported data during the update period. Premenopause Cohort studies identified in the Jan 2006-Dec 2007 update Only two new prospective cohort studies – the Black Women’s Health Study (Palmer, J. R. et al., 2007 , BRE80122) and the French EPIC-E3N study (Tehard, B. 2006 , BRE80103) were identified over the update period. Studies selected for the dose-response meta-analysis unadjusted for BMI Together with four other studies retrieved in the SLR database, six studies with appropriate format of data were included in the dose-response meta-analysis unadjusted for BMI (Muti, P. et al., 2000, BRE80180, Huang, Z. et al., 1999 , BRE04118;Kaaks, R. et al., 1998 , BRE04522;Palmer, J. R. et al., 2007 , BRE80122;Sonnenschein, E. et al., 1999 , BRE11604;Tehard, B. 2006 , BRE80103). The EPIC study (Lahmann, P. H. et al., 2004 , BRE15804) was not included as the dose-response slope provided was derived from a BMI adjusted model. A total of 1169 cancer cases were included (Table WHR1). Studies selected for the dose-response meta-analysis adjusted for BMI Only four studies - the EPIC study (1879 cases), the Nurses’ Health Study (1037 cases), the New York Women’s Health study (259 cases) and the ORDET study (70 cases) were included in the dose-response meta-analysis adjusted for BMI (Huang, Z. et al., 1999 , BRE04118;Lahmann, P. H. et al., 2004 , BRE15804;Sonnenschein, E. et al., 1999 , BRE11604, Muti, P. et al., 2000, BRE80180). There were 844 cancer cases in this analysis. The study selection process is detailed in Table WHR1. Results
180
No association was observed between WHR and premenopausal breast cancer in the dose-response meta-analysis that was not adjusted for BMI (RR for 0.1 unit increase=1.07, 95% CI = 0.90-1.26). Among these six studies, only the French EPIC-E3N study reported a decrease in risk that was statistically significant (Tehard, B. 2006 , BRE80103) (Fig WHR1). When BMI was taken into account, the risk estiamte for an increment of 0.1 unit in WHR was 1.24, (95% CI = 0.91-1.67) (Fig WHR2). Both analyses were not statistically significant and excess heterogeneity between the studies were observed (I2 = 59.2%, p = 0.031; I2=75.6%, p = 0.006 respectively). Only Huang et al. (Huang, Z. et al., 1999 , BRE04118), Sonnenschein et al. (Sonnenschein, E. et al., 1999 , BRE11604) and Muti et al. (Muti, P. et al., 2000, BRE80180) had reported data both with and without BMI additionally accounted for. As shown in Figs.WHR1 and WHR2, an increased in risk was observed in all three studies when BMI was adjusted (RR BMI adjusted = 1.20 vs. RR BMI not adjusted = 1.09; RR BMI adjusted = 1.56 vs. RR BMI not adjusted = 1.48 and RR BMI adjusted = 1.86 vs. RR BMI not adjusted = 1.51 respectively). This is one of the reasons why as compared to the BMI unadjusted model presented in this report, a stronger summary RR was reported in the Global Report (RR for 0.1 unit increase=1.20, 95% CI = 1.01-1.44), where models that were additionally adjusted for BMI were selected from Huang’s and Sonnenschein’s reports. Also, the contribution of each study towards the summary RR changed after new studies were added to the analysis. Previously in the Global Report, the Nurses’ Health Study was a main contributor (weight = 54.5%), while in the present analyses, this study weighted 19.93% & 29.28% respectively in the BMI unadjusted and BMI adjusted analyses. The number of studies was quite small to fully investigate the heterogeneity between the studies. Nevertheless meta-regression was performed on each of the following factors: year of publication, ethnicity, geographic area, length of follow-up, anthropometric measurement method and number of exposure categories. None of these factors could significantly explain the heterogeneity observed. No publication bias was observed (Fig WHR3) and none of the studies showed a strong influence on the pooled risk estimate as suggested by the sensitivity testing. The results are supported by the highest versus lowest forest plots. (Figs WHR4, WHR5).
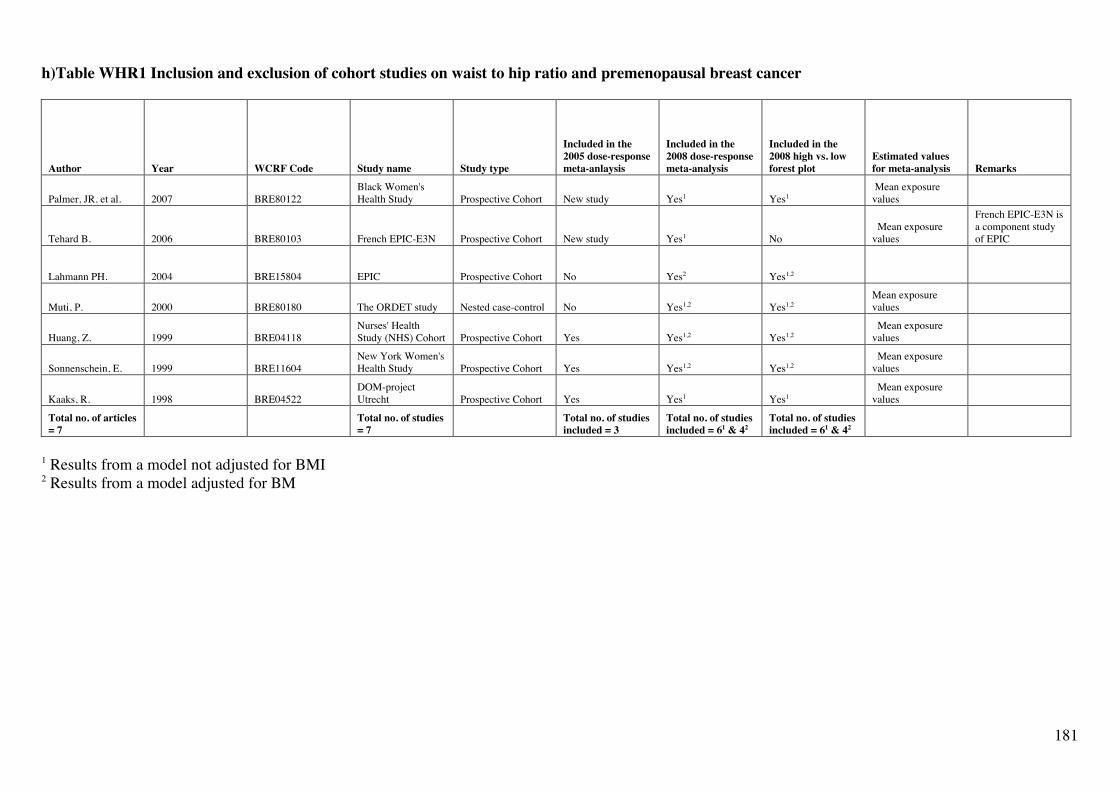
181
h)Table WHR1 Inclusion and exclusion of cohort studies on waist to hip ratio and premenopausal breast cancer
Author Year WCRF Code Study name Study type
Included in the 2005 dose-response meta-anlaysis
Included in the 2008 dose-response meta-analysis
Included in the 2008 high vs. low forest plot
Estimated values for meta-analysis Remarks
Palmer, JR. et al. 2007 BRE80122 Black Women's Health Study Prospective Cohort New study Yes1 Yes1
Mean exposure values
Tehard B. 2006 BRE80103 French EPIC-E3N Prospective Cohort New study Yes1 No Mean exposure values
French EPIC-E3N is a component study of EPIC
Lahmann PH. 2004 BRE15804 EPIC Prospective Cohort No Yes2 Yes1,2
Muti, P. 2000 BRE80180 The ORDET study Nested case-control No Yes1,2 Yes1,2 Mean exposure values
Huang, Z. 1999 BRE04118 Nurses' Health Study (NHS) Cohort Prospective Cohort Yes Yes1,2 Yes1,2
Mean exposure values
Sonnenschein, E. 1999 BRE11604 New York Women's Health Study Prospective Cohort Yes Yes1,2 Yes1,2
Mean exposure values
Kaaks, R. 1998 BRE04522 DOM-project Utrecht Prospective Cohort Yes Yes1 Yes1
Mean exposure values
Total no. of articles = 7
Total no. of studies = 7
Total no. of studies included = 3
Total no. of studies included = 61 & 42
Total no. of studies included = 61 & 42
1 Results from a model not adjusted for BMI 2 Results from a model adjusted for BM

182
xxxviii. Fig. WHR1 Dose-response meta-analysis on waist-hip ratio and premenopausal breast cancer, results unadjusted for BMI (**=new studies identified during the update)
NOTE: Weights are from random effects analysis
Overall (I-squared = 59.2%, p = 0.031)
Kaaks, R. (1998)
Muti P (2000)
ID
**Tehard B. (2006)
Huang, Z (1999)
**Palmer, J.R. et al. (2007)
Sonnenschein, E. (1999)
Study
1.07 (0.90, 1.26)
0.99 (0.71, 1.39)
1.51 (0.91, 2.51)
RR (95% CI)
0.73 (0.55, 0.96)
1.09 (0.87, 1.37)
1.07 (0.96, 1.19)
1.48 (1.02, 2.13)
0.1 WHR
100.00
14.12
8.18
Weight
17.10
19.93
27.87
12.80
%
BRE04522
BRE80180
wcrf_code
BRE80103
BRE04118
BRE80122
BRE11604
DOM-project Utrecht, 1974/1984
The ORDET study
studydescription
E3N-EPIC
Nurses' Health Study (NHS) Cohort
Black Women's Health Study
New York Women's Health Study
1.07 (0.90, 1.26)
0.99 (0.71, 1.39)
1.51 (0.91, 2.51)
RR (95% CI)
0.73 (0.55, 0.96)
1.09 (0.87, 1.37)
1.07 (0.96, 1.19)
1.48 (1.02, 2.13)
0.1 WHR
100.00
14.12
8.18
Weight
17.10
19.93
27.87
12.80
%
1 .398
1 2.51

183
xxxix. Fig. WHR2 Dose-response meta-analysis on waist-hip ratio and premenopausal breast cancer, results adjusted for BMI

184
xl. Fig. WHR3 Funnel plot for waist-hip ratio and premenopausal breast cancer, results unadjusted for BMI

185
xli. Fig. WHR4 Highest versus lowest forest plot on waist-hip ratio and premenopausal breast cancer, results unadjusted for BMI (**= new studies identified during the update)
**Palmer, J.R. et al. (2007)
Lahmann PH (2004)
Muti P (2000)
Huang, Z (1999)
Sonnenschein, E. (1999)
Kaaks, R. (1998)
ID
Study
1.19 (0.87, 1.63)
0.92 (0.66, 1.28)
1.70 (0.89, 3.26)
1.18 (0.74, 1.88)
1.72 (0.96, 3.08)
0.96 (0.60, 1.54)
WHR RR (95% CI)
High vs Low
BRE80122
BRE15804
BRE80180
BRE04118
BRE11604
BRE04522
wcrf_code
Black Women's Health Study
EPIC
The ORDET study
Nurses' Health Study (NHS) Cohort
New York Women's Health Study
DOM-project Utrecht
studydescription
>=0.87 vs <0.71
>=0.85 vs <=0.74
>=0.8 vs <=0.74
>=0.84 vs <0.73
>=0.78 vs <=0.70
>=0.8 vs <=0.73
contrast
1.19 (0.87, 1.63)
0.92 (0.66, 1.28)
1.70 (0.89, 3.26)
1.18 (0.74, 1.88)
1.72 (0.96, 3.08)
0.96 (0.60, 1.54)
WHR RR (95% CI)
High vs Low
BRE80122
BRE15804
BRE80180
BRE04118
BRE11604
BRE04522
wcrf_code
1 .307 1 3.2
6

186
xlii. Fig. WHR5 Highest versus lowest forest plot on waist-hip ratio and premenopausal breast cancer, results adjusted for BMI

187
Postmenopause Cohort studies identified in the Jan 2006-Dec 2007 update A total of six new prospective cohort or nested case-control studies were identified (Ahn, J. et al., 2007 , BRE80139;Krebs, E. E. et al., 2006 , BRE80106;Mellemkjaer, L. et al., 2006 , BRE80039;Palmer, J. R. et al., 2007 , BRE80122;Rinaldi, S. et al., 2006 , BRE80101;Tehard, B. 2006 , BRE80103) over the update period. Studies selected for the dose-response meta-analysis, unadjusted for BMI Of the 20 studies, eleven studies with the appropriate format of data were included in the BMI unadjusted dose-response meta-analysis (Muti, P. et al., 2000, BRE80180; Gapstur, S. M. et al., 1992 , BRE03101;Huang, Z. et al., 1999 , BRE04118;Kaaks, R. et al., 1998 , BRE04522;Krebs, E. E. et al., 2006 , BRE80106;Lahmann, P. H. et al., 2003 , BRE20119;Macinnis, R. J. et al., 2004 , BRE80159;Mellemkjaer, L. et al., 2006 , BRE80039;Palmer, J. R. et al., 2007 , BRE80122;Sonnenschein, E. et al., 1999 , BRE11604;Tehard, B. 2006 , BRE80103), giving a total of 4648 cases. Although Sellers et al. had published a more recent report on the Iowa Women’s Health Study (Sellers, Thomas et al., 2002 , BRE20892) in 2002 (1650 cases), results presented in this report was further adjusted for BMI; therefore data from the same study, presented by Gapstur et al. in 1992 (Gapstur, S. M. et al., 1992 , BRE03101) (489 cases) were retained in the analysis, as in the 2007 Global Report. Studies selected for the dose-response meta-analysis, adjusted for BMI Five studies (3857 cases) with the appropriate format of data were included in the BMI adjusted dose-response meta-analysis (Muti, P. et al., 2000, BRE80180; Huang, Z. et al., 1999 , BRE04118;Lahmann, P. H. et al., 2004 , BRE15804;Sellers, Thomas et al., 2002 , BRE20892;Sonnenschein, E. et al., 1999 , BRE11604). A number of studies had not provided an appropriate format of data and were not included in the dose-response meta-analysis. These included the NIH-AARP Diet and Health Study (Ahn, J. et al., 2007 , BRE80139) and the Women Health Initiative Observational study (Morimoto, Libby et al., 2002 , BRE20457). Details of study selection are given in Table WHR2. Results No association between WHR and postmenopausal breast cancer was observed in the dose-response meta-analyses - for each 0.1 unit increment in WHR, RR = 1.09, 95% CI = 1.00-1.19 with models not adjusted for BMI and RR = 1.03, 95% CI = 0.96-1.12 with models adjusted for BMI. A significant amount of heterogeneity was found across the studies in the analysis unadjusted for BMI (I2 = 63.1%, p = 0.003; I2 = 30.3%, p = 0.220 respectively). The separation of BMI adjusted and unadjusted models in the analyses had not produced very different summary risk estimates (1.03 vs. 1.09). In the Global Report, data from the Nurses’ Health Study (Huang, Z. et al., 1999 , BRE04118) and the New York Women’s Health Study (Sonnenschein, E. et al., 1999 , BRE11604) were further adjusted for BMI. In the former study, the risk estimate remained similar when BMI was unaccounted for (1.15 vs. 1.18), but the difference observed in the latter study was larger (0.99 vs. 1.20) (Figs.WHR6, WHR7).

188
Unlike the premenopausal analysis, the association between WHR and postmenopausal breast cancer was weaker when BMI was further adjusted. The addition of new studies may contribute to the lower summary risk estimates as compared to the risk estimate generated in 2005 for the Global Report (RR for 0.1 unit increase = 1.19, 95% CI = 1.10-1.28). In the 2005 analysis of five studies, more weights were given to the big American studies such as the Iowa Women’s Health Study (47.5%) (Gapstur, S. M. et al., 1992 , BRE03101) and the Nurses’ Health Study (39.3%) (Huang, Z. et al., 1999 , BRE04118), in which the effect observed was strong (RR = 1.18 and 1.15 respectively). Presently in the analysis without BMI further adjusted (Fig. WHR6), these studies only weighted 13.13% and 12.94% respectively. Notice that the WHR data selected for the Malmo Diet and Cancer Study – Lahmann et al. (Lahmann, P. H. et al., 2003 , BRE20119) had replaced Wirfalt et al. (Wirfalt, E. et al., 2004 , BRE17083) with a lower risk estimate of 1.17 vs. 1.49 (Fig. WHR6). The latter nested case-control report with 237 cases had only presented mean WHR data, while the former report (246 cases ascertained after an average of 5.7 years of follow-up) had various confounders controlled for in the model. However, there is no suggestion that the replacement of these study data would contribute to the lower summary risk estimate observed in the present analysis unadjusted for BMI. When the same risk estimate of Wirfalt et al. from the 2005 analysis for the Global Report was used instead of Lahmann et al., the summary risk estimate was 1.11 (95% CI = 1.01-1.22, I2 = 31.35%, d.f. = 10), which is also lower than 1.19 observed in the Global Report. Exploring the heterogeneity through meta-regression suggested that more recent publications were associated with lower risk estimates. This may explain the smaller effect size in the present analysis. No publication bias was observed (Fig. WHR8) and none of the studies showed a strong influence on the pooled risk estimate as suggested by the sensitive testing. The NIH-AARP Diet and Health study (Ahn, J. et al., 2007 , BRE80139) that was not included in the dose-response meta-analysis reported a significant increased risk of breast cancer in relation to WHR in menopausal hormone therapy non-users (RR = 1.88, 95% CI = 1.10-3.23 for WHR >0.94 vs. <0.7). A positive trend that was statistically significant was also reported (p < 0.001). When data by MHT use were merged, the risk estimate became RR highest
vs. lowest = 1.26 (95% CI = 0.91-1.76) (Fig WHR9). The results are supported by the highest versus lowest forest plots. (Figs WHR9, WHR10).
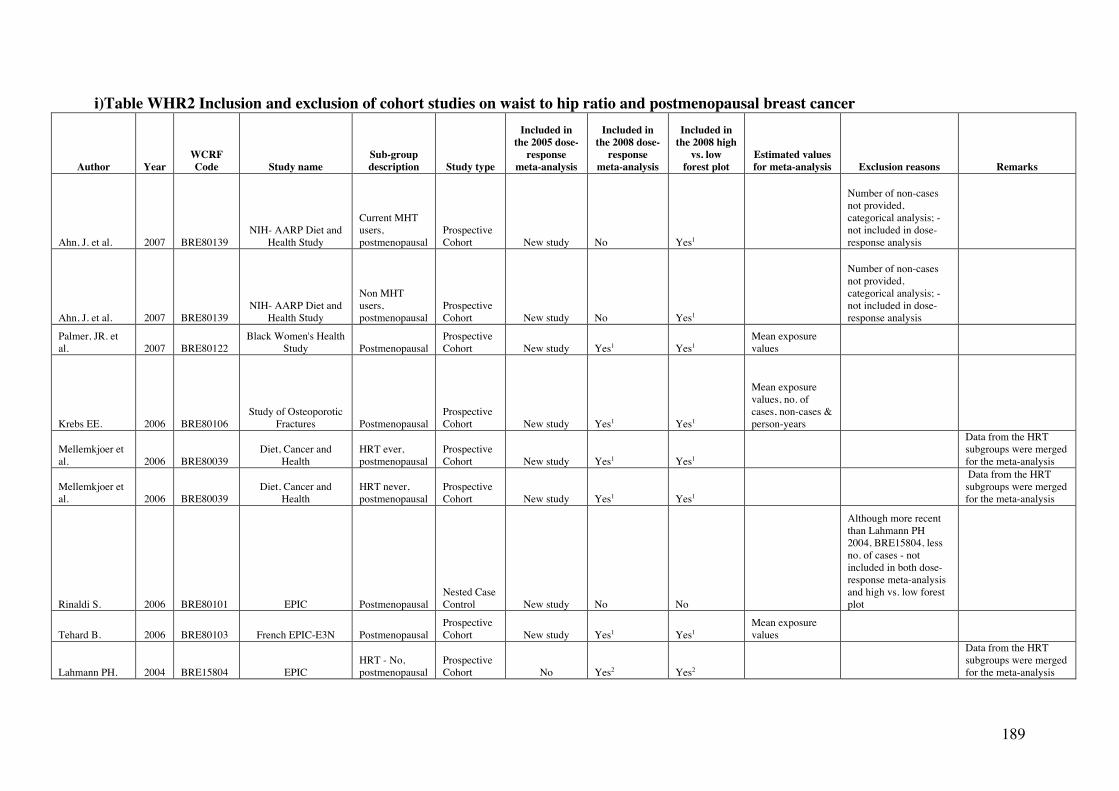
189
i)Table WHR2 Inclusion and exclusion of cohort studies on waist to hip ratio and postmenopausal breast cancer
Author Year WCRF Code Study name
Sub-group description Study type
Included in the 2005 dose-
response meta-analysis
Included in the 2008 dose-
response meta-analysis
Included in the 2008 high
vs. low forest plot
Estimated values for meta-analysis Exclusion reasons Remarks
Ahn, J. et al. 2007 BRE80139 NIH- AARP Diet and
Health Study
Current MHT users, postmenopausal
Prospective Cohort New study No Yes1
Number of non-cases not provided, categorical analysis; - not included in dose-response analysis
Ahn, J. et al. 2007 BRE80139 NIH- AARP Diet and
Health Study
Non MHT users, postmenopausal
Prospective Cohort New study No Yes1
Number of non-cases not provided, categorical analysis; - not included in dose-response analysis
Palmer, JR. et al. 2007 BRE80122
Black Women's Health Study Postmenopausal
Prospective Cohort New study Yes1 Yes1
Mean exposure values
Krebs EE. 2006 BRE80106 Study of Osteoporotic
Fractures Postmenopausal Prospective Cohort New study Yes1 Yes1
Mean exposure values, no. of cases, non-cases & person-years
Mellemkjoer et al. 2006 BRE80039
Diet, Cancer and Health
HRT ever, postmenopausal
Prospective Cohort New study Yes1 Yes1
Data from the HRT subgroups were merged for the meta-analysis
Mellemkjoer et al. 2006 BRE80039
Diet, Cancer and Health
HRT never, postmenopausal
Prospective Cohort New study Yes1 Yes1
Data from the HRT subgroups were merged for the meta-analysis
Rinaldi S. 2006 BRE80101 EPIC Postmenopausal Nested Case Control New study No No
Although more recent than Lahmann PH 2004, BRE15804, less no. of cases - not included in both dose-response meta-analysis and high vs. low forest plot
Tehard B. 2006 BRE80103 French EPIC-E3N Postmenopausal Prospective Cohort New study Yes1 Yes1
Mean exposure values
Lahmann PH. 2004 BRE15804 EPIC HRT - No, postmenopausal
Prospective Cohort No Yes2 Yes2
Data from the HRT subgroups were merged for the meta-analysis

190
Lahmann PH. 2004 BRE15804 EPIC HRT - Yes, postmenopausal
Prospective Cohort No Yes2 Yes2
Data from the HRT subgroups were merged for the meta-analysis
Macinnis, RJ. et al. 2004 BRE80159
Melbourne Collaborative Cohort
Study Postmenopausal Prospective Cohort No Yes1 Yes1
Wirfalt, E. 2004 BRE17083 Malmo Diet and
Cancer Postmenopausal Nested Case Control Yes No No Mean difference only
Lahmann, PH. 2003 BRE20119 Malmo Diet and
Cancer Postmenopausal Prospective Cohort No Yes1 Yes1
Mean exposure values, no. of non-cases & person-years
Morimoto, LM. 2002 BRE20457
Women's Health Initiative (WHI)
Observational Study HRT - No, postmenopausal
Prospective Cohort No No Yes1
Number of non-cases not provided, can't estimate as analyses were subgrouped by HRT status - not included in dose-response analysis
Data from the HRT subgroups were merged for the meta-analysis
Morimoto, LM. 2002 BRE20457
Women's Health Initiative (WHI)
Observational Study HRT - Yes, postmenopausal
Prospective Cohort No No Yes1
Number of non-cases not provided, can't estimate as analyses were subgrouped by HRT status - not included in dose-response analysis
Data from the HRT subgroups were merged for the meta-analysis
Sellers, TA. 2002 BRE20892 Iowa Women's Health
Study Family History BC - No
Prospective Cohort No Yes2 Yes2
Mean exposure values
Data from the family history of BC subgroups were merged for the meta-analysis, total no. of cases = 1650 after 13 yrs of follow-up; results further adjusted for BMI
Sellers, TA. 2002 BRE20892 Iowa Women's Health
Study Family History BC - Yes
Prospective Cohort No Yes2 Yes2
Mean exposure values
Data from the family history of BC subgroups were merged for the meta-analysis, total no. of cases = 1650 after 13 yrs of follow-up; results further adjusted for

191
BMI
Muti, P. 2000 BRE80180 The ORDET study Postmenopausal Nested case-control No Yes1,2 Yes1,2
Mean exposure values
Huang, Z. 1999 BRE04118 Nurses' Health Study
(NHS) Cohort Postmenopausal Prospective Cohort Yes Yes1,2 Yes1,2
Mean exposure values
Sonnenschein, E. 1999 BRE11604
New York Women's Health Study Postmenopausal
Prospective Cohort Yes Yes1,2 Yes1,2
Mean exposure values
Kaaks, R. 1998 BRE04522 DOM-project Utrecht Postmenopausal Prospective Cohort Yes Yes1 Yes1
Mean exposure values
den Tonkelaar, I. 1995 BRE02224 DOM-project Utrecht Postmenopausal
Prospective Cohort No No No
Superseded by Kaaks 1998 BRE04522 - not included in both dose-response meta-analysis and high vs. low forest plot
Sellers, TA. 1993 BRE18025 Iowa Women's Health
Study Family History BC - No
Prospective Cohort No No No
Superseded by Sellers, 2002 BRE20892 - not included in both dose-response meta-analysis and high vs. low forest plot
Sellers, TA. 1993 BRE18025 Iowa Women's Health
Study Family History BC - Yes
Prospective Cohort No No No
Superseded by Sellers, 2002 BRE20892 - not included in both dose-response meta-analysis and high vs. low forest plot
Gapstur, SM. 1992 BRE03101 Iowa Women's Health
Study Postmenopausal Prospective Cohort Yes Yes1 Yes1
Mean exposure values
Total no. of cases = 489, 4 yrs of follow-up; results not further adjusted for BMI
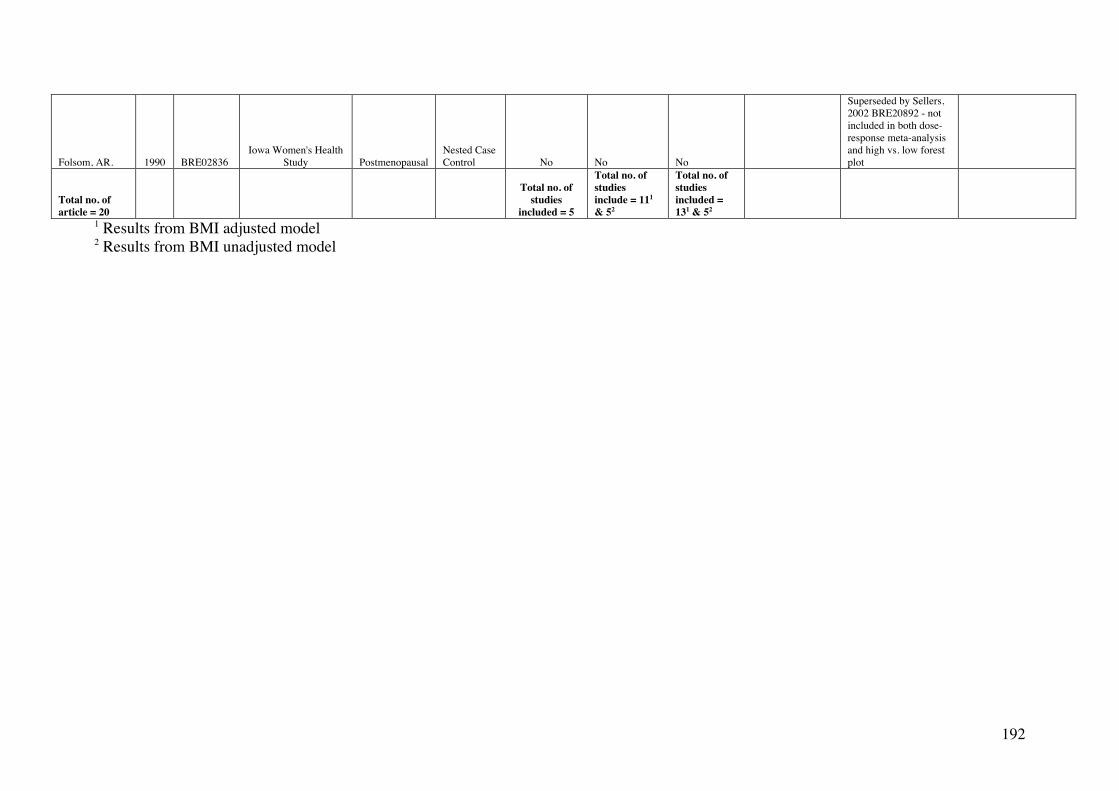
192
Folsom, AR. 1990 BRE02836 Iowa Women's Health
Study Postmenopausal Nested Case Control No No No
Superseded by Sellers, 2002 BRE20892 - not included in both dose-response meta-analysis and high vs. low forest plot
Total no. of article = 20
Total no. of studies
included = 5
Total no. of studies include = 111 & 52
Total no. of studies included = 131 & 52
1 Results from BMI adjusted model 2 Results from BMI unadjusted model

193
xliii. Fig. WHR6 Dose-response meta-analysis on waist-hip ratio and postmenopausal breast cancer, results unadjusted for BMI (**=new studies identified during the update)
NOTE: Weights are from random effects analysis
Overall (I-squared = 63.1%, p = 0.003)
Muti P (2000)
Macinnis, R.J et al. (2004) Lahmann, Petra, H. (2003)
Kaaks, R. (1998)
Huang, Z (1999) Sonnenschein, E. (1999)
**Tehard B. (2006)
**Mellemkjoer et al. (2006)
Gapstur, S. M. (1992)
**Krebs E.E. (2006)
ID
**Palmer, J.R. et al. (2007)
Study
1.09 (1.00, 1.19)
0.94 (0.58, 1.52)
1.10 (0.94, 1.29) 1.17 (0.89, 1.55)
2.05 (1.18, 3.57)
1.18 (1.05, 1.33) 1.20 (0.88, 1.64)
1.02 (0.87, 1.19)
0.87 (0.77, 0.97)
1.18 (1.05, 1.32)
1.15 (0.97, 1.37)
RR (95% CI)
1.03 (0.92, 1.15)
0.1 WHR
100.00
2.65
10.77 6.04
2.11
12.94 5.32
10.86
13.07
13.13
10.10
Weight
13.00
%
BRE80180
BRE80159 BRE20119
BRE04522
BRE04118 BRE11604
BRE80103
BRE80039
BRE03101
BRE80106
wcrf_code
BRE80122
The ORDET study
Melbourne Collaborative Cohort Study Malmo Diet and Cancer
DOM-project Utrecht, 1974/1984
Nurses' Health Study (NHS) Cohort New York Women's Health Study
E3N-EPIC
Diet, Cancer and Health
Iowa Women's Health Study
Study of Osteoporotic Fractures
studydescription
Black Women's Health Study
1.09 (1.00, 1.19)
0.94 (0.58, 1.52)
1.10 (0.94, 1.29) 1.17 (0.89, 1.55)
2.05 (1.18, 3.57)
1.18 (1.05, 1.33) 1.20 (0.88, 1.64)
1.02 (0.87, 1.19)
0.87 (0.77, 0.97)
1.18 (1.05, 1.32)
1.15 (0.97, 1.37)
RR (95% CI)
1.03 (0.92, 1.15)
0.1 WHR
100.00
2.65
10.77 6.04
2.11
12.94 5.32
10.86
13.07
13.13
10.10
Weight
13.00
%
1 .28 1 3.5
7

194
xliv. Fig. WHR7 Dose-response meta-analysis on waist-hip ratio and postmenopausal breast cancer, results adjusted for BMI

195
xlv. Fig. WHR8 Funnel plot for waist-hip ratio and postmenopausal breast cancer, results unadjusted for BMI
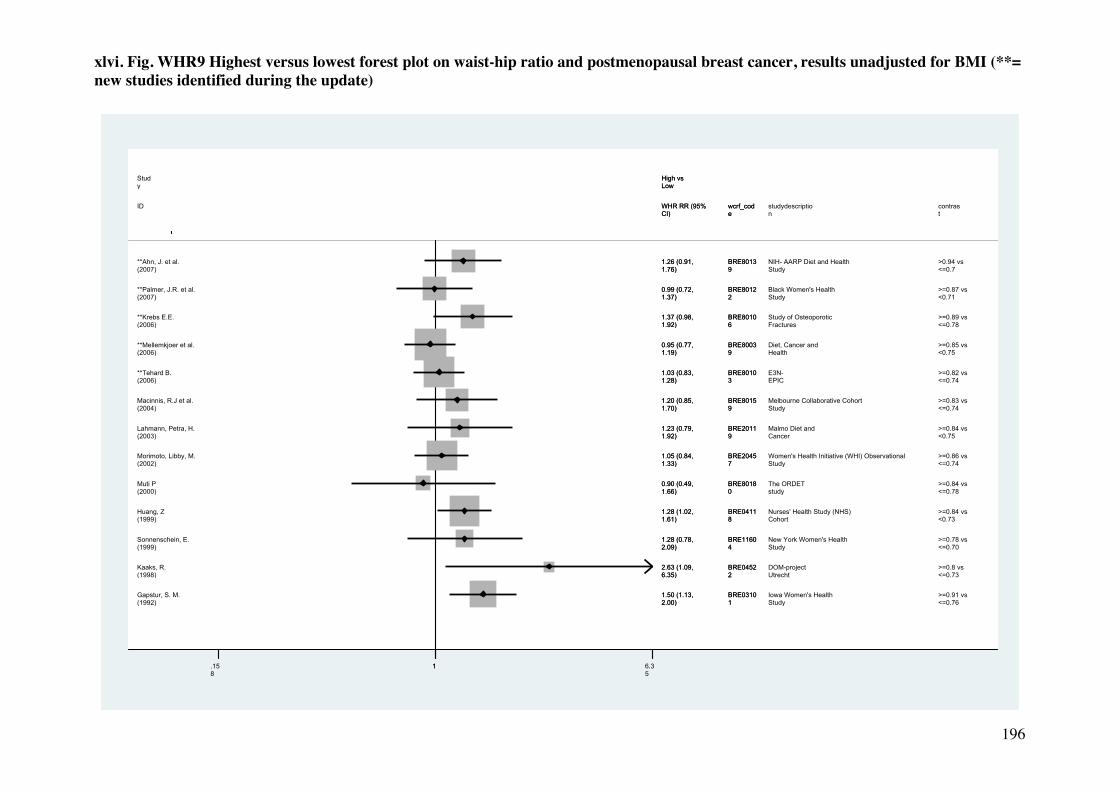
196
xlvi. Fig. WHR9 Highest versus lowest forest plot on waist-hip ratio and postmenopausal breast cancer, results unadjusted for BMI (**= new studies identified during the update)
**Ahn, J. et al. (2007) **Palmer, J.R. et al. (2007) **Krebs E.E. (2006) **Mellemkjoer et al. (2006) **Tehard B. (2006) Macinnis, R.J et al. (2004) Lahmann, Petra, H. (2003) Morimoto, Libby, M. (2002) Muti P (2000) Huang, Z (1999) Sonnenschein, E. (1999) Kaaks, R. (1998) Gapstur, S. M. (1992)
ID
Study
1.26 (0.91, 1.76) 0.99 (0.72, 1.37) 1.37 (0.98, 1.92) 0.95 (0.77, 1.19) 1.03 (0.83, 1.28) 1.20 (0.85, 1.70) 1.23 (0.79, 1.92) 1.05 (0.84, 1.33) 0.90 (0.49, 1.66) 1.28 (1.02, 1.61) 1.28 (0.78, 2.09) 2.63 (1.09, 6.35) 1.50 (1.13, 2.00)
WHR RR (95% CI)
High vs Low
BRE80139 BRE80122 BRE80106 BRE80039 BRE80103 BRE80159 BRE20119 BRE20457 BRE80180 BRE04118 BRE11604 BRE04522 BRE03101
wcrf_code
NIH- AARP Diet and Health Study Black Women's Health Study Study of Osteoporotic Fractures Diet, Cancer and Health E3N-EPIC Melbourne Collaborative Cohort Study Malmo Diet and Cancer Women's Health Initiative (WHI) Observational Study The ORDET study Nurses' Health Study (NHS) Cohort New York Women's Health Study DOM-project Utrecht Iowa Women's Health Study
studydescription
>0.94 vs <=0.7 >=0.87 vs <0.71 >=0.89 vs <=0.78 >=0.85 vs <0.75 >=0.82 vs <=0.74 >=0.83 vs <=0.74 >=0.84 vs <0.75 >=0.86 vs <=0.74 >=0.84 vs <=0.78 >=0.84 vs <0.73 >=0.78 vs <=0.70 >=0.8 vs <=0.73 >=0.91 vs <=0.76
contrast
1.26 (0.91, 1.76) 0.99 (0.72, 1.37) 1.37 (0.98, 1.92) 0.95 (0.77, 1.19) 1.03 (0.83, 1.28) 1.20 (0.85, 1.70) 1.23 (0.79, 1.92) 1.05 (0.84, 1.33) 0.90 (0.49, 1.66) 1.28 (1.02, 1.61) 1.28 (0.78, 2.09) 2.63 (1.09, 6.35) 1.50 (1.13, 2.00)
WHR RR (95% CI)
High vs Low
BRE80139 BRE80122 BRE80106 BRE80039 BRE80103 BRE80159 BRE20119 BRE20457 BRE80180 BRE04118 BRE11604 BRE04522 BRE03101
wcrf_code
1 .158 1 6.3
5

197
xlvii. Fig. WHR10 Highest versus lowest forest plot on waist-hip ratio and postmenopausal breast cancer, results adjusted for BMI

198
8.3.1 Height (and proxy measure) Summary of results of the dose-response meta-analysis Premenopausal breast cancer Postmenopausal breast cancer
2nd Report Continuous update 2nd Report Continuous update
Studies (n) 11 12 15 16
Cases (n) 3206 9024
RR (95% CI)
(5 cm increase)
1.09 (1.05-1.14)
1.09 (1.05-1.12) 1.11 (1.09-1.13)
1.10 (1.07-1.13)
Heterogeneity
I2
29.6%(0-
65.3%)
0%, p=0.449 0% (0-53.6%)
36.2%, p=0.074
Overall summary During the update period, seven reports were identified; from Europe - the Malmo Diet and Cancer study (Wirfalt, E. et al., 2005 , BRE11111), the French EPIC-E3N study (Tehard, B. 2006 , BRE80103) and the Sweden, Finland Co-twin study (Lundqvist, E. et al., 2007 , BRE80002;Lundqvist, E. et al., 2007 , BRE80003); from the United States – the Nurses’ Health Study II (Baer, H. J. et al., 2006 , BRE80118), the PLCO Cancer Screening Trial (Chang, S. C. et al., 2006 , BRE80110) and the Study of Osteoporotic Fractures (Krebs, E. E. et al., 2006 , BRE80106) and from Japan - the JPHC study (Iwasaki, M. et al., 2007 , BRE20027). In addition, data from the Melbourne Collaborative Cohort Study from Australia with European participants were included in the meta-analysis. This study was referenced in the 2007 Global Report only. Forty-six reports were retrieved from the SLR database, which included reports from cohort studies such as the Dom-project from the Netherlands (three reports) (Den Tonkelaar, I. et al., 1994 , BRE02222;Den Tonkelaar, I. et al., 1995 , BRE02224;Kaaks, R. et al., 1998 , BRE04522), the Malmo Diet and Cancer Study (four reports) (Lahmann, P. H. et al., 2003 , BRE20119;Mattisson, I. W. 2004 , BRE17807;Wirfalt, E. et al., 2004 , BRE17083;Wirfalt, E. et al., 2002 , BRE13504), the Nurses’ Health Study (two reports) (Berkey, C. S. et al., 1999 , BRE00743;Colditz, Graham and Rosner, Bernard 2000 , BRE19251), the New York Women’s Health Study (Saadatian-Elahi, M. et al., 2002 , BRE21486;Sonnenschein, E. et al., 1999 , BRE11604;Toniolo, P. et al., 1994 , BRE12398) and the NHANES I (Freni, S. C. et al., 1996 , BRE02960;Swanson, C. A. et al., 1988 , BRE11981), etc. The Nord-Trondelag Health Survey published results on five birth cohorts (Nilsen, T. I. L. and Vatten, L. J. 2001 , BRE16210). Other studies had presented one or two reports that were also mostly based in Europe (De Stavola, B. L. et al., 2004 , BRE02123;De Stavola, B. L. et al., 1993 , BRE02122;Gaard, M. et al., 1994 , BRE03044;Hoyer, A. P. et al., 1998 , BRE15433;Hoyer, A. P. and Engholm, G. 1992 , BRE04086;Jonsson, F. et al., 2003 , BRE04482;Kilkkinen, A. V. 2004 , BRE17698;Lahmann, P. H. et al., 2004 , BRE15804;Manjer, J. K. 2001 , BRE17790;Overvad, K. W. 1991 , BRE17893;Tornberg, S. A. et al., 1988 , BRE12418;Tryggvadottir, L. et al., 2002 , BRE12507;Tulinius, H. et al., 1997 , BRE12565;van den Brandt, P. A. et al., 1997 , BRE12717;Vatten, L. J. et al., 1990 , BRE12833;Vatten, L. J. and Kvinnsland, S. 1992 , BRE12828;Vatten, L. J. and Kvinnsland,
199
S. 1990 , BRE12827;Weiderpass, E. B. 2004 , BRE18151) or the United States (Barrett-Connor, E. and Friedlander, N. J. 1993 , BRE00581;Cerhan, J. R. et al., 2004 , BRE01495;Drake, D. A. 2001 , BRE02418;Galanis, D. J. et al., 1998 , BRE03058;Le Marchand, L. et al., 1988 , BRE15836;Morimoto, Libby et al., 2002 , BRE20457;Palmer, Julie et al., 2001 , BRE20603;Petrelli, Jennifer et al., 2002 , BRE20653;Schatzkin, A. C. 1989 , BRE18013;Sellers, Thomas et al., 2002 , BRE20892). Only three reports were from Asia (Goodman, M. T. et al., 1997 , BRE03352;Key, T. J. et al., 1999 , BRE04758;Wu, M. H. et al., 2006 , BRE24628). Menopause age unspecified Cohort studies identified in the Jan 2006 - Dec 2007 update Only one study (Lundqvist, E. et al., 2007 , BRE80002;Lundqvist, E. et al., 2007 , BRE80003) had provided data, no meta-analysis was generated. Results This Swedish and Finnish study on twins had two study designs - a prospective cohort design (Lundqvist, E. et al., 2007 , BRE80002) and a case-control nested within the cohort (Lundqvist, E. et al., 2007 , BRE80003). With 1637 cases, a RR for Q4 vs. Q1 of 1.6 (95% CI = 1.4-1.8) was reported in the prospective cohort. While a RR for Q4 vs. Q1 of 1.8 (95% CI = 1.3-2.7) was presented in the 1170 nested cases. Premenopause Cohort studies identified in the Jan 2006 - Dec 2007 update Three prospective cohort studies - the JPHC study (Iwasaki, M. et al., 2007 , BRE20027), the Nurses’ Health Study II (Baer, H. J. et al., 2006 , BRE80118) and the French EPIC-E3N study (Tehard, B. 2006 , BRE80103) had published data on height and premenopausal breast cancer during the update period. Studies selected for the dose-response meta-analysis Table Ht1 shows the inclusion and exclusion of studies for the meta-analysis performed on height and premenopausal breast caner for this update report. Altogether twelve studies, two from the update and ten retrieved from the SLR database, were included in the dose-response meta-analysis. The increment unit for the dose-response meta-analysis was remained as 5 cm, as in the Global Report. Results As shown in Fig. Ht1, the estimated summary relative risk on the 12 studies of premenopausal breast cancer was 1.09 (95% CI = 1.05-1.12) for an increase in height of 5cm, which is almost the same as that presented in the 2007 Global Report (RR = 1.09, 95% CI = 1.05 -1.14). There was no suggestion of excess heterogeneity (I2 = 0%, p = 0.449). No indication of strong influence from any single study on the summary risk estimate and no indication of publication bias (Fig. Ht2).

200
For the three studies (De Stavola, B. L. et al., 1993 , BRE02122;Freni, S. C. et al., 1996 , BRE02960;Le Marchand, L. et al., 1988 , BRE15836) not included in the dose-response meta-analysis, all reported an increased in risk for the comparison of highest versus lowest exposure categories (Fig. Ht3).

201
j)Table Ht1 Inclusion and exclusion of cohort studies on height and premenopausal breast cancer
Author
Year WCRF Code Study name Study type
Included in the 2005 dose-response meta-analysis
Included in the 2008 dose-response meta-analysis
Included in the 2008 high vs. low forest plot Exclusion reasons
Estimated values for the analysis Remarks
Iwasaki et al. 2007 BRE20027 JPHC Prospective Cohort New study Yes Yes
Mean exposure values
Baer, H.J. 2006 BRE80118 NHS II Prospective Cohort New study Yes Yes
Tehard B. 2006 BRE80103 French EPIC-E3N
Prospective Cohort New study No No
Data pooled from all the EPIC centres (Lahmann PH 2004, BRE15804) were selected instead
French EPIC-E3N is a component study of EPIC
Lahmann PH 2004 BRE15804 EPIC Prospective Cohort No Yes Yes
Weiderpass, E. 2004 BRE18151
Assembled cohort (Sweden + Norway)
Prospective Cohort No Yes Yes
Reference group was kept as the 3rd quantile as provided in article; mid-exposure values were calculated for the close-ended categories; mid-point plus half of the width of the last exposure category was used for the highest open-ended category
Saadatian-Elahi, M. 2002 BRE21486
New York Women's Health Study
Nested Case Control Yes No No
Mean difference only
Tryggvadottir, L. 2002 BRE12507 Iceland, 1979 Nested Case Control Yes Yes No
Only dose-response analysis were performed
Manjer, J 2001 BRE17790
Malmo Preventive Project (MPP)
Prospective Cohort Yes Yes Yes
Mean exposure values
Palmer, Julie, R. 2001 BRE20603 Black Women's Health Study
Nested Case Control Yes No No
A mixture of prevalent and incident cases
Berkey, C. S. 1999 BRE00743
Nurses' Health Study (NHS) Cohort
Prospective Cohort No No No
Missing no. of cases and non cases & C.I.s, can't estimate
Sonnenschein, E. 1999 BRE11604
New York Women's Health Study
Prospective Cohort Yes Yes Yes
Mean exposure values

202
Galanis, D.J. 1998 BRE03058
Hawaii State Department of Health
Prospective Cohort Yes Yes Yes
Mean exposure values
Kaaks, R. 1998 BRE04522 DOM-project Utrecht
Prospective Cohort Yes Yes Yes
Mean exposure values
Tulinius, H. 1997 BRE12565 Reykjavik Study
Prospective Cohort Yes Yes No
Only dose-response analysis were performed
Freni, S. C. 1996 BRE02960 NHANES I Prospective Cohort No No Yes
Missing no. of non cases, can't estimate
Toniolo, P. 1994 BRE12398
New York Women's Health Study
Nested Case Control Yes No No
Superseded by Sonneschein 1999, BRE11604
De Stavola, B. L. 1993 BRE02122 Guernsey G2 and G3
Prospective Cohort No No Yes
Missing no. of non cases, can't estimate
Vatten, L. J. 1992 BRE12828 Norway, 1974 Prospective Cohort Yes Yes Yes
Mean exposure values
Vatten, L.J. 1990 BRE12827 Norway, 1974 Prospective Cohort No No No
Superseded by Vatten 1992, BRE12828
Le Marchand, L 1988 BRE15836 Hawaii 1942, 1960, 1972
Nested Case Control No No Yes
Missing exposure levels
Tornberg, S. A. 1988 BRE12418 Swedish cohort, 1963
Prospective Cohort Yes Yes No
Only dose-response analysis were performed
Total no. of articles =22
Total number of cohort studies =17
Total number of studies included =11
Total number of studies included =12
Total number of studies included =12

203
xlviii. Fig. Ht1 Dose-response meta-analysis on height and premenopausal breast cancer (**=new studies identified during the update)
NOTE: Weights are from random effects analysis
Overall (I-squared = 0.0%, p = 0.449)
Lahmann PH (2004)
Study
Vatten, L. J. (1992)
ID
Galanis, D.J. (1998)
Tornberg, S. A. (1988)
Tryggvadottir, L. (2002)
Sonnenschein, E. (1999)
Weiderpass, E. (2004)
** Baer, H.J. (2006)
Tulinius, H. (1997)
Kaaks, R. (1998)
** Iwasaki et al. (2007)
Manjer, J (2001)
1.09 (1.05, 1.12)
1.05 (0.98, 1.13)
5cm Height
1.15 (1.06, 1.26)
RR (95% CI)
1.04 (0.85, 1.27)
1.11 (0.98, 1.26)
0.99 (0.80, 1.23)
0.99 (0.84, 1.16)
0.97 (0.85, 1.11)
1.11 (1.06, 1.17)
1.19 (0.99, 1.44)
1.09 (0.93, 1.28)
1.13 (0.97, 1.31)
0.99 (0.86, 1.16)
100.00
16.93
%
12.18
Weight
2.30
5.50
1.96
3.49
5.08
37.93
2.61
3.72
4.19
4.10
BRE15804
BRE12828
WCRF_Code
BRE03058
BRE12418
BRE12507
BRE11604
BRE18151
BRE80118
BRE12565
BRE04522
BRE20027
BRE17790
EPIC
Norway, 1974
StudyDescription
Hawaii State Department of Health
Swedish cohort, 1963
Iceland, 1979
New York Women's Health Study
Assembled cohort (Sweden + Norway)
NHS II
Reykjavik Study
DOM-project Utrecht
JPHC
Malmo Preventive Project (MPP)
1.09 (1.05, 1.12)
1.05 (0.98, 1.13)
5cm Height
1.15 (1.06, 1.26)
RR (95% CI)
1.04 (0.85, 1.27)
1.11 (0.98, 1.26)
0.99 (0.80, 1.23)
0.99 (0.84, 1.16)
0.97 (0.85, 1.11)
1.11 (1.06, 1.17)
1.19 (0.99, 1.44)
1.09 (0.93, 1.28)
1.13 (0.97, 1.31)
0.99 (0.86, 1.16)
100.00
16.93
%
12.18
Weight
2.30
5.50
1.96
3.49
5.08
37.93
2.61
3.72
4.19
4.10
1 .694 1 1.4
4

204
xlix. Fig. Ht2 Funnel plot for height and premenopausal breast cancer

205
l. Fig. Ht3 Highest versus lowest forest plot on height and premenopausal breast cancer (** = new studies identified during the update)
**Iwasaki et al. (2007) **Baer, H.J. (2006) Lahmann PH (2004) Weiderpass, E. (2004) Manjer, J (2001) Sonnenschein, E. (1999) Galanis, D.J. (1998) Kaaks, R. (1998) Freni, S. C. (1996) De Stavola, B. L. (1993) Vatten, L. J. (1992) Le Marchand, L (1988)
ID
Study
1.48 (0.79, 2.76) 1.57 (1.23, 2.01) 1.33 (0.96, 1.84) 0.91 (0.67, 1.23) 1.00 (0.59, 1.70) 0.96 (0.55, 1.67) 1.10 (0.62, 1.96) 1.28 (0.78, 2.11) 1.60 (0.64, 4.03) 1.30 (0.69, 2.46) 1.62 (1.23, 2.14) 1.41 (0.68, 2.92)
Height RR (95% CI)
High vs. Low
BRE20027 BRE80118 BRE15804 BRE18151 BRE17790 BRE11604 BRE03058 BRE04522 BRE02960 BRE02122 BRE12828 BRE15836
WCRF_Code
JPHC NHS II EPIC Assembled cohort (Sweden + Norway) Malmo Preventive Project (MPP) New York Women's Health Study Hawaii State Department of Health DOM-project Utrecht NHANES I Guernsey G2 and G3 Norway, 1974 Hawaii 1942, 1960, 1972
Study
>=160 vs <148cm >=175 vs <160cm >=167.7 vs <=155.9cm >=175 vs 165-169cm >=169.1 vs <=159cm >=170.1 vs <=160.9cm >=160.1 vs <=154.9cm >=169.1 vs <=160.8cm >=167 vs <=155.9cm >=166 vs <=157.9cm >=167 vs <=158.9cm Q3 vs Q1
Contrast
1.48 (0.79, 2.76) 1.57 (1.23, 2.01) 1.33 (0.96, 1.84) 0.91 (0.67, 1.23) 1.00 (0.59, 1.70) 0.96 (0.55, 1.67) 1.10 (0.62, 1.96) 1.28 (0.78, 2.11) 1.60 (0.64, 4.03) 1.30 (0.69, 2.46) 1.62 (1.23, 2.14) 1.41 (0.68, 2.92)
Height RR (95% CI)
High vs. Low
BRE20027 BRE80118 BRE15804 BRE18151 BRE17790 BRE11604 BRE03058 BRE04522 BRE02960 BRE02122 BRE12828 BRE15836
WCRF_Code
1 .248 1 4.0
3
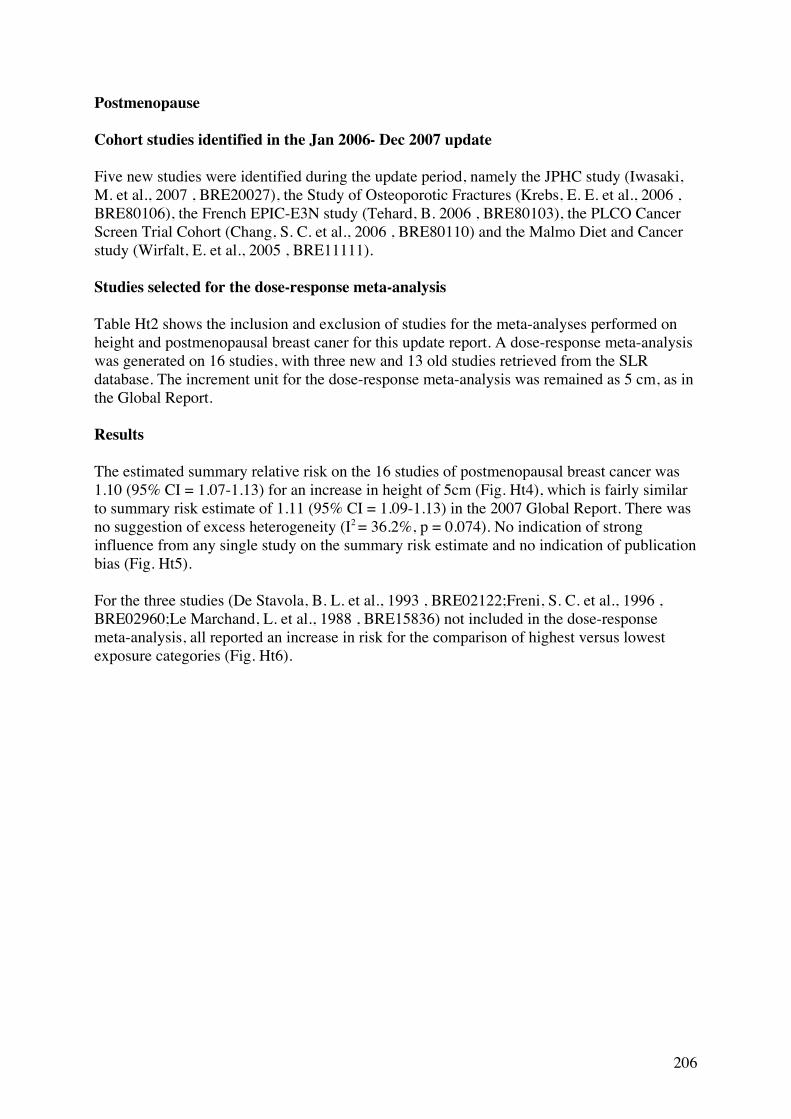
206
Postmenopause Cohort studies identified in the Jan 2006- Dec 2007 update Five new studies were identified during the update period, namely the JPHC study (Iwasaki, M. et al., 2007 , BRE20027), the Study of Osteoporotic Fractures (Krebs, E. E. et al., 2006 , BRE80106), the French EPIC-E3N study (Tehard, B. 2006 , BRE80103), the PLCO Cancer Screen Trial Cohort (Chang, S. C. et al., 2006 , BRE80110) and the Malmo Diet and Cancer study (Wirfalt, E. et al., 2005 , BRE11111). Studies selected for the dose-response meta-analysis Table Ht2 shows the inclusion and exclusion of studies for the meta-analyses performed on height and postmenopausal breast caner for this update report. A dose-response meta-analysis was generated on 16 studies, with three new and 13 old studies retrieved from the SLR database. The increment unit for the dose-response meta-analysis was remained as 5 cm, as in the Global Report. Results The estimated summary relative risk on the 16 studies of postmenopausal breast cancer was 1.10 (95% CI = 1.07-1.13) for an increase in height of 5cm (Fig. Ht4), which is fairly similar to summary risk estimate of 1.11 (95% CI = 1.09-1.13) in the 2007 Global Report. There was no suggestion of excess heterogeneity (I2 = 36.2%, p = 0.074). No indication of strong influence from any single study on the summary risk estimate and no indication of publication bias (Fig. Ht5). For the three studies (De Stavola, B. L. et al., 1993 , BRE02122;Freni, S. C. et al., 1996 , BRE02960;Le Marchand, L. et al., 1988 , BRE15836) not included in the dose-response meta-analysis, all reported an increase in risk for the comparison of highest versus lowest exposure categories (Fig. Ht6).

207
k)Table Ht2 Inclusion and exclusion of cohort studies on height and postmenopausal breast cancer Author Year
WCRF Code Study name Study type SubGroupDesc
Included in the 2005 meta-analysis
Included in the 2008 meta-analysis
Included in the 2008 high vs. low forest plot Exclusion reasons
Estimated values for the analysis Remarks
Iwasaki et al. 2007 BRE20027 JPHC Prospective Cohort Postmenopausal New study Yes Yes
Mean exposure values
Chang S.C. 2006 BRE80110
PLCO Cancer Screening Trial cohort
Prospective Cohort Postmenopausal New study Yes Yes
Mean exposure values
Krebs E.E. 2006 BRE80106
Study of Osteoporotic Fractures
Prospective Cohort Postmenopausal New study Yes No
Only dose-response analysis were performed
Tehard B. 2006 BRE80103 French EPIC-E3N Prospective Cohort Postmenopausal New study No No
Data pooled from all the EPIC centres (Lahmann PH 2004, BRE15804) were selected instead
French EPIC E3N is a component study of EPIC
Wilfart, E et al. 2005 BRE11111 Malmo Diet and Cancer
Nested Case Control Postmenopausal New study No No
Data pooled from all the EPIC centres (Lahmann PH 2004, BRE15804) were selected instead, mean difference only
Malmo Diet and Cancer is a component study of EPIC
Colditz, G. A. 2004 BRE01783
Nurses' Health Study (NHS) Cohort
Prospective Cohort
HRT - No, postmenopausal No No No
Cancer outcome by hormone type
Lahmann PH 2004 BRE15804 EPIC Prospective Cohort Postmenopausal No Yes Yes
Macinnis, R.J et al. 2004 BRE80159
Melbourne Collaborative Cohort Study
Prospective Cohort Postmenopausal No Yes Yes
Mattisson, I. 2004 BRE17807 Malmo Diet and Cancer
Prospective Cohort Postmenopausal Yes No No
Data pooled from all the EPIC centres (Lahmann PH 2004, BRE15804) were selected instead
Malmo Diet and Cancer is a component study of EPIC
Wirfalt, E. 2004 BRE17083 Malmo Diet and Cancer
Nested Case Control Postmenopausal Yes No No
Data pooled from all the EPIC centres (Lahmann PH 2004, BRE15804) were selected instead
Malmo Diet and Cancer is a component study of EPIC
Lahmann, PH. 2003 BRE20119 Malmo Diet and Cancer
Prospective Cohort Postmenopausal No No No
Data pooled from all the EPIC centres (Lahmann PH 2004, BRE15804) were selected instead
Malmo Diet and Cancer is a component study of EPIC

208
Morimoto, Libby, M. 2002 BRE20457
Women's Health Initiative (WHI) Observational Study
Prospective Cohort Postmenopausal No Yes Yes
Mean exposure values, no. of non-cases & person-years
Petrelli, Jennifer, M. 2002 BRE20653 CPS-II US cohort
Prospective Cohort Postmenopausal No No No
Mortality as disease outcome
Saadatian-Elahi, M. 2002 BRE21486
New York Women's Health Study
Nested Case Control Postmenopausal Yes No No Mean difference only
Sellers, Thomas, A. 2002 BRE20892
Iowa Women's Health Study
Prospective Cohort
Family History BC - No & Postmenopausal No Yes Yes
Mean exposure values
Sellers, Thomas, A. 2002 BRE20892
Iowa Women's Health Study
Prospective Cohort
Family History BC - Yes & Postmenopausal No Yes Yes
Mean exposure values
Tryggvadottir, L. 2002 BRE12507 Iceland, 1979
Nested Case Control Postmenopausal Yes Yes No
Only dose-response analysis were performed
Wirfalt, E. 2002 BRE13504 Malmo Diet and Cancer
Nested Case Control Postmenopausal No No No
Data pooled from all the EPIC centres (Lahmann 2004, BRE15804) were selected instead
Malmo Diet and Cancer is a component study of EPIC
Manjer, J 2001 BRE17790 Malmo Preventive Project (MPP)
Prospective Cohort Postmenopausal Yes Yes Yes
Mean exposure values
Palmer, Julie, R. 2001 BRE20603
Black Women's Health Study
Nested Case Control Postmenopausal Yes No No
A mixture of prevalent and incident cases
Berkey, C. S. 1999 BRE00743
Nurses' Health Study (NHS) Cohort
Prospective Cohort Postmenopausal No No No
Missing no. of cases and non cases & C.I.s, can't estimate
Sonnenschein, E. 1999 BRE11604
New York Women's Health Study
Prospective Cohort Postmenopausal Yes Yes Yes
Mean exposure values
Galanis, D.J. 1998 BRE03058
Hawaii State Department of Health
Prospective Cohort Postmenopausal Yes Yes Yes
Mean exposure values
Kaaks, R. 1998 BRE04522 DOM-project Utrecht
Prospective Cohort Postmenopausal Yes Yes Yes
Mean exposure values
Tulinius, H. 1997 BRE12565 Reykjavik Study Prospective Cohort Postmenopausal Yes Yes No
Only dose-response analysis were performed
van den Brandt, P. A. 1997 BRE12717
The Netherlands Cohort Study on diet and cancer Case Cohort Postmenopausal Yes Yes Yes

209
Freni, S. C. 1996 BRE02960 NHANES I Prospective Cohort Postmenopausal No No Yes
Missing no. of non cases, can't estimate
den Tonkelaar, I. 1995 BRE02224
DOM-project Utrecht
Prospective Cohort Postmenopausal No No No
Superseded by Kaaks 1998 BRE04522
Toniolo, P. 1994 BRE12398
New York Women's Health Study
Nested Case Control Postmenopausal Yes No No
Superseded by Sonneschein 1999, BRE11604
Barrett-Connor, E. 1993 BRE00581 Rancho Bernardo
Prospective Cohort Postmenopausal Yes No No Mean difference only
De Stavola, B. L. 1993 BRE02122
Guernsey G2 and G3
Prospective Cohort Postmenopausal No No Yes
Missing no. of non cases, can't estimate
den Tonkelaar, I. 1992 BRE02222
DOM-project Utrecht
Prospective Cohort Postmenopausal No No No
Superseded by Kaaks 1998 BRE04522
Vatten, L.J. 1990 BRE12827 Norway, 1974 Prospective Cohort Postmenopausal Yes Yes Yes
Mean exposure values
Le Marchand, L 1988 BRE15836
Hawaii 1942, 1960, 1972
Nested Case Control Postmenopausal No No Yes Missing exposure levels
Tornberg, S. A. 1988 BRE12418 Swedish cohort, 1963
Prospective Cohort Postmenopausal Yes Yes No
Only dose-response analysis were performed
Total no. of articles =34
Total no. of cohort studies = 25
Total no. of studies included = 15
Total no. of studies included = 16
Total no. of studies included = 15

210
li. Fig. Ht4 Dose-response meta-analysis on height and postmenopausal breast cancer
Note: Iwasaki et al., 2007, Chang et al., 2006 and Krebs et al., 2006 are the new studies identified during the update.
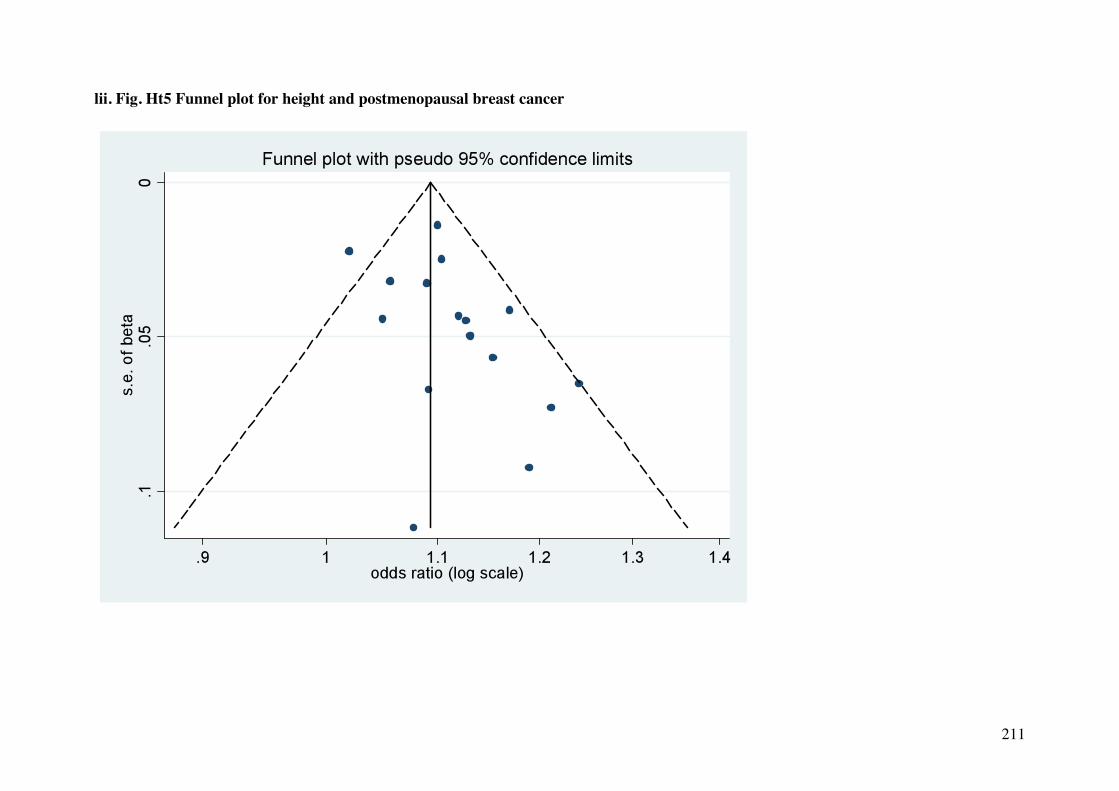
211
lii. Fig. Ht5 Funnel plot for height and postmenopausal breast cancer

212
liii. Fig. Ht6 Highest versus lowest forest plot on height and postmenopausal breast cancer
Note: Iwasaki et al., 2007 and Chang et al., 2006 are the new studies identified during the update.

213
8.4.1 Birthweight Global Report,. 2007 Menopause age unspecified Overall, a statistically significant increased risk was reported in the dose-response meta-analysis of five cohort studies (summary RR for increment of 1kg=1.07, 95% CI = 1.03-1.11) (Ahlgren, M. et al., 2004 , BRE14201;De Stavola, B. L. et al., 2000 , BRE11734;dos Santos Silva, I. et al., 2004 , BRE02399;Hilakivi-Clarke, L. et al., 2001 , BRE03903;Vatten, L. J. et al., 2005 , BRE24432). The highest versus lowest forest plot with one additional study (Andersson, S. W. et al., 2001 , BRE00327) supported this finding in general. Premenopause The detrimental effect was also observed in four premenopausal cohorts (summary RR for increment of
1kg=1.08, 95% CI = 1.04-1.13) (Ahlgren, M. et al., 2004 , BRE14201;De Stavola, B. L. et al., 2000 , BRE11734;dos Santos Silva, I. et al., 2004 , BRE02399;McCormack, V. A. et al., 2005 , BRE23366) and the dicotomic forest plot presented similar results (De Stavola, B. L. et al., 2000 , BRE11734;Kaijser, M. et al., 2003 , BRE04537;McCormack, V. A. et al., 2005 , BRE23366;Vatten, L. J. et al., 2005 , BRE24432). Postmenopause No association was shown in the postmenopausal women of three cohorts (Ahlgren, M. et al., 2004 , BRE14201;Lahmann, P. H. et al., 2004 , BRE18517;McCormack, V. A. et al., 2005 , BRE23366) (summary RR for increment of 1kg=1.03, 95% CI = 0.97-1.10). Results from the dicotomic plot were also inconsistent (Lahmann, P. H. et al., 2004 , BRE18517;McCormack, V. A. et al., 2005 , BRE23366;Vatten, L. J. et al., 2005 , BRE24432). Update Four new reports presented respectively by the Women's Lifestyle and Health Study, NCI DES Combined Cohort Study, Nurses’ Health Study I and II and a historical cohort from Denmark were identified during the update (Ahlgren, M. et al., 2007 , BRE80132;Lof, M. et al., 2007 , BRE80030;Michels, K. B. et al., 2006 , BRE80120;Troisi, R. et al., 2006 , BRE80119). The Danish cohort (Ahlgren, M. et al., 2007 , BRE80132) had previously published two other reports (Ahlgren, M. et al., 2003 , BRE00198;Ahlgren, M. et al., 2004 , BRE14201), but since this new data lacks the appropriate format to be included in the highest versus lowest forest plot, data from 2004 was used as in the previous analysis in the Global Report (Ahlgren, M. et al., 2004 , BRE14201). The Nurses Health Study I and II (Michels, K. B. et al., 2006 , BRE80120) had provided results respectively by menopausal status and by hormone receptor type. New studies were included in the relevant highest versus lowest forest plots as shown in Fig. BW1. There were a total of nine studies in the menopausal age unspecified subgroup and four
214
each in the pre and postmenopausal subgroups. Dose-response meta-analysis was not performed as only two additional studies (Ahlgren, M. et al., 2007 , BRE80132;Michels, K. B. et al., 2006 , BRE80120) had the appropriate format of data that allow inclusion in the menopause age unspecified meta-analysis. Loef et al. (Lof, M. et al., 2007 , BRE80030) did not provide the number of cases and non cases for each exposure category and the more detailed analysis in Troisi et al.’s paper had only two categories (>=3500 vs. 3000-3499g) (Troisi, R. et al., 2006 , BRE80119). As for the analyses by menopausal status, only the Nurses’ Health Study I and II had provided new data (Michels, K. B. et al., 2006 , BRE80120). Results Menopause age unspecified Consistent with the Global Report, all results presented were bigger than one (Fig. BW1). However only three studies, of which included the newly identified Women’s Lifestyle and Health Study (Lof, M. et al., 2007 , BRE80030) observed a statistically significant increased risk in the dicotomic analysis (Ahlgren, M. et al., 2004 , BRE14201;Vatten, L. J. et al., 2005 , BRE24432). Results published by Vatten et al. in 2005 were included in the Global Report, but the risk estimate should be 1.50 (95% CI = 1.01-2.22) instead of 0.67 (95% CI = 0.45-0.99) for the comparison of >=3840 vs. <=3039g (Vatten, L. J. et al., 2005 , BRE24432). The other six studies either reported no association (Ekbom, A. et al., 1997 , BRE80172;Troisi, R. et al., 2006 , BRE80119), or results with wide confidence intervals (Andersson, S. W. et al., 2001 , BRE00327;De Stavola, B. L. et al., 2000 , BRE11734;dos Santos Silva, I. et al., 2004 , BRE02399;Hilakivi-Clarke, L. et al., 2001 , BRE03903). The results published by Ekbom et al. on the Uppsala Birth Cohort Study in 1997 (RR for >=4000 vs.
2500-2999g = 1.04, 95% CI = 0.77-1.41) (1068 cases) were not included in the highest versus lowest forest plot in the Global Report (Ekbom, A. et al., 1997 , BRE80172). Prior to this 1997 report, Ekbom et al. found a statistically non-significant increased risk for the same analysis in 1992 (RR for >=4000 vs. 2500-2999g = 1.23, 95% CI = 0.75-2.0) (458 cases) (Ekbom, A. et al., 1992 , BRE02554). In 2003, as a follow-up report, Kaijser et al. compared the observed and expected numbers of breast cancer between the Uppsala Birth Cohort born between 1925 and1949 and the general public. The standardised incident ratio (SIR) for the >=3 kg subgroup was 2.55 (95% CI = 1.03-5.25) (Kaijser, M. et al., 2003 , BRE04537). Mogren et al. not included in the highest versus lowest forest plot (Fig. BW1) also observed an increased risk in their 2500-3999g subgroup (SIR = 1.29, 95% CI = 0.62-2.37) (10 observed cases) (Mogren, I. et al., 1999 , BRE80173). The Nurses’ Health Study I and II found statistically significant increased risks in the ER+ (81 cases) and PR+ (75 cases) tumour type (RR for >8.4 vs. <=5.5lb=1.79, 95% CI = 1.12-2.86; RR for >8.4 vs.
<=5.5lb=1.81, 95% CI = 1.11-2.94 respectively) (Michels, K. B. et al., 2006 , BRE80120). Premenopause

215
All four studies included here had presented results bigger than one (De Stavola, B. L. et al., 2000 , BRE11734;McCormack, V. A. et al., 2005 , BRE23366;Michels, K. B. et al., 2006 , BRE80120;Vatten, L. J. et al., 2005 , BRE24432), but none of these results had reached statistical significance. New evidence from the Nurses’ Health Study I and II (Michels, K. B. et al., 2006 , BRE80120) observed a risk estimate of 1.37 (95% CI = 0.96-1.95) for >8.4 vs. <=5.5lb, which supported the previous finding in 2005 that a higher birthweight may associate with an increased risk in premenopausal breast cancer. Results published by McCormack et al. in 2005 on the Uppsala Birth Cohort Study was included in the present analysis (McCormack, V. A. et al., 2005 , BRE23366) (Fig. BW1), however unlike the previous analysis, results by Kaijser et al. in 2003 on a different but possibly overlapped cohort was omitted (Kaijser, M. et al., 2003 , BRE04537). As explained above, participants in this historical cohort had birth years of 1925-1949, while the one analysed by McCormack et al. was 1915-1929. Kaijser et al. reported a SIR of 2.46 (95% CI = 0.51-7.19). Postmenopause Results on birthweight and postmenopausal breast cancer remained inconsistent after one more study – the Nurses’ Health Study I and II (Michels, K. B. et al., 2006 , BRE80120) was added to the highest versus lowest plot. No association was observed in this new study. Published meta-analysis The summary risk estimate of seven cohort and 10 case-control studies, published by Michels and Xue in 2006, for breast cancer comparing women with high birthweight to low birthweight was 1.23 (95% CI = 1.13-1.34). For cohort studies alone, the RR was 1.24 (95% CI = 1.10-1.40) (Michels K.B., Xue F., 2006). In 2007 an update with three additional cohort and two case-control studies was published by the same authors. A summary RR of 1.15 (95% CI = 1.09-1.21) for the comparison of high versus low birthweight was reported (Xue F., Michels K.B., 2007). The observed positive association was consistent with our analysis of nine cohort and nested case-control studies (Fig.BW1, menopause age unspecified). In our analysis, the cohort studies conducted by Mogren et al. (Mogren, I. et al., 1999 , BRE80173) and Kaijser et al. (Kaijser, M. et al., 2003 , BRE04537) were not included as they presented standardised incident ratios.

216
liv. Fig. BW1 Highest versus lowest forest plot on birthweight by menopausal status (** = new studies identified during the update)
0 = menopause age unspecified, 1 = premenopause , 2 = postmenopause
.
.
.
**Michels, K.B. (2006)
1
0
Andersson, S. W. (2001)
McCormack V.A. (2005)
Ahlgren, M. (2004) dos Santos S. (2004)
De Stavola B.L. (2000)
Vatten, L. J. (2005)
2
Vatten, L. J. (2005)
Hilakivi-Clarke, L. (2001)
**Michels, K.B. (2006)
Study
**Loef et al. (2007)
Vatten, L. J. (2005)
ID
Ekbom, A. (1997)
McCormack V.A. (2005)
De Stavola B.L. (2000)
Lahmann, P. H. (2004)
**Troisi, R. (2006)
0.98 (0.81, 1.19)
1.93 (0.75, 4.98)
4.00 (1.49, 10.73)
1.17 (1.08, 1.27) 1.57 (0.60, 4.12)
5.65 (0.95, 33.72)
1.10 (0.49, 2.46)
1.10 (0.50, 2.41)
1.90 (0.71, 5.08)
1.37 (0.96, 1.95)
HvL Birth
1.54 (1.01, 2.33)
1.50 (1.01, 2.22)
weight RR (95% CI)
1.04 (0.77, 1.41)
0.91 (0.57, 1.46)
2.02 (0.59, 6.91)
2.66 (0.96, 7.39)
1.09 (0.66, 1.80)
16.69
1.71
1.58
23.95 1.65
0.50
2.31
2.42
1.59
8.84
%
6.96
7.55
Weight
10.69
5.79
1.04
1.48
5.23
BRE80120
BRE00327
BRE23366
BRE14201 BRE02399
BRE11734
BRE24432
BRE24432
BRE03903
BRE80120
BRE80030
BRE24432
wcrf_code
BRE80172
BRE23366
BRE11734
BRE18517
BRE80119
Nurses' Health Study (NHS) Cohort & NHS II
Goteborg, 1968
Upsala birth cohort
Danish Cohort, 1930 NSHD (British cohort)
MRC National Survey of Health and Development
Norway, 1974
Norway, 1974
Helsinki newborn, 1924
Nurses' Health Study (NHS) Cohort & NHS II
Women's Lifestyle and Health Study
Norway, 1974
studydescription
Upsala birth cohort
Upsala birth cohort
MRC National Survey of Health and Development
Malmo Diet and Cancer
NCI DES Combined Cohort Study
>8.5 vs.<=5.5lb
Q5 vs. Q1
>=4000 vs. <3000g
4 vs. 2.5kg >=4 vs <=2.9kg
>=4 vs. <=2.9kg
>=3840 vs <=3039g
>=3840 vs <=3039g
<=2500 vs. >4000g
>8.4 vs. <5.5lb
>3 vs <2.5kg
>=3840 vs <=3039g
contrast
>=4000 vs. 2500-2999g
>=4000 vs. <3000g
>=4 vs. <=2.9kg
>=4001 vs <=2999g
3500+ vs. 3000-3499g
0.98 (0.81, 1.19)
1.93 (0.75, 4.98)
4.00 (1.49, 10.73)
1.17 (1.08, 1.27) 1.57 (0.60, 4.12)
5.65 (0.95, 33.72)
1.10 (0.49, 2.46)
1.10 (0.50, 2.41)
1.90 (0.71, 5.08)
1.37 (0.96, 1.95)
HvL Birth
1.54 (1.01, 2.33)
1.50 (1.01, 2.22)
weight RR (95% CI)
1.04 (0.77, 1.41)
0.91 (0.57, 1.46)
2.02 (0.59, 6.91)
2.66 (0.96, 7.39)
1.09 (0.66, 1.80)
16.69
1.71
1.58
23.95 1.65
0.50
2.31
2.42
1.59
8.84
%
6.96
7.55
Weight
10.69
5.79
1.04
1.48
5.23
1 .0297 1 33.
7

217
16 References
16.1 Additional references cited in the report
Barclay AW et al. Glycemic index, glycemic load, and chronic disease risk--a meta-analysis of observational studies. Am J Clin Nutr 2008; 87(3):627-637.
Bekkering GE et al., How much of the data published in observational studies of the association between diet and prostate or bladder cancer is usable for meta-analysis? Am J Epidemiol 2008; 167(9):1017-1026.
Chene G, Thompson SG. Methods for summarizing the risk associations of quantitative variables in epidemiologic studies in a consistent form. Am J Epidemiol 1996; 144(6):610-621.
DerSimonian R, Laird N. Meta-analysis in clinical trials. Control Clin Trials 1986; 7(3):177-188.
Gissel T et al. Intake of vitamin D and risk of breast cancer-A meta-analysis. J Steroid Biochem Mol Biol 2008.
Greenland S, Longnecker MP. Methods for trend estimation from summarized dose-response data, with applications to meta-analysis. Am J Epidemiol 1992; 135(11):1301-1309.
Greenstein J et al. Risk of breast cancer associated with intake of specific food and food groups. Am J Epidemiol 1996; 143:S36.
Higgins JP, Thompson SG Quantifying heterogeneity in a meta-analysis. Stat Med 2002; 21(11):1539-1558.
Hirayama T. Life style and mortality: A large scale census-based cohort study in Japan. In: Wahrendorf J, editor. Contributions to Epidemiology and Statistics. Vol. 6. Basel: 1990.
Key J et al. Meta-analysis of studies of alcohol and breast cancer with consideration of the methodological issues. Cancer Causes Control 2006; 17(6):759-770.
Lahmann PH et al., Body size and breast cancer risk: Findings from the European Prospective Investigation into Cancer and Nutrition (EPIC). Int J Cancer 2004; 111(5):762-771.
Larsson SC et al. Folate and risk of breast cancer: a meta-analysis. J Natl Cancer Inst 2007; 99(1):64-76.
Li HL et al. Anthropometry and female breast cancer: a prospective cohort study in urban Shanghai. Zhonghua Liu Xing Bing Xue Za Zhi 2006; 27(6):488-493.
Ma H et al. Reproductive factors and breast cancer risk according to joint estrogen and progesterone receptor status: a meta-analysis of epidemiological studies. Breast Cancer Res 2006; 8(4):R43.

218
Michels KB, Xue F. Role of birthweight in the etiology of breast cancer. Int J Cancer 2006; 119(9):2007-2025.
Missmer SA et al., Meat and dairy food consumption and breast cancer: a pooled analysis of cohort studies. Int J Epidemiol 2002; 31(1):78-85.
Monninkhof EM et al. Physical activity and breast cancer: a systematic review. Epidemiology 2007; 18(1):137-157.
Orsini N et al., Generalized least squares for trend estimation of summarized dose-response data. Stata J 2006; 6:40-57.
Phipps AI et al. Body Size and Risk of Luminal, HER2-Overexpressing, and Triple-Negative Breast Cancer in Postmenopausal Women. Cancer Epidemiol Biomarkers Prev 2008.
Qin LQ et al. Soyfood intake in the prevention of breast cancer risk in women: a meta-analysis of observational epidemiological studies. J Nutr Sci Vitaminol (Tokyo) 2006; 52(6):428-436.
Renehan AG et al. Body-mass index and incidence of cancer: a systematic review and meta-analysis of prospective observational studies. Lancet 2008; 371(9612):569-578.
Sellers TA et al. Dietary folate intake, alcohol, and risk of breast cancer in a prospective study of postmenopausal women. Epidemiology 2001; 12(4):420-428.
Sellers TA et al. Interaction of dietary folate intake, alcohol, and risk of hormone receptor-defined breast cancer in a prospective study of postmenopausal women. Cancer Epidemiol Biomarkers Prev 2002; 11(10 Pt 1):1104-1107.
Suzuki R et al. Alcohol intake and risk of breast cancer defined by estrogen and progesterone receptor status--a meta-analysis of epidemiological studies. Int J Cancer 2008; 122(8):1832-1841.
Tobias A. Assessing the influence of a single study in meta-analysis. Stata Tech Bull 1999; 47:15-17.
Trock BJ et al. Meta-analysis of soy intake and breast cancer risk. J Natl Cancer Inst 2006; 98(7):459-471.
World Cancer Research Fund/ American Institute for Cancer Research. Systematic Literature Review - Support Resource In : Food, Nutrition, Physical Activity and the Prevention of Cancer: A Global Perspective. Washington DC: AICR, 2007.
World Cancer Research Fund/American Institute for Cancer Research. Food, Nutrition, Physical Activity, and the Prevention of Cancer: a Global Perspective. 2 ed. Washington DC: AICR, 2007.
Wu AH et al. Epidemiology of soy exposures and breast cancer risk. Br J Cancer 2008; 98(1):9-14.

219
Ziegler RG et al., Relative weight, weight change, height, and breast cancer risk in Asian-American women. J Natl Cancer Inst 1996; 88(10):650-660.

220
16.2 List of included studies
Reference List
BRE21537 - Adebamowo CA et al. Dietary flavonols and flavonol-rich foods intake and the risk of breast cancer. Int J Cancer 2005; 114(4):628-633.
BRE00180 - Adzersen KH et al. Raw and cooked vegetables, fruits, selected micronutrients, and breast cancer risk: a case-control study in Germany. Nutr Cancer 2003; 46(2):131-137.
BRE14201 - Ahlgren M et al. Growth patterns and the risk of breast cancer in women. N Engl J Med 2004; 351(16):1619-1626.
BRE00198 - Ahlgren M et al. Birth weight and risk of breast cancer in a cohort of 106,504 women. Int J Cancer 2003; 107(6):997-1000.
BRE80132 - Ahlgren M et al. Birth weight and risk of cancer. Cancer 2007; 110(2):412-419.
BRE80139 - Ahn J et al. Adiposity, adult weight change, and postmenopausal breast cancer risk. Arch Intern Med 2007; 167(19):2091-2102.
BRE00236 - Albanes D et al. Physical activity and risk of cancer in the NHANES I population. Am J Public Health 1989; 79(6):744-750.
BRE80007 - Almquist M et al. Serum calcium and breast cancer risk: results from a prospective cohort study of 7,847 women. Cancer Causes Control 2007; 18(6):595-602.
BRE00327 - Andersson SW et al. Cancer risk in Swedish women: the relation to size at birth. Br J Cancer 2001; 84(9):1193-1198.
BRE80136 - Andrieu N et al. Pregnancies, breast-feeding, and breast cancer risk in the International BRCA1/2 Carrier Cohort Study (IBCCS). J Natl Cancer Inst 2006; 98(8):535-544.
BRE80118 - Baer HJ et al. Adult height, age at attained height, and incidence of breast cancer in premenopausal women. Int J Cancer 2006; 119(9):2231-2235.
BRE21669 - Baglietto L et al. Does dietary folate intake modify effect of alcohol consumption on breast cancer risk? Prospective cohort study. British Medical Journal 2005; 331(7520):807.
BRE20028 - Bardia A et al. Recreational physical activity and risk of postmenopausal breast cancer based on hormone receptor status. Arch Intern Med 2006; 166(22):2478-2483.
BRE00566 - Barnes-Josiah D et al. Early body size and subsequent weight gain as predictors of breast cancer incidence (Iowa, United States). Cancer Causes Control 1995; 6(2):112-118.
BRE00581 - Barrett-Connor E, Friedlander NJ. Dietary fat, calories, and the risk of breast cancer in postmenopausal women: a prospective population-based study. J Am Coll Nutr 1993; 12(4):390-399.

221
BRE00743 - Berkey CS et al. Adolescence and breast carcinoma risk. Cancer 1999; 85(11):2400-2409.
BRE21759 - Bertone-Johnson ER et al. Plasma 25-hydroxyvitamin D and 1,25-dihydroxyvitamin D and risk of breast cancer. Cancer Epidemiol Biomarkers Prev 2005; 14(8):1991-1997.
BRE14387 - Bingham SA et al. Are imprecise methods obscuring a relation between fat and breast cancer? Lancet 2003; 362(9379):212-214.
BRE05549 - Boccardo F et al. Serum enterolactone levels and the risk of breast cancer in women with palpable cysts. Eur J Cancer 2004; 40(1):84-89.
BRE01123 - Breslow RA et al. Long-term recreational physical activity and breast cancer in the National Health and Nutrition Examination Survey I epidemiologic follow-up study. Cancer Epidemiol Biomarkers Prev 2001; 10(7):805-808.
BRE80127 - Brustad M et al. POP exposure from fish liver consumption and risk of cancer--the Norwegian Women and Cancer Study. J Environ Monit 2007; 9(7):682-686.
BRE01315 - Byrne C et al. Dietary fat, fat subtypes, and breast cancer risk: lack of an association among postmenopausal women with no history of benign breast disease. Cancer Epidemiol Biomarkers Prev 2002; 11(3):261-265.
BRE05719 - Byrne C et al. A comparison of food habit and food frequency data as predictors of breast cancer in the NHANES I/NHEFS cohort. J Nutr 1996; 126(11):2757-2764.
BRE20021 - Cade JE et al. Dietary fibre and risk of breast cancer in the UK Women's Cohort Study. Int J Epidemiol 2007; 36(2):431-438.
BRE01340 - Calle EE et al. Overweight, obesity, and mortality from cancer in a prospectively studied cohort of U.S. adults. N Engl J Med 2003; 348(17):1625-1638.
BRE14588 - Cerhan JR et al. Physical activity, physical function, and the risk of breast cancer in a prospective study among elderly women. Journals of Gerontology - Series A Biological Sciences and Medical Sciences 1998; 53(4):M251-M256.
BRE01495 - Cerhan JR et al. Interaction of adolescent anthropometric characteristics and family history on breast cancer risk in a Historical Cohort Study of 426 families (USA). Cancer Causes Control 2004; 15(1):1-9.
BRE18295 - Chang SC et al. Interrelation of energy intake, body size, and physical activity with breast cancer in the PLCO screening trial. Cancer Epidemiology Biomarkers & Prevention 2003; 12(11):1338S.
BRE80110 - Chang SC et al. Association of energy intake and energy balance with postmenopausal breast cancer in the prostate, lung, colorectal, and ovarian cancer screening trial. Cancer Epidemiol Biomarkers Prev 2006; 15(2):334-341.
BRE19205 - Chen W et al. Use of postmenopausal hormones, alcohol, and risk for invasive breast cancer. Annals of Internal Medicine 2002; 137(10):798-804.

222
BRE80034 - Cho E et al. Red meat intake and risk of breast cancer among premenopausal women. Arch Intern Med 2006; 166(20):2253-2259.
BRE80152 - Cho E et al. Nutrients Involved in One-Carbon Metabolism and Risk of Breast Cancer among Premenopausal Women. Cancer Epidemiol Biomarkers Prev 2007; 16(12):2787-2790.
BRE01651 - Cho E et al. Premenopausal dietary carbohydrate, glycemic index, glycemic load, and fiber in relation to risk of breast cancer. Cancer Epidemiol Biomarkers Prev 2003; 12(11 Pt 1):1153-1158.
BRE01652 - Cho E et al. Premenopausal intakes of vitamins A, C, and E, folate, and carotenoids, and risk of breast cancer. Cancer Epidemiol Biomarkers Prev 2003; 12(8):713-720.
BRE17370 - Cho ES. Premenopausal fat intake and risk of breast cancer. J Natl Cancer Inst 2003; 95(14):1079-1085.
BRE80134 - Chun J et al. Predictors of breast cancer development in a high-risk population. Am J Surg 2006; 192(4):474-477.
BRE01782 - Colditz GA et al. Physical activity and risk of breast cancer in premenopausal women. Br J Cancer 2003; 89(5):847-851.
BRE01783 - Colditz GA et al. Risk factors for breast cancer according to estrogen and progesterone receptor status. J Natl Cancer Inst 2004; 96(3):218-228.
BRE19251 - Colditz G, Rosner B. Cumulative risk of breast cancer to age 70 years according to risk factor status: Data from the Nurses' Health Study. Am J Epidemiol 2000; 152(10):950-964.
BRE01946 - Criqui MH et al. Selenium, retinol, retinol-binding protein, and uric acid. Associations with cancer mortality in a population-based prospective case-control study. Ann Epidemiol 1991; 1(5):385-393.
BRE80149 - Cui Y et al. Levels of zinc, selenium, calcium, and iron in benign breast tissue and risk of subsequent breast cancer. Cancer Epidemiol Biomarkers Prev 2007; 16(8):1682-1685.
BRE80016 - Dallal CM et al. Long-term recreational physical activity and risk of invasive and in situ breast cancer: the California teachers study. Arch Intern Med 2007; 167(4):408-415.
BRE02123 - De Stavola BL et al. Childhood growth and breast cancer. Am J Epidemiol 2004; 159(7):671-682.
BRE11734 - De Stavola BL et al. Birthweight, childhood growth and risk of breast cancer in a British cohort. Br J Cancer 2000; 83(7):964-968.
BRE02122 - De Stavola BL et al. The association of height, weight, menstrual and reproductive events with breast cancer: results from two prospective studies on the island of Guernsey (United Kingdom). Cancer Causes Control 1993; 4(4):331-340.

223
BRE14840 - Den Tonkelaar I et al. Urinary phytoestrogens and postmenopausal breast cancer risk. Cancer Epidemiol Biomarkers Prev 2001; 10(3):223-228.
BRE02224 - Den Tonkelaar I et al. Body fat distribution in relation to breast cancer in women participating in the DOM-project. Breast Cancer Res Treat 1995; 34(1):55-61.
BRE02222 - Den Tonkelaar I et al. A prospective study on obesity and subcutaneous fat patterning in relation to breast cancer in post-menopausal women participating in the DOM project. Br J Cancer 1994; 69(2):352-357.
BRE02326 - Dirx MJ et al. Baseline recreational physical activity, history of sports participation, and postmenopausal breast carcinoma risk in the Netherlands Cohort Study. Cancer 2001; 92(6):1638-1649.
BRE02385 - Dorgan JF et al. Physical activity and risk of breast cancer in the Framingham Heart Study. Am J Epidemiol 1994; 139(7):662-669.
BRE14889 - Dorgan JF et al. Relationships of serum carotenoids, retinol, (alpha)-tocopherol, and selenium with breast cancer risk: Results from a prospective study in Columbia, Missouri (United States). Cancer Causes Control 1998; 9(1):89-97.
BRE02399 - dos Santos Silva I et al. Is the association of birth weight with premenopausal breast cancer risk mediated through childhood growth? Br J Cancer 2004; 91(3):519-524.
BRE02418 - Drake DA. A longitudinal study of physical activity and breast cancer prediction. Cancer Nurs 2001; 24(5):371-377.
BRE18359 - Duffy C et al. Alcohol and folate intake and breast cancer risk. Journal of General Internal Medicine 2004; 19 Suppl 1:115.
BRE80153 - Egeberg R et al. Meat consumption, N-acetyl transferase 1 and 2 polymorphism and risk of breast cancer in Danish postmenopausal women. Eur J Cancer Prev 2008; 17(1):39-47.
BRE80172 - Ekbom A et al. Intrauterine environment and breast cancer risk in women: a population-based study. J Natl Cancer Inst 1997; 89(1):71-76.
BRE02554 - Ekbom A et al. Evidence of prenatal influences on breast cancer risk. Lancet 1992; 340(8826):1015-1018.
BRE80114 - Eliassen AH et al. Adult weight change and risk of postmenopausal breast cancer. Jama 2006; 296(2):193-201.
BRE80109 - Engeset D et al. Fish consumption and breast cancer risk. The European Prospective Investigation into Cancer and Nutrition (EPIC). Int J Cancer 2006; 119(1):175-182.
BRE80128 - Ericson U et al. High folate intake is associated with lower breast cancer incidence in postmenopausal women in the Malmo Diet and Cancer cohort. Am J Clin Nutr 2007; 86(2):434-443.

224
BRE02720 - Feigelson HS et al. Alcohol, folate, methionine, and risk of incident breast cancer in the American Cancer Society Cancer Prevention Study II Nutrition Cohort. Cancer Epidemiol Biomarkers Prev 2003; 12(2):161-164.
BRE02721 - Feigelson HS et al. Weight gain, body mass index, hormone replacement therapy, and postmenopausal breast cancer in a large prospective study. Cancer Epidemiol Biomarkers Prev 2004; 13(2):220-224.
BRE80117 - Feigelson HS et al. Adult weight gain and histopathologic characteristics of breast cancer among postmenopausal women. Cancer 2006; 107(1):12-21.
BRE19514 - Feigelson H et al. Alcohol consumption increases the risk of fatal breast cancer (United States). Cancer Causes Control 2001; 12(10):895-902.
BRE80171 - Folsom AR, Demissie Z. Fish intake, marine omega-3 fatty acids, and mortality in a cohort of postmenopausal women. Am J Epidemiol 2004; 160(10):1005-1010.
BRE02836 - Folsom AR et al. Increased incidence of carcinoma of the breast associated with abdominal adiposity in postmenopausal women. Am J Epidemiol 1990; 131(5):794-803.
BRE02940 - Fraser GE, Shavlik D. Risk factors, lifetime risk, and age at onset of breast cancer. Ann Epidemiol 1997; 7(6):375-382.
BRE02942 - Frazier AL et al. Adolescent diet and risk of breast cancer. Cancer Causes Control 2004; 15(1):73-82.
BRE02941 - Frazier AL et al. Adolescent diet and risk of breast cancer. Breast Cancer Res 2003; 5(3):R59-R64.
BRE02957 - French SA et al. Weight variability and incident disease in older women: the Iowa Women's Health Study. Int J Obes Relat Metab Disord 1997; 21(3):217-223.
BRE02960 - Freni SC et al. Anthropometric measures and metabolic rate in association with risk of breast cancer (United States). Cancer Causes Control 1996; 7(3):358-365.
BRE02973 - Friedenreich CM et al. Case-control study of lifetime physical activity and breast cancer risk. Am J Epidemiol 2001; 154(4):336-347.
BRE17508 - Friedenreich CMH. A cohort study of alcohol consumption and risk of breast cancer. Am J Epidemiol 1993; 137(5):512-520.
BRE02992 - Frisch RE et al. Lower prevalence of breast cancer and cancers of the reproductive system among former college athletes compared to non-athletes. Br J Cancer 1985; 52(6):885-891.
BRE02995 - Frisch RE et al. Lower lifetime occurrence of breast cancer and cancers of the reproductive system among former college athletes. Am J Clin Nutr 1987; 45(1 Suppl):328-335.
BRE03015 - Fujimaki S, Hayashi K. Re: Soy, isoflavones, and breast cancer risk in Japan. J Natl Cancer Inst 2003; 95(24):1881-1882.

225
BRE22370 - Fung TT et al. Dietary patterns and the risk of postmenopausal breast cancer. Int J Cancer 2005; 116(1):116-121.
BRE80107 - Fung TT et al. Diet quality is associated with the risk of estrogen receptor-negative breast cancer in postmenopausal women. J Nutr 2006; 136(2):466-472.
BRE03044 - Gaard M et al. Risk of breast cancer in relation to blood lipids: a prospective study of 31,209 Norwegian women. Cancer Causes Control 1994; 5(6):501-509.
BRE17516 - Gaard MT. Dietary fat and the risk of breast cancer: a prospective study of 25,892 Norwegian women. Int J Cancer 1995; 63(1):13-17.
BRE17518 - Gago-Dominguez MY. Opposing effects of dietary n-3 and n-6 fatty acids on mammary carcinogenesis: The Singapore Chinese Health Study. Br J Cancer 2003; 89(9):1686-1692.
BRE03058 - Galanis DJ et al. Anthropometric predictors of breast cancer incidence and survival in a multi-ethnic cohort of female residents of Hawaii, United States. Cancer Causes Control 1998; 9(2):217-224.
BRE80006 - Gallicchio L et al. Body mass, polymorphisms in obesity-related genes, and the risk of developing breast cancer among women with benign breast disease. Cancer Detect Prev 2007; 31(2):95-101.
BRE80112 - Gallicchio L et al. Flame-broiled food, NAT2 acetylator phenotype, and breast cancer risk among women with benign breast disease. Breast Cancer Res Treat 2006; 99(2):229-233.
BRE80158 - Ganmaa D et al. Coffee, tea, caffeine and risk of breast cancer: a 22-year follow-up. Int J Cancer 2008; 122(9):2071-2076.
BRE03101 - Gapstur SM et al. Increased risk of breast cancer with alcohol consumption in postmenopausal women. Am J Epidemiol 1992; 136(10):1221-1231.
BRE03215 - Gertig DM et al. N-acetyl transferase 2 genotypes, meat intake and breast cancer risk. Int J Cancer 1999; 80(1):13-17.
BRE22430 - Giles GG et al. Dietary carbohydrate, fibre, glycaemic index, glycaemic load and the risk of postmenopausal breast cancer. Int J Cancer 2006; 118(7):1843-1847.
BRE03262 - Giovannucci E et al. A comparison of prospective and retrospective assessments of diet in the study of breast cancer. Am J Epidemiol 1993; 137(5):502-511.
BRE03308 - Goldbohm RA et al. Consumption of black tea and cancer risk: a prospective cohort study. J Natl Cancer Inst 1996; 88(2):93-100.
BRE03354 - Goodman JE et al. COMT genotype, micronutrients in the folate metabolic pathway and breast cancer risk. Carcinogenesis 2001; 22(10):1661-1665.
BRE03352 - Goodman MT et al. Risk factors for primary breast cancer in Japan: 8-year follow-up of atomic bomb survivors. Prev Med 1997; 26(1):144-153.

226
BRE19680 - Grace P et al. Phytoestrogen concentrations in serum and spot urine as biomarkers for dietary phytoestrogen intake and their relation to breast cancer risk in European prospective Investigation of Cancer and Nutrition-Norfolk. Cancer Epidemiol Biomarkers Prev 2004; 13(5):698-708.
BRE03424 - Graham S et al. Diet in the epidemiology of postmenopausal breast cancer in the New York State Cohort. Am J Epidemiol 1992; 136(11):1327-1337.
BRE19762 - Harnack L et al. An evaluation of the Dietary Guidelines for Americans in relation to cancer occurrence. Am J Clin Nutr 2002; 76(4):889-896.
BRE22559 - Harvie M et al. Association of gain and loss of weight before and after menopause with risk of postmenopausal breast cancer in the Iowa women's health study. Cancer Epidemiol Biomarkers Prev 2005; 14(3):656-661.
BRE03888 - Hiatt RA et al. Alcohol consumption and the risk of breast cancer in a prepaid health plan. Cancer Res 1988; 48(8):2284-2287.
BRE15353 - Higginbotham S et al. Dietary Glycemic Load and Breast Cancer Risk in the Women's Health Study. Cancer Epidemiol Biomarkers Prev 2004; 13(1):65-70.
BRE03903 - Hilakivi-Clarke L et al. Tallness and overweight during childhood have opposing effects on breast cancer risk. Br J Cancer 2001; 85(11):1680-1684.
BRE80105 - Hirvonen T et al. Consumption of antioxidant-rich beverages and risk for breast cancer in French women. Ann Epidemiol 2006; 16(7):503-508.
BRE03955 - Hjartaker A et al. Childhood and adult milk consumption and risk of premenopausal breast cancer in a cohort of 48,844 women - the Norwegian women and cancer study. Int J Cancer 2001; 93(6):888-893.
BRE80145 - Hogervorst JG et al. A prospective study of dietary acrylamide intake and the risk of endometrial, ovarian, and breast cancer. Cancer Epidemiol Biomarkers Prev 2007; 16(11):2304-2313.
BRE15392 - Holmberg L et al. Alcohol intake and breast cancer risk: Effect of exposure from 15 years of age. Cancer Epidemiol Biomarkers Prev 1995; 4(8):843-847.
BRE15400 - Holmes MD et al. Meat, fish and egg intake and risk of breast cancer. Int J Cancer 2003; 104(2):221-227.
BRE04008 - Holmes MD et al. Association of dietary intake of fat and fatty acids with risk of breast cancer. Jama 1999; 281(10):914-920.
BRE04010 - Holmes MD et al. Dietary carbohydrates, fiber, and breast cancer risk. Am J Epidemiol 2004; 159(8):732-739.
BRE15413 - Horn-Ross PL et al. Patterns of alcohol consumption and breast cancer risk in the California Teachers Study cohort. Cancer Epidemiol Biomarkers Prev 2004; 13(3):405-411.

227
BRE15412 - Horn-Ross PL et al. Recent diet and breast cancer risk: The California Teachers Study (USA). Cancer Causes Control 2002; 13(5):407-415.
BRE17622 - Howe GRF. A cohort study of fat intake and risk of breast cancer. J Natl Cancer Inst 1991; 83(5):336-340.
BRE04086 - Hoyer AP, Engholm G. Serum lipids and breast cancer risk: a cohort study of 5,207 Danish women. Cancer Causes Control 1992; 3(5):403-408.
BRE15433 - Hoyer AP et al. Organochlorine exposure and risk of breast cancer. Lancet 1998; 352(9143):1816-1820.
BRE04117 - Huang Z et al. Dual effects of weight and weight gain on breast cancer risk. Jama 1997; 278(17):1407-1411.
BRE04118 - Huang Z et al. Waist circumference, waist:hip ratio, and risk of breast cancer in the Nurses' Health Study. Am J Epidemiol 1999; 150(12):1316-1324.
BRE04156 - Hulten K et al. An incident case-referent study on plasma enterolactone and breast cancer risk. Eur J Nutr 2002; 41(4):168-176.
BRE04168 - Hunter DJ et al. A prospective study of the intake of vitamins C, E, and A and the risk of breast cancer. N Engl J Med 1993; 329(4):234-240.
BRE04166 - Hunter DJ et al. A prospective study of selenium status and breast cancer risk. Jama 1990; 264(9):1128-1131.
BRE20027 - Iwasaki M et al. Body size and risk for breast cancer in relation to estrogen and progesterone receptor status in Japan. Ann Epidemiol 2007; 17(4):304-312.
BRE17653 - Jain MGF. Alcohol and breast cancer mortality in a cohort study. Breast Cancer Res Treat 2000; 64(2):201-209.
BRE04383 - Jarvinen R et al. Diet and breast cancer risk in a cohort of Finnish women. Cancer Lett 1997; 114(1-2):251-253.
BRE04434 - John EM et al. Lifetime physical activity and breast cancer risk in a multiethnic population: the San Francisco Bay area breast cancer study. Cancer Epidemiol Biomarkers Prev 2003; 12(11 Pt 1):1143-1152.
BRE04433 - John EM et al. Vitamin D and breast cancer risk: the NHANES I Epidemiologic follow-up study, 1971-1975 to 1992. National Health and Nutrition Examination Survey. Cancer Epidemiol Biomarkers Prev 1999; 8(5):399-406.
BRE04456 - Jonas CR et al. Dietary glycemic index, glycemic load, and risk of incident breast cancer in postmenopausal women. Cancer Epidemiol Biomarkers Prev 2003; 12(6):573-577.
BRE04461 - Jones DY et al. Dietary fat and breast cancer in the National Health and Nutrition Examination Survey I Epidemiologic Follow-up Study. J Natl Cancer Inst 1987; 79(3):465-471.

228
BRE04482 - Jonsson F et al. Obesity and hormone-dependent tumors: cohort and co-twin control studies based on the Swedish Twin Registry. Int J Cancer 2003; 106(4):594-599.
BRE04514 - Jumaan AO et al. Beta-carotene intake and risk of postmenopausal breast cancer. Epidemiology 1999; 10(1):49-53.
BRE04522 - Kaaks R et al. Breast-cancer incidence in relation to height, weight and body-fat distribution in the Dutch "DOM" cohort. Int J Cancer 1998; 76(5):647-651.
BRE80138 - Kabat GC et al. Dietary iron and heme iron intake and risk of breast cancer: a prospective cohort study. Cancer Epidemiol Biomarkers Prev 2007; 16(6):1306-1308.
BRE04537 - Kaijser M et al. Preterm birth, birth weight, and subsequent risk of female breast cancer. Br J Cancer 2003; 89(9):1664-1666.
BRE04713 - Keinan-Boker L et al. Dietary phytoestrogens and breast cancer risk. Am J Clin Nutr 2004; 79(2):282-288.
BRE11112 - Kesse-Guyot E et al. Dairy Products, Calcium and the Risk of Breast Cancer: Results of the French SU.VI.MAX Prospective Study. Ann Nutr Metab 2007; 51(2):139-145.
BRE04758 - Key TJ et al. Soya foods and breast cancer risk: a prospective study in Hiroshima and Nagasaki, Japan. Br J Cancer 1999; 81(7):1248-1256.
BRE15654 - Key TJA et al. Directary habits and mortality in 11 000 vegetarians and health concious people: results of a 17 year follow up. British Medical Journal 1996; 313(7060):775-779.
BRE17698 - Kilkkinen AV. Serum enterolactone concentration is not associated with breast cancer risk in a nested case-control study. Int J Cancer 2004; 108(2):277-280.
BRE80156 - Kim EH et al. A prospective study of grapefruit and grapefruit juice intake and breast cancer risk. Br J Cancer 2008; 98(1):240-241.
BRE80115 - Kim EH et al. Nurses' Health Study (NHS) Cohort 1976-1996Dietary fat and risk of postmenopausal breast cancer in a 20-year follow-up. Am J Epidemiol 2006; 164(10):990-997.
BRE17702 - Kinlen LJ. Meat and fat consumption and cancer mortality: a study of strict religious orders in Britain. Lancet 1982; i(8278):946-949.
BRE04898 - Knekt P et al. Dietary fat and risk of breast cancer. Am J Clin Nutr 1990; 52(5):903-908.
BRE04900 - Knekt P et al. Intake of dairy products and the risk of breast cancer. Br J Cancer 1996; 73(5):687-691.
BRE80106 - Krebs EE et al. Measures of adiposity and risk of breast cancer in older postmenopausal women. J Am Geriatr Soc 2006; 54(1):63-69.
BRE22995 - Kuriyama S et al. Obesity and risk of cancer in Japan. Int J Cancer 2005; 113(1):148-157.

229
BRE05142 - Kushi LH et al. Dietary fat and risk of breast cancer according to hormone receptor status. Cancer Epidemiol Biomarkers Prev 1995; 4(1):11-19.
BRE05141 - Kushi LH et al. Dietary fat and postmenopausal breast cancer. J Natl Cancer Inst 1992; 84(14):1092-1099.
BRE17728 - Kvale GH. Lactation and cancer risk: is there a relation specific to breast cancer? Journal of Epidemiology and Community Health 1988; 42(1):30-37.
BRE20026 - Lahmann PH et al. Physical activity and breast cancer risk: the European Prospective Investigation into Cancer and Nutrition. Cancer Epidemiol Biomarkers Prev 2007; 16(1):36-42.
BRE18517 - Lahmann PH et al. Birth weight is associated with postmenopausal breast cancer risk in Swedish women. Br J Cancer 2004; 91(9):1666-1668.
BRE15804 - Lahmann PH et al. Body size and breast cancer risk: Findings from the European Prospective Investigation into Cancer and Nutrition (EPIC). Int J Cancer 2004; 111(5):762-771.
BRE18516 - Lahmann PH et al. Adult weight change and postmenopausal breast cancer risk: Findings from the European Prospective Investigation into Cancer and nutrition (epic). International Journal of Obesity 2004; 28:S4.
BRE20119 - Lahmann PH et al. A prospective study of adiposity and postmenopausal breast cancer risk: the Malmo Diet and Cancer Study. Int J Cancer 2003; 103(2):246-252.
BRE23014 - Lahmann PH et al. Long-term weight change and breast cancer risk: the European prospective investigation into cancer and nutrition (EPIC). Br J Cancer 2005; 93(5):582-589.
BRE80135 - Lajous M et al. Folate, vitamin B12 and postmenopausal breast cancer in a prospective study of French women. Cancer Causes Control 2006; 17(9):1209-1213.
BRE15836 - Le Marchand L et al. Body size at different periods of life and breast cancer risk. Am J Epidemiol 1988; 128(1):137-152.
BRE15848 - Lee IM et al. Physical activity and breast cancer risk: The Women's Health Study (United States). Cancer Causes Control 2001; 12(2):137-145.
BRE17745 - Lee SYK. Effect of lifetime lactation on breast cancer risk: a Korean Women's Cohort Study. Int J Cancer 2003; 105(3):390-393.
BRE17747 - Levi FP. Dietary intake of selected micronutrients and breast-cancer risk. Int J Cancer 2001; 91(2):260-263.
BRE23123 - Li W et al. Dietary and other risk factors in women having fibrocystic breast conditions with and without concurrent breast cancer: a nested case-control study in Shanghai, China. Int J Cancer 2005; 115(6):981-993.
BRE80165 - Lin J et al. Intakes of calcium and vitamin D and breast cancer risk in women. Arch Intern Med 2007; 167(10):1050-1059.
230
BRE80030 - Lof M et al. Birth weight in relation to endometrial and breast cancer risks in Swedish women. Br J Cancer 2007; 96(1):134-136.
BRE80144 - Lof M et al. Dietary fat and breast cancer risk in the Swedish women's lifestyle and health cohort. Br J Cancer 2007; 97(11):1570-1576.
BRE15914 - London SJ et al. Lactation and risk of breast cancer in a cohort of US women. Am J Epidemiol 1990; 132(1):17-26.
BRE80100 - Lukanova A et al. Body mass index and cancer: results from the Northern Sweden Health and Disease Cohort. Int J Cancer 2006; 118(2):458-466.
BRE80002 - Lundqvist E et al. Co-twin control and cohort analyses of body mass index and height in relation to breast, prostate, ovarian, corpus uteri, colon and rectal cancer among Swedish and Finnish twins. Int J Cancer 2007; 121(4):810-818.
BRE80003 - Lundqvist E et al. Co-twin control and cohort analyses of body mass index and height in relation to breast, prostate, ovarian, corpus uteri, colon and rectal cancer among Swedish and Finnish twins. Int J Cancer 2007; 121(4):810-818.
BRE80159 - Macinnis RJ et al. Body size and composition and risk of postmenopausal breast cancer. Cancer Epidemiol Biomarkers Prev 2004; 13(12):2117-2125.
BRE23275 - Mai V et al. Diet quality and subsequent cancer incidence and mortality in a prospective cohort of women. Int J Epidemiol 2005; 34(1):54-60.
BRE17790 - Manjer JK. Risk of breast cancer in relation to anthropometry, blood pressure, blood lipids and glucose metabolism: a prospective study within the Malmo preventive project. Eur J Cancer Prev 2001; 10(1):33-42.
BRE23306 - Margolis KL et al. Physical activity in different periods of life and the risk of breast cancer: the Norwegian-Swedish Women's Lifestyle and Health cohort study. Cancer Epidemiol Biomarkers Prev 2005; 14(1):27-32.
BRE16039 - Matthews CE et al. Lifetime physical activity and breast cancer risk in the Shanghai breast cancer study. Br J Cancer 2001; 84(7):994-1001.
BRE16042 - Mattisson I et al. Intakes of plant foods, fibre and fat and risk of breast cancer - A prospective study in the Malmo Diet and Cancer cohort. Br J Cancer 2004; 90(1):122-127.
BRE17807 - Mattisson IW. High fat and alcohol intakes are risk factors of postmenopausal breast cancer: a prospective study from the Malmo diet and cancer cohort. Int J Cancer 2004; 110(4):589-597.
BRE23366 - McCormack VA et al. Birth characteristics and adult cancer incidence: Swedish cohort of over 11,000 men and women. Int J Cancer 2005; 115(4):611-617.
BRE20022 - McCullough ML et al. Vitamin D pathway gene polymorphisms, diet, and risk of postmenopausal breast cancer: a nested case-control study. Breast Cancer Res 2007; 9(1):R9.

231
BRE23368 - McCullough ML et al. Dairy, calcium, and vitamin D intake and postmenopausal breast cancer risk in the Cancer Prevention Study II Nutrition Cohort. Cancer Epidemiol Biomarkers Prev 2005; 14(12):2898-2904.
BRE17819 - McTiernan AK. Recreational physical activity and the risk of breast cancer in postmenopausal women: the women's health initiative cohort study. JAMA, Journal of the American Medical Association 2003; 290(10):1331-1336.
BRE80039 - Mellemkjaer L et al. Body composition and breast cancer in postmenopausal women: a Danish prospective cohort study. Obesity (Silver Spring) 2006; 14(10):1854-1862.
BRE23405 - Mertens AJ et al. Physical activity and breast cancer incidence in middle-aged women: a prospective cohort study. Breast Cancer Res Treat 2005;1-6.
BRE80033 - Michels KB et al. Longitudinal study on the role of body size in premenopausal breast cancer. Arch Intern Med 2006; 166(21):2395-2402.
BRE80120 - Michels KB et al. Longitudinal study of birthweight and the incidence of breast cancer in adulthood. Carcinogenesis 2006; 27(12):2464-2468.
BRE17829 - Michels KBW. Prospective assessment of breastfeeding and breast cancer incidence among 89 887 women. Lancet (British edition) 1996; 347(8999):431-436.
BRE20406 - Michels K et al. Coffee, tea, and caffeine consumption and breast cancer incidence in a cohort of Swedish women. Annals of Epidemiology 2002; 12(1):21-26.
BRE17836 - Mills PKA. Animal product consumption and subsequent fatal breast cancer risk among Seventh-day Adventists. Am J Epidemiol 1988; 127(3):440-453.
BRE17837 - Mills PKB. Dietary habits and breast cancer incidence among Seventh-day Adventists. Cancer 1989; 64(3):582-590.
BRE80137 - Modugno F et al. Obesity, hormone therapy, estrogen metabolism and risk of postmenopausal breast cancer. Int J Cancer 2006; 118(5):1292-1301.
BRE80173 - Mogren I et al. Characteristics of pregnancy and birth and malignancy in the offspring (Sweden). Cancer Causes Control 1999; 10(1):85-94.
BRE80126 - Monroe KR et al. Prospective study of grapefruit intake and risk of breast cancer in postmenopausal women: the Multiethnic Cohort Study. Br J Cancer 2007; 97(3):440-445.
BRE16124 - Moore DB et al. Physical activity and incidence of postmenopausal breast cancer. Epidemiology 2000; 11(3):292-296.
BRE16127 - Moradi T et al. Occupational physical activity and risk for breast cancer in a nationwide cohort study in Sweden. Cancer Causes Control 1999; 10(5):423-430.
BRE23480 - Morch LS et al. Amount of alcohol, drinking pattern and breast cancer among Danish nurses. American Journal of Epidemiology 2005; 161(11): S54
BRE20457 - Morimoto L et al. Obesity, body size, and risk of postmenopausal breast cancer: The Women's Health Initiative (United States). Cancer Causes Control 2002; 13(8):741-751.

232
BRE23500 - Mucci LA et al. Acrylamide intake and breast cancer risk in Swedish women. Jama 2005; 293(11):1326-1327.
BRE80180 - Muti P et al. Markers of insulin resistance and sex steroid hormone activity in relation to breast cancer risk: a prospective analysis of abdominal adiposity, sebum production, and hirsutism (Italy). Cancer Causes Control 2000; 11(8):721-730. BRE80143 - Nielsen NR, Gronbaek M. Interactions between intakes of alcohol and postmenopausal hormones on risk of breast cancer. Int J Cancer 2008; 122(5):1109-1113.
BRE23581 - Nielsen TG et al. Dietary carbohydrate intake is not associated with the breast cancer incidence rate ratio in postmenopausal Danish women. J Nutr 2005; 135(1):124-128.
BRE16210 - Nilsen TIL, Vatten LJ. Adult height and risk of breast cancer: A possible effect of early nutrition. Br J Cancer 2001; 85(7):959-961.
BRE80129 - Nishio K et al. Consumption of soy foods and the risk of breast cancer: findings from the Japan Collaborative Cohort (JACC) Study. Cancer Causes Control 2007; 18(8):801-808.
BRE80170 - Olsen A et al. Plasma enterolactone and breast cancer incidence by estrogen receptor status. Cancer Epidemiol Biomarkers Prev 2004; 13(12):2084-2089.
BRE17890 - Olsen AT. Fruits and vegetables intake differentially affects estrogen receptor negative and positive breast cancer incidence rates. Journal of Nutrition 2003; 133(7):2342-2347.
BRE17893 - Overvad KW. Selenium in human mammary carcinogenesis: a case-cohort study. European Journal of Cancer 1991; 27(7):900-902.
BRE80122 - Palmer JR et al. A prospective study of body size and breast cancer in black women. Cancer Epidemiol Biomarkers Prev 2007; 16(9):1795-1802.
BRE20603 - Palmer J et al. Height and breast cancer risk: Results from the Black Women's Health Study (United States). Cancer Causes Control 2001; 12(4):343-348.
BRE17900 - Parker EDF. Intentional weight loss and incidence of obesity-related cancers: the Iowa Women's Health Study. International Journal of Obesity 2003; 27(12):1447-1452.
BRE16299 - Patel AV et al. Recreational physical activity and risk of postmenopausal breast cancer in a large cohort of US women. Cancer Causes Control 2003; 14(6):519-529.
BRE20653 - Petrelli J et al. Body mass index, height, and postmenopausal breast cancer mortality in a prospective cohort of US women. Cancer Causes Control 2002; 13(4):325-332.
BRE16325 - Petri AL et al. Alcohol intake, type of beverage, and risk of breast cancer in pre- and postmenopausal women. Alcoholism: Clinical and Experimental Research 2004; 28(7):1084-1090.
BRE80155 - Prentice RL et al. Low-fat dietary pattern and risk of invasive breast cancer: the Women's Health Initiative Randomized Controlled Dietary Modification Trial. Jama 2006; 295(6):629-642.

233
BRE24790 - Pukkala E et al. Life-long physical activity and cancer risk among Finnish female teachers. Eur J Cancer Prev 1993; 2(5):369-376.
BRE16401 - Radimer KL et al. Weight change and the risk of late-onset breast cancer in the original Framingham cohort. Nutr Cancer 2004; 49(1):7-13.
BRE23858 - Rapp K et al. Obesity and incidence of cancer: a large cohort study of over 145,000 adults in Austria. Br J Cancer 2005; 93(9):1062-1067.
BRE80151 - Ravn-Haren G et al. Associations between GPX1 Pro198Leu polymorphism, erythrocyte GPX activity, alcohol consumption and breast cancer risk in a prospective cohort study. Carcinogenesis 2006; 27(4):820-825.
BRE80146 - Reeves GK et al. Cancer incidence and mortality in relation to body mass index in the Million Women Study: cohort study. BMJ 2007; 335(7630):1134.
BRE80038 - Reinier KS et al. Risk factors for breast carcinoma in situ versus invasive breast cancer in a prospective study of pre- and post-menopausal women. Breast Cancer Res Treat 2007; 103(3):343-348.
BRE80101 - Rinaldi S et al. Anthropometric measures, endogenous sex steroids and breast cancer risk in postmenopausal women: a study within the EPIC cohort. Int J Cancer 2006; 118(11):2832-2839.
BRE17954 - Rissanen HK. Serum fatty acids and breast cancer incidence. Nutr Cancer 2003; 45(2):168-175.
BRE80130 - Robien K et al. Vitamin D intake and breast cancer risk in postmenopausal women: the Iowa Women's Health Study. Cancer Causes Control 2007; 18(7):775-782.
BRE16489 - Rohan TE et al. Alcohol consumption and risk of breast cancer: a cohort study. Cancer Causes Control 2000; 11(3):239-247.
BRE17965 - Rohan TEH. Dietary fiber, vitamins A, C, and E, and risk of breast cancer: a cohort study. Cancer Causes & Control 1993; 4(1):29-37.
BRE17968 - Rohan TEJ. Dietary folate consumption and breast cancer risk. J Natl Cancer Inst 2000; 92(3):266-269.
BRE21486 - Saadatian-Elahi M et al. Serum fatty acids and risk of breast cancer in a nested case-control study of the New York University Women's Health Study. Cancer Epidemiol Biomarkers Prev 2002; 11(11):1353-1360.
BRE80036 - Sant M et al. Salad vegetables dietary pattern protects against HER-2-positive breast cancer: A prospective Italian study. Int J Cancer 2007; 121(4);911-914.
BRE18013 - Schatzkin AC. Is alcohol consumption related to breast cancer? Results from the Framingham Heart Study. Journal of National Cancer Institute 1989; 81(1):31-35.
BRE24028 - Schnohr P et al. Physical activity in leisure-time and risk of cancer: 14-year follow-up of 28,000 Danish men and women. Scandinavian Journal of Public Health 2005; 33(4):244-249.

234
BRE18027 - Sellers TA et al. Does folate intake decrease risk of postmenopausal breast cancer among women with a family history? Cancer Causes & Control 2004; 15(2):113-120.
BRE20892 - Sellers T et al. Interaction of waist/hip ratio and family history on the risk of hormone receptor-defined breast cancer in a prospective study of postmenopausal women. Am J Epidemiol 2002; 155(3):225-233.
BRE24061 - Sesso HD et al. Dietary and plasma lycopene and the risk of breast cancer. Cancer Epidemiol Biomarkers Prev 2005; 14(5):1074-1081.
BRE16626 - Sesso HD et al. Physical activity and breast cancer risk in the college alumni health study (United States). Cancer Causes Control 1998; 9(4):433-439.
BRE18714 - Shannon J et al. Diet and risk of breast cancer in Shanghai, China. Cancer Epidemiology Biomarkers & Prevention 2003; 12(11):1315S-1316S.
BRE16658 - Shin MH et al. Intake of dairy products, calcium, and vitamin D and risk of breast cancer. J Natl Cancer Inst 2002; 94(17):1301-1311.
BRE20941 - Sieri S et al. Fat and protein intake and subsequent breast cancer risk in postmenopausal women. Nutr Cancer 2002; 42(1):10-17.
BRE80142 - Sieri S et al. Dietary glycemic index, glycemic load, and the risk of breast cancer in an Italian prospective cohort study. Am J Clin Nutr 2007; 86(4):1160-1166.
BRE24119 - Silvera SA et al. Dietary carbohydrates and breast cancer risk: a prospective study of the roles of overall glycemic index and glycemic load. Int J Cancer 2005; 114(4):653-658.
BRE24118 - Silvera SA et al. Energy balance and breast cancer risk: a prospective cohort study. Breast Cancer Res Treat 2006; 97(1):97-106.
BRE18039 - Simard AV. Vitamin D deficiency and cancer of the breast: an unprovocative ecological hypothesis. Canadian Journal of Public Health 1991; 82(5):300-303.
BRE80147 - Sonestedt E et al. Both food habit change in the past and obesity status may influence the association between dietary factors and postmenopausal breast cancer. Public Health Nutr 2007; 10(8):769-779.
BRE11604 - Sonnenschein E et al. Body fat distribution and obesity in pre- and postmenopausal breast cancer. Int J Epidemiol 1999; 28(6):1026-1031.
BRE11742 - Steenland K et al. Cancer incidence in the National Health and Nutrition Survey I. Follow-up data: diabetes, cholesterol, pulse and physical activity. Cancer Epidemiol Biomarkers Prev 1995; 4(8):807-811.
BRE80113 - Stolzenberg-Solomon RZ et al. Folate intake, alcohol use, and postmenopausal breast cancer risk in the Prostate, Lung, Colorectal, and Ovarian Cancer Screening Trial. Am J Clin Nutr 2006; 83(4):895-904.

235
BRE18746 - Stolzenberg-Solomon RZ et al. Dietary folate intake, alcohol use and postmenopausal breast cancer risk in the Prostate, Lung, Colorectal, Ovarian (PLCO) Cancer Screening Trial. Am J Epidemiol 2004; 159(11):S69.
BRE11883 - Stripp C et al. Fish intake is positively associated with breast cancer incidence rate. J Nutr 2003; 133(11):3664-3669.
BRE80148 - Suzuki R et al. Dietary fiber intake and risk of postmenopausal breast cancer defined by estrogen and progesterone receptor status--a prospective cohort study among Swedish women. Int J Cancer 2008; 122(2):403-412. BRE80116 - Suzuki R et al. Body weight and postmenopausal breast cancer risk defined by estrogen and progesterone receptor status among Swedish women: A prospective cohort study. Int J Cancer 2006; 119(7):1683-1689.
BRE24245 - Suzuki R et al. Alcohol and postmenopausal breast cancer risk defined by estrogen and progesterone receptor status: a prospective cohort study. J Natl Cancer Inst 2005; 97(21):1601-1608.
BRE11981 - Swanson CA et al. Breast cancer risk assessed by anthropometry in the NHANES I epidemiological follow-up study. Cancer Res 1988; 48(18):5363-5367.
BRE80008 - Taylor EF et al. Meat consumption and risk of breast cancer in the UK Women's Cohort Study. Br J Cancer 2007; 96(7):1139-1146.
BRE80103 - Tehard B. Several anthropometric measurements and breast cancer risk: results of the E3N cohort study. Int J Obes (Lond) 2006; 30(1):156-163.
BRE80108 - Tehard B et al. Effect of physical activity on women at increased risk of breast cancer: results from the E3N cohort study. Cancer Epidemiol Biomarkers Prev 2006; 15(1):57-64.
BRE12173 - Tehard B et al. Anthropometry, breast cancer and menopausal status: use of repeated measurements over 10 years of follow-up-results of the French E3N women's cohort study. Int J Cancer 2004; 111(2):264-269.
BRE12199 - Terry P et al. No association among total dietary fiber, fiber fractions, and risk of breast cancer. Cancer Epidemiol Biomarkers Prev 2002; 11(11):1507-1508.
BRE12244 - Thiebaut AC, Clavel-Chapelon F. [Fat consumption and breast cancer: preliminary results from the E3N-Epic cohort]. Bull Cancer 2001; 88(10):954-958.
BRE80012 - Thiebaut AC et al. Dietary fat and postmenopausal invasive breast cancer in the National Institutes of Health-AARP Diet and Health Study cohort. J Natl Cancer Inst 2007; 99(6):451-462.
BRE12297 - Thorand B et al. Intake of fruits, vegetables, folic acid and related nutrients and risk of breast cancer in postmenopausal women. Public Health Nutr 1998; 1(3):147-156.
BRE12313 - Thune I et al. Physical activity and the risk of breast cancer. N Engl J Med 1997; 336(18):1269-1275.

236
BRE80104 - Tjonneland A et al. Folate intake, alcohol and risk of breast cancer among postmenopausal women in Denmark. Eur J Clin Nutr 2006; 60(2):280-286.
BRE80013 - Tjonneland A et al. Alcohol intake and breast cancer risk: the European Prospective Investigation into Cancer and Nutrition (EPIC). Cancer Causes Control 2007; 18(4):361-373.
BRE12349 - Tjonneland A et al. Lifetime alcohol consumption and postmenopausal breast cancer rate in Denmark: a prospective cohort study. J Nutr 2004; 134(1):173-178.
BRE12350 - Tjonneland A et al. Alcohol intake, drinking patterns and risk of postmenopausal breast cancer in Denmark: a prospective cohort study. Cancer Causes Control 2003; 14(3):277-284.
BRE12398 - Toniolo P et al. Consumption of meat, animal products, protein, and fat and risk of breast cancer: a prospective cohort study in New York. Epidemiology 1994; 5(4):391-397.
BRE12417 - Tornberg SA, Carstensen JM. Relationship between Quetelet's index and cancer of breast and female genital tract in 47,000 women followed for 25 years. Br J Cancer 1994; 69(2):358-361.
BRE12418 - Tornberg SA et al. Breast cancer risk in relation to serum cholesterol, serum beta-lipoprotein, height, weight, and blood pressure. Acta Oncol 1988; 27(1):31-37.
BRE80015 - Touillaud MS et al. Dietary lignan intake and postmenopausal breast cancer risk by estrogen and progesterone receptor status. J Natl Cancer Inst 2007; 99(6):475-486.
BRE80111 - Touillaud MS et al. No association between dietary phytoestrogens and risk of premenopausal breast cancer in a French cohort study. Cancer Epidemiol Biomarkers Prev 2006; 15(12):2574-2576.
BRE80141 - Travis RC et al. A prospective study of vegetarianism and isoflavone intake in relation to breast cancer risk in British women. Int J Cancer 2007; 122(3):705-710.
BRE80119 - Troisi R et al. Birth weight and breast cancer risk. Br J Cancer 2006; 94(11):1734-1737.
BRE12507 - Tryggvadottir L et al. Breast cancer risk factors and age at diagnosis: an Icelandic cohort study. Int J Cancer 2002; 98(4):604-608.
BRE12506 - Tryggvadottir L et al. Breastfeeding and reduced risk of breast cancer in an Icelandic cohort study. Am J Epidemiol 2001; 154(1):37-42.
BRE12565 - Tulinius H et al. Risk factors for malignant diseases: a cohort study on a population of 22,946 Icelanders. Cancer Epidemiol Biomarkers Prev 1997; 6(11):863-873.
BRE12717 - van den Brandt PA et al. Height, weight weight change, and postmenopausal breast cancer risk: The Netherlands Cohort Study. Cancer Causes Control 1997; 8(1):39-47.
BRE12719 - van den Brandt PA et al. Alcohol and breast cancer: results from The Netherlands Cohort Study. Am J Epidemiol 1995; 141(10):907-915.

237
BRE12721 - van den Brandt PA et al. Toenail selenium levels and the risk of breast cancer. Am J Epidemiol 1994; 140(1):20-26.
BRE16919 - van den Brandt PA et al. A prospective cohort study on dietary fat and the risk of postmenopausal breast cancer. Cancer Res 1993; 53(1):75-82.
BRE12728 - van der Hel OL et al. GSTM1 null genotype, red meat consumption and breast cancer risk (The Netherlands). Cancer Causes Control 2004; 15(3):295-303.
BRE80154 - van der Pols JC et al. Childhood dairy intake and adult cancer risk: 65-y follow-up of the Boyd Orr cohort. Am J Clin Nutr 2007; 86(6):1722-1729.
BRE80167 - Van Gils CH et al. Consumption of vegetables and fruits and risk of breast cancer. Jama 2005; 293(2):183-193.
BRE12755 - van Noord PA et al. Selenium levels in nails of premenopausal breast cancer patients assessed prediagnostically in a cohort-nested case-referent study among women screened in the DOM project. Int J Epidemiol 1987; 16(2):318-322.
BRE16938 - Van Noord PAH et al. Selenium and the risk of postmenopausal breast cancer in the DOM cohort. Breast Cancer Res Treat 1993; 25(1):11-19.
BRE12828 - Vatten LJ, Kvinnsland S. Prospective study of height, body mass index and risk of breast cancer. Acta Oncol 1992; 31(2):195-200.
BRE12826 - Vatten LJ, Kvinnsland S. Body mass index and risk of breast cancer. A prospective study of 23,826 Norwegian women. Int J Cancer 1990; 45(3):440-444.
BRE12827 - Vatten LJ, Kvinnsland S. Body height and risk of breast cancer. A prospective study of 23,831 Norwegian women. Br J Cancer 1990; 61(6):881-885.
BRE24432 - Vatten LJ et al. Size at birth and risk of breast cancer: prospective population-based study. Int J Cancer 2005; 114(3):461-464.
BRE12833 - Vatten LJ et al. Coffee consumption and the risk of breast cancer. A prospective study of 14,593 Norwegian women. Br J Cancer 1990; 62(2):267-270.
BRE12832 - Vatten LJ et al. Frequency of meat and fish intake and risk of breast cancer in a prospective study of 14,500 Norwegian women. Int J Cancer 1990; 46(1):12-15.
BRE18116 - Vecchia ClT. Coffee consumption and the risk of breast cancer. Surgery, USA 1986; 100(3):477-481.
BRE12851 - Velie E et al. Dietary fat, fat subtypes, and breast cancer in postmenopausal women: a prospective cohort study. J Natl Cancer Inst 2000; 92(10):833-839.
BRE12852 - Vena JE et al. Occupational exercise and risk of cancer. Am J Clin Nutr 1987; 45(1 Suppl):318-327.
BRE20024 - Verheus M et al. Plasma phytoestrogens and subsequent breast cancer risk. J Clin Oncol 2007; 25(6):648-655.

238
BRE12868 - Verhoeven DT et al. Vitamins C and E, retinol, beta-carotene and dietary fibre in relation to breast cancer risk: a prospective cohort study. Br J Cancer 1997; 75(1):149-155.
BRE80020 - Visvanathan K et al. Alcohol dehydrogenase genetic polymorphisms, low-to-moderate alcohol consumption, and risk of breast cancer. Alcohol Clin Exp Res 2007; 31(3):467-476.
BRE80150 - Vogel U et al. Peroxisome profilerator-activated receptorgamma2 Pro12Ala, interaction with alcohol intake and NSAID use, in relation to risk of breast cancer in a prospective study of Danes. Carcinogenesis 2007; 28(2):427-434.
BRE13011 - Voorrips LE et al. Intake of conjugated linoleic acid, fat, and other fatty acids in relation to postmenopausal breast cancer: the Netherlands Cohort Study on Diet and Cancer. Am J Clin Nutr 2002; 76(4):873-882.
BRE24482 - Wakai K et al. Dietary intakes of fat and fatty acids and risk of breast cancer: a prospective study in Japan. Cancer Sci 2005; 96(9):590-599.
BRE18151 - Weiderpass EB. A prospective study of body size in different periods of life and risk of premenopausal breast cancer. Cancer Epidemiology, Biomarkers & Prevention 2004; 13(7):1121-1127.
BRE13438 - Willett WC et al. Dietary fat and fiber in relation to risk of breast cancer. An 8-year follow-up. Jama 1992; 268(15):2037-2044.
BRE13442 - Willett WC et al. Dietary fat and the risk of breast cancer. N Engl J Med 1987; 316(1):22-28.
BRE13441 - Willett WC et al. Moderate alcohol consumption and the risk of breast cancer. N Engl J Med 1987; 316(19):1174-1180.
BRE13504 - Wirfalt E et al. Postmenopausal breast cancer is associated with high intakes of omega6 fatty acids (Sweden). Cancer Causes Control 2002; 13(10):883-893.
BRE11111 - Wirfalt E et al. Fat from different foods show diverging relations with breast cancer risk in postmenopausal women. Nutr Cancer 2005; 53(2):135-143.
BRE17083 - Wirfalt E et al. No relations between breast cancer risk and fatty acids of erythrocyte membranes in postmenopausal women of the Malmo Diet Cancer cohort (Sweden). Eur J Clin Nutr 2004; 58(5):761-770.
BRE13548 - Wolk A et al. A prospective study of association of monounsaturated fat and other types of fat with risk of breast cancer. Arch Intern Med 1998; 158(1):41-45.
BRE13618 - Wu K et al. A prospective study on folate, B12, and pyridoxal 5'-phosphate (B6) and breast cancer. Cancer Epidemiol Biomarkers Prev 1999; 8(3):209-217.
BRE63618 - Wu K et al. A prospective study on folate, B12, and pyridoxal 5'-phosphate (B6) and breast cancer. Cancer Epidemiol Biomarkers Prev 1999; 8(3):209-217.

239
BRE24628 - Wu MH et al. Hormonal and body-size factors in relation to breast cancer risk: a prospective study of 11,889 women in a low-incidence area. Ann Epidemiol 2006; 16(3):223-229. BRE13664 - Wyrwich KW, Wolinsky FD. Physical activity, disability, and the risk of hospitalization for breast cancer among older women. J Gerontol A Biol Sci Med Sci 2000; 55(7):M418-M421.
BRE13666 - Wyshak G, Frisch RE. Breast cancer among former college athletes compared to non-athletes: a 15-year follow-up. Br J Cancer 2000; 82(3):726-730.
BRE17122 - Yamamoto S et al. Soy, isoflavones, and breast cancer risk in Japan. J Natl Cancer Inst 2003; 95(12):906-913.
BRE24717 - Yuan JM et al. Green tea intake, ACE gene polymorphism and breast cancer risk among Chinese women in Singapore. Carcinogenesis 2005; 26(8):1389-1394.
BRE13929 - Zeleniuch-Jacquotte A et al. Circulating enterolactone and risk of breast cancer: a prospective study in New York. Br J Cancer 2004; 91(1):99-105.
BRE13953 - Zhang S et al. Dietary carotenoids and vitamins A, C, and E and risk of breast cancer. J Natl Cancer Inst 1999; 91(6):547-556.
BRE13954 - Zhang S et al. A prospective study of folate intake and the risk of breast cancer. Jama 1999; 281(17):1632-1637.
BRE24752 - Zhang SM et al. Folate intake and risk of breast cancer characterized by hormone receptor status. Cancer Epidemiol Biomarkers Prev 2005; 14(8):2004-2008.
BRE20023 - Zhang SM et al. Alcohol consumption and breast cancer risk in the Women's Health Study. Am J Epidemiol 2007; 165(6):667-676.
BRE13958 - Zhang SM et al. Plasma folate, vitamin B6, vitamin B12, homocysteine, and risk of breast cancer. J Natl Cancer Inst 2003; 95(5):373-380.
BRE13965 - Zhang Y et al. Alcohol consumption and risk of breast cancer: the Framingham Study revisited. Am J Epidemiol 1999; 149(2):93-101.
BRE17172 - Zheng W et al. N-Acetyltransferase 1 genetic polymorphism, cigarette smoking, well- done meat intake, and breast cancer risk. Cancer Epidemiol Biomarkers Prev 1999; 8(3):233-239.
BRE13994 - Zheng W et al. Occupational physical activity and the incidence of cancer of the breast, corpus uteri, and ovary in Shanghai. Cancer 1993; 71(11):3620-3624.

240
Appendix 1 Breast cancer continuous update protocol
Continuous update of the WCRF-AICR report on diet and cancer
Protocol: Breast Cancer
Prepared by: Imperial College Team
The current protocol for the continuous update should ensure consistency of approach to the evidence, common approach to the analysis and format for displaying the evidence used as in the literature reviews for the Second Expert Report.
The starting point for this protocol are:
• The judgement of the Panel of the WCRF-AICR Second Expert Report on the evidence of the relationship of food, nutrition, physical activity and breast cancer (Second Expert Report Part 2 Chapter 7.10 pp 289).
• The convention for conducting systematic reviews developed by WCRF International for the Second Expert Report (SLR Specification Manual –version 15).
• The protocol developed by the SLR group on breast cancer for the Second Expert Report (National Cancer Institute, Milan, Version October 29, 2004).
The protocol will represent the agreed plan for the Continuous Update. Should departure from the agreed plan be considered necessary at a later stage, this must be agreed by the Continuous Update Panel (CUP) and the reasons documented.
Judgement of the Panel of the WCRF-AICR Second Expert Report:
The following summary has been extracted from the WCRF-AICR Second Expert Report:
CANCER OF THE BREAST (PREMENOPAUSE) In the judgement of the Panel, the factors listed below modify the risk of cancer of the breast (premenopause). Judgements are graded according to the strength of the evidence.
DECREASES RISK
INCREASES RISK
Convincing Lactation Alcoholic drinks
Probable Body fatness
Adult attained height1 Greater birth weight
Limited –suggestive Physical activity2

241
Limited –no conclusion
Cereals (grains) and their products; (grains) and their products; potatoes; vegetables; fruits; pulses (legumes); soya and soya products; meat; poultry; fish; eggs; fats and oils; vegetable fat; sugar; sugary foods and drinks; milk and dairy products; coffee; tea; carbohydrate; starch; dietary fibre; sugars; total fat; fatty acid composition; trans-fatty acids; cholesterol; protein; vitamin A; carotenoids; folate; riboflavin; vitamin B6; cobalamin; vitamin C; vitamin D; vitamin E; iron; calcium; selenium; isoflavones; dieldrin; trans-nonachlor; dichlorodiphenyltrichloroethane; dichlorodiphenyldichloroethylene; polychlorinated biphenyls; hexachlorocyclohexane; hexachlorobenzene; energy intake; adult weight gain; adult attained height; dietary patterns; culturally defined diets; glycaemic index; and being breastfed.
Substantial effect on risk unlikely
None identified
CANCER OF THE BREAST (POSTMENOPAUSE) In the judgement of the Panel, the factors listed below modify the risk of cancer of the breast (postmenopause). Judgements are graded according to the strength of the evidence.
DECREASES RISK
INCREASES RISK
Convincing Lactation Alcoholic drinks Body fatness Adult attained height1
Probable Physical activity2
Abdominal fatness Adult weight gain
Limited –suggestive Total fat
Limited –no conclusion
Cereals (grains) and their products; potatoes; vegetables and fruits; pulses; soya and soya products; meat; poultry; fish; eggs; fats and oils; sugar; sugary drinks and foods; milk and dairy products; coffee; tea; carbohydrate; starch; dietary fibre; vegetable fat; fatty acid composition; cholesterol; protein; vitamin A and carotenoids; riboflavin; vitamin B6; vitamin B12; folate; vitamin C; vitamin D; vitamin E; isoflavones; iron; calcium; selenium; dieldrin; trans-nonachlor; dichlorodiphenyltrichloroethane; dichlorodiphenyldichloroethylene; polychlorinated biphenyls; hexachlorocyclohexane; hexachlorobenzene;

242
energy intake; birth length; culturally defined diets; dietary patterns; glycaemic index; being breastfed; and birth weight.
Substantial effect on risk unlikely
None identified
Extent of the continuous update.
The extent of the update has to be adequate to time and resources. The determination of priorities for the update will be based on:
o Study type
o Grade of evidence of the association of exposures with breast cancer
o Recommendations from the CUP and the ICL team
Study type: the study types that will be included in the update are:
o Randomized controlled trial o Group randomized controlled trial (Community trial) o Prospective cohort study o Nested case-control study o Case-cohort study o Population based case-control study with more than 1000 cases
Factors: In this initial phase the ICL team will update the factors for which the strength of the evidence of association to breast cancer was graded as convincing, probable, limited-suggestive and limited –no conclusion by the Panel of Second WCRF-AICR Expert Report. :
o Lactation o Greater birth weight o Adult attained height o Alcoholic drinks o Body fatness o Abdominal fatness o Adult weight gain o Physical activity o Total fat intake
1. Research question
The research topic is:
The associations between food, nutrition and physical activity and the risk of breast cancer.

243
2. Review team
Name Current position at ICL Role within team
Teresa Norat Research Fellow Principal investigator
Rui Veira Data manager Responsible of the data management, the design and architecture of the database
Doris Chan Research Assistant Nutritional epidemiologist, reviewer
3. Timeline
The update will include the articles added to Medline after January 1st 2006. The review for the Second Expert Report ended in December 30th 2005. A pre publication update extended the search to May 30th 2006 for exposures and cancer sites with suggestive, probable, convincing associations with the exposure of interest.
Task Deadline Preliminary output from search strategy 1st July, 2007 Review abstracts and citations identified in initial electronic search. Select papers for complete review
1st August, 2007
Review relevant papers. Select papers for data extraction* 15 September, 2007 Data extraction 30 December, 2007 Production of preliminary tables 30 January, 2007 Production of tables. Preparation of forrests plot with relevant data
March 30, 2007
Preparation of report to WCRF-AICR April 15, 2007 Transfer copy of database, Endnote files to WCRF April 15, 2007
* It is intended to continue tasks 1, 2, 3 with a monthly periodicity 4. Search strategy The WCRF-PubMed search strategy and search terms used in the SLR for the Second Expert Report will be the core for this literature search.
5. Selection of articles:
5.1 Inclusion criteria
The articles to be included in the review:
• Have to be included in Medline after January 1st 2006 (closure date of the database for the Second Report).
• Have to present results from an epidemiologic study of one of the following types:
o Randomized controlled trial

244
o Group randomized controlled trial (Community trial) o Prospective cohort study o Nested case-control study o Case-cohort study o Population based case-control study with more than 1000 cases o
• Must have as outcome of interest breast cancer (in situ, invasive) incidence or mortality in women.
• Have to present results on the relevant exposures • Published in English language • Included in Medline
5.2 Exclusion criteria
The articles to be excluded from the review:
1. Are out of the research topic 2. Do not report measure of relationship 3. The measure of relationship is only the mean difference of exposure 4. Are supplement to the main manuscript (e.g. Authors’ Reply). 5. Are in-press 6. Are not in English language
Pooled analysis will be used as support for interpretation, but the data will not be included in the database.
6. Exposures
The continuous update will use the same labels as used in the SLR for the Second Expert Report.
Surrogate exposures of diet at early age, such as attained height at age at menarche and height velocity, have been included as exposures in the database during the SLR for the Second Expert Report and will be included in the continuous update.
Biomarkers of dietary intake was coded under the Main exposure corresponding to the dietary exposure and specified in a sub-exposure. We propose to use the same list of biomarkers used by the SLR teams of Bristol and Leeds (Attachment 1).
7. Outcome The outcome of interest is breast cancer encompassing incidence and mortality (except for case-control studies, for which the outcome of interest is incidence). Separate analyses for incidence and mortality will be provided.
The information of all the papers reporting outcome for more than one cancer site, will be extracted and the information inputted in the database.

245
8. Databases Only the Medline database will be searched. Data provided from the SLR Breast cancer for the Second Expert Report indicates that 95% of the articles included in the review have been retrieved from the Medline database (See Apendix 2).
9. Hand searching for cited references For feasibility reasons, journals will not be hand searched in the continuous update. However, hand searching, and searching in other databases should be done when a formal meta-analysis will be done after recommendation of the CUP. 10. Retrieving papers
The abstracts from the initial search results from PubMed will be reviewed by one person to assess each reference as to whether it is relevant and potentially relevant.
Complete papers will be retrieved for all relevant and potentially relevant references, and for references that cannot be excluded upon reading the title and abstracts.
A second assessment will be done after review of the complete papers.
The ICL team uses resources at Imperial College to retrieve the papers identified as satisfying the inclusion criteria. This should cover most of the online journal. For articles not accessible through the ICL library, funds provided by WCRF-AICR will be required.
The assessment of trials and cohort studies will be checked by a second reviewer. 11. Labelling of references For consistency with the previous data collected during the SLR process for the Second Expert Report, the Imperial College team will use the same labelling of references: the unique identifier for a particular reference will be constructed using a 3-letter code to represent the cancer site (e.g. BRE for breast cancer), followed by a 5-digit number that will be allocated in sequence. 12. Reference Manager files Reference Manager databases are generated in the continuous update containing the references of the initial search. 1) One of the customized fields (custom 1) is named ‘inclusion’ and this field is marked
‘in’, ‘out’ for each paper, thereby indicating which papers are deemed potentially relevant based on an assessment of the title and abstract.
2) One of the customized fields (custom 2) is named ‘reasons’ and this field should include the reason for exclusion for each paper.
3) The study identifier should be entered under the field titled ‘label’. 4) One of the customized fields (custom 3) is named “study design”. This field should
include a letter (A-Q) representing the study design of each paper. 13. Data extraction

246
Ideally, data extraction should be performed in duplicate for all papers. This is not feasible with the available resources. Instead, the extracted data of 10% of the prospective cohort studies and trials in the database will be checked by a second reviewer at Imperial College.
The ICL team will update the merged MySQL database using a new interface created at Imperial College. This contains the same fields included in the Access database for the SLR for the Second Expert Report, including quality characteristics and results. The study design algorithm devised (SLR specification manual –version 15) for use of the SLR centres for the Second Expert Report will be used to allocate study designs to papers. In some cases it will be appropriate to assign more than one design to a particular paper because the methods for assessment of different exposures may vary, because the data analyses correspond to more than one study design (e.g. analyses in the entire cohort and nested case-control). Important overall aspects of the study that need attention are the strategy of analysis, the variables for which the exposure – disease association was adjusted for, the information given on the validity of the measurements and whether analyses were performed that attempted to correct for the likely effect of measurement error in the exposure variable. These variables were programmed in the Access database and are included in the MySQL database used by the continuous update by the ICL team. The effect measures estimated with all the models reported in the paper should be extracted. The models should be labelled as not adjusted, minimally adjusted and intermediately adjusted. In addition, the ICL reviewer should indicate a “best model” for inclusion in reports. Where the same exposure was analyzed in more than one way with different levels of adjustment, the best model was taken to be the one with the most appropriate adjustment for confounding. Sometimes, some of the potential risk factors are not kept in the model because its inclusion does not modify the risk estimates. This model should also be considered the “best model”. The most appropriate model should adjust for:
• Age • Socio-economic status, educational attainment • Alcohol intake • Anthropometric variables (BMI, weight, height, WHR) • Total energy intake (if exposure is a dietary variable) • Menstrual characteristics (including age at menarche, menopausal status, age at
menopause, among others) • Reproductive and hormonal factors (including parity, HRT use, OC use) • Genetic factors (e.g. family history) • Previous breast disease • Factors related to laboratory determinations (e.g. batch)
In relation to effect modification, the ICL team should report whether interaction terms were included in models and extract the results, in particular any statistical tests of heterogeneity across strata. Data should also be abstracted for sub-groups corresponding to the list of potential effect modifiers. Where the data permit, the following sub-groups must be reported:
• Age • Obesity • Physical activity

247
• Oral contraceptive use • Menopausal status • Hormone replacement therapy • Ethnicity • Family history • Smoking • Genetic polymorphism • Blood levels of nutrients/hormones
Data should be extracted for each individual paper, even if there is more than one from any one study, unless the information is identical. The extracted information should only be used once per analysis. To facilitate the detection of multiple reports from the same study, the study name in each article should be extracted . If needed, the CU team should contact the authors to confirm, refute these suspicions. If the matter remains unresolved the coordinator of the continuous update will then seek advice from the CUP if necessary. 14. Reports 14.1 Content of the report: Results of the search
Information on number of records downloaded, number of papers thought potentially relevant after reading titles and abstracts and number of included relevant papers. The reasons for excluding papers should also be described.
Description of studies identified in the continuous update Amount of data and study types (i.e. numbers of different types of studies)
Populations studied Exposures identified Outcomes identified
Summary of number of studies by exposure and study type, separated on new (studies identified in the continuous update) and total. 14.2. Tabulation of study characteristics Information on the characteristics (e.g. population, exposure, outcome, study design) and results of the study (e.g. direction and magnitude) of the new studies should be summarised in tables using the same format as for the SLR for the Second Expert Report. Within this table the studies should be ordered according to design (e.g. trials, cohort studies, case-control studies). The results will be presented separately for premenopausal and postmenopausal breast cancer. Studies that did not differentiate pre and post menopausal breast cancer will be analyzed separately in the meta-analyses. 14.3 Data analysis

248
A meta-analysis for a particular exposure and outcome will be conducted when more than 2 trials or 2 cohort studies or 3 case-control studies has been published in the year, and if the new and the previous results totalize more than 3 trials, 5 cohort studies or 5 case-control studies. The meta-analysis will include also the study results extracted during the SLR and included in the merged database. Special care will be taken to avoid including more than once the results of the same study (e.g. previous analyses and re-analyses after a longer follow-up). Results of pooled analyses will be presented to the CUP to support the evaluation, but they will not be included in the meta-analyses.
The first stage of the analysis will be to investigate whether any variations in estimates of effects exist between studies. Forest plots will be used to assess and display heterogeneity. These should be presented in the report using the standard format for the presentation used in the SLR for the Second Expert Report. Heterogeneity will be formally assessed by using the I2 statistic. If sufficient homogeneity exists, an overall summary of effect should be determined. If there is significant heterogeneity, it should be characterised as clearly as possible. If possible meta-regression should be performed to investigate sources of heterogeneity.
The list of characteristics to be explored as possible causes of heterogeneity is:
Method of measurement, assessment of the exposure Definition of exposure Exposure range Adjustment for confounders Age at recruitment Duration of follow-up Geographical region Outcome Study design From this identification, it may be possible for studies to be grouped according to a particular characteristic and separate analysis performed within each sub-group.
Meta-regression analysis will be used when appropriate and possible. In addition, sensitivity analysis and influence analyses could be done when possible and appropriate. Summary estimates should be prepared for each study design separately but not combined, and these should be displayed on the same forest plot. The studies should be ordered by study design: randomised controlled trials, cohort and then case-control studies.
Formal quality grading should not be performed on an individual study basis. Instead, study characteristics (such as aspects of study design, methods of exposure assessment etc.) will be used to explore potential sources of bias and the robustness of conclusions. This approach has the following uses: 1) To explore the reasons for heterogeneity in study results 2) To guide interpretation of findings and to aid determining the strength of inferences 3) To guide recommendations for future research The recommended method for presenting the results of the meta-analyses is in terms of log, per unit increase in exposure. If it is not possible, the meta-analyses will summarize the comparison of extreme categories. The analyses will be conducted using STATA.

249
Appendix 2 Search Strategy WCRF - PUBMED SEARCH STRATEGY (with modifications implemented by the SLR centre Milan) a) Searching for all studies relating to breast cancer: #1 Breast Neoplasms [MeSH Terms] #2 Breast AND (cancer* OR neoplasm* OR tumour* OR tumor* OR carcinoma* OR adenocarcinoma*) #3 mammary AND (cancer* OR neoplasm* OR tumour* OR tumor* OR carcinoma* OR adenocarcinoma*) #4 #1 OR #2 OR #3 b) Searching for all studies relating to food, nutrition and physical activity: #5 weight loss[tiab] or weight gain[tiab] OR anthropometry[tiab] OR birth weight[tiab] OR birthweight[tiab] OR birth-weight[tiab] OR child development[tiab] OR height[tiab] OR body composition[tiab] OR body mass[tiab] OR BMI[tiab] OR obesity[tiab] OR obese[tiab] OR overweight[tiab] OR over-weight[tiab] OR over weight[tiab] OR skinfold measurement*[tiab] OR skinfold thickness[tiab] OR DEXA[tiab] OR bio-impedence[tiab] OR waist circumference[tiab] OR hip circumference[tiab] OR waist hip ratio*[tiab] #6 recreational activit*[tiab] OR household activit*[tiab] OR occupational activit*[tiab] OR physical activit*[tiab] OR physical inactivit*[tiab] OR exercise[tiab] OR exercising[tiab] OR energy intake[tiab] OR energy expenditure[tiab] OR energy balance[tiab] OR energy density[tiab] #7 body composition[MeSH Terms] OR body constitution[MeSH Terms] OR growth[MeSH Terms] OR anthropometry[MeSH Terms] OR physical fitness[MeSH Terms] OR exertion[MeSH Terms] OR physical endurance[MeSH Terms] or walking[MeSH Terms] #8 pesticides[MeSH Terms] OR fertilizers[MeSH Terms] OR "veterinary drugs"[MeSH Terms] #9 supplements[tiab] OR supplement[tiab] OR vitamin*[tiab] OR retinol[tiab] OR carotenoid*[tiab] OR tocopherol[tiab] OR folate*[tiab] OR folic acid[tiab] OR methionine[tiab] OR riboflavin[tiab] OR thiamine[tiab] OR niacin[tiab] OR pyridoxine[tiab] OR cobalamin[tiab] OR mineral*[tiab] OR sodium[tiab] OR iron[tiab] OR calcium[tiab] OR selenium[tiab] OR iodine[tiab] OR magnesium[tiab] OR potassium[tiab] OR zinc[tiab] OR copper[tiab] OR phosphorus[tiab] OR manganese[tiab] OR chromium[tiab] OR phytochemical[tiab] OR allium[tiab] OR isothiocyanate*[tiab] OR glucosinolate*[tiab] OR indoles[tiab] OR polyphenol*[tiab] OR phytoestrogen*[tiab] OR genistein[tiab] OR saponin*[tiab] OR coumarin*[tiab] #10 vitamins[MeSH Terms] #11 salt[tiab] OR salting[tiab] OR salted[tiab] OR fiber[tiab] OR fibre[tiab] OR polysaccharide*[tiab] OR starch[tiab] OR starchy[tiab] OR carbohydrate*[tiab] OR lipid*[tiab] OR linoleic acid*[tiab] OR sterols[tiab] OR stanols[tiab] OR sugar*[tiab] OR
250
sweetener*[tiab] OR saccharin*[tiab] OR aspartame[tiab] OR acesulfame[tiab] OR cyclamates[tiab] OR maltose[tiab] OR mannitol[tiab] OR sorbitol[tiab] OR sucrose[tiab] OR xylitol[tiab] OR cholesterol[tiab] OR diet*protein*[tiab] OR hydrogenated dietary oils[tiab] OR hydrogenated lard[tiab] OR hydrogenated oils[tiab] #12 dietary carbohydrates[MeSH Terms] OR dietary proteins[MeSH Terms] OR sweetening agents[MeSH Terms] #13 cooking[tiab] OR cooked[tiab] OR grill[tiab] OR grilled[tiab] OR fried[tiab] OR fry[tiab] OR roast[tiab] OR bake[tiab] OR baked[tiab] OR stewing[tiab] OR stewed[tiab] OR casserol*[tiab] OR broil[tiab] OR broiled[tiab] OR boiled[tiab] OR microwave[tiab] OR microwaved[tiab] OR re-heating[tiab] OR reheating[tiab] OR heating[tiab] OR re-heated[tiab] OR heated[tiab] OR poach[tiab] OR poached[tiab] OR steamed[tiab] OR barbecue*[tiab] OR chargrill*[tiab] OR heterocyclic amines[tiab] OR polycyclic aromatic hydrocarbons[tiab] #14 cookery[MeSH Terms] #15 mycotoxin*[tiab] OR aflatoxin*[tiab] OR pickled[tiab] OR bottled[tiab] OR bottling[tiab] OR canned[tiab] OR canning[tiab] OR vacuum pack*[tiab] OR refrigerate*[tiab] OR refrigeration[tiab] OR cured[tiab] OR smoked[tiab] OR preserved[tiab] OR preservatives[tiab] OR nitrosamine[tiab] OR hydrogenation[tiab] OR fortified[tiab] OR additive*[tiab] OR colouring*[tiab] OR coloring*[tiab] OR flavouring*[tiab] OR flavoring*[tiab] OR nitrates[tiab] OR nitrites[tiab] OR solvent[tiab] OR solvents[tiab] OR ferment*[tiab] OR processed[tiab] OR antioxidant*[tiab] OR genetic modif*[tiab] OR genetically modif*[tiab] OR vinyl chloride[tiab] OR packaging[tiab] OR labelling[tiab] OR phthalates[tiab] #16 food preservation[MeSH Terms] #17 diet therapy[MeSH Terms] OR nutrition[MeSH Terms] OR Food Habits[MeSH Terms] OR Micronutrients[MeSH Terms] #18 pesticide*[tiab] OR herbicide*[tiab] OR DDT[tiab] OR fertiliser*[tiab] OR fertilizer*[tiab] OR organic[tiab] OR contaminants[tiab] OR contaminate*[tiab] OR veterinary drug*[tiab] OR polychlorinated dibenzofuran*[tiab] OR PCDF*[tiab] OR polychlorinated dibenzodioxin*[tiab] OR PCDD*[tiab] OR polychlorinated biphenyl*[tiab] OR PCB*[tiab] OR cadmium[tiab] OR arsenic[tiab] OR chlorinated hydrocarbon*[tiab] OR microbial contamination*[tiab] #19 fluid intake[tiab] OR water[tiab] OR drinks[tiab] OR drinking[tiab] OR tea[tiab] OR coffee[tiab] OR caffeine[tiab] OR juice[tiab] OR beer[tiab] OR spirits[tiab] OR liquor[tiab] OR wine[tiab] OR alcohol[tiab] OR alcoholic[tiab] OR beverage*[tiab] OR ethanol[tiab] OR yerba mate[tiab] OR ilex paraguariensis[tiab] #20 food*[tiab] OR cereal*[tiab] OR grain*[tiab] OR granary[tiab] OR wholegrain[tiab] OR wholewheat[tiab] OR roots[tiab] OR plantain*[tiab] OR tuber[tiab] OR tubers[tiab] OR vegetable*[tiab] OR fruit*[tiab] OR pulses[tiab] OR beans[tiab] OR lentils[tiab] OR chickpeas[tiab] OR legume*[tiab] OR soy[tiab] OR soya[tiab] OR nut[tiab] OR nuts[tiab] OR peanut*[tiab] OR groundnut*[tiab] OR seeds[tiab] OR meat[tiab] OR beef[tiab] OR pork[tiab] OR lamb[tiab] OR poultry[tiab] OR chicken[tiab] OR turkey[tiab] OR duck[tiab]

251
OR fish[tiab] OR fat[tiab] OR fats[tiab] OR fatty[tiab] OR egg[tiab] OR eggs[tiab] OR bread[tiab] OR oils[tiab] OR shellfish[tiab] OR seafood[tiab] OR sugar[tiab] OR syrup[tiab] OR dairy[tiab] OR milk[tiab] OR herbs[tiab] OR spices[tiab] OR chilli[tiab] OR chillis[tiab] OR pepper*[tiab] OR condiments[tiab] OR Potato*[tiab] OR Cabbage*[tiab] OR Brassica[tiab] OR Cruciferous[tiab] OR Radish[tiab] OR Carrot*[tiab] OR Lettuce*[tiab] OR Spinach[tiab] OR Onion*[tiab] OR Tomato*[tiab] OR Soybean[tiab] #21 food and beverages[MeSH Terms] #22 diet[tiab] OR diets[tiab] OR dietetic[tiab] OR dietary[tiab] OR eating[tiab] OR intake[tiab] OR nutrient*[tiab] OR nutrition[tiab] OR vegetarian*[tiab] OR vegan*[tiab] OR "seventh day adventist"[tiab] OR macrobiotic[tiab] OR breastfeed*[tiab] OR breast feed*[tiab] OR breastfed[tiab] OR breast fed[tiab] OR breastmilk[tiab] OR breast milk[tiab] OR Lactose[tiab] OR Galactose[tiab] OR Cheese[tiab] OR Sausage[tiab] OR Ham[tiab] #23 diet therapy[MeSH Terms] OR nutrition[MeSH Terms] #24 #5 OR #6 OR #7 OR #8 OR #9 OR #10 OR #11 OR #12 OR #13 OR #14 OR #15 OR #16 OR #17 OR #18 OR #19 OR #20 OR #21 OR #22 OR #23 Combining searches on breast cancer (a) and searches on all studies relating to food, nutrition and physical activity (b): #4 AND #24

252
Appendix 3 Exposure codes 1 Patterns of diet
1.1 Regionally defined diets *1.1.1 Mediterranean diet
Include all regionally defined diets, evident in the literature. These are likely to include Mediterranean, Mesoamerican, oriental, including Japanese and Chinese, and “western type”.
1.2 Socio-economically defined diets
To include diets of low-income, middle-income and high-income countries (presented, when available in this order). Rich and poor populations within low-income, middle-income and high-income countries should also be considered. This section should also include the concept of poverty diets (monotonous diets consumed by impoverished populations in the economically-developing world mostly made up of one starchy staple, and may be lacking in micronutrients). 1.3 Culturally defined diets
To include dietary patterns such as vegetarianism, vegan diets, macrobiotic diets and diets of Seventh-day Adventists. 1.4 Individual level dietary patterns
To include work on factor and cluster analysis, and various scores and indexes (e.g. diet diversity indexes) that do not fit into the headings above. 1.5 Other dietary patterns
Include under this heading any other dietary patterns present in the literature, that are not regionally, socio-economically, culturally or individually defined. 1.6 Breastfeeding
1.6.1 Mother Include here also age at first lactation, duration of breastfeeding, number of children breast-fed 1.6.2 Child Results concerning the effects of breastfeeding on the development of cancer should be disaggregated into effects on the mother and effects on the child. Wherever possible detailed

253
information on duration of total and exclusive breastfeeding, and of complementary feeding should be included.
1.7 Other issues For example results related to diet diversity, meal frequency, frequency of snacking, dessert-eating and breakfast-eating should be reported here. Eating out of home should be reported here. 2 Foods *2.0.1 Plant foods
2.1 Starchy foods
2.1.1 Cereals (grains) * 2.1.1.0.1 Rice, pasta, noodles * 2.1.1.0.2 Bread * 2.1.1.0.3 Cereal * Report under this subheading the cereals when it is not specified if they are wholegrain or refined cereals (e.g. fortified cereals)
2.1.1.1 Wholegrain cereals and cereal products * 2.1.1.1.1 Wholegrain rice, pasta, noodles * 2.1.1.1.2 Wholegrain bread * 2.1.1.1.3 Wholegrain cereal 2.1.1.2 Refined cereals and cereal products * 2.1.1.2.1 Refined rice, pasta, noodles * 2.1.1.2.2 Refined bread * 2.1.1.2.3 Refined cereal 2.1.2 Starchy roots, tubers and plantains * 2.1.2.1 Potatoes 2.1.3 Other starchy foods *Report polenta under this heading 2.2 Fruit and (non-starchy) vegetables Results for “fruit and vegetables” and “fruits, vegetables and fruit juices” should be reported here. If the definition of vegetables used here is different from that used in the first report, this should be highlighted. 2.2.1 Non-starchy vegetables

254
This heading should be used to report total non-starchy vegetables. If results about specific vegetables are reported they should be recorded under one of the sub-headings below or if not covered, they should be recorded under ‘2.2.1.5 other’. 2.2.1.1 Non-starchy root vegetables and tubers *2.2.1.1.1 Carrots 2.2.1.2 Cruciferous vegetables 2.2.1.3 Allium vegetables 2.2.1.4 Green leafy vegetables (not including cruciferous vegetables) 2.2.1.5 Other non-starchy vegetables *2.2.1.5.13 Tomatoes *2.2.1.5.1 Fresh beans (e.g. string beans, French beans) and peas Other non-starchy vegetables’ should include foods that are botanically fruits but are eaten as vegetables, e.g. courgettes. In addition vegetables such as French beans that do not fit into the other categories, above. If there is another sub-category of vegetables that does not easily fit into a category above eg salted root vegetables (ie you do not know if it is starchy or not) then report under 2.2.1.5. and note the precise definition used by the study. If in doubt, enter the exposure more than once in this way. 2.2.1.6 Raw vegetables This section should include any vegetables specified as eaten raw. Results concerning specific groups and type of raw vegetable should be reported twice i.e. also under the relevant headings 2.2.1.1 –2.2.1.5. 2.2.2 Fruits *2.2.2.0.1 Fruit, dried *2.2.2.0.2 Fruit, canned *2.2.2.0.3 Fruit, cooked 2.2.2.1 Citrus fruit 2.2.2.1.1 Oranges 2.2.2.1.2 Other citrus fruits (e.g. grapefruits) 2.2.2.2 Other fruits *2.2.2.2.1 Bananas *2.2.2.2.4 Melon *2.2.2.2.5 Papaya *2.2.2.2.7 Blueberries, strawberries and other berries *2.2.2.2.8 Apples, pears *2.2.2.2.10 Peaches, apricots, plums *2.2.2.2.11 Grapes

255
If results are available that consider other groups of fruit or a particular fruit please report under ‘other’, specifying the grouping/fruit used in the literature. 2.3 Pulses (legumes)
*2.3.1 Soya, soya products *2.3.1.1 Miso, soya paste soup *2.3.1.2 Soya juice *2.3.1.4 Soya milk *2.3.1.5 Tofu *2.3.2 Dried beans, chickpeas, lentiles *2.3.4 Peanuts, peanut products Where results are available for a specific pulse/legume, please report under a separate heading. 2.4 Nuts and Seeds
To include all tree nuts and seeds, but not peanuts (groundnuts). Where results are available for a specific nut/seed, e.g. brazil nuts, please report under a separate heading. 2.5 Meat, poultry, fish and eggs Wherever possible please differentiate between farmed and wild meat, poultry and fish.
2.5.1 Meat This heading refers only to red meat: essentially beef, lamb, pork from farmed domesticated animals either fresh or frozen, or dried without any other form of preservation. It does not refer to poultry or fish. Where there are data for offal (organs and other non-flesh parts of meat) and also when there are data for wild and non-domesticated animals, please show these separately under this general heading as a subcategory. 2.5.1.1 Fresh Meat 2.5.1.2 Processed meat *2.5.1.2.1 Ham *2.5.1.2.1.7 Burgers *2.5.1.2.8 Bacon *2.5.1.2.9 Hot dogs *2.5.1.2.10 Sausages
Repeat results concerning processed meat here and under the relevant section under 4. Food Production and Processing. Please record the definition of ‘processed meat’ used by each study. 2.5.1.3 Red meat

256
*2.5.1.3.1 Beef *2.5.1.3.2 Lamb *2.5.1.3.3 Pork *2.5.1.3.6 Horse, rabbit, wild meat (game)
Where results are available for a particular type of meat, e.g. beef, pork or lamb, please report under a separate heading. Show any data on wild meat (game) under this heading as a separate sub-category. 2.5.1.4 Poultry Show any data on wild birds under this heading as a separate sub-category. *2.5.1.5 Offals, offal products (organ meats) 2.5.2 Fish *2.5.2.3 Fish, processed (dried, salted, smoked) *2.5.2.5 Fatty Fish *2.5.2.7 Dried Fish *2.5.2.9 White fish, lean fish 2.5.3 Shellfish and other seafood
2.5.4 Eggs
2.6 Fats, oils and sugars 2.6.1 Animal fats *2.6.1.1 Butter *2.6.1.2 Lard *2.6.1.3 Gravy *2.6.1.4 Fish oil 2.6.2 Plant oils 2.6.3 Hydrogenated fats and oils *2.6.3.1 Margarine
Results concerning hydrogenated fats and oils should be reported twice, here and under 4.3.2 Hydrogenation 2.6.4 Sugars
This heading refers to added (extrinsic) sugars and syrups as a food, that is refined sugars, such as table sugar, or sugar used in bakery products. 2.7 Milk and dairy products

257
Results concerning milk should be reported twice, here and under 3.3 Milk *2.7.1 Milk, fresh milk, dried milk *2.7.1.1 Whole milk, full-fat milks *2.7.1.2 Semi skimmed milk, skimmed milk, low fat milk, 2% Milk *2.7.2 Cheese *2.7.2.1 Cottage cheese *2.7.2.2 Cheese, low fat *2.7.3 Yoghurt, buttermilk, sour milk, fermented milk drinks *2.7.3.1 Fermented whole milk *2.7.3.2 Fermented skimmed milk *2.7.7 Ice cream 2.8 Herbs, spices, condiments *2.8.1 Ginseng *2.8.2 Chili pepper, green chili pepper, red chili pepper 2.9 Composite foods Eg, snacks, crisps, desserts, pizza. Also report any mixed food exposures here ie if an exposure is reported as a combination of 2 or more foods that cross categories (eg bacon and eggs). Label each mixed food exposure. *2.9.1 Cakes, biscuits and pastry *2.9.2 Cookies *2.9.3 Confectionery *2.9.4 Soups *2.9.5 Pizza *2.9.6 Chocolate, candy bars *2.9.7 Snacks 3 Beverages 3.1 Total fluid intake 3.2 Water 3.3 Milk
For results concerning milk please report twice, here and under 2.7 Milk and Dairy Products. 3.4 Soft drinks

258
Soft drinks that are both carbonated and sugary should be reported under this general heading. Drinks that contain artificial sweeteners should be reported separately and labelled as such. 3.4.1 Sugary (not carbonated) 3.4.2 Carbonated (not sugary) The precise definition used by the studies should be highlighted, as definitions used for various soft drinks vary greatly. *3.5 Fruit and vegetable juices *3.5.1 Citrus fruit juice *3.5.2 Fruit juice *3.5.3 Vegetable juice *3.5.4 Tomato juice
3.6 Hot drinks 3.6.1 Coffee 3.6.2 Tea Report herbal tea as a sub-category under tea. 3.6.2.1 Black tea 3.6.2.2 Green tea 3.6.3 Maté 3.6.4 Other hot drinks
3.7 Alcoholic drinks 3.7.1 Total 3.7.1.1 Beers 3.7.1.2 Wines 3.7.1.3 Spirits 3.7.1.4 Other alcoholic drinks
4 Food production, preservation, processing and preparation 4.1 Production 4.1.1 Traditional methods (to include ‘organic’) 4.1.2 Chemical contaminants Only results based on human evidence should be reported here (see instructions for dealing with mechanistic studies). Please be comprehensive and cover the exposures listed below: 4.1.2.1 Pesticides 4.1.2.2 DDT 4.1.2.3 Herbicides 4.1.2.4 Fertilisers
259
4.1.2.5 Veterinary drugs 4.1.2.6 Other chemicals 4.1.2.6.1 Polychlorinated dibenzofurans (PCDFs) 4.1.2.6.2 Polychlorinated dibenzodioxins (PCDDs) 4.1.2.6.3 Polychlorinated biphenyls (PCBs) 4.1.2.7 Heavy metals 4.1.2.7.1 Cadmium 4.1.2.7.2 Arsenic 4.1.2.8 Waterborne residues 4.1.2.8.1 Chlorinated hydrocarbons 4.1.2.9 Other contaminants Please also report any results that cover the cumulative effect of low doses of contaminants in this section. 4.2 Preservation 4.2.1 Drying 4.2.2 Storage 4.2.2.1 Mycotoxins 4.2.2.1.1 Aflatoxins 4.2.2.1.2 Others 4.2.3 Bottling, canning, vacuum packing 4.2.4 Refrigeration 4.2.5 Salt, salting 4.2.5.1 Salt 4.2.5.2 Salting 4.2.5.3 Salted foods 4.2.5.3.1 Salted animal food 4.2.5.3.2 Salted plant food 4.2.6 Pickling 4.2.7 Curing and smoking 4.2.7.1 Cured foods 4.2.7.1.1 Cured meats 4.2.7.1.2 Smoked foods
For some cancers e.g. colon, rectum, stomach and pancreas, it may be important to report results about specific cured foods, cured meats and smoked meats. N-nitrososamines should also be covered here.

260
4.3 Processing 4.3.1 Refining Results concerning refined cereals and cereal products should be reported twice, here and under 2.1.1.2 refined cereals and cereal products. 4.3.2 Hydrogenation
Results concerning hydrogenated fats and oils should be reported twice, here and under 2.6.3 Hydrogenated fats and oils 4.3.3 Fermenting 4.3.4 Compositional manipulation 4.3.4.1 Fortification 4.3.4.2 Genetic modification 4.3.4.3 Other methods 4.3.5 Food additives 4.3.5.1 Flavours Report results for monosodium glutamate as a separate category under 4.3.5.1 Flavours. 4.3.5.2 Sweeteners (non-caloric) 4.3.5.3 Colours 4.3.5.4 Preservatives 4.3.5.4.1 Nitrites and nitrates 4.3.5.5 Solvents 4.3.5.6 Fat substitutes 4.3.5.7 Other food additives Please also report any results that cover the cumulative effect of low doses of additives. Please also report any results that cover synthetic antioxidants 4.3.6 Packaging 4.3.6.1 Vinyl chloride 4.3.6.2 Phthalates 4.4 Preparation 4.4.1 Fresh food 4.4.1.1 Raw Report results regarding all raw food other than fruit and vegetables here. There is a separate heading for raw fruit and vegetables (2.2.1.6). 4.4.1.2 Juiced

261
4.4.2 Cooked food 4.4.2.1 Steaming, boiling, poaching 4.4.2.2 Stewing, casseroling 4.4.2.3 Baking, roasting 4.4.2.4 Microwaving 4.4.2.5 Frying 4.4.2.6 Grilling (broiling) and barbecuing 4.4.2.7 Heating, re-heating Some studies may have reported methods of cooking in terms of temperature or cooking medium, and also some studies may have indicated whether the food was cooked in a direct or indirect flame. When this information is available, it should be included in the SLR report. Results linked to mechanisms e.g. heterocyclic amines, acrylamides and polycyclic aromatic hydrocarbons should also be reported here. There may also be some literature on burned food that should be reported in this section. 5 Dietary constituents
Food constituents’ relationship to outcome needs to be considered in relation to dose and form including use in fortified foods, food supplements, nutrient supplements and specially formulated foods. Where relevant and possible these should be disaggregated. 5.1 Carbohydrate 5.1.1 Total carbohydrate 5.1.2 Non-starch polysaccharides/dietary fibre 5.1.2.1 Cereal fibre 5.1.2.2 Vegetable fibre 5.1.2.3 Fruit fibre 5.1.3 Starch 5.1.3.1 Resistant starch 5.1.4 Sugars *5.1.5 Glycemic index, glycemic load This heading refers to intrinsic sugars that are naturally incorporated into the cellular structure of foods, and also extrinsic sugars not incorporated into the cellular structure of foods. Results for intrinsic and extrinsic sugars should be presented separately. Count honey and sugars in fruit juices as extrinsic. They can be natural and unprocessed, such as honey, or refined such as table sugar. Any results related to specific sugars e.g. fructose should be reported here. 5.2 Lipids 5.2.1 Total fat 5.2.2 Saturated fatty acids
262
5.2.3 Monounsaturated fatty acids 5.2.4 Polyunsaturated fatty acids 5.2.4.1 n-3 fatty acids Where available, results concerning alpha linolenic acid and long chain n-3 PUFA should be reported here, and if possible separately. 5.2.4.2 n-6 fatty acids 5.2.4.3 Conjugated linoleic acid 5.2.5 Trans fatty acids 5.2.6 Other dietary lipids, cholesterol, plant sterols and stanols.
For certain cancers, e.g. endometrium, lung, and pancreas, results concerning dietary cholesterol may be available. These results should be reported under this section. 5.3 Protein 5.3.1 Total protein 5.3.2 Plant protein 5.3.3 Animal protein 5.4 Alcohol This section refers to ethanol the chemical. Results related to specific alcoholic drinks should be reported under 3.7 Alcoholic drinks. Past alcohol refers, for example, to intake at age 18, during adolescence, etc. *5.4.1 Total Alcohol (as ethanol) *5.4.1.1 Alcohol (as ethanol) from beer *5.4.1.2 Alcohol (as ethanol) from wine *5.4.1.3 Alcohol (as ethanol) from spirits *5.4.1.4 Alcohol (as ethanol) from other alcoholic drinks * 5.4.1.5 Total alcohol (as ethanol), lifetime exposure * 5.4.1.6 Total alcohol (as ethanol), past 5.5 Vitamins *5.5.0 Vitamin supplements *5.5.0.1 Vitamin and mineral supplements *5.5.0.2 Vitamin B supplement 5.5.1 Vitamin A 5.5.1.1 Retinol 5.5.1.2 Provitamin A carotenoids 5.5.2 Non-provitamin A carotenoids Record total carotenoids under 5.5.2 as a separate category marked Total Carotenoids.

263
5.5.3 Folates and associated compounds *5.5.3.1 Total folate *5.5.3.2 Dietary folate *5.5.3.3 Folate from supplements
Examples of the associated compounds are lipotropes, methionine and other methyl donors. 5.5.4 Riboflavin 5.5.5 Thiamin (vitamin B1) 5.5.6 Niacin 5.5.7 Pyridoxine (vitamin B6) 5.5.8 Cobalamin (vitamin B12) 5.5.9 Vitamin C 5.5.10 Vitamin D (and calcium) 5.5.11 Vitamin E 5.5.12 Vitamin K 5.5.13 Other If results are available concerning any other vitamins not listed here, then these should be reported at the end of this section. In addition, where information is available concerning multiple vitamin deficiencies, these should be reported at the end of this section under ‘other’. 5.6 Minerals 5.6.1 Sodium 5.6.2 Iron 5.6.3 Calcium (and Vitamin D) 5.6.4 Selenium 5.6.5 Iodine 5.6.6 Other Results are likely to be available on other minerals e.g. magnesium, potassium, zinc, copper, phosphorus, manganese and chromium for certain cancers. These should be reported at the end of this section when appropriate under ‘other’. 5.7 Phytochemicals 5.7.1 Allium compounds 5.7.2 Isothiocyanates 5.7.3 Glucosinolates and indoles 5.7.4 Polyphenols 5.7.5 Phytoestrogens eg genistein 5.7.6 Caffeine 5.7.7 Other Where available report results relating to other phytochemicals such as saponins and coumarins. Results concerning any other bioactive compounds, which are not phytochemicals should be reported under the separate heading ‘other bioactive compounds’. Eg flavonoids, isoflavonoids, glycoalkaloids, cyanogens, oligosaccharides and anthocyanins should be reported separately under this heading.

264
5.8 Other bioactive compounds 6 Physical activity 6.1 Total physical activity (overall summary measures) 6.1.1 Type of activity 6.1.1.1 Occupational 6.1.1.2 Recreational 6.1.1.3 Household 6.1.1.4 Transportation 6.1.2 Frequency of physical activity *6.1.2.1 Frequency of occupational physical activity *6.1.2.2 Frequency of recreational physical activity 6.1.3 Intensity of physical activity *6.1.3.1 Intensity of occupational physical activity *6.1.3.2 Intensity of recreational physical activity 6.1.4 Duration of physical activity *6.1.4.1 Duration of occupational physical activity *6.1.4.2 Duration of recreational physical activity 6.2 Physical inactivity 6.3 Surrogate markers for physical activity e.g. occupation 7 Energy balance 7.1 Energy intake *7.1.0.1 Energy from fats *7.1.0.2 Energy from protein *7.1.0.3 Energy from carbohydrates *7.1.0.4 Energy from alcohol *7.1.0.5 Energy from all other sources 7.1.1 Energy density of diet 7.2 Energy expenditure 8 Anthropometry 8.1 Markers of body composition 8.1.1 BMI

265
8.1.2 Other weight adjusted for height measures 8.1.3 Weight 8.1.4 Skinfold measurements 8.1.5 Other (e.g. DEXA, bio- impedance, etc) 8.1.6 Change in body composition (including weight gain)
8.2 Markers of distribution of fat 8.2.1 Waist circumference 8.2.2 Hips circumference 8.2.3 Waist to hip ratio 8.2.4 Skinfolds ratio 8.2.5 Other e.g. CT, ultrasound
8.3 Skeletal size 8.3.1 Height (and proxy measures) 8.3.2 Other (e.g. leg length) 8.4 Growth in fetal life, infancy or childhood 8.4.1 Birthweight, 8.4.2 Weight at one year

266
Appendix 4 List of abbreviations
Abbreviations ACS American Cancer Society Cancer Prevention Study II ACLS Aerobic Center Longitudinal Study AHEI Alternative Healthy Eating Index AHS Adventist Health Study AICR American Institute for Cancer Research A-MDS Alternate Mediterranean Diet Score ARIC The Atherosclerosis Risk in Communities (ARIC) Study BBD Benign breast disease BC Breast Cancer BCDDP Breast Cancer Detection Demonstration Project Follow-up Cohort BRCA Breast Cancer susceptibility protein BRCAI Breast Cancer Type 1 susceptibility protein BRCAII Breast Cancer Type 2 susceptibility protein Copenhagen CHS Copenhagen City Heart Study CI Confidence Interval CLUE I Campaign against Cancer and Stroke I CLUE II Campaign against Cancer and Stroke II COMT Catechol-O-methyltransferase CPS-II Cancer Prevention Study II CUP Continuous Update Panel DFE Dietary folate equivalent DOM DOM project for the early detection of breast cancer DQI-R Diet Quality Index-Revised EPIC The European Prospective Investigation into Cancer and Nutrition ER Estrogen receptor GSTT1 Glutathione S-transferase theta-1 HEI Healthy Eating Index HER-2 Human Epidermal growth factor receptor 2 HR Hazard ratio HRT Hormone replacement therapy IBCCS The International BRCA1/2 Carrier Cohort Study ICL Imperial College London IRR Incident rate ratio IWHS Iowa Women’s Health Study JACC Japan Collaborative Cohort Study JPHC Japan Public Health Center-based Prospective Study on Cancer KWC Korean Women's Cohort LSS Life Span Study MCCS Melbourne Collaborative Cohort Study MEC Multi-Ethnic Cohort MHT Menopausal hormonal therapy MPCDRF Monitoring Project on Cardiovascular Disease Risk Factors (Netherlands) MPP Malmo Preventive Project MUFA Monounsaturated fatty acids NAT N-acetyltransferase NBSS Canadian National Breast Screening Study NCI, DES Combined Cohort
National Cancer Institute Combined Diethylstilbestrol Cohorts
NHANES National Health and Nutrition Examination Survey NHEFS NHANES I Epidemiologic Follow-up Study NHS Nurse’s Health Study NHSS Norway National Health Screening Service Study NIH-AARP NIH-AARP Diet and Health Study

267
O-DMA O-desmethylangolensin OR Odd ratio ORDET Hormones and Diet in the Etiology of Breast Cancer 1987-2001 PA Physical Activity PLCO The Prostate, Lung, Colorectal and Ovarian cancer screening trial PMH Postmenopausal hormone PR Progesterone receptor PUFA Polyunsaturated fatty acids RDA Recommended Dietary Allowance RFS Recommended Food Score RR Relative risk Shanghai BSE Shanghai Breast Self-Examination SFA Saturated fatty acids SIR Standardised incidence ratio SLR Systematic Literature Review SUVIMAX The Supplémentation en Vitamines et Minéraux Antioxydants UKWCS UK Women’s Cohort Study VHM & PP Vorarlberg Health Monitoring and Promotion Program WHI Women's Health Initiative WHI – DM Trial Women’s Health Initative Diet Modification Trial WHR Waist-to-hip ratio

268
Appendix 5 List of articles awaiting data extraction
Bardia A et al. Relative weight at age 12 and risk of postmenopausal breast cancer. Cancer Epidemiol Biomarkers Prev 2008; 17(2):374-378.
Chajes V et al. Association between serum trans-monounsaturated fatty acids and breast cancer risk in the E3N-EPIC Study. Am J Epidemiol 2008; 167(11):1312-1320.
Cui Y et al. Selected antioxidants and risk of hormone receptor-defined invasive breast cancers among postmenopausal women in the Women's Health Initiative Observational Study. Am J Clin Nutr 2008; 87(4):1009-1018.
Cust AE et al. The influence of overweight and insulin resistance on breast cancer risk and tumour stage at diagnosis: a prospective study. Breast Cancer Res Treat 2008.
Cutler GJ et al. Dietary flavonoid intake and risk of cancer in postmenopausal women: The Iowa Women's Health Study. Int J Cancer 2008; 123(3):664-671.
Dossus L et al. Polymorphisms of genes coding for ghrelin and its receptor in relation to anthropometry, circulating levels of IGF-I and IGFBP-3, and breast cancer risk: a case-control study nested within the European Prospective Investigation into Cancer and Nutrition (EPIC). Carcinogenesis 2008.
Freedman DM et al. Serum levels of vitamin D metabolites and breast cancer risk in the prostate, lung, colorectal, and ovarian cancer screening trial. Cancer Epidemiol Biomarkers Prev 2008; 17(4):889-894.
Hedelin M et al. Dietary phytoestrogens are not associated with risk of overall breast cancer but diets rich in coumestrol are inversely associated with risk of estrogen receptor and progesterone receptor negative breast tumors in Swedish women. J Nutr 2008; 138(5):938-945.
Ishitani K et al. A prospective study of multivitamin supplement use and risk of breast cancer. Am J Epidemiol 2008; 167(10):1197-1206.
Iwasaki M et al. Plasma isoflavone level and subsequent risk of breast cancer among Japanese women: a nested case-control study from the Japan Public Health Center-based prospective study group. J Clin Oncol 2008; 26(10):1677-1683.
Lajous M et al. Carbohydrate intake, glycemic index, glycemic load, and risk of postmenopausal breast cancer in a prospective study of French women. Am J Clin Nutr 2008; 87(5):1384-1391.
Lin J et al. Plasma folate, vitamin B-6, vitamin B-12, and risk of breast cancer in women. Am J Clin Nutr 2008; 87(3):734-743.
Maruti SS et al. A prospective study of age-specific physical activity and premenopausal breast cancer. J Natl Cancer Inst 2008; 100(10):728-737.
Olesen PT et al. Acrylamide exposure and incidence of breast cancer among postmenopausal women in the Danish Diet, Cancer and Health Study. Int J Cancer 2008; 122(9):2094-2100.

269
Rapp K et al. Weight change and cancer risk in a cohort of more than 65,000 adults in Austria. Ann Oncol 2008; 19(4):641-648.
Schulz M et al. Identification of a dietary pattern characterized by high-fat food choices associated with increased risk of breast cancer: the European Prospective Investigation into Cancer and Nutrition (EPIC)-Potsdam Study. Br J Nutr 2008;1-5.
Sinilnikova OM et al. Haplotype-based analysis of common variation in the acetyl-coA carboxylase alpha gene and breast cancer risk: a case-control study nested within the European Prospective Investigation into Cancer and Nutrition. Cancer Epidemiol Biomarkers Prev 2007; 16(3):409-415.
Suzuki R et al. Dietary lignans and postmenopausal breast cancer risk by oestrogen receptor status: a prospective cohort study of Swedish women. Br J Cancer 2008; 98(3):636-640.
Ward H et al. Breast cancer risk in relation to urinary and serum biomarkers of phytoestrogen exposure in the European Prospective into Cancer-Norfolk cohort study. Breast Cancer Res 2008; 10(2):R32.
Yu CP et al. Breast cancer risk associated with multigenotypic polymorphisms in folate-metabolizing genes: a nested case-control study in Taiwan. Anticancer Res 2007; 27(3B):1727-1732.
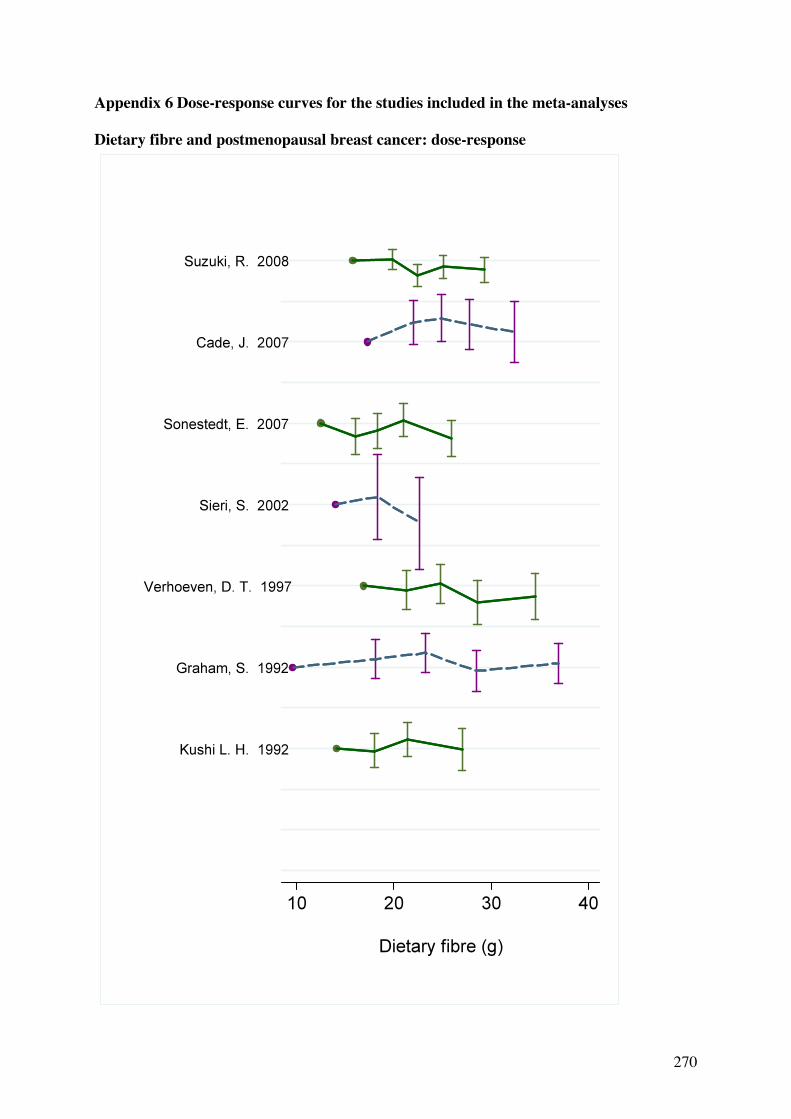
270
Appendix 6 Dose-response curves for the studies included in the meta-analyses Dietary fibre and postmenopausal breast cancer: dose-response
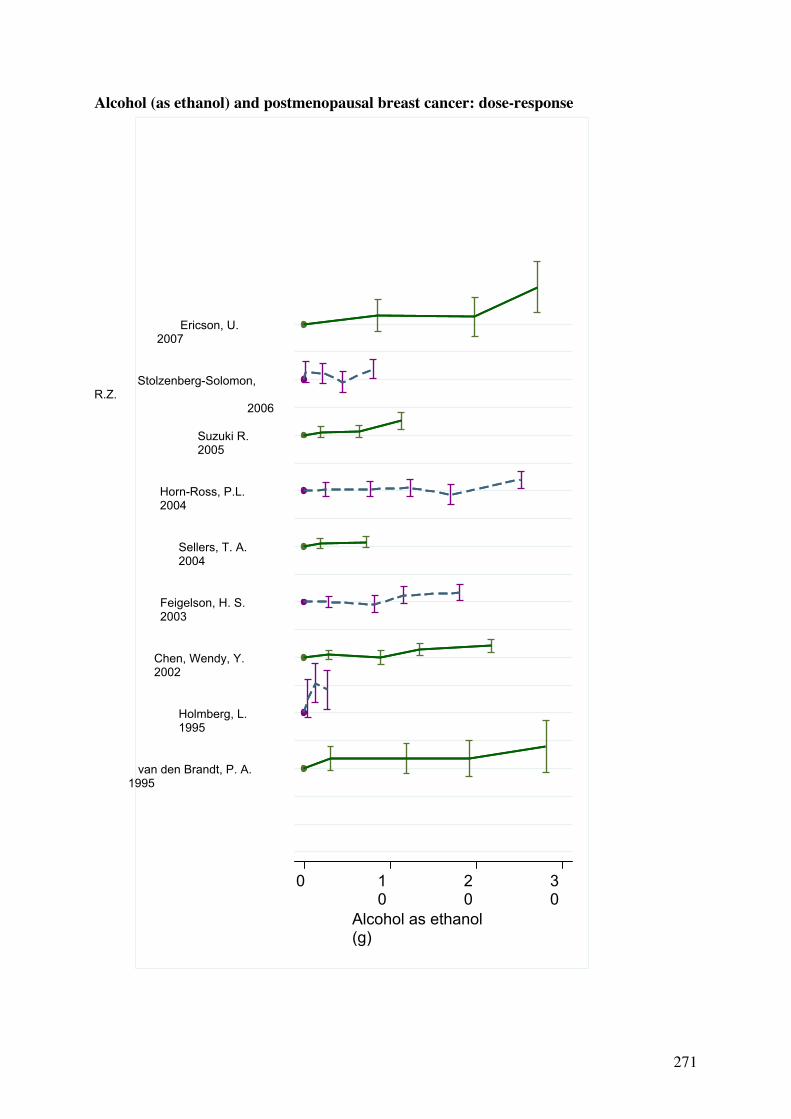
271
Alcohol (as ethanol) and postmenopausal breast cancer: dose-response
van den Brandt, P. A. 1995
Ericson, U. 2007
Horn-Ross, P.L. 2004
Chen, Wendy, Y. 2002
Feigelson, H. S. 2003
Suzuki R. 2005
Stolzenberg-Solomon, R.Z. 2006
Sellers, T. A. 2004
Holmberg, L. 1995
0 10
20
30
Alcohol as ethanol (g)
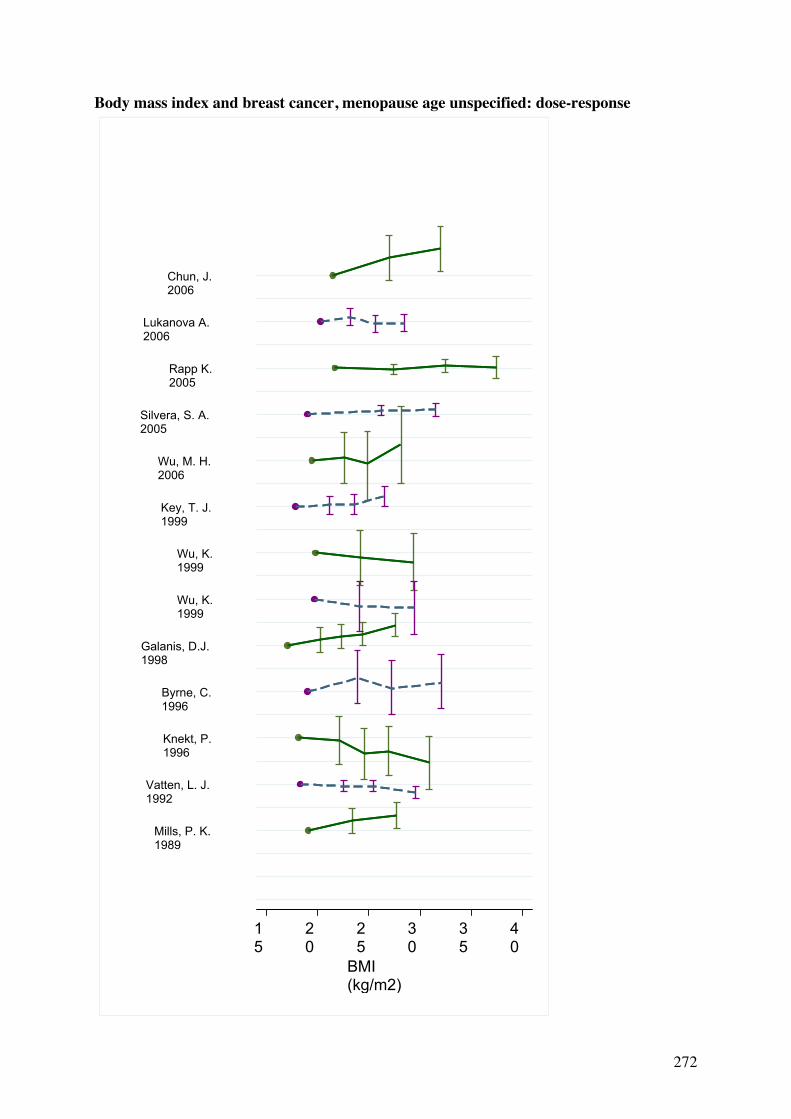
272
Body mass index and breast cancer, menopause age unspecified: dose-response
Rapp K. 2005
Chun, J. 2006
Lukanova A. 2006
Wu, K. 1999
Wu, K. 1999
Wu, M. H. 2006
Mills, P. K. 1989
Byrne, C. 1996
Silvera, S. A. 2005
Vatten, L. J. 1992
Knekt, P. 1996
Key, T. J. 1999
Galanis, D.J. 1998
15
20
25
30
35
40
BMI (kg/m2)

273
Body mass index and premenopausal breast cancer: dose-response

274
Body mass index and postmenopausal breast cancer: dose-response

275
Waist circumference and premenopausal breast cancer, unadjusted for BMI: dose-response
Kaaks, R. 1998
Tehard B. 2006
Huang, Z 1999
Palmer, J.R. 2007
60
70
80
90
100
waist circumference (cm)

276
Waist circumference and premenopausal breast cancer, adjusted for BMI: dose-response

277
Waist circumference and postmenopausal breast cancer, unadjusted for BMI: dose-response
Folsom, AR 1990
Krebs E.E. 2006
Kaaks, R. 1998
Huang, Z 1999
Palmer, J.R. 2007
60
70
80
90
100
waist circumference (cm)

278
Waist circumference and postmenopausal breast cancer, adjusted for BMI: dose-response
* # Subgroups were pooled by a fixed-effect model before including in the dose-response meta-analysis
Sellers, Thomas, A. 2002 No family history of BC#
Sellers, Thomas, A. 2002 With family history of BC#
Lahmann PH 2004 HRT non users*
Lahmann PH 2004 HRT users*
Huang, Z 1999
60
70
80
90
100
waist circumference (cm)
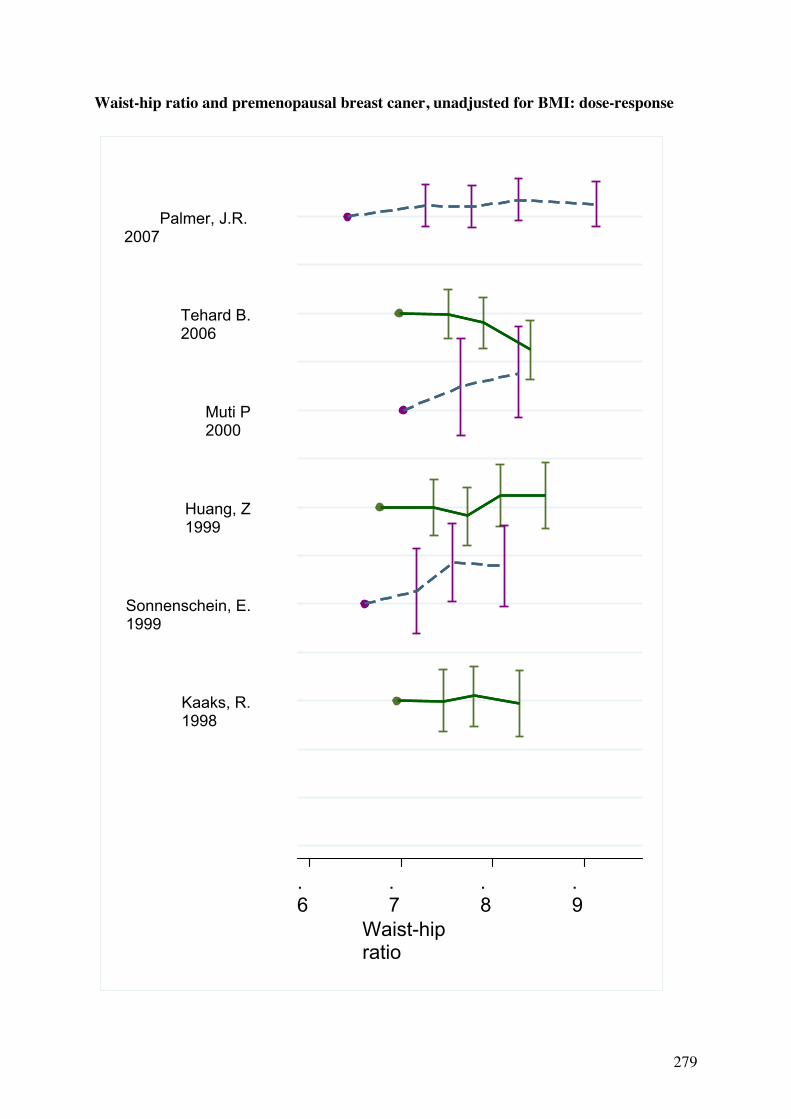
279
Waist-hip ratio and premenopausal breast caner, unadjusted for BMI: dose-response
Muti P 2000
Tehard B. 2006
Kaaks, R. 1998
Huang, Z 1999
Sonnenschein, E. 1999
Palmer, J.R. 2007
.6
.7
.8
.9
Waist-hip ratio

280
Waist-hip ratio and premenopausal breast cancer, adjusted for BMI: dose-response
Muti P 2000
Huang, Z 1999
Sonnenschein, E. 1999
.6
.65
.7
.75
.8
.85
Waist-hip ratio

281
Waist-hip ratio and postmenopausal breast cancer, unadjusted for BMI: dose-response
Muti P 2000
Krebs E.E. 2006
Lahmann, P. H. 2003
Gapstur, S. M. 1992
Tehard B. 2006
Kaaks, R. 1998
Huang, Z 1999
Sonnenschein, E. 1999
Palmer, J.R. 2007
.6
.7
.8
.9
1
Waist-hip ratio
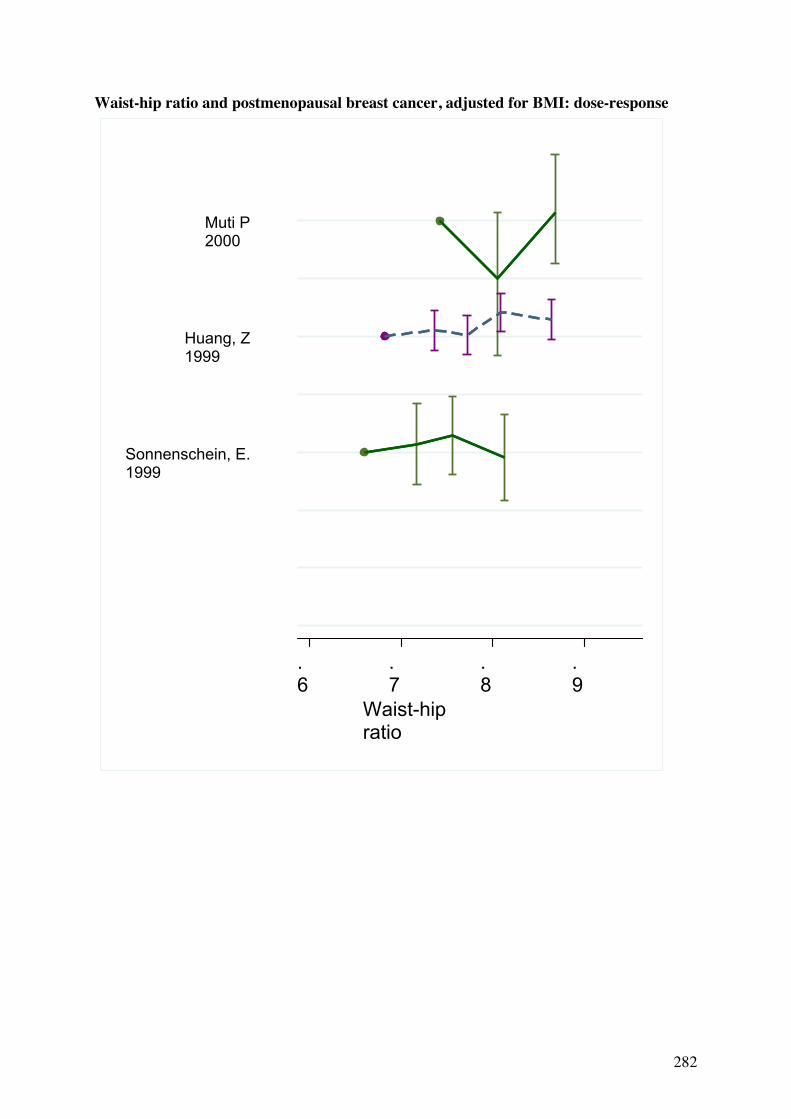
282
Waist-hip ratio and postmenopausal breast cancer, adjusted for BMI: dose-response
Muti P 2000
Huang, Z 1999
Sonnenschein, E. 1999
.6
.7
.8
.9
Waist-hip ratio

283
Height and premenopausal breast cancer: dose-response
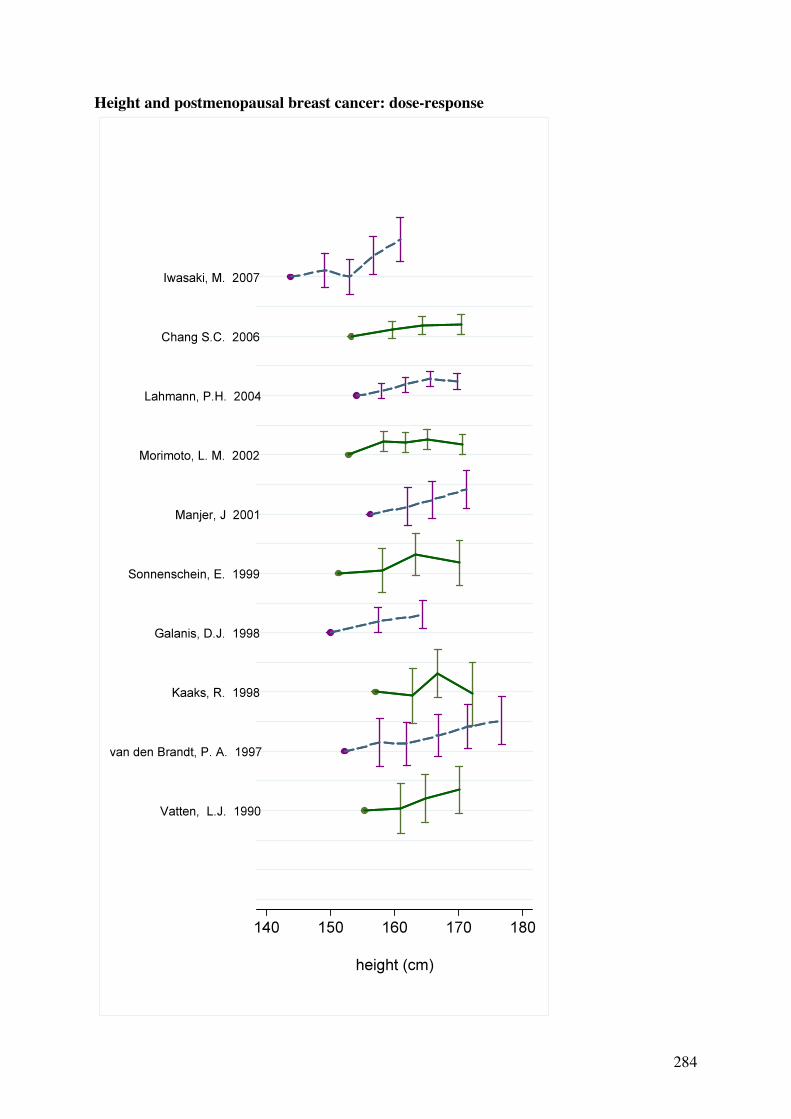
284
Height and postmenopausal breast cancer: dose-response

Model comparisonRandomised Control Trials - Best models
Author, Year, WCRFCode
Country, Ethnicity, Specialcharacteristics
Age Cases nCase
ascertainmentType of study
Non-Cases n
Lenght of follow-up, loss tofollow-up
Assessmentdetail
Additionaldetails
Exposure range Unit Outcome Subgroup Contrast Nocat. OR (95% CI) p
valuep
trend A B C D E F G
adjustments
1.4
Diet low in fat, high in fibre, fruits, and vegetables
Post-menopausal
Prentice, RL etal.,2006,BRE80155
United States, Multi-ethnic,Post menopausal
Women's Health Initiative(WHI) Dietary Modification
50 - 79 1303Self reportverified by
medical record
RandomisedControl Trial
48835
Intervention,dietary change,
decrease fatintake to 20% of
No interventionvs.
Intervention
Interventionvs.No
intervention
20.89
(0.8, 1.0)0.04 A G
Breast cancerER+
incidence
Prentice, RL etal.,2006,BRE80155
United States, Multi-ethnic,Post menopausal
Women's Health Initiative(WHI) Dietary Modification
50 - 79 1015Self reportverified by
medical record
RandomisedControl Trial
48835
Intervention,dietary change,
decrease fatintake to 20% of
No interventionvs.
Intervention
Interventionvs.No
intervention
20.97
(0.86, 1.1)0.64 A G
Breast cancerER+/PR+
incidence
Prentice, RL etal.,2006,BRE80155
United States, Multi-ethnic,Post menopausal
Women's Health Initiative(WHI) Dietary Modification
50 - 79 256Self reportverified by
medical record
RandomisedControl Trial
48835
Intervention,dietary change,
decrease fatintake to 20% of
No interventionvs.
Intervention
Interventionvs.No
intervention
20.64
(0.49, 0.84)0.001 A G
Breast cancerER+/PR-
incidence
Prentice, RL etal.,2006,BRE80155
United States, Multi-ethnic,Post menopausal
Women's Health Initiative(WHI) Dietary Modification
50 - 79 253Self reportverified by
medical record
RandomisedControl Trial
48835
Intervention,dietary change,
decrease fatintake to 20% of
No interventionvs.
Intervention
Interventionvs.No
intervention
20.89
(0.69, 1.14)0.36 A G
Breast cancerER-
incidence
Prentice, RL etal.,2006,BRE80155
United States, Multi-ethnic,Post menopausal
Women's Health Initiative(WHI) Dietary Modification
50 - 79 26Self reportverified by
medical record
RandomisedControl Trial
48835
Intervention,dietary change,
decrease fatintake to 20% of
No interventionvs.
Intervention
Interventionvs.No
intervention
20.67
(0.29, 1.54)0.34 A G
Breast cancerER-/PR+
incidence
Prentice, RL etal.,2006,BRE80155
United States, Multi-ethnic,Post menopausal
Women's Health Initiative(WHI) Dietary Modification
50 - 79 220Self reportverified by
medical record
RandomisedControl Trial
48835
Intervention,dietary change,
decrease fatintake to 20% of
No interventionvs.
Intervention
Interventionvs.No
intervention
20.89
(0.68, 1.17)0.41 A G
Breast cancerER-/PR-
incidence
Prentice, RL etal.,2006,BRE80155
United States, Multi-ethnic,Post menopausal
Women's Health Initiative(WHI) Dietary Modification
50 - 79 1041Self reportverified by
medical record
RandomisedControl Trial
48835
Intervention,dietary change,
decrease fatintake to 20% of
No interventionvs.
Intervention
Interventionvs.No
intervention
20.96
(0.85, 1.09)0.54 A G
Breast cancerPR+
incidence
Prentice, RL etal.,2006,BRE80155
United States, Multi-ethnic,Post menopausal
Women's Health Initiative(WHI) Dietary Modification
50 - 79 481Self reportverified by
medical record
RandomisedControl Trial
48835
Intervention,dietary change,
decrease fatintake to 20% of
No interventionvs.
Intervention
Interventionvs.No
intervention
20.76
(0.63, 0.92)0.004 A G
Breast cancerPR-
incidence
Prentice, RL etal.,2006,BRE80155
United States, Multi-ethnic,Post menopausal
Women's Health Initiative(WHI) Dietary Modification
50 - 79 202Self reportverified by
medical record
RandomisedControl Trial
48835
Intervention,dietary change,
decrease fatintake to 20% of
No interventionvs.
Intervention
Interventionvs.No
intervention
20.8
(0.6, 1.07)0.13 A G
Breast cancerT<0.5cm
incidence
Prentice, RL etal.,2006,BRE80155
United States, Multi-ethnic,Post menopausal
Women's Health Initiative(WHI) Dietary Modification
50 - 79 435Self reportverified by
medical record
RandomisedControl Trial
48835
Intervention,dietary change,
decrease fatintake to 20% of
No interventionvs.
Intervention
Interventionvs.No
intervention
20.84
(0.69, 1.02)0.07 A G
Breast cancerT=0.5-1cm
incidence
A : AgeB : SESC : Reproductive factors: parity, number of children, age at first birth,age at menarche, age at menopauseD : AnthropometryE : Energy intake, other dietary factorsF : OC, HRT, menopausal statusG : Others: family history, smoking status, country of birth, race, marital status, etc 1

Author, Year, WCRFCode
Country, Ethnicity, Specialcharacteristics
Age Cases nCase
ascertainmentType of study
Non-Cases n
Lenght of follow-up, loss tofollow-up
Assessmentdetail
Additionaldetails
Exposure range Unit Outcome Subgroup Contrast Nocat. OR (95% CI) p
valuep
trend A B C D E F G
adjustments
Prentice, RL etal.,2006,BRE80155
United States, Multi-ethnic,Post menopausal
Women's Health Initiative(WHI) Dietary Modification
50 - 79 622Self reportverified by
medical record
RandomisedControl Trial
48835
Intervention,dietary change,
decrease fatintake to 20% of
No interventionvs.
Intervention
Interventionvs.No
intervention
21.0
(0.85, 1.17)0.99 A G
Breast cancerT>1-2cm
incidence
Prentice, RL etal.,2006,BRE80155
United States, Multi-ethnic,Post menopausal
Women's Health Initiative(WHI) Dietary Modification
50 - 79 287Self reportverified by
medical record
RandomisedControl Trial
48835
Intervention,dietary change,
decrease fatintake to 20% of
No interventionvs.
Intervention
Interventionvs.No
intervention
20.76
(0.6, 0.98)0.03 A G
Breast cancerT>2-5cm
incidence
Prentice, RL etal.,2006,BRE80155
United States, Multi-ethnic,Post menopausal
Women's Health Initiative(WHI) Dietary Modification
50 - 79 38Self reportverified by
medical record
RandomisedControl Trial
48835
Intervention,dietary change,
decrease fatintake to 20% of
No interventionvs.
Intervention
Interventionvs.No
intervention
21.35
(0.71, 2.56)0.35 A G
Breast cancerT>5cm
incidence
Prentice, RL etal.,2006,BRE80155
United States, Multi-ethnic,Post menopausal
Women's Health Initiative(WHI) Dietary Modification
50 - 79 20Self reportverified by
medical record
RandomisedControl Trial
48835
Intervention,dietary change,
decrease fatintake to 20% of
No interventionvs.
Intervention
Interventionvs.No
intervention
21.0
(0.41, 2.44)0.99 A G
Distant breastcancer
incidence
Prentice, RL etal.,2006,BRE80155
United States, Multi-ethnic,Post menopausal
Women's Health Initiative(WHI) Dietary Modification
50 - 79 441Self reportverified by
medical record
RandomisedControl Trial
48835
Intervention,dietary change,
decrease fatintake to 20% of
No interventionvs.
Intervention
Interventionvs.No
intervention
21.01
(0.83, 1.22)0.93 A G
In situ breastcancer
incidence
Prentice, RL etal.,2006,BRE80155
United States, Multi-ethnic,Post menopausal
Women's Health Initiative(WHI) Dietary Modification
50 - 79 1727Self reportverified by
medical record
RandomisedControl Trial
48835
Intervention,dietary change,
decrease fatintake to 20% of
No interventionvs.
Intervention
Interventionvs.No
intervention
20.91
(0.83, 1.01)0.07 A G
Invasive breastcancer
incidence
Prentice, RL etal.,2006,BRE80155
United States, Multi-ethnic,Post menopausal
Women's Health Initiative(WHI) Dietary Modification
50 - 79 80Self reportverified by
medical record
RandomisedControl Trial
48835
Intervention,dietary change,
decrease fatintake to 20% of
No interventionvs.
Intervention
Interventionvs.No
intervention
20.77
(0.48, 1.22)0.26 A G
Invasive breastcancer
cancer mortality
Prentice, RL etal.,2006,BRE80155
United States, Multi-ethnic,Post menopausal
Women's Health Initiative(WHI) Dietary Modification
50 - 79 1264Self reportverified by
medical record
RandomisedControl Trial
48835
Intervention,dietary change,
decrease fatintake to 20% of
No interventionvs.
Intervention
Interventionvs.No
intervention
20.9
(0.8, 1.01)0.07 A G
Localized breastcancer
incidence
Prentice, RL etal.,2006,BRE80155
United States, Multi-ethnic,Post menopausal
Women's Health Initiative(WHI) Dietary Modification
50 - 79 391Self reportverified by
medical record
RandomisedControl Trial
48835
Intervention,dietary change,
decrease fatintake to 20% of
No interventionvs.
Intervention
Interventionvs.No
intervention
20.91
(0.74, 1.12)0.39 A G
Regional breastcancer
incidence

Results tableCohort studies - best models
Author, Year,WCRF Code
Country, Ethnicity, Specialcharacteristics
Age Cases n Caseascertainment
Type of studyNon-Cases n
Lenght offollow-up / loss
Assessmentdetail
Additional details Unit Outcome Subgroup Contrast Nocat. OR (95% CI) p
valueptrend A B C D E F G
adjustments
1.3.1
Vegetarianism
Pre-menopausal
Travis, R.C. etal.,2007,BRE80141
United KingdomEPIC Oxford
20 - 89 196National HealthRecords
FFQProspectiveCohort
36489.0 7.4 years / 0.07 Vegetarianism, selfreported
Invasive & In situ breastcancer Pre-
menopausal
Vegetarianvs.Nonvegetarian
20.95(0.68, 1.32)
A C D E F G
incidence
Post-menopausal
Travis, R.C. etal.,2007,BRE80141
United KingdomEPIC Oxford
20 - 89 290National HealthRecords
FFQProspectiveCohort
36489.0 7.4 years / 0.07 Vegetarianism, selfreported
Invasive & In situ breastcancer Post-
menopausal
Vegetarianvs.Nonvegetarian
20.79(0.54, 1.16)
A C D E F G
incidence
Menopausal status not specified
Mills, P.K.,1988,BRE17836
US, White, AdventistSeventh-day AdventistsCohort, 1960
30 - 85 59
Through socialorganization(profession,religion)
Questionnaire(nos)
Nested CaseControl
16190.020.0 years / 1.7% at birth
Breast cancer yesvs.no
21.63(0.79, 3.34)
B
mortality/incidence
Mills, P.K.,1988,BRE17836
US, White, AdventistSeventh-day AdventistsCohort, 1960
30 - 85 55
Through socialorganization(profession,religion)
Questionnaire(nos)
Nested CaseControl
16190.020.0 years / 1.7%
duration (years) ofexposure to vegetarianlifestyle
Years
Breast cancer >=40vs.0-19
42.36(0.65, 8.56)
0.11 C
mortality/incidence
Mills, P.K.,1989,BRE17837
USA, White, AdventistCalifornia Seventh-dayAdventists Cohort, 1976
25 - 99 226 By Mail FFQ (nos)ProspectiveCohort
102434 6.0 years / 1%Breast cancer
purevegetariansvs.omnivors
30.78(0.56, 1.07)
0.07 A B C D F G
incidence
Key,T.J.A.,1996,BRE15654
United Kingdom, Notspecified, Vegetarian andhealth conscious peopleUK Cohort of Vegetarians
16 - 79
From groupswith highvegetarianlikelihood
Questionnaire(nos)
ProspectiveCohort
6435.0 16.8 yearsBreast cancer
vegetarianvs.non-vegetarian
21.65(1.01, 2.7)
A G
cancer death
Travis, R.C. etal.,2007,BRE80141
United KingdomEPIC Oxford
20 - 89 585National HealthRecords
FFQProspectiveCohort
36489.0 7.4 years / 0.07 Vegetarianism, selfreported
Invasive & In situ breastcancer
Vegetarianvs.Nonvegetarian
20.91(0.72, 1.14)
A C D E F G
incidence
Travis, R.C. etal.,2007,BRE80141
United KingdomEPIC Oxford
20 - 89 433National HealthRecords
FFQProspectiveCohort
36489.0 7.4 years / 0.07 Vegetarianism, selfreported
Invasive & In situ breastcancer
HRT - No
Vegetarianvs.Nonvegetarian
20.89(0.7, 1.14)
A C D E F G
incidence
1.4
"Lowfat" habits
Menopausal status not specified
1

Author, Year,WCRF Code
Country, Ethnicity, Specialcharacteristics
Age Cases n Caseascertainment
Type of studyNon-Cases n
Lenght offollow-up / loss
Assessmentdetail
Additional details Unit Outcome Subgroup Contrast Nocat. OR (95% CI) p
valueptrend A B C D E F G
adjustments
Byrne,C.,1996,BRE05719
USA, Black and WhiteNHEFS, 1981/82
25 - 74 52 Unspecified FFQ (nos)ProspectiveCohort
23809 3.9 years / 252
number of "low-fat"habits ( low caloriesalad dressing, or noteating skin on poultry,
Breast cancer nonevs.2 or more
33.5(1.7, 7.4)
A
incidence
Animal product index
Menopausal status not specified
Mills, P.K.,1988,BRE17836
US, White, AdventistSeventh-day AdventistsCohort, 1960
30 - 85 142
Through socialorganization(profession,religion)
Questionnaire(nos)
Nested CaseControl
16190.020.0 years / 1.7%
animal productsconsumption index
Breast cancerpure-vegetarianvs.high
50.53(0.18, 1.52)
0.17 B C D
mortality/incidence
Canteen pattern
Menopausal status not specified
Sieri,S.,2004,BRE16671
Italy, WhiteORDET study, 1987
34 - 70 207Throughnetwork, paper,tv
FFQ-Quantitative
ProspectiveCohort
81634 9.5 years / 10Invasive breast cancer
Lean>1.0vs.>-1.0
30.72(0.4, 1.3)
0.291
A B C D E G
incidence
Sieri,S.,2004,BRE16671
Italy, WhiteORDET study, 1987
34 - 70 207Throughnetwork, paper,tv
FFQ-Quantitative
ProspectiveCohort
81634 9.5 years / 10Invasive breast cancer >1.0
vs.>-1.0
30.95(0.63, 1.45)
0.935
A B C D E F G
incidence
Sieri,S.,2004,BRE16671
Italy, WhiteORDET study, 1987
34 - 70 207Throughnetwork, paper,tv
FFQ-Quantitative
ProspectiveCohort
81634 9.5 years / 10Invasive breast cancer
Overweight>1.0vs.>-1.0
31.34(0.73, 2.45)
0.320
A B C D E G
incidence
Dietary guideline index score
Post-menopausal
Harnack,Lisa,2002,BRE19762
USA, Multi-ethnic, Post-menopausalIowa Women's Health Study
55 - 69 By MailFFQ-Semi-quantitative
ProspectiveCohort
34708.0 13.0 yearsBreast cancer 12.2 - 17.6
vs.2.1 - 8.3
50.76(0.65, 0.89)
<.01 A B C D E F G
incidence
FungT.T.,2006,BRE80107
United States, Post-menopausalNurses' Health Study (NHS)Cohort 1976-1996
30 - 55 3580 medical records FFQProspectiveCohort
121700.0 18.0 years Healthy Eating Index,HEI
Breast cancer Quantile 5vs.Quantile 1
51.04(0.92, 1.18)
0.68 A C D E F G
incidence
FungT.T.,2006,BRE80107
United States, Post-menopausalNurses' Health Study (NHS)Cohort 1976-1996
30 - 55 3580 medical records FFQProspectiveCohort
121700.0 18.0 years Althernative HealthyEating Index, AHEI
Breast cancer Quantile 5vs.Quantile 1
50.99(0.88, 1.11)
0.84 A C D E F G
incidence
FungT.T.,2006,BRE80107
United States, Post-menopausalNurses' Health Study (NHS)Cohort 1976-1996
30 - 55 3580 medical records FFQProspectiveCohort
121700.0 18.0 years Diet Quality Index-Revised, DQI-R
Breast cancer Quantile 5vs.Quantile 1
51.03(0.91, 1.16)
.83 A C D E F G
incidence
FungT.T.,2006,BRE80107
United States, Post-menopausalNurses' Health Study (NHS)Cohort 1976-1996
30 - 55 3580 medical records FFQProspectiveCohort
121700.0 18.0 years Recommended FoodScore, RFS
Breast cancer Quantile 5vs.Quantile 1
50.98(0.87, 1.11)
0.56 A C D E F G
incidence
2

Author, Year,WCRF Code
Country, Ethnicity, Specialcharacteristics
Age Cases n Caseascertainment
Type of studyNon-Cases n
Lenght offollow-up / loss
Assessmentdetail
Additional details Unit Outcome Subgroup Contrast Nocat. OR (95% CI) p
valueptrend A B C D E F G
adjustments
FungT.T.,2006,BRE80107
United States, Post-menopausalNurses' Health Study (NHS)Cohort 1976-1996
30 - 55 3580 medical records FFQProspectiveCohort
121700.0 18.0 yearsAlternateMediterranean DietScore, aMed
Breast cancer Quantile 5vs.Quantile 1
50.98(0.88, 1.1)
.69 A C D E F G
incidence
FungT.T.,2006,BRE80107
United States, Post-menopausalNurses' Health Study (NHS)Cohort 1976-1996
30 - 55 2367 medical records FFQProspectiveCohort
121700.0 18.0 years Healthy Eating Index,HEI
Breast cancer ER+ Quantile 5vs.Quantile 1
51.1(0.95, 1.28)
0.69 A C D E F G
incidence
FungT.T.,2006,BRE80107
United States, Post-menopausalNurses' Health Study (NHS)Cohort 1976-1996
30 - 55 2367 medical records FFQProspectiveCohort
121700.0 18.0 years Althernative HealthyEating Index, AHEI
Breast cancer ER+ Quantile 5vs.Quantile 1
51.05(0.91, 1.21)
0.19 A C D E F G
incidence
FungT.T.,2006,BRE80107
United States, Post-menopausalNurses' Health Study (NHS)Cohort 1976-1996
30 - 55 2367 medical records FFQProspectiveCohort
121700.0 18.0 years Diet Quality Index-Revised, DQIR
Breast cancer ER+ Quantile 5vs.Quantile 1
51.09(0.94, 1.27)
.55 A C D E F G
incidence
FungT.T.,2006,BRE80107
United States, Post-menopausalNurses' Health Study (NHS)Cohort 1976-1996
30 - 55 2367 medical records FFQProspectiveCohort
121700.0 18.0 years Recommended FoodScore, RFS
Breast cancer ER+ Quantile 5vs.Quantile 1
51.06(0.92, 1.23)
0.44 A C D E F G
incidence
FungT.T.,2006,BRE80107
United States, Post-menopausalNurses' Health Study (NHS)Cohort 1976-1996
30 - 55 2367 medical records FFQProspectiveCohort
121700.0 18.0 yearsAlternateMediterranean DietScore, aMed
Breast cancer ER+ Quantile 5vs.Quantile 1
51.12(0.97, 1.26)
0.04 A
incidence
FungT.T.,2006,BRE80107
United States, Post-menopausalNurses' Health Study (NHS)Cohort 1976-1996
30 - 55 2367 medical records FFQProspectiveCohort
121700.0 18.0 yearsAlternateMediterranean DietScore, aMed
Breast cancer ER+ Quantile 5vs.Quantile 1
51.05(0.91, 1.18)
0.23 A C D E F G
incidence
FungT.T.,2006,BRE80107
United States, Post-menopausalNurses' Health Study (NHS)Cohort 1976-1996
30 - 55 575 medical records FFQProspectiveCohort
121700.0 18.0 years Healthy Eating Index,HEI
Breast cancer ER- Quantile 5vs.Quantile 1
50.92(0.68, 1.24)
0.47 A C D E F G
incidence
FungT.T.,2006,BRE80107
United States, Post-menopausalNurses' Health Study (NHS)Cohort 1976-1996
30 - 55 575 medical records FFQProspectiveCohort
121700.0 18.0 years Althernative HealthyEating Index, AHEI
Breast cancer ER- Quantile 5vs.Quantile 1
50.78(0.59, 1.04)
0.01 A C D E F G
incidence
FungT.T.,2006,BRE80107
United States, Post-menopausalNurses' Health Study (NHS)Cohort 1976-1996
30 - 55 575 medical records FFQProspectiveCohort
121700.0 18.0 years Diet Quality Index-Revised, DQIR
Breast cancer ER- Quantile 5vs.Quantile 1
50.97(0.72, 1.31)
0.35 A C D E F G
incidence
FungT.T.,2006,BRE80107
United States, Post-menopausalNurses' Health Study (NHS)Cohort 1976-1996
30 - 55 575 medical records FFQProspectiveCohort
121700.0 18.0 years Recommended FoodScore, RFS
Breast cancer ER- Quantile 5vs.Quantile 1
50.69(0.51, 0.94)
0.003
A C D E F G
incidence
FungT.T.,2006,BRE80107
United States, Post-menopausalNurses' Health Study (NHS)Cohort 1976-1996
30 - 55 575 medical records FFQProspectiveCohort
121700.0 18.0 yearsAlternateMediterranean DietScore, aMed
Breast cancer ER- Quantile 5vs.Quantile 1
50.89(0.7, 1.14)
0.19 A
incidence
FungT.T.,2006,BRE80107
United States, Post-menopausalNurses' Health Study (NHS)Cohort 1976-1996
30 - 55 575 medical records FFQProspectiveCohort
121700.0 18.0 yearsAlternateMediterranean DietScore, aMed
Breast cancer ER- Quantile 5vs.Quantile 1
50.79(0.6, 1.03)
0.03 A C D E F G
incidence
3

Author, Year,WCRF Code
Country, Ethnicity, Specialcharacteristics
Age Cases n Caseascertainment
Type of studyNon-Cases n
Lenght offollow-up / loss
Assessmentdetail
Additional details Unit Outcome Subgroup Contrast Nocat. OR (95% CI) p
valueptrend A B C D E F G
adjustments
FungT.T.,2006,BRE80107
United States, Post-menopausalNurses' Health Study (NHS)Cohort 1976-1996
30 - 55 575 medical records FFQProspectiveCohort
121700.0 18.0 yearsVegetables score,component score ofAHEI
Breast cancer ER- 7.8 - 9.99vs.0 - 3.99
50.68(0.51, 0.91)
0.01 D E F G
incidence
FungT.T.,2006,BRE80107
United States, Post-menopausalNurses' Health Study (NHS)Cohort 1976-1996
30 - 55 575 medical records FFQProspectiveCohort
121700.0 18.0 years Fruit score, componentscore of AHEI
Breast cancer ER- 7.5 - 9.99vs.0 - 3.29
50.78(0.58, 1.04)
0.1 D E F G
incidence
FungT.T.,2006,BRE80107
United States, Post-menopausalNurses' Health Study (NHS)Cohort 1976-1996
30 - 55 575 medical records FFQProspectiveCohort
121700.0 18.0 yearsNuts and soy score,component score ofAHEI
Breast cancer ER- 4.6 - 9.99vs.0 - 0.83
50.79(0.6, 1.05)
0.09 D E F G
incidence
FungT.T.,2006,BRE80107
United States, Post-menopausalNurses' Health Study (NHS)Cohort 1976-1996
30 - 55 575 medical records FFQProspectiveCohort
121700.0 18.0 yearsCereal fiber score,component score ofAHEI
Breast cancer ER- 4.82 - 9.99vs.0 - 2.21
51.0(0.73, 1.35)
0.64 D E F G
incidence
FungT.T.,2006,BRE80107
United States, Post-menopausalNurses' Health Study (NHS)Cohort 1976-1996
30 - 55 575 medical records FFQProspectiveCohort
121700.0 18.0 yearsWhite vs dark meatratio score, componentscore of AHEI
Breast cancer ER- 6.07 - 9.99vs.0 - 1.83
50.86(0.65, 1.14)
0.26 D E F G
incidence
FungT.T.,2006,BRE80107
United States, Post-menopausalNurses' Health Study (NHS)Cohort 1976-1996
30 - 55 575 medical records FFQProspectiveCohort
121700.0 18.0 years
Polyunsaturated vssaturated fat ratioscore, componentscore of AHEI
Breast cancer ER- 6.26 - 9.99vs.0.35 - 3.96
50.75(0.58, 0.98)
0.02 D E F G
incidence
FungT.T.,2006,BRE80107
United States, Post-menopausalNurses' Health Study (NHS)Cohort 1976-1996
30 - 55 575 medical records FFQProspectiveCohort
121700.0 18.0 yearsTransfat score,component score ofAHEI
Breast cancer ER- 7.98 - 9.99vs.0 - 5.91
51.05(0.8, 1.39)
0.55 D E F G
incidence
FungT.T.,2006,BRE80107
United States, Post-menopausalNurses' Health Study (NHS)Cohort 1976-1996
30 - 55 575 medical records FFQProspectiveCohort
121700.0 18.0 years
Score for during ofmultivitamin use,component score ofAHEI
Breast cancer ER- 6.25 - 7.49vs.<3.49
41.23(0.94, 1.62)
0.17 D E F G
incidence
FungT.T.,2006,BRE80107
United States, Post-menopausalNurses' Health Study (NHS)Cohort 1976-1996
30 - 55 575 medical records FFQProspectiveCohort
121700.0 18.0 years
Alcohol score,component score ofAHEI, 10 points areawarded for intake
Breast cancer ER- 7.08 - 9.99vs.0
51.03(0.81, 1.31)
0.55 D E F G
incidence
FungT.T.,2006,BRE80107
United States, Post-menopausalNurses' Health Study (NHS)Cohort 1976-1996
30 - 55 575 medical records FFQProspectiveCohort
121700.0 18.0 years
Monounsaturated vssaturated fat intakeratio score, componentof Alternate
Breast cancer ER- Quantile 5vs.Quantile 1
50.79(0.63, 0.99)
0.04 D E F G
incidence
Menopausal status not specified
Mai, V.,2005,BRE23275U.S.A.BCDDP, 1973
(61) By Telephone FFQ (nos)ProspectiveCohort
37135.0 9.5 yearsBreast cancer Quantile 4
vs.Quantile 1
41.43(0.81, 2.53)
0.17 C D E G
cancer death
Mai, V.,2005,BRE23275U.S.A.BCDDP, 1973
(61) By Telephone FFQ (nos)ProspectiveCohort
37135.0 9.5 yearsBreast cancer Quantile 4
vs.Quantile 1
41.05(0.9, 1.23)
0.81 C D E G
incidence
Dietary guideline index score (excluding PA &
4

Author, Year,WCRF Code
Country, Ethnicity, Specialcharacteristics
Age Cases n Caseascertainment
Type of studyNon-Cases n
Lenght offollow-up / loss
Assessmentdetail
Additional details Unit Outcome Subgroup Contrast Nocat. OR (95% CI) p
valueptrend A B C D E F G
adjustments
Post-menopausal
Harnack,Lisa,2002,BRE19762
USA, Multi-ethnic, Post-menopausalIowa Women's Health Study
55 - 69 By MailFFQ-Semi-quantitative
ProspectiveCohort
34708.0 13.0 yearsBreast cancer 12.2 - 17.6
vs.2.1 - 8.3
50.86(0.73, 1.0)
.15 A B C D E F G
incidence
Drinker pattern
Pre-menopausal
Terry,P.,2001,BRE12203
Sweden, Not specified,Screening ProgramThe Swedish MammographyCohort, 1987
40 - 76
Through healthorg. (screening,healthinsurance)
FFQ (nos)ProspectiveCohort
61463.0 9.6 yearsBreast cancer
Pre-menopausal
>1.0vs.>-1.0
51.12(0.79, 1.58)
0.35 A B C D E F
incidence
Post-menopausal
Terry,P.,2001,BRE12203
Sweden, Not specified,Screening ProgramThe Swedish MammographyCohort, 1987
40 - 76
Through healthorg. (screening,healthinsurance)
FFQ (nos)ProspectiveCohort
61463.0 9.6 yearsBreast cancer
Post-menopausal
>1.0vs.>-1.0
51.31(1.05, 1.63)
0.002
A B C D E F
incidence
Menopausal status not specified
Terry,P.,2001,BRE12203
Sweden, Not specified,Screening ProgramThe Swedish MammographyCohort, 1987
40 - 76
Through healthorg. (screening,healthinsurance)
FFQ (nos)ProspectiveCohort
61463.0 9.6 yearsBreast cancer >1.0
vs.>-1.0
51.27(1.06, 1.52)
0.002
A B C D E F
incidence
Eating fat on beef or pork
Menopausal status not specified
Byrne,C.,1996,BRE05719
USA, Black and WhiteNHEFS, 1981/82
25 - 74 44 Unspecified FFQ (nos)ProspectiveCohort
22935 3.9 years / 252 dichotomous
Breast cancerregularvs.lea n orextra lean
22.2(1.2, 4.0)
A
incidence
Byrne,C.,1996,BRE05719
USA, Black and WhiteNHEFS, 1981/82
25 - 74 50 Unspecified FFQ (nos)ProspectiveCohort
23500 3.9 years / 252 dichotomous
Breast cancer yesvs.no
21.0(0.5, 2.1)
A
incidence
Eating skin on poultry
Menopausal status not specified
Byrne,C.,1996,BRE05719
USA, Black and WhiteNHEFS, 1981/82
25 - 74 50 Unspecified FFQ (nos)ProspectiveCohort
23471 3.9 years / 252 dichotomous
Breast cancer yesvs.no
21.7(0.9, 2.9)
A
incidence
Flavonol rich foods
Menopausal status not specified
Adebamowo, C.A.,2005,BRE21537
USA, Not specified,Registered nursesNurses' Health Study (NHS)Cohort 1976-1996
25 - 46 710
Through socialorganization(profession,religion)
FFQ-Semi-quantitative
ProspectiveCohort
706652 8.0 years serving/day
Invasive breast cancer 3.99vs.0.57
50.94(0.72, 1.22)
0.54 A C D E F G
incidence
5

Author, Year,WCRF Code
Country, Ethnicity, Specialcharacteristics
Age Cases n Caseascertainment
Type of studyNon-Cases n
Lenght offollow-up / loss
Assessmentdetail
Additional details Unit Outcome Subgroup Contrast Nocat. OR (95% CI) p
valueptrend A B C D E F G
adjustments
Healthy pattern
Pre-menopausal
Terry,P.,2001,BRE12203
Sweden, Not specified,Screening ProgramThe Swedish MammographyCohort, 1987
40 - 76
Through healthorg. (screening,healthinsurance)
FFQ (nos)ProspectiveCohort
61463.0 9.6 yearsBreast cancer
Pre-menopausal
>1.0vs.>-1.0
50.91(0.63, 1.31)
0.68 A B C D E F
incidence
Post-menopausal
Terry,P.,2001,BRE12203
Sweden, Not specified,Screening ProgramThe Swedish MammographyCohort, 1987
40 - 76
Through healthorg. (screening,healthinsurance)
FFQ (nos)ProspectiveCohort
61463.0 9.6 yearsBreast cancer
Post-menopausal
>1.0vs.>-1.0
50.91(0.72, 1.16)
0.52 A B C D E F
incidence
Velie, E.M.,2005,BRE24436
U.S.A., Not specified, Post-menopausalBCDDP, 1973
1868
Through healthorg. (screening,healthinsurance)
FFQ (nos)ProspectiveCohort
40559.0 8.0 yearsBreast cancer
Post-menopausal
Quantile 5vs.Quantile 1
51.03(0.88, 1.2)
0.95 A B C D E F G
incidence
Velie, E.M.,2005,BRE24436
U.S.A., Not specified, Post-menopausalBCDDP, 1973
1365
Through healthorg. (screening,healthinsurance)
FFQ (nos)ProspectiveCohort
40559.0 8.0 yearsInvasive breast cancer
Post-menopausal
Quantile 5vs.Quantile 1
51.04(0.87, 1.26)
0.77 B C D E F G
incidence
Menopausal status not specified
Terry,P.,2001,BRE12203
Sweden, Not specified,Screening ProgramThe Swedish MammographyCohort, 1987
40 - 76
Through healthorg. (screening,healthinsurance)
FFQ (nos)ProspectiveCohort
61463.0 9.6 yearsBreast cancer >1.0
vs.>-1.0
50.92(0.76, 1.13)
0.52 A B C D E F
incidence
Individual level dietary patterns
Post-menopausal
Wilfart, E etal.,2005,BRE11111
Sweden, Post menopausalMalmo Diet and Cancer,1991
50 - (59) 237 Cancer registry7-day Record +Questionnaire
Nested CaseControl
673 Past food habit change
Breast cancerPost-menopausal
yesvs.no
21.28(0.92, 1.79)
incidence
Menopausal status not specified
Sant etal.,2007,BRE80036
ItalyORDET study, 1987-2001
34 - 70 40 Cancer registry FFQ (nos)ProspectiveCohort
8623 11.5 years
Salad vegetablesscore, greastest factorloadings on rawvegetables and olive oil
Breast cancer HER-2 + Quantile 3vs.Quantile 1
30.25(0.1, 0.64)
0.001
A B C D E F G
incidence
Sant etal.,2007,BRE80036
ItalyORDET study, 1987-2001
34 - 70 40 Cancer registry FFQ (nos)ProspectiveCohort
8623 11.5 years
Western diet score,greastest factorloadings on potatoesravioli red and
Breast cancer HER-2 + Quantile 3vs.Quantile 1
30.75(0.27, 2.08)
0.584
A B C D E F G
incidence
Sant etal.,2007,BRE80036
ItalyORDET study, 1987-2001
34 - 70 40 Cancer registry FFQ (nos)ProspectiveCohort
8623 11.5 years
Canteen diet score,greasting factor loadingon pasta tomato sauceolive oil wine
Breast cancer HER-2 + Quantile 3vs.Quantile 1
31.39(0.5, 3.84)
0.530
A B C D E F G
incidence
Sant etal.,2007,BRE80036
ItalyORDET study, 1987-2001
34 - 70 40 Cancer registry FFQ (nos)ProspectiveCohort
8623 11.5 years
Prudent diet score,greasting factor loadingon cooked vegetablesrice poultry fish low
Breast cancer HER-2 + Quantile 3vs.Quantile 1
30.72(0.35, 1.48)
0.372
A B C D E F G
incidence
6

Author, Year,WCRF Code
Country, Ethnicity, Specialcharacteristics
Age Cases n Caseascertainment
Type of studyNon-Cases n
Lenght offollow-up / loss
Assessmentdetail
Additional details Unit Outcome Subgroup Contrast Nocat. OR (95% CI) p
valueptrend A B C D E F G
adjustments
Sant etal.,2007,BRE80036
ItalyORDET study, 1987-2001
34 - 70 198 Cancer registry FFQ (nos)ProspectiveCohort
8623 11.5 years
Salad vegetablesscore, greastest factorloadings on rawvegetables and olive oil
Breast cancer HER-2 - Quantile 3vs.Quantile 1
30.71(0.48, 1.03)
0.072
A B C D E F G
incidence
Sant etal.,2007,BRE80036
ItalyORDET study, 1987-2001
34 - 70 198 Cancer registry FFQ (nos)ProspectiveCohort
8623 11.5 years
Western diet score,greastest factorloadings on potatoesravioli red and
Breast cancer HER-2 - Quantile 3vs.Quantile 1
30.88(0.55, 1.4)
0.651
A B C D E F G
incidence
Sant etal.,2007,BRE80036
ItalyORDET study, 1987-2001
34 - 70 198 Cancer registry FFQ (nos)ProspectiveCohort
8623 11.5 years
Canteen diet score,greasting factor loadingon pasta tomato sauceolive oil wine
Breast cancer HER-2 - Quantile 3vs.Quantile 1
31.14(0.75, 1.75)
0.520
A B C D E F G
incidence
Sant etal.,2007,BRE80036
ItalyORDET study, 1987-2001
34 - 70 198 Cancer registry FFQ (nos)ProspectiveCohort
8623 11.5 years
Prudent diet score,greasting factor loadingon cooked vegetablesrice poultry fish low
Breast cancer HER-2 - Quantile 3vs.Quantile 1
31.36(0.93, 1.98)
0.126
A B C D E F G
incidence
Prudent diet
Pre-menopausal
Adebamowo, C.A.,2005,BRE21538
U.S.A., Registered nursesNHS II, 1989
26 - 46 710 By MailFFQ-Semi-quantitative
ProspectiveCohort
707338 9.0 yearsInvasive breast cancer
Pre-menopausal
>1.0vs.>-1.0
50.9(0.68, 1.18)
0.36 C D E F G
incidence
Post-menopausal
Velie, E.M.,2005,BRE24436
U.S.A., Not specified, Post-menopausalBCDDP, 1973
1239
Through healthorg. (screening,healthinsurance)
FFQ (nos)ProspectiveCohort
40559.0 8.0 yearsBreast cancer Family
History BC -No & Post-menopausal
Quantile 5vs.Quantile 1
50.83(0.68, 1.01)
0.05 B C D E F G
incidence
Velie, E.M.,2005,BRE24436
U.S.A., Not specified, Post-menopausalBCDDP, 1973
559
Through healthorg. (screening,healthinsurance)
FFQ (nos)ProspectiveCohort
40559.0 8.0 yearsBreast cancer Family
History BC -Yes & Post-menopausal
Quantile 5vs.Quantile 1
51.17(0.87, 1.58)
0.19 B C D E F G
incidence
Fung, T.T.,2005,BRE22370
U.S.A., Registered nursesNurses' Health Study (NHS)Cohort 1984
30 - 55 3026 By Mail FFQ (nos)ProspectiveCohort
71058.0 16.0 yearsBreast cancer
Post-menopausal
>1.0vs.>-1.0
50.97(0.86, 1.11)
0.43 A C D E F G
incidence
Velie, E.M.,2005,BRE24436
U.S.A., Not specified, Post-menopausalBCDDP, 1973
1768
Through healthorg. (screening,healthinsurance)
FFQ (nos)ProspectiveCohort
40559.0 8.0 yearsBreast cancer
Post-menopausal
Quantile 5vs.Quantile 1
50.79(0.68, 0.91)
0.001
B C D E F G
incidence
Velie, E.M.,2005,BRE24436
U.S.A., Not specified, Post-menopausalBCDDP, 1973
1024
Through healthorg. (screening,healthinsurance)
FFQ (nos)ProspectiveCohort
40559.0 8.0 yearsBreast cancer Post-
menopausal& Lean
Quantile 5vs.Quantile 1
50.79(0.63, 0.99)
0.02 B C D E F G
incidence
Velie, E.M.,2005,BRE24436
U.S.A., Not specified, Post-menopausalBCDDP, 1973
214
Through healthorg. (screening,healthinsurance)
FFQ (nos)ProspectiveCohort
40559.0 8.0 yearsBreast cancer Post-
menopausal&Overweight
Quantile 5vs.Quantile 1
51.59(0.97, 2.6)
0.19 B C D E F G
incidence
7

Author, Year,WCRF Code
Country, Ethnicity, Specialcharacteristics
Age Cases n Caseascertainment
Type of studyNon-Cases n
Lenght offollow-up / loss
Assessmentdetail
Additional details Unit Outcome Subgroup Contrast Nocat. OR (95% CI) p
valueptrend A B C D E F G
adjustments
Fung, T.T.,2005,BRE22370
U.S.A., Registered nursesNurses' Health Study (NHS)Cohort 1984
30 - 55 1728 By Mail FFQ (nos)ProspectiveCohort
71058.0 16.0 yearsBreast cancer ER+
Post-menopausal
>1.0vs.>-1.0
51.1(0.93, 1.31)
0.77 A C D E F G
incidence
Velie, E.M.,2005,BRE24436
U.S.A., Not specified, Post-menopausalBCDDP, 1973
850
Through healthorg. (screening,healthinsurance)
FFQ (nos)ProspectiveCohort
40559.0 8.0 yearsBreast cancer ER+
Post-menopausal
Quantile 5vs.Quantile 1
50.75(0.59, 0.96)
0.01 B C D E F G
incidence
Velie, E.M.,2005,BRE24436
U.S.A., Not specified, Post-menopausalBCDDP, 1973
679
Through healthorg. (screening,healthinsurance)
FFQ (nos)ProspectiveCohort
40559.0 8.0 yearsBreast cancer ER+/PR+
Post-menopausal
Quantile 5vs.Quantile 1
50.7(0.53, 0.91)
0.01 B C D E F G
incidence
Velie, E.M.,2005,BRE24436
U.S.A., Not specified, Post-menopausalBCDDP, 1973
146
Through healthorg. (screening,healthinsurance)
FFQ (nos)ProspectiveCohort
40559.0 8.0 yearsBreast cancer ER+/PR-
Post-menopausal
Quantile 5vs.Quantile 1
50.99(0.56, 1.73)
0.55 B C D E F G
incidence
Fung, T.T.,2005,BRE22370
U.S.A., Registered nursesNurses' Health Study (NHS)Cohort 1984
30 - 55 446 By Mail FFQ (nos)ProspectiveCohort
71058.0 16.0 yearsBreast cancer ER-
Post-menopausal
>1.0vs.>-1.0
50.62(0.45, 0.88)
0.006
A C D E F G
incidence
Velie, E.M.,2005,BRE24436
U.S.A., Not specified, Post-menopausalBCDDP, 1973
186
Through healthorg. (screening,healthinsurance)
FFQ (nos)ProspectiveCohort
40559.0 8.0 yearsBreast cancer ER-
Post-menopausal
Quantile 5vs.Quantile 1
51.03(0.63, 1.68)
0.41 B C D E F G
incidence
Velie, E.M.,2005,BRE24436
U.S.A., Not specified, Post-menopausalBCDDP, 1973
35
Through healthorg. (screening,healthinsurance)
FFQ (nos)ProspectiveCohort
40559.0 8.0 yearsBreast cancer ER-/PR+
Post-menopausal
Quantile 5vs.Quantile 1
50.46(0.11, 1.86)
0.33 B C D E F G
incidence
Velie, E.M.,2005,BRE24436
U.S.A., Not specified, Post-menopausalBCDDP, 1973
146
Through healthorg. (screening,healthinsurance)
FFQ (nos)ProspectiveCohort
40559.0 8.0 yearsBreast cancer ER-/PR-
Post-menopausal
Quantile 5vs.Quantile 1
50.82(0.45, 1.49)
0.53 B C D E F G
incidence
Velie, E.M.,2005,BRE24436
U.S.A., Not specified, Post-menopausalBCDDP, 1973
715
Through healthorg. (screening,healthinsurance)
FFQ (nos)ProspectiveCohort
40559.0 8.0 yearsBreast cancer PR+
Post-menopausal
Quantile 5vs.Quantile 1
50.69(0.53, 0.89)
0.003
B C D E F G
incidence
Velie, E.M.,2005,BRE24436
U.S.A., Not specified, Post-menopausalBCDDP, 1973
294
Through healthorg. (screening,healthinsurance)
FFQ (nos)ProspectiveCohort
40559.0 8.0 yearsBreast cancer PR-
Post-menopausal
Quantile 5vs.Quantile 1
50.91(0.6, 1.36)
0.36 B C D E F G
incidence
Velie, E.M.,2005,BRE24436
U.S.A., Not specified, Post-menopausalBCDDP, 1973
1365
Through healthorg. (screening,healthinsurance)
FFQ (nos)ProspectiveCohort
40559.0 8.0 yearsInvasive breast cancer
Post-menopausal
Quantile 5vs.Quantile 1
50.78(0.65, 0.95)
0.003
B C D E F G
incidence
Menopausal status not specified
Sieri,S.,2004,BRE16671
Italy, WhiteORDET study, 1987
34 - 70 207Throughnetwork, paper,tv
FFQ-Quantitative
ProspectiveCohort
81634 9.5 years / 10Invasive breast cancer
Lean>1.0vs.>-1.0
31.24(0.76, 2.03)
0.374
A B C D E G
incidence
8

Author, Year,WCRF Code
Country, Ethnicity, Specialcharacteristics
Age Cases n Caseascertainment
Type of studyNon-Cases n
Lenght offollow-up / loss
Assessmentdetail
Additional details Unit Outcome Subgroup Contrast Nocat. OR (95% CI) p
valueptrend A B C D E F G
adjustments
Sieri,S.,2004,BRE16671
Italy, WhiteORDET study, 1987
34 - 70 207Throughnetwork, paper,tv
FFQ-Quantitative
ProspectiveCohort
81634 9.5 years / 10Invasive breast cancer >1.0
vs.>-1.0
31.28(0.9, 1.83)
0.169
A B C D E F G
incidence
Sieri,S.,2004,BRE16671
Italy, WhiteORDET study, 1987
34 - 70 207Throughnetwork, paper,tv
FFQ-Quantitative
ProspectiveCohort
81634 9.5 years / 10Invasive breast cancer
Overweight>1.0vs.>-1.0
31.33(0.8, 2.19)
0.282
A B C D E G
incidence
Salad vegetables pattern
Menopausal status not specified
Sieri,S.,2004,BRE16671
Italy, WhiteORDET study, 1987
34 - 70 207Throughnetwork, paper,tv
FFQ-Quantitative
ProspectiveCohort
81634 9.5 years / 10Invasive breast cancer
Lean>1.0vs.>-1.0
30.39(0.22, 0.69)
0.001
A B C D E G
incidence
Sieri,S.,2004,BRE16671
Italy, WhiteORDET study, 1987
34 - 70 207Throughnetwork, paper,tv
FFQ-Quantitative
ProspectiveCohort
81634 9.5 years / 10Invasive breast cancer >1.0
vs.>-1.0
30.66(0.47, 0.95)
0.016
A B C D E F G
incidence
Sieri,S.,2004,BRE16671
Italy, WhiteORDET study, 1987
34 - 70 207Throughnetwork, paper,tv
FFQ-Quantitative
ProspectiveCohort
81634 9.5 years / 10Invasive breast cancer
Overweight>1.0vs.>-1.0
30.99(0.6, 1.61)
0.977
A B C D E G
incidence
Type of salad dressing
Menopausal status not specified
Byrne,C.,1996,BRE05719
USA, Black and WhiteNHEFS, 1981/82
25 - 74 46 Unspecified FFQ (nos)ProspectiveCohort
21514 3.9 years / 252Breast cancer
other typescombinationvs.low-fat only
21.3(0.7, 2.3)
A
incidence
Western pattern
Pre-menopausal
Terry,P.,2001,BRE12203
Sweden, Not specified,Screening ProgramThe Swedish MammographyCohort, 1987
40 - 76
Through healthorg. (screening,healthinsurance)
FFQ (nos)ProspectiveCohort
61463.0 9.6 yearsBreast cancer
Pre-menopausal
>1.0vs.>-1.0
51.08(0.7, 1.67)
0.95 A B C D E F
incidence
Adebamowo, C.A.,2005,BRE21538
U.S.A., Registered nursesNHS II, 1989
26 - 46 710 By MailFFQ-Semi-quantitative
ProspectiveCohort
707337 9.0 yearsInvasive breast cancer
Pre-menopausal
>1.0vs.>-1.0
50.97(0.71, 1.33)
0.97 C D E F G
incidence
Post-menopausal
Terry,P.,2001,BRE12203
Sweden, Not specified,Screening ProgramThe Swedish MammographyCohort, 1987
40 - 76
Through healthorg. (screening,healthinsurance)
FFQ (nos)ProspectiveCohort
61463.0 9.6 yearsBreast cancer
Post-menopausal
>1.0vs.>-1.0
50.98(0.74, 1.28)
0.89 A B C D E F
incidence
Fung, T.T.,2005,BRE22370
U.S.A., Registered nursesNurses' Health Study (NHS)Cohort 1984
30 - 55 3026 By Mail FFQ (nos)ProspectiveCohort
71058.0 16.0 yearsBreast cancer
Post-menopausal
>1.0vs.>-1.0
50.97(0.83, 1.14)
0.88 A C D E F G
incidence
9
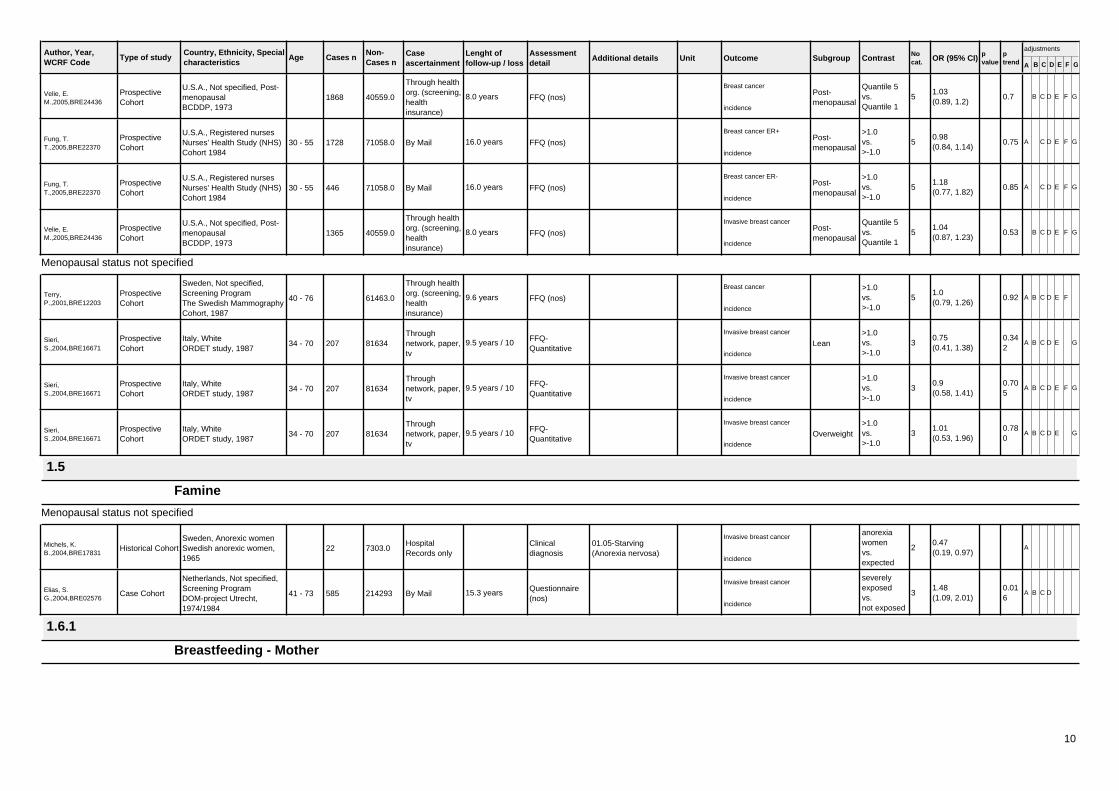
Author, Year,WCRF Code
Country, Ethnicity, Specialcharacteristics
Age Cases n Caseascertainment
Type of studyNon-Cases n
Lenght offollow-up / loss
Assessmentdetail
Additional details Unit Outcome Subgroup Contrast Nocat. OR (95% CI) p
valueptrend A B C D E F G
adjustments
Velie, E.M.,2005,BRE24436
U.S.A., Not specified, Post-menopausalBCDDP, 1973
1868
Through healthorg. (screening,healthinsurance)
FFQ (nos)ProspectiveCohort
40559.0 8.0 yearsBreast cancer
Post-menopausal
Quantile 5vs.Quantile 1
51.03(0.89, 1.2)
0.7 B C D E F G
incidence
Fung, T.T.,2005,BRE22370
U.S.A., Registered nursesNurses' Health Study (NHS)Cohort 1984
30 - 55 1728 By Mail FFQ (nos)ProspectiveCohort
71058.0 16.0 yearsBreast cancer ER+
Post-menopausal
>1.0vs.>-1.0
50.98(0.84, 1.14)
0.75 A C D E F G
incidence
Fung, T.T.,2005,BRE22370
U.S.A., Registered nursesNurses' Health Study (NHS)Cohort 1984
30 - 55 446 By Mail FFQ (nos)ProspectiveCohort
71058.0 16.0 yearsBreast cancer ER-
Post-menopausal
>1.0vs.>-1.0
51.18(0.77, 1.82)
0.85 A C D E F G
incidence
Velie, E.M.,2005,BRE24436
U.S.A., Not specified, Post-menopausalBCDDP, 1973
1365
Through healthorg. (screening,healthinsurance)
FFQ (nos)ProspectiveCohort
40559.0 8.0 yearsInvasive breast cancer
Post-menopausal
Quantile 5vs.Quantile 1
51.04(0.87, 1.23)
0.53 B C D E F G
incidence
Menopausal status not specified
Terry,P.,2001,BRE12203
Sweden, Not specified,Screening ProgramThe Swedish MammographyCohort, 1987
40 - 76
Through healthorg. (screening,healthinsurance)
FFQ (nos)ProspectiveCohort
61463.0 9.6 yearsBreast cancer >1.0
vs.>-1.0
51.0(0.79, 1.26)
0.92 A B C D E F
incidence
Sieri,S.,2004,BRE16671
Italy, WhiteORDET study, 1987
34 - 70 207Throughnetwork, paper,tv
FFQ-Quantitative
ProspectiveCohort
81634 9.5 years / 10Invasive breast cancer
Lean>1.0vs.>-1.0
30.75(0.41, 1.38)
0.342
A B C D E G
incidence
Sieri,S.,2004,BRE16671
Italy, WhiteORDET study, 1987
34 - 70 207Throughnetwork, paper,tv
FFQ-Quantitative
ProspectiveCohort
81634 9.5 years / 10Invasive breast cancer >1.0
vs.>-1.0
30.9(0.58, 1.41)
0.705
A B C D E F G
incidence
Sieri,S.,2004,BRE16671
Italy, WhiteORDET study, 1987
34 - 70 207Throughnetwork, paper,tv
FFQ-Quantitative
ProspectiveCohort
81634 9.5 years / 10Invasive breast cancer
Overweight>1.0vs.>-1.0
31.01(0.53, 1.96)
0.780
A B C D E G
incidence
1.5
Famine
Menopausal status not specified
Michels, K.B.,2004,BRE17831
Sweden, Anorexic womenSwedish anorexic women,1965
22HospitalRecords only
Clinicaldiagnosis
Historical Cohort 7303.001.05-Starving(Anorexia nervosa)
Invasive breast canceranorexiawomenvs.expected
20.47(0.19, 0.97)
A
incidence
Elias, S.G.,2004,BRE02576
Netherlands, Not specified,Screening ProgramDOM-project Utrecht,1974/1984
41 - 73 585 By MailQuestionnaire(nos)
Case Cohort 214293 15.3 yearsInvasive breast cancer
severelyexposedvs.not exposed
31.48(1.09, 2.01)
0.016
A B C D
incidence
1.6.1
Breastfeeding - Mother
10
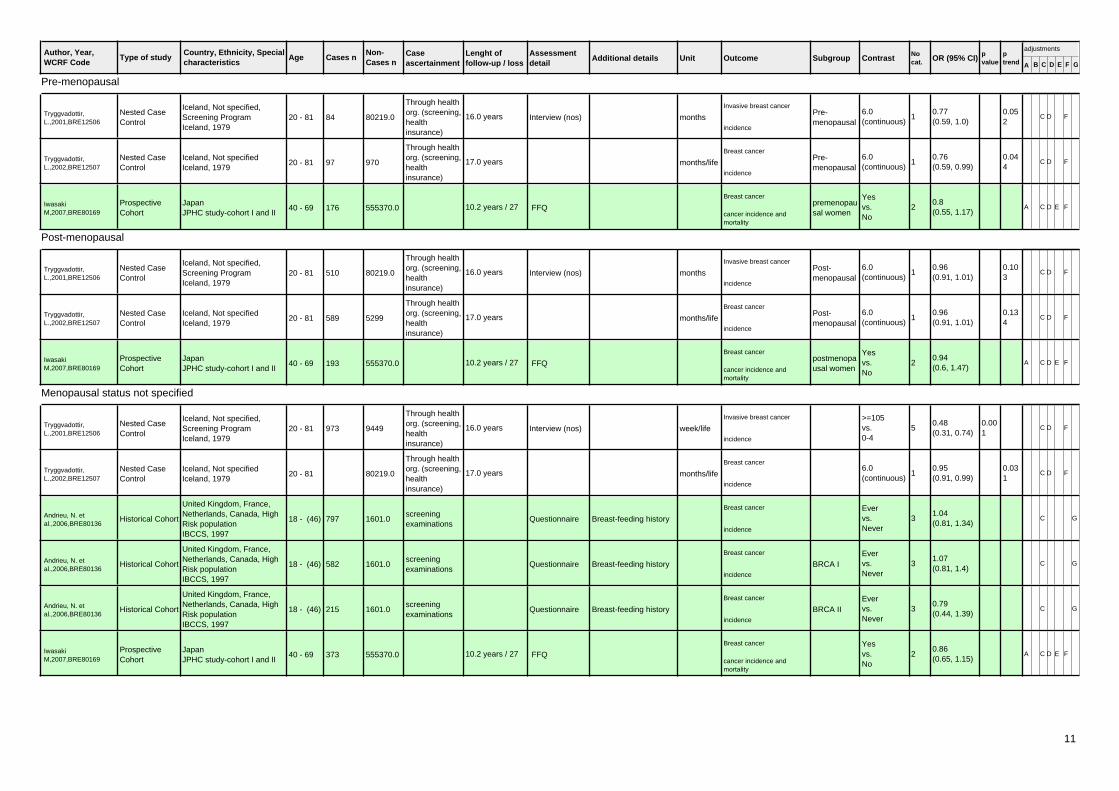
Author, Year,WCRF Code
Country, Ethnicity, Specialcharacteristics
Age Cases n Caseascertainment
Type of studyNon-Cases n
Lenght offollow-up / loss
Assessmentdetail
Additional details Unit Outcome Subgroup Contrast Nocat. OR (95% CI) p
valueptrend A B C D E F G
adjustments
Pre-menopausal
Tryggvadottir,L.,2001,BRE12506
Iceland, Not specified,Screening ProgramIceland, 1979
20 - 81 84
Through healthorg. (screening,healthinsurance)
Interview (nos)Nested CaseControl
80219.0 16.0 years months
Invasive breast cancerPre-menopausal
6.0(continuous)
10.77(0.59, 1.0)
0.052
C D F
incidence
Tryggvadottir,L.,2002,BRE12507
Iceland, Not specifiedIceland, 1979
20 - 81 97
Through healthorg. (screening,healthinsurance)
Nested CaseControl
970 17.0 years months/life
Breast cancerPre-menopausal
6.0(continuous)
10.76(0.59, 0.99)
0.044
C D F
incidence
IwasakiM,2007,BRE80169
JapanJPHC study-cohort I and II
40 - 69 176 FFQProspectiveCohort
555370.0 10.2 years / 27Breast cancer
premenopausal women
Yesvs.No
20.8(0.55, 1.17)
A C D E Fcancer incidence andmortality
Post-menopausal
Tryggvadottir,L.,2001,BRE12506
Iceland, Not specified,Screening ProgramIceland, 1979
20 - 81 510
Through healthorg. (screening,healthinsurance)
Interview (nos)Nested CaseControl
80219.0 16.0 years months
Invasive breast cancerPost-menopausal
6.0(continuous)
10.96(0.91, 1.01)
0.103
C D F
incidence
Tryggvadottir,L.,2002,BRE12507
Iceland, Not specifiedIceland, 1979
20 - 81 589
Through healthorg. (screening,healthinsurance)
Nested CaseControl
5299 17.0 years months/life
Breast cancerPost-menopausal
6.0(continuous)
10.96(0.91, 1.01)
0.134
C D F
incidence
IwasakiM,2007,BRE80169
JapanJPHC study-cohort I and II
40 - 69 193 FFQProspectiveCohort
555370.0 10.2 years / 27Breast cancer
postmenopausal women
Yesvs.No
20.94(0.6, 1.47)
A C D E Fcancer incidence andmortality
Menopausal status not specified
Tryggvadottir,L.,2001,BRE12506
Iceland, Not specified,Screening ProgramIceland, 1979
20 - 81 973
Through healthorg. (screening,healthinsurance)
Interview (nos)Nested CaseControl
9449 16.0 years week/life
Invasive breast cancer >=105vs.0-4
50.48(0.31, 0.74)
0.001
C D F
incidence
Tryggvadottir,L.,2002,BRE12507
Iceland, Not specifiedIceland, 1979
20 - 81
Through healthorg. (screening,healthinsurance)
Nested CaseControl
80219.0 17.0 years months/life
Breast cancer6.0(continuous)
10.95(0.91, 0.99)
0.031
C D F
incidence
Andrieu, N. etal.,2006,BRE80136
United Kingdom, France,Netherlands, Canada, HighRisk populationIBCCS, 1997
18 - (46) 797screeningexaminations
QuestionnaireHistorical Cohort 1601.0 Breast-feeding history
Breast cancer Evervs.Never
31.04(0.81, 1.34)
C G
incidence
Andrieu, N. etal.,2006,BRE80136
United Kingdom, France,Netherlands, Canada, HighRisk populationIBCCS, 1997
18 - (46) 582screeningexaminations
QuestionnaireHistorical Cohort 1601.0 Breast-feeding history
Breast cancer
BRCA IEvervs.Never
31.07(0.81, 1.4)
C G
incidence
Andrieu, N. etal.,2006,BRE80136
United Kingdom, France,Netherlands, Canada, HighRisk populationIBCCS, 1997
18 - (46) 215screeningexaminations
QuestionnaireHistorical Cohort 1601.0 Breast-feeding history
Breast cancer
BRCA IIEvervs.Never
30.79(0.44, 1.39)
C G
incidence
IwasakiM,2007,BRE80169
JapanJPHC study-cohort I and II
40 - 69 373 FFQProspectiveCohort
555370.0 10.2 years / 27Breast cancer Yes
vs.No
20.86(0.65, 1.15)
A C D E Fcancer incidence andmortality
11

Author, Year,WCRF Code
Country, Ethnicity, Specialcharacteristics
Age Cases n Caseascertainment
Type of studyNon-Cases n
Lenght offollow-up / loss
Assessmentdetail
Additional details Unit Outcome Subgroup Contrast Nocat. OR (95% CI) p
valueptrend A B C D E F G
adjustments
Duration of breastfeeding for each child
Menopausal status not specified
Kvale,G.,1988,BRE17728
Norway, Not specified,Screening ProgramNorway, 1956
27 - 69
Through healthorg. (screening,healthinsurance)
Questionnaire(nos)
ProspectiveCohort
48607.0 20.0 years months/child
Breast cancer2.0(continuous)
11.01(0.98, 1.05)
0.49 A C G
incidence
Total duration of breastfeeding
Pre-menopausal
London,S.J.,1990,BRE15914
USA, Not specified,Registered nursesNurses' Health Study (NHS)Cohort 1976-1996
30 - 55 624 By MailQuestionnaire(nos)
ProspectiveCohort
424071 11.0 years months/life
Breast cancerPre-menopausal
>=24vs.neverlactated
51.06(0.75, 1.5)
0.59 A C F G
incidence
Michels K.B,1996,BRE17829
usa, Registered nursesNurses' Health Study (NHS)Cohort 1976-1996
256
Through socialorganization(profession,religion)
FFQ (nos)ProspectiveCohort
127482 6.0 years months/life
Invasive breast cancerPre-menopausal
>23vs.never
60.9(0.53, 1.54)
0.98 A C D E F G
incidence
Lee, S.Y.,2003,BRE17745
Korea, Asian, Pre-menopausalKorean Women's Cohort(KWC), 1994/1995
20 - (35) 360
Through healthorg. (screening,healthinsurance)
ProspectiveCohort
582352 6.0 years months
Breast cancerPre-menopausal
>24vs.Never
40.6(0.3, 1.0)
0.001
A C D F G
incidence
Post-menopausal
London,S.J.,1990,BRE15914
USA, Not specified,Registered nursesNurses' Health Study (NHS)Cohort 1976-1996
30 - 55 511 By MailQuestionnaire(nos)
ProspectiveCohort
285687 11.0 years months/life
Breast cancerPost-menopausal
>=24vs.neverlactated
50.87(0.55, 1.39)
0.55 A C F G
incidence
Michels K.B,1996,BRE17829
usa, Registered nursesNurses' Health Study (NHS)Cohort 1976-1996
1189
Through socialorganization(profession,religion)
FFQ (nos)ProspectiveCohort
374779 6.0 years months/life
Invasive breast cancerPost-menopausal
>23vs.never
61.21(0.96, 1.54)
0.49 A C D E F G
incidence
Wilfart, E etal.,2005,BRE11111
Sweden, Post menopausalMalmo Diet and Cancer,1991
50 - (59) 237 Cancer registry7-day Record +Questionnaire
Nested CaseControl
673Months of total sum ofbreastfeeding
months
Breast cancerPost-menopausal
7+vs.Nil
30.72(0.5, 1.05)
incidence
Menopausal status not specified
Kvale,G.,1988,BRE17728
Norway, Not specified,Screening ProgramNorway, 1956
27 - 69
Through healthorg. (screening,healthinsurance)
Questionnaire(nos)
ProspectiveCohort
48607.0 20.0 years months/life
Breast cancer6.0(continuous)
10.96(0.93, 0.99)
0.01 A G
incidence
London,S.J.,1990,BRE15914
USA, Not specified,Registered nursesNurses' Health Study (NHS)Cohort 1976-1996
30 - 55 1262 By MailQuestionnaire(nos)
ProspectiveCohort
785958 11.0 years months/life
Breast cancer>=24vs.neverlactated
50.95(0.73, 1.23)
0.20 A C F G
incidence
Michels K.B,1996,BRE17829
usa, Registered nursesNurses' Health Study (NHS)Cohort 1976-1996
1459
Through socialorganization(profession,religion)
FFQ (nos)ProspectiveCohort
513015 6.0 years months/life
Invasive breast cancer >23vs.never
61.11(0.9, 1.38)
.65 A C D E F G
incidence
12
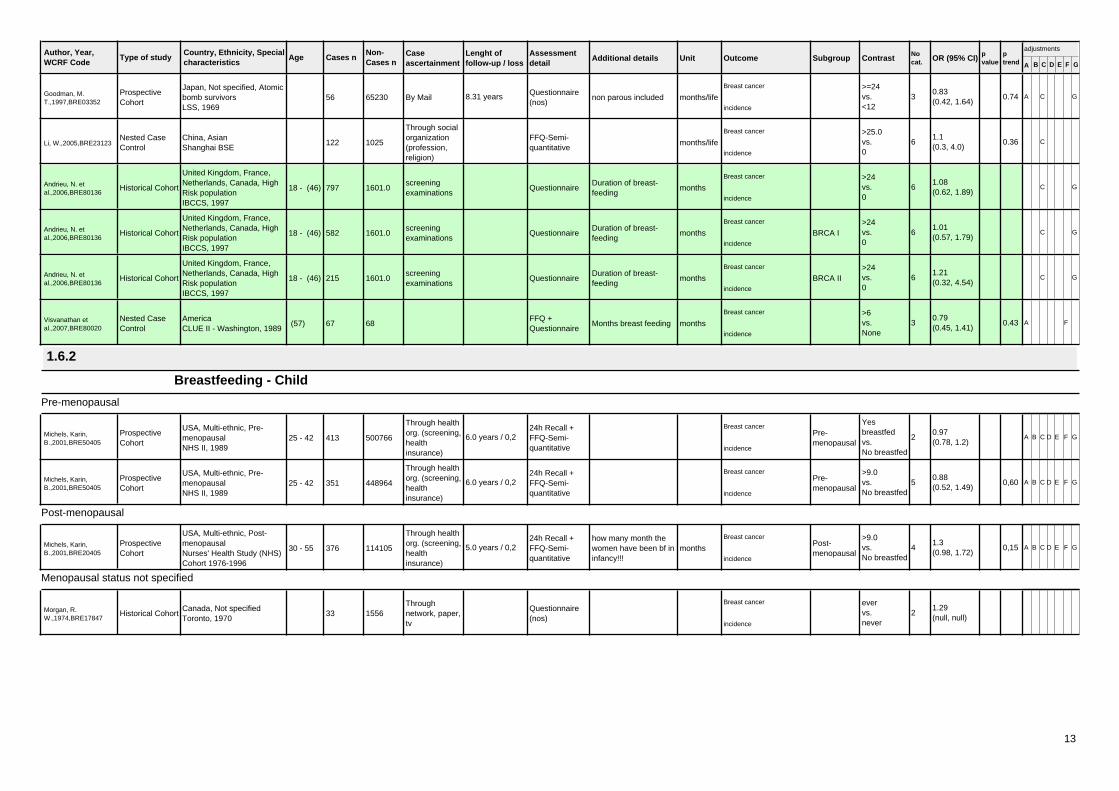
Author, Year,WCRF Code
Country, Ethnicity, Specialcharacteristics
Age Cases n Caseascertainment
Type of studyNon-Cases n
Lenght offollow-up / loss
Assessmentdetail
Additional details Unit Outcome Subgroup Contrast Nocat. OR (95% CI) p
valueptrend A B C D E F G
adjustments
Goodman, M.T.,1997,BRE03352
Japan, Not specified, Atomicbomb survivorsLSS, 1969
56 By MailQuestionnaire(nos)
ProspectiveCohort
65230 8.31 years non parous included months/life
Breast cancer >=24vs.<12
30.83(0.42, 1.64)
0.74 A C G
incidence
Li, W.,2005,BRE23123China, AsianShanghai BSE
122
Through socialorganization(profession,religion)
FFQ-Semi-quantitative
Nested CaseControl
1025 months/life
Breast cancer >25.0vs.0
61.1(0.3, 4.0)
0.36 C
incidence
Andrieu, N. etal.,2006,BRE80136
United Kingdom, France,Netherlands, Canada, HighRisk populationIBCCS, 1997
18 - (46) 797screeningexaminations
QuestionnaireHistorical Cohort 1601.0Duration of breast-feeding
months
Breast cancer >24vs.0
61.08(0.62, 1.89)
C G
incidence
Andrieu, N. etal.,2006,BRE80136
United Kingdom, France,Netherlands, Canada, HighRisk populationIBCCS, 1997
18 - (46) 582screeningexaminations
QuestionnaireHistorical Cohort 1601.0Duration of breast-feeding
months
Breast cancer
BRCA I>24vs.0
61.01(0.57, 1.79)
C G
incidence
Andrieu, N. etal.,2006,BRE80136
United Kingdom, France,Netherlands, Canada, HighRisk populationIBCCS, 1997
18 - (46) 215screeningexaminations
QuestionnaireHistorical Cohort 1601.0Duration of breast-feeding
months
Breast cancer
BRCA II>24vs.0
61.21(0.32, 4.54)
C G
incidence
Visvanathan etal.,2007,BRE80020
AmericaCLUE II - Washington, 1989
(57) 67FFQ +Questionnaire
Nested CaseControl
68 Months breast feeding months
Breast cancer >6vs.None
30.79(0.45, 1.41)
0.43 A F
incidence
1.6.2
Breastfeeding - Child
Pre-menopausal
Michels, Karin,B.,2001,BRE50405
USA, Multi-ethnic, Pre-menopausalNHS II, 1989
25 - 42 413
Through healthorg. (screening,healthinsurance)
24h Recall +FFQ-Semi-quantitative
ProspectiveCohort
500766 6.0 years / 0,2Breast cancer
Pre-menopausal
Yesbreastfedvs.No breastfed
20.97(0.78, 1.2)
A B C D E F G
incidence
Michels, Karin,B.,2001,BRE50405
USA, Multi-ethnic, Pre-menopausalNHS II, 1989
25 - 42 351
Through healthorg. (screening,healthinsurance)
24h Recall +FFQ-Semi-quantitative
ProspectiveCohort
448964 6.0 years / 0,2Breast cancer
Pre-menopausal
>9.0vs.No breastfed
50.88(0.52, 1.49)
0,60 A B C D E F G
incidence
Post-menopausal
Michels, Karin,B.,2001,BRE20405
USA, Multi-ethnic, Post-menopausalNurses' Health Study (NHS)Cohort 1976-1996
30 - 55 376
Through healthorg. (screening,healthinsurance)
24h Recall +FFQ-Semi-quantitative
ProspectiveCohort
114105 5.0 years / 0,2how many month thewomen have been bf ininfancy!!!
months
Breast cancerPost-menopausal
>9.0vs.No breastfed
41.3(0.98, 1.72)
0,15 A B C D E F G
incidence
Menopausal status not specified
Morgan, R.W.,1974,BRE17847
Canada, Not specifiedToronto, 1970
33Throughnetwork, paper,tv
Questionnaire(nos)
Historical Cohort 1556
Breast cancer evervs.never
21.29(null, null)
incidence
13

Author, Year,WCRF Code
Country, Ethnicity, Specialcharacteristics
Age Cases n Caseascertainment
Type of studyNon-Cases n
Lenght offollow-up / loss
Assessmentdetail
Additional details Unit Outcome Subgroup Contrast Nocat. OR (95% CI) p
valueptrend A B C D E F G
adjustments
EkbomA.,1993,BRE14930
Sweden, Not specifiedUpsala birth cohort
HospitalRecords only
Questionnaire(nos)
Nested CaseControl
2463.0 32.0 yearsBreast cancer
breastfeeding-novs.breast
20.97(0.44, 2.17)
0,95 A
incidence
Michels, Karin,B.,2001,BRE60405
USA, Multi-ethnic, Nurses'MothersNMS
389School healthrecords
24h Recall +FFQ-Semi-quantitative
Nested CaseControl
1501 answered by mother
Breast cancer >9.0vs.No breastfed
51.5(1.03, 2.18)
0,11 C D E F G
incidence
2.1.1
Cereals (grains)
Menopausal status not specified
Shannon,J.,2003,BRE18714
China, Not specifiedBreast Self-Exam (BSE),unknown
Through healthorg. (screening,healthinsurance)
FFQ (nos)Nested CaseControl
null excluded corn and ricefood groupintake/caloric intake
Breast cancerHighestquartilevs.Lowest
21.72(1.05, 2.82)
0.03 A C E G
incidence
Wholemeal bread
Post-menopausal
Giles, G.G.,2006,BRE22430
Australia, Post-menopausalMCCS, 1990
40 - 69 Unspecified FFQ (nos)ProspectiveCohort
12273.0 9.1 years times/week
Breast cancerPost-menopausal
1.0(continuous)
11.0(0.98, 1.02)
A E F G
incidence
Giles, G.G.,2006,BRE22430
Australia, Post-menopausalMCCS, 1990
40 - 69 Unspecified FFQ (nos)ProspectiveCohort
12273.0 9.1 years times/week
Breast cancer ER+/PR+Post-menopausal
1.0(continuous)
11.01(0.99, 1.04)
A E F G
incidence
Giles, G.G.,2006,BRE22430
Australia, Post-menopausalMCCS, 1990
40 - 69 Unspecified FFQ (nos)ProspectiveCohort
12273.0 9.1 years times/week
Breast cancer ER+/PR-Post-menopausal
1.0(continuous)
11.02(0.97, 1.07)
A E F G
incidence
Giles, G.G.,2006,BRE22430
Australia, Post-menopausalMCCS, 1990
40 - 69 Unspecified FFQ (nos)ProspectiveCohort
12273.0 9.1 years times/week
Breast cancer ER-/PR-Post-menopausal
1.0(continuous)
10.98(0.94, 1.03)
A E F G
incidence
2.1.1.0.3
Bread
Pre-menopausal
FrazierL.A.,2004,BRE02942
USA, Multi-ethnic,Registered nursesNurses' Health study II
34 - 51 361
Through healthorg. (screening,healthinsurance)
FFQ (nos)Historical Cohort 47517 9.0 years adolescent dietserving/day
Breast cancerPre-menopausal
3.9vs.0.6
51.4(0.96, 2.04)
0.01 A C D E F G
incidence
Post-menopausal
14

Author, Year,WCRF Code
Country, Ethnicity, Specialcharacteristics
Age Cases n Caseascertainment
Type of studyNon-Cases n
Lenght offollow-up / loss
Assessmentdetail
Additional details Unit Outcome Subgroup Contrast Nocat. OR (95% CI) p
valueptrend A B C D E F G
adjustments
Giles, G.G.,2006,BRE22430
Australia, Post-menopausalMCCS, 1990
40 - 69 Unspecified FFQ (nos)ProspectiveCohort
12273.0 9.1 years times/week
Breast cancerPost-menopausal
1.0(continuous)
11.01(0.99, 1.03)
A E F G
incidence
Giles, G.G.,2006,BRE22430
Australia, Post-menopausalMCCS, 1990
40 - 69 Unspecified FFQ (nos)ProspectiveCohort
12273.0 9.1 years times/week
Breast cancer ER+/PR+Post-menopausal
1.0(continuous)
11.01(0.99, 1.04)
A E F G
incidence
Giles, G.G.,2006,BRE22430
Australia, Post-menopausalMCCS, 1990
40 - 69 Unspecified FFQ (nos)ProspectiveCohort
12273.0 9.1 years times/week
Breast cancer ER+/PR-Post-menopausal
1.0(continuous)
11.01(0.97, 1.06)
A E F G
incidence
Giles, G.G.,2006,BRE22430
Australia, Post-menopausalMCCS, 1990
40 - 69 Unspecified FFQ (nos)ProspectiveCohort
12273.0 9.1 years times/week
Breast cancer ER-/PR-Post-menopausal
1.0(continuous)
10.98(0.94, 1.02)
A E F G
incidence
Menopausal status not specified
Rohan, T.E.,1993,BRE17965
Canada, Not specified,Screening ProgramCanadian National BreastScreening Study
40 - 59 518
Through healthorg. (screening,healthinsurance)
Dietary Historyquestionnaire
Nested CaseControl
1182 6.0 years g/day
Breast cancer >101.1vs.<38.0
50.95(0.68, 1.33)
0.471
A B C E F G
incidence
Key, T.J.,1999,BRE04758
Japan, Not specifiedLSS, 1969
427 By MailQuestionnaire(nos)
ProspectiveCohort
488988 24.0 years times/day
Breast cancer >=3vs.<=1
41.66(0.44, 6.16)
0.709
A G
incidence
FrazierL.A.,2003,BRE02941
USA, Multi-ethnic,Registered nursesNurses' Health Study (NHS)Cohort 1976-1996
40 - 65
Through healthorg. (screening,healthinsurance)
FFQ (nos)Nested CaseControl
121700.0 10.0 years adolescentserving/day
Breast cancer1.0(continuous)
10.98(0.92, 1.04)
A C D E F G
incidence
2.1.1.0.4
Cereal products
Post-menopausal
Giles, G.G.,2006,BRE22430
Australia, Post-menopausalMCCS, 1990
40 - 69 Unspecified FFQ (nos)ProspectiveCohort
12273.0 9.1 years times/week
Breast cancerPost-menopausal
1.0(continuous)
11.01(1.0, 1.02)
A E F G
incidence
Giles, G.G.,2006,BRE22430
Australia, Post-menopausalMCCS, 1990
40 - 69 Unspecified FFQ (nos)ProspectiveCohort
12273.0 9.1 years times/week
Breast cancer ER+/PR+Post-menopausal
1.0(continuous)
11.01(1.0, 1.02)
A E F G
incidence
Giles, G.G.,2006,BRE22430
Australia, Post-menopausalMCCS, 1990
40 - 69 Unspecified FFQ (nos)ProspectiveCohort
12273.0 9.1 years times/week
Breast cancer ER+/PR-Post-menopausal
1.0(continuous)
11.01(0.98, 1.04)
A E F G
incidence
Giles, G.G.,2006,BRE22430
Australia, Post-menopausalMCCS, 1990
40 - 69 Unspecified FFQ (nos)ProspectiveCohort
12273.0 9.1 years times/week
Breast cancer ER-/PR-Post-menopausal
1.0(continuous)
11.0(0.98, 1.03)
A E F G
incidence
15

Author, Year,WCRF Code
Country, Ethnicity, Specialcharacteristics
Age Cases n Caseascertainment
Type of studyNon-Cases n
Lenght offollow-up / loss
Assessmentdetail
Additional details Unit Outcome Subgroup Contrast Nocat. OR (95% CI) p
valueptrend A B C D E F G
adjustments
Menopausal status not specified
Rohan, T.E.,1993,BRE17965
Canada, Not specified,Screening ProgramCanadian National BreastScreening Study
40 - 59 518
Through healthorg. (screening,healthinsurance)
Dietary Historyquestionnaire
Nested CaseControl
1182 6.0 years g/day
Breast cancer >23.1vs.<0.0
50.74(0.53, 1.04)
0.014
A B C E F G
incidence
Cold cereals (breakfast)
Post-menopausal
Stolzenberg-Solomon,R.Z.,2006,BRE80113
United States, Post-menopausalPLCO Cancer ScreeningTrial cohort, 1993
55 - 74 98Cancerscreeningprogramme
FFQ (nos)ProspectiveCohort
31411.0 4.94 years 25% RDA fortifiedcereals
g/day
Breast cancernon-vitaminsusers
>0.95vs.<0.01
41.15(0.64, 2.07)
0.52 A B E F
incidence
Stolzenberg-Solomon,R.Z.,2006,BRE80113
United States, Post-menopausalPLCO Cancer ScreeningTrial cohort, 1993
55 - 74 91Cancerscreeningprogramme
FFQ (nos)ProspectiveCohort
31411.0 4.94 years 100% RDA fortifiedcereals
g/day
Breast cancernon-vitaminsusers
>0.65vs.0
41.69(0.92, 3.1)
0.03 A B E F
incidence
Giles, G.G.,2006,BRE22430
Australia, Post-menopausalMCCS, 1990
40 - 69 Unspecified FFQ (nos)ProspectiveCohort
12273.0 9.1 years times/week
Breast cancerPost-menopausal
1.0(continuous)
11.01(0.97, 1.05)
A E F G
incidence
Giles, G.G.,2006,BRE22430
Australia, Post-menopausalMCCS, 1990
40 - 69 Unspecified FFQ (nos)ProspectiveCohort
12273.0 9.1 years times/week
Breast cancer ER+/PR+Post-menopausal
1.0(continuous)
11.03(0.97, 1.09)
A E F G
incidence
Giles, G.G.,2006,BRE22430
Australia, Post-menopausalMCCS, 1990
40 - 69 Unspecified FFQ (nos)ProspectiveCohort
12273.0 9.1 years times/week
Breast cancer ER+/PR-Post-menopausal
1.0(continuous)
10.97(0.87, 1.08)
A E F G
incidence
Giles, G.G.,2006,BRE22430
Australia, Post-menopausalMCCS, 1990
40 - 69 Unspecified FFQ (nos)ProspectiveCohort
12273.0 9.1 years times/week
Breast cancer ER-/PR-Post-menopausal
1.0(continuous)
10.97(0.88, 1.06)
A E F G
incidence
Menopausal status not specified
FrazierL.A.,2003,BRE02941
USA, Multi-ethnic,Registered nursesNurses' Health Study (NHS)Cohort 1976-1996
40 - 65
Through healthorg. (screening,healthinsurance)
FFQ (nos)Nested CaseControl
121700.0 10.0 years adolescent Cups/day
Breast cancer1.0(continuous)
10.99(0.83, 1.19)
A C D E F G
incidence
2.1.1.1
Refined cereals and cereal products
Post-menopausal
Nicodemus,K.K.,2001,BRE16206
USA, Not specified, Post-menopausalIowa Women's Health Study
55 - 69 977 By Mail FFQ (nos)ProspectiveCohort
273843 9.0 years serving/week
Breast cancerPost-menopausal
13.0 - 78.0vs.0 - 2.5
51.06(0.84, 1.3)
0.80 A B C D E F G
incidence
Fung, T.T.,2005,BRE22370
U.S.A., Registered nursesNurses' Health Study (NHS)Cohort 1984
30 - 55 By Mail FFQ (nos)ProspectiveCohort
71058.0 16.0 years serving
Breast cancer ER-Post-menopausal
1.0(continuous)
11.07(0.99, 1.17)
0.09 A C D E F G
incidence
16

Author, Year,WCRF Code
Country, Ethnicity, Specialcharacteristics
Age Cases n Caseascertainment
Type of studyNon-Cases n
Lenght offollow-up / loss
Assessmentdetail
Additional details Unit Outcome Subgroup Contrast Nocat. OR (95% CI) p
valueptrend A B C D E F G
adjustments
2.1.1.1.3
Pasta
Post-menopausal
Giles, G.G.,2006,BRE22430
Australia, Post-menopausalMCCS, 1990
40 - 69 Unspecified FFQ (nos)ProspectiveCohort
12273.0 9.1 years times/week
Breast cancerPost-menopausal
1.0(continuous)
11.03(0.92, 1.15)
A E F G
incidence
Giles, G.G.,2006,BRE22430
Australia, Post-menopausalMCCS, 1990
40 - 69 Unspecified FFQ (nos)ProspectiveCohort
12273.0 9.1 years times/week
Breast cancer ER+/PR+Post-menopausal
1.0(continuous)
11.14(0.98, 1.32)
A E F G
incidence
Giles, G.G.,2006,BRE22430
Australia, Post-menopausalMCCS, 1990
40 - 69 Unspecified FFQ (nos)ProspectiveCohort
12273.0 9.1 years times/week
Breast cancer ER+/PR-Post-menopausal
1.0(continuous)
10.71(0.48, 1.03)
A E F G
incidence
Giles, G.G.,2006,BRE22430
Australia, Post-menopausalMCCS, 1990
40 - 69 Unspecified FFQ (nos)ProspectiveCohort
12273.0 9.1 years times/week
Breast cancer ER-/PR-Post-menopausal
1.0(continuous)
11.03(0.8, 1.34)
A E F G
incidence
Menopausal status not specified
Rohan, T.E.,1993,BRE17965
Canada, Not specified,Screening ProgramCanadian National BreastScreening Study
40 - 59 518
Through healthorg. (screening,healthinsurance)
Dietary Historyquestionnaire
Nested CaseControl
1182 6.0 years g/day
Breast cancer >49.1vs.<12.0
50.75(0.53, 1.04)
0.125
A B C E F G
incidence
Wholegrain cereals and cereal products
Post-menopausal
Nicodemus,K.K.,2001,BRE16206
USA, Not specified, Post-menopausalIowa Women's Health Study
55 - 69 977 By Mail FFQ (nos)ProspectiveCohort
273842 9.0 years serving/week
Breast cancerPost-menopausal
19.0 - 108.5vs.0 - 3.5
51.21(0.96, 1.5)
0.02 A B C D E F G
incidence
Fung, T.T.,2005,BRE22370
U.S.A., Registered nursesNurses' Health Study (NHS)Cohort 1984
30 - 55 By Mail FFQ (nos)ProspectiveCohort
71058.0 16.0 years serving
Breast cancer ER-Post-menopausal
1.0(continuous)
10.99(0.91, 1.07)
0.77 A C D E F G
incidence
Menopausal status not specified
Key,T.J.A.,1996,BRE15654
United Kingdom, Notspecified, Vegetarian andhealth conscious peopleUK Cohort of Vegetarians
16 - 79
From groupswith highvegetarianlikelihood
Questionnaire(nos)
ProspectiveCohort
6435.0 16.8 years wholemeal bread
Breast cancerdailyconsumptionvs.less than
21.08(0.64, 1.81)
A G
cancer death
2.1.1.1.4
Bran cereal
Menopausal status not specified
17

Author, Year,WCRF Code
Country, Ethnicity, Specialcharacteristics
Age Cases n Caseascertainment
Type of studyNon-Cases n
Lenght offollow-up / loss
Assessmentdetail
Additional details Unit Outcome Subgroup Contrast Nocat. OR (95% CI) p
valueptrend A B C D E F G
adjustments
Key,T.J.A.,1996,BRE15654
United Kingdom, Notspecified, Vegetarian andhealth conscious peopleUK Cohort of Vegetarians
16 - 79
From groupswith highvegetarianlikelihood
Questionnaire(nos)
ProspectiveCohort
6435.0 16.8 yearsBreast cancer
dailyconsumptionvs.less than
20.67(0.37, 1.24)
A G
cancer death
2.1.1.2.3
Rice
Post-menopausal
Giles, G.G.,2006,BRE22430
Australia, Post-menopausalMCCS, 1990
40 - 69 Unspecified FFQ (nos)ProspectiveCohort
12273.0 9.1 years times/week
Breast cancerPost-menopausal
1.0(continuous)
10.96(0.88, 1.05)
A E F G
incidence
Giles, G.G.,2006,BRE22430
Australia, Post-menopausalMCCS, 1990
40 - 69 Unspecified FFQ (nos)ProspectiveCohort
12273.0 9.1 years times/week
Breast cancer ER+/PR+Post-menopausal
1.0(continuous)
10.95(0.83, 1.08)
A E F G
incidence
Giles, G.G.,2006,BRE22430
Australia, Post-menopausalMCCS, 1990
40 - 69 Unspecified FFQ (nos)ProspectiveCohort
12273.0 9.1 years times/week
Breast cancer ER+/PR-Post-menopausal
1.0(continuous)
10.94(0.72, 1.21)
A E F G
incidence
Giles, G.G.,2006,BRE22430
Australia, Post-menopausalMCCS, 1990
40 - 69 Unspecified FFQ (nos)ProspectiveCohort
12273.0 9.1 years times/week
Breast cancer ER-/PR-Post-menopausal
1.0(continuous)
11.04(0.85, 1.27)
A E F G
incidence
Menopausal status not specified
Key, T.J.,1999,BRE04758
Japan, Not specifiedLSS, 1969
427 By MailQuestionnaire(nos)
ProspectiveCohort
488989 24.0 years times/day
Breast cancer >=3vs.<=1
41.13(0.76, 1.68)
0.901
A G
incidence
FrazierL.A.,2003,BRE02941
USA, Multi-ethnic,Registered nursesNurses' Health Study (NHS)Cohort 1976-1996
40 - 65
Through healthorg. (screening,healthinsurance)
FFQ (nos)Nested CaseControl
121700.0 10.0 years adolescent Cups/day
Breast cancer1.0(continuous)
10.85(0.62, 1.17)
A C D E F G
incidence
White bread
Post-menopausal
Giles, G.G.,2006,BRE22430
Australia, Post-menopausalMCCS, 1990
40 - 69 Unspecified FFQ (nos)ProspectiveCohort
12273.0 9.1 years times/week
Breast cancerPost-menopausal
1.0(continuous)
11.0(0.99, 1.02)
A E F G
incidence
Giles, G.G.,2006,BRE22430
Australia, Post-menopausalMCCS, 1990
40 - 69 Unspecified FFQ (nos)ProspectiveCohort
12273.0 9.1 years times/week
Breast cancer ER+/PR+Post-menopausal
1.0(continuous)
11.0(0.98, 1.02)
A E F G
incidence
Giles, G.G.,2006,BRE22430
Australia, Post-menopausalMCCS, 1990
40 - 69 Unspecified FFQ (nos)ProspectiveCohort
12273.0 9.1 years times/week
Breast cancer ER+/PR-Post-menopausal
1.0(continuous)
10.99(0.94, 1.03)
A E F G
incidence
18

Author, Year,WCRF Code
Country, Ethnicity, Specialcharacteristics
Age Cases n Caseascertainment
Type of studyNon-Cases n
Lenght offollow-up / loss
Assessmentdetail
Additional details Unit Outcome Subgroup Contrast Nocat. OR (95% CI) p
valueptrend A B C D E F G
adjustments
Giles, G.G.,2006,BRE22430
Australia, Post-menopausalMCCS, 1990
40 - 69 Unspecified FFQ (nos)ProspectiveCohort
12273.0 9.1 years times/week
Breast cancer ER-/PR-Post-menopausal
1.0(continuous)
11.0(0.96, 1.03)
A E F G
incidence
2.1.2
Root vegetables
Menopausal status not specified
van GilsCH,2005,BRE80167 EPIC
25 - 70 3659Dietquestionnaire
ProspectiveCohort
285526.0 5.4 yearsBreast cancer >309.1
vs.<109.0
51.02(0.89, 1.18)
0.64 C D E F G
Incidence
2.1.2.1
Potatoes
Menopausal status not specified
Verhoeven, D.T.,1997,BRE12868
the Netherland, Not specifiedThe Netherlands CohortStudy on diet and cancer,1986-1993
55 - 69 519Throughnetwork, paper,tv
FFQ-Semi-quantitative
Case Cohort 58674.3 years / nolost g/day
Invasive breast cancer 181.0vs.23.0
51.14(0.81, 1.62)
0.55 A C E F G
incidence
FrazierL.A.,2003,BRE02941
USA, Multi-ethnic,Registered nursesNurses' Health Study (NHS)Cohort 1976-1996
40 - 65
Through healthorg. (screening,healthinsurance)
FFQ (nos)Nested CaseControl
121700.0 10.0 years adolescent Cups/day
Breast cancer1.0(continuous)
10.93(0.8, 1.08)
A C D E F G
incidence
FrazierL.A.,2003,BRE02941
USA, Multi-ethnic,Registered nursesNurses' Health Study (NHS)Cohort 1976-1996
40 - 65
Through healthorg. (screening,healthinsurance)
FFQ (nos)Nested CaseControl
121700.0 10.0 years adolescentOunces*year/day
Breast cancer4.0(continuous)
11.04(0.72, 1.49)
A C D E F G
incidence
Sweet Potatoes
Menopausal status not specified
Li, W.,2005,BRE23123China, AsianShanghai BSE
130
Through socialorganization(profession,religion)
FFQ-Semi-quantitative
Nested CaseControl
1070 Convolvulaceae times/year
Breast cancer Evervs.Never
20.8(0.5, 1.3)
A E
incidence
2.2
Fruit and (non-starchy) vegetables
Post-menopausal
Olsen,A.,2003,BRE17890
Denmark, Not specified,Post-menopausalDiet, Cancer and Health,1993
50 - 65 425 By Mail FFQ (nos)ProspectiveCohort
23798 4.7 years including fruits andvegetables juices
g/day
Breast cancerPost-menopausal
100.0(continuous)
11.02(0.98, 1.06)
A B C D E F G
incidence
19
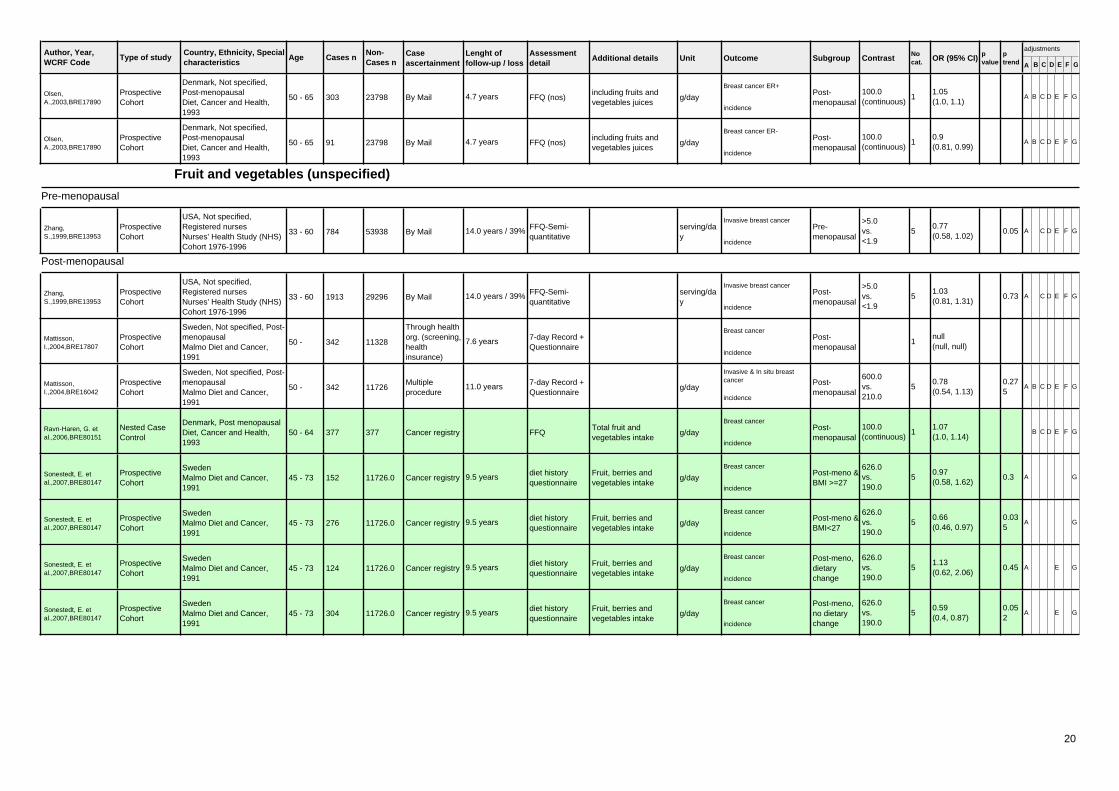
Author, Year,WCRF Code
Country, Ethnicity, Specialcharacteristics
Age Cases n Caseascertainment
Type of studyNon-Cases n
Lenght offollow-up / loss
Assessmentdetail
Additional details Unit Outcome Subgroup Contrast Nocat. OR (95% CI) p
valueptrend A B C D E F G
adjustments
Olsen,A.,2003,BRE17890
Denmark, Not specified,Post-menopausalDiet, Cancer and Health,1993
50 - 65 303 By Mail FFQ (nos)ProspectiveCohort
23798 4.7 years including fruits andvegetables juices
g/day
Breast cancer ER+Post-menopausal
100.0(continuous)
11.05(1.0, 1.1)
A B C D E F G
incidence
Olsen,A.,2003,BRE17890
Denmark, Not specified,Post-menopausalDiet, Cancer and Health,1993
50 - 65 91 By Mail FFQ (nos)ProspectiveCohort
23798 4.7 years including fruits andvegetables juices
g/day
Breast cancer ER-Post-menopausal
100.0(continuous)
10.9(0.81, 0.99)
A B C D E F G
incidence
Fruit and vegetables (unspecified)
Pre-menopausal
Zhang,S.,1999,BRE13953
USA, Not specified,Registered nursesNurses' Health Study (NHS)Cohort 1976-1996
33 - 60 784 By MailFFQ-Semi-quantitative
ProspectiveCohort
53938 14.0 years / 39% serving/day
Invasive breast cancerPre-menopausal
>5.0vs.<1.9
50.77(0.58, 1.02)
0.05 A C D E F G
incidence
Post-menopausal
Zhang,S.,1999,BRE13953
USA, Not specified,Registered nursesNurses' Health Study (NHS)Cohort 1976-1996
33 - 60 1913 By MailFFQ-Semi-quantitative
ProspectiveCohort
29296 14.0 years / 39% serving/day
Invasive breast cancerPost-menopausal
>5.0vs.<1.9
51.03(0.81, 1.31)
0.73 A C D E F G
incidence
Mattisson,I.,2004,BRE17807
Sweden, Not specified, Post-menopausalMalmo Diet and Cancer,1991
50 - 342
Through healthorg. (screening,healthinsurance)
7-day Record +Questionnaire
ProspectiveCohort
11328 7.6 yearsBreast cancer
Post-menopausal
1null(null, null)
incidence
Mattisson,I.,2004,BRE16042
Sweden, Not specified, Post-menopausalMalmo Diet and Cancer,1991
50 - 342Multipleprocedure
7-day Record +Questionnaire
ProspectiveCohort
11726 11.0 years g/day
Invasive & In situ breastcancer Post-
menopausal
600.0vs.210.0
50.78(0.54, 1.13)
0.275
A B C D E F G
incidence
Ravn-Haren, G. etal.,2006,BRE80151
Denmark, Post menopausalDiet, Cancer and Health,1993
50 - 64 377 Cancer registry FFQNested CaseControl
377Total fruit andvegetables intake
g/day
Breast cancerPost-menopausal
100.0(continuous)
11.07(1.0, 1.14)
B C D E F G
incidence
Sonestedt, E. etal.,2007,BRE80147
SwedenMalmo Diet and Cancer,1991
45 - 73 152 Cancer registrydiet historyquestionnaire
ProspectiveCohort
11726.0 9.5 years Fruit, berries andvegetables intake
g/day
Breast cancerPost-meno &BMI >=27
626.0vs.190.0
50.97(0.58, 1.62)
0.3 A G
incidence
Sonestedt, E. etal.,2007,BRE80147
SwedenMalmo Diet and Cancer,1991
45 - 73 276 Cancer registrydiet historyquestionnaire
ProspectiveCohort
11726.0 9.5 years Fruit, berries andvegetables intake
g/day
Breast cancerPost-meno &BMI<27
626.0vs.190.0
50.66(0.46, 0.97)
0.035
A G
incidence
Sonestedt, E. etal.,2007,BRE80147
SwedenMalmo Diet and Cancer,1991
45 - 73 124 Cancer registrydiet historyquestionnaire
ProspectiveCohort
11726.0 9.5 years Fruit, berries andvegetables intake
g/day
Breast cancer Post-meno,dietarychange
626.0vs.190.0
51.13(0.62, 2.06)
0.45 A E G
incidence
Sonestedt, E. etal.,2007,BRE80147
SwedenMalmo Diet and Cancer,1991
45 - 73 304 Cancer registrydiet historyquestionnaire
ProspectiveCohort
11726.0 9.5 years Fruit, berries andvegetables intake
g/day
Breast cancer Post-meno,no dietarychange
626.0vs.190.0
50.59(0.4, 0.87)
0.052
A E G
incidence
20

Author, Year,WCRF Code
Country, Ethnicity, Specialcharacteristics
Age Cases n Caseascertainment
Type of studyNon-Cases n
Lenght offollow-up / loss
Assessmentdetail
Additional details Unit Outcome Subgroup Contrast Nocat. OR (95% CI) p
valueptrend A B C D E F G
adjustments
Sonestedt, E. etal.,2007,BRE80147
SwedenMalmo Diet and Cancer,1991
45 - 73 428 Cancer registrydiet historyquestionnaire
ProspectiveCohort
11726.0 9.5 years Fruit, berries andvegetables intake
g/day
Breast cancerPost-menopausal
626.0vs.190.0
50.78(0.57, 1.05)
0.35 A E G
incidence
Menopausal status not specified
Shannon,J.,2003,BRE18714
China, Not specifiedBreast Self-Exam (BSE),unknown
Through healthorg. (screening,healthinsurance)
FFQ (nos)Nested CaseControl
nullfood groupintake/caloric intake
Breast cancerHighestquartilevs.Lowest
20.46(0.28, 0.75)
0.0004
A C E G
incidence
2.2.1
Non-starchy vegetables
Post-menopausal
Olsen,A.,2003,BRE17890
Denmark, Not specified,Post-menopausalDiet, Cancer and Health,1993
50 - 65 425 By Mail FFQ (nos)ProspectiveCohort
23798 4.7 years g/day
Breast cancerPost-menopausal
100.0(continuous)
10.98(0.89, 1.09)
A B C D E F G
incidence
Olsen,A.,2003,BRE17890
Denmark, Not specified,Post-menopausalDiet, Cancer and Health,1993
50 - 65 303 By Mail FFQ (nos)ProspectiveCohort
23798 4.7 years g/day
Breast cancer ER+Post-menopausal
100.0(continuous)
11.01(0.9, 1.13)
A B C D E F G
incidence
Olsen,A.,2003,BRE17890
Denmark, Not specified,Post-menopausalDiet, Cancer and Health,1993
50 - 65 91 By Mail FFQ (nos)ProspectiveCohort
23798 4.7 years g/day
Breast cancer ER-Post-menopausal
100.0(continuous)
10.92(0.73, 1.16)
A B C D E F G
incidence
FungT.T.,2006,BRE80107
United States, Post-menopausalNurses' Health Study (NHS)Cohort 1976-1996
30 - 55 575 medical records FFQProspectiveCohort
121700.0 18.0 years
Vegetables other thanyellow/orange, leafyand cruciferousvegetables, corn,
times/week
Breast cancer ER- 7+vs.<2
40.67(0.53, 0.87)
0.03 D E F G
incidence
Total vegetables
Menopausal status not specified
van GilsCH,2005,BRE80167 EPIC
25 - 70 3659Dietquestionnaire
ProspectiveCohort
285526.0 5.4 yearsBreast cancer >309.1
vs.<109.0
50.98(0.84, 1.14)
0.65 C D E F G
Incidence
Vegetables
Menopausal status not specified
van GilsCH,2005,BRE80167 EPIC
25 - 70 3659Dietquestionnaire
ProspectiveCohort
285526.0 5.4 years Fruiting vegetables
Breast cancer >309.1vs.<109.0
51.06(0.93, 1.21)
0.26 C D E F G
Incidence
Vegetables (unspecified)
Pre-menopausal
21

Author, Year,WCRF Code
Country, Ethnicity, Specialcharacteristics
Age Cases n Caseascertainment
Type of studyNon-Cases n
Lenght offollow-up / loss
Assessmentdetail
Additional details Unit Outcome Subgroup Contrast Nocat. OR (95% CI) p
valueptrend A B C D E F G
adjustments
Zhang,S.,1999,BRE13953
USA, Not specified,Registered nursesNurses' Health Study (NHS)Cohort 1976-1996
33 - 60 784 By MailFFQ-Semi-quantitative
ProspectiveCohort
53938 14.0 years / 39% serving/day
Invasive breast cancerPre-menopausal
>5.0vs.<1.9
50.64(0.43, 0.95)
0.10 A C D E F G
incidence
FrazierL.A.,2004,BRE02942
USA, Multi-ethnic,Registered nursesNurses' Health study II
34 - 51 361
Through healthorg. (screening,healthinsurance)
FFQ (nos)Historical Cohort 47517 9.0 years total veg adolescentdiet
serving/day
Breast cancerPre-menopausal
5.3vs.1.3
51.0(0.69, 1.44)
0.97 A C D E F G
incidence
Post-menopausal
Zhang,S.,1999,BRE13953
USA, Not specified,Registered nursesNurses' Health Study (NHS)Cohort 1976-1996
33 - 60 1913 By MailFFQ-Semi-quantitative
ProspectiveCohort
29296 14.0 years / 39% serving/day
Invasive breast cancerPost-menopausal
>5.0vs.<1.9
51.02(0.85, 1.24)
0.61 A C D E F G
incidence
Fung, T.T.,2005,BRE22370
U.S.A., Registered nursesNurses' Health Study (NHS)Cohort 1984
30 - 55 By Mail FFQ (nos)ProspectiveCohort
71058.0 16.0 years serving
Breast cancer ER-Post-menopausal
1.0(continuous)
10.94(0.88, 0.99)
0.03 A C D E F G
incidence
Menopausal status not specified
Rohan, T.E.,1993,BRE17965
Canada, Not specified,Screening ProgramCanadian National BreastScreening Study
40 - 59 518
Through healthorg. (screening,healthinsurance)
Dietary Historyquestionnaire
Nested CaseControl
1182 6.0 years g/day
Breast cancer >433.1vs.<203.0
50.86(0.61, 1.23)
0.752
A B C E F G
incidence
Verhoeven, D.T.,1997,BRE12868
the Netherland, Not specifiedThe Netherlands CohortStudy on diet and cancer,1986-1993
55 - 69 519Throughnetwork, paper,tv
FFQ-Semi-quantitative
Case Cohort 58654.3 years / nolost g/day
Invasive breast cancer 303.0vs.108.0
50.94(0.67, 1.31)
0.3 A C E F G
incidence
Li, W.,2005,BRE23123China, AsianShanghai BSE
130
Through socialorganization(profession,religion)
FFQ-Semi-quantitative
Nested CaseControl
1070 times/year
Breast cancer >957.0vs.<538.0
50.4(0.2, 0.7)
0.001
E
incidence
Vegetables rich in vitamin C and A
Menopausal status not specified
Rohan, T.E.,1993,BRE17965
Canada, Not specified,Screening ProgramCanadian National BreastScreening Study
40 - 59 518
Through healthorg. (screening,healthinsurance)
Dietary Historyquestionnaire
Nested CaseControl
1182 6.0 years g/day
Breast cancer >169.1vs.<45.0
50.74(0.52, 1.05)
0.086
A B C E F G
incidence
2.2.1.1
Carrots and Celery (umbelliferea)
Menopausal status not specified
Shannon,J.,2003,BRE18714
China, Not specifiedBreast Self-Exam (BSE),unknown
Through healthorg. (screening,healthinsurance)
FFQ (nos)Nested CaseControl
nullserving/day
Breast cancerHighestquartilevs.Lowest
21.78(1.1, 2.89)
0.02 A C E G
incidence
Garlic and Onion
Menopausal status not specified
22
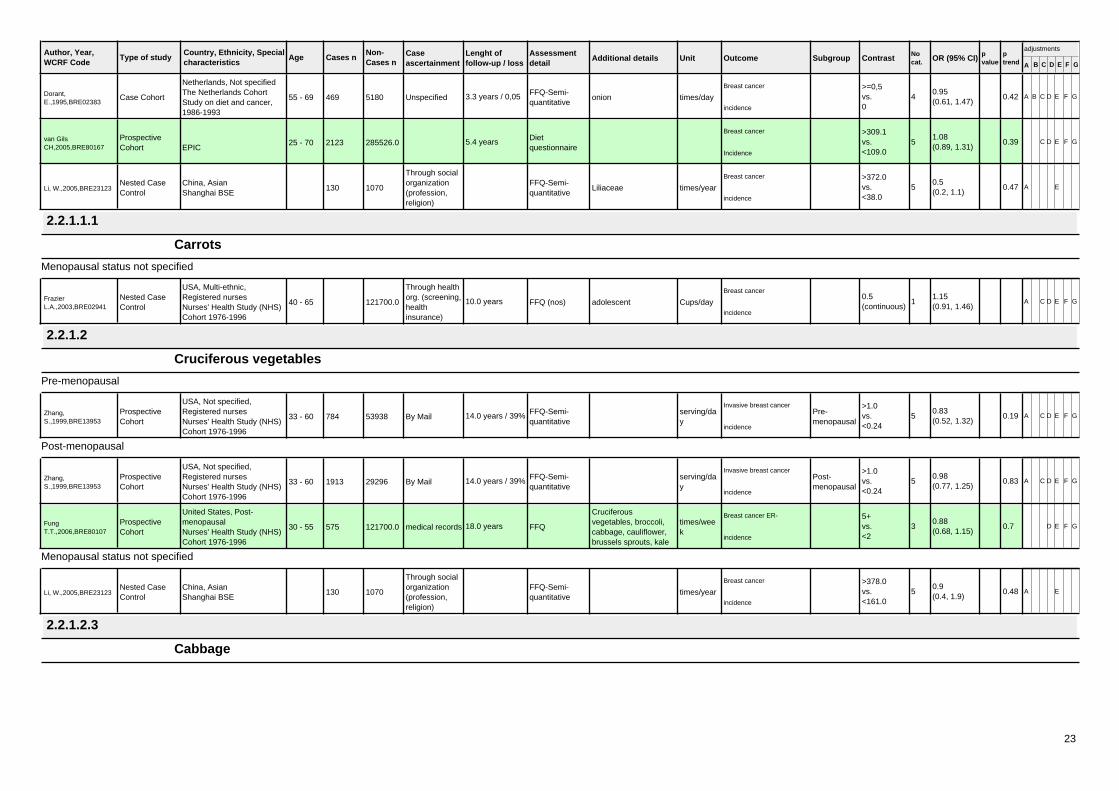
Author, Year,WCRF Code
Country, Ethnicity, Specialcharacteristics
Age Cases n Caseascertainment
Type of studyNon-Cases n
Lenght offollow-up / loss
Assessmentdetail
Additional details Unit Outcome Subgroup Contrast Nocat. OR (95% CI) p
valueptrend A B C D E F G
adjustments
Dorant,E.,1995,BRE02383
Netherlands, Not specifiedThe Netherlands CohortStudy on diet and cancer,1986-1993
55 - 69 469 UnspecifiedFFQ-Semi-quantitative
Case Cohort 5180 3.3 years / 0,05 onion times/day
Breast cancer >=0,5vs.0
40.95(0.61, 1.47)
0.42 A B C D E F G
incidence
van GilsCH,2005,BRE80167 EPIC
25 - 70 2123Dietquestionnaire
ProspectiveCohort
285526.0 5.4 yearsBreast cancer >309.1
vs.<109.0
51.08(0.89, 1.31)
0.39 C D E F G
Incidence
Li, W.,2005,BRE23123China, AsianShanghai BSE
130
Through socialorganization(profession,religion)
FFQ-Semi-quantitative
Nested CaseControl
1070 Liliaceae times/year
Breast cancer >372.0vs.<38.0
50.5(0.2, 1.1)
0.47 A E
incidence
2.2.1.1.1
Carrots
Menopausal status not specified
FrazierL.A.,2003,BRE02941
USA, Multi-ethnic,Registered nursesNurses' Health Study (NHS)Cohort 1976-1996
40 - 65
Through healthorg. (screening,healthinsurance)
FFQ (nos)Nested CaseControl
121700.0 10.0 years adolescent Cups/day
Breast cancer0.5(continuous)
11.15(0.91, 1.46)
A C D E F G
incidence
2.2.1.2
Cruciferous vegetables
Pre-menopausal
Zhang,S.,1999,BRE13953
USA, Not specified,Registered nursesNurses' Health Study (NHS)Cohort 1976-1996
33 - 60 784 By MailFFQ-Semi-quantitative
ProspectiveCohort
53938 14.0 years / 39% serving/day
Invasive breast cancerPre-menopausal
>1.0vs.<0.24
50.83(0.52, 1.32)
0.19 A C D E F G
incidence
Post-menopausal
Zhang,S.,1999,BRE13953
USA, Not specified,Registered nursesNurses' Health Study (NHS)Cohort 1976-1996
33 - 60 1913 By MailFFQ-Semi-quantitative
ProspectiveCohort
29296 14.0 years / 39% serving/day
Invasive breast cancerPost-menopausal
>1.0vs.<0.24
50.98(0.77, 1.25)
0.83 A C D E F G
incidence
FungT.T.,2006,BRE80107
United States, Post-menopausalNurses' Health Study (NHS)Cohort 1976-1996
30 - 55 575 medical records FFQProspectiveCohort
121700.0 18.0 years
Cruciferousvegetables, broccoli,cabbage, cauliflower,brussels sprouts, kale
times/week
Breast cancer ER- 5+vs.<2
30.88(0.68, 1.15)
0.7 D E F G
incidence
Menopausal status not specified
Li, W.,2005,BRE23123China, AsianShanghai BSE
130
Through socialorganization(profession,religion)
FFQ-Semi-quantitative
Nested CaseControl
1070 times/year
Breast cancer >378.0vs.<161.0
50.9(0.4, 1.9)
0.48 A E
incidence
2.2.1.2.3
Cabbage
23

Author, Year,WCRF Code
Country, Ethnicity, Specialcharacteristics
Age Cases n Caseascertainment
Type of studyNon-Cases n
Lenght offollow-up / loss
Assessmentdetail
Additional details Unit Outcome Subgroup Contrast Nocat. OR (95% CI) p
valueptrend A B C D E F G
adjustments
Menopausal status not specified
FrazierL.A.,2003,BRE02941
USA, Multi-ethnic,Registered nursesNurses' Health Study (NHS)Cohort 1976-1996
40 - 65
Through healthorg. (screening,healthinsurance)
FFQ (nos)Nested CaseControl
121700.0 10.0 years adolescent Cups/day
Breast cancer0.5(continuous)
11.0(0.64, 1.57)
A C D E F G
incidence
van GilsCH,2005,BRE80167 EPIC
25 - 70 3659Dietquestionnaire
ProspectiveCohort
285526.0 5.4 yearsBreast cancer >309.1
vs.<109.0
51.18(1.01, 1.38)
0.11 C D E F G
Incidence
2.2.1.2.4
Broccoli
Menopausal status not specified
FrazierL.A.,2003,BRE02941
USA, Multi-ethnic,Registered nursesNurses' Health Study (NHS)Cohort 1976-1996
40 - 65
Through healthorg. (screening,healthinsurance)
FFQ (nos)Nested CaseControl
121700.0 10.0 years adolescent Cups/day
Breast cancer0.5(continuous)
10.741(0.39, 1.41)
A C D E F G
incidence
Adebamowo, C.A.,2005,BRE21537
USA, Not specified,Registered nursesNurses' Health Study (NHS)Cohort 1976-1996
25 - 46 710
Through socialorganization(profession,religion)
FFQ-Semi-quantitative
ProspectiveCohort
706990 8.0 years serving/month
Invasive breast cancer 17.14vs.>0.99
50.99(0.59, 1.65)
0.1 A C D E F G
incidence
2.2.1.3
Allium vegetables
Menopausal status not specified
Dorant,E.,1995,BRE02383
Netherlands, Not specifiedThe Netherlands CohortStudy on diet and cancer,1986-1993
55 - 69 469 UnspecifiedFFQ-Semi-quantitative
Case Cohort 5180 3.3 years / 0,05 leektimes/month
Breast cancer >2vs.0
31.08(0.79, 1.48)
0.57 A B C D E F G
incidence
Adebamowo, C.A.,2005,BRE21537
USA, Not specified,Registered nursesNurses' Health Study (NHS)Cohort 1976-1996
25 - 46 710
Through socialorganization(profession,religion)
FFQ-Semi-quantitative
ProspectiveCohort
706991 8.0 years onionserving/month
Invasive breast cancer 17.14vs.>0.99
51.11(0.77, 1.61)
0.99 A C D E F G
incidence
2.2.1.4.2
Spinach
Menopausal status not specified
FrazierL.A.,2003,BRE02941
USA, Multi-ethnic,Registered nursesNurses' Health Study (NHS)Cohort 1976-1996
40 - 65
Through healthorg. (screening,healthinsurance)
FFQ (nos)Nested CaseControl
121700.0 10.0 years adolescent Cups/day
Breast cancer0.5(continuous)
11.18(0.72, 1.93)
A C D E F G
incidence
2.2.1.4.3
Lettuce
24

Author, Year,WCRF Code
Country, Ethnicity, Specialcharacteristics
Age Cases n Caseascertainment
Type of studyNon-Cases n
Lenght offollow-up / loss
Assessmentdetail
Additional details Unit Outcome Subgroup Contrast Nocat. OR (95% CI) p
valueptrend A B C D E F G
adjustments
Menopausal status not specified
Li, W.,2005,BRE23123China, AsianShanghai BSE
130
Through socialorganization(profession,religion)
FFQ-Semi-quantitative
Nested CaseControl
1070+ Sunflower seeds(Compositae)
times/year
Breast cancer >57.0vs.<8.0
50.6(0.3, 1.2)
0.07 A E
incidence
2.2.1.5
Dark green and yellow vegetables
Menopausal status not specified
Key, T.J.,1999,BRE04758
Japan, Not specifiedLSS, 1969
427 By MailQuestionnaire(nos)
ProspectiveCohort
488988 24.0 years times/week
Breast cancer >=5vs.<=1
40.99(0.69, 1.44)
0.949
A G
incidence
Sauvaget,C.,2003,BRE20841
Japan, Not specified, Atomicbomb survivorsLSS, 1969
34 - 103 76 By Mail FFQ (nos)ProspectiveCohort
23667.0 16.0 years times/week
Breast cancerdaily oralmost dailyvs.once per
31.28(0.64, 2.54)
0.5350
A B D E G
cancer death
Leafy vegetables
Post-menopausal
FungT.T.,2006,BRE80107
United States, Post-menopausalNurses' Health Study (NHS)Cohort 1976-1996
30 - 55 575 medical records FFQProspectiveCohort
121700.0 18.0 yearsLeaft vegetables,iceberg lettuce, otherlettuce, spinach
times/week
Breast cancer ER- 7+vs.<2
40.71(0.55, 0.9)
0.13 D E F G
incidence
Menopausal status not specified
van GilsCH,2005,BRE80167 EPIC
25 - 70 3659Dietquestionnaire
ProspectiveCohort
285526.0 5.4 years excluding cabbages
Breast cancer >309.1vs.<109.0
51.16(0.97, 1.38)
0.23 C D E F G
Incidence
Mushrooms
Menopausal status not specified
van GilsCH,2005,BRE80167 EPIC
25 - 70 3503Dietquestionnaire
ProspectiveCohort
285526.0 5.4 yearsBreast cancer >309.1
vs.<109.0
50.98(0.85, 1.14)
0.75 C D E F G
Incidence
Peppers
Menopausal status not specified
Adebamowo, C.A.,2005,BRE21537
USA, Not specified,Registered nursesNurses' Health Study (NHS)Cohort 1976-1996
25 - 46 710
Through socialorganization(profession,religion)
FFQ-Semi-quantitative
ProspectiveCohort
706841 8.0 years green pepperserving/month
Invasive breast cancer 17.14vs.>0.99
50.94(0.66, 1.32)
0.15 A C D E F G
incidence
Pumpkin
Menopausal status not specified
25

Author, Year,WCRF Code
Country, Ethnicity, Specialcharacteristics
Age Cases n Caseascertainment
Type of studyNon-Cases n
Lenght offollow-up / loss
Assessmentdetail
Additional details Unit Outcome Subgroup Contrast Nocat. OR (95% CI) p
valueptrend A B C D E F G
adjustments
Li, W.,2005,BRE23123China, AsianShanghai BSE
130
Through socialorganization(profession,religion)
FFQ-Semi-quantitative
Nested CaseControl
1070 cucurbitacae times/year
Breast cancer >244.0vs.<143.0
50.5(0.2, 1.2)
0.08 A E
incidence
Salad vegetables
Menopausal status not specified
Key,T.J.A.,1996,BRE15654
United Kingdom, Notspecified, Vegetarian andhealth conscious peopleUK Cohort of Vegetarians
16 - 79
From groupswith highvegetarianlikelihood
Questionnaire(nos)
ProspectiveCohort
6435.0 16.8 years raw salad
Breast cancerdailyconsumptionvs.less than
21.15(0.7, 1.87)
A G
cancer death
Sea vegetables
Menopausal status not specified
Key, T.J.,1999,BRE04758
Japan, Not specifiedLSS, 1969
427 By MailQuestionnaire(nos)
ProspectiveCohort
488989 24.0 years times/week
Breast cancer >=5vs.<=1
40.89(0.69, 1.16)
0.417
A G
incidence
Li, W.,2005,BRE23123China, AsianShanghai BSE
130
Through socialorganization(profession,religion)
FFQ-Semi-quantitative
Nested CaseControl
1070 Laminariaceae times/year
Breast cancer >14.0vs.<1.0
51.4(0.7, 2.9)
0.49 A E
incidence
Solanaceae
Menopausal status not specified
Li, W.,2005,BRE23123China, AsianShanghai BSE
130
Through socialorganization(profession,religion)
FFQ-Semi-quantitative
Nested CaseControl
1070 times/year
Breast cancer >183.0vs.<80.0
51.0(0.5, 2.0)
0.76 A E
incidence
Tomato sauce
Menopausal status not specified
Sesso H.D.,2005,BRE74061
USA, Not specified, HealthprofessionalsWomen's Health Study, 1993
1058
Through healthorg. (screening,healthinsurance)
FFQ-Semi-quantitative
ProspectiveCohort
37718 9.9 years serving/month
Breast cancer2-4serving/wkvs.none
41.23(0.93, 1.64)
0.046
A C D E F G
incidence
Umbelliferae
Menopausal status not specified
Li, W.,2005,BRE23123China, AsianShanghai BSE
130
Through socialorganization(profession,religion)
FFQ-Semi-quantitative
Nested CaseControl
1070 times/year
Breast cancer >40.0vs.<12.0
53.1(1.5, 6.1)
0.001
A E
incidence
Yellow-orange vegetables
Post-menopausal
26

Author, Year,WCRF Code
Country, Ethnicity, Specialcharacteristics
Age Cases n Caseascertainment
Type of studyNon-Cases n
Lenght offollow-up / loss
Assessmentdetail
Additional details Unit Outcome Subgroup Contrast Nocat. OR (95% CI) p
valueptrend A B C D E F G
adjustments
FungT.T.,2006,BRE80107
United States, Post-menopausalNurses' Health Study (NHS)Cohort 1976-1996
30 - 55 575 medical records FFQProspectiveCohort
121700.0 18.0 years
Yellow/orangevegetables, carrots,yams, other squash,tomatoes, tomato juice,
times/week
Breast cancer ER- 7+vs.<2
40.76(0.57, 0.99)
0.04 D E F G
incidence
Zingiberaceae
Menopausal status not specified
Li, W.,2005,BRE23123China, AsianShanghai BSE
130
Through socialorganization(profession,religion)
FFQ-Semi-quantitative
Nested CaseControl
1070 Ginger root times/year
Breast cancer >365.0vs.<207.0
51.3(0.8, 2.3)
0.19 A E
incidence
2.2.1.5.13
All tomato-containing foods
Menopausal status not specified
Sesso H.D.,2005,BRE74061
USA, Not specified, HealthprofessionalsWomen's Health Study, 1993
1076
Through healthorg. (screening,healthinsurance)
FFQ-Semi-quantitative
ProspectiveCohort
38446 9.9 years tomato-based foodproducts
serving/week
Breast cancer >=10vs.<1.5
51.16(0.78, 1.72)
0.11 A C D E F G
incidence
Tomatoes
Menopausal status not specified
Sesso H.D.,2005,BRE74061
USA, Not specified, HealthprofessionalsWomen's Health Study, 1993
1075
Through healthorg. (screening,healthinsurance)
FFQ-Semi-quantitative
ProspectiveCohort
38221 9.9 years serving/month
Breast cancer>= 5serving/weekvs.
41.45(0.94, 2.22)
0.66 A C D E F G
incidence
2.2.2
Fruit
Menopausal status not specified
van GilsCH,2005,BRE80167 EPIC
25 - 70 3659Dietquestionnaire
ProspectiveCohort
285526.0 5.4 years Total fruits
Breast cancer >309.1vs.<109.0
51.09(0.94, 1.25)
0.11 C D E F G
Incidence
Fruits (general)
Pre-menopausal
Zhang,S.,1999,BRE13953
USA, Not specified,Registered nursesNurses' Health Study (NHS)Cohort 1976-1996
33 - 60 784 By MailFFQ-Semi-quantitative
ProspectiveCohort
53938 14.0 years / 39% serving/day
Invasive breast cancerPre-menopausal
>5.0vs.<1.9
50.74(0.45, 1.24)
0.13 A C D E F G
incidence
FrazierL.A.,2004,BRE02942
USA, Multi-ethnic,Registered nursesNurses' Health study II
34 - 51 361
Through healthorg. (screening,healthinsurance)
FFQ (nos)Historical Cohort 47517 9.0 years adolescent dietserving/day
Breast cancerPre-menopausal
4.1vs.0.7
50.75(0.53, 1.07)
0.84 A C D E F G
incidence
27
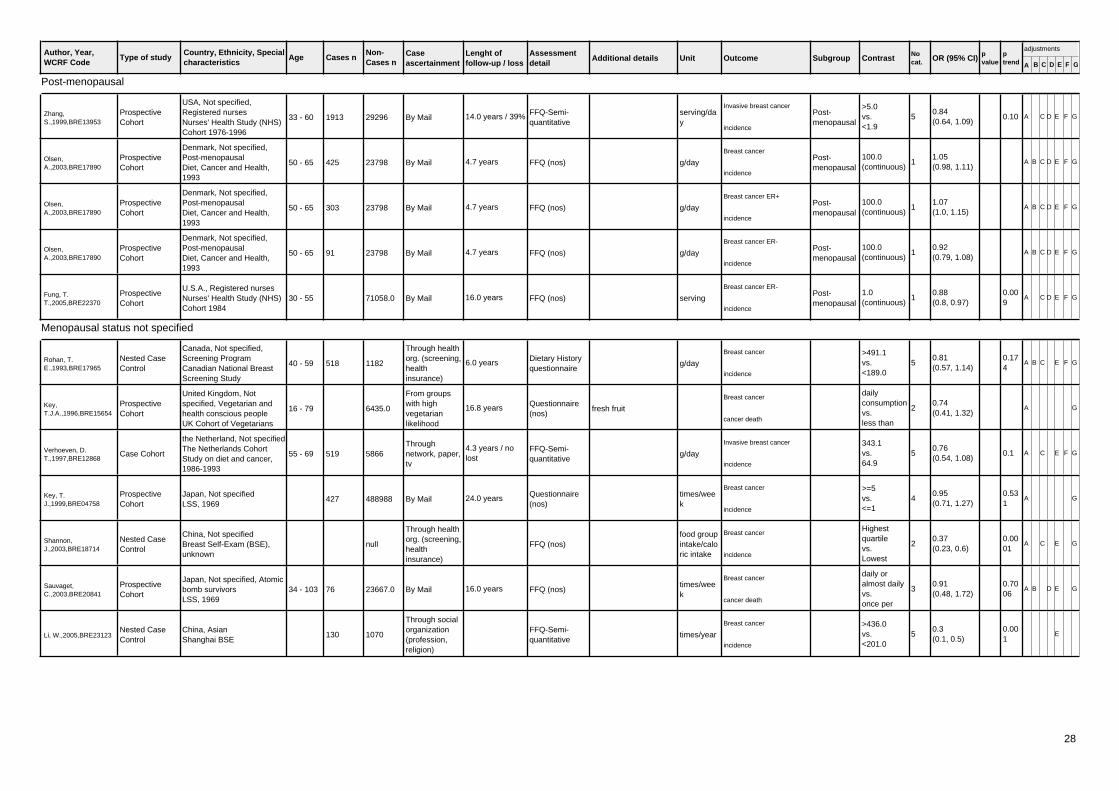
Author, Year,WCRF Code
Country, Ethnicity, Specialcharacteristics
Age Cases n Caseascertainment
Type of studyNon-Cases n
Lenght offollow-up / loss
Assessmentdetail
Additional details Unit Outcome Subgroup Contrast Nocat. OR (95% CI) p
valueptrend A B C D E F G
adjustments
Post-menopausal
Zhang,S.,1999,BRE13953
USA, Not specified,Registered nursesNurses' Health Study (NHS)Cohort 1976-1996
33 - 60 1913 By MailFFQ-Semi-quantitative
ProspectiveCohort
29296 14.0 years / 39% serving/day
Invasive breast cancerPost-menopausal
>5.0vs.<1.9
50.84(0.64, 1.09)
0.10 A C D E F G
incidence
Olsen,A.,2003,BRE17890
Denmark, Not specified,Post-menopausalDiet, Cancer and Health,1993
50 - 65 425 By Mail FFQ (nos)ProspectiveCohort
23798 4.7 years g/day
Breast cancerPost-menopausal
100.0(continuous)
11.05(0.98, 1.11)
A B C D E F G
incidence
Olsen,A.,2003,BRE17890
Denmark, Not specified,Post-menopausalDiet, Cancer and Health,1993
50 - 65 303 By Mail FFQ (nos)ProspectiveCohort
23798 4.7 years g/day
Breast cancer ER+Post-menopausal
100.0(continuous)
11.07(1.0, 1.15)
A B C D E F G
incidence
Olsen,A.,2003,BRE17890
Denmark, Not specified,Post-menopausalDiet, Cancer and Health,1993
50 - 65 91 By Mail FFQ (nos)ProspectiveCohort
23798 4.7 years g/day
Breast cancer ER-Post-menopausal
100.0(continuous)
10.92(0.79, 1.08)
A B C D E F G
incidence
Fung, T.T.,2005,BRE22370
U.S.A., Registered nursesNurses' Health Study (NHS)Cohort 1984
30 - 55 By Mail FFQ (nos)ProspectiveCohort
71058.0 16.0 years serving
Breast cancer ER-Post-menopausal
1.0(continuous)
10.88(0.8, 0.97)
0.009
A C D E F G
incidence
Menopausal status not specified
Rohan, T.E.,1993,BRE17965
Canada, Not specified,Screening ProgramCanadian National BreastScreening Study
40 - 59 518
Through healthorg. (screening,healthinsurance)
Dietary Historyquestionnaire
Nested CaseControl
1182 6.0 years g/day
Breast cancer >491.1vs.<189.0
50.81(0.57, 1.14)
0.174
A B C E F G
incidence
Key,T.J.A.,1996,BRE15654
United Kingdom, Notspecified, Vegetarian andhealth conscious peopleUK Cohort of Vegetarians
16 - 79
From groupswith highvegetarianlikelihood
Questionnaire(nos)
ProspectiveCohort
6435.0 16.8 years fresh fruit
Breast cancerdailyconsumptionvs.less than
20.74(0.41, 1.32)
A G
cancer death
Verhoeven, D.T.,1997,BRE12868
the Netherland, Not specifiedThe Netherlands CohortStudy on diet and cancer,1986-1993
55 - 69 519Throughnetwork, paper,tv
FFQ-Semi-quantitative
Case Cohort 58664.3 years / nolost g/day
Invasive breast cancer 343.1vs.64.9
50.76(0.54, 1.08)
0.1 A C E F G
incidence
Key, T.J.,1999,BRE04758
Japan, Not specifiedLSS, 1969
427 By MailQuestionnaire(nos)
ProspectiveCohort
488988 24.0 years times/week
Breast cancer >=5vs.<=1
40.95(0.71, 1.27)
0.531
A G
incidence
Shannon,J.,2003,BRE18714
China, Not specifiedBreast Self-Exam (BSE),unknown
Through healthorg. (screening,healthinsurance)
FFQ (nos)Nested CaseControl
nullfood groupintake/caloric intake
Breast cancerHighestquartilevs.Lowest
20.37(0.23, 0.6)
0.0001
A C E G
incidence
Sauvaget,C.,2003,BRE20841
Japan, Not specified, Atomicbomb survivorsLSS, 1969
34 - 103 76 By Mail FFQ (nos)ProspectiveCohort
23667.0 16.0 years times/week
Breast cancerdaily oralmost dailyvs.once per
30.91(0.48, 1.72)
0.7006
A B D E G
cancer death
Li, W.,2005,BRE23123China, AsianShanghai BSE
130
Through socialorganization(profession,religion)
FFQ-Semi-quantitative
Nested CaseControl
1070 times/year
Breast cancer >436.0vs.<201.0
50.3(0.1, 0.5)
0.001
E
incidence
28

Author, Year,WCRF Code
Country, Ethnicity, Specialcharacteristics
Age Cases n Caseascertainment
Type of studyNon-Cases n
Lenght offollow-up / loss
Assessmentdetail
Additional details Unit Outcome Subgroup Contrast Nocat. OR (95% CI) p
valueptrend A B C D E F G
adjustments
2.2.2.1
Citrus fruits
Menopausal status not specified
Li, W.,2005,BRE23123China, AsianShanghai BSE
130
Through socialorganization(profession,religion)
FFQ-Semi-quantitative
Nested CaseControl
1070 rutacceae times/year
Breast cancer >53.0vs.<13.0
50.9(0.9, 1.6)
0.72 A E
incidence
2.2.2.1.1
Grapefruit
Post-menopausal
Monroe, K.R. etal.,2007,BRE80126
United States, Multi-ethnic,Post menopausalHawaii-Los AngelesMultiethnic Cohort (MEC)
45 - 75 1657national cancerregisters
FFQProspectiveCohort
46080.0 7.0 years
Grapefruit intake, g perday, 1 grapefruit =240g per day, notincluding grapefruit
g/day
Breast cancer >=60vs.None
41.3(1.06, 1.58)
0.015
A B C D E F G
incidence
Monroe, K.R. etal.,2007,BRE80126
United States, Multi-ethnic,Post menopausalHawaii-Los AngelesMultiethnic Cohort (MEC)
45 - 75 1657national cancerregisters
FFQProspectiveCohort
46080.0 7.0 years
Grapefruit intake, g per1000kcal per day, 1grapefruit = 240g perday, not including
g/1000kcal/day
Breast cancer >=30vs.None
41.25(1.03, 1.52)
0.013
A B C D E F G
incidence
Kim EH, etal.,2008,BRE80156
United StatesNurses' Health Study (NHS)Cohort 1984
30 - 55 3570 medical recordssemi-quantitative ffq
ProspectiveCohort
69841Grapefruit,cumulatively averagedintake
items/day
Breast cancerPost-menopausal
>=1/4vs.0
40.97(0.83, 1.14)
0.34 A C D E F G
incidence
Menopausal status not specified
Kim EH, etal.,2008,BRE80156
United StatesNurses' Health Study (NHS)Cohort 1984
30 - 55 4315 medical recordssemi-quantitative ffq
ProspectiveCohort
72735Grapefruit,cumulatively averagedintake
items/day
Breast cancer >=1/4vs.0
41.0(0.86, 1.15)
0.5 A C D E F G
incidence
Kim EH, etal.,2008,BRE80156
United StatesNurses' Health Study (NHS)Cohort 1984
30 - 55 medical recordssemi-quantitative ffq
ProspectiveCohort
77050.0Grapefruit,cumulatively averagedintake
items/day
Breast cancerNever HRTusers
>=1/4vs.0
40.78(0.59, 1.04)
0.03 A C D E F G
incidence
Kim EH, etal.,2008,BRE80156
United StatesNurses' Health Study (NHS)Cohort 1984
30 - 55 medical recordssemi-quantitative ffq
ProspectiveCohort
77050.0Grapefruit,cumulatively averagedintake
items/day
Breast cancer ER-/PR-Never HRTusers
>=1/4vs.0
40.6(0.37, 0.98)
0.03 A C D E F G
incidence
2.2.2.2
Apples, pears
Menopausal status not specified
Li, W.,2005,BRE23123China, AsianShanghai BSE
130
Through socialorganization(profession,religion)
FFQ-Semi-quantitative
Nested CaseControl
1070 Rosaceae times/year
Breast cancer >192.0vs.<49.0
51.1(0.5, 2.4)
0.9 A E
incidence
29

Author, Year,WCRF Code
Country, Ethnicity, Specialcharacteristics
Age Cases n Caseascertainment
Type of studyNon-Cases n
Lenght offollow-up / loss
Assessmentdetail
Additional details Unit Outcome Subgroup Contrast Nocat. OR (95% CI) p
valueptrend A B C D E F G
adjustments
Cachi (persimmon)
Menopausal status not specified
Shannon,J.,2003,BRE18714
China, Not specifiedBreast Self-Exam (BSE),unknown
Through healthorg. (screening,healthinsurance)
FFQ (nos)Nested CaseControl
null ebenaceaeserving/day
Breast cancerHighestquartilevs.Lowest
20.62(0.43, 0.88)
0.009
A C E G
incidence
Li, W.,2005,BRE23123China, AsianShanghai BSE
130
Through socialorganization(profession,religion)
FFQ-Semi-quantitative
Nested CaseControl
1070 Ebenaceae times/year
Breast cancer 4.0 - 56.0vs.<0.0
40.6(0.4, 1.1)
0.10 A E
incidence
Lychee
Menopausal status not specified
Li, W.,2005,BRE23123China, AsianShanghai BSE
130
Through socialorganization(profession,religion)
FFQ-Semi-quantitative
Nested CaseControl
1070 Sapinadaceae times/year
Breast cancer 4.0 - 56.0vs.<0.0
40.5(0.2, 0.9)
0.03 A E
incidence
2.2.2.2.11
Grape
Menopausal status not specified
Li, W.,2005,BRE23123China, AsianShanghai BSE
130
Through socialorganization(profession,religion)
FFQ-Semi-quantitative
Nested CaseControl
1070 Vitaceae times/year
Breast cancer >27.0vs.<4.0
50.6(0.3, 1.2)
0.19 A E
incidence
2.2.2.2.7
Blueberries
Menopausal status not specified
Adebamowo, C.A.,2005,BRE21537
USA, Not specified,Registered nursesNurses' Health Study (NHS)Cohort 1976-1996
25 - 46 710
Through socialorganization(profession,religion)
FFQ-Semi-quantitative
ProspectiveCohort
707227 8.0 years serving/month
Invasive breast cancer 4.3vs.>0.99
41.25(0.86, 1.8)
0.84 A C D E F G
incidence
2.2.2.2.8
Apples
Menopausal status not specified
FrazierL.A.,2003,BRE02941
USA, Multi-ethnic,Registered nursesNurses' Health Study (NHS)Cohort 1976-1996
40 - 65
Through healthorg. (screening,healthinsurance)
FFQ (nos)Nested CaseControl
121700.0 10.0 years adolescent Unit/day
Breast cancer1.0(continuous)
11.0(0.83, 1.2)
A C D E F G
incidence
30

Author, Year,WCRF Code
Country, Ethnicity, Specialcharacteristics
Age Cases n Caseascertainment
Type of studyNon-Cases n
Lenght offollow-up / loss
Assessmentdetail
Additional details Unit Outcome Subgroup Contrast Nocat. OR (95% CI) p
valueptrend A B C D E F G
adjustments
Adebamowo, C.A.,2005,BRE21537
USA, Not specified,Registered nursesNurses' Health Study (NHS)Cohort 1976-1996
25 - 46 710
Through socialorganization(profession,religion)
FFQ-Semi-quantitative
ProspectiveCohort
707227 8.0 years serving/month
Invasive breast cancer 27.9vs.>0.99
61.16(0.77, 1.76)
0.72 A C D E F G
incidence
2.3
Beans, peas
Menopausal status not specified
Li, W.,2005,BRE23123China, AsianShanghai BSE
130
Through socialorganization(profession,religion)
FFQ-Semi-quantitative
Nested CaseControl
1070 other legumes times/year
Breast cancer >202.0vs.<97.0
50.4(0.2, 0.8)
0.006
E
incidence
Pulses (legumes)
Post-menopausal
Fung, T.T.,2005,BRE22370
U.S.A., Registered nursesNurses' Health Study (NHS)Cohort 1984
30 - 55 By Mail FFQ (nos)ProspectiveCohort
71058.0 16.0 years serving
Breast cancer ER-Post-menopausal
1.0(continuous)
10.79(0.57, 1.1)
0.16 A C D E F G
incidence
Menopausal status not specified
Li, W.,2005,BRE23123China, AsianShanghai BSE
134
Through socialorganization(profession,religion)
FFQ-Semi-quantitative
Nested CaseControl
1069 Leguminosae times/year
Breast cancer >555.0vs.<256.0
50.7(0.4, 1.3)
0.47 A E
incidence
Adebamowo, C.A.,2005,BRE21537
USA, Not specified,Registered nursesNurses' Health Study (NHS)Cohort 1976-1996
25 - 46 710
Through socialorganization(profession,religion)
FFQ-Semi-quantitative
ProspectiveCohort
706991 8.0 years beans or lentilsserving/month
Invasive breast cancer 4.3vs.>0.99
40.76(0.57, 1.0)
0.03 A C D E F G
incidence
2.3.1
Soy products
Post-menopausal
Nishio, K. etal.,2007,BRE80129
Japan, AsianJACC study, 1988
40 - 79 92 Cancer registry FFQProspectiveCohort
30454.0 7.6 years / 0.027
Soy productsconsumption, tofu,boiled beans, misosoup, lowest
Breast cancerPost-menopausal
highestconsumptionvs.others
30.88(0.41, 1.89)
0.85 A C D E F G
incidence
Menopausal status not specified
Nishio, K. etal.,2007,BRE80129
Japan, AsianJACC study, 1988
40 - 79 145 Cancer registry FFQProspectiveCohort
30454.0 7.6 years / 0.027
Soy productsconsumption, tofu,boiled beans, misosoup, lowest
Breast cancerhighestconsumptionvs.others
31.42(0.84, 2.4)
0.43 A C D E F G
incidence
Soya foods
Menopausal status not specified
31

Author, Year,WCRF Code
Country, Ethnicity, Specialcharacteristics
Age Cases n Caseascertainment
Type of studyNon-Cases n
Lenght offollow-up / loss
Assessmentdetail
Additional details Unit Outcome Subgroup Contrast Nocat. OR (95% CI) p
valueptrend A B C D E F G
adjustments
Yamamoto,S.,2003,BRE17122
Japan, Not specifiedJapan, 1990
40 - 59 179 UnspecifiedQuestionnaire(nos)
ProspectiveCohort
209354 9.0 years / 0.001 times/week
Breast cancer almost dailyvs.<2
30.81(0.49, 1.3)
0.44 A B C E F G
incidence
Li, W.,2005,BRE23123China, AsianShanghai BSE
130
Through socialorganization(profession,religion)
FFQ-Semi-quantitative
Nested CaseControl
1070 times/year
Breast cancer >370.0vs.<121.0
51.0(0.5, 1.9)
0.81 E
incidence
2.3.1.1
Fermented beancurd
Menopausal status not specified
Li, W.,2005,BRE23123China, AsianShanghai BSE
130
Through socialorganization(profession,religion)
FFQ-Semi-quantitative
Nested CaseControl
1070 Fermented beancurd times/year
Breast cancer Evervs.Never
20.8(0.5, 1.2)
A
incidence
Miso soup
Post-menopausal
Fujimaki,S.,2003,BRE03015
Japan, Not specified,Registered nursesJapan Nurses' Health Study
176 FFQ (nos)ProspectiveCohort
3952 days/week
Breast cancerPost-menopausal
>=6vs.<=1
30.51(0.3, 0.84)
F
incidence
Nishio, K. etal.,2007,BRE80129
Japan, AsianJACC study, 1988
40 - 79 92 Cancer registry FFQProspectiveCohort
30454.0 7.6 years / 0.027 Miso soupconsumption
cups/day
Breast cancerPost-menopausal
>=2vs.<1
30.92(0.52, 1.62)
0.76 A C D E F G
incidence
Menopausal status not specified
Key, T.J.,1999,BRE04758
Japan, Not specifiedLSS, 1969
427 By MailQuestionnaire(nos)
ProspectiveCohort
488987 24.0 years times/week
Breast cancer >=5vs.<=1
40.87(0.68, 1.12)
0.306
A G
incidence
Yamamoto,S.,2003,BRE17122
Japan, Not specifiedJapan, 1990
40 - 59 179 UnspecifiedQuestionnaire(nos)
ProspectiveCohort
209354 9.0 years / 0.001 Cups/day
Breast cancer >=3vs.<1
40.6(0.34, 1.1)
0.042
A B C E F G
incidence
Nishio, K. etal.,2007,BRE80129
Japan, AsianJACC study, 1988
40 - 79 145 Cancer registry FFQProspectiveCohort
30454.0 7.6 years / 0.027 Miso soupconsumption
cups/day
Breast cancer >=2vs.<1
31.01(0.65, 1.56)
0.94 A C D E F G
incidence
Natto (fermented soy)
Post-menopausal
Fujimaki,S.,2003,BRE03015
Japan, Not specified,Registered nursesJapan Nurses' Health Study
176 FFQ (nos)ProspectiveCohort
3952 days/week
Breast cancerPost-menopausal
>=6vs.<=1
31.07(0.61, 2.0)
F
incidence
32

Author, Year,WCRF Code
Country, Ethnicity, Specialcharacteristics
Age Cases n Caseascertainment
Type of studyNon-Cases n
Lenght offollow-up / loss
Assessmentdetail
Additional details Unit Outcome Subgroup Contrast Nocat. OR (95% CI) p
valueptrend A B C D E F G
adjustments
2.3.2
Beans
Post-menopausal
Nishio, K. etal.,2007,BRE80129
Japan, AsianJACC study, 1988
40 - 79 92 Cancer registry FFQProspectiveCohort
30454.0 7.6 years / 0.027 Boiled beanstimes/week
Breast cancerPost-menopausal
>=3vs.<1
30.89(0.5, 1.59)
0.75 A C D E F G
incidence
Menopausal status not specified
Nishio, K. etal.,2007,BRE80129
Japan, AsianJACC study, 1988
40 - 79 145 Cancer registry FFQProspectiveCohort
30454.0 7.6 years / 0.027 Boiled beanstimes/week
Breast cancer >=3vs.<1
30.77(0.47, 1.27)
0.31 A C D E F G
incidence
2.3.2.2
Tofu
Post-menopausal
Fujimaki,S.,2003,BRE03015
Japan, Not specified,Registered nursesJapan Nurses' Health Study
176 FFQ (nos)ProspectiveCohort
3952 days/week
Breast cancerPost-menopausal
>=6vs.<=1
31.73(1.02, 3.02)
F
incidence
Nishio, K. etal.,2007,BRE80129
Japan, AsianJACC study, 1988
40 - 79 92 Cancer registry FFQProspectiveCohort
30454.0 7.6 years / 0.027 Tofu consumptiontimes/week
Breast cancerPost-menopausal
Almost dailyvs.<=2
31.43(0.81, 2.52)
0.23 A C D E F G
incidence
Menopausal status not specified
Key, T.J.,1999,BRE04758
Japan, Not specifiedLSS, 1969
427 By MailQuestionnaire(nos)
ProspectiveCohort
488990 24.0 years times/week
Breast cancer >=5vs.<=1
41.07(0.78, 1.47)
0.712
A G
incidence
Nishio, K. etal.,2007,BRE80129
Japan, AsianJACC study, 1988
40 - 79 145 Cancer registry FFQProspectiveCohort
30454.0 7.6 years / 0.027 Tofu consumptiontimes/week
Breast cancer Almost dailyvs.<3
31.14(0.74, 1.77)
0.55 A C D E F G
incidence
2.3.3
String beans
Menopausal status not specified
Adebamowo, C.A.,2005,BRE21537
USA, Not specified,Registered nursesNurses' Health Study (NHS)Cohort 1976-1996
25 - 46 710
Through socialorganization(profession,religion)
FFQ-Semi-quantitative
ProspectiveCohort
706991 8.0 years serving/month
Invasive breast cancer 17.14vs.>0.99
51.29(0.81, 2.05)
0.48 A C D E F G
incidence
2.4
33

Author, Year,WCRF Code
Country, Ethnicity, Specialcharacteristics
Age Cases n Caseascertainment
Type of studyNon-Cases n
Lenght offollow-up / loss
Assessmentdetail
Additional details Unit Outcome Subgroup Contrast Nocat. OR (95% CI) p
valueptrend A B C D E F G
adjustments
Nuts and Seeds
Menopausal status not specified
Key,T.J.A.,1996,BRE15654
United Kingdom, Notspecified, Vegetarian andhealth conscious peopleUK Cohort of Vegetarians
16 - 79
From groupswith highvegetarianlikelihood
Questionnaire(nos)
ProspectiveCohort
6435.0 16.8 years nuts or dried fruit
Breast cancerdailyconsumptionvs.less than
21.41(0.86, 2.3)
A G
cancer death
2.5
Meat and fish
Post-menopausal
Mills, P.K.,1989,BRE17837
USA, White, AdventistCalifornia Seventh-dayAdventists Cohort, 1976
25 - 99 171 By Mail FFQ (nos)ProspectiveCohort
12062 6.0 years / 1% meat, fish and poultrytimes/week
Breast cancerPost-menopausal
>=3vs.never
31.25(0.81, 1.92)
A B C D F G
incidence
Menopausal status not specified
Mills, P.K.,1989,BRE17837
USA, White, AdventistCalifornia Seventh-dayAdventists Cohort, 1976
25 - 99 199 By Mail FFQ (nos)ProspectiveCohort
102376 6.0 years / 1% meat, fish and poutrytimes/week
Breast cancer >=3vs.none
31.33(0.9, 1.95)
0.23 A B C D F G
incidence
White meat (poultry and fish)
Pre-menopausal
Holmes,M.D.,2003,BRE15400
USA, Not specified,Registered nursesNurses' Health Study (NHS)Cohort 1976-1996
30 - 55 854HospitalRecords only
FFQ-Semi-quantitative
ProspectiveCohort
53952 18.0 years serving/day
Invasive breast cancerPre-menopausal
>0.84vs.<0.35
51.01(0.79, 1.28)
0.58 A C D E F G
incidence
Post-menopausal
Holmes,M.D.,2003,BRE15400
USA, Not specified,Registered nursesNurses' Health Study (NHS)Cohort 1976-1996
30 - 55 2936HospitalRecords only
FFQ-Semi-quantitative
ProspectiveCohort
76152 18.0 years serving/day
Invasive breast cancerPost-menopausal
>0.84vs.<0.35
50.97(0.86, 1.09)
0.99 A C D E F G
incidence
Menopausal status not specified
Holmes,M.D.,2003,BRE15400
USA, Not specified,Registered nursesNurses' Health Study (NHS)Cohort 1976-1996
30 - 55HospitalRecords only
FFQ-Semi-quantitative
ProspectiveCohort
88647.0 18.0 years serving/day
Invasive breast cancer >0.84vs.<0.35
51.0(0.9, 1.1)
0.56 A C D E F G
incidence
van der Hel, O.L.,2004,BRE12728
Denmark, CaucasianMPCDRF
20 - 5 228 By MailFFQ-Semi-quantitative
Nested CaseControl
262 10.0 years fresh g/day
Breast cancer >=30vs.<15
30.76(0.5, 1.15)
A E F G
incidence
2.5.1
Meat
Pre-menopausal
34

Author, Year,WCRF Code
Country, Ethnicity, Specialcharacteristics
Age Cases n Caseascertainment
Type of studyNon-Cases n
Lenght offollow-up / loss
Assessmentdetail
Additional details Unit Outcome Subgroup Contrast Nocat. OR (95% CI) p
valueptrend A B C D E F G
adjustments
Taylor etal.,2007,BRE80008
UKUK Women's Cohort Study(UKWCS), 1993
35 - 69 283NHS CentralRegistry
FFQProspectiveCohort
15664 8.0 yearsNon-processed meat,including red meatpoultry and offal
g/day
Breast cancerpremenopausal women
Highvs.None
41.2(0.86, 1.68)
A C D E F G
incidence
Taylor etal.,2007,BRE80008
UKUK Women's Cohort Study(UKWCS), 1993
35 - 69 283NHS CentralRegistry
FFQProspectiveCohort
15664 8.0 yearsNon-processed meat,including red meatpoultry and offal
g/day
Breast cancerpremenopausal women
50.0(continuous)
11.13(1.01, 1.26)
0.03 A C D E F G
incidence
Post-menopausal
Mills, P.K.,1988,BRE17836
US, White, AdventistSeventh-day AdventistsCohort, 1960
30 - 85 73
Through socialorganization(profession,religion)
Questionnaire(nos)
Nested CaseControl
16190.020.0 years / 1.7%
Breast cancerPost-menopausal
4vs.1-3
31.15(0.53, 2.53)
0.94 B C D E
mortality/incidence
Taylor etal.,2007,BRE80008
UKUK Women's Cohort Study(UKWCS), 1993
35 - 69 395NHS CentralRegistry
FFQProspectiveCohort
17383 8.0 yearsNon-processed meat,including red meatpoultry and offal
g/day
Breast cancerpostmenopausal women
Highvs.None
41.59(1.1, 2.3)
A C D E F G
incidence
Taylor etal.,2007,BRE80008
UKUK Women's Cohort Study(UKWCS), 1993
35 - 69 395NHS CentralRegistry
FFQProspectiveCohort
17383 8.0 yearsNon-processed meat,including red meatpoultry and offal
g/day
Breast cancerpostmenopausal women
50.0(continuous)
11.09(0.99, 1.2)
0.088
A C D E F G
incidence
Menopausal status not specified
Mills, P.K.,1988,BRE17836
US, White, AdventistSeventh-day AdventistsCohort, 1960
30 - 85 139
Through socialorganization(profession,religion)
Questionnaire(nos)
Nested CaseControl
16190.020.0 years / 1.7% days/week
Breast cancer4vs.none/occasional
31.17(0.71, 1.94)
0.77 B C D E
mortality/incidence
Gaard,,1995,BRE17516
Norway, Not specified,Screening ProgramNorway National HealthScreening Service, 1974
35 - 49 248 By MailFFQ-Semi-quantitative
ProspectiveCohort
281923 10.0 years meat meals Unit/week
Breast cancer >=6vs.<=2
52.28(1.29, 4.03)
0.01 A
incidence
Taylor etal.,2007,BRE80008
UKUK Women's Cohort Study(UKWCS), 1993
35 - 69 678NHS CentralRegistry
FFQProspectiveCohort
33725 8.0 yearsNon-processed meat,including red meatpoultry and offal
g/day
Breast cancer Highvs.None
41.33(1.04, 1.69)
A C D E F G
incidence
Taylor etal.,2007,BRE80008
UKUK Women's Cohort Study(UKWCS), 1993
35 - 69 678NHS CentralRegistry
FFQProspectiveCohort
33725 8.0 yearsNon-processed meat,including red meatpoultry and offal
g/day
Breast cancer50.0(continuous)
11.1(1.03, 1.19)
0.007
A C D E F G
incidence
Meat (unspecified)
Pre-menopausal
Holmes,M.D.,2003,BRE15400
USA, Not specified,Registered nursesNurses' Health Study (NHS)Cohort 1976-1996
30 - 55 854HospitalRecords only
FFQ-Semi-quantitative
ProspectiveCohort
53952 18.0 years red and white meatserving/day
Invasive breast cancerPre-menopausal
>2.0vs.<1.11
50.9(0.69, 1.18)
0.98 A C D E F G
incidence
Post-menopausal
Holmes,M.D.,2003,BRE15400
USA, Not specified,Registered nursesNurses' Health Study (NHS)Cohort 1976-1996
30 - 55 2936HospitalRecords only
FFQ-Semi-quantitative
ProspectiveCohort
76152 18.0 years red and white meatserving/day
Invasive breast cancerPost-menopausal
>2.0vs.<1.11
50.88(0.77, 1.02)
0.21 A C D E F G
incidence
35
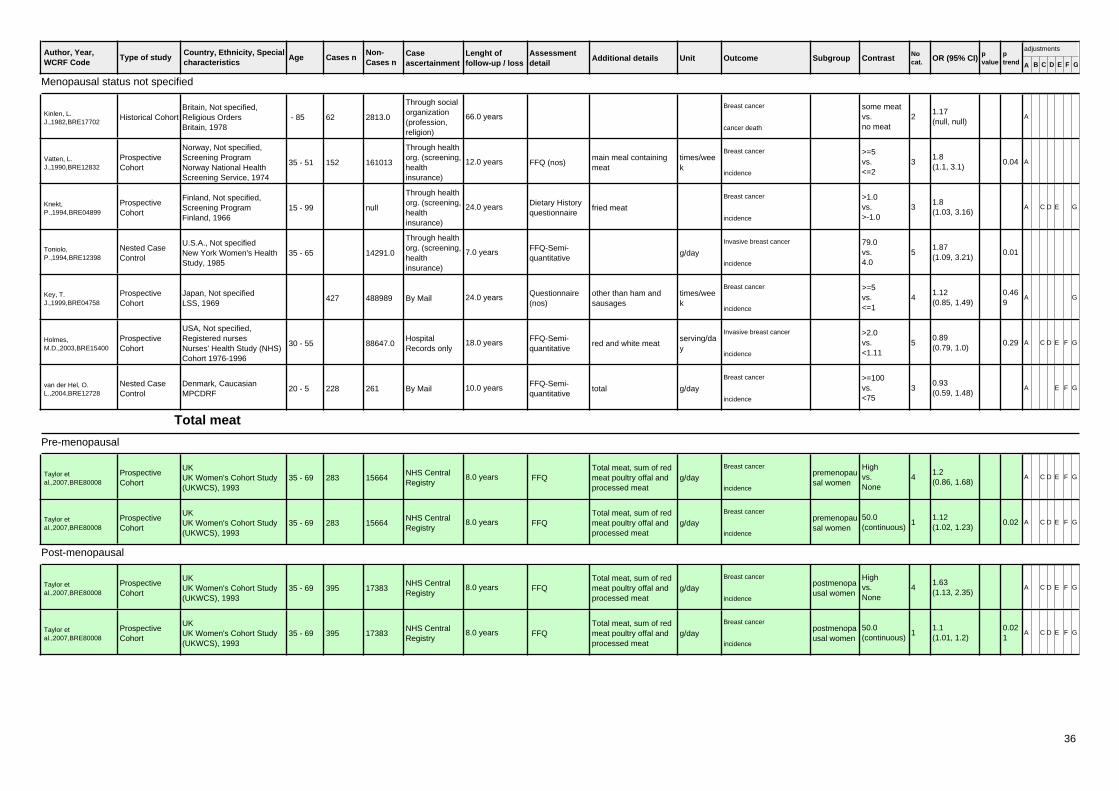
Author, Year,WCRF Code
Country, Ethnicity, Specialcharacteristics
Age Cases n Caseascertainment
Type of studyNon-Cases n
Lenght offollow-up / loss
Assessmentdetail
Additional details Unit Outcome Subgroup Contrast Nocat. OR (95% CI) p
valueptrend A B C D E F G
adjustments
Menopausal status not specified
Kinlen, L.J.,1982,BRE17702
Britain, Not specified,Religious OrdersBritain, 1978
- 85 62
Through socialorganization(profession,religion)
Historical Cohort 2813.0 66.0 yearsBreast cancer some meat
vs.no meat
21.17(null, null)
A
cancer death
Vatten, L.J.,1990,BRE12832
Norway, Not specified,Screening ProgramNorway National HealthScreening Service, 1974
35 - 51 152
Through healthorg. (screening,healthinsurance)
FFQ (nos)ProspectiveCohort
161013 12.0 years main meal containingmeat
times/week
Breast cancer >=5vs.<=2
31.8(1.1, 3.1)
0.04 A
incidence
Knekt,P.,1994,BRE04899
Finland, Not specified,Screening ProgramFinland, 1966
15 - 99
Through healthorg. (screening,healthinsurance)
Dietary Historyquestionnaire
ProspectiveCohort
null 24.0 years fried meat
Breast cancer >1.0vs.>-1.0
31.8(1.03, 3.16)
A C D E G
incidence
Toniolo,P.,1994,BRE12398
U.S.A., Not specifiedNew York Women's HealthStudy, 1985
35 - 65
Through healthorg. (screening,healthinsurance)
FFQ-Semi-quantitative
Nested CaseControl
14291.0 7.0 years g/day
Invasive breast cancer 79.0vs.4.0
51.87(1.09, 3.21)
0.01incidence
Key, T.J.,1999,BRE04758
Japan, Not specifiedLSS, 1969
427 By MailQuestionnaire(nos)
ProspectiveCohort
488989 24.0 years other than ham andsausages
times/week
Breast cancer >=5vs.<=1
41.12(0.85, 1.49)
0.469
A G
incidence
Holmes,M.D.,2003,BRE15400
USA, Not specified,Registered nursesNurses' Health Study (NHS)Cohort 1976-1996
30 - 55HospitalRecords only
FFQ-Semi-quantitative
ProspectiveCohort
88647.0 18.0 years red and white meatserving/day
Invasive breast cancer >2.0vs.<1.11
50.89(0.79, 1.0)
0.29 A C D E F G
incidence
van der Hel, O.L.,2004,BRE12728
Denmark, CaucasianMPCDRF
20 - 5 228 By MailFFQ-Semi-quantitative
Nested CaseControl
261 10.0 years total g/day
Breast cancer >=100vs.<75
30.93(0.59, 1.48)
A E F G
incidence
Total meat
Pre-menopausal
Taylor etal.,2007,BRE80008
UKUK Women's Cohort Study(UKWCS), 1993
35 - 69 283NHS CentralRegistry
FFQProspectiveCohort
15664 8.0 yearsTotal meat, sum of redmeat poultry offal andprocessed meat
g/day
Breast cancerpremenopausal women
Highvs.None
41.2(0.86, 1.68)
A C D E F G
incidence
Taylor etal.,2007,BRE80008
UKUK Women's Cohort Study(UKWCS), 1993
35 - 69 283NHS CentralRegistry
FFQProspectiveCohort
15664 8.0 yearsTotal meat, sum of redmeat poultry offal andprocessed meat
g/day
Breast cancerpremenopausal women
50.0(continuous)
11.12(1.02, 1.23)
0.02 A C D E F G
incidence
Post-menopausal
Taylor etal.,2007,BRE80008
UKUK Women's Cohort Study(UKWCS), 1993
35 - 69 395NHS CentralRegistry
FFQProspectiveCohort
17383 8.0 yearsTotal meat, sum of redmeat poultry offal andprocessed meat
g/day
Breast cancerpostmenopausal women
Highvs.None
41.63(1.13, 2.35)
A C D E F G
incidence
Taylor etal.,2007,BRE80008
UKUK Women's Cohort Study(UKWCS), 1993
35 - 69 395NHS CentralRegistry
FFQProspectiveCohort
17383 8.0 yearsTotal meat, sum of redmeat poultry offal andprocessed meat
g/day
Breast cancerpostmenopausal women
50.0(continuous)
11.1(1.01, 1.2)
0.021
A C D E F G
incidence
36

Author, Year,WCRF Code
Country, Ethnicity, Specialcharacteristics
Age Cases n Caseascertainment
Type of studyNon-Cases n
Lenght offollow-up / loss
Assessmentdetail
Additional details Unit Outcome Subgroup Contrast Nocat. OR (95% CI) p
valueptrend A B C D E F G
adjustments
Egeberg, R. etal.,2008,BRE80153
Denmark, Caucasian, PostmenopausalDiet, Cancer and Health,1993
50 - 64 378 Cancer registry FFQNested CaseControl
378 / 0.02Total meat intake, redmeat poultry fish andprocessed meat
g/day
Breast cancer >180vs.<115
42.24(1.43, 3.49)
0.01 A B C D E F
incidence
Egeberg, R. etal.,2008,BRE80153
Denmark, Caucasian, PostmenopausalDiet, Cancer and Health,1993
50 - 64 378 Cancer registry FFQNested CaseControl
378 / 0.02Total meat intake, redmeat poultry fish andprocessed meat
g/day
Breast cancer25.0(continuous)
11.09(1.02, 1.17)
A B C D E F
incidence
Egeberg, R. etal.,2008,BRE80153
Denmark, Caucasian, PostmenopausalDiet, Cancer and Health,1993
50 - 64 137 Cancer registry FFQNested CaseControl
137 / 0.02Total meat intake, redmeat poultry fish andprocessed meat
g/day
Breast cancer NAT1 fast &post-menopausal
25.0(continuous)
11.1(0.96, 1.26)
A B C D E F
incidence
Egeberg, R. etal.,2008,BRE80153
Denmark, Caucasian, PostmenopausalDiet, Cancer and Health,1993
50 - 64 218 Cancer registry FFQNested CaseControl
218 / 0.02Total meat intake, redmeat poultry fish andprocessed meat
g/day
Breast cancer NAT1 slow &post-menopausal
25.0(continuous)
11.06(0.98, 1.16)
A B C D E F
incidence
Egeberg, R. etal.,2008,BRE80153
Denmark, Caucasian, PostmenopausalDiet, Cancer and Health,1993
50 - 64 147 Cancer registry FFQNested CaseControl
147 / 0.02Total meat intake, redmeat poultry fish andprocessed meat
g/day
Breast cancer NAT2intermediate/fast & post-menopausal
25.0(continuous)
11.2(1.05, 1.37)
A B C D E F
incidence
Egeberg, R. etal.,2008,BRE80153
Denmark, Caucasian, PostmenopausalDiet, Cancer and Health,1993
50 - 64 220 Cancer registry FFQNested CaseControl
220 / 0.02Total meat intake, redmeat poultry fish andprocessed meat
g/day
Breast cancer NAT2 slow &post-menopausal
25.0(continuous)
11.01(0.93, 1.1)
A B C D E F
incidence
Menopausal status not specified
Taylor etal.,2007,BRE80008
UKUK Women's Cohort Study(UKWCS), 1993
35 - 69 678NHS CentralRegistry
FFQProspectiveCohort
33725 8.0 yearsTotal meat, sum of redmeat poultry offal andprocessed meat
g/day
Breast cancer Highvs.None
41.34(1.05, 1.71)
A C D E F G
incidence
Taylor etal.,2007,BRE80008
UKUK Women's Cohort Study(UKWCS), 1993
35 - 69 678NHS CentralRegistry
FFQProspectiveCohort
33725 8.0 yearsTotal meat, sum of redmeat poultry offal andprocessed meat
g/day
Breast cancer50.0(continuous)
11.11(1.04, 1.18)
0.001
A C D E F G
incidence
2.5.1.1
Fresh meat
Menopausal status not specified
Mills, P.K.,1989,BRE17837
USA, White, AdventistCalifornia Seventh-dayAdventists Cohort, 1976
25 - 99 209 By Mail FFQ (nos)ProspectiveCohort
107883 6.0 years / 1% other beef/vealtimes/week
Breast cancer >=1vs.never
31.06(0.71, 1.58)
0.68 A B C D F G
incidence
Voorrips, L.E.,2002,BRE13011
The Netherlands, Notspecified, Post-menopausalwomenThe Netherlands Cohort
55 - 69 783 By MailFFQ-Semi-quantitative
Case Cohort 62573.0 6.3 years g/day
Breast cancer 145.0vs.45.0
50.98(0.73, 1.33)
1 A B C D E F G
incidence
van der Hel, O.L.,2004,BRE12728
Denmark, CaucasianMPCDRF
20 - 5 228 By MailFFQ-Semi-quantitative
Nested CaseControl
262 10.0 years g/day
Breast cancer >=70vs.<45
30.93(0.6, 1.47)
A E F G
incidence
37

Author, Year,WCRF Code
Country, Ethnicity, Specialcharacteristics
Age Cases n Caseascertainment
Type of studyNon-Cases n
Lenght offollow-up / loss
Assessmentdetail
Additional details Unit Outcome Subgroup Contrast Nocat. OR (95% CI) p
valueptrend A B C D E F G
adjustments
2.5.1.2
Cured meat
Menopausal status not specified
Li, W.,2005,BRE23123China, AsianShanghai BSE
130
Through socialorganization(profession,religion)
FFQ-Semi-quantitative
Nested CaseControl
1070 preserved and cured times/year
Breast cancer >17.0vs.<4.0
51.2(0.6, 2.1)
0.67 E
incidence
Ham, Sausages and similar
Pre-menopausal
Holmes,M.D.,2003,BRE15400
USA, Not specified,Registered nursesNurses' Health Study (NHS)Cohort 1976-1996
30 - 55 854HospitalRecords only
FFQ-Semi-quantitative
ProspectiveCohort
53952 18.0 years serving/day
Invasive breast cancerPre-menopausal
>0.21vs.<0.02
50.71(0.57, 0.88)
0.05 A C D E F G
incidence
Post-menopausal
Holmes,M.D.,2003,BRE15400
USA, Not specified,Registered nursesNurses' Health Study (NHS)Cohort 1976-1996
30 - 55 2936HospitalRecords only
FFQ-Semi-quantitative
ProspectiveCohort
76152 18.0 years serving/day
Invasive breast cancerPost-menopausal
>0.21vs.<0.02
50.95(0.85, 1.08)
0.10 A C D E F G
incidence
Menopausal status not specified
Key, T.J.,1999,BRE04758
Japan, Not specifiedLSS, 1969
427 By MailQuestionnaire(nos)
ProspectiveCohort
488988 24.0 years times/week
Breast cancer >=5vs.<=1
40.78(0.48, 1.28)
0.137
A G
incidence
Key, T.J.,1999,BRE04758
Japan, Not specifiedLSS, 1969
427 By MailQuestionnaire(nos)
ProspectiveCohort
488988 24.0 years times/week
Breast cancer >=5vs.<=1
40.78(0.48, 1.28)
0.137
A G
incidence
Holmes,M.D.,2003,BRE15400
USA, Not specified,Registered nursesNurses' Health Study (NHS)Cohort 1976-1996
30 - 55HospitalRecords only
FFQ-Semi-quantitative
ProspectiveCohort
88647.0 18.0 years serving/day
Invasive breast cancer >0.21vs.<0.02
50.89(0.8, 0.98)
0.02 A C D E F G
incidence
Holmes,M.D.,2003,BRE15400
USA, Not specified,Registered nursesNurses' Health Study (NHS)Cohort 1976-1996
30 - 55HospitalRecords only
FFQ-Semi-quantitative
ProspectiveCohort
88647.0 18.0 years serving/day
Invasive breast cancer >0.21vs.<0.02
50.89(0.8, 0.98)
0.02 A C D E F G
incidence
Processed meat
Pre-menopausal
38
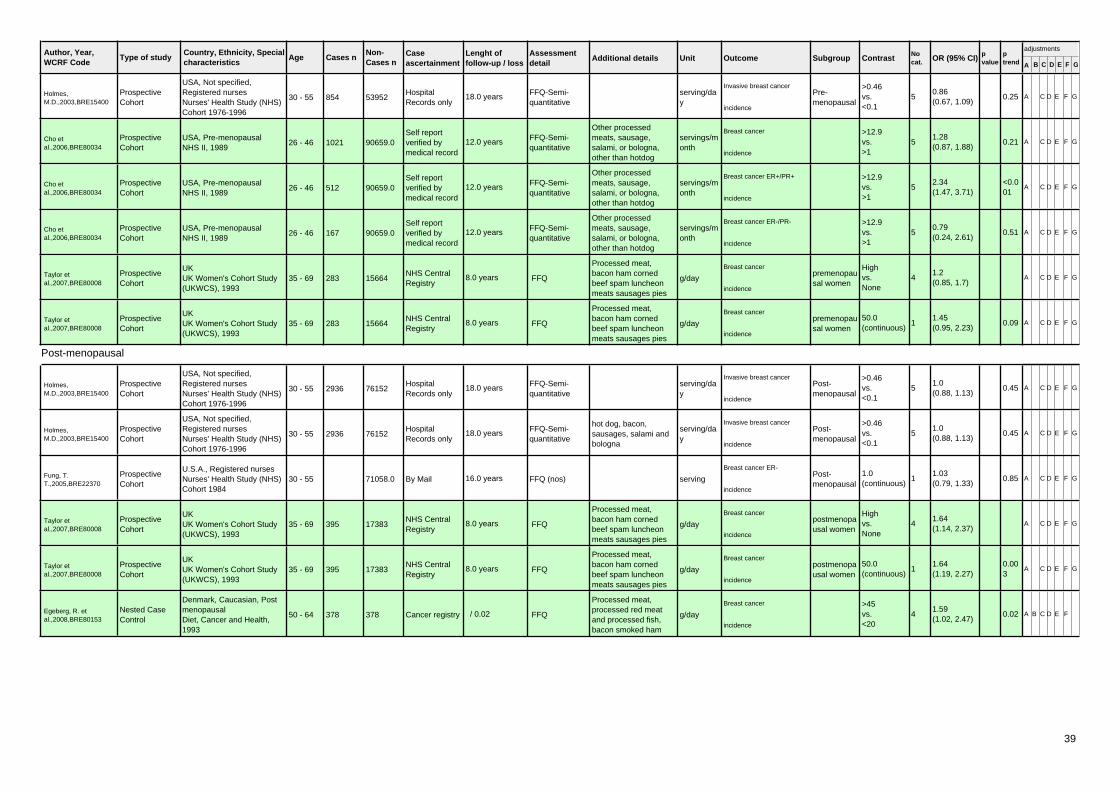
Author, Year,WCRF Code
Country, Ethnicity, Specialcharacteristics
Age Cases n Caseascertainment
Type of studyNon-Cases n
Lenght offollow-up / loss
Assessmentdetail
Additional details Unit Outcome Subgroup Contrast Nocat. OR (95% CI) p
valueptrend A B C D E F G
adjustments
Holmes,M.D.,2003,BRE15400
USA, Not specified,Registered nursesNurses' Health Study (NHS)Cohort 1976-1996
30 - 55 854HospitalRecords only
FFQ-Semi-quantitative
ProspectiveCohort
53952 18.0 years serving/day
Invasive breast cancerPre-menopausal
>0.46vs.<0.1
50.86(0.67, 1.09)
0.25 A C D E F G
incidence
Cho etal.,2006,BRE80034
USA, Pre-menopausalNHS II, 1989
26 - 46 1021Self reportverified bymedical record
FFQ-Semi-quantitative
ProspectiveCohort
90659.0 12.0 years
Other processedmeats, sausage,salami, or bologna,other than hotdog
servings/month
Breast cancer >12.9vs.>1
51.28(0.87, 1.88)
0.21 A C D E F G
incidence
Cho etal.,2006,BRE80034
USA, Pre-menopausalNHS II, 1989
26 - 46 512Self reportverified bymedical record
FFQ-Semi-quantitative
ProspectiveCohort
90659.0 12.0 years
Other processedmeats, sausage,salami, or bologna,other than hotdog
servings/month
Breast cancer ER+/PR+ >12.9vs.>1
52.34(1.47, 3.71)
<0.001
A C D E F G
incidence
Cho etal.,2006,BRE80034
USA, Pre-menopausalNHS II, 1989
26 - 46 167Self reportverified bymedical record
FFQ-Semi-quantitative
ProspectiveCohort
90659.0 12.0 years
Other processedmeats, sausage,salami, or bologna,other than hotdog
servings/month
Breast cancer ER-/PR- >12.9vs.>1
50.79(0.24, 2.61)
0.51 A C D E F G
incidence
Taylor etal.,2007,BRE80008
UKUK Women's Cohort Study(UKWCS), 1993
35 - 69 283NHS CentralRegistry
FFQProspectiveCohort
15664 8.0 years
Processed meat,bacon ham cornedbeef spam luncheonmeats sausages pies
g/day
Breast cancerpremenopausal women
Highvs.None
41.2(0.85, 1.7)
A C D E F G
incidence
Taylor etal.,2007,BRE80008
UKUK Women's Cohort Study(UKWCS), 1993
35 - 69 283NHS CentralRegistry
FFQProspectiveCohort
15664 8.0 years
Processed meat,bacon ham cornedbeef spam luncheonmeats sausages pies
g/day
Breast cancerpremenopausal women
50.0(continuous)
11.45(0.95, 2.23)
0.09 A C D E F G
incidence
Post-menopausal
Holmes,M.D.,2003,BRE15400
USA, Not specified,Registered nursesNurses' Health Study (NHS)Cohort 1976-1996
30 - 55 2936HospitalRecords only
FFQ-Semi-quantitative
ProspectiveCohort
76152 18.0 years serving/day
Invasive breast cancerPost-menopausal
>0.46vs.<0.1
51.0(0.88, 1.13)
0.45 A C D E F G
incidence
Holmes,M.D.,2003,BRE15400
USA, Not specified,Registered nursesNurses' Health Study (NHS)Cohort 1976-1996
30 - 55 2936HospitalRecords only
FFQ-Semi-quantitative
ProspectiveCohort
76152 18.0 yearshot dog, bacon,sausages, salami andbologna
serving/day
Invasive breast cancerPost-menopausal
>0.46vs.<0.1
51.0(0.88, 1.13)
0.45 A C D E F G
incidence
Fung, T.T.,2005,BRE22370
U.S.A., Registered nursesNurses' Health Study (NHS)Cohort 1984
30 - 55 By Mail FFQ (nos)ProspectiveCohort
71058.0 16.0 years serving
Breast cancer ER-Post-menopausal
1.0(continuous)
11.03(0.79, 1.33)
0.85 A C D E F G
incidence
Taylor etal.,2007,BRE80008
UKUK Women's Cohort Study(UKWCS), 1993
35 - 69 395NHS CentralRegistry
FFQProspectiveCohort
17383 8.0 years
Processed meat,bacon ham cornedbeef spam luncheonmeats sausages pies
g/day
Breast cancerpostmenopausal women
Highvs.None
41.64(1.14, 2.37)
A C D E F G
incidence
Taylor etal.,2007,BRE80008
UKUK Women's Cohort Study(UKWCS), 1993
35 - 69 395NHS CentralRegistry
FFQProspectiveCohort
17383 8.0 years
Processed meat,bacon ham cornedbeef spam luncheonmeats sausages pies
g/day
Breast cancerpostmenopausal women
50.0(continuous)
11.64(1.19, 2.27)
0.003
A C D E F G
incidence
Egeberg, R. etal.,2008,BRE80153
Denmark, Caucasian, PostmenopausalDiet, Cancer and Health,1993
50 - 64 378 Cancer registry FFQNested CaseControl
378 / 0.02
Processed meat,processed red meatand processed fish,bacon smoked ham
g/day
Breast cancer >45vs.<20
41.59(1.02, 2.47)
0.02 A B C D E F
incidence
39
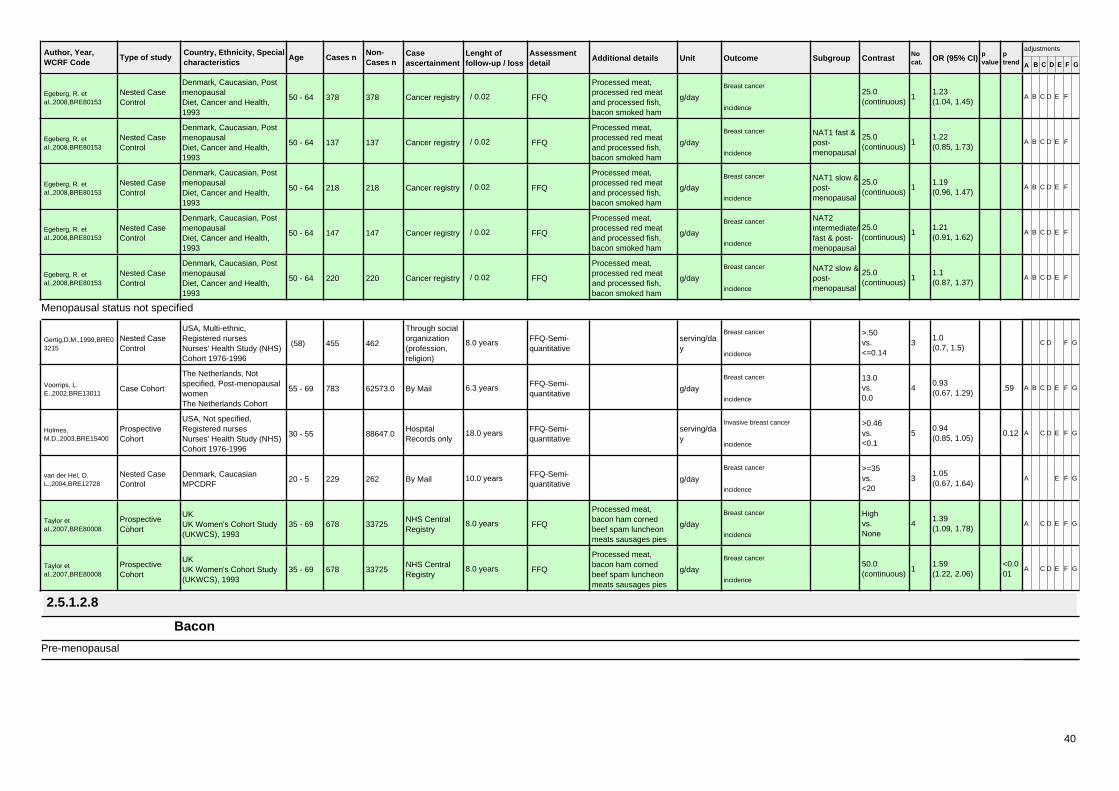
Author, Year,WCRF Code
Country, Ethnicity, Specialcharacteristics
Age Cases n Caseascertainment
Type of studyNon-Cases n
Lenght offollow-up / loss
Assessmentdetail
Additional details Unit Outcome Subgroup Contrast Nocat. OR (95% CI) p
valueptrend A B C D E F G
adjustments
Egeberg, R. etal.,2008,BRE80153
Denmark, Caucasian, PostmenopausalDiet, Cancer and Health,1993
50 - 64 378 Cancer registry FFQNested CaseControl
378 / 0.02
Processed meat,processed red meatand processed fish,bacon smoked ham
g/day
Breast cancer25.0(continuous)
11.23(1.04, 1.45)
A B C D E F
incidence
Egeberg, R. etal.,2008,BRE80153
Denmark, Caucasian, PostmenopausalDiet, Cancer and Health,1993
50 - 64 137 Cancer registry FFQNested CaseControl
137 / 0.02
Processed meat,processed red meatand processed fish,bacon smoked ham
g/day
Breast cancer NAT1 fast &post-menopausal
25.0(continuous)
11.22(0.85, 1.73)
A B C D E F
incidence
Egeberg, R. etal.,2008,BRE80153
Denmark, Caucasian, PostmenopausalDiet, Cancer and Health,1993
50 - 64 218 Cancer registry FFQNested CaseControl
218 / 0.02
Processed meat,processed red meatand processed fish,bacon smoked ham
g/day
Breast cancer NAT1 slow &post-menopausal
25.0(continuous)
11.19(0.96, 1.47)
A B C D E F
incidence
Egeberg, R. etal.,2008,BRE80153
Denmark, Caucasian, PostmenopausalDiet, Cancer and Health,1993
50 - 64 147 Cancer registry FFQNested CaseControl
147 / 0.02
Processed meat,processed red meatand processed fish,bacon smoked ham
g/day
Breast cancer NAT2intermediate/fast & post-menopausal
25.0(continuous)
11.21(0.91, 1.62)
A B C D E F
incidence
Egeberg, R. etal.,2008,BRE80153
Denmark, Caucasian, PostmenopausalDiet, Cancer and Health,1993
50 - 64 220 Cancer registry FFQNested CaseControl
220 / 0.02
Processed meat,processed red meatand processed fish,bacon smoked ham
g/day
Breast cancer NAT2 slow &post-menopausal
25.0(continuous)
11.1(0.87, 1.37)
A B C D E F
incidence
Menopausal status not specified
Gertig,D.M.,1999,BRE03215
USA, Multi-ethnic,Registered nursesNurses' Health Study (NHS)Cohort 1976-1996
(58) 455
Through socialorganization(profession,religion)
FFQ-Semi-quantitative
Nested CaseControl
462 8.0 years serving/day
Breast cancer >.50vs.<=0.14
31.0(0.7, 1.5)
C D F G
incidence
Voorrips, L.E.,2002,BRE13011
The Netherlands, Notspecified, Post-menopausalwomenThe Netherlands Cohort
55 - 69 783 By MailFFQ-Semi-quantitative
Case Cohort 62573.0 6.3 years g/day
Breast cancer 13.0vs.0.0
40.93(0.67, 1.29)
.59 A B C D E F G
incidence
Holmes,M.D.,2003,BRE15400
USA, Not specified,Registered nursesNurses' Health Study (NHS)Cohort 1976-1996
30 - 55HospitalRecords only
FFQ-Semi-quantitative
ProspectiveCohort
88647.0 18.0 years serving/day
Invasive breast cancer >0.46vs.<0.1
50.94(0.85, 1.05)
0.12 A C D E F G
incidence
van der Hel, O.L.,2004,BRE12728
Denmark, CaucasianMPCDRF
20 - 5 229 By MailFFQ-Semi-quantitative
Nested CaseControl
262 10.0 years g/day
Breast cancer >=35vs.<20
31.05(0.67, 1.64)
A E F G
incidence
Taylor etal.,2007,BRE80008
UKUK Women's Cohort Study(UKWCS), 1993
35 - 69 678NHS CentralRegistry
FFQProspectiveCohort
33725 8.0 years
Processed meat,bacon ham cornedbeef spam luncheonmeats sausages pies
g/day
Breast cancer Highvs.None
41.39(1.09, 1.78)
A C D E F G
incidence
Taylor etal.,2007,BRE80008
UKUK Women's Cohort Study(UKWCS), 1993
35 - 69 678NHS CentralRegistry
FFQProspectiveCohort
33725 8.0 years
Processed meat,bacon ham cornedbeef spam luncheonmeats sausages pies
g/day
Breast cancer50.0(continuous)
11.59(1.22, 2.06)
<0.001
A C D E F G
incidence
2.5.1.2.8
Bacon
Pre-menopausal
40

Author, Year,WCRF Code
Country, Ethnicity, Specialcharacteristics
Age Cases n Caseascertainment
Type of studyNon-Cases n
Lenght offollow-up / loss
Assessmentdetail
Additional details Unit Outcome Subgroup Contrast Nocat. OR (95% CI) p
valueptrend A B C D E F G
adjustments
Holmes,M.D.,2003,BRE15400
USA, Not specified,Registered nursesNurses' Health Study (NHS)Cohort 1976-1996
30 - 55 854HospitalRecords only
FFQ-Semi-quantitative
ProspectiveCohort
53952 18.0 years serving/day
Invasive breast cancerPre-menopausal
>0.14vs.<0.0
50.93(0.73, 1.19)
0.79 A C D E F G
incidence
Cho etal.,2006,BRE80034
USA, Pre-menopausalNHS II, 1989
26 - 46 1021Self reportverified bymedical record
FFQ-Semi-quantitative
ProspectiveCohort
90659.0 12.0 years Baconservings/month
Breast cancer >=4.3vs.<1
40.93(0.68, 1.25)
0.62 A C D E F G
incidence
Cho etal.,2006,BRE80034
USA, Pre-menopausalNHS II, 1989
26 - 46 512Self reportverified bymedical record
FFQ-Semi-quantitative
ProspectiveCohort
90659.0 12.0 years Baconservings/month
Breast cancer ER+/PR+ >=4.3vs.<1
41.12(0.76, 1.66)
0.53 A C D E F G
incidence
Cho etal.,2006,BRE80034
USA, Pre-menopausalNHS II, 1989
26 - 46 167Self reportverified bymedical record
FFQ-Semi-quantitative
ProspectiveCohort
90659.0 12.0 years Baconservings/month
Breast cancer ER-/PR- >=4.3vs.<1
40.23(0.06, 0.93)
0.03 A C D E F G
incidence
Post-menopausal
Zheng,W.,1998,BRE17170
U.S.A., Not specifiedIowa Women's Health Study
55 - 69 260 By MailFFQ-Semi-quantitative
Nested CaseControl
643 10.0 years g
Breast cancerPost-menopausal
very welldonevs.rare medium
31.64(0.92, 2.93)
0.02 A D E F
incidence
Holmes,M.D.,2003,BRE15400
USA, Not specified,Registered nursesNurses' Health Study (NHS)Cohort 1976-1996
30 - 55 2936HospitalRecords only
FFQ-Semi-quantitative
ProspectiveCohort
76152 18.0 years serving/day
Invasive breast cancerPost-menopausal
>0.14vs.<0.0
51.01(0.89, 1.14)
0.68 A C D E F G
incidence
Menopausal status not specified
Gertig,D.M.,1999,BRE03215
USA, Multi-ethnic,Registered nursesNurses' Health Study (NHS)Cohort 1976-1996
(58) 453
Through socialorganization(profession,religion)
FFQ-Semi-quantitative
Nested CaseControl
459 8.0 years serving/day
Breast cancer >0.07vs.never
31.4(1.0, 1.9)
C D F G
incidence
Holmes,M.D.,2003,BRE15400
USA, Not specified,Registered nursesNurses' Health Study (NHS)Cohort 1976-1996
30 - 55HospitalRecords only
FFQ-Semi-quantitative
ProspectiveCohort
88647.0 18.0 years serving/day
Invasive breast cancer >0.14vs.<0.0
50.96(0.87, 1.07)
0.92 A C D E F G
incidence
Holmes,M.D.,2003,BRE15400
USA, Not specified,Registered nursesNurses' Health Study (NHS)Cohort 1976-1996
30 - 55HospitalRecords only
FFQ-Semi-quantitative
ProspectiveCohort
88647.0 18.0 years serving/day
Invasive breast cancer >0.14vs.<0.0
50.96(0.87, 1.07)
0.92 A C D E F G
incidence
2.5.1.2.9
Hot dog
41

Author, Year,WCRF Code
Country, Ethnicity, Specialcharacteristics
Age Cases n Caseascertainment
Type of studyNon-Cases n
Lenght offollow-up / loss
Assessmentdetail
Additional details Unit Outcome Subgroup Contrast Nocat. OR (95% CI) p
valueptrend A B C D E F G
adjustments
Pre-menopausal
Holmes,M.D.,2003,BRE15400
USA, Not specified,Registered nursesNurses' Health Study (NHS)Cohort 1976-1996
30 - 55 854HospitalRecords only
FFQ-Semi-quantitative
ProspectiveCohort
53952 18.0 years serving/day
Invasive breast cancerPre-menopausal
>0.12vs.<0.01
51.16(0.94, 1.44)
0.11 A C D E F G
incidence
Cho etal.,2006,BRE80034
USA, Pre-menopausalNHS II, 1989
26 - 46 1021Self reportverified bymedical record
FFQ-Semi-quantitative
ProspectiveCohort
90659.0 12.0 years Hot dogservings/month
Breast cancer >=4.3vs.<1
41.14(0.83, 1.57)
0.05 A C D E F G
incidence
Cho etal.,2006,BRE80034
USA, Pre-menopausalNHS II, 1989
26 - 46 512Self reportverified bymedical record
FFQ-Semi-quantitative
ProspectiveCohort
90659.0 12.0 years Hot dogservings/month
Breast cancer ER+/PR+ >=4.3vs.<1
41.43(0.93, 2.17)
0.005
A C D E F G
incidence
Cho etal.,2006,BRE80034
USA, Pre-menopausalNHS II, 1989
26 - 46 167Self reportverified bymedical record
FFQ-Semi-quantitative
ProspectiveCohort
90659.0 12.0 years Hotdogservings/month
Breast cancer ER-/PR- >=4.3vs.<1
40.56(0.2, 1.56)
0.77 A C D E F G
incidence
Post-menopausal
Holmes,M.D.,2003,BRE15400
USA, Not specified,Registered nursesNurses' Health Study (NHS)Cohort 1976-1996
30 - 55 2936HospitalRecords only
FFQ-Semi-quantitative
ProspectiveCohort
76152 18.0 years serving/day
Invasive breast cancerPost-menopausal
>0.12vs.<0.01
51.01(0.9, 1.14)
0.81 A C D E F G
incidence
Menopausal status not specified
FrazierL.A.,2003,BRE02941
USA, Multi-ethnic,Registered nursesNurses' Health Study (NHS)Cohort 1976-1996
40 - 65
Through healthorg. (screening,healthinsurance)
FFQ (nos)Nested CaseControl
121700.0 10.0 years adolescent Unit/day
Breast cancer1.0(continuous)
10.82(0.52, 1.31)
A C D E F G
incidence
Holmes,M.D.,2003,BRE15400
USA, Not specified,Registered nursesNurses' Health Study (NHS)Cohort 1976-1996
30 - 55HospitalRecords only
FFQ-Semi-quantitative
ProspectiveCohort
88647.0 18.0 years serving/day
Invasive breast cancer >0.12vs.<0.01
51.04(0.95, 1.15)
0.35 A C D E F G
incidence
Holmes,M.D.,2003,BRE15400
USA, Not specified,Registered nursesNurses' Health Study (NHS)Cohort 1976-1996
30 - 55HospitalRecords only
FFQ-Semi-quantitative
ProspectiveCohort
88647.0 18.0 years serving/day
Invasive breast cancer >0.12vs.<0.01
51.04(0.95, 1.15)
0.35 A C D E F G
incidence
2.5.1.3
Red meat
Pre-menopausal
42

Author, Year,WCRF Code
Country, Ethnicity, Specialcharacteristics
Age Cases n Caseascertainment
Type of studyNon-Cases n
Lenght offollow-up / loss
Assessmentdetail
Additional details Unit Outcome Subgroup Contrast Nocat. OR (95% CI) p
valueptrend A B C D E F G
adjustments
Cho, E.,2003,BRE17370
US, Multi-ethnic, Pre-menopausalNHS II, 1989
25 - 42 714 By MailFFQ-Semi-quantitative
ProspectiveCohort
90655 8.0 years serving/day
Invasive breast cancerPre-menopausal
1.5vs.0.2
51.2(0.91, 1.58)
.20 A C D E F G
incidence
Holmes,M.D.,2003,BRE15400
USA, Not specified,Registered nursesNurses' Health Study (NHS)Cohort 1976-1996
30 - 55 854HospitalRecords only
FFQ-Semi-quantitative
ProspectiveCohort
53952 18.0 years serving/day
Invasive breast cancerPre-menopausal
>1.32vs.<0.55
50.94(0.72, 1.22)
0.90 A C D E F G
incidence
FrazierL.A.,2004,BRE02942
USA, Multi-ethnic,Registered nursesNurses' Health study II
34 - 51 361
Through healthorg. (screening,healthinsurance)
FFQ (nos)Historical Cohort 47517 9.0 years adolescent dietserving/day
Breast cancerPre-menopausal
2.5vs.0.7
51.22(0.82, 1.82)
0.17 A C D E F G
incidence
Cho etal.,2006,BRE80034
USA, Pre-menopausalNHS II, 1989
26 - 46 1021Self reportverified bymedical record
FFQ-Semi-quantitative
ProspectiveCohort
90659.0 12.0 years Red meatservings/week
Breast cancer >10.5vs.<=3
51.27(0.96, 1.67)
0.28 A C D E F G
incidence
Cho etal.,2006,BRE80034
USA, Pre-menopausalNHS II, 1989
26 - 46 1021Self reportverified bymedical record
FFQ-Semi-quantitative
ProspectiveCohort
90659.0 12.0 years Beef or lamb as a maindish
servings/month
Breast cancer >=4.3vs.<1
41.1(0.86, 1.39)
0.17 A C D E F G
incidence
Cho etal.,2006,BRE80034
USA, Pre-menopausalNHS II, 1989
26 - 46 1021Self reportverified bymedical record
FFQ-Semi-quantitative
ProspectiveCohort
90659.0 12.0 years Beef pork or lamb as asandwich or mixed dish
servings/month
Breast cancer >12.9vs.<1
51.01(0.63, 1.61)
0.91 A C D E F G
incidence
Cho etal.,2006,BRE80034
USA, Pre-menopausalNHS II, 1989
26 - 46 512Self reportverified bymedical record
FFQ-Semi-quantitative
ProspectiveCohort
90659.0 12.0 years Red meatservings/week
Breast cancer ER+/PR+ >10.5vs.<=3
51.97(1.35, 2.88)
0.001
A C D E F G
incidence
Cho etal.,2006,BRE80034
USA, Pre-menopausalNHS II, 1989
26 - 46 512Self reportverified bymedical record
FFQ-Semi-quantitative
ProspectiveCohort
90659.0 12.0 years Beef or lamb as a maindish
servings/month
Breast cancer ER+/PR+ >=4.3vs.<1
41.33(0.93, 1.9)
0.03 A C D E F G
incidence
Cho etal.,2006,BRE80034
USA, Pre-menopausalNHS II, 1989
26 - 46 512Self reportverified bymedical record
FFQ-Semi-quantitative
ProspectiveCohort
90659.0 12.0 years Beef pork or lamb as asandwich or mixed dish
servings/month
Breast cancer ER+/PR+ >12.9vs.<1
51.64(0.92, 2.93)
0.35 A C D E F G
incidence
Cho etal.,2006,BRE80034
USA, Pre-menopausalNHS II, 1989
26 - 46 512Self reportverified bymedical record
FFQ-Semi-quantitative
ProspectiveCohort
90659.0 12.0 yearsCumulative averagedred meat intake, from1991 1995 1999 FFQs
serving/day
Breast cancer ER+/PR+1.0(continuous)
11.44(1.18, 1.77)
A C D E F G
incidence
Cho etal.,2006,BRE80034
USA, Pre-menopausalNHS II, 1989
26 - 46 512Self reportverified bymedical record
FFQ-Semi-quantitative
ProspectiveCohort
90659.0 12.0 years Baseline red meatintake, from 1991 FFQ
serving/day
Breast cancer ER+/PR+1.0(continuous)
11.35(1.14, 1.6)
A C D E F G
incidence
Cho etal.,2006,BRE80034
USA, Pre-menopausalNHS II, 1989
26 - 46 512Self reportverified bymedical record
FFQ-Semi-quantitative
ProspectiveCohort
90659.0 12.0 yearsMost recent updatedred meat intake, from1995 FFQ
serving/day
Breast cancer ER+/PR+1.0(continuous)
11.32(1.1, 1.57)
A C D E F G
incidence
Cho etal.,2006,BRE80034
USA, Pre-menopausalNHS II, 1989
26 - 46 167Self reportverified bymedical record
FFQ-Semi-quantitative
ProspectiveCohort
90659.0 12.0 years Red meatservings/week
Breast cancer ER-/PR- >10.5vs.<=3
50.89(0.43, 1.84)
0.28 A C D E F G
incidence
43

Author, Year,WCRF Code
Country, Ethnicity, Specialcharacteristics
Age Cases n Caseascertainment
Type of studyNon-Cases n
Lenght offollow-up / loss
Assessmentdetail
Additional details Unit Outcome Subgroup Contrast Nocat. OR (95% CI) p
valueptrend A B C D E F G
adjustments
Cho etal.,2006,BRE80034
USA, Pre-menopausalNHS II, 1989
26 - 46 167Self reportverified bymedical record
FFQ-Semi-quantitative
ProspectiveCohort
90659.0 12.0 years Beef or lamb as a maindish
servings/month
Breast cancer ER-/PR- >=4.3vs.<1
40.79(0.44, 1.42)
0.31 A C D E F G
incidence
Cho etal.,2006,BRE80034
USA, Pre-menopausalNHS II, 1989
26 - 46 167Self reportverified bymedical record
FFQ-Semi-quantitative
ProspectiveCohort
90659.0 12.0 years Beef pork or lamb as asandwich or mixed dish
servings/month
Breast cancer ER-/PR- >12.9vs.<1
50.25(0.03, 1.93)
0.64 A C D E F G
incidence
Kabat GC, Miller AB,Jain M, RohanTE,2007,BRE80138
Canada, Screening ProgramCanadian National BreastScreening Study
40 - 59 1171 Cancer registry FFQProspectiveCohort
48662.0 16.4 years Red meat intake g/day
Breast cancerPre-menopausal
>108.99vs.<48.48
50.87(0.71, 1.06)
0.27 A B C D E F G
incidence
Taylor etal.,2007,BRE80008
UKUK Women's Cohort Study(UKWCS), 1993
35 - 69 283NHS CentralRegistry
FFQProspectiveCohort
15664 8.0 years
Red meat, beef porklamb other red meatsincluded in mixeddishes
g/day
Breast cancerpremenopausal women
Highvs.None
41.32(0.93, 1.88)
A C D E F G
incidence
Taylor etal.,2007,BRE80008
UKUK Women's Cohort Study(UKWCS), 1993
35 - 69 283NHS CentralRegistry
FFQProspectiveCohort
15664 8.0 years
Red meat, beef porklamb other red meatsincluded in mixeddishes
g/day
Breast cancerpremenopausal women
50.0(continuous)
11.13(0.99, 1.29)
0.08 A C D E F G
incidence
Post-menopausal
Holmes,M.D.,2003,BRE15400
USA, Not specified,Registered nursesNurses' Health Study (NHS)Cohort 1976-1996
30 - 55 2936HospitalRecords only
FFQ-Semi-quantitative
ProspectiveCohort
76152 18.0 years serving/day
Invasive breast cancerPost-menopausal
>1.32vs.<0.55
50.99(0.86, 1.13)
0.66 A C D E F G
incidence
Fung, T.T.,2005,BRE22370
U.S.A., Registered nursesNurses' Health Study (NHS)Cohort 1984
30 - 55 By Mail FFQ (nos)ProspectiveCohort
71058.0 16.0 years serving
Breast cancer ER-Post-menopausal
1.0(continuous)
11.06(0.84, 1.35)
0.62 A C D E F G
incidence
Kabat GC, Miller AB,Jain M, RohanTE,2007,BRE80138
Canada, Screening ProgramCanadian National BreastScreening Study
40 - 59 993 Cancer registry FFQProspectiveCohort
48662.0 16.4 years Red meat intake g/day
Breast cancerPost-menopausal
>108.99vs.<48.48
51.08(0.88, 1.34)
0.62 A B C D E F G
incidence
Taylor etal.,2007,BRE80008
UKUK Women's Cohort Study(UKWCS), 1993
35 - 69 395NHS CentralRegistry
FFQProspectiveCohort
17383 8.0 years
Red meat, beef porklamb other red meatsincluded in mixeddishes
g/day
Breast cancerpostmenopausal women
Highvs.None
41.56(1.09, 2.23)
A C D E F G
incidence
Taylor etal.,2007,BRE80008
UKUK Women's Cohort Study(UKWCS), 1993
35 - 69 395NHS CentralRegistry
FFQProspectiveCohort
17383 8.0 years
Red meat, beef porklamb other red meatsincluded in mixeddishes
g/day
Breast cancerpostmenopausal women
50.0(continuous)
11.12(1.01, 1.26)
0.04 C D E F G
incidence
Egeberg, R. etal.,2008,BRE80153
Denmark, Caucasian, PostmenopausalDiet, Cancer and Health,1993
50 - 64 378 Cancer registry FFQNested CaseControl
378 / 0.02 Red meat, beef vealpork lamb offal
g/day
Breast cancer >80vs.<50
41.65(1.09, 2.5)
0.03 A B C D E F
incidence
Egeberg, R. etal.,2008,BRE80153
Denmark, Caucasian, PostmenopausalDiet, Cancer and Health,1993
50 - 64 378 Cancer registry FFQNested CaseControl
378 / 0.02 Red meat, beef vealpork lamb offal
g/day
Breast cancer25.0(continuous)
11.15(1.01, 1.31)
A B C D E F
incidence
44

Author, Year,WCRF Code
Country, Ethnicity, Specialcharacteristics
Age Cases n Caseascertainment
Type of studyNon-Cases n
Lenght offollow-up / loss
Assessmentdetail
Additional details Unit Outcome Subgroup Contrast Nocat. OR (95% CI) p
valueptrend A B C D E F G
adjustments
Egeberg, R. etal.,2008,BRE80153
Denmark, Caucasian, PostmenopausalDiet, Cancer and Health,1993
50 - 64 137 Cancer registry FFQNested CaseControl
137 / 0.02 Red meat, beef vealpork lamb offal
g/day
Breast cancer NAT1 fast &post-menopausal
25.0(continuous)
11.27(0.98, 1.64)
A B C D E F
incidence
Egeberg, R. etal.,2008,BRE80153
Denmark, Caucasian, PostmenopausalDiet, Cancer and Health,1993
50 - 64 218 Cancer registry FFQNested CaseControl
218 / 0.02 Red meat, beef vealpork lamb offal
g/day
Breast cancer NAT1 slow &post-menopausal
25.0(continuous)
11.03(0.87, 1.23)
A B C D E F
incidence
Egeberg, R. etal.,2008,BRE80153
Denmark, Caucasian, PostmenopausalDiet, Cancer and Health,1993
50 - 64 147 Cancer registry FFQNested CaseControl
147 / 0.02 Red meat, beef vealpork lamb offal
g/day
Breast cancer NAT2intermediate/fast & post-menopausal
25.0(continuous)
11.37(1.07, 1.76)
A B C D E F
incidence
Egeberg, R. etal.,2008,BRE80153
Denmark, Caucasian, PostmenopausalDiet, Cancer and Health,1993
50 - 64 220 Cancer registry FFQNested CaseControl
220 / 0.02 Red meat, beef vealpork lamb offal
g/day
Breast cancer NAT2 slow &post-menopausal
25.0(continuous)
11.0(0.85, 1.18)
A B C D E F
incidence
Menopausal status not specified
Gertig,D.M.,1999,BRE03215
USA, Multi-ethnic,Registered nursesNurses' Health Study (NHS)Cohort 1976-1996
(58) 255
Through socialorganization(profession,religion)
FFQ-Semi-quantitative
Nested CaseControl
267 8.0 years months
Breast cancer NAT2genotyperapid
>=1.0vs.<=0.5
31.1(0.7, 1.8)
C D F G
incidence
Gertig,D.M.,1999,BRE03215
USA, Multi-ethnic,Registered nursesNurses' Health Study (NHS)Cohort 1976-1996
(58) 255
Through socialorganization(profession,religion)
FFQ-Semi-quantitative
Nested CaseControl
267 8.0 years months
Breast cancer NAT2genotypeslow
>=1.0vs.<=0.5
30.8(0.5, 1.3)
C D F G
incidence
Gertig,D.M.,1999,BRE03215
USA, Multi-ethnic,Registered nursesNurses' Health Study (NHS)Cohort 1976-1996
(58) 455
Through socialorganization(profession,religion)
FFQ-Semi-quantitative
Nested CaseControl
462 8.0 years serving/day
Breast cancer >1.0vs.<=0.5
30.9(0.6, 1.3)
C D F G
incidence
Holmes,M.D.,2003,BRE15400
USA, Not specified,Registered nursesNurses' Health Study (NHS)Cohort 1976-1996
30 - 55HospitalRecords only
FFQ-Semi-quantitative
ProspectiveCohort
88647.0 18.0 years serving/day
Invasive breast cancer >1.32vs.<0.55
50.94(0.84, 1.05)
0.45 A C D E F G
incidence
van der Hel, O.L.,2004,BRE12728
Denmark, CaucasianMPCDRF
20 - 5 229 By MailFFQ-Semi-quantitative
Nested CaseControl
263 10.0 years fresh g/day
Breast cancer >=45vs.<30
31.3(0.83, 2.02)
A E F G
incidence
Li, W.,2005,BRE23123China, AsianShanghai BSE
130
Through socialorganization(profession,religion)
FFQ-Semi-quantitative
Nested CaseControl
1070 excluded cured times/year
Breast cancer >303.0vs.<148.0
51.3(0.7, 2.5)
0.41 E
incidence
Kabat GC, Miller AB,Jain M, RohanTE,2007,BRE80138
Canada, Screening ProgramCanadian National BreastScreening Study
40 - 59 2491 Cancer registry FFQProspectiveCohort
46170 16.4 years Red meat intake g/day
Breast cancer >108.99vs.<48.48
50.98(0.86, 1.12)
0.91 A B C D E F G
incidence
Taylor etal.,2007,BRE80008
UKUK Women's Cohort Study(UKWCS), 1993
35 - 69 678NHS CentralRegistry
FFQProspectiveCohort
33725 8.0 years
Red meat, beef porklamb other red meatsincluded in mixeddishes
g/day
Breast cancer Highvs.None
41.41(1.1, 1.81)
A C D E F G
incidence
45

Author, Year,WCRF Code
Country, Ethnicity, Specialcharacteristics
Age Cases n Caseascertainment
Type of studyNon-Cases n
Lenght offollow-up / loss
Assessmentdetail
Additional details Unit Outcome Subgroup Contrast Nocat. OR (95% CI) p
valueptrend A B C D E F G
adjustments
Taylor etal.,2007,BRE80008
UKUK Women's Cohort Study(UKWCS), 1993
35 - 69 678NHS CentralRegistry
FFQProspectiveCohort
33725 8.0 years
Red meat, beef porklamb other red meatsincluded in mixeddishes
g/day
Breast cancer50.0(continuous)
11.12(1.03, 1.22)
0.007
A C D E F G
incidence
2.5.1.3.1
Beef
Post-menopausal
Zheng,W.,1998,BRE17170
U.S.A., Not specifiedIowa Women's Health Study
55 - 69 249 By MailFFQ-Semi-quantitative
Nested CaseControl
598 10.0 years steak g
Breast cancerPost-menopausal
very welldonevs.rare medium
32.21(1.3, 3.77)
0.01 A D E F
incidence
Menopausal status not specified
Voorrips, L.E.,2002,BRE13011
The Netherlands, Notspecified, Post-menopausalwomenThe Netherlands Cohort
55 - 69 783 By MailFFQ-Semi-quantitative
Case Cohort 62573.0 6.3 years g/day
Breast cancer 50.0vs.2.0
51.13(0.92, 1.66)
.36 A B C D E F G
incidence
FrazierL.A.,2003,BRE02941
USA, Multi-ethnic,Registered nursesNurses' Health Study (NHS)Cohort 1976-1996
40 - 65
Through healthorg. (screening,healthinsurance)
FFQ (nos)Nested CaseControl
121700.0 10.0 years adolescentserving/day
Breast cancer1.0(continuous)
11.03(0.88, 1.2)
A C D E F G
incidence
Beef index (Hamburger+beef steak+other
Menopausal status not specified
Mills, P.K.,1989,BRE17837
USA, White, AdventistCalifornia Seventh-dayAdventists Cohort, 1976
25 - 99 202 By Mail FFQ (nos)ProspectiveCohort
106667 6.0 years / 1% times/week
Breast cancer >=1vs.never
31.05(0.75, 1.47)
0.84 A B C D F G
incidence
Beef steak
Menopausal status not specified
Mills, P.K.,1989,BRE17837
USA, White, AdventistCalifornia Seventh-dayAdventists Cohort, 1976
25 - 99 201 By Mail FFQ (nos)ProspectiveCohort
106603 6.0 years / 1% times/week
Breast cancer >=1vs.never
31.19(0.76, 1.87)
0.46 A B C D F G
incidence
2.5.1.3.3
Pork
Pre-menopausal
Cho etal.,2006,BRE80034
USA, Pre-menopausalNHS II, 1989
26 - 46 1021Self reportverified bymedical record
FFQ-Semi-quantitative
ProspectiveCohort
90659.0 12.0 years Pork as a main dishservings/month
Breast cancer >=4.3vs.<1
41.1(0.81, 1.48)
0.54 A C D E F G
incidence
46

Author, Year,WCRF Code
Country, Ethnicity, Specialcharacteristics
Age Cases n Caseascertainment
Type of studyNon-Cases n
Lenght offollow-up / loss
Assessmentdetail
Additional details Unit Outcome Subgroup Contrast Nocat. OR (95% CI) p
valueptrend A B C D E F G
adjustments
Cho etal.,2006,BRE80034
USA, Pre-menopausalNHS II, 1989
26 - 46 512Self reportverified bymedical record
FFQ-Semi-quantitative
ProspectiveCohort
90659.0 12.0 years Pork as a main dishservings/month
Breast cancer ER+/PR+ >=4.3vs.<1
41.81(1.21, 2.7)
0.005
A C D E F G
incidence
Cho etal.,2006,BRE80034
USA, Pre-menopausalNHS II, 1989
26 - 46 167Self reportverified bymedical record
FFQ-Semi-quantitative
ProspectiveCohort
90659.0 12.0 years Pork as a main dishservings/month
Breast cancer ER-/PR- >=4.3vs.<1
40.83(0.37, 1.86)
>0.99
A C D E F G
incidence
Menopausal status not specified
Mills, P.K.,1989,BRE17837
USA, White, AdventistCalifornia Seventh-dayAdventists Cohort, 1976
25 - 99 204 By Mail FFQ (nos)ProspectiveCohort
102006 6.0 years / 1% dichotomous
Breast cancer anyvs.none
20.92(0.43, 1.97)
A B C D F G
incidence
Voorrips, L.E.,2002,BRE13011
The Netherlands, Notspecified, Post-menopausalwomenThe Netherlands Cohort
55 - 69 783 By MailFFQ-Semi-quantitative
Case Cohort 62573.0 6.3 years g/day
Breast cancer 72.0vs.3.0
50.8(0.6, 1.08)
.02 A B C D E F G
incidence
2.5.1.4
Chicken
Pre-menopausal
Cho, E.,2003,BRE17370
US, Multi-ethnic, Pre-menopausalNHS II, 1989
25 - 42 714 By MailFFQ-Semi-quantitative
ProspectiveCohort
90655 8.0 years chicken or turkeyserving/day
Invasive breast cancerPre-menopausal
0.9vs.0.1
51.04(0.8, 1.35)
.58 A C D E F G
incidence
FrazierL.A.,2004,BRE02942
USA, Multi-ethnic,Registered nursesNurses' Health study II
34 - 51 361
Through healthorg. (screening,healthinsurance)
FFQ (nos)Historical Cohort 47517 9.0 years adolescent dietserving/day
Breast cancerPre-menopausal
0.9vs.0.1
51.29(0.88, 1.88)
0.94 A C D E F G
incidence
Menopausal status not specified
Gertig,D.M.,1999,BRE03215
USA, Multi-ethnic,Registered nursesNurses' Health Study (NHS)Cohort 1976-1996
(58) 457
Through socialorganization(profession,religion)
FFQ-Semi-quantitative
Nested CaseControl
462 8.0 years serving/day
Breast cancer >.50vs.<=0.14
31.0(0.6, 1.6)
C D F G
incidence
Poultry
Pre-menopausal
Holmes,M.D.,2003,BRE15400
USA, Not specified,Registered nursesNurses' Health Study (NHS)Cohort 1976-1996
30 - 55 854HospitalRecords only
FFQ-Semi-quantitative
ProspectiveCohort
53952 18.0 years serving/day
Invasive breast cancerPre-menopausal
>0.46vs.<0.17
51.08(0.85, 1.37)
0.65 A C D E F G
incidence
Taylor etal.,2007,BRE80008
UKUK Women's Cohort Study(UKWCS), 1993
35 - 69 283NHS CentralRegistry
FFQProspectiveCohort
15664 8.0 years
Poultry, roastedchicken chicken slicesbread crumbed chickenchicken or turkey in a
g/day
Breast cancerpremenopausal women
Highvs.None
41.15(0.82, 1.61)
A C D E F G
incidence
Taylor etal.,2007,BRE80008
UKUK Women's Cohort Study(UKWCS), 1993
35 - 69 283NHS CentralRegistry
FFQProspectiveCohort
15664 8.0 years
Poultry, roastedchicken chicken slicesbread crumbed chickenchicken or turkey in a
g/day
Breast cancerpremenopausal women
50.0(continuous)
1123.0(0.91, 1.65)
0.172
A C D E F G
incidence
47

Author, Year,WCRF Code
Country, Ethnicity, Specialcharacteristics
Age Cases n Caseascertainment
Type of studyNon-Cases n
Lenght offollow-up / loss
Assessmentdetail
Additional details Unit Outcome Subgroup Contrast Nocat. OR (95% CI) p
valueptrend A B C D E F G
adjustments
Post-menopausal
Holmes,M.D.,2003,BRE15400
USA, Not specified,Registered nursesNurses' Health Study (NHS)Cohort 1976-1996
30 - 55 2936HospitalRecords only
FFQ-Semi-quantitative
ProspectiveCohort
76152 18.0 years serving/day
Invasive breast cancerPost-menopausal
>0.46vs.<0.17
51.0(0.89, 1.12)
0.97 A C D E F G
incidence
Fung, T.T.,2005,BRE22370
U.S.A., Registered nursesNurses' Health Study (NHS)Cohort 1984
30 - 55 By Mail FFQ (nos)ProspectiveCohort
71058.0 16.0 years serving
Breast cancer ER-Post-menopausal
1.0(continuous)
10.87(0.6, 1.28)
0.49 A C D E F G
incidence
Taylor etal.,2007,BRE80008
UKUK Women's Cohort Study(UKWCS), 1993
35 - 69 395NHS CentralRegistry
FFQProspectiveCohort
17383 8.0 years
Poultry, roastedchicken chicken slicesbread crumbed chickenchicken or turkey in a
g/day
Breast cancerpostmenopausal women
Highvs.None
41.3(0.89, 1.89)
A C D E F G
incidence
Taylor etal.,2007,BRE80008
UKUK Women's Cohort Study(UKWCS), 1993
35 - 69 395NHS CentralRegistry
FFQProspectiveCohort
17383 8.0 years
Poultry, roastedchicken chicken slicesbread crumbed chickenchicken or turkey in a
g/day
Breast cancerpostmenopausal women
50.0(continuous)
11.0(0.78, 1.28)
0.985
A C D E F G
incidence
Egeberg, R. etal.,2008,BRE80153
Denmark, Caucasian, PostmenopausalDiet, Cancer and Health,1993
50 - 64 378 Cancer registry FFQNested CaseControl
378 / 0.02 Poultry, chicken turkey g/day
Breast cancer >25vs.<10
41.33(0.85, 2.07)
0.73 A B C D E F
incidence
Egeberg, R. etal.,2008,BRE80153
Denmark, Caucasian, PostmenopausalDiet, Cancer and Health,1993
50 - 64 378 Cancer registry FFQNested CaseControl
378 / 0.02 Poultry, chicken turkey g/day
Breast cancer25.0(continuous)
11.04(0.84, 1.28)
A B C D E F
incidence
Egeberg, R. etal.,2008,BRE80153
Denmark, Caucasian, PostmenopausalDiet, Cancer and Health,1993
50 - 64 137 Cancer registry FFQNested CaseControl
137 / 0.02 Poultry, chicken turkey g/day
Breast cancer NAT1 fast &post-menopausal
25.0(continuous)
10.85(0.57, 1.27)
A B C D E F
incidence
Egeberg, R. etal.,2008,BRE80153
Denmark, Caucasian, PostmenopausalDiet, Cancer and Health,1993
50 - 64 218 Cancer registry FFQNested CaseControl
218 / 0.02 Poultry, chicken turkey g/day
Breast cancer NAT1 slow &post-menopausal
25.0(continuous)
11.06(0.82, 1.36)
A B C D E F
incidence
Egeberg, R. etal.,2008,BRE80153
Denmark, Caucasian, PostmenopausalDiet, Cancer and Health,1993
50 - 64 147 Cancer registry FFQNested CaseControl
147 / 0.02 Poultry, chicken turkey g/day
Breast cancer NAT2intermediate/fast & post-menopausal
25.0(continuous)
11.12(0.77, 1.63)
A B C D E F
incidence
Egeberg, R. etal.,2008,BRE80153
Denmark, Caucasian, PostmenopausalDiet, Cancer and Health,1993
50 - 64 220 Cancer registry FFQNested CaseControl
220 / 0.02 Poultry, chicken turkey g/day
Breast cancer NAT2 slow &post-menopausal
25.0(continuous)
10.97(0.75, 1.25)
A B C D E F
incidence
Menopausal status not specified
Mills, P.K.,1989,BRE17837
USA, White, AdventistCalifornia Seventh-dayAdventists Cohort, 1976
25 - 99 207 By Mail FFQ (nos)ProspectiveCohort
108084 6.0 years / 1% times/week
Breast cancer >=1vs.never
31.43(0.94, 2.13)
0.22 A B C D F G
incidence
Toniolo,P.,1994,BRE12398
U.S.A., Not specifiedNew York Women's HealthStudy, 1985
35 - 65
Through healthorg. (screening,healthinsurance)
FFQ-Semi-quantitative
Nested CaseControl
14291.0 7.0 years g/day
Invasive breast cancer 67.0vs.6.0
51.11(0.66, 1.86)
0.62incidence
48
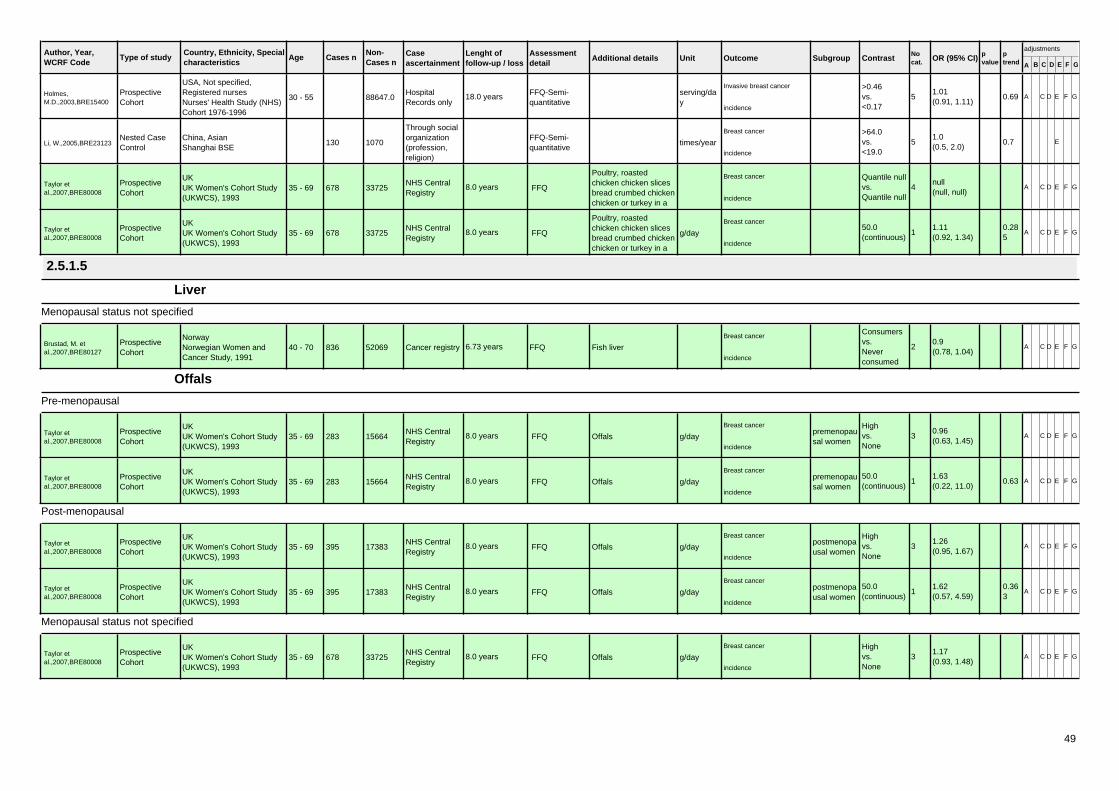
Author, Year,WCRF Code
Country, Ethnicity, Specialcharacteristics
Age Cases n Caseascertainment
Type of studyNon-Cases n
Lenght offollow-up / loss
Assessmentdetail
Additional details Unit Outcome Subgroup Contrast Nocat. OR (95% CI) p
valueptrend A B C D E F G
adjustments
Holmes,M.D.,2003,BRE15400
USA, Not specified,Registered nursesNurses' Health Study (NHS)Cohort 1976-1996
30 - 55HospitalRecords only
FFQ-Semi-quantitative
ProspectiveCohort
88647.0 18.0 years serving/day
Invasive breast cancer >0.46vs.<0.17
51.01(0.91, 1.11)
0.69 A C D E F G
incidence
Li, W.,2005,BRE23123China, AsianShanghai BSE
130
Through socialorganization(profession,religion)
FFQ-Semi-quantitative
Nested CaseControl
1070 times/year
Breast cancer >64.0vs.<19.0
51.0(0.5, 2.0)
0.7 E
incidence
Taylor etal.,2007,BRE80008
UKUK Women's Cohort Study(UKWCS), 1993
35 - 69 678NHS CentralRegistry
FFQProspectiveCohort
33725 8.0 years
Poultry, roastedchicken chicken slicesbread crumbed chickenchicken or turkey in a
Breast cancer Quantile nullvs.Quantile null
4null(null, null)
A C D E F G
incidence
Taylor etal.,2007,BRE80008
UKUK Women's Cohort Study(UKWCS), 1993
35 - 69 678NHS CentralRegistry
FFQProspectiveCohort
33725 8.0 years
Poultry, roastedchicken chicken slicesbread crumbed chickenchicken or turkey in a
g/day
Breast cancer50.0(continuous)
11.11(0.92, 1.34)
0.285
A C D E F G
incidence
2.5.1.5
Liver
Menopausal status not specified
Brustad, M. etal.,2007,BRE80127
NorwayNorwegian Women andCancer Study, 1991
40 - 70 836 Cancer registry FFQProspectiveCohort
52069 6.73 years Fish liver
Breast cancerConsumersvs.Neverconsumed
20.9(0.78, 1.04)
A C D E F G
incidence
Offals
Pre-menopausal
Taylor etal.,2007,BRE80008
UKUK Women's Cohort Study(UKWCS), 1993
35 - 69 283NHS CentralRegistry
FFQProspectiveCohort
15664 8.0 years Offals g/day
Breast cancerpremenopausal women
Highvs.None
30.96(0.63, 1.45)
A C D E F G
incidence
Taylor etal.,2007,BRE80008
UKUK Women's Cohort Study(UKWCS), 1993
35 - 69 283NHS CentralRegistry
FFQProspectiveCohort
15664 8.0 years Offals g/day
Breast cancerpremenopausal women
50.0(continuous)
11.63(0.22, 11.0)
0.63 A C D E F G
incidence
Post-menopausal
Taylor etal.,2007,BRE80008
UKUK Women's Cohort Study(UKWCS), 1993
35 - 69 395NHS CentralRegistry
FFQProspectiveCohort
17383 8.0 years Offals g/day
Breast cancerpostmenopausal women
Highvs.None
31.26(0.95, 1.67)
A C D E F G
incidence
Taylor etal.,2007,BRE80008
UKUK Women's Cohort Study(UKWCS), 1993
35 - 69 395NHS CentralRegistry
FFQProspectiveCohort
17383 8.0 years Offals g/day
Breast cancerpostmenopausal women
50.0(continuous)
11.62(0.57, 4.59)
0.363
A C D E F G
incidence
Menopausal status not specified
Taylor etal.,2007,BRE80008
UKUK Women's Cohort Study(UKWCS), 1993
35 - 69 678NHS CentralRegistry
FFQProspectiveCohort
33725 8.0 years Offals g/day
Breast cancer Highvs.None
31.17(0.93, 1.48)
A C D E F G
incidence
49

Author, Year,WCRF Code
Country, Ethnicity, Specialcharacteristics
Age Cases n Caseascertainment
Type of studyNon-Cases n
Lenght offollow-up / loss
Assessmentdetail
Additional details Unit Outcome Subgroup Contrast Nocat. OR (95% CI) p
valueptrend A B C D E F G
adjustments
Taylor etal.,2007,BRE80008
UKUK Women's Cohort Study(UKWCS), 1993
35 - 69 678NHS CentralRegistry
FFQProspectiveCohort
33725 8.0 years Offals g/day
Breast cancer50.0(continuous)
11.75(0.68, 4.5)
0.248
A C D E F G
incidence
2.5.2
Fish
Pre-menopausal
Gago-Dominguez,M.,2003,BRE17518
China, AsianThe Singapore ChineseHealth Study, 1993
45 - 74 93Direct contactat home
FFQ (nos)ProspectiveCohort
63257.0 5.3 yearsBreast cancer
Pre-menopausal
Quantile 4vs.Quantile 1
40.89(0.48, 1.66)
0.93 A B C E F G
incidence
Cho, E.,2003,BRE17370
US, Multi-ethnic, Pre-menopausalNHS II, 1989
25 - 42 714 By MailFFQ-Semi-quantitative
ProspectiveCohort
90655 8.0 years serving/day
Invasive breast cancerPre-menopausal
0.4vs.0.07
40.92(0.73, 1.15)
.52 A C D E F G
incidence
Holmes,M.D.,2003,BRE15400
USA, Not specified,Registered nursesNurses' Health Study (NHS)Cohort 1976-1996
30 - 55 854HospitalRecords only
FFQ-Semi-quantitative
ProspectiveCohort
53952 18.0 years serving/day
Invasive breast cancerPre-menopausal
>0.4vs.<0.13
51.17(0.92, 1.5)
0.71 A C D E F G
incidence
FrazierL.A.,2004,BRE02942
USA, Multi-ethnic,Registered nursesNurses' Health study II
34 - 51 361
Through healthorg. (screening,healthinsurance)
FFQ (nos)Historical Cohort 47517 9.0 years adolescent dietserving/day
Breast cancerPre-menopausal
0.6vs.0.1
50.94(0.67, 1.31)
0.97 A C D E F G
incidence
EngesetD.,2006,BRE80109
France, Italy, Spain, UK, NL,Greece, Germany, Sweden,Denmark, NorwayEuropean Prospective
35 - 70 786
Populationcancerregistries andother
FFQ + diaryProspectiveCohort
366521.0
Total fish consumption,whole fish, fishproducts, crustaceans,molluscs, roe and roe
g/day
Invasive breast cancerPre-menopausal
96.77vs.5.54
51.11(0.84, 1.45)
0.27 A C D E F G
incidence
Post-menopausal
Gago-Dominguez,M.,2003,BRE17518
China, AsianThe Singapore ChineseHealth Study, 1993
45 - 74 221Direct contactat home
FFQ (nos)ProspectiveCohort
63257.0 5.3 yearsBreast cancer
Post-menopausal
Quantile 4vs.Quantile 1
40.71(0.49, 1.01)
0.03 A B C E F G
incidence
Stripp,C.,2003,BRE11883
Denmark, Not specified,Post-menopausalDiet, Cancer and Health,1993
50 - 64 424 By Mail FFQ (nos)ProspectiveCohort
23693 4.8 years total fish intake g/day
Breast cancerPost-menopausal
>59.0vs.0 - 26.0
41.47(1.1, 1.98)
A B C D E F G
incidence
Stripp,C.,2003,BRE11883
Denmark, Not specified,Post-menopausalDiet, Cancer and Health,1993
50 - 64 303 By Mail FFQ (nos)ProspectiveCohort
null 4.8 years total fish intake g/day
Breast cancer ER+Post-menopausal
25.0(continuous)
11.14(1.03, 1.26)
A B C D E F G
incidence
Stripp,C.,2003,BRE11883
Denmark, Not specified,Post-menopausalDiet, Cancer and Health,1993
50 - 64 91 By Mail FFQ (nos)ProspectiveCohort
null 4.8 years total fish intake g/day
Breast cancer ER-Post-menopausal
25.0(continuous)
11.0(0.81, 1.24)
A B C D E F G
incidence
Holmes,M.D.,2003,BRE15400
USA, Not specified,Registered nursesNurses' Health Study (NHS)Cohort 1976-1996
30 - 55 2936HospitalRecords only
FFQ-Semi-quantitative
ProspectiveCohort
76152 18.0 years serving/day
Invasive breast cancerPost-menopausal
>0.4vs.<0.13
51.0(0.89, 1.12)
0.79 A C D E F G
incidence
50
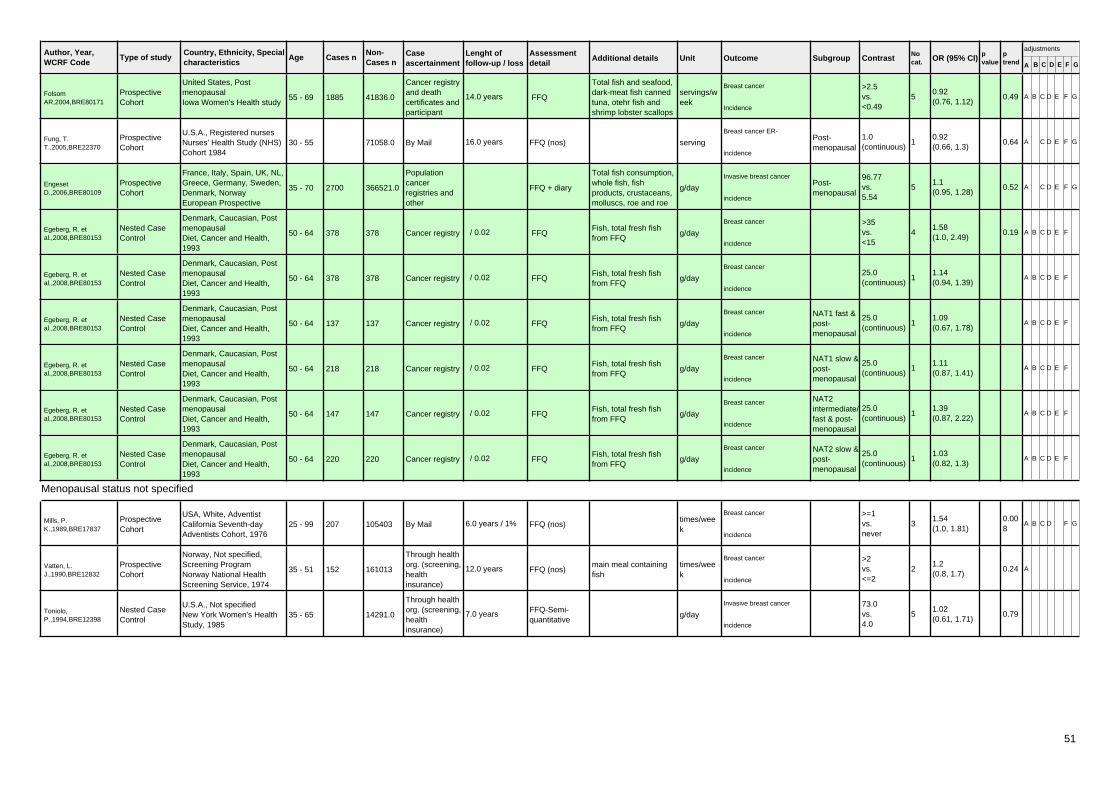
Author, Year,WCRF Code
Country, Ethnicity, Specialcharacteristics
Age Cases n Caseascertainment
Type of studyNon-Cases n
Lenght offollow-up / loss
Assessmentdetail
Additional details Unit Outcome Subgroup Contrast Nocat. OR (95% CI) p
valueptrend A B C D E F G
adjustments
FolsomAR,2004,BRE80171
United States, PostmenopausalIowa Women's Health study
55 - 69 1885
Cancer registryand deathcertificates andparticipant
FFQProspectiveCohort
41836.0 14.0 years
Total fish and seafood,dark-meat fish cannedtuna, otehr fish andshrimp lobster scallops
servings/week
Breast cancer >2.5vs.<0.49
50.92(0.76, 1.12)
0.49 A B C D E F G
Incidence
Fung, T.T.,2005,BRE22370
U.S.A., Registered nursesNurses' Health Study (NHS)Cohort 1984
30 - 55 By Mail FFQ (nos)ProspectiveCohort
71058.0 16.0 years serving
Breast cancer ER-Post-menopausal
1.0(continuous)
10.92(0.66, 1.3)
0.64 A C D E F G
incidence
EngesetD.,2006,BRE80109
France, Italy, Spain, UK, NL,Greece, Germany, Sweden,Denmark, NorwayEuropean Prospective
35 - 70 2700
Populationcancerregistries andother
FFQ + diaryProspectiveCohort
366521.0
Total fish consumption,whole fish, fishproducts, crustaceans,molluscs, roe and roe
g/day
Invasive breast cancerPost-menopausal
96.77vs.5.54
51.1(0.95, 1.28)
0.52 A C D E F G
incidence
Egeberg, R. etal.,2008,BRE80153
Denmark, Caucasian, PostmenopausalDiet, Cancer and Health,1993
50 - 64 378 Cancer registry FFQNested CaseControl
378 / 0.02 Fish, total fresh fishfrom FFQ
g/day
Breast cancer >35vs.<15
41.58(1.0, 2.49)
0.19 A B C D E F
incidence
Egeberg, R. etal.,2008,BRE80153
Denmark, Caucasian, PostmenopausalDiet, Cancer and Health,1993
50 - 64 378 Cancer registry FFQNested CaseControl
378 / 0.02 Fish, total fresh fishfrom FFQ
g/day
Breast cancer25.0(continuous)
11.14(0.94, 1.39)
A B C D E F
incidence
Egeberg, R. etal.,2008,BRE80153
Denmark, Caucasian, PostmenopausalDiet, Cancer and Health,1993
50 - 64 137 Cancer registry FFQNested CaseControl
137 / 0.02 Fish, total fresh fishfrom FFQ
g/day
Breast cancer NAT1 fast &post-menopausal
25.0(continuous)
11.09(0.67, 1.78)
A B C D E F
incidence
Egeberg, R. etal.,2008,BRE80153
Denmark, Caucasian, PostmenopausalDiet, Cancer and Health,1993
50 - 64 218 Cancer registry FFQNested CaseControl
218 / 0.02 Fish, total fresh fishfrom FFQ
g/day
Breast cancer NAT1 slow &post-menopausal
25.0(continuous)
11.11(0.87, 1.41)
A B C D E F
incidence
Egeberg, R. etal.,2008,BRE80153
Denmark, Caucasian, PostmenopausalDiet, Cancer and Health,1993
50 - 64 147 Cancer registry FFQNested CaseControl
147 / 0.02 Fish, total fresh fishfrom FFQ
g/day
Breast cancer NAT2intermediate/fast & post-menopausal
25.0(continuous)
11.39(0.87, 2.22)
A B C D E F
incidence
Egeberg, R. etal.,2008,BRE80153
Denmark, Caucasian, PostmenopausalDiet, Cancer and Health,1993
50 - 64 220 Cancer registry FFQNested CaseControl
220 / 0.02 Fish, total fresh fishfrom FFQ
g/day
Breast cancer NAT2 slow &post-menopausal
25.0(continuous)
11.03(0.82, 1.3)
A B C D E F
incidence
Menopausal status not specified
Mills, P.K.,1989,BRE17837
USA, White, AdventistCalifornia Seventh-dayAdventists Cohort, 1976
25 - 99 207 By Mail FFQ (nos)ProspectiveCohort
105403 6.0 years / 1% times/week
Breast cancer >=1vs.never
31.54(1.0, 1.81)
0.008
A B C D F G
incidence
Vatten, L.J.,1990,BRE12832
Norway, Not specified,Screening ProgramNorway National HealthScreening Service, 1974
35 - 51 152
Through healthorg. (screening,healthinsurance)
FFQ (nos)ProspectiveCohort
161013 12.0 years main meal containingfish
times/week
Breast cancer >2vs.<=2
21.2(0.8, 1.7)
0.24 A
incidence
Toniolo,P.,1994,BRE12398
U.S.A., Not specifiedNew York Women's HealthStudy, 1985
35 - 65
Through healthorg. (screening,healthinsurance)
FFQ-Semi-quantitative
Nested CaseControl
14291.0 7.0 years g/day
Invasive breast cancer 73.0vs.4.0
51.02(0.61, 1.71)
0.79incidence
51

Author, Year,WCRF Code
Country, Ethnicity, Specialcharacteristics
Age Cases n Caseascertainment
Type of studyNon-Cases n
Lenght offollow-up / loss
Assessmentdetail
Additional details Unit Outcome Subgroup Contrast Nocat. OR (95% CI) p
valueptrend A B C D E F G
adjustments
Gertig,D.M.,1999,BRE03215
USA, Multi-ethnic,Registered nursesNurses' Health Study (NHS)Cohort 1976-1996
(58) 453
Through socialorganization(profession,religion)
FFQ-Semi-quantitative
Nested CaseControl
462 8.0 years serving/day
Breast cancer >.50vs.<=0.14
31.3(0.7, 2.6)
C D F G
incidence
Key, T.J.,1999,BRE04758
Japan, Not specifiedLSS, 1969
427 By MailQuestionnaire(nos)
ProspectiveCohort
488989 24.0 years times/week
Breast cancer >=5vs.<=1
41.17(0.9, 1.54)
0.209
A G
incidence
Gago-Dominguez,M.,2003,BRE17518
China, AsianThe Singapore ChineseHealth Study, 1993
45 - 74 314Direct contactat home
FFQ (nos)ProspectiveCohort
63257.0 5.3 years fish and shelfish
Breast cancer Quantile 4vs.Quantile 1
40.74(0.54, 1.01)
0.07 A B C E F G
incidence
FrazierL.A.,2003,BRE02941
USA, Multi-ethnic,Registered nursesNurses' Health Study (NHS)Cohort 1976-1996
40 - 65
Through healthorg. (screening,healthinsurance)
FFQ (nos)Nested CaseControl
121700.0 10.0 years adolescentserving/day
Breast cancer1.0(continuous)
10.94(0.64, 1.37)
A C D E F G
incidence
Gago-Dominguez,M.,2003,BRE17518
China, AsianThe Singapore ChineseHealth Study, 1993
45 - 74 95Direct contactat home
FFQ (nos)ProspectiveCohort
63257.0 5.3 yearsIn situ breast cancer Quantile 4
vs.Quantile 1
40.93(0.53, 1.63)
0.99 A B C E F G
incidence
Gago-Dominguez,M.,2003,BRE17518
China, AsianThe Singapore ChineseHealth Study, 1993
45 - 74 188Direct contactat home
FFQ (nos)ProspectiveCohort
63257.0 5.3 yearsInvasive breast cancer Quantile 4
vs.Quantile 1
40.6(0.4, 0.9)
0.008
A B C E F G
incidence
Holmes,M.D.,2003,BRE15400
USA, Not specified,Registered nursesNurses' Health Study (NHS)Cohort 1976-1996
30 - 55HospitalRecords only
FFQ-Semi-quantitative
ProspectiveCohort
88647.0 18.0 years serving/day
Invasive breast cancer >0.4vs.<0.13
51.04(0.93, 1.14)
0.55 A C D E F G
incidence
Li, W.,2005,BRE23123China, AsianShanghai BSE
130
Through socialorganization(profession,religion)
FFQ-Semi-quantitative
Nested CaseControl
1070 excluded cured times/year
Breast cancer >169.0vs.<65.0
51.3(0.7, 2.6)
0.58 E
incidence
EngesetD.,2006,BRE80109
France, Italy, Spain, UK, NL,Greece, Germany, Sweden,Denmark, NorwayEuropean Prospective
35 - 70 4776
Populationcancerregistries andother
FFQ + diaryProspectiveCohort
366521.0
Total fish consumption,whole fish, fishproducts, crustaceans,molluscs, roe and roe
g/day
Invasive breast cancer 96.77vs.5.54
51.07(0.95, 1.2)
0.36 A C D E F G
incidence
EngesetD.,2006,BRE80109
France, Italy, Spain, UK, NL,Greece, Germany, Sweden,Denmark, NorwayEuropean Prospective
35 - 70 4435
Populationcancerregistries andother
FFQ + diaryProspectiveCohort
366521.0
Lean fish, whole leanfish, lean fish products,fish less than 4% fat,excluded german and
g/day
Invasive breast cancer 61.41vs.0.29
51.07(0.95, 1.21)
0.2 A C D E F G
incidence
2.5.2.1.7
Hamburger
Pre-menopausal
Holmes,M.D.,2003,BRE15400
USA, Not specified,Registered nursesNurses' Health Study (NHS)Cohort 1976-1996
30 - 55 854HospitalRecords only
FFQ-Semi-quantitative
ProspectiveCohort
53952 18.0 years serving/day
Invasive breast cancerPre-menopausal
>0.25vs.<0.08
51.02(0.81, 1.29)
0.96 A C D E F G
incidence
52

Author, Year,WCRF Code
Country, Ethnicity, Specialcharacteristics
Age Cases n Caseascertainment
Type of studyNon-Cases n
Lenght offollow-up / loss
Assessmentdetail
Additional details Unit Outcome Subgroup Contrast Nocat. OR (95% CI) p
valueptrend A B C D E F G
adjustments
Cho etal.,2006,BRE80034
USA, Pre-menopausalNHS II, 1989
26 - 46 1021Self reportverified bymedical record
FFQ-Semi-quantitative
ProspectiveCohort
90659.0 12.0 years Hamburgerservings/month
Breast cancer >=4.3vs.<1
41.11(0.85, 1.45)
0.37 A C D E F G
incidence
Cho etal.,2006,BRE80034
USA, Pre-menopausalNHS II, 1989
26 - 46 512Self reportverified bymedical record
FFQ-Semi-quantitative
ProspectiveCohort
90659.0 12.0 years hamburgerservings/month
Breast cancer ER+/PR+ >=4.3vs.<1
41.71(1.11, 2.62)
0.01 A C D E F G
incidence
Cho etal.,2006,BRE80034
USA, Pre-menopausalNHS II, 1989
26 - 46 167Self reportverified bymedical record
FFQ-Semi-quantitative
ProspectiveCohort
90659.0 12.0 years hamburgerservings/month
Breast cancer ER-/PR- >=4.3vs.<1
40.67(0.36, 1.22)
0.45 A C D E F G
incidence
Post-menopausal
Zheng,W.,1998,BRE17170
U.S.A., Not specifiedIowa Women's Health Study
55 - 69 247 By MailFFQ-Semi-quantitative
Nested CaseControl
602 10.0 years g
Breast cancerPost-menopausal
very welldonevs.rare medium
31.54(0.96, 2.47)
0.04 A D E F
incidence
Holmes,M.D.,2003,BRE15400
USA, Not specified,Registered nursesNurses' Health Study (NHS)Cohort 1976-1996
30 - 55 2936HospitalRecords only
FFQ-Semi-quantitative
ProspectiveCohort
76152 18.0 years serving/day
Invasive breast cancerPost-menopausal
>0.25vs.<0.08
50.91(0.8, 1.03)
0.15 A C D E F G
incidence
Menopausal status not specified
Mills, P.K.,1989,BRE17837
USA, White, AdventistCalifornia Seventh-dayAdventists Cohort, 1976
25 - 99 206 By Mail FFQ (nos)ProspectiveCohort
106997 6.0 years / 1% times/week
Breast cancer >=1vs.never
31.07(0.75, 1.55)
0.58 A B C D F G
incidence
Holmes,M.D.,2003,BRE15400
USA, Not specified,Registered nursesNurses' Health Study (NHS)Cohort 1976-1996
30 - 55HospitalRecords only
FFQ-Semi-quantitative
ProspectiveCohort
88647.0 18.0 years serving/day
Invasive breast cancer >0.25vs.<0.08
50.95(0.86, 1.06)
0.36 A C D E F G
incidence
2.5.2.3
Processed Fish
Post-menopausal
Stripp,C.,2003,BRE11883
Denmark, Not specified,Post-menopausalDiet, Cancer and Health,1993
50 - 64 424 By Mail FFQ (nos)ProspectiveCohort
23693 4.8 years g/day
Breast cancerPost-menopausal
25.0(continuous)
11.12(0.93, 1.34)
A B C D E F G
incidence
2.5.2.5
Fatty Fish
Post-menopausal
Stripp,C.,2003,BRE11883
Denmark, Not specified,Post-menopausalDiet, Cancer and Health,1993
50 - 64 424 By Mail FFQ (nos)ProspectiveCohort
23693 4.8 years g/day
Breast cancerPost-menopausal
25.0(continuous)
11.11(0.91, 1.34)
A B C D E F G
incidence
53
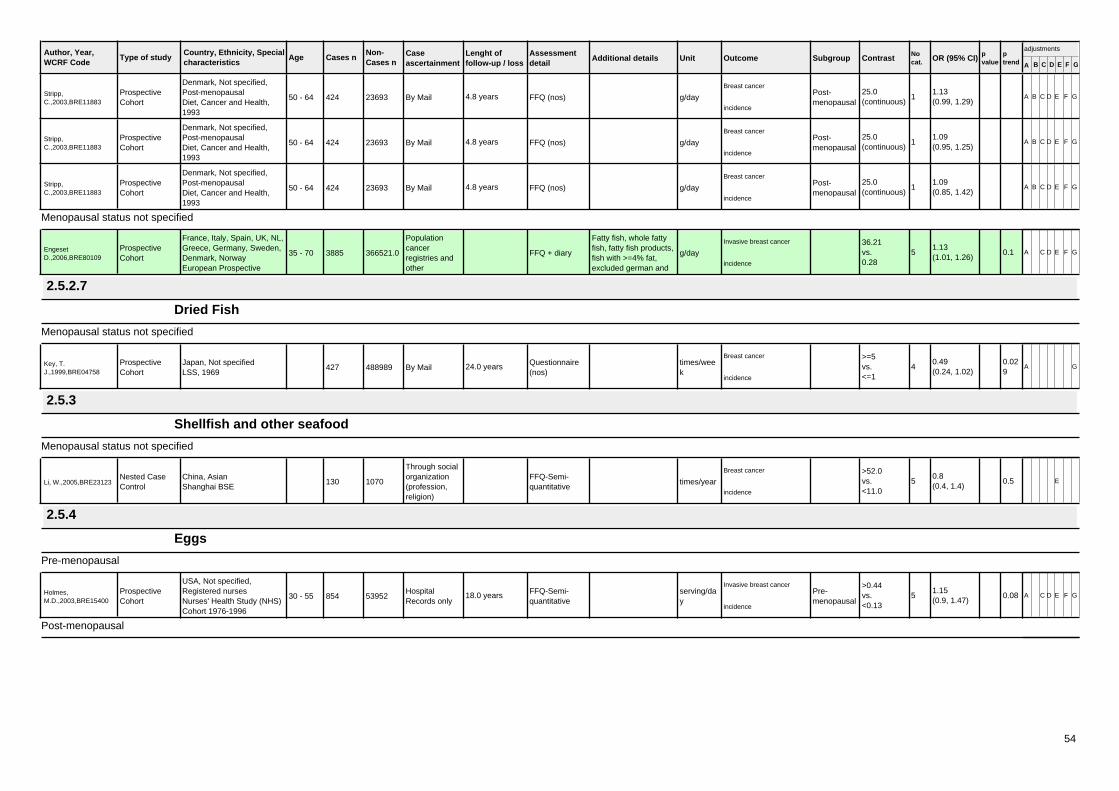
Author, Year,WCRF Code
Country, Ethnicity, Specialcharacteristics
Age Cases n Caseascertainment
Type of studyNon-Cases n
Lenght offollow-up / loss
Assessmentdetail
Additional details Unit Outcome Subgroup Contrast Nocat. OR (95% CI) p
valueptrend A B C D E F G
adjustments
Stripp,C.,2003,BRE11883
Denmark, Not specified,Post-menopausalDiet, Cancer and Health,1993
50 - 64 424 By Mail FFQ (nos)ProspectiveCohort
23693 4.8 years g/day
Breast cancerPost-menopausal
25.0(continuous)
11.13(0.99, 1.29)
A B C D E F G
incidence
Stripp,C.,2003,BRE11883
Denmark, Not specified,Post-menopausalDiet, Cancer and Health,1993
50 - 64 424 By Mail FFQ (nos)ProspectiveCohort
23693 4.8 years g/day
Breast cancerPost-menopausal
25.0(continuous)
11.09(0.95, 1.25)
A B C D E F G
incidence
Stripp,C.,2003,BRE11883
Denmark, Not specified,Post-menopausalDiet, Cancer and Health,1993
50 - 64 424 By Mail FFQ (nos)ProspectiveCohort
23693 4.8 years g/day
Breast cancerPost-menopausal
25.0(continuous)
11.09(0.85, 1.42)
A B C D E F G
incidence
Menopausal status not specified
EngesetD.,2006,BRE80109
France, Italy, Spain, UK, NL,Greece, Germany, Sweden,Denmark, NorwayEuropean Prospective
35 - 70 3885
Populationcancerregistries andother
FFQ + diaryProspectiveCohort
366521.0
Fatty fish, whole fattyfish, fatty fish products,fish with >=4% fat,excluded german and
g/day
Invasive breast cancer 36.21vs.0.28
51.13(1.01, 1.26)
0.1 A C D E F G
incidence
2.5.2.7
Dried Fish
Menopausal status not specified
Key, T.J.,1999,BRE04758
Japan, Not specifiedLSS, 1969
427 By MailQuestionnaire(nos)
ProspectiveCohort
488989 24.0 years times/week
Breast cancer >=5vs.<=1
40.49(0.24, 1.02)
0.029
A G
incidence
2.5.3
Shellfish and other seafood
Menopausal status not specified
Li, W.,2005,BRE23123China, AsianShanghai BSE
130
Through socialorganization(profession,religion)
FFQ-Semi-quantitative
Nested CaseControl
1070 times/year
Breast cancer >52.0vs.<11.0
50.8(0.4, 1.4)
0.5 E
incidence
2.5.4
Eggs
Pre-menopausal
Holmes,M.D.,2003,BRE15400
USA, Not specified,Registered nursesNurses' Health Study (NHS)Cohort 1976-1996
30 - 55 854HospitalRecords only
FFQ-Semi-quantitative
ProspectiveCohort
53952 18.0 years serving/day
Invasive breast cancerPre-menopausal
>0.44vs.<0.13
51.15(0.9, 1.47)
0.08 A C D E F G
incidence
Post-menopausal
54

Author, Year,WCRF Code
Country, Ethnicity, Specialcharacteristics
Age Cases n Caseascertainment
Type of studyNon-Cases n
Lenght offollow-up / loss
Assessmentdetail
Additional details Unit Outcome Subgroup Contrast Nocat. OR (95% CI) p
valueptrend A B C D E F G
adjustments
Mills, P.K.,1988,BRE17836
US, White, AdventistSeventh-day AdventistsCohort, 1960
30 - 85 75
Through socialorganization(profession,religion)
Questionnaire(nos)
Nested CaseControl
16190.020.0 years / 1.7% days/week
Breast cancerPost-menopausal
3+vs.none/occasional
40.67(0.31, 1.45)
0.40 B C D E
mortality/incidence
Mills, P.K.,1989,BRE17837
USA, White, AdventistCalifornia Seventh-dayAdventists Cohort, 1976
25 - 99 171 By Mail FFQ (nos)ProspectiveCohort
12062 6.0 years / 1% times/week
Breast cancerPost-menopausal
>2vs.<1
31.28(0.85, 1.94)
A B C D F G
incidence
Holmes,M.D.,2003,BRE15400
USA, Not specified,Registered nursesNurses' Health Study (NHS)Cohort 1976-1996
30 - 55 2936HospitalRecords only
FFQ-Semi-quantitative
ProspectiveCohort
76152 18.0 years serving/day
Invasive breast cancerPost-menopausal
>0.44vs.<0.13
51.01(0.89, 1.14)
0.57 A C D E F G
incidence
Menopausal status not specified
Mills, P.K.,1988,BRE17836
US, White, AdventistSeventh-day AdventistsCohort, 1960
30 - 85 141
Through socialorganization(profession,religion)
Questionnaire(nos)
Nested CaseControl
16190.020.0 years / 1.7% days/week
Breast cancer3+vs.none/occasional
40.8(0.46, 1.4)
0.66 B C D E
mortality/incidence
Mills, P.K.,1989,BRE17837
USA, White, AdventistCalifornia Seventh-dayAdventists Cohort, 1976
25 - 99 208 By Mail FFQ (nos)ProspectiveCohort
104797 6.0 years / 1% times/week
Breast cancer >=2vs.<1
31.07(0.73, 1.56)
0.61 A B C D F G
incidence
Gaard,,1995,BRE17516
Norway, Not specified,Screening ProgramNorway National HealthScreening Service, 1974
35 - 49 242 By MailFFQ-Semi-quantitative
ProspectiveCohort
277065 10.0 years Unit/week
Breast cancer >=5vs.0
51.25(0.54, 2.9)
0.82 A
incidence
Key, T.J.,1999,BRE04758
Japan, Not specifiedLSS, 1969
427 By MailQuestionnaire(nos)
ProspectiveCohort
488990 24.0 years times/week
Breast cancer >=5vs.<=1
41.05(0.79, 1.38)
0.936
A G
incidence
FrazierL.A.,2003,BRE02941
USA, Multi-ethnic,Registered nursesNurses' Health Study (NHS)Cohort 1976-1996
40 - 65
Through healthorg. (screening,healthinsurance)
FFQ (nos)Nested CaseControl
121700.0 10.0 years adolescent Unit/day
Breast cancer1.0(continuous)
10.82(0.67, 0.99)
A C D E F G
incidence
Shannon,J.,2003,BRE18714
China, Not specifiedBreast Self-Exam (BSE),unknown
Through healthorg. (screening,healthinsurance)
FFQ (nos)Nested CaseControl
nullfood groupintake/caloric intake
Breast cancerHighestquartilevs.Lowest
20.58(0.39, 0.93)
0.004
A C E G
incidence
Holmes,M.D.,2003,BRE15400
USA, Not specified,Registered nursesNurses' Health Study (NHS)Cohort 1976-1996
30 - 55HospitalRecords only
FFQ-Semi-quantitative
ProspectiveCohort
88647.0 18.0 years serving/day
Invasive breast cancer >0.44vs.<0.13
51.03(0.93, 1.15)
0.16 A C D E F G
incidence
Li, W.,2005,BRE23123China, AsianShanghai BSE
130
Through socialorganization(profession,religion)
FFQ-Semi-quantitative
Nested CaseControl
1070 times/year
Breast cancer >313.0vs.<52.0
50.7(0.4, 1.4)
0.18 E
incidence
2.6
Fats and Oils
Menopausal status not specified
55

Author, Year,WCRF Code
Country, Ethnicity, Specialcharacteristics
Age Cases n Caseascertainment
Type of studyNon-Cases n
Lenght offollow-up / loss
Assessmentdetail
Additional details Unit Outcome Subgroup Contrast Nocat. OR (95% CI) p
valueptrend A B C D E F G
adjustments
Gaard,,1995,BRE17516
Norway, Not specified,Screening ProgramNorway National HealthScreening Service, 1974
35 - 49 248 By MailFFQ-Semi-quantitative
ProspectiveCohort
281828 10.0 years edible fat g/day
Breast cancer >=29vs.<13
41.14(0.81, 1.6)
0.18 A
incidence
2.6.1.1
Butter
Menopausal status not specified
Knekt,P.,1996,BRE04900
Finland, Not specified,Screening ProgramFinland, 1966
15 - 90
Through healthorg. (screening,healthinsurance)
Dietary Historyquestionnaire
ProspectiveCohort
4697.0 25.0 yearsBreast cancer >1.0
vs.>-1.0
30.59(0.35, 0.99)
0.17 A
mortality/incidence
Jarvinen,R.,1997,BRE04383
finlandFinland, 1966
15 - UnspecifiedDietary Historyquestionnaire
ProspectiveCohort
4697.0 24.0 yearsBreast cancer Quantile 3
vs.Quantile 1
20.59(null, null)
A
incidence
Key, T.J.,1999,BRE04758
Japan, Not specifiedLSS, 1969
427 By MailQuestionnaire(nos)
ProspectiveCohort
488990 24.0 years butter - cheesetimes/week
Breast cancer >=5vs.<=1
41.13(0.85, 1.51)
0.239
A G
incidence
Thiebaut, A.C.,2001,BRE12244
France, Multi-ethnic,Registered teachersE3N-EPIC, 1990
40 - 65
Through socialorganization(profession,religion)
FFQ-Semi-quantitative
ProspectiveCohort
65879.0 3.4 years g/day
Breast cancer3° tertilevs.noconsumers
21.06(0.87, 1.31)
A B C D E F G
incidence
Voorrips, L.E.,2002,BRE13011
The Netherlands, Notspecified, Post-menopausalwomenThe Netherlands Cohort
55 - 69 783 By MailFFQ-Semi-quantitative
Case Cohort 62573.0 6.3 years g/day
Breast cancer 31.0vs.0.0
31.18(0.9, 1.54)
.08 A B C D E F G
cancer death
FrazierL.A.,2003,BRE02941
USA, Multi-ethnic,Registered nursesNurses' Health Study (NHS)Cohort 1976-1996
40 - 65
Through healthorg. (screening,healthinsurance)
FFQ (nos)Nested CaseControl
121700.0 10.0 years adolescentserving/day
Breast cancer1.0(continuous)
11.06(1.0, 1.13)
A C D E F G
incidence
Dairy cream
Menopausal status not specified
Knekt,P.,1996,BRE04900
Finland, Not specified,Screening ProgramFinland, 1966
15 - 90
Through healthorg. (screening,healthinsurance)
Dietary Historyquestionnaire
ProspectiveCohort
4697.0 25.0 yearsBreast cancer >1.0
vs.>-1.0
30.84(0.53, 1.34)
0.67 A
mortality/incidence
Jarvinen,R.,1997,BRE04383
finlandFinland, 1966
15 - UnspecifiedDietary Historyquestionnaire
ProspectiveCohort
4697.0 24.0 yearsBreast cancer Quantile 3
vs.Quantile 1
20.84(null, null)
A
incidence
van der Pols JC, etal.,2007,BRE80154
United KingdomThe Boyd Orr Cohort
(8) 98National HealthRecords
7-day foodrecords
Historical Cohort 4374.057.0 years /0.123
Childhood creamintake
Breast cancer Quantile 4vs.Quantile 1
4null(null, null)
>0.05
A E G
incidence + mortality
2.6.2
56

Author, Year,WCRF Code
Country, Ethnicity, Specialcharacteristics
Age Cases n Caseascertainment
Type of studyNon-Cases n
Lenght offollow-up / loss
Assessmentdetail
Additional details Unit Outcome Subgroup Contrast Nocat. OR (95% CI) p
valueptrend A B C D E F G
adjustments
Olive oil
Menopausal status not specified
Thiebaut, A.C.,2001,BRE12244
France, Multi-ethnic,Registered teachersE3N-EPIC, 1990
40 - 65
Through socialorganization(profession,religion)
FFQ-Semi-quantitative
ProspectiveCohort
65879.0 3.4 years g/day
Breast cancer3° tertilevs.noconsumers
20.88(0.73, 1.08)
A B C D E F G
incidence
Seed Oil
Menopausal status not specified
Thiebaut, A.C.,2001,BRE12244
France, Multi-ethnic,Registered teachersE3N-EPIC, 1990
40 - 65
Through socialorganization(profession,religion)
FFQ-Semi-quantitative
ProspectiveCohort
65879.0 3.4 years g/day
Breast cancer 4° quartilevs.1° quartile
21.07(0.88, 1.31)
A B C D E F G
incidence
Sesame oil
Menopausal status not specified
Li, W.,2005,BRE23123China, AsianShanghai BSE
130
Through socialorganization(profession,religion)
FFQ-Semi-quantitative
Nested CaseControl
1070 g/day
Breast cancer >1.66vs.<0.55
50.7(0.3, 1.2)
0.01 E
incidence
Soy oil
Menopausal status not specified
Li, W.,2005,BRE23123China, AsianShanghai BSE
130
Through socialorganization(profession,religion)
FFQ-Semi-quantitative
Nested CaseControl
1070 g/day
Breast cancer >49.5vs.<28.7
50.6(0.3, 1.2)
0.08 E
incidence
Vegetable oil-based dietary fats
Post-menopausal
Wilfart, E etal.,2005,BRE11111
Sweden, Post menopausalMalmo Diet and Cancer,1991
50 - (59) 237 Cancer registry7-day Record +Questionnaire
Nested CaseControl
673Vegetable oil-baseddietary fats
g/day
Breast cancerPost-menopausal
28.0vs.4.2
41.65(1.05, 2.58)
0.019
B C D E F G
incidence
Wilfart, E etal.,2005,BRE11111
Sweden, Post menopausalMalmo Diet and Cancer,1991
50 - (59) 237 Cancer registry7-day Record +Questionnaire
Nested CaseControl
673
Vegetable oil-baseddietary fats, adjustedfor SFA, energyadjusted using
g/day
Breast cancerPost-menopausal
28.0vs.4.2
41.68(1.07, 2.66)
0.018
B C D E F G
incidence
Wilfart, E etal.,2005,BRE11111
Sweden, Post menopausalMalmo Diet and Cancer,1991
50 - (59) 237 Cancer registry7-day Record +Questionnaire
Nested CaseControl
673
Vegetable oil-baseddietary fats, adjustedfor MUFA, energyadjusted using
g/day
Breast cancerPost-menopausal
28.0vs.4.2
41.43(0.9, 2.27)
0.088
B C D E F G
incidence
Wilfart, E etal.,2005,BRE11111
Sweden, Post menopausalMalmo Diet and Cancer,1991
50 - (59) 237 Cancer registry7-day Record +Questionnaire
Nested CaseControl
673
Vegetable oil-baseddietary fats, adjustedfor omega6PUFA,energy adjusted using
g/day
Breast cancerPost-menopausal
28.0vs.4.2
41.1(0.64, 1.88)
0.625
B C D E F G
incidence
57

Author, Year,WCRF Code
Country, Ethnicity, Specialcharacteristics
Age Cases n Caseascertainment
Type of studyNon-Cases n
Lenght offollow-up / loss
Assessmentdetail
Additional details Unit Outcome Subgroup Contrast Nocat. OR (95% CI) p
valueptrend A B C D E F G
adjustments
Wilfart, E etal.,2005,BRE11111
Sweden, Post menopausalMalmo Diet and Cancer,1991
50 - (59) 237 Cancer registry7-day Record +Questionnaire
Nested CaseControl
673
Vegetable oil-baseddietary fats, adjustedfor omega3PUFA,energy adjusted using
g/day
Breast cancerPost-menopausal
28.0vs.4.2
41.59(1.01, 2.5)
0.032
B C D E F G
incidence
2.6.3
Margarine
Menopausal status not specified
Thiebaut, A.C.,2001,BRE12244
France, Multi-ethnic,Registered teachersE3N-EPIC, 1990
40 - 65
Through socialorganization(profession,religion)
FFQ-Semi-quantitative
ProspectiveCohort
65879.0 3.4 years g/day
Breast cancer3° tertilevs.noconsumers
21.05(0.86, 1.28)
A B C D E F G
incidence
FrazierL.A.,2003,BRE02941
USA, Multi-ethnic,Registered nursesNurses' Health Study (NHS)Cohort 1976-1996
40 - 65
Through healthorg. (screening,healthinsurance)
FFQ (nos)Nested CaseControl
121700.0 10.0 years adolescentserving/day
Breast cancer1.0(continuous)
10.96(0.89, 1.03)
A C D E F G
incidence
2.6.4
Fructose
Pre-menopausal
FrazierL.A.,2004,BRE02942
USA, Multi-ethnic,Registered nursesNurses' Health study II
34 - 51 361
Through healthorg. (screening,healthinsurance)
FFQ (nos)Historical Cohort 47517 9.0 years adolescent diet gm/day
Breast cancerPre-menopausal
48.17vs.16.98
51.25(0.91, 1.74)
0.32 A C D E F G
incidence
Post-menopausal
Nielsen, T.G.,2005,BRE23581
Denmark, Post-menopausalDiet, Cancer and Health,1993
50 - 65 By Mail FFQ (nos)ProspectiveCohort
23870.0 6.6 years g/day
Breast cancerPost-menopausal
10.0(continuous)
10.99(0.81, 1.2)
0.99 B C D E F
incidence
Nielsen, T.G.,2005,BRE23581
Denmark, Post-menopausalDiet, Cancer and Health,1993
50 - 65 By Mail FFQ (nos)ProspectiveCohort
23870.0 6.6 years g/day
Breast cancer ER+Post-menopausal
10.0(continuous)
11.06(0.96, 1.18)
0.99 B C D E F
incidence
Nielsen, T.G.,2005,BRE23581
Denmark, Post-menopausalDiet, Cancer and Health,1993
50 - 65 By Mail FFQ (nos)ProspectiveCohort
23870.0 6.6 years g/day
Breast cancer ER-Post-menopausal
10.0(continuous)
10.84(0.67, 1.06)
0.99 B C D E F
incidence
2.7
Dairy products
Pre-menopausal
Lin J,2007,BRE80165US, not statedWomen's Health Study
54 - 56 276 medical records FFQProspectiveCohort
31487.0 10.0 years total diary productsservings/day
Invasive breast cancerPre-menopausal
>3.13vs.<0.92
60.64(0.42, 0.95)
0.09 A C F G
incidence
58

Author, Year,WCRF Code
Country, Ethnicity, Specialcharacteristics
Age Cases n Caseascertainment
Type of studyNon-Cases n
Lenght offollow-up / loss
Assessmentdetail
Additional details Unit Outcome Subgroup Contrast Nocat. OR (95% CI) p
valueptrend A B C D E F G
adjustments
Post-menopausal
Lin J,2007,BRE80165US, not statedWomen's Health Study
54 - 56 743 medical records FFQProspectiveCohort
31487.0 10.0 years total diary productsservings/day
Invasive breast cancerPost-menopausal
>3.13vs.<0.92
61.07(0.82, 1.39)
0.83 A C F G
incidence
High-fat dairy
Pre-menopausal
Shin, M.-H.,2002,BRE16658
USA, Not specified,Registered nursesNurses' Health Study (NHS)Cohort 1976-1996
(47) 827 By Mail FFQ (nos)ProspectiveCohort
85519 16.0 years serving/day
Invasive breast cancerPre-menopausal
1.0(continuous)
40.93(0.86, 1.01)
A C D E F G
mortality/incidence
Cho, E.,2003,BRE17370
US, Multi-ethnic, Pre-menopausalNHS II, 1989
25 - 42 714 By MailFFQ-Semi-quantitative
ProspectiveCohort
90655 8.0 years serving/day
Invasive breast cancerPre-menopausal
2.2vs.0.2
51.36(1.06, 1.75)
.02 A C D E F G
incidence
FrazierL.A.,2004,BRE02942
USA, Multi-ethnic,Registered nursesNurses' Health study II
34 - 51 361
Through healthorg. (screening,healthinsurance)
FFQ (nos)Historical Cohort 47517 9.0 years adolescent dietserving/day
Breast cancerPre-menopausal
4.9vs.0.6
51.11(0.76, 1.62)
0.20 A C D E F G
incidence
Post-menopausal
Shin, M.-H.,2002,BRE16658
USA, Not specified,Registered nursesNurses' Health Study (NHS)Cohort 1976-1996
(47) 2345 By Mail FFQ (nos)ProspectiveCohort
85519 16.0 years serving/day
Invasive breast cancerPost-menopausal
1.0(continuous)
11.01(0.95, 1.07)
A C D E F G
mortality/incidence
McCulloughM.L.,2005,BRE23368
USA, Not specified, Post-menopausalCPS-II US cohort, 1982-1998
50 - 74 2855 By MailFFQ-Semi-quantitative
ProspectiveCohort
68567 9.0 years serving/day
Breast cancerPost-menopausal
>4vs.<0.3
50.89(0.79, 1.0)
0.12 A B C D E F G
incidence
Fung, T.T.,2005,BRE22370
U.S.A., Registered nursesNurses' Health Study (NHS)Cohort 1984
30 - 55 By Mail FFQ (nos)ProspectiveCohort
71058.0 16.0 years serving
Breast cancer ER-Post-menopausal
1.0(continuous)
11.03(0.95, 1.11)
0.54 A C D E F G
incidence
Milk and dairy products
Pre-menopausal
Shin, M.-H.,2002,BRE16658
USA, Not specified,Registered nursesNurses' Health Study (NHS)Cohort 1976-1996
(47) 827 By Mail FFQ (nos)ProspectiveCohort
85519 16.0 years serving/day
Invasive breast cancerPre-menopausal
1.0(continuous)
10.9(0.83, 0.97)
A C D E F G
mortality/incidence
Cho, E.,2003,BRE17370
US, Multi-ethnic, Pre-menopausalNHS II, 1989
25 - 42 714 By MailFFQ-Semi-quantitative
ProspectiveCohort
90655 8.0 years total dairy foodsserving/day
Invasive breast cancerPre-menopausal
4.0vs.0.7
51.03(0.79, 1.36)
.72 A C D E F G
incidence
FrazierL.A.,2004,BRE02942
USA, Multi-ethnic,Registered nursesNurses' Health study II
34 - 51 361
Through healthorg. (screening,healthinsurance)
FFQ (nos)Historical Cohort 47517 9.0 years adolescent dietserving/day
Breast cancerPre-menopausal
4.9vs.1.0
50.83(0.56, 1.24)
0.81 A C D E F G
incidence
59
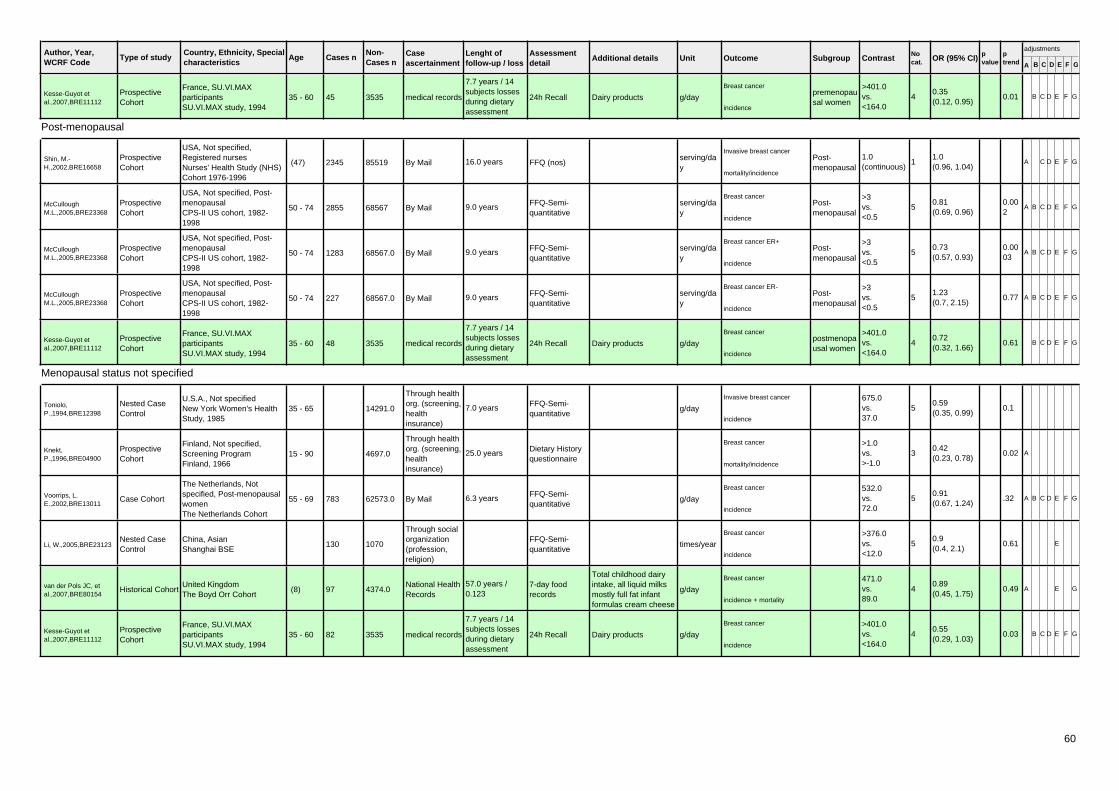
Author, Year,WCRF Code
Country, Ethnicity, Specialcharacteristics
Age Cases n Caseascertainment
Type of studyNon-Cases n
Lenght offollow-up / loss
Assessmentdetail
Additional details Unit Outcome Subgroup Contrast Nocat. OR (95% CI) p
valueptrend A B C D E F G
adjustments
Kesse-Guyot etal.,2007,BRE11112
France, SU.VI.MAXparticipantsSU.VI.MAX study, 1994
35 - 60 45 medical records 24h RecallProspectiveCohort
3535
7.7 years / 14subjects lossesduring dietaryassessment
Dairy products g/day
Breast cancerpremenopausal women
>401.0vs.<164.0
40.35(0.12, 0.95)
0.01 B C D E F G
incidence
Post-menopausal
Shin, M.-H.,2002,BRE16658
USA, Not specified,Registered nursesNurses' Health Study (NHS)Cohort 1976-1996
(47) 2345 By Mail FFQ (nos)ProspectiveCohort
85519 16.0 years serving/day
Invasive breast cancerPost-menopausal
1.0(continuous)
11.0(0.96, 1.04)
A C D E F G
mortality/incidence
McCulloughM.L.,2005,BRE23368
USA, Not specified, Post-menopausalCPS-II US cohort, 1982-1998
50 - 74 2855 By MailFFQ-Semi-quantitative
ProspectiveCohort
68567 9.0 years serving/day
Breast cancerPost-menopausal
>3vs.<0.5
50.81(0.69, 0.96)
0.002
A B C D E F G
incidence
McCulloughM.L.,2005,BRE23368
USA, Not specified, Post-menopausalCPS-II US cohort, 1982-1998
50 - 74 1283 By MailFFQ-Semi-quantitative
ProspectiveCohort
68567.0 9.0 years serving/day
Breast cancer ER+Post-menopausal
>3vs.<0.5
50.73(0.57, 0.93)
0.0003
A B C D E F G
incidence
McCulloughM.L.,2005,BRE23368
USA, Not specified, Post-menopausalCPS-II US cohort, 1982-1998
50 - 74 227 By MailFFQ-Semi-quantitative
ProspectiveCohort
68567.0 9.0 years serving/day
Breast cancer ER-Post-menopausal
>3vs.<0.5
51.23(0.7, 2.15)
0.77 A B C D E F G
incidence
Kesse-Guyot etal.,2007,BRE11112
France, SU.VI.MAXparticipantsSU.VI.MAX study, 1994
35 - 60 48 medical records 24h RecallProspectiveCohort
3535
7.7 years / 14subjects lossesduring dietaryassessment
Dairy products g/day
Breast cancerpostmenopausal women
>401.0vs.<164.0
40.72(0.32, 1.66)
0.61 B C D E F G
incidence
Menopausal status not specified
Toniolo,P.,1994,BRE12398
U.S.A., Not specifiedNew York Women's HealthStudy, 1985
35 - 65
Through healthorg. (screening,healthinsurance)
FFQ-Semi-quantitative
Nested CaseControl
14291.0 7.0 years g/day
Invasive breast cancer 675.0vs.37.0
50.59(0.35, 0.99)
0.1incidence
Knekt,P.,1996,BRE04900
Finland, Not specified,Screening ProgramFinland, 1966
15 - 90
Through healthorg. (screening,healthinsurance)
Dietary Historyquestionnaire
ProspectiveCohort
4697.0 25.0 yearsBreast cancer >1.0
vs.>-1.0
30.42(0.23, 0.78)
0.02 A
mortality/incidence
Voorrips, L.E.,2002,BRE13011
The Netherlands, Notspecified, Post-menopausalwomenThe Netherlands Cohort
55 - 69 783 By MailFFQ-Semi-quantitative
Case Cohort 62573.0 6.3 years g/day
Breast cancer 532.0vs.72.0
50.91(0.67, 1.24)
.32 A B C D E F G
incidence
Li, W.,2005,BRE23123China, AsianShanghai BSE
130
Through socialorganization(profession,religion)
FFQ-Semi-quantitative
Nested CaseControl
1070 times/year
Breast cancer >376.0vs.<12.0
50.9(0.4, 2.1)
0.61 E
incidence
van der Pols JC, etal.,2007,BRE80154
United KingdomThe Boyd Orr Cohort
(8) 97National HealthRecords
7-day foodrecords
Historical Cohort 4374.057.0 years /0.123
Total childhood dairyintake, all liquid milksmostly full fat infantformulas cream cheese
g/day
Breast cancer 471.0vs.89.0
40.89(0.45, 1.75)
0.49 A E G
incidence + mortality
Kesse-Guyot etal.,2007,BRE11112
France, SU.VI.MAXparticipantsSU.VI.MAX study, 1994
35 - 60 82 medical records 24h RecallProspectiveCohort
3535
7.7 years / 14subjects lossesduring dietaryassessment
Dairy products g/day
Breast cancer >401.0vs.<164.0
40.55(0.29, 1.03)
0.03 B C D E F G
incidence
60

Author, Year,WCRF Code
Country, Ethnicity, Specialcharacteristics
Age Cases n Caseascertainment
Type of studyNon-Cases n
Lenght offollow-up / loss
Assessmentdetail
Additional details Unit Outcome Subgroup Contrast Nocat. OR (95% CI) p
valueptrend A B C D E F G
adjustments
2.7.1
Milk
Pre-menopausal
Hjartaker,A.,2001,BRE03955
Norwey, Not specified,Young womenNOWAC, 1991
34 - 49 266 By MailQuestionnaire(nos)
ProspectiveCohort
42604 6.2 years Glasses/day
Breast cancerPre-menopausal
>3,1vs.do not drink
40.56(0.31, 1.01)
0.12 A B C D E F G
incidence
Shin, M.-H.,2002,BRE16658
USA, Not specified,Registered nursesNurses' Health Study (NHS)Cohort 1976-1996
(47) 827 By Mail FFQ (nos)ProspectiveCohort
85519 16.0 years Cups/day
Invasive breast cancerPre-menopausal
1.0(continuous)
10.85(0.79, 0.92)
A C D E F G
mortality/incidence
Kesse-Guyot etal.,2007,BRE11112
France, SU.VI.MAXparticipantsSU.VI.MAX study, 1994
35 - 60 44 medical records 24h RecallProspectiveCohort
3535
7.7 years / 14subjects lossesduring dietaryassessment
Milk g/day
Breast cancerpremenopausal women
>249.0vs.<24.0
40.41(0.16, 1.04)
0.01 B C D E F G
incidence
Post-menopausal
Mills, P.K.,1988,BRE17836
US, White, AdventistSeventh-day AdventistsCohort, 1960
30 - 85 76
Through socialorganization(profession,religion)
Questionnaire(nos)
Nested CaseControl
16190.020.0 years / 1.7% days/week
Breast cancerPost-menopausal
3+vs.none/occasional
40.89(0.34, 2.35)
0.64 B C D E
mortality/incidence
Shin, M.-H.,2002,BRE16658
USA, Not specified,Registered nursesNurses' Health Study (NHS)Cohort 1976-1996
(47) 2345 By Mail FFQ (nos)ProspectiveCohort
85519 16.0 years Cups/day
Invasive breast cancerPost-menopausal
1.0(continuous)
10.99(0.93, 1.05)
A C D E F G
mortality/incidence
McCulloughM.L.,2005,BRE23368
USA, Not specified, Post-menopausalCPS-II US cohort, 1982-1998
50 - 74 2855 By MailFFQ-Semi-quantitative
ProspectiveCohort
68567 9.0 years total milk
Breast cancerPost-menopausal
>3.1vs.non-milkdrinker
60.88(0.76, 1.02)
0.13 A B C D E F G
incidence
McCulloughM.L.,2005,BRE23368
USA, Not specified, Post-menopausalCPS-II US cohort, 1982-1998
50 - 74 1283 By MailFFQ-Semi-quantitative
ProspectiveCohort
68567.0 9.0 years mg/day
Breast cancer ER+Post-menopausal
>1250vs.<=500
50.67(0.51, 0.88)
0.004
A B C D E F G
incidence
McCulloughM.L.,2005,BRE23368
USA, Not specified, Post-menopausalCPS-II US cohort, 1982-1998
50 - 74 227 By MailFFQ-Semi-quantitative
ProspectiveCohort
68567.0 9.0 years mg/day
Breast cancer ER-Post-menopausal
>1250vs.<=500
50.77(0.4, 1.47)
0.49 A B C D E F G
incidence
Kesse-Guyot etal.,2007,BRE11112
France, SU.VI.MAXparticipantsSU.VI.MAX study, 1994
35 - 60 48 medical records 24h RecallProspectiveCohort
3535
7.7 years / 14subjects lossesduring dietaryassessment
Milk g/day
Breast cancerpostmenopausal women
>249.0vs.<24.0
41.82(0.79, 4.17)
0.96 B C D E F G
incidence
Menopausal status not specified
Mills, P.K.,1988,BRE17836
US, White, AdventistSeventh-day AdventistsCohort, 1960
30 - 85 142
Through socialorganization(profession,religion)
Questionnaire(nos)
Nested CaseControl
16190.020.0 years / 1.7%
drinks/week
Breast cancer3+vs.none/occasional
41.03(0.56, 1.9)
0.95 B C D E
mortality/incidence
61

Author, Year,WCRF Code
Country, Ethnicity, Specialcharacteristics
Age Cases n Caseascertainment
Type of studyNon-Cases n
Lenght offollow-up / loss
Assessmentdetail
Additional details Unit Outcome Subgroup Contrast Nocat. OR (95% CI) p
valueptrend A B C D E F G
adjustments
Gaard,,1995,BRE17516
Norway, Not specified,Screening ProgramNorway National HealthScreening Service, 1974
35 - 49 236 By MailFFQ-Semi-quantitative
ProspectiveCohort
261056 10.0 years Glasses/day
Breast cancer >=5vs.1
51.71(0.86, 3.38)
0.30 A
incidence
Knekt,P.,1996,BRE04900
Finland, Not specified,Screening ProgramFinland, 1966
15 - 90
Through healthorg. (screening,healthinsurance)
Dietary Historyquestionnaire
ProspectiveCohort
4697.0 25.0 years g/day
Breast cancer >1.0vs.>-1.0
30.42(0.24, 0.74)
0.003
A
mortality/incidence
Jarvinen,R.,1997,BRE04383
finlandFinland, 1966
15 - UnspecifiedDietary Historyquestionnaire
ProspectiveCohort
4697.0 24.0 yearsBreast cancer Quantile 3
vs.Quantile 1
20.42(null, null)
0.003
A
incidence
Key, T.J.,1999,BRE04758
Japan, Not specifiedLSS, 1969
427 By MailQuestionnaire(nos)
ProspectiveCohort
488989 24.0 years times/week
Breast cancer >=5vs.<=1
40.96(0.76, 1.22)
0.770
A G
incidence
Kesse-Guyot etal.,2007,BRE11112
France, SU.VI.MAXparticipantsSU.VI.MAX study, 1994
35 - 60 92 medical records 24h RecallProspectiveCohort
3535
7.7 years / 14subjects lossesduring dietaryassessment
Milk g/day
Breast cancer >249.0vs.<24.0
40.95(0.52, 1.73)
0.09 B C D E F G
incidence
Milk only
Menopausal status not specified
van der Pols JC, etal.,2007,BRE80154
United KingdomThe Boyd Orr Cohort
(8) 98National HealthRecords
7-day foodrecords
Historical Cohort 4374.057.0 years /0.123
Childhood milk intake,1 cup milk = 235ml
cups/day
Breast cancer >=1.2vs.<0.5
40.83(0.41, 1.69)
0.45 A E G
incidence + mortality
Milk shake
Menopausal status not specified
FrazierL.A.,2003,BRE02941
USA, Multi-ethnic,Registered nursesNurses' Health Study (NHS)Cohort 1976-1996
40 - 65
Through healthorg. (screening,healthinsurance)
FFQ (nos)Nested CaseControl
121700.0 10.0 years adolescent Cups/day
Breast cancer1.0(continuous)
11.06(0.7, 1.6)
A C D E F G
incidence
Milk, at different age
Pre-menopausal
Hjartaker,A.,2001,BRE03955
Norwey, Not specified,Young womenNOWAC, 1991
34 - 49 266 By MailQuestionnaire(nos)
ProspectiveCohort
42624 6.2 years as a childGlasses/day
Breast cancerPre-menopausal
>7vs.do not drink
40.64(0.22, 1.87)
0.36 A B C D E F G
incidence
Shin, M.-H.,2002,BRE16658
USA, Not specified,Registered nursesNurses' Health Study (NHS)Cohort 1976-1996
(47) 827 By Mail FFQ (nos)ProspectiveCohort
85519 16.0 years during high schoolyears
Cups/day
Invasive breast cancerPre-menopausal
1.0(continuous)
10.97(0.9, 1.05)
A C D E F G
mortality/incidence
Post-menopausal
Shin, M.-H.,2002,BRE16658
USA, Not specified,Registered nursesNurses' Health Study (NHS)Cohort 1976-1996
(47) 2345 By Mail FFQ (nos)ProspectiveCohort
85519 16.0 years during high schoolyears
Cups/day
Invasive breast cancerPost-menopausal
1.0(continuous)
11.02(0.98, 1.06)
A C D E F G
mortality/incidence
62

Author, Year,WCRF Code
Country, Ethnicity, Specialcharacteristics
Age Cases n Caseascertainment
Type of studyNon-Cases n
Lenght offollow-up / loss
Assessmentdetail
Additional details Unit Outcome Subgroup Contrast Nocat. OR (95% CI) p
valueptrend A B C D E F G
adjustments
2.7.1.1
Whole milk
Pre-menopausal
Shin, M.-H.,2002,BRE16658
USA, Not specified,Registered nursesNurses' Health Study (NHS)Cohort 1976-1996
(47) 827 By Mail FFQ (nos)ProspectiveCohort
85519 16.0 years Cups/day
Invasive breast cancerPre-menopausal
1.0(continuous)
10.92(0.8, 1.06)
A C D E F G
mortality/incidence
Post-menopausal
Mills, P.K.,1989,BRE17837
USA, White, AdventistCalifornia Seventh-dayAdventists Cohort, 1976
25 - 99 171 By Mail FFQ (nos)ProspectiveCohort
12062 6.0 years / 1% times/day
Breast cancerPost-menopausal
daily+vs.never
30.98(0.66, 1.45)
A B C D F G
incidence
Shin, M.-H.,2002,BRE16658
USA, Not specified,Registered nursesNurses' Health Study (NHS)Cohort 1976-1996
(47) 2345 By Mail FFQ (nos)ProspectiveCohort
85519 16.0 years Cups/day
Invasive breast cancerPost-menopausal
1.0(continuous)
10.97(0.9, 1.05)
A C D E F G
mortality/incidence
Menopausal status not specified
Mills, P.K.,1989,BRE17837
USA, White, AdventistCalifornia Seventh-dayAdventists Cohort, 1976
25 - 99 201 By Mail FFQ (nos)ProspectiveCohort
100224 6.0 years / 1% times/day
Breast cancer >=dailyvs.none
30.94(0.66, 1.33)
0.45 A B C D F G
incidence
Gaard,,1995,BRE17516
Norway, Not specified,Screening ProgramNorway National HealthScreening Service, 1974
35 - 49 125 By MailFFQ-Semi-quantitative
ProspectiveCohort
146564 10.0 years Glasses/day
Breast cancer >=5vs.1
52.91(1.38, 6.14)
0.08 A
incidence
Voorrips, L.E.,2002,BRE13011
The Netherlands, Notspecified, Post-menopausalwomenThe Netherlands Cohort
55 - 69 783 By MailFFQ-Semi-quantitative
Case Cohort 62573.0 6.3 years g/day
Breast cancer 232.0vs.0.0
50.9(0.66, 1.22)
.12 A B C D E F G
incidence
FrazierL.A.,2003,BRE02941
USA, Multi-ethnic,Registered nursesNurses' Health Study (NHS)Cohort 1976-1996
40 - 65
Through healthorg. (screening,healthinsurance)
FFQ (nos)Nested CaseControl
121700.0 10.0 years adolescent Cups/day
Breast cancer1.0(continuous)
11.01(0.95, 1.07)
A C D E F G
incidence
2.7.1.2
Skimmed milk
Pre-menopausal
Shin, M.-H.,2002,BRE16658
USA, Not specified,Registered nursesNurses' Health Study (NHS)Cohort 1976-1996
(47) 827 By Mail FFQ (nos)ProspectiveCohort
85519 16.0 years Cups/day
Invasive breast cancerPre-menopausal
1.0(continuous)
10.88(0.8, 0.97)
A C D E F G
mortality/incidence
Post-menopausal
Shin, M.-H.,2002,BRE16658
USA, Not specified,Registered nursesNurses' Health Study (NHS)Cohort 1976-1996
(47) 2345 By Mail FFQ (nos)ProspectiveCohort
85519 16.0 years Cups/day
Invasive breast cancerPost-menopausal
1.0(continuous)
11.0(0.95, 1.07)
A C D E F G
mortality/incidence
63

Author, Year,WCRF Code
Country, Ethnicity, Specialcharacteristics
Age Cases n Caseascertainment
Type of studyNon-Cases n
Lenght offollow-up / loss
Assessmentdetail
Additional details Unit Outcome Subgroup Contrast Nocat. OR (95% CI) p
valueptrend A B C D E F G
adjustments
Menopausal status not specified
Voorrips, L.E.,2002,BRE13011
The Netherlands, Notspecified, Post-menopausalwomenThe Netherlands Cohort
55 - 69 783 By MailFFQ-Semi-quantitative
Case Cohort 62573.0 6.3 years g/day
Breast cancer 203.0vs.0.0
31.04(0.84, 1.3)
.83 A B C D E F G
incidence
FrazierL.A.,2003,BRE02941
USA, Multi-ethnic,Registered nursesNurses' Health Study (NHS)Cohort 1976-1996
40 - 65
Through healthorg. (screening,healthinsurance)
FFQ (nos)Nested CaseControl
121700.0 10.0 years adolescent Cups/day
Breast cancer1.0(continuous)
11.03(0.88, 1.21)
A C D E F G
incidence
2.7.2
Cheese
Pre-menopausal
Shin, M.-H.,2002,BRE16658
USA, Not specified,Registered nursesNurses' Health Study (NHS)Cohort 1976-1996
(47) 827 By Mail FFQ (nos)ProspectiveCohort
85519 16.0 years hard cheeseserving/day
Invasive breast cancerPre-menopausal
1.0(continuous)
10.96(0.76, 1.21)
A C D E F G
mortality/incidence
Kesse-Guyot etal.,2007,BRE11112
France, SU.VI.MAXparticipantsSU.VI.MAX study, 1994
35 - 60 44 medical records 24h RecallProspectiveCohort
3535
7.7 years / 14subjects lossesduring dietaryassessment
Cheese g/day
Breast cancerpremenopausal women
>49.0vs.<14.0
41.16(0.46, 2.91)
0.70 B C D E F G
incidence
Kesse-Guyot etal.,2007,BRE11112
France, SU.VI.MAXparticipantsSU.VI.MAX study, 1994
35 - 60 44 medical records 24h RecallProspectiveCohort
3535
7.7 years / 14subjects lossesduring dietaryassessment
Fresh cheese g/day
Breast cancerpremenopausal women
>51.0vs.0
40.5(0.17, 1.44)
0.17 B C D E F G
incidence
Post-menopausal
Mills, P.K.,1988,BRE17836
US, White, AdventistSeventh-day AdventistsCohort, 1960
30 - 85 75
Through socialorganization(profession,religion)
Questionnaire(nos)
Nested CaseControl
16190.020.0 years / 1.7% days/week
Breast cancerPost-menopausal
3+vs.none/occasional
41.25(0.6, 2.61)
0.92 B C D E
mortality/incidence
Mills, P.K.,1989,BRE17837
USA, White, AdventistCalifornia Seventh-dayAdventists Cohort, 1976
25 - 99 171 By Mail FFQ (nos)ProspectiveCohort
12062 6.0 years / 1% times/month
Breast cancerPost-menopausal
>=12vs.<=2
31.33(0.89, 2.0)
A B C D F G
incidence
Shin, M.-H.,2002,BRE16658
USA, Not specified,Registered nursesNurses' Health Study (NHS)Cohort 1976-1996
(47) 2345 By Mail FFQ (nos)ProspectiveCohort
85519 16.0 years hard cheeseserving/day
Invasive breast cancerPost-menopausal
1.0(continuous)
11.01(0.88, 1.16)
A C D E F G
mortality/incidence
Kesse-Guyot etal.,2007,BRE11112
France, SU.VI.MAXparticipantsSU.VI.MAX study, 1994
35 - 60 48 medical records 24h RecallProspectiveCohort
3535
7.7 years / 14subjects lossesduring dietaryassessment
Cheese g/day
Breast cancerpostmenopausal women
>49.0vs.<14.0
41.05(0.44, 2.55)
0.73 B C D E F G
incidence
Kesse-Guyot etal.,2007,BRE11112
France, SU.VI.MAXparticipantsSU.VI.MAX study, 1994
35 - 60 48 medical records 24h RecallProspectiveCohort
3535
7.7 years / 14subjects lossesduring dietaryassessment
Fresh cheese g/day
Breast cancerpostmenopausal women
>51.0vs.0
41.23(0.59, 2.57)
0.88 B C D E F G
incidence
Menopausal status not specified
64

Author, Year,WCRF Code
Country, Ethnicity, Specialcharacteristics
Age Cases n Caseascertainment
Type of studyNon-Cases n
Lenght offollow-up / loss
Assessmentdetail
Additional details Unit Outcome Subgroup Contrast Nocat. OR (95% CI) p
valueptrend A B C D E F G
adjustments
Mills, P.K.,1988,BRE17836
US, White, AdventistSeventh-day AdventistsCohort, 1960
30 - 85 141
Through socialorganization(profession,religion)
Questionnaire(nos)
Nested CaseControl
16190.020.0 years / 1.7% days/week
Breast cancer3+vs.none/occasional
41.04(0.61, 1.75)
0.98 B C D E
mortality/incidence
Mills, P.K.,1989,BRE17837
USA, White, AdventistCalifornia Seventh-dayAdventists Cohort, 1976
25 - 99 203 By Mail FFQ (nos)ProspectiveCohort
103651 6.0 years / 1% times/month
Breast cancer >=12vs.<=2
31.43(0.99, 2.06)
0.03 A B C D F G
incidence
Knekt,P.,1996,BRE04900
Finland, Not specified,Screening ProgramFinland, 1966
15 - 90
Through healthorg. (screening,healthinsurance)
Dietary Historyquestionnaire
ProspectiveCohort
4697.0 25.0 yearsBreast cancer >1.0
vs.>-1.0
31.25(0.75, 2.08)
0.66 A
mortality/incidence
Jarvinen,R.,1997,BRE04383
finlandFinland, 1966
15 - UnspecifiedDietary Historyquestionnaire
ProspectiveCohort
4697.0 24.0 yearsBreast cancer Quantile 3
vs.Quantile 1
21.25(null, null)
A
incidence
Thiebaut, A.C.,2001,BRE12244
France, Multi-ethnic,Registered teachersE3N-EPIC, 1990
40 - 65
Through socialorganization(profession,religion)
FFQ-Semi-quantitative
ProspectiveCohort
65879.0 3.4 years g/day
Breast cancer 4° quartilevs.1° quartile
20.92(0.74, 1.13)
A B C D E F G
incidence
Voorrips, L.E.,2002,BRE13011
The Netherlands, Notspecified, Post-menopausalwomenThe Netherlands Cohort
55 - 69 783 By MailFFQ-Semi-quantitative
Case Cohort 62573.0 6.3 years g/day
Breast cancer 90.0vs.2.0
50.94(0.67, 1.31)
.78 A B C D E F G
incidence
FrazierL.A.,2003,BRE02941
USA, Multi-ethnic,Registered nursesNurses' Health Study (NHS)Cohort 1976-1996
40 - 65
Through healthorg. (screening,healthinsurance)
FFQ (nos)Nested CaseControl
121700.0 10.0 years adolescentserving/day
Breast cancer1.0(continuous)
10.91(0.71, 1.16)
A C D E F G
incidence
Kesse-Guyot etal.,2007,BRE11112
France, SU.VI.MAXparticipantsSU.VI.MAX study, 1994
35 - 60 92 medical records 24h RecallProspectiveCohort
3535
7.7 years / 14subjects lossesduring dietaryassessment
Cheese g/day
Breast cancer >49.0vs.<14.0
41.13(0.6, 2.13)
0.58 B C D E F G
incidence
Kesse-Guyot etal.,2007,BRE11112
France, SU.VI.MAXparticipantsSU.VI.MAX study, 1994
35 - 60 92 medical records 24h RecallProspectiveCohort
3535
7.7 years / 14subjects lossesduring dietaryassessment
Fresh cheese g/day
Breast cancer >51.0vs.0
40.86(0.48, 1.55)
0.31 B C D E F G
incidence
2.7.2.2
Low-fat dairy
Pre-menopausal
Shin, M.-H.,2002,BRE16658
USA, Not specified,Registered nursesNurses' Health Study (NHS)Cohort 1976-1996
(47) 827 By Mail FFQ (nos)ProspectiveCohort
85519 16.0 years serving/day
Invasive breast cancerPre-menopausal
1.0(continuous)
10.82(0.73, 0.92)
A C D E F G
mortality/incidence
Cho, E.,2003,BRE17370
US, Multi-ethnic, Pre-menopausalNHS II, 1989
25 - 42 714 By MailFFQ-Semi-quantitative
ProspectiveCohort
90655 8.0 years serving/day
Invasive breast cancerPre-menopausal
2.8vs.0.2
50.82(0.63, 1.06)
.17 A C D E F G
incidence
65

Author, Year,WCRF Code
Country, Ethnicity, Specialcharacteristics
Age Cases n Caseascertainment
Type of studyNon-Cases n
Lenght offollow-up / loss
Assessmentdetail
Additional details Unit Outcome Subgroup Contrast Nocat. OR (95% CI) p
valueptrend A B C D E F G
adjustments
FrazierL.A.,2004,BRE02942
USA, Multi-ethnic,Registered nursesNurses' Health study II
34 - 51 361
Through healthorg. (screening,healthinsurance)
FFQ (nos)Historical Cohort 47517 9.0 years adolescent dietserving/day
Breast cancerPre-menopausal
2.6vs.0.0
50.88(0.6, 1.29)
0.24 A C D E F G
incidence
Post-menopausal
Shin, M.-H.,2002,BRE16658
USA, Not specified,Registered nursesNurses' Health Study (NHS)Cohort 1976-1996
(47) 2345 By Mail FFQ (nos)ProspectiveCohort
85519 16.0 years serving/day
Invasive breast cancerPost-menopausal
1.0(continuous)
11.02(0.94, 1.1)
A C D E F G
mortality/incidence
McCulloughM.L.,2005,BRE23368
USA, Not specified, Post-menopausalCPS-II US cohort, 1982-1998
50 - 74 2855 By MailFFQ-Semi-quantitative
ProspectiveCohort
68567 9.0 years serving/day
Breast cancerPost-menopausal
>3vs.<0.5
50.86(0.74, 0.99)
0.016
A B C D E F G
incidence
McCulloughM.L.,2005,BRE23368
USA, Not specified, Post-menopausalCPS-II US cohort, 1982-1998
50 - 74 1283 By MailFFQ-Semi-quantitative
ProspectiveCohort
68567.0 9.0 years serving/day
Breast cancer ER+Post-menopausal
>3vs.<0.5
50.76(0.61, 0.94)
0.002
A B C D E F G
incidence
McCulloughM.L.,2005,BRE23368
USA, Not specified, Post-menopausalCPS-II US cohort, 1982-1998
50 - 74 227 By MailFFQ-Semi-quantitative
ProspectiveCohort
68567.0 9.0 years serving/day
Breast cancer ER-Post-menopausal
>3vs.<0.5
51.22(0.74, 2.03)
0.59 A B C D E F G
incidence
2.7.3
Yoghurt
Pre-menopausal
Shin, M.-H.,2002,BRE16658
USA, Not specified,Registered nursesNurses' Health Study (NHS)Cohort 1976-1996
(47) 827 By Mail FFQ (nos)ProspectiveCohort
85519 16.0 years serving/day
Invasive breast cancerPre-menopausal
1.0(continuous)
10.94(0.65, 1.37)
A C D E F G
mortality/incidence
Kesse-Guyot etal.,2007,BRE11112
France, SU.VI.MAXparticipantsSU.VI.MAX study, 1994
35 - 60 45 medical records 24h RecallProspectiveCohort
3535
7.7 years / 14subjects lossesduring dietaryassessment
Yoghurt g/day
Breast cancerpremenopausal women
>126.0vs.<24.0
41.01(0.4, 2.58)
0.75 B C D E F G
incidence
Post-menopausal
Shin, M.-H.,2002,BRE16658
USA, Not specified,Registered nursesNurses' Health Study (NHS)Cohort 1976-1996
(47) 2345 By Mail FFQ (nos)ProspectiveCohort
85519 16.0 years serving/day
Invasive breast cancerPost-menopausal
1.0(continuous)
10.94(0.77, 1.15)
A C D E F G
mortality/incidence
Kesse-Guyot etal.,2007,BRE11112
France, SU.VI.MAXparticipantsSU.VI.MAX study, 1994
35 - 60 48 medical records 24h RecallProspectiveCohort
3535
7.7 years / 14subjects lossesduring dietaryassessment
Yoghurt g/day
Breast cancerpostmenopausal women
>126.0vs.<24.0
40.59(0.22, 1.54)
0.28 B C D E F G
incidence
Menopausal status not specified
Knekt,P.,1996,BRE04900
Finland, Not specified,Screening ProgramFinland, 1966
15 - 90
Through healthorg. (screening,healthinsurance)
Dietary Historyquestionnaire
ProspectiveCohort
4697.0 25.0 years fermented milk
Breast cancer >1.0vs.>-1.0
31.37(0.8, 2.37)
0.47 A
mortality/incidence
66

Author, Year,WCRF Code
Country, Ethnicity, Specialcharacteristics
Age Cases n Caseascertainment
Type of studyNon-Cases n
Lenght offollow-up / loss
Assessmentdetail
Additional details Unit Outcome Subgroup Contrast Nocat. OR (95% CI) p
valueptrend A B C D E F G
adjustments
Jarvinen,R.,1997,BRE04383
finlandFinland, 1966
15 - UnspecifiedDietary Historyquestionnaire
ProspectiveCohort
4697.0 24.0 years fermented milk
Breast cancer Quantile 3vs.Quantile 1
21.37(null, null)
A
incidence
Kesse-Guyot etal.,2007,BRE11112
France, SU.VI.MAXparticipantsSU.VI.MAX study, 1994
35 - 60 92 medical records 24h RecallProspectiveCohort
3535
7.7 years / 14subjects lossesduring dietaryassessment
Yoghurt g/day
Breast cancer >126.0vs.<24.0
40.79(0.41, 1.53)
0.32 B C D E F G
incidence
2.7.3.1
Fermented whole milk
Menopausal status not specified
Voorrips, L.E.,2002,BRE13011
The Netherlands, Notspecified, Post-menopausalwomenThe Netherlands Cohort
55 - 69 783 By MailFFQ-Semi-quantitative
Case Cohort 62573.0 6.3 years g/day
Breast cancer 53.0vs.0.0
20.88(0.71, 1.1)
.15 A B C D E F G
incidence
2.7.3.2
Fermented skimmed milk
Menopausal status not specified
Voorrips, L.E.,2002,BRE13011
The Netherlands, Notspecified, Post-menopausalwomenThe Netherlands Cohort
55 - 69 783 By MailFFQ-Semi-quantitative
Case Cohort 62573.0 6.3 years g/day
Breast cancer 172.0vs.0.0
30.89(0.7, 1.14)
.22 A B C D E F G
incidence
2.7.7
Ice cream
Menopausal status not specified
Knekt,P.,1996,BRE04900
Finland, Not specified,Screening ProgramFinland, 1966
15 - 90
Through healthorg. (screening,healthinsurance)
Dietary Historyquestionnaire
ProspectiveCohort
4697.0 25.0 yearsBreast cancer >1.0
vs.>-1.0
30.63(0.35, 1.15)
0.32 A
mortality/incidence
Jarvinen,R.,1997,BRE04383
finlandFinland, 1966
15 - UnspecifiedDietary Historyquestionnaire
ProspectiveCohort
4697.0 24.0 yearsBreast cancer Quantile 3
vs.Quantile 1
20.63(null, null)
A
incidence
FrazierL.A.,2003,BRE02941
USA, Multi-ethnic,Registered nursesNurses' Health Study (NHS)Cohort 1976-1996
40 - 65
Through healthorg. (screening,healthinsurance)
FFQ (nos)Nested CaseControl
121700.0 10.0 years adolescent Cups/day
Breast cancer0.5(continuous)
10.94(0.71, 1.23)
A C D E F G
incidence
2.8
Lotus rhizomes (nymphaeaceae)
Menopausal status not specified
67
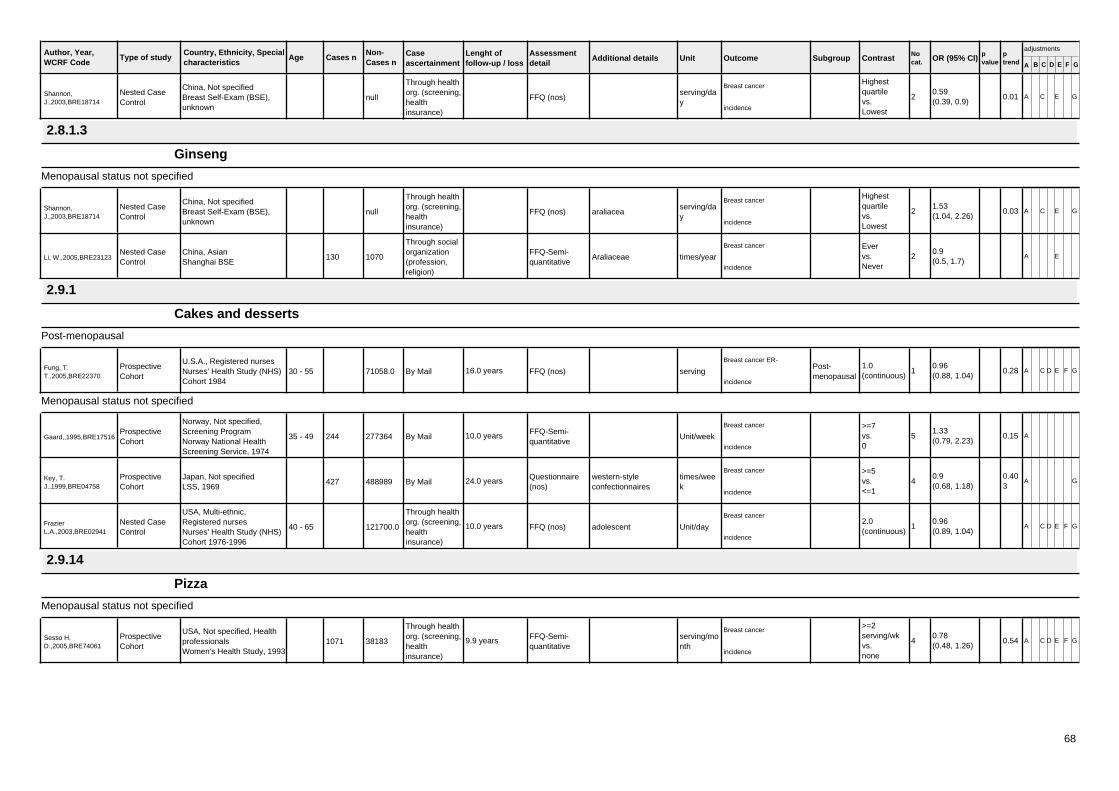
Author, Year,WCRF Code
Country, Ethnicity, Specialcharacteristics
Age Cases n Caseascertainment
Type of studyNon-Cases n
Lenght offollow-up / loss
Assessmentdetail
Additional details Unit Outcome Subgroup Contrast Nocat. OR (95% CI) p
valueptrend A B C D E F G
adjustments
Shannon,J.,2003,BRE18714
China, Not specifiedBreast Self-Exam (BSE),unknown
Through healthorg. (screening,healthinsurance)
FFQ (nos)Nested CaseControl
nullserving/day
Breast cancerHighestquartilevs.Lowest
20.59(0.39, 0.9)
0.01 A C E G
incidence
2.8.1.3
Ginseng
Menopausal status not specified
Shannon,J.,2003,BRE18714
China, Not specifiedBreast Self-Exam (BSE),unknown
Through healthorg. (screening,healthinsurance)
FFQ (nos)Nested CaseControl
null araliaceaserving/day
Breast cancerHighestquartilevs.Lowest
21.53(1.04, 2.26)
0.03 A C E G
incidence
Li, W.,2005,BRE23123China, AsianShanghai BSE
130
Through socialorganization(profession,religion)
FFQ-Semi-quantitative
Nested CaseControl
1070 Araliaceae times/year
Breast cancer Evervs.Never
20.9(0.5, 1.7)
A E
incidence
2.9.1
Cakes and desserts
Post-menopausal
Fung, T.T.,2005,BRE22370
U.S.A., Registered nursesNurses' Health Study (NHS)Cohort 1984
30 - 55 By Mail FFQ (nos)ProspectiveCohort
71058.0 16.0 years serving
Breast cancer ER-Post-menopausal
1.0(continuous)
10.96(0.88, 1.04)
0.28 A C D E F G
incidence
Menopausal status not specified
Gaard,,1995,BRE17516
Norway, Not specified,Screening ProgramNorway National HealthScreening Service, 1974
35 - 49 244 By MailFFQ-Semi-quantitative
ProspectiveCohort
277364 10.0 years Unit/week
Breast cancer >=7vs.0
51.33(0.79, 2.23)
0.15 A
incidence
Key, T.J.,1999,BRE04758
Japan, Not specifiedLSS, 1969
427 By MailQuestionnaire(nos)
ProspectiveCohort
488989 24.0 years western-styleconfectionnaires
times/week
Breast cancer >=5vs.<=1
40.9(0.68, 1.18)
0.403
A G
incidence
FrazierL.A.,2003,BRE02941
USA, Multi-ethnic,Registered nursesNurses' Health Study (NHS)Cohort 1976-1996
40 - 65
Through healthorg. (screening,healthinsurance)
FFQ (nos)Nested CaseControl
121700.0 10.0 years adolescent Unit/day
Breast cancer2.0(continuous)
10.96(0.89, 1.04)
A C D E F G
incidence
2.9.14
Pizza
Menopausal status not specified
Sesso H.D.,2005,BRE74061
USA, Not specified, HealthprofessionalsWomen's Health Study, 1993
1071
Through healthorg. (screening,healthinsurance)
FFQ-Semi-quantitative
ProspectiveCohort
38183 9.9 years serving/month
Breast cancer>=2serving/wkvs.none
40.78(0.48, 1.26)
0.54 A C D E F G
incidence
68

Author, Year,WCRF Code
Country, Ethnicity, Specialcharacteristics
Age Cases n Caseascertainment
Type of studyNon-Cases n
Lenght offollow-up / loss
Assessmentdetail
Additional details Unit Outcome Subgroup Contrast Nocat. OR (95% CI) p
valueptrend A B C D E F G
adjustments
3.2
water contamination by hazardous waste site
Menopausal status not specified
SungTI,2007,BRE80157
TaiwanTaiwan chlorinatedhydrocarbons contaminationstudy, 1973
550 Cancer registryoccupationallevel data
Historical Cohort 63982
Chlorinated alkanesand alkenes,particularlytrichloroethylene
Breast cancer Observedvs.Expected
21.09(0.96, 1.22)
A G
incidence
3.3
Fat from dried soup powders
Post-menopausal
Wilfart, E etal.,2005,BRE11111
Sweden, Post menopausalMalmo Diet and Cancer,1991
50 - (59) 237 Cancer registry7-day Record +Questionnaire
Nested CaseControl
673Fat from dried souppowders
g/day
Breast cancerPost-menopausal
0.7vs.0.09
41.6(1.04, 2.47)
0.183
B C D E F G
incidence
Wilfart, E etal.,2005,BRE11111
Sweden, Post menopausalMalmo Diet and Cancer,1991
50 - (59) 237 Cancer registry7-day Record +Questionnaire
Nested CaseControl
673
Fat from dried souppowders, adjusted forSFA, energy adjustedusing residuals
g/day
Breast cancerPost-menopausal
0.7vs.0.09
41.61(1.04, 2.48)
0.183
B C D E F G
incidence
Wilfart, E etal.,2005,BRE11111
Sweden, Post menopausalMalmo Diet and Cancer,1991
50 - (59) 237 Cancer registry7-day Record +Questionnaire
Nested CaseControl
673
Fat from dried souppowders, adjusted forMUFA, energyadjusted using
g/day
Breast cancerPost-menopausal
0.7vs.0.09
41.64(1.06, 2.53)
0.157
B C D E F G
incidence
Wilfart, E etal.,2005,BRE11111
Sweden, Post menopausalMalmo Diet and Cancer,1991
50 - (59) 237 Cancer registry7-day Record +Questionnaire
Nested CaseControl
673
Fat from dried souppowders, adjusted foromega3PUF, energyadjusted using
g/day
Breast cancerPost-menopausal
0.7vs.0.09
41.62(1.05, 2.49)
0.169
B C D E F G
incidence
Wilfart, E etal.,2005,BRE11111
Sweden, Post menopausalMalmo Diet and Cancer,1991
50 - (59) 237 Cancer registry7-day Record +Questionnaire
Nested CaseControl
673
Fat from dried souppowders, adjusted foromega6PUFA, energyadjusted using
g/day
Breast cancerPost-menopausal
0.7vs.0.09
41.6(1.04, 2.46)
0.191
B C D E F G
incidence
3.5
Fruit and vegetable juices
Post-menopausal
Olsen,A.,2003,BRE17890
Denmark, Not specified,Post-menopausalDiet, Cancer and Health,1993
50 - 65 425 By Mail FFQ (nos)ProspectiveCohort
23798 4.7 years g/day
Breast cancerPost-menopausal
100.0(continuous)
11.0(0.87, 1.16)
A B C D E F G
incidence
Olsen,A.,2003,BRE17890
Denmark, Not specified,Post-menopausalDiet, Cancer and Health,1993
50 - 65 303 By Mail FFQ (nos)ProspectiveCohort
23798 4.7 years g/day
Breast cancer ER+Post-menopausal
100.0(continuous)
11.04(0.89, 1.22)
A B C D E F G
incidence
69

Author, Year,WCRF Code
Country, Ethnicity, Specialcharacteristics
Age Cases n Caseascertainment
Type of studyNon-Cases n
Lenght offollow-up / loss
Assessmentdetail
Additional details Unit Outcome Subgroup Contrast Nocat. OR (95% CI) p
valueptrend A B C D E F G
adjustments
Olsen,A.,2003,BRE17890
Denmark, Not specified,Post-menopausalDiet, Cancer and Health,1993
50 - 65 91 By Mail FFQ (nos)ProspectiveCohort
23798 4.7 years g/day
Breast cancer ER-Post-menopausal
100.0(continuous)
10.67(0.42, 1.08)
A B C D E F G
incidence
Menopausal status not specified
van GilsCH,2005,BRE80167 EPIC
25 - 70 3659Dietquestionnaire
ProspectiveCohort
285526.0 5.4 yearsBreast cancer >309.1
vs.<109.0
51.05(0.92, 1.2)
0.51 C D E F G
Incidence
Sesso H.D.,2005,BRE74061
USA, Not specified, HealthprofessionalsWomen's Health Study, 1993
1057
Through healthorg. (screening,healthinsurance)
FFQ-Semi-quantitative
ProspectiveCohort
37827 9.9 years tomato juiceserving/month
Breast cancer>=2serving/wkvs.none
40.81(0.59, 1.11)
0.37 A C D E F G
incidence
Fruit juices
Menopausal status not specified
HirvonenT.,2006,BRE80105
France, participants of aRCTSU.VI.MAX study, 1994
35 - 60 95 medical records 24h RecallProspectiveCohort
4301 6.6 years Fruit juices ml/day
Breast cancer >=150vs.0
31.29(0.8, 2.09)
0.32 A C F G
incidence
3.5.1
Citrus fruit juice
Post-menopausal
Stolzenberg-Solomon,R.Z.,2006,BRE80113
United States, Post-menopausalPLCO Cancer ScreeningTrial cohort, 1993
55 - 74 91Cancerscreeningprogramme
FFQ (nos)ProspectiveCohort
31411.0 4.94 years Orange &/or grapefruitjuice
g/day
Breast cancernon-vitaminsusers
>180.5vs.0 - 5.61
50.86(0.43, 1.72)
0.79 A B E F
incidence
Kim EH, etal.,2008,BRE80156
United StatesNurses' Health Study (NHS)Cohort 1984
30 - 55 3570 medical recordssemi-quantitative ffq
ProspectiveCohort
69841Grapefruit juice,cumulatively averagedintake
glasses/day
Breast cancerPost-menopausal
>=1/2vs.0
41.02(0.85, 1.22)
0.95 A C D E F G
incidence
Kim EH, etal.,2008,BRE80156
United StatesNurses' Health Study (NHS)Cohort 1984
30 - 55 4315 medical recordssemi-quantitative ffq
ProspectiveCohort
72735Grapefruit juice,cumulatively averagedintake
glasses/day
Breast cancerPost-menopausal
>=1/2vs.0
40.95(0.8, 1.13)
0.52 A C D E F G
incidence
Orange juice
Menopausal status not specified
FrazierL.A.,2003,BRE02941
USA, Multi-ethnic,Registered nursesNurses' Health Study (NHS)Cohort 1976-1996
40 - 65
Through healthorg. (screening,healthinsurance)
FFQ (nos)Nested CaseControl
121700.0 10.0 years adolescentGlasses/day
Breast cancer1.0(continuous)
10.97(0.82, 1.14)
A C D E F G
incidence
3.6.1
Coffee
70

Author, Year,WCRF Code
Country, Ethnicity, Specialcharacteristics
Age Cases n Caseascertainment
Type of studyNon-Cases n
Lenght offollow-up / loss
Assessmentdetail
Additional details Unit Outcome Subgroup Contrast Nocat. OR (95% CI) p
valueptrend A B C D E F G
adjustments
Pre-menopausal
Vatten, L.J.,1990,BRE12833
NorwayNorway National HealthScreening Service, 1974
91
Through healthorg. (screening,healthinsurance)
FFQ + recallProspectiveCohort
108870 12.0 years / 152 daily coffe consumption Cups/day
Breast cancerPre-menopausal
>=7 cupsvs.<=2 cups
40.8(0.4, 1.6)
0.36 A
incidence
Michels, K.B.,2002,BRE20406
Sweden, Not specifiedThe Swedish MammographyCohort, 1987
40 - 76 407 By MailFFQ-Semi-quantitative
ProspectiveCohort
212574 9.5 years Cups/week
Invasive breast cancerPre-menopausal
4+ cups/dayvs.1 cup/weekor less
51.24(0.79, 1.94)
0.24 A B C D E F
incidence
Post-menopausal
Vatten, L.J.,1990,BRE12833
NorwayNorway National HealthScreening Service, 1974
61
Through healthorg. (screening,healthinsurance)
FFQ + recallProspectiveCohort
53018 12.0 years / 152 daily coffe consumption Cups/day
Breast cancerPost-menopausal
>=7 cupsvs.<=2 cups
40.8(0.3, 2.3)
0.77 A
incidence
Michels, K.B.,2002,BRE20406
Sweden, Not specifiedThe Swedish MammographyCohort, 1987
40 - 76 864 By MailFFQ-Semi-quantitative
ProspectiveCohort
296744 9.5 years Cups/week
Invasive breast cancerPost-menopausal
4+ cups/dayvs.1 cup/weekor less
50.85(0.61, 1.19)
0.51 A B C D E F
incidence
Menopausal status not specified
Snowdon, D.A.,1984,BRE11552
USA, White, AdventistSeventh-day AdventistsCohort, 1960
30 - 175 UnspecifiedQuestionnaire(nos)
ProspectiveCohort
null 21.0 years Cups/day
Breast cancer 2+vs.<1
30.9(0.6, 1.3)
0.62 A
cancer death
Vatten, L.J.,1990,BRE12833
NorwayNorway National HealthScreening Service, 1974
90
Through healthorg. (screening,healthinsurance)
FFQ + recallProspectiveCohort
81490 12.0 years / 152 daily coffe consumption Cups/day
Breast cancer
Lean>=7 cupsvs.<=2 cups
40.6(0.3, 1.2)
0.02 A
incidence
Vatten, L.J.,1990,BRE12833
NorwayNorway National HealthScreening Service, 1974
152
Through healthorg. (screening,healthinsurance)
FFQ + recallProspectiveCohort
160197 12.0 years / 152 daily coffe consumption Cups/day
Breast cancer >=7 cupsvs.<=2 cups
40.5(0.5, 1.4)
0.37 A
incidence
Vatten, L.J.,1990,BRE12833
NorwayNorway National HealthScreening Service, 1974
62
Through healthorg. (screening,healthinsurance)
FFQ + recallProspectiveCohort
78707 12.0 years / 152 daily coffe consumption Cups/day
Breast cancer
Overweight>=7 cupsvs.<=2 cups
41.8(0.6, 5.4)
0.13 A
incidence
Hoyer, A.P.,1992,BRE04086
Denmark, Not specifiedGlostrup Population Studies,1982
30 - 80Direct contactat home
Questionnaire(nos)
ProspectiveCohort
5207.0 26.0 years Cups/day
Breast cancer >=7vs.0-2
31.7(0.7, 4.3)
>0.20
mortality/incidence
Key, T.J.,1999,BRE04758
Japan, Not specifiedLSS, 1969
427 By MailQuestionnaire(nos)
ProspectiveCohort
488990 24.0 years times/week
Breast cancer >=5vs.<=1
41.19(0.93, 1.52)
0.258
A G
incidence
Michels, K.B.,2002,BRE20406
Sweden, Not specifiedThe Swedish MammographyCohort, 1987
40 - 76 717 By MailFFQ-Semi-quantitative
ProspectiveCohort
306120 9.5 years Cups/week
Invasive breast cancer
Lean
4+ cups/dayvs.1 cup/weekor less
51.01(0.71, 1.45)
0.74 A B C D E F
incidence
Michels, K.B.,2002,BRE20406
Sweden, Not specifiedThe Swedish MammographyCohort, 1987
40 - 76 1271 By MailFFQ-Semi-quantitative
ProspectiveCohort
509318 9.5 years Cups/week
Invasive breast cancer4+ cups/dayvs.1 cup/weekor less
50.94(0.75, 1.28)
0.91 A B C D E F
incidence
71

Author, Year,WCRF Code
Country, Ethnicity, Specialcharacteristics
Age Cases n Caseascertainment
Type of studyNon-Cases n
Lenght offollow-up / loss
Assessmentdetail
Additional details Unit Outcome Subgroup Contrast Nocat. OR (95% CI) p
valueptrend A B C D E F G
adjustments
Michels, K.B.,2002,BRE20406
Sweden, Not specifiedThe Swedish MammographyCohort, 1987
40 - 76 554 By MailFFQ-Semi-quantitative
ProspectiveCohort
203198 9.5 years Cups/week
Invasive breast cancer
Overweight
4+ cups/dayvs.1 cup/weekor less
50.95(0.64, 1.41)
0.78 A B C D E F
incidence
HirvonenT.,2006,BRE80105
France, participants of aRCTSU.VI.MAX study, 1994
35 - 60 95 medical records 24h RecallProspectiveCohort
4301 6.6 years Coffee ml/day
Breast cancer >=253vs.0-111
31.1(0.66, 1.84)
0.71 A C F G
incidence
Ganmaa, D. etal.,2008,BRE80158
U.S.Nurses' Health Study (NHS)Cohort 1976-1996
30 - 55 5272
questionnaire/medicalrecords/deathrecord
FFQProspectiveCohort
85987.0 22.0 years Coffee cup/month
Breast cancer>=4 cup/dayvs.<1cup/month
50.92(0.82, 1.03)
0.14 A C D E F G
incidence
Ganmaa, D. etal.,2008,BRE80158
U.S.Nurses' Health Study (NHS)Cohort 1976-1996
30 - 55 2685
questionnaire/medicalrecords/deathrecord
FFQProspectiveCohort
85987.0 22.0 years Coffee cup/month
Breast cancer
BMI < 25
>=4 cup/dayvs.<1cup/month
50.93(0.8, 1.08)
0.43 A C D E F G
incidence
Ganmaa, D. etal.,2008,BRE80158
U.S.Nurses' Health Study (NHS)Cohort 1976-1996
30 - 55 2685
questionnaire/medicalrecords/deathrecord
FFQProspectiveCohort
85987.0 22.0 years Coffee cup/month
Breast cancerBMI = 25.0-29.9
>=4 cup/dayvs.<1cup/month
50.87(0.71, 1.07)
0.06 A C D E F G
incidence
Ganmaa, D. etal.,2008,BRE80158
U.S.Nurses' Health Study (NHS)Cohort 1976-1996
30 - 55 913
questionnaire/medicalrecords/deathrecord
FFQProspectiveCohort
85987.0 22.0 years Coffee cup/month
Breast cancer
BMI >=30
>=4 cup/dayvs.<1cup/month
51.02(0.78, 1.33)
0.52 A C D E F G
incidence
Decaffeinated coffee
Menopausal status not specified
Ganmaa, D. etal.,2008,BRE80158
U.S.Nurses' Health Study (NHS)Cohort 1976-1996
30 - 55 4234
questionnaire/medicalrecords/deathrecord
FFQProspectiveCohort
85987.0 22.0 years Decaffeinated coffee cup/month
Breast cancer>=4 cup/dayvs.<1cup/month
51.03(0.81, 1.31)
0.26 A C D E F G
incidence
3.6.2
Black tea
Menopausal status not specified
Goldbohm, R.A.,1996,BRE03308
Netherlands, Not specifiedThe Netherlands CohortStudy on diet and cancer,1986-1993
55 - 69 507 By MailFFQ-Semi-quantitative
Case Cohort 1376 4.3 years Cups/day
Invasive breast cancer5vs.nonconsumer
61.31(0.86, 1.99)
0.185
A B C D E F G
incidence
Key, T.J.,1999,BRE04758
Japan, Not specifiedLSS, 1969
427 By MailQuestionnaire(nos)
ProspectiveCohort
488989 24.0 years times/week
Breast cancer >=5vs.<=1
41.1(0.82, 1.48)
0.981
A G
incidence
YuanJM.,2005,BRE24717
Singapore, AsianThe Singapore ChineseHealth Study, 1993
45 - 74 62 By Mail FFQ (nos)Nested CaseControl
84 9.0 years times/month
Breast cancerACE high-activity
>4.0vs.0
31.2(0.4, 3.59)
A B C E G
incidence
72

Author, Year,WCRF Code
Country, Ethnicity, Specialcharacteristics
Age Cases n Caseascertainment
Type of studyNon-Cases n
Lenght offollow-up / loss
Assessmentdetail
Additional details Unit Outcome Subgroup Contrast Nocat. OR (95% CI) p
valueptrend A B C D E F G
adjustments
YuanJM.,2005,BRE24717
Singapore, AsianThe Singapore ChineseHealth Study, 1993
45 - 74 62 By Mail FFQ (nos)Nested CaseControl
84 9.0 years times/month
Breast cancerACE low-activity
>4.0vs.0
31.28(0.88, 1.86)
A B C E G
incidence
YuanJM.,2005,BRE24717
Singapore, AsianThe Singapore ChineseHealth Study, 1993
45 - 74 367 By Mail FFQ (nos)Nested CaseControl
799 9.0 years times/month
Breast cancer >4.0vs.0
31.21(0.86, 1.71)
A B C E G
incidence
Tea
Pre-menopausal
Michels, K.B.,2002,BRE20406
Sweden, Not specifiedThe Swedish MammographyCohort, 1987
40 - 76 407 By MailFFQ-Semi-quantitative
ProspectiveCohort
212573 9.5 years Cups/week
Invasive breast cancerPre-menopausal
4+ cups/dayvs.1 cup/weekor less
51.08(0.76, 1.52)
0.58 A B C D E F
incidence
HirvonenT.,2006,BRE80105
France, participants of aRCTSU.VI.MAX study, 1994
35 - 60 61 medical records 24h RecallProspectiveCohort
3191 6.6 yearsHerbal tea, infusion ofvegetable origin otherthan tea plant, tisane
ml/day
Breast cancerPre-menopausal
>=150vs.0
30.38(0.14, 1.04)
0.06 A C F G
incidence
Post-menopausal
Zheng,W.,1996,BRE13990
U.S.A., Not specified, Post-menopausalIowa Women's Health Study
55 - 69 1015 By MailFFQ-Semi-quantitative
ProspectiveCohort
35369.0 8.0 years Cups/month
Breast cancerPost-menopausal
>=30vs.0-3
41.14(0.92, 1.41)
0.28 A B C D E F G
incidence
Michels, K.B.,2002,BRE20406
Sweden, Not specifiedThe Swedish MammographyCohort, 1987
40 - 76 864 By MailFFQ-Semi-quantitative
ProspectiveCohort
296744 9.5 years Cups/week
Invasive breast cancerPost-menopausal
4+ cups/dayvs.1 cup/weekor less
51.13(0.86, 1.5)
0.12 A B C D E F
incidence
Menopausal status not specified
Michels, K.B.,2002,BRE20406
Sweden, Not specifiedThe Swedish MammographyCohort, 1987
40 - 76 717 By MailFFQ-Semi-quantitative
ProspectiveCohort
306120 9.5 years Cups/week
Invasive breast cancer
Lean
4+ cups/dayvs.1 cup/weekor less
51.23(0.94, 1.6)
0.13 A B C D E F
incidence
Michels, K.B.,2002,BRE20406
Sweden, Not specifiedThe Swedish MammographyCohort, 1987
40 - 76 1271 By MailFFQ-Semi-quantitative
ProspectiveCohort
509318 9.5 years Cups/week
Invasive breast cancer4+ cups/dayvs.1 cup/weekor less
51.13(0.91, 1.4)
0.11 A B C D E F
incidence
Michels, K.B.,2002,BRE20406
Sweden, Not specifiedThe Swedish MammographyCohort, 1987
40 - 76 590 By MailFFQ-Semi-quantitative
ProspectiveCohort
203198 9.5 years Cups/week
Invasive breast cancer
Overweight
4+ cups/dayvs.1 cup/weekor less
50.97(0.67, 1.41)
0.47 A B C D E F
incidence
Li, W.,2005,BRE23123China, AsianShanghai BSE
130
Through socialorganization(profession,religion)
FFQ-Semi-quantitative
Nested CaseControl
1070 times/year
Breast cancer Evervs.Never
20.8(0.5, 1.3)
A
incidence
Adebamowo, C.A.,2005,BRE21537
USA, Not specified,Registered nursesNurses' Health Study (NHS)Cohort 1976-1996
25 - 46 710
Through socialorganization(profession,religion)
FFQ-Semi-quantitative
ProspectiveCohort
707109 8.0 years serving/month
Invasive breast cancer 60vs.>0.99
71.02(0.81, 1.28)
0.83 A C D E F G
incidence
73

Author, Year,WCRF Code
Country, Ethnicity, Specialcharacteristics
Age Cases n Caseascertainment
Type of studyNon-Cases n
Lenght offollow-up / loss
Assessmentdetail
Additional details Unit Outcome Subgroup Contrast Nocat. OR (95% CI) p
valueptrend A B C D E F G
adjustments
HirvonenT.,2006,BRE80105
France, participants of aRCTSU.VI.MAX study, 1994
35 - 60 95 medical records 24h RecallProspectiveCohort
4301 6.6 yearsTea, infusion of leavesof Camellia sinensis,the
ml/day
Breast cancer >=350vs.0
30.75(0.45, 1.28)
0.37 A C F G
incidence
HirvonenT.,2006,BRE80105
France, participants of aRCTSU.VI.MAX study, 1994
35 - 60 95 medical records 24h RecallProspectiveCohort
4301 6.6 yearsHerbal tea, infusion ofvegetable origin otherthan tea plant, tisane
ml/day
Breast cancer >=150vs.0
30.43(0.2, 0.94)
0.05 A B C D E F G
incidence
Ganmaa, D. etal.,2008,BRE80158
U.S.Nurses' Health Study (NHS)Cohort 1976-1996
30 - 55 5272
questionnaire/medicalrecords/deathrecord
FFQProspectiveCohort
85987.0 22.0 years Tea cup/month
Breast cancer>=4 cup/dayvs.<1cup/month
50.94(0.77, 1.14)
0.25 A C D E F G
incidence
3.6.2.2
Green tea
Menopausal status not specified
Key, T.J.,1999,BRE04758
Japan, Not specifiedLSS, 1969
427 By MailQuestionnaire(nos)
ProspectiveCohort
488988 24.0 years times/day
Breast cancer >=5vs.<=1
40.86(0.62, 1.21)
0.284
A G
incidence
YuanJM.,2005,BRE24717
Singapore, AsianThe Singapore ChineseHealth Study, 1993
45 - 74 61 By Mail FFQ (nos)Nested CaseControl
96 9.0 years times/month
Breast cancerACE high-activity
>4.0vs.0
30.29(0.1, 0.79)
A B C E G
incidence
YuanJM.,2005,BRE24717
Singapore, AsianThe Singapore ChineseHealth Study, 1993
45 - 74 312 By Mail FFQ (nos)Nested CaseControl
753 9.0 years times/month
Breast cancerACE low-activity
>4.0vs.0
31.11(0.79, 1.57)
A B C E G
incidence
YuanJM.,2005,BRE24717
Singapore, AsianThe Singapore ChineseHealth Study, 1993
45 - 74 380 By Mail FFQ (nos)Nested CaseControl
859 9.0 years times/month
Breast cancer >4.0vs.0
30.91(0.66, 1.26)
A B C E G
incidence
3.7.1
Alcohol consumption
Pre-menopausal
Visvanathan etal.,2007,BRE80020
AmericaCLUE II - Washington, 1989
(57) 41FFQ +Questionnaire
Nested CaseControl
44 Alcohol consumption
Breast cancerPre-menopausal
Drinkersvs.Nondrinkers
32.69(1.0, 7.26)
A F
incidence
Post-menopausal
Wilfart, E etal.,2005,BRE11111
Sweden, Post menopausalMalmo Diet and Cancer,1991
50 - (59) 237 Cancer registry7-day Record +Questionnaire
Nested CaseControl
673 Alcohol habits
Breast cancerPost-menopausal
Highvs.Zero
43.14(1.17, 8.39)
incidence
74

Author, Year,WCRF Code
Country, Ethnicity, Specialcharacteristics
Age Cases n Caseascertainment
Type of studyNon-Cases n
Lenght offollow-up / loss
Assessmentdetail
Additional details Unit Outcome Subgroup Contrast Nocat. OR (95% CI) p
valueptrend A B C D E F G
adjustments
Visvanathan etal.,2007,BRE80020
AmericaCLUE II - Washington, 1989
(57) 221FFQ +Questionnaire
Nested CaseControl
219 Alcohol consumption
Breast cancerPost-menopausal
Drinkersvs.Nondrinkers
31.25(0.84, 1.87)
A F
incidence
Vogel, U. etal.,2007,BRE80150
Denmark, Post menopausalDiet, Cancer and Health,1993
50 - 64 361 Cancer registry FFQNested CaseControl
361 Alcohol consumption
Breast cancerPost-menopausal
Drinkersvs.Abstainers
21.23(0.47, 3.21)
B C D F G
incidence
Menopausal status not specified
Visvanathan etal.,2007,BRE80020
AmericaCLUE II - Washington, 1989
(57) 262FFQ +Questionnaire
Nested CaseControl
263Total alcoholconsumption
Breast cancer Drinkersvs.Nondrinkers
31.4(0.97, 2.03)
A F
incidence
Visvanathan etal.,2007,BRE80020
AmericaCLUE II - Washington, 1989
(57) 176FFQ +Questionnaire
Nested CaseControl
177 Alcohol consumption
Breast cancer ER+ Drinkersvs.Nondrinkers
21.47(0.93, 2.31)
A F
incidence
Visvanathan etal.,2007,BRE80020
AmericaCLUE II - Washington, 1989
(57) 44FFQ +Questionnaire
Nested CaseControl
44 Alcohol consumption
Breast cancer ER- Drinkersvs.Nondrinkers
21.84(0.75, 4.51)
A F
incidence
Alcoholic drinks
Pre-menopausal
Holmberg,L.,1995,BRE15392
Sweden, Not specified,Screening ProgramThe Swedish MammographyCohort, 1987
40 - 74 54
Through healthorg. (screening,healthinsurance)
FFQ (nos)Nested CaseControl
97 alcohol use
Invasive breast cancerPre-menopausal
Ever usevs.Never use
20.8(0.4, 1.9)
B C D F
incidence
Post-menopausal
Holmberg,L.,1995,BRE15392
Sweden, Not specified,Screening ProgramThe Swedish MammographyCohort, 1987
40 - 74 222
Through healthorg. (screening,healthinsurance)
FFQ (nos)Nested CaseControl
355 alcohol use
Invasive breast cancerPost-menopausal
Ever usevs.Never use
21.9(1.2, 2.7)
B C D F
incidence
Nielsen, N.R. etal.,2007,BRE80143
Denmark, Post menopausalCopenhagenCHS
39 - 91 267 Cancer registryDietaryquestionnaire
ProspectiveCohort
5035.0Weekly alcoholconsumption, total frombeer wine and spirits
drinks/week
Invasive breast cancer >21vs.<1
51.54(0.77, 3.1)
0.06 A B C D F G
incidence
Nielsen, N.R. etal.,2007,BRE80143
Denmark, Post menopausalCopenhagenCHS
39 - 91 182 Cancer registryDietaryquestionnaire
ProspectiveCohort
5035.0Weekly alcoholconsumption, total frombeer wine and spirits
drinks/week
Invasive breast cancer
HRT - No>21vs.<1
51.28(0.46, 3.57)
0.79 A B C D G
incidence
Nielsen, N.R. etal.,2007,BRE80143
Denmark, Post menopausalCopenhagenCHS
39 - 91 85 Cancer registryDietaryquestionnaire
ProspectiveCohort
5035.0Weekly alcoholconsumption, total frombeer wine and spirits
drinks/week
Invasive breast cancer
HRT - Yes>21vs.<1
52.17(0.79, 5.93)
0.004
A B C D G
incidence
Menopausal status not specified
Holmberg,L.,1995,BRE15392
Sweden, Not specified,Screening ProgramThe Swedish MammographyCohort, 1987
40 - 74 276
Through healthorg. (screening,healthinsurance)
FFQ (nos)Nested CaseControl
452 alcohol use
Invasive breast cancer Ever usevs.Never use
21.7(0.2, 2.4)
B C D F
incidence
75

Author, Year,WCRF Code
Country, Ethnicity, Specialcharacteristics
Age Cases n Caseascertainment
Type of studyNon-Cases n
Lenght offollow-up / loss
Assessmentdetail
Additional details Unit Outcome Subgroup Contrast Nocat. OR (95% CI) p
valueptrend A B C D E F G
adjustments
Hoyer, A.P.,1998,BRE15433
Denmark, Not specifiedCopenhagenCHS
20 - 237 UnspecifiedQuestionnaire(nos)
Nested CaseControl
476 17.0 yearsBreast cancer
every daysvs.never orhardly ever
41.6(0.82, 3.11)
0.16 B C D E F G
incidence
Colditz, G.A.,2000,BRE19251
U.S.A., Not specified,Registered nursesNurses' Health Study (NHS)Cohort 1976-1996
30 - 55 By MailQuestionnaire(nos)
ProspectiveCohort
58520.0 14.0 years drinks/day
Invasive breast cancer 1 drinkvs.never drink
21.07(1.0, 1.13)
C D E F G
incidence
Baglietto,L.,2005,BRE21669
AustraliaMelbourne,1990
7 - 75 537Questionnaire(nos)
ProspectiveCohort
17447.0 13.0 years g/day
Breast cancer >40vs.abstainer
51.41(0.9, 2.23)
0.29 E
incidence
Morch etal.,2007,BRE80004
DenmarkDanish Nurse Cohort Study
44 - 93 365 Cancer registryQuestionnaire(nos)
ProspectiveCohort
17647 7.6 yearsWeekly alcohol intake(nr of drinks), excludingnon-drinkers
drinks/week
Invasive breast cancer1.0(continuous)
11.02(1.01, 1.03)
A C F G
incidence
Morch etal.,2007,BRE80004
DenmarkDanish Nurse Cohort Study
44 - 93 247 Cancer registryQuestionnaire(nos)
ProspectiveCohort
17647 7.6 years
Alcohol intake/bingedrinking on lastweekday, Mon toThurs, intake of +>4
drinks/weekday
Invasive breast cancer1.0(continuous)
11.02(0.95, 1.1)
A C E F G
incidence
Morch etal.,2007,BRE80004
DenmarkDanish Nurse Cohort Study
44 - 93 351 Cancer registryQuestionnaire(nos)
ProspectiveCohort
17647 7.6 years
Alcohol intake/bingedrinking on lastweekend, Fri - Sun,>=4 drinks/day was
drinks/weekend
Invasive breast cancer1.0(continuous)
11.04(1.01, 1.07)
A C E F G
incidence
Morch etal.,2007,BRE80004
DenmarkDanish Nurse Cohort Study
44 - 93 457 Cancer registryQuestionnaire(nos)
ProspectiveCohort
17647 7.6 years Weekly alcohol intake(nr of drinks)
drinks/week
Invasive breast cancer >27vs.1-3
71.62(1.04, 2.52)
A C F G
incidence
Morch etal.,2007,BRE80004
DenmarkDanish Nurse Cohort Study
44 - 93 457 Cancer registryQuestionnaire(nos)
ProspectiveCohort
17647 7.6 years
Alcohol intake/bingedrinking on lastweekday, Mon toThurs, intake of +>4
drinks/weekday
Invasive breast cancer >7vs.1
70.92(0.39, 2.14)
A C E F G
incidence
Morch etal.,2007,BRE80004
DenmarkDanish Nurse Cohort Study
44 - 93 457 Cancer registryQuestionnaire(nos)
ProspectiveCohort
17647 7.6 years
Alcohol intake/bingedrinking on lastweekend, Fri - Sun,>=4 drinks/day was
drinks/weekend
Invasive breast cancer >21vs.1-3
70.86(0.12, 6.26)
A C E F G
incidence
Alcoholic drinks - currency of use
Pre-menopausal
Holmberg,L.,1995,BRE15392
Sweden, Not specified,Screening ProgramThe Swedish MammographyCohort, 1987
40 - 74 54
Through healthorg. (screening,healthinsurance)
FFQ (nos)Nested CaseControl
97
Invasive breast cancerPre-menopausal
Currentvs.Never
30.9(0.4, 2.1)
B C D F
incidence
Post-menopausal
Holmberg,L.,1995,BRE15392
Sweden, Not specified,Screening ProgramThe Swedish MammographyCohort, 1987
40 - 74 222
Through healthorg. (screening,healthinsurance)
FFQ (nos)Nested CaseControl
355
Invasive breast cancerPost-menopausal
Currentvs.Never
31.8(1.2, 2.8)
B C D F
incidence
Menopausal status not specified
76

Author, Year,WCRF Code
Country, Ethnicity, Specialcharacteristics
Age Cases n Caseascertainment
Type of studyNon-Cases n
Lenght offollow-up / loss
Assessmentdetail
Additional details Unit Outcome Subgroup Contrast Nocat. OR (95% CI) p
valueptrend A B C D E F G
adjustments
Holmberg,L.,1995,BRE15392
Sweden, Not specified,Screening ProgramThe Swedish MammographyCohort, 1987
40 - 74 276
Through healthorg. (screening,healthinsurance)
FFQ (nos)Nested CaseControl
452
Invasive breast cancer Currentvs.Never
31.3(0.9, 2.0)
B C D F
incidence
Alcoholic drinks - duration of use
Pre-menopausal
Holmberg,L.,1995,BRE15392
Sweden, Not specified,Screening ProgramThe Swedish MammographyCohort, 1987
40 - 74 54
Through healthorg. (screening,healthinsurance)
FFQ (nos)Nested CaseControl
97 Years
Invasive breast cancerPre-menopausal
>= 21 yrvs.Never
40.4(0.1, 1.5)
B C D F
incidence
Post-menopausal
Holmberg,L.,1995,BRE15392
Sweden, Not specified,Screening ProgramThe Swedish MammographyCohort, 1987
40 - 74 222
Through healthorg. (screening,healthinsurance)
FFQ (nos)Nested CaseControl
355 Years
Invasive breast cancerPost-menopausal
>= 21 yrvs.Never
41.9(1.2, 3.0)
B C D F
incidence
Menopausal status not specified
Holmberg,L.,1995,BRE15392
Sweden, Not specified,Screening ProgramThe Swedish MammographyCohort, 1987
40 - 74 276
Through healthorg. (screening,healthinsurance)
FFQ (nos)Nested CaseControl
452 Years
Invasive breast cancer >= 21 yrvs.Never
41.8(1.2, 2.7)
B C D F
incidence
Alcoholic drinks - Precocity of use (age at first
Pre-menopausal
Holmberg,L.,1995,BRE15392
Sweden, Not specified,Screening ProgramThe Swedish MammographyCohort, 1987
40 - 74 54
Through healthorg. (screening,healthinsurance)
FFQ (nos)Nested CaseControl
97 Years
Invasive breast cancerPre-menopausal
15-27 yrvs.Never
30.5(0.2, 1.3)
B C D F
incidence
Post-menopausal
Holmberg,L.,1995,BRE15392
Sweden, Not specified,Screening ProgramThe Swedish MammographyCohort, 1987
40 - 74 222
Through healthorg. (screening,healthinsurance)
FFQ (nos)Nested CaseControl
355 Years
Invasive breast cancerPost-menopausal
15-27 yrvs.Never
31.7(1.0, 2.7)
B C D F
incidence
Menopausal status not specified
Holmberg,L.,1995,BRE15392
Sweden, Not specified,Screening ProgramThe Swedish MammographyCohort, 1987
40 - 74 276
Through healthorg. (screening,healthinsurance)
FFQ (nos)Nested CaseControl
452 Years
Invasive breast cancer 15-27 yrvs.Never
31.6(1.1, 2.4)
B C D F
incidence
Lin, Y.,2005,BRE23154JapanJACC study, 1988
40 - 79 128Generalpopulation(survey)
Questionnaire(nos)
ProspectiveCohort
241392 7.6 years Years
Breast cancer >35vs.non drinkers
41.33(0.78, 2.28)
A C D F G
incidence
Lin, Y.,2005,BRE23154JapanJACC study, 1988
40 - 79 145Generalpopulation(survey)
Questionnaire(nos)
ProspectiveCohort
259676 7.6 years times/week
Breast cancer 5-7vs.non drinkers
51.51(0.8, 2.83)
A C D F G
incidence
Alcoholism
77

Author, Year,WCRF Code
Country, Ethnicity, Specialcharacteristics
Age Cases n Caseascertainment
Type of studyNon-Cases n
Lenght offollow-up / loss
Assessmentdetail
Additional details Unit Outcome Subgroup Contrast Nocat. OR (95% CI) p
valueptrend A B C D E F G
adjustments
Pre-menopausal
Tonnesen,H.,1994,BRE12403
Denmark, Not specified,AlcoholicsCopenhagen alcoholicwomen, 1954
12HospitalRecords only
Historical Cohort 3093.0 9.4 years with age 9-44 yrs
Breast cancerPre-menopausal
Alcoholicwomenvs.Danish
21.5(0.8, 2.6)
A G
incidence
Kuper,H.,2000,BRE15770
Sweden, Not specified,AlcoholicsSwedish alcoholic women,1965
(43) 143HospitalRecords only
Historical Cohort 353596 9.6 yearsexcluding the first yearof follow-up; age atfollow-up <50 yrs
Breast cancerPre-menopausal
Alcoholicwomenvs.General
21.11(0.93, 1.3)
A
incidence
Post-menopausal
Tonnesen,H.,1994,BRE12403
Denmark, Not specified,AlcoholicsCopenhagen alcoholicwomen, 1954
12HospitalRecords only
Historical Cohort 3093.0 9.4 years with age 55+ yrs
Breast cancerPost-menopausal
Alcoholicwomenvs.Danish
21.0(0.5, 1.8)
A G
incidence
Menopausal status not specified
Tonnesen,H.,1994,BRE12403
Denmark, Not specified,AlcoholicsCopenhagen alcoholicwomen, 1954
41HospitalRecords only
Historical Cohort 3093.0 9.4 yearsBreast cancer
Alcoholicwomenvs.Danish
21.3(0.9, 1.7)
A G
incidence
Sigvardsson,S.,1996,BRE18037
Swedish, Not specified,AlcoholicsSwedish TemperanceBoards alcoholic women
459Otherprocedure
Historical Cohort 31016
Breast cancerYesalcoholismvs.No
21.4(1.2, 1.7)
incidence
Kuper,H.,2000,BRE15770
Sweden, Not specified,AlcoholicsSwedish alcoholic women,1965
(43) 514HospitalRecords only
Historical Cohort 353596 9.6 years 1-30 yrs of follow-upexcluding the first year
Breast cancerAlcoholicwomenvs.General
21.15(1.05, 1.25)
A
incidence
Mild/moderate alcoholism
Menopausal status not specified
Hardell,L.,2000,BRE15281
Sweden, Not specified,AlcoholicsSwedish TemperanceBoards alcoholic women
359Otherprocedure
Historical Cohort 26602
Breast cancerYesmild/moderate alcoholismvs.
21.4(1.1, 1.7)
incidence
Severe alcoholism
Menopausal status not specified
Hardell,L.,2000,BRE15281
Sweden, Not specified,AlcoholicsSwedish TemperanceBoards alcoholic women
77Otherprocedure
Historical Cohort 4414
Breast cancerYes severealcoholismvs.No severe
21.4(0.9, 2.2)
incidence
Total alcoholic drinks
Pre-menopausal
Feigelson,H.S.,2001,BRE19514
50 States of America,Columbia and Puerto Rico,Multi-ethnicCPS-II US cohort, 1982-
365
Through healthorg. (screening,healthinsurance)
Questionnaire(nos)
ProspectiveCohort
76428 14.0 years drinks/day
Breast cancerPre-menopausal
>=3vs.None
61.1(0.74, 1.6)
0.37 A B C D E F G
cancer death
78

Author, Year,WCRF Code
Country, Ethnicity, Specialcharacteristics
Age Cases n Caseascertainment
Type of studyNon-Cases n
Lenght offollow-up / loss
Assessmentdetail
Additional details Unit Outcome Subgroup Contrast Nocat. OR (95% CI) p
valueptrend A B C D E F G
adjustments
Petri,A.L.,2004,BRE16325
Denmark, Not specifiedCopenhagen Center forProspective PopulationStudies, unknown
20 - 91 76 UnspecifiedQuestionnaire(nos)
ProspectiveCohort
5420drinks/week
Breast cancerPre-menopausal
>27vs.1-6
53.49(1.36, 8.99)
A C F G
incidence
Post-menopausal
Hiatt, R.A.,1988,BRE03888
Northern California, USA,Multi-ethnicPrepaid Health Plan inNorthern California, 1978
226
Through healthorg. (screening,healthinsurance)
FFQ (nos)Case Cohort 58347.0 6.0 years <=4 cases in highestcat.
drinks/day
Breast cancerPost-menopausal
6+/dayCurrentdrinkervs.
64.2(1.5, 11.5)
A D G
incidence
Feigelson,H.S.,2001,BRE19514
50 States of America,Columbia and Puerto Rico,Multi-ethnicCPS-II US cohort, 1982-
1054
Through healthorg. (screening,healthinsurance)
Questionnaire(nos)
ProspectiveCohort
158536 14.0 years drinks/day
Breast cancerPost-menopausal
>=3vs.None
61.3(1.0, 1.6)
0.16 A B C D E F G
cancer death
Pike, M.C.,2002,BRE16343
U.S.A., Multi-ethnic, Post-menopausalHawaii and California, 1993
1757 By MailQuestionnaire(nos)
ProspectiveCohort
88712.0 6.0 years drinks/day
Breast cancerPost-menopausal
>=1vs.never
31.39(null, null)
0.002
C D E F G
incidence
Petri,A.L.,2004,BRE16325
Denmark, Not specifiedCopenhagen Center forProspective PopulationStudies, unknown
20 - 91 397 UnspecifiedQuestionnaire(nos)
ProspectiveCohort
10997drinks/week
Breast cancerPost-menopausal
>27vs.1-6
50.57(0.18, 1.78)
A C F G
incidence
Menopausal status not specified
Hiatt, R.A.,1988,BRE03888
Northern California, USA,Multi-ethnicPrepaid Health Plan inNorthern California, 1978
303
Through healthorg. (screening,healthinsurance)
FFQ (nos)Case Cohort 58347.0 6.0 years drinks/day
Breast cancer6+/dayCurrentdrinkervs.
63.3(1.18, 9.28)
A D G
incidence
Hoyer, A.P.,1992,BRE04086
Denmark, Not specifiedGlostrup Population Studies,1982
30 - 80Direct contactat home
Questionnaire(nos)
ProspectiveCohort
5207.0 26.0 years drinks/week
Breast cancer >=9vs.0
40.8(0.3, 2.0)
>0.20
mortality/incidence
Byrne,C.,1996,BRE05719
USA, Black and WhiteNHEFS, 1981/82
25 - 74 52 Unspecified FFQ (nos)ProspectiveCohort
23841 3.9 years / 252 drinks/week
Breast cancer >7vs.0
41.4(0.6, 3.2)
A
incidence
Thun, M.J.,1997,BRE12310
U.S.A., Multi-ethnicCPS-II US cohort, 1982-1998
30 - 104 691
Through socialorganization(profession,religion)
Questionnaire(nos)
ProspectiveCohort
230552 9.0 years drinks/day
Breast cancer >=4vs.none
51.0(0.7, 1.4)
0.02 A B C D E F G
cancer death
Key, T.J.,1999,BRE04758
Japan, Not specifiedLSS, 1969
427 By MailQuestionnaire(nos)
ProspectiveCohort
488990 24.0 yearsBreast cancer drinker
vs.non drinker
30.96(0.74, 1.23)
A G
incidence
Wu, K.,1999,BRE13618
USA, Not specified, BlooddonorsCLUE I, 1974
18 - 90 133Throughnetwork, paper,tv
Questionnaire(nos)
Nested CaseControl
133 21.0 years drinks/week
Breast cancer >=4vs.<1
41.5(0.62, 3.65)
incidence
Wu, K.,1999,BRE63618
USA, Not specified, BlooddonorsCLUE II, 1989
18 - 90 110Throughnetwork, paper,tv
Questionnaire(nos)
Nested CaseControl
110 6.0 years drinks/week
Breast cancer >=4vs.<1
41.83(0.74, 4.54)
incidence
79
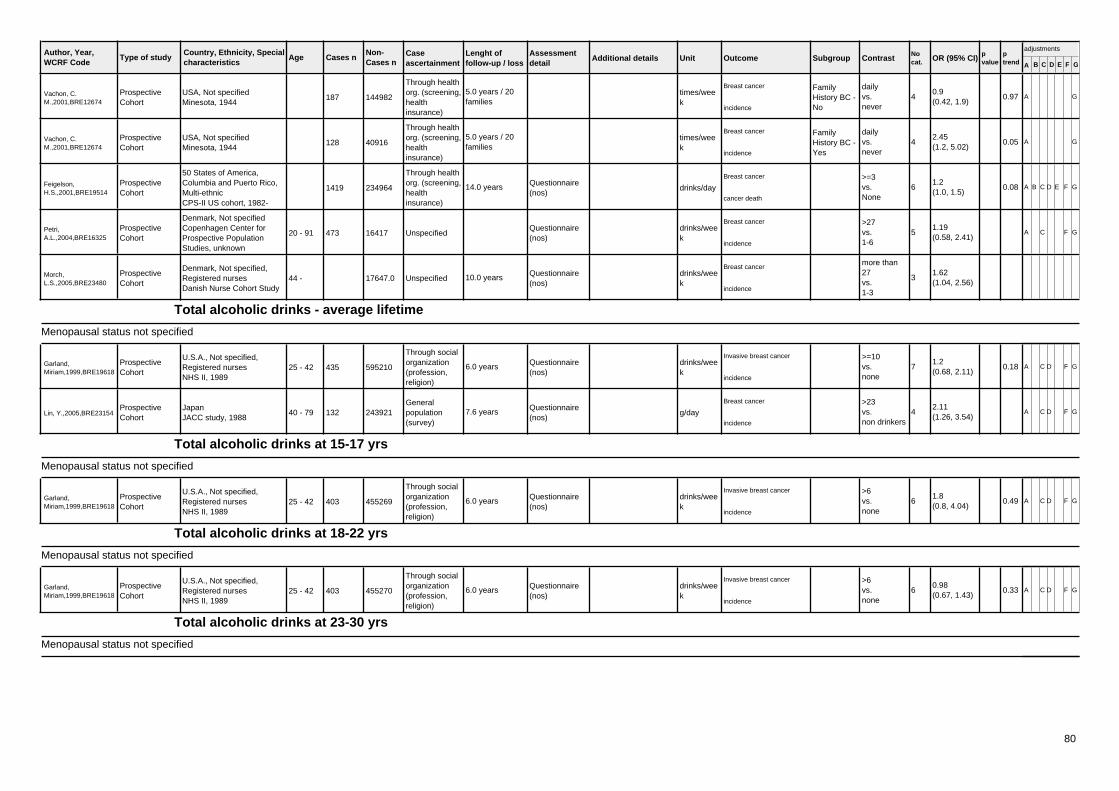
Author, Year,WCRF Code
Country, Ethnicity, Specialcharacteristics
Age Cases n Caseascertainment
Type of studyNon-Cases n
Lenght offollow-up / loss
Assessmentdetail
Additional details Unit Outcome Subgroup Contrast Nocat. OR (95% CI) p
valueptrend A B C D E F G
adjustments
Vachon, C.M.,2001,BRE12674
USA, Not specifiedMinesota, 1944
187
Through healthorg. (screening,healthinsurance)
ProspectiveCohort
1449825.0 years / 20families
times/week
Breast cancer FamilyHistory BC -No
dailyvs.never
40.9(0.42, 1.9)
0.97 A G
incidence
Vachon, C.M.,2001,BRE12674
USA, Not specifiedMinesota, 1944
128
Through healthorg. (screening,healthinsurance)
ProspectiveCohort
409165.0 years / 20families
times/week
Breast cancer FamilyHistory BC -Yes
dailyvs.never
42.45(1.2, 5.02)
0.05 A G
incidence
Feigelson,H.S.,2001,BRE19514
50 States of America,Columbia and Puerto Rico,Multi-ethnicCPS-II US cohort, 1982-
1419
Through healthorg. (screening,healthinsurance)
Questionnaire(nos)
ProspectiveCohort
234964 14.0 years drinks/day
Breast cancer >=3vs.None
61.2(1.0, 1.5)
0.08 A B C D E F G
cancer death
Petri,A.L.,2004,BRE16325
Denmark, Not specifiedCopenhagen Center forProspective PopulationStudies, unknown
20 - 91 473 UnspecifiedQuestionnaire(nos)
ProspectiveCohort
16417drinks/week
Breast cancer >27vs.1-6
51.19(0.58, 2.41)
A C F G
incidence
Morch,L.S.,2005,BRE23480
Denmark, Not specified,Registered nursesDanish Nurse Cohort Study
44 - UnspecifiedQuestionnaire(nos)
ProspectiveCohort
17647.0 10.0 years drinks/week
Breast cancermore than27vs.1-3
31.62(1.04, 2.56)
incidence
Total alcoholic drinks - average lifetime
Menopausal status not specified
Garland,Miriam,1999,BRE19618
U.S.A., Not specified,Registered nursesNHS II, 1989
25 - 42 435
Through socialorganization(profession,religion)
Questionnaire(nos)
ProspectiveCohort
595210 6.0 years drinks/week
Invasive breast cancer >=10vs.none
71.2(0.68, 2.11)
0.18 A C D F G
incidence
Lin, Y.,2005,BRE23154JapanJACC study, 1988
40 - 79 132Generalpopulation(survey)
Questionnaire(nos)
ProspectiveCohort
243921 7.6 years g/day
Breast cancer >23vs.non drinkers
42.11(1.26, 3.54)
A C D F G
incidence
Total alcoholic drinks at 15-17 yrs
Menopausal status not specified
Garland,Miriam,1999,BRE19618
U.S.A., Not specified,Registered nursesNHS II, 1989
25 - 42 403
Through socialorganization(profession,religion)
Questionnaire(nos)
ProspectiveCohort
455269 6.0 years drinks/week
Invasive breast cancer >6vs.none
61.8(0.8, 4.04)
0.49 A C D F G
incidence
Total alcoholic drinks at 18-22 yrs
Menopausal status not specified
Garland,Miriam,1999,BRE19618
U.S.A., Not specified,Registered nursesNHS II, 1989
25 - 42 403
Through socialorganization(profession,religion)
Questionnaire(nos)
ProspectiveCohort
455270 6.0 years drinks/week
Invasive breast cancer >6vs.none
60.98(0.67, 1.43)
0.33 A C D F G
incidence
Total alcoholic drinks at 23-30 yrs
Menopausal status not specified
80

Author, Year,WCRF Code
Country, Ethnicity, Specialcharacteristics
Age Cases n Caseascertainment
Type of studyNon-Cases n
Lenght offollow-up / loss
Assessmentdetail
Additional details Unit Outcome Subgroup Contrast Nocat. OR (95% CI) p
valueptrend A B C D E F G
adjustments
Garland,Miriam,1999,BRE19618
U.S.A., Not specified,Registered nursesNHS II, 1989
25 - 42 403
Through socialorganization(profession,religion)
Questionnaire(nos)
ProspectiveCohort
455270 6.0 years drinks/week
Invasive breast cancer >6vs.none
61.32(0.9, 1.93)
0.07 A C D F G
incidence
Total alcoholic drinks at 31-40 yrs
Menopausal status not specified
Garland,Miriam,1999,BRE19618
U.S.A., Not specified,Registered nursesNHS II, 1989
25 - 42 403
Through socialorganization(profession,religion)
Questionnaire(nos)
ProspectiveCohort
455271 6.0 years drinks/week
Invasive breast cancer >6vs.none
61.02(0.66, 1.58)
0.93 A C D F G
incidence
3.7.1.1
Beers
Pre-menopausal
Petri,A.L.,2004,BRE16325
Denmark, Not specifiedCopenhagen Center forProspective PopulationStudies, unknown
20 - 91 76 UnspecifiedQuestionnaire(nos)
ProspectiveCohort
5448drinks/week
Breast cancerPre-menopausal
>6vs.<1
40.49(0.15, 1.61)
A C F G
incidence
Post-menopausal
Feigelson,H.S.,2001,BRE19514
50 States of America,Columbia and Puerto Rico,Multi-ethnicCPS-II US cohort, 1982-
463
Through healthorg. (screening,healthinsurance)
Questionnaire(nos)
ProspectiveCohort
76523 14.0 yearsamong women whodrink only one kind ofalcohol
drinks/day
Breast cancerPost-menopausal
>=3vs.No alcohol
51.29(0.68, 2.45)
0.89 A B C D E F G
cancer death
Mattisson,I.,2004,BRE17807
Sweden, Not specified, Post-menopausalMalmo Diet and Cancer,1991
50 - 342
Through healthorg. (screening,healthinsurance)
7-day Record +Questionnaire
ProspectiveCohort
11328 7.6 yearsBreast cancer
Post-menopausal
>36.1vs.<=5.6
41.44(0.75, 2.75)
A B C D E F G
incidence
Petri,A.L.,2004,BRE16325
Denmark, Not specifiedCopenhagen Center forProspective PopulationStudies, unknown
20 - 91 144 UnspecifiedQuestionnaire(nos)
ProspectiveCohort
5622 age >=70 yrsdrinks/week
Breast cancerPost-menopausal
>6vs.<1
40.62(0.25, 1.55)
A C F G
incidence
Menopausal status not specified
Hiatt, R.A.,1988,BRE03888
Northern California, USA,Multi-ethnicPrepaid Health Plan inNorthern California, 1978
303
Through healthorg. (screening,healthinsurance)
FFQ (nos)Case Cohort 58347.0 6.0 yearsBreast cancer
Regularvs.Abstainerslifelong
31.37(0.76, 2.47)
A D G
incidence
Goodman, M.T.,1997,BRE03352
Japan, Not specified, Atomicbomb survivorsLSS, 1969
120 By MailQuestionnaire(nos)
ProspectiveCohort
147419 8.31 yearsBreast cancer
drinkervs.neverdrinker
20.63(0.36, 1.1)
A G
incidence
Zhang,Y.,1999,BRE13965
U.S.A., Not specified,Original and OffspringCohortsFramingham Study, 1948
12 - 62 287Generalpopulation(survey)
Interview (nos)ProspectiveCohort
5048.0 34.3 years drinks/week
Breast cancer >=3.0vs.None
41.0(0.5, 2.2)
A B C D E F G
incidence
Visvanathan etal.,2007,BRE80020
AmericaCLUE II - Washington, 1989
(57)FFQ +Questionnaire
Nested CaseControl
14624.0 Beer consumption
Breast cancerBeerdrinkersvs.Non beer
20.95(0.56, 1.63)
A F
incidence
81

Author, Year,WCRF Code
Country, Ethnicity, Specialcharacteristics
Age Cases n Caseascertainment
Type of studyNon-Cases n
Lenght offollow-up / loss
Assessmentdetail
Additional details Unit Outcome Subgroup Contrast Nocat. OR (95% CI) p
valueptrend A B C D E F G
adjustments
Zhang etal.,2007,BRE20023
AmericaWomen's Health Study,1993
(55) Medical notesFFQ +Questionnaire
ProspectiveCohort
38454.0 10.0 years Beer intake g/day
Invasive & In situ breastcancer 10.0
(continuous)1
1.15(1.02, 1.29)
A C D E F G
incidence
Tjonneland etal.,2007,BRE80013
Denmark,France,Germany,Greece,Italy,TheNetherlands,Norway,Spain,Sweden and UK, Multi-ethnic
35 - 70
Populationcancerregistries andother
FFQ + recallProspectiveCohort
274688.0 6.4 years Beer consumption g/day
Invasive breast cancer10.0(continuous)
11.05(0.98, 1.12)
F
incidence
3.7.1.2
Red wines
Menopausal status not specified
HirvonenT.,2006,BRE80105
France, participants of aRCTSU.VI.MAX study, 1994
35 - 60 95 medical records 24h RecallProspectiveCohort
4301 6.6 years Red wine ml/day
Breast cancer >=150vs.0
31.24(0.76, 2.03)
0.39 A C F G
incidence
Zhang etal.,2007,BRE20023
AmericaWomen's Health Study,1993
(55) Medical notesFFQ +Questionnaire
ProspectiveCohort
38454.0 10.0 years Red wine intake g/day
Invasive & In situ breastcancer 10.0
(continuous)1
1.02(0.81, 1.27)
A C D E F G
incidence
White wines
Menopausal status not specified
HirvonenT.,2006,BRE80105
France, participants of aRCTSU.VI.MAX study, 1994
35 - 60 95 medical records 24h RecallProspectiveCohort
4301 6.6 years White or rose wine ml/day
Breast cancer >=150vs.0
31.09(0.64, 1.84)
0.88 A C F G
incidence
Zhang etal.,2007,BRE20023
AmericaWomen's Health Study,1993
(55) Medical notesFFQ +Questionnaire
ProspectiveCohort
38454.0 10.0 years White wine intake g/day
Invasive & In situ breastcancer 10.0
(continuous)1
1.07(0.95, 1.21)
A C D E F G
incidence
Wines
Pre-menopausal
Petri,A.L.,2004,BRE16325
Denmark, Not specifiedCopenhagen Center forProspective PopulationStudies, unknown
20 - 91 76 UnspecifiedQuestionnaire(nos)
ProspectiveCohort
5412drinks/week
Breast cancerPre-menopausal
>6vs.<1
41.43(0.67, 3.01)
A C F G
incidence
Post-menopausal
Feigelson,H.S.,2001,BRE19514
50 States of America,Columbia and Puerto Rico,Multi-ethnicCPS-II US cohort, 1982-
573
Through healthorg. (screening,healthinsurance)
Questionnaire(nos)
ProspectiveCohort
94941 14.0 yearsamong women whodrink only one kind ofalcohol
drinks/day
Breast cancerPost-menopausal
>=3vs.No alcohol
50.79(0.39, 1.6)
0.50 A B C D E F G
cancer death
Mattisson,I.,2004,BRE17807
Sweden, Not specified, Post-menopausalMalmo Diet and Cancer,1991
50 - 342
Through healthorg. (screening,healthinsurance)
7-day Record +Questionnaire
ProspectiveCohort
11328 7.6 yearsBreast cancer
Post-menopausal
>20.8vs.<=2.9
42.11(1.24, 3.6)
A B C D E F G
incidence
82
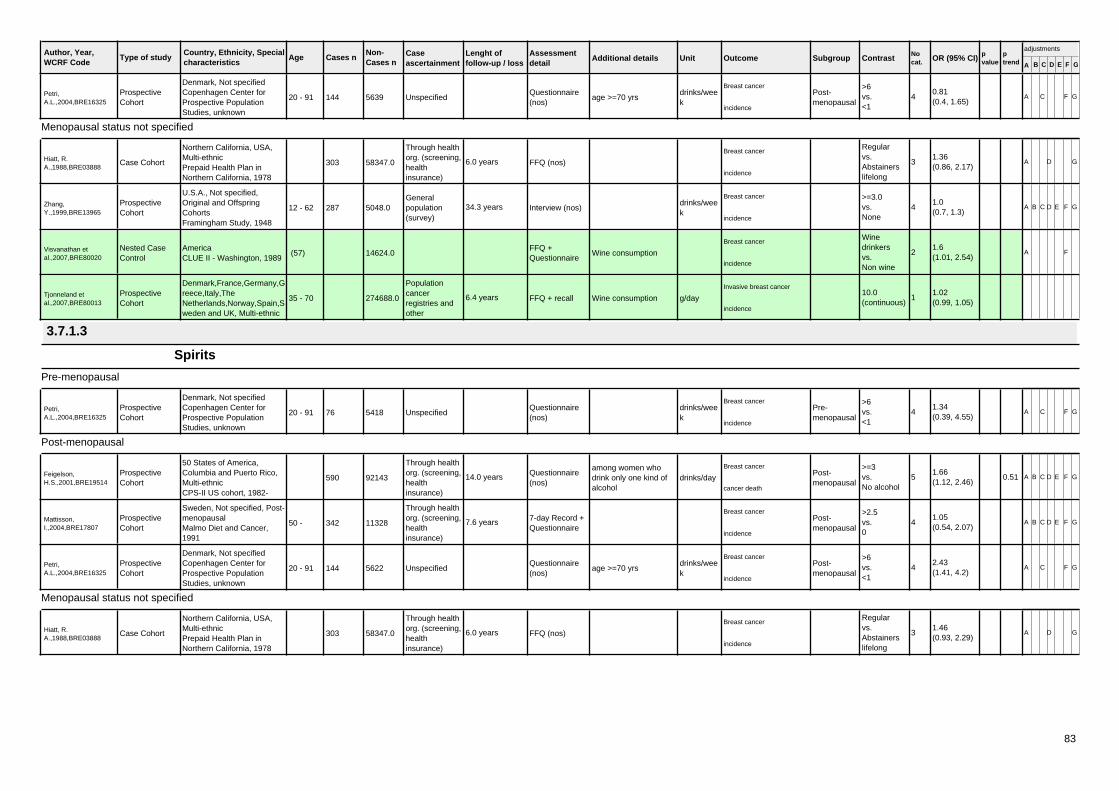
Author, Year,WCRF Code
Country, Ethnicity, Specialcharacteristics
Age Cases n Caseascertainment
Type of studyNon-Cases n
Lenght offollow-up / loss
Assessmentdetail
Additional details Unit Outcome Subgroup Contrast Nocat. OR (95% CI) p
valueptrend A B C D E F G
adjustments
Petri,A.L.,2004,BRE16325
Denmark, Not specifiedCopenhagen Center forProspective PopulationStudies, unknown
20 - 91 144 UnspecifiedQuestionnaire(nos)
ProspectiveCohort
5639 age >=70 yrsdrinks/week
Breast cancerPost-menopausal
>6vs.<1
40.81(0.4, 1.65)
A C F G
incidence
Menopausal status not specified
Hiatt, R.A.,1988,BRE03888
Northern California, USA,Multi-ethnicPrepaid Health Plan inNorthern California, 1978
303
Through healthorg. (screening,healthinsurance)
FFQ (nos)Case Cohort 58347.0 6.0 yearsBreast cancer
Regularvs.Abstainerslifelong
31.36(0.86, 2.17)
A D G
incidence
Zhang,Y.,1999,BRE13965
U.S.A., Not specified,Original and OffspringCohortsFramingham Study, 1948
12 - 62 287Generalpopulation(survey)
Interview (nos)ProspectiveCohort
5048.0 34.3 years drinks/week
Breast cancer >=3.0vs.None
41.0(0.7, 1.3)
A B C D E F G
incidence
Visvanathan etal.,2007,BRE80020
AmericaCLUE II - Washington, 1989
(57)FFQ +Questionnaire
Nested CaseControl
14624.0 Wine consumption
Breast cancerWinedrinkersvs.Non wine
21.6(1.01, 2.54)
A F
incidence
Tjonneland etal.,2007,BRE80013
Denmark,France,Germany,Greece,Italy,TheNetherlands,Norway,Spain,Sweden and UK, Multi-ethnic
35 - 70
Populationcancerregistries andother
FFQ + recallProspectiveCohort
274688.0 6.4 years Wine consumption g/day
Invasive breast cancer10.0(continuous)
11.02(0.99, 1.05)
incidence
3.7.1.3
Spirits
Pre-menopausal
Petri,A.L.,2004,BRE16325
Denmark, Not specifiedCopenhagen Center forProspective PopulationStudies, unknown
20 - 91 76 UnspecifiedQuestionnaire(nos)
ProspectiveCohort
5418drinks/week
Breast cancerPre-menopausal
>6vs.<1
41.34(0.39, 4.55)
A C F G
incidence
Post-menopausal
Feigelson,H.S.,2001,BRE19514
50 States of America,Columbia and Puerto Rico,Multi-ethnicCPS-II US cohort, 1982-
590
Through healthorg. (screening,healthinsurance)
Questionnaire(nos)
ProspectiveCohort
92143 14.0 yearsamong women whodrink only one kind ofalcohol
drinks/day
Breast cancerPost-menopausal
>=3vs.No alcohol
51.66(1.12, 2.46)
0.51 A B C D E F G
cancer death
Mattisson,I.,2004,BRE17807
Sweden, Not specified, Post-menopausalMalmo Diet and Cancer,1991
50 - 342
Through healthorg. (screening,healthinsurance)
7-day Record +Questionnaire
ProspectiveCohort
11328 7.6 yearsBreast cancer
Post-menopausal
>2.5vs.0
41.05(0.54, 2.07)
A B C D E F G
incidence
Petri,A.L.,2004,BRE16325
Denmark, Not specifiedCopenhagen Center forProspective PopulationStudies, unknown
20 - 91 144 UnspecifiedQuestionnaire(nos)
ProspectiveCohort
5622 age >=70 yrsdrinks/week
Breast cancerPost-menopausal
>6vs.<1
42.43(1.41, 4.2)
A C F G
incidence
Menopausal status not specified
Hiatt, R.A.,1988,BRE03888
Northern California, USA,Multi-ethnicPrepaid Health Plan inNorthern California, 1978
303
Through healthorg. (screening,healthinsurance)
FFQ (nos)Case Cohort 58347.0 6.0 yearsBreast cancer
Regularvs.Abstainerslifelong
31.46(0.93, 2.29)
A D G
incidence
83

Author, Year,WCRF Code
Country, Ethnicity, Specialcharacteristics
Age Cases n Caseascertainment
Type of studyNon-Cases n
Lenght offollow-up / loss
Assessmentdetail
Additional details Unit Outcome Subgroup Contrast Nocat. OR (95% CI) p
valueptrend A B C D E F G
adjustments
Zhang,Y.,1999,BRE13965
U.S.A., Not specified,Original and OffspringCohortsFramingham Study, 1948
12 - 62 287Generalpopulation(survey)
Interview (nos)ProspectiveCohort
5048.0 34.3 years drinks/week
Breast cancer >=3.0vs.None
40.7(0.5, 1.0)
A B C D E F G
incidence
Morch,L.S.,2005,BRE23480
Denmark, Not specified,Registered nursesDanish Nurse Cohort Study
44 - UnspecifiedQuestionnaire(nos)
ProspectiveCohort
17647.0 10.0 yearsBreast cancer 4-7
vs.Quantile 1
21.6(1.1, 2.32)
incidence
Tjonneland etal.,2007,BRE80013
Denmark,France,Germany,Greece,Italy,TheNetherlands,Norway,Spain,Sweden and UK, Multi-ethnic
35 - 70
Populationcancerregistries andother
FFQ + recallProspectiveCohort
274688.0 6.4 years Spirit consumption g/day
Invasive breast cancer10.0(continuous)
11.09(0.99, 1.21)
B C D F G
incidence
3.7.1.4
Liquor
Menopausal status not specified
Visvanathan etal.,2007,BRE80020
AmericaCLUE II - Washington, 1989
(57)FFQ +Questionnaire
Nested CaseControl
14624.0 Liquor consumption
Breast cancerLiquordrinkersvs.Non liquor
21.1(0.65, 1.86)
A F
incidence
Zhang etal.,2007,BRE20023
AmericaWomen's Health Study,1993
(55) Medical notesFFQ +Questionnaire
ProspectiveCohort
38454.0 10.0 years Liquor intake g/day
Invasive & In situ breastcancer 10.0
(continuous)1
1.07(0.96, 1.18)
A C D E F G
incidence
Sake
Menopausal status not specified
Goodman, M.T.,1997,BRE03352
Japan, Not specified, Atomicbomb survivorsLSS, 1969
115 By MailQuestionnaire(nos)
ProspectiveCohort
134942 8.31 yearsBreast cancer
drinkervs.neverdrinker
20.81(0.41, 1.6)
A G
incidence
4.1.2.1
1-2-Dichloropropane in drinking water
Menopausal status not specified
O'Leary, E.S.,2004,BRE17886
U.S.A., Not specifiedNew York State Cohort,1980
(61) 83 By Mail FFQ (nos)Nested CaseControl
168 12.0 years
Invasive & In situ breastcancer
detectedvs.nonedetected
21.1(0.4, 2.6)
A B C G
incidence
2-4-d-organochlordane in drinking water
Menopausal status not specified
O'Leary, E.S.,2004,BRE17886
U.S.A., Not specifiedNew York State Cohort,1980
(61) 98 By Mail FFQ (nos)Nested CaseControl
191 12.0 years
Invasive & In situ breastcancer
detectedvs.nonedetected
21.2(0.6, 2.1)
A B C G
incidence
84
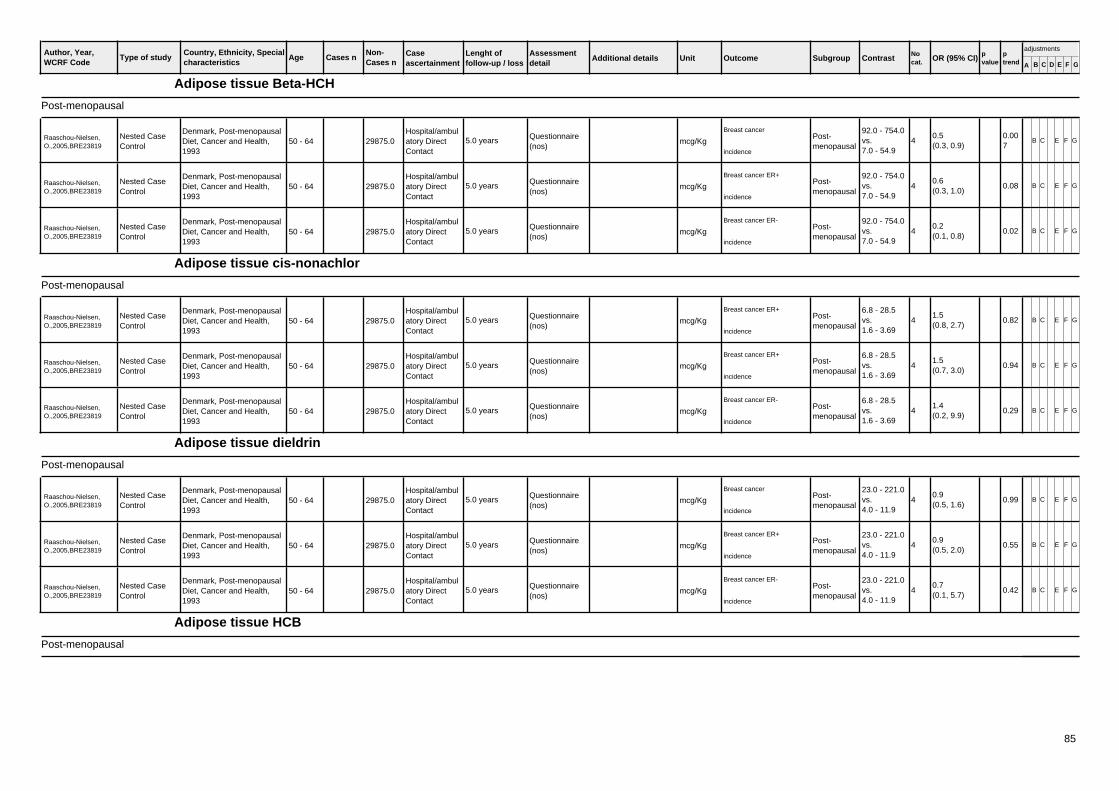
Author, Year,WCRF Code
Country, Ethnicity, Specialcharacteristics
Age Cases n Caseascertainment
Type of studyNon-Cases n
Lenght offollow-up / loss
Assessmentdetail
Additional details Unit Outcome Subgroup Contrast Nocat. OR (95% CI) p
valueptrend A B C D E F G
adjustments
Adipose tissue Beta-HCH
Post-menopausal
Raaschou-Nielsen,O.,2005,BRE23819
Denmark, Post-menopausalDiet, Cancer and Health,1993
50 - 64Hospital/ambulatory DirectContact
Questionnaire(nos)
Nested CaseControl
29875.0 5.0 years mcg/Kg
Breast cancerPost-menopausal
92.0 - 754.0vs.7.0 - 54.9
40.5(0.3, 0.9)
0.007
B C E F G
incidence
Raaschou-Nielsen,O.,2005,BRE23819
Denmark, Post-menopausalDiet, Cancer and Health,1993
50 - 64Hospital/ambulatory DirectContact
Questionnaire(nos)
Nested CaseControl
29875.0 5.0 years mcg/Kg
Breast cancer ER+Post-menopausal
92.0 - 754.0vs.7.0 - 54.9
40.6(0.3, 1.0)
0.08 B C E F G
incidence
Raaschou-Nielsen,O.,2005,BRE23819
Denmark, Post-menopausalDiet, Cancer and Health,1993
50 - 64Hospital/ambulatory DirectContact
Questionnaire(nos)
Nested CaseControl
29875.0 5.0 years mcg/Kg
Breast cancer ER-Post-menopausal
92.0 - 754.0vs.7.0 - 54.9
40.2(0.1, 0.8)
0.02 B C E F G
incidence
Adipose tissue cis-nonachlor
Post-menopausal
Raaschou-Nielsen,O.,2005,BRE23819
Denmark, Post-menopausalDiet, Cancer and Health,1993
50 - 64Hospital/ambulatory DirectContact
Questionnaire(nos)
Nested CaseControl
29875.0 5.0 years mcg/Kg
Breast cancer ER+Post-menopausal
6.8 - 28.5vs.1.6 - 3.69
41.5(0.8, 2.7)
0.82 B C E F G
incidence
Raaschou-Nielsen,O.,2005,BRE23819
Denmark, Post-menopausalDiet, Cancer and Health,1993
50 - 64Hospital/ambulatory DirectContact
Questionnaire(nos)
Nested CaseControl
29875.0 5.0 years mcg/Kg
Breast cancer ER+Post-menopausal
6.8 - 28.5vs.1.6 - 3.69
41.5(0.7, 3.0)
0.94 B C E F G
incidence
Raaschou-Nielsen,O.,2005,BRE23819
Denmark, Post-menopausalDiet, Cancer and Health,1993
50 - 64Hospital/ambulatory DirectContact
Questionnaire(nos)
Nested CaseControl
29875.0 5.0 years mcg/Kg
Breast cancer ER-Post-menopausal
6.8 - 28.5vs.1.6 - 3.69
41.4(0.2, 9.9)
0.29 B C E F G
incidence
Adipose tissue dieldrin
Post-menopausal
Raaschou-Nielsen,O.,2005,BRE23819
Denmark, Post-menopausalDiet, Cancer and Health,1993
50 - 64Hospital/ambulatory DirectContact
Questionnaire(nos)
Nested CaseControl
29875.0 5.0 years mcg/Kg
Breast cancerPost-menopausal
23.0 - 221.0vs.4.0 - 11.9
40.9(0.5, 1.6)
0.99 B C E F G
incidence
Raaschou-Nielsen,O.,2005,BRE23819
Denmark, Post-menopausalDiet, Cancer and Health,1993
50 - 64Hospital/ambulatory DirectContact
Questionnaire(nos)
Nested CaseControl
29875.0 5.0 years mcg/Kg
Breast cancer ER+Post-menopausal
23.0 - 221.0vs.4.0 - 11.9
40.9(0.5, 2.0)
0.55 B C E F G
incidence
Raaschou-Nielsen,O.,2005,BRE23819
Denmark, Post-menopausalDiet, Cancer and Health,1993
50 - 64Hospital/ambulatory DirectContact
Questionnaire(nos)
Nested CaseControl
29875.0 5.0 years mcg/Kg
Breast cancer ER-Post-menopausal
23.0 - 221.0vs.4.0 - 11.9
40.7(0.1, 5.7)
0.42 B C E F G
incidence
Adipose tissue HCB
Post-menopausal
85

Author, Year,WCRF Code
Country, Ethnicity, Specialcharacteristics
Age Cases n Caseascertainment
Type of studyNon-Cases n
Lenght offollow-up / loss
Assessmentdetail
Additional details Unit Outcome Subgroup Contrast Nocat. OR (95% CI) p
valueptrend A B C D E F G
adjustments
Raaschou-Nielsen,O.,2005,BRE23819
Denmark, Post-menopausalDiet, Cancer and Health,1993
50 - 64Hospital/ambulatory DirectContact
Questionnaire(nos)
Nested CaseControl
29875.0 5.0 years mcg/Kg
Breast cancerPost-menopausal
91.0 - 704.0vs.8.0 - 57.9
40.5(0.3, 0.9)
0.002
B C E F G
incidence
Raaschou-Nielsen,O.,2005,BRE23819
Denmark, Post-menopausalDiet, Cancer and Health,1993
50 - 64Hospital/ambulatory DirectContact
Questionnaire(nos)
Nested CaseControl
29875.0 5.0 years mcg/Kg
Breast cancer ER+Post-menopausal
91.0 - 704.0vs.8.0 - 57.9
40.6(0.4, 1.1)
0.08 B C E F G
incidence
Raaschou-Nielsen,O.,2005,BRE23819
Denmark, Post-menopausalDiet, Cancer and Health,1993
50 - 64Hospital/ambulatory DirectContact
Questionnaire(nos)
Nested CaseControl
29875.0 5.0 years mcg/Kg
Breast cancer ER-Post-menopausal
91.0 - 704.0vs.8.0 - 57.9
40.2(0.0, 0.6)
0.004
B C E F G
incidence
Adipose tissue oxychlordane
Post-menopausal
Raaschou-Nielsen,O.,2005,BRE23819
Denmark, Post-menopausalDiet, Cancer and Health,1993
50 - 64Hospital/ambulatory DirectContact
Questionnaire(nos)
Nested CaseControl
29875.0 5.0 years mcg/Kg
Breast cancerPost-menopausal
37.0 - 142.0vs.6.0 - 20.9
40.5(0.3, 0.9)
0.03 B C E F G
incidence
Raaschou-Nielsen,O.,2005,BRE23819
Denmark, Post-menopausalDiet, Cancer and Health,1993
50 - 64Hospital/ambulatory DirectContact
Questionnaire(nos)
Nested CaseControl
29875.0 5.0 years mcg/Kg
Breast cancer ER+Post-menopausal
37.0 - 142.0vs.6.0 - 20.9
40.6(0.3, 1.1)
0.09 B C E F G
incidence
Raaschou-Nielsen,O.,2005,BRE23819
Denmark, Post-menopausalDiet, Cancer and Health,1993
50 - 64Hospital/ambulatory DirectContact
Questionnaire(nos)
Nested CaseControl
29875.0 5.0 years mcg/Kg
Breast cancer ER-Post-menopausal
37.0 - 142.0vs.6.0 - 20.9
40.1(0.0, 0.7)
0.04 B C E F G
incidence
Adipose tissue trans-nonachlor
Post-menopausal
Raaschou-Nielsen,O.,2005,BRE23819
Denmark, Post-menopausalDiet, Cancer and Health,1993
50 - 64Hospital/ambulatory DirectContact
Questionnaire(nos)
Nested CaseControl
29875.0 5.0 years mcg/Kg
Breast cancer ER+Post-menopausal
50.0 - 172.0vs.3.0 - 25.9
40.7(0.5, 1.2)
0.05 B C E F G
incidence
Raaschou-Nielsen,O.,2005,BRE23819
Denmark, Post-menopausalDiet, Cancer and Health,1993
50 - 64Hospital/ambulatory DirectContact
Questionnaire(nos)
Nested CaseControl
29875.0 5.0 years mcg/Kg
Breast cancer ER+Post-menopausal
50.0 - 172.0vs.3.0 - 25.9
40.9(0.5, 1.5)
0.29 B C E F G
incidence
Raaschou-Nielsen,O.,2005,BRE23819
Denmark, Post-menopausalDiet, Cancer and Health,1993
50 - 64Hospital/ambulatory DirectContact
Questionnaire(nos)
Nested CaseControl
29875.0 5.0 years mcg/Kg
Breast cancer ER-Post-menopausal
50.0 - 172.0vs.3.0 - 25.9
40.2(0.1, 0.9)
0.02 B C E F G
incidence
Beta-hexachlorocyclohexane (HCH)
Menopausal status not specified
Ward, E.M.,2000,BRE13163
Norway, Not specifiedNorway Serum Bank, 1973
18 - 60Otherprocedure
Nested CaseControl
25431.0 20.0 yearsBreast cancer 1.0
vs.-1.0
40.7(null, null)
C G
incidence
86

Author, Year,WCRF Code
Country, Ethnicity, Specialcharacteristics
Age Cases n Caseascertainment
Type of studyNon-Cases n
Lenght offollow-up / loss
Assessmentdetail
Additional details Unit Outcome Subgroup Contrast Nocat. OR (95% CI) p
valueptrend A B C D E F G
adjustments
BHC in drinking water
Menopausal status not specified
O'Leary, E.S.,2004,BRE17886
U.S.A., Not specifiedNew York State Cohort,1980
(61) 98 By Mail FFQ (nos)Nested CaseControl
192 12.0 years
Invasive & In situ breastcancer
detectedvs.nonedetected
21.1(0.6, 2.1)
A B C G
incidence
Chlordane in drinking water
Menopausal status not specified
O'Leary, E.S.,2004,BRE17886
U.S.A., Not specifiedNew York State Cohort,1980
(61) 83 By Mail FFQ (nos)Nested CaseControl
163 12.0 years
Invasive & In situ breastcancer
detectedvs.nonedetected
21.4(0.6, 3.5)
A B C G
incidence
Dieldrin in drinking water
Menopausal status not specified
O'Leary, E.S.,2004,BRE17886
U.S.A., Not specifiedNew York State Cohort,1980
(61) 95 By Mail FFQ (nos)Nested CaseControl
187 12.0 years
Invasive & In situ breastcancer
detectedvs.nonedetected
21.1(0.6, 2.0)
A B C G
incidence
Heptachlor in drinking water
Menopausal status not specified
O'Leary, E.S.,2004,BRE17886
U.S.A., Not specifiedNew York State Cohort,1980
(61) 96 By Mail FFQ (nos)Nested CaseControl
191 12.0 years
Invasive & In situ breastcancer
detectedvs.nonedetected
21.1(0.6, 1.9)
A B C G
incidence
Heptachlorepoxide in drinking water
Menopausal status not specified
O'Leary, E.S.,2004,BRE17886
U.S.A., Not specifiedNew York State Cohort,1980
(61) 81 By Mail FFQ (nos)Nested CaseControl
161 12.0 years
Invasive & In situ breastcancer
detectedvs.nonedetected
21.0(0.4, 2.7)
A B C G
incidence
Serum Beta-hexachlorocyclohexane (HCH)
Menopausal status not specified
Hoyer, A.P.,1998,BRE15433
Denmark, Not specifiedCopenhagenCHS
20 - 237 UnspecifiedQuestionnaire(nos)
Nested CaseControl
470 17.0 years ng/g
Breast cancer >1.0vs.>-1.0
41.36(0.79, 2.33)
0.24 B C D E F G
incidence
Dorgan,J.F.,1999,BRE14890
USA, Multi-ethnic, BlooddonorsColumbia Missouri BreastCancer Serum Bank, 1977
(57) 105 UnspecifiedNested CaseControl
208 9.5 years ng/g lipid
Breast cancer177.0 -1600.0vs.0 - 75.0
40.6(0.0, 1.3)
0.65 B C D F G
incidence
Serum Dieldrin
87

Author, Year,WCRF Code
Country, Ethnicity, Specialcharacteristics
Age Cases n Caseascertainment
Type of studyNon-Cases n
Lenght offollow-up / loss
Assessmentdetail
Additional details Unit Outcome Subgroup Contrast Nocat. OR (95% CI) p
valueptrend A B C D E F G
adjustments
Menopausal status not specified
Hoyer, A.P.,1998,BRE15433
Denmark, Not specifiedCopenhagenCHS
20 - 237 UnspecifiedQuestionnaire(nos)
Nested CaseControl
469 17.0 years ng/g
Breast cancer >1.0vs.>-1.0
42.05(1.17, 3.57)
0.01 B C D E F G
incidence
Dorgan,J.F.,1999,BRE14890
USA, Multi-ethnic, BlooddonorsColumbia Missouri BreastCancer Serum Bank, 1977
(57) 105 UnspecifiedNested CaseControl
207 9.5 years ng/g lipid
Breast cancer104.0 -921.0vs.0 - 23.0
40.7(0.3, 1.3)
0.44 B C D F G
incidence
Hoyer, A.P.,2001,BRE15437
Denmark, Not specifiedCopenhagenCHS
25 - 80 116 UnspecifiedNested CaseControl
226 17.0 years ng/ml
Breast cancer ER+ >57.11vs.<12.0
41.4(0.8, 2.5)
0.2 A C D F
incidence
Hoyer, A.P.,2001,BRE15437
Denmark, Not specifiedCopenhagenCHS
25 - 80 44 UnspecifiedNested CaseControl
92 17.0 years ng/ml
Breast cancer ER- >57.11vs.<12.0
47.6(1.3, 46.1)
0.01 A C D F
incidence
Hoyer, A.P.,2002,BRE04087
Denmark, Not specifiedCopenhagenCHS
20 - 75 36
Through healthorg. (screening,healthinsurance)
Nested CaseControl
72 17.0 yearsBreast cancer p53 mutation >1.0
vs.>-1.0
43.53(0.79, 15.79)
0.12 A C D F G
incidence
Hoyer, A.P.,2002,BRE04087
Denmark, Not specifiedCopenhagenCHS
20 - 75
Through healthorg. (screening,healthinsurance)
Nested CaseControl
7712.0 17.0 years ng/ml
Breast cancer p53 mutation1.0(continuous)
11.0(null, null)
0.48 A C D F G
cancer death
Hoyer, A.P.,2002,BRE04087
Denmark, Not specifiedCopenhagenCHS
20 - 75 123
Through healthorg. (screening,healthinsurance)
Nested CaseControl
244 17.0 yearsBreast cancer p53 wild-type >1.0
vs.>-1.0
41.2(0.56, 2.58)
0.60 A C D F G
incidence
Hoyer, A.P.,2002,BRE04087
Denmark, Not specifiedCopenhagenCHS
20 - 75
Through healthorg. (screening,healthinsurance)
Nested CaseControl
7712.0 17.0 years ng/ml
Breast cancer p53 wild-type1.0(continuous)
11.01(null, null)
0.01 A C D F G
cancer death
Serum Heptachlorepoxide
Menopausal status not specified
Ward, E.M.,2000,BRE13163
Norway, Not specifiedNorway Serum Bank, 1973
18 - 60Otherprocedure
Nested CaseControl
25431.0 20.0 yearsBreast cancer 1.0
vs.-1.0
41.0(null, null)
C G
incidence
Serum Hexachlorobenzene (HCB)
Menopausal status not specified
Dorgan,J.F.,1999,BRE14890
USA, Multi-ethnic, BlooddonorsColumbia Missouri BreastCancer Serum Bank, 1977
(57) 105 UnspecifiedNested CaseControl
208 9.5 years ng/g lipid
Breast cancer106.0 -406.0vs.0 - 62.0
42.3(1.0, 5.0)
0.38 B C D F G
incidence
Hoyer, A.P.,2001,BRE15437
Denmark, Not specifiedCopenhagenCHS
25 - 80 114 UnspecifiedNested CaseControl
222 17.0 years ng/ml
Breast cancer ER+ >335.75vs.<206.49
41.2(0.7, 2.1)
0.20 A C D F
incidence
88

Author, Year,WCRF Code
Country, Ethnicity, Specialcharacteristics
Age Cases n Caseascertainment
Type of studyNon-Cases n
Lenght offollow-up / loss
Assessmentdetail
Additional details Unit Outcome Subgroup Contrast Nocat. OR (95% CI) p
valueptrend A B C D E F G
adjustments
Hoyer, A.P.,2001,BRE15437
Denmark, Not specifiedCopenhagenCHS
25 - 80 44 UnspecifiedNested CaseControl
92 17.0 years ng/ml
Breast cancer ER- >335.75vs.<206.49
40.4(0.1, 1.4)
0.20 A C D F
incidence
Serum Oxychlordane
Menopausal status not specified
Ward, E.M.,2000,BRE13163
Norway, Not specifiedNorway Serum Bank, 1973
18 - 60Otherprocedure
Nested CaseControl
25431.0 20.0 yearsBreast cancer 1.0
vs.-1.0
40.9(null, null)
C G
incidence
Serum trans-nonachlor
Menopausal status not specified
Ward, E.M.,2000,BRE13163
Norway, Not specifiedNorway Serum Bank, 1973
18 - 60Otherprocedure
Nested CaseControl
25431.0 20.0 yearsBreast cancer 1.0
vs.-1.0
41.0(null, null)
C G
incidence
Trihalomethane in drinking water
Menopausal status not specified
Vinceti,M.,2004,BRE21237
Italy, Not specifiedGuastalla, 1965
35Historical Cohort 2698.0 12.0 yearsBreast cancer esposed
vs.unesposed
21.3(0.9, 1.8)
cancer death
4.1.2.2
Adipose tissue DDE
Menopausal status not specified
Cocco,P.,2000,BRE17383
U.S.A., Multi-ethnicUSA, 1975
UnspecifiedProspectiveCohort
null 19.0 years white women
Breast cancer
1null(null, null)
A
cancer death
Cocco,P.,2000,BRE17383
U.S.A., Multi-ethnicUSA, 1975
UnspecifiedProspectiveCohort
null 19.0 years african americanwomen
Breast cancer
1null(null, null)
A
cancer death
Adipose tissue p-p' DDE
Post-menopausal
Raaschou-Nielsen,O.,2005,BRE23819
Denmark, Post-menopausalDiet, Cancer and Health,1993
50 - 64Hospital/ambulatory DirectContact
Questionnaire(nos)
Nested CaseControl
29875.0 5.0 years mcg/Kg
Breast cancerPost-menopausal
904.0 -6693.0vs.15.0 - 282.0
40.7(0.5, 1.2)
0.29 B C E F G
incidence
89

Author, Year,WCRF Code
Country, Ethnicity, Specialcharacteristics
Age Cases n Caseascertainment
Type of studyNon-Cases n
Lenght offollow-up / loss
Assessmentdetail
Additional details Unit Outcome Subgroup Contrast Nocat. OR (95% CI) p
valueptrend A B C D E F G
adjustments
Raaschou-Nielsen,O.,2005,BRE23819
Denmark, Post-menopausalDiet, Cancer and Health,1993
50 - 64Hospital/ambulatory DirectContact
Questionnaire(nos)
Nested CaseControl
29875.0 5.0 years mcg/Kg
Breast cancer ER+Post-menopausal
904.0 -6693.0vs.15.0 - 282.0
41.1(0.6, 1.8)
0.82 B C E F G
incidence
Raaschou-Nielsen,O.,2005,BRE23819
Denmark, Post-menopausalDiet, Cancer and Health,1993
50 - 64Hospital/ambulatory DirectContact
Questionnaire(nos)
Nested CaseControl
29875.0 5.0 years mcg/Kg
Breast cancer ER-Post-menopausal
904.0 -6693.0vs.15.0 - 282.0
40.1(0.0, 0.5)
0.005
B C E F G
incidence
Adipose tissue p-p' DDT
Post-menopausal
Raaschou-Nielsen,O.,2005,BRE23819
Denmark, Post-menopausalDiet, Cancer and Health,1993
50 - 64Hospital/ambulatory DirectContact
Questionnaire(nos)
Nested CaseControl
29875.0 5.0 years mcg/Kg
Breast cancerPost-menopausal
31.0 - 159.0vs.6.0 - 13.9
40.6(0.3, 1.0)
0,19 B C E F G
incidence
Raaschou-Nielsen,O.,2005,BRE23819
Denmark, Post-menopausalDiet, Cancer and Health,1993
50 - 64Hospital/ambulatory DirectContact
Questionnaire(nos)
Nested CaseControl
29875.0 5.0 years mcg/Kg
Breast cancer ER+Post-menopausal
31.0 - 159.0vs.6.0 - 13.9
40.6(0.3, 1.1)
0,18 B C E F G
incidence
Raaschou-Nielsen,O.,2005,BRE23819
Denmark, Post-menopausalDiet, Cancer and Health,1993
50 - 64Hospital/ambulatory DirectContact
Questionnaire(nos)
Nested CaseControl
29875.0 5.0 years mcg/Kg
Breast cancer ER-Post-menopausal
31.0 - 159.0vs.6.0 - 13.9
40.5(0.1, 2.1)
0,85 B C E F G
incidence
DDT
Pre-menopausal
CohnBA,2007,BRE80163
United States, unknownKaiser Permanent MedicalCare Program
(26) 96HospitalRecords only
Nested CaseControl
96 p,p'-DDT at age <14yrs mcg/L
Breast cancerPre-menopausal
>14.0vs.<8.08
35.2(1.4, 19.1)
0.01Mortality/Incidence
Plasma DDE
Post-menopausal
Laden,F.,2001,BRE17732
U.S.A., Not specified, Post-menopausalNurses' Health Study (NHS)Cohort 1976-1996
43 - 69 372 By MailNested CaseControl
372 21.0 years mcg/g
Invasive & In situ breastcancer Post-
menopausal
1.446 -6.054vs.0.0070 -
50.82(0.49, 1.37)
0.15 C D F G
incidence
Laden,F.,2001,BRE17732
U.S.A., Not specified, Post-menopausalNurses' Health Study (NHS)Cohort 1976-1996
43 - 69 195 By MailNested CaseControl
207 21.0 years
Invasive & In situ breastcancer Post-
menopausal& Lean
>1.0vs.>-1.0
31.19(0.73, 1.94)
0.51 G
incidence
Laden,F.,2001,BRE17732
U.S.A., Not specified, Post-menopausalNurses' Health Study (NHS)Cohort 1976-1996
43 - 69 118 By MailNested CaseControl
109 21.0 years normal BMI
Invasive & In situ breastcancer Post-
menopausal& Other
>1.0vs.>-1.0
30.64(0.34, 1.21)
0.1 G
incidence
Laden,F.,2001,BRE17732
U.S.A., Not specified, Post-menopausalNurses' Health Study (NHS)Cohort 1976-1996
43 - 69 59 By MailNested CaseControl
56 21.0 years
Invasive & In situ breastcancer
Post-menopausal&Overweight
>1.0vs.>-1.0
30.75(0.3, 1.9)
0.59 G
incidence
Menopausal status not specified
90

Author, Year,WCRF Code
Country, Ethnicity, Specialcharacteristics
Age Cases n Caseascertainment
Type of studyNon-Cases n
Lenght offollow-up / loss
Assessmentdetail
Additional details Unit Outcome Subgroup Contrast Nocat. OR (95% CI) p
valueptrend A B C D E F G
adjustments
Hunter,D.J.,1997,BRE15469
USA, Not specified,Registered nursesNurses' Health Study (NHS)Cohort 1976-1996
236 UnspecifiedNested CaseControl
236 3.0 years ppb
Breast cancer >9.47vs.<2.78
50.72(0.37, 1.4)
0.47 C F G
incidence
Serum DDE
Pre-menopausal
Helzlsouer, K.J.,1999,BRE03835
USA, Caucasian, BlooddonorsCLUE I, 1974
Throughnetwork, paper,tv
Nested CaseControl
20305.0 21.0 years total DDE
Breast cancerPre-menopausal
Quantile 3vs.Quantile 1
30.86(null, null)
0.68 G
incidence
Helzlsouer, K.J.,1999,BRE53835
USA, Caucasian, BlooddonorsCLUE II, 1989
Throughnetwork, paper,tv
Nested CaseControl
25080.0 6.0 years total DDE, 1989
Breast cancerPre-menopausal
Quantile 3vs.Quantile 1
31.42(null, null)
0.8 G
incidence
Post-menopausal
Helzlsouer, K.J.,1999,BRE03835
USA, Caucasian, BlooddonorsCLUE I, 1974
Throughnetwork, paper,tv
Nested CaseControl
20305.0 21.0 years total DDE
Breast cancer
HRT - YesQuantile 3vs.Quantile 1
30.8(null, null)
0.61 G
incidence
Helzlsouer, K.J.,1999,BRE53835
USA, Caucasian, BlooddonorsCLUE II, 1989
Throughnetwork, paper,tv
Nested CaseControl
25080.0 6.0 years total DDE, 1989
Breast cancer
HRT - YesQuantile 3vs.Quantile 1
30.59(null, null)
0.19 G
incidence
Helzlsouer, K.J.,1999,BRE03835
USA, Caucasian, BlooddonorsCLUE I, 1974
Throughnetwork, paper,tv
Nested CaseControl
20305.0 21.0 years total DDE
Breast cancerPost-menopausal
Quantile 3vs.Quantile 1
30.52(null, null)
0.003
G
incidence
Helzlsouer, K.J.,1999,BRE53835
USA, Caucasian, BlooddonorsCLUE II, 1989
Throughnetwork, paper,tv
Nested CaseControl
25080.0 6.0 years total DDE, 1989
Breast cancerPost-menopausal
Quantile 3vs.Quantile 1
30.5(null, null)
0.15 G
incidence
Menopausal status not specified
Wolff, M.S.,1993,BRE13545
U.S.A.New York Women's HealthStudy, 1985
35 - 65Hospital/ambulatory DirectContact
Nested CaseControl
14290.0 6.0 years ng/ml
Breast cancer1.0(continuous)
11.09(null, null)
0.0037
C F G
incidence
Krieger,N.,1994,BRE15739
U.S.A., Multi-ethnicNorth California,1960
UnspecifiedNested CaseControl
57040.0 30.0 years ppb
Breast cancer 49.7 - 149.5vs.5.3 - 29.6
31.33(0.68, 2.62)
0.431
C D F
incidence
Helzlsouer, K.J.,1999,BRE03835
USA, Caucasian, BlooddonorsCLUE I, 1974
Throughnetwork, paper,tv
Nested CaseControl
20305.0 21.0 years total DDE
Breast cancer
HRT - NoQuantile 3vs.Quantile 1
31.67(null, null)
0.41 G
incidence
Helzlsouer, K.J.,1999,BRE53835
USA, Caucasian, BlooddonorsCLUE II, 1989
Throughnetwork, paper,tv
Nested CaseControl
25080.0 6.0 years total DDE, 1989
Breast cancer
HRT - NoQuantile 3vs.Quantile 1
30.17(null, null)
0.13 G
incidence
91

Author, Year,WCRF Code
Country, Ethnicity, Specialcharacteristics
Age Cases n Caseascertainment
Type of studyNon-Cases n
Lenght offollow-up / loss
Assessmentdetail
Additional details Unit Outcome Subgroup Contrast Nocat. OR (95% CI) p
valueptrend A B C D E F G
adjustments
Helzlsouer, K.J.,1999,BRE03835
USA, Caucasian, BlooddonorsCLUE I, 1974
235Throughnetwork, paper,tv
Nested CaseControl
235 21.0 years total DDE ng/g
Breast cancer2446.7 -10795.91vs.<1017.19
50.73(0.4, 1.32)
0.13 G
incidence
Helzlsouer, K.J.,1999,BRE53835
USA, Caucasian, BlooddonorsCLUE II, 1989
105Throughnetwork, paper,tv
Nested CaseControl
105 6.0 years total DDE, 1989 ng/g
Breast cancer1595.2 -10065.2vs.<816.3
30.58(0.29, 1.17)
0.15 G
incidence
Wolff, M.S.,2000,BRE13547
U.S.A., Not specifiedNew York Women's HealthStudy, 1985
34 - 65 110 By MailQuestionnaire(nos)
Nested CaseControl
213 11.0 years ng/g
Breast cancer >1934.0vs.<663.0
41.3(0.51, 3.35)
0.99 C D F G
incidence
Wolff, M.S.,2000,BRE13547
U.S.A., Not specifiedNew York Women's HealthStudy, 1985
34 - 65 By MailQuestionnaire(nos)
Nested CaseControl
14275.0 11.0 yearsBreast cancer ER+
1null(null, null)
incidence
Wolff, M.S.,2000,BRE13547
U.S.A., Not specifiedNew York Women's HealthStudy, 1985
34 - 65 By MailQuestionnaire(nos)
Nested CaseControl
14275.0 11.0 yearsBreast cancer ER-
1null(null, null)
incidence
Serum DDT
Pre-menopausal
Cohn, B.A.,2002,BRE18317
U.S.A., Not specified, Pre-menopausalChildren Health andDevelopment Study
- 50 UnspecifiedHistorical Cohort null ng/ml
Breast cancer >1.0vs.>-1.0
310.4(2.5, 43.2)
0.001
C G
incidence
Menopausal status not specified
Hoyer, A.P.,1998,BRE15433
Denmark, Not specifiedCopenhagenCHS
20 - 166 UnspecifiedQuestionnaire(nos)
Nested CaseControl
326 17.0 years ng/g
Breast cancer >1.0vs.>-1.0
40.84(0.49, 1.45)
0.65 B C D E F G
incidence
Dorgan,J.F.,1999,BRE14890
USA, Multi-ethnic, BlooddonorsColumbia Missouri BreastCancer Serum Bank, 1977
(57) 104 UnspecifiedNested CaseControl
206 9.5 years ng/g lipid
Breast cancer4021.0 -21077.0vs.204.0 -
40.8(0.4, 1.6)
0.65 B C D F G
incidence
Hoyer, A.P.,2002,BRE04087
Denmark, Not specifiedCopenhagenCHS
20 - 75 28
Through healthorg. (screening,healthinsurance)
Nested CaseControl
56 17.0 yearsBreast cancer p53 mutation >1.0
vs.>-1.0
40.88(0.19, 4.17)
0.78 A C D F G
incidence
Hoyer, A.P.,2002,BRE04087
Denmark, Not specifiedCopenhagenCHS
20 - 75
Through healthorg. (screening,healthinsurance)
Nested CaseControl
7712.0 17.0 years ng/ml
Breast cancer p53 mutation100.0(continuous)
10.99(null, null)
0.64 A C D F G
cancer death
Hoyer, A.P.,2002,BRE04087
Denmark, Not specifiedCopenhagenCHS
20 - 75 86
Through healthorg. (screening,healthinsurance)
Nested CaseControl
171 17.0 years total
Breast cancer p53 wild-type >1.0vs.>-1.0
40.7(0.32, 1.55)
0.98 A C D F G
incidence
92

Author, Year,WCRF Code
Country, Ethnicity, Specialcharacteristics
Age Cases n Caseascertainment
Type of studyNon-Cases n
Lenght offollow-up / loss
Assessmentdetail
Additional details Unit Outcome Subgroup Contrast Nocat. OR (95% CI) p
valueptrend A B C D E F G
adjustments
Hoyer, A.P.,2002,BRE04087
Denmark, Not specifiedCopenhagenCHS
20 - 75
Through healthorg. (screening,healthinsurance)
Nested CaseControl
7712.0 17.0 years ng/ml
Breast cancer p53 wild-type100.0(continuous)
10.99(null, null)
0.65 A C D F G
cancer death
Serum p,p'-DDE
Menopausal status not specified
Hoyer, A.P.,1998,BRE15433
Denmark, Not specifiedCopenhagenCHS
20 - 237 UnspecifiedQuestionnaire(nos)
Nested CaseControl
469 17.0 years ng/g
Breast cancer >1.0vs.>-1.0
40.88(0.56, 1.37)
0.52 B C D E F G
incidence
Dorgan,J.F.,1999,BRE14890
USA, Multi-ethnic, BlooddonorsColumbia Missouri BreastCancer Serum Bank, 1977
(57) 105 UnspecifiedNested CaseControl
207 9.5 years ng/g lipid
Breast cancer3501.0 -20667.0vs.31.0 -
40.8(0.4, 1.5)
0.77 B C D F G
incidence
Ward, E.M.,2000,BRE13163
Norway, Not specifiedNorway Serum Bank, 1973
18 - 60Otherprocedure
Nested CaseControl
25431.0 20.0 yearsBreast cancer 1.0
vs.-1.0
41.2(null, null)
C G
incidence
Hoyer, A.P.,2001,BRE15437
Denmark, Not specifiedCopenhagenCHS
25 - 80 116 UnspecifiedNested CaseControl
226 17.0 years ng/ml
Breast cancer ER+ >1688.85vs.<741.03
40.9(0.6, 1.5)
0.2 A C D F
incidence
Hoyer, A.P.,2001,BRE15437
Denmark, Not specifiedCopenhagenCHS
25 - 80 44 UnspecifiedNested CaseControl
92 17.0 years ng/ml
Breast cancer ER- >1688.85vs.<741.03
40.6(0.2, 1.7)
0.2 A C D F
incidence
Hoyer, A.P.,2002,BRE04087
Denmark, Not specifiedCopenhagenCHS
20 - 75 36
Through healthorg. (screening,healthinsurance)
Nested CaseControl
72 17.0 yearsBreast cancer p53 mutation >1.0
vs.>-1.0
40.81(0.23, 2.84)
0.61 A C D F G
incidence
Hoyer, A.P.,2002,BRE04087
Denmark, Not specifiedCopenhagenCHS
20 - 75
Through healthorg. (screening,healthinsurance)
Nested CaseControl
7712.0 17.0 years ng/ml
Breast cancer p53 mutation100.0(continuous)
10.98(null, null)
0.47 A C D F G
cancer death
Hoyer, A.P.,2002,BRE04087
Denmark, Not specifiedCopenhagenCHS
20 - 75 123
Through healthorg. (screening,healthinsurance)
Nested CaseControl
244 17.0 yearsBreast cancer p53 wild-type >1.0
vs.>-1.0
40.86(0.46, 1.61)
0.38 A C D F G
incidence
Hoyer, A.P.,2002,BRE04087
Denmark, Not specifiedCopenhagenCHS
20 - 75
Through healthorg. (screening,healthinsurance)
Nested CaseControl
7712.0 17.0 years ng/ml
Breast cancer p53 wild-type100.0(continuous)
10.98(null, null)
0.19 A C D F G
cancer death
Serum p,p'-DDT
Menopausal status not specified
Hoyer, A.P.,1998,BRE15433
Denmark, Not specifiedCopenhagenCHS
20 - 237 UnspecifiedQuestionnaire(nos)
Nested CaseControl
470 17.0 years ng/g
Breast cancer >1.0vs.>-1.0
41.19(0.76, 1.87)
0.57 B C D E F G
incidence
93

Author, Year,WCRF Code
Country, Ethnicity, Specialcharacteristics
Age Cases n Caseascertainment
Type of studyNon-Cases n
Lenght offollow-up / loss
Assessmentdetail
Additional details Unit Outcome Subgroup Contrast Nocat. OR (95% CI) p
valueptrend A B C D E F G
adjustments
Dorgan,J.F.,1999,BRE14890
USA, Multi-ethnic, BlooddonorsColumbia Missouri BreastCancer Serum Bank, 1977
(57) 105 UnspecifiedNested CaseControl
207 9.5 years ng/g lipid
Breast cancer468.0 -1724.0vs.0 - 180.0
40.4(0.2, 1.0)
0.05 B C D F G
incidence
Ward, E.M.,2000,BRE13163
Norway, Not specifiedNorway Serum Bank, 1973
18 - 60Otherprocedure
Nested CaseControl
25431.0 20.0 yearsBreast cancer 1.0
vs.-1.0
40.3(null, null)
C G
incidence
Hoyer, A.P.,2002,BRE04087
Denmark, Not specifiedCopenhagenCHS
20 - 75 36
Through healthorg. (screening,healthinsurance)
Nested CaseControl
72 17.0 yearsBreast cancer p53 mutation >1.0
vs.>-1.0
40.95(0.3, 2.98)
0.98 A C D F G
incidence
Hoyer, A.P.,2002,BRE04087
Denmark, Not specifiedCopenhagenCHS
20 - 75
Through healthorg. (screening,healthinsurance)
Nested CaseControl
7712.0 17.0 years ng/ml
Breast cancer p53 mutation10.0(continuous)
10.99(null, null)
0.7 A C D F G
cancer death
Hoyer, A.P.,2002,BRE04087
Denmark, Not specifiedCopenhagenCHS
20 - 75 123
Through healthorg. (screening,healthinsurance)
Nested CaseControl
244 17.0 yearsBreast cancer p53 wild-type >1.0
vs.>-1.0
41.32(0.68, 2.59)
0.85 A C D F G
incidence
Hoyer, A.P.,2002,BRE04087
Denmark, Not specifiedCopenhagenCHS
20 - 75
Through healthorg. (screening,healthinsurance)
Nested CaseControl
7712.0 17.0 years ng/ml
Breast cancer p53 wild-type10.0(continuous)
10.99(null, null)
0.89 A C D F G
cancer death
4.1.2.6.3
Adipose tissue PCB
Post-menopausal
Raaschou-Nielsen,O.,2005,BRE23819
Denmark, Post-menopausalDiet, Cancer and Health,1993
50 - 64Hospital/ambulatory DirectContact
Questionnaire(nos)
Nested CaseControl
29875.0 5.0 years mcg/Kg
Breast cancerPost-menopausal
1024.0 -4357.0vs.56.0 - 670.9
41.1(0.7, 1.7)
0.44 B C E F G
incidence
Raaschou-Nielsen,O.,2005,BRE23819
Denmark, Post-menopausalDiet, Cancer and Health,1993
50 - 64Hospital/ambulatory DirectContact
Questionnaire(nos)
Nested CaseControl
29875.0 5.0 years mcg/Kg
Breast cancer ER+Post-menopausal
1024.0 -4357.0vs.56.0 - 670.9
41.4(0.8, 2.5)
0.5 B C E F G
incidence
Raaschou-Nielsen,O.,2005,BRE23819
Denmark, Post-menopausalDiet, Cancer and Health,1993
50 - 64Hospital/ambulatory DirectContact
Questionnaire(nos)
Nested CaseControl
29875.0 5.0 years mcg/Kg
Breast cancer ER-Post-menopausal
1024.0 -4357.0vs.56.0 - 670.9
40.3(0.1, 0.9)
0.007
B C E F G
incidence
Adipose tissue PCB congener 99
Post-menopausal
Raaschou-Nielsen,O.,2005,BRE23819
Denmark, Post-menopausalDiet, Cancer and Health,1993
50 - 64Hospital/ambulatory DirectContact
Questionnaire(nos)
Nested CaseControl
29875.0 5.0 years mcg/Kg
Breast cancerPost-menopausal
26.7 - 99.4vs.5.6 - 14.9
41.1(0.7, 1.9)
0.85 B C E F G
incidence
94

Author, Year,WCRF Code
Country, Ethnicity, Specialcharacteristics
Age Cases n Caseascertainment
Type of studyNon-Cases n
Lenght offollow-up / loss
Assessmentdetail
Additional details Unit Outcome Subgroup Contrast Nocat. OR (95% CI) p
valueptrend A B C D E F G
adjustments
Raaschou-Nielsen,O.,2005,BRE23819
Denmark, Post-menopausalDiet, Cancer and Health,1993
50 - 64Hospital/ambulatory DirectContact
Questionnaire(nos)
Nested CaseControl
29875.0 5.0 years mcg/Kg
Breast cancer ER+Post-menopausal
26.7 - 99.4vs.5.6 - 14.9
41.1(0.6, 2.1)
0.69 B C E F G
incidence
Raaschou-Nielsen,O.,2005,BRE23819
Denmark, Post-menopausalDiet, Cancer and Health,1993
50 - 64Hospital/ambulatory DirectContact
Questionnaire(nos)
Nested CaseControl
29875.0 5.0 years mcg/Kg
Breast cancer ER-Post-menopausal
26.7 - 99.4vs.5.6 - 14.9
40.3(0.1, 1.4)
0.14 B C E F G
incidence
Adipose tissue PCB congener 118
Post-menopausal
Raaschou-Nielsen,O.,2005,BRE23819
Denmark, Post-menopausalDiet, Cancer and Health,1993
50 - 64Hospital/ambulatory DirectContact
Questionnaire(nos)
Nested CaseControl
29875.0 5.0 years mcg/Kg
Breast cancerPost-menopausal
51.0 - 200.0vs.3.0 - 26.9
40.9(0.6, 1.4)
0.99 B C E F G
incidence
Raaschou-Nielsen,O.,2005,BRE23819
Denmark, Post-menopausalDiet, Cancer and Health,1993
50 - 64Hospital/ambulatory DirectContact
Questionnaire(nos)
Nested CaseControl
29875.0 5.0 years mcg/Kg
Breast cancer ER+Post-menopausal
51.0 - 200.0vs.3.0 - 26.9
41.0(0.6, 1.7)
0.37 B C E F G
incidence
Raaschou-Nielsen,O.,2005,BRE23819
Denmark, Post-menopausalDiet, Cancer and Health,1993
50 - 64Hospital/ambulatory DirectContact
Questionnaire(nos)
Nested CaseControl
29875.0 5.0 years mcg/Kg
Breast cancer ER-Post-menopausal
51.0 - 200.0vs.3.0 - 26.9
40.2(0.0, 0.8)
0.06 B C E F G
incidence
Adipose tissue PCB congener 138
Post-menopausal
Raaschou-Nielsen,O.,2005,BRE23819
Denmark, Post-menopausalDiet, Cancer and Health,1993
50 - 64Hospital/ambulatory DirectContact
Questionnaire(nos)
Nested CaseControl
29875.0 5.0 years mcg/Kg
Breast cancerPost-menopausal
170.0 -629.0vs.6.0 - 96.9
41.1(0.7, 1.7)
0.84 B C E F G
incidence
Raaschou-Nielsen,O.,2005,BRE23819
Denmark, Post-menopausalDiet, Cancer and Health,1993
50 - 64Hospital/ambulatory DirectContact
Questionnaire(nos)
Nested CaseControl
29875.0 5.0 years mcg/Kg
Breast cancer ER+Post-menopausal
170.0 -629.0vs.6.0 - 96.9
41.4(0.8, 2.4)
0.27 B C E F G
incidence
Raaschou-Nielsen,O.,2005,BRE23819
Denmark, Post-menopausalDiet, Cancer and Health,1993
50 - 64Hospital/ambulatory DirectContact
Questionnaire(nos)
Nested CaseControl
29875.0 5.0 years mcg/Kg
Breast cancer ER-Post-menopausal
170.0 -629.0vs.6.0 - 96.9
40.3(0.1, 0.9)
0.008
B C E F G
incidence
Adipose tissue PCB congener 153
Post-menopausal
Raaschou-Nielsen,O.,2005,BRE23819
Denmark, Post-menopausalDiet, Cancer and Health,1993
50 - 64Hospital/ambulatory DirectContact
Questionnaire(nos)
Nested CaseControl
29875.0 5.0 years mcg/Kg
Breast cancerPost-menopausal
322.0 -1294.0vs.18.0 - 205.9
41.1(0.7, 1.7)
0.66 B C E F G
incidence
Raaschou-Nielsen,O.,2005,BRE23819
Denmark, Post-menopausalDiet, Cancer and Health,1993
50 - 64Hospital/ambulatory DirectContact
Questionnaire(nos)
Nested CaseControl
29875.0 5.0 years mcg/Kg
Breast cancer ER+Post-menopausal
322.0 -1294.0vs.18.0 - 205.9
41.4(0.8, 2.3)
0.41 B C E F G
incidence
95

Author, Year,WCRF Code
Country, Ethnicity, Specialcharacteristics
Age Cases n Caseascertainment
Type of studyNon-Cases n
Lenght offollow-up / loss
Assessmentdetail
Additional details Unit Outcome Subgroup Contrast Nocat. OR (95% CI) p
valueptrend A B C D E F G
adjustments
Raaschou-Nielsen,O.,2005,BRE23819
Denmark, Post-menopausalDiet, Cancer and Health,1993
50 - 64Hospital/ambulatory DirectContact
Questionnaire(nos)
Nested CaseControl
29875.0 5.0 years mcg/Kg
Breast cancer ER-Post-menopausal
322.0 -1294.0vs.18.0 - 205.9
40.3(0.1, 0.9)
0.008
B C E F G
incidence
Adipose tissue PCB congener 156
Post-menopausal
Raaschou-Nielsen,O.,2005,BRE23819
Denmark, Post-menopausalDiet, Cancer and Health,1993
50 - 64Hospital/ambulatory DirectContact
Questionnaire(nos)
Nested CaseControl
29875.0 5.0 years mcg/Kg
Breast cancerPost-menopausal
43.0 - 206.0vs.3.0 - 29.9
40.9(0.6, 1.5)
0.26 B C E F G
incidence
Raaschou-Nielsen,O.,2005,BRE23819
Denmark, Post-menopausalDiet, Cancer and Health,1993
50 - 64Hospital/ambulatory DirectContact
Questionnaire(nos)
Nested CaseControl
29875.0 5.0 years mcg/Kg
Breast cancer ER+Post-menopausal
43.0 - 206.0vs.3.0 - 29.9
41.0(0.6, 1.7)
0.95 B C E F G
incidence
Raaschou-Nielsen,O.,2005,BRE23819
Denmark, Post-menopausalDiet, Cancer and Health,1993
50 - 64Hospital/ambulatory DirectContact
Questionnaire(nos)
Nested CaseControl
29875.0 5.0 years mcg/Kg
Breast cancer ER-Post-menopausal
43.0 - 206.0vs.3.0 - 29.9
40.5(0.1, 1.9)
0.05 B C E F G
incidence
Adipose tissue PCB congener 170
Post-menopausal
Raaschou-Nielsen,O.,2005,BRE23819
Denmark, Post-menopausalDiet, Cancer and Health,1993
50 - 64Hospital/ambulatory DirectContact
Questionnaire(nos)
Nested CaseControl
29875.0 5.0 years mcg/Kg
Breast cancerPost-menopausal
98.0 - 502.0vs.6.0 - 66.9
41.1(0.7, 1.8)
0.42 B C E F G
incidence
Raaschou-Nielsen,O.,2005,BRE23819
Denmark, Post-menopausalDiet, Cancer and Health,1993
50 - 64Hospital/ambulatory DirectContact
Questionnaire(nos)
Nested CaseControl
29875.0 5.0 years mcg/Kg
Breast cancer ER+Post-menopausal
98.0 - 502.0vs.6.0 - 66.9
41.3(0.7, 2.3)
0.47 B C E F G
incidence
Raaschou-Nielsen,O.,2005,BRE23819
Denmark, Post-menopausalDiet, Cancer and Health,1993
50 - 64Hospital/ambulatory DirectContact
Questionnaire(nos)
Nested CaseControl
29875.0 5.0 years mcg/Kg
Breast cancer ER-Post-menopausal
98.0 - 502.0vs.6.0 - 66.9
40.4(0.1, 1.6)
0.02 B C E F G
incidence
Adipose tissue PCB congener 180
Post-menopausal
Raaschou-Nielsen,O.,2005,BRE23819
Denmark, Post-menopausalDiet, Cancer and Health,1993
50 - 64Hospital/ambulatory DirectContact
Questionnaire(nos)
Nested CaseControl
29875.0 5.0 years mcg/Kg
Breast cancerPost-menopausal
230.0 -1084.0vs.13.0 - 154.9
41.1(0.6, 1.8)
0.32 B C E F G
incidence
Raaschou-Nielsen,O.,2005,BRE23819
Denmark, Post-menopausalDiet, Cancer and Health,1993
50 - 64Hospital/ambulatory DirectContact
Questionnaire(nos)
Nested CaseControl
29875.0 5.0 years mcg/Kg
Breast cancer ER+Post-menopausal
230.0 -1084.0vs.13.0 - 154.9
41.2(0.7, 2.2)
0.63 B C E F G
incidence
Raaschou-Nielsen,O.,2005,BRE23819
Denmark, Post-menopausalDiet, Cancer and Health,1993
50 - 64Hospital/ambulatory DirectContact
Questionnaire(nos)
Nested CaseControl
29875.0 5.0 years mcg/Kg
Breast cancer ER-Post-menopausal
230.0 -1084.0vs.13.0 - 154.9
40.3(0.1, 1.2)
0.02 B C E F G
incidence
96

Author, Year,WCRF Code
Country, Ethnicity, Specialcharacteristics
Age Cases n Caseascertainment
Type of studyNon-Cases n
Lenght offollow-up / loss
Assessmentdetail
Additional details Unit Outcome Subgroup Contrast Nocat. OR (95% CI) p
valueptrend A B C D E F G
adjustments
Adipose tissue PCB congener 183
Post-menopausal
Raaschou-Nielsen,O.,2005,BRE23819
Denmark, Post-menopausalDiet, Cancer and Health,1993
50 - 64Hospital/ambulatory DirectContact
Questionnaire(nos)
Nested CaseControl
29875.0 5.0 years mcg/Kg
Breast cancerPost-menopausal
24.0 - 106.0vs.2.0 - 13.9
41.3(0.8, 2.0)
0.57 B C E F G
incidence
Raaschou-Nielsen,O.,2005,BRE23819
Denmark, Post-menopausalDiet, Cancer and Health,1993
50 - 64Hospital/ambulatory DirectContact
Questionnaire(nos)
Nested CaseControl
29875.0 5.0 years mcg/Kg
Breast cancer ER+Post-menopausal
24.0 - 106.0vs.2.0 - 13.9
41.6(0.9, 2.8)
0.13 B C E F G
incidence
Raaschou-Nielsen,O.,2005,BRE23819
Denmark, Post-menopausalDiet, Cancer and Health,1993
50 - 64Hospital/ambulatory DirectContact
Questionnaire(nos)
Nested CaseControl
29875.0 5.0 years mcg/Kg
Breast cancer ER-Post-menopausal
24.0 - 106.0vs.2.0 - 13.9
40.4(0.1, 1.2)
0.04 B C E F G
incidence
Adipose tissue PCB congener 187
Post-menopausal
Raaschou-Nielsen,O.,2005,BRE23819
Denmark, Post-menopausalDiet, Cancer and Health,1993
50 - 64Hospital/ambulatory DirectContact
Questionnaire(nos)
Nested CaseControl
29875.0 5.0 years mcg/Kg
Breast cancerPost-menopausal
60.0 - 322.0vs.3.0 - 37.9
41.2(0.8, 2.0)
0.97 B C E F G
incidence
Raaschou-Nielsen,O.,2005,BRE23819
Denmark, Post-menopausalDiet, Cancer and Health,1993
50 - 64Hospital/ambulatory DirectContact
Questionnaire(nos)
Nested CaseControl
29875.0 5.0 years mcg/Kg
Breast cancer ER+Post-menopausal
60.0 - 322.0vs.3.0 - 37.9
41.6(0.9, 2.7)
0.19 B C E F G
incidence
Raaschou-Nielsen,O.,2005,BRE23819
Denmark, Post-menopausalDiet, Cancer and Health,1993
50 - 64Hospital/ambulatory DirectContact
Questionnaire(nos)
Nested CaseControl
29875.0 5.0 years mcg/Kg
Breast cancer ER-Post-menopausal
60.0 - 322.0vs.3.0 - 37.9
40.4(0.1, 1.3)
0.01 B C E F G
incidence
Adipose tissue PCB congener 201
Post-menopausal
Raaschou-Nielsen,O.,2005,BRE23819
Denmark, Post-menopausalDiet, Cancer and Health,1993
50 - 64Hospital/ambulatory DirectContact
Questionnaire(nos)
Nested CaseControl
29875.0 5.0 years mcg/Kg
Breast cancerPost-menopausal
23.0 - 114.0vs.1.0 - 15.9
41.1(0.7, 1.9)
0.87 B C E F G
incidence
Raaschou-Nielsen,O.,2005,BRE23819
Denmark, Post-menopausalDiet, Cancer and Health,1993
50 - 64Hospital/ambulatory DirectContact
Questionnaire(nos)
Nested CaseControl
29875.0 5.0 years mcg/Kg
Breast cancer ER+Post-menopausal
23.0 - 114.0vs.1.0 - 15.9
41.4(0.8, 2.6)
0.3 B C E F G
incidence
Raaschou-Nielsen,O.,2005,BRE23819
Denmark, Post-menopausalDiet, Cancer and Health,1993
50 - 64Hospital/ambulatory DirectContact
Questionnaire(nos)
Nested CaseControl
29875.0 5.0 years mcg/Kg
Breast cancer ER-Post-menopausal
23.0 - 114.0vs.1.0 - 15.9
40.4(0.1, 1.5)
0.08 B C E F G
incidence
Plasma PCB
Post-menopausal
97

Author, Year,WCRF Code
Country, Ethnicity, Specialcharacteristics
Age Cases n Caseascertainment
Type of studyNon-Cases n
Lenght offollow-up / loss
Assessmentdetail
Additional details Unit Outcome Subgroup Contrast Nocat. OR (95% CI) p
valueptrend A B C D E F G
adjustments
Laden,F.,2001,BRE17732
U.S.A., Not specified, Post-menopausalNurses' Health Study (NHS)Cohort 1976-1996
43 - 69 370 By MailNested CaseControl
370 21.0 years mcg/g
Invasive & In situ breastcancer Post-
menopausal
0.766 -1.986vs.0.131 -
50.84(0.47, 1.52)
0.56 C D F G
incidence
Laden,F.,2001,BRE17732
U.S.A., Not specified, Post-menopausalNurses' Health Study (NHS)Cohort 1976-1996
43 - 69 194 By MailNested CaseControl
206 21.0 years
Invasive & In situ breastcancer Post-
menopausal& Lean
>1.0vs.>-1.0
31.41(0.84, 2.37)
0.81 G
incidence
Laden,F.,2001,BRE17732
U.S.A., Not specified, Post-menopausalNurses' Health Study (NHS)Cohort 1976-1996
43 - 69 118 By MailNested CaseControl
109 21.0 years normal BMI
Invasive & In situ breastcancer Post-
menopausal& Other
>1.0vs.>-1.0
31.21(0.63, 2.31)
0.32 G
incidence
Laden,F.,2001,BRE17732
U.S.A., Not specified, Post-menopausalNurses' Health Study (NHS)Cohort 1976-1996
43 - 69 58 By MailNested CaseControl
55 21.0 years
Invasive & In situ breastcancer
Post-menopausal&Overweight
>1.0vs.>-1.0
30.26(0.09, 0.76)
0.01 G
incidence
Menopausal status not specified
Hunter,D.J.,1997,BRE15469
USA, Not specified,Registered nursesNurses' Health Study (NHS)Cohort 1976-1996
230 UnspecifiedNested CaseControl
230 3.0 years ppb
Breast cancer >6.32vs.<3.59
50.66(0.32, 1.37)
0.47 C F G
incidence
Plasma PCB congener 118
Post-menopausal
Laden,F.,2001,BRE17732
U.S.A., Not specified, Post-menopausalNurses' Health Study (NHS)Cohort 1976-1996
43 - 69 370 By MailNested CaseControl
371 21.0 years mcg/g
Invasive & In situ breastcancer Post-
menopausal
0.101 -0.313vs.0.014 -
50.69(0.39, 1.22)
0.67 C D F G
incidence
Plasma PCB congener 138
Post-menopausal
Laden,F.,2001,BRE17732
U.S.A., Not specified, Post-menopausalNurses' Health Study (NHS)Cohort 1976-1996
43 - 69 370 By MailNested CaseControl
370 21.0 years mcg/g
Invasive & In situ breastcancer Post-
menopausal
0.143 -0.402vs.0.0040 -
50.87(0.5, 1.5)
0.21 C D F G
incidence
Plasma PCB congener 153
Post-menopausal
Laden,F.,2001,BRE17732
U.S.A., Not specified, Post-menopausalNurses' Health Study (NHS)Cohort 1976-1996
43 - 69 370 By MailNested CaseControl
370 21.0 years mcg/g
Invasive & In situ breastcancer Post-
menopausal
0.159 -0.447vs.0.0090 -
50.83(0.47, 1.48)
0.26 C D F G
incidence
Plasma PCB congener 180
Post-menopausal
Laden,F.,2001,BRE17732
U.S.A., Not specified, Post-menopausalNurses' Health Study (NHS)Cohort 1976-1996
43 - 69 370 By MailNested CaseControl
370 21.0 years mcg/g
Invasive & In situ breastcancer Post-
menopausal
0.103 -0.467vs.0 - 0.054
50.98(0.55, 1.75)
0.67 C D F G
incidence
98

Author, Year,WCRF Code
Country, Ethnicity, Specialcharacteristics
Age Cases n Caseascertainment
Type of studyNon-Cases n
Lenght offollow-up / loss
Assessmentdetail
Additional details Unit Outcome Subgroup Contrast Nocat. OR (95% CI) p
valueptrend A B C D E F G
adjustments
Serum PCB
Pre-menopausal
Helzlsouer, K.J.,1999,BRE03835
USA, Caucasian, BlooddonorsCLUE I, 1974
Throughnetwork, paper,tv
Nested CaseControl
20305.0 21.0 yearsBreast cancer
Pre-menopausal
Quantile 3vs.Quantile 1
32.21(null, null)
0.12 G
incidence
Helzlsouer, K.J.,1999,BRE53835
USA, Caucasian, BlooddonorsCLUE II, 1989
Throughnetwork, paper,tv
Nested CaseControl
25080.0 6.0 years 1989
Breast cancerPre-menopausal
Quantile 3vs.Quantile 1
32.12(null, null)
0.40 G
incidence
Post-menopausal
Helzlsouer, K.J.,1999,BRE03835
USA, Caucasian, BlooddonorsCLUE I, 1974
Throughnetwork, paper,tv
Nested CaseControl
20305.0 21.0 yearsBreast cancer
HRT - YesQuantile 3vs.Quantile 1
30.83(null, null)
0.69 G
incidence
Helzlsouer, K.J.,1999,BRE53835
USA, Caucasian, BlooddonorsCLUE II, 1989
Throughnetwork, paper,tv
Nested CaseControl
25080.0 6.0 years 1989
Breast cancer
HRT - YesQuantile 3vs.Quantile 1
31.19(null, null)
0.55 G
incidence
Helzlsouer, K.J.,1999,BRE03835
USA, Caucasian, BlooddonorsCLUE I, 1974
Throughnetwork, paper,tv
Nested CaseControl
20305.0 21.0 yearsBreast cancer
Post-menopausal
Quantile 3vs.Quantile 1
30.62(null, null)
0.10 G
incidence
Helzlsouer, K.J.,1999,BRE53835
USA, Caucasian, BlooddonorsCLUE II, 1989
Throughnetwork, paper,tv
Nested CaseControl
25080.0 6.0 years 1989
Breast cancerPost-menopausal
Quantile 3vs.Quantile 1
30.74(null, null)
0.44 G
incidence
Menopausal status not specified
Wolff, M.S.,1993,BRE13545
U.S.A.New York Women's HealthStudy, 1985
35 - 65Hospital/ambulatory DirectContact
Nested CaseControl
14290.0 6.0 years ng/ml
Breast cancer1.0(continuous)
11.08(null, null)
0.16 C F G
incidence
Krieger,N.,1994,BRE15739
U.S.A., Multi-ethnicNorth California,1960
UnspecifiedNested CaseControl
57040.0 30.0 years ppb
Breast cancer 5.1 - 20.6vs.1.5 - 3.4
30.94(0.48, 1.84)
0.878
C D F
incidence
Helzlsouer, K.J.,1999,BRE03835
USA, Caucasian, BlooddonorsCLUE I, 1974
Throughnetwork, paper,tv
Nested CaseControl
20305.0 21.0 yearsBreast cancer
HRT - NoQuantile 3vs.Quantile 1
31.34(null, null)
0.71 G
incidence
Helzlsouer, K.J.,1999,BRE53835
USA, Caucasian, BlooddonorsCLUE II, 1989
Throughnetwork, paper,tv
Nested CaseControl
25080.0 6.0 years 1989
Breast cancer
HRT - NoQuantile 3vs.Quantile 1
30.07(null, null)
0.06 G
incidence
Dorgan,J.F.,1999,BRE14890
USA, Multi-ethnic, BlooddonorsColumbia Missouri BreastCancer Serum Bank, 1977
(57) 104 UnspecifiedNested CaseControl
206 9.5 years ng/g lipid
Breast cancer564.0 -2682.0vs.17.0 - 257.0
40.7(0.3, 1.5)
0.79 B C D F G
incidence
99

Author, Year,WCRF Code
Country, Ethnicity, Specialcharacteristics
Age Cases n Caseascertainment
Type of studyNon-Cases n
Lenght offollow-up / loss
Assessmentdetail
Additional details Unit Outcome Subgroup Contrast Nocat. OR (95% CI) p
valueptrend A B C D E F G
adjustments
Helzlsouer, K.J.,1999,BRE03835
USA, Caucasian, BlooddonorsCLUE I, 1974
235Throughnetwork, paper,tv
Nested CaseControl
235 21.0 years ng/g
Breast cancer852.23 -6460.04vs.<394.47
51.12(0.59, 2.15)
0.44 G
incidence
Helzlsouer, K.J.,1999,BRE53835
USA, Caucasian, BlooddonorsCLUE II, 1989
105Throughnetwork, paper,tv
Nested CaseControl
105 6.0 years 1989 ng/g
Breast cancer333.6 -2007.9vs.13.6 - 191.8
30.76(0.38, 1.51)
0.60 G
incidence
Hoyer, A.P.,2000,BRE15436
Denmark, Not specifiedCopenhagenCHS
25 - 80 UnspecifiedQuestionnaire(nos)
Nested CaseControl
6038.0 16.0 years ng/g
Breast cancer >1.0vs.>-1.0
41.6(0.8, 3.3)
0.17 D
incidence
Ward, E.M.,2000,BRE13163
Norway, Not specifiedNorway Serum Bank, 1973
18 - 60Otherprocedure
Nested CaseControl
25431.0 20.0 yearsBreast cancer 1.0
vs.-1.0
40.5(null, null)
C G
incidence
Wolff, M.S.,2000,BRE13547
U.S.A., Not specifiedNew York Women's HealthStudy, 1985
34 - 65 110 By MailQuestionnaire(nos)
Nested CaseControl
213 11.0 years ng/g
Breast cancer >876.0vs.<477.0
42.02(0.76, 5.37)
0,23 C D F G
incidence
Wolff, M.S.,2000,BRE13547
U.S.A., Not specifiedNew York Women's HealthStudy, 1985
34 - 65 By MailQuestionnaire(nos)
Nested CaseControl
14275.0 11.0 years serum PCB
Breast cancer ER+
1null(null, null)
incidence
Wolff, M.S.,2000,BRE13547
U.S.A., Not specifiedNew York Women's HealthStudy, 1985
34 - 65 By MailQuestionnaire(nos)
Nested CaseControl
14275.0 11.0 yearsBreast cancer ER-
1null(null, null)
incidence
Hoyer, A.P.,2001,BRE15437
Denmark, Not specifiedCopenhagenCHS
25 - 80 116 UnspecifiedNested CaseControl
226 17.0 years ng/ml
Breast cancer ER+ >1405.73vs.<811.1
41.3(0.8, 2.2)
0.2 A C D F
incidence
Hoyer, A.P.,2001,BRE15437
Denmark, Not specifiedCopenhagenCHS
25 - 80 44 UnspecifiedNested CaseControl
92 17.0 years ng/ml
Breast cancer ER- >1405.73vs.<811.1
40.8(0.3, 2.6)
0.2 A C D F
incidence
Hoyer, A.P.,2002,BRE04087
Denmark, Not specifiedCopenhagenCHS
20 - 75 36
Through healthorg. (screening,healthinsurance)
Nested CaseControl
72 17.0 yearsBreast cancer p53 mutation >1.0
vs.>-1.0
43.0(0.66, 13.62)
0.13 A C D F G
incidence
Hoyer, A.P.,2002,BRE04087
Denmark, Not specifiedCopenhagenCHS
20 - 75
Through healthorg. (screening,healthinsurance)
Nested CaseControl
7712.0 17.0 years ng/ml
Breast cancer p53 mutation100.0(continuous)
10.98(null, null)
0.65 A C D F G
cancer death
Hoyer, A.P.,2002,BRE04087
Denmark, Not specifiedCopenhagenCHS
20 - 75 123
Through healthorg. (screening,healthinsurance)
Nested CaseControl
244 17.0 yearsBreast cancer p53 wild-type >1.0
vs.>-1.0
40.96(0.5, 1.83)
0.87 A C D F G
incidence
Hoyer, A.P.,2002,BRE04087
Denmark, Not specifiedCopenhagenCHS
20 - 75
Through healthorg. (screening,healthinsurance)
Nested CaseControl
7712.0 17.0 years ng/ml
Breast cancer p53 wild-type100.0(continuous)
10.99(null, null)
0.47 A C D F G
cancer death
100

Author, Year,WCRF Code
Country, Ethnicity, Specialcharacteristics
Age Cases n Caseascertainment
Type of studyNon-Cases n
Lenght offollow-up / loss
Assessmentdetail
Additional details Unit Outcome Subgroup Contrast Nocat. OR (95% CI) p
valueptrend A B C D E F G
adjustments
Serum PCB congener 153
Menopausal status not specified
Hoyer, A.P.,2000,BRE15436
Denmark, Not specifiedCopenhagenCHS
25 - 80 UnspecifiedQuestionnaire(nos)
Nested CaseControl
6038.0 16.0 years ng/g
Breast cancer >1.0vs.>-1.0
41.3(0.6, 2.6)
0.99 D
incidence
Serum PCB congener 180
Menopausal status not specified
Hoyer, A.P.,2000,BRE15436
Denmark, Not specifiedCopenhagenCHS
25 - 80 UnspecifiedQuestionnaire(nos)
Nested CaseControl
6038.0 16.0 years ng/g
Breast cancer >1.0vs.>-1.0
40.9(0.4, 2.2)
0.99 D
incidence
Serum PCB-118
Menopausal status not specified
Dorgan,J.F.,1999,BRE14890
USA, Multi-ethnic, BlooddonorsColumbia Missouri BreastCancer Serum Bank, 1977
(57) 104 UnspecifiedNested CaseControl
207 9.5 years ng/g lipid
Breast cancer110.0 -533.0vs.0 - 49.0
41.0(0.5, 2.2)
0.77 B C D F G
incidence
Hoyer, A.P.,2000,BRE15436
Denmark, Not specifiedCopenhagenCHS
25 - 80 UnspecifiedQuestionnaire(nos)
Nested CaseControl
6038.0 16.0 years ng/g
Breast cancer >1.0vs.>-1.0
41.9(0.9, 3.9)
0.07 D
incidence
serum PCB-138
Menopausal status not specified
Dorgan,J.F.,1999,BRE14890
USA, Multi-ethnic, BlooddonorsColumbia Missouri BreastCancer Serum Bank, 1977
(57) 104 UnspecifiedNested CaseControl
207 9.5 years ng/g lipid
Breast cancer125.0 -359.0vs.0 - 69.0
41.2(0.6, 2.4)
0.82 B C D F G
incidence
Hoyer, A.P.,2000,BRE15436
Denmark, Not specifiedCopenhagenCHS
25 - 80 UnspecifiedQuestionnaire(nos)
Nested CaseControl
6038.0 16.0 years ng/g
Breast cancer >1.0vs.>-1.0
42.1(1.0, 4.4)
0.04 D
incidence
4.1.2.7.2
Toenail Arsenic
Pre-menopausal
Garland,M.,1996,BRE03132
US, Not specified,Registered nursesNurses' Health Study (NHS)Cohort 1976-1996
30 - 55 137 By MailNested CaseControl
127 4.0 years mcg/g
Breast cancerPre-menopausal
>0.138vs.<0.0589
50.74(0.31, 1.77)
0.68 A C D E F G
incidence
Post-menopausal
101

Author, Year,WCRF Code
Country, Ethnicity, Specialcharacteristics
Age Cases n Caseascertainment
Type of studyNon-Cases n
Lenght offollow-up / loss
Assessmentdetail
Additional details Unit Outcome Subgroup Contrast Nocat. OR (95% CI) p
valueptrend A B C D E F G
adjustments
Garland,M.,1996,BRE03132
US, Not specified,Registered nursesNurses' Health Study (NHS)Cohort 1976-1996
30 - 55 152 By MailNested CaseControl
184 4.0 years mcg/g
Breast cancerPost-menopausal
>0.138vs.<0.0589
51.47(0.67, 3.19)
0.39 A C D E F G
incidence
Menopausal status not specified
Garland,M.,1996,BRE03132
US, Not specified,Registered nursesNurses' Health Study (NHS)Cohort 1976-1996
30 - 55 308 By MailNested CaseControl
325 4.0 years mcg/g
Breast cancer >0.138vs.<0.0589
51.12(0.66, 1.91)
0.78 A C D E F G
incidence
4.1.2.8
Nitrate in water
Menopausal status not specified
Weyer, P.J.,2000,BRE13338
USA, Multi-ethnicIowa Women's Health Study
55 - 69 1024 By MailQuestionnaire+Recalled six day- Diary
ProspectiveCohort
241314 11.0 years mg/day
Breast cancer >27.2vs.< 11.6
40.99(0.83, 1.19)
A B D E G
incidence
Weyer, P.J.,2000,BRE13338
USA, Multi-ethnicIowa Women's Health Study
55 - 69 810 By MailQuestionnaire+Recalled six day- Diary
ProspectiveCohort
192433 11.0 years Municipal Water supply1955-1988
mg/liter
Breast cancer > 2.46vs.< .36
41.03(0.83, 1.28)
A B D E G
incidence
Weyer, P.J.,2000,BRE13338
USA, Multi-ethnicIowa Women's Health Study
55 - 69 732 By MailQuestionnaire+Recalled six day- Diary
ProspectiveCohort
168605 11.0 years Municipal Water supply1955-1964
mg/liter
Breast cancer > 2.22vs.< .33
41.12(0.89, 1.41)
A B D E G
incidence
4.2
Preserved animal foods
Pre-menopausal
Holmes,M.D.,2003,BRE15400
USA, Not specified,Registered nursesNurses' Health Study (NHS)Cohort 1976-1996
30 - 55 854HospitalRecords only
FFQ-Semi-quantitative
ProspectiveCohort
53952 18.0 yearshot dog, bacon,sausages, salami andbologna
serving/day
Invasive breast cancerPre-menopausal
>0.46vs.<0.1
50.86(0.67, 1.09)
0.25 A C D E F G
incidence
Menopausal status not specified
Holmes,M.D.,2003,BRE15400
USA, Not specified,Registered nursesNurses' Health Study (NHS)Cohort 1976-1996
30 - 55HospitalRecords only
FFQ-Semi-quantitative
ProspectiveCohort
88647.0 18.0 yearshot dog, bacon,sausages, salami andbologna
serving/day
Invasive breast cancer >0.46vs.<0.1
50.94(0.85, 1.05)
0.12 A C D E F G
incidence
Preserved vegetables
Menopausal status not specified
Li, W.,2005,BRE23123China, AsianShanghai BSE
130
Through socialorganization(profession,religion)
FFQ-Semi-quantitative
Nested CaseControl
1070 only vegetables times/year
Breast cancer >57.0vs.<5.0
50.9(0.5, 1.7)
0.8 E
incidence
102

Author, Year,WCRF Code
Country, Ethnicity, Specialcharacteristics
Age Cases n Caseascertainment
Type of studyNon-Cases n
Lenght offollow-up / loss
Assessmentdetail
Additional details Unit Outcome Subgroup Contrast Nocat. OR (95% CI) p
valueptrend A B C D E F G
adjustments
4.2.1
Drying or dried foods
Menopausal status not specified
Key, T.J.,1999,BRE04758
Japan, Not specifiedLSS, 1969
427 By MailQuestionnaire(nos)
ProspectiveCohort
488989 24.0 years dried fishtimes/week
Breast cancer >=5vs.<=1
40.49(0.24, 1.02)
0.029
A G
incidence
4.2.6
Pickling
Menopausal status not specified
Key, T.J.,1999,BRE04758
Japan, Not specifiedLSS, 1969
427 By MailQuestionnaire(nos)
ProspectiveCohort
488991 24.0 years
pickled vegetables(including salted fishgut) drop of vegetableunspecified (same
times/week
Breast cancer >=5vs.<=1
41.35(1.04, 1.75)
0.059
A G
incidence
4.3.1
Refining
Post-menopausal
Nicodemus,K.K.,2001,BRE16206
USA, Not specified, Post-menopausalIowa Women's Health Study
55 - 69 977 By Mail FFQ (nos)ProspectiveCohort
273843 9.0 years Refined cereals andcereal products
serving/week
Breast cancerPost-menopausal
13.0 - 78.0vs.0 - 2.5
51.06(0.84, 1.3)
0.80 A B C D E F G
incidence
4.3.3
Fermenting
Menopausal status not specified
Voorrips, L.E.,2002,BRE13011
The Netherlands, Notspecified, Post-menopausalwomenThe Netherlands Cohort
55 - 69 783 By MailFFQ-Semi-quantitative
Case Cohort 62573.0 6.3 years Fermented whole milk g/day
Breast cancer 53.0vs.0.0
20.88(0.71, 1.1)
.15 A B C D E F G
incidence
Voorrips, L.E.,2002,BRE13011
The Netherlands, Notspecified, Post-menopausalwomenThe Netherlands Cohort
55 - 69 783 By MailFFQ-Semi-quantitative
Case Cohort 62573.0 6.3 years Fermented skimmedmilk
g/day
Breast cancer 172.0vs.0.0
30.89(0.7, 1.14)
.22 A B C D E F G
incidence
4.4.2
Acrylamide
Post-menopausal
103

Author, Year,WCRF Code
Country, Ethnicity, Specialcharacteristics
Age Cases n Caseascertainment
Type of studyNon-Cases n
Lenght offollow-up / loss
Assessmentdetail
Additional details Unit Outcome Subgroup Contrast Nocat. OR (95% CI) p
valueptrend A B C D E F G
adjustments
Hogervorst, J.G. etal.,2007,BRE80145
Netherlands, PostmenopausalThe Netherlands CohortStudy on diet and cancer,
55 - 69 1350 Cancer registry FFQCase Cohort 1796.0 11.3 years / 0
Acrylamide, from fries,crisps, bread, crispyand rye bread, cookies,pastry, rusk, chocolate
mcg/day
Invasive breast cancer 36.8vs.9.5
50.93(0.73, 1.19)
0.79 A B C D E F G
incidence
Hogervorst, J.G. etal.,2007,BRE80145
Netherlands, PostmenopausalThe Netherlands CohortStudy on diet and cancer,
55 - 69 767 Cancer registry FFQCase Cohort 1796.0 11.3 years / 0
Acrylamide, from fries,crisps, bread, crispyand rye bread, cookies,pastry, rusk, chocolate
mcg/day
Invasive breast cancerneversmokers
36.8vs.9.5
51.1(0.8, 1.52)
0.55 A B C D E F G
incidence
Menopausal status not specified
Mucci, L.A.,2006,BRE23500
Sweden, Not specifiedWomen's Lifestyle andHealth Study
(39)
Through healthorg. (screening,healthinsurance)
FFQ-Semi-quantitative
ProspectiveCohort
43404.0 11.0 years mcg/day
Breast cancerhighestquintilevs.lowest
21.19(0.91, 1.55)
A B C E F G
incidence
4.4.2.1
Steaming, boiling, poaching
Post-menopausal
Stripp,C.,2003,BRE11883
Denmark, Not specified,Post-menopausalDiet, Cancer and Health,1993
50 - 64 424 By Mail FFQ (nos)ProspectiveCohort
23693 4.8 years boiled fish g/day
Breast cancerPost-menopausal
25.0(continuous)
11.09(0.85, 1.42)
A B C D E F G
incidence
Menopausal status not specified
Vatten, L.J.,1990,BRE12832
Norway, Not specified,Screening ProgramNorway National HealthScreening Service, 1974
35 - 51 152
Through healthorg. (screening,healthinsurance)
FFQ (nos)ProspectiveCohort
161013 12.0 years main meal containingpoaching fish
times/month
Breast cancer >=5vs.<2
30.7(0.4, 1.0)
0.06 A
incidence
4.4.2.3
Baking, roasting
Menopausal status not specified
Gertig,D.M.,1999,BRE03215
USA, Multi-ethnic,Registered nursesNurses' Health Study (NHS)Cohort 1976-1996
(58) 402
Through socialorganization(profession,religion)
FFQ-Semi-quantitative
Nested CaseControl
421 8.0 years roasted red meat months
Breast cancer >=1vs.<1
30.9(0.6, 1.4)
C D F G
incidence
4.4.2.5
Frying
Post-menopausal
Stripp,C.,2003,BRE11883
Denmark, Not specified,Post-menopausalDiet, Cancer and Health,1993
50 - 64 424 By Mail FFQ (nos)ProspectiveCohort
23693 4.8 years fried fish g/day
Breast cancerPost-menopausal
25.0(continuous)
11.09(0.95, 1.25)
A B C D E F G
incidence
Menopausal status not specified
104

Author, Year,WCRF Code
Country, Ethnicity, Specialcharacteristics
Age Cases n Caseascertainment
Type of studyNon-Cases n
Lenght offollow-up / loss
Assessmentdetail
Additional details Unit Outcome Subgroup Contrast Nocat. OR (95% CI) p
valueptrend A B C D E F G
adjustments
Knekt,P.,1994,BRE04899
Finland, Not specified,Screening ProgramFinland, 1966
15 - 99
Through healthorg. (screening,healthinsurance)
Dietary Historyquestionnaire
ProspectiveCohort
null 24.0 years fried meat
Breast cancer >1.0vs.>-1.0
31.8(1.03, 3.16)
A C D E G
incidence
Jarvinen,R.,1997,BRE04383
finlandFinland, 1966
15 - UnspecifiedDietary Historyquestionnaire
ProspectiveCohort
4697.0 24.0 years fried meat
Breast cancer Quantile 3vs.Quantile 1
21.8(1.03, 3.16)
A C D E G
incidence
Gertig,D.M.,1999,BRE03215
USA, Multi-ethnic,Registered nursesNurses' Health Study (NHS)Cohort 1976-1996
(58) 396
Through socialorganization(profession,religion)
FFQ-Semi-quantitative
Nested CaseControl
413 8.0 years pan-fried red meat week
Breast cancer >=1vs.never
31.0(0.6, 1.5)
C D F G
incidence
Gertig,D.M.,1999,BRE03215
USA, Multi-ethnic,Registered nursesNurses' Health Study (NHS)Cohort 1976-1996
(58) 396
Through socialorganization(profession,religion)
FFQ-Semi-quantitative
Nested CaseControl
413 8.0 years pan-fried red meat week
Breast cancer >=1vs.never
31.0(0.6, 1.5)
C D F G
incidence
FrazierL.A.,2003,BRE02941
USA, Multi-ethnic,Registered nursesNurses' Health Study (NHS)Cohort 1976-1996
40 - 65
Through healthorg. (screening,healthinsurance)
FFQ (nos)Nested CaseControl
121700.0 10.0 years adolescentOunces*year/day
Breast cancer4.0(continuous)
11.04(0.72, 1.49)
A C D E F G
incidence
Li, W.,2005,BRE23123China, AsianShanghai BSE
130
Through socialorganization(profession,religion)
FFQ-Semi-quantitative
Nested CaseControl
1070 fried foods times/year
Breast cancer >123.0vs.<33.0
50.8(0.4, 1.5)
0.69 E
incidence
4.4.2.6
Barbecued
Menopausal status not specified
Gertig,D.M.,1999,BRE03215
USA, Multi-ethnic,Registered nursesNurses' Health Study (NHS)Cohort 1976-1996
(58) 398
Through socialorganization(profession,religion)
FFQ-Semi-quantitative
Nested CaseControl
420 8.0 years barbecued red meat week
Breast cancer >=1vs.never
31.0(0.6, 1.7)
C D F G
incidence
Gertig,D.M.,1999,BRE03215
USA, Multi-ethnic,Registered nursesNurses' Health Study (NHS)Cohort 1976-1996
(58) 398
Through socialorganization(profession,religion)
FFQ-Semi-quantitative
Nested CaseControl
420 8.0 years barbecued red meat week
Breast cancer >=1vs.never
31.0(0.6, 1.7)
C D F G
incidence
Broiled
Menopausal status not specified
Gertig,D.M.,1999,BRE03215
USA, Multi-ethnic,Registered nursesNurses' Health Study (NHS)Cohort 1976-1996
(58) 399
Through socialorganization(profession,religion)
FFQ-Semi-quantitative
Nested CaseControl
415 8.0 years broiled red meat week
Breast cancer >=1vs.never
31.1(0.7, 1.8)
C D F G
incidence
GallicchioL.,2006,BRE80112
United States, With benignbreast diseaseBBD cohort-CLUE II, 1989
30
CLUE IIcohort/pathology report/self-reported
Questionnaire(nos)
ProspectiveCohort
426Ever consumed flame-broiled food
Invasive & In situ breastcancer Fast/interme
diateacetylator
Yesvs.No
22.62(1.06, 6.46)
A
incidence
105

Author, Year,WCRF Code
Country, Ethnicity, Specialcharacteristics
Age Cases n Caseascertainment
Type of studyNon-Cases n
Lenght offollow-up / loss
Assessmentdetail
Additional details Unit Outcome Subgroup Contrast Nocat. OR (95% CI) p
valueptrend A B C D E F G
adjustments
GallicchioL.,2006,BRE80112
United States, With benignbreast diseaseBBD cohort-CLUE II, 1989
30
CLUE IIcohort/pathology report/self-reported
Questionnaire(nos)
ProspectiveCohort
426Flame-broiled foodconsumption
times/week
Invasive & In situ breastcancer Fast/interme
diateacetylator
>=1vs.Never
32.7(0.92, 7.95)
0.06 A
incidence
GallicchioL.,2006,BRE80112
United States, With benignbreast diseaseBBD cohort-CLUE II, 1989
77
CLUE IIcohort/pathology report/self-reported
Questionnaire(nos)
ProspectiveCohort
1110Ever consumed flame-broiled food
Invasive & In situ breastcancer Yes
vs.No
21.31(0.79, 2.17)
A
incidence
GallicchioL.,2006,BRE80112
United States, With benignbreast diseaseBBD cohort-CLUE II, 1989
77
CLUE IIcohort/pathology report/self-reported
Questionnaire(nos)
ProspectiveCohort
1110Flame-broiled foodconsumption
times/week
Invasive & In situ breastcancer >=1
vs.Never
31.52(0.83, 2.8)
0.2 A
incidence
GallicchioL.,2006,BRE80112
United States, With benignbreast diseaseBBD cohort-CLUE II, 1989
42
CLUE IIcohort/pathology report/self-reported
Questionnaire(nos)
ProspectiveCohort
613Ever consumed flame-broiled food
Invasive & In situ breastcancer Slow
acetylator
Yesvs.No
20.75(0.39, 1.43)
A
incidence
GallicchioL.,2006,BRE80112
United States, With benignbreast diseaseBBD cohort-CLUE II, 1989
42
CLUE IIcohort/pathology report/self-reported
Questionnaire(nos)
ProspectiveCohort
613Flame-broiled foodconsumption
times/week
Invasive & In situ breastcancer Slow
acetylator
>=1vs.Never
30.89(0.4, 1.99)
A
incidence
Charred
Menopausal status not specified
Gertig,D.M.,1999,BRE03215
USA, Multi-ethnic,Registered nursesNurses' Health Study (NHS)Cohort 1976-1996
(58) 255
Through socialorganization(profession,religion)
FFQ-Semi-quantitative
Nested CaseControl
267 8.0 years Charred meat months
Breast cancer NAT2genotyperapid
>=1vs.0
41.2(0.6, 2.3)
C D F G
incidence
Gertig,D.M.,1999,BRE03215
USA, Multi-ethnic,Registered nursesNurses' Health Study (NHS)Cohort 1976-1996
(58) 255
Through socialorganization(profession,religion)
FFQ-Semi-quantitative
Nested CaseControl
267 8.0 years months
Breast cancer NAT2genotypeslow
>=1vs.<1
31.1(0.6, 2.0)
C D F G
incidence
Gertig,D.M.,1999,BRE03215
USA, Multi-ethnic,Registered nursesNurses' Health Study (NHS)Cohort 1976-1996
(58) 406
Through socialorganization(profession,religion)
FFQ-Semi-quantitative
Nested CaseControl
418 8.0 years charred red meat months
Breast cancer >=1vs.<1
31.0(0.7, 1.7)
C D F G
incidence
Gertig,D.M.,1999,BRE03215
USA, Multi-ethnic,Registered nursesNurses' Health Study (NHS)Cohort 1976-1996
(58) 406
Through socialorganization(profession,religion)
FFQ-Semi-quantitative
Nested CaseControl
418 8.0 years charred red meat months
Breast cancer >=1vs.<1
31.0(0.7, 1.7)
C D F G
incidence
Grilling (broiling) and barbecuing
Menopausal status not specified
Gertig,D.M.,1999,BRE03215
USA, Multi-ethnic,Registered nursesNurses' Health Study (NHS)Cohort 1976-1996
(58) 402
Through socialorganization(profession,religion)
FFQ-Semi-quantitative
Nested CaseControl
421 8.0 years roasted red meat months
Breast cancer >=1vs.<1
30.9(0.6, 1.4)
C D F G
incidence
5.1
Carbohydrate
106

Author, Year,WCRF Code
Country, Ethnicity, Specialcharacteristics
Age Cases n Caseascertainment
Type of studyNon-Cases n
Lenght offollow-up / loss
Assessmentdetail
Additional details Unit Outcome Subgroup Contrast Nocat. OR (95% CI) p
valueptrend A B C D E F G
adjustments
Pre-menopausal
Holmes, M.D.,2004,BRE04010
U.S.A., Not specified,Registered nursesNurses' Health Study (NHS)Cohort 1976-1996
30 - 55 852 By MailFFQ-Semi-quantitative
ProspectiveCohort
53891 18.0 years / 0,04 g/day
Breast cancerPre-menopausal
240.0vs.159.0
50.98(0.78, 1.23)
0.61 A C D E F G
incidence
Holmes, M.D.,2004,BRE04010
U.S.A., Not specified,Registered nursesNurses' Health Study (NHS)Cohort 1976-1996
30 - 55 527 By MailFFQ-Semi-quantitative
ProspectiveCohort
39403 18.0 years / 0,04 g/day
Breast cancer Pre-menopausal& Lean
240.0vs.159.0
51.2(0.89, 1.61)
0.37 A C D E F G
incidence
Holmes, M.D.,2004,BRE04010
U.S.A., Not specified,Registered nursesNurses' Health Study (NHS)Cohort 1976-1996
30 - 55 292 By MailFFQ-Semi-quantitative
ProspectiveCohort
25129 18.0 years / 0,04 g/day
Breast cancer Pre-menopausal&Overweight
240.0vs.159.0
50.72(0.48, 1.07)
0.04 A C D E F G
incidence
Post-menopausal
Holmes, M.D.,2004,BRE04010
U.S.A., Not specified,Registered nursesNurses' Health Study (NHS)Cohort 1976-1996
30 - 55 2924 By MailFFQ-Semi-quantitative
ProspectiveCohort
76200 18.0 years / 0,04 g/day
Breast cancerPost-menopausal
>1.0vs.>-1.0
50.96(0.84, 1.09)
0.82 A C D E F G
incidence
Holmes, M.D.,2004,BRE04010
U.S.A., Not specified,Registered nursesNurses' Health Study (NHS)Cohort 1976-1996
30 - 55 1343 By MailFFQ-Semi-quantitative
ProspectiveCohort
47051 18.0 years / 0,04 g/day
Breast cancer Post-menopausal& Lean
>1.0vs.>-1.0
50.95(0.78, 1.15)
0.65 A C D E F G
incidence
Holmes, M.D.,2004,BRE04010
U.S.A., Not specified,Registered nursesNurses' Health Study (NHS)Cohort 1976-1996
30 - 55 1344 By MailFFQ-Semi-quantitative
ProspectiveCohort
46111 18.0 years / 0,04 g/day
Breast cancer Post-menopausal&Overweight
>1.0vs.>-1.0
50.96(0.8, 1.17)
0.91 A C D E F G
incidence
Menopausal status not specified
Howe, G.R.,1991,BRE17622
canada, Multi-ethnic,Screening ProgramNBSS, 1980
40 - 59
Through healthorg. (screening,healthinsurance)
Dietary Historyquestionnaire
Nested CaseControl
56837.0 5.0 years for 693 cal/day cal/day
Breast cancer693.0(continuous)
10.72(0.52, 0.99)
A E G
incidence
Horn-Ross,P.L.,2002,BRE15412
USA, Multi-ethnic,Registered teachersCalifornia Teachers Study,1995
21 - 103 By Mail FFQ (nos)ProspectiveCohort
111383.0 2.0 years g/day
Invasive breast cancer <240.0vs.<128.0
50.8(0.5, 1.2)
0.8 A C D E F G
incidence
Carbohydrate/Protein
Menopausal status not specified
Horn-Ross,P.L.,2002,BRE15412
USA, Multi-ethnic,Registered teachersCalifornia Teachers Study,1995
21 - 103 By Mail FFQ (nos)ProspectiveCohort
111383.0 2.0 yearsInvasive breast cancer Quantile 5
vs.<2.5
51.0(0.8, 1.2)
1 A C D E F G
incidence
Total carbohydrate
Pre-menopausal
FrazierL.A.,2004,BRE02942
USA, Multi-ethnic,Registered nursesNurses' Health study II
34 - 51 361
Through healthorg. (screening,healthinsurance)
FFQ (nos)Historical Cohort 47517 9.0 years adolescent diet gm/day
Breast cancerPre-menopausal
359.1vs.263.3
51.21(0.89, 1.64)
0.59 A C D E F G
incidence
107

Author, Year,WCRF Code
Country, Ethnicity, Specialcharacteristics
Age Cases n Caseascertainment
Type of studyNon-Cases n
Lenght offollow-up / loss
Assessmentdetail
Additional details Unit Outcome Subgroup Contrast Nocat. OR (95% CI) p
valueptrend A B C D E F G
adjustments
Post-menopausal
Kushi L.H.,1992,BRE05141
US, Multi-ethnic, Post-menopausalIowa Women's Health Study
55 - 69 459 By MailFFQ-Semi-quantitative
ProspectiveCohort
130443 4.0 years / 1086 g/day
Breast cancerPost-menopausal
252.7vs.181.0
41.16(0.72, 1.86)
0.51 A C D E F G
incidence
Barrett-Connor,E.,1993,BRE00581
U.S, WhiteRancho Bernardo, 1972
40 - 79 15
Through socialorganization(profession,religion)
24h RecallProspectiveCohort
575 15.0 years g/day
Breast cancerPost-menopausal
66.0(continuous)
11.93(1.18, 3.16)
A C D E
incidence
Sieri,Sabina,2002,BRE20941
Italy, Not specified, Post-menopausalORDET study, 1987
41 - 70 56Throughnetwork, paper,tv
FFQ-Semi-quantitative
Nested CaseControl
214 5.5 years g/day
Breast cancerPost-menopausal
217.6 -303.4vs.<190.2
30.42(0.18, 0.95)
0.040
B C E G
incidence
Byrne,C.,2002,BRE01315
U.S, Multi-ethnic, Post-menopausalNurses' Health Study (NHS)Cohort 1976-1996
(57) 1071 By MailFFQ-Semi-quantitative
ProspectiveCohort
44697 14.0 years g/day
Invasive breast cancerPost-menopausal
Quantile 5vs.Quantile 1
50.88(0.72, 1.09)
0.53 A C D E F G
incidence
Nielsen, T.G.,2005,BRE23581
Denmark, Post-menopausalDiet, Cancer and Health,1993
50 - 65 By Mail FFQ (nos)ProspectiveCohort
23870.0 6.6 years g/day
Breast cancerPost-menopausal
50.0(continuous)
11.06(0.97, 1.16)
0.99 B C D E F
incidence
Nielsen, T.G.,2005,BRE23581
Denmark, Post-menopausalDiet, Cancer and Health,1993
50 - 65 By Mail FFQ (nos)ProspectiveCohort
23870.0 6.6 years g/day
Breast cancer ER+Post-menopausal
50.0(continuous)
11.02(0.92, 1.14)
0.99 B C D E F
incidence
Nielsen, T.G.,2005,BRE23581
Denmark, Post-menopausalDiet, Cancer and Health,1993
50 - 65 By Mail FFQ (nos)ProspectiveCohort
23870.0 6.6 years g/day
Breast cancer ER-Post-menopausal
50.0(continuous)
11.09(0.89, 1.34)
0.99 B C D E F
incidence
Giles, G.G.,2006,BRE22430
Australia, Post-menopausalMCCS, 1990
40 - 69 Unspecified FFQ (nos)ProspectiveCohort
12273.0 9.1 years sd/day
Breast cancerPost-menopausal
1.0(continuous)
11.31(0.98, 1.75)
A E F G
incidence
Giles, G.G.,2006,BRE22430
Australia, Post-menopausalMCCS, 1990
40 - 69 Unspecified FFQ (nos)ProspectiveCohort
12273.0 9.1 years sd/day
Breast cancer ER+/PR+Post-menopausal
1.0(continuous)
11.38(0.91, 2.09)
A E F G
incidence
Giles, G.G.,2006,BRE22430
Australia, Post-menopausalMCCS, 1990
40 - 69 Unspecified FFQ (nos)ProspectiveCohort
12273.0 9.1 years sd/day
Breast cancer ER+/PR-Post-menopausal
1.0(continuous)
11.91(0.75, 4.86)
A E F G
incidence
Giles, G.G.,2006,BRE22430
Australia, Post-menopausalMCCS, 1990
40 - 69 Unspecified FFQ (nos)ProspectiveCohort
12273.0 9.1 years sd/day
Breast cancer ER-/PR-Post-menopausal
1.0(continuous)
10.88(0.45, 1.71)
A E F G
incidence
Menopausal status not specified
Giovannucci,E.,1993,BRE03262
US, Not specified,Registered nursesNurses' Health Study (NHS)Cohort 1976-1996
30 - 55 392 By MailFFQ-Semi-quantitative
Nested CaseControl
786 2.0 years g/day
Breast cancer Quantile 5vs.Quantile 1
50.81(0.55, 1.2)
0.63 A E
incidence
108

Author, Year,WCRF Code
Country, Ethnicity, Specialcharacteristics
Age Cases n Caseascertainment
Type of studyNon-Cases n
Lenght offollow-up / loss
Assessmentdetail
Additional details Unit Outcome Subgroup Contrast Nocat. OR (95% CI) p
valueptrend A B C D E F G
adjustments
Kushi, L.H.,1995,BRE05142
US, Multi-ethnicIowa Women's Health Study
55 - 69 262 By MailFFQ-Semi-quantitative
ProspectiveCohort
34388.0 6.0 years g/day
Breast cancer ER+/PR+ >225.0vs.<197.0
30.79(0.6, 0.79)
0.07 A E
incidence
Kushi, L.H.,1995,BRE05142
US, Multi-ethnicIowa Women's Health Study
55 - 69 75 By MailFFQ-Semi-quantitative
ProspectiveCohort
34388.0 6.0 years g/day
Breast cancer ER+/PR- >225.0vs.<197.0
30.78(0.44, 1.39)
0.42 A E
incidence
Kushi, L.H.,1995,BRE05142
US, Multi-ethnicIowa Women's Health Study
55 - 69 14 By MailFFQ-Semi-quantitative
ProspectiveCohort
34388.0 6.0 years g/day
Breast cancer ER-/PR+ >225.0vs.<197.0
33.82(0.76, 19.19)
0.10 A E
incidence
Kushi, L.H.,1995,BRE05142
US, Multi-ethnicIowa Women's Health Study
55 - 69 61 By MailFFQ-Semi-quantitative
ProspectiveCohort
34388.0 6.0 years g/day
Breast cancer ER-/PR- >225.0vs.<197.0
30.6(0.31, 1.14)
0.12 A E
incidence
Navarro SilveraS.A.,2004,BRE24119
Canada, Not specified,Screening ProgramCanadian National BreastScreening Study
40 - 59 1450
Through healthorg. (screening,healthinsurance)
FFQ (nos)ProspectiveCohort
811649 16.6 years g/day
Breast cancer >249.1vs.<143.0
50.93(0.7, 1.22)
0.86 A C D E F G
incidence
5.1.2
Cellulose
Menopausal status not specified
Terry,P.,2002,BRE12199
Canada, Not specifiedCanadian National BreastScreening Study
40 - 59Hospital/ambulatory DirectContact
FFQ (nos)ProspectiveCohort
89835.0 16.2 years g/day
Invasive & In situ breastcancer >6.9
vs.<3.2
50.97(0.83, 1.14)
0.64 A B C D E F G
incidence
Crude fibre
Menopausal status not specified
Li, W.,2005,BRE23123China, AsianShanghai BSE
130
Through socialorganization(profession,religion)
FFQ-Semi-quantitative
Nested CaseControl
1070 g/day
Breast cancer >11.82vs.<7.58
51.3(0.5, 3.3)
0.69 A
incidence
Dietary fibre
Pre-menopausal
Willett, W.C.,1992,BRE13438
U.S, Not specified,Registered nursesNurses' Health Study (NHS)Cohort 1976-1996
30 - 55 527 By MailFFQ-Semi-quantitative
ProspectiveCohort
89494.0 8.0 yearsBreast cancer
Pre-menopausal
Quantile 5vs.Quantile 1
51.06(0.78, 1.45)
0.95 A C D E F G
incidence
Cho, E.,2003,BRE01651
U.S, Multi-ethnic, RegisterednursesNurses' Health study II
26 - 46 714 By MailFFQ-Semi-quantitative
ProspectiveCohort
90655 8.0 years g/day
Breast cancerPre-menopausal
24.8vs.12.5
50.88(0.67, 1.14)
0.60 C D E F G
incidence
109

Author, Year,WCRF Code
Country, Ethnicity, Specialcharacteristics
Age Cases n Caseascertainment
Type of studyNon-Cases n
Lenght offollow-up / loss
Assessmentdetail
Additional details Unit Outcome Subgroup Contrast Nocat. OR (95% CI) p
valueptrend A B C D E F G
adjustments
FrazierL.A.,2004,BRE02942
USA, Multi-ethnic,Registered nursesNurses' Health study II
34 - 51 361
Through healthorg. (screening,healthinsurance)
FFQ (nos)Historical Cohort 47517 9.0 years total fiber adolescentdiet
gm/day
Breast cancerPre-menopausal
27.5vs.15.1
50.81(0.58, 1.13)
0.11 A C D E F G
incidence
Holmes, M.D.,2004,BRE04010
U.S.A., Not specified,Registered nursesNurses' Health Study (NHS)Cohort 1976-1996
30 - 55 852 By MailFFQ-Semi-quantitative
ProspectiveCohort
53891 18.0 years / 0,04 g/day
Breast cancerPre-menopausal
24.8vs.12.1
50.99(0.75, 1.29)
0.79 A C D E F G
incidence
Holmes, M.D.,2004,BRE04010
U.S.A., Not specified,Registered nursesNurses' Health Study (NHS)Cohort 1976-1996
30 - 55 527 By MailFFQ-Semi-quantitative
ProspectiveCohort
39403 18.0 years / 0,04 g/day
Breast cancer Pre-menopausal& Lean
24.8vs.12.1
51.1(0.78, 1.54)
0.62 A C D E F G
incidence
Holmes, M.D.,2004,BRE04010
U.S.A., Not specified,Registered nursesNurses' Health Study (NHS)Cohort 1976-1996
30 - 55 292 By MailFFQ-Semi-quantitative
ProspectiveCohort
25129 18.0 years / 0,04 g/day
Breast cancer Pre-menopausal&Overweight
24.8vs.12.1
50.85(0.51, 1.42)
0.94 A C D E F G
incidence
Post-menopausal
Kushi L.H.,1992,BRE05141
US, Multi-ethnic, Post-menopausalIowa Women's Health Study
55 - 69 459 By MailFFQ-Semi-quantitative
ProspectiveCohort
130443 4.0 years / 1086 g/day
Breast cancerPost-menopausal
27.0vs.14.1
40.99(0.69, 1.41)
0.79 A C D E F G
incidence
Willett, W.C.,1992,BRE13438
U.S, Not specified,Registered nursesNurses' Health Study (NHS)Cohort 1976-1996
30 - 55 774 By MailFFQ-Semi-quantitative
ProspectiveCohort
89494.0 8.0 yearsBreast cancer
Post-menopausal
Quantile 5vs.Quantile 1
50.96(0.75, 1.25)
0.98 A C D E F G
incidence
Graham,S.,1992,BRE03424
USA, White, Post-menopausalNew York State Cohort,1980
50 - 107 344 By Mail FFQ (nos)ProspectiveCohort
17401 8.0 years g/month
Breast cancerPost-menopausal
982.0 -5184.0vs.88.0 - 478.0
51.07(0.76, 1.51)
A B
incidence
Holmes, M.D.,2004,BRE04010
U.S.A., Not specified,Registered nursesNurses' Health Study (NHS)Cohort 1976-1996
30 - 55 2924 By MailFFQ-Semi-quantitative
ProspectiveCohort
76200 18.0 years / 0,04 g/day
Breast cancerPost-menopausal
>1.0vs.>-1.0
50.96(0.83, 1.1)
0.35 A C D E F G
incidence
Holmes, M.D.,2004,BRE04010
U.S.A., Not specified,Registered nursesNurses' Health Study (NHS)Cohort 1976-1996
30 - 55 1343 By MailFFQ-Semi-quantitative
ProspectiveCohort
47051 18.0 years / 0,04 g/day
Breast cancer Post-menopausal& Lean
>1.0vs.>-1.0
51.04(0.84, 1.27)
0.83 A C D E F G
incidence
Holmes, M.D.,2004,BRE04010
U.S.A., Not specified,Registered nursesNurses' Health Study (NHS)Cohort 1976-1996
30 - 55 1344 By MailFFQ-Semi-quantitative
ProspectiveCohort
46111 18.0 years / 0,04 g/day
Breast cancer Post-menopausal&Overweight
>1.0vs.>-1.0
50.85(0.69, 1.05)
0.11 A C D E F G
incidence
Mattisson,I.,2004,BRE16042
Sweden, Not specified, Post-menopausalMalmo Diet and Cancer,1991
50 - 342Multipleprocedure
7-day Record +Questionnaire
ProspectiveCohort
11726 11.0 years g/day
Invasive & In situ breastcancer Post-
menopausal
25.9vs.12.5
50.58(0.4, 0.84)
0.056
A B C D E F G
incidence
Giles, G.G.,2006,BRE22430
Australia, Post-menopausalMCCS, 1990
40 - 69 Unspecified FFQ (nos)ProspectiveCohort
12273.0 9.1 years sd/day
Breast cancerPost-menopausal
1.0(continuous)
11.08(0.92, 1.26)
A E F G
incidence
110

Author, Year,WCRF Code
Country, Ethnicity, Specialcharacteristics
Age Cases n Caseascertainment
Type of studyNon-Cases n
Lenght offollow-up / loss
Assessmentdetail
Additional details Unit Outcome Subgroup Contrast Nocat. OR (95% CI) p
valueptrend A B C D E F G
adjustments
Giles, G.G.,2006,BRE22430
Australia, Post-menopausalMCCS, 1990
40 - 69 Unspecified FFQ (nos)ProspectiveCohort
12273.0 9.1 years sd/day
Breast cancer ER+/PR+Post-menopausal
1.0(continuous)
11.36(1.1, 1.67)
A E F G
incidence
Giles, G.G.,2006,BRE22430
Australia, Post-menopausalMCCS, 1990
40 - 69 Unspecified FFQ (nos)ProspectiveCohort
12273.0 9.1 years sd/day
Breast cancer ER+/PR-Post-menopausal
1.0(continuous)
11.01(0.61, 1.69)
A E F G
incidence
Giles, G.G.,2006,BRE22430
Australia, Post-menopausalMCCS, 1990
40 - 69 Unspecified FFQ (nos)ProspectiveCohort
12273.0 9.1 years sd/day
Breast cancer ER-/PR-Post-menopausal
1.0(continuous)
10.65(0.43, 0.99)
A E F G
incidence
Suzuki, R. etal.,2008,BRE80148
Sweden, Post menopausalThe Swedish MammographyCohort, 1987
(60) 716 Cancer registry FFQProspectiveCohort
51823.0 8.3 years Total dietary fibre g/day
Breast cancer ER+/PR+ >26.7vs.<18.4
50.85(0.64, 1.13)
0.35 A B C D E F G
incidence
Suzuki, R. etal.,2008,BRE80148
Sweden, Post menopausalThe Swedish MammographyCohort, 1987
(60) 609 Cancer registry FFQProspectiveCohort
51823.0 8.3 years Total dietary fibre
Breast cancer ER+/PR+ FamilyHistory BC -No
Quantile 4vs.Quantile 1
40.85(0.64, 1.11)
0.25 A B C D E F
incidence
Suzuki, R. etal.,2008,BRE80148
Sweden, Post menopausalThe Swedish MammographyCohort, 1987
(60) 107 Cancer registry FFQProspectiveCohort
51823.0 8.3 years Total dietary fibre
Breast cancer ER+/PR+ FamilyHistory BC -Yes
Quantile 4vs.Quantile 1
41.33(0.68, 2.59)
0.32 A B C D E F
incidence
Suzuki, R. etal.,2008,BRE80148
Sweden, Post menopausalThe Swedish MammographyCohort, 1987
(60) 171 Cancer registry FFQProspectiveCohort
51823.0 8.3 years Total dietary fibre
Breast cancer ER+/PR+High alcoholintake
Quantile 4vs.Quantile 1
40.81(0.47, 1.39)
0.26 A B C D E F
incidence
Suzuki, R. etal.,2008,BRE80148
Sweden, Post menopausalThe Swedish MammographyCohort, 1987
(60) 545 Cancer registry FFQProspectiveCohort
51823.0 8.3 years Total dietary fibre
Breast cancer ER+/PR+Low alcoholintake
Quantile 4vs.Quantile 1
40.91(0.68, 1.2)
0.67 A B C D E F
incidence
Suzuki, R. etal.,2008,BRE80148
Sweden, Post menopausalThe Swedish MammographyCohort, 1987
(60) 243 Cancer registry FFQProspectiveCohort
51823.0 8.3 years Total dietary fibre
Breast cancer ER+/PR+PMH - everusers
Quantile 4vs.Quantile 1
40.5(0.31, 0.8)
0.001
A B C D E F
incidence
Suzuki, R. etal.,2008,BRE80148
Sweden, Post menopausalThe Swedish MammographyCohort, 1987
(60) 299 Cancer registry FFQProspectiveCohort
51823.0 8.3 years Total dietary fibre
Breast cancer ER+/PR+PMH - neverusers
Quantile 4vs.Quantile 1
41.1(0.75, 1.6)
0.46 A B C D E F
incidence
Suzuki, R. etal.,2008,BRE80148
Sweden, Post menopausalThe Swedish MammographyCohort, 1987
(60) 279 Cancer registry FFQProspectiveCohort
51823.0 8.3 years Total dietary fibre g/day
Breast cancer ER+/PR- >26.7vs.<18.4
50.83(0.52, 1.31)
0.25 A B C D E F G
incidence
Suzuki, R. etal.,2008,BRE80148
Sweden, Post menopausalThe Swedish MammographyCohort, 1987
(60) 250 Cancer registry FFQProspectiveCohort
51823.0 8.3 years Total dietary fibre
Breast cancer ER+/PR- FamilyHistory BC -No
Quantile 4vs.Quantile 1
40.83(0.54, 1.28)
0.28 A B C D E F
incidence
Suzuki, R. etal.,2008,BRE80148
Sweden, Post menopausalThe Swedish MammographyCohort, 1987
(60) 29 Cancer registry FFQProspectiveCohort
51823.0 8.3 years Total dietary fibre
Breast cancer ER+/PR- FamilyHistory BC -Yes
Quantile 4vs.Quantile 1
41.13(0.29, 4.45)
0.88 A B C D E F
incidence
111

Author, Year,WCRF Code
Country, Ethnicity, Specialcharacteristics
Age Cases n Caseascertainment
Type of studyNon-Cases n
Lenght offollow-up / loss
Assessmentdetail
Additional details Unit Outcome Subgroup Contrast Nocat. OR (95% CI) p
valueptrend A B C D E F G
adjustments
Suzuki, R. etal.,2008,BRE80148
Sweden, Post menopausalThe Swedish MammographyCohort, 1987
(60) 91 Cancer registry FFQProspectiveCohort
51823.0 8.3 years Total dietary fibre
Breast cancer ER+/PR-High alcoholintake
Quantile 4vs.Quantile 1
40.71(0.33, 1.51)
0.093
A B C D E F
incidence
Suzuki, R. etal.,2008,BRE80148
Sweden, Post menopausalThe Swedish MammographyCohort, 1987
(60) 188 Cancer registry FFQProspectiveCohort
51823.0 8.3 years Total dietary fibre
Breast cancer ER+/PR-Low alcoholintake
Quantile 4vs.Quantile 1
40.78(0.48, 1.26)
0.4 A B C D E F
incidence
Suzuki, R. etal.,2008,BRE80148
Sweden, Post menopausalThe Swedish MammographyCohort, 1987
(60) 123 Cancer registry FFQProspectiveCohort
51823.0 8.3 years Total dietary fibre
Breast cancer ER+/PR-PMH - everusers
Quantile 4vs.Quantile 1
40.64(0.34, 1.22)
0.08 A B C D E F
incidence
Suzuki, R. etal.,2008,BRE80148
Sweden, Post menopausalThe Swedish MammographyCohort, 1987
(60) 102 Cancer registry FFQProspectiveCohort
51823.0 8.3 years Total dietary fibre
Breast cancer ER+/PR-PMH - neverusers
Quantile 4vs.Quantile 1
40.73(0.36, 1.47)
0.44 A B C D E F
incidence
Suzuki, R. etal.,2008,BRE80148
Sweden, Post menopausalThe Swedish MammographyCohort, 1987
(60) 143 Cancer registry FFQProspectiveCohort
51823.0 8.3 years Total dietary fibre g/day
Breast cancer ER-/PR- >26.7vs.<18.4
50.94(0.49, 1.8)
0.38 A B C D E F G
incidence
Suzuki, R. etal.,2008,BRE80148
Sweden, Post menopausalThe Swedish MammographyCohort, 1987
(60) 122 Cancer registry FFQProspectiveCohort
51823.0 8.3 years Total dietary fibre
Breast cancer ER-/PR- FamilyHistory BC -No
Quantile 4vs.Quantile 1
40.89(0.49, 1.62)
0.45 A B C D E F
incidence
Suzuki, R. etal.,2008,BRE80148
Sweden, Post menopausalThe Swedish MammographyCohort, 1987
(60) 21 Cancer registry FFQProspectiveCohort
51823.0 8.3 years Total dietary fibre
Breast cancer ER-/PR- FamilyHistory BC -Yes
Quantile 4vs.Quantile 1
42.42(0.36, 16.3)
0.98 A B C D E F
incidence
Suzuki, R. etal.,2008,BRE80148
Sweden, Post menopausalThe Swedish MammographyCohort, 1987
(60) 34 Cancer registry FFQProspectiveCohort
51823.0 8.3 years Total dietary fibre
Breast cancer ER-/PR-High alcoholintake
Quantile 4vs.Quantile 1
40.93(0.27, 3.22)
0.73 A B C D E F
incidence
Suzuki, R. etal.,2008,BRE80148
Sweden, Post menopausalThe Swedish MammographyCohort, 1987
(60) 109 Cancer registry FFQProspectiveCohort
51823.0 8.3 years Total dietary fibre
Breast cancer ER-/PR-Low alcoholintake
Quantile 4vs.Quantile 1
40.97(0.51, 1.85)
0.57 A B C D E F
incidence
Suzuki, R. etal.,2008,BRE80148
Sweden, Post menopausalThe Swedish MammographyCohort, 1987
(60) 34 Cancer registry FFQProspectiveCohort
51823.0 8.3 years Total dietary fibre
Breast cancer ER-/PR-PMH - everusers
Quantile 4vs.Quantile 1
40.34(0.09, 1.26)
0.039
A B C D E F
incidence
Suzuki, R. etal.,2008,BRE80148
Sweden, Post menopausalThe Swedish MammographyCohort, 1987
(60) 66 Cancer registry FFQProspectiveCohort
51823.0 8.3 years Total dietary fibre
Breast cancer ER-/PR-PMH - neverusers
Quantile 4vs.Quantile 1
41.15(0.51, 2.58)
0.96 A B C D E F
incidence
Suzuki, R. etal.,2008,BRE80148
Sweden, Post menopausalThe Swedish MammographyCohort, 1987
(60) 1248 Cancer registry FFQProspectiveCohort
51823.0 8.3 years Total dietary fibre g/day
Invasive breast cancer >26.7vs.<18.4
50.85(0.69, 1.05)
0.09 A B C D E F G
incidence
Suzuki, R. etal.,2008,BRE80148
Sweden, Post menopausalThe Swedish MammographyCohort, 1987
(60) 1109 Cancer registry FFQProspectiveCohort
51823.0 8.3 years Total dietary fibre
Invasive breast cancer FamilyHistory BC -No
Quantile 4vs.Quantile 1
40.83(0.68, 1.01)
0.053
A B C D E F
incidence
112

Author, Year,WCRF Code
Country, Ethnicity, Specialcharacteristics
Age Cases n Caseascertainment
Type of studyNon-Cases n
Lenght offollow-up / loss
Assessmentdetail
Additional details Unit Outcome Subgroup Contrast Nocat. OR (95% CI) p
valueptrend A B C D E F G
adjustments
Suzuki, R. etal.,2008,BRE80148
Sweden, Post menopausalThe Swedish MammographyCohort, 1987
(60) 175 Cancer registry FFQProspectiveCohort
51823.0 8.3 years Total dietary fibre
Invasive breast cancer FamilyHistory BC -Yes
Quantile 4vs.Quantile 1
41.31(0.75, 2.27)
0.52 A B C D E F
incidence
Suzuki, R. etal.,2008,BRE80148
Sweden, Post menopausalThe Swedish MammographyCohort, 1987
(60) 319 Cancer registry FFQProspectiveCohort
51823.0 8.3 years Total dietary fibre
Invasive breast cancerHigh alcoholintake
Quantile 4vs.Quantile 1
40.76(0.51, 1.14)
0.045
A B C D E F
incidence
Suzuki, R. etal.,2008,BRE80148
Sweden, Post menopausalThe Swedish MammographyCohort, 1987
(60) 965 Cancer registry FFQProspectiveCohort
51823.0 8.3 years Total dietary fibre
Invasive breast cancerLow alcoholintake
Quantile 4vs.Quantile 1
40.86(0.69, 1.06)
0.23 A B C D E F
incidence
Suzuki, R. etal.,2008,BRE80148
Sweden, Post menopausalThe Swedish MammographyCohort, 1987
(60) 446 Cancer registry FFQProspectiveCohort
51823.0 8.3 years Total dietary fibre
Invasive breast cancerPMH - everusers
Quantile 4vs.Quantile 1
40.5(0.36, 0.71)
<0.0001
A B C D E F
incidence
Suzuki, R. etal.,2008,BRE80148
Sweden, Post menopausalThe Swedish MammographyCohort, 1987
(60) 528 Cancer registry FFQProspectiveCohort
51823.0 8.3 years Total dietary fibre
Invasive breast cancerPMH - neverusers
Quantile 4vs.Quantile 1
40.99(0.74, 1.32)
0.87 A B C D E F
incidence
Menopausal status not specified
Willett, W.C.,1992,BRE13438
U.S, Not specified,Registered nursesNurses' Health Study (NHS)Cohort 1976-1996
30 - 55 1439 By MailFFQ-Semi-quantitative
ProspectiveCohort
692679 8.0 years g/day
Breast cancer >22.0vs.<11.9
51.02(0.85, 1.23)
0.62 A C D E F G
incidence
Giovannucci,E.,1993,BRE03262
US, Not specified,Registered nursesNurses' Health Study (NHS)Cohort 1976-1996
30 - 55 392 By MailFFQ-Semi-quantitative
Nested CaseControl
786 2.0 years g/day
Breast cancer Quantile 5vs.Quantile 1
50.62(0.41, 0.93)
0.38 A
incidence
Rohan, T.E.,1993,BRE17965
Canada, Not specified,Screening ProgramCanadian National BreastScreening Study
40 - 59
Through healthorg. (screening,healthinsurance)
Dietary Historyquestionnaire
Nested CaseControl
56837.0 6.0 years g/day
Breast cancer12.0(continuous)
10.85(0.7, 1.04)
A B C E F G
incidence
Kushi, L.H.,1995,BRE05142
US, Multi-ethnicIowa Women's Health Study
55 - 69 339 By MailFFQ-Semi-quantitative
ProspectiveCohort
34388.0 6.0 years mg/day
Breast cancer ER+/PR+ >21.8vs.<16.9
30.92(0.7, 1.2)
0.45 A E
incidence
Kushi, L.H.,1995,BRE05142
US, Multi-ethnicIowa Women's Health Study
55 - 69 75 By MailFFQ-Semi-quantitative
ProspectiveCohort
34388.0 6.0 years mg/day
Breast cancer ER+/PR- >21.8vs.<16.0
31.24(0.71, 2.17)
0.45 A E
incidence
Kushi, L.H.,1995,BRE05142
US, Multi-ethnicIowa Women's Health Study
55 - 69 14 By MailFFQ-Semi-quantitative
ProspectiveCohort
34388.0 6.0 years mg/day
Breast cancer ER-/PR+ >21.8vs.<16.0
31.48(0.33, 6.66)
0.81 A E
incidence
Kushi, L.H.,1995,BRE05142
US, Multi-ethnicIowa Women's Health Study
55 - 69 61 By MailFFQ-Semi-quantitative
ProspectiveCohort
34388.0 6.0 years mg/day
Breast cancer ER-/PR- >21.8vs.<16.0
30.98(0.52, 1.84)
0.98 A E
incidence
113

Author, Year,WCRF Code
Country, Ethnicity, Specialcharacteristics
Age Cases n Caseascertainment
Type of studyNon-Cases n
Lenght offollow-up / loss
Assessmentdetail
Additional details Unit Outcome Subgroup Contrast Nocat. OR (95% CI) p
valueptrend A B C D E F G
adjustments
Verhoeven, D.T.,1997,BRE12868
the Netherland, Not specifiedThe Netherlands CohortStudy on diet and cancer,1986-1993
55 - 69 519Throughnetwork, paper,tv
FFQ-Semi-quantitative
Case Cohort 58664.3 years / nolost g/day
Invasive breast cancer 34.5vs.16.9
50.83(0.56, 1.24)
0.16 A C E F G
incidence
Terry,P.,2002,BRE12199
Canada, Not specifiedCanadian National BreastScreening Study
40 - 59Hospital/ambulatory DirectContact
FFQ (nos)ProspectiveCohort
89835.0 16.2 years g/day
Invasive & In situ breastcancer >25.8
vs.<15.1
50.92(0.78, 1.09)
0.16 A B C D E F G
incidence
Horn-Ross,P.L.,2002,BRE15412
USA, Multi-ethnic,Registered teachersCalifornia Teachers Study,1995
21 - 103 By Mail FFQ (nos)ProspectiveCohort
111383.0 2.0 years g/day
Invasive breast cancer <19.0vs.<9.0
50.9(0.7, 1.2)
0.3 A C D E F G
incidence
FrazierL.A.,2003,BRE02941
USA, Multi-ethnic,Registered nursesNurses' Health Study (NHS)Cohort 1976-1996
40 - 65
Through healthorg. (screening,healthinsurance)
FFQ (nos)Nested CaseControl
121700.0 10.0 years adolescent g/day
Breast cancer 14.3vs.5.6
50.78(null, null)
0.09 A C D E F G
incidence
Fibre
Post-menopausal
Sonestedt, E. etal.,2007,BRE80147
SwedenMalmo Diet and Cancer,1991
45 - 73 152 Cancer registrydiet historyquestionnaire
ProspectiveCohort
11726.0 9.5 years Dietary fibre intake g/day
Breast cancerPost-meno &BMI >=27
25.9vs.12.5
51.23(0.74, 2.05)
0.37 A G
incidence
Sonestedt, E. etal.,2007,BRE80147
SwedenMalmo Diet and Cancer,1991
45 - 73 276 Cancer registrydiet historyquestionnaire
ProspectiveCohort
11726.0 9.5 years Dietary fibre intake g/day
Breast cancerPost-meno &BMI<27
25.9vs.12.5
50.57(0.38, 0.85)
0.13 A G
incidence
Sonestedt, E. etal.,2007,BRE80147
SwedenMalmo Diet and Cancer,1991
45 - 73 124 Cancer registrydiet historyquestionnaire
ProspectiveCohort
11726.0 9.5 years Dietary fibre intake g/day
Breast cancer Post-meno,dietarychange
25.9vs.12.5
51.26(0.63, 2.55)
0.54 A E G
incidence
Sonestedt, E. etal.,2007,BRE80147
SwedenMalmo Diet and Cancer,1991
45 - 73 304 Cancer registrydiet historyquestionnaire
ProspectiveCohort
11726.0 9.5 years Dietary fibre intake g/day
Breast cancer Post-meno,no dietarychange
25.9vs.12.5
50.63(0.43, 0.93)
0.45 A E G
incidence
Sonestedt, E. etal.,2007,BRE80147
SwedenMalmo Diet and Cancer,1991
45 - 73 428 Cancer registrydiet historyquestionnaire
ProspectiveCohort
11726.0 9.5 years Dietary fibre intake g/day
Breast cancerPost-menopausal
25.9vs.12.5
50.77(0.57, 1.05)
0.51 A E G
incidence
Insoluble fibre (englyst method)
Pre-menopausal
Cho, E.,2003,BRE01651
U.S, Multi-ethnic, RegisterednursesNurses' Health study II
26 - 46 714 By MailFFQ-Semi-quantitative
ProspectiveCohort
90655 8.0 years g/day
Breast cancerPre-menopausal
19.0vs.9.5
50.81(0.62, 1.07)
0.14 C D E F G
incidence
Menopausal status not specified
Terry,P.,2002,BRE12199
Canada, Not specifiedCanadian National BreastScreening Study
40 - 59Hospital/ambulatory DirectContact
FFQ (nos)ProspectiveCohort
89835.0 16.2 years g/day
Invasive & In situ breastcancer >5.5
vs.<2.7
50.89(0.76, 1.03)
0.13 A B C D E F G
incidence
114

Author, Year,WCRF Code
Country, Ethnicity, Specialcharacteristics
Age Cases n Caseascertainment
Type of studyNon-Cases n
Lenght offollow-up / loss
Assessmentdetail
Additional details Unit Outcome Subgroup Contrast Nocat. OR (95% CI) p
valueptrend A B C D E F G
adjustments
Lignin
Menopausal status not specified
Terry,P.,2002,BRE12199
Canada, Not specifiedCanadian National BreastScreening Study
40 - 59Hospital/ambulatory DirectContact
FFQ (nos)ProspectiveCohort
89835.0 16.2 years g/day
Invasive & In situ breastcancer >2.1
vs.<0.9
50.89(0.76, 1.03)
0.06 A B C D E F G
incidence
Non-starch polysaccharides/dietary fibre
Post-menopausal
Sieri,Sabina,2002,BRE20941
Italy, Not specified, Post-menopausalORDET study, 1987
41 - 70 56Throughnetwork, paper,tv
FFQ-Semi-quantitative
Nested CaseControl
214 5.5 years g/day
Breast cancerPost-menopausal
20.1 - 37.4vs.<16.6
30.73(0.33, 1.59)
0.452
B C E G
incidence
Soluble fibre
Pre-menopausal
Cho, E.,2003,BRE01651
U.S, Multi-ethnic, RegisterednursesNurses' Health study II
26 - 46 714 By MailFFQ-Semi-quantitative
ProspectiveCohort
90655 8.0 years g/day
Breast cancerPre-menopausal
7.4vs.3.8
50.87(0.67, 1.13)
0.50 C D E F G
incidence
Menopausal status not specified
Terry,P.,2002,BRE12199
Canada, Not specifiedCanadian National BreastScreening Study
40 - 59Hospital/ambulatory DirectContact
FFQ (nos)ProspectiveCohort
89835.0 16.2 years g/day
Invasive & In situ breastcancer >7.8
vs.<4.5
50.9(0.75, 1.08)
0.23 A B C D E F G
incidence
Total fibre
Pre-menopausal
Cade etal.,2007,BRE20021
UKUK Women's Cohort Study(UKWCS), 1993
35 - 69 232NHS CentralRegistry
FFQProspectiveCohort
14261 7.5 yearsTotal dietary fibre,Englyst fibre from allfoods in FFQ
g/day
Breast cancerpremenopausal women
>30.0vs.<19.9
50.48(0.24, 0.96)
0.01 A C D E F G
incidence
Post-menopausal
Cade etal.,2007,BRE20021
UKUK Women's Cohort Study(UKWCS), 1993
35 - 69 286NHS CentralRegistry
FFQProspectiveCohort
15067 7.5 yearsTotal dietary fibre,Englyst fibre from allfoods in FFQ
g/day
Breast cancerpostmenopausal women
>30.0vs.<20.9
51.18(0.7, 1.99)
0.97 A C D E F G
incidence
5.1.2.1
Cereal fibre
Pre-menopausal
Cho, E.,2003,BRE01651
U.S, Multi-ethnic, RegisterednursesNurses' Health study II
26 - 46 714 By MailFFQ-Semi-quantitative
ProspectiveCohort
90655 8.0 years g/day
Breast cancerPre-menopausal
8.8vs.3.0
50.91(0.69, 1.21)
0.21 C D E F G
incidence
115

Author, Year,WCRF Code
Country, Ethnicity, Specialcharacteristics
Age Cases n Caseascertainment
Type of studyNon-Cases n
Lenght offollow-up / loss
Assessmentdetail
Additional details Unit Outcome Subgroup Contrast Nocat. OR (95% CI) p
valueptrend A B C D E F G
adjustments
Holmes, M.D.,2004,BRE04010
U.S.A., Not specified,Registered nursesNurses' Health Study (NHS)Cohort 1976-1996
30 - 55 852 By MailFFQ-Semi-quantitative
ProspectiveCohort
53891 18.0 years / 0,04 g/day
Breast cancerPre-menopausal
8.4vs.2.4
50.99(0.78, 1.25)
0.29 A C D E F G
incidence
Cade etal.,2007,BRE20021
UKUK Women's Cohort Study(UKWCS), 1993
35 - 69 232NHS CentralRegistry
FFQProspectiveCohort
14261 7.5 years Cereal fibre, Englystfibre
g/day
Breast cancerpremenopausal women
>13.0vs.<3.9
50.59(0.32, 1.1)
0.05 A C D E F G
incidence
Post-menopausal
Holmes, M.D.,2004,BRE04010
U.S.A., Not specified,Registered nursesNurses' Health Study (NHS)Cohort 1976-1996
30 - 55 2924 By MailFFQ-Semi-quantitative
ProspectiveCohort
76200 18.0 years / 0,04 g/day
Breast cancerPost-menopausal
>1.0vs.>-1.0
51.08(0.96, 1.22)
0.09 A C D E F G
incidence
Giles, G.G.,2006,BRE22430
Australia, Post-menopausalMCCS, 1990
40 - 69 Unspecified FFQ (nos)ProspectiveCohort
12273.0 9.1 years sd/day
Breast cancerPost-menopausal
1.0(continuous)
11.08(0.95, 1.23)
A E F G
incidence
Giles, G.G.,2006,BRE22430
Australia, Post-menopausalMCCS, 1990
40 - 69 Unspecified FFQ (nos)ProspectiveCohort
12273.0 9.1 years sd/day
Breast cancer ER+/PR+Post-menopausal
1.0(continuous)
11.17(0.98, 1.39)
A E F G
incidence
Giles, G.G.,2006,BRE22430
Australia, Post-menopausalMCCS, 1990
40 - 69 Unspecified FFQ (nos)ProspectiveCohort
12273.0 9.1 years sd/day
Breast cancer ER+/PR-Post-menopausal
1.0(continuous)
11.24(0.83, 1.86)
A E F G
incidence
Giles, G.G.,2006,BRE22430
Australia, Post-menopausalMCCS, 1990
40 - 69 Unspecified FFQ (nos)ProspectiveCohort
12273.0 9.1 years sd/day
Breast cancer ER-/PR-Post-menopausal
1.0(continuous)
10.78(0.55, 1.11)
A E F G
incidence
Cade etal.,2007,BRE20021
UKUK Women's Cohort Study(UKWCS), 1993
35 - 69 286NHS CentralRegistry
FFQProspectiveCohort
15067 7.5 years Cereal fibre, Englystfibre
g/day
Breast cancerpostmenopausal women
>13.0vs.<3.9
51.15(0.68, 1.94)
0.89 A C D E F G
incidence
Suzuki, R. etal.,2008,BRE80148
Sweden, Post menopausalThe Swedish MammographyCohort, 1987
(60) 716 Cancer registry FFQProspectiveCohort
51823.0 8.3 years Cereal fibre intake g/day
Breast cancer ER+/PR+ >19.1vs.<11.9
50.99(0.77, 1.29)
0.46 A B C D E F G
incidence
Suzuki, R. etal.,2008,BRE80148
Sweden, Post menopausalThe Swedish MammographyCohort, 1987
(60) 243 Cancer registry FFQProspectiveCohort
51823.0 8.3 years Cereal fibre intake
Breast cancer ER+/PR+PMH - everusers
Quantile 4vs.Quantile 1
40.41(0.25, 0.67)
0.0001
A B C D E F
incidence
Suzuki, R. etal.,2008,BRE80148
Sweden, Post menopausalThe Swedish MammographyCohort, 1987
(60) 299 Cancer registry FFQProspectiveCohort
51823.0 8.3 years Cereal fibre intake
Breast cancer ER+/PR+PMH - neverusers
Quantile 4vs.Quantile 1
41.14(0.8, 1.64)
0.97 A B C D E F
incidence
Suzuki, R. etal.,2008,BRE80148
Sweden, Post menopausalThe Swedish MammographyCohort, 1987
(60) 279 Cancer registry FFQProspectiveCohort
51823.0 8.3 years Cereal fibre intake g/day
Breast cancer ER+/PR- >19.1vs.<11.9
50.86(0.56, 1.32)
0.26 A B C D E F G
incidence
116

Author, Year,WCRF Code
Country, Ethnicity, Specialcharacteristics
Age Cases n Caseascertainment
Type of studyNon-Cases n
Lenght offollow-up / loss
Assessmentdetail
Additional details Unit Outcome Subgroup Contrast Nocat. OR (95% CI) p
valueptrend A B C D E F G
adjustments
Suzuki, R. etal.,2008,BRE80148
Sweden, Post menopausalThe Swedish MammographyCohort, 1987
(60) 123 Cancer registry FFQProspectiveCohort
51823.0 8.3 years Cereal fibre intake
Breast cancer ER+/PR-PMH - everusers
Quantile 4vs.Quantile 1
40.6(0.3, 1.21)
0.08 A B C D E F
incidence
Suzuki, R. etal.,2008,BRE80148
Sweden, Post menopausalThe Swedish MammographyCohort, 1987
(60) 102 Cancer registry FFQProspectiveCohort
51823.0 8.3 years Cereal fibre intake
Breast cancer ER+/PR-PMH - neverusers
Quantile 4vs.Quantile 1
40.84(0.45, 1.55)
0.67 A B C D E F
incidence
Suzuki, R. etal.,2008,BRE80148
Sweden, Post menopausalThe Swedish MammographyCohort, 1987
(60) 143 Cancer registry FFQProspectiveCohort
51823.0 8.3 years Cereal fibre intake g/day
Breast cancer ER-/PR- >19.1vs.<11.9
50.69(0.39, 1.24)
0.21 A B C D E F G
incidence
Suzuki, R. etal.,2008,BRE80148
Sweden, Post menopausalThe Swedish MammographyCohort, 1987
(60) 34 Cancer registry FFQProspectiveCohort
51823.0 8.3 years Cereal fibre intake
Breast cancer ER-/PR-PMH - everusers
Quantile 4vs.Quantile 1
40.23(0.06, 0.89)
0.02 A B C D E F
incidence
Suzuki, R. etal.,2008,BRE80148
Sweden, Post menopausalThe Swedish MammographyCohort, 1987
(60) 66 Cancer registry FFQProspectiveCohort
51823.0 8.3 years Cereal fibre intake
Breast cancer ER-/PR-PMH - neverusers
Quantile 4vs.Quantile 1
40.87(0.41, 1.85)
0.69 A B C D E F
incidence
Suzuki, R. etal.,2008,BRE80148
Sweden, Post menopausalThe Swedish MammographyCohort, 1987
(60) 1284 Cancer registry FFQProspectiveCohort
51823.0 8.3 years Cereal fibre intake g/day
Invasive breast cancer >19.1vs.<11.9
50.91(0.75, 1.11)
0.098
A B C D E F G
incidence
Suzuki, R. etal.,2008,BRE80148
Sweden, Post menopausalThe Swedish MammographyCohort, 1987
(60) 446 Cancer registry FFQProspectiveCohort
51823.0 8.3 years Cereal fibre intake
Invasive breast cancerPMH - everusers
Quantile 4vs.Quantile 1
40.44(0.31, 0.63)
<0.0001
A B C D E F
incidence
Suzuki, R. etal.,2008,BRE80148
Sweden, Post menopausalThe Swedish MammographyCohort, 1987
(60) 528 Cancer registry FFQProspectiveCohort
51823.0 8.3 years Cereal fibre intake
Invasive breast cancerPMH - neverusers
Quantile 4vs.Quantile 1
41.03(0.79, 1.35)
0.82 A B C D E F
incidence
Menopausal status not specified
Terry,P.,2002,BRE12199
Canada, Not specifiedCanadian National BreastScreening Study
40 - 59Hospital/ambulatory DirectContact
FFQ (nos)ProspectiveCohort
89835.0 16.2 years g/day
Invasive & In situ breastcancer >5.6
vs.<2.5
50.9(0.78, 1.04)
0.13 A B C D E F G
incidence
5.1.2.2
Fiber from cruciferous vegetables
Pre-menopausal
Cho, E.,2003,BRE01651
U.S, Multi-ethnic, RegisterednursesNurses' Health study II
26 - 46 714 By MailFFQ-Semi-quantitative
ProspectiveCohort
90655 8.0 years g/day
Breast cancerPre-menopausal
1.8vs.0.2
50.87(0.68, 1.12)
0.08 C D E F G
incidence
Fiber from legumes
Pre-menopausal
117

Author, Year,WCRF Code
Country, Ethnicity, Specialcharacteristics
Age Cases n Caseascertainment
Type of studyNon-Cases n
Lenght offollow-up / loss
Assessmentdetail
Additional details Unit Outcome Subgroup Contrast Nocat. OR (95% CI) p
valueptrend A B C D E F G
adjustments
Cho, E.,2003,BRE01651
U.S, Multi-ethnic, RegisterednursesNurses' Health study II
26 - 46 714 By MailFFQ-Semi-quantitative
ProspectiveCohort
90655 8.0 years g/day
Breast cancerPre-menopausal
2.0vs.0.1
50.79(0.62, 1.02)
0.04 C D E F G
incidence
Post-menopausal
Giles, G.G.,2006,BRE22430
Australia, Post-menopausalMCCS, 1990
40 - 69 Unspecified FFQ (nos)ProspectiveCohort
12273.0 9.1 years sd/day
Breast cancerPost-menopausal
1.0(continuous)
10.97(0.86, 1.11)
A E F G
incidence
Giles, G.G.,2006,BRE22430
Australia, Post-menopausalMCCS, 1990
40 - 69 Unspecified FFQ (nos)ProspectiveCohort
12273.0 9.1 years sd/day
Breast cancer ER+/PR+Post-menopausal
1.0(continuous)
11.01(0.86, 1.18)
A E F G
incidence
Giles, G.G.,2006,BRE22430
Australia, Post-menopausalMCCS, 1990
40 - 69 Unspecified FFQ (nos)ProspectiveCohort
12273.0 9.1 years sd/day
Breast cancer ER+/PR-Post-menopausal
1.0(continuous)
10.95(0.61, 1.46)
A E F G
incidence
Giles, G.G.,2006,BRE22430
Australia, Post-menopausalMCCS, 1990
40 - 69 Unspecified FFQ (nos)ProspectiveCohort
12273.0 9.1 years sd/day
Breast cancer ER-/PR-Post-menopausal
1.0(continuous)
10.87(0.6, 1.27)
A E F G
incidence
Fibre from potatoes
Post-menopausal
Giles, G.G.,2006,BRE22430
Australia, Post-menopausalMCCS, 1990
40 - 69 Unspecified FFQ (nos)ProspectiveCohort
12273.0 9.1 years sd/day
Breast cancerPost-menopausal
1.0(continuous)
10.97(0.85, 1.11)
A E F G
incidence
Giles, G.G.,2006,BRE22430
Australia, Post-menopausalMCCS, 1990
40 - 69 Unspecified FFQ (nos)ProspectiveCohort
12273.0 9.1 years sd/day
Breast cancer ER+/PR+Post-menopausal
1.0(continuous)
10.98(0.82, 1.18)
A E F G
incidence
Giles, G.G.,2006,BRE22430
Australia, Post-menopausalMCCS, 1990
40 - 69 Unspecified FFQ (nos)ProspectiveCohort
12273.0 9.1 years sd/day
Breast cancer ER+/PR-Post-menopausal
1.0(continuous)
10.79(0.48, 1.32)
A E F G
incidence
Giles, G.G.,2006,BRE22430
Australia, Post-menopausalMCCS, 1990
40 - 69 Unspecified FFQ (nos)ProspectiveCohort
12273.0 9.1 years sd/day
Breast cancer ER-/PR-Post-menopausal
1.0(continuous)
11.07(0.85, 1.36)
A E F G
incidence
Vegetable fibre
Pre-menopausal
Cho, E.,2003,BRE01651
U.S, Multi-ethnic, RegisterednursesNurses' Health study II
26 - 46 714 By MailFFQ-Semi-quantitative
ProspectiveCohort
90655 8.0 years g/day
Breast cancerPre-menopausal
10.4vs.3.3
50.97(0.75, 1.24)
0.52 C D E F G
incidence
Holmes, M.D.,2004,BRE04010
U.S.A., Not specified,Registered nursesNurses' Health Study (NHS)Cohort 1976-1996
30 - 55 852 By MailFFQ-Semi-quantitative
ProspectiveCohort
53891 18.0 years / 0,04 g/day
Breast cancerPre-menopausal
10.2vs.3.6
50.95(0.72, 1.25)
0.65 A C D E F G
incidence
118

Author, Year,WCRF Code
Country, Ethnicity, Specialcharacteristics
Age Cases n Caseascertainment
Type of studyNon-Cases n
Lenght offollow-up / loss
Assessmentdetail
Additional details Unit Outcome Subgroup Contrast Nocat. OR (95% CI) p
valueptrend A B C D E F G
adjustments
Cade etal.,2007,BRE20021
UKUK Women's Cohort Study(UKWCS), 1993
35 - 69 232NHS CentralRegistry
FFQProspectiveCohort
14261 7.5 years Vegetable fibre,Englyst fibre
g/day
Breast cancerpremenopausal women
>7.0vs.<2.9
51.26(0.73, 2.18)
0.96 A C D E F G
incidence
Post-menopausal
Holmes, M.D.,2004,BRE04010
U.S.A., Not specified,Registered nursesNurses' Health Study (NHS)Cohort 1976-1996
30 - 55 2924 By MailFFQ-Semi-quantitative
ProspectiveCohort
76200 18.0 years / 0,04 g/day
Breast cancerPost-menopausal
>1.0vs.>-1.0
50.94(0.82, 1.08)
0.27 A C D E F G
incidence
Giles, G.G.,2006,BRE22430
Australia, Post-menopausalMCCS, 1990
40 - 69 Unspecified FFQ (nos)ProspectiveCohort
12273.0 9.1 years sd/day
Breast cancerPost-menopausal
1.0(continuous)
11.07(0.95, 1.2)
A E F G
incidence
Giles, G.G.,2006,BRE22430
Australia, Post-menopausalMCCS, 1990
40 - 69 Unspecified FFQ (nos)ProspectiveCohort
12273.0 9.1 years sd/day
Breast cancer ER+/PR+Post-menopausal
1.0(continuous)
11.13(0.97, 1.32)
A E F G
incidence
Giles, G.G.,2006,BRE22430
Australia, Post-menopausalMCCS, 1990
40 - 69 Unspecified FFQ (nos)ProspectiveCohort
12273.0 9.1 years sd/day
Breast cancer ER+/PR-Post-menopausal
1.0(continuous)
11.14(0.81, 1.61)
A E F G
incidence
Giles, G.G.,2006,BRE22430
Australia, Post-menopausalMCCS, 1990
40 - 69 Unspecified FFQ (nos)ProspectiveCohort
12273.0 9.1 years sd
Breast cancer ER-/PR-Post-menopausal
1.0(continuous)
10.83(0.58, 1.19)
A E F G
incidence
Cade etal.,2007,BRE20021
UKUK Women's Cohort Study(UKWCS), 1993
35 - 69 286NHS CentralRegistry
FFQProspectiveCohort
15067 7.5 years Vegetable fibre,Englyst fibre
g/day
Breast cancerpostmenopausal women
>8.0vs.<2.9
51.2(0.74, 1.94)
0.4 A C D E F G
incidence
Suzuki, R. etal.,2008,BRE80148
Sweden, Post menopausalThe Swedish MammographyCohort, 1987
(60) 716 Cancer registry FFQProspectiveCohort
51823.0 8.3 years Vegetable fibre intake g/day
Breast cancer ER+/PR+ >2.67vs.<0.93
50.85(0.61, 1.18)
0.23 A B C D E F G
incidence
Suzuki, R. etal.,2008,BRE80148
Sweden, Post menopausalThe Swedish MammographyCohort, 1987
(60) 243 Cancer registry FFQProspectiveCohort
51823.0 8.3 years Vegetable fibre intake
Breast cancer ER+/PR+PMH - everusers
Quantile 4vs.Quantile 1
41.01(0.57, 1.78)
0.92 A B C D E F
incidence
Suzuki, R. etal.,2008,BRE80148
Sweden, Post menopausalThe Swedish MammographyCohort, 1987
(60) 299 Cancer registry FFQProspectiveCohort
51823.0 8.3 years Vegetable fibre intake
Breast cancer ER+/PR+PMH - neverusers
Quantile 4vs.Quantile 1
40.63(0.41, 0.99)
0.023
A B C D E F
incidence
Suzuki, R. etal.,2008,BRE80148
Sweden, Post menopausalThe Swedish MammographyCohort, 1987
(60) 279 Cancer registry FFQProspectiveCohort
51823.0 8.3 years Vegetable fibre intake g/day
Breast cancer ER+/PR- >2.67vs.<0.93
51.03(0.59, 1.8)
0.79 A B C D E F G
incidence
Suzuki, R. etal.,2008,BRE80148
Sweden, Post menopausalThe Swedish MammographyCohort, 1987
(60) 123 Cancer registry FFQProspectiveCohort
51823.0 8.3 years Vegetable fibre intake
Breast cancer ER+/PR-PMH - everusers
Quantile 4vs.Quantile 1
41.82(0.71, 4.69)
0.46 A B C D E F
incidence
119

Author, Year,WCRF Code
Country, Ethnicity, Specialcharacteristics
Age Cases n Caseascertainment
Type of studyNon-Cases n
Lenght offollow-up / loss
Assessmentdetail
Additional details Unit Outcome Subgroup Contrast Nocat. OR (95% CI) p
valueptrend A B C D E F G
adjustments
Suzuki, R. etal.,2008,BRE80148
Sweden, Post menopausalThe Swedish MammographyCohort, 1987
(60) 102 Cancer registry FFQProspectiveCohort
51823.0 8.3 years Vegetable fibre intake
Breast cancer ER+/PR-PMH - neverusers
Quantile 4vs.Quantile 1
40.81(0.36, 1.8)
0.51 A B C D E F
incidence
Suzuki, R. etal.,2008,BRE80148
Sweden, Post menopausalThe Swedish MammographyCohort, 1987
(60) 143 Cancer registry FFQProspectiveCohort
51823.0 8.3 years Vegetable fibre intake g/day
Breast cancer ER-/PR- >2.67vs.<0.93
50.84(0.4, 1.77)
0.5 A B C D E F G
incidence
Suzuki, R. etal.,2008,BRE80148
Sweden, Post menopausalThe Swedish MammographyCohort, 1987
(60) 34 Cancer registry FFQProspectiveCohort
51823.0 8.3 years Vegetable fibre intake
Breast cancer ER-/PR-PMH - everusers
Quantile 4vs.Quantile 1
42.15(0.33, 13.9)
0.91 A B C D E F
incidence
Suzuki, R. etal.,2008,BRE80148
Sweden, Post menopausalThe Swedish MammographyCohort, 1987
(60) 66 Cancer registry FFQProspectiveCohort
51823.0 8.3 years Vegetable fibre intake
Breast cancer ER-/PR-PMH - neverusers
Quantile 4vs.Quantile 1
40.78(0.3, 2.02)
0.62 A B C D E F
incidence
Suzuki, R. etal.,2008,BRE80148
Sweden, Post menopausalThe Swedish MammographyCohort, 1987
(60) 1248 Cancer registry FFQProspectiveCohort
51823.0 8.3 years Vegetable fibre intake g/day
Invasive breast cancer >2.67vs.<0.93
50.92(0.72, 1.18)
0.31 A B C D E F G
incidence
Suzuki, R. etal.,2008,BRE80148
Sweden, Post menopausalThe Swedish MammographyCohort, 1987
(60) 446 Cancer registry FFQProspectiveCohort
51823.0 8.3 years Vegetable fibre intake
Invasive breast cancerPMH - everusers
Quantile 4vs.Quantile 1
41.39(0.89, 2.17)
0.29 A B C D E F
incidence
Suzuki, R. etal.,2008,BRE80148
Sweden, Post menopausalThe Swedish MammographyCohort, 1987
(60) 528 Cancer registry FFQProspectiveCohort
51823.0 8.3 years Vegetable fibre intake
Invasive breast cancerPMH - neverusers
Quantile 4vs.Quantile 1
40.65(0.46, 0.9)
0.003
A B C D E F
incidence
Menopausal status not specified
Terry,P.,2002,BRE12199
Canada, Not specifiedCanadian National BreastScreening Study
40 - 59Hospital/ambulatory DirectContact
FFQ (nos)ProspectiveCohort
89835.0 16.2 years g/day
Invasive & In situ breastcancer >11.0
vs.<5.3
50.9(0.75, 1.08)
0.21 A B C D E F G
incidence
5.1.2.3
Fruit fibre
Pre-menopausal
Cho, E.,2003,BRE01651
U.S, Multi-ethnic, RegisterednursesNurses' Health study II
26 - 46 714 By MailFFQ-Semi-quantitative
ProspectiveCohort
90655 8.0 years g/day
Breast cancerPre-menopausal
6.2vs.1.1
51.13(0.88, 1.46)
0.54 C D E F G
incidence
Holmes, M.D.,2004,BRE04010
U.S.A., Not specified,Registered nursesNurses' Health Study (NHS)Cohort 1976-1996
30 - 55 852 By MailFFQ-Semi-quantitative
ProspectiveCohort
53891 18.0 years / 0,04 g/day
Breast cancerPre-menopausal
7.1vs.1.3
50.86(0.67, 1.1)
0.78 A C D E F G
incidence
Cade etal.,2007,BRE20021
UKUK Women's Cohort Study(UKWCS), 1993
35 - 69 232NHS CentralRegistry
FFQProspectiveCohort
14261 7.5 years Fruit fibre, Englyst fibre g/day
Breast cancerpremenopausal women
>6.0vs.<1.9
50.81(0.44, 1.49)
0.09 A C D E F G
incidence
120

Author, Year,WCRF Code
Country, Ethnicity, Specialcharacteristics
Age Cases n Caseascertainment
Type of studyNon-Cases n
Lenght offollow-up / loss
Assessmentdetail
Additional details Unit Outcome Subgroup Contrast Nocat. OR (95% CI) p
valueptrend A B C D E F G
adjustments
Post-menopausal
Holmes, M.D.,2004,BRE04010
U.S.A., Not specified,Registered nursesNurses' Health Study (NHS)Cohort 1976-1996
30 - 55 2924 By MailFFQ-Semi-quantitative
ProspectiveCohort
76200 18.0 years / 0,04 g/day
Breast cancerPost-menopausal
>1.0vs.>-1.0
50.92(0.81, 1.04)
0.08 A C D E F G
incidence
Giles, G.G.,2006,BRE22430
Australia, Post-menopausalMCCS, 1990
40 - 69 Unspecified FFQ (nos)ProspectiveCohort
12273.0 9.1 years sd/day
Breast cancerPost-menopausal
1.0(continuous)
11.0(0.88, 1.13)
A E F G
incidence
Giles, G.G.,2006,BRE22430
Australia, Post-menopausalMCCS, 1990
40 - 69 Unspecified FFQ (nos)ProspectiveCohort
12273.0 9.1 years sd/day
Breast cancer ER+/PR+Post-menopausal
1.0(continuous)
11.15(1.0, 1.34)
A E F G
incidence
Giles, G.G.,2006,BRE22430
Australia, Post-menopausalMCCS, 1990
40 - 69 Unspecified FFQ (nos)ProspectiveCohort
12273.0 9.1 years sd/day
Breast cancer ER+/PR-Post-menopausal
1.0(continuous)
10.82(0.53, 1.28)
A E F G
incidence
Giles, G.G.,2006,BRE22430
Australia, Post-menopausalMCCS, 1990
40 - 69 Unspecified FFQ (nos)ProspectiveCohort
12273.0 9.1 years sd/day
Breast cancer ER-/PR-Post-menopausal
1.0(continuous)
10.78(0.55, 1.11)
A E F G
incidence
Cade etal.,2007,BRE20021
UKUK Women's Cohort Study(UKWCS), 1993
35 - 69 286NHS CentralRegistry
FFQProspectiveCohort
15067 7.5 years Fruit fibre, Englyst fibre g/day
Breast cancerpostmenopausal women
>7.0vs.<1.9
51.1(0.66, 1.84)
0.64 A C D E F G
incidence
Suzuki, R. etal.,2008,BRE80148
Sweden, Post menopausalThe Swedish MammographyCohort, 1987
(60) 716 Cancer registry FFQProspectiveCohort
51823.0 8.3 years Fruit fibre intake g/day
Breast cancer ER+/PR+ >5.2vs.<1.6
50.62(0.39, 0.97)
0.022
A B C D E F G
incidence
Suzuki, R. etal.,2008,BRE80148
Sweden, Post menopausalThe Swedish MammographyCohort, 1987
(60) 243 Cancer registry FFQProspectiveCohort
51823.0 8.3 years Fruit fibre intake
Breast cancer ER+/PR+PMH - everusers
Quantile 4vs.Quantile 1
40.85(0.43, 1.68)
0.95 A B C D E F
incidence
Suzuki, R. etal.,2008,BRE80148
Sweden, Post menopausalThe Swedish MammographyCohort, 1987
(60) 299 Cancer registry FFQProspectiveCohort
51823.0 8.3 years Fruit fibre intake
Breast cancer ER+/PR+PMH - neverusers
Quantile 4vs.Quantile 1
40.45(0.25, 0.81)
0.01 A B C D E F
incidence
Suzuki, R. etal.,2008,BRE80148
Sweden, Post menopausalThe Swedish MammographyCohort, 1987
(60) 279 Cancer registry FFQProspectiveCohort
51823.0 8.3 years Fruit fibre intake g/day
Breast cancer ER+/PR- >5.2vs.<1.6
50.6(0.29, 1.22)
0.14 A B C D E F G
incidence
Suzuki, R. etal.,2008,BRE80148
Sweden, Post menopausalThe Swedish MammographyCohort, 1987
(60) 123 Cancer registry FFQProspectiveCohort
51823.0 8.3 years Fruit fibre intake
Breast cancer ER+/PR-PMH - everusers
Quantile 4vs.Quantile 1
40.92(0.35, 2.39)
0.91 A B C D E F
incidence
Suzuki, R. etal.,2008,BRE80148
Sweden, Post menopausalThe Swedish MammographyCohort, 1987
(60) 102 Cancer registry FFQProspectiveCohort
51823.0 8.3 years Fruit fibre intake
Breast cancer ER+/PR-PMH - neverusers
Quantile 4vs.Quantile 1
40.72(0.26, 2.04)
0.5 A B C D E F
incidence
121

Author, Year,WCRF Code
Country, Ethnicity, Specialcharacteristics
Age Cases n Caseascertainment
Type of studyNon-Cases n
Lenght offollow-up / loss
Assessmentdetail
Additional details Unit Outcome Subgroup Contrast Nocat. OR (95% CI) p
valueptrend A B C D E F G
adjustments
Suzuki, R. etal.,2008,BRE80148
Sweden, Post menopausalThe Swedish MammographyCohort, 1987
(60) 143 Cancer registry FFQProspectiveCohort
51823.0 8.3 years Fruit fibre intake g/day
Breast cancer ER-/PR- >5.2vs.<1.6
50.5(0.18, 1.39)
0.15 A B C D E F G
incidence
Suzuki, R. etal.,2008,BRE80148
Sweden, Post menopausalThe Swedish MammographyCohort, 1987
(60) 34 Cancer registry FFQProspectiveCohort
51823.0 8.3 years Fruit fibre intake
Breast cancer ER-/PR-PMH - everusers
Quantile 4vs.Quantile 1
40.39(0.06, 2.5)
0.39 A B C D E F
incidence
Suzuki, R. etal.,2008,BRE80148
Sweden, Post menopausalThe Swedish MammographyCohort, 1987
(60) 66 Cancer registry FFQProspectiveCohort
51823.0 8.3 years Fruit fibre intake
Breast cancer ER-/PR-PMH - neverusers
Quantile 4vs.Quantile 1
40.88(0.24, 3.25)
0.83 A B C D E F
incidence
Suzuki, R. etal.,2008,BRE80148
Sweden, Post menopausalThe Swedish MammographyCohort, 1987
(60) 1284 Cancer registry FFQProspectiveCohort
51823.0 8.3 years Fruit fibre intake g/day
Invasive breast cancer >5.2vs.<1.6
50.66(0.47, 0.93)
0.007
A B C D E F G
incidence
Suzuki, R. etal.,2008,BRE80148
Sweden, Post menopausalThe Swedish MammographyCohort, 1987
(60) 446 Cancer registry FFQProspectiveCohort
51823.0 8.3 years Fruit fibre intake
Invasive breast cancerPMH - everusers
Quantile 4vs.Quantile 1
40.77(0.47, 1.28)
0.34 A B C D E F
incidence
Suzuki, R. etal.,2008,BRE80148
Sweden, Post menopausalThe Swedish MammographyCohort, 1987
(60) 528 Cancer registry FFQProspectiveCohort
51823.0 8.3 years Fruit fibre intake
Invasive breast cancerPMH - neverusers
Quantile 4vs.Quantile 1
40.57(0.36, 0.89)
0.016
A B C D E F
incidence
Menopausal status not specified
Terry,P.,2002,BRE12199
Canada, Not specifiedCanadian National BreastScreening Study
40 - 59Hospital/ambulatory DirectContact
FFQ (nos)ProspectiveCohort
89835.0 16.2 years g/day
Invasive & In situ breastcancer >6.6
vs.<1.9
51.07(0.92, 1.25)
0.51 A B C D E F G
incidence
5.1.3
Starch
Post-menopausal
Sieri,Sabina,2002,BRE20941
Italy, Not specified, Post-menopausalORDET study, 1987
41 - 70 56Throughnetwork, paper,tv
FFQ-Semi-quantitative
Nested CaseControl
214 5.5 years g/day
Breast cancerPost-menopausal
150.0 -243.0vs.<126.9
32.64(0.71, 9.83)
0.120
B C E G
incidence
Nielsen, T.G.,2005,BRE23581
Denmark, Post-menopausalDiet, Cancer and Health,1993
50 - 65 By Mail FFQ (nos)ProspectiveCohort
23870.0 6.6 years g/day
Breast cancerPost-menopausal
10.0(continuous)
11.0(0.96, 1.04)
0.99 B C D E F
incidence
Nielsen, T.G.,2005,BRE23581
Denmark, Post-menopausalDiet, Cancer and Health,1993
50 - 65 By Mail FFQ (nos)ProspectiveCohort
23870.0 6.6 years g/day
Breast cancer ER+Post-menopausal
10.0(continuous)
10.98(0.94, 1.03)
0.99 B C D E F
incidence
Nielsen, T.G.,2005,BRE23581
Denmark, Post-menopausalDiet, Cancer and Health,1993
50 - 65 By Mail FFQ (nos)ProspectiveCohort
23870.0 6.6 years g/day
Breast cancer ER-Post-menopausal
10.0(continuous)
11.06(0.97, 1.16)
0.99 B C D E F
incidence
122

Author, Year,WCRF Code
Country, Ethnicity, Specialcharacteristics
Age Cases n Caseascertainment
Type of studyNon-Cases n
Lenght offollow-up / loss
Assessmentdetail
Additional details Unit Outcome Subgroup Contrast Nocat. OR (95% CI) p
valueptrend A B C D E F G
adjustments
Giles, G.G.,2006,BRE22430
Australia, Post-menopausalMCCS, 1990
40 - 69 Unspecified FFQ (nos)ProspectiveCohort
12273.0 9.1 years sd/day
Breast cancerPost-menopausal
1.0(continuous)
11.14(0.95, 1.38)
A E F G
incidence
Giles, G.G.,2006,BRE22430
Australia, Post-menopausalMCCS, 1990
40 - 69 Unspecified FFQ (nos)ProspectiveCohort
12273.0 9.1 years sd/day
Breast cancer ER+/PR+Post-menopausal
1.0(continuous)
11.07(0.82, 1.41)
A E F G
incidence
Giles, G.G.,2006,BRE22430
Australia, Post-menopausalMCCS, 1990
40 - 69 Unspecified FFQ (nos)ProspectiveCohort
12273.0 9.1 years sd/day
Breast cancer ER+/PR-Post-menopausal
1.0(continuous)
11.6(0.91, 2.84)
A E F G
incidence
Giles, G.G.,2006,BRE22430
Australia, Post-menopausalMCCS, 1990
40 - 69 Unspecified FFQ (nos)ProspectiveCohort
12273.0 9.1 years sd/day
Breast cancer ER-/PR-Post-menopausal
1.0(continuous)
10.8(0.5, 1.28)
A E F G
incidence
5.1.4
Glucose
Post-menopausal
Nielsen, T.G.,2005,BRE23581
Denmark, Post-menopausalDiet, Cancer and Health,1993
50 - 65 By Mail FFQ (nos)ProspectiveCohort
23870.0 6.6 years g/day
Breast cancerPost-menopausal
50.0(continuous)
11.06(0.79, 1.42)
0.99 B C D E F
incidence
Nielsen, T.G.,2005,BRE23581
Denmark, Post-menopausalDiet, Cancer and Health,1993
50 - 65 By Mail FFQ (nos)ProspectiveCohort
23870.0 6.6 years g/day
Breast cancer ER+Post-menopausal
10.0(continuous)
11.05(0.91, 1.21)
0.99 B C D E F
incidence
Nielsen, T.G.,2005,BRE23581
Denmark, Post-menopausalDiet, Cancer and Health,1993
50 - 65 By Mail FFQ (nos)ProspectiveCohort
23870.0 6.6 years g/day
Breast cancer ER-Post-menopausal
10.0(continuous)
10.86(0.64, 1.16)
0.99 B C D E F
incidence
Lactose
Post-menopausal
Nielsen, T.G.,2005,BRE23581
Denmark, Post-menopausalDiet, Cancer and Health,1993
50 - 65 By Mail FFQ (nos)ProspectiveCohort
23870.0 6.6 years g/day
Breast cancerPost-menopausal
10.0(continuous)
11.04(0.98, 1.1)
0.99 B C D E F
incidence
Nielsen, T.G.,2005,BRE23581
Denmark, Post-menopausalDiet, Cancer and Health,1993
50 - 65 By Mail FFQ (nos)ProspectiveCohort
23870.0 6.6 years g/day
Breast cancer ER+Post-menopausal
10.0(continuous)
11.04(0.97, 1.11)
0.99 B C D E F
incidence
Nielsen, T.G.,2005,BRE23581
Denmark, Post-menopausalDiet, Cancer and Health,1993
50 - 65 By Mail FFQ (nos)ProspectiveCohort
23870.0 6.6 years g/day
Breast cancer ER-Post-menopausal
10.0(continuous)
11.07(0.95, 1.22)
0.99 B C D E F
incidence
Menopausal status not specified
123

Author, Year,WCRF Code
Country, Ethnicity, Specialcharacteristics
Age Cases n Caseascertainment
Type of studyNon-Cases n
Lenght offollow-up / loss
Assessmentdetail
Additional details Unit Outcome Subgroup Contrast Nocat. OR (95% CI) p
valueptrend A B C D E F G
adjustments
Jarvinen,R.,1997,BRE04383
finlandFinland, 1966
15 - UnspecifiedDietary Historyquestionnaire
ProspectiveCohort
4697.0 24.0 yearsBreast cancer Quantile 3
vs.Quantile 1
20.53(null, null)
0.008
A
incidence
Maltose
Post-menopausal
Nielsen, T.G.,2005,BRE23581
Denmark, Post-menopausalDiet, Cancer and Health,1993
50 - 65 By Mail FFQ (nos)ProspectiveCohort
23870.0 6.6 years g/day
Breast cancerPost-menopausal
2.0(continuous)
11.02(0.88, 1.18)
0.99 B C D E F
incidence
Nielsen, T.G.,2005,BRE23581
Denmark, Post-menopausalDiet, Cancer and Health,1993
50 - 65 By Mail FFQ (nos)ProspectiveCohort
23870.0 6.6 years g/day
Breast cancer ER+Post-menopausal
2.0(continuous)
11.04(0.9, 1.2)
0.99 B C D E F
incidence
Nielsen, T.G.,2005,BRE23581
Denmark, Post-menopausalDiet, Cancer and Health,1993
50 - 65 By Mail FFQ (nos)ProspectiveCohort
23870.0 6.6 years g/day
Breast cancer ER-Post-menopausal
2.0(continuous)
11.03(0.78, 1.38)
0.99 B C D E F
incidence
Sucrose
Pre-menopausal
FrazierL.A.,2004,BRE02942
USA, Multi-ethnic,Registered nursesNurses' Health study II
34 - 51 361
Through healthorg. (screening,healthinsurance)
FFQ (nos)Historical Cohort 47517 9.0 years adolescent diet gm/day
Breast cancerPre-menopausal
102.4vs.50.1
50.98(0.7, 1.39)
0.87 A C D E F G
incidence
Post-menopausal
Nielsen, T.G.,2005,BRE23581
Denmark, Post-menopausalDiet, Cancer and Health,1993
50 - 65 By Mail FFQ (nos)ProspectiveCohort
23870.0 6.6 years g/day
Breast cancerPost-menopausal
10.0(continuous)
11.01(0.94, 1.08)
0.99 B C D E F
incidence
Nielsen, T.G.,2005,BRE23581
Denmark, Post-menopausalDiet, Cancer and Health,1993
50 - 65 By Mail FFQ (nos)ProspectiveCohort
23870.0 6.6 years g/day
Breast cancer ER+Post-menopausal
10.0(continuous)
11.01(0.95, 1.07)
0.99 B C D E F
incidence
Nielsen, T.G.,2005,BRE23581
Denmark, Post-menopausalDiet, Cancer and Health,1993
50 - 65 By Mail FFQ (nos)ProspectiveCohort
23870.0 6.6 years g/day
Breast cancer ER-Post-menopausal
10.0(continuous)
11.05(0.94, 1.16)
0.99 B C D E F
incidence
Sugars (as nutrients)
Post-menopausal
Sieri,Sabina,2002,BRE20941
Italy, Not specified, Post-menopausalORDET study, 1987
41 - 70 56Throughnetwork, paper,tv
FFQ-Semi-quantitative
Nested CaseControl
214 5.5 years g/day
Breast cancerPost-menopausal
72.9 - 141.0vs.<54.3
30.34(0.11, 1.03)
0.096
B C E G
incidence
Giles, G.G.,2006,BRE22430
Australia, Post-menopausalMCCS, 1990
40 - 69 Unspecified FFQ (nos)ProspectiveCohort
12273.0 9.1 years sd/day
Breast cancerPost-menopausal
1.0(continuous)
11.07(0.89, 1.28)
A E F G
incidence
124

Author, Year,WCRF Code
Country, Ethnicity, Specialcharacteristics
Age Cases n Caseascertainment
Type of studyNon-Cases n
Lenght offollow-up / loss
Assessmentdetail
Additional details Unit Outcome Subgroup Contrast Nocat. OR (95% CI) p
valueptrend A B C D E F G
adjustments
Giles, G.G.,2006,BRE22430
Australia, Post-menopausalMCCS, 1990
40 - 69 Unspecified FFQ (nos)ProspectiveCohort
12273.0 9.1 years sd/day
Breast cancer ER+/PR+Post-menopausal
1.0(continuous)
11.13(0.87, 1.46)
A E F G
incidence
Giles, G.G.,2006,BRE22430
Australia, Post-menopausalMCCS, 1990
40 - 69 Unspecified FFQ (nos)ProspectiveCohort
12273.0 9.1 years sd/day
Breast cancer ER+/PR-Post-menopausal
1.0(continuous)
11.07(0.58, 1.95)
A E F G
incidence
Giles, G.G.,2006,BRE22430
Australia, Post-menopausalMCCS, 1990
40 - 69 Unspecified FFQ (nos)ProspectiveCohort
12273.0 9.1 years sd/day
Breast cancer ER-/PR-Post-menopausal
1.0(continuous)
11.06(0.69, 1.63)
A E F G
incidence
Menopausal status not specified
Navarro SilveraS.A.,2004,BRE24119
Canada, Not specified,Screening ProgramCanadian National BreastScreening Study
40 - 59 1450
Through healthorg. (screening,healthinsurance)
FFQ (nos)ProspectiveCohort
811649 16.6 years g/day
Breast cancer >103.1vs.<52.0
50.88(0.7, 1.12)
A C D E F G
incidence
5.1.5
Glycemic index
Pre-menopausal
Cho, E.,2003,BRE01651
U.S, Multi-ethnic, RegisterednursesNurses' Health study II
26 - 46 714 By MailFFQ-Semi-quantitative
ProspectiveCohort
90655 8.0 years Breadunit/day
Breast cancerPre-menopausal
82.0vs.70.0
51.05(0.83, 1.33)
0.97 C D E F G
incidence
Cho, E.,2003,BRE01651
U.S, Multi-ethnic, RegisterednursesNurses' Health study II
26 - 46 422 By MailFFQ-Semi-quantitative
ProspectiveCohort
424644 8.0 years Breadunit/day
Breast cancer Pre-menopausal& Lean
Quantile 5vs.Quantile 1
51.04(0.76, 1.41)
0.94 C D E F G
incidence
Cho, E.,2003,BRE01651
U.S, Multi-ethnic, RegisterednursesNurses' Health study II
26 - 46 291 By MailFFQ-Semi-quantitative
ProspectiveCohort
285780 8.0 years Breadunit/day
Breast cancer Pre-menopausal&Overweight
Quantile 5vs.Quantile 1
51.05(0.72, 1.52)
0.98 C D E F G
incidence
FrazierL.A.,2004,BRE02942
USA, Multi-ethnic,Registered nursesNurses' Health study II
34 - 51 361
Through healthorg. (screening,healthinsurance)
FFQ (nos)Historical Cohort 47517 9.0 years adolescent diet
Breast cancerPre-menopausal
83.5vs.73.6
51.47(1.04, 2.08)
0.01 A C D E F G
incidence
Holmes, M.D.,2004,BRE04010
U.S.A., Not specified,Registered nursesNurses' Health Study (NHS)Cohort 1976-1996
30 - 55 852 By MailFFQ-Semi-quantitative
ProspectiveCohort
53891 18.0 years / 0,04 Bread unit
Breast cancerPre-menopausal
81.0vs.69.0
51.02(0.82, 1.28)
0.68 A C D E F G
incidence
Navarro SilveraS.A.,2004,BRE24119
Canada, Not specified,Screening ProgramCanadian National BreastScreening Study
40 - 59
Through healthorg. (screening,healthinsurance)
FFQ (nos)ProspectiveCohort
49111.0 16.6 years overall glicemic index
Breast cancerPre-menopausal
>92.1vs.<63.0
40.78(0.52, 1.16)
0.12 A C D E F G
incidence
Holmes, M.D.,2004,BRE04010
U.S.A., Not specified,Registered nursesNurses' Health Study (NHS)Cohort 1976-1996
30 - 55 527 By MailFFQ-Semi-quantitative
ProspectiveCohort
39403 18.0 years / 0,04 Bread unit
Breast cancer Pre-menopausal& Lean
81.0vs.69.0
51.06(0.79, 1.42)
0.64 A C D E F G
incidence
125

Author, Year,WCRF Code
Country, Ethnicity, Specialcharacteristics
Age Cases n Caseascertainment
Type of studyNon-Cases n
Lenght offollow-up / loss
Assessmentdetail
Additional details Unit Outcome Subgroup Contrast Nocat. OR (95% CI) p
valueptrend A B C D E F G
adjustments
Navarro SilveraS.A.,2004,BRE24119
Canada, Not specified,Screening ProgramCanadian National BreastScreening Study
40 - 59
Through healthorg. (screening,healthinsurance)
FFQ (nos)ProspectiveCohort
49111.0 16.6 years overall glicemic index
Breast cancer Pre-menopausal& Lean
>92.1vs.<63.0
40.89(0.54, 1.45)
0.44 A C D E F G
incidence
Holmes, M.D.,2004,BRE04010
U.S.A., Not specified,Registered nursesNurses' Health Study (NHS)Cohort 1976-1996
30 - 55 292 By MailFFQ-Semi-quantitative
ProspectiveCohort
25129 18.0 years / 0,04 Bread unit
Breast cancer Pre-menopausal&Overweight
81.0vs.69.0
50.83(0.57, 1.22)
0.48 A C D E F G
incidence
Navarro SilveraS.A.,2004,BRE24119
Canada, Not specified,Screening ProgramCanadian National BreastScreening Study
40 - 59
Through healthorg. (screening,healthinsurance)
FFQ (nos)ProspectiveCohort
49111.0 16.6 years overall glicemic index
Breast cancer Pre-menopausal&Overweight
>92.1vs.<63.0
40.62(0.32, 1.23)
0.13 A C D E F G
incidence
Sieri, S. etal.,2007,BRE80142
ItalyORDET study, 1987
34 - 70 146 Cancer registrysemi-quantitative ffq
ProspectiveCohort
8926.011.5 years /0.004
Glycemic Index,energy-adjustedglycemic index
Invasive & In situ breastcancer Pre-
menopausal
>57.6vs.<53.4
51.82(1.01, 3.27)
B C D E F G
incidence
Post-menopausal
Jonas, C.R.,2003,BRE04456
USA, Not specified, Post-menopausalCPS-II US cohort, 1982-1998
50 - 74 1442 UnspecifiedFFQ-Semi-quantitative
ProspectiveCohort
277264 5.0 years / 7581 Bread unit
Breast cancerPost-menopausal
>1.0vs.>-1.0
51.03(0.87, 1.22)
0.706
A B C D E F G
incidence
Navarro SilveraS.A.,2004,BRE24119
Canada, Not specified,Screening ProgramCanadian National BreastScreening Study
40 - 59
Through healthorg. (screening,healthinsurance)
FFQ (nos)ProspectiveCohort
49111.0 16.6 years overall glicemic index
Breast cancer
HRT - Yes>92.1vs.<63.0
42.15(1.16, 4.0)
0.02 A C D E F G
incidence
Higginbotham,S.,2004,BRE15353
USA, Not specified, ElderlyWomen's Health Study, 1993
45 - By MailFFQ-Semi-quantitative
ProspectiveCohort
38446.0 6.8 years Glucoseunit
Breast cancer >1.0vs.>-1.0
51.03(0.84, 1.28)
0.66 A C D E F G
incidence
Holmes, M.D.,2004,BRE04010
U.S.A., Not specified,Registered nursesNurses' Health Study (NHS)Cohort 1976-1996
30 - 55 2924 By MailFFQ-Semi-quantitative
ProspectiveCohort
76200 18.0 years / 0,04 Bread unit
Breast cancerPost-menopausal
>1.0vs.>-1.0
51.15(1.02, 1.3)
0.02 A C D E F G
incidence
Higginbotham,S.,2004,BRE15353
USA, Not specified, ElderlyWomen's Health Study, 1993
45 - 559 By MailFFQ-Semi-quantitative
ProspectiveCohort
38446.0 6.8 years Glucoseunit
Breast cancerPost-menopausal
>1.0vs.>-1.0
50.89(0.67, 1.17)
0.39 A C D E F G
incidence
Navarro SilveraS.A.,2004,BRE24119
Canada, Not specified,Screening ProgramCanadian National BreastScreening Study
40 - 59
Through healthorg. (screening,healthinsurance)
FFQ (nos)ProspectiveCohort
49111.0 16.6 years overall glicemic index
Breast cancerPost-menopausal
>92.1vs.<63.0
41.87(1.18, 2.97)
0.01 A C D E F G
incidence
Holmes, M.D.,2004,BRE04010
U.S.A., Not specified,Registered nursesNurses' Health Study (NHS)Cohort 1976-1996
30 - 55 1343 By MailFFQ-Semi-quantitative
ProspectiveCohort
47051 18.0 years / 0,04 Bread unit
Breast cancer Post-menopausal& Lean
>1.0vs.>-1.0
51.28(1.08, 1.53)
0.003
A C D E F G
incidence
Navarro SilveraS.A.,2004,BRE24119
Canada, Not specified,Screening ProgramCanadian National BreastScreening Study
40 - 59
Through healthorg. (screening,healthinsurance)
FFQ (nos)ProspectiveCohort
49111.0 16.6 years overall glicemic index
Breast cancer Post-menopausal& Lean
>92.1vs.<63.0
41.99(1.06, 9.72)
0.03 A C D E F G
incidence
126

Author, Year,WCRF Code
Country, Ethnicity, Specialcharacteristics
Age Cases n Caseascertainment
Type of studyNon-Cases n
Lenght offollow-up / loss
Assessmentdetail
Additional details Unit Outcome Subgroup Contrast Nocat. OR (95% CI) p
valueptrend A B C D E F G
adjustments
Holmes, M.D.,2004,BRE04010
U.S.A., Not specified,Registered nursesNurses' Health Study (NHS)Cohort 1976-1996
30 - 55 1344 By MailFFQ-Semi-quantitative
ProspectiveCohort
46111 18.0 years / 0,04 Bread unit
Breast cancer Post-menopausal&Overweight
>1.0vs.>-1.0
51.05(0.87, 1.26)
0.46 A C D E F G
incidence
Navarro SilveraS.A.,2004,BRE24119
Canada, Not specified,Screening ProgramCanadian National BreastScreening Study
40 - 59
Through healthorg. (screening,healthinsurance)
FFQ (nos)ProspectiveCohort
49111.0 16.6 years overall glicemic index
Breast cancer Post-menopausal&Overweight
>92.1vs.<63.0
41.57(0.78, 3.13)
0.25 A C D E F G
incidence
Higginbotham,S.,2004,BRE15353
USA, Not specified, ElderlyWomen's Health Study, 1993
45 - 338 By MailFFQ-Semi-quantitative
ProspectiveCohort
38446.0 6.8 years Glucoseunit
Breast cancerPre-menopausal
>1.0vs.>-1.0
51.29(0.92, 1.81)
0.06 A C D E F G
incidence
Nielsen, T.G.,2005,BRE23581
Denmark, Post-menopausalDiet, Cancer and Health,1993
50 - 65 By Mail FFQ (nos)ProspectiveCohort
23870.0 6.6 years Unit/day
Breast cancerPost-menopausal
10.0(continuous)
10.94(0.8, 1.1)
0.99 B C D E F
incidence
Nielsen, T.G.,2005,BRE23581
Denmark, Post-menopausalDiet, Cancer and Health,1993
50 - 65 By Mail FFQ (nos)ProspectiveCohort
23870.0 6.6 years Unit/day
Breast cancer ER+Post-menopausal
10.0(continuous)
10.86(0.71, 1.04)
0.99 B C D E F
incidence
Nielsen, T.G.,2005,BRE23581
Denmark, Post-menopausalDiet, Cancer and Health,1993
50 - 65 By Mail FFQ (nos)ProspectiveCohort
23870.0 6.6 years Unit/day
Breast cancer ER-Post-menopausal
10.0(continuous)
11.46(1.01, 2.11)
0.99 B C D E F
incidence
Giles, G.G.,2006,BRE22430
Australia, Post-menopausalMCCS, 1990
40 - 69 Unspecified FFQ (nos)ProspectiveCohort
12273.0 9.1 years SD Units
Breast cancerPost-menopausal
1.0(continuous)
10.98(0.88, 1.1)
A E F G
incidence
Giles, G.G.,2006,BRE22430
Australia, Post-menopausalMCCS, 1990
40 - 69 Unspecified FFQ (nos)ProspectiveCohort
12273.0 9.1 years SD Units
Breast cancer ER+/PR+Post-menopausal
1.0(continuous)
10.91(0.77, 1.07)
A E F G
incidence
Giles, G.G.,2006,BRE22430
Australia, Post-menopausalMCCS, 1990
40 - 69 Unspecified FFQ (nos)ProspectiveCohort
12273.0 9.1 years SD Units
Breast cancer ER+/PR-Post-menopausal
1.0(continuous)
10.8(0.57, 1.12)
A E F G
incidence
Giles, G.G.,2006,BRE22430
Australia, Post-menopausalMCCS, 1990
40 - 69 Unspecified FFQ (nos)ProspectiveCohort
12273.0 9.1 years SD Units
Breast cancer ER-/PR-Post-menopausal
1.0(continuous)
10.98(0.74, 1.29)
A E F G
incidence
Sieri, S. etal.,2007,BRE80142
ItalyORDET study, 1987
34 - 70 128 Cancer registrysemi-quantitative ffq
ProspectiveCohort
8926.011.5 years /0.004
Glycemic Index,energy-adjustedglycemic index
Invasive & In situ breastcancer Post-
menopausal
>57.6vs.<53.4
51.12(0.62, 2.02)
B C D E F G
incidence
Menopausal status not specified
Navarro SilveraS.A.,2004,BRE24119
Canada, Not specified,Screening ProgramCanadian National BreastScreening Study
40 - 59
Through healthorg. (screening,healthinsurance)
FFQ (nos)ProspectiveCohort
49111.0 16.6 years overall glicemic index
Breast cancer
HRT - No>92.1vs.<63.0
41.58(0.79, 3.18)
0.27 A C D E F G
incidence
127

Author, Year,WCRF Code
Country, Ethnicity, Specialcharacteristics
Age Cases n Caseascertainment
Type of studyNon-Cases n
Lenght offollow-up / loss
Assessmentdetail
Additional details Unit Outcome Subgroup Contrast Nocat. OR (95% CI) p
valueptrend A B C D E F G
adjustments
Navarro SilveraS.A.,2004,BRE24119
Canada, Not specified,Screening ProgramCanadian National BreastScreening Study
40 - 59 1450
Through healthorg. (screening,healthinsurance)
FFQ (nos)ProspectiveCohort
811648 16.6 years overall glicemic index
Breast cancer >96.1vs.<60.0
50.88(0.63, 1.22)
0.38 A C D E F G
incidence
Sieri, S. etal.,2007,BRE80142
ItalyORDET study, 1987
34 - 70 289 Cancer registrysemi-quantitative ffq
ProspectiveCohort
8926.011.5 years /0.004
Glycemic Index,energy-adjustedglycemic index
Invasive & In situ breastcancer >57.6
vs.<53.4
51.57(1.04, 2.36)
0.04 B C D E F G
incidence
Sieri, S. etal.,2007,BRE80142
ItalyORDET study, 1987
34 - 70 147 Cancer registrysemi-quantitative ffq
ProspectiveCohort
8926.011.5 years /0.004
Glycemic Index,energy-adjustedglycemic index
Invasive & In situ breastcancer
BMI < 25>57.6vs.<53.4
52.22(1.18, 4.19)
B C D E F G
incidence
Sieri, S. etal.,2007,BRE80142
ItalyORDET study, 1987
34 - 70 142 Cancer registrysemi-quantitative ffq
ProspectiveCohort
8926.011.5 years /0.004
Glycemic Index,energy-adjustedglycemic index
Invasive & In situ breastcancer
BMI >= 25>57.6vs.<53.4
51.11(0.64, 1.94)
B C D E F G
incidence
Glycemic load
Pre-menopausal
Cho, E.,2003,BRE01651
U.S, Multi-ethnic, RegisterednursesNurses' Health study II
26 - 46 714 By MailFFQ-Semi-quantitative
ProspectiveCohort
90655 8.0 years g/day
Breast cancerPre-menopausal
211.0vs.138.0
51.06(0.78, 1.45)
0.96 C D E F G
incidence
Cho, E.,2003,BRE01651
U.S, Multi-ethnic, RegisterednursesNurses' Health study II
26 - 46 422 By MailFFQ-Semi-quantitative
ProspectiveCohort
424644 8.0 years g/day
Breast cancer Pre-menopausal& Lean
Quantile 5vs.Quantile 1
50.83(0.56, 1.24)
0.19 C D E F G
incidence
Cho, E.,2003,BRE01651
U.S, Multi-ethnic, RegisterednursesNurses' Health study II
26 - 46 291 By MailFFQ-Semi-quantitative
ProspectiveCohort
285780 8.0 years g/day
Breast cancer Pre-menopausal&Overweight
Quantile 5vs.Quantile 1
51.46(0.89, 2.39)
0.14 C D E F G
incidence
FrazierL.A.,2004,BRE02942
USA, Multi-ethnic,Registered nursesNurses' Health study II
34 - 51 361
Through healthorg. (screening,healthinsurance)
FFQ (nos)Historical Cohort 47517 9.0 years adolescent diet
Breast cancerPre-menopausal
289.0vs.202.0
51.23(0.91, 1.67)
0.14 A C D E F G
incidence
Holmes, M.D.,2004,BRE04010
U.S.A., Not specified,Registered nursesNurses' Health Study (NHS)Cohort 1976-1996
30 - 55 852 By MailFFQ-Semi-quantitative
ProspectiveCohort
53891 18.0 years / 0,04 Breadunit/day
Breast cancerPre-menopausal
186.0vs.116.0
50.87(0.7, 1.12)
0.26 A C D E F G
incidence
Navarro SilveraS.A.,2004,BRE24119
Canada, Not specified,Screening ProgramCanadian National BreastScreening Study
40 - 59
Through healthorg. (screening,healthinsurance)
FFQ (nos)ProspectiveCohort
49111.0 16.6 years g/day
Breast cancerPre-menopausal
>169.1vs.<125.0
40.96(0.76, 1.22)
0.44 A C D E F G
incidence
Holmes, M.D.,2004,BRE04010
U.S.A., Not specified,Registered nursesNurses' Health Study (NHS)Cohort 1976-1996
30 - 55 527 By MailFFQ-Semi-quantitative
ProspectiveCohort
39403 18.0 years / 0,04 Breadunit/day
Breast cancer Pre-menopausal& Lean
186.0vs.116.0
51.01(0.75, 1.35)
0.7 A C D E F G
incidence
Navarro SilveraS.A.,2004,BRE24119
Canada, Not specified,Screening ProgramCanadian National BreastScreening Study
40 - 59
Through healthorg. (screening,healthinsurance)
FFQ (nos)ProspectiveCohort
49111.0 16.6 years g/day
Breast cancer Pre-menopausal& Lean
>169.1vs.<125.0
41.01(0.76, 1.35)
0.70 A C D E F G
incidence
128

Author, Year,WCRF Code
Country, Ethnicity, Specialcharacteristics
Age Cases n Caseascertainment
Type of studyNon-Cases n
Lenght offollow-up / loss
Assessmentdetail
Additional details Unit Outcome Subgroup Contrast Nocat. OR (95% CI) p
valueptrend A B C D E F G
adjustments
Holmes, M.D.,2004,BRE04010
U.S.A., Not specified,Registered nursesNurses' Health Study (NHS)Cohort 1976-1996
30 - 55 292 By MailFFQ-Semi-quantitative
ProspectiveCohort
25129 18.0 years / 0,04 Breadunit/day
Breast cancer Pre-menopausal&Overweight
186.0vs.116.0
50.68(0.45, 1.03)
0.02 A C D E F G
incidence
Navarro SilveraS.A.,2004,BRE24119
Canada, Not specified,Screening ProgramCanadian National BreastScreening Study
40 - 59
Through healthorg. (screening,healthinsurance)
FFQ (nos)ProspectiveCohort
49111.0 16.6 years g/day
Breast cancer Pre-menopausal&Overweight
>169.1vs.<125.0
40.85(0.55, 1.31)
0.46 A C D E F G
incidence
Sieri, S. etal.,2007,BRE80142
ItalyORDET study, 1987
34 - 70 146 Cancer registrysemi-quantitative ffq
ProspectiveCohort
8926.011.5 years /0.004
Glycemic load, energy-adjusted glycemic load
Invasive & In situ breastcancer Pre-
menopausal
>133.8vs.<103.2
53.89(1.81, 8.34)
B C D E F G
incidence
Post-menopausal
Jonas, C.R.,2003,BRE04456
USA, Not specified, Post-menopausalCPS-II US cohort, 1982-1998
50 - 74 1442 UnspecifiedFFQ-Semi-quantitative
ProspectiveCohort
277265 5.0 years / 7581 Breadunit/day
Breast cancerPost-menopausal
>1.0vs.>-1.0
50.9(0.76, 1.08)
0.679
A B C D E F G
incidence
Navarro SilveraS.A.,2004,BRE24119
Canada, Not specified,Screening ProgramCanadian National BreastScreening Study
40 - 59
Through healthorg. (screening,healthinsurance)
FFQ (nos)ProspectiveCohort
49111.0 16.6 years g/day
Breast cancer
HRT - Yes>169.1vs.<125.0
41.2(0.82, 1.76)
0.37 A C D E F G
incidence
Higginbotham,S.,2004,BRE15353
USA, Not specified, ElderlyWomen's Health Study, 1993
45 - By MailFFQ-Semi-quantitative
ProspectiveCohort
38446.0 6.8 years Glucoseunit/day
Breast cancer >1.0vs.>-1.0
51.01(0.76, 1.35)
0.96 A C D E F G
incidence
Holmes, M.D.,2004,BRE04010
U.S.A., Not specified,Registered nursesNurses' Health Study (NHS)Cohort 1976-1996
30 - 55 2924 By MailFFQ-Semi-quantitative
ProspectiveCohort
76200 18.0 years / 0,04 Breadunit/day
Breast cancerPost-menopausal
>1.0vs.>-1.0
51.03(0.9, 1.16)
0.51 A C D E F G
incidence
Higginbotham,S.,2004,BRE15353
USA, Not specified, ElderlyWomen's Health Study, 1993
45 - 559 By MailFFQ-Semi-quantitative
ProspectiveCohort
38446.0 6.8 years Glucoseunit/day
Breast cancerPost-menopausal
>1.0vs.>-1.0
50.9(0.63, 1.31)
0.40 A C D E F G
incidence
Navarro SilveraS.A.,2004,BRE24119
Canada, Not specified,Screening ProgramCanadian National BreastScreening Study
40 - 59
Through healthorg. (screening,healthinsurance)
FFQ (nos)ProspectiveCohort
49111.0 16.6 years g/day
Breast cancerPost-menopausal
>169.1vs.<125.0
41.08(0.82, 1.41)
0.68 A C D E F G
incidence
Holmes, M.D.,2004,BRE04010
U.S.A., Not specified,Registered nursesNurses' Health Study (NHS)Cohort 1976-1996
30 - 55 1343 By MailFFQ-Semi-quantitative
ProspectiveCohort
47051 18.0 years / 0,04 Breadunit/day
Breast cancer Post-menopausal& Lean
>1.0vs.>-1.0
51.06(0.87, 1.28)
0.42 A C D E F G
incidence
Navarro SilveraS.A.,2004,BRE24119
Canada, Not specified,Screening ProgramCanadian National BreastScreening Study
40 - 59
Through healthorg. (screening,healthinsurance)
FFQ (nos)ProspectiveCohort
49111.0 16.6 years g/day
Breast cancer Post-menopausal& Lean
>169.1vs.<125.0
40.97(0.68, 1.39)
0.48 A C D E F G
incidence
Holmes, M.D.,2004,BRE04010
U.S.A., Not specified,Registered nursesNurses' Health Study (NHS)Cohort 1976-1996
30 - 55 1344 By MailFFQ-Semi-quantitative
ProspectiveCohort
46111 18.0 years / 0,04 Breadunit/day
Breast cancer Post-menopausal&Overweight
>1.0vs.>-1.0
50.97(0.8, 1.18)
0.95 A C D E F G
incidence
129

Author, Year,WCRF Code
Country, Ethnicity, Specialcharacteristics
Age Cases n Caseascertainment
Type of studyNon-Cases n
Lenght offollow-up / loss
Assessmentdetail
Additional details Unit Outcome Subgroup Contrast Nocat. OR (95% CI) p
valueptrend A B C D E F G
adjustments
Navarro SilveraS.A.,2004,BRE24119
Canada, Not specified,Screening ProgramCanadian National BreastScreening Study
40 - 59
Through healthorg. (screening,healthinsurance)
FFQ (nos)ProspectiveCohort
49111.0 16.6 years g/day
Breast cancer Post-menopausal&Overweight
>169.1vs.<125.0
41.22(0.82, 1.82)
0.21 A C D E F G
incidence
Higginbotham,S.,2004,BRE15353
USA, Not specified, ElderlyWomen's Health Study, 1993
45 - 338 By MailFFQ-Semi-quantitative
ProspectiveCohort
38446.0 6.8 years Glucoseunit/day
Breast cancerPre-menopausal
>1.0vs.>-1.0
51.27(0.79, 2.03)
0.27 A C D E F G
incidence
Nielsen, T.G.,2005,BRE23581
Denmark, Post-menopausalDiet, Cancer and Health,1993
50 - 65 By Mail FFQ (nos)ProspectiveCohort
23870.0 6.6 years Unit/day
Breast cancerPost-menopausal
100.0(continuous)
11.04(0.9, 1.19)
0.99 B C D E F
incidence
Nielsen, T.G.,2005,BRE23581
Denmark, Post-menopausalDiet, Cancer and Health,1993
50 - 65 By Mail FFQ (nos)ProspectiveCohort
23870.0 6.6 years Unit/day
Breast cancer ER+Post-menopausal
100.0(continuous)
10.99(0.84, 1.17)
0.99 B C D E F
incidence
Nielsen, T.G.,2005,BRE23581
Denmark, Post-menopausalDiet, Cancer and Health,1993
50 - 65 By Mail FFQ (nos)ProspectiveCohort
23870.0 6.6 years Unit/day
Breast cancer ER-Post-menopausal
100.0(continuous)
11.17(0.86, 1.59)
0.99 B C D E F
incidence
Giles, G.G.,2006,BRE22430
Australia, Post-menopausalMCCS, 1990
40 - 69 Unspecified FFQ (nos)ProspectiveCohort
12273.0 9.1 years SD Units
Breast cancerPost-menopausal
1.0(continuous)
11.19(0.93, 1.52)
A E F G
incidence
Giles, G.G.,2006,BRE22430
Australia, Post-menopausalMCCS, 1990
40 - 69 Unspecified FFQ (nos)ProspectiveCohort
12273.0 9.1 years SD Units
Breast cancer ER+/PR+Post-menopausal
1.0(continuous)
11.11(0.78, 1.59)
A E F G
incidence
Giles, G.G.,2006,BRE22430
Australia, Post-menopausalMCCS, 1990
40 - 69 Unspecified FFQ (nos)ProspectiveCohort
12273.0 9.1 years SD Units
Breast cancer ER+/PR-Post-menopausal
1.0(continuous)
11.32(0.6, 2.9)
A E F G
incidence
Giles, G.G.,2006,BRE22430
Australia, Post-menopausalMCCS, 1990
40 - 69 Unspecified FFQ (nos)ProspectiveCohort
12273.0 9.1 years SD Units
Breast cancer ER-/PR-Post-menopausal
1.0(continuous)
10.81(0.46, 1.44)
A E F G
incidence
Sieri, S. etal.,2007,BRE80142
ItalyORDET study, 1987
34 - 70 128 Cancer registrysemi-quantitative ffq
ProspectiveCohort
8926.011.5 years /0.004
Glycemic load, energy-adjusted glycemic load
Invasive & In situ breastcancer Post-
menopausal
>133.8vs.<103.2
51.67(0.8, 3.46)
B C D E F G
incidence
Menopausal status not specified
Navarro SilveraS.A.,2004,BRE24119
Canada, Not specified,Screening ProgramCanadian National BreastScreening Study
40 - 59
Through healthorg. (screening,healthinsurance)
FFQ (nos)ProspectiveCohort
49111.0 16.6 years g/day
Breast cancer
HRT - No>169.1vs.<125.0
40.94(0.65, 1.38)
0.69 A C D E F G
incidence
Navarro SilveraS.A.,2004,BRE24119
Canada, Not specified,Screening ProgramCanadian National BreastScreening Study
40 - 59 1450
Through healthorg. (screening,healthinsurance)
FFQ (nos)ProspectiveCohort
811648 16.6 years g/day
Breast cancer >175.1vs.<119.0
50.95(0.79, 1.14)
0.70 A C D E F G
incidence
130

Author, Year,WCRF Code
Country, Ethnicity, Specialcharacteristics
Age Cases n Caseascertainment
Type of studyNon-Cases n
Lenght offollow-up / loss
Assessmentdetail
Additional details Unit Outcome Subgroup Contrast Nocat. OR (95% CI) p
valueptrend A B C D E F G
adjustments
Sieri, S. etal.,2007,BRE80142
ItalyORDET study, 1987
34 - 70 289 Cancer registrysemi-quantitative ffq
ProspectiveCohort
8926.011.5 years /0.004
Glycemic load,energy-adjustedglycemic load
Invasive & In situ breastcancer >133.8
vs.<103.2
52.53(1.54, 4.16)
0.001
B C D E F G
incidence
Sieri, S. etal.,2007,BRE80142
ItalyORDET study, 1987
34 - 70 147 Cancer registrysemi-quantitative ffq
ProspectiveCohort
8926.011.5 years /0.004
Glycemic load,energy-adjustedglycemic load
Invasive & In situ breastcancer
BMI < 25>133.8vs.<103.2
55.79(2.6, 12.9)
B C D E F G
incidence
Sieri, S. etal.,2007,BRE80142
ItalyORDET study, 1987
34 - 70 142 Cancer registrysemi-quantitative ffq
ProspectiveCohort
8926.011.5 years /0.004
Glycemic load,energy-adjustedglycemic load
Invasive & In situ breastcancer
BMI >=25>133.8vs.<103.2
51.31(0.66, 2.61)
B C D E F G
incidence
5.2
Animal fat
Pre-menopausal
FrazierL.A.,2004,BRE02942
USA, Multi-ethnic,Registered nursesNurses' Health study II
34 - 51 361
Through healthorg. (screening,healthinsurance)
FFQ (nos)Historical Cohort 47517 9.0 years adolescent diet g/day
Breast cancerPre-menopausal
101.1vs.57.5
51.12(0.78, 1.61)
0.38 A C D E F G
incidence
Post-menopausal
Graham,S.,1992,BRE03424
USA, White, Post-menopausalNew York State Cohort,1980
50 - 107 344 By Mail FFQ (nos)ProspectiveCohort
17401 8.0 years g/month
Breast cancerPost-menopausal
1780.0 -10603.0vs.0 - 893.0
51.12(0.78, 1.61)
A B
incidence
Sieri,Sabina,2002,BRE20941
Italy, Not specified, Post-menopausalORDET study, 1987
41 - 70 56Throughnetwork, paper,tv
FFQ-Semi-quantitative
Nested CaseControl
214 5.5 years g/day
Breast cancerPost-menopausal
36.3 - 75.9vs.<27.6
31.84(63.0, 5.43)
0.251
B C E G
incidence
Menopausal status not specified
Kushi, L.H.,1995,BRE05142
US, Multi-ethnicIowa Women's Health Study
55 - 69 329 By MailFFQ-Semi-quantitative
ProspectiveCohort
34388.0 6.0 years g/day
Breast cancer ER+/PR+ >42.0vs.<33.2
31.02(0.78, 1.33)
0.87 A E
incidence
Kushi, L.H.,1995,BRE05142
US, Multi-ethnicIowa Women's Health Study
55 - 69 75 By MailFFQ-Semi-quantitative
ProspectiveCohort
34388.0 6.0 years g/day
Breast cancer ER+/PR- >42.0vs.<33.2
31.41(0.76, 2.63)
0.79 A E
incidence
Kushi, L.H.,1995,BRE05142
US, Multi-ethnicIowa Women's Health Study
55 - 69 11 By MailFFQ-Semi-quantitative
ProspectiveCohort
34388.0 6.0 years g/day
Breast cancer ER-/PR+ >42.0vs.<33.2
31.22(0.27, 5.45)
0.79 A E
incidence
Kushi, L.H.,1995,BRE05142
US, Multi-ethnicIowa Women's Health Study
55 - 69 61 By MailFFQ-Semi-quantitative
ProspectiveCohort
34388.0 6.0 years g/day
Breast cancer ER-/PR- >42.0vs.<33.2
30.79(0.42, 1.46)
0.47 A E
incidence
131

Author, Year,WCRF Code
Country, Ethnicity, Specialcharacteristics
Age Cases n Caseascertainment
Type of studyNon-Cases n
Lenght offollow-up / loss
Assessmentdetail
Additional details Unit Outcome Subgroup Contrast Nocat. OR (95% CI) p
valueptrend A B C D E F G
adjustments
Voorrips, L.E.,2002,BRE13011
The Netherlands, Notspecified, Post-menopausalwomenThe Netherlands Cohort
55 - 69 783 By MailFFQ-Semi-quantitative
Case Cohort 62573.0 6.3 years g/day
Breast cancer 71.0vs.35.0
51.05(0.79, 1.4)
0.87 A B C D E F G
incidence
FrazierL.A.,2003,BRE02941
USA, Multi-ethnic,Registered nursesNurses' Health Study (NHS)Cohort 1976-1996
40 - 65
Through healthorg. (screening,healthinsurance)
FFQ (nos)Nested CaseControl
121700.0 10.0 years adolescent g/day
Breast cancer 84.7vs.25.5
51.01(null, null)
.96 A C D E F G
incidence
Cholesterol
Pre-menopausal
Willett, W.C.,1987,BRE13442
US, Not specified,Registered nursesNurses' Health Study (NHS)Cohort 1976-1996
34 - 59 By MailFFQ-Semi-quantitative
ProspectiveCohort
89538.0
4.0 years / 9,235(10% do notreturn the FUquestionnaire)
Breast cancerPre-menopausal
Quantile 5vs.Quantile 1
51.0(null, null)
0.76 A C D E F G
incidence
Willett, W.C.,1992,BRE13438
U.S, Not specified,Registered nursesNurses' Health Study (NHS)Cohort 1976-1996
30 - 55 527 By MailFFQ-Semi-quantitative
ProspectiveCohort
89494.0 8.0 yearsBreast cancer
Pre-menopausal
Quantile 5vs.Quantile 1
51.23(0.93, 1.62)
0.11 A C D E F G
incidence
Holmes, M.D.,1999,BRE04008
US, Multi-ethnic, RegisterednursesNurses' Health Study (NHS)Cohort 1976-1996
30 - 55 By MailFFQ-Semi-quantitative
ProspectiveCohort
121700.0 14.0 years 100mg/1000kcalmg/1000kcal/day
Invasive breast cancerPre-menopausal
100.0(continuous)
11.09(0.98, 1.21)
A C D E F G
incidence
Cho, E.,2003,BRE17370
US, Multi-ethnic, Pre-menopausalNHS II, 1989
25 - 42 714 By MailFFQ-Semi-quantitative
ProspectiveCohort
90655 8.0 years mg/1000Kcal
Invasive breast cancerPre-menopausal
178.0vs.93.0
51.16(0.87, 1.55)
.14 A C D E F G
incidence
Post-menopausal
Willett, W.C.,1987,BRE13442
US, Not specified,Registered nursesNurses' Health Study (NHS)Cohort 1976-1996
34 - 59 By MailFFQ-Semi-quantitative
ProspectiveCohort
89538.0
4.0 years / 9,235(10% do notreturn the FUquestionnaire)
Breast cancerPost-menopausal
Quantile 5vs.Quantile 1
50.86(null, null)
0.62 A C D E F G
incidence
Kushi L.H.,1992,BRE05141
US, Multi-ethnic, Post-menopausalIowa Women's Health Study
55 - 69 459 By MailFFQ-Semi-quantitative
ProspectiveCohort
130442 4.0 years / 1086 mg/day
Breast cancerPost-menopausal
394.4vs.201.8
41.24(0.87, 1.76)
0.2 A C D E F G
incidence
Willett, W.C.,1992,BRE13438
U.S, Not specified,Registered nursesNurses' Health Study (NHS)Cohort 1976-1996
30 - 55 774 By MailFFQ-Semi-quantitative
ProspectiveCohort
89494.0 8.0 yearsBreast cancer
Post-menopausal
Quantile 5vs.Quantile 1
50.92(0.73, 1.15)
0.67 A C D E F G
incidence
Holmes, M.D.,1999,BRE04008
US, Multi-ethnic, RegisterednursesNurses' Health Study (NHS)Cohort 1976-1996
30 - 55 By MailFFQ-Semi-quantitative
ProspectiveCohort
121700.0 14.0 years 100mg/1000kcalmg/1000kcal/day
Invasive breast cancerPost-menopausal
100.0(continuous)
10.96(0.88, 1.04)
A C D E F G
incidence
Menopausal status not specified
Jones, D.Y.,1987,BRE04461
US, Multi-ethnicNHANES I, 1971
25 - 74 86Generalpopulation(survey)
24h RecallProspectiveCohort
4902 10.0 years / 776 mg/day
Breast cancer >415.0vs.<129.9
40.7(0.36, 1.37)
0.12 A B C D F
incidence
132

Author, Year,WCRF Code
Country, Ethnicity, Specialcharacteristics
Age Cases n Caseascertainment
Type of studyNon-Cases n
Lenght offollow-up / loss
Assessmentdetail
Additional details Unit Outcome Subgroup Contrast Nocat. OR (95% CI) p
valueptrend A B C D E F G
adjustments
Willett, W.C.,1987,BRE13442
US, Not specified,Registered nursesNurses' Health Study (NHS)Cohort 1976-1996
34 - 59 601 By MailFFQ-Semi-quantitative
ProspectiveCohort
89538
4.0 years / 9,235(10% do notreturn the FUquestionnaire)
g/day
Breast cancer Quantile 5vs.Quantile 1
50.91(0.7, 1.18)
0.43 A C D E F G
incidence
Knekt,P.,1990,BRE04898
Finland, Not specified,Screening ProgramMobile Clinic HealthExamination Survey, 1973
20 - 69
Through healthorg. (screening,healthinsurance)
Dietary Historyquestionnaire
ProspectiveCohort
3988.0 20.0 years mg/day
Breast cancer >450.0vs.<315.0
32.21(0.97, 5.02)
0.09 A E
incidence
Willett, W.C.,1992,BRE13438
U.S, Not specified,Registered nursesNurses' Health Study (NHS)Cohort 1976-1996
30 - 55 1439 By MailFFQ-Semi-quantitative
ProspectiveCohort
692674 8.0 years mg/day
Breast cancer >408.0vs.<246.9
51.0(0.85, 1.18)
0.80 A C D E F G
incidence
Van den Brandt,P.A.,1993,BRE16919
the Netherlands, Notspecified, Post-menopausalwomenThe Netherlands Cohort
55 - 69 437 By MailFFQ-Semi-quantitative
ProspectiveCohort
51873.3 years / nolost g/day
Invasive breast cancer >1.0vs.>-1.0
51.09(0.74, 1.61)
0.59 A B C D E F G
incidence
Kushi, L.H.,1995,BRE05142
US, Multi-ethnicIowa Women's Health Study
55 - 69 329 By MailFFQ-Semi-quantitative
ProspectiveCohort
34388.0 6.0 years mg/day
Breast cancer ER+/PR+ >318.0vs.<243.0
31.12(0.85, 1.45)
0.43 A E
incidence
Kushi, L.H.,1995,BRE05142
US, Multi-ethnicIowa Women's Health Study
55 - 69 75 By MailFFQ-Semi-quantitative
ProspectiveCohort
34388.0 6.0 years mg/day
Breast cancer ER+/PR- >318.0vs.<243.0
30.97(0.55, 1.69)
0.92 A E
incidence
Kushi, L.H.,1995,BRE05142
US, Multi-ethnicIowa Women's Health Study
55 - 69 14 By MailFFQ-Semi-quantitative
ProspectiveCohort
34388.0 6.0 years mg/day
Breast cancer ER-/PR+ >318.0vs.<243.0
30.56(0.13, 2.36)
0.49 A E
incidence
Kushi, L.H.,1995,BRE05142
US, Multi-ethnicIowa Women's Health Study
55 - 69 61 By MailFFQ-Semi-quantitative
ProspectiveCohort
34388.0 6.0 years mg/day
Breast cancer ER-/PR- >318.0vs.<243.0
31.03(0.52, 2.02)
0.98 A E
incidence
Holmes, M.D.,1999,BRE04008
US, Multi-ethnic, RegisterednursesNurses' Health Study (NHS)Cohort 1976-1996
30 - 55 By MailFFQ-Semi-quantitative
ProspectiveCohort
121700.0 14.0 years mg/1000kcal/day
Invasive breast cancer100.0(continuous)
11.0(0.94, 1.06)
A C D E F G
incidence
Cis unsaturated fatty acids
Menopausal status not specified
Voorrips, L.E.,2002,BRE13011
The Netherlands, Notspecified, Post-menopausalwomenThe Netherlands Cohort
55 - 69 783 By MailFFQ-Semi-quantitative
Case Cohort 62573.0 6.3 years g/day
Breast cancer 45.0vs.26.0
50.79(0.54, 1.17)
.04 A B C D E F G
incidence
Erythrocyte 20:4/20:3
Post-menopausal
Wirfalt,E.,2004,BRE17083
Sweden, Not specified, Post-menopausalMalmo Diet and Cancer,1991
50 - By Mail7-day Record +Questionnaire
Nested CaseControl
12803.0 8.0 years Unit
Breast cancerPost-menopausal
1.0(continuous)
11.06(0.97, 1.17)
0.192
incidence
133

Author, Year,WCRF Code
Country, Ethnicity, Specialcharacteristics
Age Cases n Caseascertainment
Type of studyNon-Cases n
Lenght offollow-up / loss
Assessmentdetail
Additional details Unit Outcome Subgroup Contrast Nocat. OR (95% CI) p
valueptrend A B C D E F G
adjustments
Erythrocyte n-3/n-6
Post-menopausal
Wirfalt,E.,2004,BRE17083
Sweden, Not specified, Post-menopausalMalmo Diet and Cancer,1991
50 - By Mail7-day Record +Questionnaire
Nested CaseControl
12803.0 8.0 years Unit
Breast cancerPost-menopausal
1.0(continuous)
10.96(0.78, 1.18)
0.698
incidence
Erythrocyte Oleic acid/stearic acid
Post-menopausal
Pala V.,2001,BRE20601Italy, CaucasianORDET study, 1987
42 - 69 71Nested CaseControl
141 5.5 years saturation index**
Breast cancerPost-menopausal
>1.3vs.<1.18
30.29(0.13, 0.64)
.00incidence
Wirfalt,E.,2004,BRE17083
Sweden, Not specified, Post-menopausalMalmo Diet and Cancer,1991
50 - By Mail7-day Record +Questionnaire
Nested CaseControl
12803.0 8.0 years %
Breast cancerPost-menopausal
0.1(continuous)
11.03(0.8, 1.32)
0.843
incidence
Wirfalt,E.,2004,BRE17083
Sweden, Not specified, Post-menopausalMalmo Diet and Cancer,1991
50 - By Mail7-day Record +Questionnaire
Nested CaseControl
12803.0 8.0 years %
Breast cancerPost-menopausal
0.1(continuous)
10.79(0.45, 1.39)
0.420
incidence
Erythrocyte Palmitoleicic acid/Palmitic acid
Post-menopausal
Pala V.,2001,BRE20601Italy, CaucasianORDET study, 1987
42 - 69 71Nested CaseControl
141 5.5 years saturation index n-7
Breast cancerPost-menopausal
>53.01vs.<42.98
30.55(0.26, 1.17)
.11cancer death
Wirfalt,E.,2004,BRE17083
Sweden, Not specified, Post-menopausalMalmo Diet and Cancer,1991
50 - By Mail7-day Record +Questionnaire
Nested CaseControl
12803.0 8.0 years Unit
Breast cancerPost-menopausal
0.1(continuous)
10.99(0.98, 1.01)
0.346
incidence
Fat
Post-menopausal
Sonestedt, E. etal.,2007,BRE80147
SwedenMalmo Diet and Cancer,1991
45 - 73 152 Cancer registrydiet historyquestionnaire
ProspectiveCohort
11726.0 9.5 years Dietary fat intake g/day
Breast cancerPost-meno &BMI >=27
96.1vs.62.5
50.72(0.42, 1.23)
0.48 A G
incidence
Sonestedt, E. etal.,2007,BRE80147
SwedenMalmo Diet and Cancer,1991
45 - 73 276 Cancer registrydiet historyquestionnaire
ProspectiveCohort
11726.0 9.5 years Dietary fat intake g/day
Breast cancerPost-meno &BMI<27
96.1vs.62.5
51.59(1.09, 2.32)
0.015
A G
incidence
Sonestedt, E. etal.,2007,BRE80147
SwedenMalmo Diet and Cancer,1991
45 - 73 124 Cancer registrydiet historyquestionnaire
ProspectiveCohort
11726.0 9.5 years Dietary fat intake g/day
Breast cancer Post-meno,dietarychange
96.1vs.62.5
51.25(0.72, 2.19)
0.48 A E G
incidence
134

Author, Year,WCRF Code
Country, Ethnicity, Specialcharacteristics
Age Cases n Caseascertainment
Type of studyNon-Cases n
Lenght offollow-up / loss
Assessmentdetail
Additional details Unit Outcome Subgroup Contrast Nocat. OR (95% CI) p
valueptrend A B C D E F G
adjustments
Sonestedt, E. etal.,2007,BRE80147
SwedenMalmo Diet and Cancer,1991
45 - 73 304 Cancer registrydiet historyquestionnaire
ProspectiveCohort
11726.0 9.5 years Dietary fat intake g/day
Breast cancer Post-meno,no dietarychange
96.1vs.62.5
51.22(0.85, 1.77)
0.14 A E G
incidence
Sonestedt, E. etal.,2007,BRE80147
SwedenMalmo Diet and Cancer,1991
45 - 73 428 Cancer registrydiet historyquestionnaire
ProspectiveCohort
11726.0 9.5 years Dietary fat intake g/day
Breast cancerPost-menopausal
96.1vs.62.5
51.21(0.9, 1.64)
0.14 A E G
incidence
Fat from fermented milk products
Post-menopausal
Wilfart, E etal.,2005,BRE11111
Sweden, Post menopausalMalmo Diet and Cancer,1991
50 - (59) 237 Cancer registry7-day Record +Questionnaire
Nested CaseControl
673Energy-adjusted fatintakes from fermentedmilk products
g/day
Breast cancerPost-menopausal
Highvs.Zero
30.63(0.42, 0.94)
0.006
B C D E F G
incidence
Wilfart, E etal.,2005,BRE11111
Sweden, Post menopausalMalmo Diet and Cancer,1991
50 - (59) 237 Cancer registry7-day Record +Questionnaire
Nested CaseControl
673
Fat from fermentedmilk products, adjustedfor SFA, lowestexposure category
g/day
Breast cancerPost-menopausal
Highvs.Zero
30.62(0.42, 0.93)
0.006
B C D E F G
incidence
Wilfart, E etal.,2005,BRE11111
Sweden, Post menopausalMalmo Diet and Cancer,1991
50 - (59) 237 Cancer registry7-day Record +Questionnaire
Nested CaseControl
673
Fat from fermentedmilk products, adjustedfor MUFA, lowestexposure category
g/day
Breast cancerPost-menopausal
Highvs.Zero
30.65(0.43, 0.97)
0.008
B C D E F G
incidence
Wilfart, E etal.,2005,BRE11111
Sweden, Post menopausalMalmo Diet and Cancer,1991
50 - (59) 237 Cancer registry7-day Record +Questionnaire
Nested CaseControl
673
Fat from fermentedmilk products, adjustedfor omega6PUFA,lowest exposure
g/day
Breast cancerPost-menopausal
Highvs.Zero
30.7(0.46, 1.05)
0.021
B C D E F G
incidence
Wilfart, E etal.,2005,BRE11111
Sweden, Post menopausalMalmo Diet and Cancer,1991
50 - (59) 237 Cancer registry7-day Record +Questionnaire
Nested CaseControl
673
Fat from fermentedmilk products, adjustedfor omega3PUFA,lowest exposure
g/day
Breast cancerPost-menopausal
Highvs.Zero
30.64(0.43, 0.96)
0.009
B C D E F G
incidence
Fat/Fiber
Menopausal status not specified
Horn-Ross,P.L.,2002,BRE15412
USA, Multi-ethnic,Registered teachersCalifornia Teachers Study,1995
21 - 103 By Mail FFQ (nos)ProspectiveCohort
111383.0 2.0 yearsInvasive breast cancer Quantile 5
vs.<2.5
51.1(0.8, 1.4)
0.7 A C D E F G
incidence
n-3/n-6 fatty acids
Post-menopausal
Wirfalt,E.,2002,BRE13504
Sweden, Not specified, Post-menopausalMalmo Diet and Cancer,1991
50 - 237 By Mail7-day Record +Questionnaire
Nested CaseControl
673 8.0 years g/day
Breast cancerPost-menopausal
0.33vs.0.15
50.66(0.41, 1.08)
0.137
B C D E F
incidence
Wirfalt,E.,2004,BRE17083
Sweden, Not specified, Post-menopausalMalmo Diet and Cancer,1991
50 - By Mail7-day Record +Questionnaire
Nested CaseControl
12803.0 8.0 years percent of total fattyacids
Breast cancerPost-menopausal
1null(null, null)
incidence
135

Author, Year,WCRF Code
Country, Ethnicity, Specialcharacteristics
Age Cases n Caseascertainment
Type of studyNon-Cases n
Lenght offollow-up / loss
Assessmentdetail
Additional details Unit Outcome Subgroup Contrast Nocat. OR (95% CI) p
valueptrend A B C D E F G
adjustments
Polyunsaturated/Saturated fatty acids
Post-menopausal
Barrett-Connor,E.,1993,BRE00581
U.S, WhiteRancho Bernardo, 1972
40 - 79 15
Through socialorganization(profession,religion)
24h RecallProspectiveCohort
575 15.0 yearsBreast cancer
Post-menopausal
1null(null, null)
incidence
Wirfalt,E.,2002,BRE13504
Sweden, Not specified, Post-menopausalMalmo Diet and Cancer,1991
50 - 237 By Mail7-day Record +Questionnaire
Nested CaseControl
673 8.0 years /day
Breast cancerPost-menopausal
0.55vs.0.22
51.86(1.13, 3.07)
0.009
B C D E F
incidence
Wirfalt,E.,2004,BRE17083
Sweden, Not specified, Post-menopausalMalmo Diet and Cancer,1991
50 - By Mail7-day Record +Questionnaire
Nested CaseControl
12803.0 8.0 years percent of total fattyacids
Breast cancerPost-menopausal
1null(null, null)
incidence
Wirfalt,E.,2004,BRE17083
Sweden, Not specified, Post-menopausalMalmo Diet and Cancer,1991
50 - By Mail7-day Record +Questionnaire
Nested CaseControl
12803.0 8.0 years Unit
Breast cancerPost-menopausal
0.1(continuous)
10.98(0.72, 1.35)
0.916
incidence
Menopausal status not specified
Knekt,P.,1990,BRE04898
Finland, Not specified,Screening ProgramMobile Clinic HealthExamination Survey, 1973
20 - 69
Through healthorg. (screening,healthinsurance)
Dietary Historyquestionnaire
ProspectiveCohort
3988.0 20.0 yearsBreast cancer >0.14
vs.<0.1
31.5(0.77, 2.93)
0.38 A E
incidence
Serum 18:2,n-6/20:4,n-6
Menopausal status not specified
Chajes,V.,1999,BRE14597
Sweden, Not specifiedVIP + MONICA + MSP
UnspecifiedNested CaseControl
29708.0 11.0 years %
Breast cancer >1.0vs.>-1.0
41.95(0.9, 4.24)
0.135
C D F
incidence
Serum 20:5,n-3/20:4,n-6
Menopausal status not specified
Chajes,V.,1999,BRE14597
Sweden, Not specifiedVIP + MONICA + MSP
UnspecifiedNested CaseControl
29708.0 11.0 years %
Breast cancer >1.0vs.>-1.0
40.88(0.42, 1.86)
0.591
C D F
incidence
Serum Palmitic acid/Palmitoleic acid
Pre-menopausal
Saadatian-Elahi,M.,2002,BRE21486
US, Not specifiedNew York Women's HealthStudy, 1985
34 - 65 91Throughnetwork, paper,tv
Nested CaseControl
91 4.3 years %
Breast cancerPre-menopausal
>1.0vs.>-1.0
40.68(0.26, 1.79)
0.73 A C F G
incidence
Post-menopausal
136

Author, Year,WCRF Code
Country, Ethnicity, Specialcharacteristics
Age Cases n Caseascertainment
Type of studyNon-Cases n
Lenght offollow-up / loss
Assessmentdetail
Additional details Unit Outcome Subgroup Contrast Nocat. OR (95% CI) p
valueptrend A B C D E F G
adjustments
Saadatian-Elahi,M.,2002,BRE21486
US, Not specifiedNew York Women's HealthStudy, 1985
34 - 65 106Throughnetwork, paper,tv
Nested CaseControl
106 4.3 years %
Breast cancerPost-menopausal
>1.0vs.>-1.0
40.96(0.39, 2.33)
0.89 A C F G
incidence
Menopausal status not specified
Saadatian-Elahi,M.,2002,BRE21486
US, Not specifiedNew York Women's HealthStudy, 1985
34 - 65Throughnetwork, paper,tv
Nested CaseControl
null 4.3 years %
Breast cancer >1.0vs.>-1.0
40.83(0.44, 1.55)
0.74 A C F G
incidence
Serum PUFA/SFA
Pre-menopausal
Vatten, L.J.,1993,BRE12821
Norway, Not specifiedNorway Serum Bank, 1973
65Throughnetwork, paper,tv
Nested CaseControl
195 18.0 years mg/liter
Breast cancerPre-menopausal
>1.0vs.>-1.0
40.6(0.3, 1.3)
0.33incidence
Saadatian-Elahi,M.,2002,BRE21486
US, Not specifiedNew York Women's HealthStudy, 1985
34 - 65 91Throughnetwork, paper,tv
Nested CaseControl
91 4.3 years %
Breast cancerPre-menopausal
>1.0vs.>-1.0
40.45(0.17, 1.23)
0.21 A C E G
incidence
Post-menopausal
Saadatian-Elahi,M.,2002,BRE21486
US, Not specifiedNew York Women's HealthStudy, 1985
34 - 65 106Throughnetwork, paper,tv
Nested CaseControl
106 4.3 years %
Breast cancerPost-menopausal
>1.0vs.>-1.0
41.17(0.49, 2.76)
0.27 A C E G
incidence
Menopausal status not specified
Saadatian-Elahi,M.,2002,BRE21486
US, Not specifiedNew York Women's HealthStudy, 1985
34 - 65Throughnetwork, paper,tv
Nested CaseControl
null 4.3 years %
Breast cancer >1.0vs.>-1.0
40.65(0.34, 1.22)
0.12 A C E G
incidence
Serum Stearic acid/Oleic acid
Pre-menopausal
Saadatian-Elahi,M.,2002,BRE21486
US, Not specifiedNew York Women's HealthStudy, 1985
34 - 65 91Throughnetwork, paper,tv
Nested CaseControl
91 4.3 years %
Breast cancerPre-menopausal
>1.0vs.>-1.0
41.29(0.5, 3.28)
0.43 A C F G
incidence
Post-menopausal
Saadatian-Elahi,M.,2002,BRE21486
US, Not specifiedNew York Women's HealthStudy, 1985
34 - 65 106Throughnetwork, paper,tv
Nested CaseControl
106 4.3 years %
Breast cancerPost-menopausal
>1.0vs.>-1.0
40.6(0.24, 1.49)
0.25 A C F G
incidence
Menopausal status not specified
Chajes,V.,1999,BRE14597
Sweden, Not specifiedVIP + MONICA + MSP
UnspecifiedNested CaseControl
29708.0 11.0 years %
Breast cancer >1.0vs.>-1.0
40.5(0.23, 1.1)
0.064
C D F
incidence
137

Author, Year,WCRF Code
Country, Ethnicity, Specialcharacteristics
Age Cases n Caseascertainment
Type of studyNon-Cases n
Lenght offollow-up / loss
Assessmentdetail
Additional details Unit Outcome Subgroup Contrast Nocat. OR (95% CI) p
valueptrend A B C D E F G
adjustments
Saadatian-Elahi,M.,2002,BRE21486
US, Not specifiedNew York Women's HealthStudy, 1985
34 - 65Throughnetwork, paper,tv
Nested CaseControl
null 4.3 years %
Breast cancer >1.0vs.>-1.0
40.85(0.46, 1.59)
0.72 A C F G
incidence
Serum Total fat
Pre-menopausal
Vatten, L.J.,1993,BRE12821
Norway, Not specifiedNorway Serum Bank, 1973
65Throughnetwork, paper,tv
Nested CaseControl
195 18.0 yearsBreast cancer
Pre-menopausal
>1.0vs.>-1.0
40.5(0.2, 1.2)
0.06incidence
Menopausal status not specified
Vatten, L.J.,1993,BRE12821
Norway, Not specifiedNorway Serum Bank, 1973
Throughnetwork, paper,tv
Nested CaseControl
170000.0 18.0 yearsBreast cancer
1null(null, null)
incidence
Total fat
Pre-menopausal
Löf, M. etal.,2007,BRE80144
SwedenWomen's Lifestyle andHealth Study
30 - 49 432 Cancer registry FFQProspectiveCohort
44137 13.0 years Total fat intake g/day
Invasive breast cancer
Age < 50 yrs80.7vs.30.8
51.46(0.87, 2.47)
0.1 A B C D E F
incidence
Post-menopausal
Löf, M. etal.,2007,BRE80144
SwedenWomen's Lifestyle andHealth Study
30 - 49 542 Cancer registry FFQProspectiveCohort
29590 13.0 years Total fat intake g/day
Invasive breast cancerAge >= 50yrs
80.2vs.30.8
50.76(0.47, 1.22)
0.34 A B C D E F
incidence
Menopausal status not specified
Löf, M. etal.,2007,BRE80144
SwedenWomen's Lifestyle andHealth Study
30 - 49 974 Cancer registry FFQProspectiveCohort
43595 13.0 years Total fat intake g/day
Invasive breast cancer 80.7vs.30.8
51.02(0.72, 1.45)
0.7 A B C D E F
incidence
Total fat (as nutrients)
Pre-menopausal
Willett, W.C.,1987,BRE13442
US, Not specified,Registered nursesNurses' Health Study (NHS)Cohort 1976-1996
34 - 59 By MailFFQ-Semi-quantitative
ProspectiveCohort
89538.0
4.0 years / 9,235(10% do notreturn the FUquestionnaire)
Breast cancerPre-menopausal
Quantile 5vs.Quantile 1
50.93(null, null)
0.78 A C D E F G
incidence
Willett, W.C.,1992,BRE13438
U.S, Not specified,Registered nursesNurses' Health Study (NHS)Cohort 1976-1996
30 - 55 527 By MailFFQ-Semi-quantitative
ProspectiveCohort
89494.0 8.0 years g/day
Breast cancerPre-menopausal
Quantile 5vs.Quantile 1
50.96(0.73, 1.26)
0.76 A C D E F G
incidence
FrazierL.A.,2004,BRE02942
USA, Multi-ethnic,Registered nursesNurses' Health study II
34 - 51 361
Through healthorg. (screening,healthinsurance)
FFQ (nos)Historical Cohort 47517 9.0 years adolescent diet g/day
Breast cancerPre-menopausal
140.7vs.107.0
50.91(0.67, 1.24)
0.68 A C D E F G
incidence
138

Author, Year,WCRF Code
Country, Ethnicity, Specialcharacteristics
Age Cases n Caseascertainment
Type of studyNon-Cases n
Lenght offollow-up / loss
Assessmentdetail
Additional details Unit Outcome Subgroup Contrast Nocat. OR (95% CI) p
valueptrend A B C D E F G
adjustments
Post-menopausal
Willett, W.C.,1987,BRE13442
US, Not specified,Registered nursesNurses' Health Study (NHS)Cohort 1976-1996
34 - 59 By MailFFQ-Semi-quantitative
ProspectiveCohort
89538.0
4.0 years / 9,235(10% do notreturn the FUquestionnaire)
Breast cancerPost-menopausal
Quantile 5vs.Quantile 1
50.77(null, null)
0.22 A C D E F G
incidence
Howe, G.R.,1991,BRE17622
canada, Multi-ethnic,Screening ProgramNBSS, 1980
40 - 59 287
Through healthorg. (screening,healthinsurance)
Dietary Historyquestionnaire
Nested CaseControl
56837.0 5.0 years g/day
Breast cancerPost-menopausal
77.0(continuous)
11.17(0.79, 1.72)
A E G
incidence
Kushi L.H.,1992,BRE05141
US, Multi-ethnic, Post-menopausalIowa Women's Health Study
55 - 69 459 By MailFFQ-Semi-quantitative
ProspectiveCohort
130443 4.0 years / 1086 g/day
Breast cancerPost-menopausal
80.7vs.56.6
41.38(0.86, 2.21)
0.18 A C D E F G
incidence
Willett, W.C.,1992,BRE13438
U.S, Not specified,Registered nursesNurses' Health Study (NHS)Cohort 1976-1996
30 - 55 774 By MailFFQ-Semi-quantitative
ProspectiveCohort
89494.0 8.0 years g/day
Breast cancerPost-menopausal
Quantile 5vs.Quantile 1
50.91(0.73, 1.14)
0.61 A C D E F G
incidence
Graham,S.,1992,BRE03424
USA, White, Post-menopausalNew York State Cohort,1980
50 - 107 344 By Mail FFQ (nos)ProspectiveCohort
17401 8.0 years g/month
Breast cancerPost-menopausal
2344.0 -13422.0vs.0 - 1268.0
50.99(0.69, 1.41)
A B
incidence
Barrett-Connor,E.,1993,BRE00581
U.S, WhiteRancho Bernardo, 1972
40 - 79 15
Through socialorganization(profession,religion)
24h RecallProspectiveCohort
575 15.0 years g/day
Breast cancerPost-menopausal
28.0(continuous)
12.01(1.19, 3.41)
A C D E
incidence
Wirfalt,E.,2002,BRE13504
Sweden, Not specified, Post-menopausalMalmo Diet and Cancer,1991
50 - 237 By Mail7-day Record +Questionnaire
Nested CaseControl
673 8.0 years g/day
Breast cancerPost-menopausal
105.0vs.69.0
51.51(0.92, 2.49)
0.019
B C D E F
incidence
Sieri,Sabina,2002,BRE20941
Italy, Not specified, Post-menopausalORDET study, 1987
41 - 70 56Throughnetwork, paper,tv
FFQ-Semi-quantitative
Nested CaseControl
214 5.5 years g/day
Breast cancerPost-menopausal
62.8 - 146.6vs.<54.3
33.47(1.43, 8.44)
0.005
B C E G
incidence
Byrne,C.,2002,BRE01315
U.S, Multi-ethnic, Post-menopausalNurses' Health Study (NHS)Cohort 1976-1996
(57) 1071 By MailFFQ-Semi-quantitative
ProspectiveCohort
44697 14.0 years g/day
Invasive breast cancerPost-menopausal
Quantile 5vs.Quantile 1
50.94(0.77, 1.15)
0.57 A C D E F G
incidence
Mattisson,I.,2004,BRE17807
Sweden, Not specified, Post-menopausalMalmo Diet and Cancer,1991
50 - 342
Through healthorg. (screening,healthinsurance)
7-day Record +Questionnaire
ProspectiveCohort
11328 7.6 years g/day
Breast cancerPost-menopausal
100.0vs.65.0
51.34(0.94, 1.9)
0.018
A B C D E F G
incidence
Menopausal status not specified
Kinlen, L.J.,1982,BRE17702
Britain, Not specified,Religious OrdersBritain, 1978
- 85 31
Through socialorganization(profession,religion)
Historical Cohort 2813.0 66.0 years estimated in no meatgroup (1769)
g/week
Breast cancer not knowvs.low
41.33(null, null)
A
cancer death
Jones, D.Y.,1987,BRE04461
US, Multi-ethnicNHANES I, 1971
25 - 74 86Generalpopulation(survey)
24h RecallProspectiveCohort
4912 10.0 years / 776 g/day
Breast cancer >74.0vs.<37.9
40.34(0.16, 0.73)
0.03 A B C D F
incidence
139

Author, Year,WCRF Code
Country, Ethnicity, Specialcharacteristics
Age Cases n Caseascertainment
Type of studyNon-Cases n
Lenght offollow-up / loss
Assessmentdetail
Additional details Unit Outcome Subgroup Contrast Nocat. OR (95% CI) p
valueptrend A B C D E F G
adjustments
Willett, W.C.,1987,BRE13442
US, Not specified,Registered nursesNurses' Health Study (NHS)Cohort 1976-1996
34 - 59 601 By MailFFQ-Semi-quantitative
ProspectiveCohort
89538
4.0 years / 9,235(10% do notreturn the FUquestionnaire)
g/day
Breast cancer Quantile 5vs.Quantile 1
50.82(0.64, 1.05)
0.11 A C D E F G
incidence
Knekt,P.,1990,BRE04898
Finland, Not specified,Screening ProgramMobile Clinic HealthExamination Survey, 1973
20 - 69
Through healthorg. (screening,healthinsurance)
Dietary Historyquestionnaire
ProspectiveCohort
3988.0 20.0 years g/day
Breast cancer >97.3vs.<71.1
31.72(0.61, 4.82)
0.10 A E
incidence
Howe, G.R.,1991,BRE17622
canada, Multi-ethnic,Screening ProgramNBSS, 1980
40 - 59
Through healthorg. (screening,healthinsurance)
Dietary Historyquestionnaire
Nested CaseControl
56837.0 5.0 years g/day
Breast cancer77.0(continuous)
11.35(1.0, 1.82)
A E G
incidence
Willett, W.C.,1992,BRE13438
U.S, Not specified,Registered nursesNurses' Health Study (NHS)Cohort 1976-1996
30 - 55 1240 By MailFFQ-Semi-quantitative
ProspectiveCohort
89494.0 8.0 yearsBreast cancer Family
History BC -No
Quantile 5vs.Quantile 1
50.94(null, null)
0.73 A C D E F G
incidence
Willett, W.C.,1992,BRE13438
U.S, Not specified,Registered nursesNurses' Health Study (NHS)Cohort 1976-1996
30 - 55 199 By MailFFQ-Semi-quantitative
ProspectiveCohort
89494.0 8.0 yearsBreast cancer Family
History BC -Yes
Quantile 5vs.Quantile 1
50.66(null, null)
0.26 A C D E F G
incidence
Willett, W.C.,1992,BRE13438
U.S, Not specified,Registered nursesNurses' Health Study (NHS)Cohort 1976-1996
30 - 55 203 By MailFFQ-Semi-quantitative
ProspectiveCohort
89494.0 8.0 yearsBreast cancer
LeanQuantile 5vs.Quantile 1
51.06(null, null)
0.91 A C D E F G
incidence
Willett, W.C.,1992,BRE13438
U.S, Not specified,Registered nursesNurses' Health Study (NHS)Cohort 1976-1996
30 - 55 1439 By MailFFQ-Semi-quantitative
ProspectiveCohort
692676 8.0 years g/day
Breast cancer >82.0vs.<57.9
50.9(0.77, 1.07)
0.47 A C D E F G
incidence
Willett, W.C.,1992,BRE13438
U.S, Not specified,Registered nursesNurses' Health Study (NHS)Cohort 1976-1996
30 - 55 980 By MailFFQ-Semi-quantitative
ProspectiveCohort
89494.0 8.0 yearsBreast cancer
OverweightQuantile 5vs.Quantile 1
50.9(null, null)
0.56 A C D E F G
incidence
Giovannucci,E.,1993,BRE03262
US, Not specified,Registered nursesNurses' Health Study (NHS)Cohort 1976-1996
30 - 55 392 By MailFFQ-Semi-quantitative
Nested CaseControl
786 2.0 years g/day
Breast cancer Quantile 5vs.Quantile 1
50.64(0.43, 0.96)
0.07 A E
incidence
Giovannucci,E.,1993,BRE03262
US, Not specified,Registered nursesNurses' Health Study (NHS)Cohort 1976-1996
30 - 55 By MailFFQ-Semi-quantitative
Nested CaseControl
95000.0 2.0 years g/day
Breast cancer100.0(continuous)
11.04(0.64, 1.68)
A
incidence
Van den Brandt,P.A.,1993,BRE16919
the Netherlands, Notspecified, Post-menopausalwomenThe Netherlands Cohort
55 - 69 437 By MailFFQ-Semi-quantitative
ProspectiveCohort
51883.3 years / nolost g/day
Invasive breast cancer >1.0vs.>-1.0
51.08(0.73, 1.59)
0.32 A B C D E F G
incidence
Toniolo,P.,1994,BRE12398
U.S.A., Not specifiedNew York Women's HealthStudy, 1985
35 - 65
Through healthorg. (screening,healthinsurance)
FFQ-Semi-quantitative
Nested CaseControl
14291.0 7.0 years g/day
Invasive breast cancer 123.0vs.28.0
51.49(0.89, 2.48)
0.09incidence
Gaard,,1995,BRE17516
Norway, Not specified,Screening ProgramNorway National HealthScreening Service, 1974
35 - 49 248 By MailFFQ-Semi-quantitative
ProspectiveCohort
280232 10.0 years g/day
Breast cancer >61.0vs.<49.9
41.25(0.86, 1.81)
0.18 A D E F G
incidence
140
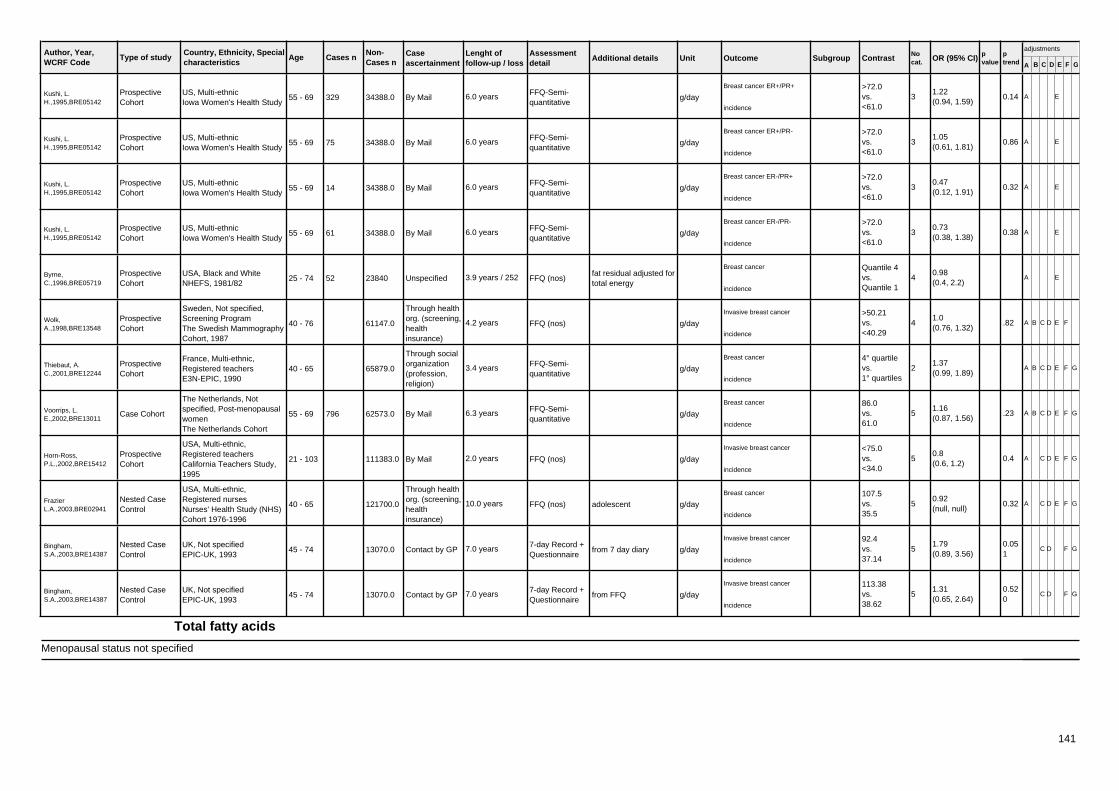
Author, Year,WCRF Code
Country, Ethnicity, Specialcharacteristics
Age Cases n Caseascertainment
Type of studyNon-Cases n
Lenght offollow-up / loss
Assessmentdetail
Additional details Unit Outcome Subgroup Contrast Nocat. OR (95% CI) p
valueptrend A B C D E F G
adjustments
Kushi, L.H.,1995,BRE05142
US, Multi-ethnicIowa Women's Health Study
55 - 69 329 By MailFFQ-Semi-quantitative
ProspectiveCohort
34388.0 6.0 years g/day
Breast cancer ER+/PR+ >72.0vs.<61.0
31.22(0.94, 1.59)
0.14 A E
incidence
Kushi, L.H.,1995,BRE05142
US, Multi-ethnicIowa Women's Health Study
55 - 69 75 By MailFFQ-Semi-quantitative
ProspectiveCohort
34388.0 6.0 years g/day
Breast cancer ER+/PR- >72.0vs.<61.0
31.05(0.61, 1.81)
0.86 A E
incidence
Kushi, L.H.,1995,BRE05142
US, Multi-ethnicIowa Women's Health Study
55 - 69 14 By MailFFQ-Semi-quantitative
ProspectiveCohort
34388.0 6.0 years g/day
Breast cancer ER-/PR+ >72.0vs.<61.0
30.47(0.12, 1.91)
0.32 A E
incidence
Kushi, L.H.,1995,BRE05142
US, Multi-ethnicIowa Women's Health Study
55 - 69 61 By MailFFQ-Semi-quantitative
ProspectiveCohort
34388.0 6.0 years g/day
Breast cancer ER-/PR- >72.0vs.<61.0
30.73(0.38, 1.38)
0.38 A E
incidence
Byrne,C.,1996,BRE05719
USA, Black and WhiteNHEFS, 1981/82
25 - 74 52 Unspecified FFQ (nos)ProspectiveCohort
23840 3.9 years / 252 fat residual adjusted fortotal energy
Breast cancer Quantile 4vs.Quantile 1
40.98(0.4, 2.2)
A E
incidence
Wolk,A.,1998,BRE13548
Sweden, Not specified,Screening ProgramThe Swedish MammographyCohort, 1987
40 - 76
Through healthorg. (screening,healthinsurance)
FFQ (nos)ProspectiveCohort
61147.0 4.2 years g/day
Invasive breast cancer >50.21vs.<40.29
41.0(0.76, 1.32)
.82 A B C D E F
incidence
Thiebaut, A.C.,2001,BRE12244
France, Multi-ethnic,Registered teachersE3N-EPIC, 1990
40 - 65
Through socialorganization(profession,religion)
FFQ-Semi-quantitative
ProspectiveCohort
65879.0 3.4 years g/day
Breast cancer 4° quartilevs.1° quartiles
21.37(0.99, 1.89)
A B C D E F G
incidence
Voorrips, L.E.,2002,BRE13011
The Netherlands, Notspecified, Post-menopausalwomenThe Netherlands Cohort
55 - 69 796 By MailFFQ-Semi-quantitative
Case Cohort 62573.0 6.3 years g/day
Breast cancer 86.0vs.61.0
51.16(0.87, 1.56)
.23 A B C D E F G
incidence
Horn-Ross,P.L.,2002,BRE15412
USA, Multi-ethnic,Registered teachersCalifornia Teachers Study,1995
21 - 103 By Mail FFQ (nos)ProspectiveCohort
111383.0 2.0 years g/day
Invasive breast cancer <75.0vs.<34.0
50.8(0.6, 1.2)
0.4 A C D E F G
incidence
FrazierL.A.,2003,BRE02941
USA, Multi-ethnic,Registered nursesNurses' Health Study (NHS)Cohort 1976-1996
40 - 65
Through healthorg. (screening,healthinsurance)
FFQ (nos)Nested CaseControl
121700.0 10.0 years adolescent g/day
Breast cancer 107.5vs.35.5
50.92(null, null)
0.32 A C D E F G
incidence
Bingham,S.A.,2003,BRE14387
UK, Not specifiedEPIC-UK, 1993
45 - 74 Contact by GP7-day Record +Questionnaire
Nested CaseControl
13070.0 7.0 years from 7 day diary g/day
Invasive breast cancer 92.4vs.37.14
51.79(0.89, 3.56)
0.051
C D F G
incidence
Bingham,S.A.,2003,BRE14387
UK, Not specifiedEPIC-UK, 1993
45 - 74 Contact by GP7-day Record +Questionnaire
Nested CaseControl
13070.0 7.0 years from FFQ g/day
Invasive breast cancer 113.38vs.38.62
51.31(0.65, 2.64)
0.520
C D F G
incidence
Total fatty acids
Menopausal status not specified
141

Author, Year,WCRF Code
Country, Ethnicity, Specialcharacteristics
Age Cases n Caseascertainment
Type of studyNon-Cases n
Lenght offollow-up / loss
Assessmentdetail
Additional details Unit Outcome Subgroup Contrast Nocat. OR (95% CI) p
valueptrend A B C D E F G
adjustments
Voorrips, L.E.,2002,BRE13011
The Netherlands, Notspecified, Post-menopausalwomenThe Netherlands Cohort
55 - 69 783 By MailFFQ-Semi-quantitative
Case Cohort 62573.0 6.3 years g/day
Breast cancer 80.0vs.56.0
51.13(0.84, 1.52)
0.29 A B C D E F G
incidence
Unsaturated fat
Menopausal status not specified
Löf, M. etal.,2007,BRE80144
SwedenWomen's Lifestyle andHealth Study
30 - 49 974 Cancer registry FFQProspectiveCohort
43595 13.0 years Unsaturated fat, monoand polyunsaturated fat
g/day
Invasive breast cancer10.0(continuous)
10.79(0.62, 1.01)
A B C D E F
incidence
Unsaturated fatty acids
Post-menopausal
Byrne,C.,2002,BRE01315
U.S, Multi-ethnic, Post-menopausalNurses' Health Study (NHS)Cohort 1976-1996
(57) 1071 By MailFFQ-Semi-quantitative
ProspectiveCohort
44697 14.0 years g/day
Invasive breast cancerPost-menopausal
Quantile 5vs.Quantile 1
51.16(0.92, 1.46)
0.30 A C D E F G
incidence
Vegetable fat
Pre-menopausal
FrazierL.A.,2004,BRE02942
USA, Multi-ethnic,Registered nursesNurses' Health study II
34 - 51 361
Through healthorg. (screening,healthinsurance)
FFQ (nos)Historical Cohort 47517 9.0 years adolescent diet g/day
Breast cancerPre-menopausal
60.9vs.30.1
50.58(0.38, 0.86)
0.005
A C D E F G
incidence
Post-menopausal
Graham,S.,1992,BRE03424
USA, White, Post-menopausalNew York State Cohort,1980
50 - 107 344 By Mail FFQ (nos)ProspectiveCohort
17401 8.0 years g/month
Breast cancerPost-menopausal
699.0 -3108.0vs.0 - 380.0
51.07(0.76, 1.5)
A B
incidence
Sieri,Sabina,2002,BRE20941
Italy, Not specified, Post-menopausalORDET study, 1987
41 - 70 56Throughnetwork, paper,tv
FFQ-Semi-quantitative
Nested CaseControl
214 5.5 years g/day
Breast cancerPost-menopausal
30.0 - 129.9vs.<22.3
30.88(0.29, 2.66)
0.880
B C E G
incidence
Menopausal status not specified
Kushi, L.H.,1995,BRE05142
US, Multi-ethnicIowa Women's Health Study
55 - 69 329 By MailFFQ-Semi-quantitative
ProspectiveCohort
34388.0 6.0 years g/day
Breast cancer ER+/PR+ >31.4vs.<23.9
31.11(0.85, 1.46)
0.50 A E
incidence
Kushi, L.H.,1995,BRE05142
US, Multi-ethnicIowa Women's Health Study
55 - 69 75 By MailFFQ-Semi-quantitative
ProspectiveCohort
34388.0 6.0 years g/day
Breast cancer ER+/PR- >31.4vs.<23.9
30.89(0.51, 0.54)
0.67 A E
incidence
Kushi, L.H.,1995,BRE05142
US, Multi-ethnicIowa Women's Health Study
55 - 69 14 By MailFFQ-Semi-quantitative
ProspectiveCohort
34388.0 6.0 years g/day
Breast cancer ER-/PR+ >31.4vs.<23.9
30.8(0.21, 2.98)
0.73 A E
incidence
142

Author, Year,WCRF Code
Country, Ethnicity, Specialcharacteristics
Age Cases n Caseascertainment
Type of studyNon-Cases n
Lenght offollow-up / loss
Assessmentdetail
Additional details Unit Outcome Subgroup Contrast Nocat. OR (95% CI) p
valueptrend A B C D E F G
adjustments
Kushi, L.H.,1995,BRE05142
US, Multi-ethnicIowa Women's Health Study
55 - 69 61 By MailFFQ-Semi-quantitative
ProspectiveCohort
34388.0 6.0 years g/day
Breast cancer ER-/PR- >31.4vs.<23.9
31.05(0.56, 1.97)
0.90 A E
incidence
Voorrips, L.E.,2002,BRE13011
The Netherlands, Notspecified, Post-menopausalwomenThe Netherlands Cohort
55 - 69 783 By MailFFQ-Semi-quantitative
Case Cohort 62573.0 6.3 years g/day
Breast cancer 38.0vs.5.0
51.02(0.75, 1.38)
0.85 A B C D E F G
incidence
FrazierL.A.,2003,BRE02941
USA, Multi-ethnic,Registered nursesNurses' Health Study (NHS)Cohort 1976-1996
40 - 65
Through healthorg. (screening,healthinsurance)
FFQ (nos)Nested CaseControl
121700.0 10.0 years adolescent g/day
Breast cancer 28.3vs.5.4
50.85(null, null)
0.05 A C D E F G
incidence
5.2.2
Erythrocyte 15:0
Post-menopausal
Pala V.,2001,BRE20601Italy, CaucasianORDET study, 1987
42 - 69 71Nested CaseControl
141 5.5 years 05.02.02 Erythrocytesaturated 15:0
Breast cancerPost-menopausal
>19.0vs.<0.15
30.93(0.46, 1.89)
.86incidence
Wirfalt,E.,2004,BRE17083
Sweden, Not specified, Post-menopausalMalmo Diet and Cancer,1991
50 - By Mail7-day Record +Questionnaire
Nested CaseControl
12803.0 8.0 years %
Breast cancerPost-menopausal
0.1(continuous)
10.93(0.7, 1.22)
0.612
incidence
Erythrocyte 17:0
Post-menopausal
Pala V.,2001,BRE20601Italy, CaucasianORDET study, 1987
42 - 69 71Nested CaseControl
141 5.5 years 05.02.02 Erythrocytesaturated 17:0
Breast cancerPost-menopausal
>0.38vs.<0.32
30.77(0.38, 1.58)
.48incidence
Wirfalt,E.,2004,BRE17083
Sweden, Not specified, Post-menopausalMalmo Diet and Cancer,1991
50 - By Mail7-day Record +Questionnaire
Nested CaseControl
12803.0 8.0 years %
Breast cancerPost-menopausal
0.1(continuous)
10.98(0.72, 1.36)
0.947
incidence
Erythrocyte Arachidic acid
Post-menopausal
Pala V.,2001,BRE20601Italy, CaucasianORDET study, 1987
42 - 69 71Nested CaseControl
141 5.5 years 05.02.02 Erythrocytesaturated 20:0
Breast cancerPost-menopausal
>0.08vs.<0.06
30.66(0.25, 1.75)
.55incidence
Erythrocyte Myristic acid
Post-menopausal
143

Author, Year,WCRF Code
Country, Ethnicity, Specialcharacteristics
Age Cases n Caseascertainment
Type of studyNon-Cases n
Lenght offollow-up / loss
Assessmentdetail
Additional details Unit Outcome Subgroup Contrast Nocat. OR (95% CI) p
valueptrend A B C D E F G
adjustments
Pala V.,2001,BRE20601Italy, CaucasianORDET study, 1987
42 - 69 71Nested CaseControl
141 5.5 years 05.02.02 Erythrocytesaturated 14:0
Breast cancerPost-menopausal
>36.0vs.<0.29
31.52(0.65, 3.55)
.37incidence
Wirfalt,E.,2004,BRE17083
Sweden, Not specified, Post-menopausalMalmo Diet and Cancer,1991
50 - By Mail7-day Record +Questionnaire
Nested CaseControl
12803.0 8.0 years %
Breast cancerPost-menopausal
0.1(continuous)
10.92(0.79, 1.06)
0.244
incidence
Erythrocyte Palmitic acid
Post-menopausal
Pala V.,2001,BRE20601Italy, CaucasianORDET study, 1987
42 - 69 71Nested CaseControl
141 5.5 years 05.02.02 Erythrocytesaturated 16:0
Breast cancerPost-menopausal
>21.39vs.<20.71
31.49(0.75, 2.96)
.27incidence
Wirfalt,E.,2004,BRE17083
Sweden, Not specified, Post-menopausalMalmo Diet and Cancer,1991
50 - By Mail7-day Record +Questionnaire
Nested CaseControl
12803.0 8.0 years %
Breast cancerPost-menopausal
1.0(continuous)
11.0(0.86, 1.16)
0.979
incidence
Erythrocyte Saturated fatty acids
Post-menopausal
Pala V.,2001,BRE20601Italy, CaucasianORDET study, 1987
42 - 69 71Nested CaseControl
141 5.5 yearsBreast cancer
Post-menopausal
>40.31vs.<39.67
31.01(0.45, 2.29)
.89incidence
Erythrocyte Stearic acid
Post-menopausal
Pala V.,2001,BRE20601Italy, CaucasianORDET study, 1987
42 - 69 71Nested CaseControl
141 5.5 years 05.02.02 Erythrocytesaturated 18:0
Breast cancerPost-menopausal
>18.25vs.<17.62
30.68(0.32, 1.48)
.33incidence
Wirfalt,E.,2004,BRE17083
Sweden, Not specified, Post-menopausalMalmo Diet and Cancer,1991
50 - By Mail7-day Record +Questionnaire
Nested CaseControl
12803.0 8.0 years %
Breast cancerPost-menopausal
1.0(continuous)
11.04(0.84, 1.27)
0.728
incidence
Myristic acid
Post-menopausal
Wirfalt,E.,2004,BRE17083
Sweden, Not specified, Post-menopausalMalmo Diet and Cancer,1991
50 - By Mail7-day Record +Questionnaire
Nested CaseControl
12803.0 8.0 years percent of total fattyacids
Breast cancerPost-menopausal
1null(null, null)
incidence
Menopausal status not specified
Holmes, M.D.,1999,BRE04008
US, Multi-ethnic, RegisterednursesNurses' Health Study (NHS)Cohort 1976-1996
30 - 55 2097 By MailFFQ-Semi-quantitative
ProspectiveCohort
121700.0 14.0 years % of totalenergy/day
Invasive breast cancer1.0(continuous)
11.04(0.91, 1.19)
A C D E F G
incidence
144

Author, Year,WCRF Code
Country, Ethnicity, Specialcharacteristics
Age Cases n Caseascertainment
Type of studyNon-Cases n
Lenght offollow-up / loss
Assessmentdetail
Additional details Unit Outcome Subgroup Contrast Nocat. OR (95% CI) p
valueptrend A B C D E F G
adjustments
Palmitic acid
Post-menopausal
Wirfalt,E.,2004,BRE17083
Sweden, Not specified, Post-menopausalMalmo Diet and Cancer,1991
50 - By Mail7-day Record +Questionnaire
Nested CaseControl
12803.0 8.0 years percent of total fattyacids
Breast cancerPost-menopausal
1null(null, null)
incidence
Menopausal status not specified
Holmes, M.D.,1999,BRE04008
US, Multi-ethnic, RegisterednursesNurses' Health Study (NHS)Cohort 1976-1996
30 - 55 2097 By MailFFQ-Semi-quantitative
ProspectiveCohort
121700.0 14.0 years % of totalenergy/day
Invasive breast cancer5.0(continuous)
10.91(0.75, 1.1)
A C D E F G
incidence
Voorrips, L.E.,2002,BRE13011
The Netherlands, Notspecified, Post-menopausalwomenThe Netherlands Cohort
55 - 69 783 By MailFFQ-Semi-quantitative
Case Cohort 62573.0 6.3 years g/day
Breast cancer 18.0vs.11.0
51.01(0.68, 1.52)
.89 A B C D E F G
incidence
Saturated fat
Menopausal status not specified
Löf, M. etal.,2007,BRE80144
SwedenWomen's Lifestyle andHealth Study
30 - 49 974 Cancer registry FFQProspectiveCohort
43595 13.0 years Saturated fat g/day
Invasive breast cancer10.0(continuous)
11.21(1.0, 1.45)
A B C D E F
incidence
Saturated fatty acids
Pre-menopausal
Willett, W.C.,1987,BRE13442
US, Not specified,Registered nursesNurses' Health Study (NHS)Cohort 1976-1996
34 - 59 By MailFFQ-Semi-quantitative
ProspectiveCohort
89538.0
4.0 years / 9,235(10% do notreturn the FUquestionnaire)
Breast cancerPre-menopausal
Quantile 5vs.Quantile 1
50.83(null, null)
0.70 A C D E F G
incidence
Willett, W.C.,1992,BRE13438
U.S, Not specified,Registered nursesNurses' Health Study (NHS)Cohort 1976-1996
30 - 55 527 By MailFFQ-Semi-quantitative
ProspectiveCohort
89494.0 8.0 yearsBreast cancer
Pre-menopausal
Quantile 5vs.Quantile 1
50.93(0.7, 1.22)
0.92 A C D E F G
incidence
FrazierL.A.,2004,BRE02942
USA, Multi-ethnic,Registered nursesNurses' Health study II
34 - 51 361
Through healthorg. (screening,healthinsurance)
FFQ (nos)Historical Cohort 47517 9.0 years adolescent diet g/day
Breast cancerPre-menopausal
58.9vs.39.7
50.93(0.67, 1.29)
0.79 A C D E F G
incidence
Löf, M. etal.,2007,BRE80144
SwedenWomen's Lifestyle andHealth Study
30 - 49 432 Cancer registry FFQProspectiveCohort
44137 13.0 years SFA g/day
Invasive breast cancer
Age < 50 yrs37.9vs.12.9
50.93(0.56, 1.88)
0.86 A B C D E F
incidence
Post-menopausal
Willett, W.C.,1987,BRE13442
US, Not specified,Registered nursesNurses' Health Study (NHS)Cohort 1976-1996
34 - 59 By MailFFQ-Semi-quantitative
ProspectiveCohort
89538.0
4.0 years / 9,235(10% do notreturn the FUquestionnaire)
Breast cancerPost-menopausal
Quantile 5vs.Quantile 1
50.96(null, null)
0.52 A C D E F G
incidence
145

Author, Year,WCRF Code
Country, Ethnicity, Specialcharacteristics
Age Cases n Caseascertainment
Type of studyNon-Cases n
Lenght offollow-up / loss
Assessmentdetail
Additional details Unit Outcome Subgroup Contrast Nocat. OR (95% CI) p
valueptrend A B C D E F G
adjustments
Kushi L.H.,1992,BRE05141
US, Multi-ethnic, Post-menopausalIowa Women's Health Study
55 - 69 459 By MailFFQ-Semi-quantitative
ProspectiveCohort
130444 4.0 years / 1086 g/day
Breast cancerPost-menopausal
29.3vs.18.8
41.07(0.68, 1.68)
0.53 A C D E F G
incidence
Willett, W.C.,1992,BRE13438
U.S, Not specified,Registered nursesNurses' Health Study (NHS)Cohort 1976-1996
30 - 55 774 By MailFFQ-Semi-quantitative
ProspectiveCohort
89494.0 8.0 yearsBreast cancer
Post-menopausal
Quantile 5vs.Quantile 1
50.91(0.73, 1.14)
0.45 A C D E F G
incidence
Barrett-Connor,E.,1993,BRE00581
U.S, WhiteRancho Bernardo, 1972
40 - 79 15
Through socialorganization(profession,religion)
24h RecallProspectiveCohort
575 15.0 yearsBreast cancer
Post-menopausal
1null(null, null)
incidence
Wirfalt,E.,2002,BRE13504
Sweden, Not specified, Post-menopausalMalmo Diet and Cancer,1991
50 - 237 By Mail7-day Record +Questionnaire
Nested CaseControl
673 8.0 years g/day
Breast cancerPost-menopausal
53.0vs.28.0
50.95(0.57, 1.61)
0.833
B C D E F
incidence
Sieri,Sabina,2002,BRE20941
Italy, Not specified, Post-menopausalORDET study, 1987
41 - 70 56Throughnetwork, paper,tv
FFQ-Semi-quantitative
Nested CaseControl
214 5.5 years g/day
Breast cancerPost-menopausal
22.2 - 43.9vs.<18.3
31.12(0.31, 4.04)
0.761
B C E G
incidence
Byrne,C.,2002,BRE01315
U.S, Multi-ethnic, Post-menopausalNurses' Health Study (NHS)Cohort 1976-1996
(57) 1071 By MailFFQ-Semi-quantitative
ProspectiveCohort
44697 14.0 years g/day
Invasive breast cancerPost-menopausal
Quantile 5vs.Quantile 1
50.88(0.7, 1.12)
0.05 A C D E F G
incidence
Löf, M. etal.,2007,BRE80144
SwedenWomen's Lifestyle andHealth Study
30 - 49 542 Cancer registry FFQProspectiveCohort
29590 13.0 years SFA g/day
Invasive breast cancerAge >= 50yrs
37.6vs.12.9
51.29(0.66, 2.5)
0.44 A B C D E F
incidence
Menopausal status not specified
Jones, D.Y.,1987,BRE04461
US, Multi-ethnicNHANES I, 1971
25 - 74 86Generalpopulation(survey)
24h RecallProspectiveCohort
4902 10.0 years / 776 g/day
Breast cancer >27.0vs.<12.9
40.29(0.12, 0.67)
0.04 A B C D F
incidence
Willett, W.C.,1987,BRE13442
US, Not specified,Registered nursesNurses' Health Study (NHS)Cohort 1976-1996
34 - 59 601 By MailFFQ-Semi-quantitative
ProspectiveCohort
89543
4.0 years / 9,235(10% do notreturn the FUquestionnaire)
g/day
Breast cancer Quantile 5vs.Quantile 1
50.84(0.66, 1.08)
0.06 A C D E F G
incidence
Knekt,P.,1990,BRE04898
Finland, Not specified,Screening ProgramMobile Clinic HealthExamination Survey, 1973
20 - 69
Through healthorg. (screening,healthinsurance)
Dietary Historyquestionnaire
ProspectiveCohort
3988.0 20.0 years g/day
Breast cancer >55.4vs.<39.5
31.36(0.5, 3.73)
0.31 A E
incidence
Howe, G.R.,1991,BRE17622
canada, Multi-ethnic,Screening ProgramNBSS, 1980
40 - 59 519
Through healthorg. (screening,healthinsurance)
Dietary Historyquestionnaire
Nested CaseControl
1182 5.0 years g/day
Breast cancer Quantile 4vs.Quantile 1
41.08(0.73, 1.59)
.10 A E G
incidence
Willett, W.C.,1992,BRE13438
U.S, Not specified,Registered nursesNurses' Health Study (NHS)Cohort 1976-1996
30 - 55 1439 By MailFFQ-Semi-quantitative
ProspectiveCohort
692674 8.0 years g/day
Breast cancer >34.0vs.<21.9
50.86(0.73, 1.02)
0.22 A C D E F G
incidence
146

Author, Year,WCRF Code
Country, Ethnicity, Specialcharacteristics
Age Cases n Caseascertainment
Type of studyNon-Cases n
Lenght offollow-up / loss
Assessmentdetail
Additional details Unit Outcome Subgroup Contrast Nocat. OR (95% CI) p
valueptrend A B C D E F G
adjustments
Giovannucci,E.,1993,BRE03262
US, Not specified,Registered nursesNurses' Health Study (NHS)Cohort 1976-1996
30 - 55 392 By MailFFQ-Semi-quantitative
Nested CaseControl
786 2.0 years g/day
Breast cancer Quantile 5vs.Quantile 1
50.9(0.61, 1.34)
0.47 A E
incidence
Giovannucci,E.,1993,BRE03262
US, Not specified,Registered nursesNurses' Health Study (NHS)Cohort 1976-1996
30 - 55 By MailFFQ-Semi-quantitative
Nested CaseControl
95000.0 2.0 years g/day
Breast cancer45.0(continuous)
11.11(0.65, 1.9)
A
incidence
Van den Brandt,P.A.,1993,BRE16919
the Netherlands, Notspecified, Post-menopausalwomenThe Netherlands Cohort
55 - 69 437 By MailFFQ-Semi-quantitative
ProspectiveCohort
51873.3 years / nolost g/day
Invasive breast cancer >1.0vs.>-1.0
51.39(0.94, 2.06)
0.049
A B C D E F G
incidence
Toniolo,P.,1994,BRE12398
U.S.A., Not specifiedNew York Women's HealthStudy, 1985
35 - 65
Through healthorg. (screening,healthinsurance)
FFQ-Semi-quantitative
Nested CaseControl
14291.0 7.0 years g/day
Invasive breast cancer 50.0vs.11.0
51.47(0.88, 2.46)
0.09incidence
Gaard,,1995,BRE17516
Norway, Not specified,Screening ProgramNorway National HealthScreening Service, 1974
35 - 49 248 By MailFFQ-Semi-quantitative
ProspectiveCohort
281925 10.0 years g/day
Breast cancer >28.0vs.<19.9
41.01(0.75, 1.57)
0.74 A D E F G
incidence
Kushi, L.H.,1995,BRE05142
US, Multi-ethnicIowa Women's Health Study
55 - 69 329 By MailFFQ-Semi-quantitative
ProspectiveCohort
34388.0 6.0 years g/day
Breast cancer ER+/PR+ >25.4vs.<21.5
31.18(0.91, 1.53)
0.20 A E
incidence
Kushi, L.H.,1995,BRE05142
US, Multi-ethnicIowa Women's Health Study
55 - 69 75 By MailFFQ-Semi-quantitative
ProspectiveCohort
34388.0 6.0 years g/day
Breast cancer ER+/PR- >25.4vs.<21.5
31.58(0.89, 2.81)
0.11 A E
incidence
Kushi, L.H.,1995,BRE05142
US, Multi-ethnicIowa Women's Health Study
55 - 69 14 By MailFFQ-Semi-quantitative
ProspectiveCohort
34388.0 6.0 years g/day
Breast cancer ER-/PR+ >25.4vs.<21.5
30.91(0.23, 3.63)
0.98 A E
incidence
Kushi, L.H.,1995,BRE05142
US, Multi-ethnicIowa Women's Health Study
55 - 69 61 By MailFFQ-Semi-quantitative
ProspectiveCohort
34388.0 6.0 years g/day
Breast cancer ER-/PR- >25.4vs.<21.5
30.74(0.39, 1.41)
0.38 A E
incidence
Wolk,A.,1998,BRE13548
Sweden, Not specified,Screening ProgramThe Swedish MammographyCohort, 1987
40 - 76
Through healthorg. (screening,healthinsurance)
FFQ (nos)ProspectiveCohort
61147.0 4.2 years g/day
Invasive breast cancer >21.71vs.<16.29
41.09(0.83, 1.42)
.83 A B C D E F
incidence
Thiebaut, A.C.,2001,BRE12244
France, Multi-ethnic,Registered teachersE3N-EPIC, 1990
40 - 65
Through socialorganization(profession,religion)
FFQ-Semi-quantitative
ProspectiveCohort
65879.0 3.4 years g/day
Breast cancer 4° quartilevs.1° quartiles
21.22(0.91, 1.63)
A B C D E F G
incidence
Voorrips, L.E.,2002,BRE13011
The Netherlands, Notspecified, Post-menopausalwomenThe Netherlands Cohort
55 - 69 783 By MailFFQ-Semi-quantitative
Case Cohort 62573.0 6.3 years g/day
Breast cancer 38.0vs.22.0
51.4(0.97, 2.03)
0.11 A B C D E F G
incidence
Horn-Ross,P.L.,2002,BRE15412
USA, Multi-ethnic,Registered teachersCalifornia Teachers Study,1995
21 - 103 By Mail FFQ (nos)ProspectiveCohort
111383.0 2.0 years g/day
Invasive breast cancer <25.0vs.<11.0
60.8(0.6, 1.2)
0.2 A C D E F G
incidence
147

Author, Year,WCRF Code
Country, Ethnicity, Specialcharacteristics
Age Cases n Caseascertainment
Type of studyNon-Cases n
Lenght offollow-up / loss
Assessmentdetail
Additional details Unit Outcome Subgroup Contrast Nocat. OR (95% CI) p
valueptrend A B C D E F G
adjustments
FrazierL.A.,2003,BRE02941
USA, Multi-ethnic,Registered nursesNurses' Health Study (NHS)Cohort 1976-1996
40 - 65
Through healthorg. (screening,healthinsurance)
FFQ (nos)Nested CaseControl
121700.0 10.0 years adolescent g/day
Breast cancer 48.4vs.14.5
50.98(null, null)
0.82 A C D E F G
incidence
Löf, M. etal.,2007,BRE80144
SwedenWomen's Lifestyle andHealth Study
30 - 49 974 Cancer registry FFQProspectiveCohort
43595 13.0 years SFA g/day
Invasive breast cancer 37.9vs.12.9
51.12(0.69, 1.81)
0.65 A B C D E F
incidence
Serum 15:0
Pre-menopausal
Rissanen,H.,2003,BRE17954
Finland, Not specifiedMobile Clinic HealthExamination Survey, 1973
18 - 89 27Throughnetwork, paper,tv
Nested CaseControl
51 10.0 years %
Breast cancerPre-menopausal
>0.43vs.<0.34
30.42(0.1, 1.8)
0.59incidence
Post-menopausal
Rissanen,H.,2003,BRE17954
Finland, Not specifiedMobile Clinic HealthExamination Survey, 1973
18 - 89 31Throughnetwork, paper,tv
Nested CaseControl
59 10.0 years %
Breast cancerPost-menopausal
>0.45vs.<0.37
31.09(0.36, 3.25)
0.98incidence
Menopausal status not specified
Rissanen,H.,2003,BRE17954
Finland, Not specifiedMobile Clinic HealthExamination Survey, 1973
18 - 89 58Throughnetwork, paper,tv
Nested CaseControl
110 10.0 years %
Breast cancer >1.0vs.>-1.0
30.77(0.33, 1.77)
0.72incidence
Serum 17:0
Pre-menopausal
Rissanen,H.,2003,BRE17954
Finland, Not specifiedMobile Clinic HealthExamination Survey, 1973
18 - 89 27Throughnetwork, paper,tv
Nested CaseControl
51 10.0 yearsBreast cancer
Pre-menopausal
>0.49vs.<0.42
30.71(0.17, 2.91)
0.68incidence
Post-menopausal
Rissanen,H.,2003,BRE17954
Finland, Not specifiedMobile Clinic HealthExamination Survey, 1973
18 - 89 31Throughnetwork, paper,tv
Nested CaseControl
59 10.0 years %
Breast cancerPost-menopausal
>0.5vs.<0.43
31.26(0.41, 3.9)
0.94incidence
Menopausal status not specified
Rissanen,H.,2003,BRE17954
Finland, Not specifiedMobile Clinic HealthExamination Survey, 1973
18 - 89 58Throughnetwork, paper,tv
Nested CaseControl
110 10.0 yearsBreast cancer >1.0
vs.>-1.0
31.08(0.45, 2.56)
0.74incidence
Serum Myristic acid
Pre-menopausal
148

Author, Year,WCRF Code
Country, Ethnicity, Specialcharacteristics
Age Cases n Caseascertainment
Type of studyNon-Cases n
Lenght offollow-up / loss
Assessmentdetail
Additional details Unit Outcome Subgroup Contrast Nocat. OR (95% CI) p
valueptrend A B C D E F G
adjustments
Saadatian-Elahi,M.,2002,BRE21486
US, Not specifiedNew York Women's HealthStudy, 1985
34 - 65 91Throughnetwork, paper,tv
Nested CaseControl
91 4.3 years %
Breast cancerPre-menopausal
>1.0vs.>-1.0
42.22(0.78, 6.31)
0.14 A C F G
incidence
Rissanen,H.,2003,BRE17954
Finland, Not specifiedMobile Clinic HealthExamination Survey, 1973
18 - 89 27Throughnetwork, paper,tv
Nested CaseControl
51 10.0 years %
Breast cancerPre-menopausal
>1.39vs.<1.07
30.74(0.21, 2.57)
0.73incidence
Post-menopausal
Saadatian-Elahi,M.,2002,BRE21486
US, Not specifiedNew York Women's HealthStudy, 1985
34 - 65 106Throughnetwork, paper,tv
Nested CaseControl
106 4.3 years %
Breast cancerPost-menopausal
>1.0vs.>-1.0
40.57(0.23, 1.41)
0.37 A C F G
incidence
Rissanen,H.,2003,BRE17954
Finland, Not specifiedMobile Clinic HealthExamination Survey, 1973
18 - 89 31Throughnetwork, paper,tv
Nested CaseControl
59 10.0 years %
Breast cancerPost-menopausal
>1.79vs.<1.3
31.15(0.42, 3.17)
0.38incidence
Menopausal status not specified
Chajes,V.,1999,BRE14597
Sweden, Not specifiedVIP + MONICA + MSP
UnspecifiedNested CaseControl
29708.0 11.0 years %
Breast cancer >1.0vs.>-1.0
41.21(0.56, 1.02)
0.679
C D F
incidence
Saadatian-Elahi,M.,2002,BRE21486
US, Not specifiedNew York Women's HealthStudy, 1985
34 - 65 197Throughnetwork, paper,tv
Nested CaseControl
197 4.3 years %
Breast cancer >1.0vs.>-1.0
40.91(0.49, 1.67)
0.86 A C F G
incidence
Rissanen,H.,2003,BRE17954
Finland, Not specifiedMobile Clinic HealthExamination Survey, 1973
18 - 89 58Throughnetwork, paper,tv
Nested CaseControl
110 10.0 years %
Breast cancer >1.0vs.>-1.0
30.96(0.44, 2.11)
0.60incidence
Serum Palmitic acid
Pre-menopausal
Vatten, L.J.,1993,BRE12821
Norway, Not specifiedNorway Serum Bank, 1973
65Throughnetwork, paper,tv
Nested CaseControl
195 18.0 years mg/liter
Breast cancerPre-menopausal
>1.0vs.>-1.0
40.6(0.3, 1.2)
0.11incidence
Saadatian-Elahi,M.,2002,BRE21486
US, Not specifiedNew York Women's HealthStudy, 1985
34 - 65 91Throughnetwork, paper,tv
Nested CaseControl
91 4.3 years %
Breast cancerPre-menopausal
>1.0vs.>-1.0
41.2(0.45, 3.21)
0.87 A C F G
incidence
Rissanen,H.,2003,BRE17954
Finland, Not specifiedMobile Clinic HealthExamination Survey, 1973
18 - 89 27Throughnetwork, paper,tv
Nested CaseControl
51 10.0 years %
Breast cancerPre-menopausal
>25.94vs.<24.48
32.53(0.79, 8.06)
0.33incidence
Post-menopausal
Saadatian-Elahi,M.,2002,BRE21486
US, Not specifiedNew York Women's HealthStudy, 1985
34 - 65 106Throughnetwork, paper,tv
Nested CaseControl
106 4.3 years %
Breast cancerPost-menopausal
>1.0vs.>-1.0
42.57(0.99, 6.61)
0.07 A C F G
incidence
149

Author, Year,WCRF Code
Country, Ethnicity, Specialcharacteristics
Age Cases n Caseascertainment
Type of studyNon-Cases n
Lenght offollow-up / loss
Assessmentdetail
Additional details Unit Outcome Subgroup Contrast Nocat. OR (95% CI) p
valueptrend A B C D E F G
adjustments
Rissanen,H.,2003,BRE17954
Finland, Not specifiedMobile Clinic HealthExamination Survey, 1973
18 - 89 31Throughnetwork, paper,tv
Nested CaseControl
59 10.0 years %
Breast cancerPost-menopausal
>26.88vs.<24.96
33.3(0.78, 13.91)
0.05incidence
Menopausal status not specified
Vatten, L.J.,1993,BRE12821
Norway, Not specifiedNorway Serum Bank, 1973
Throughnetwork, paper,tv
Nested CaseControl
170000.0 18.0 yearsBreast cancer
1null(null, null)
incidence
Chajes,V.,1999,BRE14597
Sweden, Not specifiedVIP + MONICA + MSP
UnspecifiedNested CaseControl
29708.0 11.0 years %
Breast cancer >1.0vs.>-1.0
42.09(0.95, 4.63)
0.043
C D F
incidence
Saadatian-Elahi,M.,2002,BRE21486
US, Not specifiedNew York Women's HealthStudy, 1985
34 - 65Throughnetwork, paper,tv
Nested CaseControl
null 4.3 years %
Breast cancer >1.0vs.>-1.0
41.64(0.86, 3.14)
0.27 A C F G
incidence
Rissanen,H.,2003,BRE17954
Finland, Not specifiedMobile Clinic HealthExamination Survey, 1973
18 - 89 58Throughnetwork, paper,tv
Nested CaseControl
110 10.0 years %
Breast cancer >1.0vs.>-1.0
32.83(1.16, 6.91)
0.04incidence
Serum SFA
Pre-menopausal
Vatten, L.J.,1993,BRE12821
Norway, Not specifiedNorway Serum Bank, 1973
65Throughnetwork, paper,tv
Nested CaseControl
195 18.0 years mg/liter
Breast cancerPre-menopausal
>1.0vs.>-1.0
40.6(0.3, 1.2)
0.07incidence
Saadatian-Elahi,M.,2002,BRE21486
US, Not specifiedNew York Women's HealthStudy, 1985
34 - 65 91Throughnetwork, paper,tv
Nested CaseControl
91 4.3 years %
Breast cancerPre-menopausal
>1.0vs.>-1.0
41.66(0.56, 4.89)
0.45 A C F G
incidence
Rissanen,H.,2003,BRE17954
Finland, Not specifiedMobile Clinic HealthExamination Survey, 1973
18 - 89 27Throughnetwork, paper,tv
Nested CaseControl
51 10.0 years %
Breast cancerPre-menopausal
>36.66vs.<35.11
32.08(0.63, 6.9)
0.36incidence
Post-menopausal
Saadatian-Elahi,M.,2002,BRE21486
US, Not specifiedNew York Women's HealthStudy, 1985
34 - 65 106Throughnetwork, paper,tv
Nested CaseControl
106 4.3 years %
Breast cancerPost-menopausal
>1.0vs.>-1.0
41.96(0.73, 5.25)
0.09 A C F G
incidence
Rissanen,H.,2003,BRE17954
Finland, Not specifiedMobile Clinic HealthExamination Survey, 1973
18 - 89 31Throughnetwork, paper,tv
Nested CaseControl
59 10.0 years %
Breast cancerPost-menopausal
>37.71vs.<35.47
33.53(0.75, 16.5)
0.006
incidence
Menopausal status not specified
Vatten, L.J.,1993,BRE12821
Norway, Not specifiedNorway Serum Bank, 1973
Throughnetwork, paper,tv
Nested CaseControl
170000.0 18.0 yearsBreast cancer
1null(null, null)
incidence
150

Author, Year,WCRF Code
Country, Ethnicity, Specialcharacteristics
Age Cases n Caseascertainment
Type of studyNon-Cases n
Lenght offollow-up / loss
Assessmentdetail
Additional details Unit Outcome Subgroup Contrast Nocat. OR (95% CI) p
valueptrend A B C D E F G
adjustments
Chajes,V.,1999,BRE14597
Sweden, Not specifiedVIP + MONICA + MSP
UnspecifiedNested CaseControl
29708.0 11.0 years %
Breast cancer >1.0vs.>-1.0
41.15(0.46, 2.85)
0.760
C D F
incidence
Saadatian-Elahi,M.,2002,BRE21486
US, Not specifiedNew York Women's HealthStudy, 1985
34 - 65Throughnetwork, paper,tv
Nested CaseControl
null 4.3 years %
Breast cancer >1.0vs.>-1.0
41.46(0.74, 2.83)
0.11 A C F G
incidence
Rissanen,H.,2003,BRE17954
Finland, Not specifiedMobile Clinic HealthExamination Survey, 1973
18 - 89 58Throughnetwork, paper,tv
Nested CaseControl
110 10.0 years %
Breast cancer >1.0vs.>-1.0
32.49(0.99, 6.34)
0.01incidence
Serum Stearic acid
Pre-menopausal
Vatten, L.J.,1993,BRE12821
Norway, Not specifiedNorway Serum Bank, 1973
65Throughnetwork, paper,tv
Nested CaseControl
195 18.0 years mg/liter
Breast cancerPre-menopausal
>1.0vs.>-1.0
40.7(0.3, 1.5)
0.23incidence
Saadatian-Elahi,M.,2002,BRE21486
US, Not specifiedNew York Women's HealthStudy, 1985
34 - 65 91Throughnetwork, paper,tv
Nested CaseControl
91 4.3 years %
Breast cancerPre-menopausal
>1.0vs.>-1.0
42.31(0.69, 7.78)
0.19 A C F G
incidence
Rissanen,H.,2003,BRE17954
Finland, Not specifiedMobile Clinic HealthExamination Survey, 1973
18 - 89 27Throughnetwork, paper,tv
Nested CaseControl
51 10.0 years %
Breast cancerPre-menopausal
>8.81vs.<8.22
33.16(0.72, 13.81)
0.42incidence
Post-menopausal
Saadatian-Elahi,M.,2002,BRE21486
US, Not specifiedNew York Women's HealthStudy, 1985
34 - 65 106Throughnetwork, paper,tv
Nested CaseControl
106 4.3 years %
Breast cancerPost-menopausal
>1.0vs.>-1.0
41.01(0.42, 2.47)
0.65 A C F G
incidence
Rissanen,H.,2003,BRE17954
Finland, Not specifiedMobile Clinic HealthExamination Survey, 1973
18 - 89 31Throughnetwork, paper,tv
Nested CaseControl
59 10.0 years %
Breast cancerPost-menopausal
>8.46vs.<7.74
31.16(0.39, 3.43)
0.33incidence
Menopausal status not specified
Vatten, L.J.,1993,BRE12821
Norway, Not specifiedNorway Serum Bank, 1973
Throughnetwork, paper,tv
Nested CaseControl
170000.0 18.0 yearsBreast cancer
1null(null, null)
incidence
Chajes,V.,1999,BRE14597
Sweden, Not specifiedVIP + MONICA + MSP
UnspecifiedNested CaseControl
29708.0 11.0 years %
Breast cancer >1.0vs.>-1.0
40.49(0.22, 1.08)
0.047
C D F
incidence
Saadatian-Elahi,M.,2002,BRE21486
US, Not specifiedNew York Women's HealthStudy, 1985
34 - 65Throughnetwork, paper,tv
Nested CaseControl
null 4.3 years %
Breast cancer >1.0vs.>-1.0
41.18(0.6, 2.3)
0.79 A C F G
incidence
151

Author, Year,WCRF Code
Country, Ethnicity, Specialcharacteristics
Age Cases n Caseascertainment
Type of studyNon-Cases n
Lenght offollow-up / loss
Assessmentdetail
Additional details Unit Outcome Subgroup Contrast Nocat. OR (95% CI) p
valueptrend A B C D E F G
adjustments
Rissanen,H.,2003,BRE17954
Finland, Not specifiedMobile Clinic HealthExamination Survey, 1973
18 - 89 58Throughnetwork, paper,tv
Nested CaseControl
110 10.0 years %
Breast cancer >1.0vs.>-1.0
31.65(0.69, 3.94)
0.20incidence
Stearic acid
Post-menopausal
Wirfalt,E.,2004,BRE17083
Sweden, Not specified, Post-menopausalMalmo Diet and Cancer,1991
50 - By Mail7-day Record +Questionnaire
Nested CaseControl
12803.0 8.0 years percent of total fattyacids
Breast cancerPost-menopausal
1null(null, null)
incidence
Menopausal status not specified
Holmes, M.D.,1999,BRE04008
US, Multi-ethnic, RegisterednursesNurses' Health Study (NHS)Cohort 1976-1996
30 - 55 2097 By MailFFQ-Semi-quantitative
ProspectiveCohort
121700.0 14.0 years % of totalenergy/day
Invasive breast cancer1.0(continuous)
10.96(0.89, 1.03)
A C D E F G
incidence
Voorrips, L.E.,2002,BRE13011
The Netherlands, Notspecified, Post-menopausalwomenThe Netherlands Cohort
55 - 69 783 By MailFFQ-Semi-quantitative
Case Cohort 62573.0 6.3 years g/day
Breast cancer 8.0vs.5.2
50.93(0.61, 1.41)
.65 A B C D E F G
incidence
5.2.3
Erythrocyte 20:1,n-9c
Post-menopausal
Pala V.,2001,BRE20601Italy, CaucasianORDET study, 1987
42 - 69 71Nested CaseControl
141 5.5 years05.02.03 Erythrocytemono saturated20:1,n-9c
Breast cancerPost-menopausal
>0.36vs.<0.24
31.56(0.49, 4.93)
.42incidence
Erythrocyte Monounsaturated fatty acids
Post-menopausal
Pala V.,2001,BRE20601Italy, CaucasianORDET study, 1987
42 - 69 71Nested CaseControl
141 5.5 yearsBreast cancer
Post-menopausal
>17.42vs.<16.15
35.21(1.95, 13.91)
.00incidence
Erythrocyte Oleic acid
Post-menopausal
Pala V.,2001,BRE20601Italy, CaucasianORDET study, 1987
42 - 69 71Nested CaseControl
141 5.5 years05.02.03 Erythrocytemono saturated18:1,n-9c
Breast cancerPost-menopausal
>15.03vs.<13.96
32.79(1.24, 6.28)
.01incidence
Wirfalt,E.,2004,BRE17083
Sweden, Not specified, Post-menopausalMalmo Diet and Cancer,1991
50 - By Mail7-day Record +Questionnaire
Nested CaseControl
12803.0 8.0 years %
Breast cancerPost-menopausal
1.0(continuous)
10.99(0.85, 1.15)
0.905
incidence
152

Author, Year,WCRF Code
Country, Ethnicity, Specialcharacteristics
Age Cases n Caseascertainment
Type of studyNon-Cases n
Lenght offollow-up / loss
Assessmentdetail
Additional details Unit Outcome Subgroup Contrast Nocat. OR (95% CI) p
valueptrend A B C D E F G
adjustments
Erythrocyte Palmitoleic acid
Post-menopausal
Pala V.,2001,BRE20601Italy, CaucasianORDET study, 1987
42 - 69 71Nested CaseControl
141 5.5 years05.02.03 Erythrocytemono saturated16:1,n-7c
Breast cancerPost-menopausal
>0.49vs.<0.39
32.32(1.03, 5.2)
.04incidence
Wirfalt,E.,2004,BRE17083
Sweden, Not specified, Post-menopausalMalmo Diet and Cancer,1991
50 - By Mail7-day Record +Questionnaire
Nested CaseControl
12803.0 8.0 years %
Breast cancerPost-menopausal
1.0(continuous)
11.14(0.89, 2.82)
0.772
incidence
Erythrocyte Vaccenic acid
Post-menopausal
Pala V.,2001,BRE20601Italy, CaucasianORDET study, 1987
42 - 69 71Nested CaseControl
141 5.5 years05.02.03 Erythrocytemono saturated18:1,n-7c
Breast cancerPost-menopausal
>1.45vs.<1.26
31.42(0.57, 3.55)
.50incidence
Monounsaturated fatty acids
Pre-menopausal
Willett, W.C.,1992,BRE13438
U.S, Not specified,Registered nursesNurses' Health Study (NHS)Cohort 1976-1996
30 - 55 527 By MailFFQ-Semi-quantitative
ProspectiveCohort
89494.0 8.0 yearsBreast cancer
Pre-menopausal
Quantile 5vs.Quantile 1
51.03(0.78, 1.37)
0.72 A C D E F G
incidence
FrazierL.A.,2004,BRE02942
USA, Multi-ethnic,Registered nursesNurses' Health study II
34 - 51 361
Through healthorg. (screening,healthinsurance)
FFQ (nos)Historical Cohort 47517 9.0 years adolescent diet g/day
Breast cancerPre-menopausal
51.2vs.37.7
50.86(0.63, 1.18)
0.69 A C D E F G
incidence
Löf, M. etal.,2007,BRE80144
SwedenWomen's Lifestyle andHealth Study
30 - 49 432 Cancer registry FFQProspectiveCohort
44137 13.0 years MUFA g/day
Invasive breast cancer
Age < 50 yrs26.5vs.10.4
51.69(0.81, 3.51)
0.2 A B C D E F
incidence
Post-menopausal
Kushi L.H.,1992,BRE05141
US, Multi-ethnic, Post-menopausalIowa Women's Health Study
55 - 69 459 By MailFFQ-Semi-quantitative
ProspectiveCohort
130443 4.0 years / 1086 g/day
Breast cancerPost-menopausal
30.7vs.20.3
41.09(0.7, 1.7)
0.63 A C D E F G
incidence
Willett, W.C.,1992,BRE13438
U.S, Not specified,Registered nursesNurses' Health Study (NHS)Cohort 1976-1996
30 - 55 774 By MailFFQ-Semi-quantitative
ProspectiveCohort
89494.0 8.0 yearsBreast cancer
Post-menopausal
Quantile 5vs.Quantile 1
50.93(0.74, 1.17)
0.77 A C D E F G
incidence
Barrett-Connor,E.,1993,BRE00581
U.S, WhiteRancho Bernardo, 1972
40 - 79 15
Through socialorganization(profession,religion)
24h RecallProspectiveCohort
575 15.0 yearsBreast cancer
Post-menopausal
1null(null, null)
incidence
Wirfalt,E.,2002,BRE13504
Sweden, Not specified, Post-menopausalMalmo Diet and Cancer,1991
50 - 237 By Mail7-day Record +Questionnaire
Nested CaseControl
673 8.0 years g/day
Breast cancerPost-menopausal
37.0vs.23.0
52.01(1.19, 3.38)
0.001
B C D E F
incidence
153

Author, Year,WCRF Code
Country, Ethnicity, Specialcharacteristics
Age Cases n Caseascertainment
Type of studyNon-Cases n
Lenght offollow-up / loss
Assessmentdetail
Additional details Unit Outcome Subgroup Contrast Nocat. OR (95% CI) p
valueptrend A B C D E F G
adjustments
Sieri,Sabina,2002,BRE20941
Italy, Not specified, Post-menopausalORDET study, 1987
41 - 70 56Throughnetwork, paper,tv
FFQ-Semi-quantitative
Nested CaseControl
214 5.5 years g/day
Breast cancerPost-menopausal
30.0 - 104.3vs.<23.5
32.96(0.7, 12.6)
0.139
B C E G
incidence
Löf, M. etal.,2007,BRE80144
SwedenWomen's Lifestyle andHealth Study
30 - 49 542 Cancer registry FFQProspectiveCohort
29590 13.0 years MUFA g/day
Invasive breast cancerAge >= 50yrs
26.4vs.10.4
50.45(0.25, 0.99)
0.01 A B C D E F
incidence
Menopausal status not specified
Jones, D.Y.,1987,BRE04461
US, Multi-ethnicNHANES I, 1971
25 - 74 86Generalpopulation(survey)
24h RecallProspectiveCohort
4902 10.0 years / 776 g/day
Breast cancer >29.0vs.<13.9
40.59(0.3, 1.13)
0.14 A B C D F
incidence
Knekt,P.,1990,BRE04898
Finland, Not specified,Screening ProgramMobile Clinic HealthExamination Survey, 1973
20 - 69
Through healthorg. (screening,healthinsurance)
Dietary Historyquestionnaire
ProspectiveCohort
3988.0 20.0 years g/day
Breast cancer >31.1vs.<22.6
32.7(0.99, 7.37)
0.05 A E
incidence
Howe, G.R.,1991,BRE17622
canada, Multi-ethnic,Screening ProgramNBSS, 1980
40 - 59 519
Through healthorg. (screening,healthinsurance)
Dietary Historyquestionnaire
Nested CaseControl
1182 5.0 years g/day
Breast cancer Quantile 4vs.Quantile 1
41.23(0.81, 1.89)
.04 A E G
incidence
Willett, W.C.,1992,BRE13438
U.S, Not specified,Registered nursesNurses' Health Study (NHS)Cohort 1976-1996
30 - 55 1439 By MailFFQ-Semi-quantitative
ProspectiveCohort
692676 8.0 years g/day
Breast cancer >34.0vs.<22.9
50.92(0.78, 1.09)
0.56 A C D E F G
incidence
Giovannucci,E.,1993,BRE03262
US, Not specified,Registered nursesNurses' Health Study (NHS)Cohort 1976-1996
30 - 55 392 By MailFFQ-Semi-quantitative
Nested CaseControl
786 2.0 years g/day
Breast cancer Quantile 5vs.Quantile 1
51.04(0.7, 1.55)
0.25 A E
incidence
Van den Brandt,P.A.,1993,BRE16919
the Netherlands, Notspecified, Post-menopausalwomenThe Netherlands Cohort
55 - 69 437 By MailFFQ-Semi-quantitative
ProspectiveCohort
51873.3 years / nolost g/day
Invasive breast cancer >1.0vs.>-1.0
50.75(0.5, 1.12)
0.13 A B C D E F G
incidence
Gaard,,1995,BRE17516
Norway, Not specified,Screening ProgramNorway National HealthScreening Service, 1974
35 - 49 248 By MailFFQ-Semi-quantitative
ProspectiveCohort
281925 10.0 years g/day
Breast cancer >21.0vs.<15.9
41.72(1.19, 2.49)
0.01 A D E F G
incidence
Kushi, L.H.,1995,BRE05142
US, Multi-ethnicIowa Women's Health Study
55 - 69 329 By MailFFQ-Semi-quantitative
ProspectiveCohort
34388.0 6.0 years g/day
Breast cancer ER+/PR+ >26.7vs.<22.6
31.27(0.97, 1.66)
0.09 A E
incidence
Kushi, L.H.,1995,BRE05142
US, Multi-ethnicIowa Women's Health Study
55 - 69 75 By MailFFQ-Semi-quantitative
ProspectiveCohort
34388.0 6.0 years g/day
Breast cancer ER+/PR- >26.7vs.<22.6
30.89(0.5, 1.59)
0.70 A E
incidence
Kushi, L.H.,1995,BRE05142
US, Multi-ethnicIowa Women's Health Study
55 - 69 14 By MailFFQ-Semi-quantitative
ProspectiveCohort
34388.0 6.0 years g/day
Breast cancer ER-/PR+ >26.7vs.<22.6
30.65(0.18, 2.31)
0.51 A E
incidence
154

Author, Year,WCRF Code
Country, Ethnicity, Specialcharacteristics
Age Cases n Caseascertainment
Type of studyNon-Cases n
Lenght offollow-up / loss
Assessmentdetail
Additional details Unit Outcome Subgroup Contrast Nocat. OR (95% CI) p
valueptrend A B C D E F G
adjustments
Kushi, L.H.,1995,BRE05142
US, Multi-ethnicIowa Women's Health Study
55 - 69 61 By MailFFQ-Semi-quantitative
ProspectiveCohort
34388.0 6.0 years g/day
Breast cancer ER-/PR- >26.7vs.<22.6
30.8(0.44, 1.46)
0.46 A E
incidence
Wolk,A.,1998,BRE13548
Sweden, Not specified,Screening ProgramThe Swedish MammographyCohort, 1987
40 - 76
Through healthorg. (screening,healthinsurance)
FFQ (nos)ProspectiveCohort
61147.0 4.2 years g/day
Invasive breast cancer >18.41vs.<14.39
40.95(0.72, 1.24)
.38 A B C D E F
incidence
Thiebaut, A.C.,2001,BRE12244
France, Multi-ethnic,Registered teachersE3N-EPIC, 1990
40 - 65
Through socialorganization(profession,religion)
FFQ-Semi-quantitative
ProspectiveCohort
65879.0 3.4 years g/day
Breast cancer 4° quartilevs.1° quartiles
21.22(0.93, 1.59)
A B C D E F G
incidence
Voorrips, L.E.,2002,BRE13011
The Netherlands, Notspecified, Post-menopausalwomenThe Netherlands Cohort
55 - 69 783 By MailFFQ-Semi-quantitative
Case Cohort 62573.0 6.3 years g/day
Breast cancer 27.0vs.18.0
50.61(0.38, 0.96)
.001 A B C D E F G
incidence
FrazierL.A.,2003,BRE02941
USA, Multi-ethnic,Registered nursesNurses' Health Study (NHS)Cohort 1976-1996
40 - 65
Through healthorg. (screening,healthinsurance)
FFQ (nos)Nested CaseControl
121700.0 10.0 years adolescent g/day
Breast cancer 39.8vs.13.3
50.89(null, null)
0.28 A C D E F G
incidence
Löf, M. etal.,2007,BRE80144
SwedenWomen's Lifestyle andHealth Study
30 - 49 974 Cancer registry FFQProspectiveCohort
43595 13.0 years MUFA g/day
Invasive breast cancer 26.5vs.10.4
50.88(0.53, 1.46)
0.65 A B C D E F
incidence
Oleic acid
Post-menopausal
Barrett-Connor,E.,1993,BRE00581
U.S, WhiteRancho Bernardo, 1972
40 - 79 15
Through socialorganization(profession,religion)
24h RecallProspectiveCohort
575 15.0 yearsBreast cancer
Post-menopausal
1null(null, null)
incidence
Byrne,C.,2002,BRE01315
U.S, Multi-ethnic, Post-menopausalNurses' Health Study (NHS)Cohort 1976-1996
(57) 1071 By MailFFQ-Semi-quantitative
ProspectiveCohort
44697 14.0 years g/day
Invasive breast cancerPost-menopausal
Quantile 5vs.Quantile 1
51.13(0.81, 1.57)
0.67 A C D E F G
incidence
Wirfalt,E.,2004,BRE17083
Sweden, Not specified, Post-menopausalMalmo Diet and Cancer,1991
50 - By Mail7-day Record +Questionnaire
Nested CaseControl
12803.0 8.0 years percent of total fattyacids
Breast cancerPost-menopausal
1null(null, null)
incidence
Menopausal status not specified
Toniolo,P.,1994,BRE12398
U.S.A., Not specifiedNew York Women's HealthStudy, 1985
35 - 65
Through healthorg. (screening,healthinsurance)
FFQ-Semi-quantitative
Nested CaseControl
14291.0 7.0 years g/day
Invasive breast cancer 42.0vs.10.0
51.57(0.9, 2.71)
0.24incidence
Voorrips, L.E.,2002,BRE13011
The Netherlands, Notspecified, Post-menopausalwomenThe Netherlands Cohort
55 - 69 783 By MailFFQ-Semi-quantitative
Case Cohort 62573.0 6.3 years g/day
Breast cancer 21.0vs.13.0
50.67(0.44, 1.03)
.001 A B C D E F G
incidence
155

Author, Year,WCRF Code
Country, Ethnicity, Specialcharacteristics
Age Cases n Caseascertainment
Type of studyNon-Cases n
Lenght offollow-up / loss
Assessmentdetail
Additional details Unit Outcome Subgroup Contrast Nocat. OR (95% CI) p
valueptrend A B C D E F G
adjustments
Horn-Ross,P.L.,2002,BRE15412
USA, Multi-ethnic,Registered teachersCalifornia Teachers Study,1995
21 - 103 By Mail FFQ (nos)ProspectiveCohort
111383.0 2.0 years g/day
Invasive breast cancer <29.0vs.<13.0
50.9(0.6, 1.2)
0.5 A C D E F G
incidence
Other 18:1 isomers
Menopausal status not specified
Voorrips, L.E.,2002,BRE13011
The Netherlands, Notspecified, Post-menopausalwomenThe Netherlands Cohort
55 - 69 783 By MailFFQ-Semi-quantitative
Case Cohort 62573.0 6.3 years g/day
Breast cancer 2.3vs.0.4
50.89(0.65, 1.21)
.91 A B C D E F G
incidence
Palmitoleic acid
Post-menopausal
Wirfalt,E.,2004,BRE17083
Sweden, Not specified, Post-menopausalMalmo Diet and Cancer,1991
50 - By Mail7-day Record +Questionnaire
Nested CaseControl
12803.0 8.0 years percent of total fattyacids
Breast cancerPost-menopausal
1null(null, null)
incidence
Serum Cis MUFA
Pre-menopausal
Rissanen,H.,2003,BRE17954
Finland, Not specifiedMobile Clinic HealthExamination Survey, 1973
18 - 89 27Throughnetwork, paper,tv
Nested CaseControl
51 10.0 years %
Breast cancerPre-menopausal
>31.2vs.<27.71
31.67(0.45, 6.15)
0.73incidence
Post-menopausal
Rissanen,H.,2003,BRE17954
Finland, Not specifiedMobile Clinic HealthExamination Survey, 1973
18 - 89 31Throughnetwork, paper,tv
Nested CaseControl
59 10.0 years %
Breast cancerPost-menopausal
>34.43vs.<31.54
32.26(0.54, 9.51)
0.32incidence
Menopausal status not specified
Rissanen,H.,2003,BRE17954
Finland, Not specifiedMobile Clinic HealthExamination Survey, 1973
18 - 89 58Throughnetwork, paper,tv
Nested CaseControl
110 10.0 years %
Breast cancer >1.0vs.>-1.0
31.76(0.7, 4.43)
0.33incidence
Serum MUFA
Pre-menopausal
Vatten, L.J.,1993,BRE12821
Norway, Not specifiedNorway Serum Bank, 1973
65Throughnetwork, paper,tv
Nested CaseControl
195 18.0 years mg/liter
Breast cancerPre-menopausal
>1.0vs.>-1.0
40.6(0.3, 1.4)
0.18incidence
Saadatian-Elahi,M.,2002,BRE21486
US, Not specifiedNew York Women's HealthStudy, 1985
34 - 65 91Throughnetwork, paper,tv
Nested CaseControl
91 4.3 years %
Breast cancerPre-menopausal
>1.0vs.>-1.0
41.13(0.42, 3.04)
0.82 A C F G
incidence
156
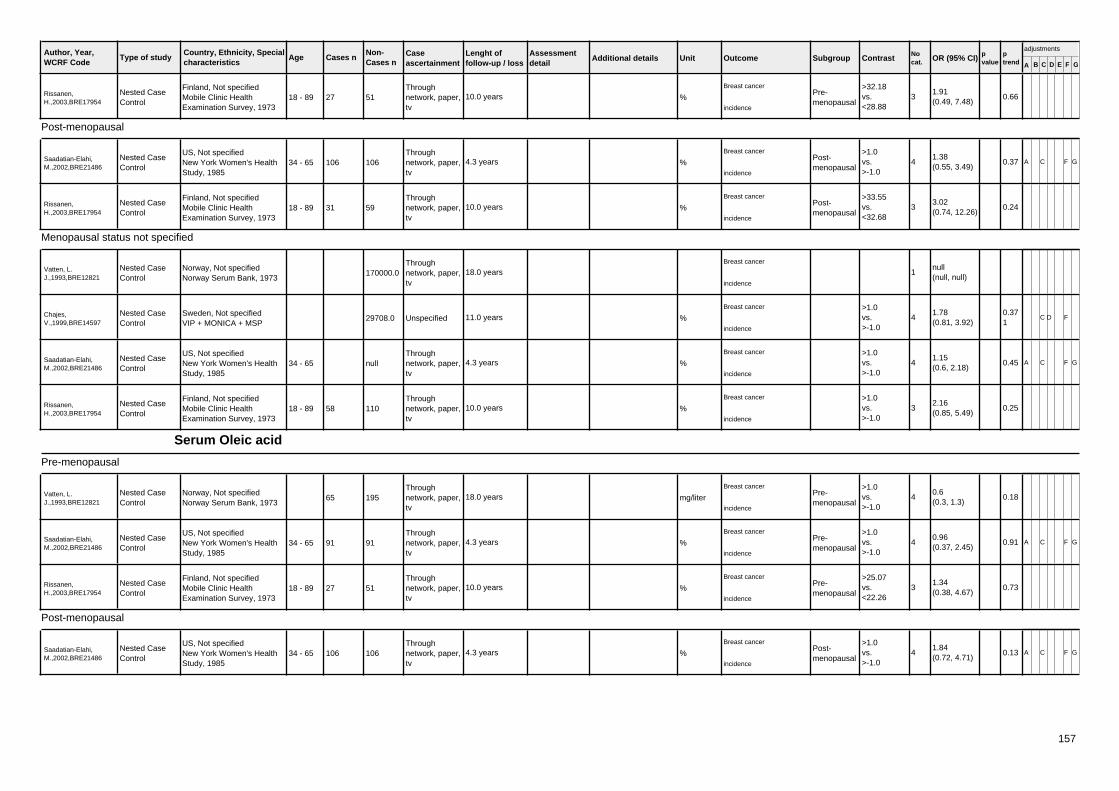
Author, Year,WCRF Code
Country, Ethnicity, Specialcharacteristics
Age Cases n Caseascertainment
Type of studyNon-Cases n
Lenght offollow-up / loss
Assessmentdetail
Additional details Unit Outcome Subgroup Contrast Nocat. OR (95% CI) p
valueptrend A B C D E F G
adjustments
Rissanen,H.,2003,BRE17954
Finland, Not specifiedMobile Clinic HealthExamination Survey, 1973
18 - 89 27Throughnetwork, paper,tv
Nested CaseControl
51 10.0 years %
Breast cancerPre-menopausal
>32.18vs.<28.88
31.91(0.49, 7.48)
0.66incidence
Post-menopausal
Saadatian-Elahi,M.,2002,BRE21486
US, Not specifiedNew York Women's HealthStudy, 1985
34 - 65 106Throughnetwork, paper,tv
Nested CaseControl
106 4.3 years %
Breast cancerPost-menopausal
>1.0vs.>-1.0
41.38(0.55, 3.49)
0.37 A C F G
incidence
Rissanen,H.,2003,BRE17954
Finland, Not specifiedMobile Clinic HealthExamination Survey, 1973
18 - 89 31Throughnetwork, paper,tv
Nested CaseControl
59 10.0 years %
Breast cancerPost-menopausal
>33.55vs.<32.68
33.02(0.74, 12.26)
0.24incidence
Menopausal status not specified
Vatten, L.J.,1993,BRE12821
Norway, Not specifiedNorway Serum Bank, 1973
Throughnetwork, paper,tv
Nested CaseControl
170000.0 18.0 yearsBreast cancer
1null(null, null)
incidence
Chajes,V.,1999,BRE14597
Sweden, Not specifiedVIP + MONICA + MSP
UnspecifiedNested CaseControl
29708.0 11.0 years %
Breast cancer >1.0vs.>-1.0
41.78(0.81, 3.92)
0.371
C D F
incidence
Saadatian-Elahi,M.,2002,BRE21486
US, Not specifiedNew York Women's HealthStudy, 1985
34 - 65Throughnetwork, paper,tv
Nested CaseControl
null 4.3 years %
Breast cancer >1.0vs.>-1.0
41.15(0.6, 2.18)
0.45 A C F G
incidence
Rissanen,H.,2003,BRE17954
Finland, Not specifiedMobile Clinic HealthExamination Survey, 1973
18 - 89 58Throughnetwork, paper,tv
Nested CaseControl
110 10.0 years %
Breast cancer >1.0vs.>-1.0
32.16(0.85, 5.49)
0.25incidence
Serum Oleic acid
Pre-menopausal
Vatten, L.J.,1993,BRE12821
Norway, Not specifiedNorway Serum Bank, 1973
65Throughnetwork, paper,tv
Nested CaseControl
195 18.0 years mg/liter
Breast cancerPre-menopausal
>1.0vs.>-1.0
40.6(0.3, 1.3)
0.18incidence
Saadatian-Elahi,M.,2002,BRE21486
US, Not specifiedNew York Women's HealthStudy, 1985
34 - 65 91Throughnetwork, paper,tv
Nested CaseControl
91 4.3 years %
Breast cancerPre-menopausal
>1.0vs.>-1.0
40.96(0.37, 2.45)
0.91 A C F G
incidence
Rissanen,H.,2003,BRE17954
Finland, Not specifiedMobile Clinic HealthExamination Survey, 1973
18 - 89 27Throughnetwork, paper,tv
Nested CaseControl
51 10.0 years %
Breast cancerPre-menopausal
>25.07vs.<22.26
31.34(0.38, 4.67)
0.73incidence
Post-menopausal
Saadatian-Elahi,M.,2002,BRE21486
US, Not specifiedNew York Women's HealthStudy, 1985
34 - 65 106Throughnetwork, paper,tv
Nested CaseControl
106 4.3 years %
Breast cancerPost-menopausal
>1.0vs.>-1.0
41.84(0.72, 4.71)
0.13 A C F G
incidence
157

Author, Year,WCRF Code
Country, Ethnicity, Specialcharacteristics
Age Cases n Caseascertainment
Type of studyNon-Cases n
Lenght offollow-up / loss
Assessmentdetail
Additional details Unit Outcome Subgroup Contrast Nocat. OR (95% CI) p
valueptrend A B C D E F G
adjustments
Rissanen,H.,2003,BRE17954
Finland, Not specifiedMobile Clinic HealthExamination Survey, 1973
18 - 89 31Throughnetwork, paper,tv
Nested CaseControl
59 10.0 years %
Breast cancerPost-menopausal
>26.33vs.<24.55
33.7(0.84, 15.83)
0.21incidence
Menopausal status not specified
Vatten, L.J.,1993,BRE12821
Norway, Not specifiedNorway Serum Bank, 1973
Throughnetwork, paper,tv
Nested CaseControl
170000.0 18.0 yearsBreast cancer
1null(null, null)
incidence
Chajes,V.,1999,BRE14597
Sweden, Not specifiedVIP + MONICA + MSP
UnspecifiedNested CaseControl
29708.0 11.0 years %
Breast cancer >1.0vs.>-1.0
42.25(0.98, 1.02)
0.205
C D F
incidence
Saadatian-Elahi,M.,2002,BRE21486
US, Not specifiedNew York Women's HealthStudy, 1985
34 - 65Throughnetwork, paper,tv
Nested CaseControl
null 4.3 years %
Breast cancer >1.0vs.>-1.0
41.23(0.65, 2.32)
0.33 A C F G
incidence
Rissanen,H.,2003,BRE17954
Finland, Not specifiedMobile Clinic HealthExamination Survey, 1973
18 - 89 58Throughnetwork, paper,tv
Nested CaseControl
110 10.0 years %
Breast cancer >1.0vs.>-1.0
31.91(0.78, 4.67)
0.25incidence
Serum Palmitoleic acid
Pre-menopausal
Saadatian-Elahi,M.,2002,BRE21486
US, Not specifiedNew York Women's HealthStudy, 1985
34 - 65 91Throughnetwork, paper,tv
Nested CaseControl
91 4.3 years %
Breast cancerPre-menopausal
>1.0vs.>-1.0
41.07(0.41, 2.79)
0.77 A C F G
incidence
Rissanen,H.,2003,BRE17954
Finland, Not specifiedMobile Clinic HealthExamination Survey, 1973
18 - 89 27Throughnetwork, paper,tv
Nested CaseControl
51 10.0 years %
Breast cancerPre-menopausal
>3.25vs.<2.61
31.56(0.45, 5.39)
0.88incidence
Post-menopausal
Saadatian-Elahi,M.,2002,BRE21486
US, Not specifiedNew York Women's HealthStudy, 1985
34 - 65 106Throughnetwork, paper,tv
Nested CaseControl
106 4.3 years %
Breast cancerPost-menopausal
>1.0vs.>-1.0
41.27(0.54, 3.09)
0.53 A C F G
incidence
Rissanen,H.,2003,BRE17954
Finland, Not specifiedMobile Clinic HealthExamination Survey, 1973
18 - 89 31Throughnetwork, paper,tv
Nested CaseControl
59 10.0 years %
Breast cancerPost-menopausal
>4.61vs.<3.57
30.89(0.28, 2.83)
0.87incidence
Menopausal status not specified
Chajes,V.,1999,BRE14597
Sweden, Not specifiedVIP + MONICA + MSP
UnspecifiedNested CaseControl
29708.0 11.0 years %
Breast cancer >1.0vs.>-1.0
40.69(0.3, 1.56)
0.384
C D F
incidence
Saadatian-Elahi,M.,2002,BRE21486
US, Not specifiedNew York Women's HealthStudy, 1985
34 - 65Throughnetwork, paper,tv
Nested CaseControl
null 4.3 yearsBreast cancer >1.0
vs.>-1.0
41.16(0.62, 2.16)
0.53 A C F G
incidence
158

Author, Year,WCRF Code
Country, Ethnicity, Specialcharacteristics
Age Cases n Caseascertainment
Type of studyNon-Cases n
Lenght offollow-up / loss
Assessmentdetail
Additional details Unit Outcome Subgroup Contrast Nocat. OR (95% CI) p
valueptrend A B C D E F G
adjustments
Rissanen,H.,2003,BRE17954
Finland, Not specifiedMobile Clinic HealthExamination Survey, 1973
18 - 89 58Throughnetwork, paper,tv
Nested CaseControl
110 10.0 years %
Breast cancer >1.0vs.>-1.0
31.16(0.49, 2.7)
0.95incidence
Serum Vaccenic acid
Pre-menopausal
Saadatian-Elahi,M.,2002,BRE21486
US, Not specifiedNew York Women's HealthStudy, 1985
34 - 65 91Throughnetwork, paper,tv
Nested CaseControl
91 4.3 years %
Breast cancerPre-menopausal
>1.0vs.>-1.0
40.63(0.22, 1.79)
0.31 A C F G
incidence
Post-menopausal
Saadatian-Elahi,M.,2002,BRE21486
US, Not specifiedNew York Women's HealthStudy, 1985
34 - 65 106Throughnetwork, paper,tv
Nested CaseControl
106 4.3 years %
Breast cancerPost-menopausal
>1.0vs.>-1.0
40.72(0.28, 1.84)
0.57 A C F G
incidence
Menopausal status not specified
Chajes,V.,1999,BRE14597
Sweden, Not specifiedVIP + MONICA + MSP
UnspecifiedNested CaseControl
29708.0 11.0 years %
Breast cancer >1.0vs.>-1.0
40.89(0.36, 2.2)
0.986
C D F
incidence
Saadatian-Elahi,M.,2002,BRE21486
US, Not specifiedNew York Women's HealthStudy, 1985
34 - 65Throughnetwork, paper,tv
Nested CaseControl
null 4.3 years %
Breast cancer >1.0vs.>-1.0
40.74(0.38, 1.46)
0.36 A C F G
incidence
5.2.4
Erythrocyte PUFA fatty acids
Post-menopausal
Pala V.,2001,BRE20601Italy, CaucasianORDET study, 1987
42 - 69 71Nested CaseControl
141 5.5 yearsBreast cancer
Post-menopausal
>43.61vs.<42.43
30.34(0.15, 0.79)
.01cancer death
Polyunsaturated fatty acids
Pre-menopausal
FrazierL.A.,2004,BRE02942
USA, Multi-ethnic,Registered nursesNurses' Health study II
34 - 51 361
Through healthorg. (screening,healthinsurance)
FFQ (nos)Historical Cohort 47517 9.0 years adolescent diet g/day
Breast cancerPre-menopausal
25.5vs.15.4
50.86(0.61, 1.2)
0.11 A C D E F G
incidence
Löf, M. etal.,2007,BRE80144
SwedenWomen's Lifestyle andHealth Study
30 - 49 432 Cancer registry FFQProspectiveCohort
44137 13.0 years PUFA g/day
Invasive breast cancer
Age < 50 yrs11.2vs.4.3
51.06(0.64, 1.75)
0.71 A B C D E F
incidence
Post-menopausal
159

Author, Year,WCRF Code
Country, Ethnicity, Specialcharacteristics
Age Cases n Caseascertainment
Type of studyNon-Cases n
Lenght offollow-up / loss
Assessmentdetail
Additional details Unit Outcome Subgroup Contrast Nocat. OR (95% CI) p
valueptrend A B C D E F G
adjustments
Kushi L.H.,1992,BRE05141
US, Multi-ethnic, Post-menopausalIowa Women's Health Study
55 - 69 459 By MailFFQ-Semi-quantitative
ProspectiveCohort
130443 4.0 years / 1086 g/day
Breast cancerPost-menopausal
15.8vs.9.2
41.49(1.01, 2.2)
0.05 A C D E F G
incidence
Barrett-Connor,E.,1993,BRE00581
U.S, WhiteRancho Bernardo, 1972
40 - 79 15
Through socialorganization(profession,religion)
24h RecallProspectiveCohort
575 15.0 yearsBreast cancer
Post-menopausal
1null(null, null)
incidence
Wirfalt,E.,2002,BRE13504
Sweden, Not specified, Post-menopausalMalmo Diet and Cancer,1991
50 - 237 By Mail7-day Record +Questionnaire
Nested CaseControl
673 8.0 years g/day
Breast cancerPost-menopausal
19.0vs.9.3
53.02(1.75, 5.21)
0.0007
B C D E F
incidence
Sieri,Sabina,2002,BRE20941
Italy, Not specified, Post-menopausalORDET study, 1987
41 - 70 56Throughnetwork, paper,tv
FFQ-Semi-quantitative
Nested CaseControl
214 5.5 years g/day
Breast cancerPost-menopausal
7.7 - 18.0vs.<6.3
32.03(0.68, 6.03)
0.202
B C E G
incidence
Löf, M. etal.,2007,BRE80144
SwedenWomen's Lifestyle andHealth Study
30 - 49 542 Cancer registry FFQProspectiveCohort
29590 13.0 years PUFA g/day
Invasive breast cancerAge >= 50yrs
11.2vs.4.3
50.54(0.35, 0.85)
0.08 A B C D E F
incidence
Menopausal status not specified
Jones, D.Y.,1987,BRE04461
US, Multi-ethnicNHANES I, 1971
25 - 74 86Generalpopulation(survey)
24h RecallProspectiveCohort
4902 10.0 years / 776 g/day
Breast cancer >9.0vs.<2.9
40.73(0.39, 1.36)
0.45 A B C D F
incidence
Knekt,P.,1990,BRE04898
Finland, Not specified,Screening ProgramMobile Clinic HealthExamination Survey, 1973
20 - 69
Through healthorg. (screening,healthinsurance)
Dietary Historyquestionnaire
ProspectiveCohort
3988.0 20.0 years g/day
Breast cancer >6.8vs.<4.5
31.23(0.55, 2.75)
0.28 A E
incidence
Howe, G.R.,1991,BRE17622
canada, Multi-ethnic,Screening ProgramNBSS, 1980
40 - 59 519
Through healthorg. (screening,healthinsurance)
Dietary Historyquestionnaire
Nested CaseControl
1182 5.0 years g/day
Breast cancer Quantile 4vs.Quantile 1
41.3(0.93, 1.82)
.13 A E G
incidence
Giovannucci,E.,1993,BRE03262
US, Not specified,Registered nursesNurses' Health Study (NHS)Cohort 1976-1996
30 - 55 392 By MailFFQ-Semi-quantitative
Nested CaseControl
786 2.0 years g/day
Breast cancer Quantile 5vs.Quantile 1
50.83(0.57, 1.21)
0.43 A E
incidence
Van den Brandt,P.A.,1993,BRE16919
the Netherlands, Notspecified, Post-menopausalwomenThe Netherlands Cohort
55 - 69 437 By MailFFQ-Semi-quantitative
ProspectiveCohort
51873.3 years / nolost g/day
Invasive breast cancer >1.0vs.>-1.0
50.95(0.64, 1.4)
0.85 A B C D E F G
incidence
Kushi, L.H.,1995,BRE05142
US, Multi-ethnicIowa Women's Health Study
55 - 69 329 By MailFFQ-Semi-quantitative
ProspectiveCohort
34388.0 6.0 years g/day
Breast cancer ER+/PR+ >13.1vs.<10.6
30.93(0.71, 1.22)
0.58 A E
incidence
Kushi, L.H.,1995,BRE05142
US, Multi-ethnicIowa Women's Health Study
55 - 69 75 By MailFFQ-Semi-quantitative
ProspectiveCohort
34388.0 6.0 years g/day
Breast cancer ER+/PR- >13.1vs.<10.6
30.9(0.52, 1.54)
0.70 A E
incidence
160

Author, Year,WCRF Code
Country, Ethnicity, Specialcharacteristics
Age Cases n Caseascertainment
Type of studyNon-Cases n
Lenght offollow-up / loss
Assessmentdetail
Additional details Unit Outcome Subgroup Contrast Nocat. OR (95% CI) p
valueptrend A B C D E F G
adjustments
Kushi, L.H.,1995,BRE05142
US, Multi-ethnicIowa Women's Health Study
55 - 69 14 By MailFFQ-Semi-quantitative
ProspectiveCohort
34388.0 6.0 years g/day
Breast cancer ER-/PR+ >13.1vs.<10.6
30.5(0.12, 1.99)
0.32 A E
incidence
Kushi, L.H.,1995,BRE05142
US, Multi-ethnicIowa Women's Health Study
55 - 69 61 By MailFFQ-Semi-quantitative
ProspectiveCohort
34388.0 6.0 years g/day
Breast cancer ER-/PR- >13.1vs.<10.6
31.32(0.73, 2.4)
0.32 A E
incidence
Wolk,A.,1998,BRE13548
Sweden, Not specified,Screening ProgramThe Swedish MammographyCohort, 1987
40 - 76
Through healthorg. (screening,healthinsurance)
FFQ (nos)ProspectiveCohort
61147.0 4.2 years g/day
Invasive breast cancer >7.71vs.<5.29
41.01(0.8, 1.26)
.92 A B C D E F
incidence
Thiebaut, A.C.,2001,BRE12244
France, Multi-ethnic,Registered teachersE3N-EPIC, 1990
40 - 65
Through socialorganization(profession,religion)
FFQ-Semi-quantitative
ProspectiveCohort
65879.0 3.4 years g/day
Breast cancer 4° quartilevs.1° quartiles
21.14(0.91, 1.42)
A B C D E F G
incidence
Voorrips, L.E.,2002,BRE13011
The Netherlands, Notspecified, Post-menopausalwomenThe Netherlands Cohort
55 - 69 783 By MailFFQ-Semi-quantitative
Case Cohort 62573.0 6.3 years g/day
Breast cancer 24.0vs.8.0
50.88(0.65, 1.21)
.39 A B C D E F G
incidence
Löf, M. etal.,2007,BRE80144
SwedenWomen's Lifestyle andHealth Study
30 - 49 974 Cancer registry FFQProspectiveCohort
43595 13.0 years PUFA g/day
Invasive breast cancer 11.2vs.4.3
50.72(0.52, 1.0)
0.08 A B C D E F
incidence
Serum PUFA
Pre-menopausal
Vatten, L.J.,1993,BRE12821
Norway, Not specifiedNorway Serum Bank, 1973
65Throughnetwork, paper,tv
Nested CaseControl
195 18.0 years mg/liter
Breast cancerPre-menopausal
>1.0vs.>-1.0
40.6(0.3, 1.4)
0.14incidence
Vatten, L.J.,1993,BRE12821
Norway, Not specifiedNorway Serum Bank, 1973
65Throughnetwork, paper,tv
Nested CaseControl
195 18.0 years mg/liter
Breast cancerPre-menopausal
>1.0vs.>-1.0
41.0(0.4, 2.1)
0.75incidence
Saadatian-Elahi,M.,2002,BRE21486
US, Not specifiedNew York Women's HealthStudy, 1985
34 - 65 91Throughnetwork, paper,tv
Nested CaseControl
91 4.3 years %
Breast cancerPre-menopausal
>1.0vs.>-1.0
40.6(0.24, 1.54)
0.39 A C F G
incidence
Rissanen,H.,2003,BRE17954
Finland, Not specifiedMobile Clinic HealthExamination Survey, 1973
18 - 89 27Throughnetwork, paper,tv
Nested CaseControl
51 10.0 years %
Breast cancerPre-menopausal
>34.84vs.<31.13
30.55(0.15, 1.97)
0.43incidence
Post-menopausal
Saadatian-Elahi,M.,2002,BRE21486
US, Not specifiedNew York Women's HealthStudy, 1985
34 - 65 106Throughnetwork, paper,tv
Nested CaseControl
106 4.3 years %
Breast cancerPost-menopausal
>1.0vs.>-1.0
40.42(0.17, 1.08)
0.09 A C F G
incidence
161

Author, Year,WCRF Code
Country, Ethnicity, Specialcharacteristics
Age Cases n Caseascertainment
Type of studyNon-Cases n
Lenght offollow-up / loss
Assessmentdetail
Additional details Unit Outcome Subgroup Contrast Nocat. OR (95% CI) p
valueptrend A B C D E F G
adjustments
Rissanen,H.,2003,BRE17954
Finland, Not specifiedMobile Clinic HealthExamination Survey, 1973
18 - 89 31Throughnetwork, paper,tv
Nested CaseControl
59 10.0 years %
Breast cancerPost-menopausal
>31.53vs.<26.69
30.13(0.03, 0.62)
0.03incidence
Menopausal status not specified
Vatten, L.J.,1993,BRE12821
Norway, Not specifiedNorway Serum Bank, 1973
Throughnetwork, paper,tv
Nested CaseControl
170000.0 18.0 yearsBreast cancer
1null(null, null)
incidence
Saadatian-Elahi,M.,2002,BRE21486
US, Not specifiedNew York Women's HealthStudy, 1985
34 - 65Throughnetwork, paper,tv
Nested CaseControl
null 4.3 years %
Breast cancer >1.0vs.>-1.0
40.59(0.31, 1.09)
0.09 A C F G
incidence
Rissanen,H.,2003,BRE17954
Finland, Not specifiedMobile Clinic HealthExamination Survey, 1973
18 - 89 58Throughnetwork, paper,tv
Nested CaseControl
110 10.0 years %
Breast cancer >1.0vs.>-1.0
30.31(0.12, 0.77)
0.04incidence
5.2.4.1
Alpha-linolenic acid
Post-menopausal
Barrett-Connor,E.,1993,BRE00581
U.S, WhiteRancho Bernardo, 1972
40 - 79 15
Through socialorganization(profession,religion)
24h RecallProspectiveCohort
575 15.0 yearsBreast cancer
Post-menopausal
1null(null, null)
incidence
Sieri,Sabina,2002,BRE20941
Italy, Not specified, Post-menopausalORDET study, 1987
41 - 70 56Throughnetwork, paper,tv
FFQ-Semi-quantitative
Nested CaseControl
214 5.5 years linolenic acid g/day
Breast cancerPost-menopausal
0.99 - 1.69vs.<0.86
30.71(0.2, 2.55)
0.593
B C E G
incidence
Wirfalt,E.,2004,BRE17083
Sweden, Not specified, Post-menopausalMalmo Diet and Cancer,1991
50 - By Mail7-day Record +Questionnaire
Nested CaseControl
12803.0 8.0 years percent of total fattyacids
Breast cancerPost-menopausal
1null(null, null)
incidence
Menopausal status not specified
Holmes, M.D.,1999,BRE04008
US, Multi-ethnic, RegisterednursesNurses' Health Study (NHS)Cohort 1976-1996
30 - 55 2097 By MailFFQ-Semi-quantitative
ProspectiveCohort
121700.0 14.0 years % of totalenergy/day
Invasive breast cancer1.0(continuous)
10.75(0.54, 1.03)
A C D E F G
incidence
Voorrips, L.E.,2002,BRE13011
The Netherlands, Notspecified, Post-menopausalwomenThe Netherlands Cohort
55 - 69 783 By MailFFQ-Semi-quantitative
Case Cohort 62573.0 6.3 years g/day
Breast cancer 1.7vs.0.6
50.7(0.51, 0.97)
.006 A B C D E F G
incidence
DHA (Docosahexaenoic acid)
Post-menopausal
Wirfalt,E.,2004,BRE17083
Sweden, Not specified, Post-menopausalMalmo Diet and Cancer,1991
50 - By Mail7-day Record +Questionnaire
Nested CaseControl
12803.0 8.0 years percent of total fattyacids
Breast cancerPost-menopausal
1null(null, null)
incidence
162

Author, Year,WCRF Code
Country, Ethnicity, Specialcharacteristics
Age Cases n Caseascertainment
Type of studyNon-Cases n
Lenght offollow-up / loss
Assessmentdetail
Additional details Unit Outcome Subgroup Contrast Nocat. OR (95% CI) p
valueptrend A B C D E F G
adjustments
Menopausal status not specified
Holmes, M.D.,1999,BRE04008
US, Multi-ethnic, RegisterednursesNurses' Health Study (NHS)Cohort 1976-1996
30 - 55 2097 By MailFFQ-Semi-quantitative
ProspectiveCohort
121700.0 14.0 years % of totalenergy/day
Invasive breast cancer0.03(continuous)
11.04(1.01, 1.06)
A C D E F G
incidence
Voorrips, L.E.,2002,BRE13011
The Netherlands, Notspecified, Post-menopausalwomenThe Netherlands Cohort
55 - 69 783 By MailFFQ-Semi-quantitative
Case Cohort 62573.0 6.3 years g/day
Breast cancer 0.14vs.0.01
51.0(0.72, 1.37)
.70 A B C D E F G
incidence
Docosapentaenoic acid
Post-menopausal
Wirfalt,E.,2004,BRE17083
Sweden, Not specified, Post-menopausalMalmo Diet and Cancer,1991
50 - By Mail7-day Record +Questionnaire
Nested CaseControl
12803.0 8.0 years percent of total fattyacids
Breast cancerPost-menopausal
1null(null, null)
incidence
Eicosapentainoic acid
Post-menopausal
Wirfalt,E.,2004,BRE17083
Sweden, Not specified, Post-menopausalMalmo Diet and Cancer,1991
50 - By Mail7-day Record +Questionnaire
Nested CaseControl
12803.0 8.0 years percent of total fattyacids
Breast cancerPost-menopausal
1null(null, null)
incidence
Menopausal status not specified
Holmes, M.D.,1999,BRE04008
US, Multi-ethnic, RegisterednursesNurses' Health Study (NHS)Cohort 1976-1996
30 - 55 2097 By MailFFQ-Semi-quantitative
ProspectiveCohort
121700.0 14.0 years % of totalenergy/day
Invasive breast cancer0.03(continuous)
11.06(1.02, 1.1)
A C D E F G
incidence
Voorrips, L.E.,2002,BRE13011
The Netherlands, Notspecified, Post-menopausalwomenThe Netherlands Cohort
55 - 69 783 By MailFFQ-Semi-quantitative
Case Cohort 62573.0 6.3 years g/day
Breast cancer 0.08vs.0.0
50.98(0.72, 1.35)
.87 A B C D E F G
incidence
Erythrocyte 22:5,n-3c
Post-menopausal
Pala V.,2001,BRE20601Italy, CaucasianORDET study, 1987
42 - 69 71Nested CaseControl
141 5.5 years05.02.04.01Erythrocyte n-3 fattyacids 22:5,n-3c
Breast cancerPost-menopausal
>2.19vs.<1.97
30.83(0.4, 1.73)
.65incidence
Erythrocyte Alpha-Linolenic acid
Post-menopausal
Pala V.,2001,BRE20601Italy, CaucasianORDET study, 1987
42 - 69 71Nested CaseControl
141 5.5 years05.02.04.01Erythrocyte n-3 fattyacids 18:3,n-3c
Breast cancerPost-menopausal
>0.11vs.<0.08
31.38(0.7, 2.7)
.35incidence
163

Author, Year,WCRF Code
Country, Ethnicity, Specialcharacteristics
Age Cases n Caseascertainment
Type of studyNon-Cases n
Lenght offollow-up / loss
Assessmentdetail
Additional details Unit Outcome Subgroup Contrast Nocat. OR (95% CI) p
valueptrend A B C D E F G
adjustments
Wirfalt,E.,2004,BRE17083
Sweden, Not specified, Post-menopausalMalmo Diet and Cancer,1991
50 - By Mail7-day Record +Questionnaire
Nested CaseControl
12803.0 8.0 years %
Breast cancerPost-menopausal
0.1(continuous)
10.91(0.75, 1.09)
0.304
incidence
Erythrocyte DHA
Post-menopausal
Pala V.,2001,BRE20601Italy, CaucasianORDET study, 1987
42 - 69 71Nested CaseControl
141 5.5 years05.02.04.01Erythrocyte n-3 fattyacids 22:6,n-3c
Breast cancerPost-menopausal
>6.15vs.<5.3
30.48(0.23, 1.0)
.05cancer death
Wirfalt,E.,2004,BRE17083
Sweden, Not specified, Post-menopausalMalmo Diet and Cancer,1991
50 - By Mail7-day Record +Questionnaire
Nested CaseControl
12803.0 8.0 years %
Breast cancerPost-menopausal
1.0(continuous)
11.1(0.65, 1.85)
0.723
incidence
Wirfalt,E.,2004,BRE17083
Sweden, Not specified, Post-menopausalMalmo Diet and Cancer,1991
50 - By Mail7-day Record +Questionnaire
Nested CaseControl
12803.0 8.0 years %
Breast cancerPost-menopausal
1.0(continuous)
10.96(0.83, 1.11)
0.603
incidence
Erythrocyte EPA
Post-menopausal
Pala V.,2001,BRE20601Italy, CaucasianORDET study, 1987
42 - 69 71Nested CaseControl
141 5.5 years05.02.04.01Erythrocyte n-3 fattyacids 20:5,n-3c
Breast cancerPost-menopausal
>0.66vs.<0.49
30.76(0.35, 1.62)
.46incidence
Wirfalt,E.,2004,BRE17083
Sweden, Not specified, Post-menopausalMalmo Diet and Cancer,1991
50 - By Mail7-day Record +Questionnaire
Nested CaseControl
12803.0 8.0 years %
Breast cancerPost-menopausal
1.0(continuous)
10.98(0.75, 1.27)
0.853
incidence
Erythrocyte Long-chain n-3 fatty acids
Post-menopausal
Pala V.,2001,BRE20601Italy, CaucasianORDET study, 1987
42 - 69 71Nested CaseControl
141 5.5 yearsBreast cancer
Post-menopausal
>8.89vs.<7.97
30.51(0.25, 1.04)
.06incidence
Erythrocyte n-3 fatty acids
Post-menopausal
Pala V.,2001,BRE20601Italy, CaucasianORDET study, 1987
42 - 69 71Nested CaseControl
141 5.5 years n-3 PUFA
Breast cancerPost-menopausal
>8.97vs.<8.05
30.53(0.26, 1.08)
.07incidence
n-3 fatty acids
Post-menopausal
164

Author, Year,WCRF Code
Country, Ethnicity, Specialcharacteristics
Age Cases n Caseascertainment
Type of studyNon-Cases n
Lenght offollow-up / loss
Assessmentdetail
Additional details Unit Outcome Subgroup Contrast Nocat. OR (95% CI) p
valueptrend A B C D E F G
adjustments
Wirfalt,E.,2002,BRE13504
Sweden, Not specified, Post-menopausalMalmo Diet and Cancer,1991
50 - 237 By Mail7-day Record +Questionnaire
Nested CaseControl
673 8.0 years g/day
Breast cancerPost-menopausal
3.2vs.1.5
51.81(1.09, 2.99)
0.026
B C D E F
incidence
FolsomAR,2004,BRE80171
United States, PostmenopausalIowa Women's Health study
55 - 69 1885
Cancer registryand deathcertificates andparticipant
FFQProspectiveCohort
41836.0 14.0 years Omega-3 fatty acidsfrom fish
g/day
Breast cancer >0.27vs.<0.05
50.91(0.77, 1.08)
0.19 A B C D E F G
Incidence
Menopausal status not specified
Gago-Dominguez,M.,2003,BRE17518
China, AsianThe Singapore ChineseHealth Study, 1993
45 - 74 314Direct contactat home
FFQ (nos)ProspectiveCohort
63257.0 5.3 yearsBreast cancer Quantile 4
vs.Quantile 1
40.87(0.64, 1.18)
0.40 A B C E F G
incidence
n-3 fatty acids from fish
Pre-menopausal
Gago-Dominguez,M.,2003,BRE17518
China, AsianThe Singapore ChineseHealth Study, 1993
45 - 74 93Direct contactat home
FFQ (nos)ProspectiveCohort
63257.0 5.3 yearsBreast cancer
Pre-menopausal
Quantile 4vs.Quantile 1
40.9(0.49, 1.65)
0.93 A B C E F G
incidence
Post-menopausal
Gago-Dominguez,M.,2003,BRE17518
China, AsianThe Singapore ChineseHealth Study, 1993
45 - 74 221Direct contactat home
FFQ (nos)ProspectiveCohort
63257.0 5.3 yearsBreast cancer
Post-menopausal
Quantile 4vs.Quantile 1
40.68(0.47, 0.97)
0.02 A B C E F G
incidence
Gago-Dominguez,M.,2004,BRE18398
China, Asian, Post-menopausalSingapore, 1994
45 - 74 82Throughnetwork, paper,tv
FFQ-Semi-quantitative
Nested CaseControl
218 9.0 years g/1000Kcal
Breast cancer Post-menop& GSTM1null-null
2°-4°quartilesvs.1°quartile
20.66(0.37, 1.16)
A B C G
incidence
Gago-Dominguez,M.,2004,BRE18398
China, Asian, Post-menopausalSingapore, 1994
45 - 74 34Throughnetwork, paper,tv
FFQ-Semi-quantitative
Nested CaseControl
96 9.0 years g/1000Kcal
Breast cancer Post-menop& GSTM1null-null &GSTT1 null-
2°-4°quartilesvs.1°quartile
20.62(0.24, 1.59)
A B C G
incidence
Gago-Dominguez,M.,2004,BRE18398
China, Asian, Post-menopausalSingapore, 1994
45 - 74 98Throughnetwork, paper,tv
FFQ-Semi-quantitative
Nested CaseControl
248 9.0 years g/1000Kcal
Breast cancer Post-menop& GSTM1positive
2°-4°quartilesvs.1°quartile
20.83(0.48, 1.42)
A B C G
incidence
Gago-Dominguez,M.,2004,BRE18398
China, Asian, Post-menopausalSingapore, 1994
45 - 74 148Throughnetwork, paper,tv
FFQ-Semi-quantitative
Nested CaseControl
387 9.0 years g/1000Kcal
Breast cancer Post-menop& GSTM1positive orGSTP1 AA
2°-4°quartilesvs.1°quartile
20.86(0.56, 1.32)
A B C G
incidence
Gago-Dominguez,M.,2004,BRE18398
China, Asian, Post-menopausalSingapore, 1994
45 - 74 146Throughnetwork, paper,tv
FFQ-Semi-quantitative
Nested CaseControl
370 9.0 years g/1000Kcal
Breast cancer Post-menop& GSTM1positive orGSTT1
2°-4°quartilesvs.1°quartile
20.84(0.54, 1.29)
A B C G
incidence
Gago-Dominguez,M.,2004,BRE18398
China, Asian, Post-menopausalSingapore, 1994
45 - 74 115Throughnetwork, paper,tv
FFQ-Semi-quantitative
Nested CaseControl
304 9.0 years g/1000Kcal
Breast cancer Post-menop& GSTP1AA
2°-4°quartilesvs.1°quartile
20.94(0.58, 1.54)
A B C G
incidence
165

Author, Year,WCRF Code
Country, Ethnicity, Specialcharacteristics
Age Cases n Caseascertainment
Type of studyNon-Cases n
Lenght offollow-up / loss
Assessmentdetail
Additional details Unit Outcome Subgroup Contrast Nocat. OR (95% CI) p
valueptrend A B C D E F G
adjustments
Gago-Dominguez,M.,2004,BRE18398
China, Asian, Post-menopausalSingapore, 1994
45 - 74 65Throughnetwork, paper,tv
FFQ-Semi-quantitative
Nested CaseControl
162 9.0 years g/1000Kcal
Breast cancer Post-menop& GSTP1AB/BB
2°-4°quartilesvs.1°quartile
20.49(0.26, 0.93)
A B C G
incidence
Gago-Dominguez,M.,2004,BRE18398
China, Asian, Post-menopausalSingapore, 1994
45 - 74 66Throughnetwork, paper,tv
FFQ-Semi-quantitative
Nested CaseControl
204 9.0 years g/1000Kcal
Breast cancer Post-menop& GSTT1null-null
2°-4°quartilesvs.1°quartile
20.54(0.29, 1.0)
A B C G
incidence
Gago-Dominguez,M.,2004,BRE18398
China, Asian, Post-menopausalSingapore, 1994
45 - 74 32Throughnetwork, paper,tv
FFQ-Semi-quantitative
Nested CaseControl
79 9.0 years g/1000Kcal
Breast cancer Post-menop& GSTT1null-null &GSTP1
2°-4°quartilesvs.1°quartile
20.36(0.14, 0.94)
A B C G
incidence
Gago-Dominguez,M.,2004,BRE18398
China, Asian, Post-menopausalSingapore, 1994
45 - 74 25Throughnetwork, paper,tv
FFQ-Semi-quantitative
Nested CaseControl
71 9.0 years g/1000Kcal
Breast cancer Post-menop& GSTT1null-null &GSTP1
2°-4°quartilesvs.1°quartile
20.26(0.08, 0.78)
A B C G
incidence
Gago-Dominguez,M.,2004,BRE18398
China, Asian, Post-menopausalSingapore, 1994
45 - 74 114Throughnetwork, paper,tv
FFQ-Semi-quantitative
Nested CaseControl
262 9.0 years g/1000Kcal
Breast cancer Post-menop& GSTT1positive
2°-4°quartilesvs.1°quartile
20.95(0.58, 1.56)
A B C G
incidence
Gago-Dominguez,M.,2004,BRE18398
China, Asian, Post-menopausalSingapore, 1994
45 - 74 155Throughnetwork, paper,tv
FFQ-Semi-quantitative
Nested CaseControl
395 9.0 years g/1000Kcal
Breast cancer Post-menop& GSTT1positive orGSTP1 AA
2°-4°quartilesvs.1°quartile
20.88(0.58, 1.34)
A B C G
incidence
Menopausal status not specified
Gago-Dominguez,M.,2003,BRE17518
China, AsianThe Singapore ChineseHealth Study, 1993
45 - 74 314Direct contactat home
FFQ (nos)ProspectiveCohort
63257.0 5.3 yearsBreast cancer Quantile 4
vs.Quantile 1
40.72(0.53, 0.98)
0.04 A B C E F G
incidence
n-3 fatty acids from other food (no marine)
Menopausal status not specified
Gago-Dominguez,M.,2003,BRE17518
China, AsianThe Singapore ChineseHealth Study, 1993
45 - 74 314Direct contactat home
FFQ (nos)ProspectiveCohort
63257.0 5.3 yearsBreast cancer Quantile 4
vs.Quantile 1
41.0(0.73, 1.36)
0.97 A B C E F G
incidence
Serum 22:5,n-6
Pre-menopausal
Saadatian-Elahi,M.,2002,BRE21486
US, Not specifiedNew York Women's HealthStudy, 1985
34 - 65 91Throughnetwork, paper,tv
Nested CaseControl
91 4.3 years %
Breast cancerPre-menopausal
>1.0vs.>-1.0
41.52(0.56, 4.12)
0.37 A C F G
incidence
Post-menopausal
Saadatian-Elahi,M.,2002,BRE21486
US, Not specifiedNew York Women's HealthStudy, 1985
34 - 65 106Throughnetwork, paper,tv
Nested CaseControl
106 4.3 years %
Breast cancerPost-menopausal
>1.0vs.>-1.0
41.28(0.53, 3.13)
0.49 A C F G
incidence
Menopausal status not specified
166

Author, Year,WCRF Code
Country, Ethnicity, Specialcharacteristics
Age Cases n Caseascertainment
Type of studyNon-Cases n
Lenght offollow-up / loss
Assessmentdetail
Additional details Unit Outcome Subgroup Contrast Nocat. OR (95% CI) p
valueptrend A B C D E F G
adjustments
Saadatian-Elahi,M.,2002,BRE21486
US, Not specifiedNew York Women's HealthStudy, 1985
34 - 65Throughnetwork, paper,tv
Nested CaseControl
null 4.3 years %
Breast cancer >1.0vs.>-1.0
41.43(0.76, 2.69)
0.22 A C F G
incidence
Serum Alpha-Linolenic acid
Pre-menopausal
Vatten, L.J.,1993,BRE12821
Norway, Not specifiedNorway Serum Bank, 1973
65Throughnetwork, paper,tv
Nested CaseControl
195 18.0 years mg/liter
Breast cancerPre-menopausal
>1.0vs.>-1.0
40.6(0.3, 1.4)
0.15incidence
Saadatian-Elahi,M.,2002,BRE21486
US, Not specifiedNew York Women's HealthStudy, 1985
34 - 65 91Throughnetwork, paper,tv
Nested CaseControl
91 4.3 years %
Breast cancerPre-menopausal
>1.0vs.>-1.0
40.97(0.41, 2.26)
0.84 A C F G
incidence
Post-menopausal
Saadatian-Elahi,M.,2002,BRE21486
US, Not specifiedNew York Women's HealthStudy, 1985
34 - 65 106Throughnetwork, paper,tv
Nested CaseControl
106 4.3 years %
Breast cancerPost-menopausal
>1.0vs.>-1.0
40.64(0.26, 1.57)
0.23 A C F G
incidence
Menopausal status not specified
Vatten, L.J.,1993,BRE12821
Norway, Not specifiedNorway Serum Bank, 1973
Throughnetwork, paper,tv
Nested CaseControl
170000.0 18.0 yearsBreast cancer
1null(null, null)
incidence
Chajes,V.,1999,BRE14597
Sweden, Not specifiedVIP + MONICA + MSP
UnspecifiedNested CaseControl
29708.0 11.0 years %
Breast cancer >1.0vs.>-1.0
41.36(0.63, 2.96)
0.424
C D F
incidence
Saadatian-Elahi,M.,2002,BRE21486
US, Not specifiedNew York Women's HealthStudy, 1985
34 - 65Throughnetwork, paper,tv
Nested CaseControl
null 4.3 years %
Breast cancer >1.0vs.>-1.0
40.8(0.44, 1.46)
0.48 A C F G
incidence
Serum DHA
Pre-menopausal
Vatten, L.J.,1993,BRE12821
Norway, Not specifiedNorway Serum Bank, 1973
65Throughnetwork, paper,tv
Nested CaseControl
195 18.0 years mg/liter
Breast cancerPre-menopausal
>1.0vs.>-1.0
40.6(0.3, 1.3)
0.41incidence
Saadatian-Elahi,M.,2002,BRE21486
US, Not specifiedNew York Women's HealthStudy, 1985
34 - 65 91Throughnetwork, paper,tv
Nested CaseControl
91 4.3 years %
Breast cancerPre-menopausal
>1.0vs.>-1.0
40.83(0.27, 2.58)
0.51 A C F G
incidence
Post-menopausal
Saadatian-Elahi,M.,2002,BRE21486
US, Not specifiedNew York Women's HealthStudy, 1985
34 - 65 106Throughnetwork, paper,tv
Nested CaseControl
106 4.3 years %
Breast cancerPost-menopausal
>1.0vs.>-1.0
40.67(0.27, 1.7)
0.41 A C F G
incidence
167

Author, Year,WCRF Code
Country, Ethnicity, Specialcharacteristics
Age Cases n Caseascertainment
Type of studyNon-Cases n
Lenght offollow-up / loss
Assessmentdetail
Additional details Unit Outcome Subgroup Contrast Nocat. OR (95% CI) p
valueptrend A B C D E F G
adjustments
Menopausal status not specified
Vatten, L.J.,1993,BRE12821
Norway, Not specifiedNorway Serum Bank, 1973
Throughnetwork, paper,tv
Nested CaseControl
170000.0 18.0 yearsBreast cancer
1null(null, null)
incidence
Chajes,V.,1999,BRE14597
Sweden, Not specifiedVIP + MONICA + MSP
UnspecifiedNested CaseControl
29708.0 11.0 years %
Breast cancer >1.0vs.>-1.0
40.92(0.42, 2.02)
0.405
C D F
incidence
Saadatian-Elahi,M.,2002,BRE21486
US, Not specifiedNew York Women's HealthStudy, 1985
34 - 65Throughnetwork, paper,tv
Nested CaseControl
null 4.3 years %
Breast cancer >1.0vs.>-1.0
40.7(0.35, 1.4)
0.49 A C F G
incidence
Serum DPA
Pre-menopausal
Saadatian-Elahi,M.,2002,BRE21486
US, Not specifiedNew York Women's HealthStudy, 1985
34 - 65 91Throughnetwork, paper,tv
Nested CaseControl
91 4.3 years %
Breast cancerPre-menopausal
>1.0vs.>-1.0
41.2(0.42, 3.47)
0.70 A C F G
incidence
Post-menopausal
Saadatian-Elahi,M.,2002,BRE21486
US, Not specifiedNew York Women's HealthStudy, 1985
34 - 65 106Throughnetwork, paper,tv
Nested CaseControl
106 4.3 years %
Breast cancerPost-menopausal
>1.0vs.>-1.0
40.82(0.33, 2.04)
0.65 A C F G
incidence
Menopausal status not specified
Saadatian-Elahi,M.,2002,BRE21486
US, Not specifiedNew York Women's HealthStudy, 1985
34 - 65Throughnetwork, paper,tv
Nested CaseControl
null 4.3 years %
Breast cancer >1.0vs.>-1.0
41.05(0.55, 2.02)
0.73 A C F G
incidence
Serum EPA
Pre-menopausal
Vatten, L.J.,1993,BRE12821
Norway, Not specifiedNorway Serum Bank, 1973
65Throughnetwork, paper,tv
Nested CaseControl
195 18.0 years mg/liter
Breast cancerPre-menopausal
>1.0vs.>-1.0
40.9(0.4, 2.0)
0.85incidence
Saadatian-Elahi,M.,2002,BRE21486
US, Not specifiedNew York Women's HealthStudy, 1985
34 - 65 91Throughnetwork, paper,tv
Nested CaseControl
91 4.3 yearsBreast cancer
Pre-menopausal
>1.0vs.>-1.0
40.82(0.32, 2.11)
0.46 A C F G
incidence
Post-menopausal
Saadatian-Elahi,M.,2002,BRE21486
US, Not specifiedNew York Women's HealthStudy, 1985
34 - 65 106Throughnetwork, paper,tv
Nested CaseControl
106 4.3 years %
Breast cancerPost-menopausal
>1.0vs.>-1.0
40.91(0.32, 2.62)
0.99 A C F G
incidence
Menopausal status not specified
168

Author, Year,WCRF Code
Country, Ethnicity, Specialcharacteristics
Age Cases n Caseascertainment
Type of studyNon-Cases n
Lenght offollow-up / loss
Assessmentdetail
Additional details Unit Outcome Subgroup Contrast Nocat. OR (95% CI) p
valueptrend A B C D E F G
adjustments
Vatten, L.J.,1993,BRE12821
Norway, Not specifiedNorway Serum Bank, 1973
Throughnetwork, paper,tv
Nested CaseControl
170000.0 18.0 yearsBreast cancer
1null(null, null)
incidence
Chajes,V.,1999,BRE14597
Sweden, Not specifiedVIP + MONICA + MSP
UnspecifiedNested CaseControl
29708.0 11.0 years %
Breast cancer >1.0vs.>-1.0
40.51(0.25, 1.03)
0.081
C D F
incidence
Saadatian-Elahi,M.,2002,BRE21486
US, Not specifiedNew York Women's HealthStudy, 1985
34 - 65Throughnetwork, paper,tv
Nested CaseControl
null 4.3 years %
Breast cancer >1.0vs.>-1.0
40.85(0.44, 1.65)
0.61 A C F G
incidence
Serum PUFA n-3
Pre-menopausal
Vatten, L.J.,1993,BRE12821
Norway, Not specifiedNorway Serum Bank, 1973
65Throughnetwork, paper,tv
Nested CaseControl
195 18.0 years mg/liter
Breast cancerPre-menopausal
>1.0vs.>-1.0
40.7(0.3, 1.6)
0.57incidence
Saadatian-Elahi,M.,2002,BRE21486
US, Not specifiedNew York Women's HealthStudy, 1985
34 - 65 91Throughnetwork, paper,tv
Nested CaseControl
91 4.3 years %
Breast cancerPre-menopausal
>1.0vs.>-1.0
40.79(0.29, 2.18)
0.52 A C F G
incidence
Post-menopausal
Saadatian-Elahi,M.,2002,BRE21486
US, Not specifiedNew York Women's HealthStudy, 1985
34 - 65 106Throughnetwork, paper,tv
Nested CaseControl
106 4.3 years %
Breast cancerPost-menopausal
>1.0vs.>-1.0
40.68(0.26, 1.74)
0.30 A C F G
incidence
Menopausal status not specified
Vatten, L.J.,1993,BRE12821
Norway, Not specifiedNorway Serum Bank, 1973
Throughnetwork, paper,tv
Nested CaseControl
170000.0 18.0 yearsBreast cancer
1null(null, null)
incidence
Chajes,V.,1999,BRE14597
Sweden, Not specifiedVIP + MONICA + MSP
UnspecifiedNested CaseControl
29708.0 11.0 years %
Breast cancer >1.0vs.>-1.0
40.58(0.27, 1.28)
0.281
C D F
incidence
Saadatian-Elahi,M.,2002,BRE21486
US, Not specifiedNew York Women's HealthStudy, 1985
34 - 65Throughnetwork, paper,tv
Nested CaseControl
null 4.3 years %
Breast cancer >1.0vs.>-1.0
40.69(0.35, 1.34)
0.30 A C F G
incidence
5.2.4.2
Arachidonic acid
Post-menopausal
Wirfalt,E.,2004,BRE17083
Sweden, Not specified, Post-menopausalMalmo Diet and Cancer,1991
50 - By Mail7-day Record +Questionnaire
Nested CaseControl
12803.0 8.0 years percent of total fattyacids
Breast cancerPost-menopausal
1null(null, null)
incidence
169

Author, Year,WCRF Code
Country, Ethnicity, Specialcharacteristics
Age Cases n Caseascertainment
Type of studyNon-Cases n
Lenght offollow-up / loss
Assessmentdetail
Additional details Unit Outcome Subgroup Contrast Nocat. OR (95% CI) p
valueptrend A B C D E F G
adjustments
Menopausal status not specified
Holmes, M.D.,1999,BRE04008
US, Multi-ethnic, RegisterednursesNurses' Health Study (NHS)Cohort 1976-1996
30 - 55 2097 By MailFFQ-Semi-quantitative
ProspectiveCohort
121700.0 14.0 years % of totalenergy/day
Invasive breast cancer0.03(continuous)
11.05(1.0, 1.1)
A C D E F G
incidence
Voorrips, L.E.,2002,BRE13011
The Netherlands, Notspecified, Post-menopausalwomenThe Netherlands Cohort
55 - 69 783 By MailFFQ-Semi-quantitative
Case Cohort 62573.0 6.3 years g/day
Breast cancer 0.15vs.0.05
50.99(0.73, 1.34)
.93 A B C D E F G
incidence
Erythrocyte 20:2,n-6c
Post-menopausal
Pala V.,2001,BRE20601Italy, CaucasianORDET study, 1987
42 - 69 71Nested CaseControl
141 5.5 years05.02.04.02Erythrocyte n-6 fattyacids 20:2,n-6c
Breast cancerPost-menopausal
>0.27vs.<0.23
30.52(0.26, 1.02)
.04incidence
Erythrocyte 22:4,n-6c
Post-menopausal
Pala V.,2001,BRE20601Italy, CaucasianORDET study, 1987
42 - 69 71Nested CaseControl
141 5.5 years05.02.04.02Erythrocyte n-6 fattyacids 22:4,n-6c
Breast cancerPost-menopausal
>3.09vs.<2.55
30.76(0.35, 1.63)
.49incidence
Wirfalt,E.,2004,BRE17083
Sweden, Not specified, Post-menopausalMalmo Diet and Cancer,1991
50 - By Mail7-day Record +Questionnaire
Nested CaseControl
12803.0 8.0 years %
Breast cancerPost-menopausal
1.0(continuous)
11.1(0.8, 1.5)
0.557
incidence
Erythrocyte 22:5,n-6c
Post-menopausal
Pala V.,2001,BRE20601Italy, CaucasianORDET study, 1987
42 - 69 71Nested CaseControl
141 5.5 years05.02.04.02Erythrocyte n-6 fattyacids 22:5,n-6c
Breast cancerPost-menopausal
>0.82vs.<0.7
31.65(0.74, 3.64)
.27incidence
Erythrocyte Arachidonic acid
Post-menopausal
Wirfalt,E.,2004,BRE17083
Sweden, Not specified, Post-menopausalMalmo Diet and Cancer,1991
50 - By Mail7-day Record +Questionnaire
Nested CaseControl
12803.0 8.0 years %
Breast cancerPost-menopausal
1.0(continuous)
11.07(0.93, 1.24)
0.361
incidence
Erythrocyte C20:4
Post-menopausal
Pala V.,2001,BRE20601Italy, CaucasianORDET study, 1987
42 - 69 71Nested CaseControl
141 5.5 years05.02.04.02Erythrocyte n-6 fattyacids 20:4,n-6c
Breast cancerPost-menopausal
>17.94vs.<16.66
31.4(0.64, 3.1)
.42cancer death
170

Author, Year,WCRF Code
Country, Ethnicity, Specialcharacteristics
Age Cases n Caseascertainment
Type of studyNon-Cases n
Lenght offollow-up / loss
Assessmentdetail
Additional details Unit Outcome Subgroup Contrast Nocat. OR (95% CI) p
valueptrend A B C D E F G
adjustments
Erythrocyte DH-Gamma-Linolenic acid
Post-menopausal
Pala V.,2001,BRE20601Italy, CaucasianORDET study, 1987
42 - 69 71Nested CaseControl
141 5.5 years05.02.04.02Erythrocyte n-6 fattyacids 20:3,n-6c
Breast cancerPost-menopausal
>2.15vs.<1.87
30.68(0.33, 1.41)
.29incidence
Wirfalt,E.,2004,BRE17083
Sweden, Not specified, Post-menopausalMalmo Diet and Cancer,1991
50 - By Mail7-day Record +Questionnaire
Nested CaseControl
12803.0 8.0 years %
Breast cancerPost-menopausal
1.0(continuous)
10.74(0.45, 1.22)
0.242
incidence
Erythrocyte Gamma-Linolenic acid
Post-menopausal
Pala V.,2001,BRE20601Italy, CaucasianORDET study, 1987
42 - 69 71Nested CaseControl
141 5.5 years05.02.04.02Erythrocyte n-6 fattyacids 18:3,n-6c
Breast cancerPost-menopausal
>0.08vs.<0.05
30.98(0.46, 2.07)
.95incidence
Erythrocyte Linoleic acid
Post-menopausal
Pala V.,2001,BRE20601Italy, CaucasianORDET study, 1987
42 - 69 71Nested CaseControl
141 5.5 years05.02.04.02Erythrocyte n-6 fattyacids 18:2,n-6c
Breast cancerPost-menopausal
>10.67vs.<10.3
30.44(0.2, 1.0)
.06incidence
Wirfalt,E.,2004,BRE17083
Sweden, Not specified, Post-menopausalMalmo Diet and Cancer,1991
50 - By Mail7-day Record +Questionnaire
Nested CaseControl
12803.0 8.0 years %
Breast cancerPost-menopausal
1.0(continuous)
10.99(0.89, 1.1)
0.824
incidence
Erythrocyte n-6 fatty acids
Post-menopausal
Pala V.,2001,BRE20601Italy, CaucasianORDET study, 1987
42 - 69 71Nested CaseControl
141 5.5 years n-6 PUFA
Breast cancerPost-menopausal
>35.16vs.<33.68
30.49(0.22, 1.06)
.08incidence
Linoleic acid
Pre-menopausal
Willett, W.C.,1987,BRE13442
US, Not specified,Registered nursesNurses' Health Study (NHS)Cohort 1976-1996
34 - 59 By MailFFQ-Semi-quantitative
ProspectiveCohort
89538.0
4.0 years / 9,235(10% do notreturn the FUquestionnaire)
Breast cancerPre-menopausal
Quantile 5vs.Quantile 1
50.76(null, null)
0.46 A C D E F G
incidence
Willett, W.C.,1992,BRE13438
U.S, Not specified,Registered nursesNurses' Health Study (NHS)Cohort 1976-1996
30 - 55 527 By MailFFQ-Semi-quantitative
ProspectiveCohort
89494.0 8.0 yearsBreast cancer
Pre-menopausal
Quantile 5vs.Quantile 1
50.89(0.68, 1.17)
0.94 A C D E F G
incidence
Post-menopausal
171

Author, Year,WCRF Code
Country, Ethnicity, Specialcharacteristics
Age Cases n Caseascertainment
Type of studyNon-Cases n
Lenght offollow-up / loss
Assessmentdetail
Additional details Unit Outcome Subgroup Contrast Nocat. OR (95% CI) p
valueptrend A B C D E F G
adjustments
Willett, W.C.,1987,BRE13442
US, Not specified,Registered nursesNurses' Health Study (NHS)Cohort 1976-1996
34 - 59 By MailFFQ-Semi-quantitative
ProspectiveCohort
89538.0
4.0 years / 9,235(10% do notreturn the FUquestionnaire)
Breast cancerPost-menopausal
Quantile 5vs.Quantile 1
50.9(null, null)
0.04 A C D E F G
incidence
Willett, W.C.,1992,BRE13438
U.S, Not specified,Registered nursesNurses' Health Study (NHS)Cohort 1976-1996
30 - 55 774 By MailFFQ-Semi-quantitative
ProspectiveCohort
89494.0 8.0 yearsBreast cancer
Post-menopausal
Quantile 5vs.Quantile 1
50.91(0.73, 1.14)
0.66 A C D E F G
incidence
Barrett-Connor,E.,1993,BRE00581
U.S, WhiteRancho Bernardo, 1972
40 - 79 15
Through socialorganization(profession,religion)
24h RecallProspectiveCohort
575 15.0 yearsBreast cancer
Post-menopausal
1null(null, null)
incidence
Sieri,Sabina,2002,BRE20941
Italy, Not specified, Post-menopausalORDET study, 1987
41 - 70 56Throughnetwork, paper,tv
FFQ-Semi-quantitative
Nested CaseControl
214 5.5 years g/day
Breast cancerPost-menopausal
6.18 - 16.3vs.<5.07
31.39(0.51, 3.8)
0.455
B C E G
incidence
Byrne,C.,2002,BRE01315
U.S, Multi-ethnic, Post-menopausalNurses' Health Study (NHS)Cohort 1976-1996
(57) 1071 By MailFFQ-Semi-quantitative
ProspectiveCohort
44697 14.0 years g/day
Invasive breast cancerPost-menopausal
Quantile 5vs.Quantile 1
50.93(0.74, 1.16)
0.75 A C D E F G
incidence
Wirfalt,E.,2004,BRE17083
Sweden, Not specified, Post-menopausalMalmo Diet and Cancer,1991
50 - By Mail7-day Record +Questionnaire
Nested CaseControl
12803.0 8.0 years percent of total fattyacids
Breast cancerPost-menopausal
1null(null, null)
incidence
Menopausal status not specified
Willett, W.C.,1987,BRE13442
US, Not specified,Registered nursesNurses' Health Study (NHS)Cohort 1976-1996
34 - 59 601 By MailFFQ-Semi-quantitative
ProspectiveCohort
89538
4.0 years / 9,235(10% do notreturn the FUquestionnaire)
g/day
Breast cancer Quantile 5vs.Quantile 1
50.88(0.69, 1.12)
0.16 A C D E F G
incidence
Willett, W.C.,1992,BRE13438
U.S, Not specified,Registered nursesNurses' Health Study (NHS)Cohort 1976-1996
30 - 55 1439 By MailFFQ-Semi-quantitative
ProspectiveCohort
690675 8.0 years g/day
Breast cancer >23.0vs.<11.9
50.91(0.77, 1.07)
0.73 A C D E F G
incidence
Toniolo,P.,1994,BRE12398
U.S.A., Not specifiedNew York Women's HealthStudy, 1985
35 - 65
Through healthorg. (screening,healthinsurance)
FFQ-Semi-quantitative
Nested CaseControl
14291.0 7.0 years g/day
Invasive breast cancer 19.0vs.4.0
51.13(0.65, 1.98)
0.47incidence
Holmes, M.D.,1999,BRE04008
US, Multi-ethnic, RegisterednursesNurses' Health Study (NHS)Cohort 1976-1996
30 - 55 2097 By MailFFQ-Semi-quantitative
ProspectiveCohort
121700.0 14.0 years % of totalenergy/day
Invasive breast cancer1.0(continuous)
10.95(0.92, 0.98)
A C D E F G
incidence
Voorrips, L.E.,2002,BRE13011
The Netherlands, Notspecified, Post-menopausalwomenThe Netherlands Cohort
55 - 69 783 By MailFFQ-Semi-quantitative
Case Cohort 62573.0 6.3 years g/day
Breast cancer 22.0vs.7.0
50.96(0.71, 1.31)
.67 A B C D E F G
incidence
Horn-Ross,P.L.,2002,BRE15412
USA, Multi-ethnic,Registered teachersCalifornia Teachers Study,1995
21 - 103 By Mail FFQ (nos)ProspectiveCohort
111383.0 2.0 years g/day
Invasive breast cancer <16.0vs.<6.0
50.9(0.7, 1.3)
0.9 A C D E F G
incidence
n-6 fatty acids
172

Author, Year,WCRF Code
Country, Ethnicity, Specialcharacteristics
Age Cases n Caseascertainment
Type of studyNon-Cases n
Lenght offollow-up / loss
Assessmentdetail
Additional details Unit Outcome Subgroup Contrast Nocat. OR (95% CI) p
valueptrend A B C D E F G
adjustments
Post-menopausal
Wirfalt,E.,2002,BRE13504
Sweden, Not specified, Post-menopausalMalmo Diet and Cancer,1991
50 - 237 By Mail7-day Record +Questionnaire
Nested CaseControl
673 8.0 years g/day
Breast cancerPost-menopausal
16.0vs.7.2
53.02(1.78, 5.13)
0.0002
B C D E F
incidence
Sonestedt, E. etal.,2007,BRE80147
SwedenMalmo Diet and Cancer,1991
45 - 73 152 Cancer registrydiet historyquestionnaire
ProspectiveCohort
11726.0 9.5 years Omega-6 fatty acidsintake
g/day
Breast cancerPost-meno &BMI >=27
14.1vs.6.6
51.07(0.63, 1.8)
0.59 A G
incidence
Sonestedt, E. etal.,2007,BRE80147
SwedenMalmo Diet and Cancer,1991
45 - 73 276 Cancer registrydiet historyquestionnaire
ProspectiveCohort
11726.0 9.5 years Omega-6 fatty acidsintake
g/day
Breast cancerPost-meno &BMI<27
14.1vs.6.6
51.84(1.24, 2.71)
0.002
A G
incidence
Sonestedt, E. etal.,2007,BRE80147
SwedenMalmo Diet and Cancer,1991
45 - 73 304 Cancer registrydiet historyquestionnaire
ProspectiveCohort
11726.0 9.5 years Omega-6 fatty acidsintake
g/day
Breast cancer Post-meno,dietarychange
14.1vs.6.6
50.69(0.39, 1.22)
0.64 A E G
incidence
Sonestedt, E. etal.,2007,BRE80147
SwedenMalmo Diet and Cancer,1991
45 - 73 304 Cancer registrydiet historyquestionnaire
ProspectiveCohort
11726.0 9.5 years Omega-6 fatty acidsintake
g/day
Breast cancer Post-meno,no dietarychange
14.1vs.6.6
52.09(1.42, 3.08)
0.0005
A E G
incidence
Sonestedt, E. etal.,2007,BRE80147
SwedenMalmo Diet and Cancer,1991
45 - 73 428 Cancer registrydiet historyquestionnaire
ProspectiveCohort
11726.0 9.5 years Omega-6 fatty acidsintake
g/day
Breast cancerPost-menopausal
14.1vs.6.6
51.54(1.13, 2.1)
0.004
A E G
incidence
Menopausal status not specified
Gago-Dominguez,M.,2003,BRE17518
China, AsianThe Singapore ChineseHealth Study, 1993
45 - 74 314Direct contactat home
FFQ (nos)ProspectiveCohort
63257.0 5.3 yearsBreast cancer Quantile 4
vs.Quantile 1
41.22(0.89, 1.67)
0.45 A B C E F G
incidence
Serum 20:2,n-6
Pre-menopausal
Saadatian-Elahi,M.,2002,BRE21486
US, Not specifiedNew York Women's HealthStudy, 1985
34 - 65 91Throughnetwork, paper,tv
Nested CaseControl
91 4.3 years %
Breast cancerPre-menopausal
>1.0vs.>-1.0
40.94(0.38, 2.35)
0.51 A C F G
incidence
Post-menopausal
Saadatian-Elahi,M.,2002,BRE21486
US, Not specifiedNew York Women's HealthStudy, 1985
34 - 65 106Throughnetwork, paper,tv
Nested CaseControl
106 4.3 years %
Breast cancerPost-menopausal
>1.0vs.>-1.0
40.71(0.27, 1.87)
0.83 A C F G
incidence
Menopausal status not specified
Saadatian-Elahi,M.,2002,BRE21486
US, Not specifiedNew York Women's HealthStudy, 1985
34 - 65Throughnetwork, paper,tv
Nested CaseControl
null 4.3 years %
Breast cancer >1.0vs.>-1.0
40.82(0.43, 1.56)
0.47 A C F G
incidence
Serum 22:4,n-6
173
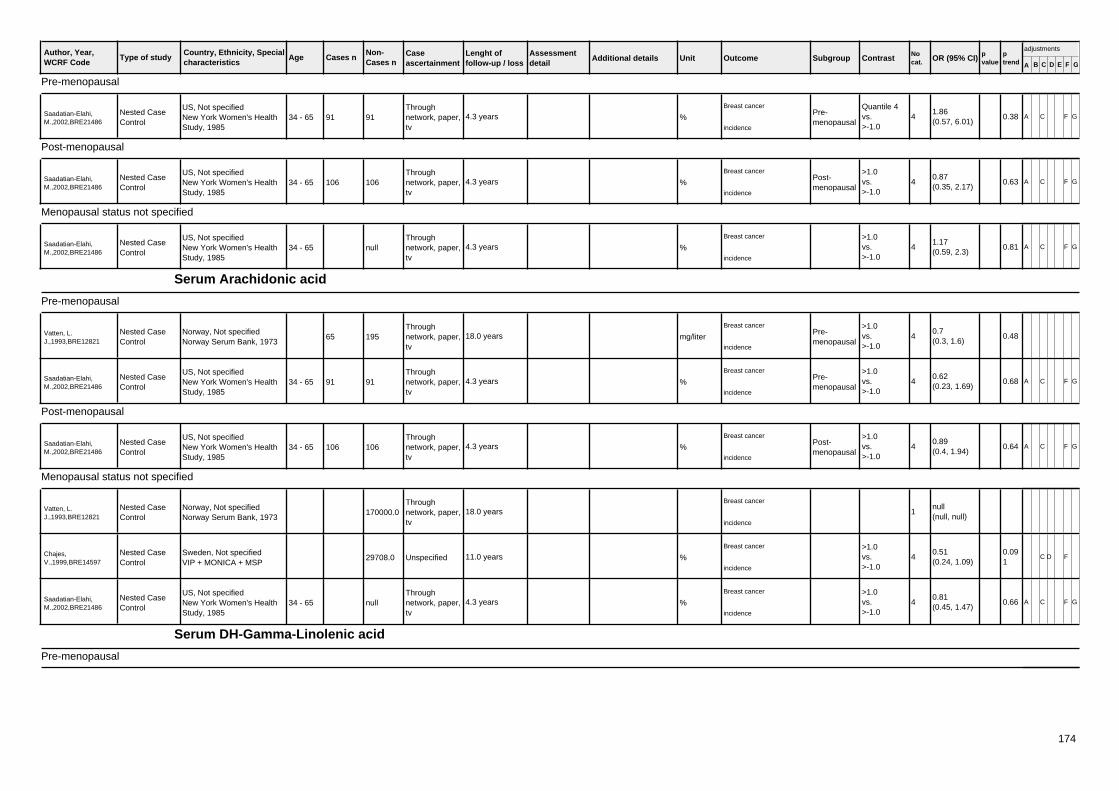
Author, Year,WCRF Code
Country, Ethnicity, Specialcharacteristics
Age Cases n Caseascertainment
Type of studyNon-Cases n
Lenght offollow-up / loss
Assessmentdetail
Additional details Unit Outcome Subgroup Contrast Nocat. OR (95% CI) p
valueptrend A B C D E F G
adjustments
Pre-menopausal
Saadatian-Elahi,M.,2002,BRE21486
US, Not specifiedNew York Women's HealthStudy, 1985
34 - 65 91Throughnetwork, paper,tv
Nested CaseControl
91 4.3 years %
Breast cancerPre-menopausal
Quantile 4vs.>-1.0
41.86(0.57, 6.01)
0.38 A C F G
incidence
Post-menopausal
Saadatian-Elahi,M.,2002,BRE21486
US, Not specifiedNew York Women's HealthStudy, 1985
34 - 65 106Throughnetwork, paper,tv
Nested CaseControl
106 4.3 years %
Breast cancerPost-menopausal
>1.0vs.>-1.0
40.87(0.35, 2.17)
0.63 A C F G
incidence
Menopausal status not specified
Saadatian-Elahi,M.,2002,BRE21486
US, Not specifiedNew York Women's HealthStudy, 1985
34 - 65Throughnetwork, paper,tv
Nested CaseControl
null 4.3 years %
Breast cancer >1.0vs.>-1.0
41.17(0.59, 2.3)
0.81 A C F G
incidence
Serum Arachidonic acid
Pre-menopausal
Vatten, L.J.,1993,BRE12821
Norway, Not specifiedNorway Serum Bank, 1973
65Throughnetwork, paper,tv
Nested CaseControl
195 18.0 years mg/liter
Breast cancerPre-menopausal
>1.0vs.>-1.0
40.7(0.3, 1.6)
0.48incidence
Saadatian-Elahi,M.,2002,BRE21486
US, Not specifiedNew York Women's HealthStudy, 1985
34 - 65 91Throughnetwork, paper,tv
Nested CaseControl
91 4.3 years %
Breast cancerPre-menopausal
>1.0vs.>-1.0
40.62(0.23, 1.69)
0.68 A C F G
incidence
Post-menopausal
Saadatian-Elahi,M.,2002,BRE21486
US, Not specifiedNew York Women's HealthStudy, 1985
34 - 65 106Throughnetwork, paper,tv
Nested CaseControl
106 4.3 years %
Breast cancerPost-menopausal
>1.0vs.>-1.0
40.89(0.4, 1.94)
0.64 A C F G
incidence
Menopausal status not specified
Vatten, L.J.,1993,BRE12821
Norway, Not specifiedNorway Serum Bank, 1973
Throughnetwork, paper,tv
Nested CaseControl
170000.0 18.0 yearsBreast cancer
1null(null, null)
incidence
Chajes,V.,1999,BRE14597
Sweden, Not specifiedVIP + MONICA + MSP
UnspecifiedNested CaseControl
29708.0 11.0 years %
Breast cancer >1.0vs.>-1.0
40.51(0.24, 1.09)
0.091
C D F
incidence
Saadatian-Elahi,M.,2002,BRE21486
US, Not specifiedNew York Women's HealthStudy, 1985
34 - 65Throughnetwork, paper,tv
Nested CaseControl
null 4.3 years %
Breast cancer >1.0vs.>-1.0
40.81(0.45, 1.47)
0.66 A C F G
incidence
Serum DH-Gamma-Linolenic acid
Pre-menopausal
174
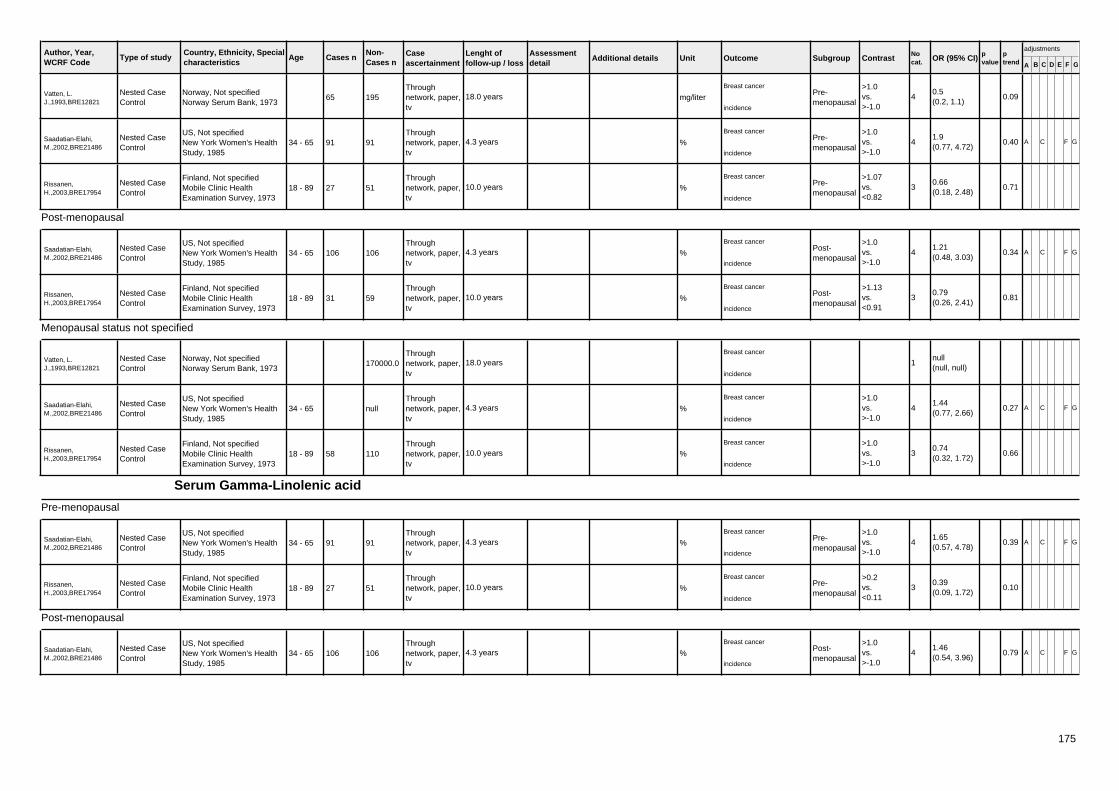
Author, Year,WCRF Code
Country, Ethnicity, Specialcharacteristics
Age Cases n Caseascertainment
Type of studyNon-Cases n
Lenght offollow-up / loss
Assessmentdetail
Additional details Unit Outcome Subgroup Contrast Nocat. OR (95% CI) p
valueptrend A B C D E F G
adjustments
Vatten, L.J.,1993,BRE12821
Norway, Not specifiedNorway Serum Bank, 1973
65Throughnetwork, paper,tv
Nested CaseControl
195 18.0 years mg/liter
Breast cancerPre-menopausal
>1.0vs.>-1.0
40.5(0.2, 1.1)
0.09incidence
Saadatian-Elahi,M.,2002,BRE21486
US, Not specifiedNew York Women's HealthStudy, 1985
34 - 65 91Throughnetwork, paper,tv
Nested CaseControl
91 4.3 years %
Breast cancerPre-menopausal
>1.0vs.>-1.0
41.9(0.77, 4.72)
0.40 A C F G
incidence
Rissanen,H.,2003,BRE17954
Finland, Not specifiedMobile Clinic HealthExamination Survey, 1973
18 - 89 27Throughnetwork, paper,tv
Nested CaseControl
51 10.0 years %
Breast cancerPre-menopausal
>1.07vs.<0.82
30.66(0.18, 2.48)
0.71incidence
Post-menopausal
Saadatian-Elahi,M.,2002,BRE21486
US, Not specifiedNew York Women's HealthStudy, 1985
34 - 65 106Throughnetwork, paper,tv
Nested CaseControl
106 4.3 years %
Breast cancerPost-menopausal
>1.0vs.>-1.0
41.21(0.48, 3.03)
0.34 A C F G
incidence
Rissanen,H.,2003,BRE17954
Finland, Not specifiedMobile Clinic HealthExamination Survey, 1973
18 - 89 31Throughnetwork, paper,tv
Nested CaseControl
59 10.0 years %
Breast cancerPost-menopausal
>1.13vs.<0.91
30.79(0.26, 2.41)
0.81incidence
Menopausal status not specified
Vatten, L.J.,1993,BRE12821
Norway, Not specifiedNorway Serum Bank, 1973
Throughnetwork, paper,tv
Nested CaseControl
170000.0 18.0 yearsBreast cancer
1null(null, null)
incidence
Saadatian-Elahi,M.,2002,BRE21486
US, Not specifiedNew York Women's HealthStudy, 1985
34 - 65Throughnetwork, paper,tv
Nested CaseControl
null 4.3 years %
Breast cancer >1.0vs.>-1.0
41.44(0.77, 2.66)
0.27 A C F G
incidence
Rissanen,H.,2003,BRE17954
Finland, Not specifiedMobile Clinic HealthExamination Survey, 1973
18 - 89 58Throughnetwork, paper,tv
Nested CaseControl
110 10.0 years %
Breast cancer >1.0vs.>-1.0
30.74(0.32, 1.72)
0.66incidence
Serum Gamma-Linolenic acid
Pre-menopausal
Saadatian-Elahi,M.,2002,BRE21486
US, Not specifiedNew York Women's HealthStudy, 1985
34 - 65 91Throughnetwork, paper,tv
Nested CaseControl
91 4.3 years %
Breast cancerPre-menopausal
>1.0vs.>-1.0
41.65(0.57, 4.78)
0.39 A C F G
incidence
Rissanen,H.,2003,BRE17954
Finland, Not specifiedMobile Clinic HealthExamination Survey, 1973
18 - 89 27Throughnetwork, paper,tv
Nested CaseControl
51 10.0 years %
Breast cancerPre-menopausal
>0.2vs.<0.11
30.39(0.09, 1.72)
0.10incidence
Post-menopausal
Saadatian-Elahi,M.,2002,BRE21486
US, Not specifiedNew York Women's HealthStudy, 1985
34 - 65 106Throughnetwork, paper,tv
Nested CaseControl
106 4.3 years %
Breast cancerPost-menopausal
>1.0vs.>-1.0
41.46(0.54, 3.96)
0.79 A C F G
incidence
175

Author, Year,WCRF Code
Country, Ethnicity, Specialcharacteristics
Age Cases n Caseascertainment
Type of studyNon-Cases n
Lenght offollow-up / loss
Assessmentdetail
Additional details Unit Outcome Subgroup Contrast Nocat. OR (95% CI) p
valueptrend A B C D E F G
adjustments
Rissanen,H.,2003,BRE17954
Finland, Not specifiedMobile Clinic HealthExamination Survey, 1973
18 - 89 31Throughnetwork, paper,tv
Nested CaseControl
59 10.0 years %
Breast cancerPost-menopausal
>0.21vs.<0.11
30.58(0.18, 1.87)
0.37incidence
Menopausal status not specified
Chajes,V.,1999,BRE14597
Sweden, Not specifiedVIP + MONICA + MSP
UnspecifiedNested CaseControl
29708.0 11.0 years %
Breast cancer >1.0vs.>-1.0
40.51(0.23, 1.14)
0.111
C D F
incidence
Saadatian-Elahi,M.,2002,BRE21486
US, Not specifiedNew York Women's HealthStudy, 1985
34 - 65Throughnetwork, paper,tv
Nested CaseControl
null 4.3 years %
Breast cancer >1.0vs.>-1.0
41.45(0.73, 2.89)
0.50 A C F G
incidence
Rissanen,H.,2003,BRE17954
Finland, Not specifiedMobile Clinic HealthExamination Survey, 1973
18 - 89 58Throughnetwork, paper,tv
Nested CaseControl
110 10.0 years %
Breast cancer >1.0vs.>-1.0
30.5(0.2, 1.25)
0.08incidence
Serum Linoleic acid
Pre-menopausal
Vatten, L.J.,1993,BRE12821
Norway, Not specifiedNorway Serum Bank, 1973
65Throughnetwork, paper,tv
Nested CaseControl
195 18.0 years mg/liter
Breast cancerPre-menopausal
>1.0vs.>-1.0
40.4(0.2, 1.0)
0.02incidence
Saadatian-Elahi,M.,2002,BRE21486
US, Not specifiedNew York Women's HealthStudy, 1985
34 - 65 91Throughnetwork, paper,tv
Nested CaseControl
91 4.3 years %
Breast cancerPre-menopausal
>1.0vs.>-1.0
41.11(0.42, 2.94)
0.93 A C F G
incidence
Rissanen,H.,2003,BRE17954
Finland, Not specifiedMobile Clinic HealthExamination Survey, 1973
18 - 89 27Throughnetwork, paper,tv
Nested CaseControl
51 10.0 years %
Breast cancerPre-menopausal
>27.99vs.<24.75
30.33(0.1, 1.17)
0.51incidence
Post-menopausal
Saadatian-Elahi,M.,2002,BRE21486
US, Not specifiedNew York Women's HealthStudy, 1985
34 - 65 106Throughnetwork, paper,tv
Nested CaseControl
106 4.3 years %
Breast cancerPost-menopausal
>1.0vs.>-1.0
41.04(0.4, 2.67)
0.94 A C F G
incidence
Rissanen,H.,2003,BRE17954
Finland, Not specifiedMobile Clinic HealthExamination Survey, 1973
18 - 89 31Throughnetwork, paper,tv
Nested CaseControl
59 10.0 years %
Breast cancerPost-menopausal
>24.32vs.<20.45
30.26(0.07, 0.95)
0.04incidence
Menopausal status not specified
Vatten, L.J.,1993,BRE12821
Norway, Not specifiedNorway Serum Bank, 1973
Throughnetwork, paper,tv
Nested CaseControl
170000.0 18.0 yearsBreast cancer
1null(null, null)
incidence
Chajes,V.,1999,BRE14597
Sweden, Not specifiedVIP + MONICA + MSP
UnspecifiedNested CaseControl
29708.0 11.0 years %
Breast cancer >1.0vs.>-1.0
41.41(0.67, 2.94)
0.367
C D F
incidence
176
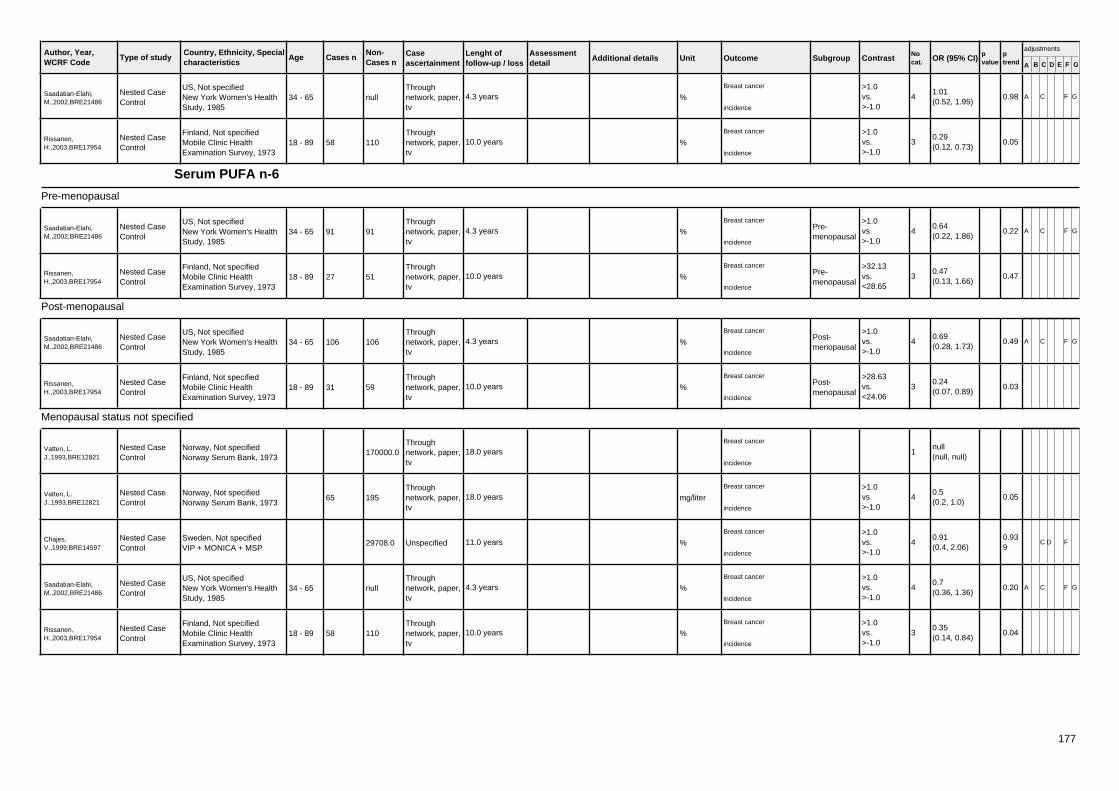
Author, Year,WCRF Code
Country, Ethnicity, Specialcharacteristics
Age Cases n Caseascertainment
Type of studyNon-Cases n
Lenght offollow-up / loss
Assessmentdetail
Additional details Unit Outcome Subgroup Contrast Nocat. OR (95% CI) p
valueptrend A B C D E F G
adjustments
Saadatian-Elahi,M.,2002,BRE21486
US, Not specifiedNew York Women's HealthStudy, 1985
34 - 65Throughnetwork, paper,tv
Nested CaseControl
null 4.3 years %
Breast cancer >1.0vs.>-1.0
41.01(0.52, 1.95)
0.98 A C F G
incidence
Rissanen,H.,2003,BRE17954
Finland, Not specifiedMobile Clinic HealthExamination Survey, 1973
18 - 89 58Throughnetwork, paper,tv
Nested CaseControl
110 10.0 years %
Breast cancer >1.0vs.>-1.0
30.29(0.12, 0.73)
0.05incidence
Serum PUFA n-6
Pre-menopausal
Saadatian-Elahi,M.,2002,BRE21486
US, Not specifiedNew York Women's HealthStudy, 1985
34 - 65 91Throughnetwork, paper,tv
Nested CaseControl
91 4.3 years %
Breast cancerPre-menopausal
>1.0vs.>-1.0
40.64(0.22, 1.86)
0.22 A C F G
incidence
Rissanen,H.,2003,BRE17954
Finland, Not specifiedMobile Clinic HealthExamination Survey, 1973
18 - 89 27Throughnetwork, paper,tv
Nested CaseControl
51 10.0 years %
Breast cancerPre-menopausal
>32.13vs.<28.65
30.47(0.13, 1.66)
0.47incidence
Post-menopausal
Saadatian-Elahi,M.,2002,BRE21486
US, Not specifiedNew York Women's HealthStudy, 1985
34 - 65 106Throughnetwork, paper,tv
Nested CaseControl
106 4.3 years %
Breast cancerPost-menopausal
>1.0vs.>-1.0
40.69(0.28, 1.73)
0.49 A C F G
incidence
Rissanen,H.,2003,BRE17954
Finland, Not specifiedMobile Clinic HealthExamination Survey, 1973
18 - 89 31Throughnetwork, paper,tv
Nested CaseControl
59 10.0 years %
Breast cancerPost-menopausal
>28.63vs.<24.06
30.24(0.07, 0.89)
0.03incidence
Menopausal status not specified
Vatten, L.J.,1993,BRE12821
Norway, Not specifiedNorway Serum Bank, 1973
Throughnetwork, paper,tv
Nested CaseControl
170000.0 18.0 yearsBreast cancer
1null(null, null)
incidence
Vatten, L.J.,1993,BRE12821
Norway, Not specifiedNorway Serum Bank, 1973
65Throughnetwork, paper,tv
Nested CaseControl
195 18.0 years mg/liter
Breast cancer >1.0vs.>-1.0
40.5(0.2, 1.0)
0.05incidence
Chajes,V.,1999,BRE14597
Sweden, Not specifiedVIP + MONICA + MSP
UnspecifiedNested CaseControl
29708.0 11.0 years %
Breast cancer >1.0vs.>-1.0
40.91(0.4, 2.06)
0.939
C D F
incidence
Saadatian-Elahi,M.,2002,BRE21486
US, Not specifiedNew York Women's HealthStudy, 1985
34 - 65Throughnetwork, paper,tv
Nested CaseControl
null 4.3 years %
Breast cancer >1.0vs.>-1.0
40.7(0.36, 1.36)
0.20 A C F G
incidence
Rissanen,H.,2003,BRE17954
Finland, Not specifiedMobile Clinic HealthExamination Survey, 1973
18 - 89 58Throughnetwork, paper,tv
Nested CaseControl
110 10.0 years %
Breast cancer >1.0vs.>-1.0
30.35(0.14, 0.84)
0.04incidence
177

Author, Year,WCRF Code
Country, Ethnicity, Specialcharacteristics
Age Cases n Caseascertainment
Type of studyNon-Cases n
Lenght offollow-up / loss
Assessmentdetail
Additional details Unit Outcome Subgroup Contrast Nocat. OR (95% CI) p
valueptrend A B C D E F G
adjustments
5.2.4.3
Conjugated linoleic acid
Menopausal status not specified
Voorrips, L.E.,2002,BRE13011
The Netherlands, Notspecified, Post-menopausalwomenThe Netherlands Cohort
55 - 69 783 By MailFFQ-Semi-quantitative
Case Cohort 62573.0 6.3 years g/day
Breast cancer 0.29vs.0.07
51.24(0.91, 1.69)
.02 A B C D E F G
incidence
Serum 18:2 CLA
Pre-menopausal
Rissanen,H.,2003,BRE17954
Finland, Not specifiedMobile Clinic HealthExamination Survey, 1973
18 - 89 27Throughnetwork, paper,tv
Nested CaseControl
51 10.0 years %
Breast cancerPre-menopausal
>0.53vs.<0.43
30.91(0.22, 3.8)
0.94incidence
Post-menopausal
Rissanen,H.,2003,BRE17954
Finland, Not specifiedMobile Clinic HealthExamination Survey, 1973
18 - 89 31Throughnetwork, paper,tv
Nested CaseControl
59 10.0 years %
Breast cancerPost-menopausal
>0.59vs.<0.47
31.58(0.39, 6.43)
0.57incidence
Menopausal status not specified
Rissanen,H.,2003,BRE17954
Finland, Not specifiedMobile Clinic HealthExamination Survey, 1973
18 - 89 58Throughnetwork, paper,tv
Nested CaseControl
110 10.0 years %
Breast cancer >1.0vs.>-1.0
31.2(0.44, 3.27)
0.64incidence
5.2.5
Erythrocyte Elaidic acid
Post-menopausal
Pala V.,2001,BRE20601Italy, CaucasianORDET study, 1987
42 - 69 71Nested CaseControl
141 5.5 years05.02.03 Erythrocytemono saturated18:1,n-9t
Breast cancerPost-menopausal
>0.24vs.<0.16
30.71(0.3, 1.64)
.42incidence
Serum Elaidic acid
Pre-menopausal
Saadatian-Elahi,M.,2002,BRE21486
US, Not specifiedNew York Women's HealthStudy, 1985
34 - 65 91Throughnetwork, paper,tv
Nested CaseControl
91 4.3 yearsBreast cancer
Pre-menopausal
>1.0vs.>-1.0
41.02(0.36, 2.88)
0.80 A C F G
incidence
Post-menopausal
Saadatian-Elahi,M.,2002,BRE21486
US, Not specifiedNew York Women's HealthStudy, 1985
34 - 65 106Throughnetwork, paper,tv
Nested CaseControl
106 4.3 years %
Breast cancerPost-menopausal
>1.0vs.>-1.0
40.36(0.13, 1.03)
0.13 A C F G
incidence
178

Author, Year,WCRF Code
Country, Ethnicity, Specialcharacteristics
Age Cases n Caseascertainment
Type of studyNon-Cases n
Lenght offollow-up / loss
Assessmentdetail
Additional details Unit Outcome Subgroup Contrast Nocat. OR (95% CI) p
valueptrend A B C D E F G
adjustments
Menopausal status not specified
Chajes,V.,1999,BRE14597
Sweden, Not specifiedVIP + MONICA + MSP
UnspecifiedNested CaseControl
29708.0 11.0 years %
Breast cancer >1.0vs.>-1.0
40.55(0.2, 1.51)
0.339
C D F
incidence
Saadatian-Elahi,M.,2002,BRE21486
US, Not specifiedNew York Women's HealthStudy, 1985
34 - 65Throughnetwork, paper,tv
Nested CaseControl
null 4.3 years %
Breast cancer >1.0vs.>-1.0
40.66(0.33, 1.31)
0.25 A C F G
incidence
Serum Trans MUFA
Pre-menopausal
Rissanen,H.,2003,BRE17954
Finland, Not specifiedMobile Clinic HealthExamination Survey, 1973
18 - 89 27Throughnetwork, paper,tv
Nested CaseControl
51 10.0 years %
Breast cancerPre-menopausal
>1.16vs.<0.88
31.27(0.38, 4.19)
0.47incidence
Post-menopausal
Rissanen,H.,2003,BRE17954
Finland, Not specifiedMobile Clinic HealthExamination Survey, 1973
18 - 89 31Throughnetwork, paper,tv
Nested CaseControl
59 10.0 years %
Breast cancerPost-menopausal
>1.16vs.<0.84
32.18(0.62, 7.62)
0.26incidence
Menopausal status not specified
Rissanen,H.,2003,BRE17954
Finland, Not specifiedMobile Clinic HealthExamination Survey, 1973
18 - 89 58Throughnetwork, paper,tv
Nested CaseControl
110 10.0 yearsBreast cancer >1.0
vs.>-1.0
31.47(0.65, 3.32)
0.18incidence
Serum Trans-11-18:1
Pre-menopausal
Rissanen,H.,2003,BRE17954
Finland, Not specifiedMobile Clinic HealthExamination Survey, 1973
18 - 89 27Throughnetwork, paper,tv
Nested CaseControl
51 10.0 yearsBreast cancer
Pre-menopausal
>0.46vs.<0.34
32.05(0.54, 7.77)
0.22incidence
Post-menopausal
Rissanen,H.,2003,BRE17954
Finland, Not specifiedMobile Clinic HealthExamination Survey, 1973
18 - 89 31Throughnetwork, paper,tv
Nested CaseControl
59 10.0 years %
Breast cancerPost-menopausal
>0.42vs.<0.31
37.9(1.46, 42.69)
0.49incidence
Menopausal status not specified
Rissanen,H.,2003,BRE17954
Finland, Not specifiedMobile Clinic HealthExamination Survey, 1973
18 - 89 58Throughnetwork, paper,tv
Nested CaseControl
110 10.0 years %
Breast cancer >1.0vs.>-1.0
33.69(1.35, 10.06)
0.17incidence
Trans fatty acids
Post-menopausal
179

Author, Year,WCRF Code
Country, Ethnicity, Specialcharacteristics
Age Cases n Caseascertainment
Type of studyNon-Cases n
Lenght offollow-up / loss
Assessmentdetail
Additional details Unit Outcome Subgroup Contrast Nocat. OR (95% CI) p
valueptrend A B C D E F G
adjustments
Byrne,C.,2002,BRE01315
U.S, Multi-ethnic, Post-menopausalNurses' Health Study (NHS)Cohort 1976-1996
(57) 1071 By MailFFQ-Semi-quantitative
ProspectiveCohort
44697 14.0 years g/day
Invasive breast cancerPost-menopausal
Quantile 5vs.Quantile 1
50.91(0.73, 1.13)
0.33 A C D E F G
incidence
Trans Unsaturated Fatty Acids
Menopausal status not specified
Voorrips, L.E.,2002,BRE13011
The Netherlands, Notspecified, Post-menopausalwomenThe Netherlands Cohort
55 - 69 783 By MailFFQ-Semi-quantitative
Case Cohort 62573.0 6.3 years g/day
Breast cancer 3.6vs.1.5
51.3(0.93, 1.8)
.01 A B C D E F G
incidence
Trans Vaccenic acid
Menopausal status not specified
Voorrips, L.E.,2002,BRE13011
The Netherlands, Notspecified, Post-menopausalwomenThe Netherlands Cohort
55 - 69 783 By MailFFQ-Semi-quantitative
Case Cohort 62573.0 6.3 years g/day
Breast cancer 1.2vs.0.3
51.34(0.98, 1.82)
.006 A B C D E F G
incidence
5.2.6
Other dietary lipids, cholesterol, plant sterols a
Post-menopausal
Kim,E.H.J.,2006,BRE80115
United States, Post-menopausalnurses' Health Study (NHS)Cohort 1976-2000
1653 medical records FFQProspectiveCohort
121701.0 20.0 years Cholesterol intakemg/1000Kcal
Breast cancer ER+/PR+100.0(continuous)
11.0(0.99, 1.01)
A C D E F G
incidence
Kim,E.H.J.,2006,BRE80115
United States, Post-menopausalnurses' Health Study (NHS)Cohort 1976-2000
477 medical records FFQProspectiveCohort
121701.0 20.0 years Cholesterol intakemg/1000Kcal
Breast cancer ER+/PR-100.0(continuous)
11.0(0.98, 1.02)
A C D E F G
incidence
Kim,E.H.J.,2006,BRE80115
United States, Post-menopausalnurses' Health Study (NHS)Cohort 1976-2000
517 medical records FFQProspectiveCohort
121701.0 20.0 years Cholesterol intakemg/1000Kcal
Breast cancer ER-/PR-100.0(continuous)
11.0(0.98, 1.01)
A C D E F G
incidence
Kim,E.H.J.,2006,BRE80115
United States, Post-menopausalnurses' Health Study (NHS)Cohort 1976-2000
83 medical records FFQProspectiveCohort
121701.0 20.0 years Cholesterol intakemg/1000Kcal
Breast cancer ER-/PR-100.0(continuous)
11.01(0.97, 1.05)
A C D E F G
incidence
5.3
Protein
Menopausal status not specified
Howe, G.R.,1991,BRE17622
canada, Multi-ethnic,Screening ProgramNBSS, 1980
40 - 59
Through healthorg. (screening,healthinsurance)
Dietary Historyquestionnaire
Nested CaseControl
56837.0 5.0 years for 693 cal/day cal/day
Breast cancer693.0(continuous)
10.86(0.35, 2.16)
A E G
incidence
180

Author, Year,WCRF Code
Country, Ethnicity, Specialcharacteristics
Age Cases n Caseascertainment
Type of studyNon-Cases n
Lenght offollow-up / loss
Assessmentdetail
Additional details Unit Outcome Subgroup Contrast Nocat. OR (95% CI) p
valueptrend A B C D E F G
adjustments
Horn-Ross,P.L.,2002,BRE15412
USA, Multi-ethnic,Registered teachersCalifornia Teachers Study,1995
21 - 103 By Mail FFQ (nos)ProspectiveCohort
111383.0 2.0 years g/day
Invasive breast cancer <80.0vs.<42.0
50.9(0.6, 1.4)
0.6 A C D E F G
incidence
FrazierL.A.,2003,BRE02941
USA, Multi-ethnic,Registered nursesNurses' Health Study (NHS)Cohort 1976-1996
40 - 65
Through healthorg. (screening,healthinsurance)
FFQ (nos)Nested CaseControl
121700.0 10.0 years adolescent g/day
Breast cancer 93.5vs.34.9
50.88(null, null)
0.27 A C D E F G
incidence
5.3.1
Methionine
Pre-menopausal
Cho, E. etal.,2007,BRE80152
United States, Pre-menopausalNHS II, 1989
26 - 46 221Self reportverified bymedical record
semi-quantitative ffq
ProspectiveCohort
90663.0 12.0 years
Total methionine, fromfoods andsupplements,cumulative average
g/day
Breast cancer ER-Pre-menopausal
2.5vs.1.6
50.86(0.54, 1.36)
0.89 A C D E F G
incidence
Cho, E. etal.,2007,BRE80152
United States, Pre-menopausalNHS II, 1989
26 - 46 1032Self reportverified bymedical record
semi-quantitative ffq
ProspectiveCohort
90663.0 12.0 years
Total methionine, fromfoods andsupplements,cumulative average
g/day
Invasive breast cancerPre-menopausal
2.5vs.1.6
51.1(0.89, 1.36)
0.47 A C D E F G
incidence
Post-menopausal
Feigelson, H.S.,2003,BRE02720
U.S, Not specifiedCPS-II US cohort, 1982-1998
1303 By MailFFQ-Semi-quantitative
ProspectiveCohort
65258 6.0 years / 7592 g/day
Breast cancerPost-menopausal
>=1.04vs.<0.64
50.92(0.77, 1.11)
A B C D E F G
incidence
Total protein
Pre-menopausal
Holmes,M.D.,2003,BRE15400
USA, Not specified,Registered nursesNurses' Health Study (NHS)Cohort 1976-1996
30 - 55 854HospitalRecords only
FFQ-Semi-quantitative
ProspectiveCohort
53952 18.0 years % of totalenergy/day
Invasive breast cancerPre-menopausal
>20.7vs.<16.4
51.09(0.86, 1.37)
0.6 A C D E F G
incidence
Post-menopausal
Kushi L.H.,1992,BRE05141
US, Multi-ethnic, Post-menopausalIowa Women's Health Study
55 - 69 459 By MailFFQ-Semi-quantitative
ProspectiveCohort
130443 4.0 years / 1086 g/day
Breast cancerPost-menopausal
97.1vs.66.0
41.0(0.65, 1.55)
0.83 A C D E F G
incidence
Barrett-Connor,E.,1993,BRE00581
U.S, WhiteRancho Bernardo, 1972
40 - 79 15
Through socialorganization(profession,religion)
24h RecallProspectiveCohort
575 15.0 years g/day
Breast cancerPost-menopausal
21.0(continuous)
11.55(0.89, 2.69)
A C D E
incidence
Sieri,Sabina,2002,BRE20941
Italy, Not specified, Post-menopausalORDET study, 1987
41 - 70 56Throughnetwork, paper,tv
FFQ-Semi-quantitative
Nested CaseControl
214 5.5 years g/day
Breast cancerPost-menopausal
71.5 - 111.4vs.<64.1
31.44(0.7, 2.97)
0.285
B C E G
incidence
Byrne,C.,2002,BRE01315
U.S, Multi-ethnic, Post-menopausalNurses' Health Study (NHS)Cohort 1976-1996
(57) 1071 By MailFFQ-Semi-quantitative
ProspectiveCohort
44697 14.0 years g/day
Invasive breast cancerPost-menopausal
Quantile 5vs.Quantile 1
51.02(0.84, 1.25)
0.62 A C D E F G
incidence
181

Author, Year,WCRF Code
Country, Ethnicity, Specialcharacteristics
Age Cases n Caseascertainment
Type of studyNon-Cases n
Lenght offollow-up / loss
Assessmentdetail
Additional details Unit Outcome Subgroup Contrast Nocat. OR (95% CI) p
valueptrend A B C D E F G
adjustments
Holmes,M.D.,2003,BRE15400
USA, Not specified,Registered nursesNurses' Health Study (NHS)Cohort 1976-1996
30 - 55 2936HospitalRecords only
FFQ-Semi-quantitative
ProspectiveCohort
76152 18.0 years % of totalenergy/day
Invasive breast cancerPost-menopausal
>20.7vs.<16.4
51.01(0.9, 1.14)
0.66 A C D E F G
incidence
Menopausal status not specified
Giovannucci,E.,1993,BRE03262
US, Not specified,Registered nursesNurses' Health Study (NHS)Cohort 1976-1996
30 - 55 392 By MailFFQ-Semi-quantitative
Nested CaseControl
786 2.0 years g/day
Breast cancer Quantile 5vs.Quantile 1
51.25(0.86, 1.84)
0.27 A E
incidence
Toniolo,P.,1994,BRE12398
U.S.A., Not specifiedNew York Women's HealthStudy, 1985
35 - 65
Through healthorg. (screening,healthinsurance)
FFQ-Semi-quantitative
Nested CaseControl
14291.0 7.0 years g/day
Invasive breast cancer 110.0vs.31.0
51.13(0.64, 2.02)
0.51incidence
Kushi, L.H.,1995,BRE05142
US, Multi-ethnicIowa Women's Health Study
55 - 69 329 By MailFFQ-Semi-quantitative
ProspectiveCohort
34388.0 6.0 years g/day
Breast cancer ER+/PR+ >85.0vs.<72.0
30.84(0.64, 1.1)
0.22 A E
incidence
Kushi, L.H.,1995,BRE05142
US, Multi-ethnicIowa Women's Health Study
55 - 69 75 By MailFFQ-Semi-quantitative
ProspectiveCohort
34388.0 6.0 years g/day
Breast cancer ER+/PR- >85.0vs.<72.0
31.31(0.74, 2.31)
0.38 A E
incidence
Kushi, L.H.,1995,BRE05142
US, Multi-ethnicIowa Women's Health Study
55 - 69 14 By MailFFQ-Semi-quantitative
ProspectiveCohort
34388.0 6.0 years g/day
Breast cancer ER-/PR+ >85.0vs.<72.0
30.98(0.24, 3.93)
0.99 A E
incidence
Kushi, L.H.,1995,BRE05142
US, Multi-ethnicIowa Women's Health Study
55 - 69 61 By MailFFQ-Semi-quantitative
ProspectiveCohort
34388.0 6.0 years g/day
Breast cancer ER-/PR- >85.0vs.<72.0
31.14(0.59, 2.2)
0.73 A E
incidence
Holmes,M.D.,2003,BRE15400
USA, Not specified,Registered nursesNurses' Health Study (NHS)Cohort 1976-1996
30 - 55HospitalRecords only
FFQ-Semi-quantitative
ProspectiveCohort
88647.0 18.0 years % of totalenergy/day
Invasive breast cancer >20.7vs.<16.4
51.05(0.95, 1.16)
0.37 A C D E F G
incidence
5.3.2
Plant protein
Pre-menopausal
Holmes,M.D.,2003,BRE15400
USA, Not specified,Registered nursesNurses' Health Study (NHS)Cohort 1976-1996
30 - 55 854HospitalRecords only
FFQ-Semi-quantitative
ProspectiveCohort
53952 18.0 years % of totalenergy/day
Invasive breast cancerPre-menopausal
>5.3vs.<3.9
51.04(0.82, 1.31)
0.87 A C D E F G
incidence
Post-menopausal
Sieri,Sabina,2002,BRE20941
Italy, Not specified, Post-menopausalORDET study, 1987
41 - 70 56Throughnetwork, paper,tv
FFQ-Semi-quantitative
Nested CaseControl
214 5.5 years g/day
Breast cancerPost-menopausal
24.6 - 37.8vs.<21.5
30.97(0.31, 3.01)
0.989
B C E G
incidence
182

Author, Year,WCRF Code
Country, Ethnicity, Specialcharacteristics
Age Cases n Caseascertainment
Type of studyNon-Cases n
Lenght offollow-up / loss
Assessmentdetail
Additional details Unit Outcome Subgroup Contrast Nocat. OR (95% CI) p
valueptrend A B C D E F G
adjustments
Holmes,M.D.,2003,BRE15400
USA, Not specified,Registered nursesNurses' Health Study (NHS)Cohort 1976-1996
30 - 55 2936HospitalRecords only
FFQ-Semi-quantitative
ProspectiveCohort
76152 18.0 years % of totalenergy/day
Invasive breast cancerPost-menopausal
>5.3vs.<3.9
50.99(0.87, 1.12)
0.97 A C D E F G
incidence
Menopausal status not specified
Holmes,M.D.,2003,BRE15400
USA, Not specified,Registered nursesNurses' Health Study (NHS)Cohort 1976-1996
30 - 55HospitalRecords only
FFQ-Semi-quantitative
ProspectiveCohort
88647.0 18.0 years % of totalenergy/day
Invasive breast cancer >5.3vs.<3.9
51.02(0.92, 1.13)
0.82 A C D E F G
incidence
5.3.3
Animal protein
Pre-menopausal
Holmes,M.D.,2003,BRE15400
USA, Not specified,Registered nursesNurses' Health Study (NHS)Cohort 1976-1996
30 - 55 854HospitalRecords only
FFQ-Semi-quantitative
ProspectiveCohort
53952 18.0 years % of totalenergy/day
Invasive breast cancerPre-menopausal
>16.2vs.<11.6
51.05(0.83, 1.33)
0.59 A C D E F G
incidence
Post-menopausal
Sieri,Sabina,2002,BRE20941
Italy, Not specified, Post-menopausalORDET study, 1987
41 - 70 56Throughnetwork, paper,tv
FFQ-Semi-quantitative
Nested CaseControl
214 5.5 years g/day
Breast cancerPost-menopausal
49.8 - 91.3vs.<40.4
33.78(0.95, 15.0)
0.055
B C E G
incidence
Holmes,M.D.,2003,BRE15400
USA, Not specified,Registered nursesNurses' Health Study (NHS)Cohort 1976-1996
30 - 55 2936HospitalRecords only
FFQ-Semi-quantitative
ProspectiveCohort
76152 18.0 years % of totalenergy/day
Invasive breast cancerPost-menopausal
>16.2vs.<11.6
51.0(0.88, 1.12)
0.69 A C D E F G
incidence
Menopausal status not specified
Holmes,M.D.,2003,BRE15400
USA, Not specified,Registered nursesNurses' Health Study (NHS)Cohort 1976-1996
30 - 55HospitalRecords only
FFQ-Semi-quantitative
ProspectiveCohort
88647.0 18.0 years % of totalenergy/day
Invasive breast cancer >16.2vs.<11.6
51.02(0.92, 1.13)
0.43 A C D E F G
incidence
5.4
Alcohol (as ethanol)
Pre-menopausal
Willett, W.C.,1987,BRE13441
U.S.A., Not specified,Registered nursesNurses' Health Study (NHS)Cohort 1976-1996
34 - 59 298 By MailFFQ-Semi-quantitative
ProspectiveCohort
49693 4.0 years controls stay for n. ofwomen
g/day
Breast cancerPre-menopausal
>=5.0vs.none
31.5(null, null)
A
incidence
Schatzkin,A.,1987,BRE18010
U.S.A., Multi-ethnicNHEFS, 1981/82
25 - 74 45Generalpopulation(survey)
24h RecallProspectiveCohort
7188.0 10.0 yearsBreast cancer
Pre-menopausal
Any Drinkingvs.Nondrinking
22.0(1.0, 3.8)
A
incidence
Friedenreich, C.M.,1993,BRE17508
Canada, Not specified,Screening ProgramNBSS, 1980
235
Through healthorg. (screening,healthinsurance)
FFQ (nos)Nested CaseControl
491 5.5 years g/day
Breast cancerPre-menopausal
>=30vs.Nondrinkers
51.88(0.96, 3.66)
0.07 A C E F G
incidence
183

Author, Year,WCRF Code
Country, Ethnicity, Specialcharacteristics
Age Cases n Caseascertainment
Type of studyNon-Cases n
Lenght offollow-up / loss
Assessmentdetail
Additional details Unit Outcome Subgroup Contrast Nocat. OR (95% CI) p
valueptrend A B C D E F G
adjustments
Holmberg,L.,1995,BRE15392
Sweden, Not specified,Screening ProgramThe Swedish MammographyCohort, 1987
40 - 74 54
Through healthorg. (screening,healthinsurance)
FFQ (nos)Nested CaseControl
97 mean dose g/day
Invasive breast cancerPre-menopausal
>= 2 g/dayvs.Never
40.8(0.4, 1.4)
B C D F
incidence
Jain,M.G.,2000,BRE17653
Canada, Not specified,Screening ProgramNBSS, 1980
40 - 59 76
Through healthorg. (screening,healthinsurance)
FFQ-Quantitative
ProspectiveCohort
49165.0 10.3 years only drinkers g/day
Breast cancerPre-menopausal
10.0(continuous)
11.018(1.007,1.029)
A B C D E F G
cancer death
Rohan,T.E.,2000,BRE16489
Canada, Not specified,Screening ProgramNBSS, 1980
40 - 59 598
Through healthorg. (screening,healthinsurance)
FFQ-Quantitative
Case Cohort 56837.0 10.0 years only drinkers g/day
Breast cancerPre-menopausal
10.0(continuous)
11.06(0.97, 1.15)
A C E F G
incidence
Rissanen,H.,2003,BRE17954
Finland, Not specifiedMobile Clinic HealthExamination Survey, 1973
18 - 89Throughnetwork, paper,tv
Nested CaseControl
8196.0 10.0 yearsBreast cancer
Pre-menopausal
1null(null, null)
incidence
Colditz, G.A.,2004,BRE01783
U.S.A., Not specified,Registered nursesNurses' Health Study (NHS)Cohort 1976-1996
30 - 55 1281 By MailProspectiveCohort
66145.0 19.0 years cumulative ouncesOunces*year
Breast cancer ER+/PR+Pre-menopausal
100.0(continuous)
11.03(1.01, 1.05)
A C D F G
incidence
Colditz, G.A.,2004,BRE01783
U.S.A., Not specified,Registered nursesNurses' Health Study (NHS)Cohort 1976-1996
30 - 55 318 By MailProspectiveCohort
66145.0 19.0 years cumulative ouncesOunces*year
Breast cancer ER+/PR-Pre-menopausal
100.0(continuous)
11.02(0.99, 1.06)
A C D F G
incidence
Colditz, G.A.,2004,BRE01783
U.S.A., Not specified,Registered nursesNurses' Health Study (NHS)Cohort 1976-1996
30 - 55 80 By MailProspectiveCohort
66145.0 19.0 years cumulative ouncesOunces*year
Breast cancer ER-/PR+Pre-menopausal
100.0(continuous)
11.02(0.94, 1.09)
A C D F G
incidence
Colditz, G.A.,2004,BRE01783
U.S.A., Not specified,Registered nursesNurses' Health Study (NHS)Cohort 1976-1996
30 - 55 By MailProspectiveCohort
66145.0 19.0 years cumulative ouncesOunces*year
Breast cancer ER-/PR-Pre-menopausal
100.0(continuous)
11.0(0.96, 1.03)
A C D F G
incidence
Horn-Ross,P.L.,2004,BRE15413
USA, Not specified,Registered teachersCalifornia Teachers Study,1995
- 84 295
Through socialorganization(profession,religion)
FFQ (nos)ProspectiveCohort
172715 5.0 years g/day
Invasive breast cancerPre-menopausal
>= 20vs.Nondrinkers
61.21(0.76, 1.92)
A C D E F G
incidence
Zhang etal.,2007,BRE20023
AmericaWomen's Health Study,1993
(55) 362 Medical notesFFQ +Questionnaire
ProspectiveCohort
38454.0 10.0 years Alcohol intake g/day
Invasive & In situ breastcancer Pre-
menopausal10.0(continuous)
11.08(0.96, 1.22)
A C D E F G
incidence
Post-menopausal
Willett, W.C.,1987,BRE13441
U.S.A., Not specified,Registered nursesNurses' Health Study (NHS)Cohort 1976-1996
34 - 59 205 By MailFFQ-Semi-quantitative
ProspectiveCohort
26745 4.0 years controls stay for n. ofwomen
g/day
Breast cancerPost-menopausal
>=5.0vs.none
31.3(null, null)
A
incidence
Schatzkin,A.,1987,BRE18010
U.S.A., Multi-ethnicNHEFS, 1981/82
25 - 74 76Generalpopulation(survey)
24h RecallProspectiveCohort
7188.0 10.0 yearsBreast cancer
Post-menopausal
Any Drinkingvs.Nondrinking
21.3(0.8, 2.1)
A
incidence
184

Author, Year,WCRF Code
Country, Ethnicity, Specialcharacteristics
Age Cases n Caseascertainment
Type of studyNon-Cases n
Lenght offollow-up / loss
Assessmentdetail
Additional details Unit Outcome Subgroup Contrast Nocat. OR (95% CI) p
valueptrend A B C D E F G
adjustments
Gapstur, S.M.,1992,BRE03101
U.S.A., Not specified, Post-menopausalIowa Women's Health Study
55 - 69 By MailFFQ-Semi-quantitative
ProspectiveCohort
37105.0 4.0 years g/day
Breast cancer FamilyHistory BC -No & Post-menopausal
>= 4vs.Abstainers
31.15(null, null)
A
incidence
Gapstur, S.M.,1992,BRE03101
U.S.A., Not specified, Post-menopausalIowa Women's Health Study
55 - 69 By MailFFQ-Semi-quantitative
ProspectiveCohort
37105.0 4.0 years g/day
Breast cancer FamilyHistory BC -Yes & Post-menopausal
>= 4vs.Abstainers
31.57(null, null)
A
incidence
Gapstur, S.M.,1992,BRE03101
U.S.A., Not specified, Post-menopausalIowa Women's Health Study
55 - 69 By MailFFQ-Semi-quantitative
ProspectiveCohort
37105.0 4.0 years Noncontraceptiveestrogen use
g/day
Breast cancer
HRT - No>= 4vs.Abstainers
30.83(null, null)
A
incidence
Gapstur, S.M.,1992,BRE03101
U.S.A., Not specified, Post-menopausalIowa Women's Health Study
55 - 69 By MailFFQ-Semi-quantitative
ProspectiveCohort
37105.0 4.0 years Noncontraceptiveestrogen use
g/day
Breast cancer
HRT - Yes>= 4vs.Abstainers
31.66(null, null)
A
incidence
Gapstur, S.M.,1992,BRE03101
U.S.A., Not specified, Post-menopausalIowa Women's Health Study
55 - 69 459 By MailFFQ-Semi-quantitative
ProspectiveCohort
133074 4.0 years g/day
Breast cancerPost-menopausal
>=15vs.0
51.46(1.04, 2.04)
0.04 A C D F
incidence
Gapstur, S.M.,1992,BRE03101
U.S.A., Not specified, Post-menopausalIowa Women's Health Study
55 - 69 By MailFFQ-Semi-quantitative
ProspectiveCohort
37105.0 4.0 years BMI<=22.89 g/day
Breast cancer Post-menopausal& Lean
>= 4vs.Abstainers
32.26(null, null)
A
incidence
Gapstur, S.M.,1992,BRE03101
U.S.A., Not specified, Post-menopausalIowa Women's Health Study
55 - 69 By MailFFQ-Semi-quantitative
ProspectiveCohort
37105.0 4.0 years BMI>30.70 g/day
Breast cancer Post-menopausal&Overweight
>= 4vs.Abstainers
30.86(null, null)
A
incidence
Barrett-Connor,E.,1993,BRE00581
U.S, WhiteRancho Bernardo, 1972
40 - 79 15
Through socialorganization(profession,religion)
24h RecallProspectiveCohort
575 15.0 years g/day
Breast cancerPost-menopausal
18.0(continuous)
10.75(0.35, 1.63)
A C D
incidence
Friedenreich, C.M.,1993,BRE17508
Canada, Not specified,Screening ProgramNBSS, 1980
284
Through healthorg. (screening,healthinsurance)
FFQ (nos)Nested CaseControl
691 5.5 years g/day
Breast cancerPost-menopausal
>=30vs.Nondrinkers
50.86(0.46, 1.59)
0.19 A C E F G
incidence
van den Brandt, P.A.,1995,BRE12719
the Netherlands, Notspecified, Post-menopausalThe Netherlands CohortStudy on diet and cancer,
55 - 69 386 By MailQuestionnaire(nos)
Case Cohort 62573.0 3.3 years breast cancer insister(s)-No
g/day
Breast cancer FamilyHistory BC -No & Post-menopausal
>=15vs.Nondrinker
31.18(null, null)
0.289
A
incidence
van den Brandt, P.A.,1995,BRE12719
the Netherlands, Notspecified, Post-menopausalThe Netherlands CohortStudy on diet and cancer,
55 - 69 36 By MailQuestionnaire(nos)
Case Cohort 62573.0 3.3 years breast cancer insister(s)-yes
g/day
Breast cancer FamilyHistory BC -Yes & Post-menopausal
>=15vs.Nondrinker
34.29(null, null)
0.021
A
incidence
van den Brandt, P.A.,1995,BRE12719
the Netherlands, Notspecified, Post-menopausalThe Netherlands CohortStudy on diet and cancer,
55 - 69 344 By MailQuestionnaire(nos)
Case Cohort 62573.0 3.3 years g/day
Breast cancer
HRT - No>=15vs.Nondrinker
31.24(null, null)
0.261
A
incidence
van den Brandt, P.A.,1995,BRE12719
the Netherlands, Notspecified, Post-menopausalThe Netherlands CohortStudy on diet and cancer,
55 - 69 55 By MailQuestionnaire(nos)
Case Cohort 62573.0 3.3 years g/day
Breast cancer
HRT - Yes>=15vs.Nondrinker
31.07(null, null)
0.572
A
incidence
185

Author, Year,WCRF Code
Country, Ethnicity, Specialcharacteristics
Age Cases n Caseascertainment
Type of studyNon-Cases n
Lenght offollow-up / loss
Assessmentdetail
Additional details Unit Outcome Subgroup Contrast Nocat. OR (95% CI) p
valueptrend A B C D E F G
adjustments
van den Brandt, P.A.,1995,BRE12719
the Netherlands, Notspecified, Post-menopausalThe Netherlands CohortStudy on diet and cancer,
55 - 69 422 By MailQuestionnaire(nos)
Case Cohort 4318 3.3 years g/day
Breast cancerPost-menopausal
>=30vs.Nondrinker
51.72(0.9, 3.28)
0.047
A B C D E F G
incidence
van den Brandt, P.A.,1995,BRE12719
the Netherlands, Notspecified, Post-menopausalThe Netherlands CohortStudy on diet and cancer,
55 - 69 117 By MailQuestionnaire(nos)
Case Cohort 62573.0 3.3 years BMI<22 g/day
Breast cancer Post-menopausal& Lean
>=15vs.Nondrinker
31.57(null, null)
0.114
A
incidence
van den Brandt, P.A.,1995,BRE12719
the Netherlands, Notspecified, Post-menopausalThe Netherlands CohortStudy on diet and cancer,
55 - 69 96 By MailQuestionnaire(nos)
Case Cohort 62573.0 3.3 years BMI>=27 g/day
Breast cancer Post-menopausal&Overweight
>=15vs.Nondrinker
31.41(null, null)
0.064
A
incidence
Holmberg,L.,1995,BRE15392
Sweden, Not specified,Screening ProgramThe Swedish MammographyCohort, 1987
40 - 74 222
Through healthorg. (screening,healthinsurance)
FFQ (nos)Nested CaseControl
355 mean dose g/day
Invasive breast cancerPost-menopausal
>= 2 g/dayvs.Never
41.8(1.1, 2.9)
B C D F
incidence
Jain,M.G.,2000,BRE17653
Canada, Not specified,Screening ProgramNBSS, 1980
40 - 59 39
Through healthorg. (screening,healthinsurance)
FFQ-Quantitative
ProspectiveCohort
49165.0 10.3 years only drinkers g/day
Breast cancer
HRT - Yes10.0(continuous)
11.007(0.993,1.021)
A B C D E F G
cancer death
Rohan,T.E.,2000,BRE16489
Canada, Not specified,Screening ProgramNBSS, 1980
40 - 59 946
Through healthorg. (screening,healthinsurance)
FFQ-Quantitative
Case Cohort 56837.0 10.0 years only drinkers g/day
Breast cancer
HRT - Yes10.0(continuous)
11.08(0.99, 1.19)
A C E F G
incidence
Jain,M.G.,2000,BRE17653
Canada, Not specified,Screening ProgramNBSS, 1980
40 - 59 98
Through healthorg. (screening,healthinsurance)
FFQ-Quantitative
ProspectiveCohort
49165.0 10.3 years only drinkers; not pre-menopausal
g/day
Breast cancerPost-menopausal
10.0(continuous)
11.006(0.997,1.016)
A B C D E F G
cancer death
Rohan,T.E.,2000,BRE16489
Canada, Not specified,Screening ProgramNBSS, 1980
40 - 59 542
Through healthorg. (screening,healthinsurance)
FFQ-Quantitative
Case Cohort 56837.0 10.0 years only drinkers g/day
Breast cancerPost-menopausal
10.0(continuous)
11.05(0.98, 1.11)
A C E F G
incidence
Sieri,Sabina,2002,BRE20941
Italy, Not specified, Post-menopausalORDET study, 1987
41 - 70 56Throughnetwork, paper,tv
FFQ-Semi-quantitative
Nested CaseControl
214 5.5 years g/day
Breast cancerPost-menopausal
12.9 - 52.7vs.<0.75
31.04(0.46, 2.33)
0.963
B C E G
incidence
Chen, Wendy,Y.,2002,BRE19205
U.S.A., Not specified,Registered nursesNurses' Health Study (NHS)Cohort 1976-1996
30 - 55 1722 By MailFFQ-Semi-quantitative
ProspectiveCohort
557984 15.6 years g/day
Invasive breast cancerPost-menopausal
>=20vs.none
51.33(1.12, 1.58)
0.001
A C D F G
incidence
Tjonneland,A.,2003,BRE12350
Denmark, Not specified,Post-menopausalDiet, Cancer and Health,1993
50 - 64 By Mail FFQ (nos)ProspectiveCohort
23778.0 4.7 yearsexcluded abstainersand occasionaldrinkers
g/day
Breast cancerHRT -Former
10.0(continuous)
11.2(1.07, 1.36)
A B C D F G
incidence
Tjonneland,A.,2003,BRE12350
Denmark, Not specified,Post-menopausalDiet, Cancer and Health,1993
50 - 64 By Mail FFQ (nos)ProspectiveCohort
23778.0 4.7 yearsexcluded abstainersand occasionaldrinkers
g/day
Breast cancer
HRT - No10.0(continuous)
11.07(0.97, 1.18)
A B C D F G
incidence
Tjonneland,A.,2003,BRE12350
Denmark, Not specified,Post-menopausalDiet, Cancer and Health,1993
50 - 64 By Mail FFQ (nos)ProspectiveCohort
23778.0 4.7 yearsexcluded abstainersand occasionaldrinkers
g/day
Breast cancer
HRT - Yes10.0(continuous)
11.07(1.0, 1.16)
A B C D F G
incidence
186

Author, Year,WCRF Code
Country, Ethnicity, Specialcharacteristics
Age Cases n Caseascertainment
Type of studyNon-Cases n
Lenght offollow-up / loss
Assessmentdetail
Additional details Unit Outcome Subgroup Contrast Nocat. OR (95% CI) p
valueptrend A B C D E F G
adjustments
Feigelson, H.S.,2003,BRE02720
U.S, Not specifiedCPS-II US cohort, 1982-1998
1303 By MailFFQ-Semi-quantitative
ProspectiveCohort
65258 6.0 years / 7592 g/day
Breast cancerPost-menopausal
>=15vs.none
51.26(1.04, 1.53)
0.01 A B C D E F G
incidence
Rissanen,H.,2003,BRE17954
Finland, Not specifiedMobile Clinic HealthExamination Survey, 1973
18 - 89Throughnetwork, paper,tv
Nested CaseControl
8196.0 10.0 yearsBreast cancer
Post-menopausal
1null(null, null)
incidence
Tjonneland,A.,2003,BRE12350
Denmark, Not specified,Post-menopausalDiet, Cancer and Health,1993
50 - 64 By Mail FFQ (nos)ProspectiveCohort
23778.0 4.7 yearsexcluded abstainersand occasionaldrinkers
g/day
Breast cancerPost-menopausal
10.0(continuous)
11.1(1.04, 1.16)
A B C D F G
incidence
Mattisson,I.,2004,BRE17807
Sweden, Not specified, Post-menopausalMalmo Diet and Cancer,1991
50 - 342
Through healthorg. (screening,healthinsurance)
7-day Record +Questionnaire
ProspectiveCohort
11328 7.6 yearsBreast cancer
Post-menopausal
>30vs.<=15
41.68(0.91, 3.12)
A B C D E F G
incidence
Tjonneland,A.,2004,BRE12349
Denmark, Not specified,Post-menopausalDiet, Cancer and Health,1993
50 - 65Direct contactat home
FFQ (nos)ProspectiveCohort
23683.0 4.7 years baseline g/day
Breast cancerPost-menopausal
10.0(continuous)
11.1(1.03, 1.16)
A B C D F G
incidence
Duffy,C.,2004,BRE18359
U.S.A, Multi-ethnic, Post-menopausalWomen's Health Initiative(WHI) Observational Study,
50 - 79
Through healthorg. (screening,healthinsurance)
FFQ (nos)ProspectiveCohort
93724.0 5.0 years g/day
Breast cancerPost-menopausal
>15vs.Non-drinkers
41.26(1.07, 1.48)
A B C D F G
incidence
Sellers, T.A.,2004,BRE18027
USA, Not specified, Post-menopausalIowa Women's Health Study
55 - 69 1875 By MailFFQ-Semi-quantitative
ProspectiveCohort
33552 14.0 years g/day
Breast cancerPost-menopausal
>4vs.0
31.11(0.98, 1.27)
0.09 A B C D E F G
incidence
Stolzenberg-Solomon,R. Z.,2004,BRE18746
, Not specified, Post-menopausalPLCO Cancer ScreeningTrial cohort, 1993
55 - 74 777
Through healthorg. (screening,healthinsurance)
Questionnaire(nos)
ProspectiveCohort
28210 4.94 yearsBreast cancer
Post-menopausal
5th quintilevs.1st quintile
21.29(1.02, 1.69)
.08 A B C E F G
incidence
Colditz, G.A.,2004,BRE01783
U.S.A., Not specified,Registered nursesNurses' Health Study (NHS)Cohort 1976-1996
30 - 55 1281 By MailProspectiveCohort
66145.0 19.0 years cumulative ouncesOunces*year
Breast cancer ER+/PR+
HRT - Yes100.0(continuous)
11.0(0.93, 1.07)
A C D F G
incidence
Colditz, G.A.,2004,BRE01783
U.S.A., Not specified,Registered nursesNurses' Health Study (NHS)Cohort 1976-1996
30 - 55 318 By MailProspectiveCohort
66145.0 19.0 years cumulative ouncesOunces*year
Breast cancer ER+/PR-
HRT - Yes100.0(continuous)
11.09(1.01, 1.18)
A C D F G
incidence
Colditz, G.A.,2004,BRE01783
U.S.A., Not specified,Registered nursesNurses' Health Study (NHS)Cohort 1976-1996
30 - 55 80 By MailProspectiveCohort
66145.0 19.0 years cumulative ouncesOunces*year
Breast cancer ER-/PR+
HRT - Yes100.0(continuous)
11.05(0.83, 1.33)
A C D F G
incidence
Colditz, G.A.,2004,BRE01783
U.S.A., Not specified,Registered nursesNurses' Health Study (NHS)Cohort 1976-1996
30 - 55 417 By MailProspectiveCohort
66145.0 19.0 years cumulative ouncesOunces*year
Breast cancer ER-/PR-
HRT - Yes100.0(continuous)
10.9(0.76, 1.08)
A C D F G
incidence
Horn-Ross,P.L.,2004,BRE15413
USA, Not specified,Registered teachersCalifornia Teachers Study,1995
- 84 482
Through socialorganization(profession,religion)
FFQ (nos)ProspectiveCohort
103460.0 5.0 years g/day
Invasive breast cancer
HRT - Yes>=20vs.Nondrinkers
31.51(1.13, 2.03)
A C D E F G
incidence
187

Author, Year,WCRF Code
Country, Ethnicity, Specialcharacteristics
Age Cases n Caseascertainment
Type of studyNon-Cases n
Lenght offollow-up / loss
Assessmentdetail
Additional details Unit Outcome Subgroup Contrast Nocat. OR (95% CI) p
valueptrend A B C D E F G
adjustments
Horn-Ross,P.L.,2004,BRE15413
USA, Not specified,Registered teachersCalifornia Teachers Study,1995
- 84 973
Through socialorganization(profession,religion)
FFQ (nos)ProspectiveCohort
195223 5.0 years g/day
Invasive breast cancerPost-menopausal
>= 20vs.Nondrinkers
61.32(1.06, 1.63)
A C D E F G
incidence
Horn-Ross,P.L.,2004,BRE15413
USA, Not specified,Registered teachersCalifornia Teachers Study,1995
- 84 698
Through socialorganization(profession,religion)
FFQ (nos)ProspectiveCohort
103460.0 5.0 years BMI<27.3 g/day
Invasive breast cancer Post-menopausal& Lean
>=20vs.Nondrinkers
31.4(1.09, 1.79)
A C D E F G
incidence
Horn-Ross,P.L.,2004,BRE15413
USA, Not specified,Registered teachersCalifornia Teachers Study,1995
- 84 275
Through socialorganization(profession,religion)
FFQ (nos)ProspectiveCohort
103460.0 5.0 years BMI>=27.3 g/day
Invasive breast cancer Post-menopausal&Overweight
>=20vs.Nondrinkers
31.1(0.71, 1.72)
A C D E F G
incidence
SuzukiR.,2005,BRE24245
Sweden, Not specified, Post-menopausalSweden, 1987
- 70 299
Through healthorg. (screening,healthinsurance)
FFQ (nos)ProspectiveCohort
51847.0 8.3 years g of ethanol per day. g/day
Breast cancer ER+/PR+
HRT - No>=10.0vs.non drinkers
41.2(0.76, 1.9)
A B C D E F G
incidence
SuzukiR.,2005,BRE24245
Sweden, Not specified, Post-menopausalSweden, 1987
- 70 243
Through healthorg. (screening,healthinsurance)
FFQ (nos)ProspectiveCohort
51847.0 8.3 years g of ethanol per day. g/day
Breast cancer ER+/PR+
HRT - Yes>=10.0vs.non drinkers
41.8(1.24, 2.6)
A B C D E F G
incidence
SuzukiR.,2005,BRE24245
Sweden, Not specified, Post-menopausalSweden, 1987
- 70 716
Through healthorg. (screening,healthinsurance)
FFQ (nos)ProspectiveCohort
51847.0 8.3 years g of ethanol per day g/day
Breast cancer ER+/PR+Post-menopausal
>=10.0vs.non drinkers
41.35(1.02, 1.8)
0.049
A B C D E F G
incidence
SuzukiR.,2005,BRE24245
Sweden, Not specified, Post-menopausalSweden, 1987
- 70 102
Through healthorg. (screening,healthinsurance)
FFQ (nos)ProspectiveCohort
51847.0 8.3 years g of ethanol per day. g/day
Breast cancer ER+/PR-
HRT - No>=10.0vs.non drinkers
42.54(1.33, 2.86)
A B C D E F G
incidence
SuzukiR.,2005,BRE24245
Sweden, Not specified, Post-menopausalSweden, 1987
- 70 123
Through healthorg. (screening,healthinsurance)
FFQ (nos)ProspectiveCohort
51847.0 8.3 years g of ethanol per day. g/day
Breast cancer ER+/PR-
HRT - Yes>=10.0vs.non drinkers
43.51(1.98, 6.21)
A B C D E F G
incidence
SuzukiR.,2005,BRE24245
Sweden, Not specified, Post-menopausalSweden, 1987
- 70 279
Through healthorg. (screening,healthinsurance)
FFQ (nos)ProspectiveCohort
51847.0 8.3 years g of ethanol per day g/day
Breast cancer ER+/PR-Post-menopausal
>=10.0vs.non drinkers
42.36(1.56, 3.56)
0.001
A B C D E F G
incidence
SuzukiR.,2005,BRE24245
Sweden, Not specified, Post-menopausalSweden, 1987
- 70 91
Through healthorg. (screening,healthinsurance)
FFQ (nos)ProspectiveCohort
51847.0 8.3 years g of ethanol per day. g/day
Breast cancer ER-
HRT - No>=10.0vs.non drinkers
40.79(0.32, 1.95)
A B C D E F G
incidence
SuzukiR.,2005,BRE24245
Sweden, Not specified, Post-menopausalSweden, 1987
- 70 42
Through healthorg. (screening,healthinsurance)
FFQ (nos)ProspectiveCohort
51847.0 8.3 years g of ethanol per day. g/day
Breast cancer ER-
HRT - Yes>=10.0vs.non drinkers
40.21(0.05, 0.89)
A B C D E F G
incidence
SuzukiR.,2005,BRE24245
Sweden, Not specified, Post-menopausalSweden, 1987
- 70 50
Through healthorg. (screening,healthinsurance)
FFQ (nos)ProspectiveCohort
51847.0 8.3 years g of ethanol per day g/day
Breast cancer ER-/PR+Post-menopausal
>=10.0vs.non drinkers
40.62(0.13, 2.9)
0.57 A B C D E F G
incidence
SuzukiR.,2005,BRE24245
Sweden, Not specified, Post-menopausalSweden, 1987
- 70 143
Through healthorg. (screening,healthinsurance)
FFQ (nos)ProspectiveCohort
51847.0 8.3 years g of ethanol per day g/day
Breast cancer ER-/PR-Post-menopausal
>=10.0vs.non drinkers
40.8(0.38, 1.67)
0.45 A B C D E F G
incidence
188

Author, Year,WCRF Code
Country, Ethnicity, Specialcharacteristics
Age Cases n Caseascertainment
Type of studyNon-Cases n
Lenght offollow-up / loss
Assessmentdetail
Additional details Unit Outcome Subgroup Contrast Nocat. OR (95% CI) p
valueptrend A B C D E F G
adjustments
SuzukiR.,2005,BRE24245
Sweden, Not specified, Post-menopausalSweden, 1987
- 70 528
Through healthorg. (screening,healthinsurance)
FFQ (nos)ProspectiveCohort
51847.0 8.3 years g of ethanol per day. g/day
Invasive breast cancer
HRT - No>=10.0vs.non drinkers
41.31(0.94, 1.81)
A B C D E F G
incidence
SuzukiR.,2005,BRE24245
Sweden, Not specified, Post-menopausalSweden, 1987
- 70 446
Through healthorg. (screening,healthinsurance)
FFQ (nos)ProspectiveCohort
51847.0 8.3 years g of ethanol per day. g/day
Invasive breast cancer
HRT - Yes>=10.0vs.non drinkers
41.72(1.3, 2.28)
A B C D E F G
incidence
SuzukiR.,2005,BRE24245
Sweden, Not specified, Post-menopausalSweden, 1987
- 70 1284
Through healthorg. (screening,healthinsurance)
FFQ (nos)ProspectiveCohort
430583 8.3 years g of ethanol per day g/day
Invasive breast cancerPost-menopausal
>=10.0vs.non drinkers
41.43(1.16, 1.76)
0.0012
A B C D E F G
incidence
Mellemkjoer etal.,2006,BRE80039
Danmark, Post-menopausalDiet, Cancer and Health,1993
50 - 65 633 Cancer registry FFQProspectiveCohort
23155 6.1 years Alcohol intake g/day
Breast cancer12.0(continuous)
11.1(1.04, 1.16)
A B C E G
incidence
Stolzenberg-Solomon,R.Z.,2006,BRE80113
United States, Post-menopausalPLCO Cancer ScreeningTrial cohort, 1993
55 - 74 691Cancerscreeningprogramme
FFQ (nos)ProspectiveCohort
31411.0 4.94 years Alcohol consumption g/day
Breast cancer >7.63vs.0 - 0.01
51.37(1.08, 1.76)
0.02 A B
incidence
Ravn-Haren, G. etal.,2006,BRE80151
Denmark, Post menopausalDiet, Cancer and Health,1993
50 - 64 377 Cancer registry FFQNested CaseControl
377 Alcohol intake g/day
Breast cancerPost-menopausal
10.0(continuous)
11.1(1.0, 1.22)
B C D F G
incidence
Stolzenberg-Solomon,R.Z.,2006,BRE80113
United States, Post-menopausalPLCO Cancer ScreeningTrial cohort, 1993
55 - 74Cancerscreeningprogramme
FFQ (nos)ProspectiveCohort
31411.0 4.94 years Alcohol consumption g/day
Breast cancer total folate<=335.5microgram/day
>7.63vs.<0.01
51.95(1.03, 3.72)
A B D E F
incidence
Stolzenberg-Solomon,R.Z.,2006,BRE80113
United States, Post-menopausalPLCO Cancer ScreeningTrial cohort, 1993
55 - 74 115Cancerscreeningprogramme
FFQ (nos)ProspectiveCohort
31411.0 4.94 years Alcohol consumption g/day
Breast cancer total folate<=335.5microgram/day
>7.63vs.<0.01
52.1(1.08, 4.07)
0.004
A B D E F
incidence
Stolzenberg-Solomon,R.Z.,2006,BRE80113
United States, Post-menopausalPLCO Cancer ScreeningTrial cohort, 1993
55 - 74Cancerscreeningprogramme
FFQ (nos)ProspectiveCohort
31411.0 4.94 years Alcohol consumption g/day
Breast cancer total folate>335.5microgram/day
>7.63vs.<0.01
51.23(0.93, 1.62)
0.3 A B D E F
incidence
Vogel, U. etal.,2007,BRE80150
Denmark, Post menopausalDiet, Cancer and Health,1993
50 - 64 44 Cancer registry FFQNested CaseControl
41 Alcohol intake g/day
Breast cancerCOX2T8473C CC
10.0(continuous)
10.85(0.64, 1.14)
B C D F
incidence
Vogel, U. etal.,2007,BRE80150
Denmark, Post menopausalDiet, Cancer and Health,1993
50 - 64 150 Cancer registry FFQNested CaseControl
165 Alcohol intake g/day
Breast cancerCOX2T8473C CT
10.0(continuous)
11.15(0.94, 1.4)
0.18 B C D F
incidence
Vogel, U. etal.,2007,BRE80150
Denmark, Post menopausalDiet, Cancer and Health,1993
50 - 64 167 Cancer registry FFQNested CaseControl
155 Alcohol intake g/day
Breast cancerCOX2T8473C TT
10.0(continuous)
11.16(1.01, 1.33)
B C D F
incidence
Vogel, U. etal.,2007,BRE80150
Denmark, Post menopausalDiet, Cancer and Health,1993
50 - 64 86 Cancer registry FFQNested CaseControl
86 Alcohol intake g/day
Breast cancerIL-6 G-174CCC
10.0(continuous)
11.0(0.8, 1.25)
B C D F
incidence
189

Author, Year,WCRF Code
Country, Ethnicity, Specialcharacteristics
Age Cases n Caseascertainment
Type of studyNon-Cases n
Lenght offollow-up / loss
Assessmentdetail
Additional details Unit Outcome Subgroup Contrast Nocat. OR (95% CI) p
valueptrend A B C D E F G
adjustments
Vogel, U. etal.,2007,BRE80150
Denmark, Post menopausalDiet, Cancer and Health,1993
50 - 64 167 Cancer registry FFQNested CaseControl
177 Alcohol intake g/day
Breast cancerIL-6 G-174CCG
10.0(continuous)
11.2(1.04, 1.4)
0.25 B C D F
incidence
Vogel, U. etal.,2007,BRE80150
Denmark, Post menopausalDiet, Cancer and Health,1993
50 - 64 108 Cancer registry FFQNested CaseControl
98 Alcohol intake g/day
Breast cancerIL-6 G-174CGG
10.0(continuous)
11.02(0.84, 1.24)
B C D F
incidence
Vogel, U. etal.,2007,BRE80150
Denmark, Post menopausalDiet, Cancer and Health,1993
50 - 64 113 Cancer registry FFQNested CaseControl
116 Alcohol intake g/day
Breast cancerIL-8 T-251AAA
10.0(continuous)
11.08(0.9, 1.3)
B C D F
incidence
Vogel, U. etal.,2007,BRE80150
Denmark, Post menopausalDiet, Cancer and Health,1993
50 - 64 160 Cancer registry FFQNested CaseControl
167 Alcohol intake g/day
Breast cancerIL-8 T-251AAT
10.0(continuous)
11.11(0.96, 1.28)
0.97 B C D F
incidence
Vogel, U. etal.,2007,BRE80150
Denmark, Post menopausalDiet, Cancer and Health,1993
50 - 64 88 Cancer registry FFQNested CaseControl
78 Alcohol intake g/day
Breast cancerIL-8 T-251ATT
10.0(continuous)
11.12(0.9, 1.38)
B C D F
incidence
Vogel, U. etal.,2007,BRE80150
Denmark, Post menopausalDiet, Cancer and Health,1993
50 - 64 361 Cancer registry FFQNested CaseControl
361 Alcohol consumption g/day
Breast cancerPost-menopausal
10.0(continuous)
11.08(0.98, 1.2)
B C D F G
incidence
Vogel, U. etal.,2007,BRE80150
Denmark, Post menopausalDiet, Cancer and Health,1993
50 - 64 283 Cancer registry FFQNested CaseControl
258 Alcohol intake g/day
Breast cancer PPAR-gamma2ProAla CC
10.0(continuous)
11.2(1.06, 1.35)
B C D F
incidence
Vogel, U. etal.,2007,BRE80150
Denmark, Post menopausalDiet, Cancer and Health,1993
50 - 64 71 Cancer registry FFQNested CaseControl
93 Alcohol intake g/day
Breast cancer PPAR-gamma2ProAla CG
10.0(continuous)
10.86(0.68, 1.08)
0.02 B C D F
incidence
Vogel, U. etal.,2007,BRE80150
Denmark, Post menopausalDiet, Cancer and Health,1993
50 - 64 7 Cancer registry FFQNested CaseControl
10 Alcohol intake g/day
Breast cancer PPAR-gamma2ProAla GG
10.0(continuous)
10.48(0.1, 2.22)
B C D F
incidence
Zhang etal.,2007,BRE20023
AmericaWomen's Health Study,1993
(55) 545 Medical notesFFQ +Questionnaire
ProspectiveCohort
38454.0 10.0 years Alcohol intake g/day
Invasive & In situ breastcancer PMH -
currentusers
10.0(continuous)
11.15(1.05, 1.26)
A C D E F G
incidence
Zhang etal.,2007,BRE20023
AmericaWomen's Health Study,1993
(55) 112 Medical notesFFQ +Questionnaire
ProspectiveCohort
38454.0 10.0 years Alcohol intake g/day
Invasive & In situ breastcancer PMH - past
users10.0(continuous)
10.91(0.72, 1.16)
A C D E F G
incidence
Zhang etal.,2007,BRE20023
AmericaWomen's Health Study,1993
(55) 910 Medical notesFFQ +Questionnaire
ProspectiveCohort
38454.0 10.0 years Alcohol intake g/day
Invasive & In situ breastcancer Post-
menopausal10.0(continuous)
11.07(0.99, 1.15)
A C D E F G
incidence
Ericson, U. etal.,2007,BRE80128
Sweden, Post menopausalMalmo Diet and Cancer,1991
50 - 392 Cancer registryDietary Historyquestionnaire
ProspectiveCohort
11683 9.5 years Alcohol consumption g/day
Invasive breast cancerPost-menopausal
>30vs.None
42.52(1.33, 4.77)
0.06 A
incidence
190

Author, Year,WCRF Code
Country, Ethnicity, Specialcharacteristics
Age Cases n Caseascertainment
Type of studyNon-Cases n
Lenght offollow-up / loss
Assessmentdetail
Additional details Unit Outcome Subgroup Contrast Nocat. OR (95% CI) p
valueptrend A B C D E F G
adjustments
Menopausal status not specified
Willett, W.C.,1987,BRE13441
U.S.A., Not specified,Registered nursesNurses' Health Study (NHS)Cohort 1976-1996
34 - 59 551 By MailFFQ-Semi-quantitative
ProspectiveCohort
85272 4.0 years maternal b.c.; controlsstay for n. of women
g/day
Breast cancer FamilyHistory BC -No
>=5.0vs.none
31.4(null, null)
A
incidence
Willett, W.C.,1987,BRE13441
U.S.A., Not specified,Registered nursesNurses' Health Study (NHS)Cohort 1976-1996
34 - 59 50 By MailFFQ-Semi-quantitative
ProspectiveCohort
4266 4.0 years maternal b.c.; controlsstay for n. of women
g/day
Breast cancer FamilyHistory BC -Yes
>=5.0vs.none
31.4(null, null)
A
incidence
Willett, W.C.,1987,BRE13441
U.S.A., Not specified,Registered nursesNurses' Health Study (NHS)Cohort 1976-1996
34 - 59 81 By MailFFQ-Semi-quantitative
ProspectiveCohort
14690 4.0 years controls stay for n. ofwomen
g/day
Breast cancer
Lean>=5.0vs.none
33.2(null, null)
A
incidence
Schatzkin,A.,1987,BRE18010
U.S.A., Multi-ethnicNHEFS, 1981/82
25 - 74 37Generalpopulation(survey)
24h RecallProspectiveCohort
7188.0 10.0 years BMI <= 22.5
Breast cancer
LeanAny Drinkingvs.Nondrinking
23.5(1.6, 7.9)
A
incidence
Willett, W.C.,1987,BRE13441
U.S.A., Not specified,Registered nursesNurses' Health Study (NHS)Cohort 1976-1996
34 - 59 601 By MailFFQ-Semi-quantitative
ProspectiveCohort
89538 4.0 years g/day
Breast cancer >=15vs.none
51.6(1.3, 2.0)
A C F
incidence
Schatzkin,A.,1987,BRE18010
U.S.A., Multi-ethnicNHEFS, 1981/82
25 - 74 88Generalpopulation(survey)
24h RecallProspectiveCohort
7188.0 10.0 years g/day
Breast cancer >=5vs.None
42.0(1.1, 3.7)
A B C D E F
incidence
Willett, W.C.,1987,BRE13441
U.S.A., Not specified,Registered nursesNurses' Health Study (NHS)Cohort 1976-1996
34 - 59 149 By MailFFQ-Semi-quantitative
ProspectiveCohort
23319 4.0 years controls stay for n. ofwomen
g/day
Breast cancer
Overweight>=5.0vs.none
31.1(null, null)
A
incidence
Schatzkin,A.,1987,BRE18010
U.S.A., Multi-ethnicNHEFS, 1981/82
25 - 74 44Generalpopulation(survey)
24h RecallProspectiveCohort
7188.0 10.0 years BMI >= 27.1
Breast cancer
OverweightAny Drinkingvs.Nondrinking
21.0(0.5, 1.9)
A
incidence
Schatzkin,A.,1989,BRE18013
U.S.A., Not specifiedFramingham Study, 1948
31 - 64 143Generalpopulation(survey)
Interview (nos)ProspectiveCohort
69328 26.0 years / 86.2 at baseline g/day
Breast cancer >=5.0vs.None
40.6(0.4, 1.0)
0.03 A B C D F G
incidence
Friedenreich, C.M.,1993,BRE17508
Canada, Not specified,Screening ProgramNBSS, 1980
519
Through healthorg. (screening,healthinsurance)
FFQ (nos)Nested CaseControl
1182 5.5 years g/day
Breast cancer >=30vs.Nondrinkers
51.22(0.78, 1.9)
0.88 A C E F G
incidence
Giovannucci,E.,1993,BRE17530
U.S.A., Not specified,Registered nursesNurses' Health Study (NHS)Cohort 1976-1996
30 - 55 616 By MailFFQ-Semi-quantitative
Nested CaseControl
1277 3.0 years g/day
Breast cancer >=30vs.0
61.55(1.01, 2.39)
A C D F G
incidence
Fuchs,C.S.,1995,BRE15082
USA, Not specified,Registered nursesNurses' Health Study (NHS)Cohort 1976-1996
34 - 59 350 By MailFFQ-Semi-quantitative
ProspectiveCohort
85709.0 12.0 years g/day
Breast cancer >=30vs.0
61.67(1.1, 2.53)
A D E F G
cancer death
191

Author, Year,WCRF Code
Country, Ethnicity, Specialcharacteristics
Age Cases n Caseascertainment
Type of studyNon-Cases n
Lenght offollow-up / loss
Assessmentdetail
Additional details Unit Outcome Subgroup Contrast Nocat. OR (95% CI) p
valueptrend A B C D E F G
adjustments
Holmberg,L.,1995,BRE15392
Sweden, Not specified,Screening ProgramThe Swedish MammographyCohort, 1987
40 - 74 276
Through healthorg. (screening,healthinsurance)
FFQ (nos)Nested CaseControl
452 mean dose g/day
Invasive breast cancer >= 2 g/dayvs.Never
41.6(1.0, 2.4)
B C D F
incidence
Goodman, M.T.,1997,BRE03352
Japan, Not specified, Atomicbomb survivorsLSS, 1969
127 By MailQuestionnaire(nos)
ProspectiveCohort
152764 8.31 years ml/week
Breast cancer >=55vs.never
40.68(0.32, 1.46)
0.27 A G
incidence
Zhang,Y.,1999,BRE13965
U.S.A., Not specified,Original and OffspringCohortsFramingham Study, 1948
12 - 62 287Generalpopulation(survey)
Interview (nos)ProspectiveCohort
5048.0 34.3 years g/day
Breast cancer >=15.0vs.Nondrinker
40.7(0.5, 1.1)
A B C D F G
incidence
Garland,Miriam,1999,BRE19618
U.S.A., Not specified,Registered nursesNHS II, 1989
25 - 42 400
Through socialorganization(profession,religion)
Questionnaire(nos)
ProspectiveCohort
569657 6.0 years g/day
Invasive breast cancer >20vs.none
61.23(0.68, 2.21)
0.85 A C D F G
incidence
Hines,L.M.,2000,BRE15364
USA, Multi-ethnic,Registered nursesNurses' Health Study (NHS)Cohort 1976-1996
30 - 55 149
Through socialorganization(profession,religion)
FFQ-Semi-quantitative
Nested CaseControl
206 8.0 years g/day
Breast cancer ADH3genotypeFast
>=10vs.none
30.8(0.4, 1.5)
0.83 C D E F G
incidence
Hines,L.M.,2000,BRE15364
USA, Multi-ethnic,Registered nursesNurses' Health Study (NHS)Cohort 1976-1996
30 - 55 290
Through socialorganization(profession,religion)
FFQ-Semi-quantitative
Nested CaseControl
357 8.0 years g/day
Breast cancer ADH3genotypeintermediate
>=10vs.nonegenotipe fast
40.8(0.4, 1.4)
0.91 C D E F G
incidence
Hines,L.M.,2000,BRE15364
USA, Multi-ethnic,Registered nursesNurses' Health Study (NHS)Cohort 1976-1996
30 - 55 126
Through socialorganization(profession,religion)
FFQ-Semi-quantitative
Nested CaseControl
171 8.0 years g/day
Breast cancer ADH3genotypeSlow
>=10vs.abstain fast
41.1(0.5, 2.4)
0.21 C D E F G
incidence
Jain,M.G.,2000,BRE17653
Canada, Not specified,Screening ProgramNBSS, 1980
40 - 59 110
Through healthorg. (screening,healthinsurance)
FFQ-Quantitative
ProspectiveCohort
49165.0 10.3 years only drinkers g/day
Breast cancer FamilyHistory BC -No
10.0(continuous)
11.015(null, null)
A B C D E F G
cancer death
Rohan,T.E.,2000,BRE16489
Canada, Not specified,Screening ProgramNBSS, 1980
40 - 59 1093
Through healthorg. (screening,healthinsurance)
FFQ-Quantitative
Case Cohort 56837.0 10.0 years only drinkers g/day
Breast cancer FamilyHistory BC -No
10.0(continuous)
11.05(1.0, 1.1)
A C E F G
incidence
Jain,M.G.,2000,BRE17653
Canada, Not specified,Screening ProgramNBSS, 1980
40 - 59 64
Through healthorg. (screening,healthinsurance)
FFQ-Quantitative
ProspectiveCohort
49165.0 10.3 years only drinkers g/day
Breast cancer FamilyHistory BC -Yes
10.0(continuous)
11.002(0.984,1.016)
A B C D E F G
cancer death
Rohan,T.E.,2000,BRE16489
Canada, Not specified,Screening ProgramNBSS, 1980
40 - 59 243
Through healthorg. (screening,healthinsurance)
FFQ-Quantitative
Case Cohort 56837.0 10.0 years only drinkers g/day
Breast cancer FamilyHistory BC -Yes
10.0(continuous)
11.08(0.93, 1.26)
A C E F G
incidence
Jain,M.G.,2000,BRE17653
Canada, Not specified,Screening ProgramNBSS, 1980
40 - 59 135
Through healthorg. (screening,healthinsurance)
FFQ-Quantitative
ProspectiveCohort
49165.0 10.3 years only drinkers g/day
Breast cancer
HRT - No10.0(continuous)
11.012(1.003,1.021)
A B C D E F G
cancer death
Rohan,T.E.,2000,BRE16489
Canada, Not specified,Screening ProgramNBSS, 1980
40 - 59 373
Through healthorg. (screening,healthinsurance)
FFQ-Quantitative
Case Cohort 56837.0 10.0 years only drinkers g/day
Breast cancer
HRT - No10.0(continuous)
11.05(0.99, 1.11)
A C E F G
incidence
192

Author, Year,WCRF Code
Country, Ethnicity, Specialcharacteristics
Age Cases n Caseascertainment
Type of studyNon-Cases n
Lenght offollow-up / loss
Assessmentdetail
Additional details Unit Outcome Subgroup Contrast Nocat. OR (95% CI) p
valueptrend A B C D E F G
adjustments
Jain,M.G.,2000,BRE17653
Canada, Not specified,Screening ProgramNBSS, 1980
40 - 59 54
Through healthorg. (screening,healthinsurance)
FFQ-Quantitative
ProspectiveCohort
49165.0 10.3 years only drinkers;BMI<22.9
g/day
Breast cancer
Lean10.0(continuous)
11.013(0.998,1.028)
A B C E F G
cancer death
Rohan,T.E.,2000,BRE16489
Canada, Not specified,Screening ProgramNBSS, 1980
40 - 59 263
Through healthorg. (screening,healthinsurance)
FFQ-Quantitative
Case Cohort 56837.0 10.0 years only drinkers;BMI<21.6
g/day
Breast cancer
Lean10.0(continuous)
11.0(0.9, 1.1)
A C E F G
incidence
Hines,L.M.,2000,BRE15364
USA, Multi-ethnic,Registered nursesNurses' Health Study (NHS)Cohort 1976-1996
30 - 55 455
Through socialorganization(profession,religion)
FFQ-Semi-quantitative
Nested CaseControl
612 8.0 years g/day
Breast cancer >=10vs.none
31.1(0.7, 1.6)
0.94 C D E F G
incidence
Jain,M.G.,2000,BRE17653
Canada, Not specified,Screening ProgramNBSS, 1980
40 - 59 223
Through healthorg. (screening,healthinsurance)
FFQ-Quantitative
ProspectiveCohort
521621 10.3 years controls stay forperson-yrs
g/day
Breast cancer10.0(continuous)
11.012(1.005,1.019)
A B C D E F G
cancer death
Jain,M.G.,2000,BRE17653
Canada, Not specified,Screening ProgramNBSS, 1980
40 - 59 60
Through healthorg. (screening,healthinsurance)
FFQ-Quantitative
ProspectiveCohort
49165.0 10.3 years only drinkers;BMI>27.8
g/day
Breast cancer
Overweight10.0(continuous)
11.025(1.009,1.041)
A B C E F G
cancer death
Rohan,T.E.,2000,BRE16489
Canada, Not specified,Screening ProgramNBSS, 1980
40 - 59 262
Through healthorg. (screening,healthinsurance)
FFQ-Quantitative
Case Cohort 56837.0 10.0 years only drinkers;BMI>=27.5
g/day
Breast cancer
Overweight10.0(continuous)
11.13(0.92, 1.42)
A C E F G
incidence
Rohan,T.E.,2000,BRE16489
Canada, Not specified,Screening ProgramNBSS, 1980
40 - 59 1336
Through healthorg. (screening,healthinsurance)
FFQ-Quantitative
Case Cohort 566190 10.0 years g/day
Invasive breast cancer >50vs.0
71.7(0.97, 2.98)
0.35 A C E F G
incidence
Horn-Ross,P.L.,2002,BRE15412
USA, Multi-ethnic,Registered teachersCalifornia Teachers Study,1995
21 - 103 681 By Mail FFQ (nos)ProspectiveCohort
111383.0 2.0 years g/day
Invasive breast cancer >=20vs.non drinkers
61.5(1.2, 2.0)
0.01 A C D E F G
incidence
Feigelson, H.S.,2003,BRE02720
U.S, Not specifiedCPS-II US cohort, 1982-1998
327 By MailFFQ-Semi-quantitative
ProspectiveCohort
66561.0 6.0 years / 7592 by high levels of dietaryfolate (first quartile)
g/day
Breast cancer H nutr/foodintake &Post-menopausal
>=15vs.none
50.93(0.56, 1.54)
A B C D E F G
incidence
Feigelson, H.S.,2003,BRE02720
U.S, Not specifiedCPS-II US cohort, 1982-1998
348 By MailFFQ-Semi-quantitative
ProspectiveCohort
66561.0 6.0 years / 7592by high levels ofdietary+supplementsfolate (first quartile)
g/day
Breast cancer H nutr/foodintake &Post-menopausal
>=15vs.none
51.5(1.02, 2.22)
A B C D E F G
incidence
Feigelson, H.S.,2003,BRE02720
U.S, Not specifiedCPS-II US cohort, 1982-1998
297 By MailFFQ-Semi-quantitative
ProspectiveCohort
66561.0 6.0 years / 7592 by low levels of dietaryfolate (first quartile)
g/day
Breast cancer L nutr/foodintake &Post-menopausal
>=15vs.none
51.4(1.0, 1.99)
A B C D E F G
incidence
Feigelson, H.S.,2003,BRE02720
U.S, Not specifiedCPS-II US cohort, 1982-1998
307 By MailFFQ-Semi-quantitative
ProspectiveCohort
66561.0 6.0 years / 7592by low levels ofdietary+supplementsfolate (first quartile)
g/day
Breast cancer L nutr/foodintake &Post-menopausal
>=15vs.none
51.33(0.94, 1.88)
A B C D E F G
incidence
Rissanen,H.,2003,BRE17954
Finland, Not specifiedMobile Clinic HealthExamination Survey, 1973
18 - 89Throughnetwork, paper,tv
Nested CaseControl
8196.0 10.0 yearsBreast cancer
1null(null, null)
incidence
193

Author, Year,WCRF Code
Country, Ethnicity, Specialcharacteristics
Age Cases n Caseascertainment
Type of studyNon-Cases n
Lenght offollow-up / loss
Assessmentdetail
Additional details Unit Outcome Subgroup Contrast Nocat. OR (95% CI) p
valueptrend A B C D E F G
adjustments
Zhang, S.M.,2003,BRE13958
US, Not specified,Registered nursesNurses' Health Study (NHS)Cohort 1976-1996
43 - 69 By MailFFQ-Semi-quantitative
Nested CaseControl
32826.0 40.0 monthsBreast cancer
1null(null, null)
incidence
Kilkkinen,A.,2004,BRE17698
FinlandHelsinki and Oulu, 1982
25 - 74 UnspecifiedQuestionnaire(nos)
Nested CaseControl
15497.0 15.0 yearsBreast cancer
1null(null, null)
A G
incidence
Colditz, G.A.,2004,BRE01783
U.S.A., Not specified,Registered nursesNurses' Health Study (NHS)Cohort 1976-1996
30 - 55 1281 By MailProspectiveCohort
66145.0 19.0 years cumulative ouncesOunces*year
Breast cancer ER+/PR+
HRT - No100.0(continuous)
11.01(0.97, 1.06)
A C D F G
incidence
Colditz, G.A.,2004,BRE01783
U.S.A., Not specified,Registered nursesNurses' Health Study (NHS)Cohort 1976-1996
30 - 55 318 By MailProspectiveCohort
66145.0 19.0 years cumulative ouncesOunces*year
Breast cancer ER+/PR-
HRT - No100.0(continuous)
10.98(0.89, 1.09)
A C D F G
incidence
Colditz, G.A.,2004,BRE01783
U.S.A., Not specified,Registered nursesNurses' Health Study (NHS)Cohort 1976-1996
30 - 55 80 By MailProspectiveCohort
66145.0 19.0 years cumulative ouncesOunces*year
Breast cancer ER-/PR+
HRT - No100.0(continuous)
10.93(0.64, 1.36)
A C D F G
incidence
Colditz, G.A.,2004,BRE01783
U.S.A., Not specified,Registered nursesNurses' Health Study (NHS)Cohort 1976-1996
30 - 55 417 By MailProspectiveCohort
66145.0 19.0 years cumulative ouncesOunces*year
Breast cancer ER-/PR-
HRT - No100.0(continuous)
11.07(0.99, 1.15)
A C D F G
incidence
Horn-Ross,P.L.,2004,BRE15413
USA, Not specified,Registered teachersCalifornia Teachers Study,1995
- 84 784
Through socialorganization(profession,religion)
FFQ (nos)ProspectiveCohort
103460.0 5.0 years g/day
Invasive breast cancer FamilyHistory BC -No & Post-menopausal
>=20vs.Nondrinkers
31.42(1.13, 1.79)
A C D E F G
incidence
Horn-Ross,P.L.,2004,BRE15413
USA, Not specified,Registered teachersCalifornia Teachers Study,1995
- 84 189
Through socialorganization(profession,religion)
FFQ (nos)ProspectiveCohort
103460.0 5.0 years family history in firstdegree
g/day
Invasive breast cancer FamilyHistory BC -Yes & Post-menopausal
>=20vs.Nondrinkers
30.92(0.54, 1.57)
A C D E F G
incidence
Horn-Ross,P.L.,2004,BRE15413
USA, Not specified,Registered teachersCalifornia Teachers Study,1995
- 84 170
Through socialorganization(profession,religion)
FFQ (nos)ProspectiveCohort
103460.0 5.0 years g/day
Invasive breast cancer
HRT - No>=20vs.Nondrinkers
30.98(0.55, 1.73)
A C D E F G
incidence
Dumeaux,V.,2004,BRE14906
Norway, Not specifiedNOWAC, 1991
30 - 70 1082 By Mail FFQ (nos)ProspectiveCohort
59202511.0 years /excluded 10women
g/day
Invasive breast cancer >= 10 g/dayvs.None
41.69(1.32, 2.15)
0.0001
A C D F G
incidence
Lin, Y.,2005,BRE23154JapanJACC study, 1988
40 - 79 132Generalpopulation(survey)
Questionnaire(nos)
ProspectiveCohort
242619 7.6 years g/day
Breast cancer >15vs.non drinkers
42.93(1.55, 5.54)
0.01 A C D F G
incidence
Zhang etal.,2007,BRE20023
AmericaWomen's Health Study,1993
(55) 804 Medical notesFFQ +Questionnaire
ProspectiveCohort
38454.0 10.0 years Alcohol intake g/day
Breast cancer ER+/PR+ >=30vs.non drinkers
61.39(0.9, 2.15)
0.02 A C D E F G
incidence
Zhang etal.,2007,BRE20023
AmericaWomen's Health Study,1993
(55) 804 Medical notesFFQ +Questionnaire
ProspectiveCohort
38454.0 10.0 years Alcohol intake g/day
Breast cancer ER+/PR+10.0(continuous)
11.11(1.03, 1.2)
A C D E F G
incidence
194

Author, Year,WCRF Code
Country, Ethnicity, Specialcharacteristics
Age Cases n Caseascertainment
Type of studyNon-Cases n
Lenght offollow-up / loss
Assessmentdetail
Additional details Unit Outcome Subgroup Contrast Nocat. OR (95% CI) p
valueptrend A B C D E F G
adjustments
Zhang etal.,2007,BRE20023
AmericaWomen's Health Study,1993
(55) 125 Medical notesFFQ +Questionnaire
ProspectiveCohort
38454.0 10.0 years Alcohol intake g/day
Breast cancer ER+/PR- >=30vs.non drinkers
60.69(0.17, 2.88)
0.97 A C D E F G
incidence
Zhang etal.,2007,BRE20023
AmericaWomen's Health Study,1993
(55) 125 Medical notesFFQ +Questionnaire
ProspectiveCohort
38454.0 10.0 years Alcohol intake g/day
Breast cancer ER+/PR-10.0(continuous)
11.0(0.81, 1.24)
C D E F G
incidence
Zhang etal.,2007,BRE20023
AmericaWomen's Health Study,1993
(55) 167 Medical notesFFQ +Questionnaire
ProspectiveCohort
38454.0 10.0 years Alcohol intake g/day
Breast cancer ER-/PR-
ER-/PR->=30vs.non drinkers
61.15(0.41, 3.19)
0.79 A C D E F G
incidence
Zhang etal.,2007,BRE20023
AmericaWomen's Health Study,1993
(55) 167 Medical notesFFQ +Questionnaire
ProspectiveCohort
38454.0 10.0 years Alcohol intake g/day
Breast cancer ER-/PR-10.0(continuous)
10.99(0.82, 1.2)
C D E F G
incidence
Zhang etal.,2007,BRE20023
AmericaWomen's Health Study,1993
(55) 822 Medical notesFFQ +Questionnaire
ProspectiveCohort
38454.0 10.0 years Alcohol intake g/day
Invasive & In situ breastcancer
BMI < 2510.0(continuous)
11.08(1.01, 1.17)
A C E F G
incidence
Zhang etal.,2007,BRE20023
AmericaWomen's Health Study,1993
(55) 643 Medical notesFFQ +Questionnaire
ProspectiveCohort
38454.0 10.0 years Alcohol intake g/day
Invasive & In situ breastcancer
BMI >= 2510.0(continuous)
11.04(0.94, 1.15)
A C E F G
incidence
Zhang etal.,2007,BRE20023
AmericaWomen's Health Study,1993
(55) 1371 Medical notesFFQ +Questionnaire
ProspectiveCohort
38454.0 10.0 years Alcohol intake g/day
Invasive & In situ breastcancer Family
History BC -No
10.0(continuous)
11.05(0.99, 1.12)
A C D E F G
incidence
Zhang etal.,2007,BRE20023
AmericaWomen's Health Study,1993
(55) 113 Medical notesFFQ +Questionnaire
ProspectiveCohort
38454.0 10.0 years Alcohol intake g/day
Invasive & In situ breastcancer Family
History BC -Yes
10.0(continuous)
11.23(1.05, 1.44)
A C D E F G
incidence
Zhang etal.,2007,BRE20023
AmericaWomen's Health Study,1993
(55) 1484 Medical notesFFQ +Questionnaire
ProspectiveCohort
38454.0 10.0 years Alcohol intake g/day
Invasive & In situ breastcancer >=30
vs.non drinkers
61.32(0.96, 1.82)
0.02 A C D E F G
incidence
Zhang etal.,2007,BRE20023
AmericaWomen's Health Study,1993
(55) 1484 Medical notesFFQ +Questionnaire
ProspectiveCohort
38454.0 10.0 years Alcohol intake g/day
Invasive & In situ breastcancer 10.0
(continuous)1
1.07(1.01, 1.14)
A C D E F G
incidence
Zhang etal.,2007,BRE20023
AmericaWomen's Health Study,1993
(55) 251 Medical notesFFQ +Questionnaire
ProspectiveCohort
38454.0 10.0 years Alcohol intake g/day
Invasive & In situ breastcancer PMH - never
users10.0(continuous)
10.99(0.86, 1.15)
A C D E F G
incidence
Tjonneland etal.,2007,BRE80013
Denmark,France,Germany,Greece,Italy,TheNetherlands,Norway,Spain,Sweden and UK, Multi-ethnic
35 - 70 711
Populationcancerregistries andother
FFQ + recallProspectiveCohort
53264 6.4 years Average alcohol intake g/day
Invasive breast cancer folate intake<=200mcg/day
10.0(continuous)
11.02(0.97, 1.08)
B C D E F G
incidence
Tjonneland etal.,2007,BRE80013
Denmark,France,Germany,Greece,Italy,TheNetherlands,Norway,Spain,Sweden and UK, Multi-ethnic
35 - 70 876
Populationcancerregistries andother
FFQ + recallProspectiveCohort
49184 6.4 years Average alcohol intake g/day
Invasive breast cancer folate intake>200-<=300mcg/day
10.0(continuous)
11.05(1.01, 1.11)
B C D E F G
incidence
195

Author, Year,WCRF Code
Country, Ethnicity, Specialcharacteristics
Age Cases n Caseascertainment
Type of studyNon-Cases n
Lenght offollow-up / loss
Assessmentdetail
Additional details Unit Outcome Subgroup Contrast Nocat. OR (95% CI) p
valueptrend A B C D E F G
adjustments
Tjonneland etal.,2007,BRE80013
Denmark,France,Germany,Greece,Italy,TheNetherlands,Norway,Spain,Sweden and UK, Multi-ethnic
35 - 70 944
Populationcancerregistries andother
FFQ + recallProspectiveCohort
49184 6.4 years Average alcohol intake g/day
Invasive breast cancer folate intake>300-<=400mcg/day
10.0(continuous)
11.04(1.0, 1.09)
B C D E F G
incidence
Tjonneland etal.,2007,BRE80013
Denmark,France,Germany,Greece,Italy,TheNetherlands,Norway,Spain,Sweden and UK, Multi-ethnic
35 - 70 957
Populationcancerregistries andother
FFQ + recallProspectiveCohort
43506 6.4 years Average alcohol intake g/day
Invasive breast cancer folate intake>400mcg/day
10.0(continuous)
11.02(0.97, 1.06)
B C D E F G
incidence
Tjonneland etal.,2007,BRE80013
Denmark,France,Germany,Greece,Italy,TheNetherlands,Norway,Spain,Sweden and UK, Multi-ethnic
35 - 70 1466
Populationcancerregistries andother
FFQ + recallProspectiveCohort
87146 6.4 years
Baseline averagealcohol intake, quartilesfor women drinking>=19g/day vs. 0.1-1.5
g/day
Invasive breast cancerHigh alcoholintake
>37.2vs.0.1 - 1.5
51.09(0.93, 1.28)
B C D F G
incidence
Tjonneland etal.,2007,BRE80013
Denmark,France,Germany,Greece,Italy,TheNetherlands,Norway,Spain,Sweden and UK, Multi-ethnic
35 - 70 4291
Populationcancerregistries andother
FFQ + recallProspectiveCohort
274688 6.4 years Baseline averagealcohol intake
g/day
Invasive breast cancer >19vs.>0-1.5
61.13(1.01, 1.25)
B C D F G
incidence
Zhang etal.,2007,BRE20023
AmericaWomen's Health Study,1993
(55) 1190 Medical notesFFQ +Questionnaire
ProspectiveCohort
38454.0 10.0 years Alcohol intake g/day
Invasive breast cancer >=30vs.non drinkers
61.43(1.02, 2.02)
0.01 A C D E F G
incidence
Zhang etal.,2007,BRE20023
AmericaWomen's Health Study,1993
(55) 1190 Medical notesFFQ +Questionnaire
ProspectiveCohort
38454.0 10.0 years Alcohol intake g/day
Invasive breast cancer10.0(continuous)
11.09(1.02, 1.16)
A C D E F G
incidence
Alcohol (as ethanol) at Thirties
Post-menopausal
Tjonneland,A.,2004,BRE12349
Denmark, Not specified,Post-menopausalDiet, Cancer and Health,1993
50 - 65Direct contactat home
FFQ (nos)ProspectiveCohort
23683.0 4.7 years g/day
Breast cancerPost-menopausal
10.0(continuous)
11.05(0.96, 1.14)
A B C D F G
incidence
Alcohol (as ethanol) at Twenties
Post-menopausal
Tjonneland,A.,2004,BRE12349
Denmark, Not specified,Post-menopausalDiet, Cancer and Health,1993
50 - 65Direct contactat home
FFQ (nos)ProspectiveCohort
23683.0 4.7 years g/day
Breast cancerPost-menopausal
10.0(continuous)
11.06(0.93, 1.2)
A B C D F G
incidence
Alcohol (as ethanol) - Cumulative intake
Post-menopausal
Tjonneland,A.,2004,BRE12349
Denmark, Not specified,Post-menopausalDiet, Cancer and Health,1993
50 - 65Direct contactat home
FFQ (nos)ProspectiveCohort
23683.0 4.7 years g/day/year
Breast cancerPost-menopausal
10.0(continuous)
11.02(0.99, 1.05)
A B C D F G
incidence
Alcohol (as ethanol) - Most recent consumption
Pre-menopausal
196

Author, Year,WCRF Code
Country, Ethnicity, Specialcharacteristics
Age Cases n Caseascertainment
Type of studyNon-Cases n
Lenght offollow-up / loss
Assessmentdetail
Additional details Unit Outcome Subgroup Contrast Nocat. OR (95% CI) p
valueptrend A B C D E F G
adjustments
Tjonneland etal.,2007,BRE80013
Denmark,France,Germany,Greece,Italy,TheNetherlands,Norway,Spain,Sweden and UK, Multi-ethnic
35 - 70 776
Populationcancerregistries andother
FFQ + recallProspectiveCohort
72332 6.4 years Recent alcohol intake g/day
Invasive breast cancerpremenopausal women
10.0(continuous)
11.04(0.98, 1.09)
B C D F G
incidence
Post-menopausal
Tjonneland etal.,2007,BRE80013
Denmark,France,Germany,Greece,Italy,TheNetherlands,Norway,Spain,Sweden and UK, Multi-ethnic
35 - 70 1229
Populationcancerregistries andother
FFQ + recallProspectiveCohort
75685 6.4 years Recent alcohol intake g/day
Invasive breast cancer Post-menop& HRTnonusers
10.0(continuous)
11.06(1.01, 1.1)
B C D F G
incidence
Tjonneland etal.,2007,BRE80013
Denmark,France,Germany,Greece,Italy,TheNetherlands,Norway,Spain,Sweden and UK, Multi-ethnic
35 - 70 973
Populationcancerregistries andother
FFQ + recallProspectiveCohort
36460 6.4 years Recent alcohol intake g/day
Invasive breast cancerPost-menop& HRT users
10.0(continuous)
11.03(0.99, 1.08)
B C D F G
incidence
Tjonneland etal.,2007,BRE80013
Denmark,France,Germany,Greece,Italy,TheNetherlands,Norway,Spain,Sweden and UK, Multi-ethnic
35 - 70 1202
Populationcancerregistries andother
FFQ + recallProspectiveCohort
112145 6.4 years Recent alcohol intake g/day
Invasive breast cancerpostmenopausal women
10.0(continuous)
11.04(1.01, 1.07)
B C D F G
incidence
Menopausal status not specified
Schatzkin,A.,1989,BRE18013
U.S.A., Not specifiedFramingham Study, 1948
31 - 64 141Generalpopulation(survey)
Interview (nos)ProspectiveCohort
2636.0 26.0 years / 86.2 g/day
Breast cancer >=5.0vs.None
40.8(0.5, 1.2)
0.41 A B C D F G
incidence
Tjonneland etal.,2007,BRE80013
Denmark,France,Germany,Greece,Italy,TheNetherlands,Norway,Spain,Sweden and UK, Multi-ethnic
35 - 70 695
Populationcancerregistries andother
FFQ + recallProspectiveCohort
43272 6.4 years Recent alcohol intake g/day
Invasive breast cancerperimenopausal women
10.0(continuous)
10.98(0.93, 1.04)
B C D F G
incidence
Alcohol (as ethanol) at 18-22 yrs
Pre-menopausal
Horn-Ross,P.L.,2004,BRE15413
USA, Not specified,Registered teachersCalifornia Teachers Study,1995
- 84 285
Through socialorganization(profession,religion)
FFQ (nos)ProspectiveCohort
167116 5.0 years g/day
Invasive breast cancerPre-menopausal
>= 20vs.Nondrinkers
60.62(0.34, 1.13)
A C D E F G
incidence
Post-menopausal
Horn-Ross,P.L.,2004,BRE15413
USA, Not specified,Registered teachersCalifornia Teachers Study,1995
- 84 906
Through socialorganization(profession,religion)
FFQ (nos)ProspectiveCohort
183204 5.0 years g/day
Invasive breast cancerPost-menopausal
>= 20vs.Nondrinkers
61.07(0.72, 1.58)
A C D E F G
incidence
Alcohol (as ethanol) at 30-35 yrs
Pre-menopausal
Horn-Ross,P.L.,2004,BRE15413
USA, Not specified,Registered teachersCalifornia Teachers Study,1995
- 84 261
Through socialorganization(profession,religion)
FFQ (nos)ProspectiveCohort
122187 5.0 years g/day
Invasive breast cancerPre-menopausal
>= 20vs.Nondrinkers
60.91(0.53, 1.57)
A C D E F G
incidence
Post-menopausal
197

Author, Year,WCRF Code
Country, Ethnicity, Specialcharacteristics
Age Cases n Caseascertainment
Type of studyNon-Cases n
Lenght offollow-up / loss
Assessmentdetail
Additional details Unit Outcome Subgroup Contrast Nocat. OR (95% CI) p
valueptrend A B C D E F G
adjustments
Horn-Ross,P.L.,2004,BRE15413
USA, Not specified,Registered teachersCalifornia Teachers Study,1995
- 84 906
Through socialorganization(profession,religion)
FFQ (nos)ProspectiveCohort
182539 5.0 years g/day
Invasive breast cancerPost-menopausal
>= 20vs.Nondrinkers
61.2(0.93, 1.55)
A C D E F G
incidence
Alcohol (as ethanol) at Fifties
Post-menopausal
Tjonneland,A.,2004,BRE12349
Denmark, Not specified,Post-menopausalDiet, Cancer and Health,1993
50 - 65Direct contactat home
FFQ (nos)ProspectiveCohort
23683.0 4.7 years g/day
Breast cancerPost-menopausal
10.0(continuous)
11.12(1.05, 1.19)
A B C D F G
incidence
Alcohol (as ethanol) at Forties
Post-menopausal
Tjonneland,A.,2004,BRE12349
Denmark, Not specified,Post-menopausalDiet, Cancer and Health,1993
50 - 65Direct contactat home
FFQ (nos)ProspectiveCohort
23683.0 4.7 years g/day
Breast cancerPost-menopausal
10.0(continuous)
11.08(1.01, 1.15)
A B C D F G
incidence
Ethanol from beer
Pre-menopausal
Friedenreich, C.M.,1993,BRE17508
Canada, Not specified,Screening ProgramNBSS, 1980
235
Through healthorg. (screening,healthinsurance)
FFQ (nos)Nested CaseControl
491 5.5 years g/day
Breast cancerPre-menopausal
>=10vs.Nondrinkersof specified
32.06(0.91, 4.68)
A C E F G
incidence
Post-menopausal
Friedenreich, C.M.,1993,BRE17508
Canada, Not specified,Screening ProgramNBSS, 1980
284
Through healthorg. (screening,healthinsurance)
FFQ (nos)Nested CaseControl
691 5.5 years g/day
Breast cancerPost-menopausal
>=10vs.Nondrinkersof specified
30.58(0.23, 1.46)
A C E F G
incidence
van den Brandt, P.A.,1995,BRE12719
the Netherlands, Notspecified, Post-menopausalThe Netherlands CohortStudy on diet and cancer,
55 - 69 422 By MailQuestionnaire(nos)
Case Cohort 62573.0 3.3 years g/day
Breast cancerPost-menopausal
1.0(continuous)
10.93(0.82, 1.05)
A B C D E F G
incidence
Tjonneland,A.,2003,BRE12350
Denmark, Not specified,Post-menopausalDiet, Cancer and Health,1993
50 - 64 By Mail FFQ (nos)ProspectiveCohort
23778.0 4.7 yearsexcluded abstainersand occasionaldrinkers
g/day
Breast cancerPost-menopausal
10.0(continuous)
11.01(0.87, 1.17)
A B C D F G
incidence
Menopausal status not specified
Willett, W.C.,1987,BRE13441
U.S.A., Not specified,Registered nursesNurses' Health Study (NHS)Cohort 1976-1996
34 - 59 327 By MailFFQ-Semi-quantitative
ProspectiveCohort
47536 4.0 years g/day
Breast cancer >=5.0vs.none
31.5(1.2, 2.0)
A
incidence
Friedenreich, C.M.,1993,BRE17508
Canada, Not specified,Screening ProgramNBSS, 1980
519
Through healthorg. (screening,healthinsurance)
FFQ (nos)Nested CaseControl
1182 5.5 years g/day
Breast cancer>=10vs.Nondrinkersof specified
31.12(0.62, 2.02)
A C E F G
incidence
198

Author, Year,WCRF Code
Country, Ethnicity, Specialcharacteristics
Age Cases n Caseascertainment
Type of studyNon-Cases n
Lenght offollow-up / loss
Assessmentdetail
Additional details Unit Outcome Subgroup Contrast Nocat. OR (95% CI) p
valueptrend A B C D E F G
adjustments
Jain,M.G.,2000,BRE17653
Canada, Not specified,Screening ProgramNBSS, 1980
40 - 59 223
Through healthorg. (screening,healthinsurance)
FFQ-Quantitative
ProspectiveCohort
49165.0 10.3 years g/day
Breast cancer10.0(continuous)
11.015(0.992,1.038)
A B C D E F G
cancer death
Rohan,T.E.,2000,BRE16489
Canada, Not specified,Screening ProgramNBSS, 1980
40 - 59 1336
Through healthorg. (screening,healthinsurance)
FFQ-Quantitative
Case Cohort 566190 10.0 years g/day
Breast cancer >20vs.0
40.76(0.37, 1.58)
0.88 A C E F G
incidence
Horn-Ross,P.L.,2002,BRE15412
USA, Multi-ethnic,Registered teachersCalifornia Teachers Study,1995
21 - 103 681 By Mail FFQ (nos)ProspectiveCohort
111383.0 2.0 years g/day
Invasive breast cancer >=5vs.non drinkers
30.9(0.5, 1.6)
0.2 A C D E F G
incidence
Ethanol from hard liquor
Pre-menopausal
Friedenreich, C.M.,1993,BRE17508
Canada, Not specified,Screening ProgramNBSS, 1980
235
Through healthorg. (screening,healthinsurance)
FFQ (nos)Nested CaseControl
491 5.5 years g/day
Breast cancerPre-menopausal
>=10vs.Nondrinkersof specified
31.21(0.75, 1.96)
A C E F G
incidence
Post-menopausal
Friedenreich, C.M.,1993,BRE17508
Canada, Not specified,Screening ProgramNBSS, 1980
284
Through healthorg. (screening,healthinsurance)
FFQ (nos)Nested CaseControl
691 5.5 years g/day
Breast cancerPost-menopausal
>=10vs.Nondrinkersof specified
31.0(0.64, 1.56)
A C E F G
incidence
van den Brandt, P.A.,1995,BRE12719
the Netherlands, Notspecified, Post-menopausalThe Netherlands CohortStudy on diet and cancer,
55 - 69 422 By MailQuestionnaire(nos)
Case Cohort 62573.0 3.3 years g/day
Breast cancerPost-menopausal
1.0(continuous)
11.02(0.99, 1.04)
A B C D E F G
incidence
Tjonneland,A.,2003,BRE12350
Denmark, Not specified,Post-menopausalDiet, Cancer and Health,1993
50 - 64 By Mail FFQ (nos)ProspectiveCohort
23778.0 4.7 yearsexcluded abstainersand occasionaldrinkers
g/day
Breast cancerPost-menopausal
10.0(continuous)
11.15(0.92, 1.43)
A B C D F G
incidence
Menopausal status not specified
Willett, W.C.,1987,BRE13441
U.S.A., Not specified,Registered nursesNurses' Health Study (NHS)Cohort 1976-1996
34 - 59 447 By MailFFQ-Semi-quantitative
ProspectiveCohort
66936 4.0 years g/day
Breast cancer >=5.0vs.none
31.5(1.2, 1.9)
A
incidence
Friedenreich, C.M.,1993,BRE17508
Canada, Not specified,Screening ProgramNBSS, 1980
519
Through healthorg. (screening,healthinsurance)
FFQ (nos)Nested CaseControl
1182 5.5 years g/day
Breast cancer>=10vs.Nondrinkersof specified
31.1(0.79, 1.52)
A C E F G
incidence
Jain,M.G.,2000,BRE17653
Canada, Not specified,Screening ProgramNBSS, 1980
40 - 59
Through healthorg. (screening,healthinsurance)
FFQ-Quantitative
ProspectiveCohort
49165.0 10.3 years g/day
Breast cancer10.0(continuous)
10.984(0.973,0.996)
A B C D E F G
cancer death
Rohan,T.E.,2000,BRE16489
Canada, Not specified,Screening ProgramNBSS, 1980
40 - 59 1336
Through healthorg. (screening,healthinsurance)
FFQ-Quantitative
Case Cohort 566190 10.0 years g/day
Breast cancer >20vs.0
41.42(0.96, 2.11)
0.03 A C E F G
incidence
199

Author, Year,WCRF Code
Country, Ethnicity, Specialcharacteristics
Age Cases n Caseascertainment
Type of studyNon-Cases n
Lenght offollow-up / loss
Assessmentdetail
Additional details Unit Outcome Subgroup Contrast Nocat. OR (95% CI) p
valueptrend A B C D E F G
adjustments
Horn-Ross,P.L.,2002,BRE15412
USA, Multi-ethnic,Registered teachersCalifornia Teachers Study,1995
21 - 103 681 By Mail FFQ (nos)ProspectiveCohort
111383.0 2.0 years g/day
Invasive breast cancer >=20vs.non drinkers
41.7(1.0, 2.8)
0.002
A C D E F G
incidence
Ethanol from wine
Pre-menopausal
Friedenreich, C.M.,1993,BRE17508
Canada, Not specified,Screening ProgramNBSS, 1980
235
Through healthorg. (screening,healthinsurance)
FFQ (nos)Nested CaseControl
491 5.5 years g/day
Breast cancerPre-menopausal
>=10vs.Nondrinkersof specified
31.99(1.15, 3.43)
A C E F G
incidence
Post-menopausal
Friedenreich, C.M.,1993,BRE17508
Canada, Not specified,Screening ProgramNBSS, 1980
284
Through healthorg. (screening,healthinsurance)
FFQ (nos)Nested CaseControl
691 5.5 years g/day
Breast cancerPost-menopausal
>=10vs.Nondrinkersof specified
31.1(0.62, 1.94)
A C E F G
incidence
van den Brandt, P.A.,1995,BRE12719
the Netherlands, Notspecified, Post-menopausalThe Netherlands CohortStudy on diet and cancer,
55 - 69 422 By MailQuestionnaire(nos)
Case Cohort 62573.0 3.3 years g/day
Breast cancerPost-menopausal
1.0(continuous)
11.01(0.99, 1.02)
A B C D E F G
incidence
Tjonneland,A.,2003,BRE12350
Denmark, Not specified,Post-menopausalDiet, Cancer and Health,1993
50 - 64 By Mail FFQ (nos)ProspectiveCohort
23778.0 4.7 yearsexcluded abstainersand occasionaldrinkers
g/day
Breast cancerPost-menopausal
10.0(continuous)
11.14(1.06, 1.22)
A B C D F G
incidence
Menopausal status not specified
Willett, W.C.,1987,BRE13441
U.S.A., Not specified,Registered nursesNurses' Health Study (NHS)Cohort 1976-1996
34 - 59 496 By MailFFQ-Semi-quantitative
ProspectiveCohort
77605 4.0 years g/day
Breast cancer >=5.0vs.none
31.4(1.1, 1.8)
A
incidence
Friedenreich, C.M.,1993,BRE17508
Canada, Not specified,Screening ProgramNBSS, 1980
519
Through healthorg. (screening,healthinsurance)
FFQ (nos)Nested CaseControl
1182 5.5 years g/day
Breast cancer>=10vs.Nondrinkersof specified
31.46(0.99, 2.14)
A C E F G
incidence
Jain,M.G.,2000,BRE17653
Canada, Not specified,Screening ProgramNBSS, 1980
40 - 59
Through healthorg. (screening,healthinsurance)
FFQ-Quantitative
ProspectiveCohort
49165.0 10.3 years g/day
Breast cancer10.0(continuous)
11.042(1.031,1.052)
A B C D E F G
cancer death
Rohan,T.E.,2000,BRE16489
Canada, Not specified,Screening ProgramNBSS, 1980
40 - 59 1336
Through healthorg. (screening,healthinsurance)
FFQ-Quantitative
Case Cohort 566191 10.0 years g/day
Breast cancer >20vs.0
40.79(0.53, 1.19)
0.78 A C E F G
incidence
Horn-Ross,P.L.,2002,BRE15412
USA, Multi-ethnic,Registered teachersCalifornia Teachers Study,1995
21 - 103 681 By Mail FFQ (nos)ProspectiveCohort
111383.0 2.0 years g/day
Invasive breast cancer >=20vs.non drinkers
41.7(1.2, 2.4)
0.002
A C D E F G
incidence
5.5
Vitamin B
Pre-menopausal
200
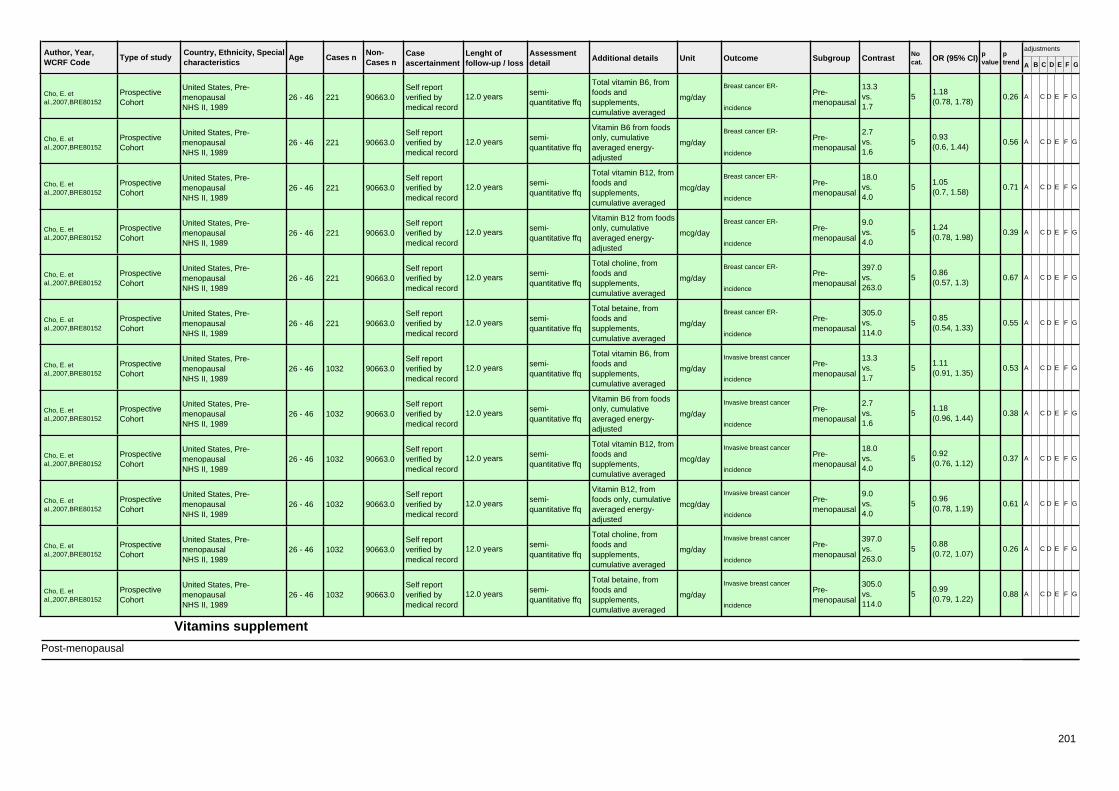
Author, Year,WCRF Code
Country, Ethnicity, Specialcharacteristics
Age Cases n Caseascertainment
Type of studyNon-Cases n
Lenght offollow-up / loss
Assessmentdetail
Additional details Unit Outcome Subgroup Contrast Nocat. OR (95% CI) p
valueptrend A B C D E F G
adjustments
Cho, E. etal.,2007,BRE80152
United States, Pre-menopausalNHS II, 1989
26 - 46 221Self reportverified bymedical record
semi-quantitative ffq
ProspectiveCohort
90663.0 12.0 years
Total vitamin B6, fromfoods andsupplements,cumulative averaged
mg/day
Breast cancer ER-Pre-menopausal
13.3vs.1.7
51.18(0.78, 1.78)
0.26 A C D E F G
incidence
Cho, E. etal.,2007,BRE80152
United States, Pre-menopausalNHS II, 1989
26 - 46 221Self reportverified bymedical record
semi-quantitative ffq
ProspectiveCohort
90663.0 12.0 years
Vitamin B6 from foodsonly, cumulativeaveraged energy-adjusted
mg/day
Breast cancer ER-Pre-menopausal
2.7vs.1.6
50.93(0.6, 1.44)
0.56 A C D E F G
incidence
Cho, E. etal.,2007,BRE80152
United States, Pre-menopausalNHS II, 1989
26 - 46 221Self reportverified bymedical record
semi-quantitative ffq
ProspectiveCohort
90663.0 12.0 years
Total vitamin B12, fromfoods andsupplements,cumulative averaged
mcg/day
Breast cancer ER-Pre-menopausal
18.0vs.4.0
51.05(0.7, 1.58)
0.71 A C D E F G
incidence
Cho, E. etal.,2007,BRE80152
United States, Pre-menopausalNHS II, 1989
26 - 46 221Self reportverified bymedical record
semi-quantitative ffq
ProspectiveCohort
90663.0 12.0 years
Vitamin B12 from foodsonly, cumulativeaveraged energy-adjusted
mcg/day
Breast cancer ER-Pre-menopausal
9.0vs.4.0
51.24(0.78, 1.98)
0.39 A C D E F G
incidence
Cho, E. etal.,2007,BRE80152
United States, Pre-menopausalNHS II, 1989
26 - 46 221Self reportverified bymedical record
semi-quantitative ffq
ProspectiveCohort
90663.0 12.0 years
Total choline, fromfoods andsupplements,cumulative averaged
mg/day
Breast cancer ER-Pre-menopausal
397.0vs.263.0
50.86(0.57, 1.3)
0.67 A C D E F G
incidence
Cho, E. etal.,2007,BRE80152
United States, Pre-menopausalNHS II, 1989
26 - 46 221Self reportverified bymedical record
semi-quantitative ffq
ProspectiveCohort
90663.0 12.0 years
Total betaine, fromfoods andsupplements,cumulative averaged
mg/day
Breast cancer ER-Pre-menopausal
305.0vs.114.0
50.85(0.54, 1.33)
0.55 A C D E F G
incidence
Cho, E. etal.,2007,BRE80152
United States, Pre-menopausalNHS II, 1989
26 - 46 1032Self reportverified bymedical record
semi-quantitative ffq
ProspectiveCohort
90663.0 12.0 years
Total vitamin B6, fromfoods andsupplements,cumulative averaged
mg/day
Invasive breast cancerPre-menopausal
13.3vs.1.7
51.11(0.91, 1.35)
0.53 A C D E F G
incidence
Cho, E. etal.,2007,BRE80152
United States, Pre-menopausalNHS II, 1989
26 - 46 1032Self reportverified bymedical record
semi-quantitative ffq
ProspectiveCohort
90663.0 12.0 years
Vitamin B6 from foodsonly, cumulativeaveraged energy-adjusted
mg/day
Invasive breast cancerPre-menopausal
2.7vs.1.6
51.18(0.96, 1.44)
0.38 A C D E F G
incidence
Cho, E. etal.,2007,BRE80152
United States, Pre-menopausalNHS II, 1989
26 - 46 1032Self reportverified bymedical record
semi-quantitative ffq
ProspectiveCohort
90663.0 12.0 years
Total vitamin B12, fromfoods andsupplements,cumulative averaged
mcg/day
Invasive breast cancerPre-menopausal
18.0vs.4.0
50.92(0.76, 1.12)
0.37 A C D E F G
incidence
Cho, E. etal.,2007,BRE80152
United States, Pre-menopausalNHS II, 1989
26 - 46 1032Self reportverified bymedical record
semi-quantitative ffq
ProspectiveCohort
90663.0 12.0 years
Vitamin B12, fromfoods only, cumulativeaveraged energy-adjusted
mcg/day
Invasive breast cancerPre-menopausal
9.0vs.4.0
50.96(0.78, 1.19)
0.61 A C D E F G
incidence
Cho, E. etal.,2007,BRE80152
United States, Pre-menopausalNHS II, 1989
26 - 46 1032Self reportverified bymedical record
semi-quantitative ffq
ProspectiveCohort
90663.0 12.0 years
Total choline, fromfoods andsupplements,cumulative averaged
mg/day
Invasive breast cancerPre-menopausal
397.0vs.263.0
50.88(0.72, 1.07)
0.26 A C D E F G
incidence
Cho, E. etal.,2007,BRE80152
United States, Pre-menopausalNHS II, 1989
26 - 46 1032Self reportverified bymedical record
semi-quantitative ffq
ProspectiveCohort
90663.0 12.0 years
Total betaine, fromfoods andsupplements,cumulative averaged
mg/day
Invasive breast cancerPre-menopausal
305.0vs.114.0
50.99(0.79, 1.22)
0.88 A C D E F G
incidence
Vitamins supplement
Post-menopausal
201
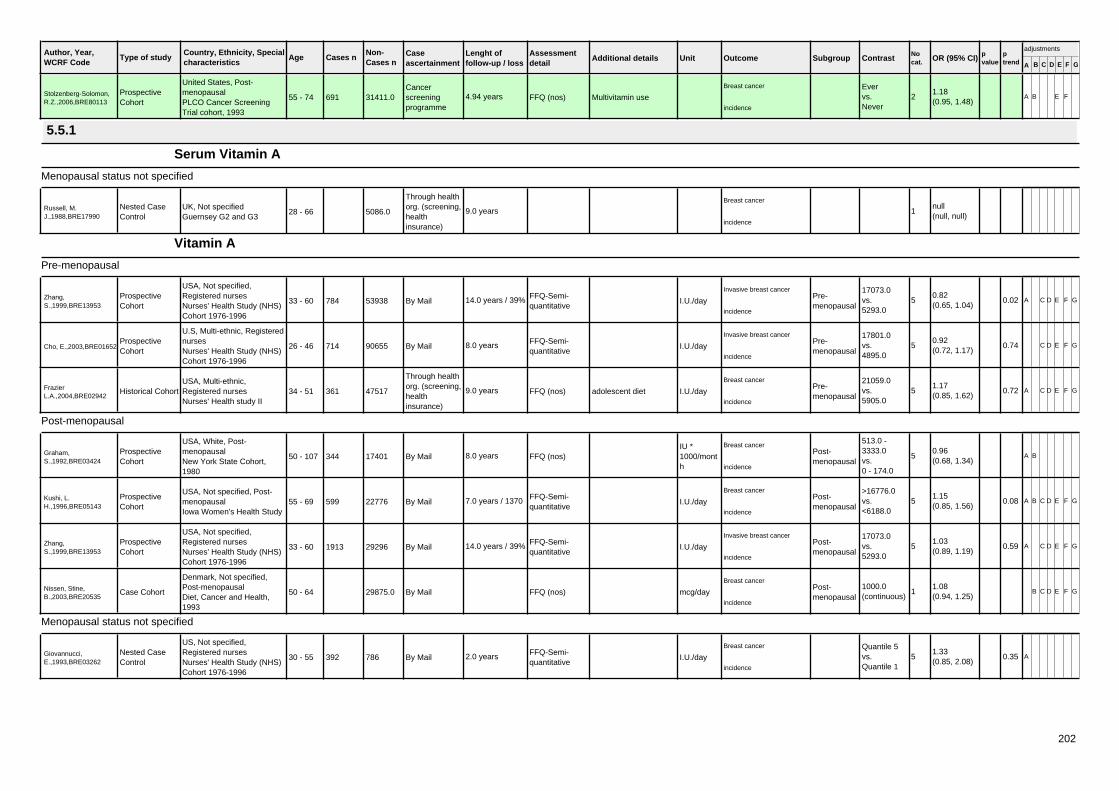
Author, Year,WCRF Code
Country, Ethnicity, Specialcharacteristics
Age Cases n Caseascertainment
Type of studyNon-Cases n
Lenght offollow-up / loss
Assessmentdetail
Additional details Unit Outcome Subgroup Contrast Nocat. OR (95% CI) p
valueptrend A B C D E F G
adjustments
Stolzenberg-Solomon,R.Z.,2006,BRE80113
United States, Post-menopausalPLCO Cancer ScreeningTrial cohort, 1993
55 - 74 691Cancerscreeningprogramme
FFQ (nos)ProspectiveCohort
31411.0 4.94 years Multivitamin use
Breast cancer Evervs.Never
21.18(0.95, 1.48)
A B E F
incidence
5.5.1
Serum Vitamin A
Menopausal status not specified
Russell, M.J.,1988,BRE17990
UK, Not specifiedGuernsey G2 and G3
28 - 66
Through healthorg. (screening,healthinsurance)
Nested CaseControl
5086.0 9.0 yearsBreast cancer
1null(null, null)
incidence
Vitamin A
Pre-menopausal
Zhang,S.,1999,BRE13953
USA, Not specified,Registered nursesNurses' Health Study (NHS)Cohort 1976-1996
33 - 60 784 By MailFFQ-Semi-quantitative
ProspectiveCohort
53938 14.0 years / 39% I.U./day
Invasive breast cancerPre-menopausal
17073.0vs.5293.0
50.82(0.65, 1.04)
0.02 A C D E F G
incidence
Cho, E.,2003,BRE01652
U.S, Multi-ethnic, RegisterednursesNurses' Health Study (NHS)Cohort 1976-1996
26 - 46 714 By MailFFQ-Semi-quantitative
ProspectiveCohort
90655 8.0 years I.U./day
Invasive breast cancerPre-menopausal
17801.0vs.4895.0
50.92(0.72, 1.17)
0.74 C D E F G
incidence
FrazierL.A.,2004,BRE02942
USA, Multi-ethnic,Registered nursesNurses' Health study II
34 - 51 361
Through healthorg. (screening,healthinsurance)
FFQ (nos)Historical Cohort 47517 9.0 years adolescent diet I.U./day
Breast cancerPre-menopausal
21059.0vs.5905.0
51.17(0.85, 1.62)
0.72 A C D E F G
incidence
Post-menopausal
Graham,S.,1992,BRE03424
USA, White, Post-menopausalNew York State Cohort,1980
50 - 107 344 By Mail FFQ (nos)ProspectiveCohort
17401 8.0 yearsIU *1000/month
Breast cancerPost-menopausal
513.0 -3333.0vs.0 - 174.0
50.96(0.68, 1.34)
A B
incidence
Kushi, L.H.,1996,BRE05143
USA, Not specified, Post-menopausalIowa Women's Health Study
55 - 69 599 By MailFFQ-Semi-quantitative
ProspectiveCohort
22776 7.0 years / 1370 I.U./day
Breast cancerPost-menopausal
>16776.0vs.<6188.0
51.15(0.85, 1.56)
0.08 A B C D E F G
incidence
Zhang,S.,1999,BRE13953
USA, Not specified,Registered nursesNurses' Health Study (NHS)Cohort 1976-1996
33 - 60 1913 By MailFFQ-Semi-quantitative
ProspectiveCohort
29296 14.0 years / 39% I.U./day
Invasive breast cancerPost-menopausal
17073.0vs.5293.0
51.03(0.89, 1.19)
0.59 A C D E F G
incidence
Nissen, Stine,B.,2003,BRE20535
Denmark, Not specified,Post-menopausalDiet, Cancer and Health,1993
50 - 64 By Mail FFQ (nos)Case Cohort 29875.0 mcg/day
Breast cancerPost-menopausal
1000.0(continuous)
11.08(0.94, 1.25)
B C D E F G
incidence
Menopausal status not specified
Giovannucci,E.,1993,BRE03262
US, Not specified,Registered nursesNurses' Health Study (NHS)Cohort 1976-1996
30 - 55 392 By MailFFQ-Semi-quantitative
Nested CaseControl
786 2.0 years I.U./day
Breast cancer Quantile 5vs.Quantile 1
51.33(0.85, 2.08)
0.35 A
incidence
202

Author, Year,WCRF Code
Country, Ethnicity, Specialcharacteristics
Age Cases n Caseascertainment
Type of studyNon-Cases n
Lenght offollow-up / loss
Assessmentdetail
Additional details Unit Outcome Subgroup Contrast Nocat. OR (95% CI) p
valueptrend A B C D E F G
adjustments
Rohan, T.E.,1993,BRE17965
Canada, Not specified,Screening ProgramCanadian National BreastScreening Study
40 - 59
Through healthorg. (screening,healthinsurance)
Dietary Historyquestionnaire
Nested CaseControl
56837.0 6.0 years I.U./day
Breast cancer8003.0(continuous)
10.83(0.7, 0.98)
A B C E F G
incidence
Hunter, D.J.,1993,BRE04168
USA, Not specified,Registered nursesNurses' Health Study (NHS)Cohort 1976-1996
30 - 55 1439 By MailFFQ-Semi-quantitative
ProspectiveCohort
692675 8.0 years / 4% I.U./day
Invasive breast cancer >17640.0vs.<6629.0
50.84(0.71, 0.98)
0.001
A C D E F G
incidence
Zhang,S.,1999,BRE13953
USA, Not specified,Registered nursesNurses' Health Study (NHS)Cohort 1976-1996
33 - 60 689 By MailFFQ-Semi-quantitative
ProspectiveCohort
83234.0 14.0 years / 39% I.U./day
Invasive breast cancer FamilyHistory BC -No & Pre-menopausal
17073.0vs.5293.0
50.92(0.72, 1.17)
0.23 A C D E F G
incidence
Zhang,S.,1999,BRE13953
USA, Not specified,Registered nursesNurses' Health Study (NHS)Cohort 1976-1996
33 - 60 90 By MailFFQ-Semi-quantitative
ProspectiveCohort
83234.0 14.0 years / 39% I.U./day
Invasive breast cancer FamilyHistory BC -Yes & Pre-menopausal
17073.0vs.5293.0
50.38(0.19, 0.77)
0.0099
A C D E F G
incidence
FrazierL.A.,2003,BRE02941
USA, Multi-ethnic,Registered nursesNurses' Health Study (NHS)Cohort 1976-1996
40 - 65
Through healthorg. (screening,healthinsurance)
FFQ (nos)Nested CaseControl
121700.0 10.0 years adolescent I.U./day
Breast cancer 11437.0vs.2063.0
51.02(null, null)
0.63 A C D E F G
incidence
Vitamin A diet+supplement
Pre-menopausal
Zhang,S.,1999,BRE13953
USA, Not specified,Registered nursesNurses' Health Study (NHS)Cohort 1976-1996
33 - 60 784 By MailFFQ-Semi-quantitative
ProspectiveCohort
53938 14.0 years / 39% I.U./day
Invasive breast cancerPre-menopausal
21379.0vs.5873.0
50.87(0.7, 1.09)
0.07 A C D E F G
incidence
Cho, E.,2003,BRE01652
U.S, Multi-ethnic, RegisterednursesNurses' Health Study (NHS)Cohort 1976-1996
26 - 46 714 By MailFFQ-Semi-quantitative
ProspectiveCohort
90655 8.0 years I.U./day
Invasive breast cancerPre-menopausal
21916.0vs.5639.0
50.97(0.76, 1.23)
0.97 C D E F G
incidence
Post-menopausal
Kushi, L.H.,1996,BRE05143
USA, Not specified, Post-menopausalIowa Women's Health Study
55 - 69 879 By MailFFQ-Semi-quantitative
ProspectiveCohort
34387 7.0 years / 1370 I.U./day
Breast cancerPost-menopausal
>20343.0vs.<7253.0
50.88(0.68, 1.14)
0.96 A B C D E F G
incidence
Zhang,S.,1999,BRE13953
USA, Not specified,Registered nursesNurses' Health Study (NHS)Cohort 1976-1996
33 - 60 1913 By MailFFQ-Semi-quantitative
ProspectiveCohort
29296 14.0 years / 39% I.U./day
Invasive breast cancerPost-menopausal
21379.0vs.5873.0
51.03(0.89, 1.2)
0.98 A C D E F G
incidence
Nissen, Stine,B.,2003,BRE20535
Denmark, Not specified,Post-menopausalDiet, Cancer and Health,1993
50 - 64 By Mail FFQ (nos)Case Cohort 29875.0 mcg/day
Breast cancerPost-menopausal
1000.0(continuous)
11.06(0.96, 1.18)
B C D E F G
incidence
Menopausal status not specified
Hunter, D.J.,1993,BRE04168
USA, Not specified,Registered nursesNurses' Health Study (NHS)Cohort 1976-1996
30 - 55 1439 By MailFFQ-Semi-quantitative
ProspectiveCohort
692675 8.0 years / 4% Preformed vitaminA+supplements
I.U./day
Invasive breast cancer >7460.0vs.<1530.0
50.8(0.68, 0.95)
0.003
A C D E F G
incidence
203

Author, Year,WCRF Code
Country, Ethnicity, Specialcharacteristics
Age Cases n Caseascertainment
Type of studyNon-Cases n
Lenght offollow-up / loss
Assessmentdetail
Additional details Unit Outcome Subgroup Contrast Nocat. OR (95% CI) p
valueptrend A B C D E F G
adjustments
Zhang,S.,1999,BRE13953
USA, Not specified,Registered nursesNurses' Health Study (NHS)Cohort 1976-1996
33 - 60 689 By MailFFQ-Semi-quantitative
ProspectiveCohort
83234.0 14.0 years / 39% I.U./day
Invasive breast cancer FamilyHistory BC -No & Pre-menopausal
21379.0vs.5873.0
50.96(0.76, 1.22)
0.34 A C D E F G
incidence
Zhang,S.,1999,BRE13953
USA, Not specified,Registered nursesNurses' Health Study (NHS)Cohort 1976-1996
33 - 60 90 By MailFFQ-Semi-quantitative
ProspectiveCohort
83234.0 14.0 years / 39% I.U./day
Invasive breast cancer FamilyHistory BC -Yes & Pre-menopausal
21379.0vs.5873.0
50.41(0.2, 0.84)
0.01 A C D E F G
incidence
Vitamin A supplement
Post-menopausal
Kushi, L.H.,1996,BRE05143
USA, Not specified, Post-menopausalIowa Women's Health Study
55 - 69 879 By MailFFQ-Semi-quantitative
ProspectiveCohort
34387 7.0 years / 1370 I.U./day
Breast cancerPost-menopausal
>10001.0vs.<0.0
40.71(0.47, 1.06)
0.35 A B C D E F G
incidence
Nissen, Stine,B.,2003,BRE20535
Denmark, Not specified,Post-menopausalDiet, Cancer and Health,1993
50 - 64 By Mail FFQ (nos)Case Cohort 29875.0 mcg/day
Breast cancerPost-menopausal
1000.0(continuous)
11.16(0.87, 1.55)
B C D E F G
incidence
Menopausal status not specified
Rohan, T.E.,1993,BRE17965
Canada, Not specified,Screening ProgramCanadian National BreastScreening Study
40 - 59 519
Through healthorg. (screening,healthinsurance)
Dietary Historyquestionnaire
Nested CaseControl
1182 6.0 years I.U./day
Breast cancer >5000.1vs.0
30.7(0.42, 1.15)
0.420
A B C E F G
incidence
Hunter, D.J.,1993,BRE04168
USA, Not specified,Registered nursesNurses' Health Study (NHS)Cohort 1976-1996
30 - 55 By MailFFQ-Semi-quantitative
ProspectiveCohort
89494.0 8.0 years / 4% I.U./day
Invasive breast cancer >=23000vs.No use
50.44(0.14, 1.38)
0.76 A C D E F G
incidence
Hunter, D.J.,1993,BRE04168
USA, Not specified,Registered nursesNurses' Health Study (NHS)Cohort 1976-1996
30 - 55 By MailFFQ-Semi-quantitative
ProspectiveCohort
89494.0 8.0 years / 4% supplement duration Years/life
Invasive breast cancer >=10vs.no use
51.16(0.64, 2.1)
0.85 A C D E F G
incidence
Zhang,S.,1999,BRE13953
USA, Not specified,Registered nursesNurses' Health Study (NHS)Cohort 1976-1996
33 - 60 2523 By MailFFQ-Semi-quantitative
ProspectiveCohort
77925 14.0 years / 39% I.U./day
Invasive breast cancer >=23000vs.never user
50.49(0.2, 1.18)
A C D E F G
incidence
5.5.1.1
Plasma Retinol
Pre-menopausal
Hulten,2001,BRE04155swedenVIP + MONICA + MSP
57 UnspecifiedNested CaseControl
93
Breast cancerPre-menopausal
>1.0vs.>-1.0
40.8(0.2, 3.3)
0.98 D
incidence
Post-menopausal
Hulten,2001,BRE04155swedenVIP + MONICA + MSP
67 UnspecifiedNested CaseControl
109
Breast sarcomaPost-menopausal
>1.0vs.>-1.0
40.6(0.2, 1.2)
0.31 D
incidence
204
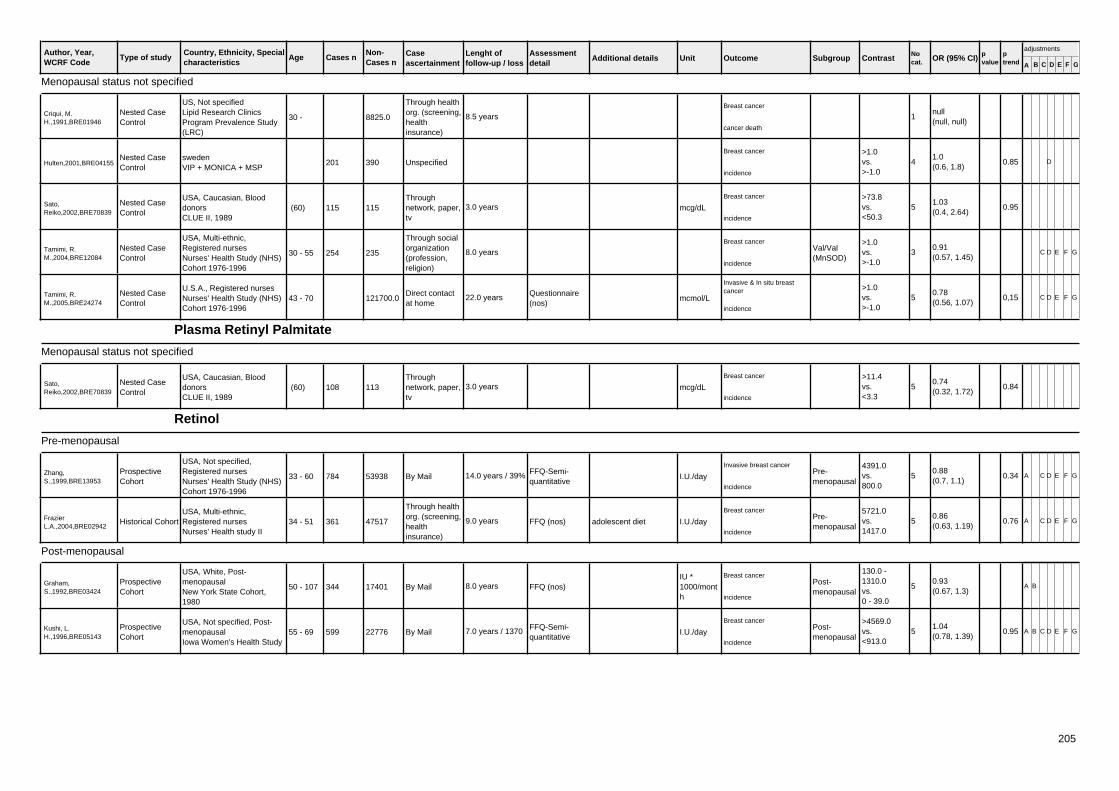
Author, Year,WCRF Code
Country, Ethnicity, Specialcharacteristics
Age Cases n Caseascertainment
Type of studyNon-Cases n
Lenght offollow-up / loss
Assessmentdetail
Additional details Unit Outcome Subgroup Contrast Nocat. OR (95% CI) p
valueptrend A B C D E F G
adjustments
Menopausal status not specified
Criqui, M.H.,1991,BRE01946
US, Not specifiedLipid Research ClinicsProgram Prevalence Study(LRC)
30 -
Through healthorg. (screening,healthinsurance)
Nested CaseControl
8825.0 8.5 yearsBreast cancer
1null(null, null)
cancer death
Hulten,2001,BRE04155swedenVIP + MONICA + MSP
201 UnspecifiedNested CaseControl
390
Breast cancer >1.0vs.>-1.0
41.0(0.6, 1.8)
0.85 D
incidence
Sato,Reiko,2002,BRE70839
USA, Caucasian, BlooddonorsCLUE II, 1989
(60) 115Throughnetwork, paper,tv
Nested CaseControl
115 3.0 years mcg/dL
Breast cancer >73.8vs.<50.3
51.03(0.4, 2.64)
0.95incidence
Tamimi, R.M.,2004,BRE12084
USA, Multi-ethnic,Registered nursesNurses' Health Study (NHS)Cohort 1976-1996
30 - 55 254
Through socialorganization(profession,religion)
Nested CaseControl
235 8.0 yearsBreast cancer
Val/Val(MnSOD)
>1.0vs.>-1.0
30.91(0.57, 1.45)
C D E F G
incidence
Tamimi, R.M.,2005,BRE24274
U.S.A., Registered nursesNurses' Health Study (NHS)Cohort 1976-1996
43 - 70Direct contactat home
Questionnaire(nos)
Nested CaseControl
121700.0 22.0 years mcmol/L
Invasive & In situ breastcancer >1.0
vs.>-1.0
50.78(0.56, 1.07)
0,15 C D E F G
incidence
Plasma Retinyl Palmitate
Menopausal status not specified
Sato,Reiko,2002,BRE70839
USA, Caucasian, BlooddonorsCLUE II, 1989
(60) 108Throughnetwork, paper,tv
Nested CaseControl
113 3.0 years mcg/dL
Breast cancer >11.4vs.<3.3
50.74(0.32, 1.72)
0.84incidence
Retinol
Pre-menopausal
Zhang,S.,1999,BRE13953
USA, Not specified,Registered nursesNurses' Health Study (NHS)Cohort 1976-1996
33 - 60 784 By MailFFQ-Semi-quantitative
ProspectiveCohort
53938 14.0 years / 39% I.U./day
Invasive breast cancerPre-menopausal
4391.0vs.800.0
50.88(0.7, 1.1)
0.34 A C D E F G
incidence
FrazierL.A.,2004,BRE02942
USA, Multi-ethnic,Registered nursesNurses' Health study II
34 - 51 361
Through healthorg. (screening,healthinsurance)
FFQ (nos)Historical Cohort 47517 9.0 years adolescent diet I.U./day
Breast cancerPre-menopausal
5721.0vs.1417.0
50.86(0.63, 1.19)
0.76 A C D E F G
incidence
Post-menopausal
Graham,S.,1992,BRE03424
USA, White, Post-menopausalNew York State Cohort,1980
50 - 107 344 By Mail FFQ (nos)ProspectiveCohort
17401 8.0 yearsIU *1000/month
Breast cancerPost-menopausal
130.0 -1310.0vs.0 - 39.0
50.93(0.67, 1.3)
A B
incidence
Kushi, L.H.,1996,BRE05143
USA, Not specified, Post-menopausalIowa Women's Health Study
55 - 69 599 By MailFFQ-Semi-quantitative
ProspectiveCohort
22776 7.0 years / 1370 I.U./day
Breast cancerPost-menopausal
>4569.0vs.<913.0
51.04(0.78, 1.39)
0.95 A B C D E F G
incidence
205

Author, Year,WCRF Code
Country, Ethnicity, Specialcharacteristics
Age Cases n Caseascertainment
Type of studyNon-Cases n
Lenght offollow-up / loss
Assessmentdetail
Additional details Unit Outcome Subgroup Contrast Nocat. OR (95% CI) p
valueptrend A B C D E F G
adjustments
Zhang,S.,1999,BRE13953
USA, Not specified,Registered nursesNurses' Health Study (NHS)Cohort 1976-1996
33 - 60 1913 By MailFFQ-Semi-quantitative
ProspectiveCohort
29296 14.0 years / 39% I.U./day
Invasive breast cancerPost-menopausal
4391.0vs.800.0
51.05(0.91, 1.21)
0.63 A C D E F G
incidence
Menopausal status not specified
Giovannucci,E.,1993,BRE03262
US, Not specified,Registered nursesNurses' Health Study (NHS)Cohort 1976-1996
30 - 55 392 By MailFFQ-Semi-quantitative
Nested CaseControl
786 2.0 years I.U./day
Breast cancer Quantile 5vs.Quantile 1
51.25(0.82, 1.91)
0.14 A
incidence
Rohan, T.E.,1993,BRE17965
Canada, Not specified,Screening ProgramCanadian National BreastScreening Study
40 - 59
Through healthorg. (screening,healthinsurance)
Dietary Historyquestionnaire
Nested CaseControl
56837.0 6.0 years I.U./day
Breast cancer3273.0(continuous)
10.89(0.77, 1.03)
A B C E F G
incidence
Verhoeven, D.T.,1997,BRE12868
the Netherland, Not specifiedThe Netherlands CohortStudy on diet and cancer,1986-1993
55 - 69 519Throughnetwork, paper,tv
FFQ-Semi-quantitative
Case Cohort 58664.3 years / nolost mg/day
Invasive breast cancer 0.766vs.0.229
51.24(0.83, 1.83)
0.38 A C E F G
incidence
Zhang,S.,1999,BRE13953
USA, Not specified,Registered nursesNurses' Health Study (NHS)Cohort 1976-1996
33 - 60 689 By MailFFQ-Semi-quantitative
ProspectiveCohort
83234.0 14.0 years / 39% I.U./day
Invasive breast cancer FamilyHistory BC -No & Pre-menopausal
4391.0vs.800.0
50.92(0.72, 1.17)
0.63 A C D E F G
incidence
Zhang,S.,1999,BRE13953
USA, Not specified,Registered nursesNurses' Health Study (NHS)Cohort 1976-1996
33 - 60 90 By MailFFQ-Semi-quantitative
ProspectiveCohort
83234.0 14.0 years / 39% I.U./day
Invasive breast cancer FamilyHistory BC -Yes & Pre-menopausal
4391.0vs.800.0
50.62(0.31, 1.23)
0.19 A C D E F G
incidence
Michels, K.B.,2001,BRE17830
Sweden, Not specified,Screening ProgramValencia, 1997
40 - 76 717 By MailFFQ-Semi-quantitative
ProspectiveCohort
59039.0 130.0 months mg/day
Invasive breast cancer
Lean1.51vs.0.52
51.05(0.83, 1.33)
0.59 A B C D E F
incidence
Michels, K.B.,2001,BRE17830
Sweden, Not specified,Screening ProgramValencia, 1997
40 - 76 By MailFFQ-Semi-quantitative
ProspectiveCohort
59039.0 130.0 months mg/day
Invasive breast cancer 1.51vs.0.52
51.0(0.83, 1.2)
0.96 A B C D E F
incidence
Michels, K.B.,2001,BRE17830
Sweden, Not specified,Screening ProgramValencia, 1997
40 - 76 554 By MailFFQ-Semi-quantitative
ProspectiveCohort
59039.0 130.0 months mg/day
Invasive breast cancer
Overweight1.51vs.0.52
50.93(0.69, 1.24)
0.49 A B C D E F
incidence
FrazierL.A.,2003,BRE02941
USA, Multi-ethnic,Registered nursesNurses' Health Study (NHS)Cohort 1976-1996
40 - 65
Through healthorg. (screening,healthinsurance)
FFQ (nos)Nested CaseControl
121700.0 10.0 years adolescent I.U./day
Breast cancer 5542.0vs.612.0
51.05(null, null)
0.59 A C D E F G
incidence
Retinol diet+supplement
Pre-menopausal
Zhang,S.,1999,BRE13953
USA, Not specified,Registered nursesNurses' Health Study (NHS)Cohort 1976-1996
33 - 60 784 By MailFFQ-Semi-quantitative
ProspectiveCohort
53938 14.0 years / 39% I.U./day
Invasive breast cancerPre-menopausal
9366.0vs.1021.0
50.78(0.62, 0.99)
0.44 A C D E F G
incidence
Post-menopausal
206

Author, Year,WCRF Code
Country, Ethnicity, Specialcharacteristics
Age Cases n Caseascertainment
Type of studyNon-Cases n
Lenght offollow-up / loss
Assessmentdetail
Additional details Unit Outcome Subgroup Contrast Nocat. OR (95% CI) p
valueptrend A B C D E F G
adjustments
Kushi, L.H.,1996,BRE05143
USA, Not specified, Post-menopausalIowa Women's Health Study
55 - 69 879 By MailFFQ-Semi-quantitative
ProspectiveCohort
34387 7.0 years / 1370 I.U./day
Breast cancerPost-menopausal
>7492.0vs.<1232.0
51.01(0.81, 1.26)
0.79 A B C D E F G
incidence
Zhang,S.,1999,BRE13953
USA, Not specified,Registered nursesNurses' Health Study (NHS)Cohort 1976-1996
33 - 60 1913 By MailFFQ-Semi-quantitative
ProspectiveCohort
29296 14.0 years / 39% I.U./day
Invasive breast cancerPost-menopausal
9366.0vs.1021.0
50.95(0.83, 1.1)
0.40 A C D E F G
incidence
Menopausal status not specified
Zhang,S.,1999,BRE13953
USA, Not specified,Registered nursesNurses' Health Study (NHS)Cohort 1976-1996
33 - 60 689 By MailFFQ-Semi-quantitative
ProspectiveCohort
83234.0 14.0 years / 39% I.U./day
Invasive breast cancer FamilyHistory BC -No & Pre-menopausal
9366.0vs.1021.0
50.82(0.64, 1.04)
0.67 A C D E F G
incidence
Zhang,S.,1999,BRE13953
USA, Not specified,Registered nursesNurses' Health Study (NHS)Cohort 1976-1996
33 - 60 90 By MailFFQ-Semi-quantitative
ProspectiveCohort
83234.0 14.0 years / 39% I.U./day
Invasive breast cancer FamilyHistory BC -Yes & Pre-menopausal
9366.0vs.1021.0
50.59(0.29, 1.21)
0.38 A C D E F G
incidence
Retinol supplement
Post-menopausal
Kushi, L.H.,1996,BRE05143
USA, Not specified, Post-menopausalIowa Women's Health Study
55 - 69 879 By MailFFQ-Semi-quantitative
ProspectiveCohort
34387 7.0 years / 1370 I.U./day
Breast cancerPost-menopausal
>10001.0vs.<0.0
40.77(0.49, 1.21)
0.38 A B C D E F G
incidence
Serum Retinol
Menopausal status not specified
Dorgan,J.F.,1998,BRE14889
U S, Not specifiedColumbia Missouri BreastCancer Serum Bank, 1977
41 - 73 105Throughnetwork, paper,tv
Nested CaseControl
209 9.5 years mcmol/L
Invasive breast cancer 2.31 - 3.32vs.<1.67
40.9(0.4, 2.0)
0.99 D G
incidence
Toniolo,P.,2001,BRE12399
US, Not specifiedNew York Women's HealthStudy, 1985
35 - 65
Through healthorg. (screening,healthinsurance)
Nested CaseControl
14275.0 mcg/dL
Breast cancer Quantile 4vs.Quantile 4
41.0(null, null)
0.50 C F G
incidence
Sato,Reiko,2002,BRE20839
USA, Caucasian, BlooddonorsCLUE I, 1974
(51) 244Throughnetwork, paper,tv
Nested CaseControl
244 20.0 years mcg/dL
Breast cancer >73.0vs.<46.1
50.97(0.53, 1.8)
.83incidence
Serum Retinol Binding Protein
Menopausal status not specified
Russell, M.J.,1988,BRE17990
UK, Not specifiedGuernsey G2 and G3
28 - 66
Through healthorg. (screening,healthinsurance)
Nested CaseControl
5086.0 9.0 yearsBreast cancer
1null(null, null)
incidence
Serum Retinyl Palmitate
Menopausal status not specified
207

Author, Year,WCRF Code
Country, Ethnicity, Specialcharacteristics
Age Cases n Caseascertainment
Type of studyNon-Cases n
Lenght offollow-up / loss
Assessmentdetail
Additional details Unit Outcome Subgroup Contrast Nocat. OR (95% CI) p
valueptrend A B C D E F G
adjustments
Sato,Reiko,2002,BRE20839
USA, Caucasian, BlooddonorsCLUE I, 1974
(51) 220Throughnetwork, paper,tv
Nested CaseControl
232 20.0 years mcg/dL
Breast cancer >12.3vs.<3.3
50.78(0.4, 1.51)
.39incidence
5.5.1.2
Alpha-carotene
Pre-menopausal
Zhang,S.,1999,BRE13953
USA, Not specified,Registered nursesNurses' Health Study (NHS)Cohort 1976-1996
33 - 60 784 By MailFFQ-Semi-quantitative
ProspectiveCohort
53938 14.0 years / 39% mcg/day
Invasive breast cancerPre-menopausal
1453.0vs.220.0
50.84(0.67, 1.06)
0.14 A C D E F G
incidence
Terry,P.,2002,BRE12200
Canada, Not specified,Screening ProgramCanadian National BreastScreening Study
672Throughnetwork, paper,tv
FFQ-Quantitative
Case Cohort 56837.0SDUnits/day
Breast cancerPre-menopausal
1.0(continuous)
11.01(0.89, 1.14)
A B C D E F G
incidence
Cho, E.,2003,BRE01652
U.S, Multi-ethnic, RegisterednursesNurses' Health Study (NHS)Cohort 1976-1996
26 - 46 714 By MailFFQ-Semi-quantitative
ProspectiveCohort
90655 8.0 years mcg/day
Invasive breast cancerPre-menopausal
1537.0vs.183.0
50.85(0.67, 1.08)
0.35 C D E F G
incidence
Post-menopausal
Zhang,S.,1999,BRE13953
USA, Not specified,Registered nursesNurses' Health Study (NHS)Cohort 1976-1996
33 - 60 1913 By MailFFQ-Semi-quantitative
ProspectiveCohort
29296 14.0 years / 39% mcg/day
Invasive breast cancerPost-menopausal
1453.0vs.220.0
50.98(0.85, 1.13)
0.48 A C D E F G
incidence
Terry,P.,2002,BRE12200
Canada, Not specified,Screening ProgramCanadian National BreastScreening Study
575Throughnetwork, paper,tv
FFQ-Quantitative
Case Cohort 56837.0SDUnits/day
Breast cancerPost-menopausal
1.0(continuous)
11.02(0.91, 1.14)
A B C D E F G
incidence
Menopausal status not specified
Zhang,S.,1999,BRE13953
USA, Not specified,Registered nursesNurses' Health Study (NHS)Cohort 1976-1996
33 - 60 689 By MailFFQ-Semi-quantitative
ProspectiveCohort
83234.0 14.0 years / 39% mcg/day
Invasive breast cancer FamilyHistory BC -No & Pre-menopausal
1453.0vs.220.0
50.89(0.7, 1.14)
0.46 A C D E F G
incidence
Zhang,S.,1999,BRE13953
USA, Not specified,Registered nursesNurses' Health Study (NHS)Cohort 1976-1996
33 - 60 90 By MailFFQ-Semi-quantitative
ProspectiveCohort
83234.0 14.0 years / 39% mcg/day
Invasive breast cancer FamilyHistory BC -Yes & Pre-menopausal
1453.0vs.220.0
50.47(0.23, 0.98)
0.01 A C D E F G
incidence
Terry,P.,2002,BRE12200
Canada, Not specified,Screening ProgramCanadian National BreastScreening Study
1184Throughnetwork, paper,tv
FFQ-Quantitative
Case Cohort 56837.0SDUnits/day
Breast cancer FamilyHistory BC -No
1.0(continuous)
10.98(0.91, 1.06)
A B C D E F G
incidence
Terry,P.,2002,BRE12200
Canada, Not specified,Screening ProgramCanadian National BreastScreening Study
268Throughnetwork, paper,tv
FFQ-Quantitative
Case Cohort 56837.0SDUnits/day
Breast cancer FamilyHistory BC -Yes
1.0(continuous)
11.07(0.88, 1.32)
A B C D E F G
incidence
208

Author, Year,WCRF Code
Country, Ethnicity, Specialcharacteristics
Age Cases n Caseascertainment
Type of studyNon-Cases n
Lenght offollow-up / loss
Assessmentdetail
Additional details Unit Outcome Subgroup Contrast Nocat. OR (95% CI) p
valueptrend A B C D E F G
adjustments
Terry,P.,2002,BRE12200
Canada, Not specified,Screening ProgramCanadian National BreastScreening Study
492Throughnetwork, paper,tv
FFQ-Quantitative
Case Cohort 56837.0SDUnits/day
Breast cancer
Lean1.0(continuous)
10.9(0.79, 1.05)
A B C E F G
incidence
Terry,P.,2002,BRE12200
Canada, Not specified,Screening ProgramCanadian National BreastScreening Study
1431Throughnetwork, paper,tv
FFQ-Quantitative
Case Cohort 63278 mcg/day
Breast cancer 2441.0vs.344.0
51.01(0.8, 1.25)
0.95 A B C D E F G
incidence
Terry,P.,2002,BRE12200
Canada, Not specified,Screening ProgramCanadian National BreastScreening Study
542Throughnetwork, paper,tv
FFQ-Quantitative
Case Cohort 56837.0SDUnits/day
Breast cancer
Overweight1.0(continuous)
11.04(0.91, 1.18)
A B C E F G
incidence
Horn-Ross,P.L.,2002,BRE15412
USA, Multi-ethnic,Registered teachersCalifornia Teachers Study,1995
21 - 103 By Mail FFQ (nos)ProspectiveCohort
111383.0 2.0 years mcg/day
Invasive breast cancer <766.0vs.<157.0
51.2(0.9, 1.5)
0.03 A C D E F G
incidence
Beta-carotene
Pre-menopausal
Zhang,S.,1999,BRE13953
USA, Not specified,Registered nursesNurses' Health Study (NHS)Cohort 1976-1996
33 - 60 784 By MailFFQ-Semi-quantitative
ProspectiveCohort
53938 14.0 years / 39% mcg/day
Invasive breast cancerPre-menopausal
7609.0vs.1677.0
50.84(0.67, 1.05)
0.07 A C D E F G
incidence
Terry,P.,2002,BRE12200
Canada, Not specified,Screening ProgramCanadian National BreastScreening Study
672Throughnetwork, paper,tv
FFQ-Quantitative
Case Cohort 56837.0SDUnits/day
Breast cancerPre-menopausal
1.0(continuous)
11.01(0.89, 1.15)
A B C D E F G
incidence
Cho, E.,2003,BRE01652
U.S, Multi-ethnic, RegisterednursesNurses' Health Study (NHS)Cohort 1976-1996
26 - 46 714 By MailFFQ-Semi-quantitative
ProspectiveCohort
90655 8.0 years mcg/day
Invasive breast cancerPre-menopausal
7701.0vs.1675.0
50.96(0.75, 1.22)
0.97 C D E F G
incidence
Post-menopausal
Zhang,S.,1999,BRE13953
USA, Not specified,Registered nursesNurses' Health Study (NHS)Cohort 1976-1996
33 - 60 1913 By MailFFQ-Semi-quantitative
ProspectiveCohort
29296 14.0 years / 39% mcg/day
Invasive breast cancerPost-menopausal
7609.0vs.1677.0
50.94(0.81, 1.09)
0.42 A C D E F G
incidence
Terry,P.,2002,BRE12200
Canada, Not specified,Screening ProgramCanadian National BreastScreening Study
575Throughnetwork, paper,tv
FFQ-Quantitative
Case Cohort 56837.0SDUnits/day
Breast cancerPost-menopausal
1.0(continuous)
11.01(0.89, 1.15)
A B C D E F G
incidence
Menopausal status not specified
Giovannucci,E.,1993,BRE03262
US, Not specified,Registered nursesNurses' Health Study (NHS)Cohort 1976-1996
30 - 55 392 By MailFFQ-Semi-quantitative
Nested CaseControl
786 2.0 years I.U./day
Breast cancer Quantile 5vs.Quantile 1
51.0(0.68, 1.48)
0.65 A
incidence
Rohan, T.E.,1993,BRE17965
Canada, Not specified,Screening ProgramCanadian National BreastScreening Study
40 - 59
Through healthorg. (screening,healthinsurance)
Dietary Historyquestionnaire
Nested CaseControl
56837.0 6.0 years I.U./day
Breast cancer4995.0(continuous)
10.85(0.72, 1.0)
A B C E F G
incidence
209

Author, Year,WCRF Code
Country, Ethnicity, Specialcharacteristics
Age Cases n Caseascertainment
Type of studyNon-Cases n
Lenght offollow-up / loss
Assessmentdetail
Additional details Unit Outcome Subgroup Contrast Nocat. OR (95% CI) p
valueptrend A B C D E F G
adjustments
Verhoeven, D.T.,1997,BRE12868
the Netherland, Not specifiedThe Netherlands CohortStudy on diet and cancer,1986-1993
55 - 69 519Throughnetwork, paper,tv
FFQ-Semi-quantitative
Case Cohort 58664.3 years / nolost mg/day
Invasive breast cancer 0.719vs.0.197
51.01(0.72, 1.42)
0.96 A C E F G
incidence
Zhang,S.,1999,BRE13953
USA, Not specified,Registered nursesNurses' Health Study (NHS)Cohort 1976-1996
33 - 60 689 By MailFFQ-Semi-quantitative
ProspectiveCohort
83234.0 14.0 years / 39% mcg/day
Invasive breast cancer FamilyHistory BC -No & Pre-menopausal
7609.0vs.1677.0
50.93(0.73, 1.18)
0.48 A C D E F G
incidence
Zhang,S.,1999,BRE13953
USA, Not specified,Registered nursesNurses' Health Study (NHS)Cohort 1976-1996
33 - 60 90 By MailFFQ-Semi-quantitative
ProspectiveCohort
83234.0 14.0 years / 39% mcg/day
Invasive breast cancer FamilyHistory BC -Yes & Pre-menopausal
7609.0vs.1677.0
50.38(0.19, 0.77)
0.0099
A C D E F G
incidence
Michels, K.B.,2001,BRE17830
Sweden, Not specified,Screening ProgramValencia, 1997
40 - 76 717 By MailFFQ-Semi-quantitative
ProspectiveCohort
59039.0 130.0 months mg/day
Invasive breast cancer
Lean5.1vs.0.97
51.14(0.89, 1.47)
0.21 A B C D E F
incidence
Michels, K.B.,2001,BRE17830
Sweden, Not specified,Screening ProgramValencia, 1997
40 - 76 By MailFFQ-Semi-quantitative
ProspectiveCohort
59039.0 130.0 months mg/day
Invasive breast cancer 5.1vs.0.97
51.01(0.84, 1.22)
0.53 A B C D E F
incidence
Michels, K.B.,2001,BRE17830
Sweden, Not specified,Screening ProgramValencia, 1997
40 - 76 554 By MailFFQ-Semi-quantitative
ProspectiveCohort
59039.0 130.0 months mg/day
Invasive breast cancer
Overweight5.1vs.0.97
50.86(0.65, 1.14)
0.60 A B C D E F
incidence
Terry,P.,2002,BRE12200
Canada, Not specified,Screening ProgramCanadian National BreastScreening Study
1184Throughnetwork, paper,tv
FFQ-Quantitative
Case Cohort 56837.0SDUnits/day
Breast cancer FamilyHistory BC -No
1.0(continuous)
10.96(0.88, 1.05)
A B C D E F G
incidence
Terry,P.,2002,BRE12200
Canada, Not specified,Screening ProgramCanadian National BreastScreening Study
268Throughnetwork, paper,tv
FFQ-Quantitative
Case Cohort 56837.0SDUnits/day
Breast cancer FamilyHistory BC -Yes
1.0(continuous)
11.22(0.95, 1.58)
A B C D E F G
incidence
Terry,P.,2002,BRE12200
Canada, Not specified,Screening ProgramCanadian National BreastScreening Study
492Throughnetwork, paper,tv
FFQ-Quantitative
Case Cohort 56837.0SDUnits/day
Breast cancer
Lean1.0(continuous)
10.88(0.77, 1.04)
A B C E F G
incidence
Terry,P.,2002,BRE12200
Canada, Not specified,Screening ProgramCanadian National BreastScreening Study
1452Throughnetwork, paper,tv
FFQ-Quantitative
Case Cohort 63277 mcg/day
Breast cancer 9832.0vs.2205.0
51.01(0.7, 1.33)
0.98 A B C D E F G
incidence
Terry,P.,2002,BRE12200
Canada, Not specified,Screening ProgramCanadian National BreastScreening Study
542Throughnetwork, paper,tv
FFQ-Quantitative
Case Cohort 56837.0SDUnits/day
Breast cancer
Overweight1.0(continuous)
11.05(0.92, 1.2)
A B C E F G
incidence
Horn-Ross,P.L.,2002,BRE15412
USA, Multi-ethnic,Registered teachersCalifornia Teachers Study,1995
21 - 103 By Mail FFQ (nos)ProspectiveCohort
111383.0 2.0 years mcg/day
Invasive breast cancer <4652.0vs.<1465.0
51.1(0.9, 1.4)
0.2 A C D E F G
incidence
Beta-carotene diet+supplement
Pre-menopausal
210

Author, Year,WCRF Code
Country, Ethnicity, Specialcharacteristics
Age Cases n Caseascertainment
Type of studyNon-Cases n
Lenght offollow-up / loss
Assessmentdetail
Additional details Unit Outcome Subgroup Contrast Nocat. OR (95% CI) p
valueptrend A B C D E F G
adjustments
Zhang,S.,1999,BRE13953
USA, Not specified,Registered nursesNurses' Health Study (NHS)Cohort 1976-1996
33 - 60 784 By MailFFQ-Semi-quantitative
ProspectiveCohort
53938 14.0 years / 39% mcg/day
Invasive breast cancerPre-menopausal
7694.0vs.1683.0
50.83(0.66, 1.04)
0.04 A C D E F G
incidence
Post-menopausal
Zhang,S.,1999,BRE13953
USA, Not specified,Registered nursesNurses' Health Study (NHS)Cohort 1976-1996
33 - 60 1913 By MailFFQ-Semi-quantitative
ProspectiveCohort
29296 14.0 years / 39% mcg/day
Invasive breast cancerPost-menopausal
7694.0vs.1683.0
50.94(0.81, 1.09)
0.42 A C D E F G
incidence
Menopausal status not specified
Zhang,S.,1999,BRE13953
USA, Not specified,Registered nursesNurses' Health Study (NHS)Cohort 1976-1996
33 - 60 689 By MailFFQ-Semi-quantitative
ProspectiveCohort
83234.0 14.0 years / 39% mcg/day
Invasive breast cancer FamilyHistory BC -No & Pre-menopausal
7694.0vs.1683.0
50.91(0.71, 1.16)
0.33 A C D E F G
incidence
Zhang,S.,1999,BRE13953
USA, Not specified,Registered nursesNurses' Health Study (NHS)Cohort 1976-1996
33 - 60 90 By MailFFQ-Semi-quantitative
ProspectiveCohort
83234.0 14.0 years / 39% mcg/day
Invasive breast cancer FamilyHistory BC -Yes & Pre-menopausal
7694.0vs.1683.0
50.42(0.21, 0.83)
0.002
A C D E F G
incidence
Beta-cryptoxanthin
Pre-menopausal
Zhang,S.,1999,BRE13953
USA, Not specified,Registered nursesNurses' Health Study (NHS)Cohort 1976-1996
33 - 60 784 By MailFFQ-Semi-quantitative
ProspectiveCohort
53938 14.0 years / 39% mcg/day
Invasive breast cancerPre-menopausal
175.0vs.20.0
50.89(0.7, 1.13)
0.34 A C D E F G
incidence
Terry,P.,2002,BRE12200
Canada, Not specified,Screening ProgramCanadian National BreastScreening Study
672Throughnetwork, paper,tv
FFQ-Quantitative
Case Cohort 56837.0SDUnits/day
Breast cancerPre-menopausal
1.0(continuous)
10.93(0.82, 1.05)
A B C D E F G
incidence
Cho, E.,2003,BRE01652
U.S, Multi-ethnic, RegisterednursesNurses' Health Study (NHS)Cohort 1976-1996
26 - 46 714 By MailFFQ-Semi-quantitative
ProspectiveCohort
90655 8.0 years mcg/day
Invasive breast cancerPre-menopausal
104.0vs.8.0
51.2(0.94, 1.54)
0.11 C D E F G
incidence
Post-menopausal
Zhang,S.,1999,BRE13953
USA, Not specified,Registered nursesNurses' Health Study (NHS)Cohort 1976-1996
33 - 60 1913 By MailFFQ-Semi-quantitative
ProspectiveCohort
29296 14.0 years / 39% mcg/day
Invasive breast cancerPost-menopausal
175.0vs.20.0
50.97(0.84, 1.12)
0.91 A C D E F G
incidence
Terry,P.,2002,BRE12200
Canada, Not specified,Screening ProgramCanadian National BreastScreening Study
575Throughnetwork, paper,tv
FFQ-Quantitative
Case Cohort 56837.0SDUnits/day
Breast cancerPost-menopausal
1.0(continuous)
11.08(0.95, 1.23)
A B C D E F G
incidence
Menopausal status not specified
Zhang,S.,1999,BRE13953
USA, Not specified,Registered nursesNurses' Health Study (NHS)Cohort 1976-1996
33 - 60 689 By MailFFQ-Semi-quantitative
ProspectiveCohort
83234.0 14.0 years / 39% mcg/day
Invasive breast cancer FamilyHistory BC -No & Pre-menopausal
175.0vs.20.0
50.94(0.73, 1.22)
0.71 A C D E F G
incidence
211

Author, Year,WCRF Code
Country, Ethnicity, Specialcharacteristics
Age Cases n Caseascertainment
Type of studyNon-Cases n
Lenght offollow-up / loss
Assessmentdetail
Additional details Unit Outcome Subgroup Contrast Nocat. OR (95% CI) p
valueptrend A B C D E F G
adjustments
Zhang,S.,1999,BRE13953
USA, Not specified,Registered nursesNurses' Health Study (NHS)Cohort 1976-1996
33 - 60 90 By MailFFQ-Semi-quantitative
ProspectiveCohort
83234.0 14.0 years / 39% mcg/day
Invasive breast cancer FamilyHistory BC -Yes & Pre-menopausal
175.0vs.20.0
50.57(0.28, 1.15)
0.09 A C D E F G
incidence
Terry,P.,2002,BRE12200
Canada, Not specified,Screening ProgramCanadian National BreastScreening Study
1184Throughnetwork, paper,tv
FFQ-Quantitative
Case Cohort 56837.0SDUnits/day
Breast cancer FamilyHistory BC -No
1.0(continuous)
10.94(0.87, 1.03)
A B C D E F G
incidence
Terry,P.,2002,BRE12200
Canada, Not specified,Screening ProgramCanadian National BreastScreening Study
268Throughnetwork, paper,tv
FFQ-Quantitative
Case Cohort 56837.0SDUnits/day
Breast cancer FamilyHistory BC -Yes
1.0(continuous)
11.45(1.08, 1.95)
A B C D E F G
incidence
Terry,P.,2002,BRE12200
Canada, Not specified,Screening ProgramCanadian National BreastScreening Study
492Throughnetwork, paper,tv
FFQ-Quantitative
Case Cohort 56837.0SDUnits/day
Breast cancer
Lean1.0(continuous)
10.94(0.81, 1.11)
A B C E F G
incidence
Terry,P.,2002,BRE12200
Canada, Not specified,Screening ProgramCanadian National BreastScreening Study
1448Throughnetwork, paper,tv
FFQ-Quantitative
Case Cohort 63061 mcg/day
Breast cancer 246.0vs.26.0
50.88(0.6, 1.13)
0.59 A B C D E F G
incidence
Terry,P.,2002,BRE12200
Canada, Not specified,Screening ProgramCanadian National BreastScreening Study
542Throughnetwork, paper,tv
FFQ-Quantitative
Case Cohort 56837.0SDUnits/day
Breast cancer
Overweight1.0(continuous)
11.06(0.91, 1.23)
A B C E F G
incidence
Carotene
Post-menopausal
Graham,S.,1992,BRE03424
USA, White, Post-menopausalNew York State Cohort,1980
50 - 107 344 By Mail FFQ (nos)ProspectiveCohort
17401 8.0 yearsIU *1000/month
Breast cancerPost-menopausal
347.0 -2030.0vs.0 - 115.0
50.89(0.63, 1.26)
A B
incidence
Cryptoxanthin
Menopausal status not specified
Horn-Ross,P.L.,2002,BRE15412
USA, Multi-ethnic,Registered teachersCalifornia Teachers Study,1995
21 - 103 By Mail FFQ (nos)ProspectiveCohort
111383.0 2.0 years mcg/day
Invasive breast cancer <154.0vs.<27.0
51.0(0.8, 1.3)
0.7 A C D E F G
incidence
Plasma Alpha-carotene
Pre-menopausal
Hulten,2001,BRE04155swedenVIP + MONICA + MSP
57 UnspecifiedNested CaseControl
93
Breast cancerPre-menopausal
>1.0vs.>-1.0
40.7(0.2, 2.4)
0.59 D
incidence
Post-menopausal
Hulten,2001,BRE04155swedenVIP + MONICA + MSP
67 UnspecifiedNested CaseControl
109
Breast cancerPost-menopausal
>1.0vs.>-1.0
40.5(0.2, 1.4)
0.17 D
incidence
212

Author, Year,WCRF Code
Country, Ethnicity, Specialcharacteristics
Age Cases n Caseascertainment
Type of studyNon-Cases n
Lenght offollow-up / loss
Assessmentdetail
Additional details Unit Outcome Subgroup Contrast Nocat. OR (95% CI) p
valueptrend A B C D E F G
adjustments
Menopausal status not specified
Hulten,2001,BRE04155swedenVIP + MONICA + MSP
201 UnspecifiedNested CaseControl
390
Breast cancer >1.0vs.>-1.0
40.7(0.4, 1.2)
0.21 D
incidence
Sato,Reiko,2002,BRE70839
USA, Caucasian, BlooddonorsCLUE II, 1989
(60) 115Throughnetwork, paper,tv
Nested CaseControl
113 3.0 years mcg/dL
Breast cancer >4.9vs.<1.4
50.84(0.34, 2.08)
0.59incidence
Han, J.L.,2003,BRE18435
USA, Multi-ethnic,Registered nursesNurses' Health Study (NHS)Cohort 1976-1996
(57) 881
Through socialorganization(profession,religion)
Nested CaseControl
844 8.0 yearsBreast cancer 194Trp non
carriers(XRCCI ArgTrp)
>1.0vs.>-1.0
40.68(0.5, 0.92)
0.008
C D E F G
incidence
Tamimi, R.M.,2004,BRE12084
USA, Multi-ethnic,Registered nursesNurses' Health Study (NHS)Cohort 1976-1996
30 - 55 254
Through socialorganization(profession,religion)
Nested CaseControl
235 8.0 yearsBreast cancer
Val/Val(MnSOD)
>1.0vs.>-1.0
30.96(0.6, 1.52)
C D E F G
incidence
Sesso D.H.,2005,BRE24061
USA, Not specified, HealthprofessionalsWomen's Health Study, 1993
Through healthorg. (screening,healthinsurance)
Nested CaseControl
28345.0 7.0 years g/dl
Breast cancer 15.9vs.2.2
41.06(0.61, 1.84)
0.85 C D E F G
incidence
Tamimi, R.M.,2005,BRE24274
U.S.A., Registered nursesNurses' Health Study (NHS)Cohort 1976-1996
43 - 70 564Direct contactat home
Questionnaire(nos)
Nested CaseControl
121700.0 22.0 years mcmol/L
Breast cancer ER+ >1.0vs.>-1.0
50.72(0.5, 1.04)
0.03 A C E F G
incidence
Tamimi, R.M.,2005,BRE24274
U.S.A., Registered nursesNurses' Health Study (NHS)Cohort 1976-1996
43 - 70 165Direct contactat home
Questionnaire(nos)
Nested CaseControl
121700.0 22.0 years mcmol/L
Breast cancer ER- >1.0vs.>-1.0
50.5(0.28, 0.91)
0.48 A C E F G
incidence
Tamimi, R.M.,2005,BRE24274
U.S.A., Registered nursesNurses' Health Study (NHS)Cohort 1976-1996
43 - 70Direct contactat home
Questionnaire(nos)
Nested CaseControl
121700.0 22.0 years mcmol/L
Invasive & In situ breastcancer >1.0
vs.>-1.0
50.64(0.47, 0.88)
0.01 C D E F G
incidence
Plasma Beta-carotene
Pre-menopausal
Hulten,2001,BRE04155swedenVIP + MONICA + MSP
57 UnspecifiedNested CaseControl
93
Breast cancerPre-menopausal
>1.0vs.>-1.0
41.6(0.5, 5.4)
0.28 D
incidence
Post-menopausal
Hulten,2001,BRE04155swedenVIP + MONICA + MSP
67 UnspecifiedNested CaseControl
109
Breast cancerPost-menopausal
>1.0vs.>-1.0
40.7(0.2, 1.9)
0.25 D
incidence
Menopausal status not specified
Hulten,2001,BRE04155swedenVIP + MONICA + MSP
201 UnspecifiedNested CaseControl
390
Breast cancer >1.0vs.>-1.0
40.8(0.5, 1.4)
0.40 D
incidence
213

Author, Year,WCRF Code
Country, Ethnicity, Specialcharacteristics
Age Cases n Caseascertainment
Type of studyNon-Cases n
Lenght offollow-up / loss
Assessmentdetail
Additional details Unit Outcome Subgroup Contrast Nocat. OR (95% CI) p
valueptrend A B C D E F G
adjustments
Sato,Reiko,2002,BRE70839
USA, Caucasian, BlooddonorsCLUE II, 1989
(60) 115Throughnetwork, paper,tv
Nested CaseControl
115 3.0 years mcg/dL
Breast cancer >22.6vs.<7.1
50.62(0.27, 1.42)
0.26incidence
Han, J.L.,2003,BRE18435
USA, Multi-ethnic,Registered nursesNurses' Health Study (NHS)Cohort 1976-1996
(57) 881
Through socialorganization(profession,religion)
Nested CaseControl
844 8.0 yearsBreast cancer 194Trp non
carriers(XRCCI ArgTrp)
>1.0vs.>-1.0
40.84(0.62, 1.14)
0.07 C D E F G
incidence
Tamimi, R.M.,2004,BRE12084
USA, Multi-ethnic,Registered nursesNurses' Health Study (NHS)Cohort 1976-1996
30 - 55 254
Through socialorganization(profession,religion)
Nested CaseControl
234 8.0 yearsBreast cancer
Val/Val(MnSOD)
>1.0vs.>-1.0
30.81(0.5, 1.31)
C D E F G
incidence
Sesso D.H.,2005,BRE24061
USA, Not specified, HealthprofessionalsWomen's Health Study, 1993
Through healthorg. (screening,healthinsurance)
Nested CaseControl
28345.0 7.0 years g/dl
Breast cancer 45.6vs.8.3
41.36(0.79, 2.33)
0.36 C D E F G
incidence
Tamimi, R.M.,2005,BRE24274
U.S.A., Registered nursesNurses' Health Study (NHS)Cohort 1976-1996
43 - 70Direct contactat home
Questionnaire(nos)
Nested CaseControl
121700.0 22.0 years mcmol/L
Invasive & In situ breastcancer >1.0
vs.>-1.0
50.73(0.53, 1.02)
0.01 C D E F G
incidence
Plasma Beta-cryptoxanthin
Post-menopausal
Hulten,2001,BRE04155swedenVIP + MONICA + MSP
67 UnspecifiedNested CaseControl
109
Breast cancerPost-menopausal
>1.0vs.>-1.0
40.8(0.3, 2.3)
0.41 D
incidence
Menopausal status not specified
Sato,Reiko,2002,BRE70839
USA, Caucasian, BlooddonorsCLUE II, 1989
(60) 115Throughnetwork, paper,tv
Nested CaseControl
115 3.0 years mcg/dL
Breast cancer >17.3vs.<6.5
50.7(0.29, 1.73)
0.68incidence
Tamimi, R.M.,2004,BRE12084
USA, Multi-ethnic,Registered nursesNurses' Health Study (NHS)Cohort 1976-1996
30 - 55 254
Through socialorganization(profession,religion)
Nested CaseControl
235 8.0 yearsBreast cancer
Val/Val(MnSOD)
>1.0vs.>-1.0
30.53(0.34, 0.84)
C D E F G
incidence
Tamimi, R.M.,2005,BRE24274
U.S.A., Registered nursesNurses' Health Study (NHS)Cohort 1976-1996
43 - 70Direct contactat home
Questionnaire(nos)
Nested CaseControl
121700.0 22.0 years mcmol/L
Invasive & In situ breastcancer >1.0
vs.>-1.0
50.95(0.69, 1.31)
0.08 C D E F G
incidence
Plasma Cryptoxanthin
Pre-menopausal
Hulten,2001,BRE04155swedenVIP + MONICA + MSP
57 UnspecifiedNested CaseControl
93
Breast cancerPre-menopausal
>1.0vs.>-1.0
41.0(0.3, 3.6)
0.49 D
incidence
Menopausal status not specified
214

Author, Year,WCRF Code
Country, Ethnicity, Specialcharacteristics
Age Cases n Caseascertainment
Type of studyNon-Cases n
Lenght offollow-up / loss
Assessmentdetail
Additional details Unit Outcome Subgroup Contrast Nocat. OR (95% CI) p
valueptrend A B C D E F G
adjustments
Hulten,2001,BRE04155swedenVIP + MONICA + MSP
201 UnspecifiedNested CaseControl
390
Breast cancer >1.0vs.>-1.0
40.9(0.5, 1.6)
0.60 D
incidence
Sesso D.H.,2005,BRE24061
USA, Not specified, HealthprofessionalsWomen's Health Study, 1993
Through healthorg. (screening,healthinsurance)
Nested CaseControl
28345.0 7.0 years g/dl
Breast cancer 20.6vs.3.5
40.82(0.46, 1.44)
0.21 C D E F G
incidence
Provitamin A carotenoids
Pre-menopausal
Cho, E.,2003,BRE01652
U.S, Multi-ethnic, RegisterednursesNurses' Health Study (NHS)Cohort 1976-1996
26 - 46 714 By MailFFQ-Semi-quantitative
ProspectiveCohort
90655 8.0 years I.U./day
Invasive breast cancerPre-menopausal
7366.0vs.964.0
50.8(0.63, 1.02)
0.10 C D E F G
incidence
Cho, E.,2003,BRE01652
U.S, Multi-ethnic, RegisterednursesNurses' Health Study (NHS)Cohort 1976-1996
26 - 46 714 By MailFFQ-Semi-quantitative
ProspectiveCohort
90655 8.0 years I.U./day
Invasive breast cancerPre-menopausal
3339.0vs.799.0
50.88(0.69, 1.12)
0.15 C D E F G
incidence
Menopausal status not specified
Hunter, D.J.,1993,BRE04168
USA, Not specified,Registered nursesNurses' Health Study (NHS)Cohort 1976-1996
30 - 55 1439 By MailFFQ-Semi-quantitative
ProspectiveCohort
692675 8.0 years / 4% I.U./day
Invasive breast cancer >11410.0vs.<3849.0
50.89(0.76, 1.05)
0.08 A C D E F G
incidence
Serum Alpha-carotene
Menopausal status not specified
Dorgan,J.F.,1998,BRE14889
U S, Not specifiedColumbia Missouri BreastCancer Serum Bank, 1977
41 - 73 105Throughnetwork, paper,tv
Nested CaseControl
209 9.5 years mcmol/L
Invasive breast cancer 0.14 - 0.84vs.<0.05
41.8(0.8, 4.1)
0.11 D G
incidence
Toniolo,P.,2001,BRE12399
US, Not specifiedNew York Women's HealthStudy, 1985
35 - 65
Through healthorg. (screening,healthinsurance)
Nested CaseControl
14275.0 mcg/dL
Breast cancer Quantile 4vs.Quantile 4
41.0(null, null)
0.0006
C F G
incidence
Sato,Reiko,2002,BRE20839
USA, Caucasian, BlooddonorsCLUE I, 1974
(51) 231Throughnetwork, paper,tv
Nested CaseControl
235 20.0 years mcg/dL
Breast cancer >3.5vs.<0.8
50.69(0.36, 1.34)
0.09incidence
Serum Beta-carotene
Menopausal status not specified
Dorgan,J.F.,1998,BRE14889
U S, Not specifiedColumbia Missouri BreastCancer Serum Bank, 1977
41 - 73 105Throughnetwork, paper,tv
Nested CaseControl
209 9.5 years mcmol/L
Invasive breast cancer 0.69 - 2.2vs.<0.29
41.1(0.5, 2.4)
0.97 D G
incidence
Toniolo,P.,2001,BRE12399
US, Not specifiedNew York Women's HealthStudy, 1985
35 - 65
Through healthorg. (screening,healthinsurance)
Nested CaseControl
14275.0 mcg/dL
Breast cancer Quantile 4vs.Quantile 4
41.0(null, null)
0.006
C F G
incidence
215

Author, Year,WCRF Code
Country, Ethnicity, Specialcharacteristics
Age Cases n Caseascertainment
Type of studyNon-Cases n
Lenght offollow-up / loss
Assessmentdetail
Additional details Unit Outcome Subgroup Contrast Nocat. OR (95% CI) p
valueptrend A B C D E F G
adjustments
Sato,Reiko,2002,BRE20839
USA, Caucasian, BlooddonorsCLUE I, 1974
(51) 243Throughnetwork, paper,tv
Nested CaseControl
244 20.0 years mcg/dL
Breast cancer >22.2vs.<7.2
50.41(0.22, 0.79)
0.007
incidence
Serum beta-cryptoxanthin
Menopausal status not specified
Dorgan,J.F.,1998,BRE14889
U S, Not specifiedColumbia Missouri BreastCancer Serum Bank, 1977
41 - 73 105Throughnetwork, paper,tv
Nested CaseControl
209 9.5 years mcmol/L
Invasive breast cancer 0.28 - 1.07vs.<0.1
40.6(0.3, 1.2)
0.41 D G
incidence
Toniolo,P.,2001,BRE12399
US, Not specifiedNew York Women's HealthStudy, 1985
35 - 65
Through healthorg. (screening,healthinsurance)
Nested CaseControl
14275.0 mcg/dL
Breast cancer Quantile 4vs.Quantile 4
41.0(null, null)
0.05 C F G
incidence
Sato,Reiko,2002,BRE20839
USA, Caucasian, BlooddonorsCLUE I, 1974
(51) 244Throughnetwork, paper,tv
Nested CaseControl
244 20.0 years mcg/dL
Breast cancer >15.8vs.<4.4
50.98(0.55, 1.75)
.67incidence
5.5.10
Blood 1,25-dihydroxyvitamin D
Menopausal status not specified
Bertone-Johnson, E.R.,2005,BRE21759
U.S.A., Registered nursesNurses' Health Study (NHS)Cohort 1976-1996
43 - 69 701 By MailNested CaseControl
701 6.0 years ng/ml
Breast cancer >38.2vs.<28.5
50.76(0.52, 1.11)
0.39 C D E F G
incidence
Blood 25-hydroxyvitamin D
Menopausal status not specified
Bertone-Johnson, E.R.,2005,BRE21759
U.S.A., Registered nursesNurses' Health Study (NHS)Cohort 1976-1996
43 - 69 701 By MailNested CaseControl
701 6.0 yearsBreast cancer >1.0
vs.>-1.0
50.73(0.49, 1.07)
0.06 C D E F G
incidence
Dietary Vitamin D
Pre-menopausal
Shin, M.-H.,2002,BRE16658
USA, Not specified,Registered nursesNurses' Health Study (NHS)Cohort 1976-1996
(47) 827 By Mail FFQ (nos)ProspectiveCohort
85519 16.0 years I.U./day
Invasive breast cancerPre-menopausal
1.0(continuous)
50.88(0.79, 0.98)
A C D E F G
mortality/incidence
Dietary vitamin D
Pre-menopausal
216

Author, Year,WCRF Code
Country, Ethnicity, Specialcharacteristics
Age Cases n Caseascertainment
Type of studyNon-Cases n
Lenght offollow-up / loss
Assessmentdetail
Additional details Unit Outcome Subgroup Contrast Nocat. OR (95% CI) p
valueptrend A B C D E F G
adjustments
Lin J,2007,BRE80165US, not statedWomen's Health Study
54 - 56 276 medical records FFQProspectiveCohort
31487.0 10.0 years Vitamin D from diet IU/day
Invasive breast cancerPre-menopausal
>319.0vs.<141.9
61.02(0.69, 1.53)
0.4 A C D E F G
incidence
Dietary Vitamin D
Post-menopausal
Shin, M.-H.,2002,BRE16658
USA, Not specified,Registered nursesNurses' Health Study (NHS)Cohort 1976-1996
(47) 2345 By Mail FFQ (nos)ProspectiveCohort
85519 16.0 years I.U./day
Invasive breast cancerPost-menopausal
1.0(continuous)
11.0(0.94, 1.06)
A C D E F G
mortality/incidence
Dietary vitamin D
Post-menopausal
Robien, K. etal.,2007,BRE80130
United States, 99% white,Post menopausalIowa Women's Health study
55 - 69 2440State healthregistry
FFQProspectiveCohort
34321.0Dietary vitamin Dintake
I.U./day
Invasive breast cancer >=800vs.<400
30.55(0.24, 1.22)
0.14 A B C D E F G
incidence
Lin J,2007,BRE80165US, not statedWomen's Health Study
54 - 56 743 medical records FFQProspectiveCohort
31487.0 10.0 years Vitamin D from diet IU/day
Invasive breast cancerPost-menopausal
>319.0vs.<141.9
61.22(0.95, 1.55)
0.09 A G
incidence
Dietary Vitamin D
Menopausal status not specified
Simard,A.,1991,BRE18039
Canada, Not specified,Screening ProgramNBSS, 1980
40 - 59
Through healthorg. (screening,healthinsurance)
24h Recall +FFQ-Semi-quantitative
Nested CaseControl
9089.0
Breast cancer
1null(null, null)
incidence
John, E.M.,1999,BRE04433
USA, WhiteNHANES I, 1971
25 - 74 177 Unspecified 24h RecallProspectiveCohort
4747.0 17.3 years I.U./day
Breast cancer >=200vs.<100
30.85(0.59, 1.24)
0.48 A B C D E G
mortality/incidence
Total vitamin D
Pre-menopausal
Lin J,2007,BRE80165US, not statedWomen's Health Study
54 - 56 206 medical records FFQProspectiveCohort
31487.0 10.0 years Total vitamin D IU/day
Breast cancer ER+Pre-menopausal
>548.0vs.<161.9
60.53(0.31, 0.88)
0.03 A G
incidence
Lin J,2007,BRE80165US, not statedWomen's Health Study
54 - 56 59 medical records FFQProspectiveCohort
31487.0 10.0 years Total vitamin D IU/day
Breast cancer ER-Pre-menopausal
>548.0vs.<161.9
61.3(0.53, 3.15)
0.62 A C D E G
incidence
Lin J,2007,BRE80165US, not statedWomen's Health Study
54 - 56 186 medical records FFQProspectiveCohort
31487.0 10.0 years Total vitamin D IU/day
Breast cancer PR+Pre-menopausal
>548.0vs.<161.9
60.55(0.32, 0.94)
0.04 A C D E G
incidence
217

Author, Year,WCRF Code
Country, Ethnicity, Specialcharacteristics
Age Cases n Caseascertainment
Type of studyNon-Cases n
Lenght offollow-up / loss
Assessmentdetail
Additional details Unit Outcome Subgroup Contrast Nocat. OR (95% CI) p
valueptrend A B C D E F G
adjustments
Lin J,2007,BRE80165US, not statedWomen's Health Study
54 - 56 74 medical records FFQProspectiveCohort
31487.0 10.0 years Total vitamin D IU/day
Breast cancer PR-Pre-menopausal
>548.0vs.<161.9
61.08(0.48, 2.42)
0.79 A C D E G
incidence
Lin J,2007,BRE80165US, not statedWomen's Health Study
54 - 56 276 medical records FFQProspectiveCohort
31487.0 10.0 years Total vitamin D IU/day
Invasive breast cancerPre-menopausal
>548.0vs.<161.9
60.65(0.42, 1.0)
0.07 A C D E F G
incidence
Lin J,2007,BRE80165US, not statedWomen's Health Study
54 - 56 72 medical records FFQProspectiveCohort
31487.0 10.0 years Total vitamin D IU/day
Well differentiated breastcancer Pre-
menopausal
>548.0vs.<161.9
60.44(0.19, 1.03)
0.14 E G
incidence
Post-menopausal
McCulloughM.L.,2005,BRE23368
USA, Not specified, Post-menopausalCPS-II US cohort, 1982-1998
50 - 74 227 By MailFFQ-Semi-quantitative
ProspectiveCohort
68567.0 9.0 years Total vitamin D(dietaryplus multivitamins)
I.U./day
Breast cancer ER-Post-menopausal
>700vs.<=100
81.35(0.79, 2.23)
0.82 A B C D E F G
incidence
Lin J,2007,BRE80165US, not statedWomen's Health Study
54 - 56 602 medical records FFQProspectiveCohort
31487.0 10.0 years Total vitamin D IU/day
Breast cancer ER+Post-menopausal
>548.0vs.<161.9
61.28(0.93, 1.76)
0.57 A C F G
incidence
Lin J,2007,BRE80165US, not statedWomen's Health Study
54 - 56 109 medical records FFQProspectiveCohort
31487.0 10.0 years Total vitamin D IU/day
Breast cancer ER-Post-menopausal
>548.0vs.<161.9
61.47(0.66, 3.3)
0.6 A C F G
incidence
Lin J,2007,BRE80165US, not statedWomen's Health Study
54 - 56 522 medical records FFQProspectiveCohort
31487.0 10.0 years Total vitamin D IU/day
Breast cancer PR+Post-menopausal
>548.0vs.<161.9
61.23(0.88, 1.72)
0.58 A C F G
incidence
Lin J,2007,BRE80165US, not statedWomen's Health Study
54 - 56 179 medical records FFQProspectiveCohort
31487.0 10.0 years Total vitamin D IU/day
Breast cancer PR-Post-menopausal
>548.0vs.<161.9
61.48(0.76, 2.88)
0.87 A C F G
incidence
Lin J,2007,BRE80165US, not statedWomen's Health Study
54 - 56 743 medical records FFQProspectiveCohort
31487.0 10.0 years Total vitamin D IU/day
Invasive breast cancerPost-menopausal
>548.0vs.<161.9
61.3(0.97, 1.73)
0.52 A G
incidence
Lin J,2007,BRE80165US, not statedWomen's Health Study
54 - 56 164 medical records FFQProspectiveCohort
31487.0 10.0 years Total vitamin D IU/day
Well differentiated breastcancer Post-
menopausal
>548.0vs.<161.9
61.34(0.72, 2.47)
0.77 A C F G
incidence
Vitamin D and calcium
Pre-menopausal
Shin, M.-H.,2002,BRE16658
USA, Not specified,Registered nursesNurses' Health Study (NHS)Cohort 1976-1996
(47) 827 By Mail FFQ (nos)ProspectiveCohort
85519 16.0 years I.U./day
Invasive breast cancerPre-menopausal
1.0(continuous)
10.94(0.9, 0.99)
A C D E F G
mortality/incidence
Post-menopausal
218

Author, Year,WCRF Code
Country, Ethnicity, Specialcharacteristics
Age Cases n Caseascertainment
Type of studyNon-Cases n
Lenght offollow-up / loss
Assessmentdetail
Additional details Unit Outcome Subgroup Contrast Nocat. OR (95% CI) p
valueptrend A B C D E F G
adjustments
Shin, M.-H.,2002,BRE16658
USA, Not specified,Registered nursesNurses' Health Study (NHS)Cohort 1976-1996
(47) 2345 By Mail FFQ (nos)ProspectiveCohort
85519 16.0 years I.U./day
Invasive breast cancerPost-menopausal
1.0(continuous)
10.98(0.96, 1.01)
A C D E F G
mortality/incidence
McCulloughM.L.,2005,BRE23368
USA, Not specified, Post-menopausalCPS-II US cohort, 1982-1998
50 - 74 2855 By MailFFQ-Semi-quantitative
ProspectiveCohort
68567 9.0 years Total vitamin D(dietaryplus multivitamins)
I.U./day
Breast cancerPost-menopausal
>700vs.<=100
80.95(0.81, 1.13)
0.98 A B C D E F G
incidence
McCulloughM.L.,2005,BRE23368
USA, Not specified, Post-menopausalCPS-II US cohort, 1982-1998
50 - 74 1283 By MailFFQ-Semi-quantitative
ProspectiveCohort
68567.0 9.0 years Total vitamin D(dietaryplus multivitamins)
I.U./day
Breast cancer ER+Post-menopausal
>700vs.<=100
80.84(0.65, 1.09)
0.57 A B C D E F G
incidence
Menopausal status not specified
John, E.M.,1999,BRE04433
USA, WhiteNHANES I, 1971
25 - 74 177 Unspecified 24h RecallProspectiveCohort
4747.0 17.3 years from food orsupplements
I.U./day
Breast cancer>=200 ordailysupplementsvs.
30.86(0.61, 1.2)
0.37 A B C D E G
mortality/incidence
Vitamin D from foods and supplements
Post-menopausal
Robien, K. etal.,2007,BRE80130
United States, 99% white,Post menopausalIowa Women's Health study
55 - 69 1221State healthregistry
FFQProspectiveCohort
34321.0Total vitamin D intake,diet and supplementscombined
I.U./day
Breast cancer ER+/PR+ >=800vs.<400
30.96(0.78, 1.18)
0.69 A B C D E F G
incidence
Robien, K. etal.,2007,BRE80130
United States, 99% white,Post menopausalIowa Women's Health study
55 - 69 230State healthregistry
FFQProspectiveCohort
34321.0Total vitamin D intake,diet and supplementscombined
I.U./day
Breast cancer ER+/PR- >=800vs.<400
30.85(0.53, 1.36)
0.5 A B C D E F G
incidence
Robien, K. etal.,2007,BRE80130
United States, 99% white,Post menopausalIowa Women's Health study
55 - 69 224State healthregistry
FFQProspectiveCohort
34321.0Total vitamin D intake,diet and supplementscombined
I.U./day
Breast cancer ER-/PR- >=800vs.<400
30.77(0.48, 1.25)
0.29 A B C D E F G
incidence
Robien, K. etal.,2007,BRE80130
United States, 99% white,Post menopausalIowa Women's Health study
55 - 69 280State healthregistry
FFQProspectiveCohort
34321.0Total vitamin D intake,diet and supplementscombined
I.U./day
In situ breast cancer >=800vs.<400
30.61(0.37, 0.99)
0.05 A B C D E F G
incidence
Robien, K. etal.,2007,BRE80130
United States, 99% white,Post menopausalIowa Women's Health study
55 - 69 2440State healthregistry
FFQProspectiveCohort
34321.0Total vitamin D intake,diet and supplementscombined
I.U./day
Invasive breast cancer >=800vs.<400
30.89(0.77, 1.03)
0.12 A B C D E F G
incidence
Robien, K. etal.,2007,BRE80130
United States, 99% white,Post menopausalIowa Women's Health study
55 - 69 1317State healthregistry
FFQProspectiveCohort
34321.0Total vitamin D intake,diet and supplementscombined
I.U./day
Localized breast cancer >=800vs.<400
30.91(0.75, 1.11)
0.35 A B C D E F G
incidence
Robien, K. etal.,2007,BRE80130
United States, 99% white,Post menopausalIowa Women's Health study
55 - 69 466State healthregistry
FFQProspectiveCohort
34321.0Total vitamin D intake,diet and supplementscombined
I.U./day
Regional and distant breastcancer >=800
vs.<400
30.9(0.65, 1.25)
0.53 A B C D E F G
incidence
Vitamin D supplement
Pre-menopausal
219

Author, Year,WCRF Code
Country, Ethnicity, Specialcharacteristics
Age Cases n Caseascertainment
Type of studyNon-Cases n
Lenght offollow-up / loss
Assessmentdetail
Additional details Unit Outcome Subgroup Contrast Nocat. OR (95% CI) p
valueptrend A B C D E F G
adjustments
Lin J,2007,BRE80165US, not statedWomen's Health Study
54 - 56 276 medical records FFQProspectiveCohort
31487.0 10.0 years Vitamin D fromsupplements
IU/day
Invasive breast cancerPre-menopausal
>400.0vs.0
40.76(0.5, 1.17)
0.41 A C D E F G
incidence
Post-menopausal
Robien, K. etal.,2007,BRE80130
United States, 99% white,Post menopausalIowa Women's Health study
55 - 69 2440State healthregistry
FFQProspectiveCohort
34321.0Vitamin D supplementuse
I.U./day
Invasive breast cancer >=800vs.non users
40.89(0.74, 1.08)
0.33 A B C D E F G
incidence
Lin J,2007,BRE80165US, not statedWomen's Health Study
54 - 56 743 medical records FFQProspectiveCohort
31487.0 10.0 years Vitamin D fromsupplements
IU/day
Invasive breast cancerPost-menopausal
>400.0vs.0
40.87(0.68, 1.12)
0.31 A
incidence
Menopausal status not specified
John, E.M.,1999,BRE04433
USA, WhiteNHANES I, 1971
25 - 74 177 Unspecified 24h RecallProspectiveCohort
4747.0 17.3 yearsBreast cancer daily
vs.never
30.89(0.6, 1.32)
0.52 A B C D E G
mortality/incidence
5.5.11
Alpha-tocopherol
Menopausal status not specified
Rohan, T.E.,1993,BRE17965
Canada, Not specified,Screening ProgramCanadian National BreastScreening Study
40 - 59
Through healthorg. (screening,healthinsurance)
Dietary Historyquestionnaire
Nested CaseControl
56837.0 6.0 years mg/day
Breast cancer4.0(continuous)
10.96(0.76, 1.21)
A B C E F G
incidence
Alpha-tocopherol supplement
Menopausal status not specified
Rohan, T.E.,1993,BRE17965
Canada, Not specified,Screening ProgramCanadian National BreastScreening Study
40 - 59 519
Through healthorg. (screening,healthinsurance)
Dietary Historyquestionnaire
Nested CaseControl
1182 6.0 years mg/day
Breast cancer >3.1vs.0
31.2(0.83, 1.75)
0.655
A B C E F G
incidence
Plasma Alpha-tocopherol
Menopausal status not specified
Sato,Reiko,2002,BRE70839
USA, Caucasian, BlooddonorsCLUE II, 1989
(60) 115Throughnetwork, paper,tv
Nested CaseControl
115 3.0 years mg/dL
Breast cancer >1.65vs.<0.98
50.67(0.28, 1.62)
0.54incidence
Tamimi, R.M.,2004,BRE12084
USA, Multi-ethnic,Registered nursesNurses' Health Study (NHS)Cohort 1976-1996
30 - 55 254
Through socialorganization(profession,religion)
Nested CaseControl
225 8.0 yearsBreast cancer
Val/Val(MnSOD)
>1.0vs.>-1.0
30.98(0.62, 1.55)
C D E F G
incidence
Tamimi, R.M.,2005,BRE24274
U.S.A., Registered nursesNurses' Health Study (NHS)Cohort 1976-1996
43 - 70Direct contactat home
Questionnaire(nos)
Nested CaseControl
121700.0 22.0 years mcmol/L
Invasive & In situ breastcancer >1.0
vs.>-1.0
50.79(0.57, 1.08)
0.14 C D E F G
incidence
220

Author, Year,WCRF Code
Country, Ethnicity, Specialcharacteristics
Age Cases n Caseascertainment
Type of studyNon-Cases n
Lenght offollow-up / loss
Assessmentdetail
Additional details Unit Outcome Subgroup Contrast Nocat. OR (95% CI) p
valueptrend A B C D E F G
adjustments
Plasma Gamma-tocopherol
Menopausal status not specified
Sato,Reiko,2002,BRE70839
USA, Caucasian, BlooddonorsCLUE II, 1989
(60) 115Throughnetwork, paper,tv
Nested CaseControl
115 3.0 years mg/dL
Breast cancer >0.34vs.<0.12
50.8(0.33, 1.93)
0.68incidence
Tamimi, R.M.,2004,BRE12084
USA, Multi-ethnic,Registered nursesNurses' Health Study (NHS)Cohort 1976-1996
30 - 55 254
Through socialorganization(profession,religion)
Nested CaseControl
235 8.0 yearsBreast cancer
Val/Val(MnSOD)
>1.0vs.>-1.0
31.06(0.68, 1.65)
C D E F G
incidence
Tamimi, R.M.,2005,BRE24274
U.S.A., Registered nursesNurses' Health Study (NHS)Cohort 1976-1996
43 - 70Direct contactat home
Questionnaire(nos)
Nested CaseControl
121700.0 22.0 years mcmol/L
Invasive & In situ breastcancer >1.0
vs.>-1.0
50.96(0.71, 1.3)
0.71 C D E F G
incidence
Plasma Tocopherol (Vitamin E)
Pre-menopausal
Hulten,2001,BRE04155swedenVIP + MONICA + MSP
57 UnspecifiedNested CaseControl
93
Breast cancerPre-menopausal
>1.0vs.>-1.0
40.5(0.04, 6.6)
0.74 D
incidence
Post-menopausal
Hulten,2001,BRE04155swedenVIP + MONICA + MSP
67 UnspecifiedNested CaseControl
109
Breast cancerPost-menopausal
>1.0vs.>-1.0
42.9(0.7, 12.4)
0.22 D
incidence
Menopausal status not specified
Hulten,2001,BRE04155swedenVIP + MONICA + MSP
201 UnspecifiedNested CaseControl
390
Breast cancer >1.0vs.>-1.0
41.3(0.6, 2.7)
0.47 D
incidence
Serum Alpha-tocopherol
Menopausal status not specified
Dorgan,J.F.,1998,BRE14889
U S, Not specifiedColumbia Missouri BreastCancer Serum Bank, 1977
41 - 73 105Throughnetwork, paper,tv
Nested CaseControl
209 9.5 years mcmol/L
Invasive breast cancer31.33 -107.69vs.<21.59
41.2(0.5, 2.8)
0.72 D G
incidence
Sato,Reiko,2002,BRE20839
USA, Caucasian, BlooddonorsCLUE I, 1974
(51) 244Throughnetwork, paper,tv
Nested CaseControl
244 20.0 years mg/dL
Breast cancer >1.4vs.<0.9
50.94(0.52, 1.73)
0.69incidence
Serum Gamma-tocopherol
Menopausal status not specified
221

Author, Year,WCRF Code
Country, Ethnicity, Specialcharacteristics
Age Cases n Caseascertainment
Type of studyNon-Cases n
Lenght offollow-up / loss
Assessmentdetail
Additional details Unit Outcome Subgroup Contrast Nocat. OR (95% CI) p
valueptrend A B C D E F G
adjustments
Sato,Reiko,2002,BRE20839
USA, Caucasian, BlooddonorsCLUE I, 1974
(51) 244Throughnetwork, paper,tv
Nested CaseControl
244 20.0 years mg/dL
Breast cancer >0.32vs.<0.14
50.7(0.4, 1.23)
0.08incidence
Serum Tocopherol (Vitamin E)
Menopausal status not specified
Russell, M.J.,1988,BRE17990
UK, Not specifiedGuernsey G2 and G3
28 - 66
Through healthorg. (screening,healthinsurance)
Nested CaseControl
5086.0 9.0 yearsBreast cancer
1null(null, null)
incidence
Total vitamin E (diet and supplements)
Pre-menopausal
Zhang,S.,1999,BRE13953
USA, Not specified,Registered nursesNurses' Health Study (NHS)Cohort 1976-1996
33 - 60 784 By MailFFQ-Semi-quantitative
ProspectiveCohort
53938 14.0 years / 39% I.U./day
Invasive breast cancerPre-menopausal
251.0vs.5.0
51.22(0.98, 1.52)
0.007
A C D E F G
incidence
Cho, E.,2003,BRE01652
U.S, Multi-ethnic, RegisterednursesNurses' Health Study (NHS)Cohort 1976-1996
26 - 46 714 By MailFFQ-Semi-quantitative
ProspectiveCohort
90655 8.0 years mg/day
Invasive breast cancerPre-menopausal
10.0vs.6.0
51.13(0.89, 1.43)
0.49 C D E F G
incidence
Post-menopausal
Kushi, L.H.,1996,BRE05143
USA, Not specified, Post-menopausalIowa Women's Health Study
55 - 69 879 By MailFFQ-Semi-quantitative
ProspectiveCohort
34387 7.0 years / 1370 I.U./day
Breast cancerPost-menopausal
>35.66vs.<5.66
51.05(0.83, 1.33)
0.85 A B C D E F G
incidence
Zhang,S.,1999,BRE13953
USA, Not specified,Registered nursesNurses' Health Study (NHS)Cohort 1976-1996
33 - 60 1913 By MailFFQ-Semi-quantitative
ProspectiveCohort
29296 14.0 years / 39% I.U./day
Invasive breast cancerPost-menopausal
251.0vs.5.0
50.84(0.72, 0.96)
0.50 A C D E F G
incidence
Nissen, Stine,B.,2003,BRE20535
Denmark, Not specified,Post-menopausalDiet, Cancer and Health,1993
50 - 64 By Mail FFQ (nos)Case Cohort 29875.0 mg/day
Breast cancerPost-menopausal
10.0(continuous)
11.0(0.97, 1.03)
B C D E F G
incidence
Menopausal status not specified
Hunter, D.J.,1993,BRE04168
USA, Not specified,Registered nursesNurses' Health Study (NHS)Cohort 1976-1996
30 - 55 1439 By MailFFQ-Semi-quantitative
ProspectiveCohort
692675 8.0 years / 4% I.U./day
Invasive breast cancer >24.1vs.<3.8
50.9(0.77, 1.06)
0.07 A C D E F G
incidence
Zhang,S.,1999,BRE13953
USA, Not specified,Registered nursesNurses' Health Study (NHS)Cohort 1976-1996
33 - 60 689 By MailFFQ-Semi-quantitative
ProspectiveCohort
83234.0 14.0 years / 39% I.U./day
Invasive breast cancer FamilyHistory BC -No & Pre-menopausal
251.0vs.5.0
51.21(0.96, 1.53)
0.004
A C D E F G
incidence
Zhang,S.,1999,BRE13953
USA, Not specified,Registered nursesNurses' Health Study (NHS)Cohort 1976-1996
33 - 60 90 By MailFFQ-Semi-quantitative
ProspectiveCohort
83234.0 14.0 years / 39% I.U./day
Invasive breast cancer FamilyHistory BC -Yes & Pre-menopausal
251.0vs.5.0
51.41(0.69, 2.89)
0.77 A C D E F G
incidence
Vitamin E
222

Author, Year,WCRF Code
Country, Ethnicity, Specialcharacteristics
Age Cases n Caseascertainment
Type of studyNon-Cases n
Lenght offollow-up / loss
Assessmentdetail
Additional details Unit Outcome Subgroup Contrast Nocat. OR (95% CI) p
valueptrend A B C D E F G
adjustments
Pre-menopausal
Zhang,S.,1999,BRE13953
USA, Not specified,Registered nursesNurses' Health Study (NHS)Cohort 1976-1996
33 - 60 784 By MailFFQ-Semi-quantitative
ProspectiveCohort
53938 14.0 years / 39% I.U./day
Invasive breast cancerPre-menopausal
10.0vs.5.0
50.81(0.64, 1.02)
0.29 A C D E F G
incidence
Cho, E.,2003,BRE01652
U.S, Multi-ethnic, RegisterednursesNurses' Health Study (NHS)Cohort 1976-1996
26 - 46 714 By MailFFQ-Semi-quantitative
ProspectiveCohort
90655 8.0 years mg/day
Invasive breast cancerPre-menopausal
59.0vs.7.0
51.17(0.92, 1.5)
0.34 C D E F G
incidence
FrazierL.A.,2004,BRE02942
USA, Multi-ethnic,Registered nursesNurses' Health study II
34 - 51 361
Through healthorg. (screening,healthinsurance)
FFQ (nos)Historical Cohort 47517 9.0 years adolescent diet mg/day
Breast cancerPre-menopausal
15.6vs.9.8
50.61(0.42, 0.89)
0.003
A C D E F G
incidence
Post-menopausal
Graham,S.,1992,BRE03424
USA, White, Post-menopausalNew York State Cohort,1980
50 - 107 344 By Mail FFQ (nos)ProspectiveCohort
17401 8.0 years mg/month
Breast cancerPost-menopausal
278.0 -2036.0vs.30.0 - 130.0
50.86(0.61, 1.21)
A B
incidence
Kushi, L.H.,1996,BRE05143
USA, Not specified, Post-menopausalIowa Women's Health Study
55 - 69 570 By MailFFQ-Semi-quantitative
ProspectiveCohort
21782 7.0 years / 1370 I.U./day
Breast cancerPost-menopausal
>9.65vs.<4.89
51.08(0.74, 1.58)
0.32 A B C D E F G
incidence
Zhang,S.,1999,BRE13953
USA, Not specified,Registered nursesNurses' Health Study (NHS)Cohort 1976-1996
33 - 60 1913 By MailFFQ-Semi-quantitative
ProspectiveCohort
29296 14.0 years / 39% I.U./day
Invasive breast cancerPost-menopausal
10.0vs.5.0
50.96(0.83, 1.11)
0.55 A C D E F G
incidence
Nissen, Stine,B.,2003,BRE20535
Denmark, Not specified,Post-menopausalDiet, Cancer and Health,1993
50 - 64 By Mail FFQ (nos)Case Cohort 29875.0 mg/day
Breast cancerPost-menopausal
10.0(continuous)
11.13(0.61, 2.1)
B C D E F G
incidence
Menopausal status not specified
Rohan, T.E.,1993,BRE17965
Canada, Not specified,Screening ProgramCanadian National BreastScreening Study
40 - 59
Through healthorg. (screening,healthinsurance)
Dietary Historyquestionnaire
Nested CaseControl
56837.0 6.0 years mg/day
Breast cancer13.0(continuous)
11.02(0.87, 1.19)
A B C E F G
incidence
Verhoeven, D.T.,1997,BRE12868
the Netherland, Not specifiedThe Netherlands CohortStudy on diet and cancer,1986-1993
55 - 69 519Throughnetwork, paper,tv
FFQ-Semi-quantitative
Case Cohort 58664.3 years / nolost mg/day
Invasive breast cancer 19.82vs.5.96
51.25(0.85, 1.85)
0.37 A C E F G
incidence
Zhang,S.,1999,BRE13953
USA, Not specified,Registered nursesNurses' Health Study (NHS)Cohort 1976-1996
33 - 60 689 By MailFFQ-Semi-quantitative
ProspectiveCohort
83234.0 14.0 years / 39% I.U./day
Invasive breast cancer FamilyHistory BC -No & Pre-menopausal
10.0vs.5.0
50.84(0.66, 1.07)
0.43 A C D E F G
incidence
Zhang,S.,1999,BRE13953
USA, Not specified,Registered nursesNurses' Health Study (NHS)Cohort 1976-1996
33 - 60 90 By MailFFQ-Semi-quantitative
ProspectiveCohort
83234.0 14.0 years / 39% I.U./day
Invasive breast cancer FamilyHistory BC -Yes & Pre-menopausal
10.0vs.5.0
50.57(0.28, 1.15)
0.27 A C D E F G
incidence
Michels, K.B.,2001,BRE17830
Sweden, Not specified,Screening ProgramValencia, 1997
40 - 76 717 By MailFFQ-Semi-quantitative
ProspectiveCohort
59039.0 130.0 months mg/day
Invasive breast cancer
Lean9.3vs.3.8
50.86(0.56, 1.32)
0.73 A B C D E F
incidence
223

Author, Year,WCRF Code
Country, Ethnicity, Specialcharacteristics
Age Cases n Caseascertainment
Type of studyNon-Cases n
Lenght offollow-up / loss
Assessmentdetail
Additional details Unit Outcome Subgroup Contrast Nocat. OR (95% CI) p
valueptrend A B C D E F G
adjustments
Michels, K.B.,2001,BRE17830
Sweden, Not specified,Screening ProgramValencia, 1997
40 - 76 By MailFFQ-Semi-quantitative
ProspectiveCohort
59039.0 130.0 months mg/day
Invasive breast cancer 9.3vs.3.8
50.83(0.6, 1.14)
0.38 A B C D E F
incidence
Michels, K.B.,2001,BRE17830
Sweden, Not specified,Screening ProgramValencia, 1997
40 - 76 554 By MailFFQ-Semi-quantitative
ProspectiveCohort
59039.0 130.0 months mg/day
Invasive breast cancer
Overweight9.3vs.3.8
50.74(0.45, 1.19)
0.27 A B C D E F
incidence
Horn-Ross,P.L.,2002,BRE15412
USA, Multi-ethnic,Registered teachersCalifornia Teachers Study,1995
21 - 103 By Mail FFQ (nos)ProspectiveCohort
111383.0 2.0 years
Alpha-TE(tocopherolequivalent
Invasive breast cancer <204.0vs.<8.0
51.1(0.9, 1.4)
0.4 A C D E F G
incidence
FrazierL.A.,2003,BRE02941
USA, Multi-ethnic,Registered nursesNurses' Health Study (NHS)Cohort 1976-1996
40 - 65
Through healthorg. (screening,healthinsurance)
FFQ (nos)Nested CaseControl
121700.0 10.0 years adolescent I.U./day
Breast cancer 8.1vs.2.2
50.87(null, null)
0.18 A C D E F G
incidence
Li, W.,2005,BRE23123China, AsianShanghai BSE
130
Through socialorganization(profession,religion)
FFQ-Semi-quantitative
Nested CaseControl
1070
Alpha-TE(tocopherolequivalent
Breast cancer >22.9vs.<13.8
50.6(0.3, 1.3)
0.23 A
incidence
Vitamin E from supplements
Post-menopausal
Kushi, L.H.,1996,BRE05143
USA, Not specified, Post-menopausalIowa Women's Health Study
55 - 69 879 By MailFFQ-Semi-quantitative
ProspectiveCohort
34387 7.0 years / 1370 I.U./day
Breast cancerPost-menopausal
>251.0vs.<0.0
50.96(0.76, 1.23)
0.97 A B C D E F G
incidence
Nissen, Stine,B.,2003,BRE20535
Denmark, Not specified,Post-menopausalDiet, Cancer and Health,1993
50 - 64 By Mail FFQ (nos)Case Cohort 29875.0 mg/day
Breast cancerPost-menopausal
10.0(continuous)
11.0(0.96, 1.03)
B C D E F G
incidence
Menopausal status not specified
Rohan, T.E.,1993,BRE17965
Canada, Not specified,Screening ProgramCanadian National BreastScreening Study
40 - 59 519
Through healthorg. (screening,healthinsurance)
Dietary Historyquestionnaire
Nested CaseControl
1182 6.0 years mg/day
Breast cancer >4.1vs.0
31.0(0.65, 1.54)
0.708
A B C E F G
incidence
Hunter, D.J.,1993,BRE04168
USA, Not specified,Registered nursesNurses' Health Study (NHS)Cohort 1976-1996
30 - 55 By MailFFQ-Semi-quantitative
ProspectiveCohort
89494.0 8.0 years / 4% I.U./day
Invasive breast cancer >=600vs.No use
51.01(0.69, 1.49)
0.43 A C D E F G
incidence
Hunter, D.J.,1993,BRE04168
USA, Not specified,Registered nursesNurses' Health Study (NHS)Cohort 1976-1996
30 - 55 By MailFFQ-Semi-quantitative
ProspectiveCohort
89494.0 8.0 years / 4% supplement duration Years/life
Invasive breast cancer >=10vs.no use
51.19(0.85, 1.66)
0.17 A C D E F G
incidence
Zhang,S.,1999,BRE13953
USA, Not specified,Registered nursesNurses' Health Study (NHS)Cohort 1976-1996
33 - 60 2523 By MailFFQ-Semi-quantitative
ProspectiveCohort
77925 14.0 years / 39% I.U./day
Invasive breast cancer >=600vs.never user
50.92(0.7, 1.21)
A C D E F G
incidence
5.5.13
224

Author, Year,WCRF Code
Country, Ethnicity, Specialcharacteristics
Age Cases n Caseascertainment
Type of studyNon-Cases n
Lenght offollow-up / loss
Assessmentdetail
Additional details Unit Outcome Subgroup Contrast Nocat. OR (95% CI) p
valueptrend A B C D E F G
adjustments
Antioxidant indices
Menopausal status not specified
Horn-Ross,P.L.,2002,BRE15412
USA, Multi-ethnic,Registered teachersCalifornia Teachers Study,1995
21 - 103 By Mail FFQ (nos)ProspectiveCohort
111383.0 2.0 years from fruits andvegetables
Invasive breast cancer Quantile 5vs.<8.3
51.0(0.7, 1.2)
0.8 A C D E F G
incidence
Multivitamin supplement
Post-menopausal
Feigelson, H.S.,2003,BRE02720
U.S, Not specifiedCPS-II US cohort, 1982-1998
1303 By MailFFQ-Semi-quantitative
ProspectiveCohort
65258 6.0 years / 7592 dichotomous
Breast cancerPost-menopausal
any use in1982 and1992vs.
41.02(0.89, 1.17)
A B C D E F G
incidence
Wilfart, E etal.,2005,BRE11111
Sweden, Post menopausalMalmo Diet and Cancer,1991
50 - (59) 237 Cancer registry7-day Record +Questionnaire
Nested CaseControl
673Dietary supplementsuse
Breast cancerPost-menopausal
yesvs.no
20.8(0.57, 1.12)
A
incidence
Menopausal status not specified
Hunter, D.J.,1993,BRE04168
USA, Not specified,Registered nursesNurses' Health Study (NHS)Cohort 1976-1996
30 - 55 By MailFFQ-Semi-quantitative
ProspectiveCohort
89494.0 8.0 years / 4% supplement duration Years/life
Invasive breast cancer >=10vs.no use
51.0(0.83, 1.2)
0.99 A C D E F G
incidence
Wu, K.,1999,BRE13618
USA, Not specified, BlooddonorsCLUE I, 1974
18 - 90 133Throughnetwork, paper,tv
Questionnaire(nos)
Nested CaseControl
133 21.0 years dichotomous
Breast cancer evervs.never
31.25(0.67, 2.36)
incidence
Wu, K.,1999,BRE63618
USA, Not specified, BlooddonorsCLUE II, 1989
18 - 90 110Throughnetwork, paper,tv
Questionnaire(nos)
Nested CaseControl
110 6.0 years dichotomous
Breast cancer evervs.never
30.77(0.42, 1.43)
incidence
Zhang,S.,1999,BRE13953
USA, Not specified,Registered nursesNurses' Health Study (NHS)Cohort 1976-1996
33 - 60 2523 By MailFFQ-Semi-quantitative
ProspectiveCohort
77925 14.0 years / 39% Years/life
Invasive breast cancercurrent user,>=10vs.never user
60.96(0.85, 1.09)
A C D E F G
incidence
Other vitamins (including multivitamins)
Menopausal status not specified
FrazierL.A.,2003,BRE02941
USA, Multi-ethnic,Registered nursesNurses' Health Study (NHS)Cohort 1976-1996
40 - 65
Through healthorg. (screening,healthinsurance)
FFQ (nos)Nested CaseControl
121700.0 10.0 years adolescentserving/day
Breast cancer1.0(continuous)
11.04(0.84, 1.28)
A C D E F G
incidence
Vitamin B supplement
Menopausal status not specified
Wu, K.,1999,BRE13618
USA, Not specified, BlooddonorsCLUE I, 1974
18 - 90 133Throughnetwork, paper,tv
Questionnaire(nos)
Nested CaseControl
133 21.0 years dichotomous
Breast cancer evervs.never
31.06(0.47, 2.38)
incidence
225

Author, Year,WCRF Code
Country, Ethnicity, Specialcharacteristics
Age Cases n Caseascertainment
Type of studyNon-Cases n
Lenght offollow-up / loss
Assessmentdetail
Additional details Unit Outcome Subgroup Contrast Nocat. OR (95% CI) p
valueptrend A B C D E F G
adjustments
Wu, K.,1999,BRE63618
USA, Not specified, BlooddonorsCLUE II, 1989
18 - 90 110Throughnetwork, paper,tv
Questionnaire(nos)
Nested CaseControl
110 6.0 years dichotomous
Breast cancer evervs.never
30.57(0.27, 1.21)
incidence
Wu, K.,1999,BRE63618
USA, Not specified, BlooddonorsCLUE II, 1989
18 - 90Throughnetwork, paper,tv
Questionnaire(nos)
Nested CaseControl
14625.0 6.0 yearsBreast cancer >-1.0
vs.>1.0
50.79(0.33, 1.9)
incidence
5.5.2
Carotenoids diet+supplement
Post-menopausal
Kushi, L.H.,1996,BRE05143
USA, Not specified, Post-menopausalIowa Women's Health Study
55 - 69 879 By MailFFQ-Semi-quantitative
ProspectiveCohort
34387 7.0 years / 1370 I.U./day
Breast cancerPost-menopausal
>13470.0vs.<4425.0
50.88(0.7, 1.12)
0.98 A B C D E F G
incidence
Lutein
Menopausal status not specified
Horn-Ross,P.L.,2002,BRE15412
USA, Multi-ethnic,Registered teachersCalifornia Teachers Study,1995
21 - 103 By Mail FFQ (nos)ProspectiveCohort
111383.0 2.0 years mcg/day
Invasive breast cancer <1782.0vs.<576.0
51.2(0.9, 1.6)
0.3 A C D E F G
incidence
Lutein and zeaxanthin
Pre-menopausal
Zhang,S.,1999,BRE13953
USA, Not specified,Registered nursesNurses' Health Study (NHS)Cohort 1976-1996
33 - 60 784 By MailFFQ-Semi-quantitative
ProspectiveCohort
53938 14.0 years / 39% mcg/day
Invasive breast cancerPre-menopausal
8796.0vs.1376.0
50.79(0.63, 0.99)
0.04 A C D E F G
incidence
Terry,P.,2002,BRE12200
Canada, Not specified,Screening ProgramCanadian National BreastScreening Study
672Throughnetwork, paper,tv
FFQ-Quantitative
Case Cohort 56837.0SDUnits/day
Breast cancerPre-menopausal
1.0(continuous)
11.01(0.92, 1.12)
A B C D E F G
incidence
Cho, E.,2003,BRE01652
U.S, Multi-ethnic, RegisterednursesNurses' Health Study (NHS)Cohort 1976-1996
26 - 46 714 By MailFFQ-Semi-quantitative
ProspectiveCohort
90655 8.0 years mcg/day
Invasive breast cancerPre-menopausal
5939.0vs.1006.0
50.96(0.75, 1.22)
0.82 C D E F G
incidence
Post-menopausal
Zhang,S.,1999,BRE13953
USA, Not specified,Registered nursesNurses' Health Study (NHS)Cohort 1976-1996
33 - 60 1913 By MailFFQ-Semi-quantitative
ProspectiveCohort
29296 14.0 years / 39% mcg/day
Invasive breast cancerPost-menopausal
8796.0vs.1376.0
50.95(0.82, 1.1)
012 A C D E F G
incidence
Terry,P.,2002,BRE12200
Canada, Not specified,Screening ProgramCanadian National BreastScreening Study
575Throughnetwork, paper,tv
FFQ-Quantitative
Case Cohort 56837.0SDUnits/day
Breast cancerPost-menopausal
1.0(continuous)
11.02(0.9, 1.15)
A B C D E F G
incidence
Menopausal status not specified
226

Author, Year,WCRF Code
Country, Ethnicity, Specialcharacteristics
Age Cases n Caseascertainment
Type of studyNon-Cases n
Lenght offollow-up / loss
Assessmentdetail
Additional details Unit Outcome Subgroup Contrast Nocat. OR (95% CI) p
valueptrend A B C D E F G
adjustments
Zhang,S.,1999,BRE13953
USA, Not specified,Registered nursesNurses' Health Study (NHS)Cohort 1976-1996
33 - 60 689 By MailFFQ-Semi-quantitative
ProspectiveCohort
83234.0 14.0 years / 39% mcg/day
Invasive breast cancer FamilyHistory BC -No & Pre-menopausal
8796.0vs.1376.0
50.88(0.69, 1.12)
0.32 A C D E F G
incidence
Zhang,S.,1999,BRE13953
USA, Not specified,Registered nursesNurses' Health Study (NHS)Cohort 1976-1996
33 - 60 90 By MailFFQ-Semi-quantitative
ProspectiveCohort
83234.0 14.0 years / 39% mcg/day
Invasive breast cancer FamilyHistory BC -Yes & Pre-menopausal
8796.0vs.1376.0
50.38(0.18, 0.81)
0.004
A C D E F G
incidence
Terry,P.,2002,BRE12200
Canada, Not specified,Screening ProgramCanadian National BreastScreening Study
1184Throughnetwork, paper,tv
FFQ-Quantitative
Case Cohort 56837.0SDUnits/day
Breast cancer FamilyHistory BC -No
1.0(continuous)
10.99(0.92, 1.07)
A B C D E F G
incidence
Terry,P.,2002,BRE12200
Canada, Not specified,Screening ProgramCanadian National BreastScreening Study
268Throughnetwork, paper,tv
FFQ-Quantitative
Case Cohort 56837.0SDUnits/day
Breast cancer FamilyHistory BC -Yes
1.0(continuous)
11.24(0.87, 1.75)
A B C D E F G
incidence
Terry,P.,2002,BRE12200
Canada, Not specified,Screening ProgramCanadian National BreastScreening Study
492Throughnetwork, paper,tv
FFQ-Quantitative
Case Cohort 56837.0SDUnits/day
Breast cancer
Lean1.0(continuous)
11.0(0.9, 1.11)
A B C E F G
incidence
Terry,P.,2002,BRE12200
Canada, Not specified,Screening ProgramCanadian National BreastScreening Study
1452Throughnetwork, paper,tv
FFQ-Quantitative
Case Cohort 63278 mcg/day
Breast cancer 6838.0vs.1219.0
51.17(0.9, 1.53)
0.14 A B C D E F G
incidence
Terry,P.,2002,BRE12200
Canada, Not specified,Screening ProgramCanadian National BreastScreening Study
542Throughnetwork, paper,tv
FFQ-Quantitative
Case Cohort 56837.0SDUnits/day
Breast cancer
Overweight1.0(continuous)
10.99(0.89, 1.13)
A B C E F G
incidence
Lycopene
Pre-menopausal
Zhang,S.,1999,BRE13953
USA, Not specified,Registered nursesNurses' Health Study (NHS)Cohort 1976-1996
33 - 60 784 By MailFFQ-Semi-quantitative
ProspectiveCohort
53938 14.0 years / 39% mcg/day
Invasive breast cancerPre-menopausal
12688.0vs.1520.0
51.1(0.87, 1.38)
0.34 A C D E F G
incidence
Terry,P.,2002,BRE12200
Canada, Not specified,Screening ProgramCanadian National BreastScreening Study
672Throughnetwork, paper,tv
FFQ-Quantitative
Case Cohort 56837.0SDUnits/day
Breast cancerPre-menopausal
1.0(continuous)
10.99(0.88, 1.11)
A B C D E F G
incidence
Cho, E.,2003,BRE01652
U.S, Multi-ethnic, RegisterednursesNurses' Health Study (NHS)Cohort 1976-1996
26 - 46 714 By MailFFQ-Semi-quantitative
ProspectiveCohort
90655 8.0 years mcg/day
Invasive breast cancerPre-menopausal
15745.0vs.3570.0
51.17(0.92, 1.49)
0.06 C D E F G
incidence
Post-menopausal
Zhang,S.,1999,BRE13953
USA, Not specified,Registered nursesNurses' Health Study (NHS)Cohort 1976-1996
33 - 60 1913 By MailFFQ-Semi-quantitative
ProspectiveCohort
29296 14.0 years / 39% mcg/day
Invasive breast cancerPost-menopausal
12688.0vs.1520.0
51.02(0.88, 1.18)
0.97 A C D E F G
incidence
227

Author, Year,WCRF Code
Country, Ethnicity, Specialcharacteristics
Age Cases n Caseascertainment
Type of studyNon-Cases n
Lenght offollow-up / loss
Assessmentdetail
Additional details Unit Outcome Subgroup Contrast Nocat. OR (95% CI) p
valueptrend A B C D E F G
adjustments
Terry,P.,2002,BRE12200
Canada, Not specified,Screening ProgramCanadian National BreastScreening Study
575Throughnetwork, paper,tv
FFQ-Quantitative
Case Cohort 56837.0SDUnits/day
Breast cancerPost-menopausal
1.0(continuous)
11.02(0.9, 1.16)
A B C D E F G
incidence
Menopausal status not specified
Zhang,S.,1999,BRE13953
USA, Not specified,Registered nursesNurses' Health Study (NHS)Cohort 1976-1996
33 - 60 689 By MailFFQ-Semi-quantitative
ProspectiveCohort
83234.0 14.0 years / 39% mcg/day
Invasive breast cancer FamilyHistory BC -No & Pre-menopausal
12688.0vs.1520.0
51.05(0.82, 1.34)
0.43 A C D E F G
incidence
Zhang,S.,1999,BRE13953
USA, Not specified,Registered nursesNurses' Health Study (NHS)Cohort 1976-1996
33 - 60 90 By MailFFQ-Semi-quantitative
ProspectiveCohort
83234.0 14.0 years / 39% mcg/day
Invasive breast cancer FamilyHistory BC -Yes & Pre-menopausal
12688.0vs.1520.0
51.42(0.7, 2.88)
0.75 A C D E F G
incidence
Terry,P.,2002,BRE12200
Canada, Not specified,Screening ProgramCanadian National BreastScreening Study
1184Throughnetwork, paper,tv
FFQ-Quantitative
Case Cohort 56837.0SDUnits/day
Breast cancer FamilyHistory BC -No
1.0(continuous)
10.99(0.91, 1.06)
A B C D E F G
incidence
Terry,P.,2002,BRE12200
Canada, Not specified,Screening ProgramCanadian National BreastScreening Study
268Throughnetwork, paper,tv
FFQ-Quantitative
Case Cohort 56837.0SDUnits/day
Breast cancer FamilyHistory BC -Yes
1.0(continuous)
11.23(0.98, 1.53)
A B C D E F G
incidence
Terry,P.,2002,BRE12200
Canada, Not specified,Screening ProgramCanadian National BreastScreening Study
492Throughnetwork, paper,tv
FFQ-Quantitative
Case Cohort 56837.0SDUnits/day
Breast cancer
Lean1.0(continuous)
10.9(0.77, 1.09)
A B C E F G
incidence
Terry,P.,2002,BRE12200
Canada, Not specified,Screening ProgramCanadian National BreastScreening Study
1451Throughnetwork, paper,tv
FFQ-Quantitative
Case Cohort 63152 mcg/day
Breast cancer 23748.0vs.2283.0
51.14(0.9, 1.41)
0.85 A B C D E F G
incidence
Terry,P.,2002,BRE12200
Canada, Not specified,Screening ProgramCanadian National BreastScreening Study
542Throughnetwork, paper,tv
FFQ-Quantitative
Case Cohort 56837.0SDUnits/day
Breast cancer
Overweight1.0(continuous)
11.01(0.89, 1.14)
A B C E F G
incidence
Horn-Ross,P.L.,2002,BRE15412
USA, Multi-ethnic,Registered teachersCalifornia Teachers Study,1995
21 - 103 By Mail FFQ (nos)ProspectiveCohort
111383.0 2.0 years mcg/day
Invasive breast cancer <2777.0vs.<910.0
50.9(0.7, 1.1)
0.5 A C D E F G
incidence
Sesso H.D.,2005,BRE74061
USA, Not specified, HealthprofessionalsWomen's Health Study, 1993
1076
Through healthorg. (screening,healthinsurance)
FFQ-Semi-quantitative
ProspectiveCohort
38447.0 9.9 years median lycopeneintake
mcg/day
Breast cancer 16741.0vs.3326.0
51.0(0.8, 1.25)
0.71 A C D E F G
incidence
Sesso H.D.,2005,BRE74061
USA, Not specified, HealthprofessionalsWomen's Health Study, 1993
719
Through healthorg. (screening,healthinsurance)
FFQ-Semi-quantitative
ProspectiveCohort
38447.0 9.9 years median lycopeneintake
mcg/day
Breast cancer ER+/PR+ 16741.0vs.3326.0
51.12(0.85, 1.47)
0.16 A C D E F G
incidence
Plasma Carotenoids (total)
Menopausal status not specified
228

Author, Year,WCRF Code
Country, Ethnicity, Specialcharacteristics
Age Cases n Caseascertainment
Type of studyNon-Cases n
Lenght offollow-up / loss
Assessmentdetail
Additional details Unit Outcome Subgroup Contrast Nocat. OR (95% CI) p
valueptrend A B C D E F G
adjustments
Sato,Reiko,2002,BRE70839
USA, Caucasian, BlooddonorsCLUE II, 1989
(60) 115Throughnetwork, paper,tv
Nested CaseControl
115 3.0 years mcg/dL
Breast cancer >123.8vs.<67.0
50.61(0.26, 1.43)
0.25incidence
Tamimi, R.M.,2004,BRE12084
USA, Multi-ethnic,Registered nursesNurses' Health Study (NHS)Cohort 1976-1996
30 - 55 254
Through socialorganization(profession,religion)
Nested CaseControl
235 8.0 yearsBreast cancer
Val/Val(MnSOD)
>1.0vs.>-1.0
30.93(0.59, 1.47)
C D E F G
incidence
Tamimi, R.M.,2005,BRE24274
U.S.A., Registered nursesNurses' Health Study (NHS)Cohort 1976-1996
43 - 70Direct contactat home
Questionnaire(nos)
Nested CaseControl
121700.0 22.0 years mcmol/L
Invasive & In situ breastcancer >1.0
vs.>-1.0
50.76(0.55, 1.05)
0.05 C D E F G
incidence
Plasma Lutein
Pre-menopausal
Hulten,2001,BRE04155swedenVIP + MONICA + MSP
57 UnspecifiedNested CaseControl
93
Breast cancerPre-menopausal
>1.0vs.>-1.0
40.3(0.1, 1.4)
0.03 D
incidence
Post-menopausal
Hulten,2001,BRE04155swedenVIP + MONICA + MSP
67 UnspecifiedNested CaseControl
109
Breast cancerPost-menopausal
>1.0vs.>-1.0
40.9(0.3, 2.6)
0.73 D
incidence
Menopausal status not specified
Hulten,2001,BRE04155swedenVIP + MONICA + MSP
201 UnspecifiedNested CaseControl
390
Breast cancer >1.0vs.>-1.0
41.0(0.6, 1.7)
0.73 D
incidence
Sato,Reiko,2002,BRE70839
USA, Caucasian, BlooddonorsCLUE II, 1989
(60) 115Throughnetwork, paper,tv
Nested CaseControl
115 3.0 years mcg/dL
Breast cancer >30.9vs.<16.4
50.4(0.17, 0.98)
0.11incidence
Plasma Lycopene
Pre-menopausal
Hulten,2001,BRE04155swedenVIP + MONICA + MSP
57 UnspecifiedNested CaseControl
93
Breast cancerPre-menopausal
>1.0vs.>-1.0
41.2(0.3, 4.8)
0.85 D
incidence
Post-menopausal
Hulten,2001,BRE04155swedenVIP + MONICA + MSP
67 UnspecifiedNested CaseControl
109
Breast cancerPost-menopausal
>1.0vs.>-1.0
42.4(0.7, 7.9)
0.53 D
incidence
Menopausal status not specified
229

Author, Year,WCRF Code
Country, Ethnicity, Specialcharacteristics
Age Cases n Caseascertainment
Type of studyNon-Cases n
Lenght offollow-up / loss
Assessmentdetail
Additional details Unit Outcome Subgroup Contrast Nocat. OR (95% CI) p
valueptrend A B C D E F G
adjustments
Hulten,2001,BRE04155swedenVIP + MONICA + MSP
201 UnspecifiedNested CaseControl
390
Breast cancer >1.0vs.>-1.0
41.0(0.6, 1.8)
0.54 D
incidence
Sato,Reiko,2002,BRE70839
USA, Caucasian, BlooddonorsCLUE II, 1989
(60) 115Throughnetwork, paper,tv
Nested CaseControl
115 3.0 years mcg/dL
Breast cancer >49.1vs.<23.5
50.8(0.34, 1.85)
0.57incidence
Tamimi, R.M.,2004,BRE12084
USA, Multi-ethnic,Registered nursesNurses' Health Study (NHS)Cohort 1976-1996
30 - 55 254
Through socialorganization(profession,religion)
Nested CaseControl
235 8.0 yearsBreast cancer
Val/Val(MnSOD)
>1.0vs.>-1.0
31.22(0.77, 1.92)
C D E F G
incidence
Sesso D.H.,2005,BRE24061
USA, Not specified, HealthprofessionalsWomen's Health Study, 1993
Through healthorg. (screening,healthinsurance)
Nested CaseControl
28345.0 7.0 years median plasmalycopene
g/dl
Breast cancer >13.1vs.<7.2
40.93(0.56, 1.52)
0.86 C D E F G
incidence
Sesso D.H.,2005,BRE24061
USA, Not specified, HealthprofessionalsWomen's Health Study, 1993
Through healthorg. (screening,healthinsurance)
Nested CaseControl
28345.0 7.0 years median plasmalycopene
g/dl
Breast cancer >13.1vs.<7.2
40.94(0.56, 1.57)
0.91 C D E F G
incidence
Sesso D.H.,2005,BRE24061
USA, Not specified, HealthprofessionalsWomen's Health Study, 1993
Through healthorg. (screening,healthinsurance)
Nested CaseControl
28345.0 7.0 years median plasmalycopene
g/dl
Breast cancer >13.1vs.<7.2
40.91(0.55, 1.51)
0.81 C D E F G
incidence
Sesso D.H.,2005,BRE24061
USA, Not specified, HealthprofessionalsWomen's Health Study, 1993
Through healthorg. (screening,healthinsurance)
Nested CaseControl
28345.0 7.0 years median plasmalycopene
g/dl
Breast cancer >13.1vs.<7.2
40.92(0.55, 1.54)
0.87 C D E F G
incidence
Sesso D.H.,2005,BRE24061
USA, Not specified, HealthprofessionalsWomen's Health Study, 1993
Through healthorg. (screening,healthinsurance)
Nested CaseControl
28345.0 7.0 years median plasmalycopene
g/dl
Breast cancer >13.1vs.<7.2
40.92(0.55, 1.54)
0.87 C D E F G
incidence
Sesso D.H.,2005,BRE24061
USA, Not specified, HealthprofessionalsWomen's Health Study, 1993
344
Through healthorg. (screening,healthinsurance)
Nested CaseControl
344 7.0 years median plasmalycopene
g/dl
Breast cancer ER+/PR+ >13.1vs.<7.2
40.9(0.47, 1.71)
0.8 C D E F G
incidence
Tamimi, R.M.,2005,BRE24274
U.S.A., Registered nursesNurses' Health Study (NHS)Cohort 1976-1996
43 - 70Direct contactat home
Questionnaire(nos)
Nested CaseControl
121700.0 22.0 years mcmol/L
Invasive & In situ breastcancer >1.0
vs.>-1.0
51.01(0.73, 1.39)
0.53 C D E F G
incidence
Plasma Zeaxanthin
Pre-menopausal
Hulten,2001,BRE04155swedenVIP + MONICA + MSP
57 UnspecifiedNested CaseControl
93
Breast cancerPre-menopausal
>1.0vs.>-1.0
40.7(0.2, 3.3)
0.25 D
incidence
Post-menopausal
230

Author, Year,WCRF Code
Country, Ethnicity, Specialcharacteristics
Age Cases n Caseascertainment
Type of studyNon-Cases n
Lenght offollow-up / loss
Assessmentdetail
Additional details Unit Outcome Subgroup Contrast Nocat. OR (95% CI) p
valueptrend A B C D E F G
adjustments
Hulten,2001,BRE04155swedenVIP + MONICA + MSP
67 UnspecifiedNested CaseControl
109
Breast cancerPost-menopausal
>1.0vs.>-1.0
40.4(0.1, 1.4)
0.28 D
incidence
Menopausal status not specified
Hulten,2001,BRE04155swedenVIP + MONICA + MSP
201 UnspecifiedNested CaseControl
390
Breast cancer >1.0vs.>-1.0
40.8(0.5, 1.4)
0.54 D
incidence
Sesso D.H.,2005,BRE24061
USA, Not specified, HealthprofessionalsWomen's Health Study, 1993
Through healthorg. (screening,healthinsurance)
Nested CaseControl
28345.0 7.0 years plasmalutein/zeaxanthin
g/dl
Breast cancer 28.8vs.9.7
40.78(0.45, 1.38)
0.4 C D E F G
incidence
Tamimi, R.M.,2005,BRE24274
U.S.A., Registered nursesNurses' Health Study (NHS)Cohort 1976-1996
43 - 70Direct contactat home
Questionnaire(nos)
Nested CaseControl
121700.0 22.0 years mcmol/L
Invasive & In situ breastcancer >1.0
vs.>-1.0
50.74(0.55, 1.01)
0.04 C D E F G
incidence
Serum lutein
Menopausal status not specified
Toniolo,P.,2001,BRE12399
US, Not specifiedNew York Women's HealthStudy, 1985
35 - 65
Through healthorg. (screening,healthinsurance)
Nested CaseControl
14275.0 mcg/dL
Breast cancer Quantile 4vs.Quantile 4
41.0(null, null)
0.01 C F G
incidence
Sato,Reiko,2002,BRE20839
USA, Caucasian, BlooddonorsCLUE I, 1974
(51) 244Throughnetwork, paper,tv
Nested CaseControl
244 20.0 years mcg/dL
Breast cancer >32.2vs.<13.6
50.77(0.43, 1.4)
.41incidence
Serum Lutein & Zeaxanthin
Menopausal status not specified
Dorgan,J.F.,1998,BRE14889
U S, Not specifiedColumbia Missouri BreastCancer Serum Bank, 1977
41 - 73 105Throughnetwork, paper,tv
Nested CaseControl
209 9.5 years mcmol/L
Invasive breast cancer 0.6 - 2.43vs.<0.35
40.9(0.4, 1.8)
.11 D G
incidence
Tamimi, R.M.,2004,BRE12084
USA, Multi-ethnic,Registered nursesNurses' Health Study (NHS)Cohort 1976-1996
30 - 55 254
Through socialorganization(profession,religion)
Nested CaseControl
235 8.0 yearsBreast cancer
Val/Val(MnSOD)
>1.0vs.>-1.0
30.67(0.42, 1.06)
C D E F G
incidence
Serum lycopene
Menopausal status not specified
Dorgan,J.F.,1998,BRE14889
U S, Not specifiedColumbia Missouri BreastCancer Serum Bank, 1977
41 - 73 105Throughnetwork, paper,tv
Nested CaseControl
209 9.5 years mcmol/L
Invasive breast cancer 0.51 - 1.75vs.<0.22
40.5(0.2, 1.2)
0.02 D G
incidence
Toniolo,P.,2001,BRE12399
US, Not specifiedNew York Women's HealthStudy, 1985
35 - 65
Through healthorg. (screening,healthinsurance)
Nested CaseControl
14275.0 mcg/dL
Breast cancer Quantile 4vs.Quantile 4
41.0(null, null)
0.15 C F G
incidence
231

Author, Year,WCRF Code
Country, Ethnicity, Specialcharacteristics
Age Cases n Caseascertainment
Type of studyNon-Cases n
Lenght offollow-up / loss
Assessmentdetail
Additional details Unit Outcome Subgroup Contrast Nocat. OR (95% CI) p
valueptrend A B C D E F G
adjustments
Sato,Reiko,2002,BRE20839
USA, Caucasian, BlooddonorsCLUE I, 1974
(51) 244Throughnetwork, paper,tv
Nested CaseControl
244 20.0 years mcg/dL
Breast cancer >49.3vs.<20.0
50.55(0.29, 1.06)
0.04incidence
Serum total carotenoids
Menopausal status not specified
Toniolo,P.,2001,BRE12399
US, Not specifiedNew York Women's HealthStudy, 1985
35 - 65
Through healthorg. (screening,healthinsurance)
Nested CaseControl
14275.0 mcg/dL
Breast cancer Quantile 4vs.Quantile 4
41.0(null, null)
0.0008
C F G
incidence
Sato,Reiko,2002,BRE20839
USA, Caucasian, BlooddonorsCLUE I, 1974
(51) 244Throughnetwork, paper,tv
Nested CaseControl
244 20.0 years mcg/dL
Breast cancer >121.6vs.<51.4
50.55(0.29, 1.03)
0.02incidence
Serum Zeaxanthin
Menopausal status not specified
Toniolo,P.,2001,BRE12399
US, Not specifiedNew York Women's HealthStudy, 1985
35 - 65
Through healthorg. (screening,healthinsurance)
Nested CaseControl
14275.0 mcg/dL
Breast cancer Quantile 4vs.Quantile 4
41.0(null, null)
0.54 C F G
incidence
Total carotenoids
Pre-menopausal
Zhang,S.,1999,BRE13953
USA, Not specified,Registered nursesNurses' Health Study (NHS)Cohort 1976-1996
33 - 60 784 By MailFFQ-Semi-quantitative
ProspectiveCohort
53938 14.0 years / 39% I.U./day
Invasive breast cancerPre-menopausal
4680.0vs.1037.0
50.84(0.67, 1.05)
0.06 A C D E F G
incidence
Cho, E.,2003,BRE01652
U.S, Multi-ethnic, RegisterednursesNurses' Health Study (NHS)Cohort 1976-1996
26 - 46 714 By MailFFQ-Semi-quantitative
ProspectiveCohort
90655 8.0 years I.U./day
Invasive breast cancerPre-menopausal
16963.0vs.3414.0
50.91(0.71, 1.16)
0.76 C D E F G
incidence
Post-menopausal
Kushi, L.H.,1996,BRE05143
USA, Not specified, Post-menopausalIowa Women's Health Study
55 - 69 599 By MailFFQ-Semi-quantitative
ProspectiveCohort
22776 7.0 years / 1370 I.U./day
Breast cancerPost-menopausal
>13048.0vs.<4348.0
51.17(0.87, 1.56)
0.12 A B C D E F G
incidence
Zhang,S.,1999,BRE13953
USA, Not specified,Registered nursesNurses' Health Study (NHS)Cohort 1976-1996
33 - 60 1913 By MailFFQ-Semi-quantitative
ProspectiveCohort
29296 14.0 years / 39% I.U./day
Invasive breast cancerPost-menopausal
4680.0vs.1037.0
50.95(0.82, 1.1)
0.38 A C D E F G
incidence
Menopausal status not specified
Zhang,S.,1999,BRE13953
USA, Not specified,Registered nursesNurses' Health Study (NHS)Cohort 1976-1996
33 - 60 689 By MailFFQ-Semi-quantitative
ProspectiveCohort
83234.0 14.0 years / 39% I.U./day
Invasive breast cancer FamilyHistory BC -No & Pre-menopausal
4680.0vs.1037.0
50.93(0.73, 1.19)
0.41 A C D E F G
incidence
232

Author, Year,WCRF Code
Country, Ethnicity, Specialcharacteristics
Age Cases n Caseascertainment
Type of studyNon-Cases n
Lenght offollow-up / loss
Assessmentdetail
Additional details Unit Outcome Subgroup Contrast Nocat. OR (95% CI) p
valueptrend A B C D E F G
adjustments
Zhang,S.,1999,BRE13953
USA, Not specified,Registered nursesNurses' Health Study (NHS)Cohort 1976-1996
33 - 60 90 By MailFFQ-Semi-quantitative
ProspectiveCohort
83234.0 14.0 years / 39% I.U./day
Invasive breast cancer FamilyHistory BC -Yes & Pre-menopausal
4680.0vs.1037.0
50.38(0.19, 0.77)
0.001
A C D E F G
incidence
FrazierL.A.,2003,BRE02941
USA, Multi-ethnic,Registered nursesNurses' Health Study (NHS)Cohort 1976-1996
40 - 65
Through healthorg. (screening,healthinsurance)
FFQ (nos)Nested CaseControl
121700.0 10.0 years adolescent I.U./day
Breast cancer 9253.0vs.1053.0
51.1(null, null)
0.65 A C D E F G
incidence
Li, W.,2005,BRE23123China, AsianShanghai BSE
130
Through socialorganization(profession,religion)
FFQ-Semi-quantitative
Nested CaseControl
1070 mcg/day
Breast cancer >1450.6vs.<873.9
50.7(0.3, 1.9)
0.56 A
incidence
5.5.3
Dietary folate
Post-menopausal
TjonnelandA.,2006,BRE80104
Denmark, Post-menopausalDiet, Cancer and Health,1993
50 - 64 388 Cancer registry FFQNested CaseControl
388 Dietary folatemicrog/day
Breast cancer >400vs.<=250
50.8(0.37, 1.69)
B C D E G
incidence
Stolzenberg-Solomon,R.Z.,2006,BRE80113
United States, Post-menopausalPLCO Cancer ScreeningTrial cohort, 1993
55 - 74 691Cancerscreeningprogramme
FFQ (nos)ProspectiveCohort
31411.0 4.94 yearsNatural folate fromfoods that were notfortified
microg/day
Breast cancer >337.1vs.<233.6
50.98(0.78, 1.24)
0.63 A B E F
incidence
Stolzenberg-Solomon,R.Z.,2006,BRE80113
United States, Post-menopausalPLCO Cancer ScreeningTrial cohort, 1993
55 - 74 700Cancerscreeningprogramme
FFQ (nos)ProspectiveCohort
31411.0 4.94 yearsFolate form foods,included natural folateand added folic acid
microg/day
Breast cancer >412.0vs.<261.3
51.04(0.83, 1.31)
0.56 A B E F
incidence
Stolzenberg-Solomon,R.Z.,2006,BRE80113
United States, Post-menopausalPLCO Cancer ScreeningTrial cohort, 1993
55 - 74 91Cancerscreeningprogramme
FFQ (nos)ProspectiveCohort
31411.0 4.94 yearsNatural folate fromfoods that were notfortified
microg/day
Breast cancernon-vitaminsusers
>322.1vs.<221.0
51.01(0.54, 1.89)
0.81 A B E F
incidence
Stolzenberg-Solomon,R.Z.,2006,BRE80113
United States, Post-menopausalPLCO Cancer ScreeningTrial cohort, 1993
55 - 74 91Cancerscreeningprogramme
FFQ (nos)ProspectiveCohort
31411.0 4.94 yearsFolate from foods,included natural folateand added folic acid
microg/day
Breast cancernon-vitaminsusers
>395.1vs.<244.0
51.2(0.66, 2.19)
0.23 A B E F
incidence
Lajous, M. etal.,2006,BRE80135
France, Post menopausalE3N-EPIC, 1990
1812
patientrecords/directcontact/healthinsurance
FFQProspectiveCohort
62739.0 9.0 years / 0.01 Dietary folate intake mcg/day
Invasive & In situ breastcancer 522.0
vs.296.0
50.78(0.67, 0.9)
0.001
A B C D E F G
incidence
Lajous, M. etal.,2006,BRE80135
France, Post menopausalE3N-EPIC, 1990
596
patientrecords/directcontact/healthinsurance
FFQProspectiveCohort
62739.0 9.0 years / 0.01 Dietary folate intake mcg/day
Invasive & In situ breastcancer Vit B-12
intake11.6mcg/day
522.0vs.296.0
50.62(0.47, 0.81)
0.02 A B C D E F G
incidence
Lajous, M. etal.,2006,BRE80135
France, Post menopausalE3N-EPIC, 1990
601
patientrecords/directcontact/healthinsurance
FFQProspectiveCohort
62739.0 9.0 years / 0.01 Dietary folate intake mcg/day
Invasive & In situ breastcancer Vit B-12
intake4.2mcg/day
522.0vs.296.0
50.92(0.7, 1.2)
0.44 A B C D E F G
incidence
233

Author, Year,WCRF Code
Country, Ethnicity, Specialcharacteristics
Age Cases n Caseascertainment
Type of studyNon-Cases n
Lenght offollow-up / loss
Assessmentdetail
Additional details Unit Outcome Subgroup Contrast Nocat. OR (95% CI) p
valueptrend A B C D E F G
adjustments
Lajous, M. etal.,2006,BRE80135
France, Post menopausalE3N-EPIC, 1990
615
patientrecords/directcontact/healthinsurance
FFQProspectiveCohort
62739.0 9.0 years / 0.01 Dietary folate intake mcg/day
Invasive & In situ breastcancer Vit B-12
intake6.7mcg/day
522.0vs.296.0
50.73(0.56, 0.97)
0.01 A B C D E F G
incidence
Menopausal status not specified
ZhangS.M.,2005,BRE24752
USA, Not specified,Registered nursesNurses' Health Study (NHS)Cohort 1976-1996
30 - 55 2812
Through socialorganization(profession,religion)
FFQ-Semi-quantitative
ProspectiveCohort
88744.0 20.0 years mcg/day
Breast cancer ER+ >332.1vs.<205.9
51.15(1.01, 1.3)
0.05 A C D E F G
incidence
ZhangS.M.,2005,BRE24752
USA, Not specified,Registered nursesNurses' Health Study (NHS)Cohort 1976-1996
30 - 55 438
Through socialorganization(profession,religion)
FFQ-Semi-quantitative
ProspectiveCohort
88744.0 20.0 years subgroup:alcohol >=15g/d
mcg/day
Breast cancer ER+
Other>332.1vs.<205.9
51.06(0.77, 1.47)
0.74 A C D E F G
incidence
ZhangS.M.,2005,BRE24752
USA, Not specified,Registered nursesNurses' Health Study (NHS)Cohort 1976-1996
30 - 55 2374
Through socialorganization(profession,religion)
FFQ-Semi-quantitative
ProspectiveCohort
88744.0 20.0 years subgroup:alcohol <15g/d
mcg/day
Breast cancer ER+
Other>332.1vs.<205.9
51.16(1.02, 1.33)
0.04 A C D E F G
incidence
ZhangS.M.,2005,BRE24752
USA, Not specified,Registered nursesNurses' Health Study (NHS)Cohort 1976-1996
30 - 55 985
Through socialorganization(profession,religion)
FFQ-Semi-quantitative
ProspectiveCohort
88744.0 20.0 years mcg/day
Breast cancer ER- >332.1vs.<205.9
50.97(0.79, 1.18)
0.34 A C D E F G
incidence
ZhangS.M.,2005,BRE24752
USA, Not specified,Registered nursesNurses' Health Study (NHS)Cohort 1976-1996
30 - 55 129
Through socialorganization(profession,religion)
FFQ-Semi-quantitative
ProspectiveCohort
88744.0 20.0 years subgroup:alcohol >=15g/d
mcg/day
Breast cancer ER-
Other>332.1vs.<205.9
50.66(0.36, 1.21)
0.06 A C D E F G
incidence
ZhangS.M.,2005,BRE24752
USA, Not specified,Registered nursesNurses' Health Study (NHS)Cohort 1976-1996
30 - 55 856
Through socialorganization(profession,religion)
FFQ-Semi-quantitative
ProspectiveCohort
88744.0 20.0 years subgroup:alcohol <15g/d
mcg/day
Breast cancer ER-
Other>332.1vs.<205.9
51.04(0.83, 1.28)
0.85 A C D E F G
incidence
ZhangS.M.,2005,BRE24752
USA, Not specified,Registered nursesNurses' Health Study (NHS)Cohort 1976-1996
30 - 55 2256
Through socialorganization(profession,religion)
FFQ-Semi-quantitative
ProspectiveCohort
88744.0 20.0 years mcg/day
Breast cancer PR+ >332.1vs.<205.9
51.09(0.95, 1.26)
0.55 A C D E F G
incidence
ZhangS.M.,2005,BRE24752
USA, Not specified,Registered nursesNurses' Health Study (NHS)Cohort 1976-1996
30 - 55 344
Through socialorganization(profession,religion)
FFQ-Semi-quantitative
ProspectiveCohort
88744.0 20.0 years subgroup: alcohol>=15g/d
mcg/day
Breast cancer PR+
Other>332.1vs.<205.9
50.98(0.69, 1.4)
0.63 A C D E F G
incidence
ZhangS.M.,2005,BRE24752
USA, Not specified,Registered nursesNurses' Health Study (NHS)Cohort 1976-1996
30 - 55 1912
Through socialorganization(profession,religion)
FFQ-Semi-quantitative
ProspectiveCohort
88744.0 20.0 years subgroup: alcohol<15g/d
mcg/day
Breast cancer PR+
Other>332.1vs.<205.9
51.12(0.97, 1.3)
0.37 A C D E F G
incidence
ZhangS.M.,2005,BRE24752
USA, Not specified,Registered nursesNurses' Health Study (NHS)Cohort 1976-1996
30 - 55 1361
Through socialorganization(profession,religion)
FFQ-Semi-quantitative
ProspectiveCohort
88744.0 20.0 years mcg/day
Breast cancer PR- >332.1vs.<205.9
51.08(0.91, 1.29)
0.42 A C D E F G
incidence
ZhangS.M.,2005,BRE24752
USA, Not specified,Registered nursesNurses' Health Study (NHS)Cohort 1976-1996
30 - 55 188
Through socialorganization(profession,religion)
FFQ-Semi-quantitative
ProspectiveCohort
88744.0 20.0 years subgroup: alcohol>=15g/d
mcg/day
Breast cancer PR-
Other>332.1vs.<205.9
50.76(0.45, 1.27)
0.29 A C D E F G
incidence
234

Author, Year,WCRF Code
Country, Ethnicity, Specialcharacteristics
Age Cases n Caseascertainment
Type of studyNon-Cases n
Lenght offollow-up / loss
Assessmentdetail
Additional details Unit Outcome Subgroup Contrast Nocat. OR (95% CI) p
valueptrend A B C D E F G
adjustments
ZhangS.M.,2005,BRE24752
USA, Not specified,Registered nursesNurses' Health Study (NHS)Cohort 1976-1996
30 - 55 1173
Through socialorganization(profession,religion)
FFQ-Semi-quantitative
ProspectiveCohort
88744.0 20.0 years subgroup: alcohol<15g/d
mcg/day
Breast cancer PR-
Other>332.1vs.<205.9
51.14(0.95, 1.38)
0.16 A C D E F G
incidence
Folate
Post-menopausal
Ericson, U. etal.,2007,BRE80128
Sweden, Post menopausalMalmo Diet and Cancer,1991
50 - 392 Cancer registryDietary Historyquestionnaire
ProspectiveCohort
11699.0 9.5 years
Dietary folateequivalents, food folate+ 1.7 x folic acid fromsupplements
mcg/day
Invasive breast cancer50 years andolder
582.0vs.160.0
50.59(0.36, 0.97)
0.01 A B C D E F G
incidence
Folate diet+supplement
Pre-menopausal
Cho, E.,2003,BRE01652
U.S, Multi-ethnic, RegisterednursesNurses' Health Study (NHS)Cohort 1976-1996
26 - 46 714 By MailFFQ-Semi-quantitative
ProspectiveCohort
90655 8.0 years mcg/day
Invasive breast cancerPre-menopausal
826.0vs.228.0
51.03(0.81, 1.32)
0.96 C D E F G
incidence
Post-menopausal
Feigelson, H.S.,2003,BRE02720
U.S, Not specifiedCPS-II US cohort, 1982-1998
1303 By MailFFQ-Semi-quantitative
ProspectiveCohort
65258 6.0 years / 7592 mcg/day
Breast cancerPost-menopausal
>603.7vs.<209.7
41.1(0.94, 1.29)
A B C D E F G
incidence
Stolzenberg-Solomon,R. Z.,2004,BRE18746
, Not specified, Post-menopausalPLCO Cancer ScreeningTrial cohort, 1993
55 - 74 777
Through healthorg. (screening,healthinsurance)
Questionnaire(nos)
ProspectiveCohort
28210 4.94 yearsBreast cancer
Post-menopausal
5th quintilevs.1st quintile
21.18(0.9, 1.55)
.14 A B C E F G
incidence
TjonnelandA.,2006,BRE80104
Denmark, Post-menopausalDiet, Cancer and Health,1993
50 - 64 388 Cancer registry FFQNested CaseControl
388 Total folate intakemicrog/day
Breast cancer >400vs.<=300
50.6(0.35, 1.06)
B C D E G
incidence
Stolzenberg-Solomon,R.Z.,2006,BRE80113
United States, Post-menopausalPLCO Cancer ScreeningTrial cohort, 1993
55 - 74 691Cancerscreeningprogramme
FFQ (nos)ProspectiveCohort
31411.0 4.94 years Total folate, foods andsupplements combined
microg/day
Breast cancer >853.1vs.<335.5
51.32(1.04, 1.68)
0.03 A B D E F
incidence
Ericson, U. etal.,2007,BRE80128
Sweden, Post menopausalMalmo Diet and Cancer,1991
50 - 392 Cancer registryDietary Historyquestionnaire
ProspectiveCohort
11699.0 9.5 years Total folate intake,including supplement
mcg/day
Invasive breast cancer50 years andolder
456.0vs.160.0
50.56(0.34, 0.91)
0.006
A B C D E F G
incidence
Menopausal status not specified
ZhangS.M.,2005,BRE24752
USA, Not specified,Registered nursesNurses' Health Study (NHS)Cohort 1976-1996
30 - 55 2812
Through socialorganization(profession,religion)
FFQ-Semi-quantitative
ProspectiveCohort
88744.0 20.0 years mcg/day
Breast cancer ER+ >534.0vs.<228.0
51.0(0.89, 1.14)
0.83 A C D E F G
incidence
ZhangS.M.,2005,BRE24752
USA, Not specified,Registered nursesNurses' Health Study (NHS)Cohort 1976-1996
30 - 55 438
Through socialorganization(profession,religion)
FFQ-Semi-quantitative
ProspectiveCohort
88744.0 20.0 years subgroup: alcohol>=15g/d
mcg/day
Breast cancer ER+
Other>534.0vs.<228.0
51.0(0.73, 1.37)
0.81 A C D E F G
incidence
235

Author, Year,WCRF Code
Country, Ethnicity, Specialcharacteristics
Age Cases n Caseascertainment
Type of studyNon-Cases n
Lenght offollow-up / loss
Assessmentdetail
Additional details Unit Outcome Subgroup Contrast Nocat. OR (95% CI) p
valueptrend A B C D E F G
adjustments
ZhangS.M.,2005,BRE24752
USA, Not specified,Registered nursesNurses' Health Study (NHS)Cohort 1976-1996
30 - 55 2374
Through socialorganization(profession,religion)
FFQ-Semi-quantitative
ProspectiveCohort
88744.0 20.0 years subgroup: alcoho<15g/d
mcg/day
Breast cancer ER+
Other>534.0vs.<228.0
51.01(0.88, 1.15)
0.94 A C D E F G
incidence
ZhangS.M.,2005,BRE24752
USA, Not specified,Registered nursesNurses' Health Study (NHS)Cohort 1976-1996
30 - 55 985
Through socialorganization(profession,religion)
FFQ-Semi-quantitative
ProspectiveCohort
88744.0 20.0 years mcg/day
Breast cancer ER- >534.0vs.<228.0
50.81(0.66, 0.99)
0.03 A C D E F G
incidence
ZhangS.M.,2005,BRE24752
USA, Not specified,Registered nursesNurses' Health Study (NHS)Cohort 1976-1996
30 - 55 129
Through socialorganization(profession,religion)
FFQ-Semi-quantitative
ProspectiveCohort
88744.0 20.0 years subgroup: alcohol>=15g/d
mcg/day
Breast cancer ER-
Other>534.0vs.<228.0
50.46(0.25, 0.86)
0.03 A C D E F G
incidence
ZhangS.M.,2005,BRE24752
USA, Not specified,Registered nursesNurses' Health Study (NHS)Cohort 1976-1996
30 - 55 856
Through socialorganization(profession,religion)
FFQ-Semi-quantitative
ProspectiveCohort
88744.0 20.0 years subgroup: alcoho<15g/d
mcg/day
Breast cancer ER-
Other>534.0vs.<228.0
50.88(0.71, 1.1)
0.15 A C D E F G
incidence
ZhangS.M.,2005,BRE24752
USA, Not specified,Registered nursesNurses' Health Study (NHS)Cohort 1976-1996
30 - 55 2256
Through socialorganization(profession,religion)
FFQ-Semi-quantitative
ProspectiveCohort
88744.0 20.0 years mcg/day
Breast cancer PR+ >534.0vs.<228.0
50.95(0.83, 1.09)
0.24 A C D E F G
incidence
ZhangS.M.,2005,BRE24752
USA, Not specified,Registered nursesNurses' Health Study (NHS)Cohort 1976-1996
30 - 55 344
Through socialorganization(profession,religion)
FFQ-Semi-quantitative
ProspectiveCohort
88744.0 20.0 years subgroup: alcohol>=15g/d
mcg/day
Breast cancer PR+
Other>534.0vs.<228.0
50.9(0.63, 1.27)
0.56 A C D E F G
incidence
ZhangS.M.,2005,BRE24752
USA, Not specified,Registered nursesNurses' Health Study (NHS)Cohort 1976-1996
30 - 55 1912
Through socialorganization(profession,religion)
FFQ-Semi-quantitative
ProspectiveCohort
88744.0 20.0 years subgroup: alcohol<15g/d
mcg/day
Breast cancer PR+
Other>534.0vs.<228.0
50.97(0.83, 1.12)
0.33 A C D E F G
incidence
ZhangS.M.,2005,BRE24752
USA, Not specified,Registered nursesNurses' Health Study (NHS)Cohort 1976-1996
30 - 55 1361
Through socialorganization(profession,religion)
FFQ-Semi-quantitative
ProspectiveCohort
88744.0 20.0 years mcg/day
Breast cancer PR- >534.0vs.<228.0
50.97(0.82, 1.16)
0.79 A C D E F G
incidence
ZhangS.M.,2005,BRE24752
USA, Not specified,Registered nursesNurses' Health Study (NHS)Cohort 1976-1996
30 - 55 188
Through socialorganization(profession,religion)
FFQ-Semi-quantitative
ProspectiveCohort
88744.0 20.0 years subgroup: alcohol>=15g/d
mcg/day
Breast cancer PR-
Other>534.0vs.<228.0
50.81(0.51, 1.31)
0.31 A C D E F G
incidence
ZhangS.M.,2005,BRE24752
USA, Not specified,Registered nursesNurses' Health Study (NHS)Cohort 1976-1996
30 - 55 1173
Through socialorganization(profession,religion)
FFQ-Semi-quantitative
ProspectiveCohort
88744.0 20.0 years subgroup: alcohol<15g/d
mcg/day
Breast cancer PR-
Other>534.0vs.<228.0
51.01(0.83, 1.21)
0.85 A C D E F G
incidence
folate from foods and supplements
Pre-menopausal
Cho, E. etal.,2007,BRE80152
United States, Pre-menopausalNHS II, 1989
26 - 46 221Self reportverified bymedical record
semi-quantitative ffq
ProspectiveCohort
90663.0 12.0 years
Total folate, from foodsand supplemetns,cumulative averagedenergy-adjusted
mcg/day
Breast cancer ER-Pre-menopausal
822.0vs.237.0
51.08(0.7, 1.66)
0.85 A C D E F G
incidence
Cho, E. etal.,2007,BRE80152
United States, Pre-menopausalNHS II, 1989
26 - 46 1032Self reportverified bymedical record
semi-quantitative ffq
ProspectiveCohort
90663.0 12.0 yearsTotal folate, cumulativeaveraged energy-adjusted
mcg/day
Invasive breast cancerPre-menopausal
822.0vs.237.0
51.09(0.88, 1.34)
0.31 A C D E F G
incidence
236

Author, Year,WCRF Code
Country, Ethnicity, Specialcharacteristics
Age Cases n Caseascertainment
Type of studyNon-Cases n
Lenght offollow-up / loss
Assessmentdetail
Additional details Unit Outcome Subgroup Contrast Nocat. OR (95% CI) p
valueptrend A B C D E F G
adjustments
Folate Supplement
Post-menopausal
TjonnelandA.,2006,BRE80104
Denmark, Post-menopausalDiet, Cancer and Health,1993
50 - 64 388 Cancer registry FFQNested CaseControl
388 Folate supplementmicrog/day
Breast cancer >100vs.0
40.74(0.47, 1.17)
B C D E G
incidence
Stolzenberg-Solomon,R.Z.,2006,BRE80113
United States, Post-menopausalPLCO Cancer ScreeningTrial cohort, 1993
55 - 74 691Cancerscreeningprogramme
FFQ (nos)ProspectiveCohort
31411.0 4.94 years Supplemental folicacid, current or past 2y
microg/day
Breast cancer >=400vs.0
31.19(1.01, 1.41)
0.04 A F
incidence
Folates and associated compounds
Pre-menopausal
Rohan, T.E.,2000,BRE17968
Canada, Not specifiedCanadian National BreastScreening Study
287 UnspecifiedFFQ-Quantitative
Case Cohort 23848 13.0 years mcg/day
Invasive breast cancerPre-menopausal
>354.28vs.<224.77
51.72(0.97, 3.06)
0.32 A C E F G
incidence
Cho, E.,2003,BRE01652
U.S, Multi-ethnic, RegisterednursesNurses' Health Study (NHS)Cohort 1976-1996
26 - 46 714 By MailFFQ-Semi-quantitative
ProspectiveCohort
90655 8.0 years mcg/day
Invasive breast cancerPre-menopausal
429.0vs.210.0
51.07(0.82, 1.38)
0.94 C D E F G
incidence
FrazierL.A.,2004,BRE02942
USA, Multi-ethnic,Registered nursesNurses' Health study II
34 - 51 361
Through healthorg. (screening,healthinsurance)
FFQ (nos)Historical Cohort 47517 9.0 years adolescent diet mcg/day
Breast cancerPre-menopausal
437.9vs.225.6
50.88(0.63, 1.24)
0.66 A C D E F G
incidence
Post-menopausal
Rohan, T.E.,2000,BRE17968
Canada, Not specifiedCanadian National BreastScreening Study
817 UnspecifiedFFQ-Quantitative
Case Cohort 433496 13.0 years mcg/day
Invasive breast cancerPost-menopausal
>354.28vs.<224.77
50.92(0.71, 1.2)
0.57 A C E F G
incidence
Feigelson, H.S.,2003,BRE02720
U.S, Not specifiedCPS-II US cohort, 1982-1998
1303 By MailFFQ-Semi-quantitative
ProspectiveCohort
65258 6.0 years / 7592 mcg/day
Breast cancerPost-menopausal
>294.3vs.<178.7
41.07(0.91, 1.27)
A B C D E F G
incidence
Sellers, T.A.,2004,BRE18027
USA, Not specified, Post-menopausalIowa Women's Health Study
55 - 69 1515 By MailFFQ-Semi-quantitative
ProspectiveCohort
366701 14.0 years mcg/day
Breast cancer FamilyHistory BC -No & Post-menopausal
<=172vs.>294
41.11(0.9, 1.38)
0.59 A B C D E F G
incidence
Sellers, T.A.,2004,BRE18027
USA, Not specified, Post-menopausalIowa Women's Health Study
55 - 69 1091 By MailFFQ-Semi-quantitative
ProspectiveCohort
233521 14.0 years mcg/day
Breast cancer FamilyHistory BC -Yes & Post-menopausal
<=172vs.>294
52.26(1.59, 3.21)
0.005
A B C D E F G
incidence
Mattisson,I.,2004,BRE17807
Sweden, Not specified, Post-menopausalMalmo Diet and Cancer,1991
50 - 342
Through healthorg. (screening,healthinsurance)
7-day Record +Questionnaire
ProspectiveCohort
11328 7.6 yearsBreast cancer
Post-menopausal
1null(null, null)
incidence
Sellers, T.A.,2004,BRE18027
USA, Not specified, Post-menopausalIowa Women's Health Study
55 - 69 1875 By MailFFQ-Semi-quantitative
ProspectiveCohort
33552 14.0 years mcg/day
Breast cancerPost-menopausal
<=172vs.>294
41.19(0.98, 1.45)
0.20 A B C D E F G
incidence
237

Author, Year,WCRF Code
Country, Ethnicity, Specialcharacteristics
Age Cases n Caseascertainment
Type of studyNon-Cases n
Lenght offollow-up / loss
Assessmentdetail
Additional details Unit Outcome Subgroup Contrast Nocat. OR (95% CI) p
valueptrend A B C D E F G
adjustments
Menopausal status not specified
Zhang,S.,1999,BRE13954
US, Not specified,Registered nursesNurses' Health Study (NHS)Cohort 1976-1996
30 - 55 530 By MailFFQ-Semi-quantitative
ProspectiveCohort
167706 16.0 years subgroup alcohol lmorethan 15g/day
Breast cancerH nutr/foodintake
>=600vs.150-299
50.55(0.39, 0.76)
0.001
A C D E F G
incidence
Zhang,S.,1999,BRE13954
US, Not specified,Registered nursesNurses' Health Study (NHS)Cohort 1976-1996
30 - 55 2953 By MailFFQ-Semi-quantitative
ProspectiveCohort
1160275 16.0 years subgroup alcohol less15g/day
Breast cancerL nutr/foodintake
>=600vs.150-299
50.98(0.88, 1.1)
0.74 A C D E F G
incidence
Zhang,S.,1999,BRE13954
US, Not specified,Registered nursesNurses' Health Study (NHS)Cohort 1976-1996
30 - 55 3483 By MailFFQ-Semi-quantitative
ProspectiveCohort
1327981 16.0 yearsBreast cancer >=600
vs.150-299
50.91(0.82, 1.01)
.11 A C D E F G
incidence
Rohan, T.E.,2000,BRE17968
Canada, Not specifiedCanadian National BreastScreening Study
298 UnspecifiedFFQ-Quantitative
Case Cohort 110322 13.0 years alcohol intake >14g/day
mcg/day
Invasive breast cancerH nutr/foodintake
>354.28vs.<224.77
50.34(0.18, 0.61)
0.004
A C E F G
incidence
Rohan, T.E.,2000,BRE17968
Canada, Not specifiedCanadian National BreastScreening Study
178 UnspecifiedFFQ-Quantitative
Case Cohort 81649 13.0 years alcohol intake >14g/day
mcg/day
Invasive breast cancer H nutr/foodintake &Post-menopausal
>354.28vs.<224.77
50.28(0.14, 0.55)
0.003
A C E F G
incidence
Rohan, T.E.,2000,BRE17968
Canada, Not specifiedCanadian National BreastScreening Study
69 UnspecifiedFFQ-Quantitative
Case Cohort 6403 13.0 years alcohol intake >14g/day
mcg/day
Invasive breast cancer H nutr/foodintake & Pre-menopausal
>354.28vs.<224.77
50.47(0.04, 6.01)
0.65 A C E F G
incidence
Rohan, T.E.,2000,BRE17968
Canada, Not specifiedCanadian National BreastScreening Study
1038 UnspecifiedFFQ-Quantitative
Case Cohort 455869 13.0 years alcohol intake <=14g/day
mcg/day
Invasive breast cancerL nutr/foodintake
>354.28vs.<224.77
51.22(0.94, 1.58)
0.34 A C E F G
incidence
Rohan, T.E.,2000,BRE17968
Canada, Not specifiedCanadian National BreastScreening Study
639 UnspecifiedFFQ-Quantitative
Case Cohort 351848 13.0 years alcohol intake <=14g/day
mcg/day
Invasive breast cancer L nutr/foodintake &Post-menopausal
>354.28vs.<224.77
51.15(0.86, 1.54)
0.57 A C E F G
incidence
Rohan, T.E.,2000,BRE17968
Canada, Not specifiedCanadian National BreastScreening Study
218 UnspecifiedFFQ-Quantitative
Case Cohort 43743 13.0 years alcohol intake<=14g/day
mcg/day
Invasive breast cancer L nutr/foodintake & Pre-menopausal
>354.28vs.<224.77
51.31(0.7, 2.47)
0.88 A C E F G
incidence
Rohan, T.E.,2000,BRE17968
Canada, Not specifiedCanadian National BreastScreening Study
1336 UnspecifiedFFQ-Quantitative
Case Cohort 566191 13.0 years mcg/day
Invasive breast cancer >354.28vs.<224.77
50.99(0.79, 1.25)
0.88 A C E F G
incidence
FrazierL.A.,2003,BRE02941
USA, Multi-ethnic,Registered nursesNurses' Health Study (NHS)Cohort 1976-1996
40 - 65
Through healthorg. (screening,healthinsurance)
FFQ (nos)Nested CaseControl
121700.0 10.0 years adolescent mcg/day
Breast cancer 238.0vs.81.9
50.86(null, null)
0.21 A C D E F G
incidence
Folates, dietary only
Pre-menopausal
238

Author, Year,WCRF Code
Country, Ethnicity, Specialcharacteristics
Age Cases n Caseascertainment
Type of studyNon-Cases n
Lenght offollow-up / loss
Assessmentdetail
Additional details Unit Outcome Subgroup Contrast Nocat. OR (95% CI) p
valueptrend A B C D E F G
adjustments
Cho, E. etal.,2007,BRE80152
United States, Pre-menopausalNHS II, 1989
26 - 46 221Self reportverified bymedical record
semi-quantitative ffq
ProspectiveCohort
90663.0 12.0 yearsFolate from foods only,cumulative averagedenergy-adjusted
mcg/day
Breast cancer ER-Pre-menopausal
436.0vs.217.0
51.16(0.73, 1.85)
0.53 A C D E F G
incidence
Cho, E. etal.,2007,BRE80152
United States, Pre-menopausalNHS II, 1989
26 - 46 1032Self reportverified bymedical record
semi-quantitative ffq
ProspectiveCohort
90663.0 12.0 yearsFolate from foods only,cumulative averagedenergy-adjusted
mcg/day
Invasive breast cancerPre-menopausal
436.0vs.217.0
51.08(0.86, 1.35)
0.77 A C D E F G
incidence
Post-menopausal
Ericson, U. etal.,2007,BRE80128
Sweden, Post menopausalMalmo Diet and Cancer,1991
50 - 392 Cancer registryDietary Historyquestionnaire
ProspectiveCohort
11699.0 9.5 years Dietary folate intake mcg/day
Invasive breast cancer50 years andolder
302.0vs.153.0
50.56(0.35, 0.9)
0.02 A B C D E F G
incidence
Plasma Cystein
Pre-menopausal
Zhang, S.M.,2003,BRE13959
USA, Not specified,Registered nursesNurses' Health Study (NHS)Cohort 1976-1996
43 - 69 149 By MailNested CaseControl
155 8.0 years / 0.01 nanomol/ml
Breast cancerPre-menopausal
125.0(continuous)
10.33(0.13, 0.83)
C D E F G
incidence
Post-menopausal
Zhang, S.M.,2003,BRE13959
USA, Not specified,Registered nursesNurses' Health Study (NHS)Cohort 1976-1996
43 - 69 487 By MailNested CaseControl
484 8.0 years / 0.01 nanomol/ml
Breast cancerPost-menopausal
125.0(continuous)
10.72(0.47, 1.12)
C D E F G
incidence
Menopausal status not specified
Zhang, S.M.,2003,BRE13959
USA, Not specified,Registered nursesNurses' Health Study (NHS)Cohort 1976-1996
43 - 69 593 By MailNested CaseControl
637 8.0 years / 0.01 nanomol/ml
Breast cancer FamilyHistory BC -No
125.0(continuous)
10.67(0.45, 1.0)
C D E F G
incidence
Zhang, S.M.,2003,BRE13959
USA, Not specified,Registered nursesNurses' Health Study (NHS)Cohort 1976-1996
43 - 69 119 By MailNested CaseControl
75 8.0 years / 0.01 nanomol/ml
Breast cancer FamilyHistory BC -Yes
125.0(continuous)
10.53(0.24, 1.14)
C D E F G
incidence
Zhang, S.M.,2003,BRE13959
USA, Not specified,Registered nursesNurses' Health Study (NHS)Cohort 1976-1996
43 - 69 387 By MailNested CaseControl
401 8.0 years / 0.01 nanomol/ml
Breast cancer
Lean125.0(continuous)
10.52(0.33, 0.81)
C D E F G
incidence
Zhang, S.M.,2003,BRE13959
USA, Not specified,Registered nursesNurses' Health Study (NHS)Cohort 1976-1996
43 - 69 325 By MailNested CaseControl
311 8.0 years / 0.01 nanomol/ml
Breast cancer
Overweight125.0(continuous)
10.88(0.56, 1.4)
C D E F G
incidence
Zhang, S.M.,2003,BRE13959
USA, Not specified,Registered nursesNurses' Health Study (NHS)Cohort 1976-1996
43 - 69 712 By MailNested CaseControl
712 8.0 years / 0.01 nanomol/ml
Invasive & In situ breastcancer >352.0
vs.<258.0
50.44(0.26, 0.74)
0.002
C D E F G
incidence
Zhang, S.M.,2003,BRE13959
USA, Not specified,Registered nursesNurses' Health Study (NHS)Cohort 1976-1996
43 - 69 600 By MailNested CaseControl
600 8.0 years / 0.01 nanomol/ml
Invasive breast cancer >352.0vs.<258.0
50.38(0.19, 0.76)
0.01 C D E F G
incidence
239

Author, Year,WCRF Code
Country, Ethnicity, Specialcharacteristics
Age Cases n Caseascertainment
Type of studyNon-Cases n
Lenght offollow-up / loss
Assessmentdetail
Additional details Unit Outcome Subgroup Contrast Nocat. OR (95% CI) p
valueptrend A B C D E F G
adjustments
Plasma Folate
Menopausal status not specified
Zhang, S.M.,2003,BRE13958
US, Not specified,Registered nursesNurses' Health Study (NHS)Cohort 1976-1996
43 - 69 624 By MailFFQ-Semi-quantitative
Nested CaseControl
629 40.0 months Alcohol < 15 g/day ng/ml
Breast cancerL nutr/foodintake
>1.0vs.>-1.0
50.72(0.49, 1.05)
0.05 C D E F G
incidence
Zhang, S.M.,2003,BRE13958
US, Not specified,Registered nursesNurses' Health Study (NHS)Cohort 1976-1996
43 - 69 71 By MailFFQ-Semi-quantitative
Nested CaseControl
71 40.0 months Alcohol, >= 15 g/day ng/ml
Breast cancerL nutr/foodintake
>-1.0vs.>1.0
50.11(0.02, 0.59)
0.01 C D E F G
incidence
Zhang, S.M.,2003,BRE13958
US, Not specified,Registered nursesNurses' Health Study (NHS)Cohort 1976-1996
43 - 69 712 By MailFFQ-Semi-quantitative
Nested CaseControl
712 40.0 months ng/ml
Breast cancer >14.0vs.<4.59
50.73(0.5, 1.07)
0.06 C D E F G
incidence
Han, J.L.,2004,BRE18437
USA, Multi-ethnic,Registered nursesNurses' Health Study (NHS)Cohort 1976-1996
30 - 55 637
Through socialorganization(profession,religion)
Nested CaseControl
598 6.0 yearsBreast cancer 194Trp non
carriers(XRCCI ArgTrp)
>1.0vs.>-1.0
40.77(0.55, 1.07)
0.09 C D E F G
incidence
Han, J.L.,2004,BRE18437
USA, Multi-ethnic,Registered nursesNurses' Health Study (NHS)Cohort 1976-1996
30 - 55 581
Through socialorganization(profession,religion)
Nested CaseControl
593 6.0 years
other = 188His XRCCnon carriers(dimenticatoinserimento nei TEMP)
Breast cancer
Other>1.0vs.>-1.0
40.74(0.52, 1.05)
0.09 C D E F G
incidence
Plasma Homocysteine
Menopausal status not specified
Zhang, S.M.,2003,BRE13958
US, Not specified,Registered nursesNurses' Health Study (NHS)Cohort 1976-1996
43 - 69 715 By MailFFQ-Semi-quantitative
Nested CaseControl
712 40.0 months unit=nmol/L TEMP
Breast cancer >13.0vs.<8.19
50.87(0.59, 1.28)
0.67 C D E F G
incidence
RBC Folate
Menopausal status not specified
RossiE.,2006,BRE23932
Australia, CaucasianBusselton (WesternAustralia) Health Survey,1969
40 - 90Generalpopulation(survey)
Questionnaire(nos)
ProspectiveCohort
1024.0 24970.0 years mcg/liter
Breast cancer-100.0(continuous)
10.98(0.65, 1.47)
0.94 A C D E F G
cancer death
RossiE.,2006,BRE23932
Australia, CaucasianBusselton (WesternAustralia) Health Survey,1969
40 - 90Generalpopulation(survey)
Questionnaire(nos)
ProspectiveCohort
1024.0 24970.0 years mcg/liter
Breast cancer-100.0(continuous)
11.96(1.22, 3.12)
0.009
A C D E F G
incidence
Serum Cysteine
Menopausal status not specified
Goodman, J.E.,2001,BRE03354
USA, CaucasianWashington county, 1989
(60) By MailNested CaseControl
null serum cysteine
Breast cancer
COMP H/L 1null(null, null)
incidence
240

Author, Year,WCRF Code
Country, Ethnicity, Specialcharacteristics
Age Cases n Caseascertainment
Type of studyNon-Cases n
Lenght offollow-up / loss
Assessmentdetail
Additional details Unit Outcome Subgroup Contrast Nocat. OR (95% CI) p
valueptrend A B C D E F G
adjustments
Goodman, J.E.,2001,BRE03354
USA, CaucasianWashington county, 1989
(60) By MailNested CaseControl
null
Breast cancer
COMP HH 1null(null, null)
incidence
Goodman, J.E.,2001,BRE03354
USA, CaucasianWashington county, 1989
(60) By MailNested CaseControl
null serum cysteine
Breast cancer
COMP LL 1null(null, null)
incidence
Serum Folate
Pre-menopausal
Wu, K.,1999,BRE13618
USA, Not specified, BlooddonorsCLUE I, 1974
18 - 90 57Throughnetwork, paper,tv
Questionnaire(nos)
Nested CaseControl
57 21.0 yearsBreast cancer
Pre-menopausal
>-1.0vs.>1.0
51.57(0.49, 4.96)
0.71incidence
Post-menopausal
Wu, K.,1999,BRE13618
USA, Not specified, BlooddonorsCLUE I, 1974
18 - 90 63Throughnetwork, paper,tv
Questionnaire(nos)
Nested CaseControl
63 21.0 yearsBreast cancer
Post-menopausal
>-1.0vs.>1.0
50.66(0.17, 2.6)
0.79incidence
Menopausal status not specified
Wu, K.,1999,BRE13618
USA, Not specified, BlooddonorsCLUE I, 1974
18 - 90Throughnetwork, paper,tv
Questionnaire(nos)
Nested CaseControl
12450.0 21.0 yearsBreast cancer >-1.0
vs.>1.0
51.08(0.5, 2.37)
0.73incidence
Goodman, J.E.,2001,BRE03354
USA, CaucasianWashington county, 1989
(60) By MailNested CaseControl
null
Breast cancer
COMP H/L 1null(null, null)
incidence
Goodman, J.E.,2001,BRE03354
USA, CaucasianWashington county, 1989
(60) By MailNested CaseControl
null
Breast cancer
COMP HH 1null(null, null)
incidence
Goodman, J.E.,2001,BRE03354
USA, CaucasianWashington county, 1989
(60) By MailNested CaseControl
null
Breast cancer
COMP LL 1null(null, null)
incidence
RossiE.,2006,BRE23932
Australia, CaucasianBusselton (WesternAustralia) Health Survey,1969
40 - 90Generalpopulation(survey)
Questionnaire(nos)
ProspectiveCohort
1024.0 24970.0 years mcg/liter
Breast cancer-2.0(continuous)
11.3(0.77, 2.17)
0.32 A C D E F G
cancer death
RossiE.,2006,BRE23932
Australia, CaucasianBusselton (WesternAustralia) Health Survey,1969
40 - 90Generalpopulation(survey)
Questionnaire(nos)
ProspectiveCohort
1024.0 24970.0 years mcg/liter
Breast cancer-2.0(continuous)
11.41(0.86, 2.27)
0.17 A C D E F G
incidence
Serum Homocysteine
Pre-menopausal
241

Author, Year,WCRF Code
Country, Ethnicity, Specialcharacteristics
Age Cases n Caseascertainment
Type of studyNon-Cases n
Lenght offollow-up / loss
Assessmentdetail
Additional details Unit Outcome Subgroup Contrast Nocat. OR (95% CI) p
valueptrend A B C D E F G
adjustments
Wu, K.,1999,BRE13618
USA, Not specified, BlooddonorsCLUE I, 1974
18 - 90 57Throughnetwork, paper,tv
Questionnaire(nos)
Nested CaseControl
57 21.0 yearsBreast cancer
Pre-menopausal
>-1.0vs.>1.0
52.55(0.72, 9.06)
0.05incidence
Post-menopausal
Wu, K.,1999,BRE13618
USA, Not specified, BlooddonorsCLUE I, 1974
18 - 90 63Throughnetwork, paper,tv
Questionnaire(nos)
Nested CaseControl
63 21.0 yearsBreast cancer
Post-menopausal
>-1.0vs.>1.0
51.35(0.42, 4.31)
0.25incidence
Menopausal status not specified
Wu, K.,1999,BRE13618
USA, Not specified, BlooddonorsCLUE I, 1974
18 - 90Throughnetwork, paper,tv
Questionnaire(nos)
Nested CaseControl
12450.0 21.0 yearsBreast cancer >-1.0
vs.>1.0
52.08(0.91, 4.78)
0.02incidence
Goodman, J.E.,2001,BRE03354
USA, CaucasianWashington county, 1989
(60) By MailNested CaseControl
null
Breast cancer
COMP H/L 1null(null, null)
incidence
Goodman, J.E.,2001,BRE03354
USA, CaucasianWashington county, 1989
(60) By MailNested CaseControl
null
Breast cancer
COMP HH 1null(null, null)
incidence
Goodman, J.E.,2001,BRE03354
USA, CaucasianWashington county, 1989
(60) By MailNested CaseControl
null
Breast cancer
COMP LL 1null(null, null)
incidence
5.5.7
Plasma Pyridoxine (vitamin B6)
Menopausal status not specified
Zhang, S.M.,2003,BRE13958
US, Not specified,Registered nursesNurses' Health Study (NHS)Cohort 1976-1996
43 - 69 712 By MailFFQ-Semi-quantitative
Nested CaseControl
712 40.0 months pmol/ml
Breast cancer >95.3vs.<28.49
50.7(0.48, 1.02)
0.09 C D E F G
incidence
Serum Pyridoxine (vitamin B6)
Pre-menopausal
Wu, K.,1999,BRE13618
USA, Not specified, BlooddonorsCLUE I, 1974
18 - 90 57Throughnetwork, paper,tv
Questionnaire(nos)
Nested CaseControl
57 21.0 yearsBreast cancer
Pre-menopausal
>-1.0vs.>1.0
50.64(0.17, 2.38)
0.25incidence
Wu, K.,1999,BRE63618
USA, Not specified, BlooddonorsCLUE II, 1989
18 - 90 57Throughnetwork, paper,tv
Questionnaire(nos)
Nested CaseControl
57 6.0 yearsBreast cancer
Pre-menopausal
>-1.0vs.>1.0
30.89(0.1, 7.7)
0.86incidence
Wu, K.,1999,BRE63618
USA, Not specified, BlooddonorsCLUE II, 1989
18 - 90 57Throughnetwork, paper,tv
Questionnaire(nos)
Nested CaseControl
57 6.0 yearsBreast cancer
Pre-menopausal
>-1.0vs.>1.0
33.73(0.52, 26.91)
0.20incidence
242

Author, Year,WCRF Code
Country, Ethnicity, Specialcharacteristics
Age Cases n Caseascertainment
Type of studyNon-Cases n
Lenght offollow-up / loss
Assessmentdetail
Additional details Unit Outcome Subgroup Contrast Nocat. OR (95% CI) p
valueptrend A B C D E F G
adjustments
Wu, K.,1999,BRE63618
USA, Not specified, BlooddonorsCLUE II, 1989
18 - 90 57Throughnetwork, paper,tv
Questionnaire(nos)
Nested CaseControl
57 6.0 yearsBreast cancer
Pre-menopausal
>-1.0vs.>1.0
34.0(0.69, 23.18)
0.17incidence
Post-menopausal
Wu, K.,1999,BRE13618
USA, Not specified, BlooddonorsCLUE I, 1974
18 - 90 63Throughnetwork, paper,tv
Questionnaire(nos)
Nested CaseControl
63 21.0 yearsBreast cancer
Post-menopausal
>-1.0vs.>1.0
50.86(0.26, 2.79)
0.34incidence
Wu, K.,1999,BRE63618
USA, Not specified, BlooddonorsCLUE II, 1989
18 - 90 63Throughnetwork, paper,tv
Questionnaire(nos)
Nested CaseControl
63 6.0 yearsBreast cancer
Post-menopausal
>-1.0vs.>1.0
50.67(0.26, 1.72)
0.36incidence
Wu, K.,1999,BRE63618
USA, Not specified, BlooddonorsCLUE II, 1989
18 - 90 63Throughnetwork, paper,tv
Questionnaire(nos)
Nested CaseControl
63 6.0 yearsBreast cancer
Post-menopausal
>-1.0vs.>1.0
50.63(0.23, 1.76)
0.44incidence
Wu, K.,1999,BRE63618
USA, Not specified, BlooddonorsCLUE II, 1989
18 - 90 63Throughnetwork, paper,tv
Questionnaire(nos)
Nested CaseControl
63 6.0 yearsBreast cancer
Post-menopausal
>-1.0vs.>1.0
50.69(0.26, 1.8)
.59incidence
Menopausal status not specified
Wu, K.,1999,BRE13618
USA, Not specified, BlooddonorsCLUE I, 1974
18 - 90Throughnetwork, paper,tv
Questionnaire(nos)
Nested CaseControl
12450.0 21.0 yearsBreast cancer >-1.0
vs.>1.0
50.92(0.41, 2.04)
0.26incidence
Wu, K.,1999,BRE63618
USA, Not specified, BlooddonorsCLUE II, 1989
18 - 90Throughnetwork, paper,tv
Questionnaire(nos)
Nested CaseControl
14625.0 6.0 yearsBreast cancer >-1.0
vs.>1.0
50.64(0.25, 1.68)
0.80incidence
Wu, K.,1999,BRE63618
USA, Not specified, BlooddonorsCLUE II, 1989
18 - 90Throughnetwork, paper,tv
Questionnaire(nos)
Nested CaseControl
14625.0 6.0 yearsBreast cancer >-1.0
vs.>1.0
51.33(0.54, 3.25)
0.84incidence
Goodman, J.E.,2001,BRE03354
USA, CaucasianWashington county, 1989
(60) By MailNested CaseControl
null
Breast cancer
COMP H/L 1null(null, null)
incidence
Goodman, J.E.,2001,BRE03354
USA, CaucasianWashington county, 1989
(60) By MailNested CaseControl
null
Breast cancer
COMP HH 1null(null, null)
incidence
Goodman, J.E.,2001,BRE03354
USA, CaucasianWashington county, 1989
(60) By MailNested CaseControl
null
Breast cancer
COMP LL 1null(null, null)
incidence
5.5.8
Plasma Cobalamin (vitamin B12)
243

Author, Year,WCRF Code
Country, Ethnicity, Specialcharacteristics
Age Cases n Caseascertainment
Type of studyNon-Cases n
Lenght offollow-up / loss
Assessmentdetail
Additional details Unit Outcome Subgroup Contrast Nocat. OR (95% CI) p
valueptrend A B C D E F G
adjustments
Menopausal status not specified
Wu, K.,1999,BRE63618
USA, Not specified, BlooddonorsCLUE II, 1989
18 - 90Throughnetwork, paper,tv
Questionnaire(nos)
Nested CaseControl
14625.0 6.0 yearsBreast cancer >-1.0
vs.>1.0
52.1(0.87, 5.06)
0.15incidence
Zhang, S.M.,2003,BRE13958
US, Not specified,Registered nursesNurses' Health Study (NHS)Cohort 1976-1996
43 - 69 712 By MailFFQ-Semi-quantitative
Nested CaseControl
712 40.0 months pg/ml
Breast cancer >572.7vs.<320.49
50.76(0.52, 1.1)
0.08 C D E F G
incidence
Serum Cobalamin (vitamin B12)
Pre-menopausal
Wu, K.,1999,BRE13618
USA, Not specified, BlooddonorsCLUE I, 1974
18 - 90 57Throughnetwork, paper,tv
Questionnaire(nos)
Nested CaseControl
57 21.0 yearsBreast cancer
Pre-menopausal
>-1.0vs.>1.0
51.1(0.34, 3.51)
0.73incidence
Wu, K.,1999,BRE63618
USA, Not specified, BlooddonorsCLUE II, 1989
18 - 90 57Throughnetwork, paper,tv
Questionnaire(nos)
Nested CaseControl
57 6.0 yearsBreast cancer
Pre-menopausal
>-1.0vs.>1.0
32.03(0.25, 16.13)
0.30incidence
Post-menopausal
Wu, K.,1999,BRE13618
USA, Not specified, BlooddonorsCLUE I, 1974
18 - 90 63Throughnetwork, paper,tv
Questionnaire(nos)
Nested CaseControl
63 21.0 yearsBreast cancer
Post-menopausal
>-1.0vs.>1.0
54.0(1.05, 15.2)
0.08incidence
Wu, K.,1999,BRE63618
USA, Not specified, BlooddonorsCLUE II, 1989
18 - 90 63Throughnetwork, paper,tv
Questionnaire(nos)
Nested CaseControl
63 6.0 yearsBreast cancer
Post-menopausal
>-1.0vs.>1.0
52.25(0.86, 5.91)
0.20incidence
Menopausal status not specified
Wu, K.,1999,BRE13618
USA, Not specified, BlooddonorsCLUE I, 1974
18 - 90Throughnetwork, paper,tv
Questionnaire(nos)
Nested CaseControl
12450.0 21.0 yearsBreast cancer >-1.0
vs.>1.0
52.54(1.11, 5.8)
0.05incidence
Goodman, J.E.,2001,BRE03354
USA, CaucasianWashington county, 1989
(60) By MailNested CaseControl
null
Breast cancer
COMP H/L 1null(null, null)
incidence
Goodman, J.E.,2001,BRE03354
USA, CaucasianWashington county, 1989
(60) By MailNested CaseControl
null
Breast cancer
COMP HH 1null(null, null)
incidence
Goodman, J.E.,2001,BRE03354
USA, CaucasianWashington county, 1989
(60) By MailNested CaseControl
null
Breast cancer
COMP LL 1null(null, null)
incidence
5.5.9
Plasma Vitamin C
244

Author, Year,WCRF Code
Country, Ethnicity, Specialcharacteristics
Age Cases n Caseascertainment
Type of studyNon-Cases n
Lenght offollow-up / loss
Assessmentdetail
Additional details Unit Outcome Subgroup Contrast Nocat. OR (95% CI) p
valueptrend A B C D E F G
adjustments
Pre-menopausal
Wu, K.,2000,BRE13617USA, White, Blood donorsWashington county, 1989
Through healthorg. (screening,healthinsurance)
Nested CaseControl
14625.0 5.0 years mg/dL
Breast cancerPre-menopausal
1.0(continuous)
11.0(0.3, 3.8)
B
incidence
Post-menopausal
Wu, K.,2000,BRE13617USA, White, Blood donorsWashington county, 1989
Through healthorg. (screening,healthinsurance)
Nested CaseControl
14625.0 5.0 years mg/dL
Breast cancerPost-menopausal
1.0(continuous)
10.9(0.5, 1.5)
B G
incidence
Menopausal status not specified
Wu, K.,2000,BRE13617USA, White, Blood donorsWashington county, 1989
115
Through healthorg. (screening,healthinsurance)
Nested CaseControl
115 5.0 years mg/dL
Breast cancer 1.85 - 3.59vs.0.23 - 0.98
50.9(0.3, 2.4)
0.98 B G
incidence
Vitamin C
Pre-menopausal
Zhang,S.,1999,BRE13953
USA, Not specified,Registered nursesNurses' Health Study (NHS)Cohort 1976-1996
33 - 60 784 By MailFFQ-Semi-quantitative
ProspectiveCohort
53938 14.0 years / 39% mg/day
Invasive breast cancerPre-menopausal
205.0vs.70.0
51.01(0.81, 1.26)
0.82 A C D E F G
incidence
Cho, E.,2003,BRE01652
U.S, Multi-ethnic, RegisterednursesNurses' Health Study (NHS)Cohort 1976-1996
26 - 46 714 By MailFFQ-Semi-quantitative
ProspectiveCohort
90655 8.0 years mg/day
Invasive breast cancerPre-menopausal
200.0vs.69.0
51.3(1.0, 1.69)
0.16 C D E F G
incidence
FrazierL.A.,2004,BRE02942
USA, Multi-ethnic,Registered nursesNurses' Health study II
34 - 51 361
Through healthorg. (screening,healthinsurance)
FFQ (nos)Historical Cohort 47517 9.0 years adolescent diet mg/day
Breast cancerPre-menopausal
244.1vs.76.1
51.0(0.71, 1.41)
0.91 A C D E F G
incidence
FrazierL.A.,2004,BRE02942
USA, Multi-ethnic,Registered nursesNurses' Health study II
34 - 51 361
Through healthorg. (screening,healthinsurance)
FFQ (nos)Historical Cohort 47517 9.0 years adolescent diet I.U./day
Breast cancerPre-menopausal
591.0vs.159.6
50.92(0.66, 1.27)
0.91 A C D E F G
incidence
Post-menopausal
Graham,S.,1992,BRE03424
USA, White, Post-menopausalNew York State Cohort,1980
50 - 107 344 By Mail FFQ (nos)ProspectiveCohort
17401 8.0 years mg/month
Breast cancerPost-menopausal
79.0 - 498.0vs.0 - 34.0
50.81(0.59, 1.12)
A B
incidence
Kushi, L.H.,1996,BRE05143
USA, Not specified, Post-menopausalIowa Women's Health Study
55 - 69 507 By MailFFQ-Semi-quantitative
ProspectiveCohort
18910 7.0 years / 1370 mg/day
Breast cancerPost-menopausal
>198.0vs.<86.0
51.06(0.77, 1.47)
0.88 A B C D E F G
incidence
Zhang,S.,1999,BRE13953
USA, Not specified,Registered nursesNurses' Health Study (NHS)Cohort 1976-1996
33 - 60 1913 By MailFFQ-Semi-quantitative
ProspectiveCohort
29296 14.0 years / 39% mg/day
Invasive breast cancerPost-menopausal
205.0vs.70.0
51.06(0.91, 1.22)
0.57 A C D E F G
incidence
245

Author, Year,WCRF Code
Country, Ethnicity, Specialcharacteristics
Age Cases n Caseascertainment
Type of studyNon-Cases n
Lenght offollow-up / loss
Assessmentdetail
Additional details Unit Outcome Subgroup Contrast Nocat. OR (95% CI) p
valueptrend A B C D E F G
adjustments
Nissen, Stine,B.,2003,BRE20535
Denmark, Not specified,Post-menopausalDiet, Cancer and Health,1993
50 - 64 By Mail FFQ (nos)Case Cohort 29875.0 mg/day
Breast cancerPost-menopausal
100.0(continuous)
12.06(1.45, 2.91)
B C D E F G
incidence
Menopausal status not specified
Giovannucci,E.,1993,BRE03262
US, Not specified,Registered nursesNurses' Health Study (NHS)Cohort 1976-1996
30 - 55 392 By MailFFQ-Semi-quantitative
Nested CaseControl
786 2.0 years mg/day
Breast cancer Quantile 5vs.Quantile 1
51.27(0.82, 1.95)
0.25 A
incidence
Rohan, T.E.,1993,BRE17965
Canada, Not specified,Screening ProgramCanadian National BreastScreening Study
40 - 59
Through healthorg. (screening,healthinsurance)
Dietary Historyquestionnaire
Nested CaseControl
56837.0 6.0 years mg/day
Breast cancer119.0(continuous)
10.99(0.83, 1.17)
A B C E F G
incidence
Verhoeven, D.T.,1997,BRE12868
the Netherland, Not specifiedThe Netherlands CohortStudy on diet and cancer,1986-1993
55 - 69 519Throughnetwork, paper,tv
FFQ-Semi-quantitative
Case Cohort 58664.3 years / nolost mg/day
Invasive breast cancer 165.3vs.58.6
50.77(0.55, 1.08)
0.08 A C E F G
incidence
Zhang,S.,1999,BRE13953
USA, Not specified,Registered nursesNurses' Health Study (NHS)Cohort 1976-1996
33 - 60 689 By MailFFQ-Semi-quantitative
ProspectiveCohort
83234.0 14.0 years / 39% mg/day
Invasive breast cancer FamilyHistory BC -No & Pre-menopausal
205.0vs.70.0
51.12(0.89, 1.41)
0.43 A C D E F G
incidence
Zhang,S.,1999,BRE13953
USA, Not specified,Registered nursesNurses' Health Study (NHS)Cohort 1976-1996
33 - 60 90 By MailFFQ-Semi-quantitative
ProspectiveCohort
83234.0 14.0 years / 39% mg/day
Invasive breast cancer FamilyHistory BC -Yes & Pre-menopausal
205.0vs.70.0
50.37(0.17, 0.8)
0.002
A C D E F G
incidence
Michels, K.B.,2001,BRE17830
Sweden, Not specified,Screening ProgramValencia, 1997
40 - 76 717 By MailFFQ-Semi-quantitative
ProspectiveCohort
59039.0 130.0 months mg/day
Invasive breast cancer
Lean109.7vs.30.7
51.27(0.99, 1.63)
0.02 A B C D E F
incidence
Michels, K.B.,2001,BRE17830
Sweden, Not specified,Screening ProgramValencia, 1997
40 - 76 By MailFFQ-Semi-quantitative
ProspectiveCohort
59039.0 130.0 months mg/day
Invasive breast cancer 109.7vs.30.7
50.94(0.78, 1.14)
99 A B C D E F
incidence
Michels, K.B.,2001,BRE17830
Sweden, Not specified,Screening ProgramValencia, 1997
40 - 76 554 By MailFFQ-Semi-quantitative
ProspectiveCohort
59039.0 130.0 months mg/day
Invasive breast cancer
Overweight109.7vs.30.7
50.61(0.45, 0.82)
0.004
A B C D E F
incidence
Horn-Ross,P.L.,2002,BRE15412
USA, Multi-ethnic,Registered teachersCalifornia Teachers Study,1995
21 - 103 By Mail FFQ (nos)ProspectiveCohort
111383.0 2.0 years mg/day
Invasive breast cancer <653.0vs.<79.0
51.1(0.8, 1.3)
0.5 A C D E F G
incidence
FrazierL.A.,2003,BRE02941
USA, Multi-ethnic,Registered nursesNurses' Health Study (NHS)Cohort 1976-1996
40 - 65
Through healthorg. (screening,healthinsurance)
FFQ (nos)Nested CaseControl
121700.0 10.0 years adolescent mg/day
Breast cancer 121.0vs.24.6
50.95(null, null)
0.77 A C D E F G
incidence
FrazierL.A.,2003,BRE02941
USA, Multi-ethnic,Registered nursesNurses' Health Study (NHS)Cohort 1976-1996
40 - 65
Through healthorg. (screening,healthinsurance)
FFQ (nos)Nested CaseControl
121700.0 10.0 years adolescent I.U./day
Breast cancer 691.0vs.107.0
50.96(null, null)
0.84 A C D E F G
incidence
246
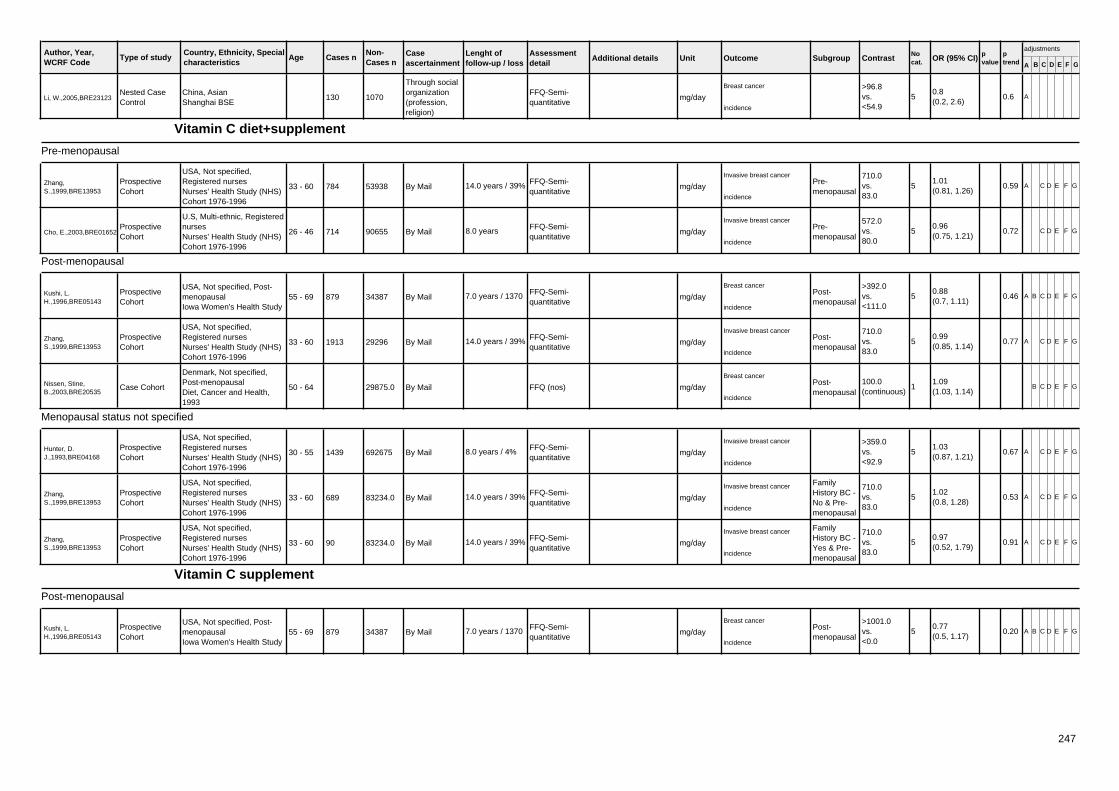
Author, Year,WCRF Code
Country, Ethnicity, Specialcharacteristics
Age Cases n Caseascertainment
Type of studyNon-Cases n
Lenght offollow-up / loss
Assessmentdetail
Additional details Unit Outcome Subgroup Contrast Nocat. OR (95% CI) p
valueptrend A B C D E F G
adjustments
Li, W.,2005,BRE23123China, AsianShanghai BSE
130
Through socialorganization(profession,religion)
FFQ-Semi-quantitative
Nested CaseControl
1070 mg/day
Breast cancer >96.8vs.<54.9
50.8(0.2, 2.6)
0.6 A
incidence
Vitamin C diet+supplement
Pre-menopausal
Zhang,S.,1999,BRE13953
USA, Not specified,Registered nursesNurses' Health Study (NHS)Cohort 1976-1996
33 - 60 784 By MailFFQ-Semi-quantitative
ProspectiveCohort
53938 14.0 years / 39% mg/day
Invasive breast cancerPre-menopausal
710.0vs.83.0
51.01(0.81, 1.26)
0.59 A C D E F G
incidence
Cho, E.,2003,BRE01652
U.S, Multi-ethnic, RegisterednursesNurses' Health Study (NHS)Cohort 1976-1996
26 - 46 714 By MailFFQ-Semi-quantitative
ProspectiveCohort
90655 8.0 years mg/day
Invasive breast cancerPre-menopausal
572.0vs.80.0
50.96(0.75, 1.21)
0.72 C D E F G
incidence
Post-menopausal
Kushi, L.H.,1996,BRE05143
USA, Not specified, Post-menopausalIowa Women's Health Study
55 - 69 879 By MailFFQ-Semi-quantitative
ProspectiveCohort
34387 7.0 years / 1370 mg/day
Breast cancerPost-menopausal
>392.0vs.<111.0
50.88(0.7, 1.11)
0.46 A B C D E F G
incidence
Zhang,S.,1999,BRE13953
USA, Not specified,Registered nursesNurses' Health Study (NHS)Cohort 1976-1996
33 - 60 1913 By MailFFQ-Semi-quantitative
ProspectiveCohort
29296 14.0 years / 39% mg/day
Invasive breast cancerPost-menopausal
710.0vs.83.0
50.99(0.85, 1.14)
0.77 A C D E F G
incidence
Nissen, Stine,B.,2003,BRE20535
Denmark, Not specified,Post-menopausalDiet, Cancer and Health,1993
50 - 64 By Mail FFQ (nos)Case Cohort 29875.0 mg/day
Breast cancerPost-menopausal
100.0(continuous)
11.09(1.03, 1.14)
B C D E F G
incidence
Menopausal status not specified
Hunter, D.J.,1993,BRE04168
USA, Not specified,Registered nursesNurses' Health Study (NHS)Cohort 1976-1996
30 - 55 1439 By MailFFQ-Semi-quantitative
ProspectiveCohort
692675 8.0 years / 4% mg/day
Invasive breast cancer >359.0vs.<92.9
51.03(0.87, 1.21)
0.67 A C D E F G
incidence
Zhang,S.,1999,BRE13953
USA, Not specified,Registered nursesNurses' Health Study (NHS)Cohort 1976-1996
33 - 60 689 By MailFFQ-Semi-quantitative
ProspectiveCohort
83234.0 14.0 years / 39% mg/day
Invasive breast cancer FamilyHistory BC -No & Pre-menopausal
710.0vs.83.0
51.02(0.8, 1.28)
0.53 A C D E F G
incidence
Zhang,S.,1999,BRE13953
USA, Not specified,Registered nursesNurses' Health Study (NHS)Cohort 1976-1996
33 - 60 90 By MailFFQ-Semi-quantitative
ProspectiveCohort
83234.0 14.0 years / 39% mg/day
Invasive breast cancer FamilyHistory BC -Yes & Pre-menopausal
710.0vs.83.0
50.97(0.52, 1.79)
0.91 A C D E F G
incidence
Vitamin C supplement
Post-menopausal
Kushi, L.H.,1996,BRE05143
USA, Not specified, Post-menopausalIowa Women's Health Study
55 - 69 879 By MailFFQ-Semi-quantitative
ProspectiveCohort
34387 7.0 years / 1370 mg/day
Breast cancerPost-menopausal
>1001.0vs.<0.0
50.77(0.5, 1.17)
0.20 A B C D E F G
incidence
247

Author, Year,WCRF Code
Country, Ethnicity, Specialcharacteristics
Age Cases n Caseascertainment
Type of studyNon-Cases n
Lenght offollow-up / loss
Assessmentdetail
Additional details Unit Outcome Subgroup Contrast Nocat. OR (95% CI) p
valueptrend A B C D E F G
adjustments
Nissen, Stine,B.,2003,BRE20535
Denmark, Not specified,Post-menopausalDiet, Cancer and Health,1993
50 - 64 By Mail FFQ (nos)Case Cohort 29875.0 mg/day
Breast cancerPost-menopausal
100.0(continuous)
11.06(1.01, 1.13)
B C D E F G
incidence
Menopausal status not specified
Rohan, T.E.,1993,BRE17965
Canada, Not specified,Screening ProgramCanadian National BreastScreening Study
40 - 59 519
Through healthorg. (screening,healthinsurance)
Dietary Historyquestionnaire
Nested CaseControl
1182 6.0 years mg/day
Breast cancer >250.1vs.0
31.46(1.05, 2.01)
0.051
A B C E F G
incidence
Hunter, D.J.,1993,BRE04168
USA, Not specified,Registered nursesNurses' Health Study (NHS)Cohort 1976-1996
30 - 55 By MailFFQ-Semi-quantitative
ProspectiveCohort
89494.0 8.0 years / 4% mg/day
Invasive breast cancer >=1300vs.No use
51.12(0.75, 1.69)
0.98 A C D E F G
incidence
Hunter, D.J.,1993,BRE04168
USA, Not specified,Registered nursesNurses' Health Study (NHS)Cohort 1976-1996
30 - 55 By MailFFQ-Semi-quantitative
ProspectiveCohort
89494.0 8.0 years / 4% supplement duration Years/life
Invasive breast cancer >=10vs.no use
51.12(0.87, 1.43)
0.58 A C D E F G
incidence
Verhoeven, D.T.,1997,BRE12868
the Netherland, Not specifiedThe Netherlands CohortStudy on diet and cancer,1986-1993
55 - 69 517Throughnetwork, paper,tv
FFQ-Semi-quantitative
Case Cohort 58624.3 years / nolost
dichotomous
Invasive breast cancer yesvs.no
21.06(0.79, 1.43)
A C E F G
incidence
Zhang,S.,1999,BRE13953
USA, Not specified,Registered nursesNurses' Health Study (NHS)Cohort 1976-1996
33 - 60 2523 By MailFFQ-Semi-quantitative
ProspectiveCohort
77925 14.0 years / 39% mg/day
Invasive breast cancer >=1300vs.never user
51.04(0.77, 1.42)
A C D E F G
incidence
5.6.2
Heme iron
Pre-menopausal
Kabat GC, Miller AB,Jain M, RohanTE,2007,BRE80138
Canada, Screening ProgramCanadian National BreastScreening Study
40 - 59 1171 Cancer registry FFQProspectiveCohort
48662.0 16.4 years
Heme iron intake, 69%heme iron for beef 39%for pork ham veal etc26% chicken fish 21%
mg/day
Breast cancerPre-menopausal
>2.95vs.<1.57
51.03(0.84, 1.25)
0.56 A B C D E F G
incidence
Post-menopausal
Kabat GC, Miller AB,Jain M, RohanTE,2007,BRE80138
Canada, Screening ProgramCanadian National BreastScreening Study
40 - 59 660 Cancer registry FFQProspectiveCohort
48662.0 16.4 years
Heme iron intake, 69%heme iron for beef 39%for pork ham veal etc26% chicken fish 21%
mg/day
Breast cancer
HRT ever>2.95vs.<1.57
50.96(0.73, 1.25)
0.92 A B C D E F G
incidence
Kabat GC, Miller AB,Jain M, RohanTE,2007,BRE80138
Canada, Screening ProgramCanadian National BreastScreening Study
40 - 59 993 Cancer registry FFQProspectiveCohort
48662.0 16.4 years
Heme iron intake, 69%heme iron for beef 39%for pork ham veal etc26% chicken fish 21%
mg/day
Breast cancerPost-menopausal
>2.95vs.<1.57
50.97(0.78, 1.2)
0.71 A B C D E F G
incidence
Menopausal status not specified
Kabat GC, Miller AB,Jain M, RohanTE,2007,BRE80138
Canada, Screening ProgramCanadian National BreastScreening Study
40 - 59 2491 Cancer registry FFQProspectiveCohort
46170 16.4 years
Heme iron intake, 69%heme iron for beef 39%for pork ham veal etc26% chicken fish 21%
mg/day
Breast cancer >2.95vs.<1.57
51.03(0.9, 1.18)
0.25 A B C D E F G
incidence
248

Author, Year,WCRF Code
Country, Ethnicity, Specialcharacteristics
Age Cases n Caseascertainment
Type of studyNon-Cases n
Lenght offollow-up / loss
Assessmentdetail
Additional details Unit Outcome Subgroup Contrast Nocat. OR (95% CI) p
valueptrend A B C D E F G
adjustments
Kabat GC, Miller AB,Jain M, RohanTE,2007,BRE80138
Canada, Screening ProgramCanadian National BreastScreening Study
40 - 59 193 Cancer registry FFQProspectiveCohort
48662.0 16.4 years
Heme iron intake, 69%heme iron for beef 39%for pork ham veal etc26% chicken fish 21%
mg/day
Breast cancer Alcoholintake>30g/day
>2.95vs.<1.57
50.8(0.45, 1.43)
0.78 A B C D E F G
incidence
Kabat GC, Miller AB,Jain M, RohanTE,2007,BRE80138
Canada, Screening ProgramCanadian National BreastScreening Study
40 - 59 1831 Cancer registry FFQProspectiveCohort
48662.0 16.4 years
Heme iron intake, 69%heme iron for beef 39%for pork ham veal etc26% chicken fish 21%
mg/day
Breast cancer
HRT never>2.95vs.<1.57
51.06(0.91, 1.24)
0.18 A B C D E F G
incidence
Iron
Pre-menopausal
Kabat GC, Miller AB,Jain M, RohanTE,2007,BRE80138
Canada, Screening ProgramCanadian National BreastScreening Study
40 - 59 1171 Cancer registry FFQProspectiveCohort
46171 16.4 years Dietary iron onlymg/ day >5 years
Breast cancerPre-menopausal
>14.99vs.<11.89
51.07(0.89, 1.3)
0.82 A B C D E F G
incidence
Kabat GC, Miller AB,Jain M, RohanTE,2007,BRE80138
Canada, Screening ProgramCanadian National BreastScreening Study
40 - 59 1171 Cancer registry FFQProspectiveCohort
48662.0 16.4 yearsIron from meat, from 22meat items and 2mixed dishes
mg/day
Breast cancerPre-menopausal
>6.11vs.<3.3
51.13(0.93, 1.37)
0.35 A B C D E F G
incidence
Post-menopausal
Kabat GC, Miller AB,Jain M, RohanTE,2007,BRE80138
Canada, Screening ProgramCanadian National BreastScreening Study
40 - 59 993 Cancer registry FFQProspectiveCohort
46171 16.4 years Dietary iron onlymg/ day >5 years
Breast cancerPost-menopausal
>14.99vs.<11.89
50.87(0.71, 1.06)
0.28 A B C D E F G
incidence
Kabat GC, Miller AB,Jain M, RohanTE,2007,BRE80138
Canada, Screening ProgramCanadian National BreastScreening Study
40 - 59 993 Cancer registry FFQProspectiveCohort
48662.0 16.4 yearsIron from meat, from 22meat items and 2mixed dishesmeat
mg/day
Breast cancerPost-menopausal
>6.11vs.<3.3
51.03(0.83, 1.27)
0.73 A B C D E F G
incidence
Menopausal status not specified
Kabat GC, Miller AB,Jain M, RohanTE,2007,BRE80138
Canada, Screening ProgramCanadian National BreastScreening Study
40 - 59 2491 Cancer registry FFQProspectiveCohort
46171 16.4 years Dietary iron onlymg/ day >5 years
Breast cancer >14.99vs.<11.89
50.97(0.85, 1.1)
0.63 A B C D E F G
incidence
Kabat GC, Miller AB,Jain M, RohanTE,2007,BRE80138
Canada, Screening ProgramCanadian National BreastScreening Study
40 - 59 2491 Cancer registry FFQProspectiveCohort
46170 16.4 yearsIron from meat, from 22meat items and 2mixed dishes
mg/day
Breast cancer >6.11vs.<3.3
51.09(0.96, 1.24)
0.26 A B C D E F G
incidence
Iron from tissue sample
Post-menopausal
Cui, Y. etal.,2007,BRE80149
United States, High RiskpopulationKaiser PermanenteNorthwest, 1970
Cancer registry Breast tissueNested CaseControl
9315.0 Iron in breast tissue
Breast cancerPost-menopausal
Quantile 5vs.Quantile 1
52.77(1.25, 6.13)
0.008
A C D F G
incidence
Menopausal status not specified
Cui, Y. etal.,2007,BRE80149
United States, High RiskpopulationKaiser PermanenteNorthwest, 1970
248 Cancer registry Breast tissueNested CaseControl
248 Iron in breast tissue
Breast cancer Quantile 5vs.Quantile 1
51.56(1.01, 2.41)
0.08 A C D F G
incidence
249

Author, Year,WCRF Code
Country, Ethnicity, Specialcharacteristics
Age Cases n Caseascertainment
Type of studyNon-Cases n
Lenght offollow-up / loss
Assessmentdetail
Additional details Unit Outcome Subgroup Contrast Nocat. OR (95% CI) p
valueptrend A B C D E F G
adjustments
5.6.3
Calcium
Pre-menopausal
Kesse-Guyot etal.,2007,BRE11112
France, SU.VI.MAXparticipantsSU.VI.MAX study, 1994
35 - 60 44 medical records 24h RecallProspectiveCohort
3535
7.7 years / 14subjects lossesduring dietaryassessment
Calcium, energyadjusted usingresiduals
mg/day
Breast cancerpremenopausal women
>1145.0vs.<806.0
40.26(0.1, 0.71)
0.01 B C D E F G
incidence
Kesse-Guyot etal.,2007,BRE11112
France, SU.VI.MAXparticipantsSU.VI.MAX study, 1994
35 - 60 44 medical records 24h RecallProspectiveCohort
3535
7.7 years / 14subjects lossesduring dietaryassessment
Dairy calcium, energyadjusted usingresiduals
mg/day
Breast cancerpremenopausal women
>734.0vs.<421.0
40.32(0.12, 0.82)
0.05 B C D E F G
incidence
Post-menopausal
Kesse-Guyot etal.,2007,BRE11112
France, SU.VI.MAXparticipantsSU.VI.MAX study, 1994
35 - 60 48 medical records 24h RecallProspectiveCohort
3535
7.7 years / 14subjects lossesduring dietaryassessment
Calcium, energyadjusted usingresiduals
mg/day
Breast cancerpostmenopausal women
>1145.0vs.<806.0
40.76(0.34, 1.7)
0.64 B C D E F G
incidence
Kesse-Guyot etal.,2007,BRE11112
France, SU.VI.MAXparticipantsSU.VI.MAX study, 1994
35 - 60 48 medical records 24h RecallProspectiveCohort
3535
7.7 years / 14subjects lossesduring dietaryassessment
Dairy calcium, energyadjusted usingresiduals
mg/day
Breast cancerpostmenopausal women
>734.0vs.<421.0
40.87(0.4, 1.92)
0.99 B C D E F G
incidence
Menopausal status not specified
Cui, Y. etal.,2007,BRE80149
United States, High RiskpopulationKaiser PermanenteNorthwest, 1970
248 Cancer registryNested CaseControl
248Calcium in breasttissue
Breast cancer Quantile 5vs.Quantile 1
51.44(0.96, 2.14)
0.15 A C D F G
incidence
van der Pols JC, etal.,2007,BRE80154
United KingdomThe Boyd Orr Cohort
(8) 98National HealthRecords
7-day foodrecords
Historical Cohort 4374.057.0 years /0.123
Total childhood calciumintake
mg/day
Breast cancer 743.0vs.406.0
4null(null, null)
>0.05
A E G
incidence + mortality
Kesse-Guyot etal.,2007,BRE11112
France, SU.VI.MAXparticipantsSU.VI.MAX study, 1994
35 - 60 92 medical records 24h RecallProspectiveCohort
3535
7.7 years / 14subjects lossesduring dietaryassessment
Calcium, energyadjusted usingresiduals
mg/day
Breast cancer >1145.0vs.<806.0
40.5(0.27, 0.91)
0.04 B C D E F G
incidence
Kesse-Guyot etal.,2007,BRE11112
France, SU.VI.MAXparticipantsSU.VI.MAX study, 1994
35 - 60 92 medical records 24h RecallProspectiveCohort
3535
7.7 years / 14subjects lossesduring dietaryassessment
Dairy calcium, energyadjusted usingresiduals
mg/day
Breast cancer >734.0vs.<421.0
40.58(0.32, 1.04)
0.21 B C D E F G
incidence
Calcium (and Vitamin D)
Pre-menopausal
Shin, M.-H.,2002,BRE16658
USA, Not specified,Registered nursesNurses' Health Study (NHS)Cohort 1976-1996
(47) 827 By Mail FFQ (nos)ProspectiveCohort
85519 16.0 years dg/day
Invasive breast cancerPre-menopausal
1.0(continuous)
10.97(0.94, 1.0)
A C D E F G
mortality/incidence
Post-menopausal
250

Author, Year,WCRF Code
Country, Ethnicity, Specialcharacteristics
Age Cases n Caseascertainment
Type of studyNon-Cases n
Lenght offollow-up / loss
Assessmentdetail
Additional details Unit Outcome Subgroup Contrast Nocat. OR (95% CI) p
valueptrend A B C D E F G
adjustments
Shin, M.-H.,2002,BRE16658
USA, Not specified,Registered nursesNurses' Health Study (NHS)Cohort 1976-1996
(47) 2345 By Mail FFQ (nos)ProspectiveCohort
85519 16.0 years dg/day
Invasive breast cancerPost-menopausal
1.0(continuous)
11.0(0.99, 1.0)
A C D E F G
mortality/incidence
Calcium from food and supplements
Pre-menopausal
Lin J,2007,BRE80165US, not statedWomen's Health Study
54 - 56 206 medical records FFQProspectiveCohort
31487.0 10.0 years total calcium mg/day
Breast cancer ER+Pre-menopausal
>1366.0vs.<616.9
60.64(0.4, 1.03)
0.14 A C D E G
incidence
Lin J,2007,BRE80165US, not statedWomen's Health Study
54 - 56 58 medical records FFQProspectiveCohort
31487.0 10.0 years total calcium mg/day
Breast cancer ER-Pre-menopausal
>1366.0vs.<616.9
60.68(0.26, 1.77)
0.41 A C D E G
incidence
Lin J,2007,BRE80165US, not statedWomen's Health Study
54 - 56 186 medical records FFQProspectiveCohort
31487.0 10.0 years total calcium mg/day
Breast cancer PR+Pre-menopausal
>1366.0vs.<616.9
60.62(0.38, 1.02)
0.09 A C D E G
incidence
Lin J,2007,BRE80165US, not statedWomen's Health Study
54 - 56 74 medical records FFQProspectiveCohort
31487.0 10.0 years total calcium mg/day
Breast cancer PR-Pre-menopausal
>1366.0vs.<616.9
60.83(0.36, 1.92)
0.81 A C D E G
incidence
Lin J,2007,BRE80165US, not statedWomen's Health Study
54 - 56 276 medical records FFQProspectiveCohort
31487.0 10.0 years Total calcium mg/day
Invasive breast cancerPre-menopausal
>1366.0vs.<616.9
60.61(0.4, 0.92)
0.04 A C D E F G
incidence
Lin J,2007,BRE80165US, not statedWomen's Health Study
54 - 56 72 medical records FFQProspectiveCohort
31487.0 10.0 years total calcium mg/day
Well differentiated breastcancer Pre-
menopausal
>1366.0vs.<616.9
61.27(0.6, 2.72)
0.66 A C D E G
incidence
Post-menopausal
McCulloughM.L.,2005,BRE23368
USA, Not specified, Post-menopausalCPS-II US cohort, 1982-1998
50 - 74 2855 By MailFFQ-Semi-quantitative
ProspectiveCohort
68567 9.0 years plus multivitamin pills mg/day
Breast cancerPost-menopausal
>1750vs.<=500
70.91(0.79, 1.06)
0.07 A B C D E F G
incidence
McCulloughM.L.,2005,BRE23368
USA, Not specified, Post-menopausalCPS-II US cohort, 1982-1998
50 - 74 2855 By MailFFQ-Semi-quantitative
ProspectiveCohort
68567 9.0 years I.U./day
Breast cancerPost-menopausal
>300vs.<=100
40.89(0.76, 1.03)
0.21 A B C D E F G
incidence
McCulloughM.L.,2005,BRE23368
USA, Not specified, Post-menopausalCPS-II US cohort, 1982-1998
50 - 74 1283 By MailFFQ-Semi-quantitative
ProspectiveCohort
68567.0 9.0 years plus multivitamin pills mg/day
Breast cancer ER+Post-menopausal
>1750vs.<=500
70.87(0.7, 1.09)
0.13 A B C D E F G
incidence
McCulloughM.L.,2005,BRE23368
USA, Not specified, Post-menopausalCPS-II US cohort, 1982-1998
50 - 74 1283 By MailFFQ-Semi-quantitative
ProspectiveCohort
68567.0 9.0 years I.U./day
Breast cancer ER+Post-menopausal
>300vs.<=100
40.74(0.59, 0.93)
0.006
A B C D E F G
incidence
251
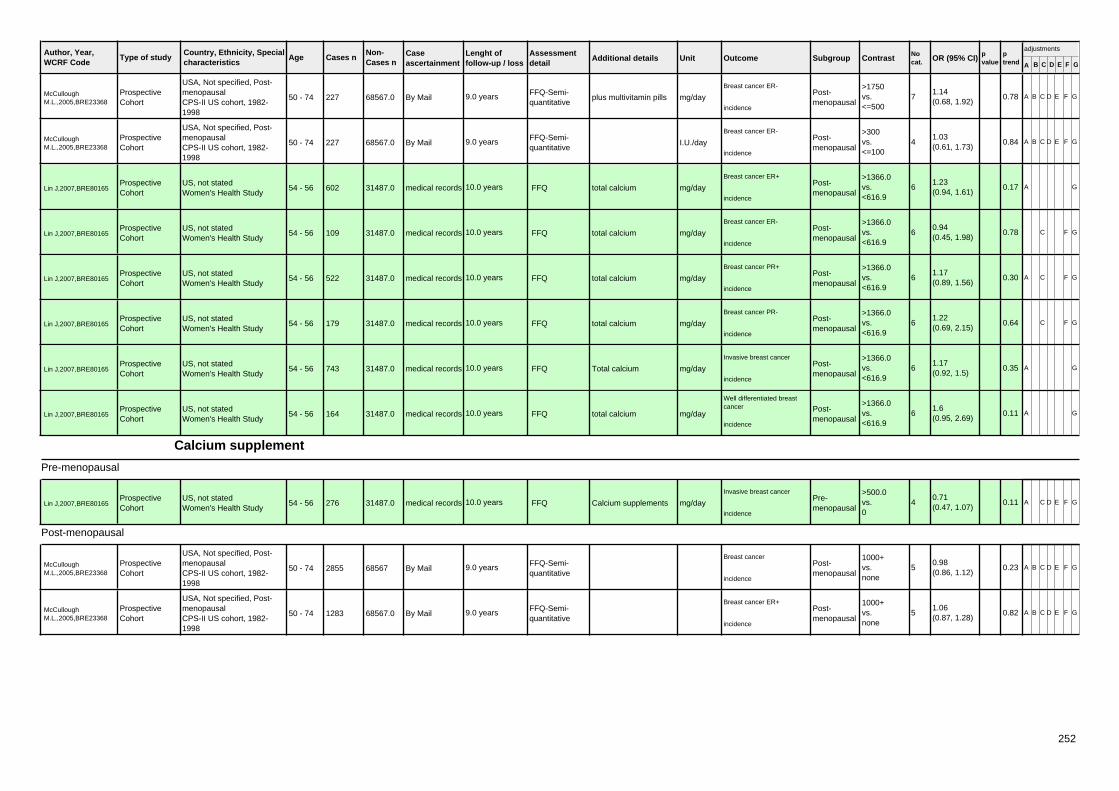
Author, Year,WCRF Code
Country, Ethnicity, Specialcharacteristics
Age Cases n Caseascertainment
Type of studyNon-Cases n
Lenght offollow-up / loss
Assessmentdetail
Additional details Unit Outcome Subgroup Contrast Nocat. OR (95% CI) p
valueptrend A B C D E F G
adjustments
McCulloughM.L.,2005,BRE23368
USA, Not specified, Post-menopausalCPS-II US cohort, 1982-1998
50 - 74 227 By MailFFQ-Semi-quantitative
ProspectiveCohort
68567.0 9.0 years plus multivitamin pills mg/day
Breast cancer ER-Post-menopausal
>1750vs.<=500
71.14(0.68, 1.92)
0.78 A B C D E F G
incidence
McCulloughM.L.,2005,BRE23368
USA, Not specified, Post-menopausalCPS-II US cohort, 1982-1998
50 - 74 227 By MailFFQ-Semi-quantitative
ProspectiveCohort
68567.0 9.0 years I.U./day
Breast cancer ER-Post-menopausal
>300vs.<=100
41.03(0.61, 1.73)
0.84 A B C D E F G
incidence
Lin J,2007,BRE80165US, not statedWomen's Health Study
54 - 56 602 medical records FFQProspectiveCohort
31487.0 10.0 years total calcium mg/day
Breast cancer ER+Post-menopausal
>1366.0vs.<616.9
61.23(0.94, 1.61)
0.17 A G
incidence
Lin J,2007,BRE80165US, not statedWomen's Health Study
54 - 56 109 medical records FFQProspectiveCohort
31487.0 10.0 years total calcium mg/day
Breast cancer ER-Post-menopausal
>1366.0vs.<616.9
60.94(0.45, 1.98)
0.78 C F G
incidence
Lin J,2007,BRE80165US, not statedWomen's Health Study
54 - 56 522 medical records FFQProspectiveCohort
31487.0 10.0 years total calcium mg/day
Breast cancer PR+Post-menopausal
>1366.0vs.<616.9
61.17(0.89, 1.56)
0.30 A C F G
incidence
Lin J,2007,BRE80165US, not statedWomen's Health Study
54 - 56 179 medical records FFQProspectiveCohort
31487.0 10.0 years total calcium mg/day
Breast cancer PR-Post-menopausal
>1366.0vs.<616.9
61.22(0.69, 2.15)
0.64 C F G
incidence
Lin J,2007,BRE80165US, not statedWomen's Health Study
54 - 56 743 medical records FFQProspectiveCohort
31487.0 10.0 years Total calcium mg/day
Invasive breast cancerPost-menopausal
>1366.0vs.<616.9
61.17(0.92, 1.5)
0.35 A G
incidence
Lin J,2007,BRE80165US, not statedWomen's Health Study
54 - 56 164 medical records FFQProspectiveCohort
31487.0 10.0 years total calcium mg/day
Well differentiated breastcancer Post-
menopausal
>1366.0vs.<616.9
61.6(0.95, 2.69)
0.11 A G
incidence
Calcium supplement
Pre-menopausal
Lin J,2007,BRE80165US, not statedWomen's Health Study
54 - 56 276 medical records FFQProspectiveCohort
31487.0 10.0 years Calcium supplements mg/day
Invasive breast cancerPre-menopausal
>500.0vs.0
40.71(0.47, 1.07)
0.11 A C D E F G
incidence
Post-menopausal
McCulloughM.L.,2005,BRE23368
USA, Not specified, Post-menopausalCPS-II US cohort, 1982-1998
50 - 74 2855 By MailFFQ-Semi-quantitative
ProspectiveCohort
68567 9.0 yearsBreast cancer
Post-menopausal
1000+vs.none
50.98(0.86, 1.12)
0.23 A B C D E F G
incidence
McCulloughM.L.,2005,BRE23368
USA, Not specified, Post-menopausalCPS-II US cohort, 1982-1998
50 - 74 1283 By MailFFQ-Semi-quantitative
ProspectiveCohort
68567.0 9.0 yearsBreast cancer ER+
Post-menopausal
1000+vs.none
51.06(0.87, 1.28)
0.82 A B C D E F G
incidence
252

Author, Year,WCRF Code
Country, Ethnicity, Specialcharacteristics
Age Cases n Caseascertainment
Type of studyNon-Cases n
Lenght offollow-up / loss
Assessmentdetail
Additional details Unit Outcome Subgroup Contrast Nocat. OR (95% CI) p
valueptrend A B C D E F G
adjustments
McCulloughM.L.,2005,BRE23368
USA, Not specified, Post-menopausalCPS-II US cohort, 1982-1998
50 - 74 227 By MailFFQ-Semi-quantitative
ProspectiveCohort
68567.0 9.0 yearsBreast cancer ER-
Post-menopausal
1000+vs.none
50.85(0.52, 1.39)
0.63 A B C D E F G
incidence
Lin J,2007,BRE80165US, not statedWomen's Health Study
54 - 56 743 medical records FFQProspectiveCohort
31487.0 10.0 years Calcium supplements mg/day
Invasive breast cancerPost-menopausal
>500.0vs.0
41.05(0.86, 1.3)
0.63 A G
incidence
Calcium, serum
Pre-menopausal
Almquist etal.,2007,BRE80007
SwedenMalmo Preventive Project(MPP), 1974
(50) 182 Cancer registryQuestionnaire(nos)
ProspectiveCohort
2882 17.8 years Serum Calcium levels mmol/liter
Invasive & In situ breastcancer premenopau
sal women
>2.41vs.<2.28
40.56(0.32, 0.99)
0.25 A B C D E F G
incidence
Almquist etal.,2007,BRE80007
SwedenMalmo Preventive Project(MPP), 1974
(50) 118 Cancer registryQuestionnaire(nos)
ProspectiveCohort
1865 17.8 years Serum calcium intake mmol/liter
Invasive & In situ breastcancer premenopau
sal, BMI<25
>2.41vs.<2.28
40.68(0.34, 1.35)
>0.05
A B C E F G
incidence
Almquist etal.,2007,BRE80007
SwedenMalmo Preventive Project(MPP), 1974
(50) 64 Cancer registryQuestionnaire(nos)
ProspectiveCohort
999 17.8 years Serum calcium intake mmol/liter
Invasive & In situ breastcancer premenopau
sal,BMI>=25
>2.41vs.<2.28
40.44(0.16, 1.15)
>0.05
A B C E F G
incidence
Menopausal status not specified
Almquist etal.,2007,BRE80007
SwedenMalmo Preventive Project(MPP), 1974
(50) 261 Cancer registryQuestionnaire(nos)
ProspectiveCohort
4711 17.8 years Serum calcium intake mmol/liter
Invasive & In situ breastcancer
BMI < 25>2.41vs.<2.28
40.82(0.56, 1.19)
>0.05
A B C E F G
incidence
Almquist etal.,2007,BRE80007
SwedenMalmo Preventive Project(MPP), 1974
(50) 176 Cancer registryQuestionnaire(nos)
ProspectiveCohort
3133 17.8 years Serum calcium intake mmol/liter
Invasive & In situ breastcancer
BMI >= 25>2.41vs.<2.28
41.09(0.68, 1.74)
>0.05
A B C E F G
incidence
Almquist etal.,2007,BRE80007
SwedenMalmo Preventive Project(MPP), 1974
(50) 437 Cancer registryQuestionnaire(nos)
ProspectiveCohort
7521 17.8 years Serum Calcium levels mmol/liter
Invasive & In situ breastcancer >2.41
vs.<2.28
40.89(0.67, 1.19)
A B C D E F G
incidence
Almquist etal.,2007,BRE80007
SwedenMalmo Preventive Project(MPP), 1974
(50) 255 Cancer registryQuestionnaire(nos)
ProspectiveCohort
4983 17.8 years Serum Calcium levels mmol/liter
Invasive & In situ breastcancer peri/postmen
opausal
>2.41vs.<2.28
41.26(0.84, 1.89)
0.45 A B C D E F G
incidence
Almquist etal.,2007,BRE80007
SwedenMalmo Preventive Project(MPP), 1974
(50) 143 Cancer registryQuestionnaire(nos)
ProspectiveCohort
2846 17.8 years Serum calcium intake mmol/liter
Invasive & In situ breastcancer peri/postmen
opausal,BMI<25
>2.41vs.<2.28
40.88(0.54, 1.44)
>0.05
A B C E F G
incidence
Almquist etal.,2007,BRE80007
SwedenMalmo Preventive Project(MPP), 1974
(50) 112 Cancer registryQuestionnaire(nos)
ProspectiveCohort
2134 17.8 years Serum calcium intake mmol/liter
Invasive & In situ breastcancer peri/postmen
opausal,BMI>=25
>2.41vs.<2.28
42.72(1.24, 5.94)
>0.05
A B C E F G
incidence
Dairy Calcium
Pre-menopausal
253

Author, Year,WCRF Code
Country, Ethnicity, Specialcharacteristics
Age Cases n Caseascertainment
Type of studyNon-Cases n
Lenght offollow-up / loss
Assessmentdetail
Additional details Unit Outcome Subgroup Contrast Nocat. OR (95% CI) p
valueptrend A B C D E F G
adjustments
Shin, M.-H.,2002,BRE16658
USA, Not specified,Registered nursesNurses' Health Study (NHS)Cohort 1976-1996
(47) 827 By Mail FFQ (nos)ProspectiveCohort
85519 16.0 years dg/day
Invasive breast cancerPre-menopausal
1.0(continuous)
10.95(0.92, 0.99)
A C D E F G
mortality/incidence
Post-menopausal
Shin, M.-H.,2002,BRE16658
USA, Not specified,Registered nursesNurses' Health Study (NHS)Cohort 1976-1996
(47) 2345 By Mail FFQ (nos)ProspectiveCohort
85519 16.0 years dg/day
Invasive breast cancerPost-menopausal
1.0(continuous)
11.0(0.97, 1.02)
A C D E F G
mortality/incidence
Dietary Calcium
Pre-menopausal
Shin, M.-H.,2002,BRE16658
USA, Not specified,Registered nursesNurses' Health Study (NHS)Cohort 1976-1996
(47) 827 By Mail FFQ (nos)ProspectiveCohort
85519 16.0 years dg/day
Invasive breast cancerPre-menopausal
1.0(continuous)
10.95(0.92, 0.99)
A C D E F G
mortality/incidence
Dietary calcium
Pre-menopausal
Lin J,2007,BRE80165US, not statedWomen's Health Study
54 - 56 276 medical records FFQProspectiveCohort
31487.0 10.0 years Calcium from diet mg/day
Invasive breast cancerPre-menopausal
>998.0vs.<556.9
60.84(0.57, 1.22)
0.24 A C D E F G
incidence
Dietary Calcium
Post-menopausal
Shin, M.-H.,2002,BRE16658
USA, Not specified,Registered nursesNurses' Health Study (NHS)Cohort 1976-1996
(47) 2345 By Mail FFQ (nos)ProspectiveCohort
85519 16.0 years dg/day
Invasive breast cancerPost-menopausal
1.0(continuous)
10.99(0.97, 1.02)
A C D E F G
mortality/incidence
Dietary calcium
Post-menopausal
Lin J,2007,BRE80165US, not statedWomen's Health Study
54 - 56 743 medical records FFQProspectiveCohort
31487.0 10.0 years Calcium from diet mg/day
Invasive breast cancerPost-menopausal
>998.0vs.<556.9
61.1(0.86, 1.39)
0.56 A G
incidence
Dietary Calcium
Menopausal status not specified
Jarvinen,R.,1997,BRE04383
finlandFinland, 1966
15 - UnspecifiedDietary Historyquestionnaire
ProspectiveCohort
4697.0 24.0 yearsBreast cancer Quantile 3
vs.Quantile 1
20.44(null, null)
0.09 A
incidence
Non-dairy calcium
Pre-menopausal
254
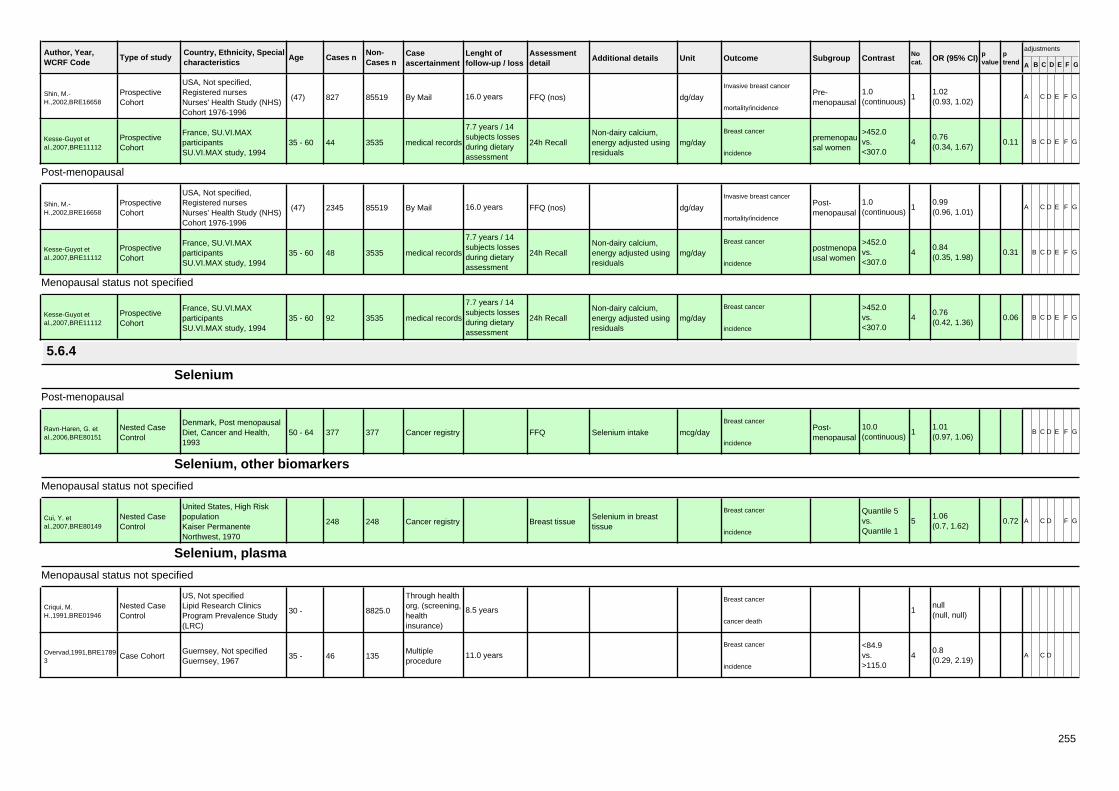
Author, Year,WCRF Code
Country, Ethnicity, Specialcharacteristics
Age Cases n Caseascertainment
Type of studyNon-Cases n
Lenght offollow-up / loss
Assessmentdetail
Additional details Unit Outcome Subgroup Contrast Nocat. OR (95% CI) p
valueptrend A B C D E F G
adjustments
Shin, M.-H.,2002,BRE16658
USA, Not specified,Registered nursesNurses' Health Study (NHS)Cohort 1976-1996
(47) 827 By Mail FFQ (nos)ProspectiveCohort
85519 16.0 years dg/day
Invasive breast cancerPre-menopausal
1.0(continuous)
11.02(0.93, 1.02)
A C D E F G
mortality/incidence
Kesse-Guyot etal.,2007,BRE11112
France, SU.VI.MAXparticipantsSU.VI.MAX study, 1994
35 - 60 44 medical records 24h RecallProspectiveCohort
3535
7.7 years / 14subjects lossesduring dietaryassessment
Non-dairy calcium,energy adjusted usingresiduals
mg/day
Breast cancerpremenopausal women
>452.0vs.<307.0
40.76(0.34, 1.67)
0.11 B C D E F G
incidence
Post-menopausal
Shin, M.-H.,2002,BRE16658
USA, Not specified,Registered nursesNurses' Health Study (NHS)Cohort 1976-1996
(47) 2345 By Mail FFQ (nos)ProspectiveCohort
85519 16.0 years dg/day
Invasive breast cancerPost-menopausal
1.0(continuous)
10.99(0.96, 1.01)
A C D E F G
mortality/incidence
Kesse-Guyot etal.,2007,BRE11112
France, SU.VI.MAXparticipantsSU.VI.MAX study, 1994
35 - 60 48 medical records 24h RecallProspectiveCohort
3535
7.7 years / 14subjects lossesduring dietaryassessment
Non-dairy calcium,energy adjusted usingresiduals
mg/day
Breast cancerpostmenopausal women
>452.0vs.<307.0
40.84(0.35, 1.98)
0.31 B C D E F G
incidence
Menopausal status not specified
Kesse-Guyot etal.,2007,BRE11112
France, SU.VI.MAXparticipantsSU.VI.MAX study, 1994
35 - 60 92 medical records 24h RecallProspectiveCohort
3535
7.7 years / 14subjects lossesduring dietaryassessment
Non-dairy calcium,energy adjusted usingresiduals
mg/day
Breast cancer >452.0vs.<307.0
40.76(0.42, 1.36)
0.06 B C D E F G
incidence
5.6.4
Selenium
Post-menopausal
Ravn-Haren, G. etal.,2006,BRE80151
Denmark, Post menopausalDiet, Cancer and Health,1993
50 - 64 377 Cancer registry FFQNested CaseControl
377 Selenium intake mcg/day
Breast cancerPost-menopausal
10.0(continuous)
11.01(0.97, 1.06)
B C D E F G
incidence
Selenium, other biomarkers
Menopausal status not specified
Cui, Y. etal.,2007,BRE80149
United States, High RiskpopulationKaiser PermanenteNorthwest, 1970
248 Cancer registry Breast tissueNested CaseControl
248Selenium in breasttissue
Breast cancer Quantile 5vs.Quantile 1
51.06(0.7, 1.62)
0.72 A C D F G
incidence
Selenium, plasma
Menopausal status not specified
Criqui, M.H.,1991,BRE01946
US, Not specifiedLipid Research ClinicsProgram Prevalence Study(LRC)
30 -
Through healthorg. (screening,healthinsurance)
Nested CaseControl
8825.0 8.5 yearsBreast cancer
1null(null, null)
cancer death
Overvad,1991,BRE17893
Guernsey, Not specifiedGuernsey, 1967
35 - 46Multipleprocedure
Case Cohort 135 11.0 yearsBreast cancer <84.9
vs.>115.0
40.8(0.29, 2.19)
A C D
incidence
255

Author, Year,WCRF Code
Country, Ethnicity, Specialcharacteristics
Age Cases n Caseascertainment
Type of studyNon-Cases n
Lenght offollow-up / loss
Assessmentdetail
Additional details Unit Outcome Subgroup Contrast Nocat. OR (95% CI) p
valueptrend A B C D E F G
adjustments
Selenium, serum
Menopausal status not specified
Dorgan,J.F.,1998,BRE14889
U S, Not specifiedColumbia Missouri BreastCancer Serum Bank, 1977
41 - 73 105Throughnetwork, paper,tv
Nested CaseControl
209 9.5 years mcmol/L
Invasive breast cancer 1.67 - 1.98vs.<1.43
40.9(0.4, 1.8)
0.99 D G
incidence
Selenium, toenail
Pre-menopausal
van Noord, P.A.,1987,BRE12755
the Netherlands, Notspecified, ScreeningProgramDOM-project Utrecht,
42 - 52
Through healthorg. (screening,healthinsurance)
Nested CaseControl
8760.0 25.7 monthsBreast cancer
Pre-menopausal
1null(null, null)
C E G
incidence
Hunter, D.J.,1990,BRE04166
US, Not specified,Registered nursesNurses' Health Study (NHS)Cohort 1976-1996
30 - 55 179 By MailNested CaseControl
171 53.0 months mcg/g
Breast cancerPre-menopausal
>0.906vs.<0.705
51.04(0.48, 2.23)
A C D E F G
incidence
Post-menopausal
Hunter, D.J.,1990,BRE04166
US, Not specified,Registered nursesNurses' Health Study (NHS)Cohort 1976-1996
30 - 55 255 By MailNested CaseControl
263 53.0 monthsmeasure of theisomeric transition ofradioactive selenium
mcg/g
Breast cancerPost-menopausal
>0.906vs.<0.705
51.21(0.66, 2.2)
A C D E F G
incidence
Van Noord,P.A.H.,1993,BRE16938
The Netherlands, Notspecified, ScreeningProgramDOM-project Utrecht,
55 - 70 67
Through healthorg. (screening,healthinsurance)
Nested CaseControl
270 5.0 yearsBreast cancer
Post-menopausal
1null(null, null)
incidence
van den Brandt, P.A,1994,BRE12721
the Netherlands, NotspecifiedThe Netherlands CohortStudy on diet and cancer,
55 - 69 355 By MailCase Cohort 4051 3.3 years mcg/g
Invasive breast cancerPost-menopausal
>0.646vs.<0.499
50.93(0.65, 1.33)
0.656
A
incidence
Menopausal status not specified
Hunter, D.J.,1990,BRE04166
US, Not specified,Registered nursesNurses' Health Study (NHS)Cohort 1976-1996
30 - 55 434 By MailNested CaseControl
434 53.0 months mcg/g
Breast cancer >0.906vs.<0.705
51.1(0.7, 1.72)
A C D E F G
incidence
5.6.7
Zinc, tissue sample
Menopausal status not specified
Cui, Y. etal.,2007,BRE80149
United States, High RiskpopulationKaiser PermanenteNorthwest, 1970
248 Cancer registryNested CaseControl
248 Zinc in breast tissue
Breast cancer Quantile 5vs.Quantile 1
51.32(0.89, 1.98)
0.06 A C D F G
incidence
5.7
256
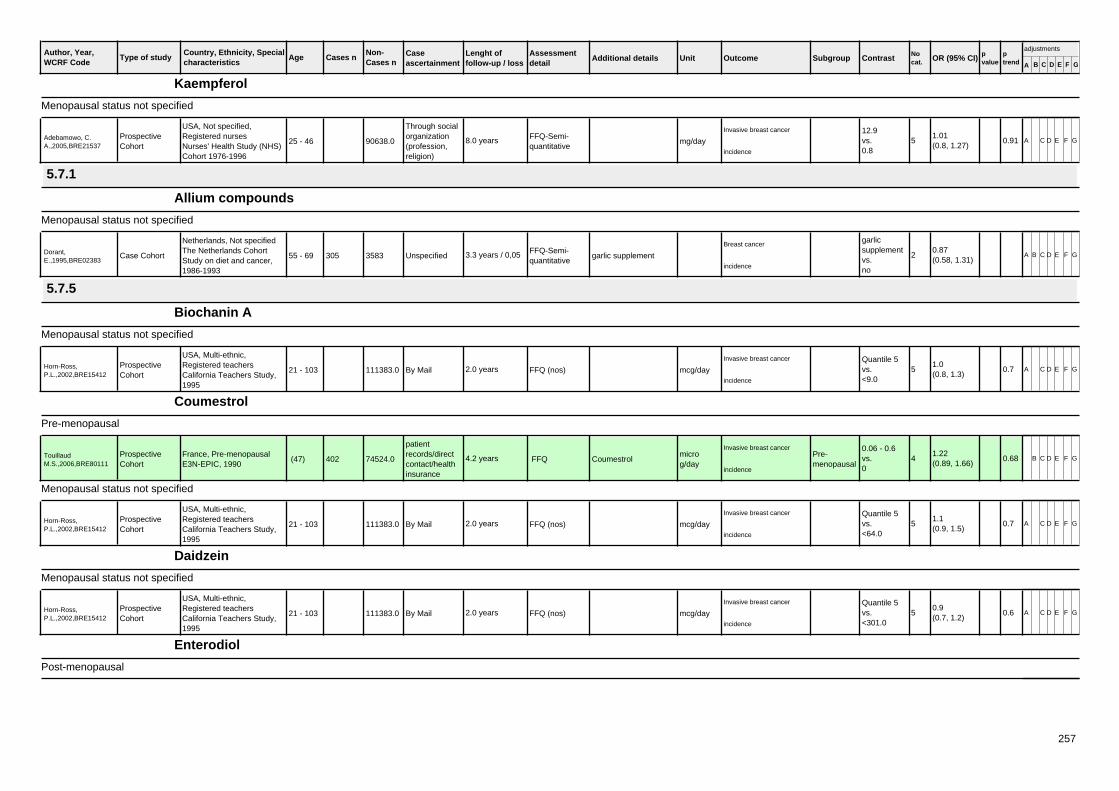
Author, Year,WCRF Code
Country, Ethnicity, Specialcharacteristics
Age Cases n Caseascertainment
Type of studyNon-Cases n
Lenght offollow-up / loss
Assessmentdetail
Additional details Unit Outcome Subgroup Contrast Nocat. OR (95% CI) p
valueptrend A B C D E F G
adjustments
Kaempferol
Menopausal status not specified
Adebamowo, C.A.,2005,BRE21537
USA, Not specified,Registered nursesNurses' Health Study (NHS)Cohort 1976-1996
25 - 46
Through socialorganization(profession,religion)
FFQ-Semi-quantitative
ProspectiveCohort
90638.0 8.0 years mg/day
Invasive breast cancer 12.9vs.0.8
51.01(0.8, 1.27)
0.91 A C D E F G
incidence
5.7.1
Allium compounds
Menopausal status not specified
Dorant,E.,1995,BRE02383
Netherlands, Not specifiedThe Netherlands CohortStudy on diet and cancer,1986-1993
55 - 69 305 UnspecifiedFFQ-Semi-quantitative
Case Cohort 3583 3.3 years / 0,05 garlic supplement
Breast cancergarlicsupplementvs.no
20.87(0.58, 1.31)
A B C D E F G
incidence
5.7.5
Biochanin A
Menopausal status not specified
Horn-Ross,P.L.,2002,BRE15412
USA, Multi-ethnic,Registered teachersCalifornia Teachers Study,1995
21 - 103 By Mail FFQ (nos)ProspectiveCohort
111383.0 2.0 years mcg/day
Invasive breast cancer Quantile 5vs.<9.0
51.0(0.8, 1.3)
0.7 A C D E F G
incidence
Coumestrol
Pre-menopausal
TouillaudM.S.,2006,BRE80111
France, Pre-menopausalE3N-EPIC, 1990
(47) 402
patientrecords/directcontact/healthinsurance
FFQProspectiveCohort
74524.0 4.2 years Coumestrolmicrog/day
Invasive breast cancerPre-menopausal
0.06 - 0.6vs.0
41.22(0.89, 1.66)
0.68 B C D E F G
incidence
Menopausal status not specified
Horn-Ross,P.L.,2002,BRE15412
USA, Multi-ethnic,Registered teachersCalifornia Teachers Study,1995
21 - 103 By Mail FFQ (nos)ProspectiveCohort
111383.0 2.0 years mcg/day
Invasive breast cancer Quantile 5vs.<64.0
51.1(0.9, 1.5)
0.7 A C D E F G
incidence
Daidzein
Menopausal status not specified
Horn-Ross,P.L.,2002,BRE15412
USA, Multi-ethnic,Registered teachersCalifornia Teachers Study,1995
21 - 103 By Mail FFQ (nos)ProspectiveCohort
111383.0 2.0 years mcg/day
Invasive breast cancer Quantile 5vs.<301.0
50.9(0.7, 1.2)
0.6 A C D E F G
incidence
Enterodiol
Post-menopausal
257

Author, Year,WCRF Code
Country, Ethnicity, Specialcharacteristics
Age Cases n Caseascertainment
Type of studyNon-Cases n
Lenght offollow-up / loss
Assessmentdetail
Additional details Unit Outcome Subgroup Contrast Nocat. OR (95% CI) p
valueptrend A B C D E F G
adjustments
Touillaud etal.,2007,BRE80015
France, Post-menopausalE3N-EPIC, 1990
41 - 72 695
patientrecords/directcontact/healthinsurance
FFQProspectiveCohort
58049.0 7.7 years Enterodiolmicrog/day
Breast cancer ER+/PR+339.0 -918.0vs.<239.0
40.79(0.63, 0.99)
0.02 A C D E F G
incidence
Touillaud etal.,2007,BRE80015
France, Post-menopausalE3N-EPIC, 1990
41 - 72 250
patientrecords/directcontact/healthinsurance
FFQProspectiveCohort
58049.0 7.7 years Enterodiolmicrog/day
Breast cancer ER+/PR-339.0 -918.0vs.<239.0
40.86(0.61, 1.21)
0.32 A C D E F G
incidence
Touillaud etal.,2007,BRE80015
France, Post-menopausalE3N-EPIC, 1990
41 - 72 37
patientrecords/directcontact/healthinsurance
FFQProspectiveCohort
58049.0 7.7 years Enterodiolmicrog/day
Breast cancer ER-/PR+339.0 -918.0vs.<239.0
40.86(0.34, 2.15)
0.76 A C D E F G
incidence
Touillaud etal.,2007,BRE80015
France, Post-menopausalE3N-EPIC, 1990
41 - 72 198
patientrecords/directcontact/healthinsurance
FFQProspectiveCohort
58049.0 7.7 years Enterodiolmicrog/day
Breast cancer ER-/PR-339.0 -918.0vs.<239.0
41.06(0.71, 1.59)
0.66 A C D E F G
incidence
Touillaud etal.,2007,BRE80015
France, Post-menopausalE3N-EPIC, 1990
41 - 72 1469
patientrecords/directcontact/healthinsurance
FFQProspectiveCohort
58049.0 7.7 years Enterdiolmicrog/day
Invasive breast cancer339.0 -918.0vs.<239.0
40.9(0.77, 1.04)
0.07 A C D E F G
incidence
Enterolactone
Post-menopausal
OlsenA,2004,BRE80170
Denmark, Post menopausalDiet, Cancer and Health,1993
50 - 64 381 Cancer registry FFQNested CaseControl
381 4.3 year Serum enterolactone nmol/litre
Breast cancer20.0(continuous)
10.93(0.86, 1.01)
0.09 B C D E F G
Incidence
OlsenA,2004,BRE80170
Denmark, Post menopausalDiet, Cancer and Health,1993
50 - 64 381 Cancer registry FFQNested CaseControl
381 4.3 year Serum enterolactone nmol/litre
Breast cancer 48.0 - 454.6vs.14.5 - 28.1
40.55(0.36, 0.85)
A F
Incidence
OlsenA,2004,BRE80170
Denmark, Post menopausalDiet, Cancer and Health,1993
50 - 64 273 Cancer registry FFQNested CaseControl
273 4.3 year Serum enterolactone nmol/litre
Breast cancer ER+20.0(continuous)
10.97(0.88, 1.06)
0.45 A B C D E F G
Incidence
OlsenA,2004,BRE80170
Denmark, Post menopausalDiet, Cancer and Health,1993
50 - 64 273 Cancer registry FFQNested CaseControl
273 4.3 year Serum enterolactone nmol/litre
Breast cancer ER+ 48.0 - 454.6vs.14.5 - 28.1
40.67(0.41, 1.08)
A F
Incidence
OlsenA,2004,BRE80170
Denmark, Post menopausalDiet, Cancer and Health,1993
50 - 64 80 Cancer registry FFQNested CaseControl
80 4.3 year Serum enterolactone nmol/litre
Breast cancer ER-20.0(continuous)
10.71(0.53, 0.94)
0.02 A B C D E F G
Incidence
OlsenA,2004,BRE80170
Denmark, Post menopausalDiet, Cancer and Health,1993
50 - 64 80 Cancer registry FFQNested CaseControl
80 4.3 year Serum enterolactone nmol/litre
Breast cancer ER- 48.0 - 454.6vs.14.5 - 28.1
40.26(0.09, 0.77)
A F
Incidence
Touillaud etal.,2007,BRE80015
France, Post-menopausalE3N-EPIC, 1990
41 - 72 695
patientrecords/directcontact/healthinsurance
FFQProspectiveCohort
58049.0 7.7 years Enterolactonemicrog/day
Breast cancer ER+/PR+560.0 -1646.0vs.<406.0
40.8(0.65, 0.99)
0.03 A C D E F G
incidence
258

Author, Year,WCRF Code
Country, Ethnicity, Specialcharacteristics
Age Cases n Caseascertainment
Type of studyNon-Cases n
Lenght offollow-up / loss
Assessmentdetail
Additional details Unit Outcome Subgroup Contrast Nocat. OR (95% CI) p
valueptrend A B C D E F G
adjustments
Touillaud etal.,2007,BRE80015
France, Post-menopausalE3N-EPIC, 1990
41 - 72 250
patientrecords/directcontact/healthinsurance
FFQProspectiveCohort
58049.0 7.7 years Enterolactonemicrog/day
Breast cancer ER+/PR-560.0 -1646.0vs.<406.0
40.85(0.6, 1.2)
0.32 A C D E F G
incidence
Touillaud etal.,2007,BRE80015
France, Post-menopausalE3N-EPIC, 1990
41 - 72 37
patientrecords/directcontact/healthinsurance
FFQProspectiveCohort
58049.0 7.7 years Enterolactonemicrog/day
Breast cancer ER-/PR+560.0 -1646.0vs.<406.0
40.63(0.24, 1.66)
0.39 A C D E F G
incidence
Touillaud etal.,2007,BRE80015
France, Post-menopausalE3N-EPIC, 1990
41 - 72 198
patientrecords/directcontact/healthinsurance
FFQProspectiveCohort
58049.0 7.7 years Enterolactonemicrog/day
Breast cancer ER-/PR-560.0 -1646.0vs.<406.0
40.95(0.64, 1.4)
0.97 A C D E F G
incidence
Touillaud etal.,2007,BRE80015
France, Post-menopausalE3N-EPIC, 1990
41 - 72 1469
patientrecords/directcontact/healthinsurance
FFQProspectiveCohort
58049.0 7.7 years Enterolactonemicrog/day
Invasive breast cancer560.0 -1646.0vs.<406.0
40.88(0.76, 1.02)
0.08 A C D E F G
incidence
Formononetin
Menopausal status not specified
Horn-Ross,P.L.,2002,BRE15412
USA, Multi-ethnic,Registered teachersCalifornia Teachers Study,1995
21 - 103 By Mail FFQ (nos)ProspectiveCohort
111383.0 2.0 years mcg/day
Invasive breast cancer Quantile 5vs.<5.0
51.1(0.8, 1.4)
0.4 A C D E F G
incidence
Genistein
Menopausal status not specified
Horn-Ross,P.L.,2002,BRE15412
USA, Multi-ethnic,Registered teachersCalifornia Teachers Study,1995
21 - 103 By Mail FFQ (nos)ProspectiveCohort
111383.0 2.0 years mcg/day
Invasive breast cancer Quantile 5vs.<290.0
51.0(0.7, 1.3)
0.9 A C D E F G
incidence
Lignans
Pre-menopausal
TouillaudM.S.,2006,BRE80111
France, Pre-menopausalE3N-EPIC, 1990
(47) 402
patientrecords/directcontact/healthinsurance
FFQProspectiveCohort
74524.0 4.2 years
Total plant lignans,sum of individual plantlignans, pinoresinol,lariciresinol,
microg/day
Invasive breast cancerPre-menopausal
1357.0 -4611.0vs.41.0 - 843.0
41.07(0.81, 1.41)
0.8 B C D E F G
incidence
TouillaudM.S.,2006,BRE80111
France, Pre-menopausalE3N-EPIC, 1990
(47) 402
patientrecords/directcontact/healthinsurance
FFQProspectiveCohort
74524.0 4.2 years
Enterolignans, lignansmetabolites, sum ofenterodiol,enterolactone
microg/day
Invasive breast cancerPre-menopausal
1289.0 -3361.0vs.168.0 -
40.94(0.71, 1.24)
0.53 B C D E F G
incidence
Post-menopausal
Touillaud etal.,2007,BRE80015
France, Post-menopausalE3N-EPIC, 1990
41 - 72 695
patientrecords/directcontact/healthinsurance
FFQProspectiveCohort
58049.0 7.7 years Total plant lignansmicrog/day
Breast cancer ER+/PR+1395.0 -5701.0vs.<877.0
40.72(0.58, 0.88)
0.01 A C D E F G
incidence
Touillaud etal.,2007,BRE80015
France, Post-menopausalE3N-EPIC, 1990
41 - 72 695
patientrecords/directcontact/healthinsurance
FFQProspectiveCohort
58049.0 7.7 years Total enterolignansmicrog/day
Breast cancer ER+/PR+896.0 -2538.0vs.<652.0
40.77(0.62, 0.95)
0.009
A C D E F G
incidence
259

Author, Year,WCRF Code
Country, Ethnicity, Specialcharacteristics
Age Cases n Caseascertainment
Type of studyNon-Cases n
Lenght offollow-up / loss
Assessmentdetail
Additional details Unit Outcome Subgroup Contrast Nocat. OR (95% CI) p
valueptrend A B C D E F G
adjustments
Touillaud etal.,2007,BRE80015
France, Post-menopausalE3N-EPIC, 1990
41 - 72 250
patientrecords/directcontact/healthinsurance
FFQProspectiveCohort
58049.0 7.7 years Total plant lignansmicrog/day
Breast cancer ER+/PR-1395.0 -5701.0vs.<877.0
40.87(0.61, 1.23)
0.46 A C D E F G
incidence
Touillaud etal.,2007,BRE80015
France, Post-menopausalE3N-EPIC, 1990
41 - 72 250
patientrecords/directcontact/healthinsurance
FFQProspectiveCohort
58049.0 7.7 years Total enterolignansmicrog/day
Breast cancer ER+/PR-896.0 -2538.0vs.<652.0
40.89(0.63, 1.25)
0.48 A C D E F G
incidence
Touillaud etal.,2007,BRE80015
France, Post-menopausalE3N-EPIC, 1990
41 - 72 37
patientrecords/directcontact/healthinsurance
FFQProspectiveCohort
58049.0 7.7 years Total plant lignansmicrog/day
Breast cancer ER-/PR+1395.0 -5701.0vs.<877.0
40.99(0.39, 2.47)
0.89 A C D E F G
incidence
Touillaud etal.,2007,BRE80015
France, Post-menopausalE3N-EPIC, 1990
41 - 72 37
patientrecords/directcontact/healthinsurance
FFQProspectiveCohort
58049.0 7.7 years Total enterolignansmicrog/day
Breast cancer ER-/PR+896.0 -2538.0vs.<652.0
40.99(0.36, 2.67)
0.79 A C D E F G
incidence
Touillaud etal.,2007,BRE80015
France, Post-menopausalE3N-EPIC, 1990
41 - 72 198
patientrecords/directcontact/healthinsurance
FFQProspectiveCohort
58049.0 7.7 years Total plant lignansmicrog/day
Breast cancer ER-/PR-1395.0 -5701.0vs.<877.0
41.11(0.74, 1.67)
0.87 A C D E F G
incidence
Touillaud etal.,2007,BRE80015
France, Post-menopausalE3N-EPIC, 1990
41 - 72 198
patientrecords/directcontact/healthinsurance
FFQProspectiveCohort
58049.0 7.7 years Total enterolignansmicrog/day
Breast cancer ER-/PR-896.0 -2538.0vs.<652.0
40.96(0.65, 1.43)
0.95 A C D E F G
incidence
Touillaud etal.,2007,BRE80015
France, Post-menopausalE3N-EPIC, 1990
41 - 72 1469
patientrecords/directcontact/healthinsurance
FFQProspectiveCohort
58049.0 7.7 years Total plant lignansmicrog/day
Invasive breast cancer1395.0 -5701.0vs.<877.0
40.83(0.71, 0.96)
0.02 A C D E F G
incidence
Touillaud etal.,2007,BRE80015
France, Post-menopausalE3N-EPIC, 1990
41 - 72 1469
patientrecords/directcontact/healthinsurance
FFQProspectiveCohort
58049.0 7.7 years Total enterolignansmicrog/day
Invasive breast cancer896.0 -2538.0vs.<652.0
40.89(0.77, 1.03)
0.06 A C D E F G
incidence
Menopausal status not specified
Keinan-Boker,L.,2004,BRE04713
Netherlands, Not specified,Screening ProgramEuropean ProspectiveInvestigation into Cancer and
50 - 69 280
Through healthorg. (screening,healthinsurance)
FFQ (nos)ProspectiveCohort
15275 5.2 years mg/day
Breast cancer 0.77vs.0.59
40.7(0.46, 1.09)
0.06 A B C D E F G
incidence
Matairesinol
Menopausal status not specified
Horn-Ross,P.L.,2002,BRE15412
USA, Multi-ethnic,Registered teachersCalifornia Teachers Study,1995
21 - 103 By Mail FFQ (nos)ProspectiveCohort
111383.0 2.0 years mcg/day
Invasive breast cancer Quantile 5vs.<12.0
51.1(0.8, 1.4)
0.2 A C D E F G
incidence
Phytoestrogen eg genistein
Post-menopausal
Touillaud etal.,2007,BRE80015
France, Post-menopausalE3N-EPIC, 1990
41 - 72 695
patientrecords/directcontact/healthinsurance
FFQProspectiveCohort
58049.0 7.7 years Pinoresinol intake,phytoestrogen
microg/day
Breast cancer ER+/PR+549.0 -2390.0vs.<311.0
40.81(0.66, 0.99)
0.15 A C D E F G
incidence
260

Author, Year,WCRF Code
Country, Ethnicity, Specialcharacteristics
Age Cases n Caseascertainment
Type of studyNon-Cases n
Lenght offollow-up / loss
Assessmentdetail
Additional details Unit Outcome Subgroup Contrast Nocat. OR (95% CI) p
valueptrend A B C D E F G
adjustments
Touillaud etal.,2007,BRE80015
France, Post-menopausalE3N-EPIC, 1990
41 - 72 695
patientrecords/directcontact/healthinsurance
FFQProspectiveCohort
58049.0 7.7 years Lariciresinol intake,phytoestrogen
microg/day
Breast cancer ER+/PR+628.0 -2581.0vs.<393.0
40.7(0.57, 0.87)
0.005
A C D E F G
incidence
Touillaud etal.,2007,BRE80015
France, Post-menopausalE3N-EPIC, 1990
41 - 72 695
patientrecords/directcontact/healthinsurance
FFQProspectiveCohort
58049.0 7.7 years Secoisolariciresinolintake, phytoestrogen
microg/day
Breast cancer ER+/PR+215.0 -750.0vs.<136.0
40.86(0.68, 1.09)
0.19 A C D E F G
incidence
Touillaud etal.,2007,BRE80015
France, Post-menopausalE3N-EPIC, 1990
41 - 72 695
patientrecords/directcontact/healthinsurance
FFQProspectiveCohort
58049.0 7.7 years Matairesinol intake,phytoestrogen
microg/day
Breast cancer ER+/PR+ 17.0 - 95.0vs.<6.0
41.04(0.8, 1.35)
0.62 A C D E F G
incidence
Touillaud etal.,2007,BRE80015
France, Post-menopausalE3N-EPIC, 1990
41 - 72 250
patientrecords/directcontact/healthinsurance
FFQProspectiveCohort
58049.0 7.7 years Pinoresinol intake,phytoestrogen
microg/day
Breast cancer ER+/PR-549.0 -2390.0vs.<311.0
40.78(0.55, 1.12)
0.27 A C D E F G
incidence
Touillaud etal.,2007,BRE80015
France, Post-menopausalE3N-EPIC, 1990
41 - 72 250
patientrecords/directcontact/healthinsurance
FFQProspectiveCohort
58049.0 7.7 years Lariciresinol intake,phytoestrogen
microg/day
Breast cancer ER+/PR-628.0 -2581.0vs.<393.0
40.71(0.49, 1.02)
0.09 A C D E F G
incidence
Touillaud etal.,2007,BRE80015
France, Post-menopausalE3N-EPIC, 1990
41 - 72 250
patientrecords/directcontact/healthinsurance
FFQProspectiveCohort
58049.0 7.7 years Secoisolariciresinolintake, phytoestrogen
microg/day
Breast cancer ER+/PR-215.0 -750.0vs.<136.0
40.93(0.63, 1.38)
0.87 A C D E F G
incidence
Touillaud etal.,2007,BRE80015
France, Post-menopausalE3N-EPIC, 1990
41 - 72 250
patientrecords/directcontact/healthinsurance
FFQProspectiveCohort
58049.0 7.7 years Matairesinol intake,phytoestrogen
microg/day
Breast cancer ER+/PR- 17.0 - 95.0vs.<6.0
41.13(0.7, 1.81)
0.88 A C D E F G
incidence
Touillaud etal.,2007,BRE80015
France, Post-menopausalE3N-EPIC, 1990
41 - 72 37
patientrecords/directcontact/healthinsurance
FFQProspectiveCohort
58049.0 7.7 years Pinoresinol intake,phytoestrogen
microg/day
Breast cancer ER-/PR+549.0 -2390.0vs.<311.0
41.02(0.34, 3.08)
0.95 A C D E F G
incidence
Touillaud etal.,2007,BRE80015
France, Post-menopausalE3N-EPIC, 1990
41 - 72 37
patientrecords/directcontact/healthinsurance
FFQProspectiveCohort
58049.0 7.7 years Lariciresinol intake,phytoestrogen
microg/day
Breast cancer ER-/PR+628.0 -2581.0vs.<393.0
40.91(0.34, 2.46)
0.73 A C D E F G
incidence
Touillaud etal.,2007,BRE80015
France, Post-menopausalE3N-EPIC, 1990
41 - 72 37
patientrecords/directcontact/healthinsurance
FFQProspectiveCohort
58049.0 7.7 years Secoisolariciresinolintake, phytoestrogen
microg/day
Breast cancer ER-/PR+215.0 -750.0vs.<136.0
40.94(0.36, 2.46)
0.95 A C D E F G
incidence
Touillaud etal.,2007,BRE80015
France, Post-menopausalE3N-EPIC, 1990
41 - 72 37
patientrecords/directcontact/healthinsurance
FFQProspectiveCohort
58049.0 7.7 years Matairesinol intake,phytoestrogen
microg/day
Breast cancer ER-/PR+ 17.0 - 95.0vs.<6.0
41.24(0.36, 4.24)
0.8 A C D E F G
incidence
Touillaud etal.,2007,BRE80015
France, Post-menopausalE3N-EPIC, 1990
41 - 72 198
patientrecords/directcontact/healthinsurance
FFQProspectiveCohort
58049.0 7.7 years Pinoresinol intake,phytoestrogen
microg/day
Breast cancer ER-/PR-549.0 -2390.0vs.<311.0
41.21(0.81, 1.82)
0.63 A C D E F G
incidence
Touillaud etal.,2007,BRE80015
France, Post-menopausalE3N-EPIC, 1990
41 - 72 198
patientrecords/directcontact/healthinsurance
FFQProspectiveCohort
58049.0 7.7 years Lariciresinol intake,phytoestrogen
microg/day
Breast cancer ER-/PR-628.0 -2581.0vs.<393.0
41.07(0.71, 1.61)
0.97 A C D E F G
incidence
261

Author, Year,WCRF Code
Country, Ethnicity, Specialcharacteristics
Age Cases n Caseascertainment
Type of studyNon-Cases n
Lenght offollow-up / loss
Assessmentdetail
Additional details Unit Outcome Subgroup Contrast Nocat. OR (95% CI) p
valueptrend A B C D E F G
adjustments
Touillaud etal.,2007,BRE80015
France, Post-menopausalE3N-EPIC, 1990
41 - 72 198
patientrecords/directcontact/healthinsurance
FFQProspectiveCohort
58049.0 7.7 years Secoisolariciresinolintake, phytoestrogen
microg/day
Breast cancer ER-/PR-215.0 -750.0vs.<136.0
40.97(0.62, 1.53)
0.98 A C D E F G
incidence
Touillaud etal.,2007,BRE80015
France, Post-menopausalE3N-EPIC, 1990
41 - 72 198
patientrecords/directcontact/healthinsurance
FFQProspectiveCohort
58049.0 7.7 years Matairesinol intake,phytoestrogen
microg/day
Breast cancer ER-/PR- 17.0 - 95.0vs.<6.0
40.94(0.56, 1.56)
0.51 A C D E F G
incidence
Touillaud etal.,2007,BRE80015
France, Post-menopausalE3N-EPIC, 1990
41 - 72 1469
patientrecords/directcontact/healthinsurance
FFQProspectiveCohort
58049.0 7.7 years Pinoresinol intake,phytoestrogen
microg/day
Invasive breast cancer549.0 -2390.0vs.<311.0
40.87(0.76, 1.01)
0.12 A C D E F G
incidence
Touillaud etal.,2007,BRE80015
France, Post-menopausalE3N-EPIC, 1990
41 - 72 1469
patientrecords/directcontact/healthinsurance
FFQProspectiveCohort
58049.0 7.7 years Lariciresinol intake,phytoestrogen
microg/day
Invasive breast cancer628.0 -2581.0vs.<393.0
40.82(0.71, 0.95)
0.01 A C D E F G
incidence
Touillaud etal.,2007,BRE80015
France, Post-menopausalE3N-EPIC, 1990
41 - 72 1469
patientrecords/directcontact/healthinsurance
FFQProspectiveCohort
58049.0 7.7 years Secoisolariciresinolintake, phytoestrogen
microg/day
Invasive breast cancer215.0 -750.0vs.<136.0
40.93(0.79, 1.09)
0.34 A C D E F G
incidence
Touillaud etal.,2007,BRE80015
France, Post-menopausalE3N-EPIC, 1990
41 - 72 1469
patientrecords/directcontact/healthinsurance
FFQProspectiveCohort
58049.0 7.7 years Matairesinol intake,phytoestrogen
microg/day
Invasive breast cancer 17.0 - 95.0vs.<6.0
41.05(0.87, 1.27)
A C D E F G
incidence
Plasma Enterolactone
Menopausal status not specified
Hulten,K.,2002,BRE04156
Sweden, Not specifiedVIP + MONICA + MSP
248 UnspecifiedNested CaseControl
492 15.0 yearsBreast cancer
87.5-100vs.25-75percentile
51.8(1.4, 4.3)
D F G
incidence
Secoisolariciresiniol
Menopausal status not specified
Horn-Ross,P.L.,2002,BRE15412
USA, Multi-ethnic,Registered teachersCalifornia Teachers Study,1995
21 - 103 By Mail FFQ (nos)ProspectiveCohort
111383.0 2.0 years mcg/day
Invasive breast cancer Quantile 5vs.<48.0
51.4(1.0, 1.8)
0.02 A C D E F G
incidence
Serum Daidzein
Post-menopausal
Verheus etal.,2007,BRE20024
NetherlandsProspect-EPIC Utrecht
(56) 296national cancerregisters
bloodNested CaseControl
296 6.5 years Plasma daidzein,phytoestrogen
Breast cancerpostmenopausal women
Quantile 3vs.Quantile 1
30.88(0.59, 1.32)
0.59incidence
Menopausal status not specified
Grace, P.B.,2004,BRE19680
United Kingdom, NotspecifiedEPIC-Norfolk
41 - 76 Unspecified Urine & SerumNested CaseControl
16744.0 8.0 years mcg/mmol
Breast cancer1.0(continuous)
10.85(0.7, 1.03)
0.044
C D E F G
incidence
262

Author, Year,WCRF Code
Country, Ethnicity, Specialcharacteristics
Age Cases n Caseascertainment
Type of studyNon-Cases n
Lenght offollow-up / loss
Assessmentdetail
Additional details Unit Outcome Subgroup Contrast Nocat. OR (95% CI) p
valueptrend A B C D E F G
adjustments
Verheus etal.,2007,BRE20024
NetherlandsProspect-EPIC Utrecht
(56) 388national cancerregisters
bloodNested CaseControl
388 6.5 years Plasma daidzein,phytoestrogen
Breast cancer Quantile 3vs.Quantile 1
30.83(0.58, 1.19)
0.33incidence
Verheus etal.,2007,BRE20024
NetherlandsProspect-EPIC Utrecht
(56) 87national cancerregisters
bloodNested CaseControl
87 6.5 years Plasma daidzein,phytoestrogen
Breast cancer pre-/perimenopausal women
Quantile 3vs.Quantile 1
30.8(0.34, 1.88)
0.44 C
incidence
Serum Enterodiol
Post-menopausal
Verheus etal.,2007,BRE20024
NetherlandsProspect-EPIC Utrecht
(56) 296national cancerregisters
bloodNested CaseControl
296 6.5 years Plasma enterodiol,phytoestrogen
Breast cancerpostmenopausal women
Quantile 3vs.Quantile 1
30.91(0.6, 1.39)
0.76incidence
Menopausal status not specified
Grace, P.B.,2004,BRE19680
United Kingdom, NotspecifiedEPIC-Norfolk
41 - 76 Unspecified Urine & SerumNested CaseControl
16744.0 8.0 years mcg/mmol
Breast cancer1.0(continuous)
10.63(0.5, 0.78)
0.392
C D E F G
incidence
Verheus etal.,2007,BRE20024
NetherlandsProspect-EPIC Utrecht
(56) 388national cancerregisters
bloodNested CaseControl
388 6.5 years Plasma enterodiol,phytoestrogen
Breast cancer Quantile 3vs.Quantile 1
31.07(0.75, 1.53)
0.63incidence
Verheus etal.,2007,BRE20024
NetherlandsProspect-EPIC Utrecht
(56) 87national cancerregisters
bloodNested CaseControl
87 6.5 years Plasma enterodiol,phytoestrogen
Breast cancer pre-/perimenopausal women
Quantile 3vs.Quantile 1
31.45(0.69, 3.05)
0.45incidence
Serum Enterolactone
Pre-menopausal
Kilkkinen,A.,2004,BRE17698
FinlandHelsinki and Oulu, 1982
25 - 74 Unspecified SerumNested CaseControl
15497.0 15.0 years nanomol/L
Breast cancerPre-menopausal
39.8vs.7.4
30.73(0.34, 1.59)
0.42 A G
incidence
Zeleniuch-Jacquotte,A.,2004,BRE13929
U.S.A., Not specifiedNew York Women's HealthStudy, 1985
34 - 65 189 By Mail SerumNested CaseControl
189 10.0 years nanomol/L
Invasive breast cancerPre-menopausal
>24.1vs.<4.98
51.6(0.7, 3.4)
0.13 A C D F
incidence
Post-menopausal
Kilkkinen,A.,2004,BRE17698
FinlandHelsinki and Oulu, 1982
25 - 74 Unspecified SerumNested CaseControl
15497.0 15.0 years nanomol/L
Breast cancerPost-menopausal
38.5vs.6.9
31.22(0.69, 2.16)
0.5 A G
incidence
Zeleniuch-Jacquotte,A.,2004,BRE13929
U.S.A., Not specifiedNew York Women's HealthStudy, 1985
34 - 65 228 By Mail SerumNested CaseControl
228 10.0 years nanomol/L
Invasive breast cancerPost-menopausal
>29.08vs.<5.4
51.0(0.5, 2.1)
0.95 A C D F
incidence
263
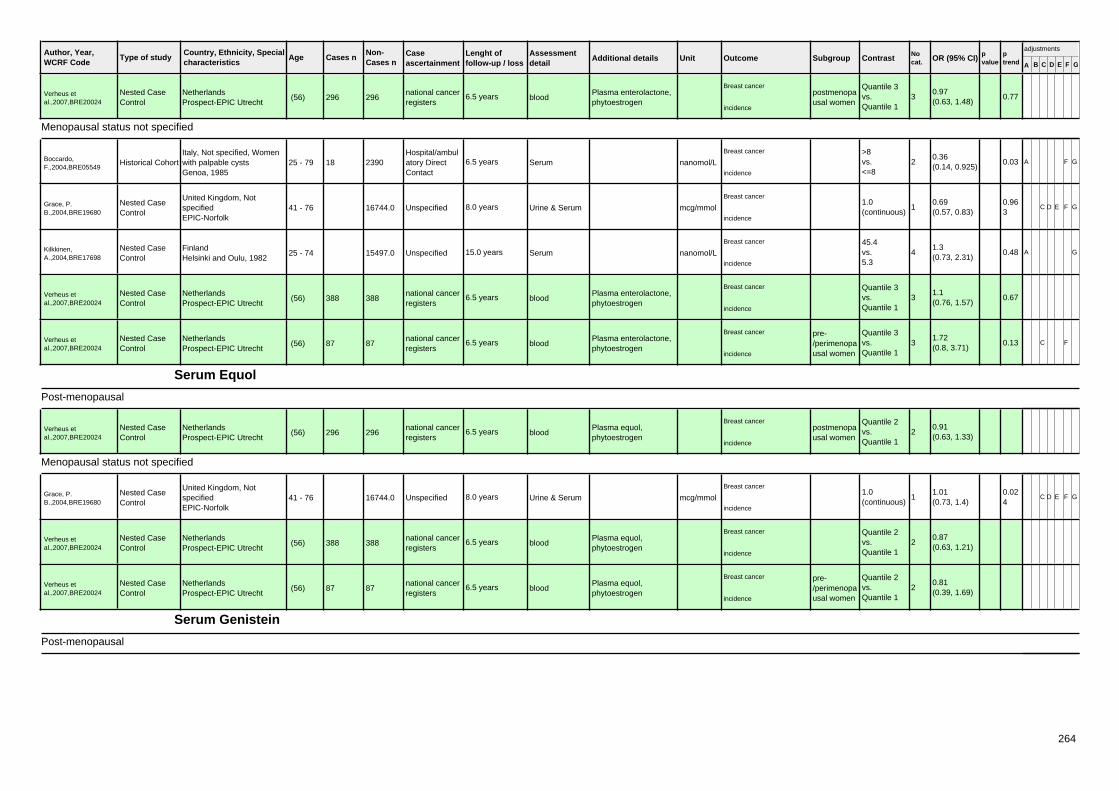
Author, Year,WCRF Code
Country, Ethnicity, Specialcharacteristics
Age Cases n Caseascertainment
Type of studyNon-Cases n
Lenght offollow-up / loss
Assessmentdetail
Additional details Unit Outcome Subgroup Contrast Nocat. OR (95% CI) p
valueptrend A B C D E F G
adjustments
Verheus etal.,2007,BRE20024
NetherlandsProspect-EPIC Utrecht
(56) 296national cancerregisters
bloodNested CaseControl
296 6.5 years Plasma enterolactone,phytoestrogen
Breast cancerpostmenopausal women
Quantile 3vs.Quantile 1
30.97(0.63, 1.48)
0.77incidence
Menopausal status not specified
Boccardo,F.,2004,BRE05549
Italy, Not specified, Womenwith palpable cystsGenoa, 1985
25 - 79 18Hospital/ambulatory DirectContact
SerumHistorical Cohort 2390 6.5 years nanomol/L
Breast cancer >8vs.<=8
20.36(0.14, 0.925)
0.03 A F G
incidence
Grace, P.B.,2004,BRE19680
United Kingdom, NotspecifiedEPIC-Norfolk
41 - 76 Unspecified Urine & SerumNested CaseControl
16744.0 8.0 years mcg/mmol
Breast cancer1.0(continuous)
10.69(0.57, 0.83)
0.963
C D E F G
incidence
Kilkkinen,A.,2004,BRE17698
FinlandHelsinki and Oulu, 1982
25 - 74 Unspecified SerumNested CaseControl
15497.0 15.0 years nanomol/L
Breast cancer 45.4vs.5.3
41.3(0.73, 2.31)
0.48 A G
incidence
Verheus etal.,2007,BRE20024
NetherlandsProspect-EPIC Utrecht
(56) 388national cancerregisters
bloodNested CaseControl
388 6.5 years Plasma enterolactone,phytoestrogen
Breast cancer Quantile 3vs.Quantile 1
31.1(0.76, 1.57)
0.67incidence
Verheus etal.,2007,BRE20024
NetherlandsProspect-EPIC Utrecht
(56) 87national cancerregisters
bloodNested CaseControl
87 6.5 years Plasma enterolactone,phytoestrogen
Breast cancer pre-/perimenopausal women
Quantile 3vs.Quantile 1
31.72(0.8, 3.71)
0.13 C F
incidence
Serum Equol
Post-menopausal
Verheus etal.,2007,BRE20024
NetherlandsProspect-EPIC Utrecht
(56) 296national cancerregisters
bloodNested CaseControl
296 6.5 years Plasma equol,phytoestrogen
Breast cancerpostmenopausal women
Quantile 2vs.Quantile 1
20.91(0.63, 1.33)
incidence
Menopausal status not specified
Grace, P.B.,2004,BRE19680
United Kingdom, NotspecifiedEPIC-Norfolk
41 - 76 Unspecified Urine & SerumNested CaseControl
16744.0 8.0 years mcg/mmol
Breast cancer1.0(continuous)
11.01(0.73, 1.4)
0.024
C D E F G
incidence
Verheus etal.,2007,BRE20024
NetherlandsProspect-EPIC Utrecht
(56) 388national cancerregisters
bloodNested CaseControl
388 6.5 years Plasma equol,phytoestrogen
Breast cancer Quantile 2vs.Quantile 1
20.87(0.63, 1.21)
incidence
Verheus etal.,2007,BRE20024
NetherlandsProspect-EPIC Utrecht
(56) 87national cancerregisters
bloodNested CaseControl
87 6.5 years Plasma equol,phytoestrogen
Breast cancer pre-/perimenopausal women
Quantile 2vs.Quantile 1
20.81(0.39, 1.69)
incidence
Serum Genistein
Post-menopausal
264

Author, Year,WCRF Code
Country, Ethnicity, Specialcharacteristics
Age Cases n Caseascertainment
Type of studyNon-Cases n
Lenght offollow-up / loss
Assessmentdetail
Additional details Unit Outcome Subgroup Contrast Nocat. OR (95% CI) p
valueptrend A B C D E F G
adjustments
Verheus etal.,2007,BRE20024
NetherlandsProspect-EPIC Utrecht
(56) 296national cancerregisters
bloodNested CaseControl
296 6.5 years Plasma genistein,phytoestrogen
Breast cancerpostmenopausal women
Quantile 3vs.Quantile 1
30.69(0.45, 1.04)
0.09incidence
Menopausal status not specified
Grace, P.B.,2004,BRE19680
United Kingdom, NotspecifiedEPIC-Norfolk
41 - 76 Unspecified Urine & SerumNested CaseControl
16744.0 8.0 years mcg/mmol
Breast cancer1.0(continuous)
10.86(0.68, 1.09)
0.077
C D E F G
incidence
Verheus etal.,2007,BRE20024
NetherlandsProspect-EPIC Utrecht
(56) 388national cancerregisters
bloodNested CaseControl
388 6.5 years Plasma genistein,phytoestrogen
Breast cancer Quantile 3vs.Quantile 1
30.68(0.47, 0.98)
0.07incidence
Verheus etal.,2007,BRE20024
NetherlandsProspect-EPIC Utrecht
(56) 87national cancerregisters
bloodNested CaseControl
87 6.5 years Plasma genistein,phytoestrogen
Breast cancer pre-/perimenopausal women
Quantile 3vs.Quantile 1
30.8(0.38, 1.69)
0.65 C
incidence
Serum Glycitein
Post-menopausal
Verheus etal.,2007,BRE20024
NetherlandsProspect-EPIC Utrecht
(56) 296national cancerregisters
bloodNested CaseControl
296 6.5 years Plasma glycitein,phytoestrogen
Breast cancerpostmenopausal women
Quantile 3vs.Quantile 1
30.81(0.53, 1.24)
0.34incidence
Menopausal status not specified
Grace, P.B.,2004,BRE19680
United Kingdom, NotspecifiedEPIC-Norfolk
41 - 76 Unspecified Urine & SerumNested CaseControl
16744.0 8.0 years mcg/mmol
Breast cancer1.0(continuous)
10.85(0.66, 1.1)
0.123
C D E F G
incidence
Verheus etal.,2007,BRE20024
NetherlandsProspect-EPIC Utrecht
(56) 388national cancerregisters
bloodNested CaseControl
388 6.5 years Plasma glycitein,phytoestrogen
Breast cancer Quantile 3vs.Quantile 1
30.83(0.59, 1.18)
0.32incidence
Verheus etal.,2007,BRE20024
NetherlandsProspect-EPIC Utrecht
(56) 87national cancerregisters
bloodNested CaseControl
87 6.5 years Plasma glycitein,phytoestrogen
Breast cancer pre-/perimenopausal women
Quantile 3vs.Quantile 1
30.92(0.42, 2.03)
0.85incidence
Serum O-DMA
Post-menopausal
Verheus etal.,2007,BRE20024
NetherlandsProspect-EPIC Utrecht
(56) 296national cancerregisters
bloodNested CaseControl
296 6.5 years Plasma O-DMA
Breast cancerpostmenopausal women
Quantile 3vs.Quantile 1
30.82(0.55, 1.23)
0.64incidence
Menopausal status not specified
Grace, P.B.,2004,BRE19680
United Kingdom, NotspecifiedEPIC-Norfolk
41 - 76 Unspecified Urine & SerumNested CaseControl
16744.0 8.0 years mcg/mmol
Breast cancer1.0(continuous)
10.79(0.65, 0.97)
0.199
C D E F G
incidence
265

Author, Year,WCRF Code
Country, Ethnicity, Specialcharacteristics
Age Cases n Caseascertainment
Type of studyNon-Cases n
Lenght offollow-up / loss
Assessmentdetail
Additional details Unit Outcome Subgroup Contrast Nocat. OR (95% CI) p
valueptrend A B C D E F G
adjustments
Verheus etal.,2007,BRE20024
NetherlandsProspect-EPIC Utrecht
(56) 388national cancerregisters
bloodNested CaseControl
388 6.5 years Plasma O-DMA,phytoestrogen
Breast cancer Quantile 3vs.Quantile 1
30.83(0.59, 1.18)
0.39incidence
Verheus etal.,2007,BRE20024
NetherlandsProspect-EPIC Utrecht
(56) 87national cancerregisters
bloodNested CaseControl
87 6.5 years Plasma O-DMA,phytoestrogen
Breast cancer pre-/perimenopausal women
Quantile 3vs.Quantile 1
30.66(0.26, 1.65)
0.32 C F
incidence
Urine Daidzein
Menopausal status not specified
Grace, P.B.,2004,BRE19680
United Kingdom, NotspecifiedEPIC-Norfolk
41 - 76 Unspecified DiaryNested CaseControl
16744.0 8.0 years mcg/mmol
Breast cancer1.0(continuous)
10.79(0.67, 0.91)
0.138
C D E F G
incidence
Grace, P.B.,2004,BRE19680
United Kingdom, NotspecifiedEPIC-Norfolk
41 - 76 Unspecified DiaryNested CaseControl
16744.0 8.0 years mcg/mmol
Breast cancer1.0(continuous)
10.81(0.68, 0.96)
0.097
C D E F G
incidence
Urine Enterodiol
Menopausal status not specified
Grace, P.B.,2004,BRE19680
United Kingdom, NotspecifiedEPIC-Norfolk
41 - 76 Unspecified DiaryNested CaseControl
16744.0 8.0 years mcg/mmol
Breast cancer1.0(continuous)
10.7(0.58, 0.85)
0.873
C D E F G
incidence
Urine Enterolactone
Post-menopausal
Den Tonkelaar,I.,2001,BRE14840
Netherlands, Not specified,Post-menopausalDOM-project Utrecht,1974/1984
50 - 64 88
Through healthorg. (screening,healthinsurance)
Nested CaseControl
268 9.0 years mcmol/mol
Breast cancerPost-menopausal
656.0 -2334.9vs.7.16 - 379.0
31.43(0.79, 2.59)
0.25incidence
Menopausal status not specified
Grace, P.B.,2004,BRE19680
United Kingdom, NotspecifiedEPIC-Norfolk
41 - 76 Unspecified DiaryNested CaseControl
16744.0 8.0 years mcg/mmol
Breast cancer1.0(continuous)
10.68(0.59, 0.78)
0.785
C D E F G
incidence
Urine Equol
Menopausal status not specified
Grace, P.B.,2004,BRE19680
United Kingdom, NotspecifiedEPIC-Norfolk
41 - 76 Unspecified DiaryNested CaseControl
16744.0 8.0 years mcg/mmol
Breast cancer1.0(continuous)
10.93(0.74, 1.18)
0.013
C D E F G
incidence
Urine Genistein
Post-menopausal
266
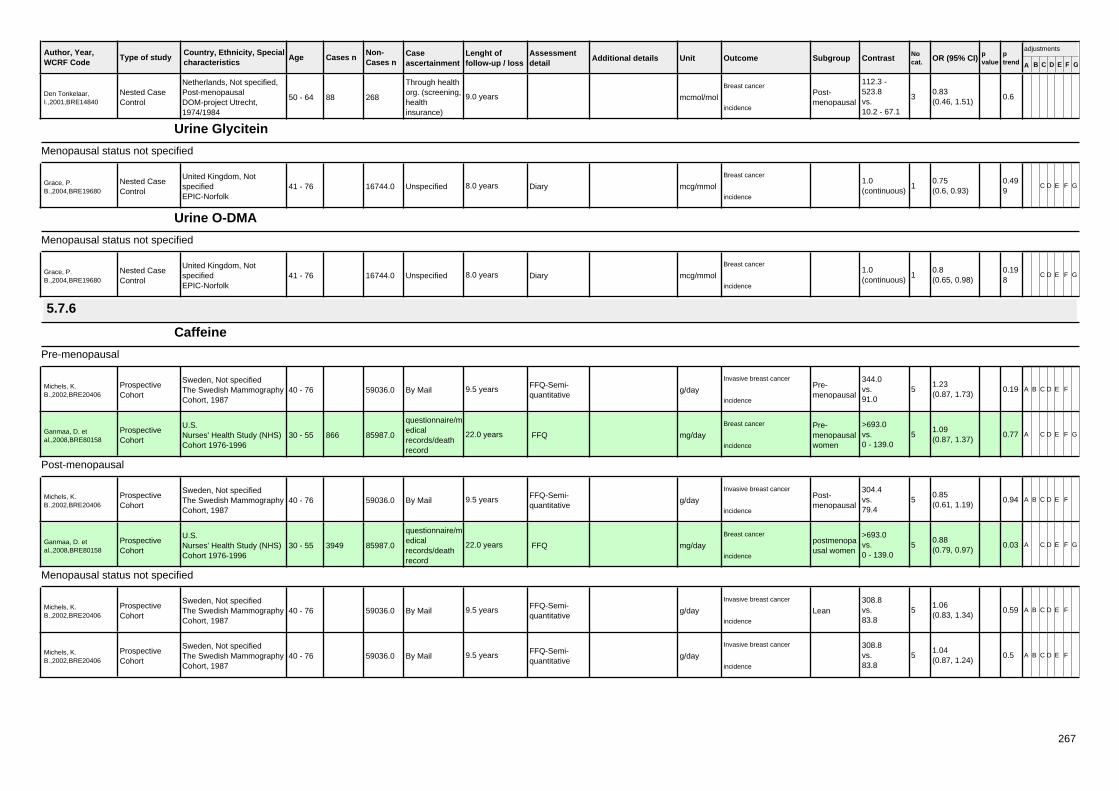
Author, Year,WCRF Code
Country, Ethnicity, Specialcharacteristics
Age Cases n Caseascertainment
Type of studyNon-Cases n
Lenght offollow-up / loss
Assessmentdetail
Additional details Unit Outcome Subgroup Contrast Nocat. OR (95% CI) p
valueptrend A B C D E F G
adjustments
Den Tonkelaar,I.,2001,BRE14840
Netherlands, Not specified,Post-menopausalDOM-project Utrecht,1974/1984
50 - 64 88
Through healthorg. (screening,healthinsurance)
Nested CaseControl
268 9.0 years mcmol/mol
Breast cancerPost-menopausal
112.3 -523.8vs.10.2 - 67.1
30.83(0.46, 1.51)
0.6incidence
Urine Glycitein
Menopausal status not specified
Grace, P.B.,2004,BRE19680
United Kingdom, NotspecifiedEPIC-Norfolk
41 - 76 Unspecified DiaryNested CaseControl
16744.0 8.0 years mcg/mmol
Breast cancer1.0(continuous)
10.75(0.6, 0.93)
0.499
C D E F G
incidence
Urine O-DMA
Menopausal status not specified
Grace, P.B.,2004,BRE19680
United Kingdom, NotspecifiedEPIC-Norfolk
41 - 76 Unspecified DiaryNested CaseControl
16744.0 8.0 years mcg/mmol
Breast cancer1.0(continuous)
10.8(0.65, 0.98)
0.198
C D E F G
incidence
5.7.6
Caffeine
Pre-menopausal
Michels, K.B.,2002,BRE20406
Sweden, Not specifiedThe Swedish MammographyCohort, 1987
40 - 76 By MailFFQ-Semi-quantitative
ProspectiveCohort
59036.0 9.5 years g/day
Invasive breast cancerPre-menopausal
344.0vs.91.0
51.23(0.87, 1.73)
0.19 A B C D E F
incidence
Ganmaa, D. etal.,2008,BRE80158
U.S.Nurses' Health Study (NHS)Cohort 1976-1996
30 - 55 866
questionnaire/medicalrecords/deathrecord
FFQProspectiveCohort
85987.0 22.0 years mg/day
Breast cancer Pre-menopausalwomen
>693.0vs.0 - 139.0
51.09(0.87, 1.37)
0.77 A C D E F G
incidence
Post-menopausal
Michels, K.B.,2002,BRE20406
Sweden, Not specifiedThe Swedish MammographyCohort, 1987
40 - 76 By MailFFQ-Semi-quantitative
ProspectiveCohort
59036.0 9.5 years g/day
Invasive breast cancerPost-menopausal
304.4vs.79.4
50.85(0.61, 1.19)
0.94 A B C D E F
incidence
Ganmaa, D. etal.,2008,BRE80158
U.S.Nurses' Health Study (NHS)Cohort 1976-1996
30 - 55 3949
questionnaire/medicalrecords/deathrecord
FFQProspectiveCohort
85987.0 22.0 years mg/day
Breast cancerpostmenopausal women
>693.0vs.0 - 139.0
50.88(0.79, 0.97)
0.03 A C D E F G
incidence
Menopausal status not specified
Michels, K.B.,2002,BRE20406
Sweden, Not specifiedThe Swedish MammographyCohort, 1987
40 - 76 By MailFFQ-Semi-quantitative
ProspectiveCohort
59036.0 9.5 years g/day
Invasive breast cancer
Lean308.8vs.83.8
51.06(0.83, 1.34)
0.59 A B C D E F
incidence
Michels, K.B.,2002,BRE20406
Sweden, Not specifiedThe Swedish MammographyCohort, 1987
40 - 76 By MailFFQ-Semi-quantitative
ProspectiveCohort
59036.0 9.5 years g/day
Invasive breast cancer 308.8vs.83.8
51.04(0.87, 1.24)
0.5 A B C D E F
incidence
267

Author, Year,WCRF Code
Country, Ethnicity, Specialcharacteristics
Age Cases n Caseascertainment
Type of studyNon-Cases n
Lenght offollow-up / loss
Assessmentdetail
Additional details Unit Outcome Subgroup Contrast Nocat. OR (95% CI) p
valueptrend A B C D E F G
adjustments
Michels, K.B.,2002,BRE20406
Sweden, Not specifiedThe Swedish MammographyCohort, 1987
40 - 76 By MailFFQ-Semi-quantitative
ProspectiveCohort
59036.0 9.5 years g/day
Invasive breast cancer
Overweight304.4vs.79.4
51.04(0.79, 1.37)
0.57 A B C D E F
incidence
Ganmaa, D. etal.,2008,BRE80158
U.S.Nurses' Health Study (NHS)Cohort 1976-1996
30 - 55 5272
questionnaire/medicalrecords/deathrecord
FFQProspectiveCohort
85987.0 22.0 years mg/day
Breast cancer >693.0vs.0 - 139.0
50.93(0.85, 1.01)
0.06 A C D E F G
incidence
Ganmaa, D. etal.,2008,BRE80158
U.S.Nurses' Health Study (NHS)Cohort 1976-1996
30 - 55 2402
questionnaire/medicalrecords/deathrecord
FFQProspectiveCohort
85987.0 22.0 years mg/day
Breast cancer ER+/PR+
ER+/PR+>693.0vs.0 - 139.0
50.88(0.77, 1.0)
0.01 A C D E F G
incidence
Ganmaa, D. etal.,2008,BRE80158
U.S.Nurses' Health Study (NHS)Cohort 1976-1996
30 - 55 731
questionnaire/medicalrecords/deathrecord
FFQProspectiveCohort
85987.0 22.0 years mg/day
Breast cancer ER-/PR+
ER-/PR+>693.0vs.0 - 139.0
50.88(0.69, 1.12)
0.33 A C D E F G
incidence
5.8
Isoflavones
Pre-menopausal
Yamamoto,S.,2003,BRE17122
Japan, Not specifiedJapan, 1990
40 - 59 89 UnspecifiedQuestionnaire(nos)
ProspectiveCohort
93628 9.0 years / 0.001 mg/day
Breast cancerPre-menopausal
25.0vs.6.9
40.66(0.25, 1.7)
0.97 A B C E F G
incidence
TouillaudM.S.,2006,BRE80111
France, Pre-menopausalE3N-EPIC, 1990
(47) 402
patientrecords/directcontact/healthinsurance
FFQProspectiveCohort
74524.0 4.2 years
Total isoflavones,genistein, daidzein,formononetin,biochanin-A
microg/day
Invasive breast cancerPre-menopausal
36.0 - 112.0vs.1.0 - 21.0
41.0(0.76, 1.31)
0.48 B C D E F G
incidence
Travis, R.C. etal.,2007,BRE80141
United KingdomEPIC Oxford
20 - 89 196National HealthRecords
FFQProspectiveCohort
36489.0 7.4 years / 0.07
Isoflavoune intake,from soy foods andmilk or other dairyproducts
mg/day
Invasive & In situ breastcancer Pre-
menopausal
10+vs.<10
21.31(0.95, 1.81)
A C D E F G
incidence
Post-menopausal
Yamamoto,S.,2003,BRE17122
Japan, Not specifiedJapan, 1990
40 - 59 87 UnspecifiedQuestionnaire(nos)
ProspectiveCohort
111637 9.0 years / 0.001 mg/day
Breast cancerPost-menopausal
25.0vs.6.9
40.32(0.14, 0.71)
0.006
A B C E F G
incidence
Travis, R.C. etal.,2007,BRE80141
United KingdomEPIC Oxford
20 - 89 290National HealthRecords
FFQProspectiveCohort
36489.0 7.4 years / 0.07
Isoflavoune intake,from soy foods andmilk or other dairyproducts
mg/day
Invasive & In situ breastcancer Post-
menopausal
10+vs.<10
20.95(0.66, 1.38)
A C D E F G
incidence
Menopausal status not specified
Yamamoto,S.,2003,BRE17122
Japan, Not specifiedJapan, 1990
40 - 59 179 UnspecifiedQuestionnaire(nos)
ProspectiveCohort
209354 9.0 years / 0.001 mg/day
Breast cancer 25.0vs.6.9
40.46(0.25, 0.84)
0.043
A B C E F G
incidence
268

Author, Year,WCRF Code
Country, Ethnicity, Specialcharacteristics
Age Cases n Caseascertainment
Type of studyNon-Cases n
Lenght offollow-up / loss
Assessmentdetail
Additional details Unit Outcome Subgroup Contrast Nocat. OR (95% CI) p
valueptrend A B C D E F G
adjustments
Keinan-Boker,L.,2004,BRE04713
Netherlands, Not specified,Screening ProgramEuropean ProspectiveInvestigation into Cancer and
50 - 69 280
Through healthorg. (screening,healthinsurance)
FFQ (nos)ProspectiveCohort
15273 5.2 years mg/day
Breast cancer 0.77vs.0.19
40.98(0.65, 1.48)
0.92 A B C D E F G
incidence
Travis, R.C. etal.,2007,BRE80141
United KingdomEPIC Oxford
20 - 89 585National HealthRecords
FFQProspectiveCohort
36489.0 7.4 years / 0.07
Isoflavoune intake,from soy foods andmilk or other dairyproducts
mg/day
Invasive & In situ breastcancer 20+
vs.<10
31.17(0.79, 1.71)
0.36 A C D E F G
incidence
Travis, R.C. etal.,2007,BRE80141
United KingdomEPIC Oxford
20 - 89 433National HealthRecords
FFQProspectiveCohort
36489.0 7.4 years / 0.07
Isoflavoune intake,from soy foods andmilk or other dairyproducts
mg/day
Invasive & In situ breastcancer
HRT - No10+vs.<10
21.16(0.92, 1.48)
A C D E F G
incidence
Myricetin
Menopausal status not specified
Adebamowo, C.A.,2005,BRE21537
USA, Not specified,Registered nursesNurses' Health Study (NHS)Cohort 1976-1996
25 - 46
Through socialorganization(profession,religion)
FFQ-Semi-quantitative
ProspectiveCohort
90638.0 8.0 years mg/day
Invasive breast cancer 2.62vs.0.09
50.99(0.78, 1.26)
0.35 A C D E F G
incidence
Quercetin
Menopausal status not specified
Adebamowo, C.A.,2005,BRE21537
USA, Not specified,Registered nursesNurses' Health Study (NHS)Cohort 1976-1996
25 - 46
Through socialorganization(profession,religion)
FFQ-Semi-quantitative
ProspectiveCohort
90638.0 8.0 years mg/day
Invasive breast cancer 30.1vs.5.3
51.05(0.83, 1.33)
0.81 A C D E F G
incidence
6.1
Physical activity
Pre-menopausal
Lahmann etal.,2007,BRE20026
Denmark,France,Germany,Greece,Italy,TheNetherlands,Spain,Swedenand UK
20 - 80 856
Populationcancerregistries andother
QuestionnaireProspectiveCohort
218169.0 6.4 yearsCombined recreationaland householdactivities
MET-hour/week
Invasive breast cancerpremenopausal women
>127.0vs.<54.0
40.82(0.66, 1.03)
0.107
A B C D E F G
incidence
Post-menopausal
Bardia etal.,2007,BRE20028
USA, Post-menopausalIowa Women's Health Study
55 - 69 2548State healthregistry
QuestionnaireProspectiveCohort
41836.0 18.0 years
Physical activity index,high is defined asvigorous activity >=2times/week or
Breast cancer Highvs.Low
30.91(0.82, 1.01)
0.13 A B C D E F G
incidence
Bardia etal.,2007,BRE20028
USA, Post-menopausalIowa Women's Health Study
55 - 69 1643State healthregistry
QuestionnaireProspectiveCohort
41836.0 18.0 years
Physical activity index,high is defined asvigorous activity >=2times/week or
Breast cancer ER+ Highvs.Low
30.87(0.77, 1.0)
0.06 A B C D E F G
incidence
Bardia etal.,2007,BRE20028
USA, Post-menopausalIowa Women's Health Study
55 - 69 1323State healthregistry
QuestionnaireProspectiveCohort
41836.0 18.0 years
Physical activity index,high is defined asvigorous activity >=2times/week or
Breast cancer ER+/PR+ Highvs.Low
30.94(0.81, 1.08)
0.37 A B C D E F G
incidence
269

Author, Year,WCRF Code
Country, Ethnicity, Specialcharacteristics
Age Cases n Caseascertainment
Type of studyNon-Cases n
Lenght offollow-up / loss
Assessmentdetail
Additional details Unit Outcome Subgroup Contrast Nocat. OR (95% CI) p
valueptrend A B C D E F G
adjustments
Bardia etal.,2007,BRE20028
USA, Post-menopausalIowa Women's Health Study
55 - 69 252State healthregistry
QuestionnaireProspectiveCohort
41836.0 18.0 years
Physical activity index,high is defined asvigorous activity >=2times/week or
Breast cancer ER+/PR- Highvs.Low
30.66(0.46, 0.94)
0.04 A B C D E F G
incidence
Bardia etal.,2007,BRE20028
USA, Post-menopausalIowa Women's Health Study
55 - 69 298State healthregistry
QuestionnaireProspectiveCohort
41836.0 18.0 years
Physical activity index,high is defined asvigorous activity >=2times/week or
Breast cancer ER- Highvs.Low
30.92(0.67, 1.25)
0.78 A B C D E F G
incidence
Bardia etal.,2007,BRE20028
USA, Post-menopausalIowa Women's Health Study
55 - 69 42State healthregistry
QuestionnaireProspectiveCohort
41836.0 18.0 years
Physical activity index,high is defined asvigorous activity >=2times/week or
Breast cancer ER-/PR+ Highvs.Low
31.42(0.67, 3.01)
0.41 A B C D E F G
incidence
Bardia etal.,2007,BRE20028
USA, Post-menopausalIowa Women's Health Study
55 - 69 244State healthregistry
QuestionnaireProspectiveCohort
41836.0 18.0 years
Physical activity index,high is defined asvigorous activity >=2times/week or
Breast cancer ER-/PR- Highvs.Low
30.8(0.56, 1.15)
0.4 A B C D E F G
incidence
Bardia etal.,2007,BRE20028
USA, Post-menopausalIowa Women's Health Study
55 - 69 1366State healthregistry
QuestionnaireProspectiveCohort
41836.0 18.0 years
Physical activity index,high is defined asvigorous activity >=2times/week or
Breast cancer PR+ Highvs.Low
30.95(0.82, 1.09)
0.45 A B C D E F G
incidence
Bardia etal.,2007,BRE20028
USA, Post-menopausalIowa Women's Health Study
55 - 69 497State healthregistry
QuestionnaireProspectiveCohort
41836.0 18.0 years
Physical activity index,high is defined asvigorous activity >=2times/week or
Breast cancer PR- Highvs.Low
30.73(0.65, 0.94)
0.04 A B C D E F G
incidence
Bardia etal.,2007,BRE20028
USA, Post-menopausalIowa Women's Health Study
55 - 69 687State healthregistry
QuestionnaireProspectiveCohort
41836.0 18.0 years
Physical activity index,high is defined asvigorous activity >=2times/week or
Breast cancer UnknownER/PR status Unknown
ER/PRstatus
Highvs.Low
30.96(0.79, 1.18)
0.87 A B C D E F G
incidence
Lahmann etal.,2007,BRE20026
Denmark,France,Germany,Greece,Italy,TheNetherlands,Spain,Swedenand UK
20 - 80 2547
Populationcancerregistries andother
QuestionnaireProspectiveCohort
218169.0 6.4 yearsCombined recreationaland householdactivities
MET-hour/week
Invasive breast cancerpostmenopausal women
>127.0vs.<54.0
40.83(0.73, 0.95)
0.002
A B C D E F G
incidence
Menopausal status not specified
Dallal etal.,2007,BRE80016
USACalifornia Teachers Study,1995
27 - 86 305 Cancer registry QuestionnaireProspectiveCohort
110599.0 6.6 years Annual moderate long-term physical activity
hours/week
Breast cancer ER+/PR- >5vs.<=0.5
50.95(0.62, 1.47)
0.86 C D E F G
incidence
physical activity index
Pre-menopausal
Lahmann etal.,2007,BRE20026
Denmark,France,Germany,Greece,Italy,TheNetherlands,Spain,Swedenand UK
20 - 80 820
Populationcancerregistries andother
QuestionnaireProspectiveCohort
218169.0 6.4 years
Total activity index,combined:occupational,recreational, and
Invasive breast cancerpremenopausal women
Activevs.Inactive
41.02(0.77, 1.36)
0.267
A B C D E F G
incidence
Post-menopausal
Lahmann etal.,2007,BRE20026
Denmark,France,Germany,Greece,Italy,TheNetherlands,Spain,Swedenand UK
20 - 80 2476
Populationcancerregistries andother
QuestionnaireProspectiveCohort
218169.0 6.4 years
Total activity index,combined:occupational,recreational, and
Invasive breast cancerpostmenopausal women
Activevs.Inactive
40.92(0.76, 1.12)
0.06 A B C D E F G
incidence
Total physical activity (overall summary
270

Author, Year,WCRF Code
Country, Ethnicity, Specialcharacteristics
Age Cases n Caseascertainment
Type of studyNon-Cases n
Lenght offollow-up / loss
Assessmentdetail
Additional details Unit Outcome Subgroup Contrast Nocat. OR (95% CI) p
valueptrend A B C D E F G
adjustments
Pre-menopausal
Lee, S.Y.,2003,BRE17745
Korea, Asian, Pre-menopausalKorean Women's Cohort(KWC), 1994/1995
20 - (35) 348
Through healthorg. (screening,healthinsurance)
ProspectiveCohort
101196 6.0 yearsBreast cancer
Pre-menopausal
yesvs.no
21.0(0.8, 1.5)
0.5667
A C D F G
incidence
Colditz, G.A.,2003,BRE01782
USA, Not specified,Registered nursesNHS II, 1989
25 - 42 849 By MailProspectiveCohort
934100 10.0 years / 849 MET-hour/week
Invasive breast cancerPre-menopausal
>=27vs.<3
51.04(0.82, 1.33)
0.86 A C D E F G
incidence
Colditz, G.A.,2003,BRE01782
USA, Not specified,Registered nursesNHS II, 1989
25 - 42 524 By MailProspectiveCohort
578000 10.0 years / 849 MET-hour/week
Invasive breast cancer Pre-menopausal& Lean
>=27vs.<3
51.04(0.72, 1.36)
0.89 A C D E F G
incidence
Colditz, G.A.,2003,BRE01782
USA, Not specified,Registered nursesNHS II, 1989
25 - 42 134 By MailProspectiveCohort
145600 10.0 years / 849 MET-hour/week
Invasive breast cancer Pre-menopausal&Overweight
>=27vs.<3
51.53(0.89, 2.63)
0.04 A C D E F G
incidence
Post-menopausal
Cerhan,J.R.,1998,BRE14588
USA, Not specified, ElderlyIowa 65+ Rural HealthStudy, 1973
65 - 102 43Direct contactat home
ProspectiveCohort
14811 11.0 yearsBreast cancer high active
vs.inactive
40.2(0.05, 1.0)
.008 A B C D E F G
incidence
Cerhan,J.R.,1998,BRE14588
USA, Not specified, ElderlyIowa 65+ Rural HealthStudy, 1973
65 - 102 34Direct contactat home
ProspectiveCohort
16791 11.0 yearsIn situ breast cancer high active
vs.inactive
40.3(0.06, 1.2)
.03 A B C D E F G
incidence
Wyrwich, K.W.,2000,BRE13664
usa, Not specified, ElderlyLSOA, 1984
70 - 96 77 UnspecifiedProspectiveCohort
21980 7.0 yearsBreast cancer highly active
vs.inactive
40.43(0.19, 0.96)
A B D G
incidence
Wyrwich, K.W.,2000,BRE13664
usa, Not specified, ElderlyLSOA, 1984
70 - 96 52 UnspecifiedProspectiveCohort
21876 7.0 yearsLocalized breast cancer highly active
vs.inactive
40.66(0.29, 1.53)
A G
incidence
Menopausal status not specified
Dorgan, J.F.,1994,BRE02385
USAFramingham Study, 1954
35 - 68 2298Generalpopulation(survey)
ProspectiveCohort
53099 28.0 yearsBreast cancer >1.0
vs.>-1.0
41.6(0.9, 2.9)
0.13 A B C E F G
incidence
Hoyer, A.P.,1998,BRE15433
Denmark, Not specifiedCopenhagenCHS
20 - 198 UnspecifiedQuestionnaire(nos)
Nested CaseControl
393 17.0 yearsBreast cancer heavy
vs.passive
30.72(0.44, 1.19)
0.2 B C D E F G
incidence
TehardB.,2006,BRE80108
FranceE3N-EPIC, 1990
40 - 65 2284
patientrecords/directcontact/healthinsurance
ProspectiveCohort
98995.0 11.4 years / 0.14
Total physical activity,multiplied MET of allPA variables byfrequency and
MET-hour/week
Breast cancer >57.8vs.<28.2
40.9(0.8, 1.02)
<0.05
A C D F G
incidence
6.1.1.1
271

Author, Year,WCRF Code
Country, Ethnicity, Specialcharacteristics
Age Cases n Caseascertainment
Type of studyNon-Cases n
Lenght offollow-up / loss
Assessmentdetail
Additional details Unit Outcome Subgroup Contrast Nocat. OR (95% CI) p
valueptrend A B C D E F G
adjustments
Low physical activity job
Menopausal status not specified
Pukkala,1993,BRE24790
finland, Registered teachersFinnish Female TeachersCohort, 1967-1991
20 - 74 322
Through socialorganization(profession,religion)
ProspectiveCohort
10118.0 7.0 years to be a languageteacher
Breast cancerlanguabeteachersvs.general
21.48(1.25, 1.69)
A
incidence
Occupational physical activity
Pre-menopausal
Albanes,1989,BRE00236
USA, Multi-ethnicNHANES I, 1971
25 - 74 46 UnspecifiedProspectiveCohort
7413.0 10.0 years non recreational ; veryactive excluded
Breast cancerPre-menopausal
inactivevs.moder active
20.4(0.1, 1.8)
A
incidence
Thune,I.,1997,BRE12313
Norway, Not specifiedNorway National HealthScreening Service, 1974
20 - 49 98 By MailProspectiveCohort
25624.0 13.7 years / 83Breast cancer
Pre-menopausal
Lifting orheavymanual laborvs.
30.48(0.24, 0.95)
0.03 A C D G
incidence
Moradi,T.,1999,BRE16127
swedenSweden, 1971
50 - 59 1597Otherprocedure
ProspectiveCohort
1480551 18.0 years age <50
Invasive breast cancerPre-menopausal
sedentaryvs.high
41.0(0.8, 1.4)
>0.5incidence
Lahmann etal.,2007,BRE20026
Denmark,France,Germany,Greece,Italy,TheNetherlands,Spain,Swedenand UK
20 - 80 659
Populationcancerregistries andother
FFQProspectiveCohort
218169.0 6.4 years
Occupational activity,nonworking categoryand missing vlauesexcluded, manual and
Invasive breast cancerpremenopausal women
Manual andheavymanualvs.
31.04(0.78, 1.38)
0.771
A B C D E F G
incidence
Post-menopausal
Albanes,1989,BRE00236
USA, Multi-ethnicNHANES I, 1971
25 - 74 UnspecifiedProspectiveCohort
7413.0 10.0 years non recreational ;very active excluded
Breast cancerPost-menopausal
inactivevs.moder active
21.5(0.7, 2.8)
A
incidence
Thune,I.,1997,BRE12313
Norway, Not specifiedNorway National HealthScreening Service, 1974
20 - 49 247 By MailProspectiveCohort
25624.0 13.7 years / 83Breast cancer
Post-menopausal
Lifting orheavymanual laborvs.
30.78(0.52, 1.18)
0.24 A C D G
incidence
Moradi,T.,1999,BRE16127
swedenSweden, 1971
50 - 59 2367Otherprocedure
ProspectiveCohort
1224905 18.0 years lifelong (census 60-70with same PAL level )
Invasive breast cancerPost-menopausal
sedentaryvs.high
41.3(1.1, 1.7)
0.005
incidence
Dirx, M.J.,2001,BRE02326
Netherlands, Not specified,Post-menopausalThe Netherlands CohortStudy on diet and cancer,
55 - 69 755Case Cohort 7104 7.3 years life-long KJ/minute
Breast cancerPost-menopausal
>12vs.<8
30.83(0.51, 1.34)
0.69 A B C D E F G
incidence
Mertens, A.J.,2005,BRE23405
USA, African-American andCaucasianAtherosclerosis Risk inCommunities (ARIC) Study,
45 - 64 UnspecifiedProspectiveCohort
7994.0 13.1 yearsBreast cancer
Post-menopausal
Quantile 4vs.Quantile 1
40.85(0.57, 1.28)
0.25 A C F G
incidence
Lahmann etal.,2007,BRE20026
Denmark,France,Germany,Greece,Italy,TheNetherlands,Spain,Swedenand UK
20 - 80 1225
Populationcancerregistries andother
FFQProspectiveCohort
218169.0 6.4 years
Occupational activity,nonworking categoryand missing vlauesexcluded, manual and
Invasive breast cancerpostmenopausal women
Manual andheavymanualvs.
31.08(0.91, 1.29)
0.743
A B C D E F G
incidence
272

Author, Year,WCRF Code
Country, Ethnicity, Specialcharacteristics
Age Cases n Caseascertainment
Type of studyNon-Cases n
Lenght offollow-up / loss
Assessmentdetail
Additional details Unit Outcome Subgroup Contrast Nocat. OR (95% CI) p
valueptrend A B C D E F G
adjustments
Menopausal status not specified
Albanes,1989,BRE00236
USA, Multi-ethnicNHANES I, 1971
25 - 74 UnspecifiedProspectiveCohort
7413.0 10.0 years
non recreational NOBEST MODELBECAUSE SAME RESOF 11742
Breast cancer inactivevs.very active
31.1(0.6, 2.0)
0.92 A
incidence
Steenland,K.,1995,BRE11742
usaNHANES I, 1971
25 - 74ProspectiveCohort
null 7.7 years non recreational
Breast cancer littlevs.a lot
30.86(0.61, 1.2)
A B D E F G
mortality/incidence
Byrne,C.,1996,BRE05719
USA, Black and WhiteNHEFS, 1981/82
25 - 74 53 Unspecified FFQ (nos)ProspectiveCohort
23759 3.9 years / 252 non- recretionalphysical activity
Breast cancerquiteinactivevs.very active
32.2(0.9, 5.5)
A
incidence
Thune,I.,1997,BRE12313
Norway, Not specifiedNorway National HealthScreening Service, 1974
20 - 49 By MailProspectiveCohort
25624.0 13.7 years / 83Breast cancer
Heavymanuallabourvs.
40.48(0.25, 0.92)
0.02 A C D G
incidence
Moradi,T.,1999,BRE16127
swedenSweden, 1971
50 - 59Otherprocedure
ProspectiveCohort
982270.0 18.0 years census 1970
Invasive breast cancer sedentaryvs.high
41.1(1.0, 1.2)
0.001
A B G
incidence
Moradi,T.,1999,BRE16127
swedenSweden, 1971
50 - 59Otherprocedure
ProspectiveCohort
982270.0 18.0 years census 1960 and 1970
Invasive breast cancer sedentaryvs.high
41.1(1.0, 1.2)
0.1 A B G
incidence
Mertens, A.J.,2005,BRE23405
USA, African-American andCaucasianAtherosclerosis Risk inCommunities (ARIC) Study,
45 - 64 UnspecifiedProspectiveCohort
7225 13.1 yearsBreast cancer Quantile 4
vs.Quantile 1
40.87(0.61, 1.24)
0.35 A C F G
incidence
6.1.1.2
Aerobic dancing
Menopausal status not specified
Drake, D.A.,2001,BRE02418
USA, Multi-ethnic, Fitnesscentre membersACLS, 1970
21 - 86
Through socialorganization(profession,religion)
ProspectiveCohort
4520.0 25.0 yearsBreast cancer
1null(null, null)
incidence
Bicycling
Menopausal status not specified
Drake, D.A.,2001,BRE02418
USA, Multi-ethnic, Fitnesscentre membersACLS, 1970
21 - 86
Through socialorganization(profession,religion)
ProspectiveCohort
4520.0 25.0 yearsBreast cancer
1null(null, null)
incidence
Change in recreational p.a., from adolescent to
Pre-menopausal
273

Author, Year,WCRF Code
Country, Ethnicity, Specialcharacteristics
Age Cases n Caseascertainment
Type of studyNon-Cases n
Lenght offollow-up / loss
Assessmentdetail
Additional details Unit Outcome Subgroup Contrast Nocat. OR (95% CI) p
valueptrend A B C D E F G
adjustments
Margolis, K.L.,2005,BRE23306
Norway and Sweden, NonHispanic White, YoungwomenWomen's Lifestyle and
30 - 49 1147Randomextraction
ProspectiveCohort
869711 9.1 years age 14 to enrollment
Invasive breast canceractive-nochangevs.inactive-no
41.2(0.85, 1.71)
A B C D E F G
incidence
Change in recreational p.a., from adolescent to
Pre-menopausal
Margolis, K.L.,2005,BRE23306
Norway and Sweden, NonHispanic White, YoungwomenWomen's Lifestyle and
30 - 49 1150Randomextraction
ProspectiveCohort
886938 9.1 years age 14 to 30
Invasive breast canceractive-nochangevs.inactive-no
41.1(0.81, 1.49)
A B C D E F G
incidence
Change in recreational p.a., from young adult to
Pre-menopausal
Margolis, K.L.,2005,BRE23306
Norway and Sweden, NonHispanic White, YoungwomenWomen's Lifestyle and
30 - 49 1148Randomextraction
ProspectiveCohort
871738 9.1 years age 30 to enrollment
Invasive breast canceractive-nochangevs.inactive-no
40.98(0.78, 1.22)
A B C D E F G
incidence
Exercise
Menopausal status not specified
Fraser, G.E.,1997,BRE02940
USA, White, AdventistAHS, 1974
24 -
Through socialorganization(profession,religion)
ProspectiveCohort
20341.0 6.0 years / 610Invasive breast cancer low level
vs.not low level
21.46(1.11, 1.92)
C D F
incidence
Flexibility activity
Menopausal status not specified
Drake, D.A.,2001,BRE02418
USA, Multi-ethnic, Fitnesscentre membersACLS, 1970
21 - 86
Through socialorganization(profession,religion)
ProspectiveCohort
4520.0 25.0 yearsBreast cancer
1null(null, null)
incidence
Golfing
Menopausal status not specified
Drake, D.A.,2001,BRE02418
USA, Multi-ethnic, Fitnesscentre membersACLS, 1970
21 - 86
Through socialorganization(profession,religion)
ProspectiveCohort
4520.0 25.0 yearsBreast cancer
1null(null, null)
incidence
Jogging
Menopausal status not specified
Drake, D.A.,2001,BRE02418
USA, Multi-ethnic, Fitnesscentre membersACLS, 1970
21 - 86
Through socialorganization(profession,religion)
ProspectiveCohort
4520.0 25.0 yearsBreast cancer
1null(null, null)
incidence
Leisure physical activity
274

Author, Year,WCRF Code
Country, Ethnicity, Specialcharacteristics
Age Cases n Caseascertainment
Type of studyNon-Cases n
Lenght offollow-up / loss
Assessmentdetail
Additional details Unit Outcome Subgroup Contrast Nocat. OR (95% CI) p
valueptrend A B C D E F G
adjustments
Post-menopausal
Ericson, U. etal.,2007,BRE80128
Sweden, Post menopausalMalmo Diet and Cancer,1991
50 - 389 Cancer registry QuestionnaireProspectiveCohort
11620 9.5 years Leisure-time physicalactivity
Invasive breast cancerPost-menopausal
Quantile 3vs.Quantile 1
30.93(0.73, 1.18)
0.55 A
incidence
Recreational activity
Pre-menopausal
Albanes,1989,BRE00236
USA, Multi-ethnicNHANES I, 1971
25 - 74 Unspecified InterviewProspectiveCohort
7413.0 10.0 years very active excluded
Breast cancerPre-menopausal
litte/noexercisevs.moderate
20.6(0.3, 1.2)
A
incidence
Thune,I.,1997,BRE12313
Norway, Not specifiedNorway National HealthScreening Service, 1974
20 - 49 98 By Mail QuestionnaireProspectiveCohort
25624.0 13.7 years / 83Breast cancer
Pre-menopausal
Regularexercisevs.Sedentary
30.53(0.25, 1.14)
0.10 A C D G
incidence
Sesso,H.D.,1998,BRE16626
usa, Not specified, CollegealumnaeCollege Alumni Health Study
37 - 69 28 By Mail QuestionnaireProspectiveCohort
1469831.0 years / 33%do not return f-up questionnaire
Kcal/week
Breast cancerPre-menopausal
>1000vs.<500
31.83(0.77, 4.31)
0.14 A D
incidence
Colditz, G.A.,2003,BRE01782
USA, Not specified,Registered nursesNHS II, 1989
25 - 42 849 By Mail QuestionnaireProspectiveCohort
934100 10.0 years / 849 running or jogginghours/week
Invasive breast cancerPre-menopausal
>=2vs.none
40.71(0.45, 1.12)
0.10 A C D E F G
incidence
Margolis, K.L.,2005,BRE23306
Norway and Sweden, NonHispanic White, YoungwomenWomen's Lifestyle and
30 - 49 1158Randomextraction
QuestionnaireProspectiveCohort
881673 9.1 yearsInvasive breast cancer vigorous
vs.none
51.24(0.85, 1.82)
0.85 A B C D E F G
incidence
Lahmann etal.,2007,BRE20026
Denmark,France,Germany,Greece,Italy,TheNetherlands,Spain,Swedenand UK
20 - 80 856
Populationcancerregistries andother
QuestionnaireProspectiveCohort
218169.0 6.4 years Recreational activityMET-hour/week
Invasive breast cancerpremenopausal women
>43.0vs.<13.0
40.94(0.76, 1.15)
0.580
A B C D E F G
incidence
Post-menopausal
Albanes,1989,BRE00236
USA, Multi-ethnicNHANES I, 1971
25 - 74 Unspecified InterviewProspectiveCohort
7413.0 10.0 years very active excluded
Breast cancerPost-menopausal
litte/noexercisevs.moderate
21.7(0.8, 2.9)
A
incidence
Thune,I.,1997,BRE12313
Norway, Not specifiedNorway National HealthScreening Service, 1974
20 - 49 248 By Mail QuestionnaireProspectiveCohort
25624.0 13.7 years / 83Breast cancer
Post-menopausal
Regularexercisevs.Sedentary
30.67(0.41, 1.1)
0.15 A C D G
incidence
Sesso,H.D.,1998,BRE16626
usa, Not specified, CollegealumnaeCollege Alumni Health Study
37 - 69 81 By Mail QuestionnaireProspectiveCohort
2066731.0 years / 33%do not return f-up questionnaire
Kcal/week
Breast cancerPost-menopausal
>1000vs.<500
30.49(0.28, 0.86)
0.015
A D
incidence
Moore, D.B.,2000,BRE16124
USA, Not specified, Post-menopausalIowa Women's Health Study
55 - 69 By Mail QuestionnaireProspectiveCohort
41837.0 10.0 years / 11% no family history of bc
Breast cancer FamilyHistory BC -No
Highvs.Low
30.92(0.79, 1.07)
A B C D F
incidence
275

Author, Year,WCRF Code
Country, Ethnicity, Specialcharacteristics
Age Cases n Caseascertainment
Type of studyNon-Cases n
Lenght offollow-up / loss
Assessmentdetail
Additional details Unit Outcome Subgroup Contrast Nocat. OR (95% CI) p
valueptrend A B C D E F G
adjustments
Moore, D.B.,2000,BRE16124
USA, Not specified, Post-menopausalIowa Women's Health Study
55 - 69 By Mail QuestionnaireProspectiveCohort
41837.0 10.0 years / 11% positive family historyof bc
Breast cancer FamilyHistory BC -Yes
Highvs.Low
30.88(0.63, 1.25)
A B C D F
incidence
Moore, D.B.,2000,BRE16124
USA, Not specified, Post-menopausalIowa Women's Health Study
55 - 69 By Mail QuestionnaireProspectiveCohort
41837.0 10.0 years / 11%Breast cancer
HRT -Former
Highvs.Low
30.97(0.76, 1.26)
A B C D F
incidence
Moore, D.B.,2000,BRE16124
USA, Not specified, Post-menopausalIowa Women's Health Study
55 - 69 By Mail QuestionnaireProspectiveCohort
41837.0 10.0 years / 11%Breast cancer
HRT - NoHighvs.Low
30.89(0.74, 1.06)
A B C D F
incidence
Moore, D.B.,2000,BRE16124
USA, Not specified, Post-menopausalIowa Women's Health Study
55 - 69 By Mail QuestionnaireProspectiveCohort
41837.0 10.0 years / 11%Breast cancer
HRT - YesHighvs.Low
30.88(0.61, 1.28)
A B C D F
incidence
Moore, D.B.,2000,BRE16124
USA, Not specified, Post-menopausalIowa Women's Health Study
55 - 69 By Mail QuestionnaireProspectiveCohort
41837.0 10.0 years / 11%Breast cancer
LeanHighvs.Low
31.01(0.75, 1.35)
A B C D F
incidence
Moore, D.B.,2000,BRE16124
USA, Not specified, Post-menopausalIowa Women's Health Study
55 - 69 1362 By Mail QuestionnaireProspectiveCohort
41837.0 10.0 years / 11%Breast cancer High
vs.Low
30.95(0.83, 1.1)
A B C D F
incidence
Moore, D.B.,2000,BRE16124
USA, Not specified, Post-menopausalIowa Women's Health Study
55 - 69 1371 By Mail QuestionnaireProspectiveCohort
41837.0 10.0 years / 11% moderate physicalactivity
Breast cancer>4times/weekvs.rarely or
40.92(0.77, 1.1)
A B C D F
incidence
Moore, D.B.,2000,BRE16124
USA, Not specified, Post-menopausalIowa Women's Health Study
55 - 69 1365 By Mail QuestionnaireProspectiveCohort
41837.0 10.0 years / 11% vigorous physicalactivity
Breast cancer>4times/weekvs.rarely or
40.05(0.72, 1.52)
A B C D F
incidence
Moore, D.B.,2000,BRE16124
USA, Not specified, Post-menopausalIowa Women's Health Study
55 - 69 By Mail QuestionnaireProspectiveCohort
41837.0 10.0 years / 11%Breast cancer
OverweightHighvs.Low
31.02(0.78, 1.33)
A B C D F
incidence
Dirx, M.J.,2001,BRE02326
Netherlands, Not specified,Post-menopausalThe Netherlands CohortStudy on diet and cancer,
55 - 69 941 QuestionnaireCase Cohort 9423 7.3 years min/day
Breast cancerPost-menopausal
>90vs.<30
40.76(0.58, 0.99)
0.003
A B C D E F G
incidence
Dirx, M.J.,2001,BRE02326
Netherlands, Not specified,Post-menopausalThe Netherlands CohortStudy on diet and cancer,
55 - 69 488 QuestionnaireCase Cohort 5221 7.3 years min/day
Breast cancer Post-menopausal& Lean
>90vs.<30
40.74(0.52, 1.08)
0.05 A B C D E F G
incidence
Dirx, M.J.,2001,BRE02326
Netherlands, Not specified,Post-menopausalThe Netherlands CohortStudy on diet and cancer,
55 - 69 367 QuestionnaireCase Cohort 3328 7.3 years min/day
Breast cancer Post-menopausal&Overweight
>90vs.<30
40.67(0.42, 1.08)
0.01 A B C D E F G
incidence
Lee, I.-M.,2001,BRE15848
USA + Puertorico, Notspecified, Registered nursesWomen's Health Study, 1993
45 - 157
Through healthorg. (screening,healthinsurance)
QuestionnaireProspectiveCohort
39322.048.0 months /<0.01
recreational and stairclimbing
KJ/week
Breast cancer ER+/PR+Post-menopausal
>=6300vs.<840
40.76(0.43, 1.34)
0.26 C D E F
incidence
276
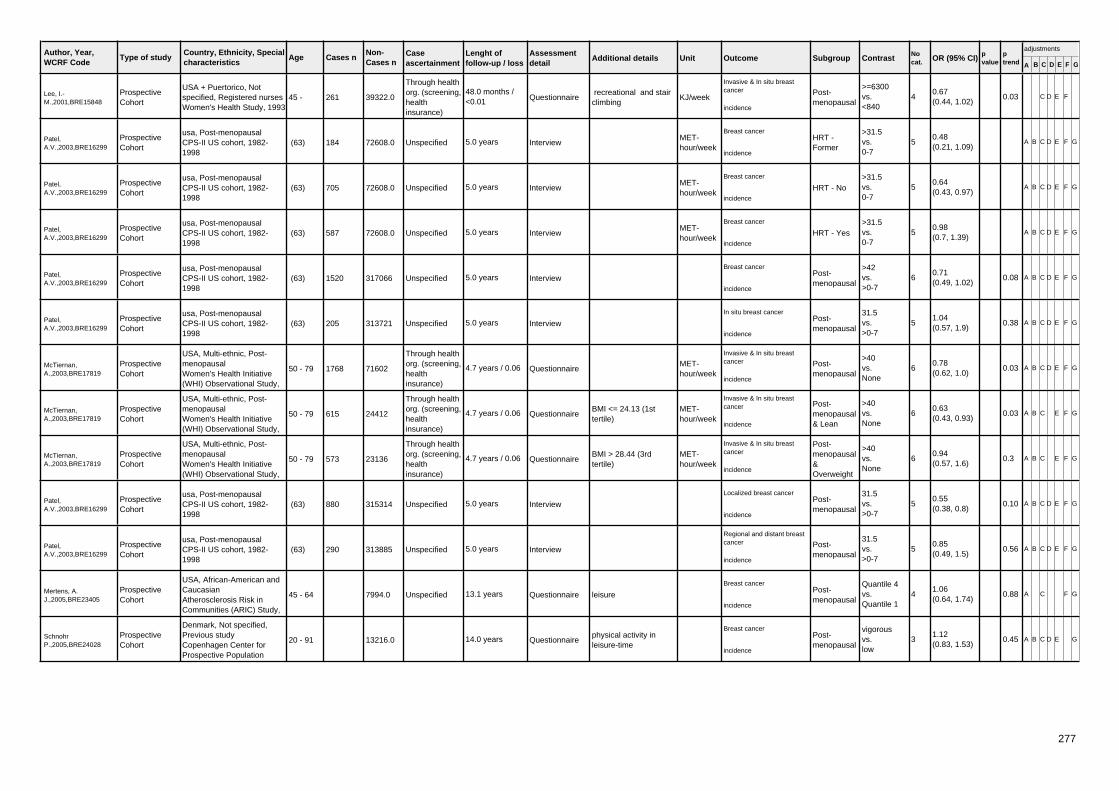
Author, Year,WCRF Code
Country, Ethnicity, Specialcharacteristics
Age Cases n Caseascertainment
Type of studyNon-Cases n
Lenght offollow-up / loss
Assessmentdetail
Additional details Unit Outcome Subgroup Contrast Nocat. OR (95% CI) p
valueptrend A B C D E F G
adjustments
Lee, I.-M.,2001,BRE15848
USA + Puertorico, Notspecified, Registered nursesWomen's Health Study, 1993
45 - 261
Through healthorg. (screening,healthinsurance)
QuestionnaireProspectiveCohort
39322.048.0 months /<0.01
recreational and stairclimbing
KJ/week
Invasive & In situ breastcancer Post-
menopausal
>=6300vs.<840
40.67(0.44, 1.02)
0.03 C D E F
incidence
Patel,A.V.,2003,BRE16299
usa, Post-menopausalCPS-II US cohort, 1982-1998
(63) 184 Unspecified InterviewProspectiveCohort
72608.0 5.0 years MET-hour/week
Breast cancerHRT -Former
>31.5vs.0-7
50.48(0.21, 1.09)
A B C D E F G
incidence
Patel,A.V.,2003,BRE16299
usa, Post-menopausalCPS-II US cohort, 1982-1998
(63) 705 Unspecified InterviewProspectiveCohort
72608.0 5.0 years MET-hour/week
Breast cancer
HRT - No>31.5vs.0-7
50.64(0.43, 0.97)
A B C D E F G
incidence
Patel,A.V.,2003,BRE16299
usa, Post-menopausalCPS-II US cohort, 1982-1998
(63) 587 Unspecified InterviewProspectiveCohort
72608.0 5.0 years MET-hour/week
Breast cancer
HRT - Yes>31.5vs.0-7
50.98(0.7, 1.39)
A B C D E F G
incidence
Patel,A.V.,2003,BRE16299
usa, Post-menopausalCPS-II US cohort, 1982-1998
(63) 1520 Unspecified InterviewProspectiveCohort
317066 5.0 yearsBreast cancer
Post-menopausal
>42vs.>0-7
60.71(0.49, 1.02)
0.08 A B C D E F G
incidence
Patel,A.V.,2003,BRE16299
usa, Post-menopausalCPS-II US cohort, 1982-1998
(63) 205 Unspecified InterviewProspectiveCohort
313721 5.0 yearsIn situ breast cancer
Post-menopausal
31.5vs.>0-7
51.04(0.57, 1.9)
0.38 A B C D E F G
incidence
McTiernan,A.,2003,BRE17819
USA, Multi-ethnic, Post-menopausalWomen's Health Initiative(WHI) Observational Study,
50 - 79 1768
Through healthorg. (screening,healthinsurance)
QuestionnaireProspectiveCohort
71602 4.7 years / 0.06 MET-hour/week
Invasive & In situ breastcancer Post-
menopausal
>40vs.None
60.78(0.62, 1.0)
0.03 A B C D E F G
incidence
McTiernan,A.,2003,BRE17819
USA, Multi-ethnic, Post-menopausalWomen's Health Initiative(WHI) Observational Study,
50 - 79 615
Through healthorg. (screening,healthinsurance)
QuestionnaireProspectiveCohort
24412 4.7 years / 0.06 BMI <= 24.13 (1sttertile)
MET-hour/week
Invasive & In situ breastcancer Post-
menopausal& Lean
>40vs.None
60.63(0.43, 0.93)
0.03 A B C E F G
incidence
McTiernan,A.,2003,BRE17819
USA, Multi-ethnic, Post-menopausalWomen's Health Initiative(WHI) Observational Study,
50 - 79 573
Through healthorg. (screening,healthinsurance)
QuestionnaireProspectiveCohort
23136 4.7 years / 0.06 BMI > 28.44 (3rdtertile)
MET-hour/week
Invasive & In situ breastcancer
Post-menopausal&Overweight
>40vs.None
60.94(0.57, 1.6)
0.3 A B C E F G
incidence
Patel,A.V.,2003,BRE16299
usa, Post-menopausalCPS-II US cohort, 1982-1998
(63) 880 Unspecified InterviewProspectiveCohort
315314 5.0 yearsLocalized breast cancer
Post-menopausal
31.5vs.>0-7
50.55(0.38, 0.8)
0.10 A B C D E F G
incidence
Patel,A.V.,2003,BRE16299
usa, Post-menopausalCPS-II US cohort, 1982-1998
(63) 290 Unspecified InterviewProspectiveCohort
313885 5.0 years
Regional and distant breastcancer Post-
menopausal
31.5vs.>0-7
50.85(0.49, 1.5)
0.56 A B C D E F G
incidence
Mertens, A.J.,2005,BRE23405
USA, African-American andCaucasianAtherosclerosis Risk inCommunities (ARIC) Study,
45 - 64 Unspecified QuestionnaireProspectiveCohort
7994.0 13.1 years leisure
Breast cancerPost-menopausal
Quantile 4vs.Quantile 1
41.06(0.64, 1.74)
0.88 A C F G
incidence
SchnohrP.,2005,BRE24028
Denmark, Not specified,Previous studyCopenhagen Center forProspective Population
20 - 91 QuestionnaireProspectiveCohort
13216.0 14.0 years physical activity inleisure-time
Breast cancerPost-menopausal
vigorousvs.low
31.12(0.83, 1.53)
0.45 A B C D E G
incidence
277
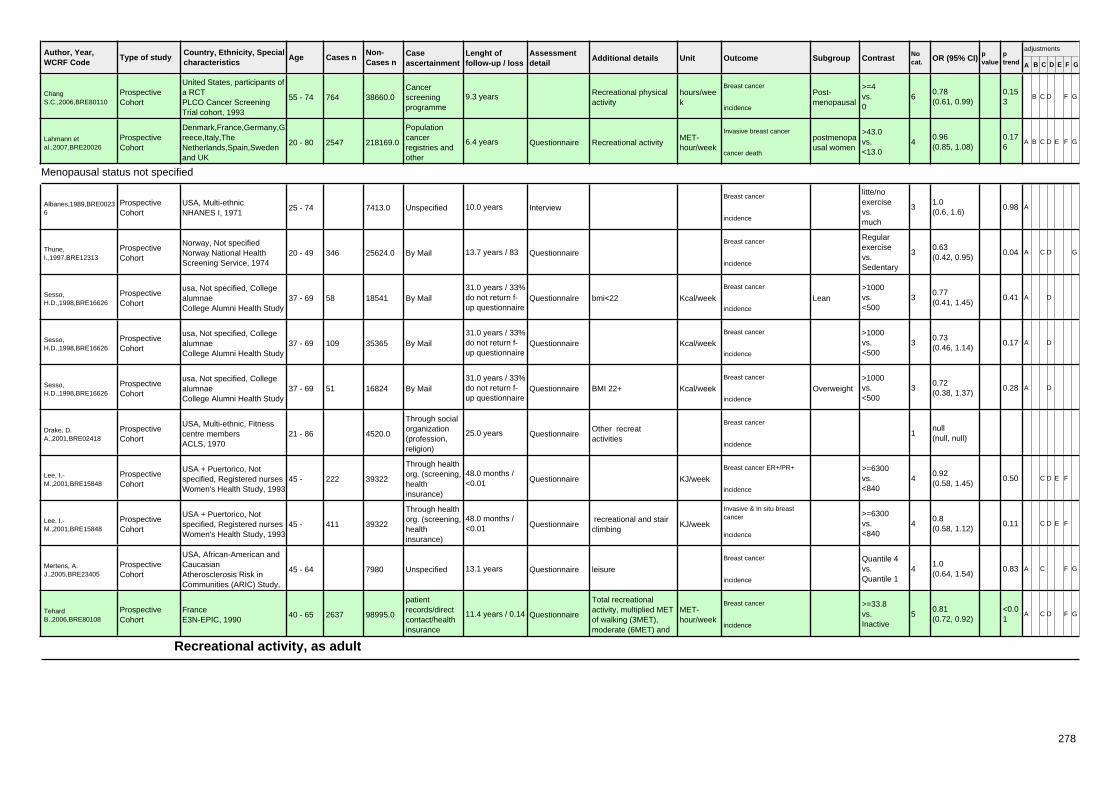
Author, Year,WCRF Code
Country, Ethnicity, Specialcharacteristics
Age Cases n Caseascertainment
Type of studyNon-Cases n
Lenght offollow-up / loss
Assessmentdetail
Additional details Unit Outcome Subgroup Contrast Nocat. OR (95% CI) p
valueptrend A B C D E F G
adjustments
ChangS.C.,2006,BRE80110
United States, participants ofa RCTPLCO Cancer ScreeningTrial cohort, 1993
55 - 74 764Cancerscreeningprogramme
ProspectiveCohort
38660.0 9.3 years Recreational physicalactivity
hours/week
Breast cancerPost-menopausal
>=4vs.0
60.78(0.61, 0.99)
0.153
B C D F G
incidence
Lahmann etal.,2007,BRE20026
Denmark,France,Germany,Greece,Italy,TheNetherlands,Spain,Swedenand UK
20 - 80 2547
Populationcancerregistries andother
QuestionnaireProspectiveCohort
218169.0 6.4 years Recreational activityMET-hour/week
Invasive breast cancerpostmenopausal women
>43.0vs.<13.0
40.96(0.85, 1.08)
0.176
A B C D E F G
cancer death
Menopausal status not specified
Albanes,1989,BRE00236
USA, Multi-ethnicNHANES I, 1971
25 - 74 Unspecified InterviewProspectiveCohort
7413.0 10.0 yearsBreast cancer
litte/noexercisevs.much
31.0(0.6, 1.6)
0.98 A
incidence
Thune,I.,1997,BRE12313
Norway, Not specifiedNorway National HealthScreening Service, 1974
20 - 49 346 By Mail QuestionnaireProspectiveCohort
25624.0 13.7 years / 83Breast cancer
Regularexercisevs.Sedentary
30.63(0.42, 0.95)
0.04 A C D G
incidence
Sesso,H.D.,1998,BRE16626
usa, Not specified, CollegealumnaeCollege Alumni Health Study
37 - 69 58 By Mail QuestionnaireProspectiveCohort
1854131.0 years / 33%do not return f-up questionnaire
bmi<22 Kcal/week
Breast cancer
Lean>1000vs.<500
30.77(0.41, 1.45)
0.41 A D
incidence
Sesso,H.D.,1998,BRE16626
usa, Not specified, CollegealumnaeCollege Alumni Health Study
37 - 69 109 By Mail QuestionnaireProspectiveCohort
3536531.0 years / 33%do not return f-up questionnaire
Kcal/week
Breast cancer >1000vs.<500
30.73(0.46, 1.14)
0.17 A D
incidence
Sesso,H.D.,1998,BRE16626
usa, Not specified, CollegealumnaeCollege Alumni Health Study
37 - 69 51 By Mail QuestionnaireProspectiveCohort
1682431.0 years / 33%do not return f-up questionnaire
BMI 22+ Kcal/week
Breast cancer
Overweight>1000vs.<500
30.72(0.38, 1.37)
0.28 A D
incidence
Drake, D.A.,2001,BRE02418
USA, Multi-ethnic, Fitnesscentre membersACLS, 1970
21 - 86
Through socialorganization(profession,religion)
QuestionnaireProspectiveCohort
4520.0 25.0 years Other recreatactivities
Breast cancer
1null(null, null)
incidence
Lee, I.-M.,2001,BRE15848
USA + Puertorico, Notspecified, Registered nursesWomen's Health Study, 1993
45 - 222
Through healthorg. (screening,healthinsurance)
QuestionnaireProspectiveCohort
3932248.0 months /<0.01 KJ/week
Breast cancer ER+/PR+ >=6300vs.<840
40.92(0.58, 1.45)
0.50 C D E F
incidence
Lee, I.-M.,2001,BRE15848
USA + Puertorico, Notspecified, Registered nursesWomen's Health Study, 1993
45 - 411
Through healthorg. (screening,healthinsurance)
QuestionnaireProspectiveCohort
3932248.0 months /<0.01
recreational and stairclimbing
KJ/week
Invasive & In situ breastcancer >=6300
vs.<840
40.8(0.58, 1.12)
0.11 C D E F
incidence
Mertens, A.J.,2005,BRE23405
USA, African-American andCaucasianAtherosclerosis Risk inCommunities (ARIC) Study,
45 - 64 Unspecified QuestionnaireProspectiveCohort
7980 13.1 years leisure
Breast cancer Quantile 4vs.Quantile 1
41.0(0.64, 1.54)
0.83 A C F G
incidence
TehardB.,2006,BRE80108
FranceE3N-EPIC, 1990
40 - 65 2637
patientrecords/directcontact/healthinsurance
QuestionnaireProspectiveCohort
98995.0 11.4 years / 0.14
Total recreationalactivity, multiplied METof walking (3MET),moderate (6MET) and
MET-hour/week
Breast cancer >=33.8vs.Inactive
50.81(0.72, 0.92)
<0.01
A C D F G
incidence
Recreational activity, as adult
278

Author, Year,WCRF Code
Country, Ethnicity, Specialcharacteristics
Age Cases n Caseascertainment
Type of studyNon-Cases n
Lenght offollow-up / loss
Assessmentdetail
Additional details Unit Outcome Subgroup Contrast Nocat. OR (95% CI) p
valueptrend A B C D E F G
adjustments
Post-menopausal
Patel,A.V.,2003,BRE16299
usa, Post-menopausalCPS-II US cohort, 1982-1998
(63) 1503 UnspecifiedProspectiveCohort
311316 5.0 years
at age 4006.01.01.02-Recreational activity,temp richiesto as adult
Breast cancerPost-menopausal
>42vs.>0-7.0
60.79(0.61, 1.03)
0.31 A B C D E F G
incidence
Recreational activity, at adolescence
Pre-menopausal
Margolis, K.L.,2005,BRE23306
Norway and Sweden, NonHispanic White, YoungwomenWomen's Lifestyle and
30 - 49 1155Randomextraction
ProspectiveCohort
891684 9.1 years at age 14
Invasive breast cancer vigorousvs.none
51.05(0.72, 1.54)
0.14 A B C D E F G
incidence
Recreational activity, at different age
Pre-menopausal
Margolis, K.L.,2005,BRE23306
Norway and Sweden, NonHispanic White, YoungwomenWomen's Lifestyle and
30 - 49 1155Randomextraction
ProspectiveCohort
892829 9.1 years age 30
Invasive breast cancer vigorousvs.none
51.2(0.77, 1.95)
0.6 A B C D E F G
incidence
Recreational activity, lifelong
Pre-menopausal
Breslow, R.A.,2001,BRE01123
USA, Not specifiedNHEFS, 1981/82
24 - 75 42Generalpopulation(survey)
ProspectiveCohort
22520 9.2 years / 285Breast cancer
Pre-menopausal
Consistentlyhighvs.Consistently
31.19(0.43, 3.3)
0.732
A B D G
incidence
Post-menopausal
Breslow, R.A.,2001,BRE01123
USA, Not specifiedNHEFS, 1981/82
24 - 75 96Generalpopulation(survey)
ProspectiveCohort
28264 9.2 years / 285Breast cancer
Post-menopausal
Consistentlyhighvs.Consistently
30.33(0.14, 0.82)
0.026
A B D G
incidence
Menopausal status not specified
Breslow, R.A.,2001,BRE01123
USA, Not specifiedNHEFS, 1981/82
24 - 75Generalpopulation(survey)
ProspectiveCohort
6160.0 9.2 years / 285 BMI<25,1
Breast cancer
Lean
Consistentlyhighvs.Consistently
30.4(0.13, 1.28)
0.158
A B G
incidence
Breslow, R.A.,2001,BRE01123
USA, Not specifiedNHEFS, 1981/82
24 - 75 138Generalpopulation(survey)
ProspectiveCohort
50781 9.2 years / 285Breast cancer
Consistentlyhighvs.Consistently
30.58(0.31, 1.07)
0.107
A B D G
incidence
Breslow, R.A.,2001,BRE01123
USA, Not specifiedNHEFS, 1981/82
24 - 75Generalpopulation(survey)
ProspectiveCohort
6160.0 9.2 years / 285
difference between 25y-o and 1982-1984-lost weight/gained upto 4.9 kg
Breast cancer
Other
Consistentlyhighvs.Consistently
30.43(0.08, 2.28)
0.284
A B G
incidence
Breslow, R.A.,2001,BRE01123
USA, Not specifiedNHEFS, 1981/82
24 - 75Generalpopulation(survey)
ProspectiveCohort
6160.0 9.2 years / 285
difference between 25y-o and 1982-1984-gained more than 20kg
Breast cancer
Other
Consistentlyhighvs.Consistently
30.32(0.04, 2.5)
0.158
A B G
incidence
279

Author, Year,WCRF Code
Country, Ethnicity, Specialcharacteristics
Age Cases n Caseascertainment
Type of studyNon-Cases n
Lenght offollow-up / loss
Assessmentdetail
Additional details Unit Outcome Subgroup Contrast Nocat. OR (95% CI) p
valueptrend A B C D E F G
adjustments
Breslow, R.A.,2001,BRE01123
USA, Not specifiedNHEFS, 1981/82
24 - 75Generalpopulation(survey)
ProspectiveCohort
6160.0 9.2 years / 285 BMI >=25.1
Breast cancer
Overweight
Consistentlyhighvs.Consistently
30.26(0.06, 1.13)
0.085
A B G
incidence
Sports
Pre-menopausal
Wyshak,G,2000,BRE13666
USA, College alumnaeUSA, 1981
21 - 80 12
Through socialorganization(profession,religion)
ProspectiveCohort
3940.0 15.0 years / 480Breast cancer
Pre-menopausal
athletesvs.non-athletes
20.16(0.04, 0.64)
0.0089
A C D F G
incidence
Post-menopausal
Dirx, M.J.,2001,BRE02326
Netherlands, Not specified,Post-menopausalThe Netherlands CohortStudy on diet and cancer,
55 - 69 943Case Cohort 9444 7.3 years hours/week
Breast cancerPost-menopausal
>2vs.no sportactivity
40.98(0.68, 1.42)
0.37 A B C D E F G
incidence
Mertens, A.J.,2005,BRE23405
USA, African-American andCaucasianAtherosclerosis Risk inCommunities (ARIC) Study,
45 - 64 UnspecifiedProspectiveCohort
7994.0 13.1 yearsBreast cancer
Post-menopausal
Quantile 4vs.Quantile 1
41.22(0.77, 1.93)
0.30 A C F G
incidence
Menopausal status not specified
Wyshak,G,2000,BRE13666
USA, College alumnaeUSA, 1981
21 - 80 175
Through socialorganization(profession,religion)
ProspectiveCohort
3908 15.0 years / 480Breast cancer athletes
vs.non-athletes
20.6(0.4, 0.8)
0.0023
A C D F G
incidence
Mertens, A.J.,2005,BRE23405
USA, African-American andCaucasianAtherosclerosis Risk inCommunities (ARIC) Study,
45 - 64 UnspecifiedProspectiveCohort
7957 13.1 yearsBreast cancer Quantile 4
vs.Quantile 1
41.31(0.87, 1.96)
0.18 A C F G
incidence
Sports, lifelong
Post-menopausal
Dirx, M.J.,2001,BRE02326
Netherlands, Not specified,Post-menopausalThe Netherlands CohortStudy on diet and cancer,
55 - 69 445Case Cohort 4187 7.3 years lifelong 06.01.01.02-Sporting, lifelong
hours/week
Breast cancerPost-menopausal
>5vs.<1
50.87(0.57, 1.32)
0.14 A B C D E F G
incidence
Stair climbing
Menopausal status not specified
Drake, D.A.,2001,BRE02418
USA, Multi-ethnic, Fitnesscentre membersACLS, 1970
21 - 86
Through socialorganization(profession,religion)
QuestionnaireProspectiveCohort
4520.0 25.0 yearsBreast cancer
1null(null, null)
incidence
TehardB.,2006,BRE80108
FranceE3N-EPIC, 1990
40 - 65 3373
patientrecords/directcontact/healthinsurance
QuestionnaireProspectiveCohort
98995.0 11.4 years / 0.14 Number of flight ofstairs
number/day
Breast cancer >=5vs.0
31.0(0.9, 1.12)
0.84 A C D F G
incidence
Stationary biking
280

Author, Year,WCRF Code
Country, Ethnicity, Specialcharacteristics
Age Cases n Caseascertainment
Type of studyNon-Cases n
Lenght offollow-up / loss
Assessmentdetail
Additional details Unit Outcome Subgroup Contrast Nocat. OR (95% CI) p
valueptrend A B C D E F G
adjustments
Menopausal status not specified
Drake, D.A.,2001,BRE02418
USA, Multi-ethnic, Fitnesscentre membersACLS, 1970
21 - 86
Through socialorganization(profession,religion)
ProspectiveCohort
4520.0 25.0 yearsBreast cancer
1null(null, null)
incidence
Swimming
Menopausal status not specified
Drake, D.A.,2001,BRE02418
USA, Multi-ethnic, Fitnesscentre membersACLS, 1970
21 - 86
Through socialorganization(profession,religion)
ProspectiveCohort
4520.0 25.0 yearsBreast cancer
1null(null, null)
incidence
Treadmill
Menopausal status not specified
Drake, D.A.,2001,BRE02418
USA, Multi-ethnic, Fitnesscentre membersACLS, 1970
21 - 86
Through socialorganization(profession,religion)
ProspectiveCohort
4520.0 25.0 yearsBreast cancer
1null(null, null)
incidence
Walking
Pre-menopausal
Colditz, G.A.,2003,BRE01782
USA, Not specified,Registered nursesNHS II, 1989
25 - 42 849 By MailProspectiveCohort
934100 10.0 years / 849 hours/week
Invasive breast cancerPre-menopausal
>=4vs.<0,33
51.07(0.81, 1.4)
0.80 A C D E F G
incidence
Post-menopausal
Dirx, M.J.,2001,BRE02326
Netherlands, Not specified,Post-menopausalThe Netherlands CohortStudy on diet and cancer,
55 - 69 941Case Cohort 9424 7.3 years biking/walking min/day
Breast cancerPost-menopausal
>60vs.<10
40.81(0.06, 1.09)
0.001
A B C D E F G
incidence
Menopausal status not specified
Drake, D.A.,2001,BRE02418
USA, Multi-ethnic, Fitnesscentre membersACLS, 1970
21 - 86
Through socialorganization(profession,religion)
ProspectiveCohort
4520.0 25.0 yearsBreast cancer
1null(null, null)
incidence
TehardB.,2006,BRE80108
FranceE3N-EPIC, 1990
40 - 65 3325
patientrecords/directcontact/healthinsurance
ProspectiveCohort
98995.0 11.4 years / 0.14 Usual distance walked,habitual, daily
meters/day
Breast cancer >=2000vs.<500
30.91(0.81, 1.02)
0.45 A C D F G
incidence
Weight training
Menopausal status not specified
Drake, D.A.,2001,BRE02418
USA, Multi-ethnic, Fitnesscentre membersACLS, 1970
21 - 86
Through socialorganization(profession,religion)
ProspectiveCohort
4520.0 25.0 yearsBreast cancer
1null(null, null)
incidence
281

Author, Year,WCRF Code
Country, Ethnicity, Specialcharacteristics
Age Cases n Caseascertainment
Type of studyNon-Cases n
Lenght offollow-up / loss
Assessmentdetail
Additional details Unit Outcome Subgroup Contrast Nocat. OR (95% CI) p
valueptrend A B C D E F G
adjustments
6.1.1.3
Gardening
Post-menopausal
Dirx, M.J.,2001,BRE02326
Netherlands, Not specified,Post-menopausalThe Netherlands CohortStudy on diet and cancer,
55 - 69 943Case Cohort 9445 7.3 years gardening/doing oddjobs
hours/week
Breast cancerPost-menopausal
>2vs.nogardening/o
40.93(0.73, 1.17)
0.23 A B C D E F G
incidence
Menopausal status not specified
Drake, D.A.,2001,BRE02418
USA, Multi-ethnic, Fitnesscentre membersACLS, 1970
21 - 86
Through socialorganization(profession,religion)
ProspectiveCohort
4520.0 25.0 yearsBreast cancer
1null(null, null)
incidence
Household activity
Pre-menopausal
Lahmann etal.,2007,BRE20026
Denmark,France,Germany,Greece,Italy,TheNetherlands,Spain,Swedenand UK
20 - 80 856
Populationcancerregistries andother
QuestionnaireProspectiveCohort
218169.0 6.4 years Household activityMET-hour/week
Invasive breast cancerpremenopausal women
>91.0vs.<27.0
40.71(0.55, 0.9)
0.003
A B C D E F G
incidence
Lahmann etal.,2007,BRE20026
Denmark,France,Germany,Greece,Italy,TheNetherlands,Spain,Swedenand UK
20 - 80
Populationcancerregistries andother
QuestionnaireProspectiveCohort
218169.0 6.4 yearsHousehold activity,pooled analysis from allcohorts
met-hour/week
Invasive breast cancerpremenopausal women
20.0(continuous)
10.96(0.92, 1.0)
A B C D E F G
incidence
Post-menopausal
Ericson, U. etal.,2007,BRE80128
Sweden, Post menopausalMalmo Diet and Cancer,1991
50 - 382 Cancer registry QuestionnaireProspectiveCohort
11464 9.5 years Household activitieshours/week
Invasive breast cancerPost-menopausal
>=30vs.0-9
40.6(0.41, 0.87)
0.01 A
incidence
Lahmann etal.,2007,BRE20026
Denmark,France,Germany,Greece,Italy,TheNetherlands,Spain,Swedenand UK
20 - 80 2547
Populationcancerregistries andother
QuestionnaireProspectiveCohort
218169.0 6.4 years Household activityMET-hour/week
Invasive breast cancerpostmenopausal women
>91.0vs.<27.0
40.81(0.7, 0.93)
0.001
A B C D E F G
incidence
Lahmann etal.,2007,BRE20026
Denmark,France,Germany,Greece,Italy,TheNetherlands,Spain,Swedenand UK
20 - 80
Populationcancerregistries andother
QuestionnaireProspectiveCohort
218169.0 6.4 yearsHousehold activity,pooled analysis from allcohorts
met-hour/week
Invasive breast cancerpostmenopausal women
20.0(continuous)
10.97(0.94, 0.99)
A B C D E F G
incidence
Menopausal status not specified
Drake, D.A.,2001,BRE02418
USA, Multi-ethnic, Fitnesscentre membersACLS, 1970
21 - 86
Through socialorganization(profession,religion)
QuestionnaireProspectiveCohort
4520.0 25.0 yearsBreast cancer
1null(null, null)
incidence
TehardB.,2006,BRE80108
FranceE3N-EPIC, 1990
40 - 65 3181
patientrecords/directcontact/healthinsurance
QuestionnaireProspectiveCohort
98995.0 11.4 years / 0.14 Light household activityhours/week
Breast cancer >=14vs.0
40.82(0.61, 1.11)
<0.05
A C D F G
incidence
282

Author, Year,WCRF Code
Country, Ethnicity, Specialcharacteristics
Age Cases n Caseascertainment
Type of studyNon-Cases n
Lenght offollow-up / loss
Assessmentdetail
Additional details Unit Outcome Subgroup Contrast Nocat. OR (95% CI) p
valueptrend A B C D E F G
adjustments
TehardB.,2006,BRE80108
FranceE3N-EPIC, 1990
40 - 65 2875
patientrecords/directcontact/healthinsurance
QuestionnaireProspectiveCohort
98995.0 11.4 years / 0.14 Heavy householdactivity
hours/week
Breast cancer >=5vs.0
40.97(0.81, 1.15)
0.47 A C D F G
incidence
6.1.3
Intensity of physical activity
Post-menopausal
Dirx, M.J.,2001,BRE02326
Netherlands, Not specified,Post-menopausalThe Netherlands CohortStudy on diet and cancer,
55 - 69 306Case Cohort 3260 7.3 yearshow intense was thesport practiced (interms of MET)
MET score
Breast cancerPost-menopausal
>6vs.<4
30.84(0.55, 1.29)
0.43 A B C D E F G
incidence
Moderate physical activity
Menopausal status not specified
Dallal etal.,2007,BRE80016
USACalifornia Teachers Study,1995
27 - 86 1879 Cancer registryProspectiveCohort
110599.0 6.6 years Annual moderate long-term physical activity
hours/week
Breast cancer ER+ >5vs.<=0.5
50.98(0.82, 1.16)
0.53 C D E F G
incidence
Dallal etal.,2007,BRE80016
USACalifornia Teachers Study,1995
27 - 86 1452 Cancer registryProspectiveCohort
110599.0 6.6 years Annual moderate long-term physical activity
hours/week
Breast cancer ER+/PR+ >5vs.<=0.5
51.02(0.84, 1.24)
0.73 C D E F G
incidence
Dallal etal.,2007,BRE80016
USACalifornia Teachers Study,1995
27 - 86 345 Cancer registryProspectiveCohort
110599.0 6.6 years Annual moderate long-term physical activity
hours/week
Breast cancer ER- >5vs.<=0.5
50.53(0.33, 0.85)
0.003
C D E F G
incidence
Dallal etal.,2007,BRE80016
USACalifornia Teachers Study,1995
27 - 86 309 Cancer registryProspectiveCohort
110599.0 6.6 years Annual moderate long-term physical activity
hours/week
Breast cancer ER-/PR- >5vs.<=0.5
50.5(0.3, 0.83)
0.003
C D E F G
incidence
Dallal etal.,2007,BRE80016
USACalifornia Teachers Study,1995
27 - 86 593 Cancer registryProspectiveCohort
110599.0 6.6 years Moderate lifetimephysical activity
hours/week
In situ breast cancer >5vs.<=0.5
50.78(0.57, 1.06)
0.11 A C D E F G
incidence
Dallal etal.,2007,BRE80016
USACalifornia Teachers Study,1995
27 - 86 593 Cancer registryProspectiveCohort
110599.0 6.6 years Moderate physicalactivity in past 3 years
hours/week
In situ breast cancer >5vs.<=0.5
50.8(0.57, 1.14)
0.6 A C D E F G
incidence
Dallal etal.,2007,BRE80016
USACalifornia Teachers Study,1995
27 - 86 2649 Cancer registryProspectiveCohort
110599.0 6.6 years Moderate lifetimephysical activity
hours/week
Invasive breast cancer >5vs.<=0.5
50.94(0.81, 1.08)
0.29 A C D E F G
incidence
Dallal etal.,2007,BRE80016
USACalifornia Teachers Study,1995
27 - 86 2649 Cancer registryProspectiveCohort
110599.0 6.6 years Moderate physicalactivity in past 3 years
hours/week
Invasive breast cancer >5vs.<=0.5
51.03(0.88, 1.19)
0.8 A C D E F G
incidence
Total light physical activity
283

Author, Year,WCRF Code
Country, Ethnicity, Specialcharacteristics
Age Cases n Caseascertainment
Type of studyNon-Cases n
Lenght offollow-up / loss
Assessmentdetail
Additional details Unit Outcome Subgroup Contrast Nocat. OR (95% CI) p
valueptrend A B C D E F G
adjustments
Menopausal status not specified
Dorgan, J.F.,1994,BRE02385
USAFramingham Study, 1954
35 - 68Generalpopulation(survey)
ProspectiveCohort
2307.0 28.0 years hours/day
Breast cancer1.0(continuous)
11.0(0.9, 1.2)
0.63 A B C E F G
incidence
Total vigorous physical activity
Menopausal status not specified
Dorgan, J.F.,1994,BRE02385
USAFramingham Study, 1954
35 - 68Generalpopulation(survey)
ProspectiveCohort
2307.0 28.0 years hours/day
Breast cancer1.0(continuous)
11.1(0.9, 1.3)
0.22 A B C E F G
incidence
Chang, S.C.,2003,BRE18295
USA, Not specified,Screening ProgramBCDDP, 1973
55 - 74
Through healthorg. (screening,healthinsurance)
Questionnaire(nos)
ProspectiveCohort
27534.0 7.0 years hours/week
Breast cancer =>4 hrs/wkvs.<4 hrs/wk
20.83(0.69, 1.0)
incidence
Vigorous physical activity
Post-menopausal
Dallal etal.,2007,BRE80016
USACalifornia Teachers Study,1995
27 - 86 1587 Cancer registryProspectiveCohort
110599.0 6.6 yearsAnnual long-termstrenuous physicalactivity
hours/week
Invasive breast cancerAge >= 55years
>5vs.<=0.5
50.9(0.74, 1.1)
0.27 C D E F G
incidence
Menopausal status not specified
Dallal etal.,2007,BRE80016
USACalifornia Teachers Study,1995
27 - 86 1879 Cancer registryProspectiveCohort
110599.0 6.6 yearsAnnual long-termstrenuous physicalactivity
hours/week
Breast cancer ER+ >5vs.<=0.5
50.89(0.74, 1.06)
0.23 C D E F G
incidence
Dallal etal.,2007,BRE80016
USACalifornia Teachers Study,1995
27 - 86 1452 Cancer registryProspectiveCohort
110599.0 6.6 yearsAnnual long-termstrenuous physicalactivity
hours/week
Breast cancer ER+/PR+ >5vs.<=0.5
50.94(0.77, 1.16)
0.67 C D E F G
incidence
Dallal etal.,2007,BRE80016
USACalifornia Teachers Study,1995
27 - 86 305 Cancer registryProspectiveCohort
110599.0 6.6 yearsAnnual long-termstrenuous physicalactivity
hours/week
Breast cancer ER+/PR- >5vs.<=0.5
50.75(0.47, 1.18)
0.31 C D E F G
incidence
Dallal etal.,2007,BRE80016
USACalifornia Teachers Study,1995
27 - 86 345 Cancer registryProspectiveCohort
110599.0 6.6 yearsAnnual long-termstrenuous physicalactivity
hours/week
Breast cancer ER- >5vs.<=0.5
50.45(0.27, 0.76)
0.003
C D E F G
incidence
Dallal etal.,2007,BRE80016
USACalifornia Teachers Study,1995
27 - 86 309 Cancer registryProspectiveCohort
110599.0 6.6 yearsAnnual long-termstrenuous physicalactivity
hours/week
Breast cancer ER-/PR- >5vs.<=0.5
50.35(0.19, 0.65)
0.001
C D E F G
incidence
Dallal etal.,2007,BRE80016
USACalifornia Teachers Study,1995
27 - 86 593 Cancer registryProspectiveCohort
110599.0 6.6 years Strenuous lifetimephysical activity
hours/week
In situ breast cancer >5vs.<=0.5
50.69(0.48, 0.98)
0.04 A C D E F G
incidence
284

Author, Year,WCRF Code
Country, Ethnicity, Specialcharacteristics
Age Cases n Caseascertainment
Type of studyNon-Cases n
Lenght offollow-up / loss
Assessmentdetail
Additional details Unit Outcome Subgroup Contrast Nocat. OR (95% CI) p
valueptrend A B C D E F G
adjustments
Dallal etal.,2007,BRE80016
USACalifornia Teachers Study,1995
27 - 86 593 Cancer registryProspectiveCohort
110599.0 6.6 yearsStrenuous physicalactivity in past threeyears
hours/week
In situ breast cancer >5vs.<=0.5
50.57(0.33, 0.99)
0.17 A C D E F G
incidence
Dallal etal.,2007,BRE80016
USACalifornia Teachers Study,1995
27 - 86 1062 Cancer registryProspectiveCohort
110599.0 6.6 yearsAnnual long-termstrenuous physicalactivity
hours/week
Invasive breast cancerAge < 55years
>5vs.<=0.5
50.68(0.53, 0.87)
0.02 C D E F G
incidence
Dallal etal.,2007,BRE80016
USACalifornia Teachers Study,1995
27 - 86 1455 Cancer registryProspectiveCohort
110599.0 6.6 yearsAnnual long-termstrenuous physicalactivity
hours/week
Invasive breast cancer
BMI <25>5vs.<=0.5
50.74(0.6, 0.91)
0.03 C D E F G
incidence
Dallal etal.,2007,BRE80016
USACalifornia Teachers Study,1995
27 - 86 1094 Cancer registryProspectiveCohort
110599.0 6.6 yearsAnnual long-termstrenuous physicalactivity
hours/week
Invasive breast cancer
BMI=>25>5vs.<=0.5
50.85(0.67, 1.09)
0.12 C D E F G
incidence
Dallal etal.,2007,BRE80016
USACalifornia Teachers Study,1995
27 - 86 2067 Cancer registryProspectiveCohort
110599.0 6.6 yearsAnnual long-termstrenuous physicalactivity
hours/week
Invasive breast cancer FamilyHistory BC -No
>5vs.<=0.5
50.74(0.62, 0.89)
0.01 C D E F G
incidence
Dallal etal.,2007,BRE80016
USACalifornia Teachers Study,1995
27 - 86 491 Cancer registryProspectiveCohort
110599.0 6.6 yearsAnnual long-termstrenuous physicalactivity
hours/week
Invasive breast cancer FamilyHistory BC -Yes
>5vs.<=0.5
51.02(0.73, 1.43)
0.72 C D E F G
incidence
Dallal etal.,2007,BRE80016
USACalifornia Teachers Study,1995
27 - 86 2649 Cancer registryProspectiveCohort
110599.0 6.6 years Strenuous lifetimephysical activity
hours/week
Invasive breast cancer >5vs.<=0.5
50.8(0.69, 0.94)
0.02 A C D E F G
incidence
Dallal etal.,2007,BRE80016
USACalifornia Teachers Study,1995
27 - 86 2649 Cancer registryProspectiveCohort
110599.0 6.6 yearsStrenuous physicalactivity in past threeyears
hours/week
Invasive breast cancer >5vs.<=0.5
50.99(0.81, 1.21)
0.56 A C D E F G
incidence
Dallal etal.,2007,BRE80016
USACalifornia Teachers Study,1995
27 - 86 618 Cancer registryProspectiveCohort
110599.0 6.6 yearsAnnual long-termstrenuous physicalactivity
hours/week
Invasive breast cancer
Parity no>5vs.<=0.5
51.01(0.77, 1.33)
0.43 C D E F G
incidence
Dallal etal.,2007,BRE80016
USACalifornia Teachers Study,1995
27 - 86 2016 Cancer registryProspectiveCohort
110599.0 6.6 yearsAnnual long-termstrenuous physicalactivity
hours/week
Invasive breast cancer
Parity yes>5vs.<=0.5
50.73(0.6, 0.89)
0.002
C D E F G
incidence
6.1.3.1
High physical activity job
Menopausal status not specified
Pukkala,1993,BRE24790
finland, Registered teachersFinnish Female TeachersCohort, 1967-1991
20 - 74 63
Through socialorganization(profession,religion)
ProspectiveCohort
10118.0 7.0 years to be a PA teacher
Breast cancerphysicaleducatioteachersvs.
21.35(0.95, 1.87)
A
incidence
Medium physical activity job
285

Author, Year,WCRF Code
Country, Ethnicity, Specialcharacteristics
Age Cases n Caseascertainment
Type of studyNon-Cases n
Lenght offollow-up / loss
Assessmentdetail
Additional details Unit Outcome Subgroup Contrast Nocat. OR (95% CI) p
valueptrend A B C D E F G
adjustments
Menopausal status not specified
Vena, J. E.Graham,S.,1987,BRE12852
washingtonWashington State, 1974
876Deathcertificate
Historical Cohort 25000.0 medium
Breast cancermedium pajobvs.general
20.83(null, null)
0.05cancer death
Sedentary occupational physical activity
Menopausal status not specified
Vena, J. E.Graham,S.,1987,BRE12852
washingtonWashington State, 1974
349Deathcertificate
Historical Cohort 25000.0 low
Breast cancerlow pa jobvs.generalpopulation
21.15(null, null)
0.001
cancer death
Dorgan, J.F.,1994,BRE02385
USAFramingham Study, 1954
35 - 68Generalpopulation(survey)
ProspectiveCohort
2307.0 28.0 years hours/day
Breast cancer1.0(continuous)
11.0(0.8, 1.2)
0.99 A B C E F G
incidence
Vigorous occupational physical activity
Menopausal status not specified
Vena, J. E.Graham,S.,1987,BRE12852
washingtonWashington State, 1974
453Deathcertificate
Historical Cohort 25000.0 high
Breast cancerhigh pa jobvs.generalpopulation
20.85(null, null)
0.05cancer death
Dorgan, J.F.,1994,BRE02385
USAFramingham Study, 1954
35 - 68Generalpopulation(survey)
ProspectiveCohort
2307.0 28.0 years hours/day
Breast cancer1.0(continuous)
11.1(0.9, 1.3)
0.50 A B C E F G
incidence
6.1.3.2
Biking intensity
Menopausal status not specified
Drake, D.A.,2001,BRE02418
USA, Multi-ethnic, Fitnesscentre membersACLS, 1970
21 - 86
Through socialorganization(profession,religion)
ProspectiveCohort
4520.0 25.0 yearsBreast cancer
1null(null, null)
incidence
High Recreational activity
Post-menopausal
McTiernan,A.,2003,BRE17819
USA, Multi-ethnic, Post-menopausalWomen's Health Initiative(WHI) Observational Study,
50 - 79 1768
Through healthorg. (screening,healthinsurance)
ProspectiveCohort
71602 4.7 years / 0.06 hours/week
Invasive & In situ breastcancer Post-
menopausal
>4vs.None
50.91(0.67, 1.2)
0.25 A B C D E F G
incidence
High recreational activity at 50 yrs
Post-menopausal
286

Author, Year,WCRF Code
Country, Ethnicity, Specialcharacteristics
Age Cases n Caseascertainment
Type of studyNon-Cases n
Lenght offollow-up / loss
Assessmentdetail
Additional details Unit Outcome Subgroup Contrast Nocat. OR (95% CI) p
valueptrend A B C D E F G
adjustments
McTiernan,A.,2003,BRE17819
USA, Multi-ethnic, Post-menopausalWomen's Health Initiative(WHI) Observational Study,
50 - 79 1747
Through healthorg. (screening,healthinsurance)
ProspectiveCohort
70126 4.7 years / 0.06
Invasive & In situ breastcancer Post-
menopausal
yesvs.no
20.92(0.83, 1.01)
0.08 A B C D E F G
incidence
High recreational activity, at age 30
Post-menopausal
McTiernan,A.,2003,BRE17819
USA, Multi-ethnic, Post-menopausalWomen's Health Initiative(WHI) Observational Study,
50 - 79 1719
Through healthorg. (screening,healthinsurance)
ProspectiveCohort
69582 4.7 years / 0.06
Invasive & In situ breastcancer Post-
menopausal
yesvs.no
20.86(0.78, 0.95)
0.003
A B C D E F G
incidence
High Recreational activity, in teens
Post-menopausal
McTiernan,A.,2003,BRE17819
USA, Multi-ethnic, Post-menopausalWomen's Health Initiative(WHI) Observational Study,
50 - 79 1709
Through healthorg. (screening,healthinsurance)
ProspectiveCohort
69351 4.7 years / 0.06
Invasive & In situ breastcancer Post-
menopausal
yesvs.no
20.94(0.85, 1.04)
0.21 A B C D E F G
incidence
Menopausal status not specified
Frisch, R.E.,1985,BRE02992
usa, College alumnaeUSA, 1981
36 By MailHistorical Cohort 7559.0 other=parous women
Breast cancer
Other
formerathletesvs.non-athletes
22.02(1.03, 3.94)
A C D F G
incidence
Jogging intensity
Menopausal status not specified
Drake, D.A.,2001,BRE02418
USA, Multi-ethnic, Fitnesscentre membersACLS, 1970
21 - 86
Through socialorganization(profession,religion)
ProspectiveCohort
4520.0 25.0 yearsBreast cancer
1null(null, null)
incidence
Moderate/high recreational activity
Post-menopausal
McTiernan,A.,2003,BRE17819
USA, Multi-ethnic, Post-menopausalWomen's Health Initiative(WHI) Observational Study,
50 - 79 1768
Through healthorg. (screening,healthinsurance)
ProspectiveCohort
71602 4.7 years / 0.06 hours/week
Invasive & In situ breastcancer Post-
menopausal
>7vs.None
70.79(0.63, 0.99)
0.12 A B C D E F G
incidence
Menopausal status not specified
Dorgan, J.F.,1994,BRE02385
USAFramingham Study, 1954
35 - 68Generalpopulation(survey)
ProspectiveCohort
2307.0 28.0 years hours/day
Breast cancer1.0(continuous)
11.2(1.0, 1.06)
0.06 A B C E F G
incidence
TehardB.,2006,BRE80108
FranceE3N-EPIC, 1990
40 - 65 3047
patientrecords/directcontact/healthinsurance
ProspectiveCohort
98995.0 11.4 years / 0.14 Moderate recreationalactivity
hours/week
Breast cancer >=14vs.inactive
50.89(0.65, 1.24)
<0.01
A C D F G
incidence
Moderate/high recreational activity, in teens
287

Author, Year,WCRF Code
Country, Ethnicity, Specialcharacteristics
Age Cases n Caseascertainment
Type of studyNon-Cases n
Lenght offollow-up / loss
Assessmentdetail
Additional details Unit Outcome Subgroup Contrast Nocat. OR (95% CI) p
valueptrend A B C D E F G
adjustments
Menopausal status not specified
Frisch, R.E.,1987,BRE02995
USATEMP
69
Through socialorganization(profession,religion)
Historical Cohort 5398 56.0 years to be atlete or not incollege
Breast cancer not atletevs.atlete
21.86(1.0, 3.47)
A C D F G
cancer prevalence
Slight recreational physical activity
Menopausal status not specified
Dorgan, J.F.,1994,BRE02385
USAFramingham Study, 1954
35 - 68Generalpopulation(survey)
ProspectiveCohort
2307.0 28.0 years hours/day
Breast cancer1.0(continuous)
11.1(0.9, 1.3)
0.47 A B C E F G
incidence
Swimming intensity
Menopausal status not specified
Drake, D.A.,2001,BRE02418
USA, Multi-ethnic, Fitnesscentre membersACLS, 1970
21 - 86
Through socialorganization(profession,religion)
ProspectiveCohort
4520.0 25.0 yearsBreast cancer
1null(null, null)
incidence
Treadmill intensity
Menopausal status not specified
Drake, D.A.,2001,BRE02418
USA, Multi-ethnic, Fitnesscentre membersACLS, 1970
21 - 86
Through socialorganization(profession,religion)
ProspectiveCohort
4520.0 25.0 yearsBreast cancer
1null(null, null)
incidence
Vigorous racquet sports
Menopausal status not specified
Drake, D.A.,2001,BRE02418
USA, Multi-ethnic, Fitnesscentre membersACLS, 1970
21 - 86
Through socialorganization(profession,religion)
ProspectiveCohort
4520.0 25.0 yearsBreast cancer
1null(null, null)
incidence
Vigorous recreational activity
Pre-menopausal
Silvera, S.A.,2005,BRE24118
Canada, Not specifiedCanadian National BreastScreening Study
40 - 59 818
Through healthorg. (screening,healthinsurance)
FFQ-Semi-quantitative
ProspectiveCohort
327994 16.4 years min/day
Breast cancerPre-menopausal
>61.0vs.0 - 30.0
40.87(0.68, 1.09)
0.23 A C D E F G
incidence
Silvera, S. A.N.,2005,BRE24118
CanadaNBSS, 1980
40 - 59 818
Through healthorg. (screening,healthinsurance)
FFQ (nos)ProspectiveCohort
327994 16.4 years min/day
Breast cancerPre-menopausal
>60vs.none
40.87(0.68, 1.09)
0.23 A C D E F G
incidence
Post-menopausal
288

Author, Year,WCRF Code
Country, Ethnicity, Specialcharacteristics
Age Cases n Caseascertainment
Type of studyNon-Cases n
Lenght offollow-up / loss
Assessmentdetail
Additional details Unit Outcome Subgroup Contrast Nocat. OR (95% CI) p
valueptrend A B C D E F G
adjustments
Lee, I.-M.,2001,BRE15848
USA + Puertorico, Notspecified, Registered nursesWomen's Health Study, 1993
45 - 157
Through healthorg. (screening,healthinsurance)
ProspectiveCohort
39322.048.0 months /<0.01 KJ/week
Breast cancer ER+/PR+Post-menopausal
>=4200vs.none
50.79(0.42, 1.49)
0.59 C D E F
incidence
Lee, I.-M.,2001,BRE15848
USA + Puertorico, Notspecified, Registered nursesWomen's Health Study, 1993
45 - 261
Through healthorg. (screening,healthinsurance)
ProspectiveCohort
39322.048.0 months /<0.01 KJ/week
Invasive & In situ breastcancer Post-
menopausal
>=4200vs.none
50.76(0.47, 1.24)
0.29 C D E F
incidence
Silvera, S.A.,2005,BRE24118
Canada, Not specifiedCanadian National BreastScreening Study
40 - 59 662
Through healthorg. (screening,healthinsurance)
FFQ-Semi-quantitative
ProspectiveCohort
2244616 16.4 years min/day
Breast cancerPost-menopausal
>61.0vs.0 - 30.0
41.0(0.78, 1.29)
0.96 A C D E F G
incidence
Silvera, S. A.N.,2005,BRE24118
CanadaNBSS, 1980
40 - 59 662
Through healthorg. (screening,healthinsurance)
FFQ (nos)ProspectiveCohort
2244616 16.4 years min/day
Breast cancerPost-menopausal
>60vs.none
41.0(0.78, 1.29)
0.96 A C D E F G
incidence
Menopausal status not specified
Lee, I.-M.,2001,BRE15848
USA + Puertorico, Notspecified, Registered nursesWomen's Health Study, 1993
45 - 222
Through healthorg. (screening,healthinsurance)
ProspectiveCohort
39322.048.0 months /<0.01 KJ/week
Breast cancer ER+/PR+ >=4200vs.none
50.89(0.54, 1.48)
0.91 C D E F
incidence
Lee, I.-M.,2001,BRE15848
USA + Puertorico, Notspecified, Registered nursesWomen's Health Study, 1993
45 - 411
Through healthorg. (screening,healthinsurance)
ProspectiveCohort
39322.048.0 months /<0.01 KJ/week
Invasive & In situ breastcancer >=4200
vs.none
50.98(0.69, 1.4)
0.98 C D E F
incidence
Silvera, S.A.,2005,BRE24118
Canada, Not specifiedCanadian National BreastScreening Study
40 - 59 1158
Through healthorg. (screening,healthinsurance)
FFQ-Semi-quantitative
ProspectiveCohort
473296 16.4 years min/day
Breast cancer >61.0vs.0 - 30.0
40.93(0.78, 1.1)
0.38 A C D E F G
incidence
Silvera, S. A.N.,2005,BRE24118
CanadaNBSS, 1980
40 - 59 1671
Through healthorg. (screening,healthinsurance)
FFQ (nos)ProspectiveCohort
660114 16.4 years min/day
Breast cancer >60vs.none
40.93(0.78, 1.1)
0.38 A C D E F G
incidence
TehardB.,2006,BRE80108
FranceE3N-EPIC, 1990
40 - 65 2941
patientrecords/directcontact/healthinsurance
ProspectiveCohort
98995.0 11.4 years / 0.14 Vigorous recreationalactivity
hours/week
Breast cancer >=5vs.inactive
50.62(0.49, 0.78)
<0.0001
A C D F G
incidence
Walking intensity
Menopausal status not specified
Drake, D.A.,2001,BRE02418
USA, Multi-ethnic, Fitnesscentre membersACLS, 1970
21 - 86
Through socialorganization(profession,religion)
ProspectiveCohort
4520.0 25.0 yearsBreast cancer
1null(null, null)
incidence
6.1.4
Duration of physical activity
Pre-menopausal
289

Author, Year,WCRF Code
Country, Ethnicity, Specialcharacteristics
Age Cases n Caseascertainment
Type of studyNon-Cases n
Lenght offollow-up / loss
Assessmentdetail
Additional details Unit Outcome Subgroup Contrast Nocat. OR (95% CI) p
valueptrend A B C D E F G
adjustments
Margolis, K.L.,2005,BRE23306
Norway and Sweden, NonHispanic White, YoungwomenWomen's Lifestyle and
30 - 49 1099Randomextraction
ProspectiveCohort
857536 9.1 years duration of competititvephysical activity
Years/life
Invasive breast cancer 5+ yvs.none
30.95(0.75, 1.19)
0.96 A B C D E F G
incidence
6.1.4.2
Duration of recreational activity
Post-menopausal
Dirx, M.J.,2001,BRE02326
Netherlands, Not specified,Post-menopausalThe Netherlands CohortStudy on diet and cancer,
55 - 69 426Case Cohort 3936 7.3 years years of sporting Years/life
Breast cancerPost-menopausal
>40vs.1-10
50.99(0.58, 1.67)
0.28 A B C D E F G
incidence
6.2
Sitting-time index (during working hours)
Post-menopausal
Dirx, M.J.,2001,BRE02326
Netherlands, Not specified,Post-menopausalThe Netherlands CohortStudy on diet and cancer,
55 - 69 755Case Cohort 7107 7.3 years life-long hours/day
Breast cancerPost-menopausal
<2vs.6-8
31.21(0.94, 1.56)
0.54 A B C D E F G
incidence
Menopausal status not specified
Zheng,W.,1993,BRE13994
ShangayTEMP
516 Cancer registryHistorical Cohort null %
Breast cancer > 80%workingvs.general pop
21.27(null, null)
0.01 A
incidence
6.3
Sweating
Menopausal status not specified
Drake, D.A.,2001,BRE02418
USA, Multi-ethnic, Fitnesscentre membersACLS, 1970
21 - 86
Through socialorganization(profession,religion)
ProspectiveCohort
4520.0 25.0 yearsBreast cancer
1null(null, null)
incidence
7.1
Energy Intake
Pre-menopausal
Holmes, M.D.,1999,BRE04008
US, Multi-ethnic, RegisterednursesNurses' Health Study (NHS)Cohort 1976-1996
30 - 55 By MailFFQ-Semi-quantitative
ProspectiveCohort
121700.0 14.0 years Kcal/day
Invasive breast cancerPre-menopausal
100.0(continuous)
10.99(0.98, 1.01)
A C D E F G
incidence
290

Author, Year,WCRF Code
Country, Ethnicity, Specialcharacteristics
Age Cases n Caseascertainment
Type of studyNon-Cases n
Lenght offollow-up / loss
Assessmentdetail
Additional details Unit Outcome Subgroup Contrast Nocat. OR (95% CI) p
valueptrend A B C D E F G
adjustments
FrazierL.A.,2004,BRE02942
USA, Multi-ethnic,Registered nursesNurses' Health study II
34 - 51 361
Through healthorg. (screening,healthinsurance)
FFQ (nos)Historical Cohort 47517 9.0 years adolescent diet Kcal/day
Breast cancerPre-menopausal
3833.0vs.1782.0
51.39(0.99, 1.96)
0.01 A C D E F G
incidence
Silvera, S.A.,2005,BRE24118
Canada, Not specifiedCanadian National BreastScreening Study
40 - 59 818
Through healthorg. (screening,healthinsurance)
FFQ-Semi-quantitative
ProspectiveCohort
327994 16.4 years Kcal/day
Breast cancerPre-menopausal
>2406.0vs.<1629.0
41.45(1.13, 1.85)
0.001
A C D E F G
incidence
Silvera, S. A.N.,2005,BRE24118
CanadaNBSS, 1980
40 - 59 818
Through healthorg. (screening,healthinsurance)
FFQ (nos)ProspectiveCohort
827994 16.4 years Kcal/day
Breast cancerPre-menopausal
>2406vs.<1630
41.45(1.13, 1.85)
0.001
A C D E F G
incidence
Post-menopausal
Kushi L.H.,1992,BRE05141
US, Multi-ethnic, Post-menopausalIowa Women's Health Study
55 - 69 459 By MailFFQ-Semi-quantitative
ProspectiveCohort
130443 4.0 years / 1086 Kcal/day
Breast cancerPost-menopausal
2264.0vs.1168.0
41.06(0.8, 1.39)
0.82 A C D E F G
incidence
Graham,S.,1992,BRE03424
USA, White, Post-menopausalNew York State Cohort,1980
50 - 107 344 By Mail FFQ (nos)ProspectiveCohort
17401 8.0 yearsKcal*1000/month
Breast cancerPost-menopausal
62.0 - 318.0vs.7.0 - 35.0
50.91(0.64, 1.27)
A B
incidence
Barrett-Connor,E.,1993,BRE00581
U.S, WhiteRancho Bernardo, 1972
40 - 79 15
Through socialorganization(profession,religion)
24h RecallProspectiveCohort
575 15.0 years Kcal/day
Breast cancerPost-menopausal
500.0(continuous)
12.72(1.51, 4.89)
A C D E
incidence
Holmes, M.D.,1999,BRE04008
US, Multi-ethnic, RegisterednursesNurses' Health Study (NHS)Cohort 1976-1996
30 - 55 By MailFFQ-Semi-quantitative
ProspectiveCohort
121700.0 14.0 years Kcal/day
Invasive breast cancerPost-menopausal
100.0(continuous)
10.99(0.98, 1.0)
A C D E F G
incidence
Velie,E.,2000,BRE12851
US, Not specified, ScreeningProgramBCDDP, 1973
996
Through healthorg. (screening,healthinsurance)
FFQ (nos)ProspectiveCohort
40022 5.3 years / 4674 KJ/day
Breast cancerPost-menopausal
Quantile 5vs.Quantile 1
50.94(0.77, 1.16)
.39 B C D E F G
incidence
Sieri,Sabina,2002,BRE20941
Italy, Not specified, Post-menopausalORDET study, 1987
41 - 70 56Throughnetwork, paper,tv
FFQ-Semi-quantitative
Nested CaseControl
214 5.5 years Kcal/day
Breast cancerPost-menopausal
1786.4 -3474.4vs.<1410.6
31.02(0.48, 2.16)
0.959
B C G
incidence
Byrne,C.,2002,BRE01315
U.S, Multi-ethnic, Post-menopausalNurses' Health Study (NHS)Cohort 1976-1996
(57) 1071 By MailFFQ-Semi-quantitative
ProspectiveCohort
44697 14.0 years Kcal/day
Invasive breast cancerPost-menopausal
Quantile 5vs.Quantile 1
50.81(0.67, 0.99)
0.03 A C D E F
incidence
Wirfalt,E.,2004,BRE17083
Sweden, Not specified, Post-menopausalMalmo Diet and Cancer,1991
50 - By Mail7-day Record +Questionnaire
Nested CaseControl
12803.0 8.0 yearsBreast cancer
Post-menopausal
1null(null, null)
incidence
Silvera, S.A.,2005,BRE24118
Canada, Not specifiedCanadian National BreastScreening Study
40 - 59 662
Through healthorg. (screening,healthinsurance)
FFQ-Semi-quantitative
ProspectiveCohort
2244616 16.4 years Kcal/day
Breast cancerPost-menopausal
>2406.0vs.<1629.0
40.94(0.72, 1.23)
0.86 A C D E F G
incidence
291

Author, Year,WCRF Code
Country, Ethnicity, Specialcharacteristics
Age Cases n Caseascertainment
Type of studyNon-Cases n
Lenght offollow-up / loss
Assessmentdetail
Additional details Unit Outcome Subgroup Contrast Nocat. OR (95% CI) p
valueptrend A B C D E F G
adjustments
Silvera, S. A.N.,2005,BRE24118
CanadaNBSS, 1980
40 - 59 662
Through healthorg. (screening,healthinsurance)
FFQ (nos)ProspectiveCohort
2244616 16.4 years Kcal/day
Breast cancerPost-menopausal
>2406vs.<1630
40.94(0.72, 1.23)
0.86 A C D E F G
incidence
ChangS.C.,2006,BRE80110
United States, participants ofa RCTPLCO Cancer ScreeningTrial cohort, 1993
55 - 74 764Cancerscreeningprogramme
FFQ (nos)ProspectiveCohort
38660.0 9.3 years Energy intake Kcal/day
Breast cancerPost-menopausal
>2084.0vs.<1315.0
41.25(1.02, 1.53)
0.064
B C D F G
incidence
Kim,E.H.J.,2006,BRE80115
United States, Post-menopausalnurses' Health Study (NHS)Cohort 1976-2000
1653 medical records FFQProspectiveCohort
121701.0 20.0 years Total energy intake Kcal
Breast cancer ER+/PR+500.0(continuous)
11.0(0.94, 1.06)
A C D E F G
incidence
Kim,E.H.J.,2006,BRE80115
United States, Post-menopausalnurses' Health Study (NHS)Cohort 1976-2000
477 medical records FFQProspectiveCohort
121701.0 20.0 years Total energy intake Kcal
Breast cancer ER+/PR-500.0(continuous)
10.97(0.87, 1.08)
A C D E F G
incidence
Kim,E.H.J.,2006,BRE80115
United States, Post-menopausalnurses' Health Study (NHS)Cohort 1976-2000
517 medical records FFQProspectiveCohort
121701.0 20.0 years Total energy intake Kcal
Breast cancer ER-/PR-500.0(continuous)
11.07(0.97, 1.18)
A C D E F G
incidence
Kim,E.H.J.,2006,BRE80115
United States, Post-menopausalnurses' Health Study (NHS)Cohort 1976-2000
83 medical records FFQProspectiveCohort
121701.0 20.0 years Total energy intake Kcal
Breast cancer ER-/PR-500.0(continuous)
11.16(0.91, 1.48)
A C D E F G
incidence
Kim,E.H.J.,2006,BRE80115
United States, Post-menopausalnurses' Health Study (NHS)Cohort 1976-2000
3537 medical records FFQProspectiveCohort
121701.0 20.0 years Total energy intake Kcal
Invasive breast cancer500.0(continuous)
11.01(0.97, 1.04)
A C D E F G
incidence
Menopausal status not specified
Jones, D.Y.,1987,BRE04461
US, Multi-ethnicNHANES I, 1971
25 - 74 86Generalpopulation(survey)
24h RecallProspectiveCohort
4912 10.0 years / 776 Kcal/day
Breast cancer >1776.0vs.<1029.9
40.7(0.36, 1.4)
0.22 A B C D F
incidence
Knekt,P.,1990,BRE04898
Finland, Not specified,Screening ProgramMobile Clinic HealthExamination Survey, 1973
20 - 69
Through healthorg. (screening,healthinsurance)
Dietary Historyquestionnaire
ProspectiveCohort
3988.0 20.0 years Kcal/day
Breast cancer >2335.0vs.<1791.0
30.58(0.29, 1.18)
0.15 A E
incidence
Howe, G.R.,1991,BRE17622
canada, Multi-ethnic,Screening ProgramNBSS, 1980
40 - 59 519
Through healthorg. (screening,healthinsurance)
Dietary Historyquestionnaire
Nested CaseControl
1182 5.0 years Kcal/day
Breast cancer Quantile 4vs.Quantile 1
40.95(0.71, 1.26)
.51 A G
incidence
Willett, W.C.,1992,BRE13438
U.S, Not specified,Registered nursesNurses' Health Study (NHS)Cohort 1976-1996
30 - 55 1439 By MailFFQ-Semi-quantitative
ProspectiveCohort
692674 8.0 years KJ/day
Breast cancer >8230.0vs.<4745.9
51.0(0.85, 1.18)
0.83 A C D E F G
incidence
Giovannucci,E.,1993,BRE03262
US, Not specified,Registered nursesNurses' Health Study (NHS)Cohort 1976-1996
30 - 55 392 By MailFFQ-Semi-quantitative
Nested CaseControl
786 2.0 years Kcal/day
Breast cancer Quantile 5vs.Quantile 1
51.01(0.65, 1.56)
0.50 A
incidence
292

Author, Year,WCRF Code
Country, Ethnicity, Specialcharacteristics
Age Cases n Caseascertainment
Type of studyNon-Cases n
Lenght offollow-up / loss
Assessmentdetail
Additional details Unit Outcome Subgroup Contrast Nocat. OR (95% CI) p
valueptrend A B C D E F G
adjustments
Van den Brandt,P.A.,1993,BRE16919
the Netherlands, Notspecified, Post-menopausalwomenThe Netherlands Cohort
55 - 69 437 By MailFFQ-Semi-quantitative
ProspectiveCohort
51873.3 years / nolost Kcal/day
Invasive breast cancer >1.0vs.>-1.0
50.99(0.7, 1.39)
0.81 A
incidence
Gaard,,1995,BRE17516
Norway, Not specified,Screening ProgramNorway National HealthScreening Service, 1974
35 - 49 248 By MailFFQ-Semi-quantitative
ProspectiveCohort
281924 10.0 years KJ/day
Breast cancer >6654.0vs.<4453.9
41.37(0.95, 1.98)
0.11 A D F G
incidence
Kushi, L.H.,1995,BRE05142
US, Multi-ethnicIowa Women's Health Study
55 - 69 329 By MailFFQ-Semi-quantitative
ProspectiveCohort
34388.0 6.0 years Kcal/day
Breast cancer ER+/PR+ >1972.0vs.<1499.0
31.06(0.81, 1.4)
0.59 A
incidence
Kushi, L.H.,1995,BRE05142
US, Multi-ethnicIowa Women's Health Study
55 - 69 75 By MailFFQ-Semi-quantitative
ProspectiveCohort
34388.0 6.0 years Kcal/day
Breast cancer ER+/PR- >1972.0vs.<1499.0
31.18(0.67, 2.05)
0.57 A E
incidence
Kushi, L.H.,1995,BRE05142
US, Multi-ethnicIowa Women's Health Study
55 - 69 14 By MailFFQ-Semi-quantitative
ProspectiveCohort
34388.0 6.0 years Kcal/day
Breast cancer ER-/PR+ >1972.0vs.<1499.0
31.31(0.29, 5.87)
0.82 A
incidence
Kushi, L.H.,1995,BRE05142
US, Multi-ethnicIowa Women's Health Study
55 - 69 61 By MailFFQ-Semi-quantitative
ProspectiveCohort
34388.0 6.0 years Kcal/day
Breast cancer ER-/PR- >1972.0vs.<1499.0
30.87(0.47, 1.6)
0.65 A
incidence
Byrne,C.,1996,BRE05719
USA, Black and WhiteNHEFS, 1981/82
25 - 74 52 Unspecified FFQ (nos)ProspectiveCohort
23831 3.9 years / 252 MJ/day
Breast cancer 6.62 - 17.9vs.<4.41
40.42(0.2, 1.1)
A
incidence
Fraser, G.E.,1997,BRE02940
USA, White, AdventistAHS, 1974
24 -
Through socialorganization(profession,religion)
ProspectiveCohort
20341.0 6.0 years / 610 Kcal/day
Invasive breast cancer >1777.2vs.<=1777.2
21.15(0.84, 1.56)
incidence
Holmes, M.D.,1999,BRE04008
US, Multi-ethnic, RegisterednursesNurses' Health Study (NHS)Cohort 1976-1996
30 - 55 By MailFFQ-Semi-quantitative
ProspectiveCohort
121700.0 14.0 years Kcal/day
Invasive breast cancer100.0(continuous)
10.99(0.98, 1.0)
A C D E F G
incidence
Voorrips, L.E.,2002,BRE13011
The Netherlands, Notspecified, Post-menopausalwomenThe Netherlands Cohort
55 - 69 783 By MailFFQ-Semi-quantitative
Case Cohort 62573.0 6.3 years KJ/day
Breast cancer 9247.0vs.5079.0
51.04(0.77, 1.4)
0.61 A B C D E F G
incidence
Horn-Ross,P.L.,2002,BRE15412
USA, Multi-ethnic,Registered teachersCalifornia Teachers Study,1995
21 - 103 By Mail FFQ (nos)ProspectiveCohort
111383.0 2.0 years calories Kcal/day
Invasive breast cancer Quantile 5vs.<1096.0
51.0(0.8, 1.3)
0.7 A C D E F G
incidence
Chang, S.C.,2003,BRE18295
USA, Not specified,Screening ProgramBCDDP, 1973
55 - 74
Through healthorg. (screening,healthinsurance)
Questionnaire(nos)
ProspectiveCohort
27534.0 7.0 years highest quartile vslowest
Breast cancer >1.0vs.>-1.0
21.25(1.02, 1.54)
0.07incidence
Silvera, S.A.,2005,BRE24118
Canada, Not specifiedCanadian National BreastScreening Study
40 - 59 1671
Through healthorg. (screening,healthinsurance)
FFQ-Semi-quantitative
ProspectiveCohort
670113 16.4 years Kcal/day
Breast cancer >2406.0vs.<1629.0
41.19(0.99, 1.42)
0.01 A C D E F G
incidence
293

Author, Year,WCRF Code
Country, Ethnicity, Specialcharacteristics
Age Cases n Caseascertainment
Type of studyNon-Cases n
Lenght offollow-up / loss
Assessmentdetail
Additional details Unit Outcome Subgroup Contrast Nocat. OR (95% CI) p
valueptrend A B C D E F G
adjustments
Silvera, S. A.N.,2005,BRE24118
CanadaNBSS, 1980
40 - 59 1671
Through healthorg. (screening,healthinsurance)
FFQ (nos)ProspectiveCohort
670113 16.4 years Kcal/day
Breast cancer >2406vs.<1630
41.19(0.99, 1.42)
0.01 A C D E F G
incidence
7.1.0.1
Energy from linoleic acid
Post-menopausal
Velie,E.,2000,BRE12851
US, Not specified, ScreeningProgramBCDDP, 1973
996
Through healthorg. (screening,healthinsurance)
FFQ (nos)ProspectiveCohort
40022 5.3 years / 4674 %/day
Breast cancerPost-menopausal
Quantile 5vs.Quantile 1
51.05(0.82, 1.34)
.44 B C D E F G
incidence
WakaiK.,2005,BRE24482
japan, Asian, Previous studyJACC study, 1988
40 - 79 76Generalpopulation(survey)
FFQ (nos)ProspectiveCohort
26291.0 7.6 days percent of energy fromn-6 fatty acids
Breast cancerPost-menopausal
>4.8vs.<3.45
41.68(0.85, 3.35)
0.15 A B C D E F G
incidence
Menopausal status not specified
WakaiK.,2005,BRE24482
japan, Asian, Previous studyJACC study, 1988
40 - 79 129Generalpopulation(survey)
FFQ (nos)ProspectiveCohort
26291.0 7.6 days percent of energy fromn-6 fatty acids
Breast cancer >4.78vs.<3.45
41.02(0.59, 1.74)
0.96 A B C D E F G
incidence
Energy from monounsaturated fatty acids
Pre-menopausal
Holmes, M.D.,1999,BRE04008
US, Multi-ethnic, RegisterednursesNurses' Health Study (NHS)Cohort 1976-1996
30 - 55 By MailFFQ-Semi-quantitative
ProspectiveCohort
121700.0 14.0 years % of totalenergy/day
Invasive breast cancerPre-menopausal
5.0(continuous)
11.02(0.91, 1.15)
A C D E F G
incidence
Cho, E.,2003,BRE17370
US, Multi-ethnic, Pre-menopausalNHS II, 1989
25 - 42 714 By MailFFQ-Semi-quantitative
ProspectiveCohort
90655 8.0 years %/day
Invasive breast cancerPre-menopausal
15.0vs.9.0
51.26(0.99, 1.6)
.06 A C D E F G
incidence
Post-menopausal
Holmes, M.D.,1999,BRE04008
US, Multi-ethnic, RegisterednursesNurses' Health Study (NHS)Cohort 1976-1996
30 - 55 By MailFFQ-Semi-quantitative
ProspectiveCohort
121700.0 14.0 years % of totalenergy/day
Invasive breast cancerPost-menopausal
5.0(continuous)
10.91(0.84, 0.99)
A C D E F G
incidence
WakaiK.,2005,BRE24482
japan, Asian, Previous studyJACC study, 1988
40 - 79 76Generalpopulation(survey)
FFQ (nos)ProspectiveCohort
26291.0 7.6 dayspercent of energy frommonounsaturated fattyacids
Breast cancerPost-menopausal
>7.48vs.<5.46
40.96(0.45, 2.05)
0.82 A B C D E F G
incidence
Menopausal status not specified
Holmes, M.D.,1999,BRE04008
US, Multi-ethnic, RegisterednursesNurses' Health Study (NHS)Cohort 1976-1996
30 - 55 By MailFFQ-Semi-quantitative
ProspectiveCohort
121700.0 14.0 years % of totalenergy/day
Invasive breast cancer5.0(continuous)
10.94(0.88, 1.0)
A C D E F G
incidence
294

Author, Year,WCRF Code
Country, Ethnicity, Specialcharacteristics
Age Cases n Caseascertainment
Type of studyNon-Cases n
Lenght offollow-up / loss
Assessmentdetail
Additional details Unit Outcome Subgroup Contrast Nocat. OR (95% CI) p
valueptrend A B C D E F G
adjustments
Holmes, M.D.,1999,BRE04008
US, Multi-ethnic, RegisterednursesNurses' Health Study (NHS)Cohort 1976-1996
30 - 55 By MailFFQ-Semi-quantitative
ProspectiveCohort
121700.0 14.0 years % of totalenergy/day
Invasive breast cancer5.0(continuous)
11.03(0.89, 1.18)
A C D E F G
incidence
Gago-Dominguez,M.,2003,BRE17518
China, AsianThe Singapore ChineseHealth Study, 1993
45 - 74 314Direct contactat home
FFQ (nos)ProspectiveCohort
63257.0 5.3 years %/day
Breast cancer 9.2vs.7.9
41.02(0.73, 1.43)
0.90 A B C E F G
incidence
WakaiK.,2005,BRE24482
japan, Asian, Previous studyJACC study, 1988
40 - 79 129Generalpopulation(survey)
FFQ (nos)ProspectiveCohort
26291.0 7.6 dayspercent of energy frommonounsaturated fattyacids
Breast cancer >7.55vs.<5.49
40.62(0.36, 1.09)
0.19 A B C D E F G
incidence
Energy from n-3 fatty acids
Pre-menopausal
Holmes, M.D.,1999,BRE04008
US, Multi-ethnic, RegisterednursesNurses' Health Study (NHS)Cohort 1976-1996
30 - 55 By MailFFQ-Semi-quantitative
ProspectiveCohort
121700.0 14.0 years % of totalenergy/day
Invasive breast cancerPre-menopausal
0.1(continuous)
11.1(0.96, 1.26)
A C D E F G
incidence
Cho, E.,2003,BRE17370
US, Multi-ethnic, Pre-menopausalNHS II, 1989
25 - 42 714 By MailFFQ-Semi-quantitative
ProspectiveCohort
90655 8.0 years %
Invasive breast cancerPre-menopausal
0.19vs.0.03
51.01(0.78, 1.31)
.50 A C D E F G
incidence
Post-menopausal
Holmes, M.D.,1999,BRE04008
US, Multi-ethnic, RegisterednursesNurses' Health Study (NHS)Cohort 1976-1996
30 - 55 By MailFFQ-Semi-quantitative
ProspectiveCohort
121700.0 14.0 years % of totalenergy/day
Invasive breast cancerPost-menopausal
0.1(continuous)
11.09(1.02, 1.17)
A C D E F G
incidence
WakaiK.,2005,BRE24482
japan, Asian, Previous studyJACC study, 1988
40 - 79 76Generalpopulation(survey)
FFQ (nos)ProspectiveCohort
26291.0 7.6 days percent of energy fromn-3 fatty acids
Breast cancerPost-menopausal
>1.34vs.<0.86
40.94(0.46, 1.91)
0.87 A B C D E F G
incidence
Menopausal status not specified
Holmes, M.D.,1999,BRE04008
US, Multi-ethnic, RegisterednursesNurses' Health Study (NHS)Cohort 1976-1996
30 - 55 By MailFFQ-Semi-quantitative
ProspectiveCohort
121700.0 14.0 years % of totalenergy/day
Invasive breast cancer0.1(continuous)
11.09(1.03, 1.16)
A C D E F G
incidence
WakaiK.,2005,BRE24482
japan, Asian, Previous studyJACC study, 1988
40 - 79 129Generalpopulation(survey)
FFQ (nos)ProspectiveCohort
26291.0 7.6 days percent of energy fromn-3 fatty acids
Breast cancer >1.32vs.<0.85
40.69(0.4, 1.18)
0.26 A B C D E F G
incidence
Energy from oleic acid
Post-menopausal
Velie,E.,2000,BRE12851
US, Not specified, ScreeningProgramBCDDP, 1973
996
Through healthorg. (screening,healthinsurance)
FFQ (nos)ProspectiveCohort
40022 5.3 years / 4674 %/day
Breast cancerPost-menopausal
Quantile 5vs.Quantile 1
50.88(0.62, 1.25)
.92 B C D E F G
incidence
Menopausal status not specified
295

Author, Year,WCRF Code
Country, Ethnicity, Specialcharacteristics
Age Cases n Caseascertainment
Type of studyNon-Cases n
Lenght offollow-up / loss
Assessmentdetail
Additional details Unit Outcome Subgroup Contrast Nocat. OR (95% CI) p
valueptrend A B C D E F G
adjustments
Holmes, M.D.,1999,BRE04008
US, Multi-ethnic, RegisterednursesNurses' Health Study (NHS)Cohort 1976-1996
30 - 55 2097 By MailFFQ-Semi-quantitative
ProspectiveCohort
121700.0 14.0 years % of totalenergy/day
Invasive breast cancer5.0(continuous)
10.86(0.77, 0.96)
A C D E F G
incidence
Energy from polyunsaturated fatty acids
Pre-menopausal
Holmes, M.D.,1999,BRE04008
US, Multi-ethnic, RegisterednursesNurses' Health Study (NHS)Cohort 1976-1996
30 - 55 By MailFFQ-Semi-quantitative
ProspectiveCohort
121700.0 14.0 years % of totalenergy/day
Invasive breast cancerPre-menopausal
5.0(continuous)
10.99(0.77, 1.27)
A C D E F G
incidence
Cho, E.,2003,BRE17370
US, Multi-ethnic, Pre-menopausalNHS II, 1989
25 - 42 714 By MailFFQ-Semi-quantitative
ProspectiveCohort
90655 8.0 years %/day
Invasive breast cancerPre-menopausal
7.0vs.4.0
51.06(0.84, 1.35)
.20 A C D E F G
incidence
Post-menopausal
Holmes, M.D.,1999,BRE04008
US, Multi-ethnic, RegisterednursesNurses' Health Study (NHS)Cohort 1976-1996
30 - 55 By MailFFQ-Semi-quantitative
ProspectiveCohort
121700.0 14.0 years % of totalenergy/day
Invasive breast cancerPost-menopausal
5.0(continuous)
10.88(0.74, 1.04)
A C D E F G
incidence
WakaiK.,2005,BRE24482
japan, Asian, Previous studyJACC study, 1988
40 - 79 76Generalpopulation(survey)
FFQ (nos)ProspectiveCohort
26291.0 7.6 dayspercent of energy frompolyunsaturated fattyacids
Breast cancerPost-menopausal
>6.06vs.<4.4
41.98(0.94, 4.18)
0.071
A B C D E F G
incidence
Menopausal status not specified
Holmes, M.D.,1999,BRE04008
US, Multi-ethnic, RegisterednursesNurses' Health Study (NHS)Cohort 1976-1996
30 - 55 By MailFFQ-Semi-quantitative
ProspectiveCohort
121700.0 14.0 years % of totalenergy/day
Invasive breast cancer5.0(continuous)
10.91(0.79, 1.04)
A C D E F G
incidence
Holmes, M.D.,1999,BRE04008
US, Multi-ethnic, RegisterednursesNurses' Health Study (NHS)Cohort 1976-1996
30 - 55 By MailFFQ-Semi-quantitative
ProspectiveCohort
121700.0 14.0 years % of totalenergy/day
Invasive breast cancer5.0(continuous)
10.97(0.81, 1.16)
A C D E F G
incidence
Gago-Dominguez,M.,2003,BRE17518
China, AsianThe Singapore ChineseHealth Study, 1993
45 - 74 314Direct contactat home
FFQ (nos)ProspectiveCohort
63257.0 5.3 years %/day
Breast cancer 5.8vs.4.8
41.27(0.92, 1.74)
0.46 A B C E F G
incidence
WakaiK.,2005,BRE24482
japan, Asian, Previous studyJACC study, 1988
40 - 79 129Generalpopulation(survey)
FFQ (nos)ProspectiveCohort
26291.0 7.6 dayspercent of energy frompolyunsaturated fattyacids
Breast cancer >6.03vs.<4.38
41.1(0.63, 1.9)
0.83 A B C D E F G
incidence
Energy from saturated fatty acids
Pre-menopausal
Holmes, M.D.,1999,BRE04008
US, Multi-ethnic, RegisterednursesNurses' Health Study (NHS)Cohort 1976-1996
30 - 55 By MailFFQ-Semi-quantitative
ProspectiveCohort
121700.0 14.0 years % of totalenergy/day
Invasive breast cancerPre-menopausal
5.0(continuous)
10.98(0.87, 1.11)
A C D E F G
incidence
296

Author, Year,WCRF Code
Country, Ethnicity, Specialcharacteristics
Age Cases n Caseascertainment
Type of studyNon-Cases n
Lenght offollow-up / loss
Assessmentdetail
Additional details Unit Outcome Subgroup Contrast Nocat. OR (95% CI) p
valueptrend A B C D E F G
adjustments
Cho, E.,2003,BRE17370
US, Multi-ethnic, Pre-menopausalNHS II, 1989
25 - 42 714 By MailFFQ-Semi-quantitative
ProspectiveCohort
90655 8.0 years %/day
Invasive breast cancerPre-menopausal
14.0vs.8.0
51.17(0.91, 1.5)
.02 A C D E F G
incidence
Post-menopausal
Holmes, M.D.,1999,BRE04008
US, Multi-ethnic, RegisterednursesNurses' Health Study (NHS)Cohort 1976-1996
30 - 55 By MailFFQ-Semi-quantitative
ProspectiveCohort
121700.0 14.0 years % of totalenergy/day
Invasive breast cancerPost-menopausal
5.0(continuous)
10.93(0.85, 1.02)
A C D E F G
incidence
Velie,E.,2000,BRE12851
US, Not specified, ScreeningProgramBCDDP, 1973
996
Through healthorg. (screening,healthinsurance)
FFQ (nos)ProspectiveCohort
40022 5.3 years / 4674 %/day
Breast cancerPost-menopausal
Quantile 5vs.Quantile 1
51.12(0.87, 1.45)
.67 B C D E F G
incidence
WakaiK.,2005,BRE24482
japan, Asian, Previous studyJACC study, 1988
40 - 79 76Generalpopulation(survey)
FFQ (nos)ProspectiveCohort
26291.0 7.6 days percent of energy fromsaturated fatty acids
Breast cancerPost-menopausal
>7.34vs.<5.19
40.64(0.34, 1.22)
0.09 A B C D E F G
incidence
Menopausal status not specified
Holmes, M.D.,1999,BRE04008
US, Multi-ethnic, RegisterednursesNurses' Health Study (NHS)Cohort 1976-1996
30 - 55 By MailFFQ-Semi-quantitative
ProspectiveCohort
121700.0 14.0 years % of totalenergy/day
Invasive breast cancer5.0(continuous)
10.94(0.88, 1.01)
A C D E F G
incidence
Holmes, M.D.,1999,BRE04008
US, Multi-ethnic, RegisterednursesNurses' Health Study (NHS)Cohort 1976-1996
30 - 55 By MailFFQ-Semi-quantitative
ProspectiveCohort
121700.0 14.0 years % of totalenergy/day
Invasive breast cancer5.0(continuous)
10.93(0.82, 1.05)
A C D E F G
incidence
Gago-Dominguez,M.,2003,BRE17518
China, AsianThe Singapore ChineseHealth Study, 1993
45 - 74 314Direct contactat home
FFQ (nos)ProspectiveCohort
63257.0 5.3 years %/day
Breast cancer 9.4vs.8.4
40.92(0.67, 1.26)
0.59 A B C E F G
incidence
WakaiK.,2005,BRE24482
japan, Asian, Previous studyJACC study, 1988
40 - 79 129Generalpopulation(survey)
FFQ (nos)ProspectiveCohort
26291.0 7.6 days percent of energy fromsaturated fatty acids
Breast cancer >7.45vs.<5.24
40.68(0.4, 1.15)
0.066
A B C D E F G
incidence
Energy from trans fatty acids
Pre-menopausal
Holmes, M.D.,1999,BRE04008
US, Multi-ethnic, RegisterednursesNurses' Health Study (NHS)Cohort 1976-1996
30 - 55 By MailFFQ-Semi-quantitative
ProspectiveCohort
121700.0 14.0 years % of totalenergy/day
Invasive breast cancerPre-menopausal
1.0(continuous)
11.0(0.88, 1.13)
A C D E F G
incidence
Cho, E.,2003,BRE17370
US, Multi-ethnic, Pre-menopausalNHS II, 1989
25 - 42 714 By MailFFQ-Semi-quantitative
ProspectiveCohort
90655 8.0 years unsaturated trans fa %
Invasive breast cancerPre-menopausal
2.3vs.0.9
51.15(0.9, 1.47)
.54 A C D E F G
incidence
Post-menopausal
Holmes, M.D.,1999,BRE04008
US, Multi-ethnic, RegisterednursesNurses' Health Study (NHS)Cohort 1976-1996
30 - 55 By MailFFQ-Semi-quantitative
ProspectiveCohort
121700.0 14.0 years % of totalenergy/day
Invasive breast cancerPost-menopausal
1.0(continuous)
10.91(0.84, 0.99)
A C D E F G
incidence
297

Author, Year,WCRF Code
Country, Ethnicity, Specialcharacteristics
Age Cases n Caseascertainment
Type of studyNon-Cases n
Lenght offollow-up / loss
Assessmentdetail
Additional details Unit Outcome Subgroup Contrast Nocat. OR (95% CI) p
valueptrend A B C D E F G
adjustments
Menopausal status not specified
Holmes, M.D.,1999,BRE04008
US, Multi-ethnic, RegisterednursesNurses' Health Study (NHS)Cohort 1976-1996
30 - 55 By MailFFQ-Semi-quantitative
ProspectiveCohort
121700.0 14.0 years % of totalenergy/day
Invasive breast cancer1.0(continuous)
10.92(0.86, 0.98)
A C D E F G
incidence
Holmes, M.D.,1999,BRE04008
US, Multi-ethnic, RegisterednursesNurses' Health Study (NHS)Cohort 1976-1996
30 - 55 By MailFFQ-Semi-quantitative
ProspectiveCohort
121700.0 14.0 years % of totalenergy/day
Invasive breast cancer1.0(continuous)
10.93(0.85, 1.02)
A C D E F G
incidence
Energy from unsaturated fat
Post-menopausal
Velie,E.,2000,BRE12851
US, Not specified, ScreeningProgramBCDDP, 1973
996
Through healthorg. (screening,healthinsurance)
FFQ (nos)ProspectiveCohort
40022 5.3 years / 4674 %/day
Breast cancerPost-menopausal
Quantile 5vs.Quantile 1
51.13(0.88, 1.45)
.35 B C D E F G
incidence
Percent of energy from fat
Post-menopausal
WakaiK.,2005,BRE24482
japan, Asian, Previous studyJACC study, 1988
40 - 79 76Generalpopulation(survey)
FFQ (nos)ProspectiveCohort
26291.0 7.6 daysBreast cancer
Post-menopausal
>24.36vs.<18.37
40.99(0.5, 1.95)
0.9 A B C D E F G
incidence
Kim,E.H.J.,2006,BRE80115
United States, Post-menopausalnurses' Health Study (NHS)Cohort 1976-2000
1653 medical records FFQProspectiveCohort
121701.0 20.0 years Percentage energyfrom total fat
%
Breast cancer ER+/PR+5.0(continuous)
10.98(0.94, 1.03)
A C D E F G
incidence
Kim,E.H.J.,2006,BRE80115
United States, Post-menopausalnurses' Health Study (NHS)Cohort 1976-2000
1653 medical records FFQProspectiveCohort
121701.0 20.0 years Percentage energyfrom animal fat
%
Breast cancer ER+/PR+5.0(continuous)
10.98(0.94, 1.03)
A C D E F G
incidence
Kim,E.H.J.,2006,BRE80115
United States, Post-menopausalnurses' Health Study (NHS)Cohort 1976-2000
1653 medical records FFQProspectiveCohort
121701.0 20.0 years Percentage energyfrom vegetable fat
%
Breast cancer ER+/PR+5.0(continuous)
10.98(0.92, 1.06)
A C D E F G
incidence
Kim,E.H.J.,2006,BRE80115
United States, Post-menopausalnurses' Health Study (NHS)Cohort 1976-2000
1653 medical records FFQProspectiveCohort
121701.0 20.0 yearsPercentage energyfrom monounsaturatedfat
%
Breast cancer ER+/PR+5.0(continuous)
10.95(0.86, 1.06)
A C D E F G
incidence
Kim,E.H.J.,2006,BRE80115
United States, Post-menopausalnurses' Health Study (NHS)Cohort 1976-2000
1653 medical records FFQProspectiveCohort
121701.0 20.0 yearsPercentage energyfrom trans-unsaturatedfat
%
Breast cancer ER+/PR+1.0(continuous)
10.95(0.86, 1.05)
A C D E F G
incidence
Kim,E.H.J.,2006,BRE80115
United States, Post-menopausalnurses' Health Study (NHS)Cohort 1976-2000
1653 medical records FFQProspectiveCohort
121701.0 20.0 yearsPercentage energyfrom alpha-linolenicacid
%
Breast cancer ER+/PR+0.1(continuous)
11.0(0.99, 1.0)
A C D E F G
incidence
Kim,E.H.J.,2006,BRE80115
United States, Post-menopausalnurses' Health Study (NHS)Cohort 1976-2000
477 medical records FFQProspectiveCohort
121701.0 20.0 years Percentage energyfrom total fat
%
Breast cancer ER+/PR-5.0(continuous)
10.98(0.9, 1.07)
A C D E F G
incidence
298

Author, Year,WCRF Code
Country, Ethnicity, Specialcharacteristics
Age Cases n Caseascertainment
Type of studyNon-Cases n
Lenght offollow-up / loss
Assessmentdetail
Additional details Unit Outcome Subgroup Contrast Nocat. OR (95% CI) p
valueptrend A B C D E F G
adjustments
Kim,E.H.J.,2006,BRE80115
United States, Post-menopausalnurses' Health Study (NHS)Cohort 1976-2000
477 medical records FFQProspectiveCohort
121701.0 20.0 years Percentage energyfrom animal fat
%
Breast cancer ER+/PR-5.0(continuous)
10.98(0.9, 1.07)
A C D E F G
incidence
Kim,E.H.J.,2006,BRE80115
United States, Post-menopausalnurses' Health Study (NHS)Cohort 1976-2000
477 medical records FFQProspectiveCohort
121701.0 20.0 years Percentage energyfrom vegetable fat
%
Breast cancer ER+/PR-5.0(continuous)
11.01(0.9, 1.14)
A C D E F G
incidence
Kim,E.H.J.,2006,BRE80115
United States, Post-menopausalnurses' Health Study (NHS)Cohort 1976-2000
477 medical records FFQProspectiveCohort
121701.0 20.0 yearsPercentage energyfrom monounsaturatedfat
%
Breast cancer ER+/PR-5.0(continuous)
10.98(0.81, 1.17)
A C D E F G
incidence
Kim,E.H.J.,2006,BRE80115
United States, Post-menopausalnurses' Health Study (NHS)Cohort 1976-2000
477 medical records FFQProspectiveCohort
121701.0 20.0 yearsPercentage energyfrom trans-unsaturatedfat
%
Breast cancer ER+/PR-1.0(continuous)
10.91(0.76, 1.09)
A C D E F G
incidence
Kim,E.H.J.,2006,BRE80115
United States, Post-menopausalnurses' Health Study (NHS)Cohort 1976-2000
517 medical records FFQProspectiveCohort
121701.0 20.0 years Percentage energyfrom fat
%
Breast cancer ER-/PR-5.0(continuous)
10.95(0.88, 1.03)
A C D E F G
incidence
Kim,E.H.J.,2006,BRE80115
United States, Post-menopausalnurses' Health Study (NHS)Cohort 1976-2000
517 medical records FFQProspectiveCohort
121701.0 20.0 years Percentage energyfrom animal fat
%
Breast cancer ER-/PR-5.0(continuous)
10.97(0.9, 1.06)
A C D E F G
incidence
Kim,E.H.J.,2006,BRE80115
United States, Post-menopausalnurses' Health Study (NHS)Cohort 1976-2000
517 medical records FFQProspectiveCohort
121701.0 20.0 years Percentage energyfrom vegetable fat
%
Breast cancer ER-/PR-5.0(continuous)
10.96(0.85, 1.07)
A C D E F G
incidence
Kim,E.H.J.,2006,BRE80115
United States, Post-menopausalnurses' Health Study (NHS)Cohort 1976-2000
517 medical records FFQProspectiveCohort
121701.0 20.0 yearsPercentage energyfrom monounsaturatedfat
%
Breast cancer ER-/PR-5.0(continuous)
10.89(0.75, 1.06)
A C D E F G
incidence
Kim,E.H.J.,2006,BRE80115
United States, Post-menopausalnurses' Health Study (NHS)Cohort 1976-2000
517 medical records FFQProspectiveCohort
121701.0 20.0 yearsPercentage energyfrom trans-unsaturatedfat
%
Breast cancer ER-/PR-1.0(continuous)
11.02(0.86, 1.2)
A C D E F G
incidence
Kim,E.H.J.,2006,BRE80115
United States, Post-menopausalnurses' Health Study (NHS)Cohort 1976-2000
517 medical records FFQProspectiveCohort
121701.0 20.0 yearsPercentage energyfrom alpha-linolenicacide
%
Breast cancer ER-/PR-0.1(continuous)
11.0(0.99, 1.01)
A C D E F G
incidence
Kim,E.H.J.,2006,BRE80115
United States, Post-menopausalnurses' Health Study (NHS)Cohort 1976-2000
83 medical records FFQProspectiveCohort
121701.0 20.0 years Percentage energyfrom total fat
%
Breast cancer ER-/PR-5.0(continuous)
10.98(0.8, 1.2)
A C D E F G
incidence
Kim,E.H.J.,2006,BRE80115
United States, Post-menopausalnurses' Health Study (NHS)Cohort 1976-2000
83 medical records FFQProspectiveCohort
121701.0 20.0 years Percentage energyfrom animal fat
%
Breast cancer ER-/PR-5.0(continuous)
10.99(0.8, 1.22)
A C D E F G
incidence
Kim,E.H.J.,2006,BRE80115
United States, Post-menopausalnurses' Health Study (NHS)Cohort 1976-2000
83 medical records FFQProspectiveCohort
121701.0 20.0 years Percentage energyfrom vegetable fat
%
Breast cancer ER-/PR-5.0(continuous)
10.99(0.74, 1.32)
A C D E F G
incidence
299

Author, Year,WCRF Code
Country, Ethnicity, Specialcharacteristics
Age Cases n Caseascertainment
Type of studyNon-Cases n
Lenght offollow-up / loss
Assessmentdetail
Additional details Unit Outcome Subgroup Contrast Nocat. OR (95% CI) p
valueptrend A B C D E F G
adjustments
Kim,E.H.J.,2006,BRE80115
United States, Post-menopausalnurses' Health Study (NHS)Cohort 1976-2000
83 medical records FFQProspectiveCohort
121701.0 20.0 yearsPercentage energyfrom monounsaturatedfat
%
Breast cancer ER-/PR-5.0(continuous)
11.01(0.65, 1.58)
A C D E F G
incidence
Kim,E.H.J.,2006,BRE80115
United States, Post-menopausalnurses' Health Study (NHS)Cohort 1976-2000
83 medical records FFQProspectiveCohort
121701.0 20.0 yearsPercentage energyfrom trans-unsaturatedfat
%
Breast cancer ER-/PR-1.0(continuous)
11.15(0.65, 2.02)
A C D E F G
incidence
Kim,E.H.J.,2006,BRE80115
United States, Post-menopausalnurses' Health Study (NHS)Cohort 1976-2000
83 medical records FFQProspectiveCohort
121701.0 20.0 yearsPercentage energyfrom alpha-linolenicacid
%
Breast cancer ER-/PR-0.1(continuous)
10.99(0.97, 1.01)
A C D E F G
incidence
Kim,E.H.J.,2006,BRE80115
United States, Post-menopausalnurses' Health Study (NHS)Cohort 1976-2000
1655 medical records FFQProspectiveCohort
121701.0 20.0 years
Percentage energyfrom fat, subgroupanalysis by waistcircumference <
%
Invasive breast cancer
<35" waist>45.1vs.30.1-35
61.13(0.81, 1.57)
0.45 A C D E F G
incidence
Kim,E.H.J.,2006,BRE80115
United States, Post-menopausalnurses' Health Study (NHS)Cohort 1976-2000
453 medical records FFQProspectiveCohort
121701.0 20.0 years
Percentage energyfrom fat, subgroupanalysis by waistcircumference >=
%
Invasive breast cancer
>=35" waist>45.1vs.<25
60.79(0.44, 1.4)
0.04 A C D E F G
incidence
Kim,E.H.J.,2006,BRE80115
United States, Post-menopausalnurses' Health Study (NHS)Cohort 1976-2000
1096 medical records FFQProspectiveCohort
121701.0 20.0 years
Percentage energyfrom fat, subgroupanalysis by BMI in1980-2000
%
Invasive breast cancerBMI = 25.0-29.9
>45.1vs.30.1-35
61.08(0.77, 1.49)
0.64 A C D E F G
incidence
Kim,E.H.J.,2006,BRE80115
United States, Post-menopausalnurses' Health Study (NHS)Cohort 1976-2000
565 medical records FFQProspectiveCohort
121701.0 20.0 years
Percentage energyfrom fat, subgroupanalysis by BMI in1980-2000
%
Invasive breast cancer
BMI >=30.0>45.1vs.30.1-35
60.9(0.52, 1.55)
0.95 A C D E F G
incidence
Kim,E.H.J.,2006,BRE80115
United States, Post-menopausalnurses' Health Study (NHS)Cohort 1976-2000
1607 medical records FFQProspectiveCohort
121701.0 20.0 years
Percentage energyfrom fat, subgroupanalysis by BMI in1980-2000
%
Invasive breast cancer
BMI<25.0>45.1vs.30.1-35
60.87(0.66, 1.16)
0.2 A C D E F G
incidence
Kim,E.H.J.,2006,BRE80115
United States, Post-menopausalnurses' Health Study (NHS)Cohort 1976-2000
3537 medical records FFQProspectiveCohort
121701.0 20.0 years Percentage energyfrom fat
%
Invasive breast cancer >50vs.30.1-35
81.01(0.74, 1.38)
0.11 A C D E F G
incidence
Kim,E.H.J.,2006,BRE80115
United States, Post-menopausalnurses' Health Study (NHS)Cohort 1976-2000
3537 medical records FFQProspectiveCohort
121701.0 20.0 years Percentage energyfrom total fat
%
Invasive breast cancer5.0(continuous)
10.98(0.95, 1.0)
A C D E F G
incidence
Kim,E.H.J.,2006,BRE80115
United States, Post-menopausalnurses' Health Study (NHS)Cohort 1976-2000
3537 medical records FFQProspectiveCohort
121701.0 20.0 years Percentage energyfrom animal fat
%
Invasive breast cancer5.0(continuous)
10.98(0.95, 1.01)
A C D E F G
incidence
Kim,E.H.J.,2006,BRE80115
United States, Post-menopausalnurses' Health Study (NHS)Cohort 1976-2000
3537 medical records FFQProspectiveCohort
121701.0 20.0 years Percentage energyfrom vegetable fat
%
Invasive breast cancer5.0(continuous)
10.99(0.95, 1.04)
A C D E F G
incidence
Kim,E.H.J.,2006,BRE80115
United States, Post-menopausalnurses' Health Study (NHS)Cohort 1976-2000
3537 medical records FFQProspectiveCohort
121701.0 20.0 yearsPercentage energyfrom monounsaturatedfat
%
Invasive breast cancer5.0(continuous)
10.94(0.88, 1.01)
A C D E F G
incidence
300

Author, Year,WCRF Code
Country, Ethnicity, Specialcharacteristics
Age Cases n Caseascertainment
Type of studyNon-Cases n
Lenght offollow-up / loss
Assessmentdetail
Additional details Unit Outcome Subgroup Contrast Nocat. OR (95% CI) p
valueptrend A B C D E F G
adjustments
Kim,E.H.J.,2006,BRE80115
United States, Post-menopausalnurses' Health Study (NHS)Cohort 1976-2000
3537 medical records FFQProspectiveCohort
121701.0 20.0 yearsPercentage energyfrom trans-unsaturatedfat
%
Invasive breast cancer1.0(continuous)
10.96(0.9, 1.03)
A C D E F G
incidence
Kim,E.H.J.,2006,BRE80115
United States, Post-menopausalnurses' Health Study (NHS)Cohort 1976-2000
3537 medical records FFQProspectiveCohort
121701.0 20.0 yearsPercentage energyfrom alpha-linolenicacid
%
Invasive breast cancer0.1(continuous)
11.0(0.99, 1.0)
A C D E F G
incidence
Kim,E.H.J.,2006,BRE80115
United States, Post-menopausalnurses' Health Study (NHS)Cohort 1976-2000
3537 medical records FFQProspectiveCohort
121701.0 20.0 years Cholesterol intakemg/1000Kcal
Invasive breast cancer100.0(continuous)
11.0(0.99, 1.0)
A C D E F G
incidence
Kim,E.H.J.,2006,BRE80115
United States, Post-menopausalnurses' Health Study (NHS)Cohort 1976-2000
497 medical records FFQProspectiveCohort
121701.0 20.0 yearsPercentage energyfrom premenopausalfat intake
%
Invasive breast cancer5.0(continuous)
11.03(0.96, 1.1)
A C D E F G
incidence
Kim,E.H.J.,2006,BRE80115
United States, Post-menopausalnurses' Health Study (NHS)Cohort 1976-2000
497 medical records FFQProspectiveCohort
121701.0 20.0 yearsPercentage energyfrom premenopausalvegetable fat intake
%
Invasive breast cancer5.0(continuous)
11.03(0.96, 1.1)
A C D E F G
incidence
Kim,E.H.J.,2006,BRE80115
United States, Post-menopausalnurses' Health Study (NHS)Cohort 1976-2000
497 medical records FFQProspectiveCohort
121701.0 20.0 yearsPercentage energyfrom premenopausalanimal fat intake
%
Invasive breast cancer5.0(continuous)
11.0(0.94, 1.07)
A C D E F G
incidence
Kim,E.H.J.,2006,BRE80115
United States, Post-menopausalnurses' Health Study (NHS)Cohort 1976-2000
497 medical records FFQProspectiveCohort
121701.0 20.0 years
Percentage energyfrom premenopausalmonounsaturated fatintake
%
Invasive breast cancer5.0(continuous)
11.04(0.97, 1.11)
A C D E F G
incidence
Kim,E.H.J.,2006,BRE80115
United States, Post-menopausalnurses' Health Study (NHS)Cohort 1976-2000
497 medical records FFQProspectiveCohort
121701.0 20.0 years
Percentage energyfrom premenopausaltrans-unsaturated fatintake
%
Invasive breast cancer1.0(continuous)
11.08(1.01, 1.15)
A C D E F G
incidence
Kim,E.H.J.,2006,BRE80115
United States, Post-menopausalnurses' Health Study (NHS)Cohort 1976-2000
497 medical records FFQProspectiveCohort
121701.0 20.0 years
Percentage energyfrom premenopausalalpha-linolenic acidintake
%
Invasive breast cancer0.1(continuous)
10.99(0.93, 1.06)
A C D E F G
incidence
Kim,E.H.J.,2006,BRE80115
United States, Post-menopausalnurses' Health Study (NHS)Cohort 1976-2000
497 medical records FFQProspectiveCohort
121701.0 20.0 years Premenopausalcholesterol intake
mg/1000Kcal
Invasive breast cancer100.0(continuous)
11.0(0.93, 1.07)
A C D E F G
incidence
Thiébaut etal.,2007,BRE80012
USA, Post-menopausalNIH- AARP Diet and HealthStudy
50 - 71 3501 Cancer registry24h Recall +FFQ
ProspectiveCohort
188736.0 4.4 years
Percent energy frommonounsaturated fatintake, density model,fat and energy intakes
%energy
Invasive breast cancer 15.2vs.7.2
51.12(1.0, 1.24)
0.028
C D E F G
incidence
Thiébaut etal.,2007,BRE80012
USA, Post-menopausalNIH- AARP Diet and HealthStudy
50 - 71 3501 Cancer registry24h Recall +FFQ
ProspectiveCohort
188736.0 4.4 years
Percent energy fromtotal fat, standardmodel(log- transformedtotal fat intake and log-
%energy
Invasive breast cancer 90.5vs.24.2
51.22(1.03, 1.45)
0.013
C D E F G
incidence
Thiébaut etal.,2007,BRE80012
USA, Post-menopausalNIH- AARP Diet and HealthStudy
50 - 71 3501 Cancer registry24h Recall +FFQ
ProspectiveCohort
188736.0 4.4 years
Percent energy fromtotal fat, standardmodel, twofoldincrease in fat intake
%
Invasive breast cancer20.0(continuous)
11.15(1.05, 1.26)
C D E F G
incidence
301
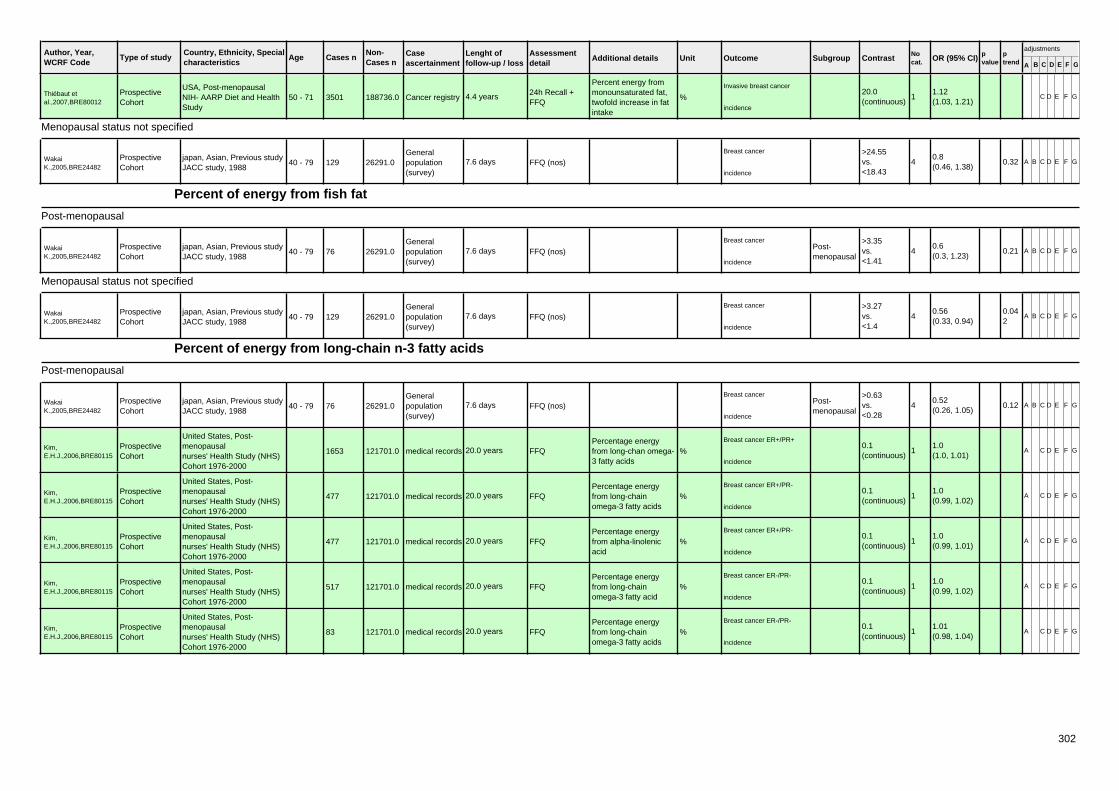
Author, Year,WCRF Code
Country, Ethnicity, Specialcharacteristics
Age Cases n Caseascertainment
Type of studyNon-Cases n
Lenght offollow-up / loss
Assessmentdetail
Additional details Unit Outcome Subgroup Contrast Nocat. OR (95% CI) p
valueptrend A B C D E F G
adjustments
Thiébaut etal.,2007,BRE80012
USA, Post-menopausalNIH- AARP Diet and HealthStudy
50 - 71 3501 Cancer registry24h Recall +FFQ
ProspectiveCohort
188736.0 4.4 years
Percent energy frommonounsaturated fat,twofold increase in fatintake
%
Invasive breast cancer20.0(continuous)
11.12(1.03, 1.21)
C D E F G
incidence
Menopausal status not specified
WakaiK.,2005,BRE24482
japan, Asian, Previous studyJACC study, 1988
40 - 79 129Generalpopulation(survey)
FFQ (nos)ProspectiveCohort
26291.0 7.6 daysBreast cancer >24.55
vs.<18.43
40.8(0.46, 1.38)
0.32 A B C D E F G
incidence
Percent of energy from fish fat
Post-menopausal
WakaiK.,2005,BRE24482
japan, Asian, Previous studyJACC study, 1988
40 - 79 76Generalpopulation(survey)
FFQ (nos)ProspectiveCohort
26291.0 7.6 daysBreast cancer
Post-menopausal
>3.35vs.<1.41
40.6(0.3, 1.23)
0.21 A B C D E F G
incidence
Menopausal status not specified
WakaiK.,2005,BRE24482
japan, Asian, Previous studyJACC study, 1988
40 - 79 129Generalpopulation(survey)
FFQ (nos)ProspectiveCohort
26291.0 7.6 daysBreast cancer >3.27
vs.<1.4
40.56(0.33, 0.94)
0.042
A B C D E F G
incidence
Percent of energy from long-chain n-3 fatty acids
Post-menopausal
WakaiK.,2005,BRE24482
japan, Asian, Previous studyJACC study, 1988
40 - 79 76Generalpopulation(survey)
FFQ (nos)ProspectiveCohort
26291.0 7.6 daysBreast cancer
Post-menopausal
>0.63vs.<0.28
40.52(0.26, 1.05)
0.12 A B C D E F G
incidence
Kim,E.H.J.,2006,BRE80115
United States, Post-menopausalnurses' Health Study (NHS)Cohort 1976-2000
1653 medical records FFQProspectiveCohort
121701.0 20.0 yearsPercentage energyfrom long-chan omega-3 fatty acids
%
Breast cancer ER+/PR+0.1(continuous)
11.0(1.0, 1.01)
A C D E F G
incidence
Kim,E.H.J.,2006,BRE80115
United States, Post-menopausalnurses' Health Study (NHS)Cohort 1976-2000
477 medical records FFQProspectiveCohort
121701.0 20.0 yearsPercentage energyfrom long-chainomega-3 fatty acids
%
Breast cancer ER+/PR-0.1(continuous)
11.0(0.99, 1.02)
A C D E F G
incidence
Kim,E.H.J.,2006,BRE80115
United States, Post-menopausalnurses' Health Study (NHS)Cohort 1976-2000
477 medical records FFQProspectiveCohort
121701.0 20.0 yearsPercentage energyfrom alpha-linolenicacid
%
Breast cancer ER+/PR-0.1(continuous)
11.0(0.99, 1.01)
A C D E F G
incidence
Kim,E.H.J.,2006,BRE80115
United States, Post-menopausalnurses' Health Study (NHS)Cohort 1976-2000
517 medical records FFQProspectiveCohort
121701.0 20.0 yearsPercentage energyfrom long-chainomega-3 fatty acid
%
Breast cancer ER-/PR-0.1(continuous)
11.0(0.99, 1.02)
A C D E F G
incidence
Kim,E.H.J.,2006,BRE80115
United States, Post-menopausalnurses' Health Study (NHS)Cohort 1976-2000
83 medical records FFQProspectiveCohort
121701.0 20.0 yearsPercentage energyfrom long-chainomega-3 fatty acids
%
Breast cancer ER-/PR-0.1(continuous)
11.01(0.98, 1.04)
A C D E F G
incidence
302

Author, Year,WCRF Code
Country, Ethnicity, Specialcharacteristics
Age Cases n Caseascertainment
Type of studyNon-Cases n
Lenght offollow-up / loss
Assessmentdetail
Additional details Unit Outcome Subgroup Contrast Nocat. OR (95% CI) p
valueptrend A B C D E F G
adjustments
Kim,E.H.J.,2006,BRE80115
United States, Post-menopausalnurses' Health Study (NHS)Cohort 1976-2000
3537 medical records FFQProspectiveCohort
121701.0 20.0 yearsPercentage energyfrom long-chainomega-3 fatty acids
%
Invasive breast cancer0.1(continuous)
11.0(1.0, 1.01)
A C D E F G
incidence
Kim,E.H.J.,2006,BRE80115
United States, Post-menopausalnurses' Health Study (NHS)Cohort 1976-2000
497 medical records FFQProspectiveCohort
121701.0 20.0 years
Percentage energyfrom premenopausallong-chain omega-3fatty acids intake
%
Invasive breast cancer0.1(continuous)
10.95(0.89, 1.02)
A C D E F G
incidence
Menopausal status not specified
WakaiK.,2005,BRE24482
japan, Asian, Previous studyJACC study, 1988
40 - 79 129Generalpopulation(survey)
FFQ (nos)ProspectiveCohort
26291.0 7.6 daysBreast cancer >0.61
vs.<0.28
40.5(0.3, 0.85)
0.024
A B C D E F G
incidence
Percent of energy from n3/n6 ratio
Post-menopausal
WakaiK.,2005,BRE24482
japan, Asian, Previous studyJACC study, 1988
40 - 79 76Generalpopulation(survey)
FFQ (nos)ProspectiveCohort
26291.0 7.6 daysBreast cancer
Post-menopausal
>4.59vs.<3.2
41.3(0.66, 2.58)
0.28 A B C D E F G
incidence
Menopausal status not specified
WakaiK.,2005,BRE24482
japan, Asian, Previous studyJACC study, 1988
40 - 79 129Generalpopulation(survey)
FFQ (nos)ProspectiveCohort
26291.0 7.6 daysBreast cancer >4.61
vs.<3.24
41.31(0.78, 2.19)
0.13 A B C D E F G
incidence
Percent of energy from polyunsaturated fat
Post-menopausal
Kim,E.H.J.,2006,BRE80115
United States, Post-menopausalnurses' Health Study (NHS)Cohort 1976-2000
1653 medical records FFQProspectiveCohort
121701.0 20.0 yearsPercentage energyfrom polyunsaturatedfat
%
Breast cancer ER+/PR+5.0(continuous)
10.95(0.77, 1.16)
A C D E F G
incidence
Kim,E.H.J.,2006,BRE80115
United States, Post-menopausalnurses' Health Study (NHS)Cohort 1976-2000
477 medical records FFQProspectiveCohort
121701.0 20.0 yearsPercentage energyfrom polyunsaturatedfat
%
Breast cancer ER+/PR-5.0(continuous)
11.02(0.7, 1.47)
A C D E F G
incidence
Kim,E.H.J.,2006,BRE80115
United States, Post-menopausalnurses' Health Study (NHS)Cohort 1976-2000
517 medical records FFQProspectiveCohort
121701.0 20.0 yearsPercentage energyfrom polyunsaturatedfat
%
Breast cancer ER-/PR-5.0(continuous)
10.89(0.62, 1.28)
A C D E F G
incidence
Kim,E.H.J.,2006,BRE80115
United States, Post-menopausalnurses' Health Study (NHS)Cohort 1976-2000
83 medical records FFQProspectiveCohort
121701.0 20.0 yearsPercentage energyfrom polyunsaturatedfat
%
Breast cancer ER-/PR-5.0(continuous)
10.93(0.38, 2.23)
A C D E F G
incidence
Kim,E.H.J.,2006,BRE80115
United States, Post-menopausalnurses' Health Study (NHS)Cohort 1976-2000
3537 medical records FFQProspectiveCohort
121701.0 20.0 yearsPercentage energyfrom polyunsaturatedfat
%
Invasive breast cancer5.0(continuous)
10.94(0.82, 1.08)
A C D E F G
incidence
303

Author, Year,WCRF Code
Country, Ethnicity, Specialcharacteristics
Age Cases n Caseascertainment
Type of studyNon-Cases n
Lenght offollow-up / loss
Assessmentdetail
Additional details Unit Outcome Subgroup Contrast Nocat. OR (95% CI) p
valueptrend A B C D E F G
adjustments
Kim,E.H.J.,2006,BRE80115
United States, Post-menopausalnurses' Health Study (NHS)Cohort 1976-2000
497 medical records FFQProspectiveCohort
121701.0 20.0 years
Percentage energyfrom premenopausalpolyunsaturated fatintake
%
Invasive breast cancer5.0(continuous)
11.03(0.96, 1.09)
A C D E F G
incidence
Thiébaut etal.,2007,BRE80012
USA, Post-menopausalNIH- AARP Diet and HealthStudy
50 - 71 3501 Cancer registry24h Recall +FFQ
ProspectiveCohort
188736.0 4.4 years
Percent energy frompolyunsaturated fatintake, density model,fat and energy intakes
%energy
Invasive breast cancer 10.3vs.4.5
51.12(1.01, 1.25)
0.04 C D E F G
incidence
Thiébaut etal.,2007,BRE80012
USA, Post-menopausalNIH- AARP Diet and HealthStudy
50 - 71 3501 Cancer registry24h Recall +FFQ
ProspectiveCohort
188736.0 4.4 years
Percent energy frompolyunsaturated fat,twofold increase in fatintake
%
Invasive breast cancer20.0(continuous)
11.1(1.01, 1.2)
C D E F G
incidence
Percent of energy from saturated fat
Post-menopausal
Kim,E.H.J.,2006,BRE80115
United States, Post-menopausalnurses' Health Study (NHS)Cohort 1976-2000
1653 medical records FFQProspectiveCohort
121701.0 20.0 years Percentage energyfrom saturated fat
%
Breast cancer ER+/PR+5.0(continuous)
10.94(0.85, 1.04)
A C D E F G
incidence
Kim,E.H.J.,2006,BRE80115
United States, Post-menopausalnurses' Health Study (NHS)Cohort 1976-2000
477 medical records FFQProspectiveCohort
121701.0 20.0 years Percentage energyfrom saturated fat
%
Breast cancer ER+/PR-5.0(continuous)
10.95(0.79, 1.14)
A C D E F G
incidence
Kim,E.H.J.,2006,BRE80115
United States, Post-menopausalnurses' Health Study (NHS)Cohort 1976-2000
517 medical records FFQProspectiveCohort
121701.0 20.0 years Percentage energyfrom saturated fat
%
Breast cancer ER-/PR-5.0(continuous)
10.93(0.78, 1.11)
A C D E F G
incidence
Kim,E.H.J.,2006,BRE80115
United States, Post-menopausalnurses' Health Study (NHS)Cohort 1976-2000
83 medical records FFQProspectiveCohort
121701.0 20.0 years Percentage energyfrom saturated fat
%
Breast cancer ER-/PR-5.0(continuous)
10.89(0.57, 1.41)
A C D E F G
incidence
Kim,E.H.J.,2006,BRE80115
United States, Post-menopausalnurses' Health Study (NHS)Cohort 1976-2000
3537 medical records FFQProspectiveCohort
121701.0 20.0 years Percentage energyfrom saturated fat
%
Invasive breast cancer5.0(continuous)
10.93(0.87, 1.0)
A C D E F G
incidence
Kim,E.H.J.,2006,BRE80115
United States, Post-menopausalnurses' Health Study (NHS)Cohort 1976-2000
497 medical records FFQProspectiveCohort
121701.0 20.0 yearsPercentage energyfrom premenopausalsaturated fat intake
%
Invasive breast cancer5.0(continuous)
11.02(0.95, 1.09)
A C D E F G
incidence
Thiébaut etal.,2007,BRE80012
USA, Post-menopausalNIH- AARP Diet and HealthStudy
50 - 71 3501 Cancer registry24h Recall +FFQ
ProspectiveCohort
188736.0 4.4 years
Percent energy fromsaturated fat intake,density model, fat andenergy intakes were
%energy
Invasive breast cancer 13.2vs.5.8
51.18(1.06, 1.31)
0.004
C D E F G
incidence
Thiébaut etal.,2007,BRE80012
USA, Post-menopausalNIH- AARP Diet and HealthStudy
50 - 71 3529 Cancer registry24h Recall +FFQ
ProspectiveCohort
188736.0 4.4 yearsPercent energy fromsaturated fat, twofoldincrease in fat intake
%
Invasive breast cancer20.0(continuous)
11.13(1.05, 1.22)
C D E F G
incidence
7.1.0.2
Energy from protein
304

Author, Year,WCRF Code
Country, Ethnicity, Specialcharacteristics
Age Cases n Caseascertainment
Type of studyNon-Cases n
Lenght offollow-up / loss
Assessmentdetail
Additional details Unit Outcome Subgroup Contrast Nocat. OR (95% CI) p
valueptrend A B C D E F G
adjustments
Post-menopausal
Velie,E.,2000,BRE12851
US, Not specified, ScreeningProgramBCDDP, 1973
996
Through healthorg. (screening,healthinsurance)
FFQ (nos)ProspectiveCohort
40022 5.3 years / 4674 %/day
Breast cancerPost-menopausal
Quantile 5vs.Quantile 1
50.91(0.74, 1.13)
.28 B C D E F G
incidence
Wirfalt,E.,2004,BRE17083
Sweden, Not specified, Post-menopausalMalmo Diet and Cancer,1991
50 - By Mail7-day Record +Questionnaire
Nested CaseControl
12803.0 8.0 yearsBreast cancer
Post-menopausal
1null(null, null)
incidence
Percent of energy from available carbohydrate
Menopausal status not specified
Sieri, S. etal.,2007,BRE80142
ItalyORDET study, 1987
34 - 70 289 Cancer registrysemi-quantitative ffq
ProspectiveCohort
8926.011.5 years /0.004
Percent of energy fromtotal carbohydrates
%
Invasive & In situ breastcancer 5.0
(continuous)1
1.25(0.94, 1.66)
B C D E F G
incidence
Sieri, S. etal.,2007,BRE80142
ItalyORDET study, 1987
34 - 70 289 Cancer registrysemi-quantitative ffq
ProspectiveCohort
8926.011.5 years /0.004
Percent of energy fromcarbohydrates fromhigh-GI foods
%
Invasive & In situ breastcancer 5.0
(continuous)1
1.55(1.07, 2.26)
B C D E F G
incidence
Sieri, S. etal.,2007,BRE80142
ItalyORDET study, 1987
34 - 70 289 Cancer registrysemi-quantitative ffq
ProspectiveCohort
8926.011.5 years /0.004
Percent of energy fromcarbohydrates fromlow-GI foods
%
Invasive & In situ breastcancer 5.0
(continuous)1
0.86(0.55, 1.34)
B C D E F G
incidence
7.1.0.3
Energy from carbohydrates
Pre-menopausal
Cho, E.,2003,BRE01651
U.S, Multi-ethnic, RegisterednursesNurses' Health study II
26 - 46 714 By MailFFQ-Semi-quantitative
ProspectiveCohort
90655 8.0 years % of totalenergy/day
Breast cancerPre-menopausal
59.4vs.41.2
50.89(0.63, 1.26)
0.42 C D E F G
incidence
Cho, E.,2003,BRE01651
U.S, Multi-ethnic, RegisterednursesNurses' Health study II
26 - 46 422 By MailFFQ-Semi-quantitative
ProspectiveCohort
424644 8.0 years % of totalenergy/day
Breast cancer Pre-menopausal& Lean
Quantile 5vs.Quantile 1
50.62(0.4, 0.97)
0.02 C D E F G
incidence
Cho, E.,2003,BRE01651
U.S, Multi-ethnic, RegisterednursesNurses' Health study II
26 - 46 291 By MailFFQ-Semi-quantitative
ProspectiveCohort
285780 8.0 years % of totalenergy/day
Breast cancer Pre-menopausal&Overweight
Quantile 5vs.Quantile 1
51.47(0.84, 2.59)
0.14 C D E F G
incidence
Post-menopausal
Velie,E.,2000,BRE12851
US, Not specified, ScreeningProgramBCDDP, 1973
996
Through healthorg. (screening,healthinsurance)
FFQ (nos)ProspectiveCohort
40022 5.3 years / 4674 %/day
Breast cancerPost-menopausal
Quantile 5vs.Quantile 1
50.91(0.73, 1.12)
0.53 B C D E F G
incidence
Wirfalt,E.,2004,BRE17083
Sweden, Not specified, Post-menopausalMalmo Diet and Cancer,1991
50 - By Mail7-day Record +Questionnaire
Nested CaseControl
12803.0 8.0 yearsBreast cancer
Post-menopausal
1null(null, null)
incidence
305

Author, Year,WCRF Code
Country, Ethnicity, Specialcharacteristics
Age Cases n Caseascertainment
Type of studyNon-Cases n
Lenght offollow-up / loss
Assessmentdetail
Additional details Unit Outcome Subgroup Contrast Nocat. OR (95% CI) p
valueptrend A B C D E F G
adjustments
7.1.0.5
Energy from vegetables
Pre-menopausal
Cho, E.,2003,BRE17370
US, Multi-ethnic, Pre-menopausalNHS II, 1989
25 - 42 388 By MailFFQ-Semi-quantitative
ProspectiveCohort
90655.0 8.0 years % of totalenergy
Breast cancer ER+Pre-menopausal
5.0(continuous)
11.02(0.88, 1.18)
A C D E F G
incidence
Cho, E.,2003,BRE17370
US, Multi-ethnic, Pre-menopausalNHS II, 1989
25 - 42 323 By MailFFQ-Semi-quantitative
ProspectiveCohort
90655.0 8.0 years % of totalenergy
Breast cancer ER+/PR+Pre-menopausal
5.0(continuous)
11.06(0.9, 1.24)
A C D E F G
incidence
Cho, E.,2003,BRE17370
US, Multi-ethnic, Pre-menopausalNHS II, 1989
25 - 42 182 By MailFFQ-Semi-quantitative
ProspectiveCohort
90655.0 8.0 years % of totalenergy
Breast cancer ER-Pre-menopausal
5.0(continuous)
10.92(0.75, 1.14)
A C D E F G
incidence
Cho, E.,2003,BRE17370
US, Multi-ethnic, Pre-menopausalNHS II, 1989
25 - 42 134 By MailFFQ-Semi-quantitative
ProspectiveCohort
90655.0 8.0 years % of totalenergy
Breast cancer ER-/PR-Pre-menopausal
5.0(continuous)
10.88(0.69, 1.14)
A C D E F G
incidence
Cho, E.,2003,BRE17370
US, Multi-ethnic, Pre-menopausalNHS II, 1989
25 - 42 364 By MailFFQ-Semi-quantitative
ProspectiveCohort
90655.0 8.0 years % of totalenergy
Breast cancer PR+Pre-menopausal
5.0(continuous)
11.08(0.93, 1.25)
A C D E F G
incidence
Cho, E.,2003,BRE17370
US, Multi-ethnic, Pre-menopausalNHS II, 1989
25 - 42 194 By MailFFQ-Semi-quantitative
ProspectiveCohort
90655.0 8.0 years % of totalenergy
Breast cancer PR-Pre-menopausal
5.0(continuous)
10.86(0.7, 1.06)
A C D E F G
incidence
Cho, E.,2003,BRE17370
US, Multi-ethnic, Pre-menopausalNHS II, 1989
25 - 42 714 By MailFFQ-Semi-quantitative
ProspectiveCohort
90655 8.0 years vegetable fat %/day
Invasive breast cancerPre-menopausal
19.0vs.9.0
51.0(0.78, 1.28)
.56 A C D E F G
incidence
Cho, E.,2003,BRE17370
US, Multi-ethnic, Pre-menopausalNHS II, 1989
25 - 42 714 By MailFFQ-Semi-quantitative
ProspectiveCohort
90655 8.0 years % of totalenergy
Invasive breast cancerPre-menopausal
5.0(continuous)
11.01(0.9, 1.12)
A C D E F G
incidence
7.1.1
Energy density of diet
Menopausal status not specified
Fraser, G.E.,1997,BRE02940
USA, White, AdventistAHS, 1974
24 -
Through socialorganization(profession,religion)
ProspectiveCohort
20341.0 6.0 years / 610 g/day
Invasive breast cancer >73.5vs.<=73.5
21.09(0.81, 1.45)
incidence
Energy from animal fat
Pre-menopausal
306

Author, Year,WCRF Code
Country, Ethnicity, Specialcharacteristics
Age Cases n Caseascertainment
Type of studyNon-Cases n
Lenght offollow-up / loss
Assessmentdetail
Additional details Unit Outcome Subgroup Contrast Nocat. OR (95% CI) p
valueptrend A B C D E F G
adjustments
Holmes, M.D.,1999,BRE04008
US, Multi-ethnic, RegisterednursesNurses' Health Study (NHS)Cohort 1976-1996
30 - 55 By MailFFQ-Semi-quantitative
ProspectiveCohort
121700.0 14.0 years % of totalenergy/day
Invasive breast cancerPre-menopausal
5.0(continuous)
11.01(0.96, 1.06)
A C D E F G
incidence
Cho, E.,2003,BRE17370
US, Multi-ethnic, Pre-menopausalNHS II, 1989
25 - 42 388 By MailFFQ-Semi-quantitative
ProspectiveCohort
90655.0 8.0 years % of totalenergy
Breast cancer ER+Pre-menopausal
5.0(continuous)
11.2(1.07, 1.35)
A C D E F G
incidence
Cho, E.,2003,BRE17370
US, Multi-ethnic, Pre-menopausalNHS II, 1989
25 - 42 323 By MailFFQ-Semi-quantitative
ProspectiveCohort
90655.0 8.0 years % of totalenergy
Breast cancer ER+/PR+Pre-menopausal
5.0(continuous)
11.18(1.04, 1.35)
A C D E F G
incidence
Cho, E.,2003,BRE17370
US, Multi-ethnic, Pre-menopausalNHS II, 1989
25 - 42 182 By MailFFQ-Semi-quantitative
ProspectiveCohort
90655.0 8.0 years % of totalenergy
Breast cancer ER-Pre-menopausal
5.0(continuous)
11.08(0.9, 1.28)
A C D E F G
incidence
Cho, E.,2003,BRE17370
US, Multi-ethnic, Pre-menopausalNHS II, 1989
25 - 42 134 By MailFFQ-Semi-quantitative
ProspectiveCohort
90655.0 8.0 years % of totalenergy
Breast cancer ER-/PR-Pre-menopausal
5.0(continuous)
11.04(0.85, 1.28)
A C D E F G
incidence
Cho, E.,2003,BRE17370
US, Multi-ethnic, Pre-menopausalNHS II, 1989
25 - 42 364 By MailFFQ-Semi-quantitative
ProspectiveCohort
90655.0 8.0 years % of totalenergy
Breast cancer PR+Pre-menopausal
5.0(continuous)
11.17(1.03, 1.32)
A C D E F G
incidence
Cho, E.,2003,BRE17370
US, Multi-ethnic, Pre-menopausalNHS II, 1989
25 - 42 194 By MailFFQ-Semi-quantitative
ProspectiveCohort
90655.0 8.0 years % of totalenergy
Breast cancer PR-Pre-menopausal
5.0(continuous)
11.11(0.94, 1.32)
A C D E F G
incidence
Cho, E.,2003,BRE17370
US, Multi-ethnic, Pre-menopausalNHS II, 1989
25 - 42 576 By MailFFQ-Semi-quantitative
ProspectiveCohort
90655.0 8.0 years %
Invasive breast cancer FamilyHistory BC -No & Pre-menopausal
5.0(continuous)
11.09(0.98, 1.2)
A C D E F G
incidence
Cho, E.,2003,BRE17370
US, Multi-ethnic, Pre-menopausalNHS II, 1989
25 - 42 138 By MailFFQ-Semi-quantitative
ProspectiveCohort
90655.0 8.0 years %
Invasive breast cancer FamilyHistory BC -Yes & Pre-menopausal
5.0(continuous)
11.28(1.04, 1.58)
A C D E F G
incidence
Cho, E.,2003,BRE17370
US, Multi-ethnic, Pre-menopausalNHS II, 1989
25 - 42 422 By MailFFQ-Semi-quantitative
ProspectiveCohort
90655.0 8.0 years %
Invasive breast cancer
Lean5.0(continuous)
11.17(1.04, 1.31)
A C D E F G
incidence
Cho, E.,2003,BRE17370
US, Multi-ethnic, Pre-menopausalNHS II, 1989
25 - 42 291 By MailFFQ-Semi-quantitative
ProspectiveCohort
90655.0 8.0 years %
Invasive breast cancer
Overweight5.0(continuous)
11.06(0.92, 1.22)
A C D E F G
incidence
Cho, E.,2003,BRE17370
US, Multi-ethnic, Pre-menopausalNHS II, 1989
25 - 42 714 By MailFFQ-Semi-quantitative
ProspectiveCohort
90655 8.0 years %/day
Invasive breast cancerPre-menopausal
23.0vs.12.0
51.32(1.01, 1.71)
.002 A C D E F G
incidence
Cho, E.,2003,BRE17370
US, Multi-ethnic, Pre-menopausalNHS II, 1989
25 - 42 714 By MailFFQ-Semi-quantitative
ProspectiveCohort
90655 8.0 years % of totalenergy
Invasive breast cancerPre-menopausal
5.0(continuous)
11.12(1.03, 1.22)
A C D E F G
incidence
307

Author, Year,WCRF Code
Country, Ethnicity, Specialcharacteristics
Age Cases n Caseascertainment
Type of studyNon-Cases n
Lenght offollow-up / loss
Assessmentdetail
Additional details Unit Outcome Subgroup Contrast Nocat. OR (95% CI) p
valueptrend A B C D E F G
adjustments
Post-menopausal
Holmes, M.D.,1999,BRE04008
US, Multi-ethnic, RegisterednursesNurses' Health Study (NHS)Cohort 1976-1996
30 - 55 By MailFFQ-Semi-quantitative
ProspectiveCohort
121700.0 14.0 years % of totalenergy/day
Invasive breast cancerPost-menopausal
5.0(continuous)
10.98(0.94, 1.02)
A C D E F G
incidence
WakaiK.,2005,BRE24482
japan, Asian, Previous studyJACC study, 1988
40 - 79 76Generalpopulation(survey)
FFQ (nos)ProspectiveCohort
26291.0 7.6 days percent of energy fromanimal fat
Breast cancerPost-menopausal
>11.55vs.<7.25
40.85(0.44, 1.67)
0.74 A B C D E F G
incidence
Menopausal status not specified
Mills, P.K.,1989,BRE17837
USA, White, AdventistCalifornia Seventh-dayAdventists Cohort, 1976
25 - 99 193 By Mail FFQ (nos)ProspectiveCohort
101810 6.0 years / 1%Breast cancer >1.0
vs.>-1.0
41.21(0.81, 1.81)
0.29 A B C D F G
incidence
Holmes, M.D.,1999,BRE04008
US, Multi-ethnic, RegisterednursesNurses' Health Study (NHS)Cohort 1976-1996
30 - 55 By MailFFQ-Semi-quantitative
ProspectiveCohort
121700.0 14.0 years % of totalenergy/day
Invasive breast cancer5.0(continuous)
10.98(0.96, 1.01)
A C D E F G
incidence
Holmes, M.D.,1999,BRE04008
US, Multi-ethnic, RegisterednursesNurses' Health Study (NHS)Cohort 1976-1996
30 - 55 By MailFFQ-Semi-quantitative
ProspectiveCohort
121700.0 14.0 years % of totalenergy/day
Invasive breast cancer5.0(continuous)
10.96(0.93, 1.0)
A C D E F G
incidence
Energy from fat
Pre-menopausal
Holmes, M.D.,1999,BRE04008
US, Multi-ethnic, RegisterednursesNurses' Health Study (NHS)Cohort 1976-1996
30 - 55 784 By MailFFQ-Semi-quantitative
ProspectiveCohort
437613 14.0 years %
Invasive breast cancerPre-menopausal
>50vs.30.1-35
81.03(0.7, 1.51)
0.77 A C D E F G
incidence
Holmes, M.D.,1999,BRE04008
US, Multi-ethnic, RegisterednursesNurses' Health Study (NHS)Cohort 1976-1996
30 - 55 By MailFFQ-Semi-quantitative
ProspectiveCohort
121700.0 14.0 years % of totalenergy/day
Invasive breast cancerPre-menopausal
5.0(continuous)
10.99(0.93, 1.05)
A C D E F G
incidence
Holmes, M.D.,1999,BRE04008
US, Multi-ethnic, RegisterednursesNurses' Health Study (NHS)Cohort 1976-1996
30 - 55 By MailFFQ-Semi-quantitative
ProspectiveCohort
121700.0 14.0 years % of totalenergy/day
Invasive breast cancerPre-menopausal
5.0(continuous)
10.99(0.91, 1.07)
A C D E F G
incidence
Cho, E.,2003,BRE17370
US, Multi-ethnic, Pre-menopausalNHS II, 1989
25 - 42 714 By MailFFQ-Semi-quantitative
ProspectiveCohort
90655 8.0 years %/day
Invasive breast cancerPre-menopausal
38.0vs.24.0
51.25(0.98, 1.59)
.06 A C D E F G
incidence
Post-menopausal
Holmes, M.D.,1999,BRE04008
US, Multi-ethnic, RegisterednursesNurses' Health Study (NHS)Cohort 1976-1996
30 - 55 1913 By MailFFQ-Semi-quantitative
ProspectiveCohort
620329 14.0 years %
Invasive breast cancerPost-menopausal
>50vs.30.1-35
81.01(0.72, 1.41)
0.06 A C D E F G
incidence
Holmes, M.D.,1999,BRE04008
US, Multi-ethnic, RegisterednursesNurses' Health Study (NHS)Cohort 1976-1996
30 - 55 By MailFFQ-Semi-quantitative
ProspectiveCohort
121700.0 14.0 years % of totalenergy/day
Invasive breast cancerPost-menopausal
5.0(continuous)
10.96(0.93, 1.0)
A C D E F G
incidence
308

Author, Year,WCRF Code
Country, Ethnicity, Specialcharacteristics
Age Cases n Caseascertainment
Type of studyNon-Cases n
Lenght offollow-up / loss
Assessmentdetail
Additional details Unit Outcome Subgroup Contrast Nocat. OR (95% CI) p
valueptrend A B C D E F G
adjustments
Holmes, M.D.,1999,BRE04008
US, Multi-ethnic, RegisterednursesNurses' Health Study (NHS)Cohort 1976-1996
30 - 55 By MailFFQ-Semi-quantitative
ProspectiveCohort
121700.0 14.0 years t% of totalenergy/day
Invasive breast cancerPost-menopausal
5.0(continuous)
10.96(0.91, 1.02)
A C D E F G
incidence
Velie,E.,2000,BRE12851
US, Not specified, ScreeningProgramBCDDP, 1973
996
Through healthorg. (screening,healthinsurance)
FFQ (nos)ProspectiveCohort
40022 5.3 years / 4674 %/day
Breast cancerPost-menopausal
Quantile 5vs.Quantile 1
51.07(0.86, 1.32)
.51 B C D E F G
incidence
Wirfalt,E.,2004,BRE17083
Sweden, Not specified, Post-menopausalMalmo Diet and Cancer,1991
50 - By Mail7-day Record +Questionnaire
Nested CaseControl
12803.0 8.0 yearsBreast cancer
Post-menopausal
1null(null, null)
incidence
WakaiK.,2005,BRE24482
japan, Asian, Previous studyJACC study, 1988
40 - 79 76Generalpopulation(survey)
FFQ (nos)ProspectiveCohort
26291.0 7.6 days percent of energy fromvegetable fat
Breast cancerPost-menopausal
>10.95vs.<7.85
42.08(1.05, 4.13)
0.043
A B C D E F G
incidence
Menopausal status not specified
Jones, D.Y.,1987,BRE04461
US, Multi-ethnicNHANES I, 1971
25 - 74 86Generalpopulation(survey)
24h RecallProspectiveCohort
4912 10.0 years / 776 %/day
Breast cancer >42.0vs.<29.9
40.66(0.33, 1.31)
0.06 A B C D F
incidence
Byrne,C.,1996,BRE05719
USA, Black and WhiteNHEFS, 1981/82
25 - 74 52 Unspecified FFQ (nos)ProspectiveCohort
23840 3.9 years / 252 % of totalenergy
Breast cancer >36.6vs.<29.4
40.98(0.5, 2.1)
A
incidence
Holmes, M.D.,1999,BRE04008
US, Multi-ethnic, RegisterednursesNurses' Health Study (NHS)Cohort 1976-1996
30 - 55 2956 By MailFFQ-Semi-quantitative
ProspectiveCohort
1172027 14.0 yearsInvasive breast cancer >50
vs.30.1-35
80.96(0.76, 1.23)
0.03 A C D E F G
incidence
Holmes, M.D.,1999,BRE04008
US, Multi-ethnic, RegisterednursesNurses' Health Study (NHS)Cohort 1976-1996
30 - 55 By MailFFQ-Semi-quantitative
ProspectiveCohort
121700.0 14.0 years % of totalenergy/day
Invasive breast cancer5.0(continuous)
10.97(0.94, 1.0)
A C D E F G
incidence
Holmes, M.D.,1999,BRE04008
US, Multi-ethnic, RegisterednursesNurses' Health Study (NHS)Cohort 1976-1996
30 - 55 By MailFFQ-Semi-quantitative
ProspectiveCohort
121700.0 14.0 years % of totalenergy/day
Invasive breast cancer5.0(continuous)
10.97(0.93, 1.02)
A C D E F G
incidence
Holmes, M.D.,1999,BRE04008
US, Multi-ethnic, RegisterednursesNurses' Health Study (NHS)Cohort 1976-1996
30 - 55 By MailFFQ-Semi-quantitative
ProspectiveCohort
121700.0 14.0 years % of totalenergy/day
Invasive breast cancer5.0(continuous)
10.96(0.93, 0.99)
A C D E F G
incidence
Holmes, M.D.,1999,BRE04008
US, Multi-ethnic, RegisterednursesNurses' Health Study (NHS)Cohort 1976-1996
30 - 55 By MailFFQ-Semi-quantitative
ProspectiveCohort
121700.0 14.0 years % of totalenergy/day
Invasive breast cancer5.0(continuous)
10.95(0.91, 1.0)
A C D E F G
incidence
Gago-Dominguez,M.,2003,BRE17518
China, AsianThe Singapore ChineseHealth Study, 1993
45 - 74 314Direct contactat home
FFQ (nos)ProspectiveCohort
63257.0 5.3 years %/day
Breast cancer 27.4vs.23.5
40.94(0.68, 1.31)
0.95 A B C E F G
incidence
309

Author, Year,WCRF Code
Country, Ethnicity, Specialcharacteristics
Age Cases n Caseascertainment
Type of studyNon-Cases n
Lenght offollow-up / loss
Assessmentdetail
Additional details Unit Outcome Subgroup Contrast Nocat. OR (95% CI) p
valueptrend A B C D E F G
adjustments
WakaiK.,2005,BRE24482
japan, Asian, Previous studyJACC study, 1988
40 - 79 129Generalpopulation(survey)
FFQ (nos)ProspectiveCohort
26291.0 7.6 days percent of energy fromvegetable fat
Breast cancer >10.92vs.<7.82
41.21(0.72, 2.02)
0.49 A B C D E F G
incidence
7.2
Resting metabolic rate (RMR)
Pre-menopausal
Freni, S.C.,1996,BRE02960
U.S.A., Not specifiedNHANES I, 1971
25 - 74 70 UnspecifiedProspectiveCohort
3793 155.0 months Kcal/day
Breast cancerPre-menopausal
>1750.0vs.1397.0 -1499.9
51.8(0.8, 4.3)
>0.10
A B C F
incidence
Post-menopausal
Freni, S.C.,1996,BRE02960
U.S.A., Not specifiedNHANES I, 1971
25 - 74 112 UnspecifiedProspectiveCohort
3829 155.0 months Kcal/day
Breast cancerPost-menopausal
>1750.0vs.1397.0 -1499.9
52.0(1.0, 4.1)
0.07 A B C F
incidence
8.1.1
BMI
Pre-menopausal
Tornberg, S.A.,1988,BRE12418
sweden, Not specified,Screening ProgramSwedish cohort, 1963
17 - 74
Through healthorg. (screening,healthinsurance)
ProspectiveCohort
46570.0 20.0 years <50 yrs. of age Unit
Breast cancerPre-menopausal
1.0(continuous)
10.95(0.91, 1.0)
A G
incidence
Le Marchand,L,1988,BRE15836
U.S.A., Multi-ethnicHawaii 1942, 1960, 1972
101Area residencylists
Nested CaseControl
444
Breast cancerPre-menopausal
Quantile 3vs.Quantile 1
30.45(0.23, 0.86)
0.016
B D
incidence
Le Marchand,L,1988,BRE15836
U.S.A., Multi-ethnicHawaii 1942, 1960, 1972
39Area residencylists
Nested CaseControl
172
Breast cancerPre-menopausal
Quantile 3vs.Quantile 1
30.72(0.24, 2.19)
0.99 B D
incidence
Vatten, L.J.,1990,BRE12826
NorwayNorway National HealthScreening Service, 1974
35 - 51 137
Through healthorg. (screening,healthinsurance)
ProspectiveCohort
185545 11.9 years Kg/m*m
Breast cancerPre-menopausal
>2.68vs.<2.19
40.36(0.2, 0.65)
0.001
A
incidence
Vatten, L.J.,1992,BRE12828
Norway, Not specified,Screening ProgramNorway, 1974
26 - 49 164
Through healthorg. (screening,healthinsurance)
ProspectiveCohort
205935 14.0 years <=50 yrs. Kg/m*m
Breast cancerPre-menopausal
>28.0vs.<21.0
40.63(0.48, 0.82)
0.001
A C G
incidence
De Stavola, B.L.,1993,BRE02122
United Kingdom, NotspecifiedGuernsey G2 and G3
73Throughnetwork, paper,tv
ProspectiveCohort
4528.0 15.0 years / 0 Kg/m*m
Breast cancerPre-menopausal
>26.5vs.<21.9
41.1(0.6, 2.1)
1 A
incidence
310

Author, Year,WCRF Code
Country, Ethnicity, Specialcharacteristics
Age Cases n Caseascertainment
Type of studyNon-Cases n
Lenght offollow-up / loss
Assessmentdetail
Additional details Unit Outcome Subgroup Contrast Nocat. OR (95% CI) p
valueptrend A B C D E F G
adjustments
Tornberg, S.A.,1994,BRE12417
Sweden, Not specified,Screening ProgramSweden, 1971
25 - 75
Through healthorg. (screening,healthinsurance)
ProspectiveCohort
47003.0 25.0 years continuous Kg/m*m
Breast cancerPre-menopausal
2.0(continuous)
10.86(0.8, 0.942)
A
incidence
Toniolo,P.,1994,BRE12398
U.S.A., Not specifiedNew York Women's HealthStudy, 1985
35 - 65 79
Through healthorg. (screening,healthinsurance)
FFQ-Semi-quantitative
Nested CaseControl
366 7.0 years Kg/m*m
Invasive breast cancerPre-menopausal
>26.6vs.<21.69
41.52(0.79, 2.92)
0.99incidence
Tulinius,H.,1997,BRE12565
IcelandReykjavik Study, 1968
45 - 59 91 UnspecifiedProspectiveCohort
11580.027.0 years /0.6% Kg/m*m
Breast cancerPre-menopausal
1.0(continuous)
11.009(0.965,1.055)
A
incidence
Huang,Z.,1997,BRE04117
USA, Not specified,Registered nursesNurses' Health Study (NHS)Cohort 1976-1996
35 - 55 1000 By MailProspectiveCohort
653004 16.0 years / 0.05 Kg/m*m
Invasive breast cancerPre-menopausal
>31vs.<=20
100.62(0.45, 0.86)
0.001
A C D F
mortality/incidence
Galanis,D.J.,1998,BRE03058
hawaii, Multi-ethnicHawaii State Department ofHealth, 1975
(43) 86 By MailProspectiveCohort
11374 14.9 years / 0 BMI at interview Kg/m*m
Breast cancerPre-menopausal
>26.1vs.<19.5
51.9(0.9, 3.9)
0.2 A B E G
incidence
Kaaks,R.,1998,BRE04522
The NetherlandsDOM-project Utrecht,1974/1984
39 - 73 147
Through healthorg. (screening,healthinsurance)
ProspectiveCohort
56646 7.1 years Kg/m*m
Breast cancerPre-menopausal
>27.151vs.<22.5
41.04(0.65, 1.68)
0.73 A C F
incidence
Sonnenschein,E.,1999,BRE11604
USA, Multi-ethnicNew York Women's HealthStudy, 1985
35 - 65 109
Through healthorg. (screening,healthinsurance)
ProspectiveCohort
4366 6.6 years Kg/m*m
Breast cancerPre-menopausal
>26.37vs.<21.4
41.0(0.58, 1.73)
A C F G
incidence
Manjer,J,2001,BRE17790
SwedenMalmo Preventive Project(MPP), 1974
(55) 112
Through healthorg. (screening,healthinsurance)
ProspectiveCohort
58079 13.1 years Kg/m*m
Invasive breast cancerPre-menopausal
>25.47vs.<20.61
41.0(0.57, 1.75)
0.77 A
incidence
Saadatian-Elahi,M.,2002,BRE21486
US, Not specifiedNew York Women's HealthStudy, 1985
34 - 65 91Throughnetwork, paper,tv
Nested CaseControl
91 4.3 years kg/cm*cm
Breast cancerPre-menopausal
1null(null, null)
incidence
Rissanen,H.,2003,BRE17954
Finland, Not specifiedMobile Clinic HealthExamination Survey, 1973
18 - 89Throughnetwork, paper,tv
Nested CaseControl
8196.0 10.0 yearsBreast cancer
Pre-menopausal
1null(null, null)
incidence
Lee, S.Y.,2003,BRE17745
Korea, Asian, Pre-menopausalKorean Women's Cohort(KWC), 1994/1995
20 - (35) 360
Through healthorg. (screening,healthinsurance)
ProspectiveCohort
582352 6.0 years Kg/m*m
Breast cancerPre-menopausal
>=23vs.<23
21.0(0.8, 1.3)
0.7575
A C D F G
incidence
Weiderpass,E.,2004,BRE18151
Sweden+Norway, Notspecified, Pre-menopausalAssembled cohort (Sweden+ Norway)
30 - 49 641 By MailProspectiveCohort
916898.0 years / 789women at cohort enrollment
Breast cancer FamilyHistory BC -No & Pre-menopausal
>=30vs.20-24.9
40.58(0.36, 0.95)
0.0004
A C F G
incidence
Weiderpass,E.,2004,BRE18151
Sweden+Norway, Notspecified, Pre-menopausalAssembled cohort (Sweden+ Norway)
30 - 49 75 By MailProspectiveCohort
45818.0 years / 789women at cohort enrollment
Breast cancer FamilyHistory BC -Yes & Pre-menopausal
>=30vs.20-24.9
40.96(0.3, 3.13)
0.37 A C F G
incidence
311

Author, Year,WCRF Code
Country, Ethnicity, Specialcharacteristics
Age Cases n Caseascertainment
Type of studyNon-Cases n
Lenght offollow-up / loss
Assessmentdetail
Additional details Unit Outcome Subgroup Contrast Nocat. OR (95% CI) p
valueptrend A B C D E F G
adjustments
Weiderpass,E.,2004,BRE18151
Sweden+Norway, Notspecified, Pre-menopausalAssembled cohort (Sweden+ Norway)
30 - 49 By MailProspectiveCohort
99717.08.0 years / 789women at cohort enrollment Kg/m*m
Breast cancerPre-menopausal
1.0(continuous)
10.96(0.94, 0.99)
A C F G
incidence
LahmannPH,2004,BRE15804
EUROPEEuropean ProspectiveInvestigation into Cancer andNutrition (EPIC) 1993-1998
18 - 80 474Otherprocedure
ProspectiveCohort
73168 4.7 years Kg/m*m
Breast cancerPre-menopausal
>28.8vs.<21.5
50.82(0.59, 1.14)
0.100
A B C E F G
incidence
LahmannPH,2004,BRE15804
EUROPEEuropean ProspectiveInvestigation into Cancer andNutrition (EPIC) 1993-1998
18 - 80 474Otherprocedure
ProspectiveCohort
73168 4.7 years unit
Breast cancerPre-menopausal
1.0(continuous)
10.98(0.96, 1.0)
A B C E F G
incidence
Tehard,B.,2004,BRE12173
France, Registered teachersE3N-EPIC, 1990
40 - 65 692
Through socialorganization(profession,religion)
ProspectiveCohort
283543 9.7 years Kg/m*m
Invasive breast cancerPre-menopausal
>23.5vs.<20.2
40.78(0.64, 0.94)
B C E F G
incidence
Silvera, S.A.,2005,BRE24118
Canada, Not specifiedCanadian National BreastScreening Study
40 - 59 818
Through healthorg. (screening,healthinsurance)
FFQ-Semi-quantitative
ProspectiveCohort
327994 16.4 years Kg/m*m
Breast cancerPre-menopausal
>30.0vs.<24.0
41.01(0.74, 1.37)
0.82 A C E F G
incidence
Kuriyama,S.,2005,BRE22995
JapanMiyagi, 1993
40 - 33Generalpopulation(survey)
Questionnaire(nos)
ProspectiveCohort
15054.0 9.0 years Kg/m*m
Breast cancerPre-menopausal
27,5-29,9vs.18,5-24,9
30.84(0.24, 2.88)
0.7 A C E G
incidence
Silvera, S. A.N.,2005,BRE24118
CanadaNBSS, 1980
40 - 59 818
Through healthorg. (screening,healthinsurance)
FFQ (nos)ProspectiveCohort
827994 16.4 years Kg/m*m
Breast cancerPre-menopausal
>30vs.<25
31.01(0.74, 1.37)
0.82 A C E F G
incidence
Michels etal.,2006,BRE80033
USA, Pre-menopausalNHS II, 1989
25 - 42Self reportverified bymedical record
FFQProspectiveCohort
116609.0 14.0 years
Current BMI, usingweight reportedpreceding cancerdiagnosis
units
Breast cancer
age < 40 yrs5.0(continuous)
10.94(0.84, 1.06)
A C D E F G
incidence
Michels etal.,2006,BRE80033
USA, Pre-menopausalNHS II, 1989
25 - 42Self reportverified bymedical record
FFQProspectiveCohort
116609.0 14.0 years
Current BMI, usingweight reportedpreceding cancerdiagnosis
units
Breast cancerage >= 40yrs
5.0(continuous)
10.91(0.85, 0.97)
A C D E F G
incidence
Michels etal.,2006,BRE80033
USA, Pre-menopausalNHS II, 1989
25 - 42Self reportverified bymedical record
FFQProspectiveCohort
116609.0 14.0 years
Current BMI, usingweight reportedpreceding cancerdiagnosis
units
Breast cancercurrent OCusers
5.0(continuous)
10.99(0.79, 1.21)
A C D E F G
incidence
Michels etal.,2006,BRE80033
USA, Pre-menopausalNHS II, 1989
25 - 42Self reportverified bymedical record
FFQProspectiveCohort
116609.0 14.0 years
Current BMI, usingweight reportedpreceding cancerdiagnosis
units
Breast cancermenstrualcycle < 32 d
5.0(continuous)
10.95(0.89, 1.01)
A C D E F G
incidence
Michels etal.,2006,BRE80033
USA, Pre-menopausalNHS II, 1989
25 - 42Self reportverified bymedical record
FFQProspectiveCohort
116609.0 14.0 years
Current BMI, usingweight reportedpreceding cancerdiagnosis
units
Breast cancer menstrualcycle >= 32d
5.0(continuous)
10.84(0.75, 0.95)
A C D E F G
incidence
Michels etal.,2006,BRE80033
USA, Pre-menopausalNHS II, 1989
25 - 42Self reportverified bymedical record
FFQProspectiveCohort
116609.0 14.0 years
Current BMI, usingweight reportedpreceding cancerdiagnosis
units
Breast cancernever OCusers
5.0(continuous)
10.84(0.73, 0.98)
A C D E F G
incidence
312

Author, Year,WCRF Code
Country, Ethnicity, Specialcharacteristics
Age Cases n Caseascertainment
Type of studyNon-Cases n
Lenght offollow-up / loss
Assessmentdetail
Additional details Unit Outcome Subgroup Contrast Nocat. OR (95% CI) p
valueptrend A B C D E F G
adjustments
Michels etal.,2006,BRE80033
USA, Pre-menopausalNHS II, 1989
25 - 42 1398Self reportverified bymedical record
FFQProspectiveCohort
116609.0 14.0 years
Current BMI, usingweight reportedpreceding cancerdiagnosis
Kg/m*m
Breast cancer >=30vs.20-22.4
60.78(0.66, 0.93)
0.001
A C D E F G
incidence
Michels etal.,2006,BRE80033
USA, Pre-menopausalNHS II, 1989
25 - 42 1398Self reportverified bymedical record
FFQProspectiveCohort
116609.0 14.0 years
Current BMI, usingweight reportedpreceding cancerdiagnosis
Kg/m*m
Breast cancer 27.5-29.9vs.20-22.4
60.97(0.79, 1.19)
0.002
A C D E F G
incidence
Michels etal.,2006,BRE80033
USA, Pre-menopausalNHS II, 1989
25 - 42 1398Self reportverified bymedical record
FFQProspectiveCohort
116609.0 14.0 years
Current BMI, usingweight reportedpreceding cancerdiagnosis
Kg/m*m
Breast cancer >=30vs.20-22.4
70.81(0.68, 0.97)
0.003
A C D E F G
incidence
Michels etal.,2006,BRE80033
USA, Pre-menopausalNHS II, 1989
25 - 42 1398Self reportverified bymedical record
FFQProspectiveCohort
116609.0 14.0 years
Current BMI, usingweight reportedpreceding cancerdiagnosis
units
Breast cancer5.0(continuous)
10.9(0.85, 0.96)
A C D E F G
incidence
Michels etal.,2006,BRE80033
USA, Pre-menopausalNHS II, 1989
25 - 42 1398Self reportverified bymedical record
FFQProspectiveCohort
116609.0 14.0 years
Current BMI, usingweight reportedpreceding cancerdiagnosis
units
Breast cancer5.0(continuous)
10.92(0.87, 0.97)
A C D E F G
incidence
Michels etal.,2006,BRE80033
USA, Pre-menopausalNHS II, 1989
25 - 42 1398Self reportverified bymedical record
FFQProspectiveCohort
116609.0 14.0 years
Current BMI, usingweight reportedpreceding cancerdiagnosis
units
Breast cancer5.0(continuous)
10.92(0.86, 0.97)
A C D E F G
incidence
Michels etal.,2006,BRE80033
USA, Pre-menopausalNHS II, 1989
25 - 42Self reportverified bymedical record
FFQProspectiveCohort
116609.0 14.0 years
Current BMI, usingweight reportedpreceding cancerdiagnosis
units
Breast cancerpast OCusers
5.0(continuous)
10.93(0.87, 0.99)
A C D E F G
incidence
LukanovaA.,2006,BRE80100
Sweden, WhiteNorthern Sweden Health andDisease Cohort, 1985
29 - 61 92 medical recordsProspectiveCohort
74207.0 8.2 years / 0.03 BMI, baseline BMI
Breast cancerPre-menopausal
>26.0vs.18.5 - 21.5
40.58(0.29, 1.11)
0.04 A G
incidence
TehardB.,2006,BRE80103
FranceE3N-EPIC, 1990
40 - 65 212
patientrecords/directcontact/healthinsurance
FFQProspectiveCohort
98997.0 4.2 years / 0.33 BMI
Breast cancerPre-menopausal
>24.4vs.<20.6
40.61(0.42, 0.89)
<=0.05
A B C E F G
incidence
TehardB.,2006,BRE80103
FranceE3N-EPIC, 1990
40 - 65 212
patientrecords/directcontact/healthinsurance
FFQProspectiveCohort
98997.0 4.2 years / 0.33 BMI, WHO criteria
Breast cancerPre-menopausal
>30.0vs.18.5 - 24.9
40.26(0.06, 1.0)
<=0.05
A B C E F G
incidence
Michels etal.,2006,BRE80033
USA, Pre-menopausalNHS II, 1989
25 - 42 669Self reportverified bymedical record
FFQProspectiveCohort
116609.0 14.0 years
Current BMI, usingweight reportedpreceding cancerdiagnosis
Kg/m*m
Breast cancer ER+ >=30vs.20-22.4
60.76(0.59, 0.97)
0.02 A C D E F G
incidence
Michels etal.,2006,BRE80033
USA, Pre-menopausalNHS II, 1989
25 - 42 669Self reportverified bymedical record
FFQProspectiveCohort
116609.0 14.0 years
Current BMI, usingweight reportedpreceding cancerdiagnosis
units
Breast cancer ER+5.0(continuous)
10.91(0.84, 0.99)
A C D E F G
incidence
Michels etal.,2006,BRE80033
USA, Pre-menopausalNHS II, 1989
25 - 42 285Self reportverified bymedical record
FFQProspectiveCohort
116609.0 14.0 years
Current BMI, usingweight reportedpreceding cancerdiagnosis
Kg/m*m
Breast cancer ER- >=30.0vs.20-22.4
61.1(0.76, 1.58)
0.52 A C D E F G
incidence
313

Author, Year,WCRF Code
Country, Ethnicity, Specialcharacteristics
Age Cases n Caseascertainment
Type of studyNon-Cases n
Lenght offollow-up / loss
Assessmentdetail
Additional details Unit Outcome Subgroup Contrast Nocat. OR (95% CI) p
valueptrend A B C D E F G
adjustments
Michels etal.,2006,BRE80033
USA, Pre-menopausalNHS II, 1989
25 - 42 285Self reportverified bymedical record
FFQProspectiveCohort
116609.0 14.0 years
Current BMI, usingweight reportedpreceding cancerdiagnosis
units
Breast cancer ER-5.0(continuous)
11.03(0.91, 1.15)
A C D E F G
incidence
Michels etal.,2006,BRE80033
USA, Pre-menopausalNHS II, 1989
25 - 42 636Self reportverified bymedical record
FFQProspectiveCohort
116609.0 14.0 years
Current BMI, usingweight reportedpreceding cancerdiagnosis
Kg/m*m
Breast cancer PR+ >=30vs.20-22.4
60.81(0.63, 1.05)
0.12 A C D E F G
incidence
Michels etal.,2006,BRE80033
USA, Pre-menopausalNHS II, 1989
25 - 42 636Self reportverified bymedical record
FFQProspectiveCohort
116609.0 14.0 years
Current BMI, usingweight reportedpreceding cancerdiagnosis
units
Breast cancer PR+5.0(continuous)
10.94(0.86, 1.02)
A C D E F G
incidence
Michels etal.,2006,BRE80033
USA, Pre-menopausalNHS II, 1989
25 - 42 300Self reportverified bymedical record
FFQProspectiveCohort
116609.0 14.0 years
Current BMI, usingweight reportedpreceding cancerdiagnosis
units
Breast cancer PR-5.0(continuous)
10.98(0.86, 1.1)
A C D E F G
incidence
Michels etal.,2006,BRE80033
USA, Pre-menopausalNHS II, 1989
25 - 42 300Self reportverified bymedical record
FFQProspectiveCohort
116609.0 14.0 years
Current BMI, usingweight reportedpreceding cancerdiagnosis
Kg/m*m
Breast cancer PR- >=30vs.20-22.4
61.01(0.71, 1.45)
0.87 A C D E F G
incidence
Lundqvist etal,2007,BRE80002
Sweden/FinlandSweden,Finland Co-twinstudy,1975
(44) 5 Cancer registryProspectiveCohort
36490.0 25.2 yearsBaseline BMI, cohortanalysis, Swedish andFininsh twin registries
Kg/m*m
Breast cancerPre-menopausal
>=30.0vs.18.5-<25.0
40.5(0.2, 1.2)
A B G
incidence
Lundqvist etal,2007,BRE80003
Sweden/FinlandSweden,Finland Co-twinstudy,1975
(44) 5Nested CaseControl
36490.0Baseline BMI, co-twincontrol analysis,Finland & Sweden
Kg/m*m
Breast cancerPre-menopausal
>=30vs.18.5- <25
40.8(0.2, 2.5)
B C G
incidence
Palmer, J.R. etal.,2007,BRE80122
United States, BlackBlack Women's HealthStudy, 1995
21 - 69 495
death certificate/ patientrecords / selfreport
FFQProspectiveCohort
59000.0 10.0 years / 0.2 Current BMI
Breast cancerPre-menopausal
>=35vs.<25
40.87(0.62, 1.21)
A B C D F G
incidence
Reeves, G.K. etal.,2007,BRE80146
United KingdomThe Million Women Study,1996
50 - 64 1179National HealthRecords
ProspectiveCohort
1222630.0
5.4 years BMI
Breast cancerPre-menopausal
>30.0vs.22.5 - 24.9
50.79(0.68, 0.92)
A B C E G
incidence
Reeves, G.K. etal.,2007,BRE80146
United KingdomThe Million Women Study,1996
50 - 64 83National HealthRecords
ProspectiveCohort
1222630.0
5.4 years BMI
Breast cancerPre-menopausal
>30.0vs.22.5 - 24.9
50.64(0.34, 1.21)
A B C E G
cancer death
Reeves, G.K. etal.,2007,BRE80146
United KingdomThe Million Women Study,1996
50 - 64 636National HealthRecords
ProspectiveCohort
1222630.0
5.4 years BMI units
Breast cancer Premenopausal neversmokers
10.0(continuous)
10.84(0.68, 1.04)
A B C E G
incidence
Iwasaki etal.,2007,BRE20027
JapanJPHC, 1990
40 - 69 201 Cancer registryQuestionnaire(nos)
ProspectiveCohort
53857.0 9.9 years / 0.05 BMI Kg/m*m
Breast cancerpremenopausal women
30+vs.<19
71.35(0.53, 3.47)
0.19 A C D E
incidence
Lundqvist etal,2007,BRE80003
Sweden/FinlandSweden,Finland Co-twinstudy,1975
(44) 436Nested CaseControl
436
Baseline BMI, co-twincontrol analyses fordizygotic twins, Finland& Sweden
Kg/m*m
Breast cancer younger (mean age31/29 yrs),Dizygotic
>=30vs.18.5-24
40.5(0.2, 1.4)
B C G
incidence
314

Author, Year,WCRF Code
Country, Ethnicity, Specialcharacteristics
Age Cases n Caseascertainment
Type of studyNon-Cases n
Lenght offollow-up / loss
Assessmentdetail
Additional details Unit Outcome Subgroup Contrast Nocat. OR (95% CI) p
valueptrend A B C D E F G
adjustments
Lundqvist etal,2007,BRE80003
Sweden/FinlandSweden,Finland Co-twinstudy,1975
(44) 227Nested CaseControl
227
Baseline BMI, co-twincontrol analyses formonozygotic twins,Finland & Sweden
Kg/m*m
Breast cancer younger (mean age31/29 yrs),Monozygotic
>=30vs.18.5-24
40.9(0.2, 5.9)
B C G
incidence
Lundqvist etal,2007,BRE80002
Sweden/FinlandSweden,Finland Co-twinstudy,1975
(44) 881 Cancer registryProspectiveCohort
42447 25.2 yearsBaseline BMI, cohortanalysis, Swedish andFininsh twin registries
Kg/m*m
Breast canceryoungersubjects
>=30.0vs.18.5-<25.0
40.8(0.4, 1.3)
A B G
incidence
Lundqvist etal,2007,BRE80002
Sweden/FinlandSweden,Finland Co-twinstudy,1975
(44) 881 Cancer registryProspectiveCohort
42447 25.2 yearsBaseline BMI, cohortanalysis, Swedish andFininsh twin registries
Kg/m*m
Breast canceryoungersubjects
1.0(continuous)
10.99(0.96, 1.01)
0.33 A B G
incidence
Lundqvist etal,2007,BRE80003
Sweden/FinlandSweden,Finland Co-twinstudy,1975
(44) 667Nested CaseControl
667Baseline BMI, co-twincontrol analysis,Finland & Sweden
Kg/m*m
Breast canceryoungersubjects
>=30vs.18.5-<25
40.6(0.3, 1.5)
B C G
incidence
Lundqvist etal,2007,BRE80003
Sweden/FinlandSweden,Finland Co-twinstudy,1975
(44) 667Nested CaseControl
667Baseline BMI, co-twinanalysis, Finland &Sweden
Kg/m*m
Breast canceryoungersubjects
1.0(continuous)
10.95(0.9, 1.0)
0.05 B C G
incidence
Iwasaki etal.,2007,BRE20027
JapanJPHC, 1990
40 - 69 62 Cancer registryQuestionnaire(nos)
ProspectiveCohort
20871 9.9 years / 0.05 BMI Kg/m*m
Breast cancer ER+premenopausal women
1.0(continuous)
11.04(0.98, 1.11)
A C D E
incidence
Iwasaki etal.,2007,BRE20027
JapanJPHC, 1990
40 - 69 41 Cancer registryQuestionnaire(nos)
ProspectiveCohort
20871 9.9 years / 0.05 BMI Kg/m*m
Breast cancer ER-premenopausal women
1.0(continuous)
11.02(0.93, 1.13)
A C D E
incidence
Iwasaki etal.,2007,BRE20027
JapanJPHC, 1990
40 - 69 53 Cancer registryQuestionnaire(nos)
ProspectiveCohort
20871 9.9 years / 0.05 BMI Kg/m*m
Breast cancer PR+premenopausal women
1.0(continuous)
11.06(0.99, 1.13)
A C D E
incidence
Iwasaki etal.,2007,BRE20027
JapanJPHC, 1990
40 - 69 42 Cancer registryQuestionnaire(nos)
ProspectiveCohort
20871 9.9 years / 0.05 BMI Kg/m*m
Breast cancer PR-premenopausal women
1.0(continuous)
10.99(0.89, 1.1)
A C D E
incidence
Reinier etal.,2007,BRE80038
USAVermont MammographyCohort, 1996
104screeningexaminations
ProspectiveCohort
61844.0 3.1 years BMI Kg/m*m
In situ breast cancerpremenopausal women
30vs.<22
51.0(0.5, 1.9)
A C F G
incidence
Reinier etal.,2007,BRE80038
USAVermont MammographyCohort, 1996
231screeningexaminations
ProspectiveCohort
61844.0 3.1 years BMI Kg/m*m
Invasive breast cancerpremenopausal women
30vs.<22
50.9(0.6, 1.3)
A C F G
incidence
Post-menopausal
Tornberg, S.A.,1988,BRE12418
sweden, Not specified,Screening ProgramSwedish cohort, 1963
17 - 74
Through healthorg. (screening,healthinsurance)
ProspectiveCohort
46570.0 20.0 years >=50 yrs. of age Unit
Breast cancerPost-menopausal
1.0(continuous)
11.02(1.0, 1.04)
A G
incidence
315

Author, Year,WCRF Code
Country, Ethnicity, Specialcharacteristics
Age Cases n Caseascertainment
Type of studyNon-Cases n
Lenght offollow-up / loss
Assessmentdetail
Additional details Unit Outcome Subgroup Contrast Nocat. OR (95% CI) p
valueptrend A B C D E F G
adjustments
Vatten, L.J.,1990,BRE12826
NorwayNorway National HealthScreening Service, 1974
35 - 51 99
Through healthorg. (screening,healthinsurance)
ProspectiveCohort
97384 11.9 years Kg/m*m
Breast cancerPost-menopausal
>2.68vs.<2.19
40.73(0.41, 1.29)
0.52 A
incidence
Folsom,AR,1990,BRE02836
USA, Post-menopausalIowa Women's Health Study
55 - 69 226 By MailNested CaseControl
1784 2.0 years Kg/m*m
Breast cancerPost-menopausal
>28.36vs.<24.39
31.06(0.76, 1.49)
0.69 A
incidence
den Tonkelaar,I.,1992,BRE02222
the Neederlands, Notspecified, Post-menopausalDOM-project Utrecht,1974/1984
49 - 66
Through healthorg. (screening,healthinsurance)
ProspectiveCohort
9746.0 12.5 years / 4%Breast cancer
Post-menopausal
>28.0vs.<22.9
41.2(0.86, 1.67)
0.99 A
incidence
den Tonkelaar,I.,1992,BRE02222
the Neederlands, Notspecified, Post-menopausalDOM-project Utrecht,1974/1984
49 - 66
Through healthorg. (screening,healthinsurance)
ProspectiveCohort
9746.0 12.5 years / 4% greater than 29 vs <22 Kg/m*m
Breast cancerPost-menopausal
upper10%vs.lower10%
21.64(1.0, 2.69)
incidence
Gapstur, S.M.,1992,BRE03101
U.S.A., Not specified, Post-menopausalIowa Women's Health Study
55 - 69 493 By MailFFQ-Semi-quantitative
ProspectiveCohort
140704 4.0 years Kg/m*m
Breast cancerPost-menopausal
>30.71vs.<22.89
51.65(1.24, 2.19)
0.0001
A
incidence
Graham,S.,1992,BRE03424
USA, White, Post-menopausalNew York State Cohort,1980
50 - 107 359 By Mail FFQ (nos)ProspectiveCohort
18140 8.0 years Kg/m*m
Breast cancerPost-menopausal
24-59vs.13-23
21.09(0.88, 1.35)
0.418
A B
incidence
Barrett-Connor,E.,1993,BRE00581
U.S, WhiteRancho Bernardo, 1972
40 - 79 15
Through socialorganization(profession,religion)
24h RecallProspectiveCohort
575 15.0 yearsBreast cancer
Post-menopausal
1null(null, null)
A
mortality/incidence
De Stavola, B.L.,1993,BRE02122
United Kingdom, NotspecifiedGuernsey G2 and G3
95Throughnetwork, paper,tv
ProspectiveCohort
4528.0 15.0 years / 0 Kg/m*m
Breast cancerPost-menopausal
>26.5vs.<21.9
41.1(0.6, 2.2)
0.74 A
incidence
Tornberg, S.A.,1994,BRE12417
Sweden, Not specified,Screening ProgramSweden, 1971
25 - 75
Through healthorg. (screening,healthinsurance)
ProspectiveCohort
47003.0 25.0 years continuous Kg/m*m
Breast cancerPost-menopausal
2.0(continuous)
11.05(1.01, 1.1)
A
incidence
Toniolo,P.,1994,BRE12398
U.S.A., Not specifiedNew York Women's HealthStudy, 1985
35 - 65 101
Through healthorg. (screening,healthinsurance)
FFQ-Semi-quantitative
Nested CaseControl
465 7.0 years Kg/m*m
Invasive breast cancerPost-menopausal
>26.6vs.<21.69
42.1(1.05, 4.17)
0.005
incidence
den Tonkelaar,I.,1995,BRE02224
netherland, ScreeningProgramDOM-project Utrecht,1974/1984
40 - 73 38
Through healthorg. (screening,healthinsurance)
ProspectiveCohort
3530 4.0 years / 5% Kg/m*m
Breast cancerPost-menopausal
>27.0vs.<24.09
31.45(0.62, 3.38)
0.82 A
incidence
PotterJD,1995,BRE80164
United States, Post-menopausalIowa Women's Health Study
55 - 69 414national cancerregisters
FFQProspectiveCohort
37105.0 7.0 years BMI
Breast cancer ER+/PR+Post-menopausal
>=30vs.<30
21.38(1.12, 1.71)
A
Incidence
PotterJD,1995,BRE80164
United States, Post-menopausalIowa Women's Health Study
55 - 69 99national cancerregisters
FFQProspectiveCohort
37105.0 7.0 years BMI
Breast cancer ER+/PR-Post-menopausal
>=30vs.<30
20.49(0.27, 0.88)
A
Incidence
316
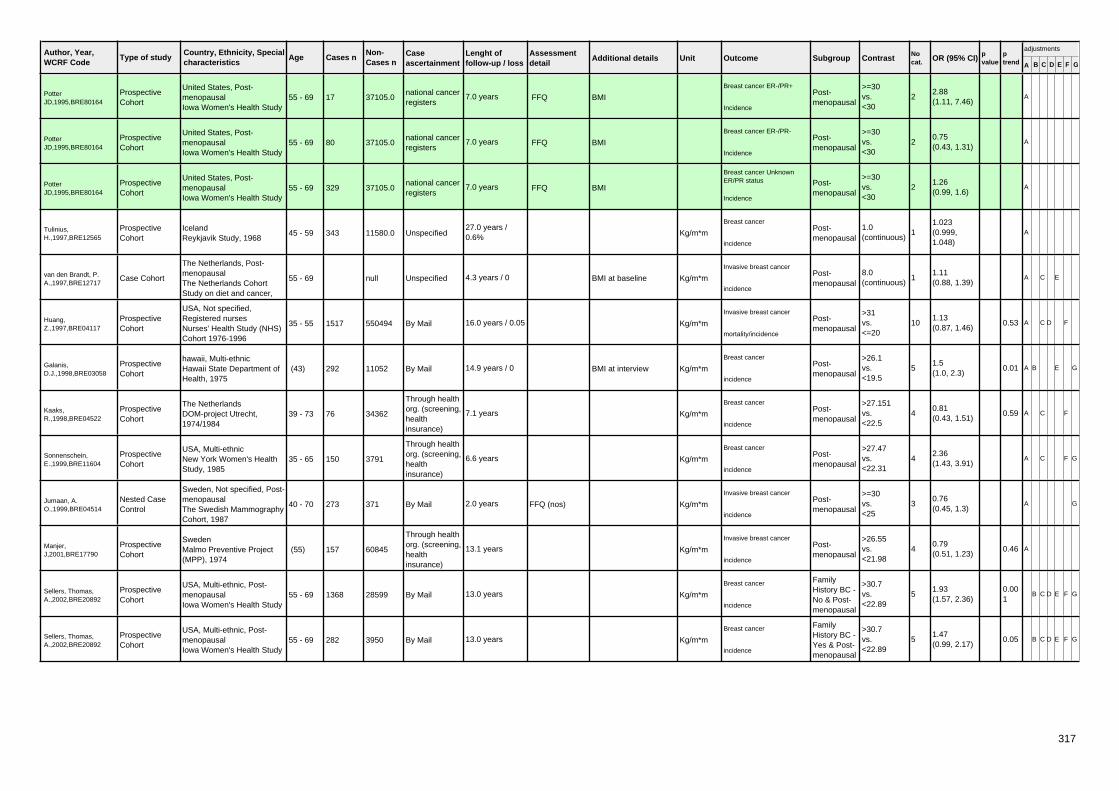
Author, Year,WCRF Code
Country, Ethnicity, Specialcharacteristics
Age Cases n Caseascertainment
Type of studyNon-Cases n
Lenght offollow-up / loss
Assessmentdetail
Additional details Unit Outcome Subgroup Contrast Nocat. OR (95% CI) p
valueptrend A B C D E F G
adjustments
PotterJD,1995,BRE80164
United States, Post-menopausalIowa Women's Health Study
55 - 69 17national cancerregisters
FFQProspectiveCohort
37105.0 7.0 years BMI
Breast cancer ER-/PR+Post-menopausal
>=30vs.<30
22.88(1.11, 7.46)
A
Incidence
PotterJD,1995,BRE80164
United States, Post-menopausalIowa Women's Health Study
55 - 69 80national cancerregisters
FFQProspectiveCohort
37105.0 7.0 years BMI
Breast cancer ER-/PR-Post-menopausal
>=30vs.<30
20.75(0.43, 1.31)
A
Incidence
PotterJD,1995,BRE80164
United States, Post-menopausalIowa Women's Health Study
55 - 69 329national cancerregisters
FFQProspectiveCohort
37105.0 7.0 years BMI
Breast cancer UnknownER/PR status Post-
menopausal
>=30vs.<30
21.26(0.99, 1.6)
A
Incidence
Tulinius,H.,1997,BRE12565
IcelandReykjavik Study, 1968
45 - 59 343 UnspecifiedProspectiveCohort
11580.027.0 years /0.6% Kg/m*m
Breast cancerPost-menopausal
1.0(continuous)
11.023(0.999,1.048)
A
incidence
van den Brandt, P.A.,1997,BRE12717
The Netherlands, Post-menopausalThe Netherlands CohortStudy on diet and cancer,
55 - 69 UnspecifiedCase Cohort null 4.3 years / 0 BMI at baseline Kg/m*m
Invasive breast cancerPost-menopausal
8.0(continuous)
11.11(0.88, 1.39)
A C E
incidence
Huang,Z.,1997,BRE04117
USA, Not specified,Registered nursesNurses' Health Study (NHS)Cohort 1976-1996
35 - 55 1517 By MailProspectiveCohort
550494 16.0 years / 0.05 Kg/m*m
Invasive breast cancerPost-menopausal
>31vs.<=20
101.13(0.87, 1.46)
0.53 A C D F
mortality/incidence
Galanis,D.J.,1998,BRE03058
hawaii, Multi-ethnicHawaii State Department ofHealth, 1975
(43) 292 By MailProspectiveCohort
11052 14.9 years / 0 BMI at interview Kg/m*m
Breast cancerPost-menopausal
>26.1vs.<19.5
51.5(1.0, 2.3)
0.01 A B E G
incidence
Kaaks,R.,1998,BRE04522
The NetherlandsDOM-project Utrecht,1974/1984
39 - 73 76
Through healthorg. (screening,healthinsurance)
ProspectiveCohort
34362 7.1 years Kg/m*m
Breast cancerPost-menopausal
>27.151vs.<22.5
40.81(0.43, 1.51)
0.59 A C F
incidence
Sonnenschein,E.,1999,BRE11604
USA, Multi-ethnicNew York Women's HealthStudy, 1985
35 - 65 150
Through healthorg. (screening,healthinsurance)
ProspectiveCohort
3791 6.6 years Kg/m*m
Breast cancerPost-menopausal
>27.47vs.<22.31
42.36(1.43, 3.91)
A C F G
incidence
Jumaan, A.O.,1999,BRE04514
Sweden, Not specified, Post-menopausalThe Swedish MammographyCohort, 1987
40 - 70 273 By Mail FFQ (nos)Nested CaseControl
371 2.0 years Kg/m*m
Invasive breast cancerPost-menopausal
>=30vs.<25
30.76(0.45, 1.3)
A G
incidence
Manjer,J,2001,BRE17790
SwedenMalmo Preventive Project(MPP), 1974
(55) 157
Through healthorg. (screening,healthinsurance)
ProspectiveCohort
60845 13.1 years Kg/m*m
Invasive breast cancerPost-menopausal
>26.55vs.<21.98
40.79(0.51, 1.23)
0.46 A
incidence
Sellers, Thomas,A.,2002,BRE20892
USA, Multi-ethnic, Post-menopausalIowa Women's Health Study
55 - 69 1368 By MailProspectiveCohort
28599 13.0 years Kg/m*m
Breast cancer FamilyHistory BC -No & Post-menopausal
>30.7vs.<22.89
51.93(1.57, 2.36)
0.001
B C D E F G
incidence
Sellers, Thomas,A.,2002,BRE20892
USA, Multi-ethnic, Post-menopausalIowa Women's Health Study
55 - 69 282 By MailProspectiveCohort
3950 13.0 years Kg/m*m
Breast cancer FamilyHistory BC -Yes & Post-menopausal
>30.7vs.<22.89
51.47(0.99, 2.17)
0.05 B C D E F G
incidence
317

Author, Year,WCRF Code
Country, Ethnicity, Specialcharacteristics
Age Cases n Caseascertainment
Type of studyNon-Cases n
Lenght offollow-up / loss
Assessmentdetail
Additional details Unit Outcome Subgroup Contrast Nocat. OR (95% CI) p
valueptrend A B C D E F G
adjustments
Morimoto, Libby,M.,2002,BRE20457
, Multi-ethnic, Post-menopausalWomen's Health Initiative(WHI) Observational Study,
50 - 79 315Throughnetwork, paper,tv
ProspectiveCohort
85917.034.8 months /0.037 at baseline Kg/m*m
Breast cancer
HRT - No>31.11vs.<22.6
52.52(1.62, 3.93)
0.001
A B C E F G
incidence
Morimoto, Libby,M.,2002,BRE20457
, Multi-ethnic, Post-menopausalWomen's Health Initiative(WHI) Observational Study,
50 - 79 704Throughnetwork, paper,tv
ProspectiveCohort
85917.034.8 months /0.037 at baseline Kg/m*m
Breast cancer
HRT - Yes>31.11vs.<22.6
50.96(0.73, 1.27)
0.75 A B C E F G
incidence
Saadatian-Elahi,M.,2002,BRE21486
US, Not specifiedNew York Women's HealthStudy, 1985
34 - 65 106Throughnetwork, paper,tv
Nested CaseControl
106 4.3 yearsBreast cancer
Post-menopausal
1null(null, null)
incidence
Wirfalt,E.,2002,BRE13504
Sweden, Not specified, Post-menopausalMalmo Diet and Cancer,1991
50 - 237 By Mail7-day Record +Questionnaire
Nested CaseControl
673 8.0 yearsBreast cancer
Post-menopausal
1null(null, null)
incidence
Petrelli, Jennifer,M.,2002,BRE20653
U.S.A.CPS-II US cohort, 1982-1998
30 - (56) 2852Direct contactat home
ProspectiveCohort
558955214.0 years /15298 Kg/m*m
Breast cancerPost-menopausal
>=40vs.18.5-20.49
123.08(2.09, 4.51)
<0.0001
A B C D E F G
cancer death
Petrelli, Jennifer,M.,2002,BRE20653
U.S.A.CPS-II US cohort, 1982-1998
30 - (56) 2852Direct contactat home
ProspectiveCohort
558955114.0 years /15298 who categories Kg/m*m
Breast cancerPost-menopausal
>=30vs.<25
31.6(1.42, 1.79)
<0.0001
A B C D E F G
cancer death
Sellers, Thomas,A.,2002,BRE20892
USA, Multi-ethnic, Post-menopausalIowa Women's Health Study
55 - 69 1043 By MailProspectiveCohort
37105.0 13.0 years Kg/m*m
Breast cancer ER+Post-menopausal
>30.7vs.<22.89
52.0(1.58, 2.53)
B C D E F G
incidence
Sellers, Thomas,A.,2002,BRE20892
USA, Multi-ethnic, Post-menopausalIowa Women's Health Study
55 - 69 232 By MailProspectiveCohort
37105.0 13.0 years Kg/m*m
Breast cancer ER-Post-menopausal
>30.7vs.<22.89
51.38(0.78, 2.43)
B C D E F G
incidence
Sellers, Thomas,A.,2002,BRE20892
USA, Multi-ethnic, Post-menopausalIowa Women's Health Study
55 - 69 993 By MailProspectiveCohort
37105.0 13.0 years Kg/m*m
Breast cancer PR+ FamilyHistory BC -No & Post-menopausal
>30.7vs.<22.89
52.24(1.72, 2.91)
B C D E F G
incidence
Sellers, Thomas,A.,2002,BRE20892
USA, Multi-ethnic, Post-menopausalIowa Women's Health Study
55 - 69 362 By MailProspectiveCohort
37105.0 13.0 years Kg/m*m
Breast cancer PR-Post-menopausal
>30.7vs.<22.89
50.96(0.62, 1.49)
B C D E F G
incidence
Rissanen,H.,2003,BRE17954
Finland, Not specifiedMobile Clinic HealthExamination Survey, 1973
18 - 89Throughnetwork, paper,tv
Nested CaseControl
8196.0 10.0 yearsBreast cancer
Post-menopausal
1null(null, null)
incidence
Calle, E.E.,2003,BRE01340
USA, Not specified, Post-menopausalCPS-II US cohort, 1982-1998
30 - (57) 2755
Through healthorg. (screening,healthinsurance)
ProspectiveCohort
495477.0 16.0 years Kg/m*m
Breast cancerPost-menopausal
>=40vs.18.5-24.9
52.12(1.41, 3.19)
0.001
A B E F G
cancer death
Patel,A.V.,2003,BRE16299
usa, Post-menopausalCPS-II US cohort, 1982-1998
(63) 780 UnspecifiedProspectiveCohort
72608.0 5.0 years MET-hour/week
Breast cancer Post-menopausal& Lean
>31.5vs.0-7
50.75(0.55, 1.03)
A B C D E F G
incidence
318

Author, Year,WCRF Code
Country, Ethnicity, Specialcharacteristics
Age Cases n Caseascertainment
Type of studyNon-Cases n
Lenght offollow-up / loss
Assessmentdetail
Additional details Unit Outcome Subgroup Contrast Nocat. OR (95% CI) p
valueptrend A B C D E F G
adjustments
Patel,A.V.,2003,BRE16299
usa, Post-menopausalCPS-II US cohort, 1982-1998
(63) 453 UnspecifiedProspectiveCohort
72608.0 5.0 years MET-hour/week
Breast cancer Post-menopausal&Overweight
>31.5vs.0-7
50.9(0.57, 1.4)
A B C D E F G
incidence
Lahmann, Petra,H.,2003,BRE20119
Sweden, White, Post-menopausalMalmo Diet and Cancer,1991
50 - 73 236 By MailProspectiveCohort
12159.0 5.7 years Kg/m*m
Invasive & In situ breastcancer >28.6
vs.<21.9
51.54(1.01, 2.35)
0.023
A C D E F G
incidence
Feigelson, H.S.,2004,BRE02721
usa, Post-menopausalCPS-II US cohort, 1982-1998
50 - 74 1182 By MailProspectiveCohort
62756.0 9.0 years / 0.9 post-menopausal Kg/m*m
Breast cancer
HRT - No>=35vs.<22
61.61(1.22, 2.18)
0.0001
A B C D E F G
incidence
Feigelson, H.S.,2004,BRE02721
usa, Post-menopausalCPS-II US cohort, 1982-1998
50 - 74 752 By MailProspectiveCohort
62756.0 9.0 years / 0.9 post-menopausal Kg/m*m
Breast cancer
HRT - Yes>=35vs.<22
61.09(0.7, 1.69)
0.12 A B C D E F G
incidence
LahmannPH,2004,BRE15804
EUROPEEuropean ProspectiveInvestigation into Cancer andNutrition (EPIC) 1993-1998
18 - 80 494Otherprocedure
ProspectiveCohort
23820 4.7 years Kg/m*m
Breast cancer
HRT - Yes>28.8vs.<21.5
50.71(0.5, 1.01)
0.073
A B C E G
incidence
LahmannPH,2004,BRE15804
EUROPEEuropean ProspectiveInvestigation into Cancer andNutrition (EPIC) 1993-1998
18 - 80 494Otherprocedure
ProspectiveCohort
23820 4.7 years Kg/m*m
Breast cancer
HRT - Yes>30vs.<25
30.66(0.45, 0.98)
0.064
A B C E G
incidence
LahmannPH,2004,BRE15804
EUROPEEuropean ProspectiveInvestigation into Cancer andNutrition (EPIC) 1993-1998
18 - 80 494Otherprocedure
ProspectiveCohort
23820 4.7 years unit
Breast cancer
HRT - Yes1.0(continuous)
10.99(0.96, 1.01)
A B C E G
incidence
Wirfalt,E.,2004,BRE17083
Sweden, Not specified, Post-menopausalMalmo Diet and Cancer,1991
50 - By Mail7-day Record +Questionnaire
Nested CaseControl
12803.0 8.0 yearsBreast cancer
Post-menopausal
1null(null, null)
incidence
Tehard,B.,2004,BRE12173
France, Registered teachersE3N-EPIC, 1990
40 - 65 680
Through socialorganization(profession,religion)
ProspectiveCohort
217093 9.7 yearsInvasive breast cancer
HRT - YesQuantile nullvs.Quantile null
4null(null, null)
B C E F G
incidence
Tehard,B.,2004,BRE12173
France, Registered teachersE3N-EPIC, 1990
40 - 65 1311
Through socialorganization(profession,religion)
ProspectiveCohort
455107 9.7 years Kg/m*m
Invasive breast cancerPost-menopausal
quartile 4-bvs.quartile 1
51.15(1.0, 1.34)
B C E F G
incidence
Macinnis, R.J etal.,2004,BRE80159
Australia, australian, southeuropean (Greek, Italian),Post menopausalMelbourne Collaborative
medical recordsProspectiveCohort
0.0 BMI, WHO categories
Invasive breast cancerPost-menopausal
>30.0vs.<24.0
31.4(1.0, 1.9)
A B F G
incidence
Macinnis, R.J etal.,2004,BRE80159
Australia, australian, southeuropean (Greek, Italian),Post menopausalMelbourne Collaborative
medical recordsProspectiveCohort
0.0 BMI Kg/m*m
Invasive breast cancerPost-menopausal
5.0(continuous)
11.14(1.02, 1.27)
0.02 A B F G
incidence
Silvera, S.A.,2005,BRE24118
Canada, Not specifiedCanadian National BreastScreening Study
40 - 59 662
Through healthorg. (screening,healthinsurance)
FFQ-Semi-quantitative
ProspectiveCohort
2244616 16.4 years Kg/m*m
Breast cancerPost-menopausal
>30.0vs.<24.0
41.26(0.95, 1.67)
0.08 A C E F G
incidence
319

Author, Year,WCRF Code
Country, Ethnicity, Specialcharacteristics
Age Cases n Caseascertainment
Type of studyNon-Cases n
Lenght offollow-up / loss
Assessmentdetail
Additional details Unit Outcome Subgroup Contrast Nocat. OR (95% CI) p
valueptrend A B C D E F G
adjustments
Kuriyama,S.,2005,BRE22995
JapanMiyagi, 1993
40 - 65Generalpopulation(survey)
Questionnaire(nos)
ProspectiveCohort
15054.0 9.0 years Kg/m*m
Breast cancerPost-menopausal
>30vs.18,5-24,9
42.67(1.03, 6.92)
0.01 A C E G
incidence
Silvera, S. A.N.,2005,BRE24118
CanadaNBSS, 1980
40 - 59 662
Through healthorg. (screening,healthinsurance)
FFQ (nos)ProspectiveCohort
2244616 16.4 years Kg/m*m
Breast cancerPost-menopausal
>30vs.<25
31.26(0.95, 1.67)
0.08 A C E F G
incidence
Mellemkjoer etal.,2006,BRE80039
Danmark, Post-menopausalDiet, Cancer and Health,1993
50 - 65 416 Cancer registry FFQProspectiveCohort
11576 6.1 years BMI Kg/m*m
Breast cancer
HRT ever30vs.18.5- <25
40.94(0.67, 1.31)
A B C E F G
incidence
Mellemkjoer etal.,2006,BRE80039
Danmark, Post-menopausalDiet, Cancer and Health,1993
50 - 65 416 Cancer registry FFQProspectiveCohort
11576 6.1 years BMI Kg/m*m
Breast cancer
HRT ever4.0(continuous)
10.98(0.89, 1.09)
0.74 A B C E F G
incidence
Mellemkjoer etal.,2006,BRE80039
Danmark, Post-menopausalDiet, Cancer and Health,1993
50 - 65 217 Cancer registry FFQProspectiveCohort
11579 6.1 years BMI Kg/m*m
Breast cancer
HRT never>=30vs.18.5 - <25
41.17(0.79, 1.73)
A B C E G
incidence
Mellemkjoer etal.,2006,BRE80039
Danmark, Post-menopausalDiet, Cancer and Health,1993
50 - 65 217 Cancer registry FFQProspectiveCohort
11579 6.1 years BMI Kg/m*m
Breast cancer
HRT never4.0(continuous)
11.06(0.95, 1.19)
0.28 A B C E G
incidence
TehardB.,2006,BRE80103
FranceE3N-EPIC, 1990
40 - 65 271
patientrecords/directcontact/healthinsurance
FFQProspectiveCohort
98997.0 4.2 years / 0.33 BMI
Breast cancer Post-menop& HRTnonusers
>25.1vs.<19.9
41.07(0.8, 1.43)
>0.05
A B C E F G
incidence
TehardB.,2006,BRE80103
FranceE3N-EPIC, 1990
40 - 65 271
patientrecords/directcontact/healthinsurance
FFQProspectiveCohort
98997.0 4.2 years / 0.33 BMI, WHO criteria
Breast cancer Post-menop& HRTnonusers
>30.0vs.18.5 - 24.9
41.4(0.91, 2.17)
>0.05
A B C E F G
incidence
TehardB.,2006,BRE80103
FranceE3N-EPIC, 1990
40 - 65 472
patientrecords/directcontact/healthinsurance
FFQProspectiveCohort
98997.0 4.2 years / 0.33 BMI
Breast cancerPost-menop& HRT users
>25.0vs.<19.9
41.16(0.9, 1.49)
>0.05
A B C E F G
incidence
TehardB.,2006,BRE80103
FranceE3N-EPIC, 1990
40 - 65 472
patientrecords/directcontact/healthinsurance
FFQProspectiveCohort
98997.0 4.2 years / 0.33 BMI, WHO criteria
Breast cancerPost-menop& HRT users
>30.0vs.18.5 - 24.9
41.45(0.9, 2.33)
>0.05
A B C E F G
incidence
TehardB.,2006,BRE80103
FranceE3N-EPIC, 1990
40 - 65 147
patientrecords/directcontact/healthinsurance
FFQProspectiveCohort
98997.0 4.2 years / 0.33 BMI
Breast cancer Post-menop&transdermalHRT users
>25.1vs.<19.9
41.16(0.71, 1.78)
>0.05
A B C E F G
incidence
LukanovaA.,2006,BRE80100
Sweden, WhiteNorthern Sweden Health andDisease Cohort, 1985
29 - 61 422 medical recordsProspectiveCohort
74207.0 8.2 years / 0.03 BMI, baseline BMI
Breast cancerPost-menopausal
>27.9vs.18.5 - 22.7
41.04(0.8, 1.36)
0.83 A G
incidence
TehardB.,2006,BRE80103
FranceE3N-EPIC, 1990
40 - 65 1037
patientrecords/directcontact/healthinsurance
FFQProspectiveCohort
98997.0 4.2 years / 0.33 BMI
Breast cancerPost-menopausal
>25.1vs.<19.9
41.21(0.96, 1.52)
>0.05
A B C E F G
incidence
320

Author, Year,WCRF Code
Country, Ethnicity, Specialcharacteristics
Age Cases n Caseascertainment
Type of studyNon-Cases n
Lenght offollow-up / loss
Assessmentdetail
Additional details Unit Outcome Subgroup Contrast Nocat. OR (95% CI) p
valueptrend A B C D E F G
adjustments
TehardB.,2006,BRE80103
FranceE3N-EPIC, 1990
40 - 65 1037
patientrecords/directcontact/healthinsurance
FFQProspectiveCohort
98997.0 4.2 years / 0.33 BMI, WHO criteria
Breast cancerPost-menopausal
>30.0vs.18.5 - 24.9
41.44(1.04, 1.99)
>0.05
A B C E F G
incidence
ChangS.C.,2006,BRE80110
United States, participants ofa RCTPLCO Cancer ScreeningTrial cohort, 1993
55 - 74 764Cancerscreeningprogramme
FFQ (nos)ProspectiveCohort
38660.0 9.3 years BMI
Breast cancerPost-menopausal
>=30.0vs.<=22.4
51.35(1.06, 1.7)
0.014
B C D F G
incidence
Ravn-Haren, G. etal.,2006,BRE80151
Denmark, Post menopausalDiet, Cancer and Health,1993
50 - 64 377 Cancer registry FFQNested CaseControl
377 BMI Kg/m*m
Breast cancerPost-menopausal
1.0(continuous)
11.02(0.99, 1.06)
B C E F G
incidence
Suzuki,R.,2006,BRE80116
Sweden, Post-menopausalThe Swedish MammographyCohort, 1987
- 70 (60) 609 Cancer registryProspectiveCohort
90303.0 BMI
Breast cancer ER+/PR+ FamilyHistory BC -No
Obesevs.Underweight/normal
31.82(1.45, 2.29)
<0.0001
A B C D E F G
incidence
Suzuki,R.,2006,BRE80116
Sweden, Post-menopausalThe Swedish MammographyCohort, 1987
- 70 (60) 107 Cancer registryProspectiveCohort
90303.0 BMI
Breast cancer ER+/PR+ FamilyHistory BC -Yes
Obesevs.Underweight/normal
30.87(0.43, 1.78)
0.88 A B C D E F G
incidence
Suzuki,R.,2006,BRE80116
Sweden, Post-menopausalThe Swedish MammographyCohort, 1987
- 70 (60) 299 Cancer registryProspectiveCohort
90303.0 BMI
Breast cancer ER+/PR+ Post-menop& HRTnonusers
Obesevs.Underweight/normal
31.9(1.38, 2.61)
<0.0001
A B C D E F G
incidence
Suzuki,R.,2006,BRE80116
Sweden, Post-menopausalThe Swedish MammographyCohort, 1987
- 70 (60) 243 Cancer registryProspectiveCohort
90303.0 BMI
Breast cancer ER+/PR+Post-menop& HRT users
Obesevs.Underweight/normal
31.18(0.78, 1.81)
0.32 A B C D E F G
incidence
Suzuki,R.,2006,BRE80116
Sweden, Post-menopausalThe Swedish MammographyCohort, 1987
- 70 (60) 716 Cancer registryProspectiveCohort
90303.0 BMI
Breast cancer ER+/PR+Post-menopausal
Obesevs.Normalweight
41.67(1.34, 2.07)
<0.0001
A B C D E F G
incidence
Suzuki,R.,2006,BRE80116
Sweden, Post-menopausalThe Swedish MammographyCohort, 1987
- 70 (60) 250 Cancer registryProspectiveCohort
90303.0 BMI
Breast cancer ER+/PR- FamilyHistory BC -No
Obesevs.Underweight/normal
30.8(0.51, 1.25)
0.16 A B C D E F G
incidence
Suzuki,R.,2006,BRE80116
Sweden, Post-menopausalThe Swedish MammographyCohort, 1987
- 70 (60) 29 Cancer registryProspectiveCohort
90303.0 BMI
Breast cancer ER+/PR- FamilyHistory BC -Yes
Obesevs.Underweight/normal
30.26(0.03, 1.95)
0.14 A B C D E F G
incidence
Suzuki,R.,2006,BRE80116
Sweden, Post-menopausalThe Swedish MammographyCohort, 1987
- 70 (60) 102 Cancer registryProspectiveCohort
90303.0 BMI
Breast cancer ER+/PR- Post-menop& HRTnonusers
Obesevs.Underweight/normal
30.92(0.5, 1.69)
0.61 A B C D E F G
incidence
Suzuki,R.,2006,BRE80116
Sweden, Post-menopausalThe Swedish MammographyCohort, 1987
- 70 (60) 123 Cancer registryProspectiveCohort
90303.0 BMI
Breast cancer ER+/PR-Post-menop& HRT users
Obesevs.Underweight/normal
30.59(0.27, 1.29)
0.14 A B C D E F G
incidence
Suzuki,R.,2006,BRE80116
Sweden, Post-menopausalThe Swedish MammographyCohort, 1987
- 70 (60) 279 Cancer registryProspectiveCohort
90303.0 BMI
Breast cancer ER+/PR-Post-menopausal
Obesevs.Normalweight
40.76(0.49, 1.17)
.096 A B C D E F G
incidence
321

Author, Year,WCRF Code
Country, Ethnicity, Specialcharacteristics
Age Cases n Caseascertainment
Type of studyNon-Cases n
Lenght offollow-up / loss
Assessmentdetail
Additional details Unit Outcome Subgroup Contrast Nocat. OR (95% CI) p
valueptrend A B C D E F G
adjustments
Suzuki,R.,2006,BRE80116
Sweden, Post-menopausalThe Swedish MammographyCohort, 1987
- 70 (60) 122 Cancer registryProspectiveCohort
90303.0 BMI
Breast cancer ER-/PR- FamilyHistory BC -No
Obesevs.Underweight/normal
30.33(0.13, 0.82)
0.04 A B C D E F G
incidence
Suzuki,R.,2006,BRE80116
Sweden, Post-menopausalThe Swedish MammographyCohort, 1987
- 70 (60) 21 Cancer registryProspectiveCohort
90303.0 BMI
Breast cancer ER-/PR- FamilyHistory BC -Yes
Obesevs.Underweight/normal
31.87(0.55, 6.32)
0.42 A B C D E F G
incidence
Suzuki,R.,2006,BRE80116
Sweden, Post-menopausalThe Swedish MammographyCohort, 1987
- 70 (60) 66 Cancer registryProspectiveCohort
90303.0 BMI
Breast cancer ER-/PR- Post-menop& HRTnonusers
Obesevs.Underweight/normal
30.43(0.15, 1.23)
0.15 A B C D E F G
incidence
Suzuki,R.,2006,BRE80116
Sweden, Post-menopausalThe Swedish MammographyCohort, 1987
- 70 (60) 34 Cancer registryProspectiveCohort
90303.0 BMI
Breast cancer ER-/PR-Post-menop& HRT users
Obesevs.Underweight/normal
30.84(0.24, 2.87)
0.77 A B C D E F G
incidence
Suzuki,R.,2006,BRE80116
Sweden, Post-menopausalThe Swedish MammographyCohort, 1987
- 70 (60) 143 Cancer registryProspectiveCohort
90303.0 BMI
Breast cancer ER-/PR-Post-menopausal
Obesevs.Normalweight
40.52(0.26, 1.04)
0.099
A B C D E F G
incidence
RinaldiS.,2006,BRE80101
The Netherlands, UK,Germany, Spain, Italy,Greece, France, Post-menopausal
613
Populationcancerregistries andother
Nested CaseControl
1139 BMI Kg/m*m
Invasive & In situ breastcancer Post-
menopausal5.0(continuous)
11.11(0.99, 1.25)
C
incidence
KrebsE.E.,2006,BRE80106
United States, White, Post-menopausalStudy of OsteoporoticFractures, 1986
65 - (74)Self reportverified bymedical record
FFQProspectiveCohort
9704.0 11.3 years / 0.23 BMI
Invasive breast cancerage >=70years
>29.0vs.<23.0
41.33(0.9, 1.98)
A B C D F G
incidence
Suzuki,R.,2006,BRE80116
Sweden, Post-menopausalThe Swedish MammographyCohort, 1987
- 70 (60) 1109 Cancer registryProspectiveCohort
90303.0 BMI
Invasive breast cancer FamilyHistory BC -No
Obesevs.Underweight/normal
31.33(1.11, 1.6)
0.002
A B C D E F G
incidence
Suzuki,R.,2006,BRE80116
Sweden, Post-menopausalThe Swedish MammographyCohort, 1987
- 70 (60) 175 Cancer registryProspectiveCohort
90303.0 BMI
Invasive breast cancer FamilyHistory BC -Yes
Obesevs.Underweight/normal
30.88(0.51, 1.51)
0.87 A B C D E F G
incidence
Suzuki,R.,2006,BRE80116
Sweden, Post-menopausalThe Swedish MammographyCohort, 1987
- 70 (60) 528 Cancer registryProspectiveCohort
90303.0 BMI
Invasive breast cancer Post-menop& HRTnonusers
Obesevs.Underweight/normal
31.38(1.07, 1.77)
0.009
A B C D E F G
incidence
Modugno, F. etal.,2006,BRE80137
United States, Multi-ethnic,Post menopausalWomen's Health Initiative(WHI) Observational Study,
50 - 79 94Self reportverified bymedical record
FFQNested CaseControl
94 7.0 years BMI
Invasive breast cancer Post-menop& HRTnonusers
Quantile 3vs.Quantile 1
33.27(1.4, 8.4)
0.006
A B E G
incidence
Suzuki,R.,2006,BRE80116
Sweden, Post-menopausalThe Swedish MammographyCohort, 1987
- 70 (60) 446 Cancer registryProspectiveCohort
90303.0 BMI
Invasive breast cancerPost-menop& HRT users
Obesevs.Underweight/normal
31.04(0.75, 1.45)
0.55 A B C D E F G
incidence
Modugno, F. etal.,2006,BRE80137
United States, Multi-ethnic,Post menopausalWomen's Health Initiative(WHI) Observational Study,
50 - 79 96Self reportverified bymedical record
FFQNested CaseControl
96 7.0 years BMI
Invasive breast cancerPost-menop& HRT users
Quantile 3vs.Quantile 1
31.47(0.67, 3.22)
0.36 A C G
incidence
322

Author, Year,WCRF Code
Country, Ethnicity, Specialcharacteristics
Age Cases n Caseascertainment
Type of studyNon-Cases n
Lenght offollow-up / loss
Assessmentdetail
Additional details Unit Outcome Subgroup Contrast Nocat. OR (95% CI) p
valueptrend A B C D E F G
adjustments
KrebsE.E.,2006,BRE80106
United States, White, Post-menopausalStudy of OsteoporoticFractures, 1986
65 - (74) 350Self reportverified bymedical record
FFQProspectiveCohort
9704.0 11.3 years / 0.23 BMI
Invasive breast cancerPost-menopausal
>29.0vs.<23.0
41.29(0.92, 1.81)
0.06 A B C D F G
incidence
KrebsE.E.,2006,BRE80106
United States, White, Post-menopausalStudy of OsteoporoticFractures, 1986
65 - (74) 350Self reportverified bymedical record
FFQProspectiveCohort
9704.0 11.3 years / 0.23 BMI, clinical cutpoints
Invasive breast cancerPost-menopausal
obesevs.non-overweight
31.55(1.13, 2.13)
A B C D F G
incidence
Suzuki,R.,2006,BRE80116
Sweden, Post-menopausalThe Swedish MammographyCohort, 1987
- 70 (60) 1284 Cancer registryProspectiveCohort
90303.0 BMI
Invasive breast cancerPost-menopausal
Obesevs.Normalweight
41.28(1.07, 1.52)
0.0046
A B C D E F G
incidence
Ahn, J. etal.,2007,BRE80139
United States, Multi-ethnic,Post menopausalNIH- AARP Diet and HealthStudy
50 - (63) 1162 Cancer registryProspectiveCohort
99039.0 4.0 4 years Current BMI
Breast cancerCurrent MHTusers
>=40.0vs.18.5-22.4
81.1(0.64, 1.88)
0.22 A B C D E F G
incidence
Ahn, J. etal.,2007,BRE80139
United States, Multi-ethnic,Post menopausalNIH- AARP Diet and HealthStudy
50 - (63) 420 Cancer registryProspectiveCohort
99039.0 4.0 4 years Current BMI
Breast cancer MHTnonusers &age atmenarche
>=35.0vs.<25.0
41.52(1.07, 2.15)
<0.001
A B C D E F G
incidence
Ahn, J. etal.,2007,BRE80139
United States, Multi-ethnic,Post menopausalNIH- AARP Diet and HealthStudy
50 - (63) 382 Cancer registryProspectiveCohort
99039.0 4.0 4 years Current BMI
Breast cancer MHTnonusers &age atmenarche
>=35.0vs.<25.0
41.97(1.33, 2.91)
<0.001
A B C D E F G
incidence
Ahn, J. etal.,2007,BRE80139
United States, Multi-ethnic,Post menopausalNIH- AARP Diet and HealthStudy
50 - (63) 57 Cancer registryProspectiveCohort
99039.0 4.0 4 years Current BMI
Breast cancer MHTnonusers &age atmenarche
>=35.0vs.<25.0
41.43(0.57, 3.58)
0.83 A B C D E F G
incidence
Ahn, J. etal.,2007,BRE80139
United States, Multi-ethnic,Post menopausalNIH- AARP Diet and HealthStudy
50 - (63) 75 Cancer registryProspectiveCohort
99039.0 4.0 4 years Current BMI
Breast cancer MHTnonusers &age atmenarche
>=35.0vs.<25.0
43.25(1.44, 7.36)
<0.001
A B C D E F G
incidence
Ahn, J. etal.,2007,BRE80139
United States, Multi-ethnic,Post menopausalNIH- AARP Diet and HealthStudy
50 - (63) 948 Cancer registryProspectiveCohort
99039.0 4.0 4 years Current BMI
Breast cancernon MHTusers
>=40.0vs.18.5-22.4
82.08(1.44, 2.99)
<0.001
A B C D E F G
incidence
Lundqvist etal,2007,BRE80003
Sweden/FinlandSweden,Finland Co-twinstudy,1975
(44) 172Nested CaseControl
172
Baseline BMI, co-twincontrol analyses formonozygotic twins,Finland & Sweden
Kg/m*m
Breast cancer older (meanage :57/58yrs),Monozygotic
>=30vs.18.5-<25
41.7(0.5, 5.1)
B C G
incidence
Lundqvist etal,2007,BRE80002
Sweden/FinlandSweden,Finland Co-twinstudy,1975
(44) 756 Cancer registryProspectiveCohort
24065 25.2 yearsBaseline BMI, cohortanalysis, Swedish andFininsh twin registries
Kg/m*m
Breast canceroldersubjects
>=30vs.18.5 -<25
41.3(1.0, 1.7)
A B G
incidence
Lundqvist etal,2007,BRE80002
Sweden/FinlandSweden,Finland Co-twinstudy,1975
(44) 756 Cancer registryProspectiveCohort
24065 25.2 yearsBaseline BMI, cohortanalysis, Swedish andFininsh twin registries
Kg/m*m
Breast canceroldersubjects
1.0(continuous)
11.03(1.01, 1.05)
0.007
A B C G
incidence
Lundqvist etal,2007,BRE80003
Sweden/FinlandSweden,Finland Co-twinstudy,1975
(44) 503Nested CaseControl
503Baseline BMI, co-twincontrol analysis,Finland & Sweden
Kg/m*m
Breast canceroldersubjects
>=30vs.18.5- <25
42.5(1.3, 4.5)
B C G
incidence
323

Author, Year,WCRF Code
Country, Ethnicity, Specialcharacteristics
Age Cases n Caseascertainment
Type of studyNon-Cases n
Lenght offollow-up / loss
Assessmentdetail
Additional details Unit Outcome Subgroup Contrast Nocat. OR (95% CI) p
valueptrend A B C D E F G
adjustments
Lundqvist etal,2007,BRE80003
Sweden/FinlandSweden,Finland Co-twinstudy,1975
(44) 503Nested CaseControl
503Baseline BMI, co-twinanalysis, Finland &Sweden
Kg/m*m
Breast canceroldersubjects
1.0(continuous)
11.09(1.04, 1.15)
0.01 B C G
incidence
Lundqvist etal,2007,BRE80003
Sweden/FinlandSweden,Finland Co-twinstudy,1975
(44) 320Nested CaseControl
320
Baseline BMI, co-twincontrol analyses fordizygotic twins, Finland& Sweden
Kg/m*m
Breast cancer older(meanage :57/58yrs),Dizygotic
>=30vs.18.5-24
42.7(1.2, 5.7)
B C G
incidence
Palmer, J.R. etal.,2007,BRE80122
United States, BlackBlack Women's HealthStudy, 1995
21 - 69 165
death certificate/ patientrecords / selfreport
FFQProspectiveCohort
59000.0 10.0 years / 0.2 Current BMI
Breast cancer Post-menop& HRTnonusers
>=35vs.<25
41.12(0.66, 1.9)
A B C D F G
incidence
Reeves, G.K. etal.,2007,BRE80146
United KingdomThe Million Women Study,1996
50 - 64 5629National HealthRecords
ProspectiveCohort
1222630.0
5.4 years BMI
Breast cancer Post-menop& HRTnonusers
>30.0vs.22.5 - 24.9
51.29(1.22, 1.36)
A B C E G
incidence
Reeves, G.K. etal.,2007,BRE80146
United KingdomThe Million Women Study,1996
50 - 64 637National HealthRecords
ProspectiveCohort
1222630.0
5.4 years BMI
Breast cancer Post-menop& HRTnonusers
>30.0vs.22.5 - 24.9
51.49(1.27, 1.75)
A B C E G
cancer death
Palmer, J.R. etal.,2007,BRE80122
United States, BlackBlack Women's HealthStudy, 1995
21 - 69 454
death certificate/ patientrecords / selfreport
FFQProspectiveCohort
59000.0 10.0 years / 0.2 Current BMI
Breast cancerPost-menopausal
>=35vs.<25
40.99(0.72, 1.36)
A B C D F G
incidence
Vogel, U. etal.,2007,BRE80150
Denmark, Post menopausalDiet, Cancer and Health,1993
50 - 64 361 Cancer registry FFQNested CaseControl
361 BMI Kg/m*m
Breast cancerPost-menopausal
1.0(continuous)
11.01(0.97, 1.05)
B C E F G
incidence
Reeves, G.K. etal.,2007,BRE80146
United KingdomThe Million Women Study,1996
50 - 64 2855National HealthRecords
ProspectiveCohort
1222630.0
5.4 years BMI units
Breast cancer Postmenopausal neversmokers
10.0(continuous)
11.41(1.28, 1.55)
A B C E G
incidence
Iwasaki etal.,2007,BRE20027
JapanJPHC, 1990
40 - 69 229 Cancer registryQuestionnaire(nos)
ProspectiveCohort
53857.0 9.9 years / 0.05 BMI Kg/m*m
Breast cancerpostmenopausal women
30+vs.<19
72.28(0.94, 5.53)
0.08 A C D E
incidence
Iwasaki etal.,2007,BRE20027
JapanJPHC, 1990
40 - 69 65 Cancer registryQuestionnaire(nos)
ProspectiveCohort
29168 9.9 years / 0.05 BMI Kg/m*m
Breast cancer ER+postmenopausal women
1.0(continuous)
11.08(1.01, 1.15)
A C D E
incidence
Ahn, J. etal.,2007,BRE80139
United States, Multi-ethnic,Post menopausalNIH- AARP Diet and HealthStudy
50 - (63) 201 Cancer registryProspectiveCohort
99039.0 4.0 4 years Current BMI
Breast cancer ER+/PR+non MHTusers
>=35.0vs.<25.0
42.69(1.62, 4.46)
<0.001
A B C D E F G
incidence
Palmer, J.R. etal.,2007,BRE80122
United States, BlackBlack Women's HealthStudy, 1995
21 - 69 84
death certificate/ patientrecords / selfreport
FFQProspectiveCohort
59000.0 10.0 years / 0.2 Current BMI
Breast cancer ER+/PR+Post-menopausal
>=30vs.<25
31.66(0.86, 3.21)
A B C D F G
incidence
Iwasaki etal.,2007,BRE20027
JapanJPHC, 1990
40 - 69 Cancer registryQuestionnaire(nos)
ProspectiveCohort
53857.0 9.9 years / 0.05 BMI Kg/m*m
Breast cancer ER+/PR+postmenopausal women
1.0(continuous)
11.1(1.01, 1.18)
A C D E
incidence
324

Author, Year,WCRF Code
Country, Ethnicity, Specialcharacteristics
Age Cases n Caseascertainment
Type of studyNon-Cases n
Lenght offollow-up / loss
Assessmentdetail
Additional details Unit Outcome Subgroup Contrast Nocat. OR (95% CI) p
valueptrend A B C D E F G
adjustments
Ahn, J. etal.,2007,BRE80139
United States, Multi-ethnic,Post menopausalNIH- AARP Diet and HealthStudy
50 - (63) 44 Cancer registryProspectiveCohort
99039.0 4.0 4 years Current BMI
Breast cancer ER+/PR-non MHTusers
>=35.0vs.<25.0
40.75(0.2, 2.75)
0.39 A B C D E F G
incidence
Palmer, J.R. etal.,2007,BRE80122
United States, BlackBlack Women's HealthStudy, 1995
21 - 69 36
death certificate/ patientrecords / selfreport
FFQProspectiveCohort
59000.0 10.0 years / 0.2 Current BMI
Breast cancer ER+/PR- orER-/PR+ Post-
menopausal
>=30vs.<25
30.39(0.14, 1.07)
A B C D F G
incidence
Iwasaki etal.,2007,BRE20027
JapanJPHC, 1990
40 - 69 41 Cancer registryQuestionnaire(nos)
ProspectiveCohort
29168 9.9 years / 0.05 BMI Kg/m*m
Breast cancer ER-postmenopausal women
1.0(continuous)
10.95(0.84, 1.06)
A C D E
incidence
Ahn, J. etal.,2007,BRE80139
United States, Multi-ethnic,Post menopausalNIH- AARP Diet and HealthStudy
50 - (63) 53 Cancer registryProspectiveCohort
99039.0 4.0 4 years Current BMI
Breast cancer ER-/PR-non MHTusers
>=35.0vs.<25.0
40.33(0.09, 1.19)
0.06 A B C D E F G
incidence
Palmer, J.R. etal.,2007,BRE80122
United States, BlackBlack Women's HealthStudy, 1995
21 - 69 52
death certificate/ patientrecords / selfreport
FFQProspectiveCohort
59000.0 10.0 years / 0.2 Current BMI
Breast cancer ER-/PR-Post-menopausal
>=30vs.<25
30.88(0.39, 1.97)
A B C D F G
incidence
Iwasaki etal.,2007,BRE20027
JapanJPHC, 1990
40 - 69 Cancer registryQuestionnaire(nos)
ProspectiveCohort
53857.0 9.9 years / 0.05 BMI Kg/m*m
Breast cancer ER-/PR-postmenopausal women
1.0(continuous)
10.98(0.87, 1.1)
A C D E
incidence
Iwasaki etal.,2007,BRE20027
JapanJPHC, 1990
40 - 69 46 Cancer registryQuestionnaire(nos)
ProspectiveCohort
29168 9.9 years / 0.05 BMI Kg/m*m
Breast cancer PR+postmenopausal women
1.0(continuous)
11.07(0.98, 1.16)
A C D E
incidence
Iwasaki etal.,2007,BRE20027
JapanJPHC, 1990
40 - 69 55 Cancer registryQuestionnaire(nos)
ProspectiveCohort
29168 9.9 years / 0.05 BMI Kg/m*m
Breast cancer PR-postmenopausal women
1.0(continuous)
11.01(0.93, 1.1)
A C D E
incidence
Ahn, J. etal.,2007,BRE80139
United States, Multi-ethnic,Post menopausalNIH- AARP Diet and HealthStudy
50 - (63) 189 Cancer registryProspectiveCohort
99039.0 4.0 4 years Current BMI
Breast cancer UnknownER/PR status non MHT
users
>=35.0vs.<25.0
42.08(1.25, 3.45)
0.003
A B C D E F G
incidence
Reinier etal.,2007,BRE80038
USAVermont MammographyCohort, 1996
176screeningexaminations
ProspectiveCohort
61844.0 3.1 years BMI Kg/m*m
In situ breast cancerpostmenopausal women
30vs.<22
50.8(0.5, 1.4)
A C F G
incidence
Ahn, J. etal.,2007,BRE80139
United States, Multi-ethnic,Post menopausalNIH- AARP Diet and HealthStudy
50 - (63) 700 Cancer registryProspectiveCohort
99039.0 4.0 4 years Current BMI
In situ or localised breastcancer non MHT
users
>=35.0vs.<25.0
41.44(1.09, 1.91)
0.002
A B C D E F G
incidence
Gallicchio etal.,2007,BRE80006
America, Caucasian, Post-menopausalBBD cohort-CLUE II, 1989
(59) 14
CLUE IIcohort/pathology report/self-reported
ProspectiveCohort
276 14.0 years BMI
Invasive & In situ breastcancer LEPR
Gln233ArgAA
>=25vs.<25
21.0(0.34, 2.94)
A
incidence
Gallicchio etal.,2007,BRE80006
America, Caucasian, Post-menopausalBBD cohort-CLUE II, 1989
(59) 39
CLUE IIcohort/pathology report/self-reported
ProspectiveCohort
594 14.0 years BMI
Invasive & In situ breastcancer LEPR
Gln233ArgAG/GG
>=25vs.<25
21.73(0.88, 3.39)
A
incidence
325

Author, Year,WCRF Code
Country, Ethnicity, Specialcharacteristics
Age Cases n Caseascertainment
Type of studyNon-Cases n
Lenght offollow-up / loss
Assessmentdetail
Additional details Unit Outcome Subgroup Contrast Nocat. OR (95% CI) p
valueptrend A B C D E F G
adjustments
Gallicchio etal.,2007,BRE80006
America, Caucasian, Post-menopausalBBD cohort-CLUE II, 1989
(59) 23
CLUE IIcohort/pathology report/self-reported
ProspectiveCohort
333 14.0 years BMI
Invasive & In situ breastcancer LEPR
IVS2+6890AG/AA
>=25vs.<25
21.53(0.64, 3.65)
A
incidence
Gallicchio etal.,2007,BRE80006
America, Caucasian, Post-menopausalBBD cohort-CLUE II, 1989
(59) 33
CLUE IIcohort/pathology report/self-reported
ProspectiveCohort
571 14.0 years BMI
Invasive & In situ breastcancer LEPR
IVS2+6890GG
>=25vs.<25
21.46(0.71, 2.98)
A
incidence
Gallicchio etal.,2007,BRE80006
America, Caucasian, Post-menopausalBBD cohort-CLUE II, 1989
(59) 30
CLUE IIcohort/pathology report/self-reported
ProspectiveCohort
597 14.0 years BMI
Invasive & In situ breastcancer LEPR
IVS2+6920AG/AA
>=25vs.<25
21.91(0.89, 4.08)
A
incidence
Gallicchio etal.,2007,BRE80006
America, Caucasian, Post-menopausalBBD cohort-CLUE II, 1989
(59) 28
CLUE IIcohort/pathology report/self-reported
ProspectiveCohort
309 14.0 years BMI
Invasive & In situ breastcancer LEPR
IVS2+6920GG
>=25vs.<25
21.01(0.46, 2.2)
A
incidence
Gallicchio etal.,2007,BRE80006
America, Caucasian, Post-menopausalBBD cohort-CLUE II, 1989
(59) 7
CLUE IIcohort/pathology report/self-reported
ProspectiveCohort
205 14.0 years BMI
Invasive & In situ breastcancer LPL
Thr399ThrCA/AA
>=25vs.<25
22.23(0.42, 11.79)
A
incidence
Gallicchio etal.,2007,BRE80006
America, Caucasian, Post-menopausalBBD cohort-CLUE II, 1989
(59) 50
CLUE IIcohort/pathology report/self-reported
ProspectiveCohort
712 14.0 years BMI
Invasive & In situ breastcancer LPL
Thr399ThrCC
>=25vs.<25
21.31(0.7, 2.45)
A
incidence
Gallicchio etal.,2007,BRE80006
America, Caucasian, Post-menopausalBBD cohort-CLUE II, 1989
(59) 20
CLUE IIcohort/pathology report/self-reported
ProspectiveCohort
434 14.0 years BMI
Invasive & In situ breastcancer PON1
Gln192ArgCT/CC
>=25vs.<25
22.43(0.92, 6.45)
A
incidence
Gallicchio etal.,2007,BRE80006
America, Caucasian, Post-menopausalBBD cohort-CLUE II, 1989
(59) 38
CLUE IIcohort/pathology report/self-reported
ProspectiveCohort
468 14.0 years BMI
Invasive & In situ breastcancer PON1
Gln192ArgTT
>=25vs.<25
21.09(0.56, 2.11)
A
incidence
Gallicchio etal.,2007,BRE80006
America, Caucasian, Post-menopausalBBD cohort-CLUE II, 1989
(59) 31
CLUE IIcohort/pathology report/self-reported
ProspectiveCohort
524 14.0 years BMI
Invasive & In situ breastcancer PON2
Ala136GlyCC
>=25vs.<25
21.15(0.56, 2.39)
A
incidence
Gallicchio etal.,2007,BRE80006
America, Caucasian, Post-menopausalBBD cohort-CLUE II, 1989
(59) 22
CLUE IIcohort/pathology report/self-reported
ProspectiveCohort
367 14.0 years BMI
Invasive & In situ breastcancer PON2
Ala136GlyCG/GG
>=25vs.<25
21.7(0.7, 4.15)
A
incidence
Gallicchio etal.,2007,BRE80006
America, Caucasian, Post-menopausalBBD cohort-CLUE II, 1989
(59) 22
CLUE IIcohort/pathology report/self-reported
ProspectiveCohort
373 14.0 years BMI
Invasive & In situ breastcancer PON2
Ser299CysCG/CC
>=25vs.<25
21.72(0.71, 4.2)
A
incidence
Gallicchio etal.,2007,BRE80006
America, Caucasian, Post-menopausalBBD cohort-CLUE II, 1989
(59) 33
CLUE IIcohort/pathology report/self-reported
ProspectiveCohort
529 14.0 years BMI
Invasive & In situ breastcancer PON2
Ser299CysGG
>=25vs.<25
21.14(0.56, 2.3)
A
incidence
Gallicchio etal.,2007,BRE80006
America, Caucasian, Post-menopausalBBD cohort-CLUE II, 1989
(59) 50
CLUE IIcohort/pathology report/self-reported
ProspectiveCohort
687 14.0 years BMI
Invasive & In situ breastcancer PPARG
IVS3-6622CC
>=25vs.<25
21.08(0.61, 1.92)
A
incidence
326

Author, Year,WCRF Code
Country, Ethnicity, Specialcharacteristics
Age Cases n Caseascertainment
Type of studyNon-Cases n
Lenght offollow-up / loss
Assessmentdetail
Additional details Unit Outcome Subgroup Contrast Nocat. OR (95% CI) p
valueptrend A B C D E F G
adjustments
Gallicchio etal.,2007,BRE80006
America, Caucasian, Post-menopausalBBD cohort-CLUE II, 1989
(59) 50
CLUE IIcohort/pathology report/self-reported
ProspectiveCohort
687 14.0 years BMI
Invasive & In situ breastcancer PPARG
IVS3-6622CT/TT
>=25vs.<25
29.75(1.21, 78.33)
A
incidence
Gallicchio etal.,2007,BRE80006
America, Caucasian, Post-menopausalBBD cohort-CLUE II, 1989
(59) 24
CLUE IIcohort/pathology report/self-reported
ProspectiveCohort
370 14.0 years BMI
Invasive & In situ breastcancer PPARG
IVS9+4523AA
>=25vs.<25
21.19(0.52, 2.72)
A
incidence
Gallicchio etal.,2007,BRE80006
America, Caucasian, Post-menopausalBBD cohort-CLUE II, 1989
(59) 37
CLUE IIcohort/pathology report/self-reported
ProspectiveCohort
520 14.0 years BMI
Invasive & In situ breastcancer PPARG
IVS9+4523AG/GG
>=25vs.<25
21.76(0.87, 3.54)
A
incidence
Gallicchio etal.,2007,BRE80006
America, Caucasian, Post-menopausalBBD cohort-CLUE II, 1989
(59) 23
CLUE IIcohort/pathology report/self-reported
ProspectiveCohort
374 14.0 years BMI
Invasive & In situ breastcancer PPARG
IVS9+7780AA
>=25vs.<25
21.09(0.47, 2.54)
A
incidence
Gallicchio etal.,2007,BRE80006
America, Caucasian, Post-menopausalBBD cohort-CLUE II, 1989
(59) 38
CLUE IIcohort/pathology report/self-reported
ProspectiveCohort
522 14.0 years BMI
Invasive & In situ breastcancer PPARG
IVS9+7780AG/GG
>=25vs.<25
21.88(0.94, 3.76)
A
incidence
Gallicchio etal.,2007,BRE80006
America, Caucasian, Post-menopausalBBD cohort-CLUE II, 1989
(59) 48
CLUE IIcohort/pathology report/self-reported
ProspectiveCohort
688 14.0 years BMI
Invasive & In situ breastcancer PPARG
Pro12AlaCC
>=25vs.<25
21.08(0.6, 1.94)
A
incidence
Gallicchio etal.,2007,BRE80006
America, Caucasian, Post-menopausalBBD cohort-CLUE II, 1989
(59) 8
CLUE IIcohort/pathology report/self-reported
ProspectiveCohort
205 14.0 years BMI
Invasive & In situ breastcancer PPARG
Pro12AlaCG/GG
>=25vs.<25
27.41(0.89, 61.42)
A
incidence
Gallicchio etal.,2007,BRE80006
America, Caucasian, Post-menopausalBBD cohort-CLUE II, 1989
(59) 48
CLUE IIcohort/pathology report/self-reported
ProspectiveCohort
568 14.0 years BMI
Invasive & In situ breastcancer TNF-
1036T>CCC
>=25vs.<25
21.63(0.89, 2.97)
A
incidence
Gallicchio etal.,2007,BRE80006
America, Caucasian, Post-menopausalBBD cohort-CLUE II, 1989
(59) 11
CLUE IIcohort/pathology report/self-reported
ProspectiveCohort
145 14.0 years BMI
Invasive & In situ breastcancer TNF-
1036T>CCT/TT
>=25vs.<25
20.97(0.28, 3.34)
A
incidence
Gallicchio etal.,2007,BRE80006
America, Caucasian, Post-menopausalBBD cohort-CLUE II, 1989
(59) 24
CLUE IIcohort/pathology report/self-reported
ProspectiveCohort
330 14.0 years BMI
Invasive & In situ breastcancer TNF-
1210T>CCT/CC
>=25vs.<25
21.87(0.78, 4.49)
A
incidence
Gallicchio etal.,2007,BRE80006
America, Caucasian, Post-menopausalBBD cohort-CLUE II, 1989
(59) 34
CLUE IIcohort/pathology report/self-reported
ProspectiveCohort
584 14.0 years BMI
Invasive & In situ breastcancer TNF-
1210T>C TT
>=25vs.<25
21.23(0.61, 2.47)
A
incidence
Gallicchio etal.,2007,BRE80006
America, Caucasian, Post-menopausalBBD cohort-CLUE II, 1989
(59) 15
CLUE IIcohort/pathology report/self-reported
ProspectiveCohort
314 14.0 years BMI
Invasive & In situ breastcancer TNF-
487A>GGA/AA
>=25vs.<25
22.67(0.83, 8.57)
A
incidence
Gallicchio etal.,2007,BRE80006
America, Caucasian, Post-menopausalBBD cohort-CLUE II, 1989
(59) 44
CLUE IIcohort/pathology report/self-reported
ProspectiveCohort
591 14.0 years BMI
Invasive & In situ breastcancer TNF-
487A>G GG
>=25vs.<25
21.26(0.68, 2.34)
A
incidence
327

Author, Year,WCRF Code
Country, Ethnicity, Specialcharacteristics
Age Cases n Caseascertainment
Type of studyNon-Cases n
Lenght offollow-up / loss
Assessmentdetail
Additional details Unit Outcome Subgroup Contrast Nocat. OR (95% CI) p
valueptrend A B C D E F G
adjustments
Ericson, U. etal.,2007,BRE80128
Sweden, Post menopausalMalmo Diet and Cancer,1991
50 - 392 Cancer registryDietary Historyquestionnaire
ProspectiveCohort
11677 9.5 years BMI
Invasive breast cancerPost-menopausal
>30vs.<=25
31.19(0.89, 1.59)
0.41 A
incidence
Reinier etal.,2007,BRE80038
USAVermont MammographyCohort, 1996
572screeningexaminations
ProspectiveCohort
61844.0 3.1 years BMI Kg/m*m
Invasive breast cancerpostmenopausal women
30vs.<22
51.9(1.4, 2.5)
A C F G
incidence
Ahn, J. etal.,2007,BRE80139
United States, Multi-ethnic,Post menopausalNIH- AARP Diet and HealthStudy
50 - (63) 248 Cancer registryProspectiveCohort
99039.0 4.0 4 years Current BMI
Regional or distantmetastases non MHT
users
>=35.0vs.<25.0
43.05(1.97, 4.71)
<0.001
A B C D E F G
incidence
Menopausal status not specified
Tornberg, S.A.,1988,BRE12418
sweden, Not specified,Screening ProgramSwedish cohort, 1963
17 - 74
Through healthorg. (screening,healthinsurance)
ProspectiveCohort
46570.0 20.0 years Unit
Breast cancer1.0(continuous)
11.01(0.99, 1.03)
A G
incidence
Schatzkin,A.,1989,BRE18013
U.S.A., Not specifiedFramingham Study, 1948
31 - 64 143Generalpopulation(survey)
Interview (nos)ProspectiveCohort
2636.0 26.0 years / 86.2 Kg/m*m
Breast cancer >=28.8vs.<=21.7
50.6(0.4, 1.1)
A B C D E F G
incidence
Mills, P.K.,1989,BRE17837
USA, White, AdventistCalifornia Seventh-dayAdventists Cohort, 1976
25 - 99 189 By Mail FFQ (nos)ProspectiveCohort
97255 6.0 years / 1% Kg/m*m
Breast cancer >=25.2vs.<=21.7
31.56(1.07, 2.27)
0.03 A
incidence
Vatten, L.J.,1990,BRE12833
NorwayNorway National HealthScreening Service, 1974
Through healthorg. (screening,healthinsurance)
FFQ + recallProspectiveCohort
14593.0 12.0 years / 152 BMI at interview Kg/m*m
Breast cancer >24.0vs.<23.9
20.7(null, null)
0.03 A
incidence
Vatten, L.J.,1990,BRE12826
NorwayNorway National HealthScreening Service, 1974
35 - 51 236
Through healthorg. (screening,healthinsurance)
ProspectiveCohort
282181 11.9 years g/cm*cm
Breast cancer >2.68vs.<2.19
40.52(0.34, 0.77)
0.001
A
incidence
Overvad,1991,BRE17893
Guernsey, Not specifiedGuernsey, 1967
35 -Multipleprocedure
Case Cohort 5162.0 11.0 yearsBreast cancer
1null(null, null)
incidence
Hoyer, A.P.,1992,BRE04086
Denmark, Not specifiedGlostrup Population Studies,1982
30 - 80Direct contactat home
Questionnaire(nos)
ProspectiveCohort
5207.0 26.0 years Kg/m*m
Breast cancer >=33vs.<26
42.5(0.8, 7.2)
0.03mortality/incidence
Vatten, L.J.,1992,BRE12828
Norway, Not specified,Screening ProgramNorway, 1974
26 - 49 291
Through healthorg. (screening,healthinsurance)
ProspectiveCohort
366675 14.0 years Kg/m*m
Breast cancer >28.0vs.<21.0
40.78(0.65, 0.94)
0.002
A C G
incidence
Van den Brandt,P.A.,1993,BRE16919
the Netherlands, Notspecified, Post-menopausalwomenThe Netherlands Cohort
55 - 69 448 By MailFFQ-Semi-quantitative
ProspectiveCohort
53633.3 years / nolost Kg/m*m
Invasive breast cancer >=27vs.<=22
40.9(0.67, 1.2)
0.44 A
incidence
328

Author, Year,WCRF Code
Country, Ethnicity, Specialcharacteristics
Age Cases n Caseascertainment
Type of studyNon-Cases n
Lenght offollow-up / loss
Assessmentdetail
Additional details Unit Outcome Subgroup Contrast Nocat. OR (95% CI) p
valueptrend A B C D E F G
adjustments
Tornberg, S.A.,1994,BRE12417
Sweden, Not specified,Screening ProgramSweden, 1971
25 - 75
Through healthorg. (screening,healthinsurance)
ProspectiveCohort
47003.0 25.0 years continuous Kg/m*m
Breast cancer2.0(continuous)
11.01(0.97, 1.05)
A
incidence
Gaard,M.,1994,BRE03044
Norway, Not specified,Screening ProgramNorway National HealthScreening Service, 1974
20 - 54
Through healthorg. (screening,healthinsurance)
ProspectiveCohort
31209.0 13.0 years g/cm*cm
Breast cancer 2.66 - 5.27vs.<2.17
40.75(0.54, 1.04)
0.06 A
incidence
Knekt,P.,1996,BRE04900
Finland, Not specified,Screening ProgramFinland, 1966
15 - 90 87
Through healthorg. (screening,healthinsurance)
Dietary Historyquestionnaire
ProspectiveCohort
4692 25.0 years Kg/m*m
Breast cancer28.68 -99.99vs.0 - 20.94
50.47(0.21, 1.04)
A
incidence
Byrne,C.,1996,BRE05719
USA, Black and WhiteNHEFS, 1981/82
25 - 74 52 Unspecified FFQ (nos)ProspectiveCohort
23512 3.9 years / 252 Kg/m*m
Breast cancer >29.3vs.<22.34
41.3(0.6, 3.0)
A
incidence
Goodman, M.T.,1997,BRE03352
Japan, Not specified, Atomicbomb survivorsLSS, 1969
149 By MailQuestionnaire(nos)
ProspectiveCohort
167730 8.31 years Kg/m*m
Breast cancer >=24,67vs.<20
41.21(0.77, 1.19)
0.23 A G
incidence
Fraser, G.E.,1997,BRE02940
USA, White, AdventistAHS, 1974
24 -
Through socialorganization(profession,religion)
ProspectiveCohort
20341.0 6.0 years / 610 Kg/m*m
Invasive breast cancer >24.3vs.<=24.3
21.32(1.0, 1.77)
C F G
incidence
Galanis,D.J.,1998,BRE03058
hawaii, Multi-ethnicHawaii State Department ofHealth, 1975
(43) 378 By MailProspectiveCohort
22426 14.9 years / 0 BMI at interview Kg/m*m
Breast cancer >26.1vs.<19.5
51.8(1.3, 2.6)
0.0001
A B E G
incidence
Wolk,A.,1998,BRE13548
Sweden, Not specified,Screening ProgramThe Swedish MammographyCohort, 1987
40 - 76
Through healthorg. (screening,healthinsurance)
FFQ (nos)ProspectiveCohort
61147.0 4.2 years Kg/m*m
Invasive breast cancer1.0(continuous)
11.024(1.004,1.043)
0.02 B C F
incidence
Key, T.J.,1999,BRE04758
Japan, Not specifiedLSS, 1969
427 By MailQuestionnaire(nos)
ProspectiveCohort
488990 24.0 years Kg/m*m
Breast cancer >=25vs.<20
51.37(1.02, 1.84)
0.05 A G
incidence
Wu, K.,1999,BRE13618
USA, Not specified, BlooddonorsCLUE I, 1974
18 - 90 133Throughnetwork, paper,tv
Questionnaire(nos)
Nested CaseControl
133 21.0 years Kg/m*m
Breast cancer >=26vs.<=22
40.75(0.32, 1.77)
incidence
Wu, K.,1999,BRE63618
USA, Not specified, BlooddonorsCLUE II, 1989
18 - 90 110Throughnetwork, paper,tv
Questionnaire(nos)
Nested CaseControl
110 6.0 years Kg/m*m
Breast cancer >=26vs.<=22
40.77(0.35, 1.7)
incidence
Rissanen,H.,2003,BRE17954
Finland, Not specifiedMobile Clinic HealthExamination Survey, 1973
18 - 89Throughnetwork, paper,tv
Nested CaseControl
8196.0 10.0 yearsBreast cancer
1null(null, null)
incidence
Jonsson,F.,2003,BRE04482
Sweden, Not specified,TwinsSwedish twin cohort, 1969
44 - 83 580School healthrecords
ProspectiveCohort
11598.0 29.0 years at baseline Kg/m*m
Breast cancer >=30vs.18.50-24.99
41.2(0.8, 1.6)
A
incidence
329

Author, Year,WCRF Code
Country, Ethnicity, Specialcharacteristics
Age Cases n Caseascertainment
Type of studyNon-Cases n
Lenght offollow-up / loss
Assessmentdetail
Additional details Unit Outcome Subgroup Contrast Nocat. OR (95% CI) p
valueptrend A B C D E F G
adjustments
Chang, S.C.,2003,BRE18295
USA, Not specified,Screening ProgramBCDDP, 1973
55 - 74
Through healthorg. (screening,healthinsurance)
Questionnaire(nos)
ProspectiveCohort
27534.0 7.0 years highest quartile vslowest
Breast cancer >1.0vs.>-1.0
21.26(0.99, 1.6)
0.06incidence
Zhang, S.M.,2003,BRE13958
US, Not specified,Registered nursesNurses' Health Study (NHS)Cohort 1976-1996
43 - 69 By MailFFQ-Semi-quantitative
Nested CaseControl
32826.0 40.0 monthsBreast cancer
1null(null, null)
incidence
LahmannPH,2004,BRE15804
EUROPEEuropean ProspectiveInvestigation into Cancer andNutrition (EPIC) 1993-1998
18 - 80 911Otherprocedure
ProspectiveCohort
78119 4.7 years Kg/m*m
Breast cancer
HRT - No>28.8vs.<21.5
51.36(1.06, 1.75)
0.002
A B C E G
incidence
LahmannPH,2004,BRE15804
EUROPEEuropean ProspectiveInvestigation into Cancer andNutrition (EPIC) 1993-1998
18 - 80 911Otherprocedure
ProspectiveCohort
78119 4.7 years Kg/m*m
Breast cancer
HRT - No>30vs.<25
31.31(1.08, 1.59)
0.0012
A B C E G
incidence
LahmannPH,2004,BRE15804
EUROPEEuropean ProspectiveInvestigation into Cancer andNutrition (EPIC) 1993-1998
18 - 80 911Otherprocedure
ProspectiveCohort
78119 4.7 years unit
Breast cancer
HRT - No1.0(continuous)
11.03(1.01, 1.05)
A B C E G
incidence
Kilkkinen,A.,2004,BRE17698
FinlandHelsinki and Oulu, 1982
25 - 74 UnspecifiedQuestionnaire(nos)
Nested CaseControl
15497.0 15.0 yearsBreast cancer
1null(null, null)
A G
incidence
Colditz, G.A.,2004,BRE01783
U.S.A., Not specified,Registered nursesNurses' Health Study (NHS)Cohort 1976-1996
30 - 55 By MailProspectiveCohort
66145.0 19.0 years Kg/m*m
Breast cancer ER+/PR+consistentlyobesevs.average
51.17(1.05, 1.3)
A C D E F G
incidence
Colditz, G.A.,2004,BRE01783
U.S.A., Not specified,Registered nursesNurses' Health Study (NHS)Cohort 1976-1996
30 - 55 By MailProspectiveCohort
66145.0 19.0 years Kg/m*m
Breast cancer ER+/PR-consistentlyobesevs.average
50.82(0.65, 1.03)
A C D E F G
incidence
Colditz, G.A.,2004,BRE01783
U.S.A., Not specified,Registered nursesNurses' Health Study (NHS)Cohort 1976-1996
30 - 55 By MailProspectiveCohort
66145.0 19.0 years Kg/m*m
Breast cancer ER-/PR+consistentlyobesevs.average
51.15(0.8, 1.67)
A C D E F G
incidence
Colditz, G.A.,2004,BRE01783
U.S.A., Not specified,Registered nursesNurses' Health Study (NHS)Cohort 1976-1996
30 - 55 By MailProspectiveCohort
66145.0 19.0 years Kg/m*m
Breast cancer ER-/PR-consistentlyobesevs.average
50.9(0.76, 1.08)
A C D E F G
incidence
Tehard,B.,2004,BRE12173
France, Registered teachersE3N-EPIC, 1990
40 - 65 631
Through socialorganization(profession,religion)
ProspectiveCohort
238461 9.7 yearsInvasive breast cancer
HRT - NoQuantile nullvs.Quantile null
4null(null, null)
B C E F G
incidence
Silvera, S.A.,2005,BRE24118
Canada, Not specifiedCanadian National BreastScreening Study
40 - 59 1671
Through healthorg. (screening,healthinsurance)
FFQ-Semi-quantitative
ProspectiveCohort
660113 16.4 years Kg/m*m
Breast cancer >30.0vs.<24.0
41.14(0.92, 1.39)
0.34 A C E F G
incidence
Kuriyama,S.,2005,BRE22995
JapanMiyagi, 1993
40 - 115Generalpopulation(survey)
Questionnaire(nos)
ProspectiveCohort
15054.0 9.0 years Kg/m*m
Breast cancer >30vs.18,5-24,9
41.9(0.87, 4.15)
0.04 A C E F G
incidence
330

Author, Year,WCRF Code
Country, Ethnicity, Specialcharacteristics
Age Cases n Caseascertainment
Type of studyNon-Cases n
Lenght offollow-up / loss
Assessmentdetail
Additional details Unit Outcome Subgroup Contrast Nocat. OR (95% CI) p
valueptrend A B C D E F G
adjustments
Silvera, S. A.N.,2005,BRE24118
CanadaNBSS, 1980
40 - 59 1671
Through healthorg. (screening,healthinsurance)
FFQ (nos)ProspectiveCohort
660113 16.4 years Kg/m*m
Breast cancer >30vs.<25
31.14(0.92, 1.39)
0.34 A C E F G
incidence
RappK.,2005,BRE23858
Austria, Not specified,Screening ProgramVHM&PP, unknow
35 - 54 1045
Through healthorg. (screening,healthinsurance)
ProspectiveCohort
7618 9.9 years at enrollment Kg/m*m
Breast cancer >=35vs.18.5-24.9
41.01(0.72, 1.42)
0.8 A G
incidence
Chun, J. etal.,2006,BRE80134
United States, Multi-ethnic,High Risk populationWomen at Risk Cohort, NewYork
(47) 62 Cancer registryProspectiveCohort
933 5.0 years BMI
Breast cancer Obesevs.Normal
42.22(1.14, 4.35)
0.02 A G
incidence
Wu, M.H.,2006,BRE24628
China, Asian, ScreeningProgramTaiwan 1990
(47) 104
Through healthorg. (screening,healthinsurance)
ProspectiveCohort
11830 10.3 years Kg/m*m
Breast cancer >26.3vs.<21.6
41.6(0.5, 5.1)
C D
incidence
LukanovaA.,2006,BRE80100
Sweden, WhiteNorthern Sweden Health andDisease Cohort, 1985
29 - 61 514 medical recordsProspectiveCohort
74207.0 8.2 years / 0.03 BMI, baseline BMI
Breast cancer >27.1vs.18.5 - 22.1
40.95(0.74, 1.23)
0.36 A G
incidence
Visvanathan etal.,2007,BRE80020
AmericaCLUE II - Washington, 1989
(57) 100FFQ +Questionnaire
Nested CaseControl
100 Baseline BMI
Breast cancer >=30vs.<25
31.6(1.04, 2.45)
0.02incidence
BMI (after menopause)
Menopausal status not specified
Colditz, G.A.,2004,BRE01783
U.S.A., Not specified,Registered nursesNurses' Health Study (NHS)Cohort 1976-1996
30 - 55 1281 By MailProspectiveCohort
66145.0 19.0 years Year*(Kg/m*m)
Breast cancer ER+/PR+
HRT - No35.0(continuous)
11.17(1.11, 1.23)
A C D E F G
incidence
Colditz, G.A.,2004,BRE01783
U.S.A., Not specified,Registered nursesNurses' Health Study (NHS)Cohort 1976-1996
30 - 55 318 By MailProspectiveCohort
66145.0 19.0 years Year*(Kg/m*m)
Breast cancer ER+/PR-
HRT - No35.0(continuous)
11.05(0.94, 1.17)
A C D E F G
incidence
Colditz, G.A.,2004,BRE01783
U.S.A., Not specified,Registered nursesNurses' Health Study (NHS)Cohort 1976-1996
30 - 55 80 By MailProspectiveCohort
66145.0 19.0 years Year*(Kg/m*m)
Breast cancer ER-/PR+
HRT - No35.0(continuous)
11.39(1.14, 1.7)
A C D E F G
incidence
Colditz, G.A.,2004,BRE01783
U.S.A., Not specified,Registered nursesNurses' Health Study (NHS)Cohort 1976-1996
30 - 55 417 By MailProspectiveCohort
66145.0 19.0 years Year*(Kg/m*m)
Breast cancer ER-/PR-
HRT - No35.0(continuous)
11.02(0.91, 1.13)
A C D E F G
incidence
BMI (long life)
Post-menopausal
Colditz, G.A.,2004,BRE01783
U.S.A., Not specified,Registered nursesNurses' Health Study (NHS)Cohort 1976-1996
30 - 55 1281 By MailProspectiveCohort
66145.0 19.0 years Year*(Kg/m*m)
Breast cancer ER+/PR+
HRT - Yes35.0(continuous)
10.97(0.95, 0.99)
A C D E F G
incidence
331

Author, Year,WCRF Code
Country, Ethnicity, Specialcharacteristics
Age Cases n Caseascertainment
Type of studyNon-Cases n
Lenght offollow-up / loss
Assessmentdetail
Additional details Unit Outcome Subgroup Contrast Nocat. OR (95% CI) p
valueptrend A B C D E F G
adjustments
Colditz, G.A.,2004,BRE01783
U.S.A., Not specified,Registered nursesNurses' Health Study (NHS)Cohort 1976-1996
30 - 55 318 By MailProspectiveCohort
66145.0 19.0 years Year*(Kg/m*m)
Breast cancer ER+/PR-
HRT - Yes35.0(continuous)
10.95(0.91, 0.99)
A C D E F G
incidence
Colditz, G.A.,2004,BRE01783
U.S.A., Not specified,Registered nursesNurses' Health Study (NHS)Cohort 1976-1996
30 - 55 80 By MailProspectiveCohort
66145.0 19.0 years Year*(Kg/m*m)
Breast cancer ER-/PR+
HRT - Yes35.0(continuous)
10.95(0.88, 1.02)
A C D E F G
incidence
Colditz, G.A.,2004,BRE01783
U.S.A., Not specified,Registered nursesNurses' Health Study (NHS)Cohort 1976-1996
30 - 55 417 By MailProspectiveCohort
66145.0 19.0 years Year*(Kg/m*m)
Breast cancer ER-/PR-
HRT - Yes35.0(continuous)
10.98(0.94, 1.01)
A C D E F G
incidence
BMI at 11 yrs
Menopausal status not specified
De Stavola, B.L.,2004,BRE02123
United Kingdom, NotspecifiedMedical Research CouncilNational Survey of Health
51Otherprocedure
ProspectiveCohort
1862 29.0 years / 0 BMI at age 11 years SD Units
Breast cancer1.0(continuous)
10.87(0.64, 1.18)
BMI at 15 yrs
Menopausal status not specified
Hilakivi-Clarke,L.,2001,BRE03903
Finland, Not specifiedHelsinki newborn, 1924
177Otherprocedure
Historical Cohort 3447 BMI at age 15
Breast cancer <=18vs.>21.5
51.7(1.0, 2.7)
0.03incidence
De Stavola, B.L.,2004,BRE02123
United Kingdom, NotspecifiedMedical Research CouncilNational Survey of Health
43Otherprocedure
ProspectiveCohort
1664 29.0 years / 0 BMI at age 15 years SD Units
Breast cancer1.0(continuous)
10.79(0.56, 1.11)
BMI at 18 yrs
Pre-menopausal
Weiderpass,E.,2004,BRE18151
Sweden+Norway, Notspecified, Pre-menopausalAssembled cohort (Sweden+ Norway)
30 - 49 By MailProspectiveCohort
99717.08.0 years / 789women Kg/m*m
Breast cancerPre-menopausal
1.0(continuous)
10.98(0.95, 1.02)
A C F G
incidence
Michels etal.,2006,BRE80033
USA, Pre-menopausalNHS II, 1989
25 - 42Self reportverified bymedical record
FFQProspectiveCohort
116609.0 14.0 years BMI at age 18 yrs units
Breast cancer
age < 40 yrs5.0(continuous)
10.83(0.68, 1.01)
A C D E F G
incidence
Michels etal.,2006,BRE80033
USA, Pre-menopausalNHS II, 1989
25 - 42Self reportverified bymedical record
FFQProspectiveCohort
116609.0 14.0 years BMI at age 18 yrs units
Breast cancerage >= 40yrs
5.0(continuous)
10.8(0.71, 0.9)
A C D E F G
incidence
Michels etal.,2006,BRE80033
USA, Pre-menopausalNHS II, 1989
25 - 42 1379Self reportverified bymedical record
FFQProspectiveCohort
116609.0 14.0 years BMI at age 18 Kg/m*m
Breast cancer >=27.5vs.20-22.4
60.57(0.41, 0.81)
<0.001
A C D E F G
incidence
332

Author, Year,WCRF Code
Country, Ethnicity, Specialcharacteristics
Age Cases n Caseascertainment
Type of studyNon-Cases n
Lenght offollow-up / loss
Assessmentdetail
Additional details Unit Outcome Subgroup Contrast Nocat. OR (95% CI) p
valueptrend A B C D E F G
adjustments
Michels etal.,2006,BRE80033
USA, Pre-menopausalNHS II, 1989
25 - 42 1379Self reportverified bymedical record
FFQProspectiveCohort
116609.0 14.0 years BMI at age 18 yrs Kg/m*m
Breast cancer >=27.5vs.20-22.4
60.61(0.42, 0.87)
0.01 A C D E F G
incidence
Michels etal.,2006,BRE80033
USA, Pre-menopausalNHS II, 1989
25 - 42 1379Self reportverified bymedical record
FFQProspectiveCohort
116609.0 14.0 years BMI at age 18 yrs units
Breast cancer5.0(continuous)
10.83(0.74, 0.94)
A C D E F G
incidence
Michels etal.,2006,BRE80033
USA, Pre-menopausalNHS II, 1989
25 - 42 663Self reportverified bymedical record
FFQProspectiveCohort
116609.0 14.0 years BMI at age 18 yr Kg/m*m
Breast cancer ER+ >=25vs.20-22.4
50.76(0.56, 1.03)
0.07 A C D E F G
incidence
Michels etal.,2006,BRE80033
USA, Pre-menopausalNHS II, 1989
25 - 42 663Self reportverified bymedical record
FFQProspectiveCohort
116609.0 14.0 years BMI at age 18 yrs units
Breast cancer ER+5.0(continuous)
10.87(0.75, 1.0)
A C D E F G
incidence
Michels etal.,2006,BRE80033
USA, Pre-menopausalNHS II, 1989
25 - 42 282Self reportverified bymedical record
FFQProspectiveCohort
116609.0 14.0 years BMI at 18 yrs Kg/m*m
Breast cancer ER- >=25vs.<18
50.94(0.6, 1.49)
0.97 A C D E F G
incidence
Michels etal.,2006,BRE80033
USA, Pre-menopausalNHS II, 1989
25 - 42 282Self reportverified bymedical record
FFQProspectiveCohort
116609.0 14.0 years BMI at age 18 yrs units
Breast cancer ER-5.0(continuous)
10.93(0.75, 1.15)
A C D E F G
incidence
Michels etal.,2006,BRE80033
USA, Pre-menopausalNHS II, 1989
25 - 42 630Self reportverified bymedical record
FFQProspectiveCohort
116609.0 14.0 years BMI at age 18 yrs Kg/m*m
Breast cancer PR+ >=25vs.20-22.4
50.84(0.62, 1.14)
0.12 A C D E F G
incidence
Michels etal.,2006,BRE80033
USA, Pre-menopausalNHS II, 1989
25 - 42 630Self reportverified bymedical record
FFQProspectiveCohort
116609.0 14.0 years BMI at 18 yrs units
Breast cancer PR+5.0(continuous)
10.87(0.75, 1.0)
A C D E F G
incidence
Michels etal.,2006,BRE80033
USA, Pre-menopausalNHS II, 1989
25 - 42 298Self reportverified bymedical record
FFQProspectiveCohort
116609.0 14.0 years BMI at age 18 yrs Kg/m*m
Breast cancer PR- >=25vs.20-22.4
50.76(0.48, 1.21)
0.55 A C D E F G
incidence
Michels etal.,2006,BRE80033
USA, Pre-menopausalNHS II, 1989
25 - 42 298Self reportverified bymedical record
FFQProspectiveCohort
116609.0 14.0 years BMI at age 18 yrs units
Breast cancer PR-5.0(continuous)
10.9(0.73, 1.11)
A C D E F G
incidence
Palmer, J.R. etal.,2007,BRE80122
United States, BlackBlack Women's HealthStudy, 1995
21 - 69 491
death certificate/ patientrecords / selfreport
FFQProspectiveCohort
59000.0 10.0 years / 0.2 BMI at age 18 y
Breast cancerPre-menopausal
>=25vs.<20
30.68(0.46, 0.98)
A B C D F G
incidence
Post-menopausal
Gapstur, S.M.,1992,BRE03101
U.S.A., Not specified, Post-menopausalIowa Women's Health Study
55 - 69 493 By MailFFQ-Semi-quantitative
ProspectiveCohort
140680 4.0 years Kg/m*m
Breast cancerPost-menopausal
>24.6vs.<19.34
50.68(0.48, 0.95)
0.003
A
incidence
333
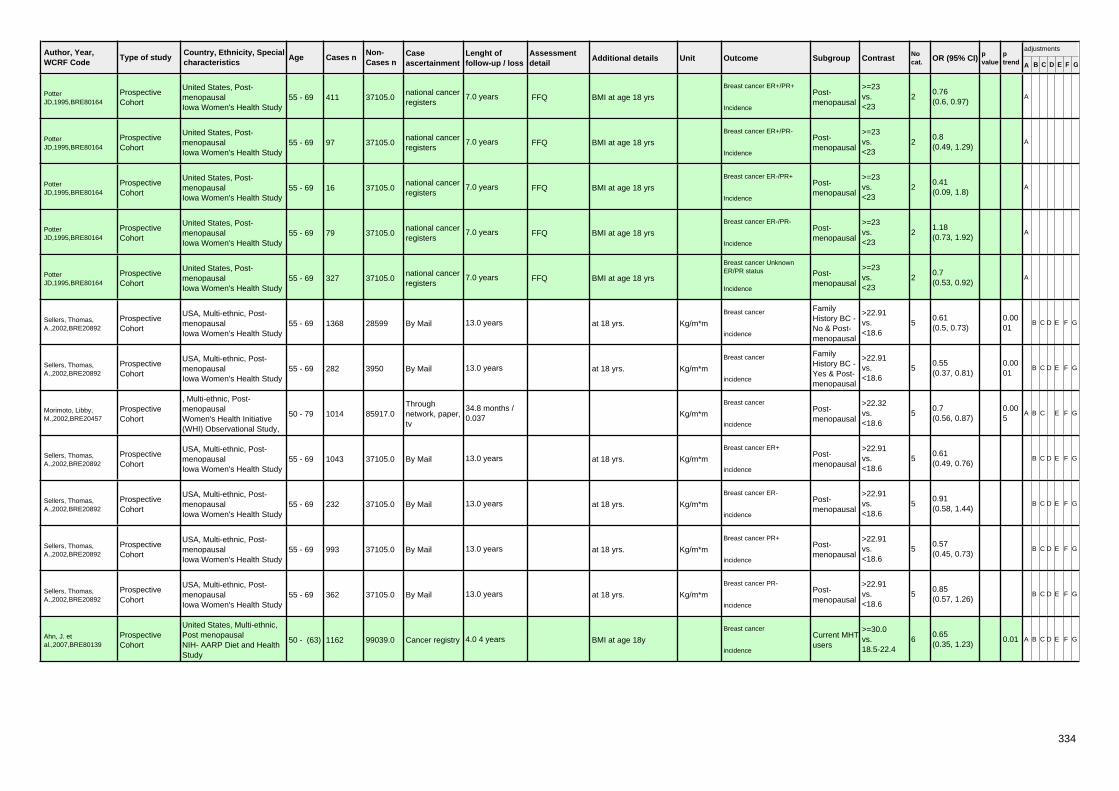
Author, Year,WCRF Code
Country, Ethnicity, Specialcharacteristics
Age Cases n Caseascertainment
Type of studyNon-Cases n
Lenght offollow-up / loss
Assessmentdetail
Additional details Unit Outcome Subgroup Contrast Nocat. OR (95% CI) p
valueptrend A B C D E F G
adjustments
PotterJD,1995,BRE80164
United States, Post-menopausalIowa Women's Health Study
55 - 69 411national cancerregisters
FFQProspectiveCohort
37105.0 7.0 years BMI at age 18 yrs
Breast cancer ER+/PR+Post-menopausal
>=23vs.<23
20.76(0.6, 0.97)
A
Incidence
PotterJD,1995,BRE80164
United States, Post-menopausalIowa Women's Health Study
55 - 69 97national cancerregisters
FFQProspectiveCohort
37105.0 7.0 years BMI at age 18 yrs
Breast cancer ER+/PR-Post-menopausal
>=23vs.<23
20.8(0.49, 1.29)
A
Incidence
PotterJD,1995,BRE80164
United States, Post-menopausalIowa Women's Health Study
55 - 69 16national cancerregisters
FFQProspectiveCohort
37105.0 7.0 years BMI at age 18 yrs
Breast cancer ER-/PR+Post-menopausal
>=23vs.<23
20.41(0.09, 1.8)
A
Incidence
PotterJD,1995,BRE80164
United States, Post-menopausalIowa Women's Health Study
55 - 69 79national cancerregisters
FFQProspectiveCohort
37105.0 7.0 years BMI at age 18 yrs
Breast cancer ER-/PR-Post-menopausal
>=23vs.<23
21.18(0.73, 1.92)
A
Incidence
PotterJD,1995,BRE80164
United States, Post-menopausalIowa Women's Health Study
55 - 69 327national cancerregisters
FFQProspectiveCohort
37105.0 7.0 years BMI at age 18 yrs
Breast cancer UnknownER/PR status Post-
menopausal
>=23vs.<23
20.7(0.53, 0.92)
A
Incidence
Sellers, Thomas,A.,2002,BRE20892
USA, Multi-ethnic, Post-menopausalIowa Women's Health Study
55 - 69 1368 By MailProspectiveCohort
28599 13.0 years at 18 yrs. Kg/m*m
Breast cancer FamilyHistory BC -No & Post-menopausal
>22.91vs.<18.6
50.61(0.5, 0.73)
0.0001
B C D E F G
incidence
Sellers, Thomas,A.,2002,BRE20892
USA, Multi-ethnic, Post-menopausalIowa Women's Health Study
55 - 69 282 By MailProspectiveCohort
3950 13.0 years at 18 yrs. Kg/m*m
Breast cancer FamilyHistory BC -Yes & Post-menopausal
>22.91vs.<18.6
50.55(0.37, 0.81)
0.0001
B C D E F G
incidence
Morimoto, Libby,M.,2002,BRE20457
, Multi-ethnic, Post-menopausalWomen's Health Initiative(WHI) Observational Study,
50 - 79 1014Throughnetwork, paper,tv
ProspectiveCohort
85917.034.8 months /0.037 Kg/m*m
Breast cancerPost-menopausal
>22.32vs.<18.6
50.7(0.56, 0.87)
0.005
A B C E F G
incidence
Sellers, Thomas,A.,2002,BRE20892
USA, Multi-ethnic, Post-menopausalIowa Women's Health Study
55 - 69 1043 By MailProspectiveCohort
37105.0 13.0 years at 18 yrs. Kg/m*m
Breast cancer ER+Post-menopausal
>22.91vs.<18.6
50.61(0.49, 0.76)
B C D E F G
incidence
Sellers, Thomas,A.,2002,BRE20892
USA, Multi-ethnic, Post-menopausalIowa Women's Health Study
55 - 69 232 By MailProspectiveCohort
37105.0 13.0 years at 18 yrs. Kg/m*m
Breast cancer ER-Post-menopausal
>22.91vs.<18.6
50.91(0.58, 1.44)
B C D E F G
incidence
Sellers, Thomas,A.,2002,BRE20892
USA, Multi-ethnic, Post-menopausalIowa Women's Health Study
55 - 69 993 By MailProspectiveCohort
37105.0 13.0 years at 18 yrs. Kg/m*m
Breast cancer PR+Post-menopausal
>22.91vs.<18.6
50.57(0.45, 0.73)
B C D E F G
incidence
Sellers, Thomas,A.,2002,BRE20892
USA, Multi-ethnic, Post-menopausalIowa Women's Health Study
55 - 69 362 By MailProspectiveCohort
37105.0 13.0 years at 18 yrs. Kg/m*m
Breast cancer PR-Post-menopausal
>22.91vs.<18.6
50.85(0.57, 1.26)
B C D E F G
incidence
Ahn, J. etal.,2007,BRE80139
United States, Multi-ethnic,Post menopausalNIH- AARP Diet and HealthStudy
50 - (63) 1162 Cancer registryProspectiveCohort
99039.0 4.0 4 years BMI at age 18y
Breast cancerCurrent MHTusers
>=30.0vs.18.5-22.4
60.65(0.35, 1.23)
0.01 A B C D E F G
incidence
334
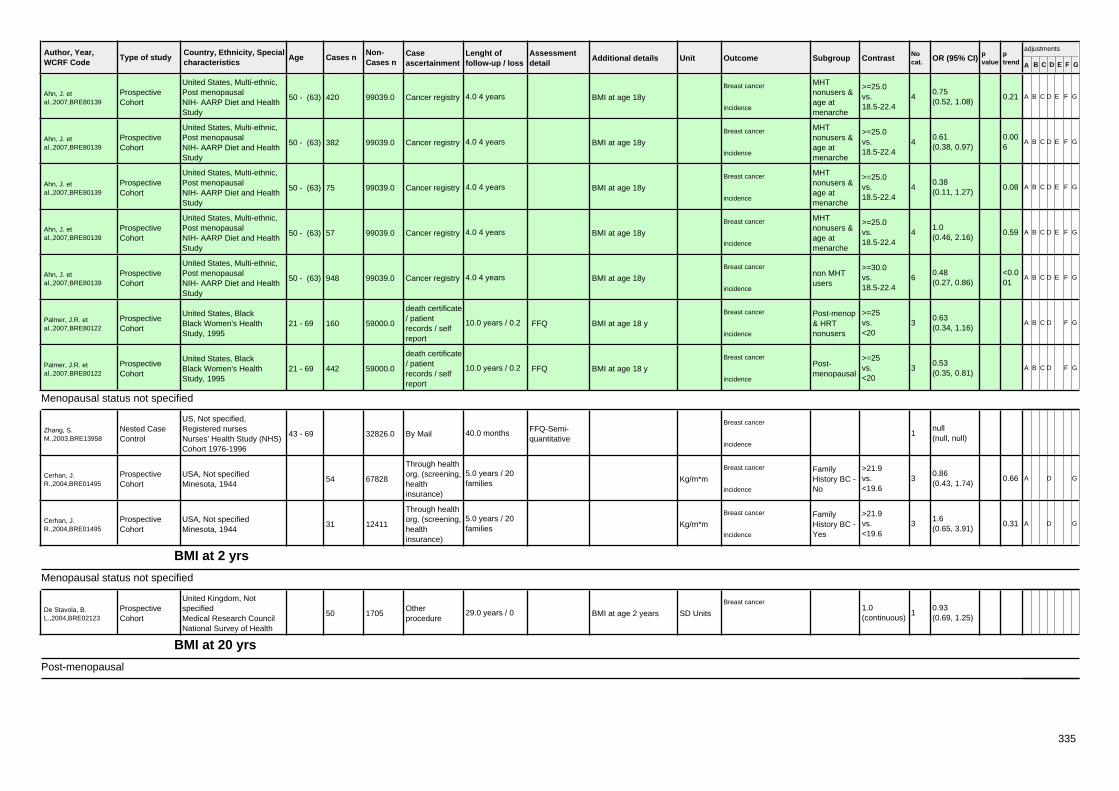
Author, Year,WCRF Code
Country, Ethnicity, Specialcharacteristics
Age Cases n Caseascertainment
Type of studyNon-Cases n
Lenght offollow-up / loss
Assessmentdetail
Additional details Unit Outcome Subgroup Contrast Nocat. OR (95% CI) p
valueptrend A B C D E F G
adjustments
Ahn, J. etal.,2007,BRE80139
United States, Multi-ethnic,Post menopausalNIH- AARP Diet and HealthStudy
50 - (63) 420 Cancer registryProspectiveCohort
99039.0 4.0 4 years BMI at age 18y
Breast cancer MHTnonusers &age atmenarche
>=25.0vs.18.5-22.4
40.75(0.52, 1.08)
0.21 A B C D E F G
incidence
Ahn, J. etal.,2007,BRE80139
United States, Multi-ethnic,Post menopausalNIH- AARP Diet and HealthStudy
50 - (63) 382 Cancer registryProspectiveCohort
99039.0 4.0 4 years BMI at age 18y
Breast cancer MHTnonusers &age atmenarche
>=25.0vs.18.5-22.4
40.61(0.38, 0.97)
0.006
A B C D E F G
incidence
Ahn, J. etal.,2007,BRE80139
United States, Multi-ethnic,Post menopausalNIH- AARP Diet and HealthStudy
50 - (63) 75 Cancer registryProspectiveCohort
99039.0 4.0 4 years BMI at age 18y
Breast cancer MHTnonusers &age atmenarche
>=25.0vs.18.5-22.4
40.38(0.11, 1.27)
0.08 A B C D E F G
incidence
Ahn, J. etal.,2007,BRE80139
United States, Multi-ethnic,Post menopausalNIH- AARP Diet and HealthStudy
50 - (63) 57 Cancer registryProspectiveCohort
99039.0 4.0 4 years BMI at age 18y
Breast cancer MHTnonusers &age atmenarche
>=25.0vs.18.5-22.4
41.0(0.46, 2.16)
0.59 A B C D E F G
incidence
Ahn, J. etal.,2007,BRE80139
United States, Multi-ethnic,Post menopausalNIH- AARP Diet and HealthStudy
50 - (63) 948 Cancer registryProspectiveCohort
99039.0 4.0 4 years BMI at age 18y
Breast cancernon MHTusers
>=30.0vs.18.5-22.4
60.48(0.27, 0.86)
<0.001
A B C D E F G
incidence
Palmer, J.R. etal.,2007,BRE80122
United States, BlackBlack Women's HealthStudy, 1995
21 - 69 160
death certificate/ patientrecords / selfreport
FFQProspectiveCohort
59000.0 10.0 years / 0.2 BMI at age 18 y
Breast cancer Post-menop& HRTnonusers
>=25vs.<20
30.63(0.34, 1.16)
A B C D F G
incidence
Palmer, J.R. etal.,2007,BRE80122
United States, BlackBlack Women's HealthStudy, 1995
21 - 69 442
death certificate/ patientrecords / selfreport
FFQProspectiveCohort
59000.0 10.0 years / 0.2 BMI at age 18 y
Breast cancerPost-menopausal
>=25vs.<20
30.53(0.35, 0.81)
A B C D F G
incidence
Menopausal status not specified
Zhang, S.M.,2003,BRE13958
US, Not specified,Registered nursesNurses' Health Study (NHS)Cohort 1976-1996
43 - 69 By MailFFQ-Semi-quantitative
Nested CaseControl
32826.0 40.0 monthsBreast cancer
1null(null, null)
incidence
Cerhan, J.R.,2004,BRE01495
USA, Not specifiedMinesota, 1944
54
Through healthorg. (screening,healthinsurance)
ProspectiveCohort
678285.0 years / 20families Kg/m*m
Breast cancer FamilyHistory BC -No
>21.9vs.<19.6
30.86(0.43, 1.74)
0.66 A D G
incidence
Cerhan, J.R.,2004,BRE01495
USA, Not specifiedMinesota, 1944
31
Through healthorg. (screening,healthinsurance)
ProspectiveCohort
124115.0 years / 20families Kg/m*m
Breast cancer FamilyHistory BC -Yes
>21.9vs.<19.6
31.6(0.65, 3.91)
0.31 A D G
incidence
BMI at 2 yrs
Menopausal status not specified
De Stavola, B.L.,2004,BRE02123
United Kingdom, NotspecifiedMedical Research CouncilNational Survey of Health
50Otherprocedure
ProspectiveCohort
1705 29.0 years / 0 BMI at age 2 years SD Units
Breast cancer1.0(continuous)
10.93(0.69, 1.25)
BMI at 20 yrs
Post-menopausal
335

Author, Year,WCRF Code
Country, Ethnicity, Specialcharacteristics
Age Cases n Caseascertainment
Type of studyNon-Cases n
Lenght offollow-up / loss
Assessmentdetail
Additional details Unit Outcome Subgroup Contrast Nocat. OR (95% CI) p
valueptrend A B C D E F G
adjustments
van den Brandt, P.A.,1997,BRE12717
The Netherlands, Post-menopausalThe Netherlands CohortStudy on diet and cancer,
55 - 69 UnspecifiedCase Cohort null 4.3 years / 0 BMI at age 20 Kg/m*m
Invasive breast cancerPost-menopausal
8.0(continuous)
10.79(0.58, 1.08)
A C E
incidence
BMI at 30 yrs
Menopausal status not specified
Okasha,M.,2001,BRE17887
UK, Not specified, CollegealumnaeGlasgow cohort, 1948
(20)School healthrecords
ProspectiveCohort
2528.0 53.0 years in young adulthood Kg/m*m
Breast cancer1.0(continuous)
11.0(0.92, 1.08)
,99 A
incidence
BMI at 4 yrs
Menopausal status not specified
De Stavola, B.L.,2004,BRE02123
United Kingdom, NotspecifiedMedical Research CouncilNational Survey of Health
55Otherprocedure
ProspectiveCohort
1903 29.0 years / 0 BMI at age 4 years SD Units
Breast cancer1.0(continuous)
10.88(0.67, 1.16)
BMI at 7 yrs
Menopausal status not specified
Hilakivi-Clarke,L.,2001,BRE03903
Finland, Not specifiedHelsinki newborn, 1924
177Otherprocedure
Historical Cohort 3447 BMI at age 7
Breast cancer <=14.3vs.>16.2
51.9(1.2, 3.1)
0.009
incidence
De Stavola, B.L.,2004,BRE02123
United Kingdom, NotspecifiedMedical Research CouncilNational Survey of Health
52Otherprocedure
ProspectiveCohort
1853 29.0 years / 0 BMI at age 7 years SD Units
Breast cancer1.0(continuous)
10.89(0.66, 1.19)
BMI at age 50
Post-menopausal
Ahn, J. etal.,2007,BRE80139
United States, Multi-ethnic,Post menopausalNIH- AARP Diet and HealthStudy
50 - (63) 1162 Cancer registryProspectiveCohort
99039.0 4.0 4 years BMI at age 50y
Breast cancerCurrent MHTusers
>=40vs.18.5-22.4
80.92(0.4, 2.1)
0.02 A B C D E F G
incidence
Ahn, J. etal.,2007,BRE80139
United States, Multi-ethnic,Post menopausalNIH- AARP Diet and HealthStudy
50 - (63) 948 Cancer registryProspectiveCohort
99039.0 4.0 4 years BMI at age 50y
Breast cancernon MHTusers
>=40.0vs.18.5-22.4
82.0(1.23, 3.26)
<0.001
A B C D E F G
incidence
BMI, at different age
Pre-menopausal
Ahlgren,M.,2004,BRE14201
Denmark, Not specifiedDanish Cohort, 1930
14 - 71School healthrecords
Historical Cohort 117415.0 33.0 years age 14 yrs Kg/m*m
Breast cancerPre-menopausal
1.0(continuous)
10.96(0.94, 0.99)
D
incidence
Post-menopausal
336

Author, Year,WCRF Code
Country, Ethnicity, Specialcharacteristics
Age Cases n Caseascertainment
Type of studyNon-Cases n
Lenght offollow-up / loss
Assessmentdetail
Additional details Unit Outcome Subgroup Contrast Nocat. OR (95% CI) p
valueptrend A B C D E F G
adjustments
Morimoto, Libby,M.,2002,BRE20457
, Multi-ethnic, Post-menopausalWomen's Health Initiative(WHI) Observational Study,
50 - 79 316Throughnetwork, paper,tv
ProspectiveCohort
85917.034.8 months /0.037 at age 50 Kg/m*m
Breast cancer
HRT - No>31.11vs.<22.6
52.07(1.32, 3.25)
0.001
A B C E F G
incidence
Morimoto, Libby,M.,2002,BRE20457
, Multi-ethnic, Post-menopausalWomen's Health Initiative(WHI) Observational Study,
50 - 79 702Throughnetwork, paper,tv
ProspectiveCohort
85917.034.8 months /0.037 at age 50 Kg/m*m
Breast cancer
HRT - Yes>31.11vs.<22.6
50.9(0.62, 1.31)
0.34 A B C E F G
incidence
Ahlgren,M.,2004,BRE14201
Denmark, Not specifiedDanish Cohort, 1930
14 - 71School healthrecords
Historical Cohort 117415.0 33.0 years age 14 yrs Kg/m*m
Breast cancerPost-menopausal
1.0(continuous)
10.94(0.92, 0.97)
D
incidence
Ahn, J. etal.,2007,BRE80139
United States, Multi-ethnic,Post menopausalNIH- AARP Diet and HealthStudy
50 - (63) 1162 Cancer registryProspectiveCohort
99039.0 4.0 4 years BMI at age 35y
Breast cancerCurrent MHTusers
>=30.0vs.18.5-22.4
60.75(0.47, 1.2)
0.38 A B C D E F G
incidence
Ahn, J. etal.,2007,BRE80139
United States, Multi-ethnic,Post menopausalNIH- AARP Diet and HealthStudy
50 - (63) 948 Cancer registryProspectiveCohort
99039.0 4.0 4 years BMI at age 35y
Breast cancernon MHTusers
>=30.0vs.18.5-22.4
61.17(0.82, 1.67)
0.06 A B C D E F G
incidence
Menopausal status not specified
Jonsson,F.,2003,BRE04482
Sweden, Not specified,TwinsSwedish twin cohort, 1969
44 - 83 421School healthrecords
ProspectiveCohort
11598.0 29.0 years at age 25 Kg
Breast cancer >=25vs.18.50-24.99
30.5(0.3, 0.8)
A D
incidence
Jonsson,F.,2003,BRE04482
Sweden, Not specified,TwinsSwedish twin cohort, 1969
44 - 83 462School healthrecords
ProspectiveCohort
11598.0 29.0 years at age 40 Kg
Breast cancer >=30vs.18.50-24.99
40.6(0.3, 1.1)
A D
incidence
Must,A.,2003,BRE18607
USA, Not specifiedHGSM III
33 - 46School healthrecords
ProspectiveCohort
858.0 32.0 years at mid-life
Breast cancerever overweightvs.never over
22.4(1.1, 5.0)
0,03cancer death
Ahlgren,M.,2004,BRE14201
Denmark, Not specifiedDanish Cohort, 1930
14 - 71School healthrecords
Historical Cohort 117415.0 33.0 years age 14 Kg/m*m
Breast cancer1.0(continuous)
10.95(0.93, 0.97)
D
incidence
BMI, at different stage
Post-menopausal
Morimoto, Libby,M.,2002,BRE20457
, Multi-ethnic, Post-menopausalWomen's Health Initiative(WHI) Observational Study,
50 - 79 311Throughnetwork, paper,tv
ProspectiveCohort
85917.034.8 months /0.037
BMI change (baselineage 18)
Kg/m*m
Breast cancer
HRT - No>9.71vs.<0.0
51.92(1.07, 3.43)
0.001
A B C E F G
incidence
Morimoto, Libby,M.,2002,BRE20457
, Multi-ethnic, Post-menopausalWomen's Health Initiative(WHI) Observational Study,
50 - 79 314Throughnetwork, paper,tv
ProspectiveCohort
85917.034.8 months /0.037
BMI change (baselineage 50)
Kg/m*m
Breast cancer
HRT - No>4.01vs.<0.0
51.45(0.98, 2.15)
0.02 A B C E F G
incidence
337
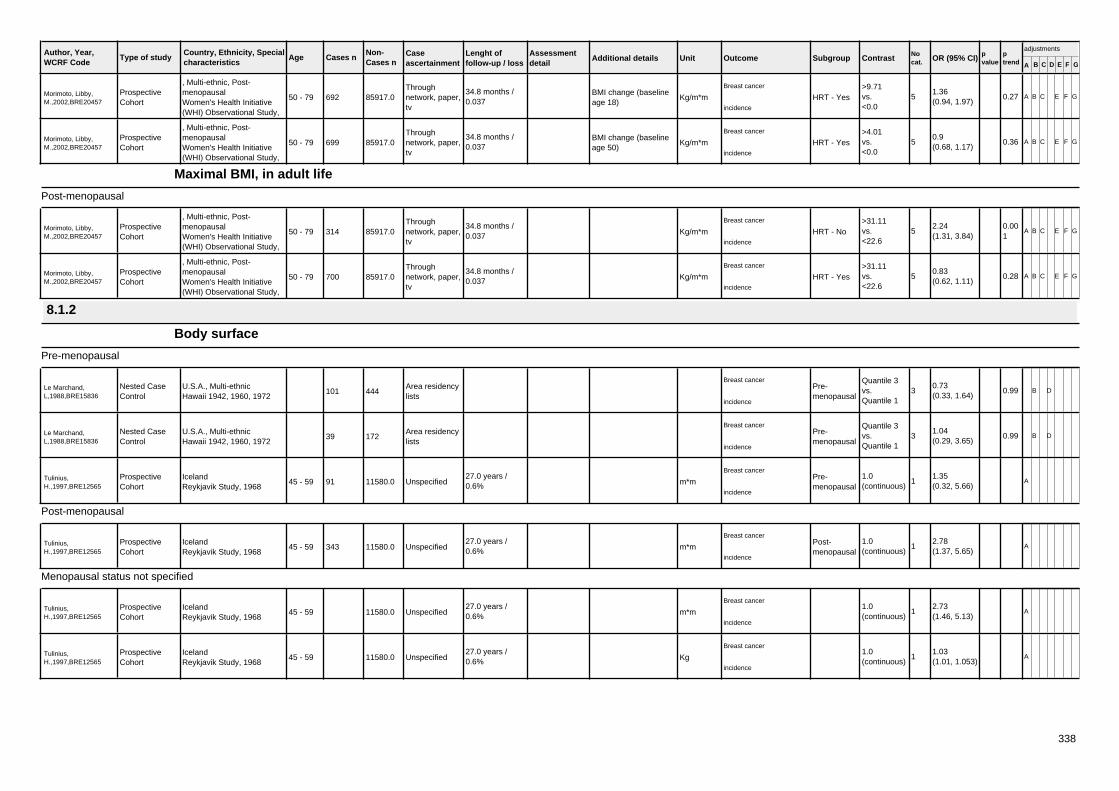
Author, Year,WCRF Code
Country, Ethnicity, Specialcharacteristics
Age Cases n Caseascertainment
Type of studyNon-Cases n
Lenght offollow-up / loss
Assessmentdetail
Additional details Unit Outcome Subgroup Contrast Nocat. OR (95% CI) p
valueptrend A B C D E F G
adjustments
Morimoto, Libby,M.,2002,BRE20457
, Multi-ethnic, Post-menopausalWomen's Health Initiative(WHI) Observational Study,
50 - 79 692Throughnetwork, paper,tv
ProspectiveCohort
85917.034.8 months /0.037
BMI change (baselineage 18)
Kg/m*m
Breast cancer
HRT - Yes>9.71vs.<0.0
51.36(0.94, 1.97)
0.27 A B C E F G
incidence
Morimoto, Libby,M.,2002,BRE20457
, Multi-ethnic, Post-menopausalWomen's Health Initiative(WHI) Observational Study,
50 - 79 699Throughnetwork, paper,tv
ProspectiveCohort
85917.034.8 months /0.037
BMI change (baselineage 50)
Kg/m*m
Breast cancer
HRT - Yes>4.01vs.<0.0
50.9(0.68, 1.17)
0.36 A B C E F G
incidence
Maximal BMI, in adult life
Post-menopausal
Morimoto, Libby,M.,2002,BRE20457
, Multi-ethnic, Post-menopausalWomen's Health Initiative(WHI) Observational Study,
50 - 79 314Throughnetwork, paper,tv
ProspectiveCohort
85917.034.8 months /0.037 Kg/m*m
Breast cancer
HRT - No>31.11vs.<22.6
52.24(1.31, 3.84)
0.001
A B C E F G
incidence
Morimoto, Libby,M.,2002,BRE20457
, Multi-ethnic, Post-menopausalWomen's Health Initiative(WHI) Observational Study,
50 - 79 700Throughnetwork, paper,tv
ProspectiveCohort
85917.034.8 months /0.037 Kg/m*m
Breast cancer
HRT - Yes>31.11vs.<22.6
50.83(0.62, 1.11)
0.28 A B C E F G
incidence
8.1.2
Body surface
Pre-menopausal
Le Marchand,L,1988,BRE15836
U.S.A., Multi-ethnicHawaii 1942, 1960, 1972
101Area residencylists
Nested CaseControl
444
Breast cancerPre-menopausal
Quantile 3vs.Quantile 1
30.73(0.33, 1.64)
0.99 B D
incidence
Le Marchand,L,1988,BRE15836
U.S.A., Multi-ethnicHawaii 1942, 1960, 1972
39Area residencylists
Nested CaseControl
172
Breast cancerPre-menopausal
Quantile 3vs.Quantile 1
31.04(0.29, 3.65)
0.99 B D
incidence
Tulinius,H.,1997,BRE12565
IcelandReykjavik Study, 1968
45 - 59 91 UnspecifiedProspectiveCohort
11580.027.0 years /0.6% m*m
Breast cancerPre-menopausal
1.0(continuous)
11.35(0.32, 5.66)
A
incidence
Post-menopausal
Tulinius,H.,1997,BRE12565
IcelandReykjavik Study, 1968
45 - 59 343 UnspecifiedProspectiveCohort
11580.027.0 years /0.6% m*m
Breast cancerPost-menopausal
1.0(continuous)
12.78(1.37, 5.65)
A
incidence
Menopausal status not specified
Tulinius,H.,1997,BRE12565
IcelandReykjavik Study, 1968
45 - 59 UnspecifiedProspectiveCohort
11580.027.0 years /0.6% m*m
Breast cancer1.0(continuous)
12.73(1.46, 5.13)
A
incidence
Tulinius,H.,1997,BRE12565
IcelandReykjavik Study, 1968
45 - 59 UnspecifiedProspectiveCohort
11580.027.0 years /0.6% Kg
Breast cancer1.0(continuous)
11.03(1.01, 1.053)
A
incidence
338

Author, Year,WCRF Code
Country, Ethnicity, Specialcharacteristics
Age Cases n Caseascertainment
Type of studyNon-Cases n
Lenght offollow-up / loss
Assessmentdetail
Additional details Unit Outcome Subgroup Contrast Nocat. OR (95% CI) p
valueptrend A B C D E F G
adjustments
Clinical obesity
Pre-menopausal
Wolk,A.,2001,BRE13549
sweden, ObeseSwedish obese cohort
18 - (47) 89HospitalRecords only
Historical Cohort 19964.0 10.6 years <50 yrs
Breast cancerPre-menopausal
obese cohortvs.general pop
20.7(0.5, 0.9)
A
incidence
Post-menopausal
Wolk,A.,2001,BRE13549
sweden, ObeseSwedish obese cohort
18 - (47) 192HospitalRecords only
Historical Cohort 19964.0 10.6 years 60-69 yrs
Breast cancerPost-menopausal
obese cohortvs.general pop
21.3(1.1, 1.6)
A
incidence
Menopausal status not specified
MollerH,1994,BRE17842
DanemarkDanish Record-linkageStudy, 1987
231HospitalRecords only
ProspectiveCohort
null 4.8 years hospital discharge withdiagnosis of obesity
Breast cancerobesevs.Danishpopulation
21.0(0.9, 1.2)
A G
incidence
Wolk,A.,2001,BRE13549
sweden, ObeseSwedish obese cohort
18 - (47) 309HospitalRecords only
Historical Cohort 205970 10.6 yearsBreast cancer
obese cohortvs.generalpopul
21.1(0.9, 1.2)
A
incidence
Cole's index
Pre-menopausal
Le Marchand,L,1988,BRE15836
U.S.A., Multi-ethnicHawaii 1942, 1960, 1972
101Area residencylists
Nested CaseControl
444 cole index
Breast cancerPre-menopausal
Quantile 3vs.Quantile 1
30.4(0.21, 0.75)
0.004
B D
incidence
Le Marchand,L,1988,BRE15836
U.S.A., Multi-ethnicHawaii 1942, 1960, 1972
39Area residencylists
Nested CaseControl
172 cole index
Breast cancerPre-menopausal
Quantile 3vs.Quantile 1
30.66(0.24, 1.86)
0.99 B D
incidence
Other weight adjusted for height measures
Menopausal status not specified
Swanson, C.A.,1988,BRE11981
usa, Black and WhiteNHANES I, 1971
25 - 74 121 UnspecifiedProspectiveCohort
7149 10.0 years wt/stature Kg/m
Breast cancer 42.0vs.25.0
41.3(0.8, 2.1)
0.54 A B C E F
mortality/incidence
Ponderal index
Pre-menopausal
McCormack,V.A.,2003,BRE20357
Sweden, Not specifiedUpsala birth cohort
36 - 82 63Generalpopulation(survey)
Historical Cohort 5358 38.0 years / 0,3 kg/m3 TEMP
Breast cancerPre-menopausal
>=28.5vs.<24.4
51.42(0.61, 3.32)
0.37 A B G
incidence
339

Author, Year,WCRF Code
Country, Ethnicity, Specialcharacteristics
Age Cases n Caseascertainment
Type of studyNon-Cases n
Lenght offollow-up / loss
Assessmentdetail
Additional details Unit Outcome Subgroup Contrast Nocat. OR (95% CI) p
valueptrend A B C D E F G
adjustments
McCormackV.A.,2005,BRE23366
Sweden, Not specifiedUpsala birth cohort
HospitalRecords only
ProspectiveCohort
5346.0 37.2 years SD Units
Invasive breast cancerPre-menopausal
1.0(continuous)
11.06(0.79, 1.42)
incidence
Post-menopausal
McCormack,V.A.,2003,BRE20357
Sweden, Not specifiedUpsala birth cohort
36 - 82 296Generalpopulation(survey)
Historical Cohort 5173 38.0 years / 0,3 kg/m3 TEMP
Breast cancerPost-menopausal
>=28.5vs.<24.4
50.85(0.59, 1.23)
0.67 A B G
incidence
McCormackV.A.,2005,BRE23366
Sweden, Not specifiedUpsala birth cohort
HospitalRecords only
ProspectiveCohort
5346.0 37.2 years SD Units
Invasive breast cancerPost-menopausal
1.0(continuous)
10.93(0.84, 1.04)
incidence
Relative weight
Pre-menopausal
Le Marchand,L,1988,BRE15836
U.S.A., Multi-ethnicHawaii 1942, 1960, 1972
101Area residencylists
Nested CaseControl
444 Benn's relative weight
Breast cancerPre-menopausal
Quantile 3vs.Quantile 1
30.35(0.18, 0.68)
0.002
B D
incidence
Le Marchand,L,1988,BRE15836
U.S.A., Multi-ethnicHawaii 1942, 1960, 1972
39Area residencylists
Nested CaseControl
172 Benn's relative weight
Breast cancerPre-menopausal
Quantile 3vs.Quantile 1
30.77(0.25, 2.36)
0.99 B D
incidence
De Stavola, B.L.,1993,BRE02122
United Kingdom, NotspecifiedGuernsey G2 and G3
73Throughnetwork, paper,tv
ProspectiveCohort
4528.0 15.0 years / 0 w/h Kg/m
Breast cancerPre-menopausal
>42.8vs.<35.19
41.3(0.6, 2.6)
0.43 A
incidence
Yong,L.C.,1996,BRE13803
USA, Screening ProgramBCDDP, 1973
31 - 89 226
Through healthorg. (screening,healthinsurance)
ProspectiveCohort
54896.0 7.0 years Kg/m^1.5
Breast cancerPre-menopausal
>34.7vs.<26.7
50.9(0.6, 1.4)
0.62 A B C F
incidence
Post-menopausal
De Stavola, B.L.,1993,BRE02122
United Kingdom, NotspecifiedGuernsey G2 and G3
95Throughnetwork, paper,tv
ProspectiveCohort
4528.0 15.0 years / 0 Kg/m
Breast cancerPost-menopausal
>42.8vs.<35.19
41.2(0.6, 2.2)
0.55 A
incidence
Yong,L.C.,1996,BRE13803
USA, Screening ProgramBCDDP, 1973
31 - 89 226
Through healthorg. (screening,healthinsurance)
ProspectiveCohort
54896.0 7.0 years Kg/m^1.5
Breast cancerPost-menopausal
>34.7vs.<26.7
51.3(1.1, 1.6)
0.03 A B C F
incidence
Menopausal status not specified
Garfinkel,L.,1986,BRE03122
USA, Multi-ethnic,Household groupsAmerican Cancer SocietyStudy, 1959
Generalpopulation(survey)
ProspectiveCohort
419060.0 12.0 years
Weight Index = weightof each person dividedby average weight *100 (an average weight
%
Breast cancer140 + weightindexvs.90-109
51.53(null, null)
A G
cancer death
Cerhan, J.R.,2004,BRE01495
USA, Not specifiedMinesota, 1944
59
Through healthorg. (screening,healthinsurance)
ProspectiveCohort
709065.0 years / 20families at age 12
Breast cancer FamilyHistory BC -No
aboveaveragevs.average
30.75(0.26, 2.16)
0.05 A D G
incidence
340
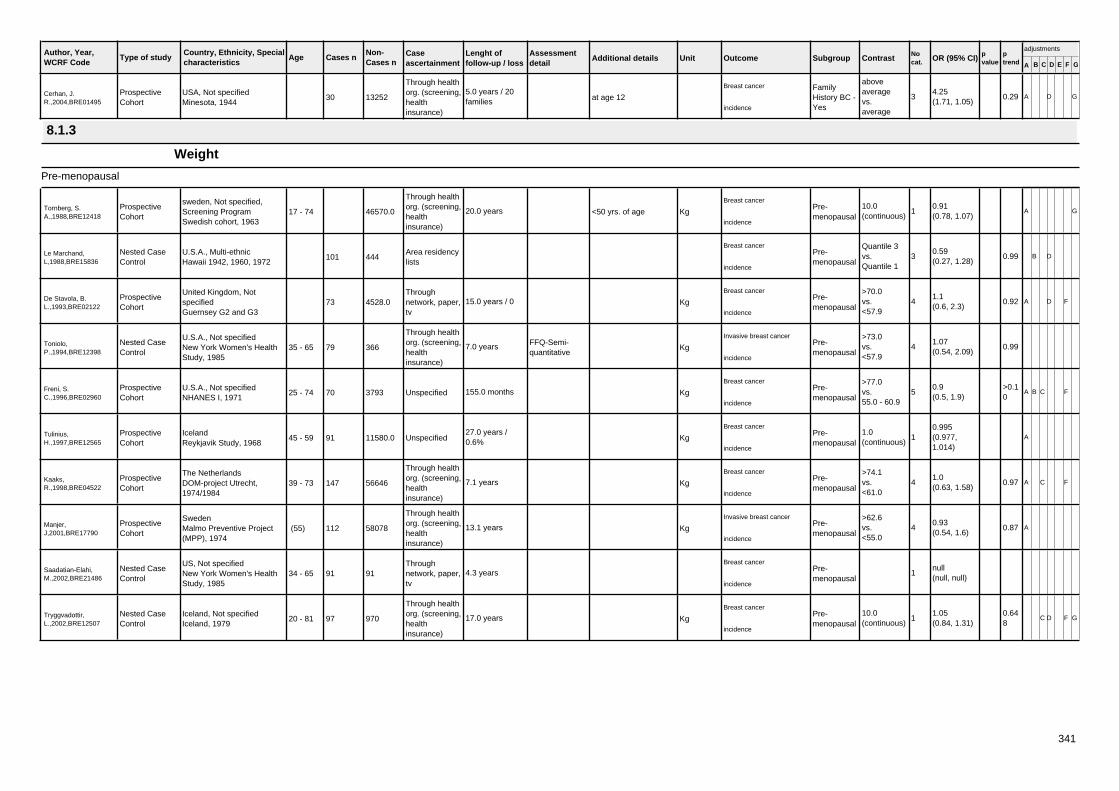
Author, Year,WCRF Code
Country, Ethnicity, Specialcharacteristics
Age Cases n Caseascertainment
Type of studyNon-Cases n
Lenght offollow-up / loss
Assessmentdetail
Additional details Unit Outcome Subgroup Contrast Nocat. OR (95% CI) p
valueptrend A B C D E F G
adjustments
Cerhan, J.R.,2004,BRE01495
USA, Not specifiedMinesota, 1944
30
Through healthorg. (screening,healthinsurance)
ProspectiveCohort
132525.0 years / 20families at age 12
Breast cancer FamilyHistory BC -Yes
aboveaveragevs.average
34.25(1.71, 1.05)
0.29 A D G
incidence
8.1.3
Weight
Pre-menopausal
Tornberg, S.A.,1988,BRE12418
sweden, Not specified,Screening ProgramSwedish cohort, 1963
17 - 74
Through healthorg. (screening,healthinsurance)
ProspectiveCohort
46570.0 20.0 years <50 yrs. of age Kg
Breast cancerPre-menopausal
10.0(continuous)
10.91(0.78, 1.07)
A G
incidence
Le Marchand,L,1988,BRE15836
U.S.A., Multi-ethnicHawaii 1942, 1960, 1972
101Area residencylists
Nested CaseControl
444
Breast cancerPre-menopausal
Quantile 3vs.Quantile 1
30.59(0.27, 1.28)
0.99 B D
incidence
De Stavola, B.L.,1993,BRE02122
United Kingdom, NotspecifiedGuernsey G2 and G3
73Throughnetwork, paper,tv
ProspectiveCohort
4528.0 15.0 years / 0 Kg
Breast cancerPre-menopausal
>70.0vs.<57.9
41.1(0.6, 2.3)
0.92 A D F
incidence
Toniolo,P.,1994,BRE12398
U.S.A., Not specifiedNew York Women's HealthStudy, 1985
35 - 65 79
Through healthorg. (screening,healthinsurance)
FFQ-Semi-quantitative
Nested CaseControl
366 7.0 years Kg
Invasive breast cancerPre-menopausal
>73.0vs.<57.9
41.07(0.54, 2.09)
0.99incidence
Freni, S.C.,1996,BRE02960
U.S.A., Not specifiedNHANES I, 1971
25 - 74 70 UnspecifiedProspectiveCohort
3793 155.0 months Kg
Breast cancerPre-menopausal
>77.0vs.55.0 - 60.9
50.9(0.5, 1.9)
>0.10
A B C F
incidence
Tulinius,H.,1997,BRE12565
IcelandReykjavik Study, 1968
45 - 59 91 UnspecifiedProspectiveCohort
11580.027.0 years /0.6% Kg
Breast cancerPre-menopausal
1.0(continuous)
10.995(0.977,1.014)
A
incidence
Kaaks,R.,1998,BRE04522
The NetherlandsDOM-project Utrecht,1974/1984
39 - 73 147
Through healthorg. (screening,healthinsurance)
ProspectiveCohort
56646 7.1 years Kg
Breast cancerPre-menopausal
>74.1vs.<61.0
41.0(0.63, 1.58)
0.97 A C F
incidence
Manjer,J,2001,BRE17790
SwedenMalmo Preventive Project(MPP), 1974
(55) 112
Through healthorg. (screening,healthinsurance)
ProspectiveCohort
58078 13.1 years Kg
Invasive breast cancerPre-menopausal
>62.6vs.<55.0
40.93(0.54, 1.6)
0.87 A
incidence
Saadatian-Elahi,M.,2002,BRE21486
US, Not specifiedNew York Women's HealthStudy, 1985
34 - 65 91Throughnetwork, paper,tv
Nested CaseControl
91 4.3 yearsBreast cancer
Pre-menopausal
1null(null, null)
incidence
Tryggvadottir,L.,2002,BRE12507
Iceland, Not specifiedIceland, 1979
20 - 81 97
Through healthorg. (screening,healthinsurance)
Nested CaseControl
970 17.0 years Kg
Breast cancerPre-menopausal
10.0(continuous)
11.05(0.84, 1.31)
0.648
C D F G
incidence
341

Author, Year,WCRF Code
Country, Ethnicity, Specialcharacteristics
Age Cases n Caseascertainment
Type of studyNon-Cases n
Lenght offollow-up / loss
Assessmentdetail
Additional details Unit Outcome Subgroup Contrast Nocat. OR (95% CI) p
valueptrend A B C D E F G
adjustments
LahmannPH,2004,BRE15804
EUROPEEuropean ProspectiveInvestigation into Cancer andNutrition (EPIC) 1993-1998
18 - 80 474Otherprocedure
ProspectiveCohort
73168 4.7 years Kg
Breast cancerPre-menopausal
>75.0vs.<56.7
50.83(0.61, 1.13)
0.459
A B C E F G
incidence
Tehard,B.,2004,BRE12173
France, Registered teachersE3N-EPIC, 1990
40 - 65 692
Through socialorganization(profession,religion)
ProspectiveCohort
283543 9.7 years Kg
Invasive breast cancerPre-menopausal
>63.1vs.<52.0
40.75(0.61, 0.93)
B C E F G
incidence
TehardB.,2006,BRE80103
FranceE3N-EPIC, 1990
40 - 65 212
patientrecords/directcontact/healthinsurance
FFQProspectiveCohort
98997.0 4.2 years / 0.33 Weight Kg
Breast cancerPre-menopausal
>65.0vs.<54.0
40.57(0.42, 0.98)
<=0.05
A B C E F G
incidence
Iwasaki etal.,2007,BRE20027
JapanJPHC, 1990
40 - 69 201 Cancer registryQuestionnaire(nos)
ProspectiveCohort
53857.0 9.9 years / 0.05 Weight Kg
Breast cancerpremenopausal women
65+vs.<50
51.57(0.96, 2.54)
0.13 A C D E
incidence
Iwasaki etal.,2007,BRE20027
JapanJPHC, 1990
40 - 69 62 Cancer registryQuestionnaire(nos)
ProspectiveCohort
20871 9.9 years / 0.05 Weight kg
Breast cancer ER+premenopausal women
1.0(continuous)
11.02(0.99, 1.05)
A C D E
incidence
Iwasaki etal.,2007,BRE20027
JapanJPHC, 1990
40 - 69 41 Cancer registryQuestionnaire(nos)
ProspectiveCohort
20871 9.9 years / 0.05 Weight kg
Breast cancer ER-premenopausal women
1.0(continuous)
11.01(0.97, 1.05)
A C D E
incidence
Iwasaki etal.,2007,BRE20027
JapanJPHC, 1990
40 - 69 53 Cancer registryQuestionnaire(nos)
ProspectiveCohort
20871 9.9 years / 0.05 Weight kg
Breast cancer PR+premenopausal women
1.0(continuous)
11.03(0.996, 1.05)
A C D E
incidence
Iwasaki etal.,2007,BRE20027
JapanJPHC, 1990
40 - 69 42 Cancer registryQuestionnaire(nos)
ProspectiveCohort
20871 9.9 years / 0.05 Weight kg
Breast cancer PR-premenopausal women
1.0(continuous)
11.0(0.95, 1.04)
A C D E
incidence
Post-menopausal
Tornberg, S.A.,1988,BRE12418
sweden, Not specified,Screening ProgramSwedish cohort, 1963
17 - 74
Through healthorg. (screening,healthinsurance)
ProspectiveCohort
46570.0 20.0 years >=50 yrs. of age Kg
Breast cancerPost-menopausal
10.0(continuous)
11.11(1.05, 1.18)
A G
incidence
Le Marchand,L,1988,BRE15836
U.S.A., Multi-ethnicHawaii 1942, 1960, 1972
39Area residencylists
Nested CaseControl
172
Breast cancerPost-menopausal
Quantile 3vs.Quantile 1
31.37(0.3, 4.88)
0.99 B D
incidence
Folsom,AR,1990,BRE02836
USA, Post-menopausalIowa Women's Health Study
55 - 69 226 By MailNested CaseControl
1809 2.0 years Kg
Breast cancerPost-menopausal
>72.5vs.<61.9
31.22(0.87, 1.73)
0.27 A
incidence
den Tonkelaar,I.,1992,BRE02222
the Neederlands, Notspecified, Post-menopausalDOM-project Utrecht,1974/1984
49 - 66
Through healthorg. (screening,healthinsurance)
ProspectiveCohort
9746.0 12.5 years / 4% Kg
Breast cancerPost-menopausal
>75.0vs.<61.0
41.27(0.91, 1.77)
0.99 A
incidence
342

Author, Year,WCRF Code
Country, Ethnicity, Specialcharacteristics
Age Cases n Caseascertainment
Type of studyNon-Cases n
Lenght offollow-up / loss
Assessmentdetail
Additional details Unit Outcome Subgroup Contrast Nocat. OR (95% CI) p
valueptrend A B C D E F G
adjustments
den Tonkelaar,I.,1992,BRE02222
the Neederlands, Notspecified, Post-menopausalDOM-project Utrecht,1974/1984
49 - 66
Through healthorg. (screening,healthinsurance)
ProspectiveCohort
9746.0 12.5 years / 4% greater than 82kg vs<57
Kg
Breast cancerPost-menopausal
upper10%vs.lower10%
21.87(1.07, 3.29)
A
incidence
Barrett-Connor,E.,1993,BRE00581
U.S, WhiteRancho Bernardo, 1972
40 - 79 15
Through socialorganization(profession,religion)
24h RecallProspectiveCohort
575 15.0 yearsBreast cancer
Post-menopausal
1null(null, null)
A
mortality/incidence
De Stavola, B.L.,1993,BRE02122
United Kingdom, NotspecifiedGuernsey G2 and G3
95Throughnetwork, paper,tv
ProspectiveCohort
4528.0 15.0 years / 0 Kg
Breast cancerPost-menopausal
>70.0vs.<57.9
41.1(0.6, 2.0)
0.92 A D F
incidence
Toniolo,P.,1994,BRE12398
U.S.A., Not specifiedNew York Women's HealthStudy, 1985
35 - 65 101
Through healthorg. (screening,healthinsurance)
FFQ-Semi-quantitative
Nested CaseControl
465 7.0 years Kg
Invasive breast cancerPost-menopausal
>73.0vs.<57.9
42.3(1.07, 4.94)
0.005
incidence
den Tonkelaar,I.,1995,BRE02224
netherland, ScreeningProgramDOM-project Utrecht,1974/1984
40 - 73 38
Through healthorg. (screening,healthinsurance)
ProspectiveCohort
3530 4.0 years / 5% Kg
Breast cancerPost-menopausal
>73.0vs.<63.99
31.45(0.63, 3.36)
0.42 A
incidence
Freni, S.C.,1996,BRE02960
U.S.A., Not specifiedNHANES I, 1971
25 - 74 112 UnspecifiedProspectiveCohort
3829 155.0 months Kg
Breast cancerPost-menopausal
>77.0vs.55.0 - 60.9
52.5(1.2, 5.1)
0.03 A B C F
incidence
Tulinius,H.,1997,BRE12565
IcelandReykjavik Study, 1968
45 - 59 343 UnspecifiedProspectiveCohort
11580.027.0 years /0.6% Kg
Breast cancerPost-menopausal
1.0(continuous)
11.012(1.003, 1.02)
A
incidence
van den Brandt, P.A.,1997,BRE12717
The Netherlands, Post-menopausalThe Netherlands CohortStudy on diet and cancer,
55 - 69 UnspecifiedCase Cohort null 4.3 years / 0 weight at baseline Kg
Invasive breast cancerPost-menopausal
10.0(continuous)
11.09(0.98, 1.21)
A C D E
incidence
Kaaks,R.,1998,BRE04522
The NetherlandsDOM-project Utrecht,1974/1984
39 - 73 76
Through healthorg. (screening,healthinsurance)
ProspectiveCohort
34363 7.1 years Kg
Breast cancerPost-menopausal
>74.1vs.<61.0
41.0(0.54, 1.85)
0.20 A C F
incidence
Manjer,J,2001,BRE17790
SwedenMalmo Preventive Project(MPP), 1974
(55) 157
Through healthorg. (screening,healthinsurance)
ProspectiveCohort
60845 13.1 years Kg
Invasive breast cancerPost-menopausal
>73.8vs.<59.3
41.24(0.79, 1.94)
0.44 A
incidence
Sellers, Thomas,A.,2002,BRE20892
USA, Multi-ethnic, Post-menopausalIowa Women's Health Study
55 - 69 1368 By MailProspectiveCohort
28599 13.0 years lbs
Breast cancer FamilyHistory BC -No & Post-menopausal
>175.0vs.<128.0
51.83(1.49, 2.24)
0.001
B C D E F G
incidence
Sellers, Thomas,A.,2002,BRE20892
USA, Multi-ethnic, Post-menopausalIowa Women's Health Study
55 - 69 282 By MailProspectiveCohort
3950 13.0 years lbs
Breast cancer FamilyHistory BC -Yes & Post-menopausal
>175.0vs.<128.0
51.74(1.15, 2.65)
0.02 B C D E F G
incidence
Morimoto, Libby,M.,2002,BRE20457
, Multi-ethnic, Post-menopausalWomen's Health Initiative(WHI) Observational Study,
50 - 79 315Throughnetwork, paper,tv
ProspectiveCohort
85917.034.8 months /0.037 Kg
Breast cancer
HRT - No>82.3vs.<58.7
52.85(1.81, 4.49)
0.001
A B C E F G
incidence
343

Author, Year,WCRF Code
Country, Ethnicity, Specialcharacteristics
Age Cases n Caseascertainment
Type of studyNon-Cases n
Lenght offollow-up / loss
Assessmentdetail
Additional details Unit Outcome Subgroup Contrast Nocat. OR (95% CI) p
valueptrend A B C D E F G
adjustments
Morimoto, Libby,M.,2002,BRE20457
, Multi-ethnic, Post-menopausalWomen's Health Initiative(WHI) Observational Study,
50 - 79 705Throughnetwork, paper,tv
ProspectiveCohort
85917.034.8 months /0.037 Kg
Breast cancer
HRT - Yes>82.3vs.<58.7
50.91(0.68, 1.21)
0.73 A B C E F G
incidence
Saadatian-Elahi,M.,2002,BRE21486
US, Not specifiedNew York Women's HealthStudy, 1985
34 - 65 106Throughnetwork, paper,tv
Nested CaseControl
106 4.3 yearsBreast cancer
Post-menopausal
1null(null, null)
incidence
Tryggvadottir,L.,2002,BRE12507
Iceland, Not specifiedIceland, 1979
20 - 81 589
Through healthorg. (screening,healthinsurance)
Nested CaseControl
5299 17.0 years Kg
Breast cancerPost-menopausal
10.0(continuous)
11.07(0.99, 1.16)
0.078
C D F G
incidence
Pike, M.C.,2002,BRE16343
U.S.A., Multi-ethnic, Post-menopausalHawaii and California, 1993
1757 By MailQuestionnaire(nos)
ProspectiveCohort
88712.0 6.0 years Kg
Breast cancerPost-menopausal
>77.0vs.<57
41.34(null, null)
0.03 C D E F G
incidence
Sellers, Thomas,A.,2002,BRE20892
USA, Multi-ethnic, Post-menopausalIowa Women's Health Study
55 - 69 1043 By MailProspectiveCohort
37105.0 13.0 years lbs
Breast cancer ER+Post-menopausal
>175.0vs.<128.0
52.03(1.59, 2.59)
B C D E F G
incidence
Sellers, Thomas,A.,2002,BRE20892
USA, Multi-ethnic, Post-menopausalIowa Women's Health Study
55 - 69 232 By MailProspectiveCohort
37105.0 13.0 years lbs
Breast cancer ER-Post-menopausal
>175.0vs.<128.0
51.22(0.68, 2.19)
B C D E F G
incidence
Sellers, Thomas,A.,2002,BRE20892
USA, Multi-ethnic, Post-menopausalIowa Women's Health Study
55 - 69 993 By MailProspectiveCohort
37105.0 13.0 years lbs
Breast cancer PR+Post-menopausal
>175.0vs.<128.0
52.31(1.76, 3.05)
B C D E F G
incidence
Sellers, Thomas,A.,2002,BRE20892
USA, Multi-ethnic, Post-menopausalIowa Women's Health Study
55 - 69 362 By MailProspectiveCohort
37105.0 13.0 years lbs
Breast cancer PR-Post-menopausal
>175.0vs.<128.0
50.99(0.63, 1.54)
B C D E F G
incidence
Lahmann, Petra,H.,2003,BRE20119
Sweden, White, Post-menopausalMalmo Diet and Cancer,1991
50 - 73 236 By MailProspectiveCohort
12159.0 5.7 years Kg
Invasive & In situ breastcancer >77.1
vs.<58.9
51.53(0.97, 2.41)
0.014
A C D E F G
incidence
LahmannPH,2004,BRE15804
EUROPEEuropean ProspectiveInvestigation into Cancer andNutrition (EPIC) 1993-1998
18 - 80 494Otherprocedure
ProspectiveCohort
23820 4.7 years Kg
Breast cancer
HRT - Yes>75.0vs.<56.7
50.92(0.66, 1.28)
0.529
A B C E G
incidence
Wirfalt,E.,2004,BRE17083
Sweden, Not specified, Post-menopausalMalmo Diet and Cancer,1991
50 - By Mail7-day Record +Questionnaire
Nested CaseControl
12803.0 8.0 yearsBreast cancer
Post-menopausal
1null(null, null)
incidence
Tehard,B.,2004,BRE12173
France, Registered teachersE3N-EPIC, 1990
40 - 65 680
Through socialorganization(profession,religion)
ProspectiveCohort
217093 9.7 years Kg
Invasive breast cancer
HRT - Yes>64.1vs.<53.0
41.19(0.97, 1.48)
B C E F G
incidence
Tehard,B.,2004,BRE12173
France, Registered teachersE3N-EPIC, 1990
40 - 65 1311
Through socialorganization(profession,religion)
ProspectiveCohort
455106 9.7 years Kg
Invasive breast cancerPost-menopausal
quartile 4-bvs.quartile 1
51.1(0.93, 1.29)
B C E F G
incidence
344

Author, Year,WCRF Code
Country, Ethnicity, Specialcharacteristics
Age Cases n Caseascertainment
Type of studyNon-Cases n
Lenght offollow-up / loss
Assessmentdetail
Additional details Unit Outcome Subgroup Contrast Nocat. OR (95% CI) p
valueptrend A B C D E F G
adjustments
Macinnis, R.J etal.,2004,BRE80159
Australia, australian, southeuropean (Greek, Italian),Post menopausalMelbourne Collaborative
medical recordsProspectiveCohort
0.0 Weight
Invasive breast cancerPost-menopausal
Quantile 4vs.Quantile 1
41.7(1.2, 2.3)
A B F G
incidence
Macinnis, R.J etal.,2004,BRE80159
Australia, australian, southeuropean (Greek, Italian),Post menopausalMelbourne Collaborative
medical recordsProspectiveCohort
0.0 Weight kg
Invasive breast cancerPost-menopausal
10.0(continuous)
11.15(1.06, 1.25)
0.001
A B F G
incidence
Mellemkjoer etal.,2006,BRE80039
Danmark, Post-menopausalDiet, Cancer and Health,1993
50 - 65 416 Cancer registry FFQProspectiveCohort
11576 6.1 years Weight Kg
Breast cancer
HRT ever>75.5vs.<62.5
41.07(0.82, 1.39)
A B C E F G
incidence
Mellemkjoer etal.,2006,BRE80039
Danmark, Post-menopausalDiet, Cancer and Health,1993
50 - 65 416 Cancer registry FFQProspectiveCohort
11576 6.1 years Weight Kg
Breast cancer
HRT ever10.0(continuous)
11.02(0.94, 1.11)
0.66 A B C E F G
incidence
Mellemkjoer etal.,2006,BRE80039
Danmark, Post-menopausalDiet, Cancer and Health,1993
50 - 65 217 Cancer registry FFQProspectiveCohort
11579 6.1 years Weight Kg
Breast cancer
HRT never>75.5vs.<62.5
41.32(0.9, 1.92)
A B C E G
incidence
Mellemkjoer etal.,2006,BRE80039
Danmark, Post-menopausalDiet, Cancer and Health,1993
50 - 65 217 Cancer registry FFQProspectiveCohort
11579 6.1 years Weight Kg
Breast cancer
HRT never10.0(continuous)
11.07(0.97, 1.19)
0.17 A B C E G
incidence
TehardB.,2006,BRE80103
FranceE3N-EPIC, 1990
40 - 65 271
patientrecords/directcontact/healthinsurance
FFQProspectiveCohort
98997.0 4.2 years / 0.33 Weight Kg
Breast cancer Post-menop& HRTnonusers
>66.0vs.<53.9
41.22(0.92, 1.63)
>0.05
A B C E F G
incidence
TehardB.,2006,BRE80103
FranceE3N-EPIC, 1990
40 - 65 472
patientrecords/directcontact/healthinsurance
FFQProspectiveCohort
98997.0 4.2 years / 0.33 Weight Kg
Breast cancerPost-menop& HRT users
>66.0vs.<53.9
41.09(0.84, 1.42)
>0.05
A B C E F G
incidence
TehardB.,2006,BRE80103
FranceE3N-EPIC, 1990
40 - 65 147
patientrecords/directcontact/healthinsurance
FFQProspectiveCohort
98997.0 4.2 years / 0.33 Weight
Breast cancer Post-menop&transdermalHRT users
>66.0vs.<53.9
41.43(0.88, 2.32)
>0.05
A B C E F G
incidence
TehardB.,2006,BRE80103
FranceE3N-EPIC, 1990
40 - 65 1073
patientrecords/directcontact/healthinsurance
FFQProspectiveCohort
98997.0 4.2 years / 0.33 Weight Kg
Breast cancerPost-menopausal
>66.0vs.<53.9
41.23(0.97, 1.57)
>0.05
A B C E F G
incidence
KrebsE.E.,2006,BRE80106
United States, White, Post-menopausalStudy of OsteoporoticFractures, 1986
65 - (74)Self reportverified bymedical record
FFQProspectiveCohort
9704.0 11.3 years / 0.23 Weight Kg
Invasive breast cancerage >=70years
>73.4vs.<57.9
41.52(1.01, 2.29)
A B C D F G
incidence
KrebsE.E.,2006,BRE80106
United States, White, Post-menopausalStudy of OsteoporoticFractures, 1986
65 - (74) 350Self reportverified bymedical record
FFQProspectiveCohort
9704.0 11.3 years / 0.23 Weight Kg
Invasive breast cancerPost-menopausal
>73.4vs.<57.9
41.49(1.05, 2.1)
0.004
A B C D F G
incidence
Iwasaki etal.,2007,BRE20027
JapanJPHC, 1990
40 - 69 229 Cancer registryQuestionnaire(nos)
ProspectiveCohort
53857.0 9.9 years / 0.05 Weight Kg
Breast cancerpostmenopausal women
65+vs.<50
51.4(0.87, 2.26)
0.053
A C D E
incidence
345

Author, Year,WCRF Code
Country, Ethnicity, Specialcharacteristics
Age Cases n Caseascertainment
Type of studyNon-Cases n
Lenght offollow-up / loss
Assessmentdetail
Additional details Unit Outcome Subgroup Contrast Nocat. OR (95% CI) p
valueptrend A B C D E F G
adjustments
Iwasaki etal.,2007,BRE20027
JapanJPHC, 1990
40 - 69 65 Cancer registryQuestionnaire(nos)
ProspectiveCohort
29168 9.9 years / 0.05 Weight kg
Breast cancer ER+postmenopausal women
1.0(continuous)
11.04(1.01, 1.07)
A C D E
incidence
Iwasaki etal.,2007,BRE20027
JapanJPHC, 1990
40 - 69 Cancer registryQuestionnaire(nos)
ProspectiveCohort
53857.0 9.9 years / 0.05 Weight kg
Breast cancer ER+/PR+postmenopausal women
1.0(continuous)
11.04(1.01, 1.08)
A C D E
incidence
Iwasaki etal.,2007,BRE20027
JapanJPHC, 1990
40 - 69 41 Cancer registryQuestionnaire(nos)
ProspectiveCohort
29168 9.9 years / 0.05 Weight kg
Breast cancer ER-postmenopausal women
1.0(continuous)
10.98(0.93, 1.03)
A C D E
incidence
Iwasaki etal.,2007,BRE20027
JapanJPHC, 1990
40 - 69 Cancer registryQuestionnaire(nos)
ProspectiveCohort
53857.0 9.9 years / 0.05 Weight kg
Breast cancer ER-/PR-postmenopausal women
1.0(continuous)
10.99(0.94, 1.04)
A C D E
incidence
Iwasaki etal.,2007,BRE20027
JapanJPHC, 1990
40 - 69 46 Cancer registryQuestionnaire(nos)
ProspectiveCohort
29168 9.9 years / 0.05 Weight kg
Breast cancer PR+postmenopausal women
1.0(continuous)
11.03(0.995, 1.07)
A C D E
incidence
Iwasaki etal.,2007,BRE20027
JapanJPHC, 1990
40 - 69 55 Cancer registryQuestionnaire(nos)
ProspectiveCohort
29168 9.9 years / 0.05 Weight kg
Breast cancer PR-postmenopausal women
1.0(continuous)
11.01(0.97, 1.04)
A C D E
incidence
Menopausal status not specified
Swanson, C.A.,1988,BRE11981
usa, Black and WhiteNHANES I, 1971
25 - 74 121 UnspecifiedProspectiveCohort
7149 10.0 years Kg
Breast cancer 87.0vs.51.0
41.2(0.7, 1.9)
0.45 A B C E F
mortality/incidence
Tornberg, S.A.,1988,BRE12418
sweden, Not specified,Screening ProgramSwedish cohort, 1963
17 - 74
Through healthorg. (screening,healthinsurance)
ProspectiveCohort
46570.0 20.0 years Kg
Breast cancer10.0(continuous)
11.08(1.02, 1.14)
A G
incidence
Overvad,1991,BRE17893
Guernsey, Not specifiedGuernsey, 1967
35 -Multipleprocedure
Case Cohort 5162.0 11.0 yearsBreast cancer
1null(null, null)
incidence
Hoyer, A.P.,1992,BRE04086
Denmark, Not specifiedGlostrup Population Studies,1982
30 - 80Direct contactat home
Questionnaire(nos)
ProspectiveCohort
5207.0 26.0 years Kg
Breast cancer >=76vs.<56
41.9(0.8, 4.6)
0.10-0.20
mortality/incidence
Key,T.J.A.,1996,BRE15654
United Kingdom, Notspecified, Vegetarian andhealth conscious peopleUK Cohort of Vegetarians
16 - 79
From groupswith highvegetarianlikelihood
Questionnaire(nos)
ProspectiveCohort
6435.0 16.8 years Kg
Breast cancer >60.5vs.<54.0
30.94(0.52, 1.71)
A G
cancer death
Tulinius,H.,1997,BRE12565
IcelandReykjavik Study, 1968
45 - 59 UnspecifiedProspectiveCohort
11580.027.0 years /0.6% Kg
Breast cancer1.0(continuous)
11.01(1.002,1.018)
A
incidence
346

Author, Year,WCRF Code
Country, Ethnicity, Specialcharacteristics
Age Cases n Caseascertainment
Type of studyNon-Cases n
Lenght offollow-up / loss
Assessmentdetail
Additional details Unit Outcome Subgroup Contrast Nocat. OR (95% CI) p
valueptrend A B C D E F G
adjustments
Goodman, M.T.,1997,BRE03352
Japan, Not specified, Atomicbomb survivorsLSS, 1969
154 By MailQuestionnaire(nos)
ProspectiveCohort
175475 8.31 years Kg
Breast cancer >=59vs.<47
41.39(0.87, 2.2)
0.16 A G
incidence
Hoyer, A.P.,1998,BRE15433
Denmark, Not specifiedCopenhagenCHS
20 - 240 UnspecifiedQuestionnaire(nos)
Nested CaseControl
477 17.0 years Kg
Breast cancer >70.5vs.<56.19
41.89(1.13, 3.15)
0.04 B C D E F G
incidence
Key, T.J.,1999,BRE04758
Japan, Not specifiedLSS, 1969
427 By MailQuestionnaire(nos)
ProspectiveCohort
488990 24.0 years Kg
Breast cancer >=55vs.<45
51.25(0.93, 1.67)
0.068
A G
incidence
Drake, D.A.,2001,BRE02418
USA, Multi-ethnic, Fitnesscentre membersACLS, 1970
21 - 86
Through socialorganization(profession,religion)
ProspectiveCohort
4520.0 25.0 yearsBreast cancer
1null(null, null)
incidence
Hoyer, A.P.,2001,BRE15437
Denmark, Not specifiedCopenhagenCHS
25 - 80 UnspecifiedNested CaseControl
10317.0 17.0 years Kg
Breast cancer ER+ >71.0vs.<57.9
41.2(0.7, 1.9)
0.2 A
incidence
Hoyer, A.P.,2001,BRE15437
Denmark, Not specifiedCopenhagenCHS
25 - 80 UnspecifiedNested CaseControl
10317.0 17.0 years Kg
Breast cancer ER- >71.0vs.<57.9
42.1(0.8, 5.9)
0.1 A
incidence
Tryggvadottir,L.,2002,BRE12507
Iceland, Not specifiedIceland, 1979
20 - 81
Through healthorg. (screening,healthinsurance)
Nested CaseControl
80219.0 17.0 years Kg
Breast cancer10.0(continuous)
11.03(0.97, 1.09)
0.275
C D F G
incidence
LahmannPH,2004,BRE15804
EUROPEEuropean ProspectiveInvestigation into Cancer andNutrition (EPIC) 1993-1998
18 - 80 911Otherprocedure
ProspectiveCohort
78119 4.7 years Kg
Breast cancer
HRT - No>75.0vs.<56.7
51.65(1.32, 2.08)
<0.0001
A B C E G
incidence
Kilkkinen,A.,2004,BRE17698
FinlandHelsinki and Oulu, 1982
25 - 74 UnspecifiedQuestionnaire(nos)
Nested CaseControl
15497.0 15.0 yearsBreast cancer
1null(null, null)
A G
incidence
Tehard,B.,2004,BRE12173
France, Registered teachersE3N-EPIC, 1990
40 - 65 631
Through socialorganization(profession,religion)
ProspectiveCohort
238010 9.7 years Kg
Invasive breast cancer
HRT - No>64.1vs.<53.0
40.94(0.78, 1.15)
B C E F G
incidence
Wu, M.H.,2006,BRE24628
China, Asian, ScreeningProgramTaiwan 1990
(47) 104
Through healthorg. (screening,healthinsurance)
ProspectiveCohort
11834 10.3 years Kg
Breast cancer >63vs.<=50
42.0(1.1, 3.8)
0.0567
A D
incidence
Weight at 20 yrs
Post-menopausal
van den Brandt, P.A.,1997,BRE12717
The Netherlands, Post-menopausalThe Netherlands CohortStudy on diet and cancer,
55 - 69 UnspecifiedCase Cohort null 4.3 years / 0 weight at age 20 Kg
Invasive breast cancerPost-menopausal
10.0(continuous)
10.94(0.82, 1.09)
A C D E
incidence
347

Author, Year,WCRF Code
Country, Ethnicity, Specialcharacteristics
Age Cases n Caseascertainment
Type of studyNon-Cases n
Lenght offollow-up / loss
Assessmentdetail
Additional details Unit Outcome Subgroup Contrast Nocat. OR (95% CI) p
valueptrend A B C D E F G
adjustments
Weight at age 18 years
Post-menopausal
Ahn, J. etal.,2007,BRE80139
United States, Multi-ethnic,Post menopausalNIH- AARP Diet and HealthStudy
50 - (63) 948 Cancer registryProspectiveCohort
99039.0 4.0 4 yearsWeight change in totaladulthood, age 18y tothe current age
kg
Breast cancernon MHTusers
>=50.0vs.-1.9-1.9
92.15(1.35, 3.42)
<0.001
A B C D E F G
incidence
Weight in teens
Post-menopausal
Folsom,AR,1990,BRE02836
USA, Post-menopausalIowa Women's Health Study
55 - 69 225 By MailNested CaseControl
1808 2.0 years weight at age 18 Kg
Breast cancerPost-menopausal
>57.31vs.<52.29
30.81(0.57, 1.14)
0.23 A
incidence
Menopausal status not specified
Cerhan, J.R.,2004,BRE01495
USA, Not specifiedMinesota, 1944
54
Through healthorg. (screening,healthinsurance)
ProspectiveCohort
678285.0 years / 20families at 18 Kg
Breast cancer FamilyHistory BC -No
>56.9vs.<52.2
30.54(0.24, 1.2)
0.08 A D G
incidence
Cerhan, J.R.,2004,BRE01495
USA, Not specifiedMinesota, 1944
31
Through healthorg. (screening,healthinsurance)
ProspectiveCohort
124115.0 years / 20families at 18 Kg
Breast cancer FamilyHistory BC -Yes
>56.9vs.<52.2
31.09(0.45, 2.62)
0.88 A D G
incidence
Weight, at different age
Post-menopausal
Lahmann, Petra,H.,2003,BRE20119
Sweden, White, Post-menopausalMalmo Diet and Cancer,1991
50 - 73 191 By MailProspectiveCohort
12159.0 5.7 years weight change sinceage 20
Kg
Invasive & In situ breastcancer >21.1
vs.<4.9
51.75(1.11, 2.77)
0.028
A C D E F G
incidence
Menopausal status not specified
Colditz, G.A.,2000,BRE19251
U.S.A., Not specified,Registered nursesNurses' Health Study (NHS)Cohort 1976-1996
30 - 55 By MailQuestionnaire(nos)
ProspectiveCohort
58520.0 14.0 years weight average overlife
Kg
Invasive breast cancerconsistentlyobesevs.average
51.06(0.95, 1.17)
C D E F G
incidence
8.1.4
Skinfold measurements
Pre-menopausal
Freni, S.C.,1996,BRE02960
U.S.A., Not specifiedNHANES I, 1971
25 - 74 70 UnspecifiedProspectiveCohort
3793 155.0 months subscapular+ triceps mm
Breast cancerPre-menopausal
>59.0vs.<27.9
50.9(0.4, 2.0)
>0.10
A B C F
incidence
Post-menopausal
348
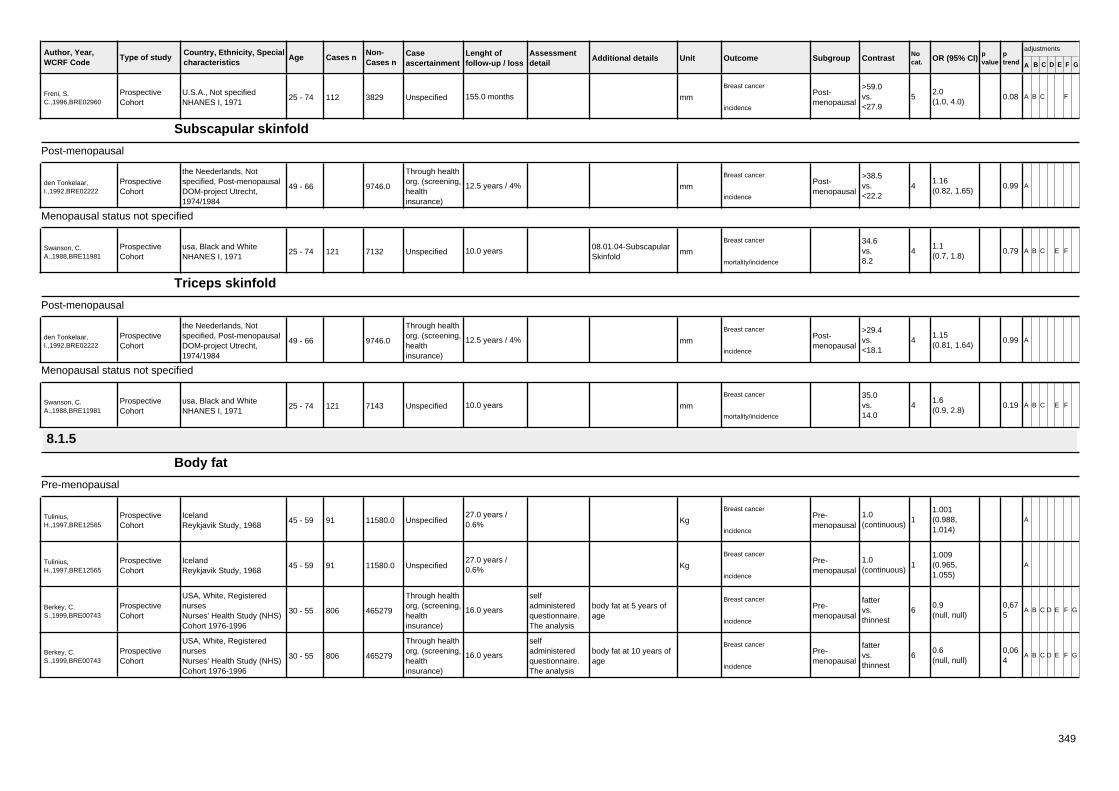
Author, Year,WCRF Code
Country, Ethnicity, Specialcharacteristics
Age Cases n Caseascertainment
Type of studyNon-Cases n
Lenght offollow-up / loss
Assessmentdetail
Additional details Unit Outcome Subgroup Contrast Nocat. OR (95% CI) p
valueptrend A B C D E F G
adjustments
Freni, S.C.,1996,BRE02960
U.S.A., Not specifiedNHANES I, 1971
25 - 74 112 UnspecifiedProspectiveCohort
3829 155.0 months mm
Breast cancerPost-menopausal
>59.0vs.<27.9
52.0(1.0, 4.0)
0.08 A B C F
incidence
Subscapular skinfold
Post-menopausal
den Tonkelaar,I.,1992,BRE02222
the Neederlands, Notspecified, Post-menopausalDOM-project Utrecht,1974/1984
49 - 66
Through healthorg. (screening,healthinsurance)
ProspectiveCohort
9746.0 12.5 years / 4% mm
Breast cancerPost-menopausal
>38.5vs.<22.2
41.16(0.82, 1.65)
0.99 A
incidence
Menopausal status not specified
Swanson, C.A.,1988,BRE11981
usa, Black and WhiteNHANES I, 1971
25 - 74 121 UnspecifiedProspectiveCohort
7132 10.0 years 08.01.04-SubscapularSkinfold
mm
Breast cancer 34.6vs.8.2
41.1(0.7, 1.8)
0.79 A B C E F
mortality/incidence
Triceps skinfold
Post-menopausal
den Tonkelaar,I.,1992,BRE02222
the Neederlands, Notspecified, Post-menopausalDOM-project Utrecht,1974/1984
49 - 66
Through healthorg. (screening,healthinsurance)
ProspectiveCohort
9746.0 12.5 years / 4% mm
Breast cancerPost-menopausal
>29.4vs.<18.1
41.15(0.81, 1.64)
0.99 A
incidence
Menopausal status not specified
Swanson, C.A.,1988,BRE11981
usa, Black and WhiteNHANES I, 1971
25 - 74 121 UnspecifiedProspectiveCohort
7143 10.0 years mm
Breast cancer 35.0vs.14.0
41.6(0.9, 2.8)
0.19 A B C E F
mortality/incidence
8.1.5
Body fat
Pre-menopausal
Tulinius,H.,1997,BRE12565
IcelandReykjavik Study, 1968
45 - 59 91 UnspecifiedProspectiveCohort
11580.027.0 years /0.6% Kg
Breast cancerPre-menopausal
1.0(continuous)
11.001(0.988,1.014)
A
incidence
Tulinius,H.,1997,BRE12565
IcelandReykjavik Study, 1968
45 - 59 91 UnspecifiedProspectiveCohort
11580.027.0 years /0.6% Kg
Breast cancerPre-menopausal
1.0(continuous)
11.009(0.965,1.055)
A
incidence
Berkey, C.S.,1999,BRE00743
USA, White, RegisterednursesNurses' Health Study (NHS)Cohort 1976-1996
30 - 55 806
Through healthorg. (screening,healthinsurance)
selfadministeredquestionnaire.The analysis
ProspectiveCohort
465279 16.0 years body fat at 5 years ofage
Breast cancerPre-menopausal
fattervs.thinnest
60.9(null, null)
0,675
A B C D E F G
incidence
Berkey, C.S.,1999,BRE00743
USA, White, RegisterednursesNurses' Health Study (NHS)Cohort 1976-1996
30 - 55 806
Through healthorg. (screening,healthinsurance)
selfadministeredquestionnaire.The analysis
ProspectiveCohort
465279 16.0 years body fat at 10 years ofage
Breast cancerPre-menopausal
fattervs.thinnest
60.6(null, null)
0,064
A B C D E F G
incidence
349

Author, Year,WCRF Code
Country, Ethnicity, Specialcharacteristics
Age Cases n Caseascertainment
Type of studyNon-Cases n
Lenght offollow-up / loss
Assessmentdetail
Additional details Unit Outcome Subgroup Contrast Nocat. OR (95% CI) p
valueptrend A B C D E F G
adjustments
Berkey, C.S.,1999,BRE00743
USA, White, RegisterednursesNurses' Health Study (NHS)Cohort 1976-1996
30 - 55 806
Through healthorg. (screening,healthinsurance)
selfadministeredquestionnaire.The analysis
ProspectiveCohort
465279 16.0 years body fat at 20 years ofage
Breast cancerPre-menopausal
fattervs.thinnest
60.72(null, null)
0,118
A B C D E F G
incidence
Post-menopausal
Tulinius,H.,1997,BRE12565
IcelandReykjavik Study, 1968
45 - 59 343 UnspecifiedProspectiveCohort
11580.027.0 years /0.6% Kg
Breast cancerPost-menopausal
1.0(continuous)
11.004(0.998, 1.01)
A
incidence
Tulinius,H.,1997,BRE12565
IcelandReykjavik Study, 1968
45 - 59 343 UnspecifiedProspectiveCohort
11580.027.0 years /0.6% Kg
Breast cancerPost-menopausal
1.0(continuous)
11.032(1.009,1.054)
A
incidence
Berkey, C.S.,1999,BRE00743
USA, White, RegisterednursesNurses' Health Study (NHS)Cohort 1976-1996
30 - 55 1485
Through healthorg. (screening,healthinsurance)
selfadministeredquestionnaire.The analysis
ProspectiveCohort
561104 16.0 years body fat at 5 years ofage
Breast cancerPost-menopausal
fattervs.thinnest
61.13(null, null)
0,826
A B C D E F G
incidence
Berkey, C.S.,1999,BRE00743
USA, White, RegisterednursesNurses' Health Study (NHS)Cohort 1976-1996
30 - 55 1485
Through healthorg. (screening,healthinsurance)
selfadministeredquestionnaire.The analysis
ProspectiveCohort
561104 16.0 years body fat at 10 years ofage
Breast cancerPost-menopausal
fattervs.thinnest
60.72(null, null)
0,043
A B C D E F G
incidence
Berkey, C.S.,1999,BRE00743
USA, White, RegisterednursesNurses' Health Study (NHS)Cohort 1976-1996
30 - 55 1485
Through healthorg. (screening,healthinsurance)
selfadministeredquestionnaire.The analysis
ProspectiveCohort
561104 16.0 years body fat at 20 years ofage
Breast cancerPost-menopausal
fattervs.thinnest
60.76(null, null)
0,205
A B C D E F G
incidence
Lahmann, Petra,H.,2003,BRE20119
Sweden, White, Post-menopausalMalmo Diet and Cancer,1991
50 - 73 234 By MailProspectiveCohort
12159.0 5.7 years percent of total weight %
Invasive & In situ breastcancer >36.1
vs.<26.9
52.01(1.26, 3.21)
0.01 A C D E F G
incidence
Wirfalt,E.,2004,BRE17083
Sweden, Not specified, Post-menopausalMalmo Diet and Cancer,1991
50 - By MailNested CaseControl
12803.0 8.0 yearsBreast cancer
Post-menopausal
1null(null, null)
incidence
Mellemkjoer etal.,2006,BRE80039
Danmark, Post-menopausalDiet, Cancer and Health,1993
50 - 65 414 Cancer registry
Recorded bytrainedtechnician.height measured
ProspectiveCohort
11534 6.1 years BFMI, body fat massindex
Kg/m*m
Breast cancer
HRT ever<6.8vs.>10.8
40.98(0.71, 1.34)
A B C D E F G
incidence
Mellemkjoer etal.,2006,BRE80039
Danmark, Post-menopausalDiet, Cancer and Health,1993
50 - 65 414 Cancer registry
Recorded bytrainedtechnician.height measured
ProspectiveCohort
11534 6.1 years BFMI, body fat massindex
Kg/m*m
Breast cancer
HRT ever1.0(continuous)
11.0(0.96, 1.04)
0.79 A B C D E F G
incidence
Mellemkjoer etal.,2006,BRE80039
Danmark, Post-menopausalDiet, Cancer and Health,1993
50 - 65 414 Cancer registry
Recorded bytrainedtechnician.height measured
ProspectiveCohort
11534 6.1 years Body fat percentage %
Breast cancer
HRT ever<30.0vs.>39.3
40.97(0.73, 1.3)
A B C E F G
incidence
Mellemkjoer etal.,2006,BRE80039
Danmark, Post-menopausalDiet, Cancer and Health,1993
50 - 65 414 Cancer registry
Recorded bytrainedtechnician.height measured
ProspectiveCohort
11534 6.1 years Body fat percentage %
Breast cancer
HRT ever10.0(continuous)
10.97(0.83, 1.13)
0.67 A B C E F G
incidence
350

Author, Year,WCRF Code
Country, Ethnicity, Specialcharacteristics
Age Cases n Caseascertainment
Type of studyNon-Cases n
Lenght offollow-up / loss
Assessmentdetail
Additional details Unit Outcome Subgroup Contrast Nocat. OR (95% CI) p
valueptrend A B C D E F G
adjustments
Mellemkjoer etal.,2006,BRE80039
Danmark, Post-menopausalDiet, Cancer and Health,1993
50 - 65 217 Cancer registry
Recorded bytrainedtechnician.height measured
ProspectiveCohort
11358 6.1 years BFMI, body fat massindex
Kg/m*m
Breast cancer
HRT never<6.8vs.>10.8
41.25(0.8, 1.96)
A B C D G
incidence
Mellemkjoer etal.,2006,BRE80039
Danmark, Post-menopausalDiet, Cancer and Health,1993
50 - 65 217 Cancer registry
Recorded bytrainedtechnician.height measured
ProspectiveCohort
11358 6.1 years BFMI, body fat massindex
Kg/m*m
Breast cancer
HRT never1.0(continuous)
10.98(0.93, 1.03)
0.43 A B C D E G
incidence
Mellemkjoer etal.,2006,BRE80039
Danmark, Post-menopausalDiet, Cancer and Health,1993
50 - 65 217 Cancer registry
Recorded bytrainedtechnician.height measured
ProspectiveCohort
11358 6.1 years Body fat percentage %
Breast cancer
HRT never<30.0vs.>39.3
40.95(0.64, 1.42)
A B C G
incidence
Mellemkjoer etal.,2006,BRE80039
Danmark, Post-menopausalDiet, Cancer and Health,1993
50 - 65 217 Cancer registry
Recorded bytrainedtechnician.height measured
ProspectiveCohort
11358 6.1 years Body fat percentage %
Breast cancer
HRT never10.0(continuous)
11.08(0.88, 1.33)
0.45 B C E G
incidence
KrebsE.E.,2006,BRE80106
United States, White, Post-menopausalStudy of OsteoporoticFractures, 1986
65 - (74) 350Self reportverified bymedical record
Self reportedand measured
ProspectiveCohort
9704.0 11.3 years / 0.23 Percentage body fat %
Invasive breast cancerPost-menopausal
>43.5vs.<35.4
41.58(1.11, 2.23)
0.001
A B C D F G
incidence
Body fat precentage
Post-menopausal
Macinnis, R.J etal.,2004,BRE80159
Australia, australian, southeuropean (Greek, Italian),Post menopausalMelbourne Collaborative
medical recordsProspectiveCohort
0.0 Percent fat
Invasive breast cancerPost-menopausal
Quantile 4vs.Quantile 1
41.7(1.2, 2.3)
A B F G
incidence
Macinnis, R.J etal.,2004,BRE80159
Australia, australian, southeuropean (Greek, Italian),Post menopausalMelbourne Collaborative
medical recordsProspectiveCohort
0.0 Percent fat %
Invasive breast cancerPost-menopausal
10.0(continuous)
11.21(1.03, 1.42)
0.02 A B F G
incidence
Fat free mass
Post-menopausal
Macinnis, R.J etal.,2004,BRE80159
Australia, australian, southeuropean (Greek, Italian),Post menopausalMelbourne Collaborative
medical recordsProspectiveCohort
0.0 FFM
Invasive breast cancerPost-menopausal
Quantile 4vs.Quantile 1
41.6(1.2, 2.3)
A B F G
incidence
Macinnis, R.J etal.,2004,BRE80159
Australia, australian, southeuropean (Greek, Italian),Post menopausalMelbourne Collaborative
medical recordsProspectiveCohort
0.0 FFM kg
Invasive breast cancerPost-menopausal
10.0(continuous)
11.45(1.16, 1.82)
0.001
A B F G
incidence
Fat mass
Post-menopausal
Macinnis, R.J etal.,2004,BRE80159
Australia, australian, southeuropean (Greek, Italian),Post menopausalMelbourne Collaborative
medical recordsProspectiveCohort
0.0 Fat mass
Invasive breast cancerPost-menopausal
Quantile 4vs.Quantile 1
41.7(1.3, 2.4)
A B F G
incidence
351

Author, Year,WCRF Code
Country, Ethnicity, Specialcharacteristics
Age Cases n Caseascertainment
Type of studyNon-Cases n
Lenght offollow-up / loss
Assessmentdetail
Additional details Unit Outcome Subgroup Contrast Nocat. OR (95% CI) p
valueptrend A B C D E F G
adjustments
Macinnis, R.J etal.,2004,BRE80159
Australia, australian, southeuropean (Greek, Italian),Post menopausalMelbourne Collaborative
medical recordsProspectiveCohort
0.0 Fat mass kg
Invasive breast cancerPost-menopausal
10.0(continuous)
11.18(1.06, 1.31)
0.003
A B F G
incidence
Lean body mass
Post-menopausal
Mellemkjoer etal.,2006,BRE80039
Danmark, Post-menopausalDiet, Cancer and Health,1993
50 - 65 414 Cancer registry FFQProspectiveCohort
11534 6.1 years FFMI, fat free massindex
Kg/m*m
Breast cancer
HRT ever>17.3vs.<15.6
41.02(0.73, 1.42)
A B C D E F G
incidence
Mellemkjoer etal.,2006,BRE80039
Danmark, Post-menopausalDiet, Cancer and Health,1993
50 - 65 414 Cancer registry FFQProspectiveCohort
11534 6.1 years FFMI, fat free massindex
Kg/m*m
Breast cancer
HRT ever1.0(continuous)
11.0(0.91, 1.09)
0.94 A B C D E F G
incidence
Mellemkjoer etal.,2006,BRE80039
Danmark, Post-menopausalDiet, Cancer and Health,1993
50 - 65 217 Cancer registry FFQProspectiveCohort
11358 6.1 years FFMI, fat free massindex
Kg/m*m
Breast cancer
HRT never>17.3vs.<15.6
41.52(0.98, 2.37)
A B C D E G
incidence
Mellemkjoer etal.,2006,BRE80039
Danmark, Post-menopausalDiet, Cancer and Health,1993
50 - 65 217 Cancer registry FFQProspectiveCohort
11358 6.1 years FFMI, fat free massindex
Kg/m*m
Breast cancer
HRT never1.0(continuous)
11.12(1.0, 1.26)
0.06 A B C D E G
incidence
Other (DEXA, bio-impedance etc)
Post-menopausal
Zhang,Y.,1997,BRE17164
USA, Post-menopausalFramingham Study, 1948
47 - 80 91ProspectiveCohort
1373.0 22.1 years / 0 Bone Mass
Breast cancerPost-menopausal
Quantile 4vs.Quantile 1
43.5(1.8, 6.8)
<0.001
B C D E F G
incidence
Menopausal status not specified
Drake, D.A.,2001,BRE02418
USA, Multi-ethnic, Fitnesscentre membersACLS, 1970
21 - 86
Through socialorganization(profession,religion)
ProspectiveCohort
4520.0 25.0 years hydrostatic percent ofbody fat
Breast cancer
1null(null, null)
incidence
8.1.6
BMI change
Pre-menopausal
Weiderpass,E.,2004,BRE18151
Sweden+Norway, Notspecified, Pre-menopausalAssembled cohort (Sweden+ Norway)
30 - 49 680 By MailProspectiveCohort
913658.0 years / 789women
between 18 andrecruitment
Breast cancerPre-menopausal
increased >4vs.increased 0-1.4
40.95(0.72, 1.25)
0.37 A C F G
incidence
Hilakivi-Clarke,R.,2005,BRE22603
Finland, Not specified, Pre-menopausalFinland, 1990
(41) 98 By MailNested CaseControl
392 6.0 years Kg/m*m
Breast cancerPre-menopausal
>7vs.<3,49
30.6(0.32, 1.11)
B C D F
incidence
Post-menopausal
352

Author, Year,WCRF Code
Country, Ethnicity, Specialcharacteristics
Age Cases n Caseascertainment
Type of studyNon-Cases n
Lenght offollow-up / loss
Assessmentdetail
Additional details Unit Outcome Subgroup Contrast Nocat. OR (95% CI) p
valueptrend A B C D E F G
adjustments
van den Brandt, P.A.,1997,BRE12717
The Netherlands, Post-menopausalThe Netherlands CohortStudy on diet and cancer,
55 - 69 500 UnspecifiedCase Cohort 5709 4.3 years / 0 between age 20 andbaseline
Kg/m*m/20yrs
Invasive breast cancerPost-menopausal
>=10vs.0 ÷ 1.9
71.42(0.83, 2.43)
0.09 A C E
incidence
Menopausal status not specified
Ballard-Barbash,R,190,BRE00514
U.S.A.NHEFS, 1981/82
25 - 74 101Randomextraction
ProspectiveCohort
5599 10.0 yearsBreast cancer >1.0
vs.>-1.0
32.5(1.2, 5.4)
A B C D E F G
incidence
Weight change
Pre-menopausal
Huang,Z.,1997,BRE04117
USA, Not specified,Registered nursesNurses' Health Study (NHS)Cohort 1976-1996
35 - 55 1000 By MailProspectiveCohort
653004 16.0 years / 0.05 Kg
Invasive breast cancerPre-menopausal
gain 25.0vs.Loss or gainof 2.0
80.74(0.54, 1.03)
0.07 A C D F
mortality/incidence
Breslow, R.A.,2001,BRE01123
USA, Not specifiedNHEFS, 1981/82
24 - 75 41Generalpopulation(survey)
ProspectiveCohort
22158 9.2 years / 285weight change from25yrs to interview in1982-84
Kg
Breast cancerPre-menopausal
gained 20 +vs.lost/gained4.9 kg
51.88(0.73, 4.88)
0.116
A B D G
incidence
LahmannPH,2005,BRE23014
Denmark,France,Germany,Greece,Italy,TheNetherlands,Norway,Spain,Sweden and UK., Not
25 - 70 254ProspectiveCohort
98352.0 5.8 years Kg
Invasive breast cancerPre-menopausal
> 20 kgvs.+/- 2 Kg
70.87(0.51, 1.49)
0.185
A B C D E F G
incidence
Post-menopausal
Folsom,AR,1990,BRE02836
USA, Post-menopausalIowa Women's Health Study
55 - 69 225 By MailNested CaseControl
1804 2.0 years current weight minusweight at age 18
Kg
Breast cancerPost-menopausal
>17.31vs.<8.19
31.6(1.13, 2.27)
0.01 A
incidence
Barnes-Josiah,D.,1995,BRE00566
USA, Post-menopausalIowa Women's Health Study
55 - 69 623 By MailProspectiveCohort
172003 6.0 years from 18yrs and by bmiat 18
Kg
Breast cancerPost-menopausal
bmi<20 &high gainvs.bmi>20 &
61.92(1.45, 2.53)
0.0004
A B C E F G
incidence
French, S.A.,1997,BRE02957
USA, Post-menopausalIowa Women's Health Study
55 - 69 658
Through socialorganization(profession,religion)
ProspectiveCohort
31625 7.0 years / 0.17
08.01.06-Weightvariability weightvariability in adultwood:root mean square
Breast cancerPost-menopausal
>1.0vs.>-1.0
40.88(0.7, 1.12)
0.12 A B D E F G
incidence
Huang,Z.,1997,BRE04117
USA, Not specified,Registered nursesNurses' Health Study (NHS)Cohort 1976-1996
35 - 55 By MailProspectiveCohort
95256.0 16.0 years / 0.05Invasive breast cancer
HRT -Former
gain 20.0vs.No HRT-Loss or gain
61.3(null, null)
A C D F
mortality/incidence
Huang,Z.,1997,BRE04117
USA, Not specified,Registered nursesNurses' Health Study (NHS)Cohort 1976-1996
35 - 55 By MailProspectiveCohort
95256.0 16.0 years / 0.05 Kg
Invasive breast cancer
HRT - Yes
gain 20.0vs.No HRT-Loss or gain
61.7(null, null)
A C D F
mortality/incidence
Huang,Z.,1997,BRE04117
USA, Not specified,Registered nursesNurses' Health Study (NHS)Cohort 1976-1996
35 - 55 1517 By MailProspectiveCohort
550494 16.0 years / 0.05 Kg
Invasive breast cancerPost-menopausal
gain 25.0vs.Loss or gainof 2.0
81.41(1.12, 1.78)
0.006
A C D F
mortality/incidence
353

Author, Year,WCRF Code
Country, Ethnicity, Specialcharacteristics
Age Cases n Caseascertainment
Type of studyNon-Cases n
Lenght offollow-up / loss
Assessmentdetail
Additional details Unit Outcome Subgroup Contrast Nocat. OR (95% CI) p
valueptrend A B C D E F G
adjustments
Breslow, R.A.,2001,BRE01123
USA, Not specifiedNHEFS, 1981/82
24 - 75 94Generalpopulation(survey)
ProspectiveCohort
26858 9.2 years / 285weight change from25yrs to interview in1982-84
Kg
Breast cancerPost-menopausal
gained 20 +vs.lost/gained4.9 kg
51.74(0.91, 3.3)
A B D G
incidence
Feigelson, H.S.,2004,BRE02721
usa, Post-menopausalCPS-II US cohort, 1982-1998
50 - 74 1182 By MailProspectiveCohort
62756.0 9.0 years / 0.9 from 18 to 1992 Kg
Breast cancer
HRT - No71+vs.-5 to 5
92.08(1.59, 2.73)
0.0001
A B C D E F G
incidence
Lahmann,P,2004,BRE18516
, Post-menopausalEuropean ProspectiveInvestigation into Cancer andNutrition (EPIC) 1993-1998
39 - 80 732 FFQProspectiveCohort
56470 4.6 years Kg
Breast cancer
HRT - No
increase >20vs.stableweight
31.52(1.02, 2.27)
<0.002
A B C E F G
incidence
Feigelson, H.S.,2004,BRE02721
usa, Post-menopausalCPS-II US cohort, 1982-1998
50 - 74 752 By MailProspectiveCohort
62756.0 9.0 years / 0.9 from 18 to 1992 Kg
Breast cancer
HRT - Yes71+vs.-5 to 5
91.11(0.75, 1.64)
0.35 A B C D E F G
incidence
LahmannPH,2005,BRE23014
Denmark,France,Germany,Greece,Italy,TheNetherlands,Norway,Spain,Sweden and UK., Not
25 - 70 626ProspectiveCohort
98352.0 5.8 years
women werepostmenopausalwomen and non-HRTusers.
Kg
Invasive breast cancer Post-menopausal& Other
> 20 kgvs.+/- 2 Kg
71.52(1.08, 2.13)
0.0002
A B C D E G
incidence
LahmannPH,2005,BRE23014
Denmark,France,Germany,Greece,Italy,TheNetherlands,Norway,Spain,Sweden and UK., Not
25 - 70 456ProspectiveCohort
98352.0 5.8 years
women werepostmenopausalwomen and HRTusers.
Kg
Invasive breast cancer Post-menopausal& Other
> 20 kgvs.+/- 2 Kg
70.95(0.65, 1.38)
0.866
A B C D E G
incidence
KrebsE.E.,2006,BRE80106
United States, White, Post-menopausalStudy of OsteoporoticFractures, 1986
65 - (74)Self reportverified bymedical record
FFQProspectiveCohort
9704.0 11.3 years / 0.23Percentage weightchange since age 25years
%
Invasive breast cancerage >=70years
>29.8vs.<5.1
41.94(1.28, 2.94)
A B C D F G
incidence
KrebsE.E.,2006,BRE80106
United States, White, Post-menopausalStudy of OsteoporoticFractures, 1986
65 - (74) 350Self reportverified bymedical record
FFQProspectiveCohort
9704.0 11.3 years / 0.23 Percentage weight gainsince age 25 years
%
Invasive breast cancerPost-menopausal
>29.8vs.<5.1
41.64(1.15, 2.34)
0.002
A B C D F G
incidence
Ahn, J. etal.,2007,BRE80139
United States, Multi-ethnic,Post menopausalNIH- AARP Diet and HealthStudy
50 - (63) 903 Cancer registryProspectiveCohort
99039.0 4.0 4 years Weight change pattern,cut off point BMI >=25
Breast cancernon MHTusers
overweightor obese atage 50yvs.
61.36(0.83, 2.21)
A B C D E F G
incidence
Menopausal status not specified
Huang,Z.,1997,BRE04117
USA, Not specified,Registered nursesNurses' Health Study (NHS)Cohort 1976-1996
35 - 55 By MailProspectiveCohort
95256.0 16.0 years / 0.05 Kg
Invasive breast cancer
HRT - No
gain 20.0vs.Loss or gainof 2.0
52.0(null, null)
A C D F
mortality/incidence
Breslow, R.A.,2001,BRE01123
USA, Not specifiedNHEFS, 1981/82
24 - 75 135Generalpopulation(survey)
ProspectiveCohort
49287 9.2 years / 285weight change from25yrs to interview in1982-84
Kg
Breast cancergained 20 +vs.lost/gained4.9 kg
51.72(0.94, 2.89)
0.015
A B D G
incidence
Jonsson,F.,2003,BRE04482
Sweden, Not specified,TwinsSwedish twin cohort, 1969
44 - 83 421School healthrecords
ProspectiveCohort
11598.0 29.0 yearsWeight changebetween age 25 andbaseline
Kg
Breast cancer >=21vs.0-5
52.1(1.3, 3.3)
A
incidence
Weight change from 18 to 30 yrs
354

Author, Year,WCRF Code
Country, Ethnicity, Specialcharacteristics
Age Cases n Caseascertainment
Type of studyNon-Cases n
Lenght offollow-up / loss
Assessmentdetail
Additional details Unit Outcome Subgroup Contrast Nocat. OR (95% CI) p
valueptrend A B C D E F G
adjustments
Post-menopausal
Ahn, J. etal.,2007,BRE80139
United States, Multi-ethnic,Post menopausalNIH- AARP Diet and HealthStudy
50 - (63) 1162 Cancer registryProspectiveCohort
99039.0 4.0 4 yearsWeight change in theearly reproductiveyears, age 18-35y
kg
Breast cancerCurrent MHTusers
>=30.0vs.-1.9-1.9
71.12(0.52, 2.41)
0.53 A B C D E F G
incidence
Ahn, J. etal.,2007,BRE80139
United States, Multi-ethnic,Post menopausalNIH- AARP Diet and HealthStudy
50 - (63) 948 Cancer registryProspectiveCohort
99039.0 4.0 4 yearsWeight change in theearly reproductiveyears, age 18-35y
kg
Breast cancernon MHTusers
>=30.0vs.-1.9-1.9
71.89(1.11, 3.22)
0.06 A B C D E F G
incidence
Ahn, J. etal.,2007,BRE80139
United States, Multi-ethnic,Post menopausalNIH- AARP Diet and HealthStudy
50 - (63) 948 Cancer registryProspectiveCohort
99039.0 4.0 4 years Weight change fromages 18 to 35y
kg
Breast cancernon MHTusers
>=30.0vs.-1.9-1.9
71.65(0.99, 2.91)
A B C D E F G
incidence
Weight change from menopause
Post-menopausal
Eliassen,A.H.,2006,BRE80114
United States, Post-menopausalNurses' Health Study (NHS)Cohort 1976-2002
30 - 55 876 medical records Self-reportedProspectiveCohort
121700.0 26.0 years
Weight change sincemenopause, weightchange as of currentquestionnaire cycle,
Kg
Invasive breast cancer Post-menop& HRTnonusers
gain >=10vs.loss or gain<2
71.19(0.94, 1.5)
0.002
A C D E F G
incidence
Eliassen,A.H.,2006,BRE80114
United States, Post-menopausalNurses' Health Study (NHS)Cohort 1976-2002
30 - 55 522 medical records Self-reportedProspectiveCohort
121700.0 26.0 years
Stable weight changesince menopause,excludes women whoswitched between gain,
Kg
Invasive breast cancer Post-menop& HRTnonusers
gain >=10vs.loss or gain<2
71.13(0.86, 1.5)
0.002
A C D E F G
incidence
Eliassen,A.H.,2006,BRE80114
United States, Post-menopausalNurses' Health Study (NHS)Cohort 1976-2002
30 - 55 809 medical records Self-reportedProspectiveCohort
121700.0 26.0 yearsIncrease in weightsince menopause,PMH never users
Kg
Invasive breast cancer Post-menop& HRTnonusers
5.0(continuous)
11.07(1.01, 1.13)
A C D E F G
incidence
Eliassen,A.H.,2006,BRE80114
United States, Post-menopausalNurses' Health Study (NHS)Cohort 1976-2002
30 - 55 421 medical records Self-reportedProspectiveCohort
121700.0 26.0 years
Increase in weightsince menopause,lighter PMH neverusers
Kg
Invasive breast cancer Post-menop& HRTnonusers &BMI <21 at
5.0(continuous)
11.11(1.01, 1.21)
A C D E F G
incidence
Eliassen,A.H.,2006,BRE80114
United States, Post-menopausalNurses' Health Study (NHS)Cohort 1976-2002
30 - 55 398 medical records Self-reportedProspectiveCohort
121700.0 26.0 years
Increase in weightsince menopause,lighter PMH neverusers
Kg
Invasive breast cancer Post-menop& HRTnonusers &BMI <25 at
5.0(continuous)
11.17(1.06, 1.3)
A C D E F G
incidence
Eliassen,A.H.,2006,BRE80114
United States, Post-menopausalNurses' Health Study (NHS)Cohort 1976-2002
30 - 55 388 medical records Self-reportedProspectiveCohort
121700.0 26.0 years
Increase in weightsince menopause,heavier PMH neverusers
Kg
Invasive breast cancer Post-menop& HRTnonusers &BMI >=21 at
5.0(continuous)
11.05(0.97, 1.14)
A C D E F G
incidence
Eliassen,A.H.,2006,BRE80114
United States, Post-menopausalNurses' Health Study (NHS)Cohort 1976-2002
30 - 55 411 medical records Self-reportedProspectiveCohort
121700.0 26.0 years
Increase in weightsince menopause,heavier PMH neverusers
Kg
Invasive breast cancer Post-menop& HRTnonusers &BMI >=25 at
5.0(continuous)
11.02(0.95, 1.09)
A C D E F G
incidence
Eliassen,A.H.,2006,BRE80114
United States, Post-menopausalNurses' Health Study (NHS)Cohort 1976-2002
30 - 55 1379 medical records Self-reportedProspectiveCohort
121700.0 26.0 years
Weight change sincemenopause, weightchange as of currentquestionnaire cycle,
Kg
Invasive breast cancerPost-menop& HRT users
gain >=10vs.loss or gain<2
71.15(0.96, 1.38)
0.22 A C D E F G
incidence
355