wavelet analysis for radarsat exploitation - dtic.mil · le logiciel de démonstration a été...
TRANSCRIPT

Wavelet Analysis for RADARSAT Exploitation Demonstration of Algorithms for Maritime Surveillance
Paris W. Vachon, John Wolfe and Yong Du
Defence R&D Canada --- Ottawa TECHNICAL MEMORANDUM
DRDC Ottawa TM 2007-030 February 2007

Wavelet Analysis for RADARSAT Exploitation Demonstration of Algorithms for Maritime Surveillance
Paris W. Vachon DRDC Ottawa John Wolfe DRDC Ottawa Yong Du Procom Consultants Group
Defence R&D Canada – Ottawa Technical Memorandum DRDC Ottawa TM 2007-030 February 2007

Principal Author
Original signed by Paris W. Vachon
Paris W. Vachon
Defence Scientist
Approved by
Original signed by Gary W. Geling
Gary W. Geling
Head, Radar Applications and Space Technologies
Approved for release by
Original signed by Cam Boulet
Cam Boulet
Chair, Document Review Panel
This work was supported by a Service Level Arrangement between the Polar Epsilon Project and DRDC Ottawa.
© Her Majesty the Queen as represented by the Minister of National Defence, 2007
© Sa Majesté la Reine, représentée par le ministre de la Défense nationale, 2007
DRDC Ottawa TM 2007-030

Abstract
This document reports on Wavelet Analysis for RADARSAT Exploitation (WARE), research software that aims to demonstrate the applications of wavelet analysis to RADARSAT ocean imagery. Wavelets are a mathematical paradigm that can be used to partition data into various frequency components, allowing the study of each component at a resolution matched to its scale. Wavelets are an efficient image processing tool for localized feature extraction and texture analysis. WARE tools have been developed using basic wavelet-based algorithms and include: (a) wind direction estimation; (b) oceanic or atmospheric front extraction; (c) oil spill detection; and (d) ship detection. WARE includes rudimentary interactive validation and has been applied to several RADARSAT ocean images that span the noted application areas. As such, the distinctive properties and advantages of wavelet analysis for target detection and recognition are demonstrated. In future, WARE could be extended to include radiometric flattening, improved algorithm efficiencies in anticipation of operationalization, and systematic testing of available wavelet families for improved algorithm performance.
Résumé
Le document décrit les outils d’analyse par ondelettes pour l’exploitation de RADARSAT (WARE), qui constituent un logiciel de recherche qui vise à démontrer les applications de l’analyse par ondelettes à l’imagerie océanique de RADARSAT. Les ondelettes sont un paradigme mathématique qui répartit les données en diverses composantes de fréquences, permettant ainsi d’étudier chaque composante avec une résolution qui correspond à son échelle. Les ondelettes constituent un outil efficace de traitement des images pour l’extraction de caractéristique localisée et l’analyse de texture. Les outils WARE ont été développés à partir d’algorithmes fondés sur les ondelettes et visent : (a) l’estimation de la direction du vent; (b) l’extraction des fronts océaniques ou atmosphériques; (c) la détection des déversements de pétrole; et (d) la détection des navires. Le logiciel WARE comprend un contrôle de qualité interactif rudimentaire et a servi à l’analyse de plusieurs images océaniques RADARSAT, qui relève des domaines d’applications notés. Ainsi, les propriétés et avantages distinctifs de l’analyse par ondelettes pour des fins de détection et de reconnaissance de cible sont démontrés. À l’avenir, le logiciel WARE pourrait également servir à l’aplatissement radiométrique, à l’amélioration du rendement d’algorithmes d’opérationalisation et à la vérification systématique des familles d’ondelettes disponibles pour l’amélioration du rendement des algorithmes.
DRDC Ottawa TM 2007-030 i

This page intentionally left blank.
ii DRDC Ottawa TM 2007-030
Executive summary
Wavelet Analysis for RADARSAT Exploitation: Demonstration of Algorithms for Maritime Surveillance
Vachon, P.W.; Wolfe, J.; Du, Y.; DRDC Ottawa TM 2007-030; Defence R&D Canada – Ottawa; February 2007.
Introduction
This document reports on Wavelet Analysis for RADARSAT Exploitation (WARE), research software that aims to demonstrate the application of wavelet analysis for exploitation of RADARSAT-1 synthetic aperture radar (SAR) ocean imagery. Multiple modes and all weather operation are unique features of RADARSAT that allow a wide range of maritime conditions and features to be routinely imaged. SAR imagery, which is fundamentally different from imagery obtained from Electro-Optical or Infrared sensors, can provide information on spatial features and textures on the ocean surface that permit target detection and characterization. Therefore, spatial frequency analysis is an important concept for RADARSAT image exploitation.
During the past few decades, wavelet analysis, a sophisticated technology for the frequency component analysis of data, has rapidly developed. Wavelets are mathematical functions that cover a finite interval of space and provide more flexibility than the traditional Fourier transform. A unique property of the wavelet transform is that it can be used to split data into various frequency components and retain location information, making it a potentially useful tool for image exploitation.
Results
In this project, WARE tools have been developed using straightforward wavelet-based algorithms. The maritime surveillance applications implemented include: (a) wind direction estimation; (b) oceanic or atmospheric front extraction; (c) oil spill detection; and (d) ship detection. WARE includes rudimentary interactive validation and has been applied to several RADARSAT ocean images that span the noted application areas. The wind direction estimation software is ready for operational implementation. Additional R&D is still required for the other tools. The demonstration software was designed and implemented in Matlab™.
Significance
As an advanced Earth observation satellite, RADARSAT images are well-suited to the detection of both natural phenomena and man-made features on the ocean surface, and have been used to monitor environmental change, to support resource sustainability, and for operational maritime surveillance. WARE applies wavelet multi-scale analysis to RADARSAT image exploitation. The implemented algorithms enhance information extraction as compared to more traditional algorithms, and represent a unique approach to target detection against a complex natural
DRDC Ottawa TM 2007-030 iii
background. Wavelet-based algorithms could be operationalized to improve near-real time SAR imagery exploitation in the RADARSAT-2 era.
Future plans
Future development of WARE algorithms could include radiometric image flattening as a pre-processing step, implementation of more quantitative validation tools, wavelet-based edge and shape analysis for target characterization, and improved processing efficiency of the core algorithms. Testing of available wavelet families also requires further effort. Wavelet packet analysis and the combination of wavelet analysis with neural networks for RADARSAT image segmentation and target detection are also recommended. An operational system could be built around the algorithms and tools that are demonstrated in WARE; this could be a standalone system or integrated into existing SAR exploitation software.
iv DRDC Ottawa TM 2007-030
Sommaire
Wavelet Analysis for RADARSAT Exploitation: Demonstration of Algorithms for Maritime Surveillance
Vachon, P.W.; Wolfe, J.; Du, Y.; DRDC Ottawa TM 2007-030; R & D pour la défense Canada – Ottawa; février 2007.
Introduction
Le document décrit les outils d’analyse par ondelettes pour l’exploitation de RADARSAT (WARE), qui constituent un logiciel d’analyse qui vise à démontrer les applications de l’analyse par ondelettes à l’imagerie océanique du radar à synthèse d’ouverture (SAR) RADARSAT-1. La multiplicité des modes et l’exploitation tous temps représentent des caractéristiques uniques de RADARSAT qui permettent l’image courante d’un large éventail de conditions et de caractéristiques maritimes. L’imagerie SAR, fondamentalement différente de l’imagerie provenant de capteurs électro-optiques ou infrarouges, peut fournir de l’information sur les caractéristiques spatiales et sur les textures de la surface océanique qui permettent la détection et la caractérisation des cibles. L’analyse de fréquence spatiale constitue donc un volet important de l’exploitation des images de RADARSAT.
Au cours des vingt dernières années, une technique perfectionnée d’analyse des composantes de fréquences, appelée analyse par ondelettes, s’est rapidement développée. Les ondelettes sont des fonctions mathématiques qui s’appliquent à un intervalle spatial fini et offrent plus de souplesse que la transformation classique de Fourier. La transformation par ondelettes présente la propriété unique de pouvoir répartir les données en diverses composantes de fréquences et de conserver l’information d’emplacement, ce qui en fait un outil très intéressant pour l’exploitation de l’image.
Résultats
Avec ce projet, des outils WARE ont été développés en utilisant des algorithmes simples reposant sur les ondelettes. Les applications dans le domaine de la surveillance maritime comprennent : (a) l’estimation de la direction du vent; (b) l’extraction des fronts océaniques ou atmosphériques; (c) la détection des déversements de pétrole; et (d) la détection des navires. Le logiciel WARE comprend un contrôle de qualité interactif rudimentaire et a servi à l’analyse de plusieurs images océaniques RADARSAT qui relèvent des domaines d’application notés. Le logiciel d’estimation de la direction du vent est prêt pour l'exécution opérationnelle. Le R&D additionnel est encore exigé pour les autres outils. Le logiciel de démonstration a été conçu et mis au point au moyen de MatlabMC.
Importance
Le satellite perfectionné d’observation de la Terre RADARSAT produit des images qui conviennent bien à la détection des phénomènes naturels et artificiels à la surface de l’océan; ces
DRDC Ottawa TM 2007-030 v

images ont servi à la surveillance des modifications de l’environnement, au soutien de la durabilité des ressources et la surveillance maritime opérationnelle. Le logiciel WARE permet de recourir à l’analyse par ondelettes multi-échelles pour l’exploitation des images de RADARSAT. Si on les compare aux algorithmes plus traditionnels, les algorithmes implantés améliorent l’extraction de l’information et sont une approche unique à la détection de cibles sur un fond naturel complexe. Des algorithmes à base d’ondelettes pourraient être mis en œuvre afin d’améliorer l’exploitation de l’imagerie SAR en temps quasi-réel pour RADARSAT 2.
Perspectives
Des recherches futures sur les algorithmes WARE devraient porter sur l’aplatissement radiométrique comme une étape de prétraitement, l’implantation de plus d’outils de validation quantitative, l’analyse par ondelettes des formes et des bordures pour la caractérisation des cibles et l’amélioration du traitement par les algorithmes de base. La mise à l’essai des familles d’ondelettes disponibles pour les applications envisagées nécessite aussi un examen plus approfondi. On recommande également d’étudier plus à fond l’analyse par paquets d’ondelettes ainsi que la combinaison de l’analyse par ondelettes et des réseaux neuronaux pour la segmentation des images de RADARSAT et la détection de cibles. Un système opérationnel pourrait être élaborer à l’aide des algorithmes et des outils démontrés dans WARE; ce système pourrait être autonome ou intégré au logiciel d’exploitation SAR déjà existant.
vi DRDC Ottawa TM 2007-030
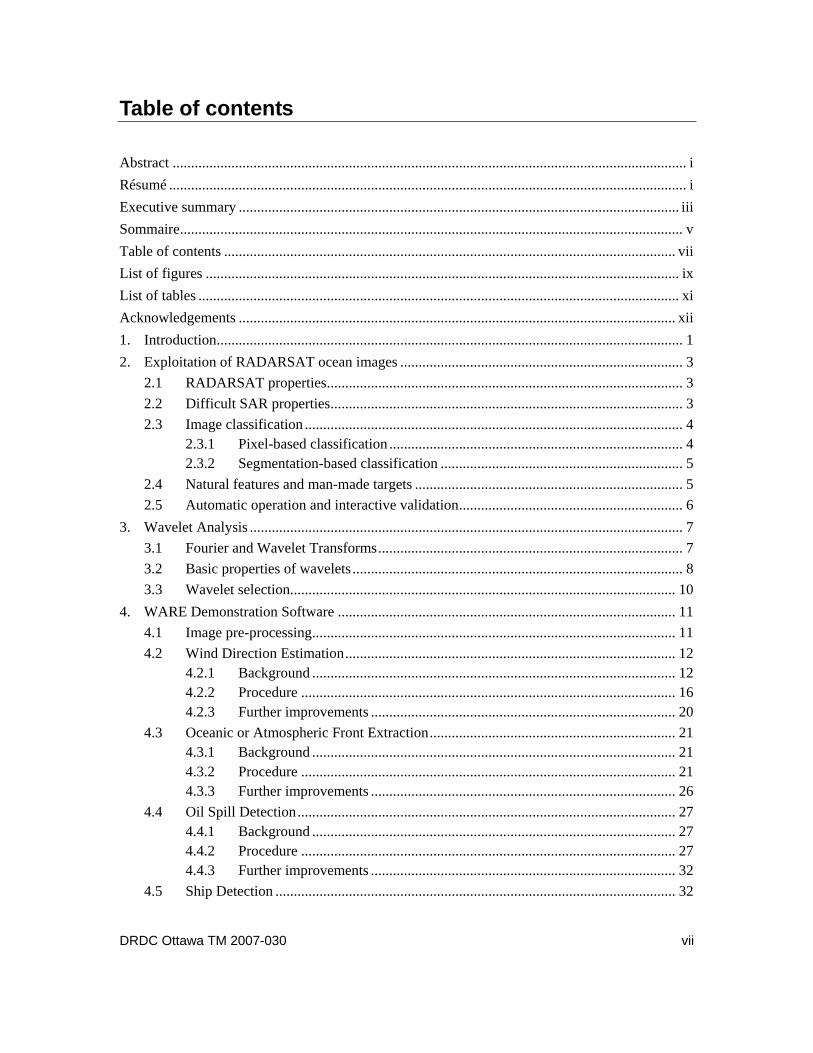
Table of contents
Abstract ............................................................................................................................................ i Résumé ............................................................................................................................................. i Executive summary ........................................................................................................................ iii Sommaire......................................................................................................................................... v Table of contents ........................................................................................................................... vii List of figures ................................................................................................................................. ix List of tables ................................................................................................................................... xi Acknowledgements ....................................................................................................................... xii 1. Introduction............................................................................................................................... 1 2. Exploitation of RADARSAT ocean images ............................................................................. 3
2.1 RADARSAT properties................................................................................................. 3 2.2 Difficult SAR properties................................................................................................ 3 2.3 Image classification ....................................................................................................... 4
2.3.1 Pixel-based classification ................................................................................ 4 2.3.2 Segmentation-based classification .................................................................. 5
2.4 Natural features and man-made targets ......................................................................... 5 2.5 Automatic operation and interactive validation............................................................. 6
3. Wavelet Analysis ...................................................................................................................... 7 3.1 Fourier and Wavelet Transforms................................................................................... 7 3.2 Basic properties of wavelets .......................................................................................... 8 3.3 Wavelet selection......................................................................................................... 10
4. WARE Demonstration Software ............................................................................................ 11 4.1 Image pre-processing................................................................................................... 11 4.2 Wind Direction Estimation.......................................................................................... 12
4.2.1 Background ................................................................................................... 12 4.2.2 Procedure ...................................................................................................... 16 4.2.3 Further improvements ................................................................................... 20
4.3 Oceanic or Atmospheric Front Extraction................................................................... 21 4.3.1 Background ................................................................................................... 21 4.3.2 Procedure ...................................................................................................... 21 4.3.3 Further improvements ................................................................................... 26
4.4 Oil Spill Detection....................................................................................................... 27 4.4.1 Background ................................................................................................... 27 4.4.2 Procedure ...................................................................................................... 27 4.4.3 Further improvements ................................................................................... 32
4.5 Ship Detection ............................................................................................................. 32
DRDC Ottawa TM 2007-030 vii

4.5.1 Background ................................................................................................... 32 4.5.2 Procedure ...................................................................................................... 33 4.5.3 Further improvements ................................................................................... 36
5. R&D Topics............................................................................................................................ 38 6. Conclusions............................................................................................................................. 42 References ..................................................................................................................................... 43 Annex A WARE Software Description......................................................................................... 46 List of acronyms............................................................................................................................ 47
viii DRDC Ottawa TM 2007-030
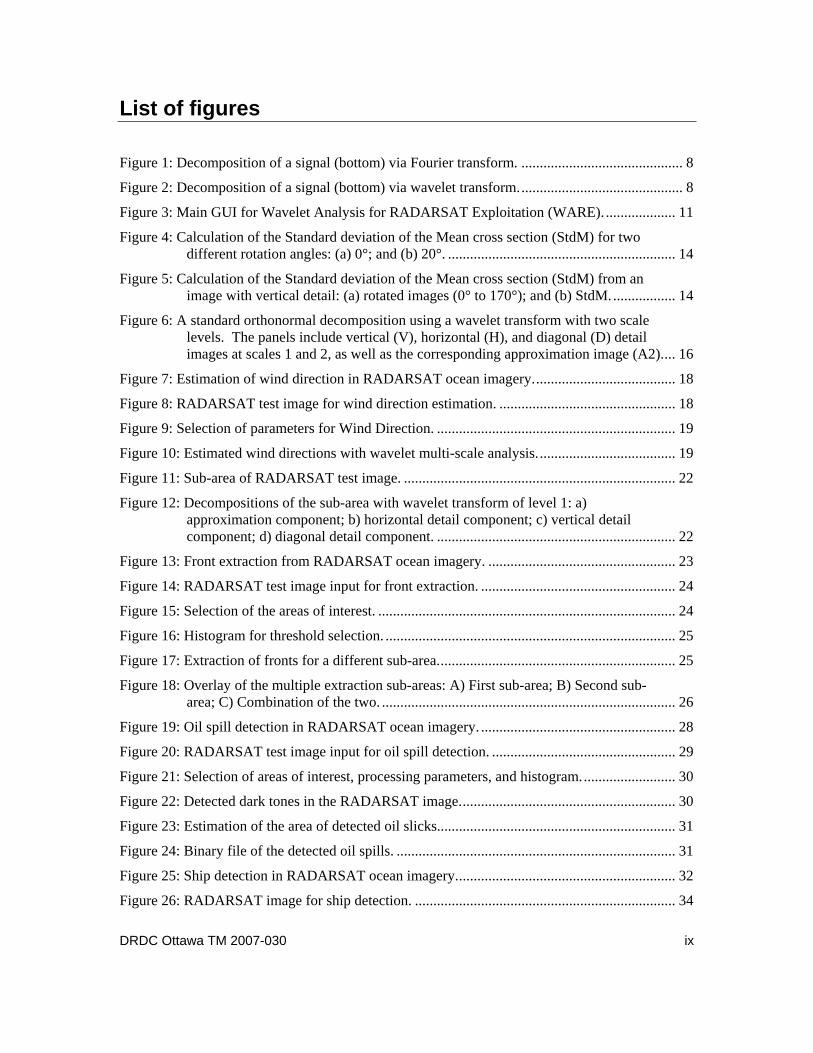
List of figures
Figure 1: Decomposition of a signal (bottom) via Fourier transform. ............................................ 8 Figure 2: Decomposition of a signal (bottom) via wavelet transform............................................. 8 Figure 3: Main GUI for Wavelet Analysis for RADARSAT Exploitation (WARE). ................... 11 Figure 4: Calculation of the Standard deviation of the Mean cross section (StdM) for two
different rotation angles: (a) 0°; and (b) 20°. .............................................................. 14 Figure 5: Calculation of the Standard deviation of the Mean cross section (StdM) from an
image with vertical detail: (a) rotated images (0° to 170°); and (b) StdM.................. 14 Figure 6: A standard orthonormal decomposition using a wavelet transform with two scale
levels. The panels include vertical (V), horizontal (H), and diagonal (D) detail images at scales 1 and 2, as well as the corresponding approximation image (A2).... 16
Figure 7: Estimation of wind direction in RADARSAT ocean imagery....................................... 18 Figure 8: RADARSAT test image for wind direction estimation. ................................................ 18 Figure 9: Selection of parameters for Wind Direction. ................................................................. 19 Figure 10: Estimated wind directions with wavelet multi-scale analysis...................................... 19 Figure 11: Sub-area of RADARSAT test image. .......................................................................... 22 Figure 12: Decompositions of the sub-area with wavelet transform of level 1: a)
approximation component; b) horizontal detail component; c) vertical detail component; d) diagonal detail component. ................................................................. 22
Figure 13: Front extraction from RADARSAT ocean imagery. ................................................... 23 Figure 14: RADARSAT test image input for front extraction. ..................................................... 24 Figure 15: Selection of the areas of interest. ................................................................................. 24 Figure 16: Histogram for threshold selection. ............................................................................... 25 Figure 17: Extraction of fronts for a different sub-area................................................................. 25 Figure 18: Overlay of the multiple extraction sub-areas: A) First sub-area; B) Second sub-
area; C) Combination of the two. ................................................................................ 26 Figure 19: Oil spill detection in RADARSAT ocean imagery. ..................................................... 28 Figure 20: RADARSAT test image input for oil spill detection. .................................................. 29 Figure 21: Selection of areas of interest, processing parameters, and histogram.......................... 30 Figure 22: Detected dark tones in the RADARSAT image........................................................... 30 Figure 23: Estimation of the area of detected oil slicks................................................................. 31 Figure 24: Binary file of the detected oil spills. ............................................................................ 31 Figure 25: Ship detection in RADARSAT ocean imagery............................................................ 32 Figure 26: RADARSAT image for ship detection. ....................................................................... 34
DRDC Ottawa TM 2007-030 ix

Figure 27: Selection of parameters and the ship detection results................................................. 34 Figure 28: Display of the bitmap product...................................................................................... 35 Figure 29: Estimation of location, size, and orientation of detected ships. ................................... 35 Figure 30: Display of the bitmap product with modelled ellipses................................................. 36 Figure 31: Close-up views of the detected ships. .......................................................................... 36 Figure 32: Proposed WARE flowchart.......................................................................................... 39 Figure 33: Wavelet edge analysis for specific target shapes: a) Target; b) Edge detection; c)
Distance from central point; and d) Wavelet analysis of the extracted edge. ............. 40 Figure 34: Example of wavelet packet decomposition of a RADARSAT image: a) Original
Image; b) Wavelet packet decomposition of the original image; and c) Fourier transform of each decomposition component. ............................................................ 41
x DRDC Ottawa TM 2007-030

List of tables
Table 1: Basic properties of some popular wavelet families. ........................................................ 10 Table 2: Output text file of estimated wind directions. ................................................................. 20
DRDC Ottawa TM 2007-030 xi
Acknowledgements
The authors thank Dr. J.K.E. (Jake) Tunaley (Polar Epsilon R&D Manager) for his interest in and support of this project. Dr. Jeff Secker provided many helpful comments on a draft version of this document.
xii DRDC Ottawa TM 2007-030
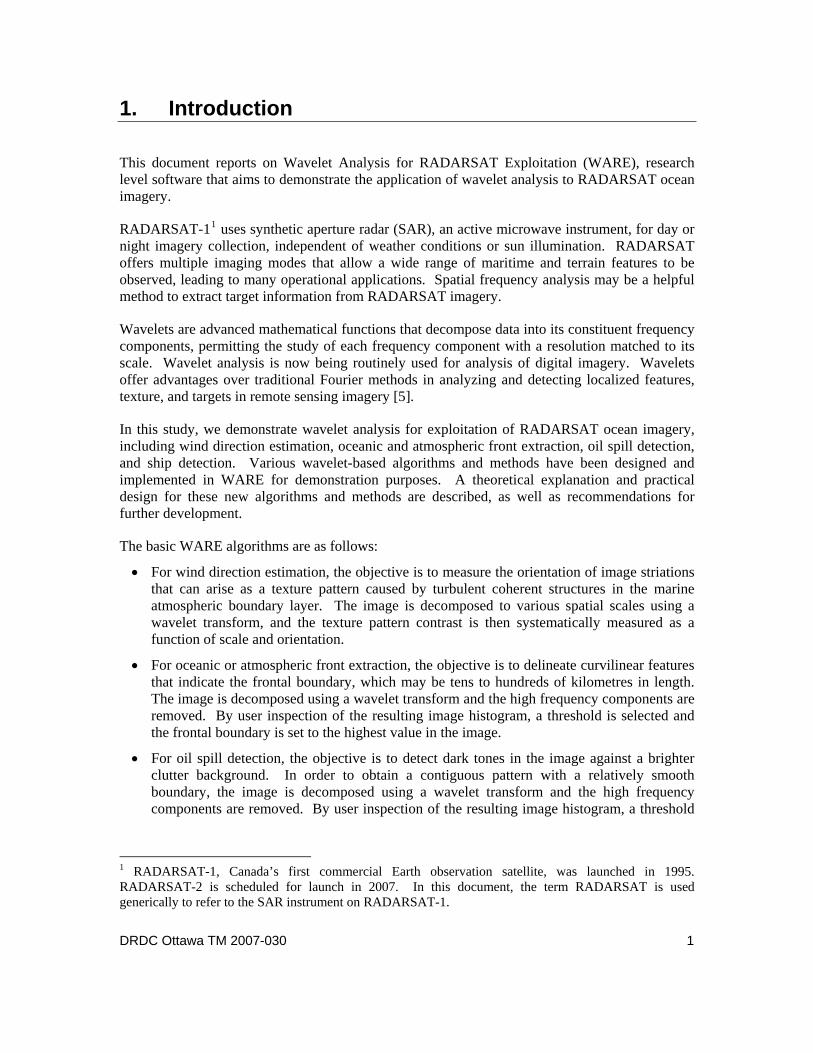
1. Introduction
This document reports on Wavelet Analysis for RADARSAT Exploitation (WARE), research level software that aims to demonstrate the application of wavelet analysis to RADARSAT ocean imagery.
RADARSAT-11 uses synthetic aperture radar (SAR), an active microwave instrument, for day or night imagery collection, independent of weather conditions or sun illumination. RADARSAT offers multiple imaging modes that allow a wide range of maritime and terrain features to be observed, leading to many operational applications. Spatial frequency analysis may be a helpful method to extract target information from RADARSAT imagery.
Wavelets are advanced mathematical functions that decompose data into its constituent frequency components, permitting the study of each frequency component with a resolution matched to its scale. Wavelet analysis is now being routinely used for analysis of digital imagery. Wavelets offer advantages over traditional Fourier methods in analyzing and detecting localized features, texture, and targets in remote sensing imagery [5].
In this study, we demonstrate wavelet analysis for exploitation of RADARSAT ocean imagery, including wind direction estimation, oceanic and atmospheric front extraction, oil spill detection, and ship detection. Various wavelet-based algorithms and methods have been designed and implemented in WARE for demonstration purposes. A theoretical explanation and practical design for these new algorithms and methods are described, as well as recommendations for further development.
The basic WARE algorithms are as follows:
• For wind direction estimation, the objective is to measure the orientation of image striations that can arise as a texture pattern caused by turbulent coherent structures in the marine atmospheric boundary layer. The image is decomposed to various spatial scales using a wavelet transform, and the texture pattern contrast is then systematically measured as a function of scale and orientation.
• For oceanic or atmospheric front extraction, the objective is to delineate curvilinear features that indicate the frontal boundary, which may be tens to hundreds of kilometres in length. The image is decomposed using a wavelet transform and the high frequency components are removed. By user inspection of the resulting image histogram, a threshold is selected and the frontal boundary is set to the highest value in the image.
• For oil spill detection, the objective is to detect dark tones in the image against a brighter clutter background. In order to obtain a contiguous pattern with a relatively smooth boundary, the image is decomposed using a wavelet transform and the high frequency components are removed. By user inspection of the resulting image histogram, a threshold
1 RADARSAT-1, Canada’s first commercial Earth observation satellite, was launched in 1995. RADARSAT-2 is scheduled for launch in 2007. In this document, the term RADARSAT is used generically to refer to the SAR instrument on RADARSAT-1.
DRDC Ottawa TM 2007-030 1

is selected in the remaining low frequency components to separate the dark tones from the brighter background.
• High resolution SAR imagery is required to accurately detect ships, to estimate their size and orientation, and to analyze their shape. Ships are detected in the image as bright targets against a darker background. The wavelet transform is first used to de-noise the background and to cluster target points for subsequent analysis. The ship size, length, width, and orientation are estimated by modeling the ship signature as an ellipse.
In this document, Section 2 briefly discusses RADARSAT exploitation for maritime surveillance; Section 3 reviews wavelet analysis; Section 4 describes the operation and results from the WARE demonstration software; and Section 5 discusses potential future WARE R&D activities.
2 DRDC Ottawa TM 2007-030
2. Exploitation of RADARSAT ocean images
RADARSAT employs variable beam modes (i.e., swath coverage and spatial resolution) and geometries (i.e., incidence angle and pass direction – right looking with ascending or descending pass directions) that allow a wide range of maritime conditions and features to be routinely imaged. A detailed discussion of the properties and features of RADARSAT is beyond the scope of this report, see [1]; key parameters relevant to maritime feature extraction and target detection are discussed.
2.1 RADARSAT properties
SAR provides a high spatial resolution digital image of radar reflectivity. The spatial resolution is an important parameter for target characterization. Of course, higher resolution is generally better, but for a fixed data bandwidth, higher spatial resolution is achieved at the expense of reduced swath coverage.
The incidence angle range across an image varies depending upon the acquisition mode, leading to the potential of inconsistencies in image radiometry for wider swath modes. For example, large scale feature extraction works best for consistent image radiometry. Also, for ship detection, larger incidence angles improve the detection performance due to the reduction of the clutter level with increasing incidence angle.
The polarization describes the orientation (e.g., vertical or horizontal) of the electric vector in the impinging electromagnetic radiation. Backscattering can change the polarization of the electromagnetic energy. RADARSAT is an HH (i.e., horizontal transmit, horizontal receive) polarization radar. Multi-polarization radars can provide more target information than a single channel radar such as RADARSAT.
The frequency or wavelength of the radar system determines the penetration depth of the electromagnetic waves into objects at the Earth surface and selects the surface roughness scale that controls the radar backscatter. RADARSAT is a single frequency radar that operates at C-band (5.3 GHz frequency or 5.6 cm wavelength).
2.2 Difficult SAR properties
Due to the geometry and physics of the image formation process, SAR imagery has certain properties that can complicate image analysis. These include speckle noise, and azimuth shifting and smearing of moving objects.
Speckle, a high frequency noise process, is an inherent property of SAR imagery that arises from the scattering of coherent radar waves from rough surfaces [13]. SAR data are often multi-look processed to reduce the effects of image speckle. Multi-look processing involves incoherently averaging several independent measurements of the backscatter, trading spatial resolution for radiometric resolution. A larger number of looks can reduce the grainy appearance of SAR images. Many filters have been designed to de-speckle SAR imagery, e.g., [16].
DRDC Ottawa TM 2007-030 3

The theoretical basis of SAR imaging assumes that all objects in the scene being imaged are stationary (i.e., static or not moving). There are several effects of target motion [24]. The most important is an azimuthal image shift, whereby a target moving with a non-zero range velocity component will not appear in its correct position in the image, but will be displaced in the azimuth direction. This effect, along with smearing due to target motion during the coherent integration time, can result in distortion of the target signature in the SAR image. Although wavelet analysis can be used to estimate the observed target shape and orientation, there could be a departure from the actual target shape in the case of moving targets.
2.3 Image classification
Classification is the process of assigning specific classes to groups of pixels in digital imagery. For example, in an ocean scene, each image pixel could be assigned to being part of the target of interest (e.g., oil covered water) or part of the background clutter. This is important for information extraction from satellite imagery, since the classified image can be used to identify areas of interest for further analysis. WARE uses straightforward classification and segmentation algorithms to distinguish target classes of interest from the background image clutter. Classification can provide scene information or target detection. The following are some common classification methods [18].
2.3.1 Pixel-based classification
Simple pixel-based classifiers are usually designed for multi channel data and include both supervised and unsupervised approaches. Supervised classifiers require the user to decide which classes exist in the image, and then to delineate samples of these classes. These samples (known as training areas) are then input into a classification program, which produces a classified image. Unsupervised classification does not require training areas, although the number of classes should be specified.
Supervised classification algorithms include Minimum-Distance-to-Means and Maximum Likelihood. Minimum-Distance-to-Means classification determines the mean digital number (DN) value of each class in each band. It then assigns unknown pixels to classes whose means are most similar to the value of the pixel. Maximum Likelihood classification is a popular classification method for multi channel data. It first determines the distributions of the DN values in each band for each class. Each unknown pixel is then assigned to a class based upon Gaussian probability. This method should produce better results than Minimum-Distance-to-Means.
A popular unsupervised classifier is the K-Means. This method works by choosing random seeds, which can be thought of as points with random DN values. After the seeds have been chosen, lines are formed to separate the classes. Next, the points lying within the delineated areas are analyzed, and their means are noted. The means then form the new seeds, and a new series of lines are formed to separate the classes. This process may be repeated several times. Other methods include Fuzzy C Means and ISODATA, which maintain the basic idea of K-Means but employ fuzzy logic or other more advanced algorithms.
4 DRDC Ottawa TM 2007-030

2.3.2 Segmentation-based classification
Unlike pixel-based classifiers, segmentation-based classification also considers the DNs of neighbouring pixels, e.g., [22], [26]. This is a more suitable method for classification of single band data, such as RADARSAT imagery. There are hundreds of segmentation approaches available in the literature, most of which use a single channel of image data. Methods for multi-channel image segmentation are also being developed that take advantage of advanced technologies such as neural networks, fuzzy logic, and the combination of both. Multi-channel image segmentation considers both the spatial neighbourhood and the multi-channel image properties.
Many algorithms have been designed for SAR image segmentation based on a variety of techniques. Thresholding techniques assume that the histogram of a SAR image is a combination of Gamma distributions [25]. The maximum-likelihood technique may be used to estimate histogram parameters. Thresholds are selected at the valleys of the multi-modal histogram by minimizing the discrimination error between the classes of pixels in the image [3]. To reduce speckle effects in SAR images, Arvelyna et al. [2] used a Bayesian approach with a maximum a posteori filter with the assumption that radar reflectivity and speckle noise follow Gamma distributions. Maximum entropy techniques are used for feature extraction and oil slick segmentation with the assumption that only two moments are to be determined, i.e., the oil slick and the surrounding ocean area. RADARSAT image segmentation has been used for sea ice, agriculture, environmental monitoring, etc.
Segmentation can be used for target detection in RADARSAT ocean imagery when the brightness of a target is not significantly different from that of the neighbouring area. Based on the target outline that the segmentation provides, edge analysis could be used to distinguish the target from the background. Furthermore, wavelet multi-scale analysis could improve the segmentation of RADARSAT imagery.
2.4 Natural features and man-made targets
RADARSAT imagery has proven to be a good tool for the extraction of features, both natural and man-made, on the Earth’s surface. Here, the discussion is limited to the ocean surface. A complete review of SAR imagery of the marine environment is beyond the scope of this document. However, many reviews are available, e.g., [15].
Compared with man-made targets, natural features such as atmospheric and oceanic fronts, surface currents, and severe storms such as polar lows and hurricanes, have very large spatial scales. Ocean waves (tidal waves, internal waves, and wind waves) encompass many spatial scales over large areas. Natural features generally constitute the background against which man-made targets must be detected. Due to the relative scales, the estimation and extraction of natural features from RADARSAT imagery is usually not impacted by the presence of man-made targets. Application of wavelet analysis to the extraction of natural features usually involves decomposition of the natural feature into its multi-scale components, followed by analysis at each spatial scale. Examples include estimation of wind direction, and characterization of hurricane eyes, internal waves, ocean wave fields, and ocean currents, [8], [9], [10], [19].
DRDC Ottawa TM 2007-030 5

Man-made targets on the ocean surface generally have much smaller spatial scales than the background natural features. Therefore, the finer resolution modes of RADARSAT are better suited to the detection of man-made targets. Man-made target detection is particularly important for environmental monitoring and maritime surveillance; oil spill detection and ship detection are important examples [23]. In general, when a man-made target is detected in RADARSAT imagery, the background natural features must also be considered, specifically, they should be separated and screened-out. Wavelet analysis is well-suited to the decomposition of an entire RADARSAT image to various spatial scales, permitting analysis of each layer individually. To screen-out the background clutter, the lower frequencies may be removed; suitable spatial scales for man-made targets may be retained and analyzed further.
2.5 Automatic operation and interactive validation
Automatic software operation is often pursued since it permits use by untrained users and can reduce the elapsed time required to obtain the information of interest. Fully automatic operation requires excellent algorithms, complete physical understanding and modelling of the phenomena of interest, and an ample amount of test data. It is still unusual to find fully automatic software for RADARSAT exploitation. In most cases, exploitation software is semi-automatic, meaning that a user or analyst decision is required to evaluate the output. Semi-automatic software requires interactive validation of the output results.
Interactive validation permits the creation of the best possible analysis result through user adaptive selection of a specific threshold or set of processing parameters. For example, the selection can be guided by a plot derived from the data, such as a DN histogram. Through extensive use, an optimal approach may become apparent; the corresponding procedure may be implemented for fully automatic operation.
Several semi-automatic algorithms have been implemented in the WARE demonstration software. These algorithms require manual operations to define the area of interest (AOI) and to make a decision on the quality and applicability of the final result.
6 DRDC Ottawa TM 2007-030

3. Wavelet Analysis
Wavelet analysis has been a hot research topic since it was first developed more than two decades ago, e.g., [6], [20]. Wavelet analysis offers both time and frequency resolution, which has lead to significant advances in signal processing, image processing, mode identification, and nonlinear theory. Wavelet analysis applications in image processing include image fusion, feature detection, information extraction, image de-noising, and image compression, e.g., [5].
3.1 Fourier and Wavelet Transforms
The Fourier transform and the wavelet transform are both representations of signals by a group or series of waves. The difference between these transforms is that the Fourier transform defines these waves (i.e., Sines and Cosines) over an infinite interval, while the wavelet transform approaches zero quickly, thus concentrating its energy in a limited interval.
The series of waves that arises from a Fourier transform are referred to as a Fourier expansion. A Fourier expansion offers frequency resolution, but not temporal resolution. When a signal is decomposed with a Fourier transform, although all of the frequencies present in a signal can be determined, the time at which they are present is not known (Figure 1). To overcome this problem, several solutions have been developed, such as the short-window Fourier transform and the wavelet transform, both of which are better able to represent a signal simultaneously in both the time and frequency domains. The short window Fourier transform offers temporal resolution, but at the expense of losing frequency resolution. In wavelet analysis, use of a fully scalable and modulated window solves the time dependence problem. The window is shifted along the signal and the spectrum is calculated at each position. This process is repeated many times with a slightly shorter (or longer) window for every new cycle. The result is a collection of time-frequency representations of the signal, all with different resolutions (Figure 2). This collection of representations is what makes multi-scale analysis possible. The large scales provide a coarse picture, while the small scales show the details.
DRDC Ottawa TM 2007-030 7

Figure 1: Decomposition of a signal (bottom) via Fourier transform.
Figure 2: Decomposition of a signal (bottom) via wavelet transform.
3.2 Basic properties of wavelets
Wavelets are mathematical functions that partition data into different frequency components, allowing the study of each component with a resolution matched to its scale. Wavelets can be symmetrical or asymmetrical and have a compact domain. Some wavelet functions have an analytic form, while others have a fast algorithm for calculating the associated wavelet transform
As a square-integrable function, the wavelet ( )tψ must satisfy some basic conditions:
8 DRDC Ottawa TM 2007-030

( ) 2
dψ ω
ωω
< +∞∫ , (1)
where ( )ψ ω is the Fourier transform of ( )tψ , and
( ) 2
00
ωψ ω
== , (2)
( ) 0t dtψ =∫ . (3)
Conditions (2) and (3) imply that wavelets have a band-pass like spectrum and must be oscillatory. In other words, ( )tψ must be a waveform.
The wavelet transform is a mathematical transformation that represents a signal in terms of shifted and dilated versions of a single function called the mother wavelet:
( ),1
stt
ssττψ ψ −⎛ ⎞= ⎜ ⎟
⎝ ⎠. (4)
The Continuous Wavelet Transform (CWT) is used to decompose a signal into constituent wavelets. The CWT’s basis functions are scaled and shifted versions of the time-localized mother wavelet, which provides the good time and frequency resolution that is sought.
The CWT is difficult to use in practical applications [4]. However, the Discrete Wavelet Transform (DWT) provides a multi-resolution decomposition of an image. This characterization of the wavelet transform allows the study of data from coarse to fine resolution, and the extraction of information within any of the available decomposition levels. The DWT can be implemented with a two-channel filter bank using quadrature mirror filters. For an image, the algorithm sequentially applies one-dimensional high and low pass filtering steps to the rows and the columns of the input image. Each filtering step is followed by sub-sampling, resulting in the change of scale.
A detailed mathematical description of wavelets is beyond the scope of this report and is not essential to the demonstration of WARE. Further discussion of wavelet analysis is available in many references, e.g., [5], [6], and [7].
DRDC Ottawa TM 2007-030 9
3.3 Wavelet selection
Unlike the case of the Fourier transform, there exist a large number of wavelet families that are a function of the mother wavelet. In practice, a specific wavelet must be selected to provide the best performance for a specific application. Critical wavelet properties to consider include:
• Orthogonality: The decomposed data resulting from orthogonal wavelets are reciprocal and orthogonal. Orthogonality reduces the correlation between scales.
• Compact Support: A compactly supported wavelet permits the use of finite length filter banks.
• Symmetry: Symmetrical filter banks have a linear phase, reducing quantization errors and edge distortion in reconstructed signals.
• Regularity: Regularity is a measure of smoothing, which is important in some applications. For example, in image compression, wavelet regularity reduces image artefacts. There is a correlation between wavelet regularity and reconstructed image quality [21].
• Vanishing Moments: When the order is large enough, high frequency data at small scales may be neglected.
In complex cases, the optimal wavelet could be determined by comparing empirical results using a number of candidate wavelet choices.
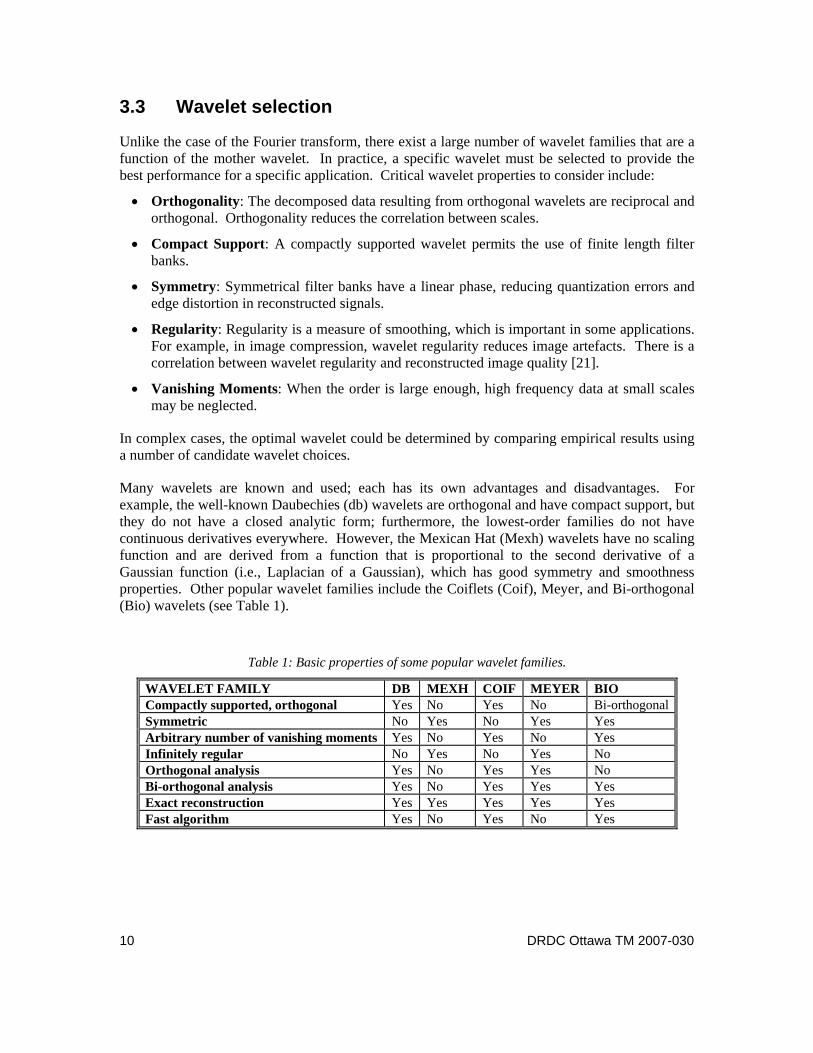
Many wavelets are known and used; each has its own advantages and disadvantages. For example, the well-known Daubechies (db) wavelets are orthogonal and have compact support, but they do not have a closed analytic form; furthermore, the lowest-order families do not have continuous derivatives everywhere. However, the Mexican Hat (Mexh) wavelets have no scaling function and are derived from a function that is proportional to the second derivative of a Gaussian function (i.e., Laplacian of a Gaussian), which has good symmetry and smoothness properties. Other popular wavelet families include the Coiflets (Coif), Meyer, and Bi-orthogonal (Bio) wavelets (see Table 1).
Table 1: Basic properties of some popular wavelet families.
WAVELET FAMILY DB MEXH COIF MEYER BIO Compactly supported, orthogonal Yes No Yes No Bi-orthogonalSymmetric No Yes No Yes Yes Arbitrary number of vanishing moments Yes No Yes No Yes Infinitely regular No Yes No Yes No Orthogonal analysis Yes No Yes Yes No Bi-orthogonal analysis Yes No Yes Yes Yes Exact reconstruction Yes Yes Yes Yes Yes Fast algorithm Yes No Yes No Yes
10 DRDC Ottawa TM 2007-030

4. WARE Demonstration Software
This Section describes the WARE software. The demonstration software (see Annex A) with GUI (Figure 3) was developed using Matlab™ and the Wavelet Toolbox. It includes modules for: (a) wind direction estimation; (b) oceanic or atmospheric front extraction; (c) oil spill detection; and (d) ship detection.
Figure 3: Main GUI for Wavelet Analysis for RADARSAT Exploitation (WARE).
4.1 Image pre-processing
There are several possible pre-processing steps that must be completed outside of WARE. For some RADARSAT ocean images, a radiometric imbalance exists that is characterized by a
DRDC Ottawa TM 2007-030 11

decrease in the mean image intensity with increasing range across the image. This is caused by a mismatch between the user-selected output lookup table (LUT) and the actual wind conditions when the image was acquired. Such trends in mean image intensity can cause difficulties for some of the WARE modules (and other image processing algorithms in general).
There are several tools available at DRDC Ottawa to remove radiometric trends in SAR images. Both IA Pro and VUSAR include radiometric correction utilities for RADARSAT images. The utilities require that the user crop a region that is relatively homogeneous across the entire range swath (if there is not a homogeneous region it’s advisable to use most or the entire image in azimuth). The utilities calculate an average (in azimuth) transect (based on the cropped region in azimuth) across the entire range swath – it makes no difference what size the cropped region is in the range dimension since the entire range swath is used to calculate the average (in azimuth) transect. This average transect is subsequently filtered or modelled with curve fitting, and the inverse of the transect is applied to the image to radiometrically balance the image in the range direction. A new RADARSAT image product is generated with an updated scaling LUT (i.e., the new product is radiometrically balanced) thus the new RADARSAT product remains radiometrically calibrated.
The RADARSAT image can also be block averaged prior to ingest into the WARE software. The block-averaged image is smaller in size, so may be processed more efficiently. A lower resolution image is adequate for several of the WARE modules. For example, the ceos_blockavg program is a stand-alone utility written in C. Typically, the original CEOS format image (or subscene) is block-averaged to a flat-binary floating point image consisting of approximately 2000 lines by 2000 pixels. A corresponding ASCII header file is also created which contains the flat-binary file specifications (i.e., number of lines, number of pixels per line, etc.) as well as the original and re-sampled pixel spacings. This information is accessed and used by WARE. The ceos_blockavg program can also be used to extract a subscene from a CEOS format image at full resolution.
4.2 Wind Direction Estimation
4.2.1 Background
Ocean surface wind vector information plays an important role in diverse research and application fields. Wind stress is one of the main forces driving ocean dynamic processes. A detailed description of the wind field can improve our understanding of atmospheric processes. RADARSAT provides an image of the roughness distribution on the sea surface under all weather conditions, with large dynamic range, high accuracy, and high resolution. Retrieval of wind information from SAR imagery provides a useful complement to support traditional wind observations and numerical modeling.
Several sources of wind direction have been used in the estimation of the wind vectors from SAR images of the ocean, including numerical weather prediction models, wind fields from spaceborne scatterometry, and analysis of boundary layer rolls, e.g., [14], [28], [29], [30], [32]. Boundary layer rolls may appear in SAR ocean images as image streaks for higher wind and/or unstable atmospheric conditions, e.g., [12], [17], [28]. Wind direction estimation amounts to measuring the orientation of the boundary layer rolls, when they are present in the SAR image. The ocean
12 DRDC Ottawa TM 2007-030

surface wind direction (to within a 180° direction ambiguity) is assumed to lie essentially parallel to the roll or image streak orientation. SAR images of boundary layer rolls are quite variable in terms of roll scale (ranging from one to tens of kilometres) and characteristics.
One approach to streak orientation estimation is through spectral analysis of the SAR image using a Discrete Fourier Transform (DFT), e.g., [14], [29], [32]. In some cases, spectral analysis works well, but the image streaks are not described quantitatively. Furthermore, when the long-wavelength spectrum is nearly symmetrical, a reliable wind direction cannot be estimated [29].
Another approach to streak orientation estimation is based on the measurement of texture features. A texture feature is a value, computed from a whole image or a sub-scene, which quantifies some characteristic of the grey-level variation within the immediate area. Therefore, it is a spatial concept that is related to the scale of the computation area. SAR image textures can be classified as random or pattern textures. Random textures are characterized by statistical properties such as the standard deviation of the grey-level (for measuring the amplitude of the texture) and the auto-correlation function width (for measuring the spatial scale of the texture). Speckle noise in SAR images is an example of a random texture. Pattern textures can be characterized by extracting measurements that quantify the nature and directionality (if any) of the pattern. The streaks in SAR images that are related to wind direction are examples of pattern textures.
In WARE, we follow the algorithm developed by Du et al. [10]. To estimate the relative strength of wind-induced streaks in SAR images, the Maximum of the standard deviations of the Mean cross section (MStdM) is introduced as a detection criterion. The cross section mean of the area of interest is obtained by computing the mean value of each column in a vertical direction (see Figure 4a). When the image is rotated through 180° with a given rotational interval, the mean values of the cross section at various rotation angles are obtained (Figure 4b). The rotation angle interval is 180 (where 180 ) and the choice of depends on the accuracy of estimation that is required, and proportionally scales the computation cost. After a complete rotation, curves of the cross section mean value are obtained. The MStdM and the Average of the Standard deviations of the Mean cross section (AvStdM) of these curves are calculated as:
/ n° 1n> > n
n
[ ]max (1), (2), , ( )MStdM StdM StdM StdM n= … ; (5)
[ ]average (1), (2), , ( )AvStdM StdM StdM StdM n= … , (6)
where is the Standard deviation of the Mean cross section for the i( )StdM i th rotation angle. The factor is introduced to describe the strength of the directional features: k
1MStdMkAvStdM
= ≥ . (7)
The higher the value of , the stronger the directional features in the image. For a given threshold, can be used to make an interactive validation decision. When is higher than a
kk k
DRDC Ottawa TM 2007-030 13

user-defined threshold, the surface feature in the image may be considered to be directional; otherwise, it is considered to be too weak to extract a reliable direction. The threshold can be based on specific test cases and on the analyst’s experience. For an image area containing streaks, the most likely direction of the texture is the direction of the MStdM derived from the rotation angle. If the north direction is zero and the rotation is clockwise, then the direction of the streaks is equal to the negative rotation angle of the MStdM.
Figure 5a shows an example for a 256-by-256 pixel sub-scene of rotated vertical detail at a scale of 3.2 km. Figure 5b shows the cross section mean curves rotated from 0° to 170° with an interval of 10°. at a rotation angle of 20°; 1.17MStdM = 0.33AvStdM = ; and k . In this case, therefore, the orientation of the streak feature is 20°.
3.55=
Figure 4: Calculation of the Standard deviation of the Mean cross section (StdM) for two different rotation
angles: (a) 0°; and (b) 20°.
(a) (b) Figure 5: Calculation of the Standard deviation of the Mean cross section (StdM) from an image with
vertical detail: (a) rotated images (0° to 170°); and (b) StdM.
14 DRDC Ottawa TM 2007-030
With the two-dimensional discrete wavelet transform, a SAR image can be decomposed into texture features at various scales. The scale of the decomposition depends on the scale of the texture features of interest, the pixel spacing, and the size of the original image. For example, if the pixel spacing of a RADARSAT ScanSAR wide mode image is 50 m, scale 1, 2, 3, 4, 5, and 6 decompositions of the image will contain the spatial variations or texture features at
km, … , (50 km, and (50 km wavelengths, respectively.
1 5 6
k
kk
(50 m) 2 0.1⋅ = m) 2 1.6⋅ = m) 2 3.2⋅ =
With a two-dimensional discrete wavelet transform, there are four components – one approximation and three details – at each scale of the decomposition. The vertical detail describes and enhances the vertical features at a specific scale (Figure 6). The principle of directional estimation is that the vertical features should be strongest when the direction of the image streak is aligned with the vertical direction. Therefore, the vertical detail image at the scale of interest could be used as a template for the detection and estimation of directionally-oriented features in SAR images. Rotating the SAR image and computing the vertical detail at a particular scale can extract the streak information for different orientations. For the individual scale, the extraction rule is that the direction of the texture feature must be aligned with the maximum vertical StdM at that scale. Under this rule, the directions of streaks at different scales can be found. MStdM, AvStdM, and the directional factor can be calculated at different spatial scales by using equations (5), (6), and (7).
Compared to traditional texture analysis, the benefit of a wavelet-based texture analysis is that multi-scales are used. The directional factor at different scales indicates at which scale the spatial feature is the most directional. Therefore, is the key to determining the optimal spatial scale for the directional estimation of texture features.
Further validation of the estimated grid of wind directions may be based on wind field coherence. After the wind direction is estimated from the texture features at the different scales for the overall wind field, the relation between each grid point and the neighbouring points is considered. The assumption is that the spatial variation of the wind direction is smooth, or changes gradually; no single wind direction should be beyond a given variation limit when compared with the mean or median wind direction in the local neighbourhood. In this kind of validation, two factors should be considered: first, the impacted coverage; and second, the variation limit. A moving boxcar window may be used to adjust the overall wind direction field. The wind direction at the central point of the boxcar may be improved by comparing with the mean or median wind direction within the overall boxcar coverage.
DRDC Ottawa TM 2007-030 15

Figure 6: A standard orthonormal decomposition using a wavelet transform with two scale levels. The
panels include vertical (V), horizontal (H), and diagonal (D) detail images at scales 1 and 2, as well as the corresponding approximation image (A2).
4.2.2 Procedure
In WARE, wavelet multi-scale analysis is used to estimate the wind direction from streak orientation in SAR images of the ocean. The image is first decomposed using a wavelet transform. Image chips are then extracted, systematically rotated at the available scales, and integrated to produce modulation profiles. The case of maximum contrast provides the orientation angle (i.e., wind direction) and scale.
The input RADARSAT image must be stored in a pair of files consisting of the flat binary image and a descriptive ASCII header file. The image is usually block averaged prior to processing with the Wind Direction Estimation tool in order to reduce the processing time. A pixel spacing of 50 to 200 m should be adequate. A land mask may be beneficial and can be used. The mask is an unsigned 8-bit integer format binary file of the same size as the input image with the land areas set to zero and ocean areas set to unity. If a land mask file is not loaded, the entire image will be processed.
The processing procedure is as follows:
1. From the main WARE GUI, click on the “Wind Field” icon to display the “Estimation of Wind Direction in RADARSAT Ocean Imagery” GUI ( ); Figure 7
16 DRDC Ottawa TM 2007-030

2. Click on “Input Image” and select the file of interest ( ); Figure 83. Select the rotation step: there are currently three options: 1°, 3°, and 6°, generally, a smaller
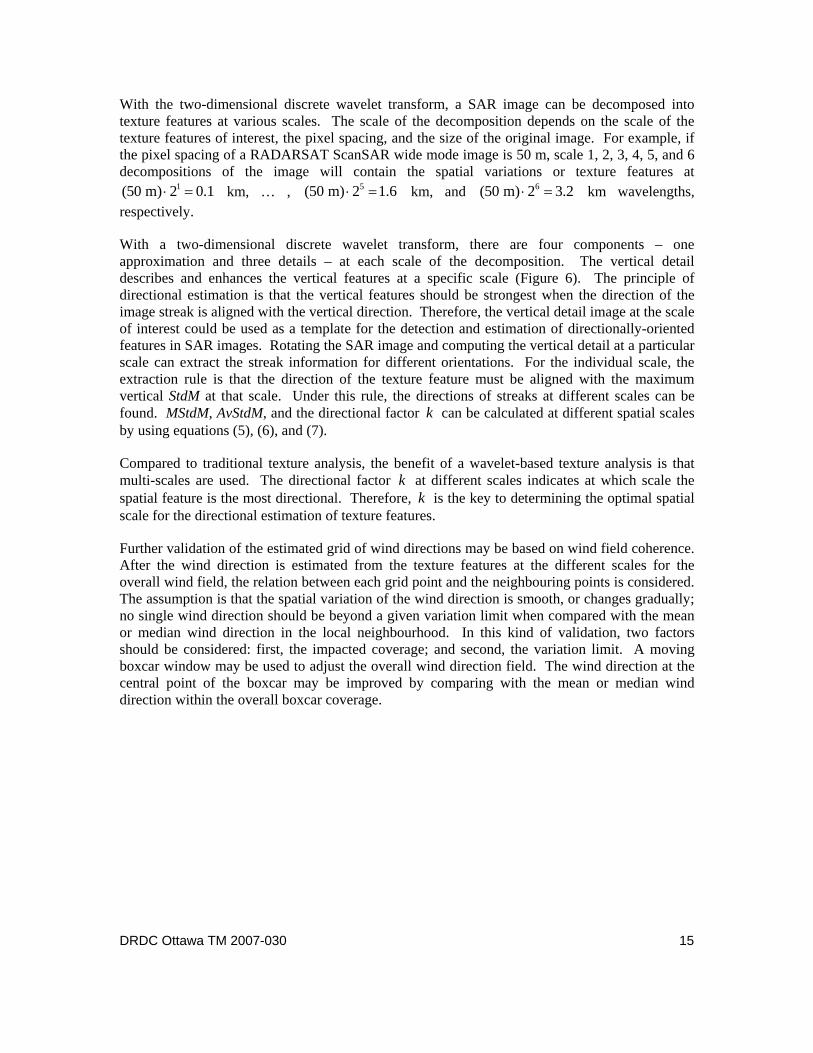
step size produces more accurate results, but increases the processing time; 4. Select the “Grid Size”, the number of the pixels between adjacent direction estimates; 5. Select “Sub-scene Size”, the size of the area that is rotated and integrated to produce the set
of contrast estimates ( ); Figure 96. Select “Filter Grid Size”, which controls the number of Grid Points that are compared to
check for and remove outliers (i.e., any direction estimates that are larger than 45° different from the mean);
7. Click on “Estimate Wind Direction” to calculate the wind direction with a 180° direction ambiguity;
8. Click on “Display Wind Field” to display the estimated wind field, which is filtered based on the selected filter grid size ( ); Figure 10
9. Click on “Save Wind Field” to save the displayed figure with the original image overlaid by wind vectors with a 180° direction ambiguity; the colors represent the various spatial scales that are matched: Magenta is 1600 m; Green is 3200 m; and Red is 6400 m for an input pixel spacing of 50 m;
10. Click on “Save Text File” to create an ASCII file that contains, for each Grid point, the pixel locations (x, y), the wind vector direction (positive y direction is zero, increasing clockwise), the wind vector direction +180°, and the selected spatial scale that best matches the scale of the image striations: 1 = 1600 m; 2 = 3200 m; and 3 = 6400 m for an input pixel spacing of 50 m ( ). Table 2
The wind direction procedure has been designed for automatic operation for an input pixel spacing of 50 m. If the input image has a pixel spacing of 50 m, then click “Estimate Wind Direction” followed by “Display Wind Field”, and the wind direction field is obtained. If the input image does not have an input pixel spacing of 50 m, then the output result needs to be corrected to the scale of image striations based on the ratio between the input image’s pixel spacing and 50 m. For example, if the input image has a pixel spacing of 75 m, then the scales of the image striations should be changed from 1600 m to 2400 m, from 3200 m to 4800 m, and from 6400 m to 9800 m. The selection of parameters at steps 2, 3, 4, and 5 is intended for use by experienced users carrying out interactive validation. When the output result is not satisfactory, the “Sub Scene Size”, “Grid Size”, “Rotation Step”, and “Filter Size” can be adjusted depending on the distribution of image striations. It should be noted that this has proven to be a robust algorithm for most cases encountered [10].
DRDC Ottawa TM 2007-030 17

Figure 7: Estimation of wind direction in RADARSAT ocean imagery.
Figure 8: RADARSAT test image for wind direction estimation.
18 DRDC Ottawa TM 2007-030
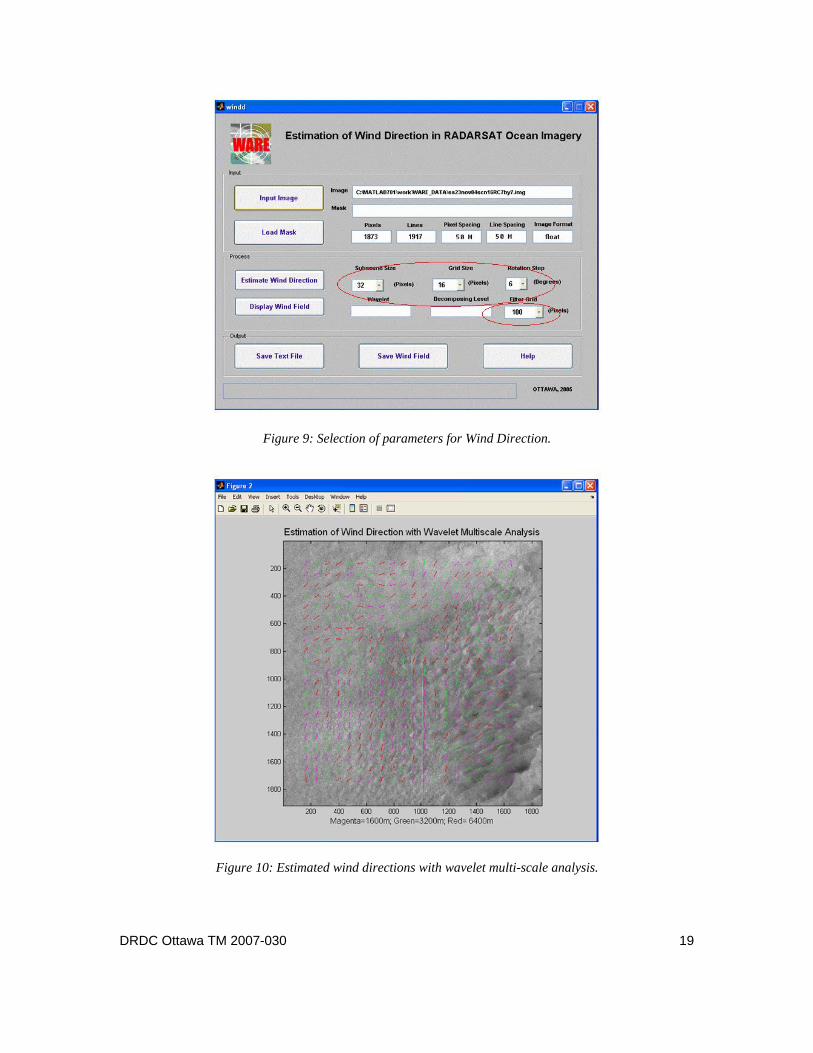
Figure 9: Selection of parameters for Wind Direction.
Figure 10: Estimated wind directions with wavelet multi-scale analysis.
DRDC Ottawa TM 2007-030 19

Table 2: Output text file of estimated wind directions.
X Y DIR1 DIR2 SCALE164 164 25.5 205.5 1 242 164 38.0 218.0 2 321 164 58.0 238.0 3 399 164 57.0 237.0 3 477 164 58.0 238.0 2 555 164 75.0 255.0 3 633 164 64.0 244.0 2 712 164 65.0 245.0 3 790 164 66.0 246.0 1 868 164 64.0 244.0 3 946 164 0.0 180.0 2 1024 164 12.0 192.0 2 1103 164 26.0 206.0 3 1181 164 41.0 221.0 2 1259 164 41.0 221.0 1 1337 164 39.0 219.0 1 1415 164 39.0 219.0 2 1494 164 39.0 219.0 2 1572 164 33.0 213.0 1 1650 164 174.0 354.0 1 164 242 42.0 222.0 1 242 242 60.0 240.0 1
4.2.3 Further improvements
Wind direction estimation as implemented in WARE has been successfully demonstrated on several RADARSAT-1 SAR images. Furthermore, this wavelet-based algorithm has been compared with spectral analysis-based algorithms elsewhere [10]. Qualitative assessment suggests that the WARE algorithm does a better job in the vicinity of dynamic atmospheric phenomena, such as meteorological fronts, where the scale of the image streaks of interest could change over small horizontal spatial scales.
The algorithm should be tested more fully, which could lead to use of new wavelet families to better deal with eddies, curvilinear features, and asymmetrically-shaped convective cells.
However, due to the robustness of the algorithm and validation that has been carried out elsewhere, we feel that this algorithm could be operationalized in the near term.
20 DRDC Ottawa TM 2007-030
4.3 Oceanic or Atmospheric Front Extraction
4.3.1 Background
An ocean front is a boundary between water masses that is usually accompanied by horizontal gradients of temperature, salinity, density, nutrients, or other water properties. The front may cause changes in the short-scale surface roughness, which can generate a radar brightness change across the ocean front in SAR imagery. Oceanic fronts can appear as step-like changes in image brightness or more usually, as isolated linear features.
An atmospheric front is a boundary between air masses that is usually accompanied by a change in wind speed and direction, as well as a horizontal temperature gradient. Over the ocean, the front may cause changes in the short-scale surface roughness, which can generate a radar brightness change across the atmospheric front in SAR imagery. Atmospheric fronts generally appear as curvilinear step-like changes in radar brightness that are tens to hundreds of kilometres in extent. There may be an associated change in the pattern texture (i.e., the nature of the turbulent atmospheric structures) across the front.
Due to the large spatial scale of oceanic and atmospheric fronts, the brightness variation with incidence angle could impact the selection of the brightness threshold. As such, radiometric flattening across the entire scene is a necessary pre-processing step for front extraction.
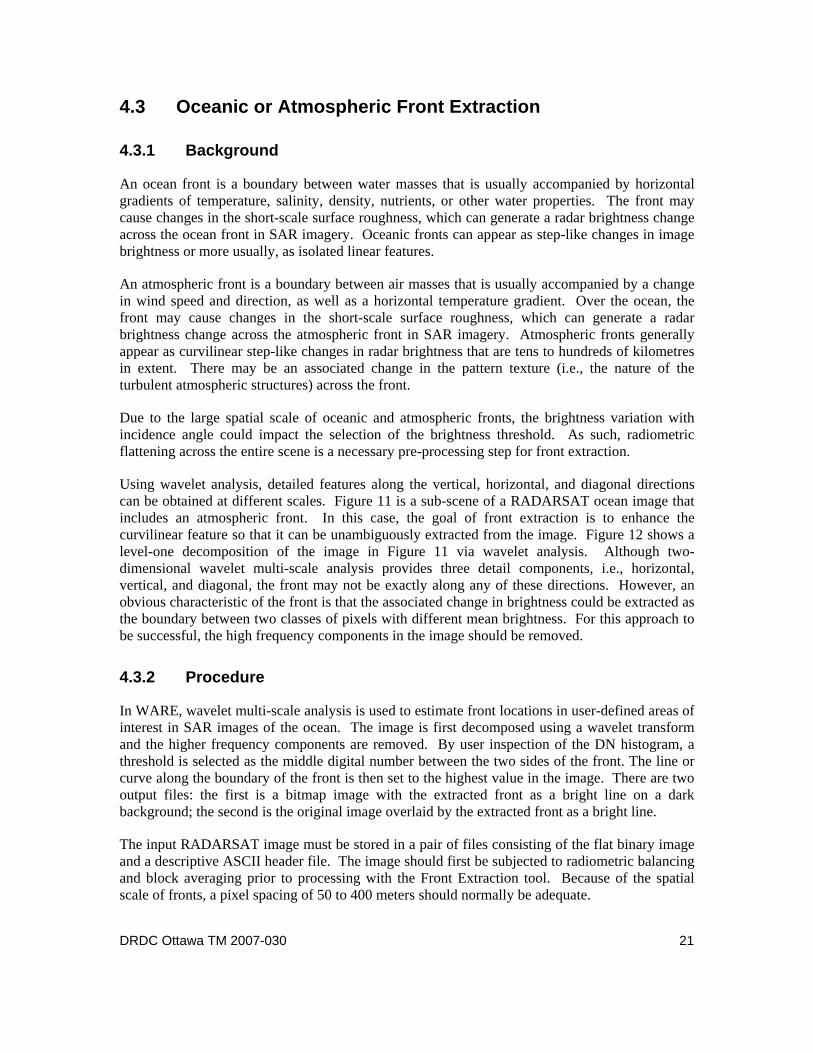
Using wavelet analysis, detailed features along the vertical, horizontal, and diagonal directions can be obtained at different scales. Figure 11 is a sub-scene of a RADARSAT ocean image that includes an atmospheric front. In this case, the goal of front extraction is to enhance the curvilinear feature so that it can be unambiguously extracted from the image. Figure 12 shows a level-one decomposition of the image in Figure 11 via wavelet analysis. Although two-dimensional wavelet multi-scale analysis provides three detail components, i.e., horizontal, vertical, and diagonal, the front may not be exactly along any of these directions. However, an obvious characteristic of the front is that the associated change in brightness could be extracted as the boundary between two classes of pixels with different mean brightness. For this approach to be successful, the high frequency components in the image should be removed.
4.3.2 Procedure
In WARE, wavelet multi-scale analysis is used to estimate front locations in user-defined areas of interest in SAR images of the ocean. The image is first decomposed using a wavelet transform and the higher frequency components are removed. By user inspection of the DN histogram, a threshold is selected as the middle digital number between the two sides of the front. The line or curve along the boundary of the front is then set to the highest value in the image. There are two output files: the first is a bitmap image with the extracted front as a bright line on a dark background; the second is the original image overlaid by the extracted front as a bright line.
The input RADARSAT image must be stored in a pair of files consisting of the flat binary image and a descriptive ASCII header file. The image should first be subjected to radiometric balancing and block averaging prior to processing with the Front Extraction tool. Because of the spatial scale of fronts, a pixel spacing of 50 to 400 meters should normally be adequate.
DRDC Ottawa TM 2007-030 21
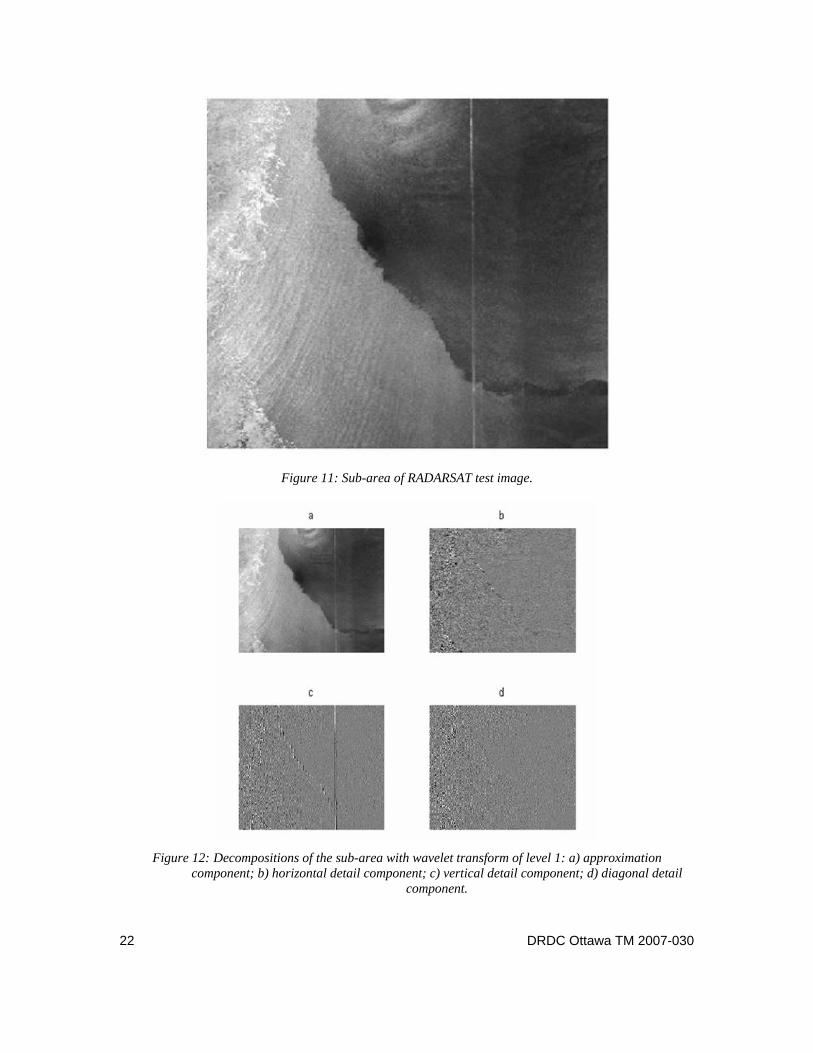
Figure 11: Sub-area of RADARSAT test image.
Figure 12: Decompositions of the sub-area with wavelet transform of level 1: a) approximation
component; b) horizontal detail component; c) vertical detail component; d) diagonal detail component.
22 DRDC Ottawa TM 2007-030

Figure 13: Front extraction from RADARSAT ocean imagery.
The processing procedure is as follows:
1. From the main WARE GUI, click on the “Fronts” icon to display the “Front Extraction from RADARSAT Ocean Imagery” GUI ( ); Figure 13
2. Click on “RADARSAT Input” to select the file of interest ( ); Figure 143. Click on “Areas of Interest”, then click and hold the left mouse button and drag to draw and
select a rectangular area of interest in the image; repeat to select additional rectangular areas of interest ( ), then Click on “Reset” to turn off the selected areas; Figure 15
4. Select the “Wavelet” and “Level”, default values are “db4” and “level 3”; 5. Click on “Estimate” to create a histogram of the image within the areas of interest (
); Figure
166. Determine the threshold by moving the slider to the lowest position (the valley) between the
two histogram peaks; 7. Click on “Front Extraction” to estimate the front location ( ); Figure 178. If the result looks good, click on “Overlay” to save; if the result is not satisfactory, then click
on “Reset”, adjust the “Wavelet”, “Level”, or “Threshold” (based upon user experience), and repeat the front extraction process;
9. Choose additional sub-areas with different brightness distributions across the front, and repeat the above steps to extract additional parts of the front;
10. After the whole front has been extracted, click on “Whole overlay layer” to create the final result ( ); Figure 17
11. Click “Save Overlay Layer” to save a bitmap image file of the front; 12. Click “Save Figure File” to save the image with the extracted front ( ). Figure 18
DRDC Ottawa TM 2007-030 23
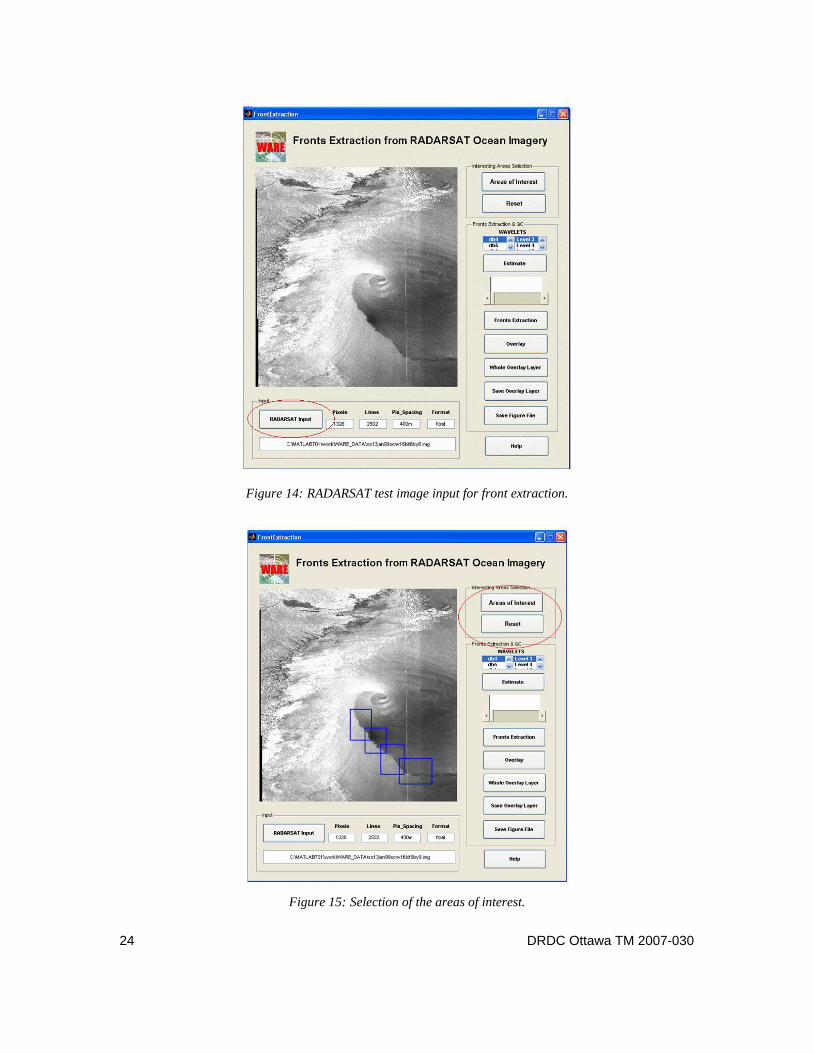
Figure 14: RADARSAT test image input for front extraction.
Figure 15: Selection of the areas of interest.
24 DRDC Ottawa TM 2007-030

Figure 16: Histogram for threshold selection.
Figure 17: Extraction of fronts for a different sub-area.
DRDC Ottawa TM 2007-030 25
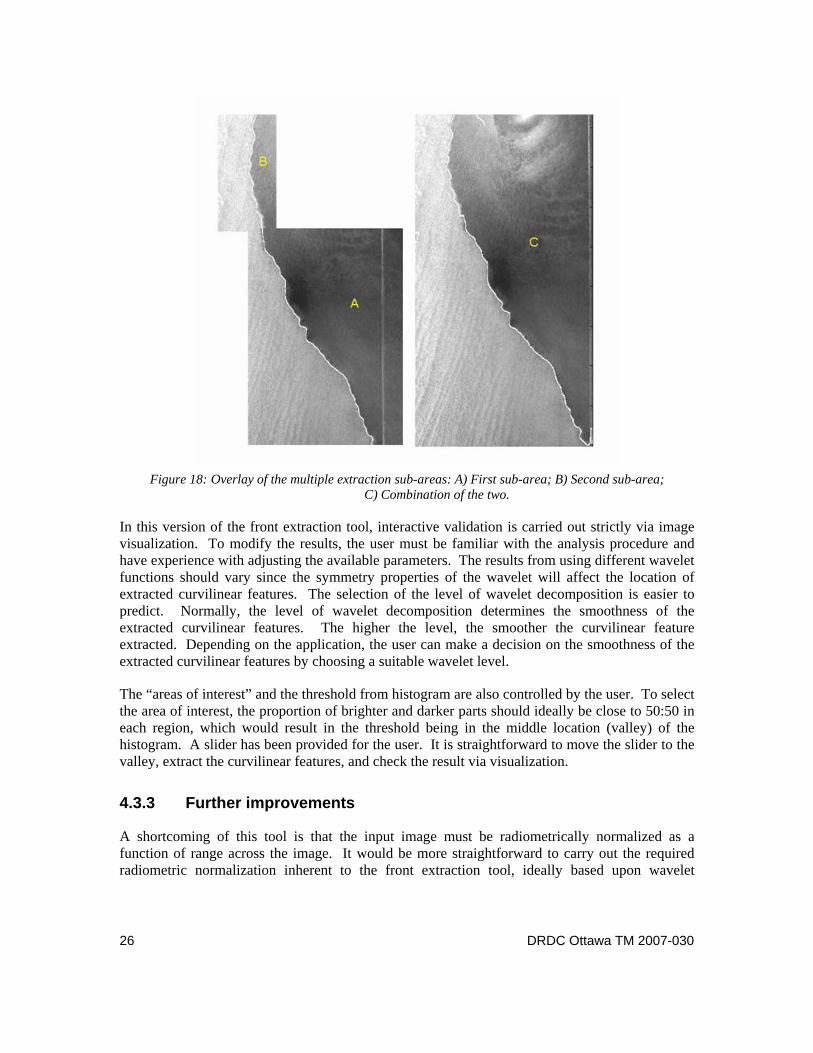
Figure 18: Overlay of the multiple extraction sub-areas: A) First sub-area; B) Second sub-area;
C) Combination of the two.
In this version of the front extraction tool, interactive validation is carried out strictly via image visualization. To modify the results, the user must be familiar with the analysis procedure and have experience with adjusting the available parameters. The results from using different wavelet functions should vary since the symmetry properties of the wavelet will affect the location of extracted curvilinear features. The selection of the level of wavelet decomposition is easier to predict. Normally, the level of wavelet decomposition determines the smoothness of the extracted curvilinear features. The higher the level, the smoother the curvilinear feature extracted. Depending on the application, the user can make a decision on the smoothness of the extracted curvilinear features by choosing a suitable wavelet level.
The “areas of interest” and the threshold from histogram are also controlled by the user. To select the area of interest, the proportion of brighter and darker parts should ideally be close to 50:50 in each region, which would result in the threshold being in the middle location (valley) of the histogram. A slider has been provided for the user. It is straightforward to move the slider to the valley, extract the curvilinear features, and check the result via visualization.
4.3.3 Further improvements
A shortcoming of this tool is that the input image must be radiometrically normalized as a function of range across the image. It would be more straightforward to carry out the required radiometric normalization inherent to the front extraction tool, ideally based upon wavelet
26 DRDC Ottawa TM 2007-030

methods. This would make the software more self contained and would demonstrate another capability of wavelet analysis.
To date, only a limited number of images have been processed using this tool. However, it is apparent that the front location is dependent upon the choice of wavelet family and the decomposition level. For example, it could be beneficial to link the decomposition level to the resolution of the data being analyzed. Although automatic operation of this tool is expected to be difficult to achieve, the threshold selection does amount to an image segmentation operation. As such, several segmentation tools could be provided to automate this process.
Additional R&D effort is still required to make this tool more general and to provide a better baseline set of analysis parameters.
4.4 Oil Spill Detection
4.4.1 Background
The term oil spill refers to the release of oil into the ocean. Oil in this context includes crude oil, oil refuse, petroleum-related products or by-products, oil mixed in waste, oily ballast, and oily bilge water.
C-band radar is sensitive to variations in sea surface roughness. Rough surfaces scatter energy back towards the radar resulting in bright signatures. Smooth surfaces reflect energy away from the radar resulting in darker signatures. Oil films locally damp the short surface waves such that the oil spill is manifested as a dark signature in the SAR image. However, the detection of an oil spill in SAR ocean imagery is dependent upon the wind speed near the ocean surface.
To complicate matters, under calm conditions, natural surfactants may form over large areas of the ocean, along current boundaries, and in areas of upwelling. The accumulation of natural surfactants at these boundaries can delineate the general circulation pattern and may be visible in the image as curvilinear features with a darker tone than the surrounding ocean [11], [27].
Thus, accurate detection of oil spills in RADARSAT imagery requires a thresholding algorithm that is dependent on the local wind speed and is used to separate the oil covered region from the background. After a region with a darker tone is detected as a candidate oil spill, it is possible to classify it as an oil spill or a natural surfactant through texture analysis.
4.4.2 Procedure
In WARE, wavelet multi-scale analysis is used to estimate the location of oil spills in SAR images of the ocean. In order to obtain a contiguous pattern with a relatively smooth boundary, the image is first decomposed using a wavelet transform and the higher frequency components are removed. Although the higher frequency components are removed to permit better detection of the dark tone, they could be used for edge analysis and to distinguish between oil spills and natural surfactants. A threshold is then selected as the mid DN between the bright and dark regions in the area of interest. The result of the thresholding is two files: the first is a bitmap image that contains the bright pattern of the detected oil spill against a dark background; the
DRDC Ottawa TM 2007-030 27
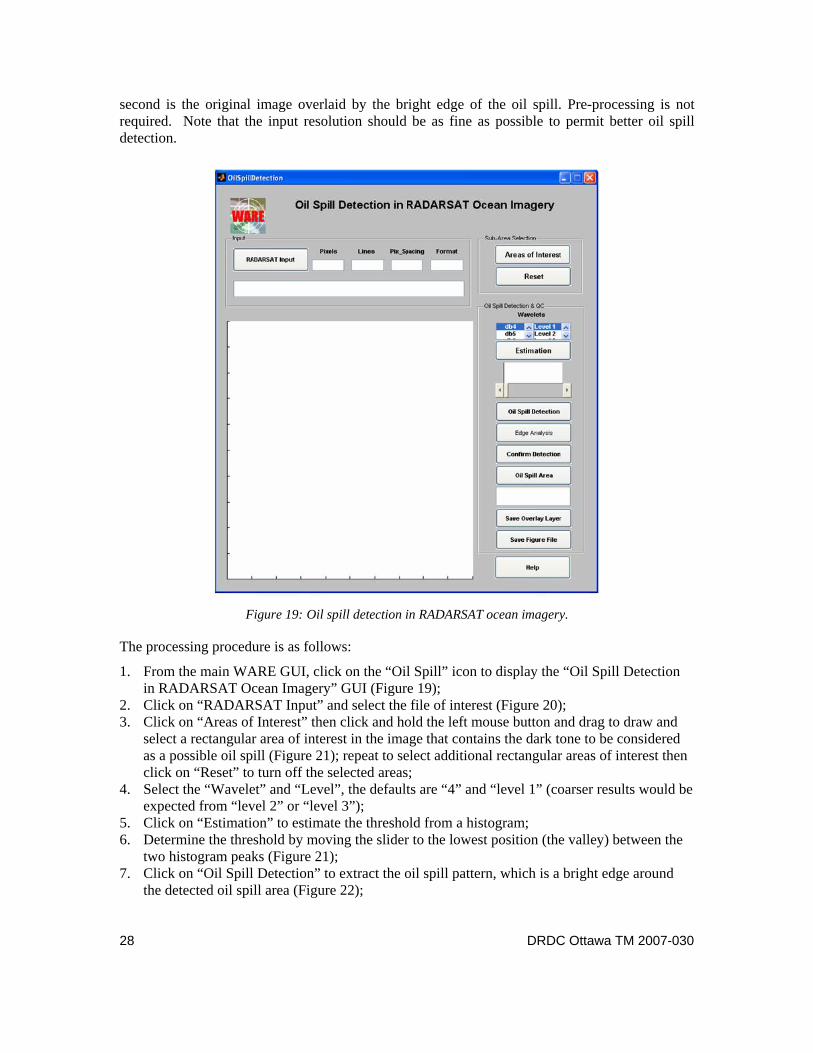
second is the original image overlaid by the bright edge of the oil spill. Pre-processing is not required. Note that the input resolution should be as fine as possible to permit better oil spill detection.
Figure 19: Oil spill detection in RADARSAT ocean imagery.
The processing procedure is as follows:
1. From the main WARE GUI, click on the “Oil Spill” icon to display the “Oil Spill Detection in RADARSAT Ocean Imagery” GUI ( ); Figure 19
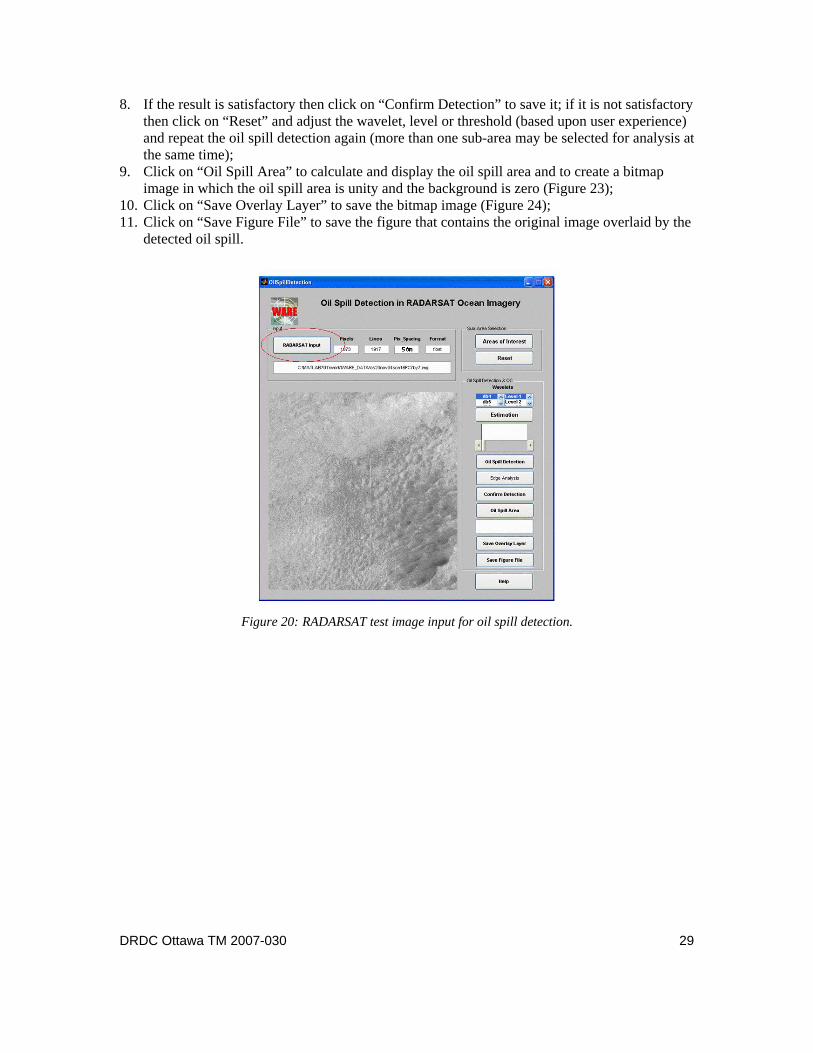
2. Click on “RADARSAT Input” and select the file of interest ( ); Figure 203. Click on “Areas of Interest” then click and hold the left mouse button and drag to draw and
select a rectangular area of interest in the image that contains the dark tone to be considered as a possible oil spill ( ); repeat to select additional rectangular areas of interest then click on “Reset” to turn off the selected areas;
Figure 21
4. Select the “Wavelet” and “Level”, the defaults are “4” and “level 1” (coarser results would be expected from “level 2” or “level 3”);
5. Click on “Estimation” to estimate the threshold from a histogram; 6. Determine the threshold by moving the slider to the lowest position (the valley) between the
two histogram peaks ( ); Figure 217. Click on “Oil Spill Detection” to extract the oil spill pattern, which is a bright edge around
the detected oil spill area ( ); Figure 22
28 DRDC Ottawa TM 2007-030
8. If the result is satisfactory then click on “Confirm Detection” to save it; if it is not satisfactory then click on “Reset” and adjust the wavelet, level or threshold (based upon user experience) and repeat the oil spill detection again (more than one sub-area may be selected for analysis at the same time);
9. Click on “Oil Spill Area” to calculate and display the oil spill area and to create a bitmap image in which the oil spill area is unity and the background is zero ( ); Figure 23
10. Click on “Save Overlay Layer” to save the bitmap image ( ); Figure 2411. Click on “Save Figure File” to save the figure that contains the original image overlaid by the
detected oil spill.
Figure 20: RADARSAT test image input for oil spill detection.
DRDC Ottawa TM 2007-030 29

Figure 21: Selection of areas of interest, processing parameters, and histogram.
Figure 22: Detected dark tones in the RADARSAT image.
30 DRDC Ottawa TM 2007-030
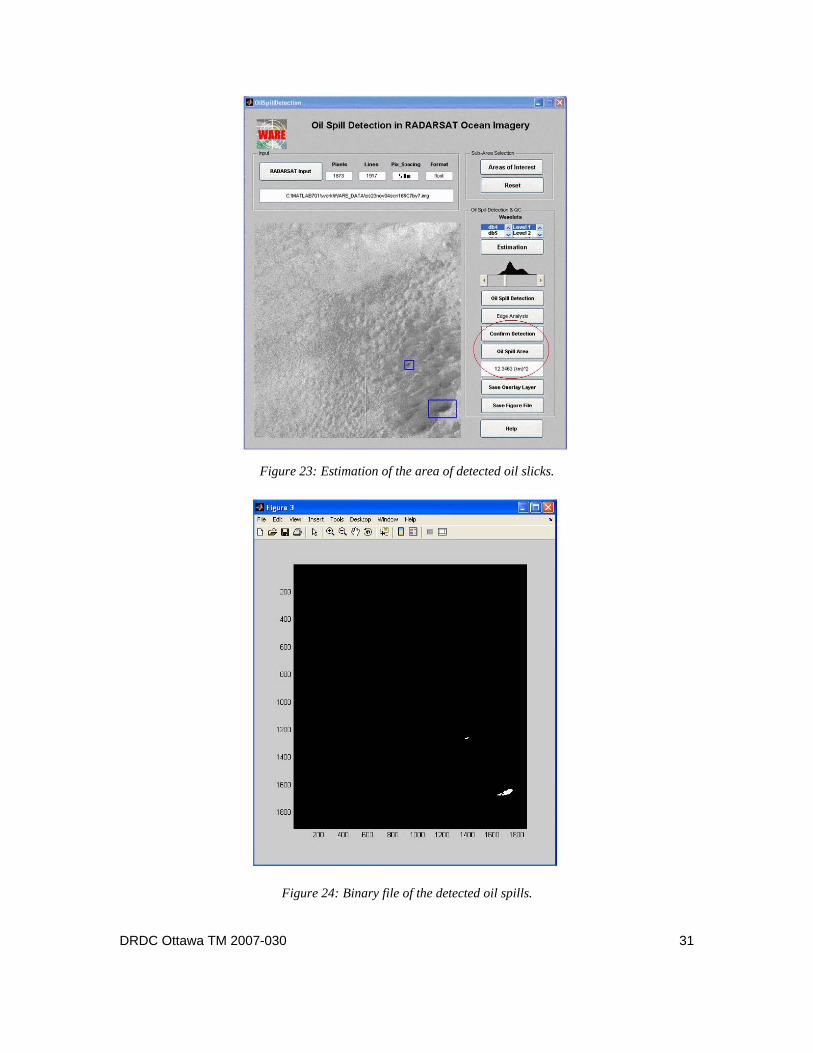
Figure 23: Estimation of the area of detected oil slicks.
Figure 24: Binary file of the detected oil spills.
DRDC Ottawa TM 2007-030 31

4.4.3 Further improvements
To date, only a limited number of images have been processed using the oil spill detection tool. However, it is apparent that the oil spill location is dependent upon the choice of wavelet family and the decomposition level. For example, it could be beneficial to link the decomposition level to the resolution of the data being analyzed.
Additional R&D effort is still required to make this tool more general and to provide a more robust baseline set of analysis parameters.
4.5 Ship Detection
4.5.1 Background
Ship detection in SAR ocean imagery amounts to the detection of bright point-like targets against the ocean clutter background [31]. The strength of the target signature depends upon the target size and composition. The ability to detect ships strongly depends upon the clutter level which responds to the wind and wave conditions and the observation geometry.
Ship detection in RADARSAT ocean imagery is essentially a solved problem based upon operational data streams and constant false alarm rate detection algorithms. In general, higher resolution permits better analysis of the ship signatures for ship size and the presence of identifying structures. Of course, ship motion could blur the imaged signature.
Figure 25: Ship detection in RADARSAT ocean imagery.
32 DRDC Ottawa TM 2007-030
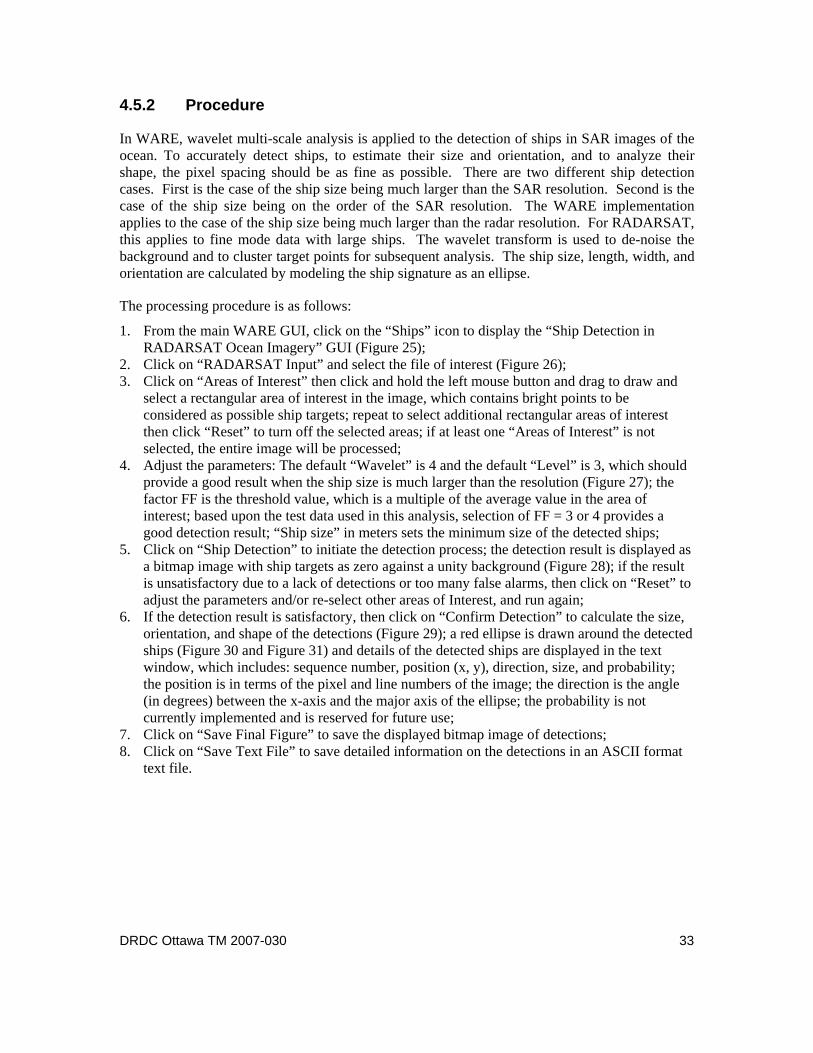
4.5.2 Procedure
In WARE, wavelet multi-scale analysis is applied to the detection of ships in SAR images of the ocean. To accurately detect ships, to estimate their size and orientation, and to analyze their shape, the pixel spacing should be as fine as possible. There are two different ship detection cases. First is the case of the ship size being much larger than the SAR resolution. Second is the case of the ship size being on the order of the SAR resolution. The WARE implementation applies to the case of the ship size being much larger than the radar resolution. For RADARSAT, this applies to fine mode data with large ships. The wavelet transform is used to de-noise the background and to cluster target points for subsequent analysis. The ship size, length, width, and orientation are calculated by modeling the ship signature as an ellipse.
The processing procedure is as follows:
1. From the main WARE GUI, click on the “Ships” icon to display the “Ship Detection in RADARSAT Ocean Imagery” GUI ( ); Figure 25
2. Click on “RADARSAT Input” and select the file of interest ( ); Figure 263. Click on “Areas of Interest” then click and hold the left mouse button and drag to draw and
select a rectangular area of interest in the image, which contains bright points to be considered as possible ship targets; repeat to select additional rectangular areas of interest then click “Reset” to turn off the selected areas; if at least one “Areas of Interest” is not selected, the entire image will be processed;
4. Adjust the parameters: The default “Wavelet” is 4 and the default “Level” is 3, which should provide a good result when the ship size is much larger than the resolution ( ); the factor FF is the threshold value, which is a multiple of the average value in the area of interest; based upon the test data used in this analysis, selection of FF = 3 or 4 provides a good detection result; “Ship size” in meters sets the minimum size of the detected ships;
Figure 27
5. Click on “Ship Detection” to initiate the detection process; the detection result is displayed as a bitmap image with ship targets as zero against a unity background ( ); if the result is unsatisfactory due to a lack of detections or too many false alarms, then click on “Reset” to adjust the parameters and/or re-select other areas of Interest, and run again;
Figure 28
6. If the detection result is satisfactory, then click on “Confirm Detection” to calculate the size, orientation, and shape of the detections ( ); a red ellipse is drawn around the detected ships ( and ) and details of the detected ships are displayed in the text window, which includes: sequence number, position (x, y), direction, size, and probability; the position is in terms of the pixel and line numbers of the image; the direction is the angle (in degrees) between the x-axis and the major axis of the ellipse; the probability is not currently implemented and is reserved for future use;
Figure 29Figure 30 Figure 31
7. Click on “Save Final Figure” to save the displayed bitmap image of detections; 8. Click on “Save Text File” to save detailed information on the detections in an ASCII format
text file.
DRDC Ottawa TM 2007-030 33
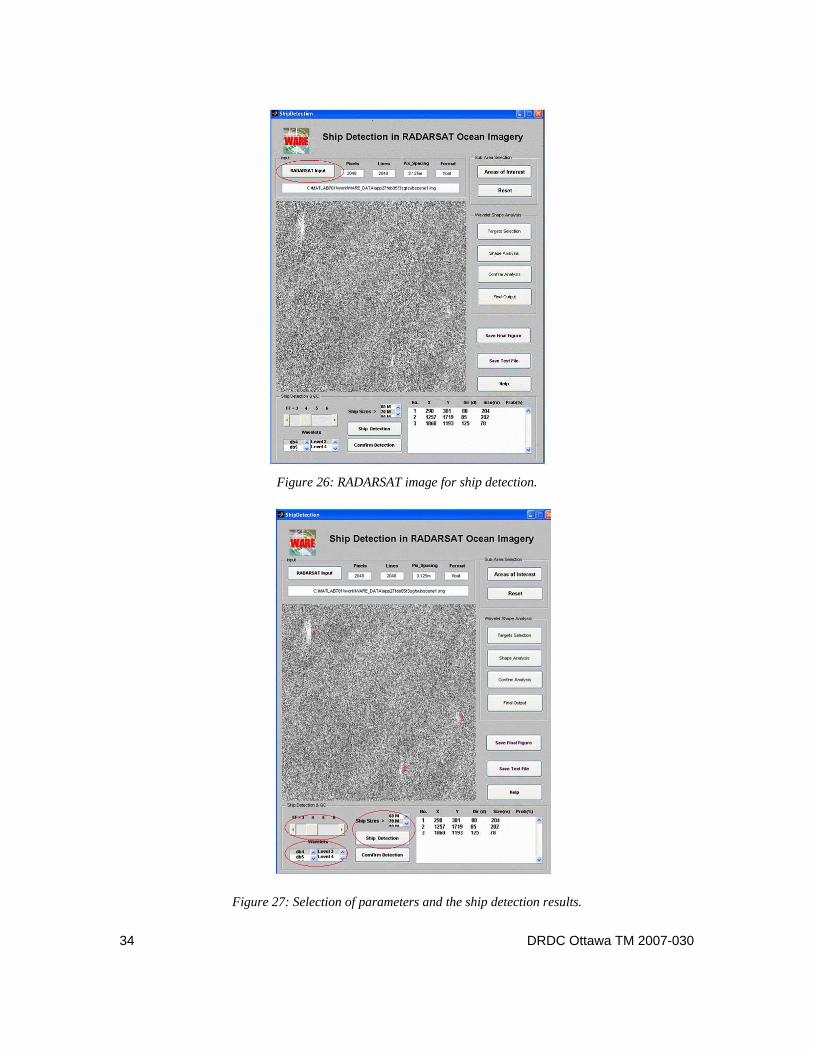
Figure 26: RADARSAT image for ship detection.
Figure 27: Selection of parameters and the ship detection results.
34 DRDC Ottawa TM 2007-030

Figure 28: Display of the bitmap product.
Figure 29: Estimation of location, size, and orientation of detected ships.
DRDC Ottawa TM 2007-030 35
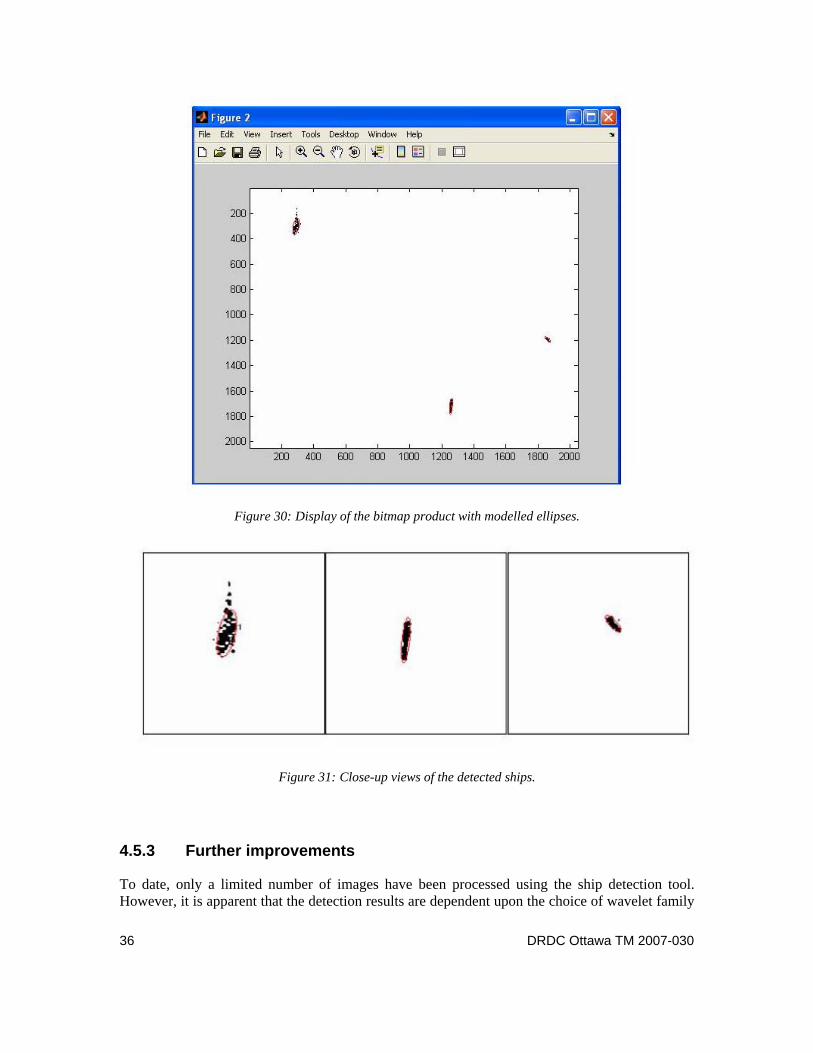
Figure 30: Display of the bitmap product with modelled ellipses.
Figure 31: Close-up views of the detected ships.
4.5.3 Further improvements
To date, only a limited number of images have been processed using the ship detection tool. However, it is apparent that the detection results are dependent upon the choice of wavelet family
36 DRDC Ottawa TM 2007-030
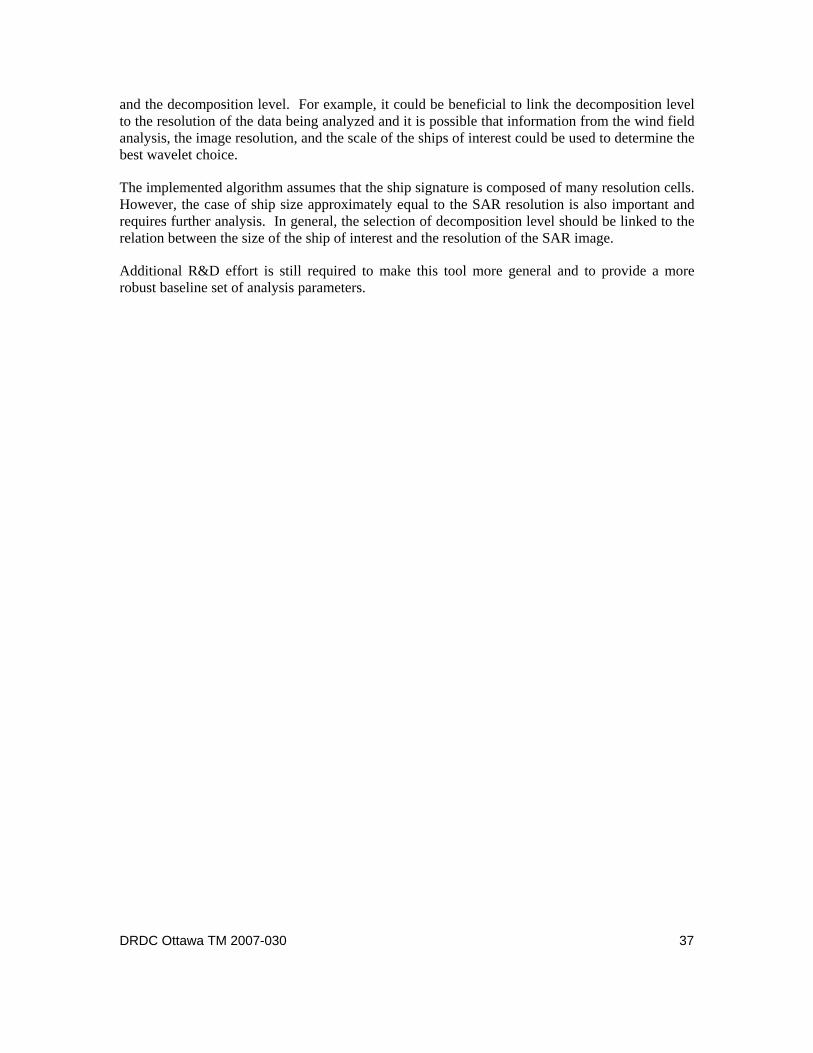
and the decomposition level. For example, it could be beneficial to link the decomposition level to the resolution of the data being analyzed and it is possible that information from the wind field analysis, the image resolution, and the scale of the ships of interest could be used to determine the best wavelet choice.
The implemented algorithm assumes that the ship signature is composed of many resolution cells. However, the case of ship size approximately equal to the SAR resolution is also important and requires further analysis. In general, the selection of decomposition level should be linked to the relation between the size of the ship of interest and the resolution of the SAR image.
Additional R&D effort is still required to make this tool more general and to provide a more robust baseline set of analysis parameters.
DRDC Ottawa TM 2007-030 37

5. R&D Topics
Based on experience with each existing WARE module described in Section 4, future WARE development could include the following improvements to all tools:
• Software Efficiency (i.e., calculation speed): More efficient throughput is always desirable.
• Interactive Validation: These tools could facilitate R&D into the selection of the wavelet family, decomposition level, and any required thresholds. Selection of the wavelet level could be carried out relative to the resolution of the RADARSAT image, the size of the target of interest, and the expected spatial structure of the features of interest. Front extraction, oil spill detection, and ship detection each require threshold selection, which depends upon histograms in the demonstration software. The threshold selection could be automated by using image segmentation algorithms.
• Automatic Options: This would involve the definition of a robust set of baseline analysis parameters for each tool.
• Radiometric Normalization: Wavelet analysis could be used to decompose the input image and remove the low frequency image component. The resulting image would be radiometrically flatter, but would locally retain the higher frequency components of interest. Such a radiometrically flattening procedure could be implemented as a routine pre-processing step for WARE.
• Land Masking: Tools are needed to exclude land from consideration. Land masking is a routine requirement for maritime surveillance software.
Often, the same RADARSAT image can be used to extract several different kinds of information, and sometimes several properties are needed at the same time to carry out a specific analysis. The WARE system could be modified to accept a single input image but provide several different outputs, as illustrated in Figure 32.
38 DRDC Ottawa TM 2007-030

Figure 32: Proposed WARE flowchart.
A promising R&D topic is the application of wavelet transforms to target edge outline and shape analysis. The various targets of interest each have their own characteristic shapes, which could be used to extract their properties and characteristics as part of the target detection and recognition process. Figure 33 shows four simple shapes: cross, circle, rectangle, and ellipse, and their edge outlines as derived from wavelet analysis. The shape could be used to recognize different target types. Furthermore, higher frequency components could be used to explore the relationship between the target and its neighbouring pixels.
The size of an object is important in ship detection. Wavelet packet analysis could be used to decompose the RADARSAT image to arbitrary pixel spacing. Figure 34 shows an example in which a RADARSAT image was decomposed into 16 layers with different frequency distributions (Figure 34c). Wavelet packet analysis can then be used to depict the relation of the pixel to its neighbours. Wavelet packet analysis might also be a unique approach to image segmentation, especially for single channel SAR data.
DRDC Ottawa TM 2007-030 39
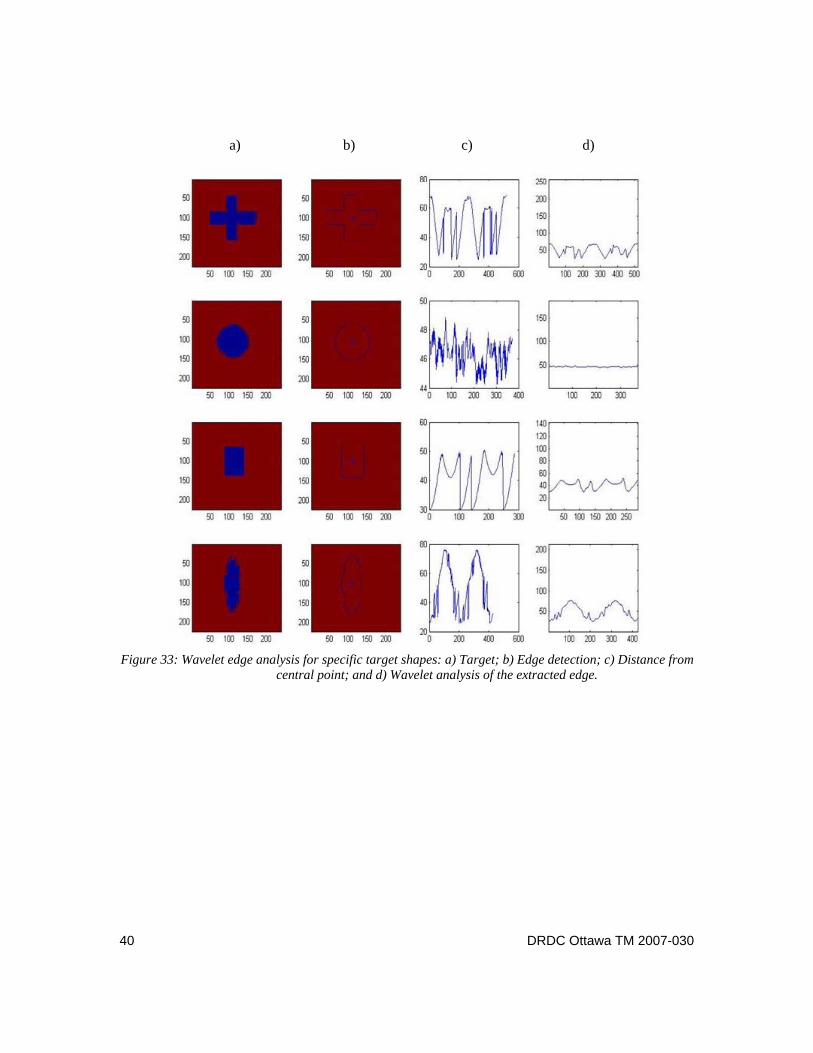
a) b) c) d)
Figure 33: Wavelet edge analysis for specific target shapes: a) Target; b) Edge detection; c) Distance from
central point; and d) Wavelet analysis of the extracted edge.
40 DRDC Ottawa TM 2007-030

a) b)
c) Figure 34: Example of wavelet packet decomposition of a RADARSAT image: a) Original Image; b)
Wavelet packet decomposition of the original image; and c) Fourier transform of each decomposition component.
Wavelet analysis combined with ANNs represents a potentially interesting combination of technologies. ANN statistical technology could be used to analyze image components that are decomposed using wavelet analysis, with the objective of classifying scale-dependent image features and reducing false alarms. This applies, in particular, to oil spill and ship target detection.
DRDC Ottawa TM 2007-030 41

6. Conclusions
We have presented demonstration software and proposed future developments for wavelet-based analysis of RADARSAT imagery for maritime surveillance applications. Wavelet analysis permits information extraction at multiple scales, which in turn permits adaptation to features and scales as actually observed in SAR imagery. Algorithms for estimation or detection of wind direction, atmospheric and oceanic fronts, oil spills, and ships have been proposed and implemented in the WARE demonstration software. The demonstration software and GUI were developed using Matlab™ and the Wavelet Toolbox. At this point, pre-processing software is required to re-format and prepare the SAR images for analysis using WARE.
The algorithms included in WARE have varying levels of maturity and capability; the wind direction estimation algorithm is thought to be ready for operationalization, but the fronts, oil spill, and ship algorithms require additional R&D. However, all of these algorithms illustrate the potential for using wavelet analysis to remove image noise and carry out analysis at a specific scale of interest. Wavelet analysis of SAR imagery for maritime surveillance applications is a new field of research and as such, further algorithm development is recommended; specific suggestions for R&D have been outlined in this document.
In the future, promising WARE algorithms could be implemented in more friendly architectures or systems, which would better support operational data formats and provide access to standard image manipulating tools for maritime surveillance with SAR data.
42 DRDC Ottawa TM 2007-030
References
[1] Annon. (1993). Special Issue: RADARSAT. Canadian Journal of Remote Sensing, 19(4): 277-396.
[2] Arvelyna Y., Oshima, M., Kristijono, A., and Guanawan, I. (2001). Auto segmentation of oil slick in RADARSAT SAR image data around Rupat Island, Malacca Strait, Proc. 22nd Asian Conference on Remote Sensing, November 2001, Singapore: 5-9.
[3] Boukharouba, S., Rebordao, J.M., and Wendel, P.L. (1985). An Amplitude Segmentation Method Based on the Distribution Function of an Image. Computer Vision, Graphics and Image processing, 29: 47-59.
[4] Bryll, R. (2000). Introduction to Wavelets. http://vislab.cs.vt.edu/~rbryll/wavelet-present.pdf (accessed 17 Jan. 2007).
[5] Castleman, K.R. (1996). Digital Image Processing, Prentice Hall, Upper Saddle River, New Jersey.
[6] Daubechies, I. (1988). Orthonormal bases of compactly supported wavelets, Communications in Pure and Applied Mathematics, 91: 909-996.
[7] Daubechies, I. (1992). Ten Lectures on Wavelets, The Society for Industrial and Applied Mathematics, 3600 University City Science Center, Philadelphia, Pennsylvania 19104-2688.
[8] Du, Y., and Vachon, P.W. (2003). Characterization of Hurricane Eyes in RADARSAT-1 SAR Images with Wavelet Analysis, Canadian Journal of Remote Sensing, 29(4): 491-498.
[9] Du, Y., Vachon, P.W., and van der Sanden, J.J. (2003). Satellite Image Fusion with Multi-scale Wavelet Analysis for Marine Application: Preserving Spatial Information and Minimizing Artifacts (PSIMA), Canadian Journal of Remote Sensing, 29(1): 14-23.
[10] Du, Y., Vachon, P.W., and Wolfe, J. (2002). Wind Direction Estimation from SAR Images of the Ocean Using Wavelet Analysis, Canadian Journal of Remote Sensing, 28(3): 498-509.
[11] El Zaart, A., Ziou, D., Bénié, G.B., Wang, S., and Jiang, Q. (1998). Oil Spill Detection in SAR Imagery, Technical Report 211, Université de Sherbrooke, Département de mathématiques et d'informatique.
[12] Gerling, T.W. (1986). Structure of the surface wind field from the Seasat SAR, Journal of Geophysical Research, 91(C2): 2308-2320.
[13] Goodman J.W. (1976). Some Fundamental Properties of Speckle, Journal of the Optical Society of America, 66(11): 1145-1150.
DRDC Ottawa TM 2007-030 43

[14] Horstmann, J., Koch, W., Lehner, S., and Tonboe, R. (2000). Wind retrieval over the ocean using synthetic aperture radar with C-band HH polarization, IEEE Transactions on Geoscience and Remote Sensing, 38(5): 2122-2131.
[15] Jackson, C.R., and Apel, J.R., editors (2004). Synthetic Aperture Radar Marine User’s Manual, US Department of Commerce, National Oceanic and Atmospheric Administration: 464 p.
[16] Lee, J.S. (1986). Speckle Suppression and Analysis for SAR Images, Optical Engineering, 25(5): 636-643.
[17] Levy, G. (2001). Boundary Layer Roll Statistics from SAR, Geophysical Research Letters, 28(10): 1993-1995.
[18] Lillesand, T.M., and Keiffer R.W. (1994). Remote Sensing and Image Interpretation, New York: Wiley and Sons. 750p.
[19] Liu, A.K., Peng, C.Y., and Chang, S.Y-S. (1997). Wavelet analysis of satellite images for Coastal Watch, IEEE Journal of Oceanic Engineering, 22: 9-17.
[20] Mallat, S.G. (1989). A theory for multiresolution signal decomposition: the wavelet representation, IEEE Transactions on Pattern Analysis and Machine Intelligence, 2: 674-693.
[21] Nicolier, E., Millon, G., and Baudrier, E. (2003). A wavelet filter criterion for an A-Priori evaluation of wavelet coding and denoising performance. In Proc. IEEE International Symposium on Signal Processing and its Applications, Paris, France, July, pp 475-478.
[22] Norris, J., and Secker J. (2003). Evaluation of two segmentation-based algorithms for automatic target detection in SAR imagery, DRDC Ottawa TR 2003-194, Defence R&D Canada – Ottawa: 71 pages.
[23] Obi, S., and Murata, M. (2003). Study on detection of information on the sea surface in SAR imagery, NEC Research & Development, 44(2): 165-169.
[24] Raney, R.K. (1971). Synthetic aperture radar and moving targets, IEEE Transactions on Aerospace and Electronic Systems, 7(3): 499-505.
[25] Sahoo, P.K., Soltani, S., Wong, A.K.C., and Chen, Y.C. (1988). A Survey of Thresholding Techniques, Computer Vision, Graphics and Image Processing, 41:233-260.
[26] Secker, J., Robson, M.A., and Vachon, P.W. (2006). Evaluation of eCognition and Feature Analyst for Assisted Target Recognition in SAR Imagery, DRDC Ottawa TR 2006-128, Defence R&D Canada – Ottawa: 159 pages.
[27] Solberg A., Storvik, G., Solberg, R., Volden, E. (1999). Automatic Detection of Oil Spills in ERS SAR Images, IEEE Transactions on Geoscience and Remote Sensing, 37(4): 1916-1924.
44 DRDC Ottawa TM 2007-030

[28] Thompson, D.R., and Beal, R.C. (2000). Mapping High-resolution wind fields using synthetic aperture radar, Johns Hopkins APL Technical Digest, 21(1): 58-67.
[29] Vachon, P.W., and Dobson, F.W. (1996). Validation of wind vector retrieval from ERS-1 SAR images over the ocean, The Global Atmosphere and Ocean System, 5: 177-187.
[30] Vachon, P.W., and Dobson, F.W. (2000). Wind retrieval from RADARSAT SAR images: Selection of a suitable C-band HH polarization wind retrieval model, Canadian Journal of Remote Sensing, 26(4): 306-313.
[31] Vachon, P.W., Campbell, J.W.M., Bjerkelund, C., Dobson, F.W., and Rey. M.T. (1997). Ship detection by the RADARSAT. SAR: Validation of detection model predictions, Canadian Journal of Remote Sensing, 23(1): 48-59.
[32] Wackerman, C.C., Rufenach, C.L., Shuchman, R.A., Johannessen, J.A., and Davidson, K.L. (1996). Wind vector retrieval using ERS-1 synthetic aperture radar imagery, IEEE Transactions on Geoscience and Remote Sensing, 34(6): 1343-1352.
DRDC Ottawa TM 2007-030 45

Annex A WARE Software Description
The WARE software and GUI was developed in Matlab™. The demo software can be run on any computer that has Matlab™ V7.0 or higher and the Matlab™ Wavelet Toolbox available. The WARE demo software set is stored in an archive (last updated on 21 February 2006) that consists of the following files:
• Examples.doc
• FrontExtraction_export.m
• fronts.jpg
• Help1.jpg
• oil-spill.jpg
• OilSpillDetection_export.m
• radarsat.jpg
• ReadMe.txt
• sar_satellite.jpg
• ShipDetection_export.m
• ships.jpg
• sun4.jpg
• WARElogoTar1.tif
• ware_export.m
• waveletbird.jpg
• windd_export.m
• WindField.jpg
The main GUI driver is initiated by executing “ware_export.m” and provides access to the four available sub-modules:
• windd_export.m: script to perform the wind field extraction;
• FrontExtraction_export.m: script to perform front extraction;
• OilSpillDetection_export.m: script to perform oil spill detection;
• ShipDetection_export.m: script to perform ship detection.
The Examples.doc file is a Word document that discusses how to use the WARE demo software via example. The remaining .jpg and .tif files are used by the GUI.
46 DRDC Ottawa TM 2007-030
List of acronyms
A Approximation, usually associated with a wavelet decomposition level ANN Artificial Neural Network ASCII American Standard Code for Information Interchange
AvStdM Average of the Standard deviations of the Mean cross section Bio Bi-orthogonal wavelet CEOS Committee on Earth Observation Satellites Coif Coiflets wavelet CWT Continuous Wavelet Transform D Diagonal, usually associated with a wavelet decomposition level db Daubechies wavelet DFT Discrete Fourier Transform DN Digital Number DND Department of National Defence DRDC Defence R&D Canada DWT Discrete Wavelet Transform FFT Fast Fourier Transform GUI Graphical User Interface H Horizontal HH Horizontal Transmit, Horizontal Receive polarization HP High Pass IA Pro Image Analyst Pro LUT Look-Up Table LP Low Pass Mexh Mexican Hat wavelet
MStdM Maximum of the Standard deviations of the Mean cross section R&D Research & Development SAR Synthetic Aperture Radar
StdM Standard deviation of the Mean cross section V Vertical VUSAR An extension of the XV image display system for displaying and analyzing
standard format SAR images WARE Wavelet Analysis for RADARSAT Exploitation
DRDC Ottawa TM 2007-030 47

This page intentionally left blank.
48 DRDC Ottawa TM 2007-030
Distribution list
Document No.: DRDC Ottawa TM 2007-030
LIST PART 1: Internal Distribution by Centre:4 Library DRDC Ottawa 1 Gary Geling 1 Paris Vachon 1 John Wolfe 1 Yong Du 1 Jeff Secker 1 Caroline Wilcox
10 TOTAL LIST PART 1
LIST PART 2: External Distribution by DRDKIM 1 DRDKIM 2 Library and Archives Canada 1 CISTI 1 LCol Jeff Howes, DPDOIS, Polar Epsilon 1 LCdr Robert Quinn, DJCP 1 LCdr Andy Samoluk, DJCP 1 Maj Peter Butler, DJCP 1 Jake Tunaley, DPDOIS, Polar Epsilon
9 TOTAL LIST PART 2
19 TOTAL COPIES REQUIRED
DRDC Ottawa TM 2007-030 49

50 DRDC Ottawa TM 2007-030
This page intentionally left blank.

DOCUMENT CONTROL DATA (Security classification of title, body of abstract and indexing annotation must be entered when the overall document is classified)
1. ORIGINATOR (The name and address of the organization preparing the document. Organizations for whom the document was prepared, e.g. Centre sponsoring a contractor's report, or tasking agency, are entered in section 8.) DRDC Ottawa 3701 Carling Avenue Ottawa, Ontario K1A 0Z4
2. SECURITY CLASSIFICATION (Overall security classification of the document
including special warning terms if applicable.) UNCLASSIFIED
3. TITLE (The complete document title as indicated on the title page. Its classification should be indicated by the appropriate abbreviation (S, C, R or U) in parentheses after the title.) Wavelet Analysis for RADARSAT Exploitation: Demonstration of Algorithms for Maritime Surveillance
4. AUTHORS (last name, followed by initials – ranks, titles, etc. not to be used) Vachon, P.W.; Wolfe, J.; Du, Y.
5. DATE OF PUBLICATION (Month and year of publication of document.) February 2007
6a. NO. OF PAGES (Total containing information, including Annexes, Appendices, etc.)
64
6b. NO. OF REFS (Total cited in document.) 32
7. DESCRIPTIVE NOTES (The category of the document, e.g. technical report, technical note or memorandum. If appropriate, enter the type of report, e.g. interim, progress, summary, annual or final. Give the inclusive dates when a specific reporting period is covered.) Technical Memorandum
8. SPONSORING ACTIVITY (The name of the department project office or laboratory sponsoring the research and development – include address.)
9a. PROJECT OR GRANT NO. (If appropriate, the applicable research
and development project or grant number under which the document was written. Please specify whether project or grant.) 15ec06-1
9b. CONTRACT NO. (If appropriate, the applicable number under which the document was written.)
10a. ORIGINATOR'S DOCUMENT NUMBER (The official document
number by which the document is identified by the originating activity. This number must be unique to this document.) DRDC Ottawa TM 2007-030
10b. OTHER DOCUMENT NO(s). (Any other numbers which may be assigned this document either by the originator or by the sponsor.)
11. DOCUMENT AVAILABILITY (Any limitations on further dissemination of the document, other than those imposed by security classification.)
(X) Unlimited distribution ( ) Defence departments and defence contractors; further distribution only as approved ( ) Defence departments and Canadian defence contractors; further distribution only as approved ( ) Government departments and agencies; further distribution only as approved ( ) Defence departments; further distribution only as approved ( ) Other (please specify):
12. DOCUMENT ANNOUNCEMENT (Any limitation to the bibliographic announcement of this document. This will normally correspond to the Document Availability (11). However, where further distribution (beyond the audience specified in (11) is possible, a wider announcement audience may be selected.))

13. ABSTRACT (A brief and factual summary of the document. It may also appear elsewhere in the body of the document itself. It is highly desirable that the abstract of classified documents be unclassified. Each paragraph of the abstract shall begin with an indication of the security classification of the information in the paragraph (unless the document itself is unclassified) represented as (S), (C), (R), or (U). It is not necessary to include here abstracts in both official languages unless the text is bilingual.)
This document reports on Wavelet Analysis for RADARSAT Exploitation (WARE), research software that aims to demonstrate the applications of wavelet analysis to RADARSAT ocean imagery. Wavelets are a mathematical paradigm that can be used to partition data into various frequency components, allowing the study of each component at a resolution matched to its scale. Wavelets are an efficient image processing tool for localized feature extraction and texture analysis. WARE tools have been developed using basic wavelet-based algorithms and include: (a) wind direction estimation; (b) oceanic or atmospheric front extraction; (c) oil spill detection; and (d) ship detection. WARE includes rudimentary interactive validation and has been applied to several RADARSAT ocean images that span the noted application areas. As such, the distinctive properties and advantages of wavelet analysis for target detection and recognition are demonstrated. In future, WARE could be extended to include radiometric flattening, improved algorithm efficiencies in anticipation of operationalization, and systematic testing of available wavelet families for improved algorithm performance. Le document décrit les outils d’analyse par ondelettes pour l’exploitation de RADARSAT (WARE), qui constituent un logiciel de recherche qui vise à démontrer les applications de l’analyse par ondelettes à l’imagerie océanique de RADARSAT. Les ondelettes sont un paradigme mathématique qui répartit les données en diverses composantes de fréquences, permettant ainsi d’étudier chaque composante avec une résolution qui correspond à son échelle. Les ondelettes constituent un outil efficace de traitement des images pour l’extraction de caractéristique localisée et l’analyse de texture. Les outils WARE ont été développés à partir d’algorithmes fondés sur les ondelettes et visent : (a) l’estimation de la direction du vent; (b) l’extraction des fronts océaniques ou atmosphériques; (c) la détection des déversements de pétrole; et (d) la détection des navires. Le logiciel WARE comprend un contrôle de qualité interactif rudimentaire et a servi à l’analyse de plusieurs images océaniques RADARSAT, qui relève des domaines d’applications notés. Ainsi, les propriétés et avantages distinctifs de l’analyse par ondelettes pour des fins de détection et de reconnaissance de cible sont démontrés. À l’avenir, le logiciel WARE pourrait également servir à l’aplatissement radiométrique, à l’amélioration du rendement d’algorithmes d’opérationalisation et à la vérification systématique des familles d’ondelettes disponibles pour l’amélioration du rendement des algorithmes.
14. KEYWORDS, DESCRIPTORS or IDENTIFIERS (Technically meaningful terms or short phrases that characterize a document and could be helpful in cataloguing the document. They should be selected so that no security classification is required. Identifiers, such as equipment model designation, trade name, military project code name, geographic location may also be included. If possible keywords should be selected from a published thesaurus, e.g. Thesaurus of Engineering and Scientific Terms (TEST) and that thesaurus identified. If it is not possible to select indexing terms which are Unclassified, the classification of each should be indicated as with the title.) RADARSAT, SAR, synthetic aperture radar, maritime surveillance, wavelet, wind direction, front detection, oil spill detection, ship detection

