waveguide-basedultrasonicandfar-field · pdf...
TRANSCRIPT

Waveguide-basedUltrasonicandFar-fieldElectromagnetic Sensors for DownholeReservoir Characterization
ANL-10/34
Nuclear Engineering Division
Availability of This ReportThis report is available, at no cost, at http://www.osti.gov/bridge. It is also available on paper to the U.S. Department of Energy and its contractors, for a processing fee, from: U.S. Department of Energy OfficeofScientificandTechnicalInformation P.O. Box 62 Oak Ridge, TN 37831-0062 phone (865) 576-8401 fax (865) 576-5728 [email protected]
DisclaimerThis report was prepared as an account of work sponsored by an agency of the United States Government. Neither the United States Governmentnoranyagencythereof,norUChicagoArgonne,LLC,noranyoftheiremployeesorofficers,makesanywarranty,expressor implied, or assumes any legal liability or responsibility for the accuracy, completeness, or usefulness of any information, apparatus, product,orprocessdisclosed,orrepresentsthatitsusewouldnotinfringeprivatelyownedrights.Referencehereintoanyspecific commercial product, process, or service by trade name, trademark, manufacturer, or otherwise, does not necessarily constitute or imply its endorsement, recommendation, or favoring by the United States Government or any agency thereof. The views and opinions of documentauthorsexpressedhereindonotnecessarilystateorreflectthoseoftheUnitedStatesGovernmentoranyagencythereof,Argonne National Laboratory, or UChicago Argonne, LLC.
About Argonne National Laboratory Argonne is a U.S. Department of Energy laboratory managed by UChicago Argonne, LLC under contract DE-AC02-06CH11357. The Laboratory’s main facility is outside Chicago, at 9700 South Cass Avenue, Argonne, Illinois 60439. For information about Argonne and its pioneering science and technology programs, see www.anl.gov.
Waveguide-basedUltrasonicandFar-fieldElectromagnetic Sensors for DownholeReservoir Characterization
ANL-10/34
prepared byS.H. Sheen, H.T. Chien, K. Wang, S. Liao, N. Gopalsami, S. Bakhtiari, and A.C. RaptisNuclear Engineering Division, Argonne National Laboratory
October 2010


Waveguide-‐based ultrasonic and far-‐field electromagnetic sensors for downhole reservoir characterization ANL-‐10/34
i
ABSTRACT
This report summarizes the first year research and development effort leading to development of high-‐temperature sensors for enhanced geothermal systems. It covers evaluation of ultrasonic and electromagnetic (EM) techniques applied to temperature measurement and flow characterization. On temperature measurement, we have evaluated both microwave radiometry and ultrasonic techniques for temperature gradient and profile measurements. Different antenna designs are evaluated and array loop antenna design is selected for further development. We have also evaluated ultrasonic techniques for total flow characterization, which includes using speed of sound to determine flow temperature, measuring acoustic impedance to estimate fluid density, and using cross-‐correlation technique to determine the mass flow rate. Method to estimate the flow enthalpy is briefly discussed. At end, the need and proposed techniques to characterize the porosity and permeability of a hot dry rock resource are presented.

Waveguide-‐based ultrasonic and far-‐field electromagnetic sensors for downhole reservoir characterization ANL-‐10/34
ii

Waveguide-‐based ultrasonic and far-‐field electromagnetic sensors for downhole reservoir characterization ANL-‐10/34
iii
Table of Contents
ABSTRACT................................................................................................................................ i List of Figures........................................................................................................................... iv List of Table............................................................................................................................... v 1 Introduction ........................................................................................................................... 1 2 Background............................................................................................................................ 2
2.1 Logging Tools ................................................................................................................ 3 2.2 Geothermal Logging ...................................................................................................... 6 2.3 Acoustic Geothermal Logging ....................................................................................... 9
3 Microwave Radiometer ....................................................................................................... 10 3.1 Fundamental................................................................................................................. 10 3.2 Antenna Selection ........................................................................................................ 12
4 Acoustic/Ultrasonic Sensors................................................................................................ 14 4.1 Flow Instruments.......................................................................................................... 14 4.2 Temperature Probe ....................................................................................................... 21 4.3 Prosity and permeability .............................................................................................. 23
5 Summary and Conclusions .................................................................................................. 24 REFERENCES......................................................................................................................... 25

Waveguide-‐based ultrasonic and far-‐field electromagnetic sensors for downhole reservoir characterization ANL-‐10/34
iv
LIST OF FIGURES
Figure 1. EGS cutaway diagram............................................................................................... 7 Figure 2. Array gain pattern, G(θ), for N = 1 to 10................................................................ 13 Figure 3. Schematic diagram of an ultrasonic cross-correlation flow instrument.................. 15 Figure 4. Laboratory setup for flow instrument tests ............................................................. 16 Figure 5. Difference in transit time of the acoustic signal at 24˚C and 43˚C water
temperature ........................................................................................................... 17 Figure 6. Calibration curve of temperature versus speed of sound in water................... 18 Figure 7. The reflected acoustic signals in water and in air .............................................. 19 Figure 8. Bubbles passing through the transducer pairs................................................... 20 Figure 9. The attenuation in signal intensity as the bubbles pass between
transducers ............................................................................................................ 20 Figure 10. Reflections from a bent probe for different probe temperatures ..................... 21 Figure 11. Time-‐of-‐flight changes, as a function of oil temperature, of reflections
from two sections of the bent probe.................................................................... 22 Figure 12. Effects of pressure on the ultrasonic temperature probe.................................. 23

Waveguide-‐based ultrasonic and far-‐field electromagnetic sensors for downhole reservoir characterization ANL-‐10/34
v
LIST OF TABLE
Table 1: Applications of Neutron Induced Gamma Spectroscopy..............................................4 Table 2: Acoustic Logs ...............................................................................................................5 Table 3: Characteristics of different antenna designs ...............................................................13

Waveguide-‐based ultrasonic and far-‐field electromagnetic sensors for downhole reservoir characterization ANL-‐10/34
1
1 Introduction This is the first-‐year annual report of the project under the B&R Code of EB4005020-‐05794-‐1004281. The report summarizes technical progress from November 2009 to September 2010. The objective of this project is to develop high-‐temperature (> 300°C) downhole instrumentations for enhanced geothermal systems. The project focuses on two sensor technologies: ultrasonic and far-‐field electromagnetic techniques. Use of sensors to establish applications in a high-‐temperature environment is the proposed engineering approach stressed in this project. It is well recognized that advanced downhole instrumentations are needed for reservoir characterization, especially in the areas of reservoir temperature profile and permeability, flow/rock interaction, and fluid flow enthalpy. Types of sensor and sensing technology addressed in this project include:
• Microwave radiometer for remote temperature profile measurement, • Ultrasonic waveguide for temperature profile measurement, • Ultrasonic flow instrument for flow rate, density and enthalpy measurements, • Passive acoustic sensor for flow/rock interaction and permeability
characterization. In this reporting period, we have conducted the following tasks:
• Knowledge capture report, • Microwave radiometer design evaluation, • Ultrasonic temperature probe development, • Ultrasonic flow instrument development.
Details of each area of development are presented in this report along with proposed future work.

Waveguide-‐based Ultrasonic and Far-‐field Electromagnetic Sensors for Downhole Reservoir Characterization ANL-‐10/34
2
2 Background Geothermal energy is an established form of alternative energy that is being harvested in many locations around the world. An almost limitless supply of energy is available from the core of the Earth, arising as hot spots near the surface, which can be utilized by geothermal power plants. It is estimated that the total heat flow over the surface of the Earth is approximately 4.4 x 10¹³ J/s, mainly as a result of the planet cooling and the decay products of radioactive rock. The traditional geothermal energy process is limited to natural convective hydrothermal sources, where water and porous rock are present in the necessary quantities. The water passes through the porous rock, absorbing the heat from the rock and then is pumped to an above ground steam electricity generator. The availability of water resource limits this traditional process. The Enhanced Geothermal System (EGS) creates artificial geothermal reservoirs and thus increases possible locations for geothermal power. A well is drilled into a suitable site and then developed through hydraulic stimulation [2]. The process uses pressurized water to fracture the rock, creating micro-‐fractures and porous surfaces, which increase the surface area for heat transfer. The water flows through the cracks and absorb the heat. The resulting hot water/steam mixture is then pumped to the surface and into the power generator. Studies have estimated that for the fluid entering the generator, at 200˚C, a mass flow rate of 80 kg/s is needed to attain economic viability for the reservoir [3]. A successful EGS needs reliable instrumentations to control the logging process and monitor the geothermal well/reservoir properties. Sensors to measure key EGS reservoir parameters, including directional temperature, pressure, fluid flow, and flow/rock interaction, are essential to the system performance. At present, EGS reservoir performance, as derived from reservoir geometry and permeability, contains significant uncertainties. In particular, the reservoir temperature gradients and flow rate of circulating fluid in an EGS reservoir are major unknowns. The current downhole logging tools and sensors are mainly those developed for gas and oil exploration, applied to an environment of relatively low temperature. The reservoir temperature of a geothermal well is typically higher than 300°C, which limits direct applications of the current gas/oil well instruments that can last only a brief period with heat shielding. In addition, oil/gas wells are located in predominately sedimentary formations while geothermal wells are more often located in hard crystalline rocks normally of volcanic origin. Therefore, high-‐temperature logging sensors for measuring temperature, pressure, flow, lithology, and other reservoir characteristics are needed in order to successfully develop and economically operate an EGS reservoir. We conducted literature search on downhole measurement technology and current research and development (R&D) activities in the areas of well logging and characterization. A knowledge capture report was generated; highlights of the report are summarized in this section.

Waveguide-‐based Ultrasonic and Far-‐field Electromagnetic Sensors for Downhole Reservoir Characterization ANL-‐10/34
3
2.1 Logging Tools
Downhole geophysical logging [4] has been developed to date mainly for oil/gas drilling. Along with, various sensors and measurement techniques have been developed for well characterization and monitoring of the well logging. In well logging the physical properties that need to be measured as a function of depth encompass electrical, nuclear, and acoustic properties. Methods to measure these properties are summarized as follows. Electrical Methods The borehole electrical properties are measured over a broad frequency range, from direct current to gigahertz. Most of the electrical logging tools operate within the frequency range of 35 Hz for focused resistivity and to 20 kHz for focused conductivity measurements. Higher frequency tools in gigahertz range have also been developed for dielectric measurement. The dielectric logs measure the phase shift and attenuation of an electromagnetic (EM) wave (e.g., millimeter wave) traveling in the formation. The phase shift derives the EM wave propagation time, which is directly related to the dielectric constant of the formation. Because the relative dielectric constant of water is much higher than other matrix materials, the phase shift measurement can be used to estimate the water-‐filled porosity. On other hand, the resistivity logs that measure the resistivity and conductivity of the formation can determine the porosity of the formation and salinity of the fluid. Nuclear Methods Nuclear logging tools utilize gamma and neutron sources to measure density and porosity of the downhole formation. In addition, one unique capability of nuclear logging is to perform elemental analysis. Commonly used nuclear logs are described as follows. Natural Gamma-ray logs measure the natural radioactivity. Potassium (40K), uranium and thorium are three principal radioactive elements in the Earth's crust that emit gamma rays of characteristic energies. The total flux of radiation can be used to identify potassium-‐rich rocks, shales among sedimentary rocks, and granitic composition among crystalline rocks. Spectral gamma-‐ray logging is carried out in practice by counting gamma rays in a number of predetermined energy windows. Relative abundances are determined by the inversion of these data. However, the inversion process is complicated by several factors: long counting time (because it needs to count daughter product emissions as well) and Compton scattering blurs the recorded spectra. In general, measurements of radioactivity can lead to some predictions, given below, of formation.
• Low concentrations of K, U, and Th indicate relatively clean limestone. • High K and Th and moderate U concentrations indicate shale. • Low Th but high U concentrations indicate the organic-‐rich (source -‐rock) shale.
Waveguide-‐based Ultrasonic and Far-‐field Electromagnetic Sensors for Downhole Reservoir Characterization ANL-‐10/34
4
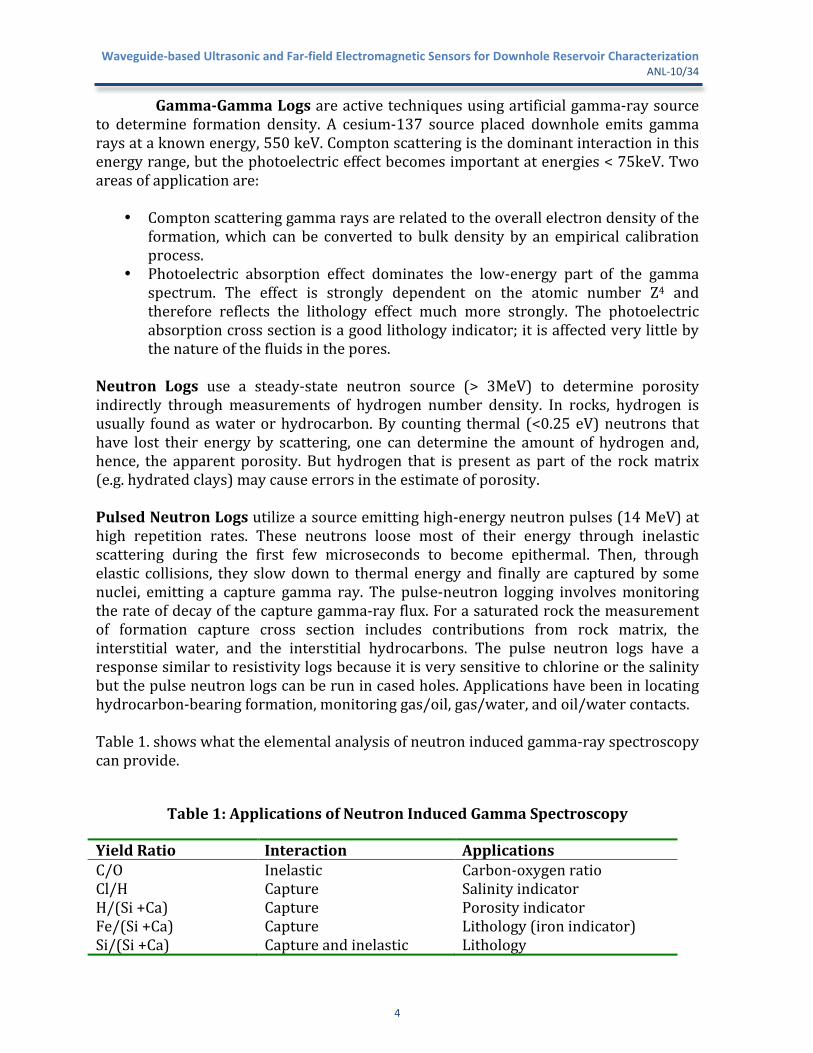
Gamma-Gamma Logs are active techniques using artificial gamma-‐ray source
to determine formation density. A cesium-‐137 source placed downhole emits gamma rays at a known energy, 550 keV. Compton scattering is the dominant interaction in this energy range, but the photoelectric effect becomes important at energies < 75keV. Two areas of application are:
• Compton scattering gamma rays are related to the overall electron density of the formation, which can be converted to bulk density by an empirical calibration process.
• Photoelectric absorption effect dominates the low-‐energy part of the gamma spectrum. The effect is strongly dependent on the atomic number Z4 and therefore reflects the lithology effect much more strongly. The photoelectric absorption cross section is a good lithology indicator; it is affected very little by the nature of the fluids in the pores.
Neutron Logs use a steady-‐state neutron source (> 3MeV) to determine porosity indirectly through measurements of hydrogen number density. In rocks, hydrogen is usually found as water or hydrocarbon. By counting thermal (<0.25 eV) neutrons that have lost their energy by scattering, one can determine the amount of hydrogen and, hence, the apparent porosity. But hydrogen that is present as part of the rock matrix (e.g. hydrated clays) may cause errors in the estimate of porosity.
Pulsed Neutron Logs utilize a source emitting high-‐energy neutron pulses (14 MeV) at high repetition rates. These neutrons loose most of their energy through inelastic scattering during the first few microseconds to become epithermal. Then, through elastic collisions, they slow down to thermal energy and finally are captured by some nuclei, emitting a capture gamma ray. The pulse-‐neutron logging involves monitoring the rate of decay of the capture gamma-‐ray flux. For a saturated rock the measurement of formation capture cross section includes contributions from rock matrix, the interstitial water, and the interstitial hydrocarbons. The pulse neutron logs have a response similar to resistivity logs because it is very sensitive to chlorine or the salinity but the pulse neutron logs can be run in cased holes. Applications have been in locating hydrocarbon-‐bearing formation, monitoring gas/oil, gas/water, and oil/water contacts. Table 1. shows what the elemental analysis of neutron induced gamma-‐ray spectroscopy can provide.
Table 1: Applications of Neutron Induced Gamma Spectroscopy
Yield Ratio Interaction Applications C/O Inelastic Carbon-‐oxygen ratio Cl/H Capture Salinity indicator H/(Si +Ca) Capture Porosity indicator Fe/(Si +Ca) Capture Lithology (iron indicator) Si/(Si +Ca) Capture and inelastic Lithology

Waveguide-‐based Ultrasonic and Far-‐field Electromagnetic Sensors for Downhole Reservoir Characterization ANL-‐10/34
5
Acoustic Methods Historically, the acoustic logs have been used to determine the compressional wave velocities as a function of depth. The velocity data are then used both for interpreting seismic reflection sections and for determining formation porosity. Table 2. lists the acoustic logs being employed.
Table 2: Acoustic Logs
Method Measure Acoustic Properties
Applications
Conventional acoustic Compressional wave velocity
Seismic velocity, porosity
Full-‐waveform acoustic Micro seismograms (waveforms)
Compressional and shear velocities, attenuations, lithology, porosity, permeability fractures
Bond logging High-‐frequency micro seismograms
Cement bond quality
The conventional acoustic logging tools contain one or two sources and a pair of receivers. Only the time delay of the compressional head-‐wave is recorded and the slowness calculated. The full-‐waveform acoustic logging tools record the entire micro seismogram digitally. In general, a full-‐waveform acoustic tool uses multiple sources and receivers with a longer (3-‐20 m) source/receiver separation. Vast amounts of information about the formation and the borehole are contained in full-‐waveform logs. Measured compressional and shear wave velocities (Vp and Vs) of the formation are of importance to the characterization of the borehole and the reservoir. Vs can be used to identify lithology and Vp/Vs to determine gas or water saturation. Analyses of the scattering and attenuations of full waveforms can lead to detection of fractures intersecting a borehole and the wave attenuation resulting from induced fluid flow between the borehole and formation can also be used to determine the formation permeability. The full-‐waveform acoustic logging technology has been expanded into acoustic imaging and characterization of the rock around a borehole. Fiber Optic Sensors Currently available fiber-‐optic sensors [5] can measure pressure, temperature, flow rate, phase fraction, strain, acoustic and sand production. Detection techniques are based on Fabry-‐Perot interferometric (FPI) FO sensing. There are intrinsic (IFPI) and extrinsic (EFPI) methods.
Waveguide-‐based Ultrasonic and Far-‐field Electromagnetic Sensors for Downhole Reservoir Characterization ANL-‐10/34
6
The fiber-‐optic sensing methods are also proposed for measuring void fraction
and the dispersed-‐phase velocity [6] of the geothermal logging process, which are the two essential factors required for calculation of flowing enthalpy. Advantages and disadvantages of fiber optic sensors are identified as follows. Advantages:
• Immune to electromagnetic interferences • Highly resistive to corrosion • Require no downhole electronics • High degree of multiplexibility • Continuous monitoring • Intrinsically safe • Without degradation up to 250°C • 5 – 10 years of lifetime
Disadvantages: • Point detection sensors • Questionable sensitivity and resolution • Interference between pressure and temperature measurements. • Expensive when a large number of sensors are required to measure vertical
temperature gradient [7] • Prevent borehole use for other purpose [8]
2.2 Geothermal Logging
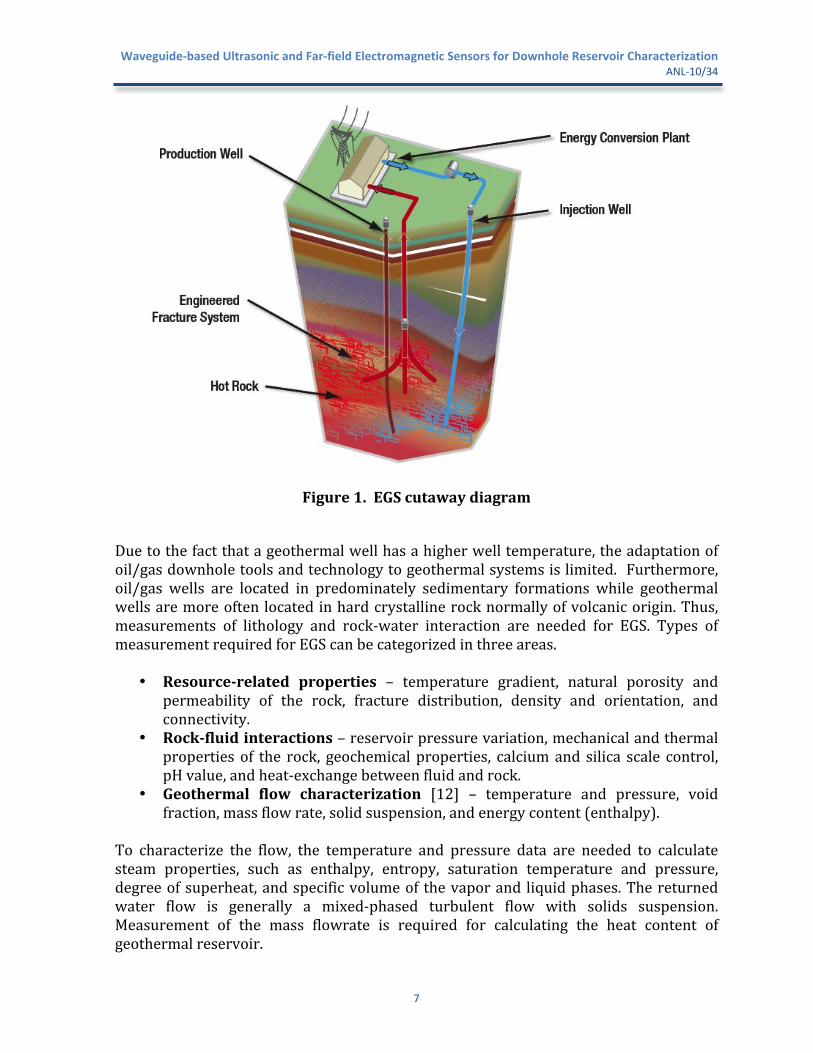
Figure 1 shows a cutaway diagram [9] of the enhanced geothermal systems (EGS). It consists of mainly cold-‐water injection wells and production wells extracting hot water. A typical EGS produces 5 MW or more of net electric power through a combination of temperature and flow rate [10]. The design and physical parameters of a typical EGS [11] are described as follows:
• Depth – few hundred feet to 12 k feet • Temperature – 200 to 315OC (180OC is considered minimal for electric power
generation) • Pressure – steam wells are < 200 psia and fluid dominated wells are < 10 kpsia • Diameter – 12 to 13 inches near surface and 6 to 12 inches at depth • Wells are corrosive containing CO2, H2S, chlorides, oxygen, and water
Waveguide-‐based Ultrasonic and Far-‐field Electromagnetic Sensors for Downhole Reservoir Characterization ANL-‐10/34
7
Figure 1. EGS cutaway diagram
Due to the fact that a geothermal well has a higher well temperature, the adaptation of oil/gas downhole tools and technology to geothermal systems is limited. Furthermore, oil/gas wells are located in predominately sedimentary formations while geothermal wells are more often located in hard crystalline rock normally of volcanic origin. Thus, measurements of lithology and rock-‐water interaction are needed for EGS. Types of measurement required for EGS can be categorized in three areas.
• Resource-related properties – temperature gradient, natural porosity and permeability of the rock, fracture distribution, density and orientation, and connectivity.
• Rock-fluid interactions – reservoir pressure variation, mechanical and thermal properties of the rock, geochemical properties, calcium and silica scale control, pH value, and heat-‐exchange between fluid and rock.
• Geothermal flow characterization [12] – temperature and pressure, void fraction, mass flow rate, solid suspension, and energy content (enthalpy).
To characterize the flow, the temperature and pressure data are needed to calculate steam properties, such as enthalpy, entropy, saturation temperature and pressure, degree of superheat, and specific volume of the vapor and liquid phases. The returned water flow is generally a mixed-‐phased turbulent flow with solids suspension. Measurement of the mass flowrate is required for calculating the heat content of geothermal reservoir.

Waveguide-‐based Ultrasonic and Far-‐field Electromagnetic Sensors for Downhole Reservoir Characterization ANL-‐10/34
8
Logging instruments that have been developed and applied to analysis of geothermal wells [13] are briefly described as follows. Pulse-code modulation telemetry instrument –The instrument is the central device of the multi-‐instrument, digital, production logging system that provides a bi-‐directional-‐cable/downhole-‐instrument interface. Continuous turbine spinner flowmeter – The instrument provides the fluid-‐flow rate data by monitoring the rotation and direction of a highly responsive turbine impeller. It may require use of various impellers and/or flow-‐restrictor for optimum results. Inherent problems: (a) requires maximum protection of the gear mechanism from produced solids and (b) the instrument accuracy depends on the fluid phase, linear response only for single-‐phase flow. Pressure and temperature instrument – Continuous wellbore pressure survey and geothermal temperature gradient measurement are essential to characterize the geothermal well. To maximize the measurement accuracy, the pressure measurement needs to be calibrated and compensated with temperature measurement. The temperature probe needs to be exposed directly to the wellbore environment with a minimum of metal in thermal contact yet with sufficient amount of mass to be structurally sound. In addition, borehole fluid temperatures were measured with a wire-‐line re-‐entry system [14]. The borehole temperature logs were used to quantify borehole fluid flow. The system consists of a MPL (marine physical laboratory) control vehicle and a borehole-‐logging tool. The logging tool is composed of pressure and platinum resistance temperature sensors. Another branch of emerging instruments is the chemical geothermometer [15] that relates the fluid chemistry and reservoir temperature. Geothermometers are subsurface temperature indicators derived from temperature-‐dependent geochemical and/or isotopic composition of hot spring waters and other geothermal fluids under certain favorable conditions. Geothermometers being developed are described as follows.
• Na-K geothermometers – The Na/K ratio decreases with an increase in temperature. An empirical equation for the reservoir temperature is given by θ (°C) = 1217 /[log(Na/K) + 1.483] -‐273.15. But it fails at T<120C and gives high temperatures for solutions with high Ca contents. Na and K are in ppm.
• Na-K-Ca geothermometers – The empirical equation relating reservoir
temperature with Na, K, and Ca contents is
β = 4/3 for Ca waters and θ < 100°C, β = 1/3 for Na waters and θ > 100 °C.
!
"(oK) =1647 / log Na /K( ) + # log Ca /Na + 2.06( ) + 2.47[ ]
Waveguide-‐based Ultrasonic and Far-‐field Electromagnetic Sensors for Downhole Reservoir Characterization ANL-‐10/34
9
• Silica geothermometers , and • Isotope geothermometers—Isotope exchange of 18O between sulfate and water
can be used as subsurface temperature indicators.
2.3 Acoustic Geothermal Logging In this section, we review and summarize various acoustic methods being used or proposed for geothermal logging. Types of acoustic log source fall into three categories: monopole, dipole, and quadruple [16].
• Monopole sources are axisymmetric or radially symmetric sources emitting compressional sonic log. The monopole source also generates a shear wave on the borehole surface in the fast formation (A fast formation is a rock in which the shear velocity is faster than the compressional velocity of the fluid in the borehole), called pseudo-‐Rayleigh wave. Stoneley waves can also be generated; the low frequency component is called the tube wave.
• Dipole sources called asymmetric sources emit energy along a single direction instead of radially. They generate a strong shear wave in both slow and fast formations, called flexural or bender wave traveling on the borehole wall.
• Quadruple sources generate asymmetric pressure waves called screw waves. Types of sound wave that travel in rocks near a borehole have been theoretically predicted [17]. Assuming the formation is homogeneous and isotropic, the 2D monopole source generates three wavefronts: a reflected wavefront at speed of Vm, compressional P-‐ and shear S-‐ waves at speeds of Vp and Vs. In a hard formation, Vp>Vs>Vm. When the angle of the refraction in the formation equals 900, a head wave is created, there are P-‐ and S-‐ head waves. After the P and S head waves, the next waves to arrive at the receivers from a monopole source are the direct and reflected mud waves. The last arrivals from a monopole source are interface, or surface waves. In general, Stoneley waves refer to waves propagating at the interface between two solids or a solid and a liquid. The decay of Stoneley-‐wave amplitude with distance from the interface is also frequency –dependent. However at low frequencies –wavelengths are comparable to the borhole diameter—the Stoneley wave decays very little. The low-‐frequency Stoneley wave is sensitive to formation permeability. Acoustic methods have also been applied to estimation of suspended sediment concentration [1] and to detection of the structure and physicomechanical properties of porous materials [18]. The method to estimate the sediment concentration is based on measurement of intensity of acoustically backscattering signals. By measuring propagation velocity and elastic wave damping factors, it is possible to determine the parameters such as elasticity, porosity, defectiveness, structural element size, anisotropy, and inhomogeneity. Use of acoustic waveguide for stress [19] and pressure [20] measurements in soil has also been reported. A steel-‐rod waveguide of 5 mm in

Waveguide-‐based Ultrasonic and Far-‐field Electromagnetic Sensors for Downhole Reservoir Characterization ANL-‐10/34
10
diameter and 500 mm in length, excited by acoustic waves with a frequency
changeable from 5 to 50 kHz was used to monitor the pressure in soil. Pressure measurement was achieved by analyzing the amplitude variation over the applied frequency. Results show that as the pressure rises, resonance frequencies drift steadily toward the region of higher values, the neighboring maxima diverge, and attenuation increases.
3 Microwave Radiometer Microwave radiometry is a well-‐established passive technique for remote temperature sensing [21]. With narrow-‐band filtering, it can also provide chemical analysis. The basic principle of microwave radiometry is based on Planck’s black body radiation from the probing materials. In drilling a geothermal well, it is desirable to know the right direction to drill, the direction towards the hot reservoir. To date, such a temperature sensor for in-‐situ reservoir temperature profile measurement is not readily available. We are conducting a feasibility study to evaluate the microwave radiometry technique for downhole applications. The key challenge of this technique is the antenna design that can sustain the harsh environment and provide remote sensing of reservoir temperature with sensitivity and directivity.
3.1 Fundamental A microwave radiometer is a passive temperature sensor that detects electromagnetic radiation from the probing object. The power radiated from the object at temperature T follows the Planck’s black body formula that at Rayleigh-‐Jeans limit has the simple expression,
, (1)
where Bν (T) is the power per unit area, k is the Boltzmann constant, and λ is the wavelength. The black body radiation experiences attenuation due to both free space attenuation and absorption by the propagating medium, which can be described by Friis formula,
, (2)
where Asource and Ae are the areas of heat source and effective antenna, respectively, l is the absorption length in the medium, and r is the distance of antenna from the source. The effective antenna area is linearly dependent on the gain, G,
€
Ae =λ2
4πG (3)
!
Bv(T) "
2kT
#2
!
Pv(T) = A
eAsource
Bv(T)
exp("r /!)
4#r2
Waveguide-‐based Ultrasonic and Far-‐field Electromagnetic Sensors for Downhole Reservoir Characterization ANL-‐10/34
11
Substituting Eq. (1) and Eq. (3) into Eq. (2) gives
(4)
Eq. (4) simply says that the detected power doesn’t depend on frequency rather it depends linearly on the antenna gain G. Including the antenna bandwidth, B, the total detected power is given by (5)
To estimate the detection sensitivity of a microwave radiometer depends on the total noise temperature TN the antenna bandwidth B and the total integral time τ. At TN, the noise level, N can be estimated from
(6)
The ratio of P(T) and N(TN) represents the signal-‐to-‐noise ratio (SNR) given as
€
SNR =GA Bτ T exp(−r /l)8TNπ
2r2 [7]
From Eq. (7), we see that for a given temperature T and noise temperature TN of the object, the SNR is linearly proportional to the antenna gain and square-‐root dependent on the antenna bandwidth. By setting SNR = 1, the expected detection sensitivity (minimum detectable temperature) of the microwave radiometer is given by
(8)
Based on Eq. (8) a broadband high-‐gain antenna with a large effective antenna area will be the optimal choice. The desirable antenna choice is a broadband high-‐gain helix antenna that operates in a frequency range from 460 MHz to 900 MHz (B = 440 MHz). Such an antenna working in axial mode has a gain of 25 (14 dBi). With r = 10 m, integrating time τ = 1 s, and TN = 2500K [22], the estimated sensitivity calculated by Eq. (8) gives Tmin = 50K.
!
Pv(T) = kTGA
source
exp("r /!)
8# 2r2
!
P(T) = BPv(T)
!
N(TN) = kT
N
B
"
!
Tmin =8" 2
r2TN
GAsource
B# exp($r /!)
Waveguide-‐based Ultrasonic and Far-‐field Electromagnetic Sensors for Downhole Reservoir Characterization ANL-‐10/34
12
3.2 Antenna Selection
Table 3 lists characteristics of three viable antenna designs, in which helix and conical spiral antennae are single antenna design. To reduce the horizontal antenna size for realistic downhole application, we evaluate the array loop antenna design. A small loop antenna has a gain of
€
Gloop (θ )∝ sin(θ )2 , (9)
where θ is the beam diversion angle. The benefit of the loop antenna is its small size but the antenna gain is reduced. However, an array of loop antenna can be used to increase the gain. The total radiation pattern of an array loop antenna is the product of the single loop antenna radiation pattern, Gloop(θ) and an array factor AF(θ), given as
€
G(θ)∝Gloop (θ) × AF(θ ) 2 (10) Giving an N-‐element array with spacing of , the array factor can be given as
€
AF(θ ) = A0 e jknd cosθ
n=0
N −1
∑ = A0sin(N2 kdcosθ )sin(12 kdcosθ )
e j N2 kd cosθ , (11)
where k is the wave number and A0 is a constant. AF(θ)= NA0 when θ = 90°. Combining Eqs. (9) and (11), the total array gain pattern is given by
€
G(θ) = sinθ sin(N2 kdcosθ)
sin( 12 kdcosθ)
2
(12)
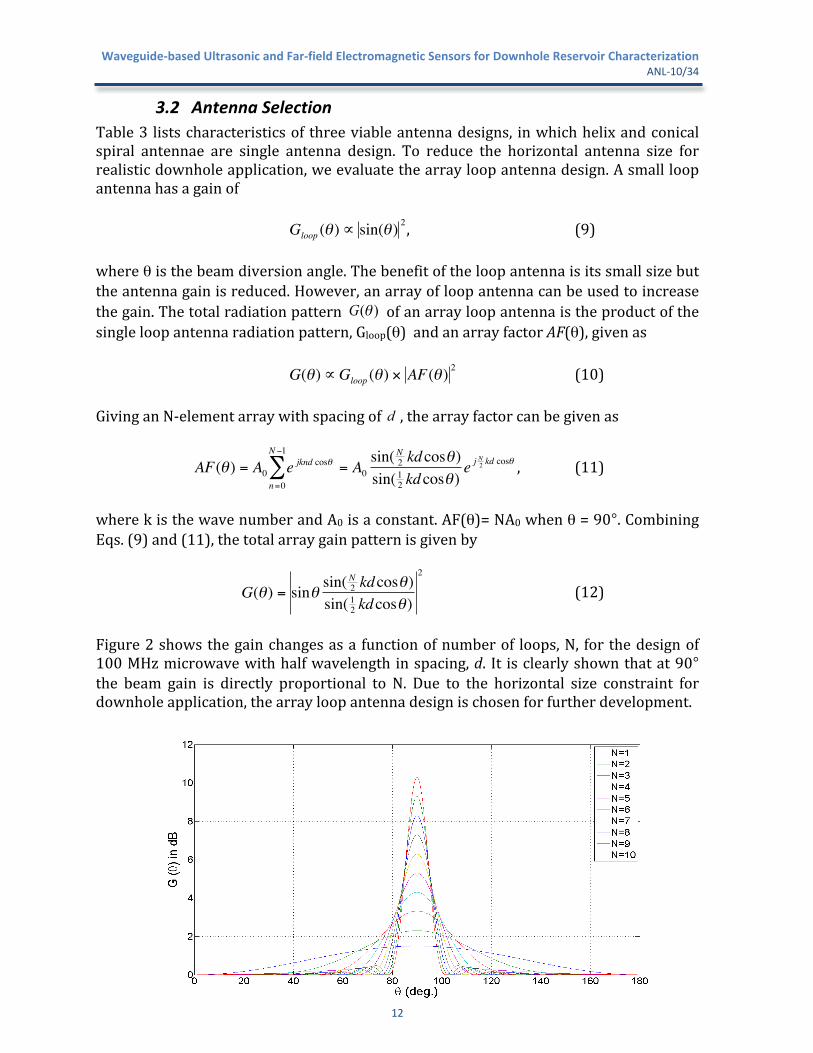
Figure 2 shows the gain changes as a function of number of loops, N, for the design of 100 MHz microwave with half wavelength in spacing, d. It is clearly shown that at 90° the beam gain is directly proportional to N. Due to the horizontal size constraint for downhole application, the array loop antenna design is chosen for further development.

Waveguide-‐based Ultrasonic and Far-‐field Electromagnetic Sensors for Downhole Reservoir Characterization ANL-‐10/34
13
Figure 2. Array gain pattern, G(θ), for N = 1 to 10
Table 3: Characteristics of different antenna designs
Waveguide-‐based Ultrasonic and Far-‐field Electromagnetic Sensors for Downhole Reservoir Characterization ANL-‐10/34
14
4 Acoustic/Ultrasonic Sensors For better understanding of a geothermal reservoir, the essential parameters that need to be determined are temperature gradient, rock formation, porosity and permeability, and flow-‐rock interaction. To date, limited measurement techniques have been developed for reservoir characterization and downhole sensors and instrumentations for in-‐situ measurement are even scarce. In this section, we explore the feasibility of using acoustic/ultrasonic (AU) techniques to measure the reservoir parameters. Initially, we target at flow characterization, temperature gradient measurement, and prediction of porosity and permeability. The flow characterization involves measurements of flow rate, fluid density, solid concentration, and heat content, which may lead to development of an ultrasonic enthalpy meter. An ultrasonic temperature probe for temperature gradient measurement will be evaluated. And at end ,we will examine the feasibility, in principle, of relating flow-‐induced acoustic noise with porosity and permeability.
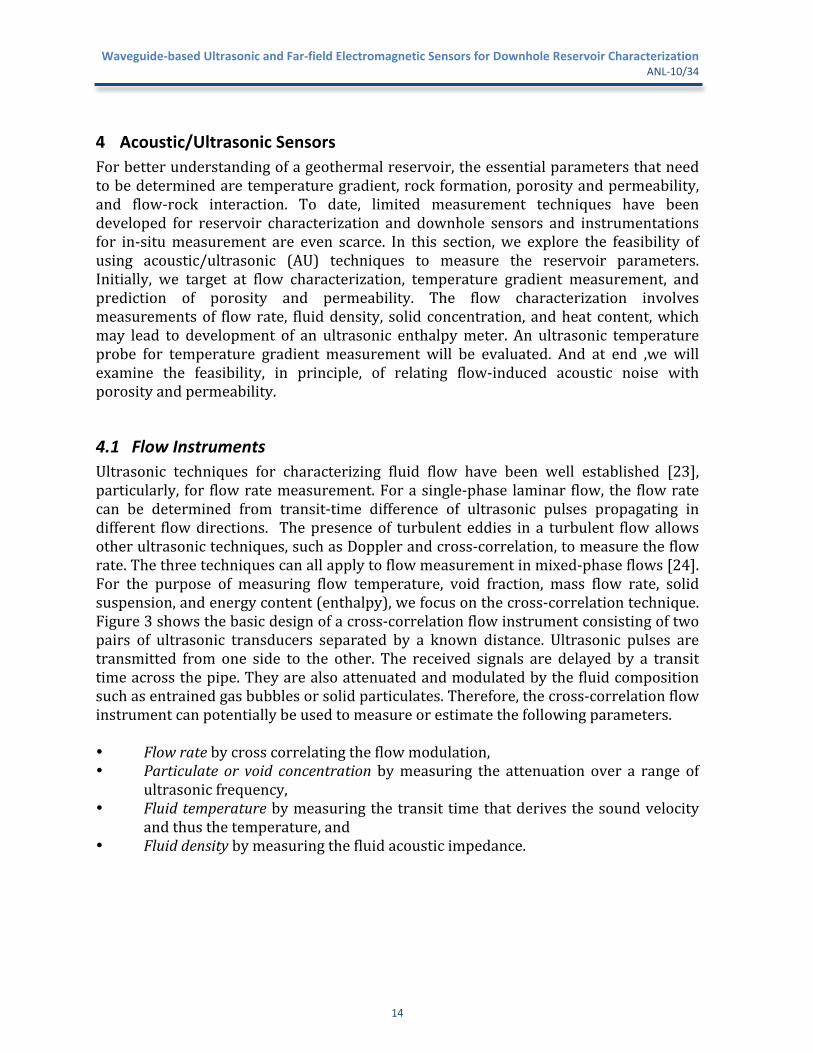
4.1 Flow Instruments Ultrasonic techniques for characterizing fluid flow have been well established [23], particularly, for flow rate measurement. For a single-‐phase laminar flow, the flow rate can be determined from transit-‐time difference of ultrasonic pulses propagating in different flow directions. The presence of turbulent eddies in a turbulent flow allows other ultrasonic techniques, such as Doppler and cross-‐correlation, to measure the flow rate. The three techniques can all apply to flow measurement in mixed-‐phase flows [24]. For the purpose of measuring flow temperature, void fraction, mass flow rate, solid suspension, and energy content (enthalpy), we focus on the cross-‐correlation technique. Figure 3 shows the basic design of a cross-‐correlation flow instrument consisting of two pairs of ultrasonic transducers separated by a known distance. Ultrasonic pulses are transmitted from one side to the other. The received signals are delayed by a transit time across the pipe. They are also attenuated and modulated by the fluid composition such as entrained gas bubbles or solid particulates. Therefore, the cross-‐correlation flow instrument can potentially be used to measure or estimate the following parameters. • Flow rate by cross correlating the flow modulation, • Particulate or void concentration by measuring the attenuation over a range of
ultrasonic frequency, • Fluid temperature by measuring the transit time that derives the sound velocity
and thus the temperature, and • Fluid density by measuring the fluid acoustic impedance.
Waveguide-‐based Ultrasonic and Far-‐field Electromagnetic Sensors for Downhole Reservoir Characterization ANL-‐10/34
15
Figure 3. Schematic diagram of an ultrasonic cross-correlation flow instrument
Acoustic impedance of a fluid, ZF, is defined as ZF = ρVS, where ρ is the fluid density and VS is the acoustic velocity in the fluid. In practice, the ultrasonic transducer is typically mounted on a metallic waveguide to isolate the transducer from potentially high-‐temperature fluid. Since the acoustic impedance of the waveguide, ZW, is much greater than that of fluid, only small portion of the acoustic energy transmits into the fluid, which can be estimated from
€
It = I0ZW − ZF
ZW + ZF
, (13)
where It and I0 are the acoustic intensity transmitted to the fluid and the total acoustic intensity, respectively. I0 is normally determined from the signal reflected from the waveguide-‐air interface. Based on Eq. (13), the fluid density can be determined according to
€
ρ =1−α1+α
ρWVWVS
, (14)
where α=It/I0, ρW and VW are density and acoustic velocity of the waveguide. For mixed-‐phase flows, however, the fluid density determined from Eq. (14) represents the fluid in the boundary layer, which is related to the total density, ρT, by
€
ρT = ρ(1−C) + ρSC , (15)
t1
t2
Δt
A
B

Waveguide-‐based Ultrasonic and Far-‐field Electromagnetic Sensors for Downhole Reservoir Characterization ANL-‐10/34
16
where ρS is the density of the second phase (particulates or gas bubbles) and C
the second phase concentration that may be estimated from attenuation measurement. Finally, the mass flow rate, M, and the additional heat content, H, over the ambient flow conditions can be estimated from
€
M = πr2V ρ(1−C) + ρSC[ ] (16)
€
H = πr2V ρ(1−C)CP + ρSCCPS[ ]ΔT (17)
where C is the second phase concentration, r the flow pipe radius, and CP, CPS are heat capacity of fluid and the second phase. ΔT = Tf -‐ T0 (Tf the fluid temperature, T0 the ambient temperature). To determine M and H, the proposed ultrasonic instrument needs to measure V, ρ, C, and Tf. If we assume the second phase is mainly water vapor, ρs can be derived from temperature and pressure measurements.
Figure 4. Laboratory setup for flow instrument tests
Figure 4 shows the laboratory setup for evaluating the ultrasonic flow instrument. The flow channel is made of an acrylic pipe of 5.5 cm in inside diameter, to which two pairs of 1 MHz piezoelectric transducers with aluminum waveguides, separated by 10.3 cm, are mounted with the waveguide surfaces flush to the inner pipe wall.
Waveguide-‐based Ultrasonic and Far-‐field Electromagnetic Sensors for Downhole Reservoir Characterization ANL-‐10/34
17
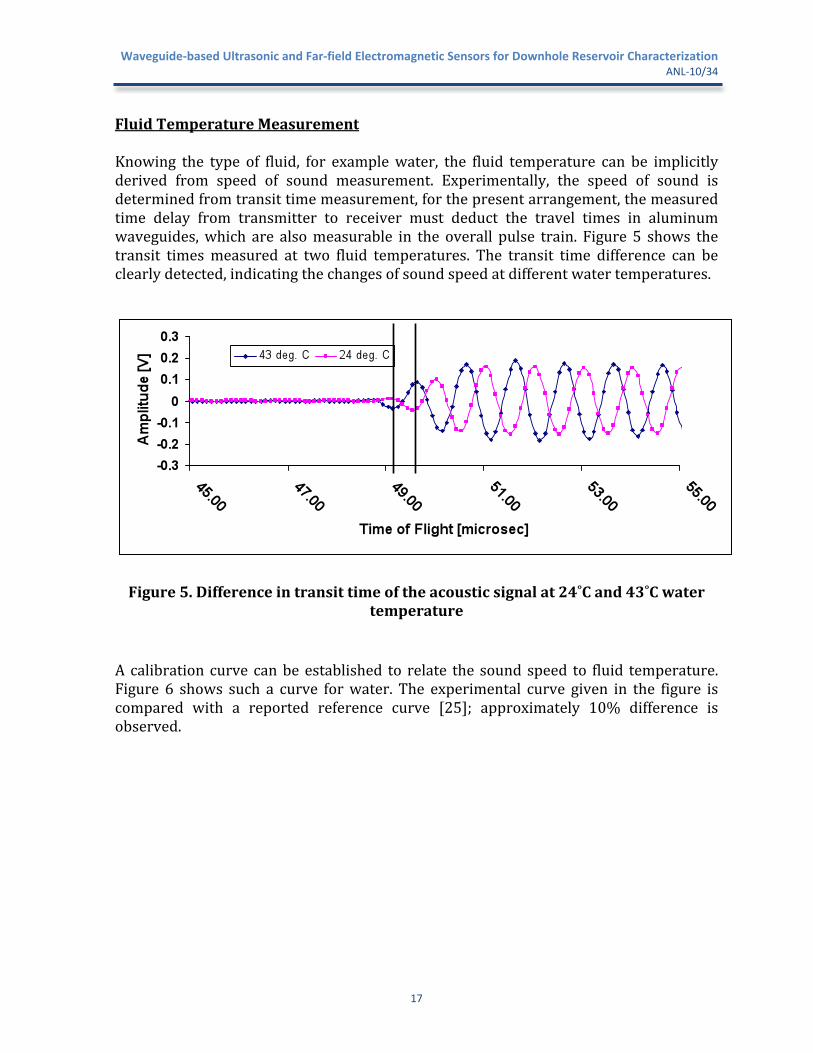
Fluid Temperature Measurement Knowing the type of fluid, for example water, the fluid temperature can be implicitly derived from speed of sound measurement. Experimentally, the speed of sound is determined from transit time measurement, for the present arrangement, the measured time delay from transmitter to receiver must deduct the travel times in aluminum waveguides, which are also measurable in the overall pulse train. Figure 5 shows the transit times measured at two fluid temperatures. The transit time difference can be clearly detected, indicating the changes of sound speed at different water temperatures.
Figure 5. Difference in transit time of the acoustic signal at 24˚C and 43˚C water temperature
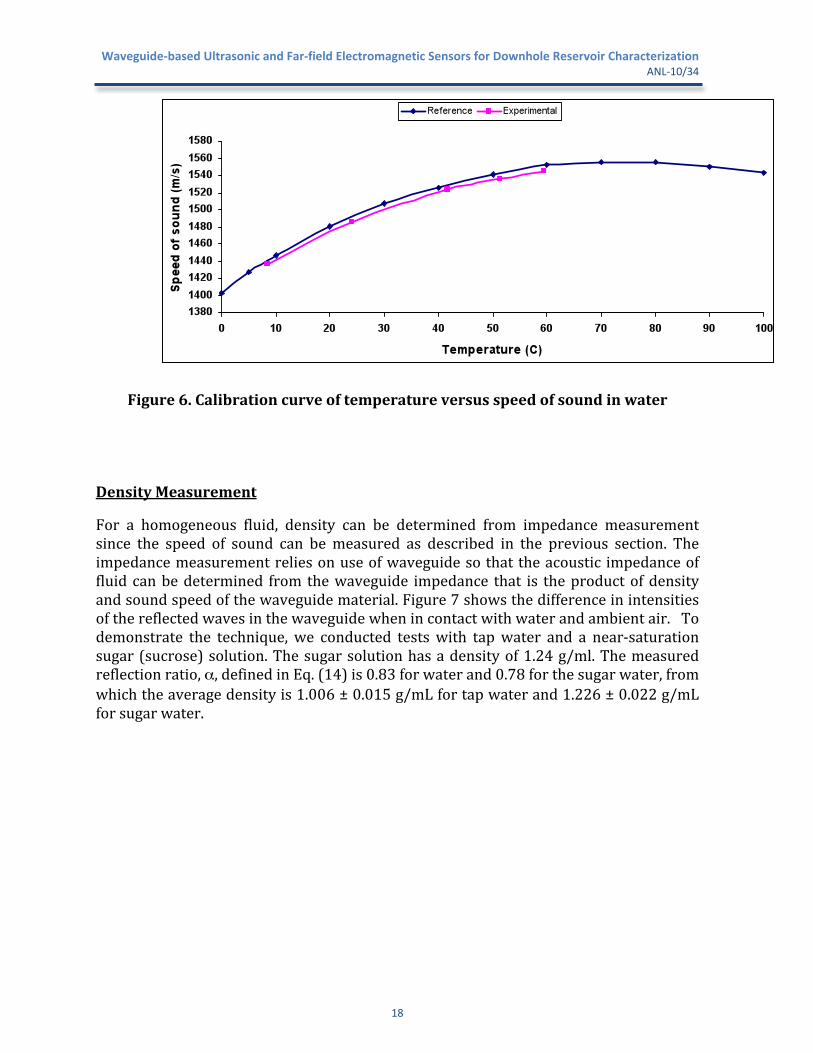
A calibration curve can be established to relate the sound speed to fluid temperature. Figure 6 shows such a curve for water. The experimental curve given in the figure is compared with a reported reference curve [25]; approximately 10% difference is observed.
Waveguide-‐based Ultrasonic and Far-‐field Electromagnetic Sensors for Downhole Reservoir Characterization ANL-‐10/34
18
Figure 6. Calibration curve of temperature versus speed of sound in water
Density Measurement
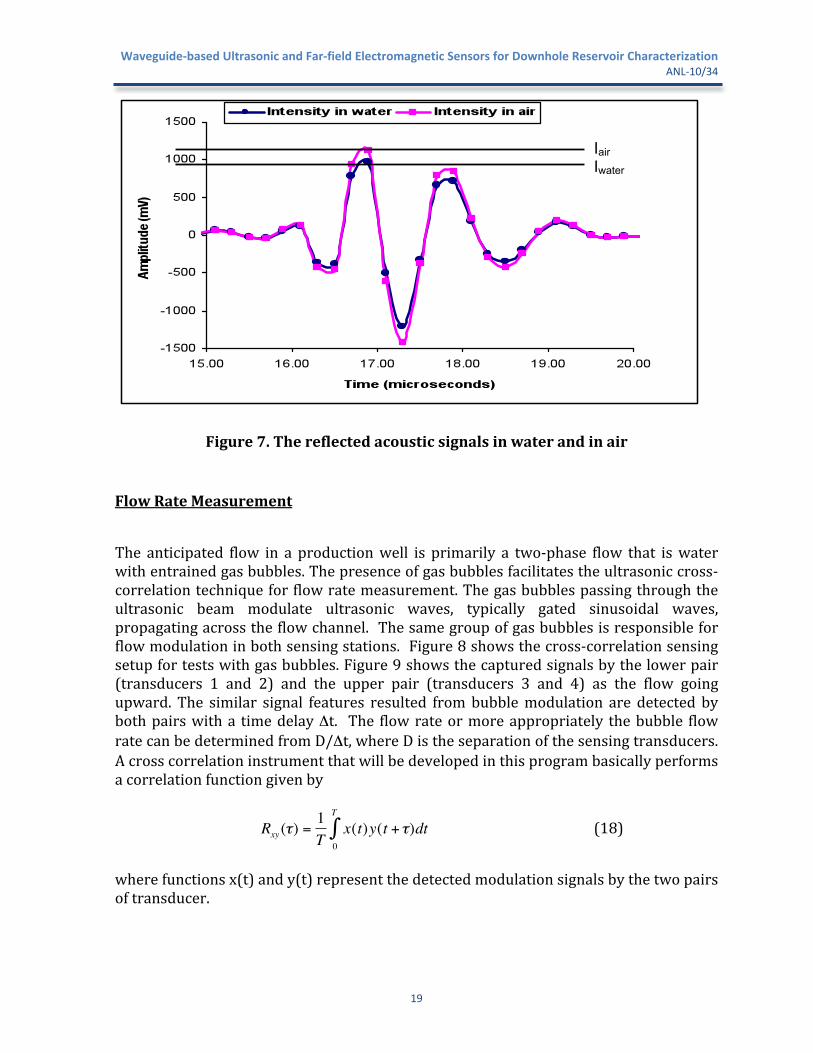
For a homogeneous fluid, density can be determined from impedance measurement since the speed of sound can be measured as described in the previous section. The impedance measurement relies on use of waveguide so that the acoustic impedance of fluid can be determined from the waveguide impedance that is the product of density and sound speed of the waveguide material. Figure 7 shows the difference in intensities of the reflected waves in the waveguide when in contact with water and ambient air. To demonstrate the technique, we conducted tests with tap water and a near-‐saturation sugar (sucrose) solution. The sugar solution has a density of 1.24 g/ml. The measured reflection ratio, α, defined in Eq. (14) is 0.83 for water and 0.78 for the sugar water, from which the average density is 1.006 ± 0.015 g/mL for tap water and 1.226 ± 0.022 g/mL for sugar water.
Waveguide-‐based Ultrasonic and Far-‐field Electromagnetic Sensors for Downhole Reservoir Characterization ANL-‐10/34
19
Figure 7. The reflected acoustic signals in water and in air
Flow Rate Measurement
The anticipated flow in a production well is primarily a two-‐phase flow that is water with entrained gas bubbles. The presence of gas bubbles facilitates the ultrasonic cross-‐correlation technique for flow rate measurement. The gas bubbles passing through the ultrasonic beam modulate ultrasonic waves, typically gated sinusoidal waves, propagating across the flow channel. The same group of gas bubbles is responsible for flow modulation in both sensing stations. Figure 8 shows the cross-‐correlation sensing setup for tests with gas bubbles. Figure 9 shows the captured signals by the lower pair (transducers 1 and 2) and the upper pair (transducers 3 and 4) as the flow going upward. The similar signal features resulted from bubble modulation are detected by both pairs with a time delay Δt. The flow rate or more appropriately the bubble flow rate can be determined from D/Δt, where D is the separation of the sensing transducers. A cross correlation instrument that will be developed in this program basically performs a correlation function given by
€
Rxy (τ) =1T
x(t)y(t +τ)dt0
T
∫ (18)
where functions x(t) and y(t) represent the detected modulation signals by the two pairs of transducer.
Iair Iwater

Waveguide-‐based Ultrasonic and Far-‐field Electromagnetic Sensors for Downhole Reservoir Characterization ANL-‐10/34
20
Figure 8. Bubbles passing through the transducer pairs
Figure 9. The attenuation in signal intensity as the bubbles pass between transducers
Δt

Waveguide-‐based Ultrasonic and Far-‐field Electromagnetic Sensors for Downhole Reservoir Characterization ANL-‐10/34
21
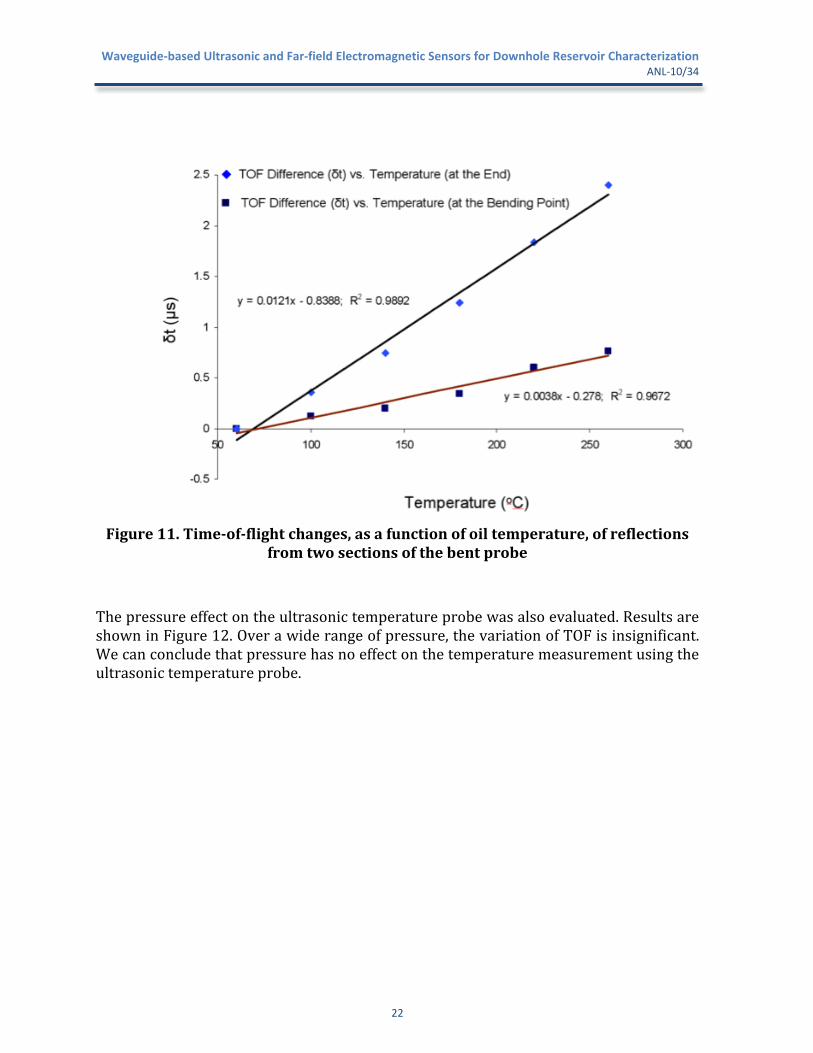
4.2 Temperature Probe An ultrasonic temperature probe that potentially can be applied to downhole temperature profile measurement in the enhanced geothermal systems uses a magetostrictive transducer to generate flexural Lamb waves in a low-‐loss magnetostrictive alloy rod. In general Lamb waves can propagate a long distance because of low attenuation and thus the temperature probe can be extended to several meters. The probe can be bent or embedded with notches to facilitate temperature profile measurement. As a pulsed Lamb wave propagates down the rod, reflections from each bend or notch will be analyzed for their times-‐of-‐flight (TOF) that are directly related to the temperature between the bends or notches. Figure 10 illustrates the performance of a bent probe with the lower section of the probe immersed in hot oil. Two reflections are detected, one from the bent and the other from the probe tip. As the oil temperature changes, the travel times of the reflections vary accordingly but at different values depending on the temperature profile of the probe. Figure 11 shows the travel time changes, δt, of the reflections as the oil temperature increases. Linear variations are detected, greater δt for the reflection from the tip because the lower section of the probe is submerged in the oil. Figure 10. Reflections from a bent probe for different probe temperatures
Waveguide-‐based Ultrasonic and Far-‐field Electromagnetic Sensors for Downhole Reservoir Characterization ANL-‐10/34
22
Figure 11. Time-of-flight changes, as a function of oil temperature, of reflections from two sections of the bent probe
The pressure effect on the ultrasonic temperature probe was also evaluated. Results are shown in Figure 12. Over a wide range of pressure, the variation of TOF is insignificant. We can conclude that pressure has no effect on the temperature measurement using the ultrasonic temperature probe.

Waveguide-‐based Ultrasonic and Far-‐field Electromagnetic Sensors for Downhole Reservoir Characterization ANL-‐10/34
23
Figure 12. Effects of pressure on the ultrasonic temperature probe
4.3 Prosity and permeability Enhanced geothermal systems target mainly at hot dry rock (HDR) resources. The technique to extract energy from HDR is based on drilling and hydraulic fracturing technologies. Figure 1 shows the typical HDR system. Water pumped down one well heats as it flows through the fracture in the reservoir rock and returns through the production well. The efficiency of energy extraction from a HDR reservoir is directly related to the porosity, permeability, and connectivity of the reservoir. To optimize the energy extraction it is imperative to characterize the reservoir, that is, to estimate the reservoir porosity and permeability. To date, these reservoir parameters are implicated from flow rate measurement. We propose to examine the feasibility of using the flow-‐induced noise to determine the reservoir parameters. This feasibility study will involve construction of a hot rock test facility by which acoustic noise level will be monitored as a function of rock porosity and flow rate.
Waveguide-‐based Ultrasonic and Far-‐field Electromagnetic Sensors for Downhole Reservoir Characterization ANL-‐10/34
24
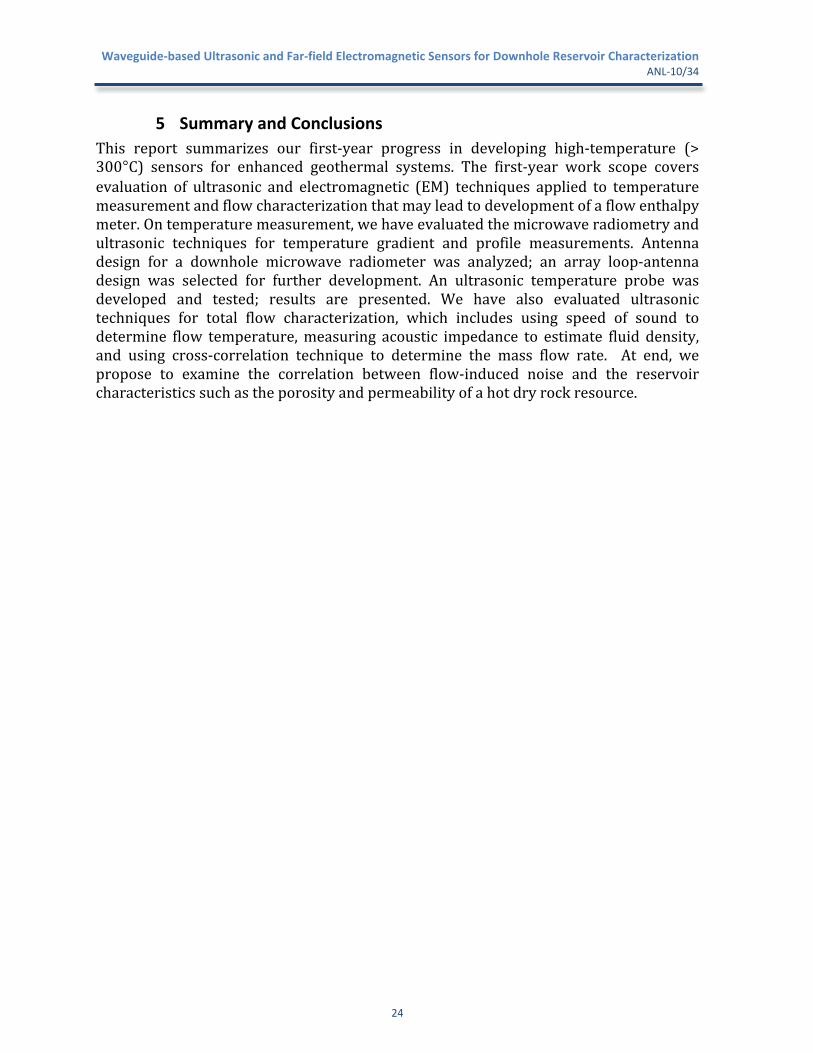
5 Summary and Conclusions This report summarizes our first-‐year progress in developing high-‐temperature (> 300°C) sensors for enhanced geothermal systems. The first-‐year work scope covers evaluation of ultrasonic and electromagnetic (EM) techniques applied to temperature measurement and flow characterization that may lead to development of a flow enthalpy meter. On temperature measurement, we have evaluated the microwave radiometry and ultrasonic techniques for temperature gradient and profile measurements. Antenna design for a downhole microwave radiometer was analyzed; an array loop-‐antenna design was selected for further development. An ultrasonic temperature probe was developed and tested; results are presented. We have also evaluated ultrasonic techniques for total flow characterization, which includes using speed of sound to determine flow temperature, measuring acoustic impedance to estimate fluid density, and using cross-‐correlation technique to determine the mass flow rate. At end, we propose to examine the correlation between flow-‐induced noise and the reservoir characteristics such as the porosity and permeability of a hot dry rock resource.
Waveguide-‐based Ultrasonic and Far-‐field Electromagnetic Sensors for Downhole Reservoir Characterization ANL-‐10/34
25
REFERENCES 1. H. Gupta, S. Roy, “Geothermal Energy: An Alternative Resource for the 21ST
Century,” Amsterdam: Elsevier, 2007. 2. P. A. Fokker, “Hydraulic Fracturing in the Hydrocarbon Industry,” Enhanced
Geothermal Innovative Network for Europe Workshop, Zurich, 2006. 3. U. S. Department of Energy, Energy Efficiency and Renewable Energy, “An
Evaluation of Enhanced Geothermal Systems Technology,” 2008, http://www1.eere.energy.gov/geothermal
4. A. Timur and M. N. Toksoz, “Downhole geophysical logging,” Annual Reviews
Earth Planet Science 1985, 13; 315-‐44. 5. S. H. Aref, M. I Zibaii, and H. Latifi, “An improved fiber optic pressure and
temperature sensor for downhole application,” Meas. Sci. Technol. 20, pp. 1-‐6, 2009.
6. N. Atalay, “Downhole enthalpy measurement in geothermal wells with fiber
optics,” Stanford Geothermal Program report SGP-‐TR-‐186, June 2008. 7. P. E. Pehme, B. L. Parker, J. A. Cherry, and J. P. Greenhouse, “Improved Resolution
of Ambient Flow through Fractured Rock with Temperature Logs”, Ground Water, Vol. 48, No.2, pp. 191-‐205, 2010
8. K. W. Wisian, D. D. Blackwell, S. Bellaniti, J. A. Benfling, R. A. Normann, And P. C.
Lynse, “Field Comparision of Conventional and New Technology Temperature Logging Systems”, Geothermics, Vol. 27, No. 2, pp. 131-‐141, 1998
9. “Acoustic telemetry system,” Halliburton communications,
http://www.halliburton.com. 10. “An evaluation of enhanced geothermal systems technology,” DOE/EERE
Geothermal Technologies Program 2008, http://www.eere.energy.gov/geothermal/
11. J. W. Tester, et.al., “The future of geothermal energy,” A study by MIT-‐led
interdisciplinary panel, 2008, http://geothermal.inel.gov/ 12. R. A. Normann and B. J. Livesay, “Geothermal high temperature instrumentation
applications,” SAND-‐98-‐1986C, June 1998. 13. J. Davarzani and M. L. Sloan, “Analysis of geothermal wells with simultaneous
logging instruments,” SPE Formation Evaluation Vol.4 No. 3, pp. 454-‐458, 1989.
Waveguide-‐based Ultrasonic and Far-‐field Electromagnetic Sensors for Downhole Reservoir Characterization ANL-‐10/34
26
14. S. M. Wiggins, J. A. Hildebrand, and J. M. Gieskes, “Geothermal state and fluid flow within ODP hole 843B: results from wireline logging,” Earth and Planetary Science Letters 195 pp. 239-‐248, 2002. (ODP—Ocean Drilling Program)
15. E. R. Crain, “How many acoustic waves can dance on the head of a sonic log?”
Canadian well logging society publication, www.spec2000.net/freepubs/AcousticWaves.pdf
16. J. B. U. Haldorsen, et.al., “Borehole acoustic waves,” Oilfield Review, 2006. 17. Zhu Weiqing,et.al., “Acoustic estimation of suspended sediment concentration,”
Science in China Vol. 44 No. 8, pp.1064-‐1072, 2001. 18. Yu. G. Bezymyannyl, “Potential of acoustic methods in monitoring the structure
and physicomechanical properties of porous materials,” Powder Metallurgy and Metal Ceramics, Vol. 40, Nos. 5-‐6, pp.221-‐228, 2001.
19. M. V. Kurlenya, V. E. Petrov, S. N. Popov, and Kh. B. Tkach, “Applicability of
acoustic waveguides for stress measurement in soils” J. of Mining Science, Vol. 33 (1) 1997.
20. A. l. Surkaev and V. G. Kul'kov, “Investigation of a pulsed waveguide piezoelectric
pressure sensor”, Acoustic Physics, Vol. 52, No. 2, pp. 218-‐221, 2006. 21. Michael A. Janssen, “Atmospheric Remote Sensing by Microwave Radiometry,”
John Wiley & Sons, Inc., 1993. 22. Nachappa Gopalsami, Shaolin Liao, Thomas W. Elmer, Eugene R. Koehl, Alexander
Heifetz, Hual-‐Te Chien, Apostolos C. Raptis, “Passive Millimeter Wave Imaging and Spectroscopy System for Terrestrial Remote Sensing,” SPIE conference proceeding, 2010.
23. D. Ensminger, Ultrasonics: “Fundamentals, Technology, Applications,” 2nd ed. New
York: Marcel Dekker Inc., 1988, pp. 383-‐389. 24. S. H. Sheen, H. T. Chien, and a. C. Raptis, “Instrumentation for fluid-‐particle flow:
acoustics,” Instrumentation for Fluid-‐particle Flow, Ed. By Shao Lee Soo, Noyes Publication, 1999.
25. N. Bilaniuk and G. S. K. Wong, “Speed of sound in pure water as a function of
temperature,” J. Acoust. Soc. Am. 93(3) pp 1609-‐1612, 1993. Amended by N. Bilaniuk and G. S. K. Wong, J. Acoust. Soc. Am. 99(5), p 3257, 1996.

Waveguide-‐based Ultrasonic and Far-‐field Electromagnetic Sensors for Downhole Reservoir Characterization ANL-‐10/34
27


Argonne National Laboratory is a U.S. Department of Energy laboratory managed by UChicago Argonne, LLC
ENERGYU.S. DEPARTMENT OF
Nuclear Engineering DivisionArgonne National Laboratory9700 South Cass Avenue, Bldg. 208Argonne, IL 60439-4842
www.anl.gov