wavefront aberrations and the depth of focus of the …wavefront aberrations and the depth of focus...
TRANSCRIPT

Wavefront aberrations and the depth of focus
of the human eye
Thesis submitted by
Fan Yi
BEng, MEng
A thesis submitted in fulfilment of the requirements for the degree of
Doctor of Philosophy
School of Optometry
Institute of Health and Biomedical Innovation
Faculty of Health
Queensland University of Technology
Brisbane, Australia
2010

1
Keywords
adaptive optics
depth of focus
eye
higher order aberrations
retinal image quality metrics
spherical aberration
vision
wavefront aberrations

2
Publications Arising from this Research
Journal article
Yi, F., Iskander, D. R., & Collins, M. J. (2010). Estimation of the depth of focus
from wavefront measurements. Journal of Vision, 10(4):3, 1-9,
http://journalofvision.org/10/4/3/, doi:10.1167/10.4.3. (Appendix D)
Conference abstracts
Yi, F., Iskander, D. R., & Collins, M. J. (2008). Spherical aberration and the
depth-of-focus in a population of normal subjects. Presented at the 4th
European
Meeting in Visual & Physiological Optics, Crete, Greece.
Yi, F., Iskander, D. R., & Collins, M. J. (2010). Subjective measurement of depth
of focus in keratoconus. Investigative Ophthalmology and Visual Science. 2010,
51: E-Abstract 4971. (Appendix E)

3
Abstract
The depth of focus (DOF) can be defined as the variation in image distance of a
lens or an optical system which can be tolerated without incurring an
objectionable lack of sharpness of focus. The DOF of the human eye serves a
mechanism of blur tolerance. As long as the target image remains within the
depth of focus in the image space, the eye will still perceive the image as being
clear. A large DOF is especially important for presbyopic patients with partial or
complete loss of accommodation (presbyopia), since this helps them to obtain an
acceptable retinal image when viewing a target moving through a range of near to
intermediate distances. The aim of this research was to investigate the DOF of the
human eye and its association with the natural wavefront aberrations, and how
higher order aberrations (HOAs) can be used to expand the DOF, in particular by
inducing spherical aberrations ( 0
4Z and 0
6Z ).
The depth of focus of the human eye can be measured using a variety of
subjective and objective methods. Subjective measurements based on a Badal
optical system have been widely adopted, through which the retinal image size
can be kept constant. In such measurements, the subject‟s tested eye is normally
cyclopleged. Objective methods without the need of cycloplegia are also used,
where the eye‟s accommodative response is continuously monitored. Generally,
the DOF measured by subjective methods are slightly larger than those measured
objectively. In recent years, methods have also been developed to estimate DOF
from retinal image quality metrics (IQMs) derived from the ocular wavefront
aberrations. In such methods, the DOF is defined as the range of defocus error
that degrades the retinal image quality calculated from the IQMs to a certain level
of the possible maximum value.
In this study, the effect of different amounts of HOAs on the DOF was
theoretically evaluated by modelling and comparing the DOF of subjects from
four different clinical groups, including young emmetropes (20 subjects), young
myopes (19 subjects), presbyopes (32 subjects) and keratoconics (35 subjects). A
novel IQM-based through-focus algorithm was developed to theoretically predict
the DOF of subjects with their natural HOAs. Additional primary spherical

4
aberration ( 0
4Z ) was also induced in the wavefronts of myopes and presbyopes to
simulate the effect of myopic refractive correction (e.g. LASIK) and presbyopic
correction (e.g. progressive power IOL) on the subject‟s DOF. Larger amounts of
HOAs were found to lead to greater values of predicted DOF. The introduction of
primary spherical aberration was found to provide moderate increase of DOF
while slightly deteriorating the image quality at the same time. The predicted
DOF was also affected by the IQMs and the threshold level adopted.
We then investigated the influence of the chosen threshold level of the IQMs on
the predicted DOF, and how it relates to the subjectively measured DOF. The
subjective DOF was measured in a group of 17 normal subjects, and we used
through-focus visual Strehl ratio based on optical transfer function (VSOTF)
derived from their wavefront aberrations as the IQM to estimate the DOF. The
results allowed comparison of the subjective DOF with the estimated DOF and
determination of a threshold level for DOF estimation. Significant correlation was
found between the subject‟s estimated threshold level for the estimated DOF and
HOA RMS (Pearson‟s r=0.88, p<0.001). The linear correlation can be used to
estimate the threshold level for each individual subject, subsequently leading to a
method for estimating individual‟s DOF from a single measurement of their
wavefront aberrations.
A subsequent study was conducted to investigate the DOF of keratoconic subjects.
Significant increases of the level of HOAs, including spherical aberration, coma
and trefoil, can be observed in keratoconic eyes. This population of subjects
provides an opportunity to study the influence of these HOAs on DOF. It was
also expected that the asymmetric aberrations (coma and trefoil) in the
keratoconic eye could interact with defocus to cause regional blur of the target. A
dual-Badal-channel optical system with a star-pattern target was used to measure
the subjective DOF in 10 keratoconic eyes and compared to those from a group of
10 normal subjects. The DOF measured in keratoconic eyes was significantly
larger than that in normal eyes. However there was not a strong correlation
between the large amount of HOA RMS and DOF in keratoconic eyes. Among all
HOA terms, spherical aberration was found to be the only HOA that helped to
significantly increase the DOF in the studied keratoconic subjects.
5
Through the first three studies, a comprehensive understanding of DOF and its
association to the HOAs in the human eye had been achieved. An adaptive optics
system was then designed and constructed. The system was capable of measuring
and altering the wavefront aberrations in the subject‟s eye and measuring the
resulting DOF under the influence of different combination of HOAs.
Using the AO system, we investigated the concept of extending the DOF through
optimized combinations of 0
4Z and 0
6Z . Systematic introduction of a targeted
amount of both 0
4Z and 0
6Z was found to significantly improve the DOF of
healthy subjects. The use of wavefront combinations of 0
4Z and 0
6Z with opposite
signs can further expand the DOF, rather than using 0
4Z or 0
6Z alone. The
optimal wavefront combinations to expand the DOF were estimated using the
ratio of increase in DOF and loss of retinal image quality defined by VSOTF. In
the experiment, the optimal combinations of 0
4Z and 0
6Z were found to provide a
better balance of DOF expansion and relatively smaller decreases in VA.
Therefore, the optimal combinations of 0
4Z and 0
6Z provides a more efficient
method to expand the DOF rather than 0
4Z or 0
6Z alone.
This PhD research has shown that there is a positive correlation between the DOF
and the eye‟s wavefront aberrations. More aberrated eyes generally have a larger
DOF. The association of DOF and the natural HOAs in normal subjects can be
quantified, which allows the estimation of DOF directly from the ocular
wavefront aberration. Among the Zernike HOA terms, spherical aberrations
( 0
4Z and 0
6Z ) were found to improve the DOF. Certain combinations of 0
4Z and
0
6Z provide a more effective method to expand DOF than using 0
4Z or 0
6Z alone,
and this could be useful in the optimal design of presbyopic optical corrections
such as multifocal contact lenses, intraocular lenses and laser corneal surgeries.

6
Table of Contents
Chapter 1. Introduction
20
1.1 Background 20
1.2 significance 21
1.3 Objectives 21
1.4 Scope of the thesis 21
Chapter 2. Literature review 23
2.1 Accommodation, presbyopia and depth of focus
23
2.1.1 Mechanism of presbyopia and statistics of its progression 23
2.1.2 Methods for presbyopic correction 23
2.1.3 The depth of focus of human eye 28
2.2 Wavefront aberration and retinal image quality 32
2.2.1 Wavefront aberrations 32
2.2.2 Representing wavefront aberrations 34
2.2.3 Wavefront sensing for the human eye 37
2.2.4 Monochromatic wavefront aberrations in normal human eye 40
2.2.5 Factors affecting higher order aberrations in the human eye 42
2.2.6 Wavefront aberrations, retinal image quality, and retinal image quality metrics 50
2.3 Summary of literature review and design of studies 54
Chapter 3. Modelling the depth of focus in different refractive groups 58
3.1 Introduction
58
3.2 Methods and subjects 60
3.2.1 Subjects 60
3.2.2 Wavefront aberrations 60
3.2.3 Depth of focus 61
3.2.4 Predicting DOF of subjects with the presence of original LSA 63
3.2.5 Estimating the effect of varying the longitudinal spherical aberration on DOF
64
3.3 Results
66

7
3.3.1 HOA comparison between clinical groups 66
3.3.2 Peak value of each image quality parameter for the four population group 67
3.3.3 Comparison of predicted DOF between groups 70
3.3.4 Influence of threshold level to the predicted DOF 71
3.3.5 Comparison of response to changes of spherical aberration in different clinical
groups
72
3.3.6 Effect of varying spherical aberration on DOF of presbyopes 74
3.3.7 Model of positive LSA induced by refractive surgery and its effect on DOF of
myopic subjects
76
3.4 Discussion 77
Chapter 4. Estimation of depth of focus from wavefront measurements 81
4.1 Introduction
81
4.2 Subjects and methods
81
4.2.1 Subjects 81
4.2.2 Apparatus 82
4.2.3 Protocol 83
4.2.4 Determination of the threshold for estimating DOF from wavefront data 85
4.2.5 Statistical analysis 88
4.3 Results 89
4.3.1 Individual matching threshold for the subjects 89
4.3.2 Comparison of predicted DOF of subjects from three different clinical groups 92
4.4 Discussion 94
Chapter 5. Subjective measurement of depth of focus in keratoconic eyes 98
5.1 Introduction
98
5.2 Methods
99
5.2.1 Subjects 99
5.2.2 Apparatus 100
5.2.3 Protocol 101
5.2.4 Wavefront and topographic data collection 103
5.2.5 Data analysis 103

8
5.3 Results
105
5.3.1 The effect of cycloplegia on DOF 105
5.3.2 Results of measurements in keratoconic subjects 106
5.3.3 Comparison between the left and right eye of keratoconic subjects 109
5.4 Discussion 110
Chapter 6. Design and construction of the adaptive optics system 113
6.1 Introduction 113
6.1.1 Origins and basic theory of AO 113
6.1.2 Reviewed designs of AO systems 114
6.2 Design and modification of the AO system
119
6.3 Calibration and evaluation of the system performance 123
6.3.1 Elimination of the effect of laser spackle and corneal reflection 123
6.3.2 Calibration of the wavefront measuring function with the HASO32TM
wavefront
sensor
124
6.3.3 Calibration of the wavefront generating function with the Mirao52TM
deformable mirror
127
6.3.4 Closed-loop correction with the AO system 131
Chapter 7. Expanding depth of focus in the human eye through optimal
combinations of primary and secondary spherical aberration
135
7.1 Introduction
135
7.2 Methods
136
7.2.1 Extending the DOF in a model eye 136
7.2.2 Extending the DOF in virtual eyes 141
7.2.3 Measurement of DOF in real eyes 143
7.3 Results
149
7.3.1 Effect of different combinations of 0
4Z and 0
6Z on the DOF of real eyes 150
7.3.2 Effect of combinations of 0
4Z and 0
6Z on centre of focus (COF) 154
7.4 Discussion and conclusion 156

9
Chapter 8. Conclusion and summary of the thesis 162
8.1 Influence of HOAs on the depth of focus 162
8.1.1 Modelling the DOF in different clinical groups 162
8.1.2 Estimation of DOF from wavefront measurements 164
8.1.3 Subjective measurement of DOF in keratoconic eyes 165
8.2 Design and construction of the AO system for experiments 165
8.3 Expanding the DOF in the human eye through optimal combinations of
primary and secondary spherical aberrations
166
8.4 Future directions 168
8.5 Conclusion 169
References 171
Appendices 200
Appendix A: Calibration results of HASO against COAS in 10 real eyes 201
Appendix B: Reading wavefront data from HASO measurements 211
Appendix C: Consent form 213
Appendix D: Published paper 1 214
Appendix E: Conference abstract 1 223

10
List of Figures
Figure 2.1 Diagram of optical zones in a typical PAL lens. 25
Figure 2.2 Pupil size and its effect on image formation of a centre-
distance MF CL.
26
Figure 2.3 Schematic depiction of the depth of focus and depth of field. 28
Figure 2.4 Wavefront aberration in an aberrated eye. 33
Figure 2.5 First 28 terms of the Zernike polynomials. 35
Figure 2.6 Refractive errors in the human eye. 36
Figure 2.7 Concept of an aberrometer based on the Scheiner-Hartmann-
Shack principle.
38
Figure 2.8 Grid pattern of (a) the ideal wavefront, and of (b) an
aberrated wavefront.
39
Figure 2.9 (a) PSF of a diffraction limited eye, and (b) PSF of an
aberrated eye, both in a 6 mm pupil.
51
Figure 2.10 Effect on retinal image of different Zernike terms. 52
Figure 2.11 Objectives and designed studies. 56
Figure 3.1 An example of the estimated modulation transfer function.
Azimuthally-averaged data at 5, 10 and 15 cpd are used as
the first three image quality metrics.
61
Figure 3.2 Flowchart of the computer simulation. (a) Algorithm for
calculating the DOF with originally present amount of LSA.
(b) Algorithm for calculating the DOF as a function of LSA.
62
Figure 3.3 DOF(LSA) estimate for subject CW. (a) through-focus
)10(
MTF at different levels of LSA. (b) 3D result of the
DOF(LSA) estimator. (c) top-view map of (b).
65
Figure 3.4 Higher order aberration (HOA) RMS values of the four
groups, consisting of young emmetropes, young myopes,
presbyopes and keratoconics for 5 mm and 3.5 mm pupil
diameters.
66
Figure 3.5 Examples of the estimated DOF(LSA) for different subjects
from each of the considered clinical groups.
73
Figure 3.6 Simulated average influence of LSA on DOF in presbyopic
group in (a) a 5 mm, and (b) a 3.5 mm pupil diameter .
74
Figure 3.7 Retinal images simulation with different levels of LSA and
defocus for a presbyopic subject DFB. This subject was
representative of the presbyopic group and had +0.175 D of
natural longitudinal spherical aberration.
75
Figure 3.8 Simulated average effect of positive LSA on DOF of the
myopic group for (a) a 5 mm, and (b) a 3.5 mm pupil
diameter.
76
Figure 3.9 The effect of interaction of the primary and 0.05 µm of 79
11
secondary SA on DOF.
Figure 4.1 Wavefront sensing system to monitor the ocular wavefront
aberration and measure the depth of focus.
82
Figure 4.2 Flow chart of simulation program for calculating through-
focus VSOTF.
86
Figure 4.3 Estimation of matching threshold based on through-focus
VSOTF.
88
Figure 4.4 Correlation between the estimated threshold and HOA RMS
(a) in a 5mm pupil, and (b) in a 3.5mm pupil. Solid line is the
linear regression and dashed line is the 95% confidence band.
91
Figure 4.5 Algorithm to estimate DOF with a predetermined threshold
from aberrations.
93
Figure 5.1 The two-channel Badal system. L1 and L2 are the Badal
lenses, PM is a first surface mirror and CBS is a 50:50 cube
beam splitter.
100
Figure 5.2 Group mean HOA of normal and keratoconic eyes. 107
Figure 6.1 Schematic concept of a basic AO system for vision science. 114
Figure 6.2 The first generation Rochester AO system (Liang, Williams &
Miller, 1997).
115
Figure 6.3 Changes of optical layout in the second generation Rochester
AO system (Hofer et al., 2006).
117
Figure 6.4 Badal stage used in Murcia AO system (Fernández et al.,
2001).
118
Figure 6.5 Schematic diagram of the KTH AO system ( Lundström et
al., 2007).
119
Figure 6.6 Schematic diagram of the first design of the AO system. 120
Figure 6.7 Optical layout of the developed AO system. 122
Figure 6.8 Hartmann-Shack spot images with the vibrating mirror (a)
off, and (b) on.
124
Figure 6.9 Measurement results of HOAs by COAS and HASO32 for a
6 mm pupil.
125
Figure 6.10 Comparison of wavefront aberrations measured by COAS
and HASO32 from two subjects in a 6 mm pupil.
126
Figure 6.11 Selected Zernike polynomials generated by the Mirao52 DM
measured by the HASO32 wavefront sensor. R is the
amplitude of the Zernike coefficient, which can be reliably
generated, and E presents the error.
128
Figure 6.12 Generation of pure (a) 0
4Z , and (b) 0
6Z with the AO system. 129
Figure 6.13 Generation of combinations of 0
4Z and 0
6Z with the AO
system.
130
12
Figure 6.14 Wavefront aberrations measured from a misaligned myopic
model eye (a) with the AO off, and (b) with the AO on.
133
Figure 6.15 Wavefront aberrations measured from a real eye (a) with the
AO off, and (b) with the AO on.
134
Figure 7.1 (a) A flow chart of the through-focus simulation algorithm to
theoretically estimate the DOF with different combinations of 0
4Z and 0
6Z Zernike polynomials terms. (b) An example of
the output of the through-focus simulation.
138
Figure 7.2 The effect of primary and secondary spherical aberrations on
the DOF of a diffraction-limited model eye.
141
Figure 7.3 Optical layout of the AO system. 146
Figure 7.4 Effect of pupil offset on the combination of wavefront
aberrations.
149
Figure 7.5 Effect on DOF by introduction of (a) 0
4Z alone (b) 0
6Z alone,
and (c) combinations of 0
4Z and 0
6Z . All plots (a), (b) and (c)
have common x and y scale to aid comparison between
different conditions.
151
Figure 7.6 Decrease in VA [logMAR] of real eyes with the introduction
of (a) 0
4Z alone (b) 0
6Z alone, and (c) combinations of 0
4Z
and 0
6Z with opposite signs. Cases in which one or more
subjects did not satisfy the best achievable VA of
0.2 logMAR criterion are indicated in red color. All plots (a),
(b) and (c) have common x and y scale to aid comparison
between different conditions.
152
Figure 7.7 ∆DOF versus ∆VA induced by 0
4Z , 0
6Z and combinations of
0
4Z and 0
6Z . The size of symbol represents the number of
occurrence of data.
153
Figure 7.8 Shift of centre of focus (COF) caused by introduction of (a) 0
4Z alone; (b) 0
6Z alone, and (c) combinations of 0
4Z and
0
6Z .
155
Figure 7.9 (a) Wavefront combination of 0.4 µm of 0
4Z and 0.2 µm of 0
6Z and its through-focus point spread function shown in (c);
(b) Wavefront combination of 0.4 µm of 0
4Z and 0.2 µm of 0
6Z and its though-focus point spread function shown in (d).
159
Figure 8.1 Flowchart of the three steps (five studies) accomplished in
this study.
163

13
List of Tables
Table 2.1 Studies of monochromatic wavefront aberrations in normal
human eyes.
40
Table 3.1 Group mean of peak values of each IQM predicted from the
original wavefront aberrations of the subjects.
68
Table 3.2 Group mean of predicted DOF (80% threshold) of the
subjects using a range of image quality metrics (IQMs).
69
Table 3.3 Group mean of predicted DOF (50% threshold) of the
subjects using a range of image quality metrics (IQMs).
69
Table 4.1 Group average results in a 5mm pupil and a 3.5mm pupil
diameter.
89
Table 4.2 Group mean of estimated DOF of the three refractive groups. 93
Table 5.1 The effect of cycloplegia on DOF, HOA RMS and spherical
aberration in a 5 mm pupil.
106
Table 5.2 Results of keratoconic eyes. 108
Table 5.3 Comparison between the left and right eye. 109
Table 6.1 Major differences of the COAS and HASO32 wavefront
sensor.
124
Table 6.2 Correlation of Zernike HOA coefficients measured by
COAS and HASO in a 6 mm pupil.
125
Table 6.3 Combinations of 0
4Z and 0
6Z can be generated using the AO
system.
131
Table 7.1 Mean predicted change in DOF (D) of up to 100 virtual eyes
by the addition of the 41 various combinations of 0
4Z and
0
6Z .
143
Table 7.2 Higher order ocular aberrations of the six measured eyes for
a 6 mm pupil.
145
Table 7.3 Mean changes of DOF and standard deviation of real eyes
with the introduction 0
4Z and 0
6Z alone and in combination
(with opposite signs).
150
Table 7.4 Optimal combination of wavefront to extend DOF for each
subject.
154

14
List of Abbreviations
3D: Three dimensional
AO: Adaptive optics
AIOL: Accommodative intraocular lens
BIF: Bifocal spectacle
CBS: Cube beam splitter
CCD: Charge-couple device (stands for a CCD camera in this thesis)
CHOA: Corneal higher order aberrations
COAS: Complete Ophthalmic Analysis System
COF: Centre of focus
cpd: Cycles per degree
CSF: Contrast sensitivity function
D: Dioptre
DM: Deformable mirror
DOF: Depth of focus
HOA: Higher order aberration
IOL: Intraocular lens
IQM: Image quality metric
LASIK: Laser in situ keratomileusis
LD: Laser diode
LED: Light emitting diode
LSA: Longitudinal spherical aberration
MFCL: Multifocal contact lens
MTF: Modulation transfer function
MV: Monovision
MVCL: Monovision contact lens
OPD: Optical path difference

15
OPL: Optical path length
OTF: Optical transfer function
PAL: Progressive addition lens
PBS: Pellicle beam splitter
PRK: Photorefractive keratectomy
PSF: Point spread function
PTF: Phase transfer function
RGP contact lens: Rigid gas permeable contact lens
RMS: Root mean square
SA: Spherical aberration
S/C: Sphero-cylinder
SD: Standard deviation
SV: Single vision
VA: Visual acuity
VM: Vibrating mirror
VSOTF: Visual Strehl ratio based on the optical transfer function

16
List of Main Symbols
),( yxA Amplitude transmittance at the point ),( yx
),( C corneal surface
,ˆresC
approximated residual corneal elevation
NCSF neural contrast sensitivity function
F refractive power
)(
MTF azimuthally-averaged modulation transfer function
DLOTF diffraction limited optical transfer function
yxP , pupil function
W ),( wavefront aberration
X, Y distances perpendicular to optical axis
Z optical axis
pZ ),( pth Zernike polynomial
0
4Z , 0
6Z Zernike polynomial terms for primary and secondary spherical
aberration
Z wavefront to refractive power transformation
1
inverse transformation from the refractive power domain to the
wavefront domain
pa coefficient associated with ),( pZ
d distance from the pupil center to the peak of cone
0d distance of the peak of cone from the keratoscopic axis

17
Offsetd offset between keratoscopic axis and pupil center
ε ),( measurement and modelling error (noise)
),( 00 yxf object
yx ff , spatial frequency components in the x and y plane
),( yxg retinal image
k k =2π/λ, wave number
n, n’ refractive indices on incident and refraction sides of a surface
p polynomial-ordering number, p =1, 2… P
r pupil radius
maxr max pupil radius
th threshold
ρ normalized distance from the origin
θ angle
azimuthally-average
λ wavelength
∆ difference
the convolution operation
complex conjugate

18
Statement of Original Authorship
The work contained in this thesis has not been previously submitted to meet
requirements for an award at this or any other higher education institution. To the
best of my knowledge and belief, the thesis contains no material previously
published or written by another person except where due reference is made.
Signature
Date

19
Acknowledgments
I would like to thank all the people who have assisted me through the preparation
and completion of this thesis. In particular, I sincerely wish to express my thanks
and appreciation to my supervisors, Dr. Robert Iskander, Prof. Michael Collins,
Dr. Peter Hendicott and Dr. Alyra Shaw, who have guided me from the
commencement to the successful completion of my study. Without their guidance
and encouragement, I would not have been able to reach this point.
To Prof. David Atchison and Prof. Joanne Wood, who were the panel members of
my final seminar, my thanks for their valuable comments on the thesis and on my
seminar.
To Mr. Brett Davis, my thanks for his help during the construction of the adaptive
optics system and a lot of useful discussion.
To my friends, Mr Atanu Ghosh, Mrs Beata Sander, Mr Ben Straker, Mr David
Alonso Caneiro, Dr Dorota Szczesna, Ms Emily Woodman, Ms Garima Tyagi,
Ms Payel Chatterjee, Mr Ranjay Chakraborty, Dr Scott Read, Ms Shila Roshani
and Mr Stephen Vincent, thanks for giving me a lot of happy memories in the lab.
Special thanks to all the subjects participated in my experiments. Without their
help, I won‟t be able to finish the study.
Finally and foremost, I would like to thank my parents and my wife, who gave
me so much support to study in Australia.

20
Chapter 1. Introduction
1.1 Background
Accommodation in the human eye refers to the ability of the crystalline lens to
change shape in order to bring objects at different distances into focus. As such, it
has an essential contribution to visual performance. It is well known that the
accommodation of the lens decreases with age (presbyopia), affecting daily near
work activities. The majority of people begin to notice some effects of presbyopia
by the mid-forties and need to use presbyopic vision corrections to help regain
near vision for daily activities. The reduction of the lens‟ accommodation ability
is continuously progressing until the eye is permanently focused at a single
distance. This process of presbyopia is irreversible.
Current methods that help presbyopes to regain near vision include reading
spectacles, bifocal spectacles, progressive spectacles, and bi- and multi-focal
contact lenses. Monovision contact lenses (one eye for near and one eye for
distance vision) and surgically inserted intraocular lenses are also widely adopted.
However, all current forms of presbyopia correction come with certain limitations.
One of the major problems is that many of the techniques provide two optical foci,
one optimized for near and one for distance vision. When the object is located
between the far distance and the near distance, the presbyope‟s vision is
compromised. Patients wearing spectacles providing multi-focal distances or
progressive addition lenses may also have difficulties to quickly align their line of
sight with the appropriate optical zone of the lens.
Another technique for treating presbyopia is to extend the depth of focus (DOF)
in the human eye, which is similar to the idea of focal range enhancement in
digital imaging. In the field of digital imaging, attempts to increase the depth of
focus have been extensively investigated, especially for microscopic imaging and
passive range detection. While a presbyopic eye with limited accommodation can
be approximated as a single focus lens, the methods to extend DOF in optical
systems could also have significant advantages for correcting presbyopia in the
human eyes.

21
1.2 Significance
The majority of people over 45 years of age need to use presbyopic vision
corrections to help regain near vision for daily activities. While all current
methods of presbyopic correction come with certain limitations, extending the
DOF of the eye could be used as an alternative method to correct presbyopia. It is
known that HOAs help to extend the DOF while compromising the on-axis visual
performance. Adding spherical aberration, for example, has also been used as a
passive clinical approach to extend the DOF in some designs of presbyopic
corrections. However, little has been known about the interaction of aberrations
in the human eye and how they can affect the DOF. There is an important gap in
the literature as the methods currently available for presbyopic correction have
typically not taken into account the influence of combinations of HOA to the
DOF, other than spherical aberration alone.
1.3 Objectives
The aim of this research study is to investigate the interaction between the DOF
and the wavefront aberrations of the eye, with a view of using wavefront
aberrations to expand the DOF. In order to achieve the aim of the study, the
following objectives need to be accomplished:
1. Estimation of the relationship between higher order aberrations (HOAs) and
depth of focus (DOF) in the eye and estimation of some candidate
wavefront aberrations to extend the DOF
2. Design and construction of an adaptive optics (AO) system.
3. Apply the pre-determined aberrations to the eye with the aid of the
developed AO system and evaluate their efficiency to extend the DOF.
1.4 Scope of the thesis
The thesis contains eight chapters. An overview of each chapter is given below:
Chapter 1 gives an introduction to the background and the motivation behind the
research. The main objectives and an overview of the thesis scope are also
provided.

22
Chapter 2 introduces the background of extending the DOF in human eye.
Specifically, it gives an extensive literature review on: (i) accommodation,
presbyopia and presbyopic corrections, (ii) DOF in the human eye, and the
factors which can affect the DOF, (iii) wavefront aberrations of the human
eye and its connection to DOF, and (iv) retinal image quality and image
quality metrics (IQM) derived from the wavefront aberration.
Chapter 3 presents the image quality metric (IQM) based methods of
theoretically estimating the DOF from wavefront aberrations. A customized
through-focus algorithm is used to model the theoretical DOF of subjects
from different clinical groups and predict the effect of inducing spherical
aberration to the DOF of myopic and presbyopic subjects.
Chapter 4 describes the development of an algorithm to estimate the threshold
level for IQMs, which would correlate with the subjectively measured DOF
and lead to a method for estimating DOF directly from a measurement of
wavefront aberrations. This algorithm is applied to estimate and compare the
DOF of subjects used in the previous chapter.
Chapter 5 investigates the subjective DOF in patients with keratoconus. A
method allowing measurement of the subjective DOF without the use of
cycloplegia is described. The measured DOF from keratoconic eyes are
compared to those of normal subjects.
Chapter 6 presents the design and construction of an AO system, which is used
to carry out the experiments of extending DOF with HOAs in this study.
This chapter also gives an introduction of the AO technology and a review of
different designs of AO systems used for visual sciences.
Chapter 7 describes the experiment of extending DOF with HOAs. In this
chapter, the optimal wavefront combinations are derived from a through-
focus simulation. The efficiency of these wavefront combinations in
expanding DOF is first evaluated in a group of “virtual eyes” and then
applied to the real eyes with the aid of an AO system.
Chapter 8 presents the conclusions and summary of the thesis.

23
Chapter 2. Literature review
2.1 Accommodation, presbyopia and depth of focus
2.1.1 Mechanism of presbyopia and statistics of its progression
The mechanism of accommodation has been studied for more than three hundred
years (Descartes, 1677; Young, 1801; Helmholtz, 1866). The most widely
accepted explanation of the mechanism of accommodation is based on the theory
of Helmholtz (1866), which suggests that accommodation is achieved by the
crystalline lens changing its shape. When the eye is unaccommodated and focuses
at its far point, the zonules on the lens pull and flatten the lens. When the eye
accommodates, the lens forms a more spherical shape to bring near targets into
focus. The ability of accommodation in the human eye declines throughout life
from birth onwards (Atchison, 1995; Hermans et al., 2008). A young person‟s eye
normally has accommodation of about 8 dioptres (Hamasaki, Ong & Marg, 1956),
which declines to about half before middle age and drops to near zero dioptre
when the person reaches their mid-fifties.
The decline of accommodation starts to become a problem for most people in
their middle age (after about 45 years of age), when they can no longer clearly see
near targets. This is the condition called presbyopia. The exact onset of
presbyopia can be affected by multiple factors, such as general health, race, diet,
geographic latitude, radiant exposure, and near working habits (Holden et al.,
2008).
There has been a continuous transition into an aging society worldwide in the last
fifty years (UN, 2001). It is predicted that one in three people will be over 60
years old in developed countries by 2050 (UN, 2001). The demands for
presbyopic corrections will increase as the population of people aged 45 years
and above continues to increase.
2.1.2 Methods for presbyopic correction
Currently the correction of presbyopia can be achieved by a variety of methods
including non-surgical and surgical options to help the patients regain near vision
for daily activities such as computer works and reading. Non-surgical methods for

24
presbyopia correction include the use of spectacles and contact lenses. Based on
different optical designs, the most popular non-surgical options are spectacles and
contact lenses such as bifocal lenses (BIF), multi-focal contact lenses (MF),
progressive addition lenses (PAL) and monovision (MV). Surgical options
include laser corneal ablation to create monovision or multifocal effect, corneal
inlays and the use of intraocular lenses (Jain, Arora & Azar, 1996; Agarwal, 2002;
Davison & Simpson, 2006; Yilmaz et al., 2008).
Bifocal spectacles
It is reported that approximately 16% of the presbyopic population are prescribed
with bifocal and trifocal spectacles (Nichols, 2009). The BIF was invented by
Benjamin Franklin in the mid 1700s. Compared to the single vision (SV) reading
glasses, it provides two optical correction zones in the same lens, which allows
clear vision both for far distance and a near distance. One disadvantage of the BIF
is that the upper and lower portions of the lens providing different optical powers
are divided by a visible line. An apparent displacement of object known as “prism
jump” can be observed by the patients when they switch their line of sight from
the distant to near optical zone (Johnson, Elliott & Buckley, 2009). Although the
BIF design provides clear vision for both distance and near vision zone, the
objects located at intermediate distances can not be focused clearly unless the
wearer has sufficient residual accommodation.
PAL spectacles
PAL spectacles are the most widely adopted measure to treat presbyopia today
(Sheedy, 2004; Meister & Fisher, 2008); The purpose of PAL designs is to
provide the presbyopes with clear vision through a range of viewing distances
without image jump and clear boundaries between different focal zones of the
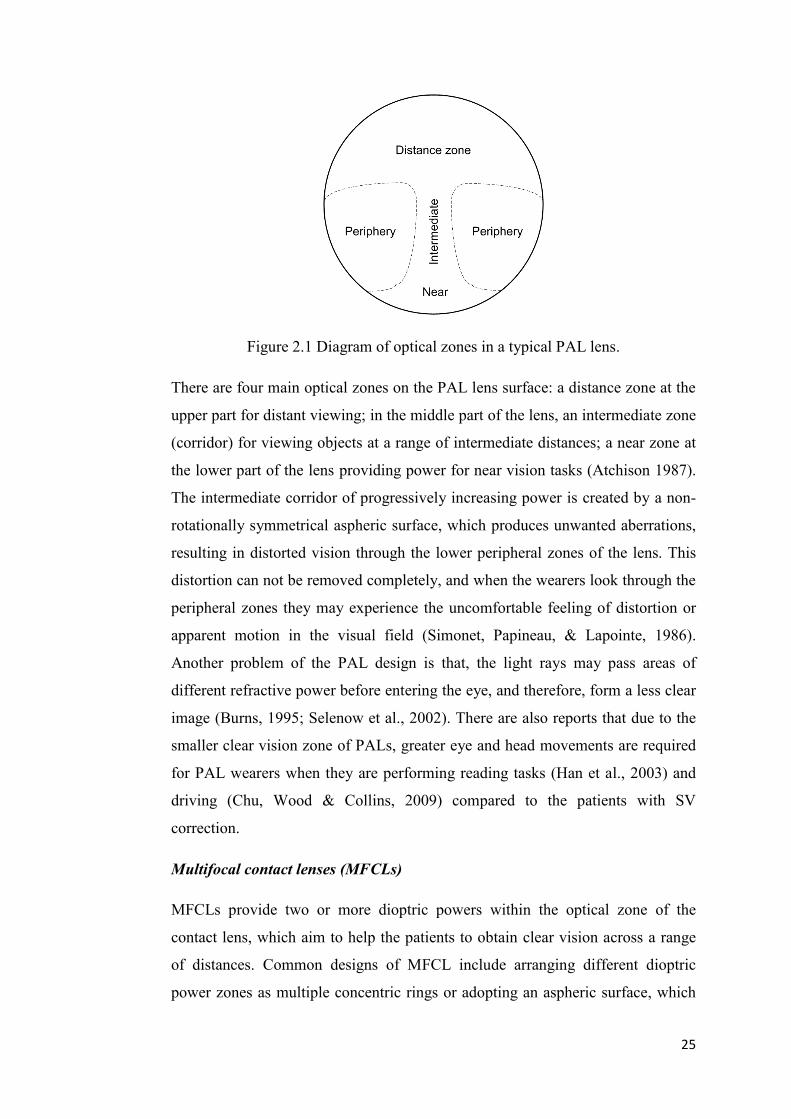
lens (Atchison 1987, 1992). A diagram of optical zones in a typical PAL lens is
shown in Figure 2.1.
25
Figure 2.1 Diagram of optical zones in a typical PAL lens.
There are four main optical zones on the PAL lens surface: a distance zone at the
upper part for distant viewing; in the middle part of the lens, an intermediate zone
(corridor) for viewing objects at a range of intermediate distances; a near zone at
the lower part of the lens providing power for near vision tasks (Atchison 1987).
The intermediate corridor of progressively increasing power is created by a non-
rotationally symmetrical aspheric surface, which produces unwanted aberrations,
resulting in distorted vision through the lower peripheral zones of the lens. This
distortion can not be removed completely, and when the wearers look through the
peripheral zones they may experience the uncomfortable feeling of distortion or
apparent motion in the visual field (Simonet, Papineau, & Lapointe, 1986).
Another problem of the PAL design is that, the light rays may pass areas of
different refractive power before entering the eye, and therefore, form a less clear
image (Burns, 1995; Selenow et al., 2002). There are also reports that due to the
smaller clear vision zone of PALs, greater eye and head movements are required
for PAL wearers when they are performing reading tasks (Han et al., 2003) and
driving (Chu, Wood & Collins, 2009) compared to the patients with SV
correction.
Multifocal contact lenses (MFCLs)
MFCLs provide two or more dioptric powers within the optical zone of the
contact lens, which aim to help the patients to obtain clear vision across a range
of distances. Common designs of MFCL include arranging different dioptric
power zones as multiple concentric rings or adopting an aspheric surface, which

26
provides progressive change of power from the centre to periphery. With such
designs, partial focus is achieved for both distant and near objects at the same
time. The visual system then uses the image in-focus for the object at the desired
distance, while the out-of-focus image reduces overall image quality. One
problem of this design is that, since the in-focus and out-of-focus images are
presented to the eye simultaneously, there is acuity and contrast loss due to the
partial focus (Koffler, 2002; Bennett, 2008). Decrease of distant visual acuity
(VA) (Sanders, Wagner & Reich, 2008) and contrast sensitivity at higher spatial
frequencies (Collins, Brown & Bowman, 1989) were both observed for the
MFCL users compared to the patients wearing spectacles. The effect of MFCL is
also limited by the pupil size, since it changes the relative coverage of the optical
zone for near and distance vision. As shown in Figure 2.2, for a MFCL of centre-
distance aspheric design, a smaller pupil size will limit the performance of near
vision. On the other hand, the distance vision will be compromised when the
pupil becomes bigger.
Figure 2.2 Pupil size and its effect on image formation of a centre-distance MF
CL.
Monovision contact lens
Monovision contact lens (MVCL) is another approach for presbyopia correction
(Jain, Arora & Azar, 1996; Bennet, 2008). This technique uses conventional
single vision contact lenses, fitting the dominant eye with distance correction and
the fellow eye with near correction (Evans, 2007). When the subject is focusing at
an object, the in-focus image and out-of-focus image produced by both eyes are
presented to the vision system at the same time. A period of adaption could be

27
required for some subjects to choose the right image (Collins et al., 1994).
Reduction of stereoacuity is reported in MVCL wearers depending on the
magnitude of the addition power (Kirschen, Huang & Nakano, 1999). The
constant monocular blur induced by MV also affects the subject‟s visual function
resulting in degraded distance VA and contrast sensitivity (Collins, Goode &
Brown, 1993) compared to the spectacle users.
Surgical options for presbyopic correction
Although corrective lenses provide a solution for daily activities involving near
work, some presbyopic patients choose to undergo refractive surgery of the
cornea to reduce their dependency on glasses and contact lenses. This treatment
can produce a permanent effect of monovision to provide close vision in the non-
dominant eye (Agarwal, 2002). However, this approach may result in
compromised binocular function and also require a prolonged adaption period
(Reilly et al., 2006).
Another procedure used by some ophthalmologists is insertion of bifocal
intraocular lenses (IOL) in each eye (Agarwal, 2002). The synthetic lens implant
is designed to allow the patient to see objects at distance or near. A modified IOL
surgery uses a multifocal intraocular lens in the patient‟s non-dominant eye, to
achieve a similar effect of monovision with a multifocal lens (so called modified
monovision).
Insertion of accommodating IOLs (AIOLs) that are able to change either their
shape or position in response to the ciliary muscle contraction is one surgical
technology recently developed, attempting to restore true accommodative
function to presbyopic eyes (Menapace et al., 2007; Glasser, 2008; Schor &
Charles, 2009). A range of AIOL designs are now available for surgical use
(Cumming et al, 2006; Doane & Jackson, 2007; Brown et al, 2009) or still
undergoing development. Since AIOL is still a newly developed technique, there
is a lack of longitudinal clinical data to evaluate the long term performance of the
correction. Also, the amplitude of accommodation provided by the current
designs of AIOLs is limited, which is insufficient to provide the optical power for
daily function without additional aids (Wolffsohn et al., 2006; Doane & Jackson,
2007; Glasser, 2008; Comander & Pineda, 2010).

28
A possible alternative technique for treating presbyopia is to extend the depth of
focus in the human eye. While a presbyopic eye with limited accommodation can
be approximated as a single focus lens, the methods to extend depth of focus
could have significant advantages for correcting presbyopia.
2.1.3 The depth of focus of human eye
The depth of focus in the human eye can be defined as the range of focusing error
which can be tolerated without incurring an objectionable lack of sharpness in the
retinal image (Schapero, Cline & Hesdorffer, 1968). It is a focus tolerance
mechanism of the eye that is of interest to modern refractive surgery and
ophthalmic lens design (Wang and Ciuffreda, 2006).
Although the human eye is regarded as a complex optical system, one can
consider the entire optical system as a single, high power positive lens. When the
accommodation of the eye is set at a constant state, the depth of focus and its
dioptric interval projection in the free space (Ogle, 1968), the depth of field of the
human eye are schematically illuminated in Figure 2.3. When the target (shown in
Figure 2.3 as “E”) moves within the depth of field in object space, its retinal
image will remain within the depth of focus in image space, and the eye will
perceive no significant change of clarity of the target.
Figure 2.3 Schematic depiction of the depth of focus and depth of field.
The ultimate goal of vision correction to provide a high standard of acuity and
contrast sensitivity over a full range of object distances in different lighting
conditions. Subjects of different ages with different lifestyles and occupations
may have their own understanding of what constitutes a good vision (Owsley &
Sloane, 1987). A young subject may prefer a comprehensive correction of both
conventional and higher order aberrations (HOA) to achieve close to diffraction
limited monochromatic optical performance. However, for a presbyope, some
functional improvement of vision across a range of distances, which helps to

29
compensate their loss of accommodation, would benefit the patient more in the
daily life activities.
DOF has long been an important concept in general optics. However, the DOF of
the human eye did not gain much attention until the 1950s (VonBahr, 1952,
Campbell, 1957, Campbell and Westheimer, 1958, Ogle and Schwartz, 1959).
Since then, different groups have concentrated on estimating the DOF in the
human eye either subjectively (Charman and Whitefoot, 1977, Green et al., 1980,
Legge et al., 1987, Atchison et al., 1997) or objectively (Ludlam et al., 1968,
Vasudevan et al., 2006). To assess the DOF subjectively, the accommodation of
the subject‟s eye need to be paralysed pharmacologically. A movable target is
then placed in front of the eye to find out the distance through which, the target is
viewed clearly without the perception of blur. This range of distance is the
subjective DOF. In an objective measurement, on the other hand, the
accommodation of the eye would not be paralysed and the subject‟s
accommodation response is continuously monitored. The range of distance the
target can be displaced without causing any change in the state of accommodation
is the objective DOF. The subjective DOF is typically larger than the DOF
measured objectively (Vasudevan, Ciuffreda & Wang, 2007).
The subjective DOF can be assessed using a variety of methods based on a range
of different criteria (Atchison, Charman & Woods, 1997; Marcos, Moreno &
Navarro, 1999). The most frequently used criteria include decrease of visual
acuity, perception of just detectable image blur, and loss of visibility of target
details (Wang & Ciuffreda, 2006). Because of different stimulus and
methodologies adopted, studies have shown a wide range of DOF values
(Campbell, 1957; Oshima, 1958; Charman & Whitefoot, 1977; Legge et al, 1987;
Atchison, Charman & Woods, 1997; Marcos, Moreno & Navarro, 1999) from as
low as 0.02 D (Oshima, 1958) to as large as 3.6 D (Charman & Whitefoot, 1977).
DOF in the eye can be affected by different factors, which are categorized as
internal and external factors. External factors refer to the properties of the visual
target and test environment, whereas internal factors refer to the optical properties
of the eye, and retinal and visual processing properties of the individual‟s neural
system. The effects of external factors of targets and environment, and optical

30
properties of the eye to the DOF have been extensively studied by different
groups. These external and internal factors are further divided (Atchison and
Smith, 2000):
1) External factors: luminance, spatial detail, contrast, and spectral profile (e.g.
colour of the target).
The DOF decreases as the target or environment luminance increases (Campbell,
1957; Tucker & Charman, 1986). Some studies show slight increase of DOF at
very low contrast levels (Campbell, 1957; Atchison, Charman & Woods, 1997).
Previous studies have shown that increase of spatial frequency or target details
cause a decrease of DeOF (Ogle & Schwartz, 1957; Tucker & Charman, 1975,
1986; Atchison, Charman & Woods, 1997; Marcos, Moreno & Navarro, 1999).
Changes of wavelength of light cause variation in the resolving power of retina. It
was also found that the DOF is smaller near the middle of the visible spectrum,
and becomes larger towards directions of either infrared or ultraviolet wavelength
(Campbell, 1957; Marcos, Moreno & Navarro, 1999).
2) Internal factors include: pupil diameter, refractive error, and monochromatic
and chromatic aberrations, photoreceptor size and ganglion cell density,
visual acuity and contrast threshold, and disease in the optical pathway.
Change of pupil size interacts with other optical properties of the eye. It affects
the amount of light entering the eye, the magnitude of certain aberrations and the
diffraction states of the eye. When the pupil becomes smaller, the DOF increases
(Campbell, 1957; Charman & Whitefoot, 1977; Tucker & Charman 1975, 1986;
Legge et al., 1987; Atchison, Charman & Woods, 1997).
The DOF can be also affected by the higher order aberrations (HOAs). In a linear
optical system, the monochromatic HOAs and chromatic aberrations are known
to compromise the image quality (e.g., compromise the visual acuity and contrast
sensitivity at the optimal focus), but at the same time increase the DOF. This
connection between HOA and DOF has been studied by different research groups.
By applying spherical and irregular aberrations to a theoretical eye model, Nio et
al (2002) found that HOA helps to increase the DOF, while at the same time
lowering the modulation transfer at higher frequencies. A slightly larger depth of

31
focus was found in myopes (Rosenfield and Abraham-Cohen, 1999; Collins et al.,
2006; Vasudevan et al., 2006), presbyopes (Nio et al., 2000) and hyperopes
(Vasudevan et al., 2006) compared to young emmetropic subjects, which may be
partially due to their increased amount of HOA (Mclellan et al., 2001; Artal et al.,
2002; He et al., 2002; Llorente et al., 2004). For patients who have undergone
conventional laser refractive surgery, significant amounts of HOAs could be
induced (Oliver et al., 1997; Marcos, 2001; Pesudovs, 2005). Artola et al (2006)
reported delayed onset of presbyopia after photorefractive keratectomy for a
group of myopic subjects, which was believed to be due to larger DOF caused by
positive spherical aberration induced by laser corneal ablation. Different DOF
was also found in patients implanted with spherical and aspheric IOLs (Marcos et
al., 2005; Rocha et al., 2007; Nanavaty et al., 2009). The aspheric design may
degrade the distance-corrected near and intermediate visual acuity after reducing
the total spherical aberration in the eye. Recently, Rocha et al (2009) investigated
the different effect of individual 3rd and 4th order Zenike polynomial coefficients
(spherical aberration, coma and trefoil) on DOF using an AO stimulus. It was
found that certain amounts of spherical aberration can significantly enhance the
DOF, while other HOA had only minimal effect.
Currently, introducing controlled levels of spherical aberration has been adopted
clinically as a passive approach to help presbyopic patients to regain part of their
near vision with simultaneous corrections including bifocal, multifocal contact
lenses and intraocular lenses (Bradley et al., 1993; Plakitsi and Charman, 1995).
However, the application of possible optimal combination of aberrations, rather
than primary spherical aberration, to extend the DOF has not yet been
investigated.

32
2.2 Wavefront aberrations and retinal image quality
In this section, an overview is given of the wavefront aberrations in the human
eye, the methods of wavefront measurement and factors affecting the wavefront
aberrations. The way that aberrations influence the retinal image quality and
image quality metrics (IQMs), which can be used to quantify the effect, is also
reviewed.
2.2.1 Wavefront aberrations
To define the concept of wavefront aberration, it is necessary to define the
wavefront of a point light source, and before that, the concepts of optical path
length (OPL) and optical path difference (OPD).
From a clinical perspective, the most frequently used explanation for wavefront
aberration is by errors of the optical path length (OPL). The optical path length
specifies the number of times a light wave needs to oscillate travelling from point
A to another point B. It is defined mathematically as the integration of the
refractive index with respect to the distance along the ray path from A to B
(Goodman, 1996; Mahajan, 1998).
OPL = B
Adssn )( (2-1)
If the light ray is travelling in homogenous materials, it becomes the sum of
distance travelled in each material multiplied by the refractive index of that
material.
m
i
ii snOPL1
(2-2)
For an incident beam entering from the air to the cornea, the OPL can be simply
calculated by
'21 nsnsOPL (2-3)
where n and n' are refractive indices of air and the cornea respectively. Since the
propagating speed of light is slower in optically denser media, more oscillations
will occur in the eye than with the same physical distance in air. Although the
33
light rays from a point source are emitted in different directions, they have the
same OPL at any instant in time.
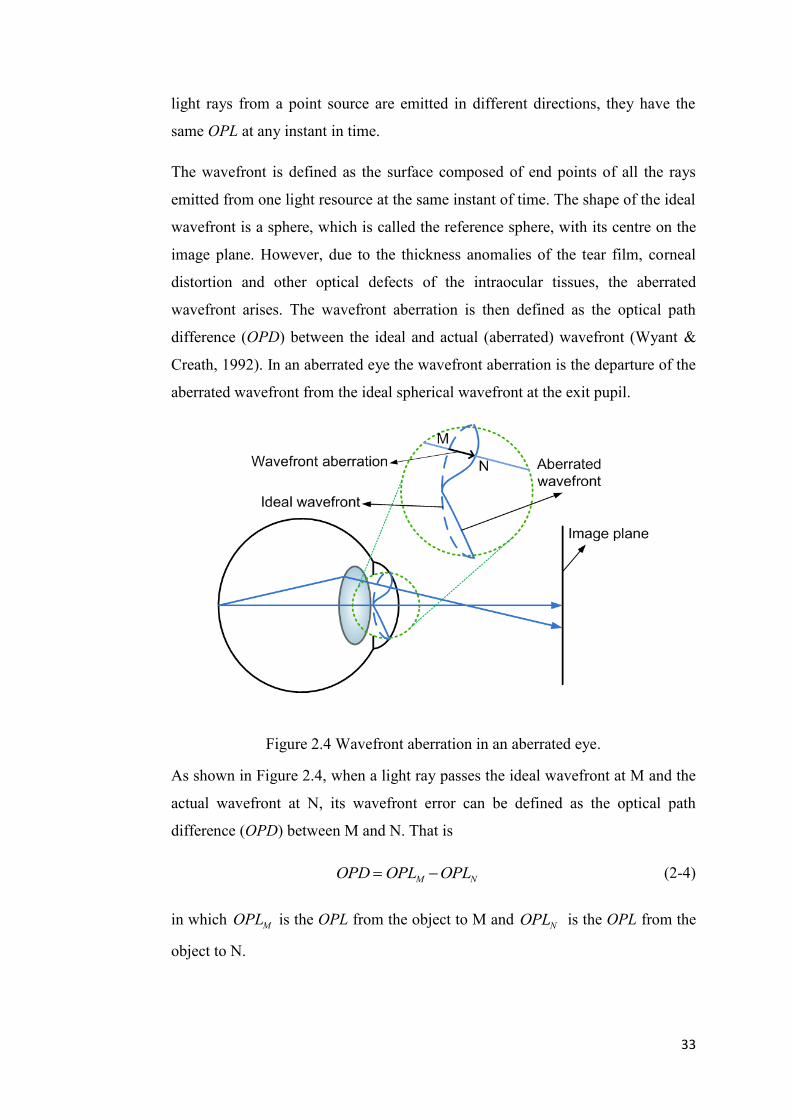
The wavefront is defined as the surface composed of end points of all the rays
emitted from one light resource at the same instant of time. The shape of the ideal
wavefront is a sphere, which is called the reference sphere, with its centre on the
image plane. However, due to the thickness anomalies of the tear film, corneal
distortion and other optical defects of the intraocular tissues, the aberrated
wavefront arises. The wavefront aberration is then defined as the optical path
difference (OPD) between the ideal and actual (aberrated) wavefront (Wyant &
Creath, 1992). In an aberrated eye the wavefront aberration is the departure of the
aberrated wavefront from the ideal spherical wavefront at the exit pupil.
Figure 2.4 Wavefront aberration in an aberrated eye.
As shown in Figure 2.4, when a light ray passes the ideal wavefront at M and the
actual wavefront at N, its wavefront error can be defined as the optical path
difference (OPD) between M and N. That is
NM OPLOPLOPD (2-4)
in which MOPL is the OPL from the object to M and NOPL is the OPL from the
object to N.

34
2.2.2 Representing wavefront aberrations
Wavefront aberrations are used as a general means to express the optical defects
of optical systems. Different polynomials have been suggested as the
mathematical function to express wavefront aberrations. Among them, the
Zernike polynomials are the most widely adopted tool due to the following
advantages: 1) the Zernike polynomials can be easily related to ophthalmic
sphero-cylinder refractive errors; 2) the Zernike polynomials are a complete set of
polynomials that are orthogonal over the unit circle (Thibos et al., 2000; Iskander,
Collins & Davis, 2001); 3) the sum of squares of the coefficients represents the
variance of wavefront aberration; and 4) the lower order truncated Zernike
polynomials are exchangeable with lower order Taylor expansions (Tyson, 1982;
Conforti, 1983).
Because the Zernike series is orthogonal, wavefront aberrations of the eye can be
decomposed into different Zernike modes, analysed mode by mode to study the
aberration distribution, and then recombined (Iskander, Collins & Davis, 2001).
The wavefront aberration can be modelled by a finite series of Zernike
polynomials
),(),(),(1
P
p
ppZaW (2-5)
In the above equation:
W ),( wavefront aberration,
index p polynomial-ordering number,
pZ ),( pth Zernike polynomial,
p =1, 2… P,
pa coefficient associated with ),( pZ ,
p order,
ρ normalized distance from the origin,

35
θ angle,
ε ),( measurement and modelling error (noise).
The pth-order Zernike polynomial is defined as
0 ),(1
0, odd ),sin()()1(2
0even ),cos()()1(2
),(0
mRn
mpmRn
p,mmRn
Z
n
m
n
m
n
p
(2-6)
where
! )2
( ! )2
( !
)!()1( 22/)(
0
snmn
s
sm
n
smn
smn
s
snR
(2-7)
in which n is the radial degree and m is the azimuthal frequency.
Figure 2.5 First 28 terms of the Zernike polynomials.

36
The first 28 terms of the Zernike polynomials up to the 6th
radial order are shown
in Figure 2.5. They include the lower-order aberrations (0~2nd
radial order) and
higher order aberrations (>2nd
radial order). The 0th
and 1st order terms (piston
and tilts) do not affect the image quality and are usually ignored, when wavefront
aberrations of a single eye are studied.
Figure 2.6 Refractive errors in the human eye.
The traditional spherical and cylindrical refractive errors of defocus ( 0
2Z ) and
astigmatism ( 2
2
2
2 ,ZZ ) as shown in Figure 2.6, can be also described by the lower
order Zernike polynomials. An eye with its far point of distant vision at infinity is
called an emmetropic eye. The parallel light rays from infinity will focus on its
retina (Figure 2.6a). Due to the spherical refractive error, in a myopic eye, the
image formed by parallel light is focused in front of the retina (Figure 2.6b). In
eyes with hyperopia, parallel light rays focus behind the retina as shown in Figure
2.6c. When the refractive power varies across the meridians of the pupil centre,
two perpendicular meridians with the maximum and minimum power can be
defined. This is the condition called astigmatism (Figure 2.6d).
37
2.2.3 Wavefront sensing for the human eye
Wavefront sensing is an important technique helping us to better understand the
optical quality of the eye, and providing aids to develop advanced vision
correction methods such as customized contact lenses, customized refractive
surgery and adaptive optics (Yoon, 2006). Wavefront aberrations in the human
eye have been noticed and studied as early as the time of Thomas Young (1801),
while some authors believe the earliest study even started in the 17th
century.
However, the first success in measuring the 2-dimentional ocular wavefront
aberrations was achieved by Smirnov in 1961 (Smirnov, 1961). He used a
modified Scheiner double pinhole, with one pinhole fixed and the other pinhole
moving across the pupil to subjectively map the ray orientations and then derive
the wavefront map. Although the process was labour intensive, he was able to
demonstrate that there were differences of aberrations between different eyes and
hence made the suggestion of using customized contact lenses to correct the
wavefront aberrations of the eye.
Wavefront sensing techniques can be categorized by whether the measurement is
based on a subjective or objective method. It is difficult to measure the wavefront
aberrations accurately using subjective methods due to the prolonged
measurement period and its dependence on the subject‟s judgement. The modern
wavefront sensors are mostly based on the objective method. During the past two
decades, a variety of designs of aberrometers became commercially available for
routine measurement of the eye‟s aberrations (Atchison, 2005). Among the
commercially available instruments, the Hartmann-Shack wavefront sensor is one
of the most widely adopted aberrometers to obtain the wavefront aberration map.
The Hartmann-Shack method was originally used in astronomy to measure
aberrations caused by turbulence in the earth‟s atmosphere to improve telescopes‟
performance (Platt & Shack, 1971). In 1994, Liang et al used this approach to
evaluate the wavefront aberrations in the eye (Liang et al, 1994). Since it offers
advantages in terms of accuracy, reliability and speed, the Hartmann-Shack
wavefront sensor has became the most popular measurement system to analyse
aberration structure of human eye for both research and clinical purposes (Thibos
& Hong, 1999; Cheng et al, 2003a; Lawless and Hodge, 2005).

38
Figure 2.7 Concept of an aberrometer based on the Scheiner-Hartmann-Shack
principle.
Liang‟s concept of the Scheiner-Hartmann-Shack aberrometer is shown in Figure
2.7. A narrow beam from the monochromatic light source (the Laser diode) was
collimated and delivered to the eye, which projects a light spot on the retina. Part
of the light is reflected back from the point source. Because the shape of an
aberrated wavefront surface changes as it propagates, the exit pupil of the eye is
imaged to the lenslet array of the CCD camera by a set of relay lenses. The
wavefront aberrations at the exit pupil of the eye are then measured.

39
Figure 2.8 Grid pattern of (a) the ideal wavefront, and of (b) an aberrated
wavefront.
As shown in Figure 2.7, the reflected wavefront passes through the micro lenslet
array and finally focuses on a CCD sensor. In a perfect eye, the reflected plane
wave will be focused into images with each point locating on the optical axis of
the corresponding lenslet (displayed as Figure 2.8a). Otherwise, the aberrated
wavefront shows a distorted grid pattern (as shown in Figure. 2.8b). It can be seen
that the local slope of the wavefront is different for each lenslet, and therefore the
wavefront will be focused into an irregular grid pattern. By measuring the
displacement of each point from its corresponding lenslet axis, the slope of the
aberrated wavefront when it entered the lenslet can be calculated. After
mathematical integration of the slope, the final aberration map will be obtained. A

40
detailed algorithm of calculating the aberration map from the wavefront slope is
described by Liang et al. (1994). The measured wavefront aberrations can be
described and analyzed with the earlier introduced Zernike polynomials
2.2.4 Monochromatic wavefront aberrations in normal human eyes
From both a fundamental and a clinical point of view, it is important to
understand the distribution of the wavefront aberrations in the population of
normal human eye, and to describe them effectively. Different groups have
performed studies on the monochromatic wavefront aberrations in populations of
normal human eyes (Porter et al., 2001; Castejón-Mochón et al., 2002; Thibos et
al., 2002; Wang and Koch, 2003a; Salmon and van de Pol, 2006). A summary of
each study is shown in Table 2.1.
Table 2.1 Studies of monochromatic wavefront aberrations in normal human eyes.
Investigators
(year)
Subjects
(No. of
eyes)
Age
(mean±std)
Refractive
error (D)
Tested
pupil
size
(mm)
Zernike
orders
HOA
RMS
(µm)
Porter et al
(2001)
109
(NA)
21~65
(41±11)
Sph: -12 ~
6
Cyl: -3 ~ 0
5.7 2nd
~5th
NA
Castejón-
Mochón
et al (2002)
59
(108)
20~30
(24)
NA 5.0 2nd
~5th
NA
Thibos et al
(2002)
100
(200)
22~35
(26±6)
Sph: -10 ~
5
Cyl: -1.75
~ 0
6.0 2nd
~7th
NA
Wang &
Koch (2003)
306
(532)
20~71
(41±10)
Sph:-
11.6~7.6
6.0 2nd
~7th
0.305
±0.095
Salmon &
van de Pol
(2006)
1433
(2560)
Pooled data Pooled
data
6.0 Pooled
data
0.33
±0.14
Porter et al (2001) investigated the distribution of monochromatic aberrations
from the 2nd
to the 5th
order across a 5.7 mm pupil in 109 normal subjects.
Castejón-Monchón and coauthors (2002) studied the monochromatic aberrations
from 108 young eyes across a 5 mm pupil. Thibos et al (2002) measured the
monochromatic aberration structure of 200 cyclopleged normal eyes. Wang and

41
Koch examined the ocular HOAs across a 6 mm pupil in 532 eyes and analyzed
the Zernike aberrations up to the 7th
radial order. An important study was later
performed by Salmon and van de Pol (2006), analyzing the pooled wavefront data
from 10 laboratories contained 2560 eyes of 1433 subjects.
There is some variation in the results between the studies (Table 2.1), which may
due to the differences of subject‟s age, refractive error, pupil size and
measurement technique. However, there are also common findings in these
studies including:
1) The second order wavefront aberrations account to the majority of the
total aberrations. Porter et al (2001) found that the second order
aberrations account for about 92% and 3rd
~5th
order aberrations account
for about 7% of the total aberrations, respectively. Castejón-Monchón et
al (2002) reported about 91% of the root-mean square (RMS) wavefront
error corresponds to the second order aberrations. In the study of Thibos
et al (2002), after correcting the subjects‟ defocus and astigmatism with
spectacle lenses, for most eyes the residual second-order wavefront
variance was still greater than the combined higher order wavefront
variance.
2) Correlations of wavefronts between left and right eyes were studied in all
five studies. Zernike coefficients of defocus ( 0
2C ), primary spherical
aberration ( 0
4C ) and horizontal astigmatism ( 2
2C ) showed the highest
correlations.
3) Most Zernike coefficients have mean values around zero, with large inter-
subject variability. One clear exception in HOAs is the spherical
aberration, which is systematically biased towards positive values for the
unaccommodated eye. Porter and coauthors (2001) reported a mean value
of spherical aberration of 0.138 ± 0.103 µm across a 5.7 mm pupil.
Salmon and van de Pol (2006) reported a mean value of 0.128 ± 0.096 µm
in a 6 mm pupil. A slightly lower mean value of 0.101 ± 0.103 µm (in a
6 mm pupil) was found by Wang and Koch (2003a).
42
2.2.5 Factors affecting wavefront aberrations in the human eye
The ocular aberrations vary due to a variety of factors. The effects of pupil size,
accommodation, age, refractive error, keratoconus, and corneal refractive
procedures will be discussed in this section.
Pupil size
The diameter of pupil can vary from about 2.0 mm under a high illumination
environment to about 8.0 mm in a dark environment (Reeves, 1920; Crawford,
1936). In a pupil size smaller than 2.0 mm, diffraction affects the image quality
more than aberrations (Atchison & Smith, 2000). A larger pupil will allow the
light rays to enter the eye through the periphery of cornea and crystalline lens
with larger incident angles compared to the paraxial rays, which may cause an
increase of wavefront aberrations. As the pupil size increases, the effect of
aberrations on image quality increases, and becomes more dominant in the larger
pupil.
Castejón-Mochón et al (2002) found the HOA RMS in 70 young eyes increased
significantly in larger pupils compared to the value in a smaller pupil. They
recorded average HOA RMS values of 0.02 µm, 0.14 µm and 0.40 µm, and these
values accounted for approximately 2.7%, 9.2% and 13.8% of the total wavefront
RMS in corresponding pupil diameters of 3.0 mm, 5.0 mm and 7.0 mm,
respectively. An increase in HOA with pupil size was also reported in the study
of Thibos et al (2002), who analysed the dependence of HOA RMS error on pupil
size for four pupil diameters of 3.0, 4.5, 6.0 and 7.5 mm. All Zernike wavefront
aberrations from the 2nd
to 6th
radial order increased with the pupil size. In the
study of Wang et al (2003) involving 51 myopic subjects, the authors found
significant increases of RMS values in Zernike aberrations through the 3rd
to 6th
radial order when the pupil diameter changed from 4 mm to 5 mm, and from
5 mm to 6 mm. A similar trend was also reported by Salmon and van de Pol
(2006) from their study on the pooled wavefront data from more than 2000 eyes.
Accommodation
Accommodation refers to the dynamic changes in optical power of the eye to
bring objects at different distances into focus. In an accommodated eye, the

43
crystalline lens changes its shape, position, and refractive index gradient (Brown,
1973; Garner & Smith, 1997; Dubbelman et al, 2003), which alters the eye‟s
optical structure and hence causes changes in the wavefront aberrations.
Accommodation-induced changes of aberrations including changes of defocus
(Ciuffreda, 1991; Garner & Yap, 1997), astigmatism (Millodot & Thibault, 1985;
Ukai & Ichihashi, 1991; Tsukamoto et al., 2000; Mutti, Enlow & Mitchell, 2001)
and HOAs (Koomen, Tousey & Scolnik, 1949; Ivanoff, 1956; Jenkins, 1963;
Howland & Buettner, 1989; Atchison et al., 1995; He, Burns & Marcos, 2000;
Ninomiya et al., 2002; Cheng et al., 2004; Buehren & Collins, 2006) have been
reported in different studies.
Among the HOA terms, a general trend of spherical aberration changing in the
direction to negative with increase in accommodation has been observed (Ivanoff,
1956; Jenkins, 1963; He, Burns & Marcos, 2000; Ninomiya et al., 2002; Cheng et
al., 2004; Buehren & Collins, 2006). Changes of other HOAs with
accommodation were believed to not be systemic by some researchers (He, Burns
& Marcos, 2000). However, a recent study by Ninomiya et al (2002) compared
the monochromatic wavefront aberrations of 33 eyes from 33 young adults
measured under the non-accommodative state and at a 3.0 D accommodative
level. They found significant changes of both 0
4C and 0
6C (p=0.02 and p=0.004, in
a 6 mm pupil) after accommodation. In the study of Cheng et al (2004), the
wavefront aberrations in a large young adult population for accommodative
stimuli up to 6.0 D were studied. The authors reported a significant negative shift
of 0
4Z as the accommodative level increased, while the 0
6Z also had a trend of
increase towards positive values at higher accommodative level. Roorda and
Glasser (2004) studied the wavefront aberrations of an isolated crystalline lens
with a laser ray trace scanning technique. In their experiment, the most noticeable
changes with accommodation were observed for 0
4Z , which became more negative,
and 0
6Z , which progressed from negative to positive.
Age
The normal aging process affects all ocular tissues and causes changes to both
neural and optical parameters of the human eye. Increases of wavefront

44
aberrations have been found in aged eyes by different studies (McLellan, Marcos
& Burns, 2001; Artal et al., 2002; Kuroda et al., 2002; Wang & Koch, 2003;
Amano et al., 2004; Applegate et al., 2007; Atchison & Markwell, 2008; Plainis
& Pallikaris, 2008). Artal et al (2002) reported an increase rate of around
0.011 µm/year in the RMS value of total ocular HOAs (5.9 mm pupil), while
Atchison and Markwell (2008) reported a much lower rate of 0.00093 µm/year in
a group of emmetropic eyes in a recent study (5 mm pupil). Among the HOAs,
coma and spherical aberration were found to increase with age in some studies
(McLellan et al., 2001; Artal et a., 2002; Applegate et al., 2007). These changes
in the ocular aberrations may be contributed by the age-related changes of two
major optical components, the cornea and crystalline lens.
It is found that the radius of curvature of cornea decreases with age, and the
asphericity also changes (Kiely, Smith & Carney, 1982, 1984; Hayashi, Hayashi
& Hayashi, 1995; Dubbelman, Sicam & Van der Heijde, 2006). Increases of
corneal aberrations with age have been studied by different groups (Oshika et al.,
1999; Guirao, Redondo & Artal, 2000; Artal et al., 2002; Wang et al., 2003;
Amano et al., 2004). Most studies showed great variation of corneal aberrations
between subjects, and found the corneal HOAs increase slightly with age.
However, this increase of corneal HOAs alone is not enough to explain the
substantial reduction of retinal image quality in aged eyes (Artal et al., 1993.)
Age-related changes in the crystalline lens are another factor affecting the eye‟s
optical performance. Tissue of the crystalline lens grows continuously throughout
life and produces a negative impact on the optical performance of the eye
(Scammon & Hesdorffer, 1937; Glasser & Campbell, 1999). The weight of
isolated lens increases at a uniform rate of 1.33 mg per year, which results in an
increase of approximately 150% in the mass over the life span (Glasser &
Campbell, 1999). In a cross-sectional study involving 100 subjects of different
ages, Brown (1974) reported a substantial decrease of the anterior lens surface
with the increase of age. The axial length thickness and equatorial diameter of the
lens also increases throughout the life span (Dubbelman & Van der Heijde, 2001;
Kasthurirangan et al., 2008). Kasthurirangan et al (2008) found an increase of
0.98 mm and 0.28 mm of the lens thickness and equatorial diameter, respectively,
in a group of aged eyes (mean age 64 years) compared to a younger group (mean

45
age 23 years). The gradient refractive index of the lens also changes with the age.
Dubbelman & Van der Heijde (2001) found a small, but significant decrease of
the equivalent refractive index of the lens with age. More recent studies (Jones,
Atchison & Pope, 2007; Kasthurirangan et al., 2008) indicated that the refractive
index of central plateau region remained unaffected, while the refractive index at
the periphery declined in older lenses. Furthermore, a mechanism of optical
balance, produced by the internal ocular surfaces, to partially compensate the
corneal aberrations, can be observed in most young eyes (Artal et al., 2001; Kelly,
Mihashi & Howland, 2004), but is not present in older subjects (Artal et al., 2002).
Refractive error
Conflicting results are found in literature of the impact of refractive errors on the
optical structure and higher order aberrations of the eye. There is some evidence
of changes in optical components with refractive errors (Lam et al, 1999).
Corneal radius was found to be significantly correlated with refractive error in
some studies, where myopes were found to have steeper corneas than emmetropes
(Carney, Mainstone & Henderson, 1997; Goss et al., 1997; Strang, Schmid &
Carney, 1998; Llorente et al., 2004a; Atchison, 2006), while hyperopes have
flatter corneas (Llorente et al., 2004a). However, the same results could not be
obtained by other studies (Mainstone et al., 1998; Horner et al., 2000). A study by
Atchison (2006) reported that the anterior corneal asphericity is not significantly
affected by myopia, but Horner et al (2000) reported a strong correlation between
change in shape of the peripheral cornea and myopia progression. Llorente et al
(2004a) also found more negatively aspheric corneas in myopes than in
hyperopes.
There are also conflicting findings on the relation of refractive errors and HOAs
in the human eye. Some authors reported no significant changes of HOAs with
myopia (Carkeet et al., 2002; Cheng et al., 2003b; Netto et al., 2005; Zadok et al.,
2005; Atchison, Schmid & Pritchard, 2006), while other researchers reported
moderate increase of HOAs in myopes (Marcos et al., 2000; He et al., 2002;
Paquin, Hamam & Simonet, 2002; Buehren, Collins & Carney, 2005). One study
by Llorente et al (2004a) showed greater HOAs in hyperopes than in myopes.
Cheng et al (2003b) found that astigmatic eyes tended to have larger total HOAs

46
than non-astigmatic eyes. In earlier studies adopting the Howland crossed-
cylinder aberroscope, Applegate (1991) found significant increase of coma and
spherical aberration in some myopic subjects and reported a mean increase of
aberrations in myopes, while Collins, Wildsoet & Atchison (1995) also found
large amount of aberrations in more than one third of their myopic subjects.
Theoretically, myopia caused by greater eye length should be accompanied by
increase of positive spherical aberration (Cheng et al, 2003b; Atchison et al.,
2004; Atchison & Charman, 2005). However some studies have demonstrated
decreases of spherical aberration in low myopia (Collins, Wildsoet & Atchison,
1995; Carkeet et al., 2002), or no significant increase of spherical aberration with
myopia (Porter et al, 2001; Cheng et al., 2003b). The study by He et al (2002)
reported slightly but significantly greater RMS values of aberrations through the
2nd
to 7th
Zernike radial orders in myopic adults compared with emmetropic
adults.
Keratoconus
Keratoconus is a progressive non-inflammatory corneal disorder, which affects
the shape, structure and transparency of the cornea and causes significant visual
problems. The estimated prevalence of keratoconus in the general population is
about 50-230/100,000 (Rabinowitz, 1998). It is currently the major indication for
cornea transplantation in developed countries (Lois et al., 1997; Liu & Slomovic,
1997).
Significant amounts of corneal and ocular HOAs are induced by the distortion of
cornea in keratoconus compared to normal eyes (Maeda et al., 2002; Gobbe &
Guillon, 2005; Alió & Shabayek, 2006; Lim et al., 2007; Schlegel et al., 2009).
Gobbe and Guillon (2005) studied the corneal HOAs in a group of keratoconics
and found they had a mean HOA RMS approximately 10 times that of the control
group. Schlegel et al (2009) reported a 6.3 times larger mean RMS of total
corneal HOAs in keratoconus than in normal eyes. Total coma, trefoil and
spherical aberration were also found to be 10 times, 5 times and 2.5 times larger
in the keratoconic subjects. Maeda et al (2002) compared the ocular aberrations in
35 keratoconic eyes and 38 normal eyes using a Hartmann-Shack wavefront
sensor. The authors reported that the keratoconic group had mean RMS of coma-

47
like aberrations and forth-order aberrations approximately 9.4 and 4.6 times of
those found in control group. Lim and co-authors (2007) also found a similar
trend in their study, reporting significantly larger ocular HOAs in total HOA
RMS and 3rd
order RMS than normal eyes. The vertical coma ( 1
3
Z ), followed by
trefoils ( 3
3
Z and 3
3Z ), and spherical aberration ( 0
4Z ) were found to be the most
dominant HOAs in both corneal and ocular aberrations in keratoconic eyes.
Corneal refractive procedures
The cornea is the major refractive component in the human eye. It contains
approximately two thirds of the unaccommodated eye‟s optical power (Carney,
Mainstone & Henderson, 1997; Artal & Guirao, 1998; Courville, Smolek &
Klyce, 2003). In the ocular system, it is the outer-most surface and acts as a
convex lens bending and refracting the light that passes through the cornea. Any
changes in the shape of the corneal surfaces will alter the corneal aberrations and
therefore affect the ocular aberrations. Nowadays, some patients choose vision
corrections by means of corneal refractive procedures to reduce their dependence
on spectacles and contact lenses. These procedures may induce additional higher
order aberrations to the eye while correcting the conventional refractive errors
and degrade the patient‟s visual acuity and retinal image quality (Marcos, 2001;
Mrochen et al., 2001; Moreno-Barriuso et al., 2001; Joslin et al., 2003; Ninomiya
et al., 2003; Wang & Koch, 2003; Berntsen, Barr & Mitchell, 2005; McCormick
et al., 2005; Pesudovs, 2005; Hiraoka et al., 2005, 2007; Subbaram et al., 2006;
Benito, Redondo & Artal, 2009; Padmanabhan et al., 2009).
I) Orthokeratology
Orthokeratology is a method of temporarily reshaping the corneal surface to
change the refraction in myopic patients by programmed application of rigid gas
permeable (RGP) contact lenses. The central cornea is flattened and thinned
during the lens wearing, resulting in a reduction of myopia and an improvement
of unaided vision (Nichols et al., 2000; Swarbrick, 2006). After wearing of the
RGP lens is ceased, the cornea can gradually return to the original shape
(Mountford, 1997, 1998).
48
Current methods of orthokeratology can help to eliminate low to moderate
myopia. However the changes in the central corneal curvature induce significant
amount of HOAs, particularly spherical aberration (Joslin et al., 2003; Berntsen,
Barr & Mitchell, 2005; Hiraoka et al., 2005, 2007). Joslin et al (2003) studied the
changes of HOAs (through the 3rd
to 6th
order) in 18 eyes after one month of
orthokeratology. The authors found significant increases of the total HOAs in
both studied pupil sizes of 3.0 mm (a factor of 2.66) and 6.0 mm (a factor of 2.50).
Among all the HOAs, the coefficient of primary spherical aberration ( 0
4C ) was
affected the most by orthokeratology, increasing from 0.084±0.16 to
0.39±0.16 µm in a 6.0 mm pupil. Similar results were observed by Berntsen and
coauthors (2005) in a group of subjects one month after treatment. Berntsen, Barr
and Mitchell (2005) observed an increase of almost five times for primary
spherical aberration in a 5.0 mm pupil. Hiraoka et al (2005) reported significant
increases of the third and fourth order wavefront RMS in 64 eyes with overnight
orthokeratology for myopia. They found approximately two and three fold
increases of the fourth order RMS in 3.0 mm pupil and 6.0 mm pupil,
respectively. Significant changes were also observed for vertical coma, which
changed from positive to negative, and for horizontal coma, which greatly
increased in the positive direction. Strong correlation was found between the
increase of HOAs and myopia correction.
The induction of HOAs by orthokeratology, in even the clinically successful
cases, may cause an overall reduction of contrast sensitivity function (Hiraoka et
al., 2007) and losses in low contrast best corrected visual acuity (Berntsen, Barr
& Mitchell, 2005).
II) Laser refractive surgery
Laser refractive surgery is one of the most technologically advanced methods
available today to reduce the dependence on spectacles and contact lenses
(Brunette, Gresset & Boivin, 2000; Pesudovs, Garamendi & Elliott, 2006).
During the procedures (phororefractive keratectomy (PRK) or Laser in situ
keratomileusis (LASIK)), the front corneal surface is reshaped by a photoablation
effect produced by an excimer laser to correct the refractive error (Li & Zhu,
2001).

49
Many studies have found significant increases of HOAs in patients who have
undergone laser refractive surgeries (Marcos, 2001; Mrochen et al., 2001;
Moreno-Barriuso et al., 2001; Ninomiya et al., 2003; Wang & Koch, 2003;
McCormick et al., 2005; Pesudovs, 2005; Subbaram et al., 2006; Benito,
Redondo & Artal, 2009; Padmanabhan et al., 2009). For patients who have
undergone conventional myopic correction, root mean square (RMS) values of
both total higher order aberrations (HOAs) and spherical aberration were found to
be dramatically increased. Marcos (2001) and Moreno-Barriuso et al (2001)
studied the post-operative aberrations in a group of subjects across a 6.5 mm
pupil using laser ray tracing technology. They reported a 1.9 times increase of
total higher order aberrations RMS and approximately 3.7 times increase in
spherical aberration. Ninomaya et al (2003) reported 2 and 3 times increase of
total HOAs RMS in subjects who have undergone laser myopic correction in
pupil diameters of 4 mm and 6 mm, respectively. Positive spherical aberration is
typically induced after corneal reshaping for myopia correction and there is a
strong positive correlation between the induced spherical aberration and the
amount of myopia corrected, as found in both clinical results (Hong & Thibos,
1999; Seiler et al., 2000; Moreno-Barriuso et al, 2001; Hersh, Fry & Blaker, 2003)
and theoretical studies (Hersh, Fry & Blaker, 2003; Yoon et al., 2005).
Significant increases of RMS values of total HOAs were also reported by studies
on outcomes of LASIK correction for hyperopia (Wang and Koch, 2003; Ma et
al., 2004; Llorente et al., 2004b; Benito, Redondo & Artal, 2009). Llorente et al
(2004) reported a 2.2 times increase in RMS of total HOAs for 13 eyes after
receiving standard LASIK presbyopic treatment. Benito, Redondo & Artal (2009)
observed an average 2.3 times higher induction of HOAs in 6 subjects who have
undergone laser correction for hyperopia across a 6 mm pupil. Smaller but still
significant increases of ocular HOAs were found in studies of Wang and Koch
(2003), and Ma et al (2004). However, spherical aberration was found to be
significantly reduced after laser hyperopic correction in all four studies.
The technology of customized LASIK correction adopting scanning spot laser
and wavefront based ablation profile was reported to reduce the post-operative
induced HOAs in 33% to 47% of the treated eyes (Krueger et al., 2001; Mrochen,
Kaemmer & Seiler, 2001). However, an average increase of 0.12 ±0.18 µm in

50
post-operative HOAs RMS was still found by Subbaram et al (2005) in 330
myopic eyes treated by the customized ablation, possibly due to the effects of
decentration and wound healing after surgery.
The increase of HOAs after corneal refractive surgeries can cause losses in low
contrast visual acuity (Marcos, 2001). In some cases of moderate to high myopic
correction, the irregularity of post-operative corneas may produce optical side
effects such as glare, halo, and monocular diplopia, which bring risks to the
patient for night driving (Hersh et al., 2000; Pop & Payette, 2004).
2.2.6 Wavefront aberrations, retinal image quality, and retinal image
quality metrics (IQM)
In this section, the effect of higher order aberrations (HOAs) on retinal image
quality and image quality metrics will be reviewed.
It is well known that the human eye suffers from high order aberrations besides
defocus and astigmatism (Smirnov, 1962; Howland & Howland, 1977; Liang et
al., 1994). Except when the pupil size is very small (e.g., in a 2.0 mm pupil), the
HOAs show a deleterious effect on the retinal image quality. It is important to
quantify the effects of different wavefront aberrations on retinal image quality.
The retinal image quality can be estimated from aberrations by double pass
techniques (Artal 1990). The commonly used criteria for analysis of image
quality in an optical system include the point spread function (PSF) and optical
transfer function (OTF).
Point spread function (PSF)
The image of a point object through an optical system is called a point spread
function. A perfect optical system images a point source into a compact, high-
contrast retinal image, while an aberrated system shows a less compact and lower
contrast image, as shown in Figure 2.9.
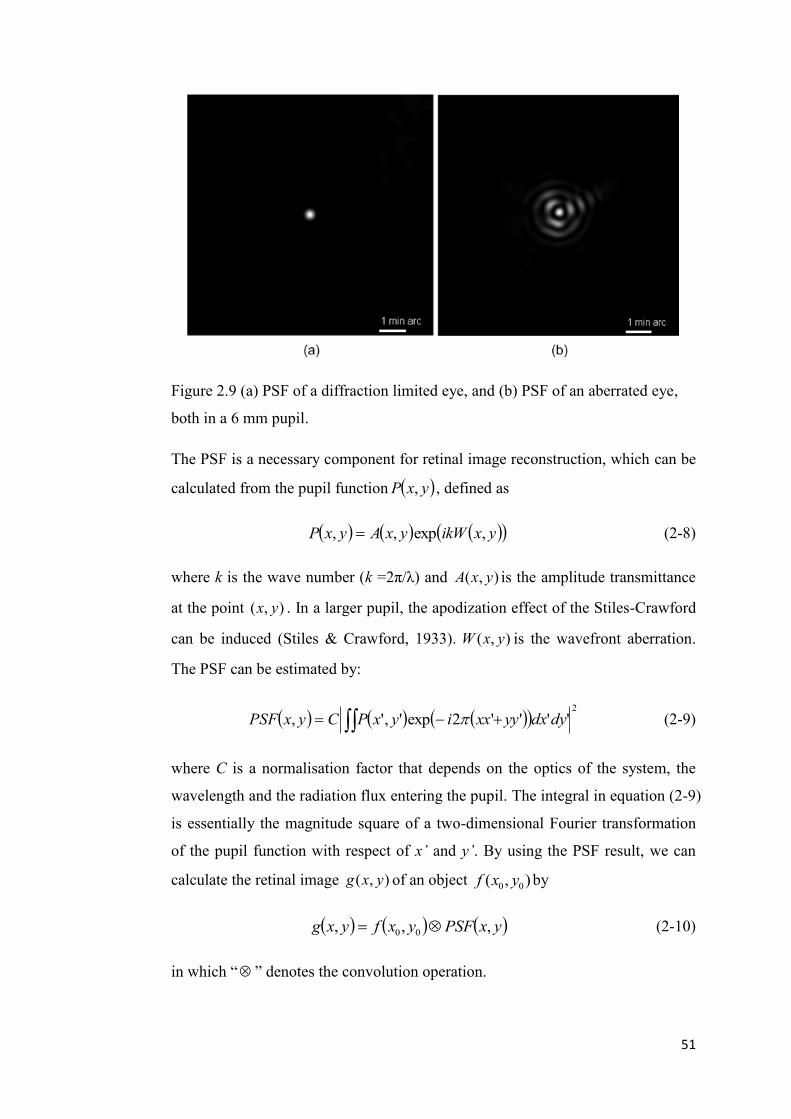
51
Figure 2.9 (a) PSF of a diffraction limited eye, and (b) PSF of an aberrated eye,
both in a 6 mm pupil.
The PSF is a necessary component for retinal image reconstruction, which can be
calculated from the pupil function yxP , , defined as
yxikWyxAyxP ,exp,, (2-8)
where k is the wave number (k =2π/λ) and ),( yxA is the amplitude transmittance
at the point ),( yx . In a larger pupil, the apodization effect of the Stiles-Crawford
can be induced (Stiles & Crawford, 1933). ),( yxW is the wavefront aberration.
The PSF can be estimated by:
2
''''2exp',', dydxyyxxiyxPCyxPSF (2-9)
where C is a normalisation factor that depends on the optics of the system, the
wavelength and the radiation flux entering the pupil. The integral in equation (2-9)
is essentially the magnitude square of a two-dimensional Fourier transformation
of the pupil function with respect of x’ and y’. By using the PSF result, we can
calculate the retinal image ),( yxg of an object ),( 00 yxf by
yxPSFyxfyxg ,,, 00 (2-10)
in which “ ” denotes the convolution operation.

52
The effects of individual terms of Zernike polynomials from the 2rd
to 6th
radial
order to the retinal image are simulated for a 6.0 mm pupil with a common
wavefront RMS value of 0.3 µm. The results are shown in Figure 2.10.
Figure 2.10 Effect on retinal image of different Zernike terms (RMS is 0.3 µm in
a 6 mm pupil).
The optical transfer function (OTF)
The optical transfer function (OTF) describes the spatial variation of the image as
a function of spatial frequency. It is a complex function that includes both the
modulation transfer function (MTF) and the phase transfer function (PTF) as
follows:
yxyxyx ffPTFffMTFffOTF ,,, (2-11)
where
yxyx ffOTFffMTF ,,
yxyx ffiffPTF ,2exp,

53
where λ is the wavelength and yx ff , are the spatial frequency components in the
x and y plane, respectively. The MTF describes the response of an optical system
to an image decomposed into sinusoidal gratings. It can be defined as the
amplitude of the image divided by the amplitude of the object. The PTF describes
the phase shift across a range of spatial frequencies. One can obtain the two-
dimensional OTF from the Fourier transform of the PSF. An alternative way is to
calculate the OTF by a convolution of the pupil function yxP , with its complex
conjugate:
dxdyYyXxPyxPYXOTF C ,,, (2-12)
“ ”denotes the complex conjugate, C is the common region of pupil for the
integration.
Retinal image quality metrics (IQMs)
A metric of the optical quality for the human eye should correlate with the visual
performance and accurately describe the eye‟s performance when affected by
different optical factors. Some optical quality metrics, such as RMS wavefront
error and Strehl ratio, have been used as standard industrial methods to evaluate
the optical quality of man-made optical systems (Marsack, Thibos & Applegate,
2004). However, the human eye is often more aberrated than man-made optical
components, and the industrial metrics may not be efficient and accurate enough
to predict the visual quality or optical limits of the eye. Marsack, Thibos and
Applegate (2004) evaluated the performances of a variety of metrics to describe
the optical quality of the eye. Some of the metrics are pupil plane based,
describing the optical wavefront quality at the exit pupil plane, while others
quantify the quality of retinal image.
The visual Strehl ratio based on the optical transfer function (VSOTF) was found
to be one of the metrics highly correlated with the visual performance (Marsack,
Thibos & Applegate, 2004; Thibos et al., 2004). The VSOTF is defined as:

54
yxyxDLyxN
yxyxyxN
dfdfffOTFffCSF
dfdfffOTFffCSF
VSOTF
,),(
,,
(2-13)
where yxDL ffOTF , denotes the diffraction limited optical transfer function,
and ),( yxN ffCSF is the neural contrast sensitivity function (Campbell and Green,
1965).
Several studies also found that the area under the MTF between 5 to 15 cpd
(Legras et al., 2004) or 5 to 25 cpd (Mouroulis & Zhang, 1992) to be well
correlated with subjective vision. However, these studies have used relatively
limited numbers of subjects.
The IQMs derived directly from wavefront aberrations provide links from the
aberrations to retinal image quality. In recent years, some research groups have
developed methods to theoretically estimate the DOF of the eye from wavefront
aberrations using various IQMs (Legge et al., 1987; Jansonius & Kooijman, 1998;
Marcos, Moreno & Navarro, 1999). In such methods, DOF is defined as the range
of defocus error that degrades the retinal image quality calculated from the IQMs
to a certain level of the possible maximum value. However, the main problem
with those methods is the application of an arbitrary threshold level that may not
be suitable for all eyes.
2.3 Summary of literature review and design of studies
With the substantial increase in the number of presbyopic patients, the
development of optimized corrections for presbyopia has become an important
research issue. The methods currently available for presbyopic correction include
different designs of spectacles, contact lenses and IOLs. However, they all come
with different limitations, such as limited depth of focus, increased eye and head
movements, some adaptation required and the potential to impair functional
vision (e.g. risk of falls and driving).

55
One method for treating presbyopia is to extend the DOF of the human eye. A
larger DOF is particularly important for presbyopic subjects, which will allow
them to obtain acceptable retinal image quality when viewing an object moving
through a range of near to intermediate distances. It is known that the DOF of the
human eye can be affected by HOAs. Inducing controlled amounts of primary
spherical aberration 0
4Z has been used as a method to help presbyopic patients to
improve their near vision through expanded DOF with corrections including
multifocal contact lenses and intraocular lenses. However, little is known about
the effect of other HOA terms on the DOF. The aim of this research study is to
investigate the interaction between the DOF and the wavefront aberrations of the
eye, with a view to using wavefront aberrations to expand the DOF. To achieve
the aims of this research, the following objectives need to be accomplished:
1. Estimation of the relationship between higher order aberrations (HOAs) and
depth of focus (DOF) in the eye and estimation of some candidate wavefront
aberrations to extend the DOF.
2. Design and construction of an adaptive optics (AO) system.
3. Apply the pre-determined aberrations to the eye with the aid of the developed
AO system and evaluate their efficiency to extend the DOF.
Five studies have been designed to fulfil the objectives. The relationship between
each objective and the studies are shown in Figure 2.11.

56
Figure 2.11 Objectives and designed studies.
Objective 1 covers the first three studies in this research. In Study 1 (described in
Chapter 3), the predicted DOF of four different clinical groups, including young
emmetropes, young myopes, presbyopes and keratoconics, will be modelled,
which allows the estimation of the relationship between different levels of HOA
RMS and the predicted DOF. In Study 2 (described in Chapter 4), a method is
developed to estimate the DOF from wavefront measurements using retinal image
quality metrics (IQMs) with an optimal threshold level, which would correlate
with the subjectively measured DOF. In Study 3 (described in Chapter 5), the
subjective DOF of a group of keratoconic subjects is measured and compared to
the subjective DOF in a group of normal eyes. Since keratoconus results in
significant increases in the level of HOA of the eye, including spherical
57
aberration, coma and trefoil, this population of subjects provides an opportunity
to study the influence of these HOA on DOF.
Study 4 (described in Chapter 6) is designed for Objective 2. It presents the
details of the design and construction of an AO system and the evaluation of the
system‟s performance.
In Study 5 (described in Chapter 7), the optimal combinations of primary and
secondary spherical aberrations ( 0
4Z and 0
6Z ) are estimated and applied to the eye
with the aid of the AO system, and their efficiency to expand the DOF is
evaluated.

58
Chapter 3. Modelling the depth of focus in different
clinical groups
3.1 Introduction
The traditional goal of vision correction is to provide an optimal level of foveal
acuity and contrast sensitivity. For young eyes with active accommodation,
achieving a high level of vision performance for far vision allows similar levels
of performance to be achieved at a range of distances from far to near. The visual
acuity of young eyes shows a slight improvement at intermediate distances that is
thought to be related to accommodation accuracy (McBrien and Millodot, 1986;
Rosenfield and Gilmartin, 1988; Ramsdale and Charman, 1989) or to the natural
variations in higher order aberrations with accommodation ( Buehren and Collins,
2006). However for presbyopes, the optimal correction of far vision will
obviously be inadequate at near distances. This problem can be partly
compensated by the depth of focus of the eye, but is normally solved by
supplementary near vision correction.
It has been reported that the DOF of the human eye is influenced by refractive
error, with myopes and hyperopes showing greater DOF than emmetropes
(Gwiazda et al., 1993; Rosenfield and Abraham-Cohen, 1999; Collins, Buehren &
Iskander, 2006; Vasudevan, Ciuffreda & Wang, 2006). This could be due to
higher levels of higher order aberrations in myopes ( He et al., 2002; Buehren,
Collins & Carney, 2005) or a difference in sensitivity to blur in myopes (Thorn et
al., 1998; Rosenfield and Abraham-Cohen, 1999; Radhakrishnan et al, 2004a,
2004b).
The DOF of human eye is also known to increase with age, with presbyopes
shown to have higher DOF than young subjects (Nio et al., 2000). These
differences are thought to arise from pupil constriction and increased levels of
HOA associated with increased age (McLellan et al., 2001). Some forms of
optical correction of presbyopes deliberately attempt to increase the depth of
focus by introducing higher order aberrations, such as spherical aberration, to the
retinal image. So-called “simultaneous vision” bifocal contact lenses produce

59
variations in power across the entrance pupil or optical zone of the lens, to create
an increased DOF (Plakitsi and Charman, 1995). Some forms of intraocular
lenses also introduce to the eye HOAs such as spherical aberration, to increase the
DOF of the eye (Mierdel et al., 1999; Nio et al., 2003; Marcos et al., 2005;
Franchini, 2007).
Corneal reshaping procedures for myopia correction, such as RK, PRK, LASIK
and orthokeratology also alter the HOAs of the cornea and total eye. Studies of
the ocular aberrations (Hong and Thibos, 1999; Seiler et al., 2000; Moreno-
Barriuso et al., 2001; Marcos et al., 2001; Hersh et al., 2003; Kohnen et al., 2005)
and theoretical simulation of the surgical outcome (Yoon et al., 2005) have shown
that positive spherical aberration is typically induced after corneal reshaping for
myopia correction and that there is a correlation between the induced spherical
aberration and the amount of myopia corrected.
Although the DOF in different refractive groups including emmetropes, myopes,
and hyperopes, have been measured by other researchers in small populations
either subjectively or objectively (Gwiazda et al., 1993; Rosenfield and Abraham-
Cohen, 1999; Collins, Buehren & Iskander, 2006; Vasudevan, Ciuffreda & Wang,
2006), there has not been a study using the IQM based method to theoretically
model and compare the DOF in a large population. The aim of the study
described in this chapter was to investigate the predicted DOF in the eyes of
various clinical populations including young emmetropes, young myopes,
presbyopes, and keratoconics. A novel computer algorithm was developed to
estimate the predicted depth of focus (DOF) as a function of defocus and
longitudinal spherical aberration (LSA) from the measurement of wavefront
aberrations. Simulations were also conducted to study the effect of altering the
eyes‟ spherical aberration on the DOF. This study focused on two clinical groups,
the myopes and presbyopes, who could have significantly higher amounts of
spherical aberration induced following refractive correction. This was undertaken
using the data from the presbyopic group to estimate the effects of simultaneous
vision bifocal contact lenses and intraocular lenses, and also with the data from
the young myopic group, to simulate the effect of corneal reshaping.
60
3.2 Methods and subjects
3.2.1 Subjects
Wavefront data from four clinical groups were used, including young myopes,
young emmetropes, presbyopes and keratoconics. The emmetropic group data
was collected from the right eye of 20 young subjects (19 to 28 years of age) with
mean spherical equivalent of 0.00 D (range +0.25 to 0.25 D). The mean
cylindrical refraction was 0.03 D (ranging from 0.00 D to 0.50 D). The myopic
group data was collected from the right eye of 19 myopes (19 to 24 years of age)
with mean spherical equivalent of 3.84 D, range from 1.00 D to 7.50 D. The
mean cylindrical refraction was 0.53 D (ranging from 0.00 D to 2.00 D). The
presbyopic group data came from the right eye of 32 subjects with a mean age of
52 years (range from 45 to 55 years). The mean spherical equivalent was 2.50 D
(range from +1.25 D to 8.00 D). The mean cylindrical refraction was 0.50 D,
ranging from 0.10 D to 1.02 D. The fourth group consisted of wavefront data
from one eye of 35 subjects diagnosed with keratoconus. This diagnosis was
based on the presence of significant asymmetry in the corneal topography map
and an axial power of at least 50 D at the cone apex. The keratoconic subjects had
a mean age of 36 years (range from 20 to 49 years) with mean spherical
equivalent of 2.72 D (range +1.50 D to 12.60 D). The mean cylindrical
refraction was 2.77 D, ranging from -0.50 D to 7.50 D.
3.2.2 Wavefront aberrations
Wavefront aberrations of all subjects were measured with a Complete Ophthalmic
Analysis System (COASTM
, WaveFront Sciences, Inc.). For each subject, a series
of 430 dynamic wavefront measurements were acquired at the sampling
frequency of about 10 Hz (Zhu et al., 2004). The wavefront measurements were
fit with a series of Zernike polynomials up to and including the 8th radial order
for 3.5 mm and 5 mm entrance pupil diameters, to simulate vision performance
under photopic and mesopic conditions, respectively. The average wavefront
aberration was then calculated for each of the subjects and used to calculate the
optical properties of the given eye at the wavelength of 555 nm. Analysis of the

61
wavefront aberrations was conducted up to the 6th radial order using two radial
orders lower than the original wavefront fit (Neal et al., 2005).
3.2.3 Depth of focus
The DOF was estimated by calculating the range of defocus errors which
degraded the retinal image quality to a certain level of the possible maximum
value. This definition has been adopted earlier by Marcos et al. (1999) who
choose an 80 percent threshold, while a 50 percent threshold was used by Legge
et al. (1987) and Jansonius and Kooijman (1998).
Four metrics of retinal image quality were used. The first three metrics were
based on the estimated azimuthally-averaged modulation transfer
function )(
MTF , at spatial frequencies of 5 , 10, and 15 cycles per degree
(cpd), as shown in Figure 3.1, simulating the subjects‟ visual performance at low,
medium and high spatial frequency, respectively. The fourth metric, the visual
Strehl ratio (VSOTF), was based on the calculated optical transfer function across
all spatial frequencies up to 60 cpd (Iskander, 2006).
Figure 3.1 An example of the estimated modulation transfer function.
Azimuthally-averaged data at 5, 10 and 15 cpd are used as the first three image
quality metrics.

62
To study the quantitative influence of the longitudinal spherical aberration (LSA)
on the DOF of subjects from different clinical groups, a dedicated simulation
program was designed from first principles in Matlab (The MathWorks, Inc.,
Natick, MA). The simulation program was used to predict the DOF of subjects
with presence of original higher order aberrations (HOA) and also the DOF
affected by different levels of LSA. The flow chart of the computer simulation
program is shown in Figure 3.2.
Figure 3.2 Flowchart of the computer simulation. (a) Algorithm for calculating
the DOF with originally present amount of LSA. (b) Algorithm for calculating the
DOF as a function of LSA.

63
3.2.4 Predicting DOF of subjects with the presence of original LSA
In the first step, COASTM
data of a total wavefront aberration, consisted of a set
of Zernike coefficients up to and including the 8th radial order, are imported.
Because all the wavefront data were acquired at natural pupil sizes that were
larger than 5 mm in diameter, for consistency, in step 2, the original Zernike
coefficients are resampled to a specific pupil diameter of either 5 mm or 3.5 mm
using the method of Schwiegerling (2002).
Because only the effect of HOA on DOF is considered in this study, the estimates
of sphero-cylinder need to be first removed from the wavefronts. One can achieve
that by simply setting the first six Zernike coefficients to zero. However, it has
been shown that the Maloney‟s best sphero-cylinder (S/C) calculated in the
refractive power domain has the best correlation to the subjective sphero-
cylindrical refractive error of the eye (Iskander et al., 2007). Hence, a
transformation from the wavefront domain to the refractive power domain is
performed. In step 3, the refractive power distribution across the pupil, ),( rF , is
calculated from the resampled wavefront ),( rW using the method of the
refractive Zernike power polynomials (Iskander et al., 2007).
),(),( rWrF ,
where Z denotes the wavefront to refractive power transformation.
Following that, in step 4, the best S/C is estimated using the method of Maloney
et al. (1993) and subtracted from the previously obtained refractive power. This
leads to the new refractive power, given by
SCZerout FFF ,
whereZerF and
SCF is the refractive power calculated from the subject‟s original
wavefront and the estimated best S/C, respectively. To simulate through-focus, in
the through-focus loop, a desired level of defocus is added to the refractive power
from step 4. The levels of this additional defocus range from 3 D to +3 D in
0.125 D steps. In step 5, an inverse transformation from the refractive power
domain to the wavefront domain is performed (Iskander, Davis & Collins, 2007)

64
),(),( 1 rFrW outout
,
which is then used, in step 6, to calculate the four considered image quality
metrics.
From the wavefront ),( rWout with a new defocus value, the corresponding point
spread function and the optical transfer function (OTF) is calculated using fast
Fourier transforms (Iskander et al., 2001). Then, the 3D modulation transfer
function (MTF) is estimated by taking the amplitude of the OTF. Three image
quality metrics (IQM) based on the estimated azimuthally-averaged modulation
transfer function )(
MTF , at spatial frequencies of 5 , 10, and 15 cpd, and
the fourth IQM based on the optical transfer function (VSOTF) are also obtained
in step 6. At this point, the depth of focus of the subject with the original HOA
can be estimated by finding the range of focus which decreases the value of an
IQM to not less than 80/50 percent of their peak value.
3.2.5 Estimating the effect of varying the longitudinal spherical aberration
on DOF
Changes were made in the simulation program to estimate the effect of different
levels of LSA on DOF, as shown in Figure 3.2(b) with dashed lines and boxes.
After the wavefront to refractive power domain transformation, in step 4, the
original amount of longitudinal spherical aberration is calculated and removed.
The LSA is estimated as the difference between the average refractive power at
the periphery and that at the centre of the pupil, given by
2
0
2
0
max ),0(),( dFdrFLSA
where maxr indicates the max pupil radius. In the procedure, the limit of 0 is set
to 001.0min r mm. An additional loop is introduced to alter the level of LSA to
the refractive power from step 3. The levels of this additional LSA, which
corresponds to the primary Seidel spherical aberration, range from 5 D to +5 D
in 0.125 D steps. This leads to a new refractive power, given by
SCnewLSAorgLSAZerout FFFFF __

65
whereZerF , orgLSAF _ , newLSAF _ , and
SCF are the refractive power components
contributed from the subject‟s original wavefront given in terms of Zernike
polynomial coefficients, estimated amount of the original LSA, introduced
amount of LSA, and the estimated best S/C, respectively.
An example of the outcome of the double loop simulation program is shown in
Figure 3.3 for an emmetropic subject CW. The through-focus )10(
MTF at
different levels of LSA (shown in Figure 3.3a) was used to construct a 3D
representation of the DOF(LSA) estimator (Figure 3.3b). Three curves are drawn
on the top-view map (displayed in Figure 3.3c) of the 3D DOF(LSA) estimator.
Figure 3.3 DOF(LSA) estimate for subject CW. (a) through-focus )10(
MTF at
different levels of LSA. (b) 3D result of the DOF(LSA) estimator. (c) top-view
map of (b).
The “O” curve in the centre corresponds to the maximum value of through focus
)10(
MTF at different LSA levels, while the other two curves indicated by “Δ”

66
mark the boundaries corresponding to the threshold level of the maximum value
(in this case 80% is used). The distance between the two “Δ” curves clearly
indicate the change of DOF under influence of different levels of LSA.
3.3 Results
3.3.1 HOA comparison between groups
The group mean value of HOA RMS up to and including the 6th radial order for
four considered clinical groups are shown in Figure 3.4 for 3.5 mm and 5 mm
pupil diameters. As described in the methods section, the estimated best sphero-
cylinder was subtracted from each subject‟s original refractive power map before
calculating the DOF. In such a case, only the structure of the HOAs and the
interaction between different wavefront terms could affect the estimated DOF.
Figure 3.4 Higher order aberration (HOA) RMS values of the four groups,
consisting of young emmetropes, young myopes, presbyopes and keratoconics for
5 mm and 3.5 mm pupil diameters.
In the 5 mm pupil diameter, the total HOA RMS values in young emmetropic
eyes were significantly smaller than those in the other groups (t-test p < 0.05). No
significant difference was found in the HOA RMS between the myopic eyes and

67
presbyopic eyes. The HOA RMS of the keratoconics group was much higher than
the other three groups (all p < 0.001). Similar results were observed when the
pupil was limited to a 3.5 mm in diameter.
3.3.2 Peak value of each image quality parameter for the four population
groups
Due to the different amount of HOA and wavefront structure in the individual
subjects‟ eyes, the achievable peak value calculated by each image quality
parameter for the four clinical groups varies. As shown in Table 3.1, the
emmetropic group has the highest group mean peak values calculated by all four
IQMs. The myopic subjects show slightly higher mean peak values than the
presbyopic subjects. While the keratoconics group has the lowest peak values in
the four considered groups.

68
Table 3.1 Group mean of peak values of each IQM predicted from the original wavefront aberrations of the subjects.
Refractive Group
Peak value from four IQMs (Mean ± SD)
5 mm pupil 3.5 mm pupil
IQMs IQMs
)5(
MTF )10(
MTF )15(
MTF VSOTF )5(
MTF )10(
MTF )15(
MTF VSOTF
Emmetropic (20)
0.89±0.06 0.74± 0.12 0.62± 0.15 0.56± 0.19 0.93±0.02 0.84± 0.06 0.74± 0.10 0.81± 0.14
Myopic (19)
0.86±0.08 0.68± 0.12 0.55± 0.13 0.46± 0.15 0.91±0.04 0.79±0.09 0.68±0.11 0.73±0.15
Presbyopic (32)
0.83±0.16 0.62± 0.11 0.47± 0.12 0.39± 0.12 0.88±0.04 0.75±0.10 0.62±0.12 0.66±0.16
Keratoconic (35)
0.43±0.22 0.24± 0.16 0.17± 0.11 0.12± 0.09 0.57±0.21 0.36±0.20 0.26±0.16 0.24±0.17
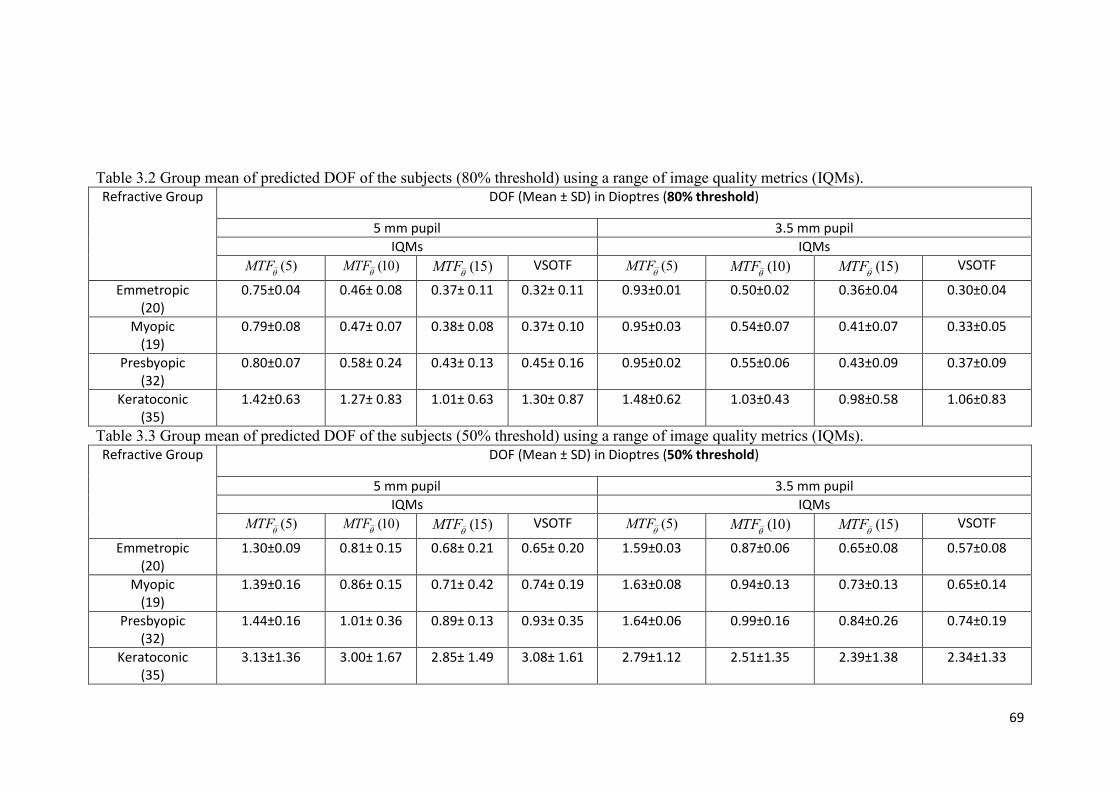
69
Table 3.2 Group mean of predicted DOF of the subjects (80% threshold) using a range of image quality metrics (IQMs).
Refractive Group
DOF (Mean ± SD) in Dioptres (80% threshold)
5 mm pupil 3.5 mm pupil
IQMs IQMs
)5(
MTF )10(
MTF )15(
MTF VSOTF )5(
MTF )10(
MTF )15(
MTF VSOTF
Emmetropic (20)
0.75±0.04 0.46± 0.08 0.37± 0.11 0.32± 0.11 0.93±0.01 0.50±0.02 0.36±0.04 0.30±0.04
Myopic (19)
0.79±0.08 0.47± 0.07 0.38± 0.08 0.37± 0.10 0.95±0.03 0.54±0.07 0.41±0.07 0.33±0.05
Presbyopic (32)
0.80±0.07 0.58± 0.24 0.43± 0.13 0.45± 0.16 0.95±0.02 0.55±0.06 0.43±0.09 0.37±0.09
Keratoconic (35)
1.42±0.63 1.27± 0.83 1.01± 0.63 1.30± 0.87 1.48±0.62 1.03±0.43 0.98±0.58 1.06±0.83
Table 3.3 Group mean of predicted DOF of the subjects (50% threshold) using a range of image quality metrics (IQMs).
Refractive Group
DOF (Mean ± SD) in Dioptres (50% threshold)
5 mm pupil 3.5 mm pupil
IQMs IQMs
)5(
MTF )10(
MTF )15(
MTF VSOTF )5(
MTF )10(
MTF )15(
MTF VSOTF
Emmetropic (20)
1.30±0.09 0.81± 0.15 0.68± 0.21 0.65± 0.20 1.59±0.03 0.87±0.06 0.65±0.08 0.57±0.08
Myopic (19)
1.39±0.16 0.86± 0.15 0.71± 0.42 0.74± 0.19 1.63±0.08 0.94±0.13 0.73±0.13 0.65±0.14
Presbyopic (32)
1.44±0.16 1.01± 0.36 0.89± 0.13 0.93± 0.35 1.64±0.06 0.99±0.16 0.84±0.26 0.74±0.19
Keratoconic (35)
3.13±1.36 3.00± 1.67 2.85± 1.49 3.08± 1.61 2.79±1.12 2.51±1.35 2.39±1.38 2.34±1.33

70
3.3.3 Comparison of predicted DOF between groups
The group means of the predicted DOF values for the four considered groups
derived from different image quality metrics with an 80 percent threshold are
presented in Table 3.2.
Emmetropes showed the smallest value of averaged DOF ranging from 0.32 to
0.75 D and from 0.30 to 0.93 D for a 5 mm and a 3.5 mm pupil diameter,
respectively. On the other hand, keratoconics showed highest averaged DOF,
ranging from 1.11 to 1.44 D and from 1.06 to 1.53 D for a 5 mm and a 3.5 mm
pupil diameter, respectively.
For a 5 mm pupil diameter, Student‟s t-test revealed differences in the predicted
DOF at low (5 cpd) spatial frequencies between the young emmetropes and
myopes (p = 0.01, 0.24, 0.38, and 0.08 for the DOF derived from )5(
MTF ,
)10(
MTF , )15(
MTF , and VSOTF, respectively). Significant differences were
also observed in the predicted DOF between the young emmetropic and the
presbyopic group (all p ≤ 0.05). However, significant differences in the predicted
DOF between young myopes and presbyopes were only found at mid spatial
frequency with )10(
MTF , (p= 0.01) and with the VSOTF (p = 0.01). The group
averaged DOF of keratoconic subjects was found to be approximately twice as
large as those of the other three groups.
When the pupil size is reduced to 3.5 mm, the average predicted DOF generally
increases, except for estimated values by the metric based on the VSOTF. In the
keratoconic group, a slight increase in the DOF is only seen at low spatial
frequencies. The results of Student‟s t-test show some significant differences of
the predicted DOF between the groups. Differences in the DOF between the
emmetropic and myopic group are found at all spatial frequencies (p = 0.03, 0.02,
0.01 for )5(
MTF , )10(
MTF and )15(
MTF , respectively) and through focus
VSOTF (p = 0.03). The presbyopic subjects again, show higher mean predicted
DOF values compared to the emmetropes. However only the difference of DOF
derived from the VSOTF between myopes and presbyopes was found to be
significant (p = 0.02). Although the average predicted DOF of keratoconic
subjects is smaller for a 3.5 mm pupil compared to the value with a 5 mm pupil

71
diameter (except for )5(
MTF ), it is still significantly larger than those values
found in the other clinical groups (all p < 0.005).
A correlation analysis was performed between the HOA RMS and the predicted
DOF for all 106 subjects (i.e., grouped data for all emmetropes, myopes,
presbyopes and keratoconics). The total HOA RMS showed a significant
correlation with the DOF based on all four metrics (Pearson‟s r = 0.64, 0.55, 0.45
and 0.67 in a 5 mm pupil, and Pearson‟s r = 0.79, 0.81, 0.81 and 0.88 in a 3.5 mm
pupil, all p < 0.001) for )5(
MTF , )10(
MTF , )15(
MTF , and through focus
VSOTF, respectively.
3.3.4 Influence of threshold level to the predicted DOF
To study the influence of chosen threshold level to the predicted DOF, the DOF
values of the four clinical groups are recalculated with a 50 percent threshold.
The group means of the predicted DOF values for the four considered groups
derived from different image quality metrics are presented in Table 3.3. After
lower the threshold to 50 percent, the mean DOF of the four considered groups
show large amount of increase compared to the value derived at an 80 percent
threshold. Emmetropes still have the smallest value of averaged DOF ranging
from 0.65 to 1.30 D and from 0.57 to 1.59 D for a 5 mm and a 3.5 mm pupil
diameter, respectively. Keratoconics show highest averaged DOF, ranging from
2.85 to 3.13 D and from 2.34 to 2.79 D for a 5 mm and a 3.5 mm pupil diameter,
respectively.
For a 5 mm pupil diameter, Student‟s t-test revealed differences in the predicted
DOF only at low (5 cpd) spatial frequencies between the young emmetropes and
myopes (p = 0.01, 0.13, 0.31, and 0.06 for the DOF derived from )5(
MTF ,
)10(
MTF , )15(
MTF , and VSOTF, respectively). Significant differences were
observed in the predicted DOF between the young emmetropic and the
presbyopic group (all p ≤ 0.05). Significant differences in the predicted DOF
between young myopes and presbyopes were also found except for the low spatial
frequency (p = 0.16, 0.02, 0.02, and 0.01 for the DOF derived from )5(
MTF ,
)10(
MTF , )15(
MTF , and VSOTF, respectively). The group averaged DOF of

72
keratoconic subjects was found to be approximately three times as large as those
of the other three groups.
In a smaller 3.5 mm pupil, the average predicted DOF generally increases, except
for estimated values by the metric based on the VSOTF. In the keratoconic group,
on the other hand, average DOF based on all four IQMs showed lower value
compared to the results in a 5mm pupil. A Student‟s t-test was performed to
reveal the differences of the predicted DOF between the groups. Differences in
the DOF between the emmetropic and myopic group are found at all spatial
frequencies (p = 0.02, 0.02, 0.02 for )5(
MTF , )10(
MTF and )15(
MTF ,
respectively) and through focus VSOTF (p = 0.02). The presbyopic subjects again,
show higher mean predicted DOF values compared to the emmetropes. The
differences of DOF derived from the )15(
MTF and VSOTF between myopes
and presbyopes were also found to be significant (p = 0.03 and 0.04). The average
predicted DOF of keratoconic was again significantly larger than those of the
other clinical groups (all p < 0.005).
Since the 80 percent threshold is considered to be close to the 3 dB level of signal
energy, the DOF presented in the following sections of results were all calculated
with an 80 percent threshold.
3.3.5 Comparison of response to changes of spherical aberration in
different clinical groups
The 3D model of DOF(LSA) estimator was used to evaluate the effect of
different levels of LSA on DOF of subjects from the four clinical groups. The
top-view of DOF(LSA) based on )10(
MTF for four typical subjects from each of
the considered clinical groups are shown in Figure 3.5. Due to the different
structure of HOA present in individuals, the response of DOF to changes of LSA
varies.

73
Figure 3.5 Examples of the estimated DOF(LSA) for different subjects from each
of the considered clinical groups.
Special attention was paid for the estimation of DOF for keratoconic subjects. As
seen in Figure 3.5(d), for a keratoconic subject AN, the through focus
)10(
MTF showed dual peaks when approximately -1.5 D of LSA was added to
the original wavefront. In this case, the DOF is defined as the sum of the discrete
defocus regions which keep the )10(
MTF above the selected threshold level
rather than a continuous defocus range.
74
3.3.6 Effect of varying spherical aberration on DOF of presbyopes
Figure 3.6 Simulated average influence of LSA on DOF in presbyopic group in (a)
a 5 mm, and (b) a 3.5 mm pupil diameter.
To simulate the impact of LSA induced, for example, by a varifocal or
progressive power contact lens on the DOF, the change of depth of focus across
different LSA values ranging from 3 D to +3 D with a step of 1/8 D were
calculated for the group of 32 presbyopic eyes. The group average result is shown
in Figure 3.6, where it is evident that the DOF increases with the introduction of
either positive or negative LSA, for all the considered IQMs.
75
Figure 3.7 Retinal images simulation with different levels of LSA and defocus for
a presbyopic subject DFB. This subject was representative of the presbyopic
group and had +0.175 D of natural longitudinal spherical aberration.
LSA of 3 D (either positive or negative) will lead to an increase of approximately
0.4 D and 0.5 D in the predicted DOF for low spatial frequencies (5 cpd) at a
5 mm and 3.5 mm pupil diameter, respectively. The improvement of DOF
decreases at higher spatial frequencies. For a 5 mm pupil diameter, DOF derived
by )10(
MTF and )15(
MTF increases by 0.25 D and 0.2 D, respectively. For a
3.5 mm pupil diameter, the increase of DOF at 10 cpd and 15 cpd are 0.35 D and
0.3 D. The DOF predicted from the VSOTF is observed to increase by 0.25 D and
0.35 D for a 5 mm and a 3.5 mm pupil diameter, respectively. Figure 3.7 shows
an example of a series of simulated retinal images of Snellen “E” letter at 0.3
logMAR for a presbyopic subject DFB for a 5 mm pupil diameter. The retinal
image quality becomes worse when a higher amount of LSA is introduced,
showing an obvious trade-off for the DOF enhancement. However, it can also be

76
noticed that with higher levels of LSA, the eye shows more tolerance to the
increase in defocus (i.e., an enhanced depth of focus).
3.3.7 Model of positive LSA induced by refractive surgery and its effect on
DOF of myopic subjects
A set of positive LSA was induced to the myopic group of eyes to model the
DOF affected by surgically induced positive LSA. Up to 2 D of LSA can be
induced after correction of 6 D myopia in a 6 mm pupil (Hersh et al., 2003; Lee
et al., 2003; Kohnen et al., 2005; Yoon et al., 2005) and up to 2 D of LSA can be
induced after orthokeratology (Joslin et al., 2003; Berntsen et al., 2005). The
interaction of DOF with positive LSA up to +3 D was simulated with a step of
0.125 D (Figure 3.8). As expected, similar results to the presbyopic group were
observed. In a 5 mm pupil, an increase of approximately 0.4 D, 0.3 D, 0.2 D and
0.3 D are achieved after introduction of 3 D LSA, for mean DOF estimated by
)5(
MTF , )10(
MTF , )15(
MTF and through focus VSOTF, respectively.
Slightly higher values are obtained for a 3.5 mm pupil, which are 0.4 D, 0.35 D,
0.3 D and 0.3 D, respectively.
Figure 3.8 Simulated average effect of positive LSA on DOF of the myopic group
for (a) a 5 mm, and (b) a 3.5 mm pupil diameter.

77
3.4 Discussion
In this study, the calculated depth of focus of various clinical groups including
emmetropes, myopes, keratoconics and presbyopes was evaluated. As a result of
high levels of higher order aberrations, the keratoconic eyes showed the largest
predicted depth of focus for the natural eye, but at the expense of poorer image
quality. The presbyopes and myopes also showed slightly higher levels of higher
order aberrations than the emmetropes and this was again reflected in a slight, but
significant increase in the predicted depth of focus of the natural eyes of these
groups. Myopes have been shown to have slightly larger depth of focus than
emmetropes in previous objective (Rosenfield & Abraham-Cohen 1999) and
simulation studies (Collins, Buehren & Iskander, 2006) of depth of focus. A
number of reports have also found that presbyopes have increased levels of higher
order aberrations compared to younger eyes (McLellan, Marcos & Burns 2001;
Amano et al., 2004; Fujikado et al., 2004; Atchison & Markwell, 2008) and this is
again reflected in a slight increase in the natural depth of focus of the eye.
The choice of image quality metrics to model the depth of focus will influence the
predicted outcomes, but metrics calculated at the retinal image plane are thought
to be superior to those in the pupil plane for predicting subjective refraction
(Thibos et al., 2004). To study the predicted DOF, three retinal image quality
metrics (IQMs) derived from azimuthally-averaged modulation transfer
function )(
MTF , at spatial frequencies of 5 , 10, and 15 cpd were used. For
the overall spatial frequency range assessment I used the visual Strehl ratio
(VSOTF) that has been found to correlate well with subjective visual
performance in a number of studies (Guirao and Williams, 2003; Cheng, Bradley
& Thibos, 2004). The predicted DOF for natural eyes was found to decrease at
higher spatial frequencies, which agrees with the objective findings of earlier
studies (Tucker & Charman, 1986; Legge et al., 1987; Atchison, Charman &
Woods, 1997). The choice of arbitrary threshold level also significantly
influences the simulated outcome. A higher threshold value in general produces
lower value of predicted DOF. When an 80% threshold level was used, the
predicted DOF of the normal subjects (emmetropes, myopes and presbyopes) in
this study matched well with the range of DOF reported by Marcos (1999). They

78
found the average DOF calculated from three subjects‟ wavefront for a 6 mm
pupil decreased from 0.75 to 0.4 D, when spatial frequency increased from 5 cpd
to 15 cpd. A similar range of 0.78 to 0.39 D was found in this study.
The simulation results also showed that the induction of additional positive or
negative LSA in the eye will modestly increase the DOF. In most of the cases,
introducing higher amounts of LSA to the original wavefront aberration resulted
in a monotonically extended DOF (although the influence degrades at higher
spatial frequencies), and at the same time resulted in a rapidly worsening of
retinal image quality. However, this relationship between LSA and DOF is far
more complex for keratoconic subjects, because of the high levels of pre-existing
monochromatic aberrations in comparison to the induced LSA.
In presbyopes, the introduction of LSA to the eye is a commonly used optical
method to extend the depth of focus. It is used as a design feature of bifocal
contact lenses and intraocular lenses (Plakitsi & Charman, 1995; Mierdel et al.,
1999; Nio et al., 2003; Marcos, Barbero & Jimenez-Alfaro, 2005; Franchini,
2007). The modelling shows modest improvements in depth of focus in the range
from about 0.25 to 0.5 D (depending on the interaction between factors such LSA
level, pupil size and image metric). This improvement in depth of focus comes at
the expense of a slight overall loss of image quality across the extended depth of
focus range, but this is a compromise that many presbyopes are prepared to
accept (Nishi et al., 2006).
The modelling of the influence of positive LSA on the depth of focus of myopes
provides some understanding of the likely optical consequences of common
refractive surgery procedures such as LASIK, PRK and orthokeratology. All of
these refractive procedures are known to increase the level of positive spherical
aberration of the eye (Seiler et al., 2000; Moreno-Barriuso et al., 2001; Marcos et
al., 2001; Berntsen et al., 2005; Kohnen et al., 2005), primarily as a result of
reducing the prolate shape of the cornea (so called sphericalisation of the cornea).
Like the results for the presbyopes, there was a clear increase in depth of focus
associated with increasing levels of positive LSA at the expense of a slight loss of
overall image quality. These effects may delay the need for full near vision

79
correction for a few years as these myopic subjects reach the age of presbyopia
(Artola et al., 2006).
In this study, the natural levels of overall higher order aberrations showed strong
correlation with the predicted DOF. This result was largely driven by the
keratoconics, whose extremely high levels of HOAs are associated with large
increases in predicted DOF, at the expense of overall image quality.
Figure 3.9 The effect of interaction of the primary and 0.05 µm of secondary SA
on DOF.
The primary spherical aberration is not the only wavefront aberration that
contributes to increase the DOF. Study on the 3D model of DOF(LSA) in eyes
with relatively higher amount of secondary spherical aberration ( )( 0
6ZRMS ≥
0.04) reveals that there may be a positive interaction between the primary and
secondary spherical aberration to increase the DOF. A customized wavefront with
-0.05 µm of secondary spherical aberration in a 5 mm pupil is generated to study
the possible relationship. The change of its DOF at different level of LSA is
shown in Figure 3.9. It can be seen that the combination of certain amount of
secondary spherical aberration and the primary spherical aberration with the
80
different sign (different signs for 0
4C and 0
6C ) could greatly increase the DOF.
Further study is required to produce a better understanding on how the interaction
between LSA and other HOA can help to achieve a high DOF in the human eye.
In conclusion, the natural levels of higher order aberrations of the eye are
associated with the predicted depth of focus, with greater levels of higher order
aberrations leading to increased depth of focus. As a result, the myopes and
presbyopes showed slightly increased predicted levels of depth of focus compared
with the emmetropes and the keratoconic subjects showed large increases in
predicted depth of focus. The simulated addition of LSA to the presbyopic and
myopic eyes produced modest increases in DOF at the expense of slight losses in
image quality. All measurements in this study were performed in monochromatic
green light (555 nm). In reality, the chromatic aberrations in the human eye will
also affect the DOF.
81
Chapter 4. Estimation of depth of focus from wavefront
measurements
4.1 Introduction
The previous study described in Chapter 3 has shown that it is possible to
estimate the depth of focus (DOF) of the eye directly from wavefront
measurements using various retinal image quality metrics (IQMs). In such
methods, DOF is defined as the range of defocus error that degrades the retinal
image quality calculated from IQMs to a certain level of the maximum value
(Legge et al., 1987; Jansonius & Kooijman, 1998; Marcos, Moreno & Navarro,
1999). Although different retinal image quality metrics are used, currently there
have been two arbitrary threshold levels adopted, 50% (Legge et al., 1987;
Jansonius & Kooijman, 1998) and 80% (Marcos, Moreno & Navarro,
1999). There has been limited study of the relationship between these threshold
levels and the actual measured DOF.
The aim of the study reported in this chapter was to estimate the threshold level
of IQMs, which would correlate with the subjectively measured DOF and lead to
a method for estimating DOF directly from a single measurement of wavefront
aberration.
4.2 Subjects and methods
4.2.1 Subjects
The experiment was performed on 17 adult subjects (9 males and 8 females) from
students and staff members of the School of Optometry, Queensland University
of Technology. The mean age of the subjects was 30 years, ranging from 18 to 46
years. The group had a mean spherical equivalent refraction error of 0.95 D
(ranging from 5.0 D to +1.0 D) and the mean cylindrical refraction was 0.32 D
(ranging from 0 D to 0.5 D). All subjects had Snellen visual acuity of at least 6/6
in the tested eye with their best correction. All subjects reported having no history

82
of significant eye diseases. The subjects gave written informed consent and the
study met the requirements of the University Human Ethics Committee and was
conducted in accordance with the Declaration of Helsinki (Appendix C).
4.2.2 Apparatus
A customized wavefront sensing system was constructed to measure the eye‟s
wavefront and DOF under different target vergences. The optical layout of the
wavefront sensing system, which is based on the HASO32TM
Hartmann Shack
wavefront sensor (Imagine Eyes, Orsay, France) is shown in Figure 4.1. In one
pilot study (see Chapter 6), the HASO32 TM
wavefront sensor was calibrated and
benchmarked against a Complete Ophthalmic Analysis System (COASTM
,
Wavefront Science, Inc) and showed high correlation and good repeatability.
Figure 4.1 Wavefront sensing system to monitor the ocular wavefront aberration
and measure the depth of focus.
In the wavefront operation channel is a 10 D achromatic microscopic lens L1
with its back focal point located at the eye‟s entrance pupil. Lenses L5 and L4, L3
and L2 are set up in an afocal form, which produce an image of the experiment
target on the back focal point of L2. The image then acts as the object of Badal
lens L1 and its distance to L1 is controlled by the movement of the Badal stage.
The Badal stage is based on a 300 mm long travel stage driven by a fine tuning
knob. In this optical setting, moving the object every 1 cm brings approximately
1 D of change in the target vergence (Atchison, 1995). The target used in the
experiment consists of a Snellen letter chart printed on a piece of clear transparent

83
glass, which is attached to a piece of diffused film and back illuminated by a
distant 633 nm LED light source. The target‟s contrast is 80% with a luminance
of approximately 600 cd/m2. During the test, the subject is asked to focus on the
letter in the middle of the first line of the letter chart. Through the optics, the
letter size produces a visual angle of approximately 20 minutes of arc (0.60
logMAR detail, similar to reading print of 12 point font size at a distance of
40 cm away).
4.2.3 Protocol
The subject‟s head was comfortably positioned in an adjustable, heavy, custom-
made headrest without a bite bar. The head‟s position with respect to the
wavefront sensing system could be adjusted in three dimensions by the operator.
Before the commencement of the measurements, all subjects were given a short
training on the system to allow them to become familiar with the task of
recognizing the “just noticeable blur”, which was defined as the first detectable
sign of changes in the clearness and sharpness of the displayed target. Then, the
subject‟s tested eye was cyclopleged and dilated by 2 drops of cyclopentolate
HCL (1% MinimsTM
, 0.5 mL, Bausch & Lomb Australia, Pty Ltd.). The
measurement then started about 30 minutes later, after the maximum
pharmacological effect of cyclopentolate was reached (Manny et al., 1993). The
subject‟s defocus level was controlled by moving the Badal stage. The operator
adjusted the position of the Badal stage to approximately compensate the
subject‟s subjective defocus. The astigmatism derived from the individual
subjective refraction was corrected with a trial lens mounted in front of the
artificial pupil (see Figure 4.1).
Under full cycloplegia and pupillary dilation, the subject was asked to fixate on
the target through an artificial pupil, while the fellow eye was fully occluded by a
black eye patch. In the experiments, two pupil diameters were considered, 5 mm
and 3.5 mm, to simulate the viewing under mesopic and photopic conditions. The
subject was instructed to identify the “clear” position (corresponding to the
subjective best focus) and “just noticeable blur” in both negative and positive

84
directions, corresponding to the movement of the Badal stage towards and away
from the eye.
The procedure for measuring the subjective DOF was as follow. First, the
operator adjusted the position of the Badal stage to help the subject finding a
“clear” position in which the target could be viewed as clear and sharp as possible.
Then the operator slowly moved the Badal stage in one randomly selected
direction until the “just noticeable blur” was reported by the subject. The scale
reading of the Badal stage was recorded by the operator. The operator then moved
the Badal stage in the opposite direction. During the movement, the subject
observed the “clear” position again, and as the movement continued, the subject
observed the appearance of “just noticeable blur”. The scale reading of this
position was also recorded. These two limits of Badal stage movement constituted
one measurement of DOF. For each pupil diameter, five sets of DOF
measurements were performed. To avoid the possibility that the subject may
remember the time it took to observe the “just noticeable blur” away from the
“clear” position, the operator moved the Badal stage at a variable speed, and the
moving speed was controlled to be less than approximately 0.2 D/s. At the end of
the experiment, the subject‟s accommodative response was examined to ensure
that there was no significant (≤ 0.1 D) recovery of accommodation.
The ocular aberrations were also recorded by taking 10 wavefront measurements
at each position (towards and away from the eye) when the “just noticeable blur”
was observed by the subject (total 20 measurements). The higher order aberration
components did not change significantly across the defocus range. Wavefront
measurements were performed with the artificial pupil removed for the fully
dilated pupils. The higher order aberration components of the wavefront data
were then averaged and used for computing the visual Strehl ratio based on the
optical transfer function (OTF), which was later used as an image quality metric
for matching the subjective DOF.
Before commencing each set of measurements, the pupil position was checked by
comparing the pupil positions on the sensor CCD with and without the artificial
pupil in the HASO control software (Imagine Eyes, Orsay, France). The
measurement had a resolution of 0.01 mm. If the displacement of the pupil was
85
greater than 0.3 mm then the position of the subject‟s head was corrected by the
operator.
4.2.4 Determination of the threshold for estimating DOF from wavefront
data
One can estimate the theoretical DOF by calculating the range of defocus errors
which degrades the retinal image quality to a certain level of the possible
maximum value. This definition has been adopted earlier by Marcos, Moreno and
Navarro (1999), who chose an 80% threshold, while a 50% threshold was used by
Legge et al. (1987) and Jansonius and Kooijman (1998). In this study, the
augmented visual Strehl ratio based on the optical transfer function (VSOTF) was
chosen as the retinal image quality predictor to estimate the matching threshold
based on the subjectively measured DOF.
The VSOTF is currently considered one of the best descriptors of visual
performance that can be directly derived from the wavefront aberrations data
(Marsack, Thibos & Applegate, 2004)
and is strongly correlated with the
subjective visual acuity (Cheng, Bradley & Thibos, 2004). Its augmented version
has used (Iskander, 2006)
yxyxDLyxN
yxyxyxN
dfdfffOTFffCSF
dfdfffOTFffCSFVSOTF
,,(
,Re,
where yxDL ffOTF , denotes the diffraction limited optical transfer function,
yxN ffCSF , is the neural contrast sensitivity function, and yx ff , are the
spatial frequency coordinates. Here the VSOTF was based on calculated optical
transfer function across all spatial frequencies up to 60 cycles per degree (cpd)
(Iskander, 2006).
To estimate DOF from an image quality metric, a through-focus calculation is
required. A dedicated simulation program was written from first principles in
Matlab (The MathWorks, Inc., Natick, MA) to calculate the through-focus
VSOTF in the presence of subject‟s original higher order aberrations (HOA). The
flow chart of the computer simulation program is shown in Figure 4.2.
86
Figure 4.2 Flow chart of simulation program for calculating through-focus
VSOTF.
In the first step, wavefront data, consisting of a set of Zernike coefficients up to
and including the 8th radial order, are imported. Since the wavefront data was
acquired for the subject‟s dilated pupils always larger than 5 mm, for consistency,
in step 2, the original Zernike coefficients were resampled to a specific pupil
diameter of either 5 mm or 3.5 mm using the method of Schwiegerling (2002).
Since the subject‟s sphero-cylindrical error was corrected during the subjective
DOF measurements, only the effect of HOAs on VSOTF is considered in the
simulation. The estimates of sphero-cylinder need to be first removed from the
wavefront. One can achieve that by simply setting the first six Zernike
coefficients to zero. However, it has been shown that the Maloney‟s best sphero-
cylinder (S/C) calculated in the refractive power domain has the best correlation
to the subjective sphero-cylindrical refractive error of the eye (Iskander et al.,
2007). Hence, a transformation from the wavefront domain to the refractive
power domain is performed. In step 3, the refractive power distribution across the
pupil, ),( rF is calculated from the resampled wavefront ),( rW using the
method of the refractive Zernike power polynomials (Iskander et al, 2007).
),(),( rWrF
where Z denotes the wavefront to refractive power transformation.

87
Following that, in step 4, the best S/C is estimated using the method of Maloney
et al. (1993) and subtracted from the previously obtained refractive power. This
leads to the new refractive power, given by
SCZerout FFF
whereZerF and
SCF is the refractive power calculated from the subject‟s original
wavefront and the estimated best S/C, respectively. To simulate through-focus, in
the through-focus loop, a desired level of defocus is added to the refractive power
from step 4. In step 5, an inverse transformation from the refractive power
domain to the wavefront domain is performed (Iskander, Davis & Collins, 2007)
),(),( 1 rFrW outout
which is then used, in step 6, to calculate the VSOTF. From the wavefront
),( rWout with a new defocus value, the corresponding point spread function and
the optical transfer function (OTF) is calculated using fast Fourier transforms
(Artal, 1990; Iskander, Collins, Davis & Carney, 2001). The through-focus
VSOTF is obtained in step 7. The calculation was repeated in a total of 49 steps
corresponding to a defocus level ranging from 3 D to +3 D in 0.125 D intervals.
An example of how the matching threshold value is estimated for data acquired
from averaged wavefront measurements of a subject in a 5 mm pupil is shown in
Figure 4.3. After obtaining the through-focus VSOTF of the subject from
wavefront data, an iterative calculation was performed, reducing the threshold
level from 99% of the maximum achievable VSOTF value, until the effective
range of defocus error produced by 12 DD gives the closest match to the
subjectively measured DOF. This threshold value was taken as the matching
threshold to estimate the DOF for this subject. The same procedure was
performed for measurements of each individual subject.

88
Figure 4.3 Estimation of matching threshold based on through-focus VSOTF.
4.2.5 Statistical analysis
Averages are represented in term of mean SD (standard deviation). Collected
data including subjective DOF, individual matching thresholds and HOA RMS in
both a 5 mm and a 3.5 mm pupil were tested for normal distribution. For
correlating the estimated VSOTF threshold values with other measures of retinal
image quality, Pearson‟s correlation coefficient was calculated.

89
4.3 Results
4.3.1 Individual matching threshold of the subjects
The individual matching threshold of 17 subjects was estimated using the
algorithm described in Figure 4.2. Data including the subjective DOF, the
matching threshold, HOA RMS and spherical aberration were collected for both a
5 mm and a 3.5 mm pupil diameter. The group mean values were shown in Table
4.1. The subjective DOF measured in the experiment ranged from 0.55 D to
1.05 D, with a mean value of 0.79 ±0.15 D, in a 5 mm pupil. When the pupil
diameter was limited to 3.5 mm, the mean DOF increased to 1.30 ±0.21 D, while
the total HOA RMS and spherical aberration reduced compared to those in a
5 mm pupil. The group means of the individual threshold estimated from the
through-focus VSOTF were 65.6 ±10.1% (ranged from 45~83%) and
36.9 ±18.4% (ranged from 15~83%) in a 5 mm pupil and a 3.5 mm pupil,
respectively.
Table 4.1 Group average results in a 5 mm pupil and a 3.5 mm pupil diameter.
Pupil
Size
Subjective
DOF (D)
Matching
Threshold
(%)
HOA RMS
(µm)
Z(4,0)
(µm)
DOF (D)
estimated
from a
50%
Threshold
DOF (D)
estimated
from an
80%
Threshold
5 mm 0.79 ± 0.15 65.6 ±
10.1
0.30 ±
0.08
0.075 ±
0.062
1.12±0.34 0.58±0.17
3.5 mm 1.30 ± 0.21 36.9 ±
18.4
0.12 ±
0.05
0.020 ±
0.015
1.07±0.54 0.52±0.24
To estimate DOF directly from wavefront measurements in a robust manner,
correlation analysis was performed between subjective DOF and HOA RMS,
subjective DOF and SA, matching threshold (from the through-focus VSOTF)
and HOA RMS, and estimated threshold and SA.

90
For a 5 mm pupil diameter, weak correlation was found between the subjective
DOF and HOA RMS (r=0.36, p>0.05), and between subjective DOF and SA
(r=0.24, p>0.05). The matching threshold showed significant correlation with the
total HOA RMS (Pearson‟s r=0.88, p<0.001). Moderate correlation was shown
between the estimated threshold and the spherical aberration value in the eye
(r=0.52, p=0.05). For a 3.5 mm pupil diameter, there was no significant
correlation observed between the DOF and HOA RMS. There was weak
correlation between DOF and SA (r=0.49, p>0.05). No correlation was found
between the estimated threshold and the spherical aberration value (Pearson‟s
r=0.36, p>0.05). However, significant correlation was found between the
estimated threshold and the HOA RMS (Pearson‟s r=0.62, p<0.05).
It was found that the DOF matching threshold and HOA RMS has the strongest
correlation (Pearson‟s r=0.88, p<0.001) in a 5 mm pupil (shown in Figure 4.4a,
with 95% confidence bands). By fitting a linear function to the data, the following
equation was obtained:
2)30.0(05.10726.12
99.33)(86.106_
RMSHOA
RMSHOApredictedevelThresholdL
(4-1)
This equation (including 95% confidence intervals) can be used to calculate the
individual threshold level for estimating the DOF using VSOTF from wavefront
measurements in subjects with normal amount of HOA.
91
Figure 4.4 Correlation between the estimated threshold and HOA RMS (a) in a
5 mm pupil, and (b) in a 3.5 mm pupil. Solid line is the linear regression and
dashed line is the 95% confidence band.
Since the astigmatism correction by the trial lens had a limited precision of 0.25 D,
it was also of interest to investigate whether the presence of the residual
astigmatism can significantly affect this result. Accordingly, additional
calculations have been performed in which we first found the sphero-cylindrical
difference between the trial lens astigmatic correction and the one measured with
the wavefront sensor (note that the wavefront aberrations were measured without
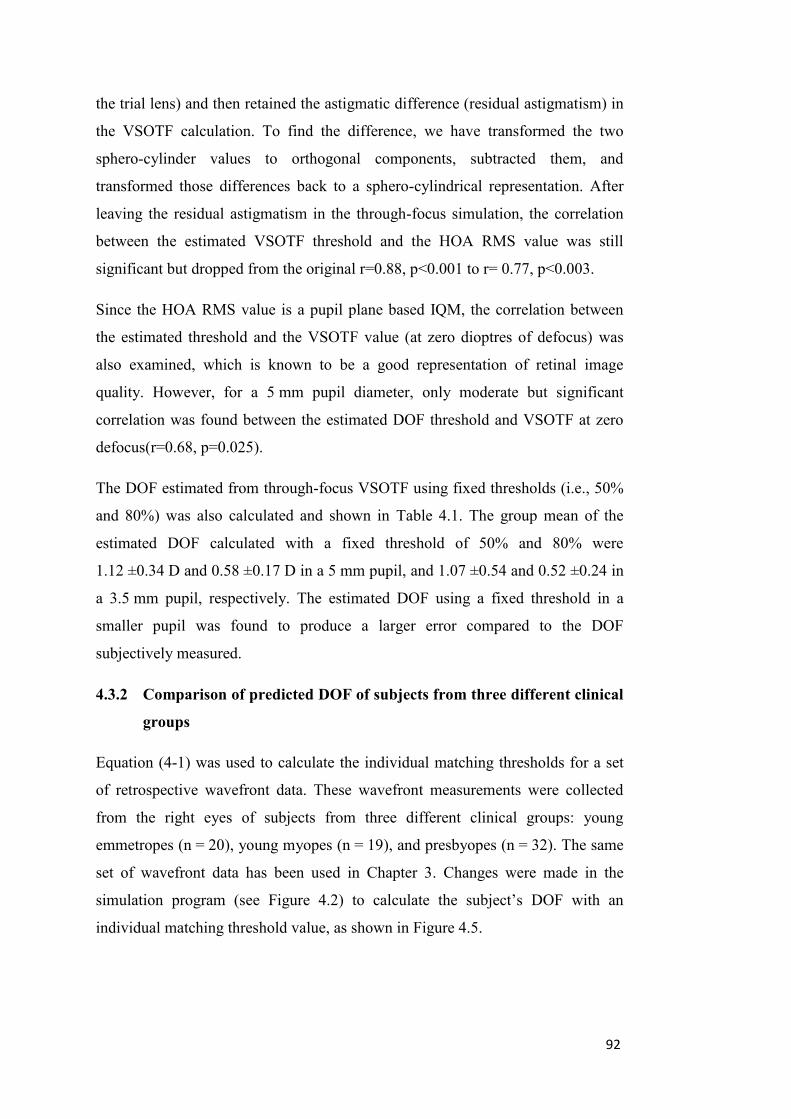
92
the trial lens) and then retained the astigmatic difference (residual astigmatism) in
the VSOTF calculation. To find the difference, we have transformed the two
sphero-cylinder values to orthogonal components, subtracted them, and
transformed those differences back to a sphero-cylindrical representation. After
leaving the residual astigmatism in the through-focus simulation, the correlation
between the estimated VSOTF threshold and the HOA RMS value was still
significant but dropped from the original r=0.88, p<0.001 to r= 0.77, p<0.003.
Since the HOA RMS value is a pupil plane based IQM, the correlation between
the estimated threshold and the VSOTF value (at zero dioptres of defocus) was
also examined, which is known to be a good representation of retinal image
quality. However, for a 5 mm pupil diameter, only moderate but significant
correlation was found between the estimated DOF threshold and VSOTF at zero
defocus(r=0.68, p=0.025).
The DOF estimated from through-focus VSOTF using fixed thresholds (i.e., 50%
and 80%) was also calculated and shown in Table 4.1. The group mean of the
estimated DOF calculated with a fixed threshold of 50% and 80% were
1.12 ±0.34 D and 0.58 ±0.17 D in a 5 mm pupil, and 1.07 ±0.54 and 0.52 ±0.24 in
a 3.5 mm pupil, respectively. The estimated DOF using a fixed threshold in a
smaller pupil was found to produce a larger error compared to the DOF
subjectively measured.
4.3.2 Comparison of predicted DOF of subjects from three different clinical
groups
Equation (4-1) was used to calculate the individual matching thresholds for a set
of retrospective wavefront data. These wavefront measurements were collected
from the right eyes of subjects from three different clinical groups: young
emmetropes (n = 20), young myopes (n = 19), and presbyopes (n = 32). The same
set of wavefront data has been used in Chapter 3. Changes were made in the
simulation program (see Figure 4.2) to calculate the subject‟s DOF with an
individual matching threshold value, as shown in Figure 4.5.
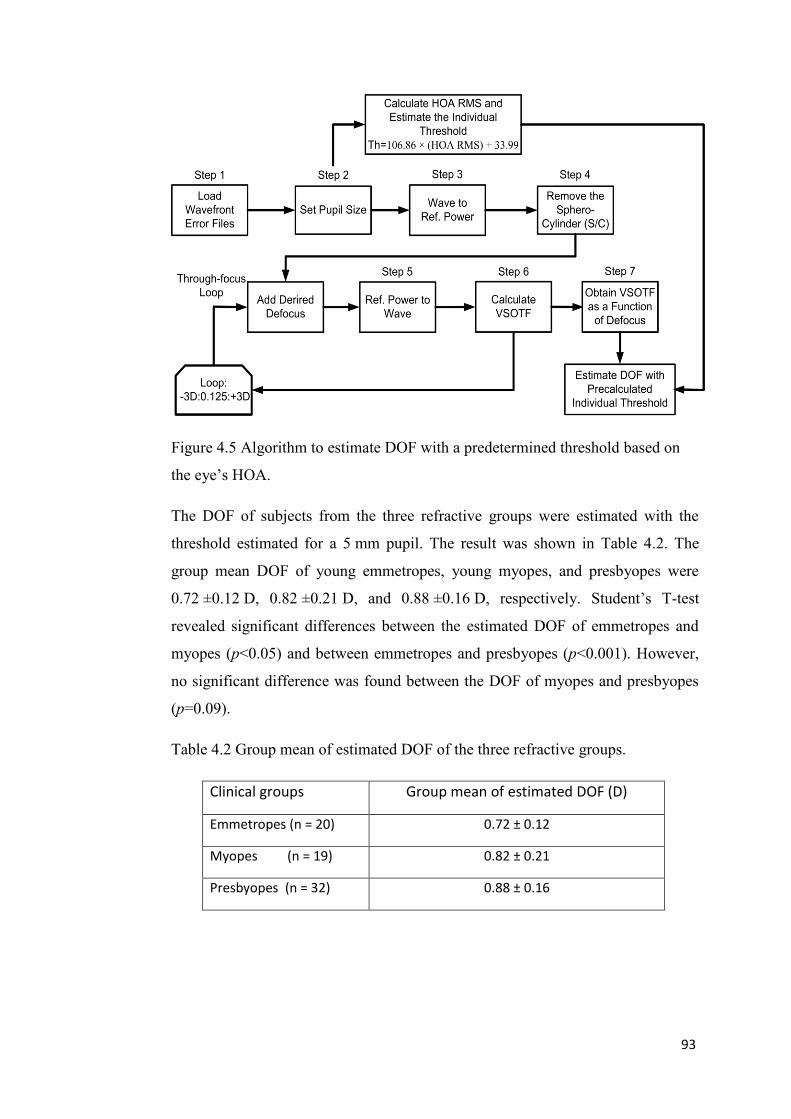
93
Figure 4.5 Algorithm to estimate DOF with a predetermined threshold based on
the eye‟s HOA.
The DOF of subjects from the three refractive groups were estimated with the
threshold estimated for a 5 mm pupil. The result was shown in Table 4.2. The
group mean DOF of young emmetropes, young myopes, and presbyopes were
0.72 ±0.12 D, 0.82 ±0.21 D, and 0.88 ±0.16 D, respectively. Student‟s T-test
revealed significant differences between the estimated DOF of emmetropes and
myopes (p<0.05) and between emmetropes and presbyopes (p<0.001). However,
no significant difference was found between the DOF of myopes and presbyopes
(p=0.09).
Table 4.2 Group mean of estimated DOF of the three refractive groups.
Clinical groups Group mean of estimated DOF (D)
Emmetropes (n = 20) 0.72 ± 0.12
Myopes (n = 19) 0.82 ± 0.21
Presbyopes (n = 32) 0.88 ± 0.16

94
4.4 Discussion
A novel method to estimate the individual threshold from through-focus VSOTF
for calculating the DOF of normal subjects from their wavefront aberrations has
been developed in this study. The threshold estimating method was based on the
subjective DOF measurements of real subjects using the defining criterion of
“just noticeable blur”. Therefore, it provided practical validation that the DOF
estimated from wavefront aberrations can correlate with the DOF measured
subjectively.
The DOF subjectively measured for the subjects in the experiment ranged from
0.55 D to 1.05 D with a mean value of 0.79 ±0.15 D, and ranged from 0.80 D to
1.61 D, with a mean value of 1.31 ±0.21 D, in a 5 mm pupil and a 3.5 mm pupil,
respectively. These values match well with the range of results found in young
subjects from 0.8 to 1.2 D (in a pupil size ranging from 3 to 5 mm) as reported by
Ogle and Schwartz (1959), Tucker and Charman (1975), and Wang and Ciuffreda
(2004). Ogle and Schwartz‟s measurements were based on 50% probability of
resolving a 20/25 checker board. Tucker and Charman‟s measurements were
based on 80% probability of achieving 90% of the optimal Snellen acuity. In
Wang and Ciuffreda‟s study (2004), the subjects viewed through a dual-channel
Badal optical system, and made judgments of when the test target showed “just
noticeable blur”.
Using different definitions of DOF are likely to affect the measured value of
subjective DOF (Wang & Ciuffreda, 2006). In clinical or research applications,
the range of defocus which decreases the visual acuity or contrast sensitivity to a
certain limit is often used as a criterion for DOF (Ogle & Schwartz, 1959; Tucker
& Charman, 1975; Legge, Mullen, Woo & Campbell, 1987). For real life
scenarios, the perception of “blur” can be considered to be a more relevant
criterion (Campbell, 1957; Atchison, Charman & Woods, 1997). Atchison et al
(2005) defined three levels of blur limits as: “noticeable”, “troublesome” and
“objectionable”. The authors found the magnitudes of “troublesome” and
“objectionable” limits were approximately 1.6-1.8 times and 2.1-2.5 times greater
than the “noticeable” limits, respectively. The widely adopted criterion “just
noticeable blur” has been chosen in this experiment to measure the subjective

95
DOF, but it is expected that a larger DOF would be obtained if a criteria of
“troublesome blur” or “objectionable blur” were chosen. Furthermore, DOF
defined by the blur criterion of “objectionable blur” may provide a closer match
to the acceptance of multifocal optics (simultaneous vision) by presbyopic
patients.
The choice of image quality metrics to estimate the depth of focus will influence
the predicted outcomes, but metrics calculated at the retinal image plane are
thought to be superior to those in the pupil plane for predicting subjective
refraction (Thibos, Hong, Bradley & Applegate, 2004). To study the predicted
DOF, the augmented visual Strehl ratio of the OTF (VSOTF) was used as the
retinal image quality metric covering overall spatial frequencies up to 60 cpd.
VSOTF has been found to correlate well with subjective visual performance in a
number of studies (Guirao & Williams, 2003; Cheng, Bradley & Thibos, 2004).
When calculated in through-focus, it represents the interaction between HOA and
defocus on retinal image quality (Collins, Buehren & Iskander, 2006). In this
study, a strong correlation was found between DOF threshold and HOA RMS in a
5mm pupil. Known as a better representative of retinal image quality, the VSOTF
at zero defocus was expected to have better correlation to the DOF threshold.
However, a weaker but still significant correlation was observed between the
DOF threshold and the VSOTF value at zero dioptres. This may be due to the fact
that for most of the subjects, the peak value of VSOTF does not locate at zero
defocus level.
The frequency-dependant features of the DOF was not investigated in this study
(the used target contained a range of spatial frequencies), but had been
extensively studied by other groups (Tucker & Charman, 1986; Legge, Mullen,
Woo & Campbell, 1987; Atchison, Charman & Woods, 1997).
It is shown that using a fixed IQM threshold (e.g. 50% or 80%) to estimate the
DOF may produce results significantly varying from the subjectively measured
DOF. In this study, the estimated DOF from through-focus VSOTF with a 50%
threshold level had an average error of 0.33 ±0.25 D and 0.55 ±0.34 D in a 5 mm
pupil and a 3.5 mm pupil respectively, compared to the subjective DOF.
Calculating the DOF with an 80% threshold averagely underestimated the DOF
96
by 0.21 ±0.15 D and 0.80 ±0.32 D, in a 5 mm pupil and a 3.5 mm pupil,
respectively. In general, use of fixed thresholds caused larger errors for the DOF
estimation in a smaller pupil. The application of Equation (4-1) to calculate the
individual thresholds has also been shown of subjects from three clinical groups
and estimated their DOF with the developed algorithm (shown in Figure 4.5). The
group mean of estimated DOF of myopes and presbyopes were found to be
significantly greater than that of emmetropes. However, no significant difference
was found between the mean DOF of myopes and presbyopes, which may due to
the fact that most presbyopic subjects in this study were also myopic.
The developed method to estimate the threshold for calculating the DOF from
wavefront aberration was affected by the subject‟s pupil size. The strong
correlation between the matching threshold level and HOA RMS was only
observed in a larger (5 mm) pupil. When pupil size was restricted to 3.5 mm, the
eye‟s blur circle was reduced. The magnitude of specific dominant HOA terms
(such as spherical aberration and coma) were also significantly lower than that in
a 5 mm pupil. These changes will significantly influence the details of the
calculated through-focus IQMs, and therefore, affect the accuracy of threshold
and DOF estimation. The matching threshold estimation method is also limited
by the range of HOA RMS. It can be applied to predict the DOF of subjects with
normal amount and structure of HOA (Porter, Guirao, Cox & Williams, 2001;
Wang & Koch, 2003). For the eyes of keratoconic subjects or patients who have
undergone refractive surgery, their significantly higher amount of HOA may also
affect the accuracy of the method, or simply exceed the predictable range.
In this study, the subjective measurements and estimating of DOF were all
performed in monochromatic light. In natural scenes, the chromatic aberrations in
the human eye will also affect the DOF (Campbell, 1957). Legge et al. (1987)
used the method described by van Meeteren (1974) to calculate the depth of focus
for monochromatic and white light at different spatial frequencies and pupil sizes.
A very small increase was found for white light DOF compared to the one
calculated for monochromatic light. Experimental measurements also showed
only small differences (Campbell, 1957).

97
In conclusion, it is shown in this study that the IQM threshold level used to
theoretically estimate the DOF from wavefront aberrations can be adaptively
optimized for each individual subject, and this method is most reliable with larger
pupils (i.e., 5 mm pupil diameter). Using a fixed threshold level to estimate the
DOF in different subjects or for DOF of the same subject in different pupil sizes
may lead to erroneous estimates.

98
Chapter 5. Subjective measurement of depth of focus in
keratoconic eyes
5.1 Introduction
Studies have been performed to compare the DOF in different refractive error
groups, with myopes reported to show slightly greater DOF than emmetropes
(Rosenfield and Abraham-Cohen, 1999; Collins, Buehren & Iskander, 2006;
Vasudevan, Ciuffreda & Wang, 2006). This could be due to increased levels of
higher order aberrations (HOA) in myopes (He et al., 2002) or to a difference in
sensitivity to blur in myopes (Thorn et al., 1998; Rosenfield and Abraham-Cohen,
1999). Hyperopes also show larger DOF compared to emmetropes (Vasudevan,
Ciuffreda & Wang, 2006), which may also be explained by the higher corneal
asphericity and greater level of HOA in hyperopes (Llorente et al., 2004a). The
DOF of the human eye also increases with age. Presbyopes have been reported to
have higher DOF than younger subjects (Nio et al., 2000). These differences may
arise from pupil constriction and increased levels of HOA associated with
increased age (McLellan et al., 2001; Artal et al., 2002).
However, little appears to be known about the DOF in the eyes of keratoconics.
Since keratoconus results in significant increases in the level of HOA of the eye,
including spherical aberration, coma and trefoil (Maeda et al., 2002), this
population of subjects provides an opportunity to study the influence of these
HOA on DOF. This information has implications for the DOF of keratoconic
subjects as they reach presbyopia and their needs for near correction.
In Chapter 3, the DOF for a group of keratoconic subjects was theoretically
modeled. The predicted DOFs estimated by VSOTF of keratoconic were
approximately 2.5 times and 3 times larger than the mean values of normal eyes in
a 5 mm pupil, when fixed thresholds of 80% and 50% were used, respectively.
However, the predicted value may lack correlation to the subjective DOF.
Possible errors generated by using fixed thresholds when estimating the DOF in
individual eyes have also been demonstrated by Yi, Iskander & Collins (2010).
Due to the large amount of HOAs in the keratoconic eyes, there has not been a

99
method to effectively predict their DOF, which would correlate with the
subjectively measured DOF. The aim of this study was to measure the subjective
DOF of keratoconic eyes and compare it to that of normal subjects.
5.2 Methods
5.2.1 Subjects
The study was performed on two groups of subjects. The control group comprised
10 adult subjects (five males and five females) with Snellen visual acuity of at
least 6/6 in the tested eye with their best refractive correction. The mean age of
the control subjects was 28 years, ranging from 18 to 46 years. The group had a
mean spherical equivalent refractive error of 1.50 ±2.15 D (ranging from
5.50 D to +0.50 D) and the mean cylindrical refraction was 0.20 ±0.23 D
(ranging from 0.50 D to 0 D) in the right eye. All control subjects reported to
have no history of significant eye diseases or corneal injury and all were
experienced in psychophysical and optical experiments.
The second group consisted of five subjects (two males and three females)
diagnosed with keratoconus. This diagnosis was based on the presence of
significant asymmetry in the corneal topography map and an axial power of at
least 50 D at the cone apex. Because of the large differences in optical aberrations
between the two eyes of the keratoconic subjects (Burns et al., 2004), DOF
measurements were taken in both eyes of the subject. The ages of keratoconic
subjects ranged from 21 to 35, with a mean age of 27 ±6 years. The mean
spherical equivalent of the 10 keratoconic eyes was 0.65 ±3.53 D (ranging from
10.5 D to +1.75 D) and the mean cylindrical refraction was 1.95 ±1.36 D
(ranging from 5 D to 0.75 D). The level of experience of the keratoconus
subjects in psychophysical vision experiments was good, as all had previously
participated in experiments related to visual performance. The Snellen visual
acuity of the keratoconic subjects with spectacle correction ranged from 6/10 to
6/6. The subjects gave written informed consent and the study met the
requirements of the University Human Ethics Committee and was conducted in
accordance with the Declaration of Helsinki (Appendix C).

100
5.2.2 Apparatus
The optical layout of the apparatus with two Badal optical channels is shown in
Figure 5.1. Similar systems were used in earlier experiments of Legge et al. (1987)
and Wang and Ciuffreda (2004).
Figure 5.1 The two-channel Badal system. L1 and L2 are the Badal lenses, PM is
a first surface mirror and CBS is a 50:50 cube beam splitter.
The variable channel (Channel 1) of the system is aligned with the line of sight of
the subject‟s tested eye. It consists of a Badal lens L1 and a moveable target
(Target 1). The Badal lens is a 5 D achromatic lens with its secondary focal point
located at the entrance pupil of the tested eye. The target consists of a vertical
half-star image, which was divided by six spokes (30 degrees separation). The
image was printed on a piece of clear plastic sheet, which is attached to a piece of
diffuse paper, and back illuminated by a distal white light LED (120 cd/m2). In
such a setting, every centimeter of movement of the target will induce a change in
target vergence of approximately 0.25 D at the entrance pupil of the eye. The
standard channel (Channel 2) has the same components as Channel 1, with L2‟s
secondary focal point coinciding with the entrance pupil of tested eye. Target 2 is
always placed on the optical far point of the subject‟s tested eye. The two Badal
channels were combined together optically by a cube beam splitter (CBS,
transmittance: reflectance = 50:50). The two hemi-fields formed by the two
targets juxtaposed to one another as seen in Figure 5.1. In this setting, the
peripheral ends of the target entered the eye with an angle of approximately 3

101
degrees and the central area subtended an angle of about 0.6 degree. The reason
for using the star image as the target instead of a letter chart was to minimize the
possible interaction between high amounts of coma and trefoil in the keratoconic
eyes with defocus to cause orientation-specific blur of the target.
The subject‟s head was positioned in a heavy, customized headrest without the
use of a bite bar. The experiment operator could adjust the head position of the
subject in three dimensions to align the line of sight with the optical axis of the
Badal system. A 5 mm artificial pupil was mounted before the tested eye. Trial
lenses were used to correct the sphero-cylinder refractive error of the eye during
the experiment. The fellow eye was occluded with a black eye patch during
testing.
5.2.3 Protocol
During the measurement, the subjects need to determine the position of “clear”
and “just noticeable blur” in both positive and negative directions, corresponding
to the target moving away from and towards the eye, respectively. Since the best
achievable retinal image quality by using trial lens correction of keratoconic eyes
may still be lower than the normal eyes, a modified blur criterion from the widely
adopted “just noticeable blur” criterion was used to estimate the subject‟s DOF.
In this study, the “clear” position is the target position where it was judged by the
subject as being as clear and sharp as possible. The “just noticeable blur” position
is the position that the observer can first notice a change or loss of sharpness or
clarity in any part of the target compared to the “clear” position.
To minimize learning effects, a short pre-measurement training on the system was
given to all subjects. In the training session, different levels of target vergences
were induced by changing the location of target 1. At first, the two semi-halves of
the target were aligned on the same optical plane, which was coincident with the
optical far point of the tested eye. The subjects were instructed to fixate and to
keep in focus the central portion and nearby spokes of the standard target. Then
the experiment operator slowly moved the variable target in one direction, either
towards or away the eye. The subjects needed to determine when the “just
noticeable blur” appeared on the variable target and indicate this to the operator,
while maintaining focus on the central part of the standard target. The training
102
took about 10 minutes until the subject became familiar with the blur judgment
task.
DOF measurement was first performed in the control group in two conditions,
both with and without cycloplegia, to examine the effect of cycloplegia on DOF
and determine the need for cycloplegia in DOF measurement using this apparatus.
All measurements were performed in dim room illumination (< 10 lux).
Cyclopentolate HCL (1% MinimsTM
, 0.5 mL, Bausch & Lomb Australia, Pty Ltd.)
was instilled to cause cycloplegia and dilation of the subject‟s right eye. The DOF
measurements then started about 30 minutes later, after the maximum
pharmacological effect of cyclopentolate was reached (Manny et al., 1993).
The procedure of measurement involved first occluding the target in channel 1
and the experiment operator moved the target in channel 2 to the optical far point
of the subject‟s eye, to form a clear retinal image. Then the subject was allowed
to view through both channels 1 and 2. The operator then adjusted the location of
target 1 from L1 until it had equal clarity to target 2. At this stage, the two images
formed by target 1 and target 2 should have the same sharpness and appeared to
be at the same object plane to the subject‟s eye. The left semifield was formed by
target one and the right semifield was formed by target 2, as shown in Figure 5.1.
The operator recorded this position of target 1 on the scale as the “clear” position.
The operator then moved target 1 in one direction, (which was randomly selected)
and the subject was instructed to focus on the image of target 2 from the standard
channel. When “just noticeable blur” in the moving target 1 was reported by the
subject, the operator recorded the location of target 1. After that, the operator
slowly moved target 1 in the opposite direction. During the movement, the
subject first observed the “clear” position, and as the movement of target 1
continued, the appearance of “just noticeable blur” would be again noted by the
subject. The scale reading of this position was again recorded by the operator.
These two limits of the Badal stage movement represented one measurement of
DOF. The scale readings were later converted to target vergences and used for
calculating DOF. For each tested eye, five sets of such measurements were
performed. The moving speed of target 1 was not constant to avoid the possibility
that the subject may remember the time it took to observe the “just noticeable
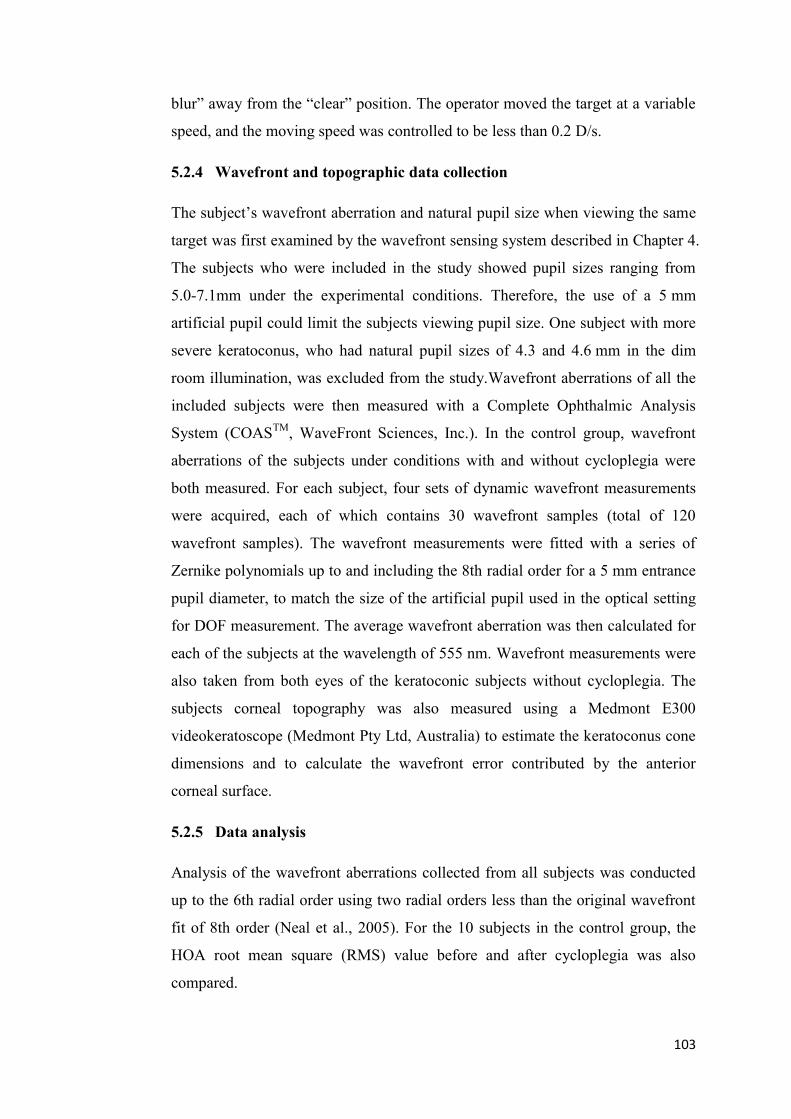
103
blur” away from the “clear” position. The operator moved the target at a variable
speed, and the moving speed was controlled to be less than 0.2 D/s.
5.2.4 Wavefront and topographic data collection
The subject‟s wavefront aberration and natural pupil size when viewing the same
target was first examined by the wavefront sensing system described in Chapter 4.
The subjects who were included in the study showed pupil sizes ranging from
5.0-7.1mm under the experimental conditions. Therefore, the use of a 5 mm
artificial pupil could limit the subjects viewing pupil size. One subject with more
severe keratoconus, who had natural pupil sizes of 4.3 and 4.6 mm in the dim
room illumination, was excluded from the study.Wavefront aberrations of all the
included subjects were then measured with a Complete Ophthalmic Analysis
System (COASTM
, WaveFront Sciences, Inc.). In the control group, wavefront
aberrations of the subjects under conditions with and without cycloplegia were
both measured. For each subject, four sets of dynamic wavefront measurements
were acquired, each of which contains 30 wavefront samples (total of 120
wavefront samples). The wavefront measurements were fitted with a series of
Zernike polynomials up to and including the 8th radial order for a 5 mm entrance
pupil diameter, to match the size of the artificial pupil used in the optical setting
for DOF measurement. The average wavefront aberration was then calculated for
each of the subjects at the wavelength of 555 nm. Wavefront measurements were
also taken from both eyes of the keratoconic subjects without cycloplegia. The
subjects corneal topography was also measured using a Medmont E300
videokeratoscope (Medmont Pty Ltd, Australia) to estimate the keratoconus cone
dimensions and to calculate the wavefront error contributed by the anterior
corneal surface.
5.2.5 Data analysis
Analysis of the wavefront aberrations collected from all subjects was conducted
up to the 6th radial order using two radial orders less than the original wavefront
fit of 8th order (Neal et al., 2005). For the 10 subjects in the control group, the
HOA root mean square (RMS) value before and after cycloplegia was also
compared.

104
Two parameters from the corneal topography of keratoconic subjects were
calculated. They included the cone dimensions (cone location and volume) and
corneal wavefront aberrations. The topography files were first loaded into a
customized program written in Matlab (The MathWorks, Inc., Natick, MA). Then
the subject‟s corneal height data were decomposed into a finite series of Zernike
polynomials (Iskander, Collins & Davis, 2001).
,),(ˆ,1
P
p
ppZaC (5-1)
where C(ρ,θ) is the corneal surface, p = 1,..., P is the polynomial-ordering number,
),( pZ is the pth Zernike polynomial, pa is the coefficient associated with
),( pZ , ρ is the nomalized distance from the origin, θ is the angle, and ,
is the modeling noise, respectively.
The first six Zernike polynomials model the tilts, and the paraboloidal curvature
of the corneal surface. By setting the first six Zernike coefficients to zero, the
estimate of residual corneal elevation was obtained, which was the corneal height
from the original topography after a parabolic surface described by the first six
Zernike polynomials was subtracted. The approximated residual corneal elevation
is given by
P
p
ppres ZaC7
,ˆ,ˆ (5-2)
The cone dimensions in keratoconic eyes were then calculated using the method
of Schwiegerling (1997) by fitting a two-dimensional Gaussian function in the
following form to the cone on the residual corneal elevation.
2
2
0
2
2
00
2
)(
2
)(exp),(
yx
yyxxhyxf
(5-3)
where h0 is the peak height of the cone, (x0, y0) is the location of the peak relative
to the keratoscopic axis, and σx and σy are the lateral dimensions of the cone
determined by the cone height falls to 1/e (e is the Euler's constant equal to 2.718)
of the peak value. The volume of the cone was given by

105
02_ hvolumeCone yx (5-4)
while the distance of the peak of cone from the keratoscopic axis was calculated
by
2
0
2
00 yxd (5-5)
and the distance from the pupil center to the peak of cone was given by
Offsetddd
0 (5-6)
where Offsetd is the offset between keratoscopic axis and pupil center. Wavefront
aberrations contributed by the anterior corneal surface are the dominant
component of the total ocular wavefront in a keratoconic eye. The corneal
wavefront error of the keratoconic eyes was derived from the topographic data
using a 3D ray-trace method (provided by the Contact Lens & Visual Optics Lab,
QUT), which was also performed in a dedicated program written in Matlab. The
corneal wavefront error was calculated with a common axis (the line of sight
based on the center of entrance pupil) as the total wavefront. Therefore no
realignment was required to match the corneal wavefront data to the ocular
wavefront data.
5.3 Results
5.3.1 The effect of cycloplegia on DOF
DOF, HOA RMS, and spherical aberrations 0
6
0
4 ZZ of the control subjects‟
eyes measured with and without cycloplegia are shown in Table 5.1.
After the subjects underwent cycloplegia, the group mean of HOA RMS
increased slightly from 0.30 ±0.08 µm to 0.33 ±0.07 µm. A similar trend was
observed in the subjects‟ spherical aberration. The group mean DOF also
increased very slightly from 0.73 ±0.09 D prior to cycloplegia to 0.78 ±0.11 D
after cycloplegia. However, none of these changes in HOA, SA and DOF were
statistically significant (p>0.1). The range of subjective DOF measured with the
dual-channel Badal system matched well with the value of 0.79±0.15 D for a

106
5 mm pupil as found in the experiment of Chapter 4. Based on these results, the
DOF measurements in keratoconic group were performed without cycloplegia.
Table 5.1 The effect of cycloplegia on DOF, HOA RMS and spherical aberration
in a 5 mm pupil.
Without Cycloplegia With Cycloplegia
Subject HOA RMS
(µm)
SA
(µm)
DOF
(D)
HOA RMS
(µm)
SA
(µm)
DOF
(D)
Subject 1 0.30 0.05 0.86 0.33 0.05 0.89
Subject 2 0.44 0.02 0.61 0.42 0.03 0.63
Subject 3 0.43 0.07 0.68 0.47 0.11 0.79
Subject 4 0.23 0.06 0.77 0.27 0.07 0.83
Subject 5 0.17 0.08 0.62 0.25 0.10 0.86
Subject 6 0.29 0.09 0.75 0.27 0.09 0.64
Subject 7 0.27 0.08 0.74 0.31 0.07 0.87
Subject 8 0.24 0.07 0.68 0.28 0.07 0.72
Subject 9 0.30 0.06 0.77 0.31 0.06 0.68
Subject 10 0.31 0.15 0.87 0.39 0.19 0.95
Mean±
std
0.30 ±0.08 0.07±0.03 0.73
±0.09
0.33
±0.07
0.08
±0.04
0.78
±0.11
5.3.2 Result of measurements in keratoconic subjects
The HOAs up to and including the 6th radial order of the control group and
keratoconus group were compared (Figure 5.2) and the HOAs in keratoconic eyes
were found to be significantly higher than those in the normal eyes. Significant
differences were observed in the RMS values of spherical aberrations ( 0
6
0
4 ZZ ),
coma-like aberrations ( 1
5
1
3
ZZ ) and trefoil ( 3
5
3
3
ZZ ) terms, particularly in
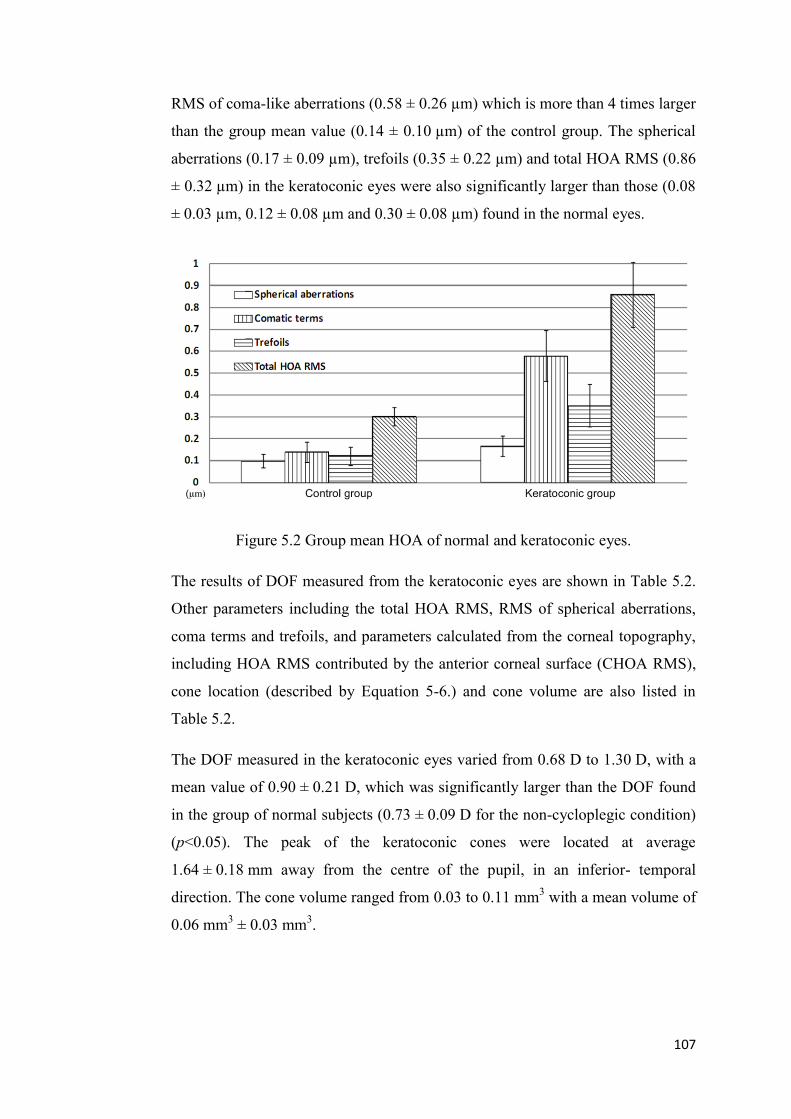
107
RMS of coma-like aberrations (0.58 ± 0.26 µm) which is more than 4 times larger
than the group mean value (0.14 ± 0.10 µm) of the control group. The spherical
aberrations (0.17 ± 0.09 µm), trefoils (0.35 ± 0.22 µm) and total HOA RMS (0.86
± 0.32 µm) in the keratoconic eyes were also significantly larger than those (0.08
± 0.03 µm, 0.12 ± 0.08 µm and 0.30 ± 0.08 µm) found in the normal eyes.
Figure 5.2 Group mean HOA of normal and keratoconic eyes.
The results of DOF measured from the keratoconic eyes are shown in Table 5.2.
Other parameters including the total HOA RMS, RMS of spherical aberrations,
coma terms and trefoils, and parameters calculated from the corneal topography,
including HOA RMS contributed by the anterior corneal surface (CHOA RMS),
cone location (described by Equation 5-6.) and cone volume are also listed in
Table 5.2.
The DOF measured in the keratoconic eyes varied from 0.68 D to 1.30 D, with a
mean value of 0.90 ± 0.21 D, which was significantly larger than the DOF found
in the group of normal subjects (0.73 ± 0.09 D for the non-cycloplegic condition)
(p<0.05). The peak of the keratoconic cones were located at average
1.64 ± 0.18 mm away from the centre of the pupil, in an inferior- temporal
direction. The cone volume ranged from 0.03 to 0.11 mm3 with a mean volume of
0.06 mm3 ± 0.03 mm
3.

108
Table 5.2 Results of keratoconic eyes.
Subject DOF (D)
Ocular wavefront aberration RMS HOA RMS (µm)
Spherical aberration
(µm)
Coma terms (µm)
Trefoils
(µm)
KC1 OS 0.93 1.12 0.17 0.78 0.71 KC1OD 0.68 0.60 0.07 0.33 0.46 KC2 OS 0.70 1.14 0.27 0.89 0.20 KC2 OD 0.79 1.10 0.25 0.80 0.25 KC3 OS 1.30 0.87 0.31 0.65 0.12 KC3 OD 0.77 0.51 0.19 0.31 0.16 KC4 OS 0.85 0.42 0.11 0.20 0.23 KC4 OD 1.24 1.21 0.17 0.81 0.74 KC5 OS 0.94 1.09 0.08 0.67 0.32 KC5 OD 0.87 0.49 0.06 0.32 0.31 Mean ±std 0.90 ±0.21 0.86 ±0.31 0.17 ±0.09 0.58 ±0.26 0.35 ±0.22
Subject Parameters calculated from topography CHOA RMS (µm)
Cone location d
(mm)
Cone volume v (mm
3)
KC1 OS 1.38 1.3095 0.11
KC1OD 0.64 1.7857 0.03
KC2 OS 1.35 1.7595 0.08
KC2 OD 1.33 1.6302 0.06
KC3 OS 1.54 1.3695 0.11
KC3 OD 0.69 1.7857 0.03
KC4 OS 0.78 1.5468 0.03
KC4 OD 1.58 1.5989 0.08
KC5 OS 1.39 1.7283 0.09
KC5 OD 1.10 1.8563 0.03
Mean± std 1.18 ±0.35 1.64 ±0.18 0.06 ±0.03
Correlation analysis was first performed for the pooled data including both the
normal eyes and keratoconic eyes. Since the pooled data was comprised of two
distinct subgroups, simple calculation of Pearson‟s r may give misleading
estimation of the strength of a relationship between two variables, whenever there
are uncertainty about the linearity of a relationship or when there are outliers
(Hotelling and Pabst, 1936; Spearman, 1987). As an alternative, Spearman‟s rank
correlation coefficient rho has been used, which is a Pearson's r correlation,
computed not on the original variables, but on the variables transformed into
rank-orders, to estimate the association. Significant correlation was found
between DOF and HOA RMS (rho=0.47, p<0.05), and a weaker correlation was
found between DOF and SA (rho=0.40, p=0.08).

109
Correlation analysis was also performed across all keratoconic eyes, between the
DOF and ocular wavefront and between DOF and parameters calculated from the
corneal topography. No statistically significant correlation was found between the
DOF and the four ocular wavefront parameters across the 10 tested eyes (for
HOA RMS, spherical aberration, coma and trefoil, r=0.32, 0.30, 0.30 and 0.25,
respectively, and all p>0.1). Significant correlation was found between DOF and
CHOA RMS (r=0.67, p<0.05). Mild correlations were also shown between DOF
and cone volume v and between DOF and cone location d (r=0.60, -0.59 and
p=0.07, 0.08).
5.3.3 Comparison between the left and right eye of keratoconic subjects
Differences in DOF and other parameters between the keratoconic subjects‟ left
and right eyes were calculated and are shown in Table 5.3.
Table 5.3 Comparison between the left and right eye.
Subject
Difference between left and right eye (Ocular wavefront aberration RMS)
∆DOF (D)
∆HOA RMS (µm)
∆Spherical aberrations
(µm)
∆Coma terms (µm)
∆Trefoils
(µm)
KC1 0.25 0.53 0.10 0.45 0.26 KC2 -0.09 -0.01 0.02 0.10 -0.05 KC3 0.53 0.36 0.12 0.34 -0.04 KC4 -0.39 -0.79 -0.06 -0.61 -0.51 KC5 0.07 0.60 0.017 0.35 0.01 Subject
Difference between left and right eye (Parameters calculated from topography)
∆DOF (D)
∆CHOA RMS (µm)
∆Cone location ∆d
(mm)
∆Cone volume ∆v
(mm3)
KC1 0.25 0.74 -0.48 0.08
KC2 -0.09 0.02 0.08 0.02
KC3 0.53 0.75 -0.48 0.08 KC4 -0.39 -0.85 0.32 -0.05
KC5 0.07 0.76 -0.24 0.06
Strong correlation was found between the difference of DOF (∆DOF) in the
subject‟s two eyes and the difference in spherical aberrations (r=0.96, p<0.01).
No significant correlation was found between ∆DOF and ∆HOA RMS, ∆Coma
and ∆Trefoil (r=0.79, 0.83 and 0.71, all p>0.05). Significant correlation was also

110
found between ∆DOF and ∆v (0.92, p= 0.03). ∆DOF and ∆CHOA RMS was
moderately correlated (r=0.87, p=0.05). Correlation between ∆DOF and ∆d was
also found to be not significant (r=-0.77, p=0.13).
5.4 Discussion
In this study, the subjective DOF from 10 keratoconic eyes and from the right
eyes of 10 normal subjects were measured with a two-channel Badal optical
system. The subjective DOF measured in the keratoconic eyes were significantly
larger (about 0.17 D) than those found in the normal subjects. Comparison
measurements of DOF of normal subjects were performed under both conditions
with and without cycloplegia. A very small change was found in the subjects‟
HOA RMS after they had full cycloplegia, which was similar to the results
reported by Jankov II et al. (2006). The difference of subjective DOF measured
by the two-Badal-channel setting with and without cycloplegia was also found to
be negligible, which matched well with the finding of Wang and Ciuffreda (2004),
who used a similar system to measure the DOF in two normal subjects with and
without cycloplegia. For this reason, DOF measurements for the keratoconic
subjects were conducted without their eyes being cyclopleged.
Spearman‟s correlation analysis across all studied eyes revealed strong
correlation between DOF and HOA RMS and a weaker correlation between DOF
and SA. Distortions of the cornea are the main reason for significantly increased
levels of HOA in keratoconus compared to the normal subjects (Madea et al.,
2002). Significant correlation was found between the subjective DOF of
keratoconic eyes and higher order aberrations contributed by the cornea. However,
the association was weaker between the DOF and total ocular HOA RMS in
keratoconus. One possible reason for the weak correlation could be due to the
metrics used in this study, which were metrics of wavefront quality (RMS values),
rather than retinal image quality metrics. They are more general indicators of the
eyes optical quality. This could also be partly due to the crystalline lens‟ potential
to compensate the aberrations produced by the cornea and to thereby reduce the
total ocular aberrations (Artal et al., 2001; Kelly, Mihashi & Howland, 2004;

111
Schlegel et al., 2009). Sabesan and Yoon (2010) have also reported some neural
compensation for asymmetric optical blur in keratoconic eyes by comparing the
visual acuity of keratoconic subjects and visual acuity of normal eyes viewing
though the keratoconus wavefront (via adaptive optics). This neural compensation
helped to reduce the impact of irregular astigmatism and improved visual
performance of keratoconic eyes. They found that the magnitude of compensation
increased with the severity of keratoconic aberrations. For this reason, the ocular
wavefront aberration alone may not be a reliable indicator to predict the visual
performance or blur tolerance in keratoconus and hence the DOF. Similar neural
adaption of keratoconic eyes for VA-related visual tasks was also reported by
Rouger et al (2010). The small sample size (5 subjects) may also contribute to the
lack of correlation between the DOF and chosen metrics.
The mean value of total HOA RMS of the keratoconic eyes was approximately
three times larger than the normal eyes. The mean values of spherical aberrations,
coma like aberrations and trefoils in keratoconic eyes were approximately two
times, four times, and three times larger than those in the control group. Spherical
aberration is known to increase the DOF of the eye (Charman & Whitefoot, 1977;
Plakitsi & Charman, 1995; Rocha et al., 2009). However, the dominant HOA
components in keratoconic eyes are asymmetric aberrations including coma and
trefoil and they were not found to significantly influence the DOF in this study.
Rocha et al. (2009) used an adaptive optics system to induce vertical coma and
oblique trefoil in normal eyes and found little effect on the DOF. These results
also matched with the finding of Atchison et al (2009). This could partly explain
why only a modest increase was found in DOF in the studied keratoconic eyes.
Conflicting results were reported by Legras et al (2010), who used contact lenses
that induced different levels of vertical coma and spherical aberration to measure
the through-focus performance of four subjects. They suggested that the effect of
vertical coma had a comparable effect to spherical aberration on the subjective
DOF. However due to the use of contact lens in their experiment, the higher order
aberrations in the subjects eye may change because of lens flexure, tear film
thickness changes or rotation and decentration of the contact lens, which could
induce more uncertainties in the results compared with adaptive optics methods.

112
The shape and physical dimensions of the cone can be used as indicators to
estimate the severity of keratoconus (Flynn et al., 2006). The location of the cone
will also influence the corneal and ocular wavefront terms. A cone located more
towards the periphery of the entrance pupil might be expected to produce high
levels of coma, while a cone located near the pupil center will introduce
predominantly spherical aberration. The cone location and its physical
dimensions did have some mild correlations with the subjective DOF in the
keratoconic eyes, with larger and more central cones being associated with
greater levels of DOF.
Since none of the keratoconic subjects involved in this study had any retinal
abnormalities, the two eyes of the same subject could be assumed to have the
same level of retinal function and importantly, the subjective criteria adopted for
“just noticeable blur” should have been identical between eyes (and presumably
less variable than between subjects). Therefore the comparison between the left
and right eyes of each keratoconic subject provides an opportunity to study the
influence of optical factors on the difference of DOF between the two eyes.
Strong correlation was found between the difference of DOF and difference in
spherical aberration between eyes. This is consistent with a number of other
studies showing the effect of spherical aberration on DOF (Charman & Whitefoot,
1977; Plakitsi & Charman, 1995; Rocha et al., 2009).
In conclusion, by using a dual-channel Badal optical system, one can reliably
measure the subjective DOF without cycloplegia. The DOF measured in
keratoconic eyes was significantly larger than that in normal eyes. However there
was not a strong correlation between the large amount of HOA RMS and DOF in
keratoconic eyes. Among all HOA terms, spherical aberration was found to be the
only HOA that helps to significantly increase the DOF in the studied keratoconic
subjects.

113
Chapter 6. Design and construction of the adaptive optics
system
6.1 Introduction
In the following chapter, an experiment which aims to measure and modify the
DOF of the human eye has been conducted with the aid of an adaptive optics (AO)
system. This chapter describes the design and construction of this AO system.
6.1.1 Origins and basic theory of AO
Adaptive correction of the wavefront aberrations in the human eye has its origin
in astronomy to solve the problem of star imaging through the turbulent
atmosphere (Hardy, Lefebyre & Koliopoulos, 1977). After the development of
the first Shack-Hartman wavefront sensor for the human eye (Liang et al., 1994),
Williams and Liang (1999) applied AO technology to correct the eye‟s higher
order aberrations (HOA) and showed highly improved contrast sensitivity in
monochromatic light (Williams et al., 2000). By correcting the HOA in the
human eye with AO, the resolution of retinal imaging is greatly improved, which
helps researchers and clinicians to obtain extended information from the living
retina (Hofer et al., 2001; Roorda, Romero & Donnelly, 2002). Adaptive optics
now allows in vivo resolution of a single photoreceptor of the retina, providing
the ability of real-time observation of the living retinal tissue at a microscopic
resolution (Roorda, Romero & Donnelly, 2002). With the aid of AO technology,
researchers and clinicians are now able to perform non-invasive monitoring of
normal retinal function and the progression of retinal disease, and the efficiency
of therapies for treating the disease. The use of an AO system to generate
different wavefront patterns is also used in the novel experiments of Artal et al.
(2001; 2004) and Chen et al. (2007) to study the blur adaptation of the human eye.
The optical layout and working theory of a typical AO system for vision
correction is shown in Figure 6.1.

114
Figure 6.1 Schematic concept of a basic AO system for vision science.
An AO system normally consists of three major components: the wavefront
sensor, a computer, and the wavefront corrector. The wavefront sensor measures
the optical aberrations at the eye‟s exit pupil plane. One of the most popular
choices of wavefront sensor available today in vision applications is the
Hartmann-Shack wavefront sensor. The raw wavefront information is then
analysed by the computer to calculate the voltage matrix driving the actuators or
the liquid-crystal light modulator on the wavefront corrector to compensate the
incoming wavefront. The wavefront corrector (a deformable mirror or a liquid
crystal spatial light modulator) alters the phase profile of the incoming wavefront
by changing the physical optical path length that the wave propagates. The AO
system shown in Figure 6.1 runs a closed-loop correction. According to the real-
time feedback from the wavefront sensor, the computer adjusts the output voltage
to the actuators. The closed-loop correction usually stops when the residual
wavefront aberration RMS is lower than a pre-determined value.
6.1.2 Reviewed designs of AO systems
During designing of the AO system for my PhD research study, a range of
designs of different AO systems applied to human vision have been reviewed
(Liang, Williams & Miller, 1997; Vargas-Martin, Prieto & Artal, 1998;
Fernández, Iglesias & Artal, 2001; Hampson et al., 2005; Fernández et al., 2006;
Hampson et al., 2006; Hofer et al., 2006; Lundström et al., 2007). After careful
analysis of the optical layout, operation procedures, and functions of each system,

115
four designs were chosen as the main references. They are the first generation
Rochester AO system (Liang, Williams & Miller, 1997), the second generation
AO ophthalmoscope of the Rochester University (Hofer et al., 2006), the
modified Murcia AO system ( Fernández, Iglesias & Artal, 2001) and the KTH
AO system described in Lundström et al. (2007)‟s study on peripheral vision
performance.
Figure 6.2 The first generation Rochester AO system (Liang, Williams & Miller,
1997).
The first generation Rochester AO system was designed for improving vision and
the resolution of retinal images. The system is shown in Figure 6.2. When the
system is set to measure and correct the ocular aberrations, a collimated laser
beam is used to create a point source on the retina of a living eye. The light
reflected from the retina forms a distorted wavefront at the pupil plane, which is
recreated at the plane of the deformable mirror by a telescope structure consisting
of two focus lenses. The magnifying ratio of the telescope is matched depending
on the ratio of the pupil size and working surface area of the deformable mirror.
The wavefront that propagates through a second telescope is received by a lenslet

116
array and the formed images are captured by CCD1. The raw spots image is then
acquired by a computer (not shown in the figure), which calculates the wavefront
and sends out a control signal to the deformable mirror to compensate the incident
wavefront from the eye. After the RMS of the observed ocular wavefront in
CCD1 is corrected to a certain level, the surface state of the deformable mirror is
frozen. The procedure of acquisition of high resolution retinal images can then be
started. The flash lamp delivers a 4 millisecond flash to illuminate a small area of
the retina. Its image is captured by CCD2. On the same position of CCD2, one can
also place a visual stimulus to perform desired visual tests.
The optical structure of the first generation Rochester AO system is simple and
efficient for its application. The same layout is adopted in the systems of a
number of other groups (Fernández, Iglesias & Artal, 2001). However, the
disadvantages of the system are also obvious. First, to form a point source onto
the retina of the eye, because there is no defocus correcting function built in the
system, the subject‟s eye and the first focal lens from the eye need to move
forward or backward together to find out the proper position, if the subject is not
wearing a corrective lens. It makes a bite bar necessary for stabilization of the
subject. Moreover, it could be difficult to accommodate the two full-length
telescope structures on a small size optical board. Due to the tilted angle of the
deformable mirror (normally 8 to 12 degrees), the non-standard orientations of
the two arms containing the Laser and CCD2 may also cause problems of
mounting the components.
Major changes have been made in the second generation AO ophthalmoscope of
the Rochester University. The different parts to the first generation system are
shown in the dash box in Figure 6.3.

117
Figure 6.3 Changes of optical layout in the second generation Rochester AO
system (Hofer et al., 2006)
The original 37-channel deformable mirror is updated to a 97-channel deformable
mirror (Xinetics, Inc.), which provides more actuators across the pupil to achieve
better correction of HOA. A pair of off-axis parabolic mirrors is used to replace
the two full-length telescopes, which help to simplify the optical path and will not
induce chromatic aberrations. Although the use of off-axis parabolic mirrors
allows the system‟s optical path to be folded, the large diameter of the 97-channel
DM still requires a very long path to magnify the eye‟s pupil to fill the entire
working surface of the mirror. The whole system needs to be assembled on an
oversized optical board approximately 2 meters long. The mechanism of defocus
correction is still not integrated in this system, which means the subject needs to
move with the first lens in front of the eye to compensate the possible defocus
before the experiment begins.

118
Based on the design of the first generation Rochester AO system, Fernández,
Iglesias and Artal (2001) introduced a very useful feature to the Murcia AO
system, which allows correction of defocus without moving the subject‟s eye.
Figure 6.4 Badal stage used in Murcia AO system ( Fernández, Iglesias & Artal,
2001)
As shown in Figure 6.4, four front surface mirrors (M1 to M4) and two focal
lenses (L1 and L2) are used to form a Badal system. M3 and M4 are mounted on
a translation stage. The optical path length between lenses L1 and L2 can then be
changed by moving the translation stage, to alter the defocus presented to the
subject‟s eye.
Another important reference for designing the AO system in this research study is
the KTH AO system described by Lundström et al. (2007). Among all the steps in
the building process of an optical system, alignment is the most time consuming
task. As shown in Figure 6.5, major components of the KTH system except the
deformable mirror are all located on a straight line on the common optical path,
which provides great convenience for alignment of the system. Before insertion
of the two mirrors delivering the wavefront to the deformable mirror, one can
align the other components on the main optical path on a straight line relatively
easily. The deformable mirror is added into the system at the last stage of
alignment.
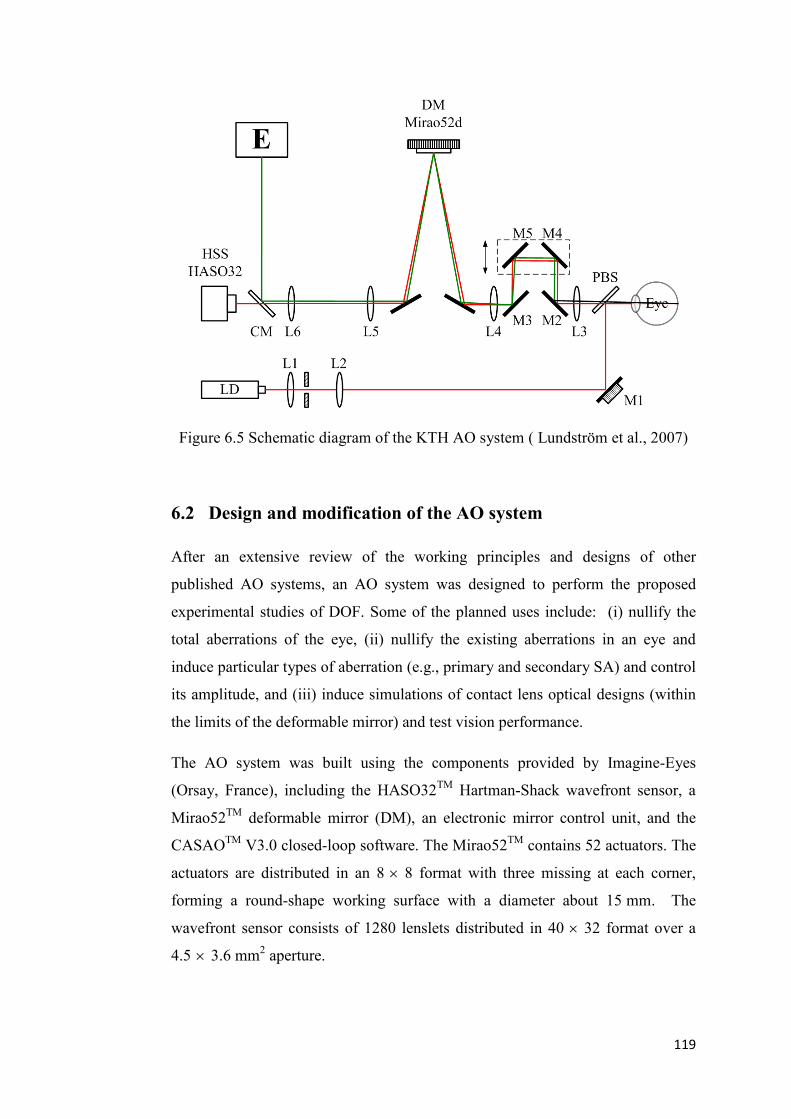
119
Figure 6.5 Schematic diagram of the KTH AO system ( Lundström et al., 2007)
6.2 Design and modification of the AO system
After an extensive review of the working principles and designs of other
published AO systems, an AO system was designed to perform the proposed
experimental studies of DOF. Some of the planned uses include: (i) nullify the
total aberrations of the eye, (ii) nullify the existing aberrations in an eye and
induce particular types of aberration (e.g., primary and secondary SA) and control
its amplitude, and (iii) induce simulations of contact lens optical designs (within
the limits of the deformable mirror) and test vision performance.
The AO system was built using the components provided by Imagine-Eyes
(Orsay, France), including the HASO32TM
Hartman-Shack wavefront sensor, a
Mirao52TM
deformable mirror (DM), an electronic mirror control unit, and the
CASAOTM
V3.0 closed-loop software. The Mirao52TM
contains 52 actuators. The
actuators are distributed in an 8 8 format with three missing at each corner,
forming a round-shape working surface with a diameter about 15 mm. The
wavefront sensor consists of 1280 lenslets distributed in 40 32 format over a
4.5 3.6 mm2 aperture.

120
During the construction of the AO system, different optical layouts were
investigated. Considerations were not only made on how to achieve the designed
functions, but also other important factors. First, the whole system was to be
assembled on a standard optical board with a size of 110 cm in length and 50 cm
in width. The location of each component was to be planned before being
mounted. Second, the optical structure of the system was designed in such a way
that makes future update and maintenance relatively easy, allowing quick
diagnosis of any alignment problems, and providing the possibility of quick
system recovery. Third, the system was designed to be both user friendly and
subject friendly to reduce the operational difficulty for users and discomfort for
subjects.
Figure 6.6 Schematic diagram of the first design of the AO system.
The schematic diagram of an early design for the system is shown in Figure 6.6.
Based on the design of the first generation Rochester AO system, it had the same
disadvantages of the system as described in section 6.1.2. After studying the
modified Murcia AO system and the KTH AO system, a second design similar to

121
the KTH system was trialed on the optical board. However, due to the limit of
physical size of the optical board, and different magnification requirements, the
setup was not successful.
The final system diagram of the AO system is shown in Figure 6.7. The system
consists of four main channels: illumination and reference channel, radiation
channel, wavefront operation channel and visual stimulus channel. A laser diode
(Edmund Optics, 785 nm) is used in the radiation channel to create a collimated
laser beam with a diameter of 1 mm. Part of the laser beam is reflected by a
coated pellicle beam splitter (PBS1: 67% transmission) to go through lens L2, the
Badal subsystem, lens L1 and to form a point source on the eye‟s retina. The
transit beam through PBS1 is blocked by a light trap (LT1). The energy level that
reaches the eye is controlled by the density filter in the radiation channel. A
measured radiant value of 25 µW was obtained at the cornea, which is 30 times
lower than the Australia/New Zealand laser safety standard for continuous
viewing (AS/NZS 2211.1:2004).
Reflected light from the retina forms a distorted wavefront at the pupil plane,
which is measured and corrected by the wavefront channel. The wavefront at the
pupil plane is reproduced by a pair of relay lenses (L1 and L2) at the surface of
Mirao52 deformable mirror. A second relay lens pair (L3 and L4) images the
wavefront to the lenslet array of HASO32 Hartmann-Shack wavefront sensor.
The Badal subsystem between L1 and L2 is used to alter the optical path length
for defocus correction and focus the collimated laser beam into a fine spot on the
retina.
The visual stimulus channel is split from the wavefront channel by a cold mirror
(CM2). Two customized targets described in Chapter 4 and Chapter 5 have been
used in the system for specific experiments. The visual stimuli is also provided by
an eMagin OLED microdisplay (eMagin, Inc., WA), which displays the visual
test from a laptop computer at an 800 600 pixel resolution. A fixed target align
with the system‟s optical axis is used for quick alignment of the subject eye.

122
Figure 6.7 Optical layout of the developed AO system.
123
6.3 Calibration and evaluation of the system performance
Before performing experiments with the AO system, it was important to calibrate
and evaluate the performance of the system. In this section, the calibration and
evaluation of performance of the HASO32TM
wavefront sensor, Mirao52TM
deformable mirror and examples of closed loop correction with the AO system
will be discussed.
6.3.1 Elimination of the effect of laser speckle and corneal reflection
Since a 785 nm laser diode (a coherent light source) is used in the radiation
channel to illuminate the eye, the laser speckle (Dainty, 1984) becomes a problem
when the collimated laser beam is illuminating the static retinal surface of a
model eye, which is used to align and calibrate the system. A Hartmann-Shack
grid pattern affected by speckle showing uneven illumination intensity is shown
in Figure 6.8a. When the unevenly illuminated spot pattern is used to calculate
the wavefront, it may produce error from the actual wavefront of the eye. To
solve this problem, a vibrating mirror was placed in the optical path, shown in
Figure 6.7 as VM, to produce random-directional high frequency vibrations
before the laser beam is delivered to the eye. The dynamic vibrations
(300 Hz~700 Hz) alter the illumination spot location on the artificial retina and
help to effectively reduce the phenomena of laser speckle (as shown in Figure
6.8b). To avoid unnecessary corneal reflections in Hartmann-Shack spot images,
an off-axis entry beam was also used when delivering the laser beam into the eye
(Williams & Yoon, 2001).
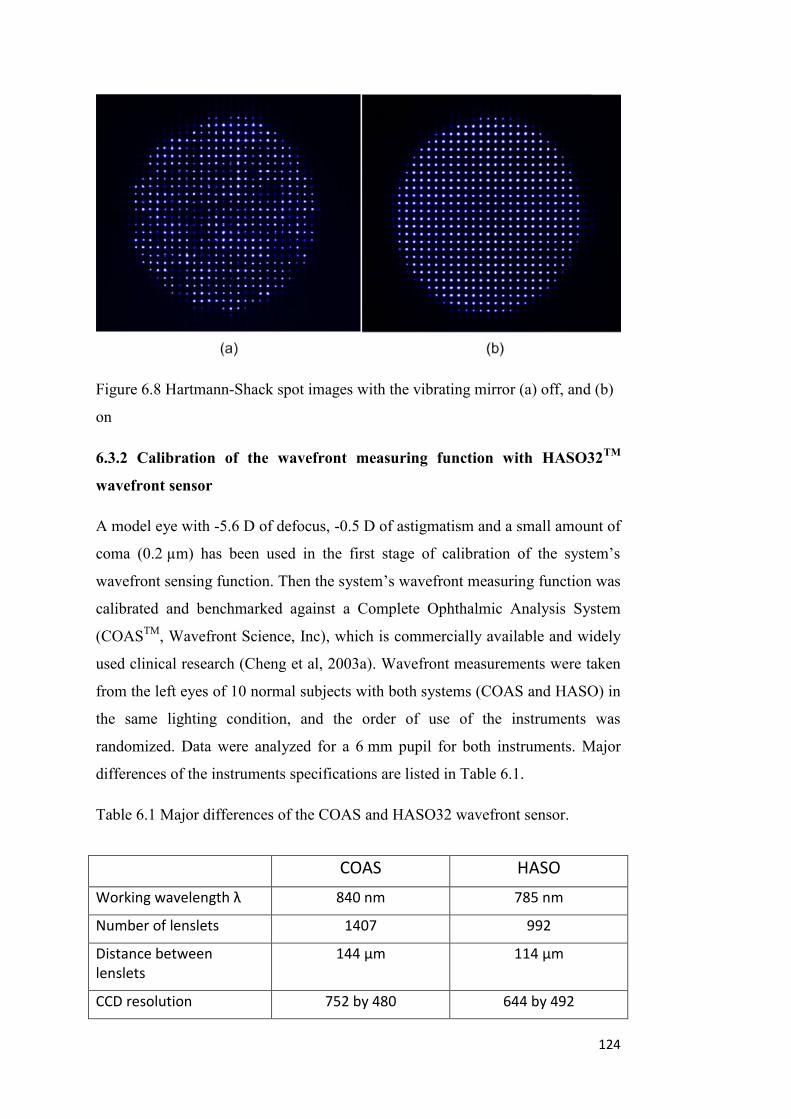
124
Figure 6.8 Hartmann-Shack spot images with the vibrating mirror (a) off, and (b)
on
6.3.2 Calibration of the wavefront measuring function with HASO32TM
wavefront sensor
A model eye with -5.6 D of defocus, -0.5 D of astigmatism and a small amount of
coma (0.2 µm) has been used in the first stage of calibration of the system‟s
wavefront sensing function. Then the system‟s wavefront measuring function was
calibrated and benchmarked against a Complete Ophthalmic Analysis System
(COASTM
, Wavefront Science, Inc), which is commercially available and widely
used clinical research (Cheng et al, 2003a). Wavefront measurements were taken
from the left eyes of 10 normal subjects with both systems (COAS and HASO) in
the same lighting condition, and the order of use of the instruments was
randomized. Data were analyzed for a 6 mm pupil for both instruments. Major
differences of the instruments specifications are listed in Table 6.1.
Table 6.1 Major differences of the COAS and HASO32 wavefront sensor.
COAS HASO
Working wavelength λ 840 nm 785 nm
Number of lenslets 1407 992
Distance between lenslets
144 µm 114 µm
CCD resolution 752 by 480 644 by 492

125
Since the defocus of the subject was nullified by a Badal optical system when
wavefront measurements were performed with the AO system, the defocus
(Zernike term 0
2Z ) was not considered in the comparison. The mean results of
measurement of astigmatism and HOAs obtained by the two instruments are
shown in Figure 6.9.
Figure 6.9 Measurement results of HOAs by COAS and HASO32
for a 6 mm
pupil.
The mean HOA RMS was 0.1372 ±0.0356 µm and 0.1525 ±0.0421 µm for the
COAS
and HASO32, respectively. There were small variations between
wavefront measurements performed by COAS and HASO32 in each individual
eye. In general, HASO32 showed about 10% higher values of HOA RMS as
compared to the COAS. All HOA coefficients showed high correlations, except
the trefoil ( 3
3
Z ) and tetrafoil ( 4
4Z ), as shown in Table 6.2.
Table 6.2 Correlation of Zernike HOA coefficients measured by COAS and
HASO in a 6 mm pupil.
Coeff 2
2
Z 2
2Z 1
3
Z 1
3Z 3
3
Z 3
3Z 2
4
Z 2
4Z 0
4Z 4
4Z 4
4
Z
R^2 0.64 0.92 0.72 0.65 0.02 0.79 0.86 0.62 0.26 0.61 0.04

126
Examples of the wavefront aberration measurements from two representative
subjects are shown in Figure 6.10, in which similar HOA structures can be
observed.
(a)
(b)
Figure 6.10 Comparison of wavefront aberrations measured by COAS and
HASO32 from two subjects in a 6 mm pupil.

127
Wavefront measurement results of all 10 subjects in a 6 mm pupil with the two
instruments have been presented in Appendix A.
6.3.3 Calibration of the wavefront generating function with the
Mirao52TM
deformable mirror
The performance of generating individual Zernike wavefront coefficients with the
Mirao52 deformable mirror (DM) has been investigated by Fernández et al (2006)
and Sabesan, Ahmad and Yoon (2007). The official user‟s manual provided by
ImagineEye claims that the Mirao52 DM is able to reliably generate individual
wavefront coefficients (amplitude limited by the maximum stroke of DM) up to
the 4th
Zernike order. In the work of Fernández et al (2006), wavefront
aberrations up to the 5th
Zernike radial order were generated and evaluated with
the Mirao52 DM. Sabesan, Ahmad and Yoon (2007) further evaluated the
system‟s ability to generate wavefront aberrations up to the 6th
Zernike radial
order (for secondary spherical aberration only). The maximum amount of
secondary spherical aberration that can be stably generated by the DM in a 6 mm
pupil was found to be approximately 0.2 µm.
Using the same procedure suggested by Fernández et al (2006), the DM‟s ability
to generate individual higher order Zernike wavefront coefficients up to the 5th
radial order, and the secondary spherical aberration ( 0
6Z ) was evaluated. An
increment of 0.1 µm was used to measure the maximum possible range before the
voltage limit of ±0.5 V was reached. This voltage limit setting was based on the
manufacturer‟s suggestion to prevent the device being exposed to a large absolute
voltage, which may damage the DM permanently. The calibration results for
generating selected HOA terms from the 3rd
to 5th
Zernike radial order and 0
6Z are
shown in Figure 6.11. R denotes the amplitude of the specific wavefront
coefficient, which can be reliably generated by the Mirao52 DM without causing
significant increase (≤ 0.05 µm) of residual aberrations. E represents the error
between the expected coefficient, which is set to be generated in the control
software and the actually measured HOA RMS. For HOAs from the 3rd
to 4th
Zernike order, E values were obtained when 1.0 µm of the specific term was
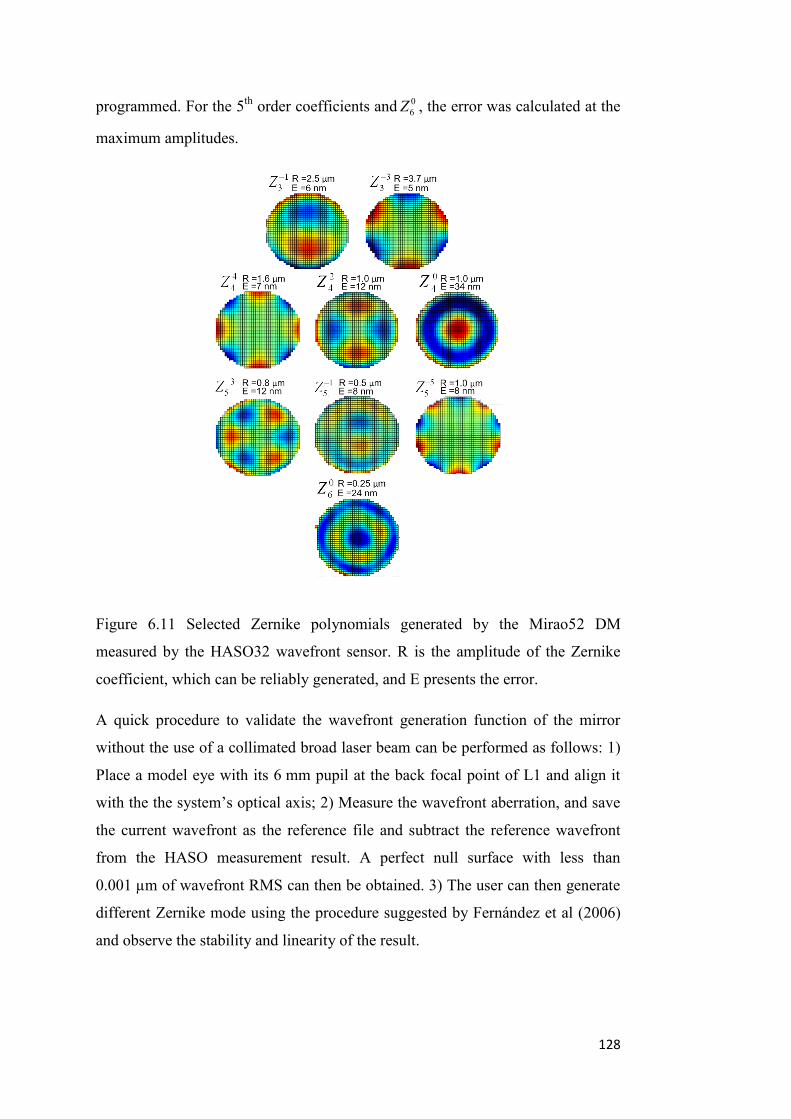
128
programmed. For the 5th
order coefficients and 0
6Z , the error was calculated at the
maximum amplitudes.
Figure 6.11 Selected Zernike polynomials generated by the Mirao52 DM
measured by the HASO32 wavefront sensor. R is the amplitude of the Zernike
coefficient, which can be reliably generated, and E presents the error.
A quick procedure to validate the wavefront generation function of the mirror
without the use of a collimated broad laser beam can be performed as follows: 1)
Place a model eye with its 6 mm pupil at the back focal point of L1 and align it
with the the system‟s optical axis; 2) Measure the wavefront aberration, and save
the current wavefront as the reference file and subtract the reference wavefront
from the HASO measurement result. A perfect null surface with less than
0.001 µm of wavefront RMS can then be obtained. 3) The user can then generate
different Zernike mode using the procedure suggested by Fernández et al (2006)
and observe the stability and linearity of the result.
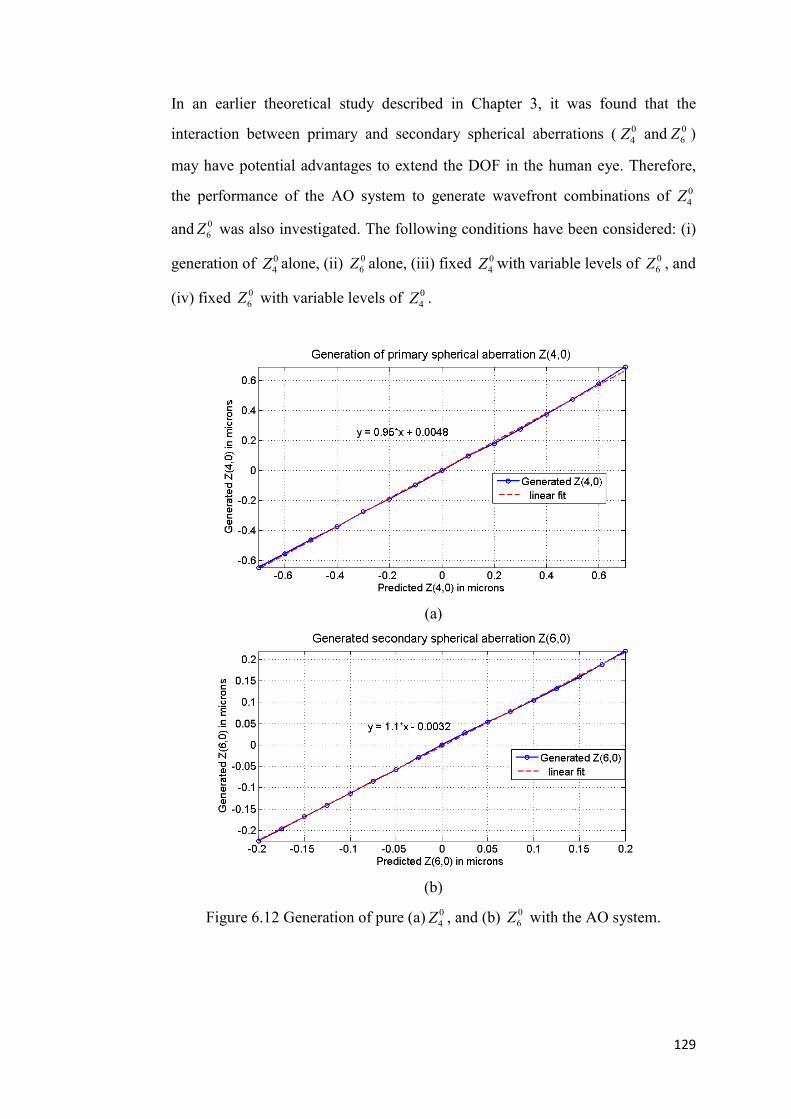
129
In an earlier theoretical study described in Chapter 3, it was found that the
interaction between primary and secondary spherical aberrations ( 0
4Z and 0
6Z )
may have potential advantages to extend the DOF in the human eye. Therefore,
the performance of the AO system to generate wavefront combinations of 0
4Z
and 0
6Z was also investigated. The following conditions have been considered: (i)
generation of 0
4Z alone, (ii) 0
6Z alone, (iii) fixed 0
4Z with variable levels of 0
6Z , and
(iv) fixed 0
6Z with variable levels of 0
4Z .
(a)
(b)
Figure 6.12 Generation of pure (a) 0
4Z , and (b) 0
6Z with the AO system.

130
(a)
(b)
Figure 6.13 Generation of combinations of 0
4Z and 0
6Z with the AO system.
Great linearity was observed when the system was used to generate 0
4Z and 0
6Z
alone, as shown in Figure 6.12. Different combinations of 0
4Z and 0
6Z can also be
generated using the AO system. Some examples are shown in Figure 6.13.
Although the generations of 0
4Z and 0
6Z are relatively independent, limited by the
actuator stroke, more combinations can be generated for 0
4Z and 0
6Z with the
opposite signs. The combinations which can be reliably (the conditions that no

131
actuator showed a voltage higher than 0.5 V and a level of residual HOAs of less
than 0.05 µm was induced) generated by the AO system are listed in Table 6.3.
Table 6.3 Combinations of 0
4Z and 0
6Z can be generated using the AO system.
“Y” indicates that the combination can be reliably generated.
6.3.4 Closed-loop correction with the AO system
After calibrating and evaluating the performance of HASO32 and Mirao52
separately, the system‟s performance of closed-loop wavefront correction
utilizing the two major components was investigated.
Experiments were performed with a myopic model eye with a 6 mm pupil size.
An example of closed-loop correction on the model eye is shown in Figure 6.14.
The model eye was mounted in front of the AO system with its exit pupil located
on the back focal point of L1, as shown in Figure 6.6. A random misalignment
was induced between the optical axis of the model eye and the AO system to
create certain amount of residual aberrations including mainly astigmatism and
coma, as seen in Figure 6.14a. After the closed-loop correction, a much lower
amount of residual aberrations were observed (as shown in Figure 6.14b). The
RMS of all residual HOA terms were controlled to be under 0.02 µm or lower,
except the trefoil term, which showed an RMS value of 0.03 µm.
The system‟s performance to correct aberrations in real eyes was also tested. An
example of the closed-loop correction of a real eye is shown in Figure 6.15. The
subject‟s pupil was dilated with 2 drops of phenylephrine 1%, while the

132
accommodation of the eye remained active. The correction was also performed in
a 6 mm pupil. The residual wavefront RMS after correction was under 0.05 µm.
Multiple corrections on the model eye were achieved by altering the state of
misalignment to generate different amounts and orientations of astigmatism and
HOAs. Experiments were also repeated in real eyes of different subjects. Under
good alignment condition, closed-loop corrections on a model eye could always
reduce the wavefront RMS of residual HOAs to the level of 0.02~0.03 µm. A
higher level of residual HOA RMS is expected in real eyes due to the movement
of the human eye and microfluctuations of the wavefront aberrations. The AO
system was able to reduce the wavefront RMS of real eyes to approximately
0.05~0.07 µm, which represents 10%~20% of the RMS of total HOAs in normal
human eyes (Wang & Koch, 2003; Salmon & van de Pol, 2006). Using the
developed AO system, an experiment for extending DOF in human eyes with
optimized wavefront aberrations was performed and is described in Chapter 7.

133
Figure 6.14 Wavefront aberrations measured from a misaligned myopic model eye (a) with the AO off, and (b) with the AO on.

134
Figure 6.15 Wavefront aberrations measured from a real eye (a) with the AO off, and (b) with the AO on.

135
Chapter 7. Expanding depth of focus in the human eye
through optimal combinations of primary and secondary
spherical aberration
7.1 Introduction
It is known that the DOF in human eye can be affected by the HOAs. The
structure of HOA in the human eye is not static. Studies of wavefront aberrations
during accommodation have revealed significant changes in HOA of young eyes
under different accommodation levels (Atchison et al., 1995; He, Burns &
Marcos, 2000; Ninimiya et al., 2002; Cheng at al., 2004). These changes
dynamically alter the structure of HOA of the eye and affect most noticeably the
Zernike coefficient terms of primary, 0
4Z , spherical aberration (Ninomiya et al.,
2002; Cheng et al., 2004; Roorda & Glasser, 2004). Ninomiya et al. (2002)
compared the monochromatic wavefront aberrations of young adults measured
with far viewing (0 D) and at a 3.0 D accommodative level. They found
significant changes of both 0
4Z and 0
6Z (in a 6 mm pupil) during accommodation.
In the study of Cheng et al. (2004), the wavefront aberrations in a large young
adult population were studied for accommodative stimuli up to 6.0 D. The authors
reported a significant negative shift of 0
4Z as the accommodative level increased,
while the 0
6Z showed a trend (not significant) towards more positive values.
Roorda and Glasser (2004) studied the wavefront aberrations of an isolated
porcine crystalline lens with a laser ray trace scanning technique. In their
experiment, the most noticeable changes with accommodation were observed for
0
4Z , which became more negative, and 0
6Z , which progressed from negative to
positive with accommodation. Although many studies have investigated the DOF
of the human eye under relaxed or cyclopleged accommodation conditions, to the
best of my knowledge, there has not been a study on the effect of combinations of
HOA such as 0
4Z and 0
6Z , similar to those occurring during accommodation.
136
Some recent studies have investigated the effect of combinations of 0
4Z and 0
6Z on
the eye‟s DOF. Using an adaptive optics system, Benard et al (2010) investigated
the effect of pure 0
4Z , 0
6Z and some combinations of 0
4Z and 0
6Z on the DOF of 5
subjects.
In this study, we aimed to investigate the effect of primary spherical aberration,
secondary spherical aberration and their various combinations on DOF by using
an adaptive optics system. The optimal combinations of these aberrations that
would extend the DOF of the human eye were derived. The chapter is organized
as follows. Firstly, the effects of 0
4Z , 0
6Z and their combinations on the DOF of an
otherwise unaberrated diffraction-limited model eye are investigated using a
through-focus simulation algorithm, and optimal combinations of 0
4Z and 0
6Z are
estimated. To evaluate the effect of those spherical aberrations in the presence of
other naturally occurring higher order aberrations, the through-focus simulation
algorithm was applied to a group of 100 “virtual eyes” generated using the
algorithm from Thibos et al (2002a). Finally, the effect of those combinations of
0
4Z and 0
6Z on the DOF of real eyes is investigated through the use of an AO
system.
7.2 Methods
7.2.1 Extending the DOF in a model eye
To understand the effect of primary and secondary spherical aberration on the
through-focus performance of the eye and to estimate a set of optimal
combinations for extending the DOF in an experiment with the AO system
described later, the DOF was first studied in an unaberrated diffraction-limited
eye model and in 100 virtual eyes generated by the statistical model developed by
Thibos et al. (2002a) based on wavefront aberrations measured from 200 normal
eyes (Thibos et al., 2002b).
A dedicated simulation program was written from first principles in MATLAB
(The MathWorks, Inc., Natick, MA) to theoretically apply a number of possible

137
combinations of 0
4Z and 0
6Z to a model eye and to calculate the DOF based on an
image quality metric (IQM). The algorithm of the through-focus calculation
(Steps 1 to 7) was presented in detail in Chapter 4. Here the algorithm is extended
to include secondary spherical aberration.
The flow chart of the simulation program is shown in Figure 7.1(a) and an
example of the simulation output is shown in Figure 7.1(b). The introduction of
different levels of 0
4Z and 0
6Z may change the characteristics of the subject‟s
though-focus IQM and therefore affect the predicted DOF. It can be seen in
Figure 7.1(b) the predicted DOF of the same subject increased after the induction
of additional primary spherical aberration (marked in red as “Modified DOF”). A
shift of centre of focus (COF) could also occur due to the interaction of defocus
and induced HOA.
Through-focus algorithm to calculate the DOF of a model eye
In the algorithm, DOF is theoretically defined as the range of defocus error which
degrades the retinal image quality to a certain level of the maximum possible
value. The visual Strehl ratio based on the optical transfer function (VSOTF) was
chosen to estimate the retinal image quality, since it is currently considered as one
of the best descriptors of visual performance that can be directly derived from
wavefront aberrations (Marsack, Thibos, & Applegate, 2004). It was also reported
as a retinal image quality metric that correlated well with the through-focus visual
acuity (VA) defined in logMAR in healthy eyes (Cheng, Bradley & Thibos, 2004).
Here the augmented version of VSOTF (Iskander, 2006) was used, which is
defined as
yxyxDLyxN
yxyxyxN
dfdfffOTFffCSF
dfdfffOTFffCSFVSOTF
,,(
,Re, (7-1)
where yxDL ffOTF , denotes the diffraction limited optical transfer function,
yxN ffCSF , is the neural contrast sensitivity function, and yx ff , are the
spatial frequency coordinates. Here the VSOTF was based on calculated optical

138
transfer function across all spatial frequencies up to 60 cycles per degree
(Iskander, 2006).
Figure 7.1 (a) A flow chart of the through-focus simulation algorithm to
theoretically estimate the DOF with different combinations of 0
4Z and 0
6Z
Zernike polynomials terms. (b) An example of the output of the through-focus
simulation.
Image quality threshold
It is important for the human eye to maintain an acceptable level of retinal image
quality after any potential extension of DOF. However, in a linear optical system,
the extension of DOF always comes at the price of lower image quality setting up
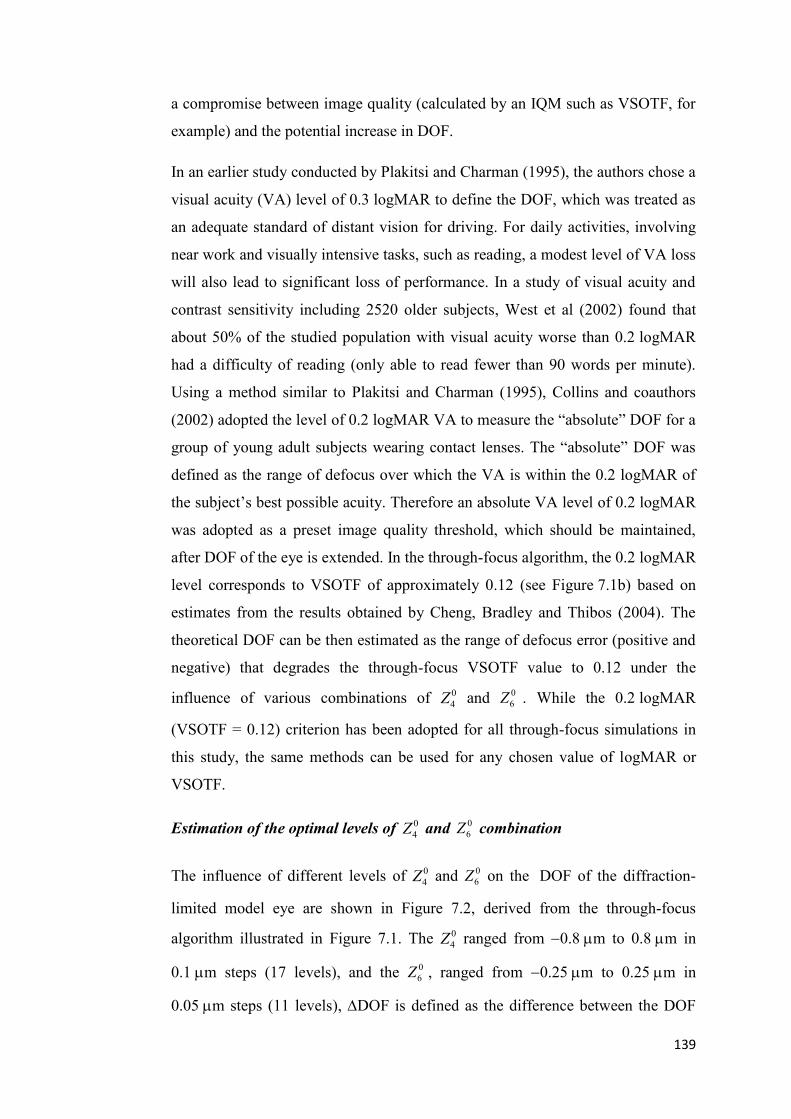
139
a compromise between image quality (calculated by an IQM such as VSOTF, for
example) and the potential increase in DOF.
In an earlier study conducted by Plakitsi and Charman (1995), the authors chose a
visual acuity (VA) level of 0.3 logMAR to define the DOF, which was treated as
an adequate standard of distant vision for driving. For daily activities, involving
near work and visually intensive tasks, such as reading, a modest level of VA loss
will also lead to significant loss of performance. In a study of visual acuity and
contrast sensitivity including 2520 older subjects, West et al (2002) found that
about 50% of the studied population with visual acuity worse than 0.2 logMAR
had a difficulty of reading (only able to read fewer than 90 words per minute).
Using a method similar to Plakitsi and Charman (1995), Collins and coauthors
(2002) adopted the level of 0.2 logMAR VA to measure the “absolute” DOF for a
group of young adult subjects wearing contact lenses. The “absolute” DOF was
defined as the range of defocus over which the VA is within the 0.2 logMAR of
the subject‟s best possible acuity. Therefore an absolute VA level of 0.2 logMAR
was adopted as a preset image quality threshold, which should be maintained,
after DOF of the eye is extended. In the through-focus algorithm, the 0.2 logMAR
level corresponds to VSOTF of approximately 0.12 (see Figure 7.1b) based on
estimates from the results obtained by Cheng, Bradley and Thibos (2004). The
theoretical DOF can be then estimated as the range of defocus error (positive and
negative) that degrades the through-focus VSOTF value to 0.12 under the
influence of various combinations of 0
4Z and 0
6Z . While the 0.2 logMAR
(VSOTF = 0.12) criterion has been adopted for all through-focus simulations in
this study, the same methods can be used for any chosen value of logMAR or
VSOTF.
Estimation of the optimal levels of 0
4Z and 0
6Z combination
The influence of different levels of 0
4Z and 0
6Z on the DOF of the diffraction-
limited model eye are shown in Figure 7.2, derived from the through-focus
algorithm illustrated in Figure 7.1. The 0
4Z ranged from 0.8 m to 0.8 m in
0.1 m steps (17 levels), and the 0
6Z , ranged from 0.25 m to 0.25 m in
0.05 m steps (11 levels), DOF is defined as the difference between the DOF

140
achieved for a particular non-zero combination of 0
4Z and 0
6Z and the DOF for
0
4Z = 0 and 0
6Z = 0. Higher levels of spherical aberration than those shown in
Figure 7.2 were not considered, since they decreased the image quality metric
below the assumed level of 0.2 logMAR (VSOTF < 0.12). Figures 7.2a and 7.2b
show the two dimensional “slices” from Figure 7.2c and represent the DOF at
zero- 0
6Z and zero- 0
4Z levels, respectively. The empty spaces in Figure 7.2(c)
show the conditions (ie. combinations of 0
6Z and 0
4Z ) in which a decrease of the
predicted DOF was calculated.
The maximum VSOTF value only occurs when 0
4Z and 0
6Z are both zero. It is
evident that combinations of 0
4Z and 0
6Z with opposite sign can significantly
extend the DOF of the model eye, within the constraints of not reducing VSOTF
below 0.12 (i.e., equivalent to 0.2 logMAR loss). On the other hand, introducing
0
4Z and 0
6Z of the same sign is not as effective at extending DOF. For example, if
we take 0.2 microns of 0
4Z and 0
6Z with opposite signs, we find a predicted DOF
of 2.2 D (Figure 7.2c). Whereas if we take 0.2 microns of 0
4Z and 0
6Z with the
same sign, we find a predicted DOF of 1.5 D (Figure 7.2c).
To further reduce the number of possible combinations of 0
4Z and 0
6Z , from the
total of 17 × 11 = 187, radial samples of the DOF matrix (Figure 7.2) starting
from the 0
4Z = 0 and 0
6Z = 0 were considered, until DOF showed a decrease.
This procedure reduced the number of candidate combinations to 41.
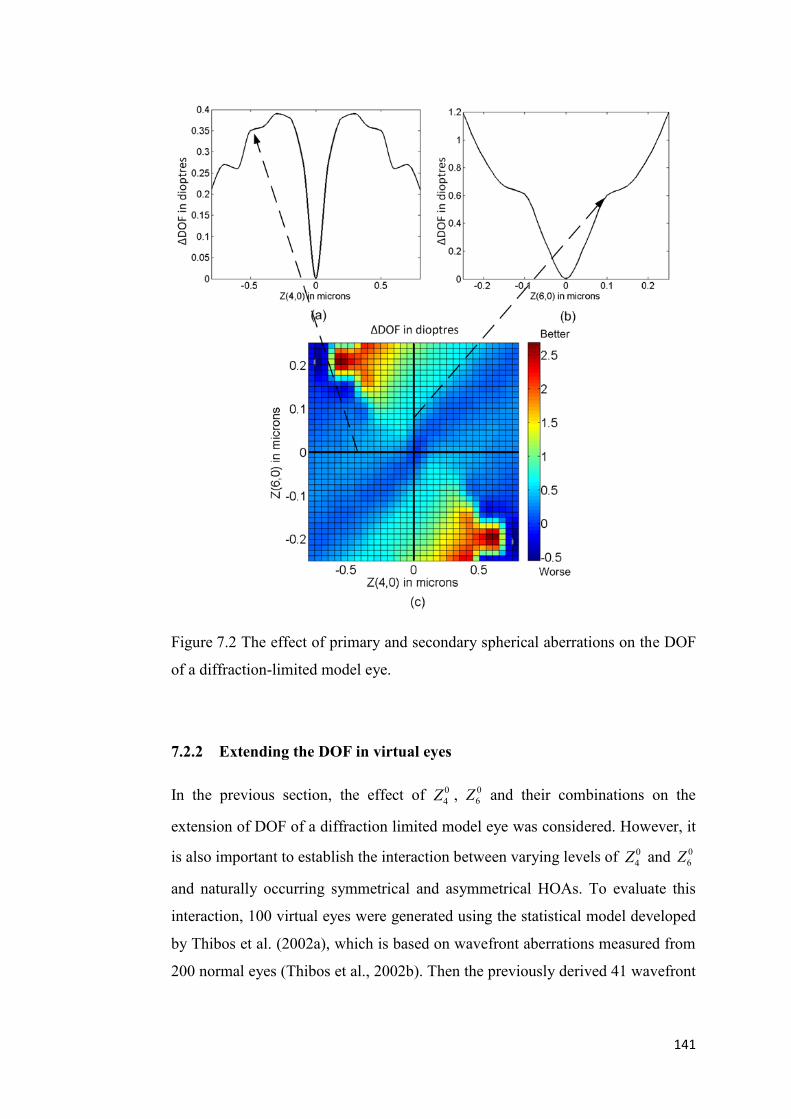
141
Figure 7.2 The effect of primary and secondary spherical aberrations on the DOF
of a diffraction-limited model eye.
7.2.2 Extending the DOF in virtual eyes
In the previous section, the effect of 0
4Z , 0
6Z and their combinations on the
extension of DOF of a diffraction limited model eye was considered. However, it
is also important to establish the interaction between varying levels of 0
4Z and 0
6Z
and naturally occurring symmetrical and asymmetrical HOAs. To evaluate this
interaction, 100 virtual eyes were generated using the statistical model developed
by Thibos et al. (2002a), which is based on wavefront aberrations measured from
200 normal eyes (Thibos et al., 2002b). Then the previously derived 41 wavefront

142
combinations (Section 2.1) were applied to these 100 virtual eyes using the
through-focus algorithm.
The average value of total HOA RMS, primary and secondary spherical
aberration of the virtual eye group of a 6.0 mm pupil size were 0.302 ±0.093 µm,
0.106 ±0.098 µm and 0.003 ±0.019 µm, respectively. The range of HOA RMS
and 0
4Z values in this group of virtual eyes from Thibos et al (2002 a,b) matched
closely to the levels of HOAs from large populations reported by Porter et al.
(2001) and Wang and Koch (2003).
The average predicted increase in DOF in the 100 virtual eyes caused by the
addition of the 41 various combinations of 0
4Z and 0
6Z is shown in Table 7.1.
Note that a positive change indicates an increase in DOF and a negative change
indicates a decrease in DOF, with respect to the original group mean DOF when
the additional 0
4Z and 0
6Z are set to be zero (i.e. the centre value of the table).

143
Table 7.1 Mean predicted change in DOF (D) of up to 100 virtual eyes by the
addition of the 41 various combinations of 0
4Z and 0
6Z .
When primary spherical aberration 0
4Z alone is added to the virtual eyes, the DOF
increases by up to about 1 D for 0.3 µm of positive or negative 0
4Z . For secondary
spherical aberration ( 0
6Z ) alone, the addition of positive or negative 0.1 µm,
extends the DOF by about 0.4 D. Not surprisingly, it was also noticed that
introducing larger amounts of spherical aberration 0
4Z and 0
6Z reduced the number
of virtual eyes in which the 0.2 logMAR (VSOTF > 0.12) image quality threshold
was satisfied.
For low amounts of 0
4Z combined with 0
6Z there was a slight increase in DOF.
For example, an increase in DOF of about 0.4 D was observed with combinations
of 0.1 µm of 0
4Z and 0.05 µm of 0
6Z of opposite coefficient signs. The use of
higher amounts of 0
4Z combined with 0
6Z in the simulation reduced the mean
DOF in the 100 virtual eyes.
7.2.3 Measurement of DOF in real eyes
After investigating the effect of different combinations of 0
4Z and 0
6Z on DOF
with a diffraction limited model eye and 100 generated virtual eyes, these 41 pre-

144
determined wavefront combinations of 0
4Z and 0
6Z were then applied to a group
of human eyes using an adaptive optics system and measured the effect on DOF.
Subjects
Six students (3 males and 3 females) from the School of Optometry, Queensland
University of Technology participated in this study. The mean age of the subjects
was 29, ranging from 26 to 33 years. The group had a mean spherical equivalent
refraction error of –1.0 ±2.0 D, (ranging from 5.0 to 0 D) and a mean cylindrical
refraction of 0.21 ±0.25 D (ranging from 0.5 to 0 D) in the tested eyes. All
subjects had good ocular health with best-corrected Snellen visual acuity of at
least 6/6 in the tested eye. The value of higher order ocular aberrations measured
by a Complete Ophthalmic Analysis System (COAS, Wavefront Science Inc.)
from the left eye of the six subjects in a 6 mm pupil diameter are shown in Table
7.2. For each subject, a series of 4 x 30 dynamic wavefront measurements were
acquired at the sampling rate of about 10 Hz. The average wavefront aberration
was then calculated for each of the subjects. Analysis of the wavefront
aberrations was conducted up to the 6th radial order using two radial orders lower
than the original wavefront fit (Neal, Baer & Topa, 2005). The RMS of total
HOA from the six eyes was 0.37 ±0.10 µm for a 6 mm pupil. The mean value of
0
4Z was 0.13 ±0.09 µm, which was more than 10 times larger than the mean value
of 0
6Z at 0.01 ±0.01 µm.
The study followed the requirements of the Queensland University of Technology
human ethics committee and was conducted in accordance with the Declaration
of Helsinki. Informed consent was obtained from all subjects who participated in
the study (Appendix C).

145
Table 7.2 Higher order ocular aberrations of the six measured eyes for a 6 mm
pupil.
Subjects Total HOA (µm) 0
4Z (µm) 0
6Z (µm)
Subject 1 0.31 0.09 0.01
Subject 2 0.37 0.18 0.00
Subject 3 0.38 0.05 -0.01
Subject 4 0.22 0.04 0.00
Subject 5 0.432 0.11 0.02
Subject 6 0.523 0.28 0.02
Mean±Std 0.37 ±0.10 0.13 ±0.09 0.01 ±0.01
Apparatus
A customized AO system was constructed for the experiment (described in details
in Chapter 6). The AO system was capable of measuring and changing the
wavefront aberration of the eye and of measuring the DOF under the influence of
different combinations of HOA. The system was built based on two major
components: the HASO32TM
Hartmann Shack wavefront sensor and the
Mirao52TM
deformable mirror (both from Imagine Eyes, Orsay, France). In a pilot
study, the HASO32TM
wavefront sensor was calibrated and benchmarked against
a Complete Ophthalmic Analysis System (COASTM
, Wavefront Science, Inc) and
showed high correlation and good repeatability. Performance of the Mirao52TM
deformable mirror to generate single wavefront mode up to the 5th and 6th
Zernike radial order was earlier evaluated by Fernández et al (2006) and Sabesan,
Ahmad and Yoon (2007). In the pilot study (Chapter 6), the mirror‟s capability
of generating combinations of primary and secondary spherical aberration was
investigated. Good correlation was observed between the predicted and generated
wavefront and the generation of 0
4Z and 0
6Z was found to be independent to each
other. However, limited by actuator stroke, more wavefront combinations can be

146
generated when 0
4Z and 0
6Z coefficients have different signs rather than when
they have the same sign.
Figure 7.3 Optical layout of the AO system
The optical layout of the AO system is shown in Figure 7.3. The system optically
conjugates the exit pupil plane of the subject with the surface of deformable
mirror and the Hartmann Shack wavefront sensor. The fixation target consists of
a Bailey-Lovie letter chart printed on a sheet of clear plastic. Two different letter
charts were used to measure the subject‟s visual acuity to reduce learning effects.
A distant white LED light source was used to back illuminate the target through a
diffuser. The target‟s contrast was 80% with an overall luminance of
approximately 120 cd/m2. The letter size on the chart was scaled to provide a
range of visual angles from 20 min of arc (0.6 logMAR detail, the top line of
chart) to 2.5 min of arc (0.3 logMAR detail, the bottom line of chart) when
viewed through the AO system optics.
Protocol
In this study, the criterion of “objectionable blur” (Atchison et al., 2005) was used
for the subjective DOF measurement instead of the “just noticeable blur” used in
study 2. This was done since large amounts of spherical aberration were induced
to the subject‟s eye and the “clearest” image for the subject was already blurred
(compared to the image without additional HOAs). The DOF defined by the

147
“objectionable blur” can also be considered to be closer to the final acceptance of
a multifocal optic (simultaneous vision) by a presbyopic patient. Therefore, the
use of “objectionable blur” for the 0.2 logMAR line was more suitable for this
experiment instead of the “just noticeable blur” criterion used in studies described
in previous Chapters.
All subjects were experienced with visual psychophysics experiments requiring
viewing of targets through a Badal optical system. To allow all subjects to
become familiar with the task of recognizing the “objectionable blur” level, each
of them was given a short training on the AO system with different levels of
induced defocus. Following this, the subject‟s tested eye was cyclopleged and
dilated by 2 drops of Cyclopentolate HCL (1% Minims, 0.5 ml, Bausch & Lomb
Australia). The measurements started about 30 minutes later after the full effect
of cycloplegia was reached (Manny et al., 1993).
Under full cycloplegia and pupillary dilation, the subject was instructed to fixate
on the 0.2 logMAR line on the displayed Bailey-Lovie letter chart through a
6 mm artificial pupil, with the fellow eye fully occluded by a black eye patch.
The subject‟s defocus level was controlled by moving the Badal stage and the
astigmatism derived from the individual subjective refraction was corrected using
a trial lens mounted in front of the artificial pupil. Using a static correction mode
in the AO system, the operator corrected the natural 0
4Z in the subject‟s eye
before any combination of additional wavefront error was input, while the other
HOAs (aside from 0
4Z ) were left uncorrected. The subject was asked to identify
the “clearest” position, which corresponds to the subjective best focus, and
“objectionable blur” in both directions when the Badal stage was moved towards
and away from the eye (representing the positive and negative direction,
respectively). To measure the subjective DOF of the subject, the experiment
operator first adjusted the location of the Badal stage to allow the subject to find
the “clearest” position. The scale reading of Badal stage corresponding to the
“clearest” position and the visual acuity of the subject was recorded. The operator
then slowly moved the Badal stage in one direction (toward or away from the eye)
which was randomly selected, until the subject noticed the appearance of
“objectionable blur”. The scale reading of the Badal stage was recorded by the

148
operator. The same procedure was repeated as the operator moved the Badal stage
in the opposite direction. The two recorded limits of Badal stage reading
corresponding to the two locations where “objectionable blur” was observed
constituted one measurement of DOF. The operator controlled the movement
speed of the Badal stage to be slower than 0.2D/s and the speed was varied during
the movement to avoid the possibility that the subject may remember the time
course when they noticed the two “objectionable blur” positions in previous
measurements. Five sets of such measurements were performed for each set of
0
4Z and 0
6Z combination introduced to the eye. For each subject a total of 41 0
4Z
and 0
6Z combinations were tested.
The whole experiment took approximately two hours to complete, including a 20-
minute break after half of the combinations were tested. The subject‟s
accommodation response was examined one hour after the commencement of
experiment and at the end of experiment to ensure that there was no significant
(i.e., less than 0.1 D) recovery of accommodation. This was achieved by
performing five DOF measurements on the bare eye of the subject every one hour,
and comparing to the bare eye DOF value obtained at the beginning of the
experiment.
During the experiment, the subject‟s head was positioned in a heavy, adjustable,
custom-made head rest without the use of a bite bar to minimize the discomfort in
the 2-hour testing. The operator can adjust the position of subject‟s head with
respect to the system‟s optical axis in three dimensions. Before commencing each
set of measurement, the subject‟s pupil position was monitored by comparing the
pupil position on the sensor CCD with and without the artificial pupil in the
HASO control software (Imagine Eyes, Orsay, France). When a displacement of
pupil of greater than 0.3 mm was observed, the position of the subject‟s head was
immediately corrected by the experiment operator.
Since large amount of 0
4Z and 0
6Z were induced to the eye, it was important to
evaluate the potential effect of pupil offset on the results. During the
measurement, the subject was instructed to keep their jaw tightly closed, and the
most significant eye movements were observed in the horizontal direction. The

149
possible effect of horizontal pupil movement of 0.3 mm to the resulting
wavefront in a 6 mm pupil was simulated, when 0.6 µm of 0
4Z , 0.25 µm of 0
6Z ,
and a combination of the two aberrations was induced by the AO system,
respectively. The simulated results for subject 3 are shown in Figure 7.4 as an
example.
Figure 7.4 Effect of pupil offset on the combination of wavefront aberrations.
Although the total HOA RMS value has only slightly changed after the simulated
pupil offset, different types of HOAs could be induced due to the pupil movement.
The major HOA (with an RMS value greater than 0.1 µm) produced by a
maximum pupil offset of 0.3 mm for the three conditions were: 0.36 µm of
horizontal coma ( 1
3Z ) when 0.6 µm of 0
4Z was induced; 0.22 µm of 1
3Z and 0.23
µm of secondary horizontal coma 1
5Z when 0.25 µm of 0
6Z was induced; 0.16
µm of 1
3Z and 0.23 µm of 1
5Z when the combination of 0.6 µm of 0
4Z and 0.25
µm of 0
6Z were induced. It they occurred, these offsets of the pupil would induce
some variability in the results. Multiple measurements were performed for each
induced type of wavefront aberrations to minimize this effect. It should also be
noted that only the maximum effect (for both pupil offset and amount of induced
HOAs) have been simulated, however the actual pupil offset was typically much
smaller during the experiment.
7.3 Results

150
7.3.1 Effect of different combinations of 0
4Z and 0
6Z on the DOF of real
eyes
The average changes in DOF of real eyes caused by different combinations of 0
4Z
and 0
6Z are shown in Table 7.3 and Figure 7.5, and the equivalent average
decrease of VA in logMAR is shown in Figure 7.6.
Table 7.3 Mean changes of DOF and standard deviation of real eyes with the
introduction 0
4Z and 0
6Z alone and in combination (with opposite signs).
Increased DOF was obtained through inducing combinations of 0
4Z and 0
6Z to the
eye. An approximately linear increase of DOF was observed with increasing
levels of 0
4Z , for both positive or negative coefficients up to 0.6 µm, as shown in
Figure 7.5a. The increase in DOF was about 0.8 D for a value of 0.6 µm of 0
4Z
coefficient. Adding positive 0
6Z showed slightly better efficiency in extending the
DOF, with an average DOF increase of 0.87 D for +0.25 µm of 0
6Z , whereas the
increase in DOF was 0.70 D when 0.25 µm of 0
6Z was added to the eyes (Figure
7.5b). The combination of 0
4Z and 0
6Z of different coefficient signs to the eye‟s
wavefront produced some significant increases in DOF at relatively low levels of
aberrations (<0.45 µm), compared with the 0
4Z and 0
6Z terms in isolation (Figure
7.5c).

151
Figure 7.5 Effect on DOF by introduction of (a) 0
4Z alone (b) 0
6Z alone, and (c)
combinations of 0
4Z and 0
6Z . All plots (a), (b) and (c) have common x and y scale
to aid comparison between different conditions.

152
Figure 7.6 Decrease in VA [logMAR] of real eyes with the introduction of (a) 0
4Z
alone (b) 0
6Z alone, and (c) combinations of 0
4Z and 0
6Z with opposite signs.
Cases in which one or more subjects did not satisfy the best achievable VA of
0.2 logMAR criterion are indicated in red color. All plots (a), (b) and (c) have
common x and y scale to aid comparison between different conditions.

153
Figure 7.7 ∆DOF versus ∆VA induced by 0
4Z , 0
6Z and combinations of 0
4Z and
0
6Z .

154
In Figure 7.7, the increase of DOF has been plotted against the loss of VA caused
by (a) 0
4Z alone, (b) 0
6Z alone and (c) combinations of the two Zernike
coefficients with opposite signs. In the experiment of this study, using pure 0
4Z
and 0
6Z helped to expand the DOF on average by 0.27 and 0.24 D per 0.1
logMAR loss of VA (Pearson‟s correlation R2=0.21 and 0.18 respectively, and all
p <0.001). The combination of 0
4Z and 0
6Z was found to provide a steeper slope
for DOF extension with 0.40 D increase in DOF for every 0.1 logMAR loss of
VA (Pearson‟s correlation R2=0.23, p <0.001). Comparisons of the regression
coefficients were performed in SPSS 16.0. The regression coefficient of
0
6
0
4 & ZZ data was found to be significantly different to the 0
4Z data and 0
6Z data
(p=0.048 and 0.037, respectively). No significant difference was found between
the 0
4Z and 0
6Z data (p=0.77).
The combinations of 0
4Z and 0
6Z which provide maximum extension of DOF for
each of the six individual subjects are presented in Table 7.4.
Table 7.4 Optimal combination of wavefront to extend DOF for each subject
Subjects 0
4Z 0
6Z Max ∆DOF
Subject 1 -0.4 0.20 1.41
Subject 2 -0.4 0.20 1.02
Subject 3 0.4 -0.25 1.66
Subject 4 -0.4 0.20 1.87
Subject 5 -0.4 0.20 1.44
Subject 6 0.4 -0.15 0.97
7.3.2 Effect of combinations of 0
4Z and 0
6Z on centre of focus (COF)
Introducing combinations of 0
4Z and 0
6Z also caused a shift of the centre of focus
(COF) as determined by the subject using the Badal system adjustment. An
approximately linear shift of COF was observed when 0
4Z , with either positive or
negative values, was induced with an average change of 2.9 D shift of centre of

155
focus per micron of 0
4Z (D/µm) (Figure 7.8a). The introduction of 0
6Z also
shifted the COF by approximately 3.5 D/µm. The relationship between the
change in 0
6Z and COF was again close to linear (Figure 7.8b). The tested
combinations of 0
4Z and 0
6Z of different signs caused larger shifts of COF than
using 0
4Z or 0
6Z alone with 3.9 D/µm of combined wavefront RMS (Figure 7.8c).
Figure 7.8 Shift of centre of focus (COF) caused by introduction of (a) 0
4Z alone;
(b) 0
6Z alone, and (c) combinations of 0
4Z and 0
6Z .
156
7.4 Discussion and conclusion
The introduction of controlled levels of primary spherical aberration ( 0
4Z ) to the
eye, has been utilized clinically as a passive approach to help presbyopic patients
to regain part of their near vision with multifocal contact lenses and intraocular
lenses (Plakitsi & Charman, 1995; Schmidinger et al., 2006). However, the effect
on DOF of secondary spherical aberration ( 0
6Z ) and combinations of 0
4Z and 0
6Z ,
which are naturally present in the human eye, are unknown. In this study, the
ratio of increase of DOF and change of retinal image quality was used to help
determine the optimal wavefront combination of 0
6Z and 0
4Z . The effect of these
wavefront combinations to extend the DOF in real eyes was investigated in
experiments aided by an AO system.
A higher average value of subjective DOF defined by “objectionable blur”
(2.59±0.52 D) was found in this study, compared to the value of Atchison et al
(1.77 D, 2005; 1.62 D, 2009) and Legras et al (1.67D, 2010). Due to the limited
number of subjects (six subjects) used in this study, it was not surprising to
observe the difference of results. In an earlier study of Yi et al (2010), the authors
reported a mean subjective DOF value of 0.79±0.15 D (ranging from 0.55 to
1.05 D) in 17 subjects, defined by the blur criterion of “just noticeable blur”. A
significant between-subject effect was also reported by Atchison et al (2009) on
blur limits. The authors reported the most insensitive subject had a blur limit
(“objectionable blur”) 3.1 times as large as the most sensitive subject in their
study involved seven subjects. The most insensitive subject in our study had a
DOF value 1.8 times as large as the most sensitive subject. The magnitude of
DOF defined by “objectionable blur” was found to be 2.3-2.9 times larger than
the value defined by “just noticeable blur” (Atchison et al, 2005, 2009). Therefore,
the mean value of 2.59±0.52 D found in this study could be regarded as at the
higher end of the range of DOF defined by the “objectionable blur”.
When larger amounts of 0
4Z (up to 0.6µm) or 0
6Z (up to 0.25µm), either positive
or negative, were induced in the subject‟s optics, a larger DOF was generally
observed. Using a similar blur criterion of “acceptable vision”, Benard, Lopez-Gil
& Legras (2010) reported an increase of DOF of about 1.41 dioptres per micron

157
(D/ µm) when 0.3 and 0.6 µm of 0
4Z were induced to the eye.In our experiment,
inducing 0
4Z or 0
6Z alone increased, on average, the DOF by approximately
1.36 dioptres per micron (D/µm) and 3.14 D/µm, respectively. When the total
wavefront RMS was kept at a level less than 0.45 µm, the combined wavefront of
0
4Z and 0
6Z with opposite signs extended the DOF, on average, by 2.52 D/µm.
The largest DOF before causing a loss of more than 2 lines of VA of four of the
six subjects was measured when the wavefront combination of 0.4 µm of 0
4Z
and 0.2 µm of 0
6Z was induced in the eye. The other two subjects achieved their
maximum DOF when 0.40 µm of 0
4Z combined with 0.25 µm and 0.15 µm of
0
6Z were induced. After the maximum DOF was observed, an increase of HOA
did not help to further extend the. DOF obtained under the influence of different
wavefront combinations would depend on the criteria of blur adopted (Atchison
et al., 2005) and spatial frequency detail of the target used (Tucker & Charman,
1975). In this study, the “objectionable blur” criterion was adopted to define the
DOF. This criterion was reported to produce a DOF approximately 2.1 to 2.5
times larger than the “just noticeable blur” limits (Atchison et al., 2005). The
measured DOF would also be expected to increase when a larger letter size is
used for the test (Tucker & Charman, 1975; Atchison et al., 2005).
The effect of the optimal wavefront combinations on DOF for 100 virtual eyes
has been simulated. However, the predicted response from the virtual eye‟s DOF
differed in some ways from the experimental results obtained in the six real eyes.
Thibos (2009) compared the predicted monochromatic retinal image quality in
1000 virtual eyes using 31 image quality metrics. Lower levels of retinal image
quality were found in virtual eyes than in human eyes (10% difference on
average). One possible reason is that, although the multivariate Gaussian model
wavefronts generated from statistics of a population of healthy eyes represents the
mean and variance of wavefront aberration in human eyes (Thibos, Bradley &
Hong, 2002), the random structure of the wavefront in virtual eyes may lack the
natural interaction among HOAs of real eyes. This could produce an advantage
for image quality in real eyes if the combination of aberration is not random.
McLellan et al (2006) studied the modulation transfer functions (MTF) of the

158
measured wavefront aberrations and of the wavefronts created by randomizing
the sign or orientation of the aberrations, while maintaining the RMS error of
each Zernike order. It was found that the wavefront aberrations of real eyes
generally had better MTF ratios (defined as real MTF/mean simulated MTF)
compared to the randomized wavefronts. The true wavefronts also tended to be
flatter near the center of pupil than the mean simulated wavefronts (McLellan et
al., 2006). The authors therefore suggested there could be a natural interaction in
the aberrations of real eyes to optimize the image quality, which was missing in
the randomly generated wavefront aberrations. Another factor affecting the
predicted results of the virtual eye group may arise from the choice of a fixed
theoretical threshold (VSOTF=0.12, correlating to a visual acuity level of
approximately 0.2 logMAR reported by Cheng, Bradley and Thibos (2004)) to
define the DOF. As shown in the study in Chapter 4, the threshold level for
estimating the DOF from wavefront aberrations can be optimized for different
subjects.
The interaction between defocus 0
2Z and primary spherical aberration 0
4Z was
earlier investigated by Thibos et al (2002b) and Applegate et al (2003). They
found that by adding 0
2Z to 0
4Z in the right proportions, the peak-to-valley of
wavefront error in the centre of the pupil can be markedly reduced, which would
help to improve the retinal image quality. The authors also suggested the similar
balancing between other HOAs could influence visual performance. It was found
in the experiment that combinations of 0
4Z and 0
6Z with different signs can
significantly expand the DOF, while combinations of the same sign do not help to
increase the DOF. This phenomenon can be explained by the interaction between
the two wavefront aberrations. The Zernike polynomials describing the primary
( 0
4Z ) and secondary spherical aberrations ( 0
6Z ) are defined as
1665 240
4 Z
11230207 2460
6 Z
.

159
Figure 7.9 (a) Wavefront combination of 0.4 µm of 0
4Z and 0.2 µm of 0
6Z and
its through-focus point spread function shown in (c); (b) Wavefront combination
of 0.4 µm of 0
4Z and 0.2 µm of 0
6Z and its though-focus point spread function
shown in (d).
In a wavefront combination that consists of 0
4Z and 0
6Z with the same sign, their
common components of 4 and 2 compensate each other and create a flatter
shape in the centre of the combined wavefront, and hence diminish the bifocal
effect of the wavefront (Figure 7.9a). While in a combination of 0
4Z and 0
6Z of
different signs, the multifocal feature is enhanced, as shown in Figure 7.9b (i.e.
the peak to valley is greater). A set of through-focus point spread functions (PSF)
of these two combined wavefronts are shown in Figure 7.9c and 7.9d. One can
160
observe the extended DOF in the PSF created by the wavefront combination of
0
4Z and 0
6Z with the opposite signs. When 0
4Z and 0
6Z have opposite signs, the
through focus PSF shows relatively little change as defocus level changes. On the
other hand, when 0
4Z and 0
6Z have the same sign, the PSF shows a large difference
as a function of defocus
Using HOAs to extend the DOF also causes a trade-off between the increase of
DOF and lowered VA. Introduction of pure 0
4Z and 0
6Z degraded the VA, on
average, at 0.30 logMAR/µm and 0.83 logMAR/µm, respectively. While the
combined wavefront of 0
4Z and 0
6Z reduced the VA at a rate of 0.40 logMAR/µm
(see Figure 7.6). The combinations of 0
4Z and 0
6Z of opposite signs were found
to provide less impact on VA to extend the subject‟s DOF. For the loss of every
0.1 logMAR VA, there was an increase of 0.40 D in DOF, compared to 0.27 and
0.24 D/0.1 logMAR for 0
4Z and 0
6Z alone.
Studies by different groups (Jacobs, Smith & Chan, 1989; Legras et al, 2004;
Cheng et al, 2010; Legras & Benard, 2010) have reported that there was no
significant difference between subjective DOF measured through-focus in a
Badal optical setting (the observer method) and the DOF value predicted when
the subject viewed defocused stimuli presented on a projection screen (the source
method). Therefore, it was proposed that a series of computer generated
defocused target images can be used instead of introducing different levels of
defocus blur to the target to determine the subjective DOF. This method has been
used in various studies (Schmid et al., 2002; Legras, Chateau & Charman, 2004;
Cheng et al, 2010).
During our experiment, the level of defocus induced to the eye was controlled by
moving the Badal stage. This gave the subjects realistic, continuous through-
focus vision when locating the “objectionable blur” limits, and the centre of
focus.The “observer method” also provides the experimenters with information
related to shifting of the centre of focus (COF) under the influence of HOA,
which is important for the design of presbyopic optical corrections for near and
intermediate vision. A linear shifting of COF averaging 2.9 dioptres per micron

161
(D/µm) was observed when up to 0.6 µm of 0
4Z (either positive or negative) was
induced. This result was similar to that reported by Rocha et al (2009), who found
an average shift of COF of 2.6 D/µm for 0
4Z . The use of 0
6Z shifted the COF by
approximately 3.64 D/µm. The combination of 0
4Z and 0
6Z of different signs
produced larger shifting of COF than when either individual wavefront aberration
was induced. It was also noticed that when a higher amount of HOA was used to
expand the DOF, the subject found it more difficult to identify the optimal focus,
with a less sharp image throughout the range. This resulted in a larger standard
deviation when measuring the shifting of COF under conditions with higher
levels of HOAs.
In conclusion, the results in this study show that systematic introduction of a
targeted amount of both 0
4Z and 0
6Z can significantly improve the DOF of
healthy subjects. The use of wavefront combinations of 0
4Z and 0
6Z with opposite
signs can further expand the DOF, than using 0
4Z or 0
6Z alone. It is important to
determine the balance between the loss of visual quality and expanded DOF
under different clinical and daily life conditions. The optimal wavefront
combinations to expand the DOF were estimated using the ratio of increase in
DOF and loss of retinal image quality defined by VSOTF. In the experiment, the
optimal combinations of 0
4Z and 0
6Z provided a better balance of DOF expansion
and relatively smaller decreases in VA, which could be useful in the design of
presbyopic optical corrections such as multifocal contact lenses and intraocular
lenses.

162
Chapter 8. Conclusion and Summary of the thesis
The aim of this research study was to investigate the interaction between the DOF
and the wavefront aberrations of the eye, with a view to using higher-order
wavefront aberrations to expand the DOF. The following section summarizes the
findings from studies in this research program and provides an overview of the
relationship between HOAs and DOF, and how HOAs can be used to optimize
the DOF (Figure 8.1).
8.1 Influence of HOAs on the depth of focus
To expand the DOF through wavefront aberrations requires a comprehensive
understanding of the relationship between the natural HOAs and DOF. Through
the first three studies in this research program, knowledge of the influence of
wavefront aberrations on the DOF has been obtained.
8.1.1 Modelling the DOF in different clinical groups
In Study 1, the influence of different levels of total HOAs on DOF was
theoretically evaluated by modelling the DOF of a large number of subjects from
four clinical groups, including young emmetropes, myopes, presbyopes and
keratoconics. A through-focus simulation program based on image quality
metrics (IQM) was designed to theoretically estimate the DOF of subjects from
their wavefront measurements.
As a result of higher levels of HOAs, the keratoconic group showed the largest
predicted DOF, but at the expense of much poorer retinal image quality. The
group means of predicted DOF of the myopic and presbyopic groups were also
significantly larger than that of the emmetropes. This association showed that
there was a positive correlation between the amount of total HOAs and DOF.

163
Figure 8.1 Flowchart of the objectives, designed studies and outcomes of this research.

164
The wavefront data from the myopic and presbyopic groups were also used to
simulate the effect of spherical aberration induced by myopic refractive
correction (e.g. LASIK) and presbyopic correction (e.g. progressive power IOL)
on the subject‟s DOF. The simulation of induced primary spherical aberration
(Zernike term 0
4Z ) in the myopic and presbyopic eyes, with either positive or
negative sign, produced modest increases in DOF at the expense of slight losses
in image quality. It was observed in several presbyopic and keratoconic subjects
with relatively higher amounts of natural secondary spherical aberration (Zernike
term 0
6Z ), that the introduction of the same amount of 0
4Z produced significantly
greater DOF extension than that observed in other subjects with lower amounts of
natural 0
6Z . This suggested that there may be an interaction between the induced
primary spherical aberration and natural secondary spherical aberrations present
in the eyes, which could help to further expand the DOF.
8.1.2 Estimation of DOF from wavefront measurements
In Study 1, the subject‟s DOF was calculated using an IQM based through-focus
algorithm with fixed threshold levels (50% and 80%). Similar methods have been
used by Legge et al (1987), Jansonius and Kooijman (1998), and Marcos et al
(1999). Selection of different retinal image quality metrics and the threshold
levels could significantly affect the calculated DOF.
In Study 2, a method was developed to estimate the threshold level for IQMs,
which would correlate with the subjectively measured DOF and lead to a method
for estimating DOF directly from a single measurement of wavefront aberrations.
A modified through-focus algorithm from Study 1 was used to find out the
matching threshold level for each individual subject. This algorithm was later
applied on the retrospective wavefront data of three different refractive groups:
young myopes, young emmetropes and presbyopes, to estimate their DOF. The
major findings and conclusions of this study include:
1. It is possible to estimate DOF of the eye directly from wavefront
measurements using retinal IQMs. The IQM threshold level used to
estimate the DOF from wavefront aberrations can be adaptively optimized
for each individual subject.

165
2. Using a fixed threshold level (50% or 80%) to estimate the DOF of
different subjects or DOF of the same subject with different pupil sizes
may lead to erroneous results.
Through Study 2, quantification of the effect of total HOAs on DOF in normal
eyes was achieved. However, the effect of higher levels of HOAs, compared to
those in the normal eyes, and how different Zernike coefficients can affect the
DOF, needed further clarification.
8.1.3 Subjective measurement of DOF in keratoconic eyes
In Study 3, subjective DOF of keratoconic eyes was measured and compared with
that of normal subjects. Since keratoconus results in significant increases in the
level of HOAs of the eye, including spherical aberration, coma and trefoil, this
population of subjects provides an opportunity to study the influence of these
HOA on DOF.
A dual-channel Badal optical system, similar to the apparatus used by earlier
experiments of Legge et al (1987) and Wang and Ciuffreda (2004), was used to
measure the DOF in a group of normal subjects and a group of keratoconic
subjects. The measurements on the normal eyes were performed in two conditions
with and without cycloplegia. No significant changes were found between the
DOF, HOA RMS, and spherical aberrations 0
6
0
4 ZZ in the control subjects
measured before and after cycloplegia.
The total HOA RMS in keratoconic eyes was approximately three times larger
than the average value in normal eyes. The DOF measured in keratoconic eyes
were also found to be significantly larger than that in normal eyes. Among all
HOA terms, spherical aberration was found to be the only HOA that was
associated with increased DOF in the keratoconic subjects.
8.2 Design and construction of the AO system for experiments
Adaptive optics (AO) is an important technology for real-time measurement and
modification of the wavefront aberrations in the human eye. An AO system was
designed and constructed (study 4) to allow testing of the interaction between
166
HOA and DOF in future experiments (study 5). The customized AO system was
designed based on the HASO32TM
wavefront sensor and the Mirao52TM
deformable mirror. The AO system was capable of measuring and changing the
wavefront aberration of the eye and measuring the DOF under the influence of
different combinations of HOA. During the design and construction of the AO
system the following experiments were conducted:
1. Calibration and evaluation of the wavefront measuring function of the
HASO32 wavefront sensor with a model eye and with real eyes in
comparison with a commonly used commercial wavefront sensor (COAS
HD, Wavefront Sciences, Inc.)
2. Evaluation of the wavefront generating function of the Mirao52
deformable mirror for the Zernike terms 0
4Z , 0
6Z alone and their
combinations.
3. Evaluation of the closed-loop wavefront correction of the AO system
utilizing the two major components: the HASO32 wavefront sensor and
the Mirao52 deformable mirror.
4. Reconstructing wavefront aberrations from the Zernike coefficients
calculated by the system‟s CASAO V3.0 software and directly from the
original slope files obtained by the HASO32 sensor (shown in Appendix
B).
The completed AO system was then used in an experiment to expand the DOF in
the human eye with optimal wavefront combinations of 0
4Z and 0
6Z .
8.3 Expanding the DOF of the human eye through optimal
combinations of primary and secondary spherical aberrations
The idea of extending the DOF through optimized combinations of 0
4Z and
0
6Z was based on mimicking the natural wavefront structure of the accommodated
young eye.
The changes of 0
4Z and 0
6Z during accommodation have been studied by different
groups (Ninomiya et al., 2002; Cheng et al., 2004; Roorda & Glasser, 2004).
167
Ninomiya et al. (2002) found significant changes of both 0
4Z and 0
6Z (in a 6 mm
pupil) during accommodation (at a 3.0 D accommodation level). In the study of
Cheng et al. (2004), the authors reported a significant negative shift of 0
4Z as the
accommodative level increased, while the 0
6Z showed a trend (not significant)
towards more positive values. Roorda and Glasser (2004) found noticeable
changes with accommodation, in an isolated porcine crystalline lens, for 0
4Z ,
which became more negative, and for 0
6Z , which progressed from negative to
positive with accommodation. It was also found in Study 1, that the interaction
between 0
4Z and 0
6Z may have the potential to further extend the DOF in the
human eye.
In study 5, the effect of 0
4Z and 0
6Z to extend the DOF was investigated with the
aid of the AO system. The optimal combinations of 0
4Z and 0
6Z were modelled
using a though-focus algorithm and then applied to study their influence on the
DOF in real eyes. The effect of the changes of wavefront aberrations on visual
resolution was also studied, since increasing DOF is typically associated with loss
of image quality. We found that introducing 0
4Z and 0
6Z alone, with either positive
or negative sign, can significantly improve the DOF of healthy subjects. Using
0
4Z alone increased, on average, the DOF by approximately 1.36 D/µm,
while 0
6Z alone helped to extend the DOF by 3.14 D/µm. The combinations of 0
4Z
and 0
6Z of opposite signs extended the DOF, on average, by 2.52 D/µm. We also
found that expanding the DOF by inducing HOAs decreases VA at the same time.
The ratio of increase of DOF and loss of VA was use to evaluate the efficiency of
wavefront aberrations to extend the DOF. Combinations of 0
4Z and 0
6Z with
opposite signs were found to expand the DOF more effectively, producing an
average increase of DOF to loss of VA of 0.40 D (DOF)/0.1 logMAR loss,
compared to 0.27 and 0.24 D (DOF)/0.1 logMAR loss for 0
4Z and 0
6Z alone,
respectively.

168
8.4 Future directions
In this thesis, the development of methods to estimate and extend the DOF in the
human eye has been explored. In particular, the use of combinations of Zernike
terms 0
4Z and 0
6Z have been shown to have potential as a method for enhancing
DOF. Recommendations to build upon this work are now discussed.
The development of practical methods for estimating the DOF in subjects with
significantly higher amount of HOAs is an unresolved issue. In Chapter 4, a
method has been proposed for estimation of DOF directly from wavefronts in
normal eyes with an individually calculated IQM threshold level, which closely
correlates to the subjective DOF. However, there was a limitation of the range of
HOA RMS which can be applied in the algorithm. For subjects with significantly
higher amount of HOAs compared to normal subjects, such as patients who have
undergone corneal refractive procedures and keratoconic subjects, their DOF
could not be predicted accurately using the developed method.
Development of methods to accurately estimate the shift of COF caused by
different HOA combinations is also an important clinical issue. Extending DOF
by introducing HOAs may bring changes to the COF, which is important for the
design of presbyopic optical corrections for near and intermediate vision. Cheng,
Bradley, & Thibos applied 31 different objective IQMs to predict the best focus
under the influence of primary spherical aberration ( 0
4Z ) and secondary
astigmatism ( 2
4
Z ). Some IQMs, especially those taking into account neural
contrast sensitivity functions (i.e. VSOTF), were found to be well correlated with
the through-focus or through-astigmatism VA. A better method to investigate the
influence of HOAs on shift of COF is to subjectively measure the shift of COF in
real eyes with natural pupils viewing targets of sinusoidal grating patterns with
different spatial frequencies, orientations and contrasts, affected by HOAs
induced through an AO system. However, such an approach would be complex
and time consuming.
Investigation of the impact of wavefront aberrations on DOF can also be
extended. In this program, the effects of 0
4Z , 0
6Z and their combinations to the
DOF in human eye has been investigated. However, there is still a lack of

169
knowledge of how the HOAs with non-symmetrically rotational characteristics
(Zernike coefficients with an azimuthal frequency m ≠ 0) may affect the eye‟s
DOF. Early clinical results have shown that a small amount of myopic
astigmatism can enhance the DOF in pseudophakic eyes, providing at least 6/9
visual acuity for both near and distant vision in optimal cases (Huber, 1981;
Sawusch & Guyton, 1991). Similar interaction may also exist between HOAs and
defocus to enhance the DOF in specific orientations and is worth investigating.
This can also be investigated with the aid of the AO system.
8.5 Conclusions
The DOF serves an important function of defocus tolerance in the human eye. It
can effectively reduce the required amount of accommodation to focus on targets
moving through a range of distances from near to far or from far to near, without
causing the perception of blur. Young eyes with active accommodation can
benefit from a large DOF. When the accommodative error is smaller than the
DOF, there will be no accommodative response change. Without the tolerance of
defocus, the eye will need to constantly change accommodation to keep a perfect
focus on the target. For presbyopic subjects with partial of complete loss of
accommodation, a large DOF is desirable since it helps to maintain clear vision
through a range of near to intermediate distances without the aid of corrective
lenses.
The DOF of the human eye can be affected by various factors including the
optical properties and retinal and visual processing properties. The optical
properties of the eye can be largely determined by knowing the wavefront
aberrations and pupil size. In this research program, the interaction of the optical
HOAs and DOF was investigated. Methods were developed to estimate the DOF
in human eyes from the wavefront aberrations and to extend the DOF by inducing
optimal combinations of HOAs. In particular, the combination of 0
4Z and 0
6Z with
different signs was used to provide better efficiency at extending the DOF than
using primary spherical aberration 0
4Z alone.

170
The outcomes of this research study help to extend the knowledge of enhancing
DOF by using HOAs. In addition, the findings from this study also provide a
potentially useful approach for designing optical corrections for presbyopia,
through methods such as contact lenses and intraocular lens designs.

171
References
Agarwal, A. (2002). Presbyopia: a surgical text book. Thorofare, NJ:Slack, pp. 3-
88,139-237.
Alió, J. L., & Shabayek, M. H. (2006). Corneal higher order aberrations: a
method to grade keratoconus. Journal of Refractive Surgery, 22, 539-545.
Amano, S., Amano, Y., Yamagami, S., Miyai, T., Miyata, K., Samejima, T., &
Oshika, T. (2004). Age-related changes in corneal and ocular higher-order
wavefront aberrations. American Journal of Ophthalmology, 137, 988-992.
Applegate, R. A. (1991). Monochromatic wavefront aberrations in myopia. In:
Noninvasive assessment of the visual system. Technical Digest Series, Vol 1.
Washington, DC: Optical Society of America, 1991: 234-237.
Applegate, R. A., Donnelly, W. J., Marsack, J. D., Koenig, D. E., & Pesudovs, K.
(2007). Three-dimensional relation between high-order root-mean-square
wavefront error, pupil diameter, and aging. Journal of the Optical Society of
America A, 24, 578-587.
Applegate, R. A., Marsack, J., Ramos, R., & Sarver, E. J. (2003). Interaction
between aberrations to improve or reduce visual performance. Journal of
Cataract and Refractive Surgery, 29, 1487-1495.
Artal, P. (1990). Calculations of two-dimensional foveal retinal images in real
eyes. Journal of the Optical Society of America A, 7, 1374-1381.
Artal, P., Berrio, E., Guirao, A., & Piers, P. (2002). Contribution of the cornea
and internal surfaces to the change of ocular aberrations with age. Journal of the
Optical Society of America A, 19, 137-143.
Artal, P., Chen, L., Fernandez, E. J., Singer, B., Manzanera, S., & Williams, D. R.
(2004). Neural compensation for the eye‟s optical aberrations. Journal of Vision,
4, 281-287.

172
Artal, P., Ferro, M., Miranda, I., & Navarro, R. (1993). Effect of aging in retinal
image quality. Journal of the Optical Society of America A, 10, 1656-1662.
Artal, P., & Guirao, A. (1998). Contribution of the cornea and the lens to the
aberrations of the human eye. Journal of Cataract and Refractive Surgery, 23,
1713-1715.
Artal, P., Guirao, A., Berrio, E., & Williams, D. R. (2001). Compensation of
corneal aberrations by the internal optics in the human eye. Journal of Vision, 1,
1-8.
Artal, P., Marcos, S., Navarro, R., Miranda, I. & Ferro, M. (1995). Through focus
image quality of eyes implanted with monofocal and multifocal intraocular lenses.
Optical Engineering, 34, 772-779.
Artola, A., Patel, S., Schimchak, P., Ayala, M. J., Ruiz-Moreno, J. R. and Alió, J.
(2006) Evidence for delayed presbyopia after photorefractive keratectomy for
myopia. Ophthalmology, 113, 735−741e1.
AS/NZS 2211.1:2004, Safety of laser products- Equipment classification,
requirements and users guide (IEC 60825-1:2001, Ed. 1.2). Standards Australia.
Atchison, D. A. (1987). Optical performance of progressive power lenses.
Clinical and Experimental Optometry, 70, 149-155.
Atchison, D. A. (1992). Spectacle lens design: a review. Applied Optics, 31,
3579-3585.
Atchison, D. A. (1995). Accommodation and presbyopia. Ophthalmic and
Physiological Optics, 15, 255-272.
Atchison, D. A. (2005). Recent advances in measurement of monochromatic
aberrations of human eyes. Clinical and Experimental Optometry, 88, 5-27.
Atchison, D. A. (2006). Optical models for human myopic eyes. Vision Research,
46, 2236-2250.
173
Atchison, D. A., Bradley, A., Thibos, L. N., & Smith, G. (1995). Useful
variations of the Badal optometer. Optometry and Vision Science, 72, 279–284.
Atchison, D. A., & Charman, W. N. (2005). Influence of reference plane and
direction of measurement on eye aberration measurement. Journal of the Optical
Society of America A, 22, 2589-2597.
Atchison, D. A., Charman, W. N., & Woods, R. L. (1997). Subjective depth-of-
focus of the eye. Optometry and Vision Science, 74, 511−520.
Atchison, D. A., Collins, M. J., Wildsoet, C. F., Christensen, J., & Waterworth, M.
D. (1995). Measurement of monochromatic ocular aberrations of human eyes as a
function of accommodation by the Howland aberroscope technique. Vision
Research, 35, 313-323.
Atchison, D. A., Fisher, S. W., Pedersen, C. A., & Ridall, P. G. (2005).
Noticeable, troublesome and objectionable limits of blur. Vision Research, 45,
1967-1974.
Atchison, D. A., Guo, H., Charman, W. N., & Fisher, S. W. (2009). Blur limits
for defocus, astigmatism and trefoil. Vision research, 49, 2393-2403.
Atchison, D. A., Jones, C. E., Schmid, K. L., Prichard, N., Pope, J. M., Strugnell,
W. E., & Riley, R. (2004). Eye shape in emmetropia and myopia. Investigative
Ophthalmology and Visual Science, 45, 3380-3386.
Atchison, D. A., & Markwell, E. L. (2008). Aberrations of emmetropic subjects at
different ages. Vision Research, 48, 2224-2231.
Atchison, D. A., Schmid, K. L., & Pritchard, N. (2006). Neural and optical limits
to visual performance in myopia. Vision Research, 46, 3707-3722.
Atchison, D. A., & Smith, G. (2000). Optics of the human eye. Oxford:
Butterworth Heinemann.

174
Benard, Y., Lopez-Gil, N., & Legras, R. (2010). Subjective depth of field in
presence of 4th-order and 6th-order Zernike spherical aberrationusing adaptive
optics technology. Journal of Cataract and Refractive Surgery, 36, 2129-2138.
Benito, A., Redondo, M., & Artal, P. (2009). Laser in situ keratomileusis disrupts
the aberration compensation mechanism of the human eye. American Journal of
Ophthalmology, 147, 424-431.
Bennett, E. S. (2008). Contact lens correction of presbyopia. Clinical and
Experimental Optometry, 91, 265-278.
Berntsen, D. A., Barr, J. T., & Mitchell, G. L. (2005). The effect of overnight
contact lens corneal reshaping on higher-order aberrations and best-corrected
visual acuity. Optometry and Vision Science, 82, 490-497.
Bradley, A., Rahman, H. A., Soni, P. S., & Zhang, X. (1993). Effect of target
distance and pupil size on letter contrast sensitivity with simultaneous vision
bifocal contact lenses. Optometry and Vision Science, 70, 476-481.
Brown, D., Dougherty, P., Gills, J. P., Hunkeler, J., Sanders, D. R., & Sanders,
M. L. (2009). Functional reading acuity and performance: comparison of 2
accommodating intraocular lenses. Journal of Cataract and Refractive Surgery,
35, 1711-1714.
Brown, N. (1973). The change in shape and internal form of the lens of the eye on
accommodation. Experimental Eye Research, 15, 441-459.
Brown, N. (1974). The change in lens curvature with age. Experimental Eye
Research, 19, 175-183.
Brunette, I., Gresset, J., & Boivin, J. F. (2000). Functional outcome and
satisfaction after photorefractive keratectomy. Part 2: survey of 690 patients – the
Canadian Refractive Surgery Research Group. Ophthalmology, 107, 1790-1796.
Buehren, T., & Collins, M. J. (2006). Accommodation stimulus-response function
and retinal image quality. Vision Research, 46, 1633-1645.

175
Buehren, T., Collins, M. J., & Carney, L. G. (2005). Near work induced
wavefront aberrations in myopia. Vision Research, 45, 1297-1312.
Burns, D. (1995) Blur due to pupil area when using progressive addition
spectacles. Ophthalmic and Physiological Optics, 15, 273-279.
Burns, D. M., Johnston, F. M., Frazer, D. G., Patterson, C., & Jackson, A. J.
(2004). Keratoconus: an analusis of corneal asymmetry. British Journal of
Ophthalmology, 88, 1252-1255.
Campbell, F. W. (1957) The depth of field of the human eye. Journal of Modern
Optics, 4, 157−164.
Campbell, F. W., & Green, D. G. (1965). Optical and retinal factors affecting
visual resolution. Journal of Physiology, 181, 576-593.
Campbell, F. W., & Westheimer, G. (1958). Sensitivity of the eye to differences
in focus. Journal of Physiology, 143, 18.
Castejón-Monchón, J. F., López-Gil, N., Benito, A., & Artal, P. (2002). Ocular
wave-front aberration statistics in a normal young population. Vision Research,
42, 1611-1617.
Cantú, R., Rosales, M. A., Tepichín, E., Curioca, A., Montes, V., & Ramirez-
Zavaleta, J. G. (2005). Objective quality of vision in presbyopic and non-
presbyopic patients after pseudoaccommodative advanced surface ablation.
Journal of Refractive Surgery, 21, S603-S605.
Carkeet, A., Luo, D. H., Tong, L., Saw, S. M., & Tan, D. T. H. (2002). Refractive
error and monochromatic aberrations in Singaporean children. Vision Research,
42, 1809-1824.
Carney, L. G., Mainstone, J. C., & Henderson, B. A. (1997). Corneal topography
and myopia: a cross-sectional study. Investigative Ophthalmology and Visual
Science, 38, 311-320.

176
Charman, W. N., & Whitefoot, H. (1977). Pupil diameter and the depth-of-field
of the human eyes as measured by laser speckle. Journal of Modern Optics, 24,
1211−1216.
Chen, L., Artal, P., Gutierrez, D., & Williams, D. R. (2007). Neural compensation
for the best aberration correction. Journal of Vision, 7, 1-9.
Cheng, H., Barnett, J. K., Vilupuru, A. S., Marsack, J. D., Kasthurirangan, S.,
Applegate, R. A., & Roorda, A. (2004). A population study on changes in wave
aberrations with accommodation. Journal of Vision, 4, 272-280.
Cheng, X., Bradley, A., Hong, X., & Thibos, L. N. (2003b). Relationship between
refractive error and monochromatic aberrations of the eye. Optometry and Vision
Science, 80, 43-49.
Cheng, X., Bradley, A., Ravikumar, S., & Thibos, L. N. (2010). Visual impact of
Zernike and Seidel forms of monochromatic aberrations. Optometry and Vision
Science, 87, 300-312.
Cheng, X., Bradley, A., & Thibos, L. N. (2004). Predicting subjective judgment
of best focus with objective image quality metrics. Journal of Vision, 4, 310−321.
Cheng, X., Himebaugh, N. L., Kollbaum, P. S., Thibos, L. N., & Bradley, A.
(2003a). Validation of a clinical Shack-Hartmann aberrometer. Optometry and
Vision Science, 80, 587-595.
Chu, B. S., Wood, J. M., & Collins, M. J. (2009). Influence of presbyopic
corrections on driving-related eye and head movements. Optometry and Vision
Science, 86, E1267-E1275.
Ciuffreda, K. J. (1991). Accommodation and its anomalies. In J. Cronly-Dillon
(Ed.), Vision and visual dysfunction: Vol. 1, pp 231-272. Boca Raton: CRC Press.
Ciuffreda, K. J. (1998). Accommodation, pupil, and presbyopia. In Borish's
Clinical Refraction: Principles and Practice (Ed, Benjamin, W. J.) Saunders,
Philadelphia, 77−120.
177
Collins, M. J., Brown, B., & Bowman, K. J. (1989). Contrast sensitivity with
contact lens corrections for presbyopia. Ophthalmic and Physiological Optics, 9,
133-138.
Collins, M. J., Buehren, T., & Iskander, D. R. (2006). Retinal image quality,
reading and myopia. Vision Research, 46, 196−215.
Collins, M. J., Franklin, R., & Davis, B. A. (2002). Optical considerations in the
contact lens correction of infant aphakia. Optometry and Vision Science, 79, 234-
240.
Collins, M. J., Goode, A., & Brown, B. (1993). Distance visual acuity and
monovision. Optometry and Vision Science, 70, 723-728.
Collins, M. J., Goode, A., Tait, A., & Shuley, V. (1994). Monovision: the
patient‟s perspective. Clinical and Experimental Optometry, 77, 69-75.
Collins, M. J., Wildsoet, C. F., & Atchison, D. A. (1995). Monochromatic
aberrations and myopia. Vision Research, 35, 1157-1163.
Comander, J., & Pineda, R. (2010). Accommodating intraocular lenses: theory
and practice. International Ophthalmology Clinics, 50, 107-117.
Conforti, G. (1983). Zernike aberration coefficients from Seidel and higher-order
power series coefficients. Optics Letters, 8, 407-408.
Courville, C. B., Smolek, M. K., & Klyce, S. D. (2003). Contribution of the
ocular surface to visual optics. Experimental Eye Research, 78, 417-425.
Crawford, B. H. (1936). The dependence of pupil size upon external light
stimulus under static and variable conditions. Proceedings of the Royal Society B,
121, 376-395.
Cummings, J. S., Colvard, D. M., Dell, S. J., Doane, J., Fine, I. H., Hoffman, R.
S., Parker, M., Slade, S. G. (2006). Clinical evaluation of the Crystalens AT-45
accommodating intraocular lens: results of the U.S. Food and Drug
178
Administration clinical trial. Journal of Cataract and Refractive Surgery, 32,
812-825.
Dainty, J. C. (1984). Laser Speckle and Related Phenomena, 2nd ed. Dainty, J. C.
Ed. Berlin, Germany: Springer-Verlag, 1984.
Davison, J. A., & Simpson, M. J. (2006) History and development of the
apodized diffrective intraocular lens. Journal of Cataract and Refractive Surgery,
32, 849-858.
Descartes, R. (1677). Treatise of Man (translated by Hall, T.S., 1972). Cambridge,
MA: Harvard University Press.
Doane, J. F., & Jackson, R. T. (2007). Accommodative intraocular lenses:
considerations on use, function and design. Current Opinion in Ophthalmology,
18, 318,324.
Dubbelman, M., Sicam, V. A., & Van der Heijde. (2006). The shape of the
anterior and posterior surface of the aging human cornea. Vision Research, 46,
993-1001.
Dubbelman, M., & Van der Heijde, G. L. (2001). The shape of the aging human
lens: curvature, equivalent refractive index and the lens paradox. Vision Research,
41, 1867-1877.
Dubbelman, M., Van der Heijde, G. L., Weeber, H. A., & Vrensen, G. F. J. M.
(2003). Changes in the internal structure of the human crystalline lens with age
and accommodation. Vision Research, 43, 2363-2375.
Evans, B. J. W. (2007). Monovision: a review. Ophthalmic and Physiological
Optics, 27, 417-439.
Fernández, EJ, Iglesias, I and Artal, P (2001) Closed-loop adaptive optics in the
human eye. Optics Letters, 26, 746-748.

179
Fernández, E. J., Vabre, L., Herman, B., Unterhuber, A., Považay, B., & Drexler,
W. (2006). Adaptive optics with a magnetic deformable mirror: application in the
human eye. Optics Express, 14, 8900-8917.
Flynn, L. S., Benjamin, W. J. and Lowther, G. E. (2006) Patients with
keratoconus and irregular astigmatism. In: Benjamin WJ. [editorial]. Borish’s
Clinical Refraction. St. Louis: Elsevier 2006; 1523–1570.
Franchini, A. (2007). Compromise between spherical and chromatic aberrations
and depth of focus in aspheric intraocular lenses. Journal of Cataract and Refract
Surgery, 33, 497−509.
Fujikado, T., Kuroda, T., Ninomiya, S., Maeda, N., Tano, Y., Oshika, T.,
Hirohara, Y., & Mihashi, T. (2004). Age-related changes in ocular and corneal
aberrations. American Journal of Ophthalmology, 138, 143-146.
Garner, L. F., & Smith, G. (1997). Changes in equivalent and gradient refractive
index of the crystalline lens with accommodation. Optometry and Vision Science,
74, 114-119.
Garner, L. F., & Yap, M. K. (1997). Changes in ocular dimensions and refraction
with accommodation. Ophthalmic and Physiological Optics, 17, 12-17.
Glasser, A. (2008). Restoration of accommodation: surgical options for correction
of presbyopia. Clinical and Experimental Optometry, 91, 279-295.
Glasser, A., & Campbell, M. C. W. (1999). Biometric, optical and physical
changes in the isolated human crystalline lens with age in relation to presbyopia.
Vision Research, 39, 1991-2015.
Gobbe, M., & Guillon, M. (2005). Corneal wavefront aberration measurements to
detect keratoconus patients. Contact Lens and Anterior Eye, 28, 57-66.
Goodman, J. W. (1996). Introduction to Fourier Optics. New York: McGraw-Hill.
Goss, D. A., Van Veen, H. G., Rainey, B. B., & Feng, B. (1997). Ocular
components measured by keratometry, phakometry, and ultrasonography in

180
emmetropic and myopic optometry students. Optometry and Vision Science, 74,
489-495.
Green, D. G., Powers, M. K., & Banks, M. S. (1980). Depth of focus, eye size
and visual acuity. Vision Research, 20, 827−835.
Guirao, A., Redondo, M., & Artal, P. (2000). Optical aberration of the human
cornea as a function of age. Journal of the Optical Society of America A, 17,
1697-1702.
Guirao, A., & Williams, D. R. (2003) A method to predict refractive errors from
wave aberration data. Optometry and Vision Science, 80, 36−42.
Gwiazda, J., Thorn, F., Bauer, J., & Held, R. (1993). Myopic children show
insufficient accommodative response to blur. Investigative Ophthalmology and
Vision Science, 34, 690−694.
Hamasaki, D., Ong, J., & Marg, E. (1956). The amplitude of accommodation in
presbyopia. American Journal of Optometry and Archives of American Academy
of Optometry, 33, 3-14.
Hampson, K. M., Paterson, C., Dainty, C., & Mallen, E. A. H. (2006). Adaptive
optics system for investigation of the effect of the aberration dynamics of the
human eye on steady-state accommodation control. Journal of the Optical Society
of America A, 23, 1082-1088.
Han, Y., Ciuffreda, K. J., Selenow, A., Bauer, E., Ali, S. R., & Spencer, W.
(2003). Statistic aspects of eye and head movements during reading in a
simulated computer-based environment with single-vision and progressive lenses.
Investigative Ophthalmology and Vision Science, 44, 145-153.
Hardy, J. W., Lefebvre, J. E., & Koliopoulos, C. L. (1977). Real-time
atmospheric compensation. Journal of the Optical Society of America, 67, 360-
369.
Hayashi, K., Hayashi, H., & Hayashi, F. (1995). Topographic analysis of the
changes in corneal shape due to aging. Cornea, 14, 527-532.
181
He, J. C., Burns, S. A., & Marcos, S. (2000). Monochromatic aberrations in the
accommodated human eye. Vision Research, 40, 41-48.
He, J. C., Sun, P., Held, R., Thorn, F., Sun, X., & Gwiazda, J. E. (2002).
Wavefront aberrations in eyes of emmetropic and moderately myopic school
children and young adults. Vision Research, 42, 1063-1070.
Helmholtz, H. (1969). Treatise on Physiological Optics (translated by Southall, J.
P. C., Optical Society of America). New York: Dover. (Original work published
in 1909).
Hermans, E. A., Dubbelman, M,, Van der Heijde, G. L., & Heethaar, R. M. (2008)
Change in the accommodative force on the lens of the human eyes with age.
Vision Research, 48, 119-126.
Hersh, P. S., Fry, K., & Blaker, J. W. (2003). Spherical aberration after laser in
situ keratomileusis and photorefractive keratectomy: clinical results and
theoretical models of etiology. Journal of Cataract and Refractive Surgery, 29,
2096-2104.
Hersh, P., Steinert, R. F., Brint, S. F., & Summit PRK-LASIK Study Group.
(2000). Photorefractive keratectomy versus laser in situ keratomileusis:
Comparison of optical side effects. Ophthalmology, 107, 925-933.
Hiraoka, T., Matsumoto, Y., Okamoto, F., Yamaguchi, T., Hirohara, Y., Mihashi,
T., & Oshika, T. (2005). Corneal higher-order aberrations induced by overnight
orthokeratology. American Journal of Ophthalmology, 139, 429-436.
Hiraoka, T., Okamoto, C., Ishii, Y., Kakita, T., & Oshika, T. (2007). Contrast
sensitivity function and ocular higher-order aberrations following overnight
orthokeratology. Investigative Ophthalmology and Vision Science, 48, 550-556.
Hofer, H., Cheng, L., Yoon, G. Y., Singer, B., Yamauchi, Y., & Williams, D. R.
(2001). Improvement in retinal image quality with dynamic correction of the
eye‟s aberrations. Optics Express, 8, 631-643.
182
Hofer, H., Porter, J., Yoon, G. Y., Chen, L., Singer, B., & Williams, D. R. (2006).
Rochester Adaptive Optics Ophthalmoscope. In. Adaptive optics for vision
science: principles, practices, design and applications. Eds. Porter, J., Queener,
H., Lin, J., Thorn, K. & Awwal, A. John Wiley & sons, Inc., publication, NJ, pp.
397-416.
Holden, B. A., Fricke, T. R., Ho, M., Wong, R., Schlenther, G., Cronjé, S.,
Burnett, A., Papas, E., Naidoo, K. S., & Frick, K. D. (2008). Global vision
impairment due to uncorrected presbyopia. Archives of Ophthalmology, 126,
1731-1739.
Hong, X., & Thibos, L. N. (1999). Longitudinal evaluation of optical aberrations
following laser in situ keratomileusis surgery. Journal of Refractive Surgery, 16,
S647-S650.
Horner, D. G., Soni, P. S., Vyas, N., & Himebaugh, N. L. (2000). Longitudinal
changes in corneal asphericity in myopia. Optometry and Vision Science, 77, 198-
203.
Hotelling, H. and Pabst, M. R. (1936) Rank correlation and tests of significance
involving no assumption of normality. The Annals of Mathematical Statistics, 7,
29–43.
Howland, H. C., & Buettner, J. (1989). Computing high order wave aberration
coefficients from variations of best focus for small artificial pupils. Vision
Research, 29, 979-983.
Howland, H. C., & Howland, B. (1977). A subjective method for the
measurement of monochromatic aberrations of the eye. Journal of Optical Society
of America, 67, 1508-1518.
Huber, C. (1981). Myopic astigmatism as a substitute for accommodation in
pseudophakia. Developments in Ophthalmology, 5, 17-26.
Huygens, C. (1690).Treatise on light. Chicago: University of Chicago Press, 1955.
[Translated by Thompson, S. P.].

183
Iskander, D. R. (2006) Computational aspects of the visual Strehl ratio.
Optometry and Vision Science, 83, 57−59.
Iskander, D. R., Collins, M. J. and Davis, B. A. (2001) Optimal modeling of
corneal surfaces with Zernike polynomials. Biomedical Engineering, IEEE
Transaction, 48, 87–95
Iskander, D. R., Collins, M. J., Davis, B. and Carney, L. G. (2001)
Monochromatic aberrations and characteristics of retinal image quality. Clinical
and Experimental Optometry, 83, 315−322.
Iskander, D. R., Davis, B. A. and Collins, M. J. (2007). The skew ray ambiguity
in the analysis of videokeratoscopic data. Optometry and Vision Science, 84,
435−442.
Iskander, D. R., Davis, B. A., Collins, M. J. and Franklin, R. (2007). Objective
refraction from monochromatic wavefront aberrations via Zernike power
polynomials. Ophthalmic and Physiological Optics, 27, 245−255.
Ivanoff, A. (1956). About the spherical aberration of the eye. Journal of the
Optical Society of America A, 46, 901-903.
Jacobs, R. J., Smith, G., & Chan, D. C. (1989). Effect of defocus on blur
thresholds and on thresholds of perceived change in blur: comparison of source
and observer methods. Optometry and Vision Science, 66, 545-553.
Jain, S., Arora, I., & Azar, D. T. (1996). Success of monovision in presbyopes:
Review of the literature and potential applications to refractive surgery. Survey of
Ophthalmology, 40, 491-499.
Jankov II, M. R., Iseli, H. P., Bueeler, M., Schor, P., Seiler, T. and Mrochen, M.
(2006) The efftct of Phenylephrine and Cyclopentolate on objective wavefront
measurements. Journal of Refractive Surgery, 22, 472–481.
Jansonius, N. M. and Kooijman, A. C. (1998) The effect of spherical and other
aberrations upon the modulation transfer of the defocused human eye.
Ophthalmic and Physiological Optics, 18, 504-513.

184
Jenkins, T. C. A. (1963). Aberrations of the eye and their effects on vision: Part I.
The British Journal of Physiological Optics, 20, 59-91.
Johnson, L. Elliott, D.B., & Buckley, J. G. (2009). Effects of gaze strategy on
standing postural stability in older multifocal wears. Clinical and Experimental
Optometry, 92, 19-26.
Jones, C. E., Atchison, D. A., & Pope, J. M. (2007). Changes in lens dimensions
and refractive index with age and accommodation. Optometry and Vision Science,
84, 990-995.
Joslin, C. E., Wu, S. M., McMahon, T. T., & Shahidi, M. (2003). Higher-order
wavefront aberrations in corneal refractive therapy. Optometry and Vision
Science, 80, 805-811.
Kasthurirangan, S., Markwell, E. I., Atchison, D. A., & Pope, J. M. (2008). In
vivo study of changes in refractive index distribution in the human crystalline
lens with age and accommodation. Investigative Ophthalmology and Visual
Science, 49, 2531-2540.
Kelly, J. E., Mihashi, T., Howland, H. C. (2004). Compensation of corneal
horizontal/vertical astigmatism, lateral coma, and spherical aberration by internal
optics of the eye. Journal of Vision, 4, 262-271.
Kiely, P. M., Smith, G., & Carney, L. G. (1982). The mean shape of the human
cornea. Journal of Modern Optics, 29, 1027-1040.
Kiely, P. M., Smith, G., & Carney, L. G. (1984). Meridional variations of corneal
shape. American Journal of Optometry and Physiological Optics, 61,619-626.
Kirschen, D. G. Huang, C., & Nakano, T. R. (1999). Comparison of suppression,
stereoacuity, and interocular differences in visual acuity in monovision and
Acuvue bifocal contact lenses. Optometry and Vision Science, 76, 832-837.
Koffler, B. H. (2002). Management of presbyopia with soft contact lenses.
Ophthalmologica, 216, S34-51.

185
Kohnen, T., Mahmoud, K. and Bühren, J. (2005) Comparison of corneal higher-
order aberrations induced by myopic and hyperopic LASIK. Ophthalmology, 112,
1692.
Koomen, M., Tousey, R., & Scolnik, R. (1949). The spherical aberration of the
human eye. Journal of the Americal Optometric Association, 39, 370-376.
Krueger, R., Applegate, R. A., MacRae, S. Eds. (2001). Wavefront Customized
Visual Correction: Quest for Super Vision II. Thorofare, NJ: SLACK INC.
Kuroda, T., Fujikado, T., Ninomiya, A., Maeda, N., Hirohara, Y., & Mihashi, T.
(2002). Effect of aging on ocular light scatter and higher order aberrations.
Journal of Refractive Surgery, 18, S598-602.
Lam, C. S., Edwards, M., Millodot, M., & Goh, W. S. (1999). A 2-year
longitudinal study of myopia progression and optical component changes among
Hong Kong schoolchildren. Optometry and Vision Science, 76, 370-380.
Lawless, M. A., & Hodge, C. (2005). Wavefront's role in corneal refractive
surgery. Clinical and Experiment Ophthalmology, 33, 199-209.
Lee, J. H., Snyder, R. W., Schweigerling, J., Nedrud, C. and Chang, M. (2003)
Longitudinal spherical aberration after LASEK and LASIK. Investigative
Ophthalmology and Visual Science, 44, E-abstract 2644-B483.
Legge, G. E., Mullen, K. T., Woo, G. C. and Campbell, F. W. (1987) Tolerance
to visual defocus. Journal of the Optical Society of America A, 4, 851−863.
Legras, R., Chateau, N., & Charman, W. N. (2004). Assessment of just-noticeable
differences for refractive errors and spherical aberration using visual simulation.
Optometry and Vision Science, 81, 718-728.
Legras, R., & Benard, Y. (2010). Comparison between simulated and measured
subjective depth of focus in presence of various monochromatic aberrations.
Investigative Ophthalmology and Visual Science, E-Abstract 3963, 2010.

186
Legras, R., Benard, Y., & Rouger, H. (2010). Through-focus visual performance
measurements and predictions with multifocal contact lenses. Vision Research, 50,
1185-1193.
Li, Z. J., & Zhu, C. H. (2001). Laser Biomedical Engineering. Wuhan, PRC,
Huazhong University of Science and Technology Press.
Liang, J., Grimm, G., Goelz, S., & Bille, J.F. (1994). Objective measurement of
wave aberrations of the human eye with the use of Hartmann-Shack wave-front
sensor. Journal of the Optical Society of America A, 11, 1949-1957.
Lim, L., Wei, R. H., Chan, W. K., & Tan, D. T. (2007). Evaluation of higher
order ocular aberrations in patients with keratoconus. Journal of Refractive
Surgery, 23, 825-828.
Liu, E., & Slomovic, A. R. (1997). Indications for penetrating keratoplasty in
Canada, 1986-1995. Cornea, 16, 414-419.
Llorente, L., Barbero, S., Cano, D., Dorronsoro, C., & Marcos, S. (2004a).
Myopic versus hyperopic eyes: axial length, corneal shape and optical aberrations.
Journal of Vision, 4, 288-298.
Llorente, L., Babero, S., Merayo, J., & Marcos, S. (2004). Total and corneal
optical aberrations induced by laser in situ keratomileusis for hyperopia. Journal
of Refractive Surgery, 20, 203-216.
Lois, N., Kowal, V. O., Cohen, E. J., Rapuano, C. J., Gault, J. A. Raber, I. M., &
Laibson, P. R. (1997). Indications of penetrating keratoplasty and associated
procedures, 1988-1995. Cornea, 16, 623-629.
Ludlam, W. M., Wittenberg, S., Giglio, E. J., & Rosenberg R. (1968).
Accommodative responses to small changes in dioptric stimulus. American
Journal of Optometry and Archives of American Academy of Optometry, 45, 483-
506.
Lundström, L, Manzanera, S, Prieto, PM, Ayala, DB, Gorceix, N, Gustafsson, J,
Unsbo, P and Artal, P (2007) Effect of optical correction and remaining
aberrations on peripheral resolution acuity in the human eye. Optics Express, 15,
12654-12661.

187
Ma, L., Atchison, D. A., Albietz, J. M., Lenton, L. M., & Mclennan, S. G. (2004).
Wavefront aberrations following laser in situ keratomileusis and refractive lens
exchange for hypermetropia. Journal of Refractive Surgery, 20, 307-316.
Maeda, N., Fujikado, T., Kuroda, T., Mihashi, T., Hirohara, Y., Nishida, K.
Watanabe, H. and Tano, Y. (2002) Wavefront aberrations measured with
Hartman-Shack sensor in patients with keratoconus. Ophthalmology, 109, 1996-
2003.
Mahajan, V. N. (1998). Optical Imaging and Aberrations. SPIE Optical
Engineering Press.
Mainstone, J. C., Carney, L. G., Anderson, C. R., Clem, P. M., Stephensen, A. L.,
& Wilson, M. D. (1998). Corneal shape in hyperopia. Clinical and Experimental
Optometry, 81,131-137.
Maloney, R. K., Bogan, S. J. and Waring, G. O. 3rd (1993) Determination of
corneal image-forming properties from corneal topography. American Journal of
Ophthalmology, 115, 31−41.
Manny, R. E., Fern, K. D., Zervas, H. J., Cline, G. E., Scott, S. K., J. M., White,
A., & Pass, F. (1993). 1% Cyclopentolate Hydrochloride: another look at the time
course of cycloplegia using an objective measure of the accommodative response.
Optometry Vision Science, 70, 651-665.
Marcos, S. (2001). Aberrations and visual performance following standard laser
vision correction. Journal of Refractive Surgery, 17, S596-S601.
Marcos, S., Barbero, S., Jimenez-Alfaro, I. (2005) Optical quality and depth-of-
field of eyes implanted with spherical and aspheric intraocular lenses. Journal of
Refractive Surgery, 21, 223−235.
Marcos, S., Barbero, S., Llorente, L., & Merayo-Lloves, J. (2001). Optical
response to LASIK surgery for myopia from total and corneal aberration
measurements. Investigative Ophthalmology and Visual Science, 42, 3349−3356.
Marcos, S., Moreno, E., & Navarro, R. (1999). The depth-of-field of the human
eye from objective and subjective measurement. Vision Research, 39, 2039−2049.
Marcos, S., Moreno-Barriuso, E., Llorente, L., Navarro, R., & Barbero, S. (2000).
Do myopic eyes suffer from large amounts of aberrations? VIII International
Congress on Myopia, 118-121.

188
Marsack, J. D., Thibos, L. N., & Applegate, R. A. (2004). Metrics of optical
quality derived from wave aberrations predicted visual performance. Journal of
Vision, 4, 322-328.
McBrien, N. A., & Millodot, M. (1986). Amplitude of accmommodation and
refractive error. Investigative Ophthalmology and Visual Science, 27, 1187-1190.
McCormick, G. J., Porter, J., Cox, I. G., & MacRae, S. (2005). Higher-order
aberrations in eyes with irregular corneas after laser refractive surgery.
Ophthalmology, 112, 1699-1709.
McLellan, J. S., Marcos, S., & Burns, S. A. (2001). Age-related changes in
monochromatic wave aberrations of the human eye. Investigative Ophthalmology
and Visual Science, 42, 1390-1395.
McLellan, J. S., Prieto, P. M., Marcos, S., & Burns, S. A. (2006). Effect of
interactions among wave aberrations on optical image quality. Vision Research,
46, 3009-3016.
Meister, D. J., & Fisher, S. W. (2008). Progress in the spectacle correction of
presbyopia. Part 2: Modern progressive lens technologies. Clinical and
Experimental Optometry, 91, 251-264.
Menapace, R., Findl, O., Kreichbaum, K., & Leydolt-Koeppl, C. (2007).
Accommodating intraocular lenses: a critical review of present and future
concepts. Graefes Archives of Clinical and Experimental Ophthalmology, 245,
473-489.
Mierdel, P., Kaemmerer, M., Krinke, H. E., & Seiler, T. (1999). Effects of
photorefractive keratectomy and cataract surgery on ocular optical errors of
higher order. Graefe’s Archives for Clinical and Experimental Ophthalmology,
237, 725−729.
Millodot, M., & Thibault, C. (1985). Variation of astigmatism with
accommodation and its relationship with dark focus. Ophthalmic and
Physiological Optics, 5, 297-301.
Mordi, J. A. and Ciuffreda, K. J. (1998) Static aspects of accommodation: age
and presbyopia. Vision Research, 38, 1643−1653.

189
Moreno-Barriuso, E., Merayo-Lloves, J., Marcos, S., Navarro, R., Llorente, L., &
Barbero, S. (2001). Ocular aberrations before and after myopic corneal refractive
surgery: LASIK-induced changes measured with laser ray tracing. Investigative
Ophthalmology and Visual Science, 42, 1396-1403.
Mountford, J. (1997). An analysis of the changes in corneal shape and refractive
error induced by accelerated Orthokeratology. International Contact Lens Clinics,
24, 128-143.
Mountford, J. (1998). Retention and regression of Orthokeratology with time.
International Contact Lens Clinics, 25, 59-64.
Mouroulis, P. and Zhang, H. (1992), Visual instrument image quality metrics and
the effects of coma and astigmatism. Journal of Optical Society of America, A, 9,
34-42.
Mrochen, M., Kaemmerer, M., Mierdel, P., & Seiler, T. (2001). Increased higher-
order optical aberrations after laser refractive surgery: a problem of subclinical
decentration. Journal of Cataract and Refractive Surgery, 27, 362-369.
Mrochen, M., Kaemmerer, M., & Seiler, T. (2001). Clinical results of wavefront-
guided laser in situ keratomileusis 3 months after surgery. Journal of Cataract
and Refractive Surgery, 27, 201-207.
Mutti, D. O., Enlow, N. L., & Mitchell, G. L. (2001). Accommodation and
induced with-the-rule astigmatism in emmetropes. Optometry and Vision Science,
78, 6-7.
Nam, J., Thibos, L. N., & Iskander, D. R. (2009a). Describing ocular aberrations
with wavefront vergence maps. Clinical and Experimental Optometry, 92, 194-
205.
Nam, J., Thibos, L. N., & Iskander, D. R. (2009b). Zernike radial slope
polynomials for wavefront reconstruction and refraction. Journal of the Optical
Society of America A, 26, 1035-1048.

190
Nanavaty, M. A., Spalton, D. J., Boyce, J., Saha, S., & Marshall, J. (2009).
Wavefront aberrations, depth of focus, and contrast sensitivity with aspheric and
spherical intraocular lenses: Fellow-eye study. Journal of Cataract and Refractive
Surgery, 35, 663-671.
Neal, D. R., Baer, C. D., & Topa, D. M. (2005). Errors in Zernike transformations
and non-modal reconstruction methods. Journal of Refractive Surgery, 21, S558-
S562.
Netto, M. V., Ambrósio, R., Shen, T. T., & Wilson, S. E. (2005). Wavefront
analysis in normal refractive surgery candidates. Journal of Refractive Surgery,
21, 332-338.
Nichols, J. J. (2009). Contact lenses 2008. Contact Lens Spectrum, 24, 24-32.
Nichols, J. J., Marsich, M. M., Nguyen, M., Barr, J. T., & Bullimore, M. A.
(2000). Overnight orthokeratology. Optometry and Vision Science, 77, 252-259.
Ninomiya, S., Fujikado, T., Kuroda, T., Maeda, N., Tano, Y., Oshika, T.,
Hirohara, Y., & Mihashi, T. (2002). Changes of ocular aberration with
accommodation. American Journal of Ophthalmology, 134, 924-926.
Ninomiya, S., Maeda, N., Kuroda, T., Fujikado, T., & Tano, Y. (2003).
Comparison of ocular higher-order aberrations and visual performance between
photorefractive keratectomy and laser in situ keratomileusis for myopia. Seminars
in Ophthalmology, 18, 29-34.
Nio, Y. K., Jansonius, N. N., Fidler, V., Geraghty, E., Norrby, S., & Kooijiman,
A. C. (2000). Age-related changes of defocus-specific contrast sensitivity in
healthy subjects. Ophthalmic and Physiological Optics, 20, 323-334.
Nio, Y. K., Jansonius, N. N., Fidler, V., Geraghty, E., Norrby, S., & Kooijiman,
A. C. (2002). Spherical and irregular aberrations are important for the optimal
performance of the human eye. Ophthalmic and Physiological Optics, 22, 103-
112.
191
Nio, Y. K., Jansonius, N. M., Geraghty, E., Norrby, S., & Kooijman, A. C. (2003).
Effect of intraocular lens implantation on visual acuity, contrast sensitivity, and
depth of focus. Journal of Cataract and Refractive Surgery, 29, 2073−2081.
Nishi, T., Nawa, Y., Ueda, T., Masuda, K., Taketani, F., & Hara, Y. (2006).
Effect of total higher-order aberrations on accommodation in pseudophakic eyes.
Journal of Cataract and Refractive Surgery, 32, 1643-1649.
Ogle, K. N. (1968). Optics: An Introduction for Ophthalmologists. ed. 2,
Springfield, Illinois, Charles C Thomas.
Ogle, K. N., & Schwartz, J. T. (1959). Depth of focus of the human eye. Journal
of the Optical Society of America, 49, 273−280.
Oliver, K. M., Hemenger, R. P., Corbett, M. C., O‟Brart, D. P., Verma, S.,
Marshall, J., & Tomlinson, A. (1997). Corneal optical aberrations induced by
photorefractive keratectomy. Journal of Refractive Surgery, 13, 246-254.
Oshika, T., Klyce, S. D., Applegate, R. A., & Howland, H. C. (1999). Changes in
corneal wavefront aberrations with aging. Investigative Ophthalmology and
Visual Science, 40, 1351-1355.
Oshima, S. (1958). Studies on the depth-of-focus of the eye. Japan Journal of
Ophthalmology, 2, 63-72.
Owens, D. A. (1991). Near work, accommodative tonus, and myopia. In:
Grosvenor, T., Flom, M. C., eds. Refractive Anomalies, Research and Clinical
Applications. Butterworth Heinemann; 318-344.
Owsley, C., & Sloane, M. E. (1987). Contrast sensitivity, acuity, and the
perception of „real-world‟ targets. British Journal of Ophthalmology, 71, 791-796.
Padmanabhan, P., Mrochen, M., Viswanathan, D., & Basuthkar, S. (2009).
Wavefront aberrations in eyes with decentered ablations. Journal of Cataract and
Refractive Surgery, 35, 695-702.

192
Paquin, M. P., Haman, H., & Simonet, P. (2002) Objectve measurement of
optical aberrations in myopic eyes. Optometry and Vision Science, 79, 285-291.
Pesudovs, K. (2005). Wavefront aberration outcomes of LASIK for high myopia
and high hyperopia. Journal of Refractive Surgery, 21, S508-S512.
Pesudovs, K., Garamendi, E., & Elliott, D. B. (2006). A quality of life
comparison of people wearing spectacles or contact lenses or having undergone
refractive surgery. Journal of Refractive Surgery, 22, 19-27.
Plainis, S., & Pallikaris, I. G. (2008). Ocular monochromatic aberration statistics
in a large emmetropic population. Journal of Modern Optics, 55, 759-772.
Plakitsi, A., & Charman, W. N. (1995). Comparison of the depth of focus with
the naked eye and with three types of presbyopic contact lens correction. Journal
of the British Contact Lens Association, 18, 119−125.
Platt, B., & Shack, R. V. (1971). Lenticular Hartman-screen. Opt Sci Center
Newsl, 5, 15-16.
Pop, M., & Payette, Y. (2004). Risk factors for night vision complaints after
LASIK for myopia. Ophthalmology, 111, 3-10.
Porter, J., Guirao, A., Cox, I. G., & Williams, D. R. (2001). Monochromatic
aberrations of the human eye in a large population. Journal of the Optical Society
of America A, 18, 1793-1803.
Rabinowitz, Y. S. (1998). Keratoconus. Survey of Ophthalmology, 42, 297-319.
Radhakrishnan, H., Pardhan, S., Calver, R. I., & O‟Leary, D. J. (2004a). Effect of
positive and negative defocus on contrast sensitivity in myopes and non-myopes.
Vision Research, 44, 1869-1878.
Radhakrishnan, H., Pardhan, S., Calver, R. I., & O‟Leary, D. J. (2004b). Unequal
reduction in visual acuity with positive and negative defocusing lenses in myopes.
Optometry and Vision Science, 81, 14-17.

193
Ramsdale, C. and Charman, W. N. (1989) A longitudinal study of the changes in
the static accommodation response. Ophthalmic and Physiological Optics, 9,
255−263.
Reeves, P. (1920). The response of the average pupil to various intensities of light.
Journal of the Optical Society of America, 4, 35-43.
Reilly, C. D., Lee, W. B., Alvarenga, L., Caspar, J., Carcia-Ferrer, F., & Mannis
M. J. (2006). Surgical monovision and monovision reversal in LASIK. Cornea,
25, 136-138.
Rocha, K. M., Soriano, E. S., Chamon, W., Chalita, M. R., & Nosé, W. (2007).
Spherical aberration and depth of focus in eyes implanted with aspheric and
spherical intraocular lenses. Ophthalmology, 114, 2050-2054.
Rocha, K. M., Vabre, L., Chateau, N., & Krueger, R. R. (2009). Expanding depth
of focus by modifying higher-order aberrations induced by an adaptive optics
visual simulator. Journal of Cataract and Refractive Surgery, 35, 1885–1892.
Roorda, A., & Glasser, A. (2004). Wave aberrations of the isolated crystalline
lens. Journal of Vision, 4, 250-261.
Rooda, A., Romero, B. F., & Donnelly, W. J. (2002). Adaptive optics scanning
laser ophthalmoscopy. Optics Express, 10, 405-412.
Rosenfield, M., & Abraham-Cohen, J. A. (1999). Blur sensitivity in myopes.
Optometry and Vision Science, 76, 303-307.
Rosenfield, M. and Gilmartin, B. (1988) Disparity-induced accommodation in
late-onset myopia. Ophthalmic and Physiological Optics, 8, 353−355.
Rouger, H., Benard, Y., Gatinel, D., & Legras, R. (2010). Visual tasks
dependence of the neural compensation for the keratoconic eye‟s optical
aberrations. Journal of Optometry, 3, 60-65.
Sabesan, R., Ahmad, K., & Yoon, G. (2007). Correcting highly aberrated eyes
using large-stroke adaptive optics. Journal of Refractive Surgery, 23, 947-952.

194
Sabesan, R. and Yoon, G. (2010) Neural compensation for long-term asymmetric
optical blur to improve visual performance in keratoconic eyes. Investigative
Ophthalmology and Vision Science, 51, 3835-3839.
Salmon, T. O., & van de Pol, C. (2006). Normal-eye Zernike coefficients and
root-mean-square wavefront errors. Journal of Cataract and Refractive Surgery,
32, 2064-1074.
Sanders, E., Wagner, H., & Reich, L. N. (2008). Visual acuity and “balanced
progressive” simultaneous vision multifocal contact lenses. Eye and Contact Lens,
34, 293-296.
Sawusch, M. R., & Guyton, D. L. (1991). Optimal astigmatism to enhance depth
of focus after cataract surgery. Ophthalmology, 98, 1025-1029.
Scammnon, R., & Hesdorffer, M. (1937). Growth in mass and volume of the
human lens in postnatal life. Archives of Ophthalmology, 17, 104-112.
Schapero, M., Cline, D., & Hofstetter H. W. (edit. 1968). Dictionary of Visual
Science. Radnor, PA, Chilton Book Company, 192.
Schlegel, Z., Lteif, Y., Bains, H. S., & Gatinel, D. (2009). Total, corneal, and
internal ocular optical aberrations in patients with keratoconus. Journal of
Refractive Surgery, 25, S951–S957.
Schmid, K. L., Iskander, D. R., Li, R. W. H., Edwards, M. H., & Lew, J. K. F.
(2002). Blur detection thresholds in childhood myopia: single and dual target
presentation. Vision Research, 42, 239-247.
Schmidinger, G., Geitzenauer, W., Hahsle, B., Klemen, U. M., Skorpik, C., &
Pieh, S. (2006). Depth of focus in eyes with diffractive bifocal and refractive
multifocal intraocular lenses. Journal of Cataract and Refractive Surgery, 32,
1650-1656.

195
Schor, C. M., & Charles, F. (2009). Prentice Award Lecture 2008: Surgical
correction of presbyopia with intraocular lenses designed to accommodate.
Optometry and Vision Science, 86, 1028-1041.
Schwiegerling, J. (1997). Cone dimensions in keratoconus using Zernike
polynomials. Optometry and Vision Science, 74, 963–969.
Schwiegerling, J. (2002). Scaling Zernike expansion coefficients to different
pupil sizes. Journal of the Optical Society of America A, 19, 1937−1945.
Seiler, T., Kaemmerer, M., Mierdel, P., & Krinke, H. E. (2000). Ocular optical
aberrations after photorefractive keratectomy for myopia and myopic astigmatism.
Archives of Ophthalmology, 118, 17-21.
Selenow, A., Bauer, E. A., Ali, S. R., Spencer, L. W., & Ciuffreda, K. J. (2002).
Assessing visual performance with progressive addition lenses. Optometry and
Vision Science, 79, 502-505.
Sheedy, J. E. (2004). Correlation analysis of the optics of progressive addition
lenses. Optometry and Vision Science, 81, 350-361.
Simonet, P., Papineau, Y., & Lapointe, R. (1986). Peripheral power variations in
progressive addition lenses. American Journal of Optometry and Physiological
Optics, 63, 873-880.
Smirnov, M. S. (1961). Measurement of the wavefront aberration of the human
eye. Biophysics, 6, 776-795.
Spearman, C. (1987). The proof and measurement of association between two
things. The American Journal of Psychology, 100, 441–471.
Stiles, W. S., & Crawford, B. H. (1933). The luminal brightness increment as a
function of wave-length for different conditions of the foveal and papafoveal
retina. Proceedings of the Royal Society of London B, 113, 496-530.
Strang, N. C., Schmid, K. L., & Carney, L. G. (1998). Hyperopia is
predominantly axial in nature. Current Eye Research, 17, 380-383.

196
Subbaram, M. V., MacRae, S. M., Slade, S. G., & Durrie, D. S. (2006).
Customized LASIK treatment for myopia: relationship between preoperative
higher order aberrations and refractive outcome. Journal of Refractive Surgery,
22, 746-753.
Swarbrick, H. A. (2006). Orthokeratology review and update. Clinical and
Experimental Optometry, 89, 124-143.
Thibos, L. N. (2009). Retinal image quality for virtual eyes generated by a
statistical model of ocular wavefront aberrations. Ophthalmic and Physiological
Optics, 29, 288-291.
Thibos, L. N., Applegate, R. A., Schwiegerling, J. T., Webb, R., & VSIA
standards taskforce members. (2000). Optical Society of America‟s standards for
reporting optical aberrations. In: V Lakshminarayanan, ed. OSA Trends in Optics
and Photonics, Vision Science and Its Applications, Vol. 35. Washington, D. C.:
Optical Society of America, 2000, 232-244.
Thibos, L. N., Bradley, A., & Hong X. (2002a). A ststistical model of the
aberration structure of normal, well-corrected eyes. Ophthalmic and
Physiological Optics, 22, 427-433.
Thibos, L. N., & Hong, X. (1999). Clinical applications of the Shack-Hartmann
aberrometer. Optometry and Vision Science, 76, 817-825.
Thibos, L. N., Hong, X., Bradley, A., & Cheng, X. (2002b). Statistical variation
of aberration structure and image quality in a normal population of healthy eyes.
Journal of Optical Society of America A, 19, 2329-2348.
Thibos, L. N., Hong, X., Bradley, A., & Applegate, R. A. (2004). Accuracy and
precision of objective refraction from wavefront aberrations. Journal of Vision, 4,
329-351.
Thorn, F., Cameron, L., Arnel, J., & Thorn, S. (1998). Myopia adults see through
defocus better than emmetropes. In: Tokoro T, ed. Myopia Updates. Proceeding
of the 6th
International Conference on Myopia. Tokyo: Springer 1998; 368-374.

197
Tsukamoto, M., Nakajima, K., Nishino, J., Hara, O., Uosato, H., & Saishin, M.
(2000). Accommodation causes with-the-rule astigmatism in emmetropes.
Optometry and Vision Science, 77, 150-155.
Tucker, J., & Charman, W. N. (1975). The depth-of-focus of the human eye for
Snellen letters. American Journal of Optometry and Physiological Optics, 52, 3-
21.
Tucker, J., & Charman, W. N. (1986). Depth of focus and accommodation for
sinusoidal gratings as a function of luminance. American Journal of Optometry
and Physiological Optics, 63, 58-70.
Tyson, R. K. (1982). Conversion of Zernike aberration coefficients to Seidel and
higher-order power-series aberration coefficients. Optics Letters, 7, 262-264.
Ukai, K., & Ichihashi, Y. (1991). Changes in ocular astigmatism over the whole
range of accommodation. Optometry and Vision Science, 68, 813-818.
UN. (2001). World population aging: 1950-2050 (No. ST/ESA/SER.A/207). New
York.
Van Meeteren, A. (1974). Calculation on the optical modulation transfer function
of the human eye for white light. Journal of Modern Optics, 21, 395-412.
Vargas-Martin, F., Prieto, P. M., & Artal, P (1998). Correction of the aberrations
in the human eye with a liquid-crystal spatial light modulator: limits to
performance. Journal of the Optical Society of America A, 15, 2552-2562.
Vasudevan, B., Ciuffreda, K. J., & Wang, B. (2006). Objective blur thresholds in
free space for different refractive groups. Current Eye Research, 31, 111−118.
Vasudevan, B., Ciuffreda, K. J., & Wang, B. (2007). Subjective and objective
depth-of-focus. Journal of Modern Optics, 54, 1307−1316.
Von Bahr, G. (1952). Studies on the depth of focus of the eye. Acta
Ophthalmologica (Copenh.), 30, 39−44.

198
Wang, B., & Ciuffreda, K. J. (2004). Depth-of-focus of the human eye in the near
retinal periphery. Vision Research, 44, 1115-1125.
Wang, B., & Ciuffreda, K. J. (2006) Depth-of-focus of the human eye: theory and
clinical implications. Survey of Ophthalmology, 51, 75−85.
Wang, L., Dai, E., Koch, D. D., & Nathoo, A. (2003). Optical aberrations of the
human anterior cornea. Journal of Cataract and Refractive Surgery, 29, 1514-
1521.
Wang, L., & Koch, D. D. (2003). Anterior corneal optical aberrations induced by
laser in situ keratomileusis for hyperopia. Journal of Cataract and Refractive
Surgery, 29, 1702-1708.
Wang, L., & Koch, D. D. (2003). Ocular higher-order aberrations in individuals
screened for refractive surgery. Journal of Cataract and Refractive Surgery, 29,
1896-1903.
Wang, L., Zhao, K. X., Jin, Y., Niu, Y. F., & Zuo, T. (2003). Changes of higher
order aberration with various pupil size in the myopic eye. Journal of Refractive
Surgery, 19, S270-S274
West, S. K., Rubin, G. S., Broman, A. T., Muñoz, B., Bandeen-Roche, K., &
Turano, K. (2002). How does visual impairment affect performance on task of
everyday life? The SEE Project. Archive of Ophthalmology, 120, 774-780.
Williams, D. R., Yoon, G. Y., Porter, J., Guirao, A., Hofer, H., & Cox, I. G.
(2000). Visual benefit of correcting higher order aberrations of the eye. Journal of
Refractive Surgery, 16, S554-S559.
Williams, D. R., & Liang, J. Z. (1999). Method and apparatus for improving
vision and the resolution of retinal images. US patent 5949521.
Williams, D. R., & Yoon, G. (2001). Wavefront sensor with off-axis illumination.
US patent 6264328 B1.
Wolffsohn, J. S., Hunt, O. A., Naroo, S., Gilmartin, B., Shah, S., Cunliffe, I. A.,
Benson, M. T., & Mantry, S. (2006). Objective accommodative amplitude and

199
dynamics with the 1CU accommodative intraocular lens. Investigative
Ophthalmology and Visual Science, 47, 1230-1235.
Wyant, J. C., & Creath, K. (1992). Basic wavefront aberration theory for optical
metrology. In Applied Optics and Optical Engineering, Academic Press, Inc.
Yi, F., Iskander, D. R., & Collins, M. J. (2010) Estimation of the depth of focus
from wavefront measurements. Journal of Vision, 10(4)3, 1-9.
Yilmaz, F., Bayraktar, S., Agca, A., Yilmaz, B., McDonald, M. B., & Van de pol,
C. (2008). Intracorneal inlay for the surgical correction of presbyopia. Journal of
Cataract and Refractive Surgery, 34, 1921-1927.
Yoon, G. (2006). Wavefront sensing and diagnostic uses. In Porter et al, eds,
Adaptive Optics for Vision Science. John Wiley & Sons, Inc., Hoboken, NJ.
Yoon, G., MacRae, S., Williams, D. R., & Cox, I. G. (2005). Causes of spherical
aberration induced by laser refractive surgery. Journal of Cataract and Refractive
surgery, 31, 127-135.
Young T. (1801). On the mechanism of the eye. Philosophical Transactions of
the Royal Society, 91, 23-88.
Zadok, D., Levy, Y., Segal, O., Barkana, Y., Morad, Y., & Avni, I. (2005).
Ocular higher-order aberrations in myopia and skiascopic wavefront repeatability.
Journal of Cataract and Refractive Surgery, 31, 1128-1132.
Zhu, M., Collins, M. J., & Iskander D. R. (2004). Microfluctuations of wavefront
aberrations of the eye. Ophthalmic and Physiological Optics, 24, 562−571.

200
Appendices
Appendix A- Calibration results of HASO against COAS in 10 real eyes 202
Appendix B- Reading wavefront data from HASO measurements 212
Appendix C- Ethics information sheet & consent form 214
Appendix D- Published paper 1 215
Appendix E- Conference abstract 1 224
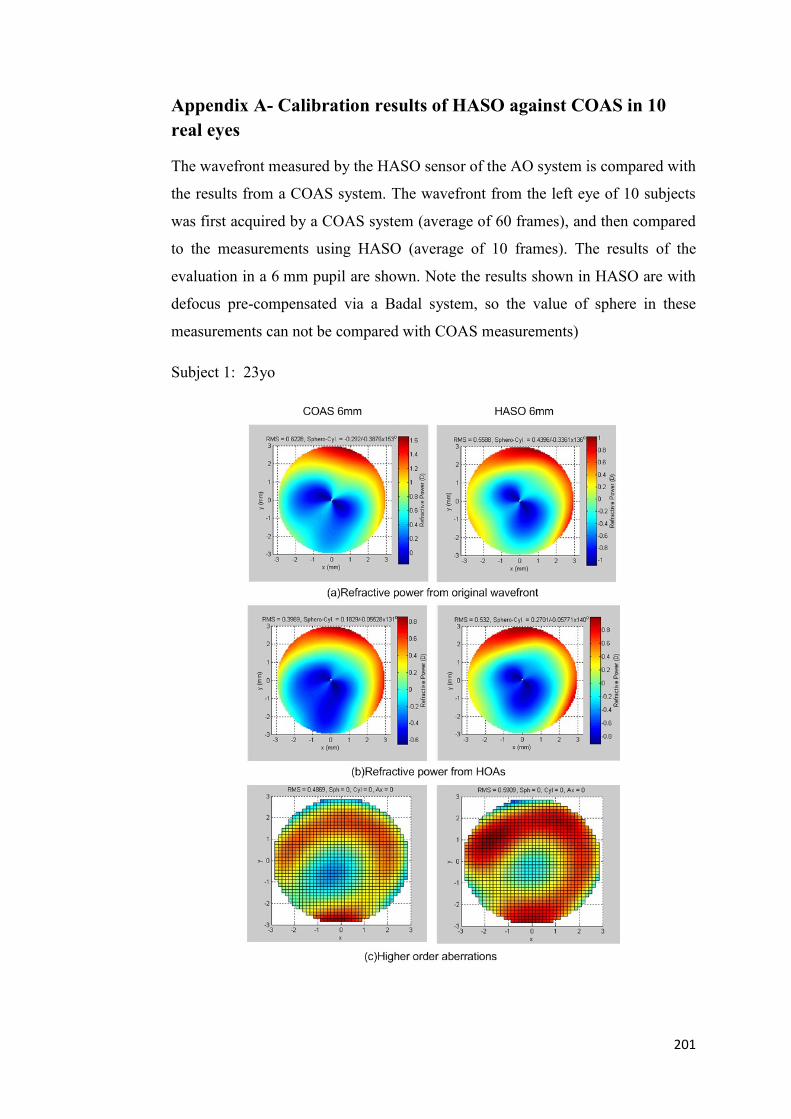
201
Appendix A- Calibration results of HASO against COAS in 10
real eyes
The wavefront measured by the HASO sensor of the AO system is compared with
the results from a COAS system. The wavefront from the left eye of 10 subjects
was first acquired by a COAS system (average of 60 frames), and then compared
to the measurements using HASO (average of 10 frames). The results of the
evaluation in a 6 mm pupil are shown. Note the results shown in HASO are with
defocus pre-compensated via a Badal system, so the value of sphere in these
measurements can not be compared with COAS measurements)
Subject 1: 23yo
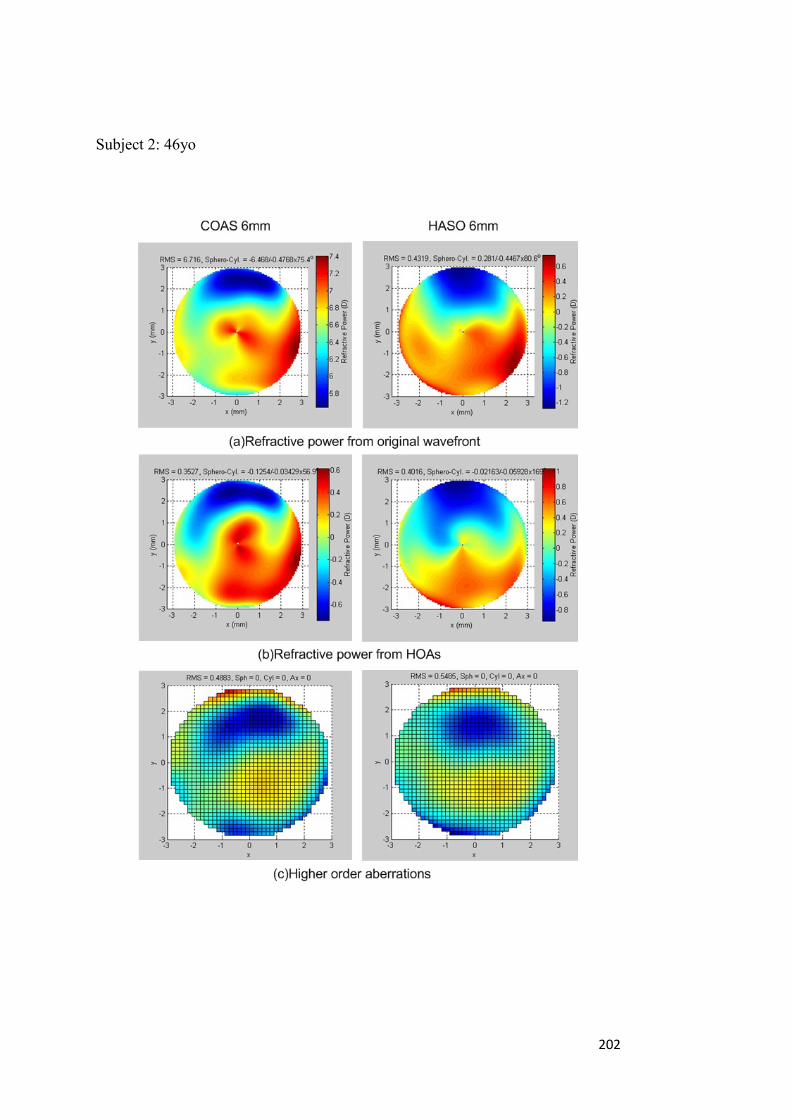
202
Subject 2: 46yo
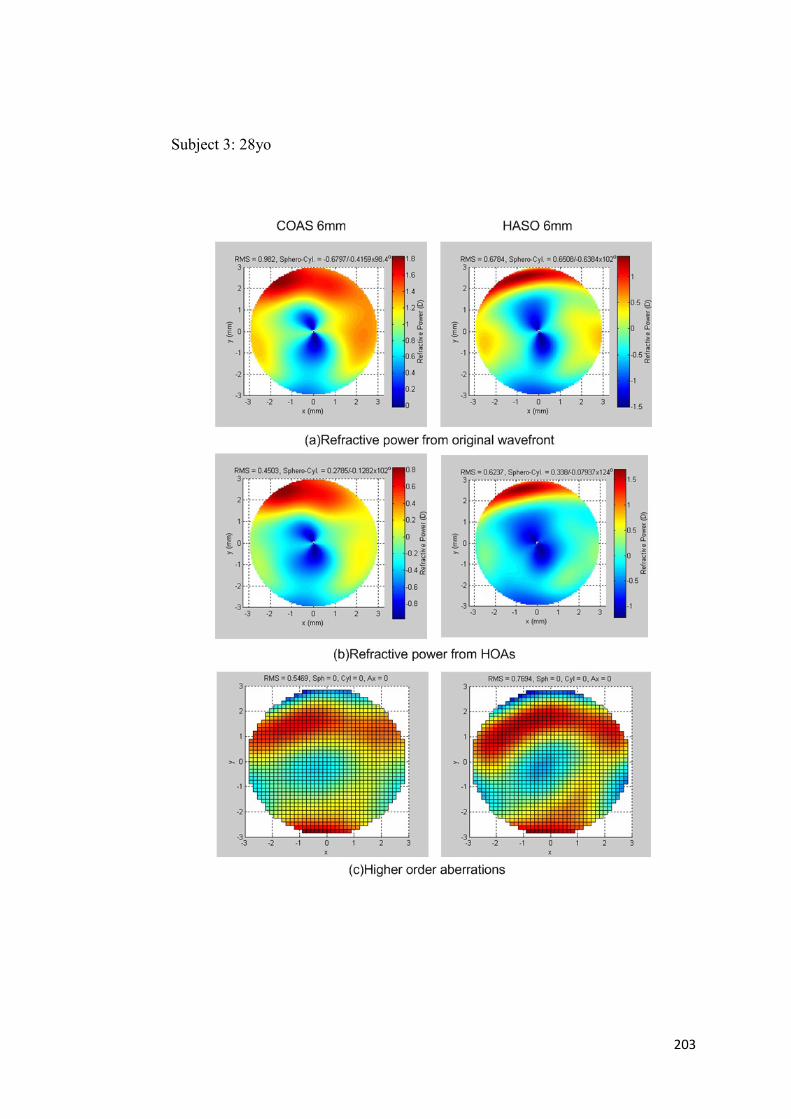
203
Subject 3: 28yo

204
Subject 4: 27yo

205
Subject 5: 28yo

206
Subject 6: 26yo

207
Subject 7: 32yo

208
Subject 8: 28yo

209
Subject 9: 25yo, Lasik subject

210
Subject 10: 29yo

211
Appendix B- Reading wavefront data from HASO measurements
Two types of data files can be obtained from the wavefront measurements
performed by the HASO sensor. They are: (1) *.txt or *.txtc files that contain the
Zernike coefficients and (2) *.has files that contain the original (raw) slope
information. The wavefront generated from the raw slope information could
provide accurate results compared to the HASO Zernike files which are processed
by the manufacturer‟s software with unknown filtering and fitting methods. The
Zernike slope polynomials developed by Nam, Thibos and Iskander (2009a,
2009b) were used to reconstruct the wavefront and derive the refractive power
map directly from the original slope files.
The physical centre of the four actuators (22, 23, 30 and 31) of the Mirao52 DM
was carefully aligned with the centre of the CCD of HASO sensor as shown in
following figure.
Different higher order Zernike polynomials were then generated for a 6 mm pupil
using the DM, which were measured by the HASO sensor and recorded in *.txt

212
and *.has files. No significant difference was found between the HOA RMS
obtained from the two methods and good similarities were observed in most of
the measurements. However, some difference can be seen for the generated
secondary spherical aberration ( 0
6Z ) recorded in the two files. The results
reconstructed from the slope file showed better symmetrical features than the
results obtained from the corresponding coefficient file.

213
Appendix C- Consent form
VISUAL OPTICS PROJECT
RESEARCH CONSENT FORM
Name of chief investigator: Dr Michael Collins Phone (W) 3138 5702 (AH)
3289 3940
By signing below, you are indicating that:
The tests and procedures involved in this study have been explained to me,
I have read the information sheet,
I have been given the opportunity to ask questions regarding this project
and the tests involved,
I understand that if I have additional questions I can contact any member
of the research team,
I have been informed that I am free to withdraw from the study at any
time, without comment or penalty;
The project is for the purpose of research and not for treatment of my eyes;
I can contact the QUT Research Ethics Officer on 3138 2091 or
[email protected] if I wish to raise any concerns about the
conduct of this research.
I consent to participate in this project.
Participant's
name:...............................................................................................…
Signature: .........................................................
Date .................................

214
Appendix D- Published paper 1
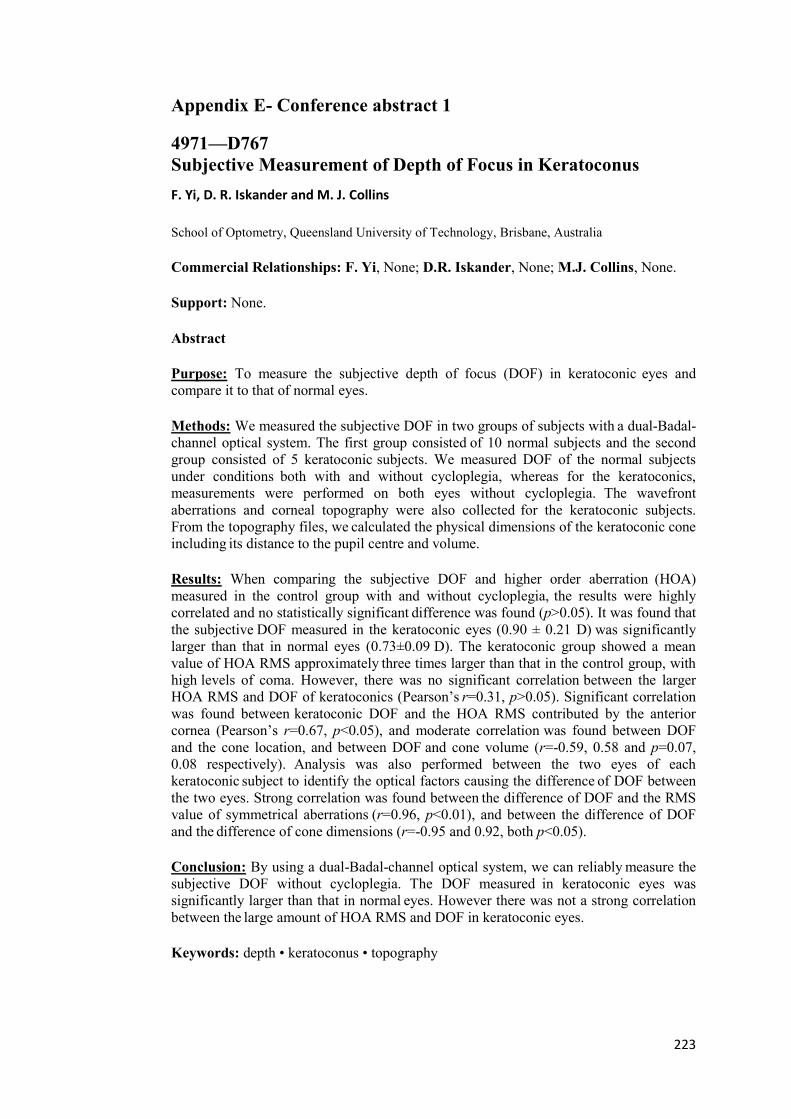
223
Appendix E- Conference abstract 1
4971—D767
Subjective Measurement of Depth of Focus in Keratoconus
F. Yi, D. R. Iskander and M. J. Collins
School of Optometry, Queensland University of Technology, Brisbane, Australia
Commercial Relationships: F. Yi, None; D.R. Iskander, None; M.J. Collins, None.
Support: None.
Abstract
Purpose: To measure the subjective depth of focus (DOF) in keratoconic eyes and
compare it to that of normal eyes.
Methods: We measured the subjective DOF in two groups of subjects with a dual-Badal-
channel optical system. The first group consisted of 10 normal subjects and the second
group consisted of 5 keratoconic subjects. We measured DOF of the normal subjects
under conditions both with and without cycloplegia, whereas for the keratoconics,
measurements were performed on both eyes without cycloplegia.
The wavefront
aberrations and corneal topography were also collected for the keratoconic subjects.
From the topography files, we calculated the physical dimensions of the keratoconic cone
including its distance to the pupil centre and volume.
Results: When comparing the subjective DOF and higher order aberration (HOA)
measured in the control group with and without cycloplegia, the results were highly
correlated and no statistically significant difference was found (p>0.05). It was found that
the subjective DOF measured in the keratoconic eyes (0.90 ± 0.21 D)
was significantly
larger than that in normal eyes (0.73±0.09 D). The keratoconic group showed a mean
value of HOA RMS approximately three times larger than that in the control group, with
high levels of coma. However, there was no significant correlation
between the larger
HOA RMS and DOF of keratoconics (Pearson‟s r=0.31, p>0.05). Significant correlation
was found between keratoconic DOF and the HOA RMS contributed by the anterior
cornea (Pearson‟s r=0.67, p<0.05), and moderate correlation was found between DOF
and the cone location, and between DOF and cone volume (r=-0.59, 0.58 and p=0.07,
0.08 respectively).
Analysis was also performed between the two eyes of each
keratoconic subject to identify the optical factors causing the difference
of DOF between
the two eyes. Strong correlation was found between the difference of DOF and the RMS
value of symmetrical aberrations (r=0.96, p<0.01), and between the difference of DOF
and the difference of cone dimensions (r=-0.95 and 0.92, both p<0.05).
Conclusion: By using a dual-Badal-channel optical system, we can reliably measure the
subjective DOF without cycloplegia. The DOF measured in keratoconic eyes was
significantly larger than that in normal eyes. However there was not a strong correlation
between the large amount of HOA RMS and DOF in keratoconic eyes.
Keywords: depth • keratoconus • topography