waveform data in terrascan - geocue...
TRANSCRIPT

Tools
Waveform Data in TerraScan TerraScan, versions 05.016 and above
GeoCue Group Support Page 1 of 8 Terrasolid
1/10/2017 www.geocue.com
GeoCue Group Support
1/10/2017
Revision 1.0
Introduction Many users of LIDAR use discrete return systems for their production, however, many systems are
capable of capturing the full waveform of the energy returned from an outgoing laser pulse. The figure
below illustrates a laser pulse directed through a tree. Different portions of the laser energy are
backscattered/returned by various surfaces: branches, twigs, leaves, and hopefully the ground itself. In
this example, the discrete return system recorded three returns, but a full waveform system would have
recorded the continuous return of energy.
Figure 1: Waveform diagram
In Figure 1, the returns/echoes are represented by the rising peaks in the waveform. The peaks are the
amplitude (intensity) of the object from which the laser pulse is reflected. Full waveform LIDAR systems
digitize the entire backscattered laser pulse. This allows for a complete record of each received signal,
resulting in more information about the returns, and the identification of possible additional returns.
One of the main advantages of waveform data is the ability to obtain additional information to produce
dense detailed point clouds from the laser pulse. This is particularly useful for improving target
resolution. Another advantage of waveform data is the capability to extract additional parameters about
a return that may be used to help better automate the classification of the point cloud. Waveform data

Tools
Waveform Data in TerraScan
GeoCue Group Support Page 2 of 8 Terrasolid
1/10/2017 www.geocue.com
is generally higher in quality and resolution providing increased vegetation and ground detail. Some
applications that utilize waveform include, but is by no means limited to, forestry and vegetation
mapping, airport obstruction analysis, target detection, and habitat mapping.
Workflow This workflow consists of preparing the data, viewing the waveform, creating scanner waveform
profiles, extracting echo properties, classification of points based on their waveform properties, and
extracting additional discrete points from the waveform information.
Prepare data TerraScan is able to read waveform information from LAS 1.3 and 1.4 files (as of TerraScan v016.031),
WDP files (external waveform data storage for LAS files) and from TopEye.TEW 1.15 (MarkII) files.
TerraScan uses the waveform information for processing tasks, but it’s not possible to write out files
that include waveform information. Nor is it usually desirable as waveform data is quite large and
unaffected by the classification process that one may do to the discrete points.
In a TerraScan project, the block binary files must be saved as LAS or Fast Binary files in order to enable
the use of waveform data for processing. Waveform-related attributes, such as echo length, echo
normality, and echo position can only be stored in the Fast Binary format. The waveform files need to be
linked to laser points via the trajectory files. The Trajectory information dialog contains an input field
‘Waveform’ which defines the file(s) used for reading waveform information. Once a laser point is
assigned to a trajectory (by line number) and the trajectory is linked to a waveform file, the software is
able to find the waveform information for any laser point using the time stamp and the echo number
stored for the laser point. Since the timestamp is used in this process then one must ensure that
timestamps are not converted if linking to an external WPD file.
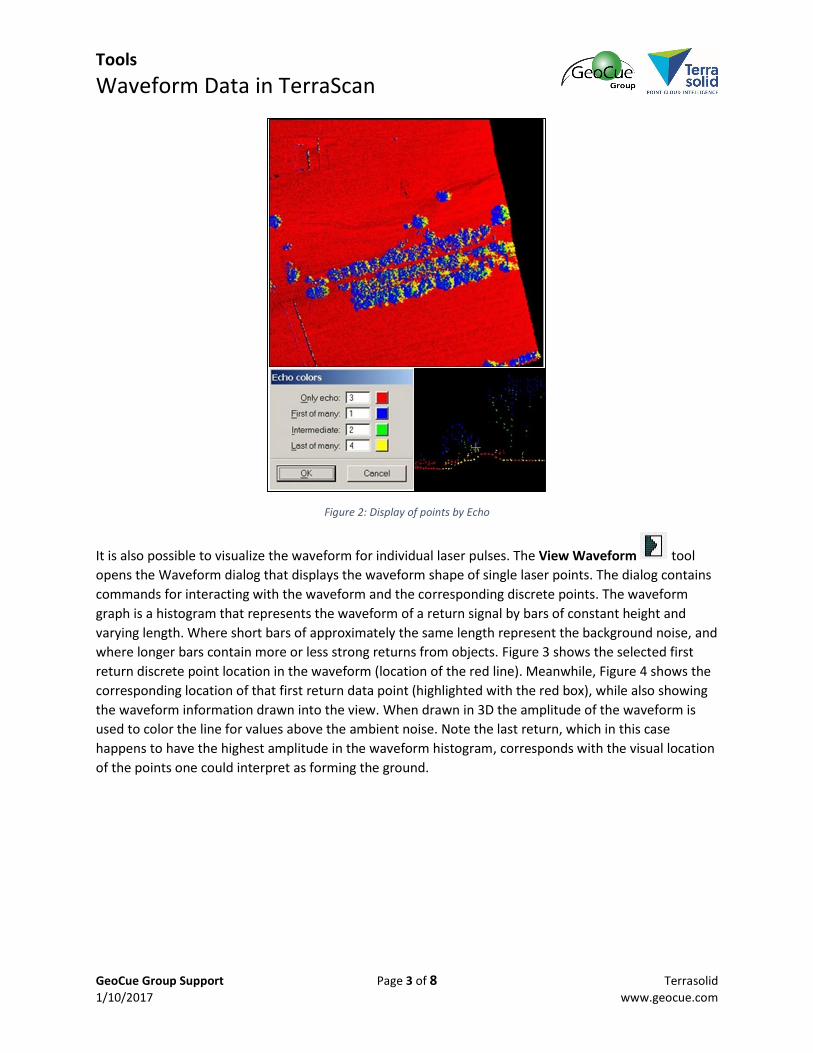
View Waveform Once the data is prepared, the point cloud can be displayed according to their return type: Only echo,
First of many, Intermediate, or Last of many. This display method can be useful for the visualizaiton of
the data.
Tools
Waveform Data in TerraScan
GeoCue Group Support Page 3 of 8 Terrasolid
1/10/2017 www.geocue.com
Figure 2: Display of points by Echo
It is also possible to visualize the waveform for individual laser pulses. The View Waveform tool
opens the Waveform dialog that displays the waveform shape of single laser points. The dialog contains
commands for interacting with the waveform and the corresponding discrete points. The waveform
graph is a histogram that represents the waveform of a return signal by bars of constant height and
varying length. Where short bars of approximately the same length represent the background noise, and
where longer bars contain more or less strong returns from objects. Figure 3 shows the selected first
return discrete point location in the waveform (location of the red line). Meanwhile, Figure 4 shows the
corresponding location of that first return data point (highlighted with the red box), while also showing
the waveform information drawn into the view. When drawn in 3D the amplitude of the waveform is
used to color the line for values above the ambient noise. Note the last return, which in this case
happens to have the highest amplitude in the waveform histogram, corresponds with the visual location
of the points one could interpret as forming the ground.

Tools
Waveform Data in TerraScan
GeoCue Group Support Page 4 of 8 Terrasolid
1/10/2017 www.geocue.com
Figure 3 - Waveform Histogram
Figure 4 - Waveform Histogram drawn on discrete points
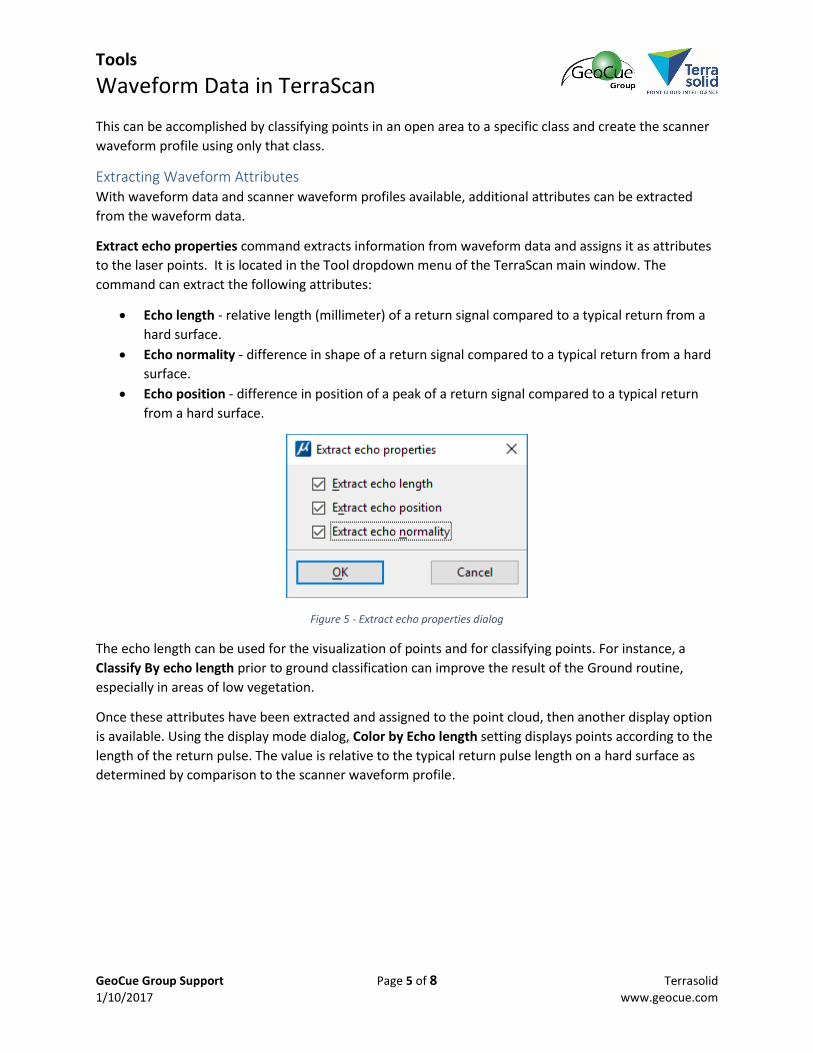
Extracting Echo Properties TerraScan allows for the extraction of information from waveform data and assigns it as attributes to
the laser points. These attributes include: Echo length, Echo normality, and Echo position. This process
requires that waveform data and scanner waveform profiles are available.
Scanner Waveform Profiles TerraScan settings contains a category for ‘Scanner waveform profiles.’ This contains a list of scanner
waveform profile definitions. These provide the reference or standard waveform shape that is typical for
the scanner by examining sample data and storing characteristics of a typical hard surface. The scanner
waveform profile contains:
Background noise level
Pulse length at 50% of peak strength
Pulse length at 35% of peak strength
Shape of the return pulse
System derived point position relative to return pulse
The scanner waveform profiles are required for waveform processing tasks, such as the extraction of
echo properties or the extraction of additional points.
The waveform profile can be created from loaded laser points and trajectory information by sampling
open areas in the dataset. The TerraScan trajectory must include the link to the waveform file. The
waveform profile is best extracted from laser points on open ground, preferably a hard surface, where a
wide range of intensity values are represented, and should not be too close to the edges of scan lines.
Tools
Waveform Data in TerraScan
GeoCue Group Support Page 5 of 8 Terrasolid
1/10/2017 www.geocue.com
This can be accomplished by classifying points in an open area to a specific class and create the scanner
waveform profile using only that class.
Extracting Waveform Attributes With waveform data and scanner waveform profiles available, additional attributes can be extracted
from the waveform data.
Extract echo properties command extracts information from waveform data and assigns it as attributes
to the laser points. It is located in the Tool dropdown menu of the TerraScan main window. The
command can extract the following attributes:
Echo length - relative length (millimeter) of a return signal compared to a typical return from a
hard surface.
Echo normality - difference in shape of a return signal compared to a typical return from a hard
surface.
Echo position - difference in position of a peak of a return signal compared to a typical return
from a hard surface.
Figure 5 - Extract echo properties dialog
The echo length can be used for the visualization of points and for classifying points. For instance, a
Classify By echo length prior to ground classification can improve the result of the Ground routine,
especially in areas of low vegetation.
Once these attributes have been extracted and assigned to the point cloud, then another display option
is available. Using the display mode dialog, Color by Echo length setting displays points according to the
length of the return pulse. The value is relative to the typical return pulse length on a hard surface as
determined by comparison to the scanner waveform profile.

Tools
Waveform Data in TerraScan
GeoCue Group Support Page 6 of 8 Terrasolid
1/10/2017 www.geocue.com
Figure 6: Display points by echo length
Classify Points by Waveform Attributes The extraction of these properties allows points to be classified based on these additional attributes in
addition to the standard classification routines of Classify by echo type or Classify echo difference.
Classify by Echo Length The By echo length routine classifies points based on the length of a return signal that resulted in a
point. It describes the relative length of a return signal compared to a typical return from a hard surface,
for example:
-50 - the echo is 50 mm shorter than a typical hard surface return.
+845 - the echo is 845 mm longer than a typical hard surface return.
Figure 7: Classify by echo length dialog
A point is classified if its echo length value falls within the given range.
Tools
Waveform Data in TerraScan
GeoCue Group Support Page 7 of 8 Terrasolid
1/10/2017 www.geocue.com
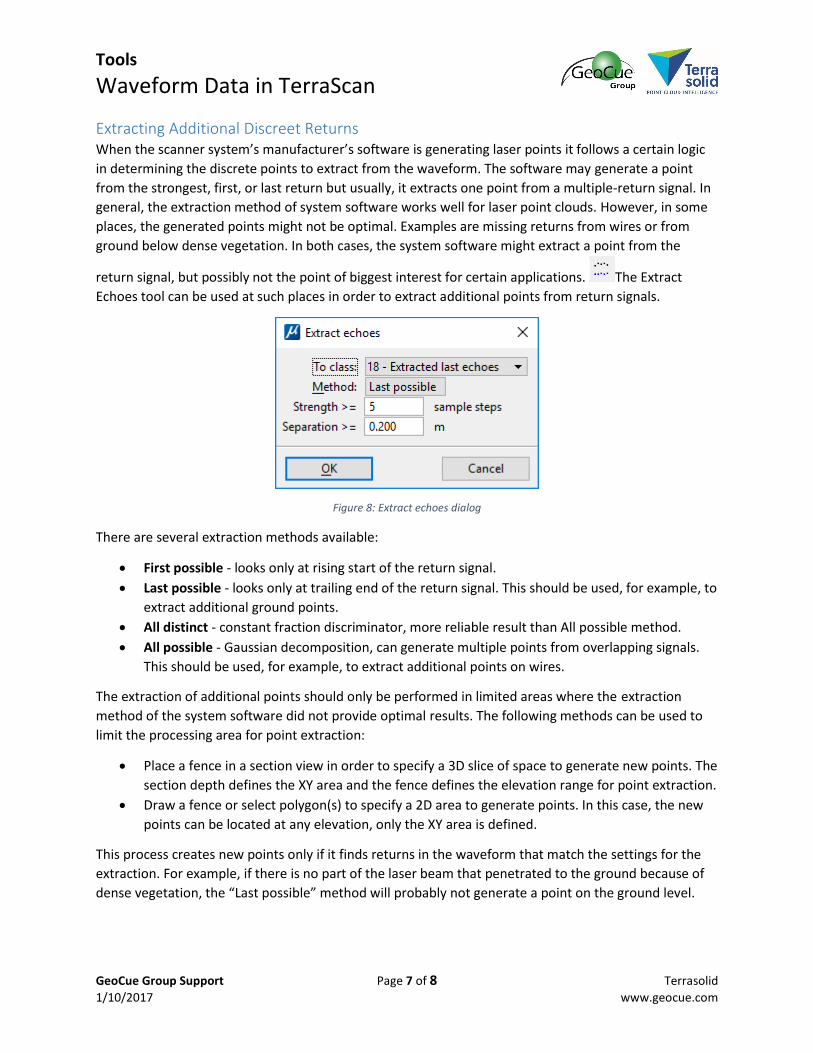
Extracting Additional Discreet Returns When the scanner system’s manufacturer’s software is generating laser points it follows a certain logic
in determining the discrete points to extract from the waveform. The software may generate a point
from the strongest, first, or last return but usually, it extracts one point from a multiple-return signal. In
general, the extraction method of system software works well for laser point clouds. However, in some
places, the generated points might not be optimal. Examples are missing returns from wires or from
ground below dense vegetation. In both cases, the system software might extract a point from the
return signal, but possibly not the point of biggest interest for certain applications. The Extract
Echoes tool can be used at such places in order to extract additional points from return signals.
Figure 8: Extract echoes dialog
There are several extraction methods available:
First possible - looks only at rising start of the return signal.
Last possible - looks only at trailing end of the return signal. This should be used, for example, to
extract additional ground points.
All distinct - constant fraction discriminator, more reliable result than All possible method.
All possible - Gaussian decomposition, can generate multiple points from overlapping signals.
This should be used, for example, to extract additional points on wires.
The extraction of additional points should only be performed in limited areas where the extraction
method of the system software did not provide optimal results. The following methods can be used to
limit the processing area for point extraction:
Place a fence in a section view in order to specify a 3D slice of space to generate new points. The
section depth defines the XY area and the fence defines the elevation range for point extraction.
Draw a fence or select polygon(s) to specify a 2D area to generate points. In this case, the new
points can be located at any elevation, only the XY area is defined.
This process creates new points only if it finds returns in the waveform that match the settings for the
extraction. For example, if there is no part of the laser beam that penetrated to the ground because of
dense vegetation, the “Last possible” method will probably not generate a point on the ground level.
Tools
Waveform Data in TerraScan
GeoCue Group Support Page 8 of 8 Terrasolid
1/10/2017 www.geocue.com
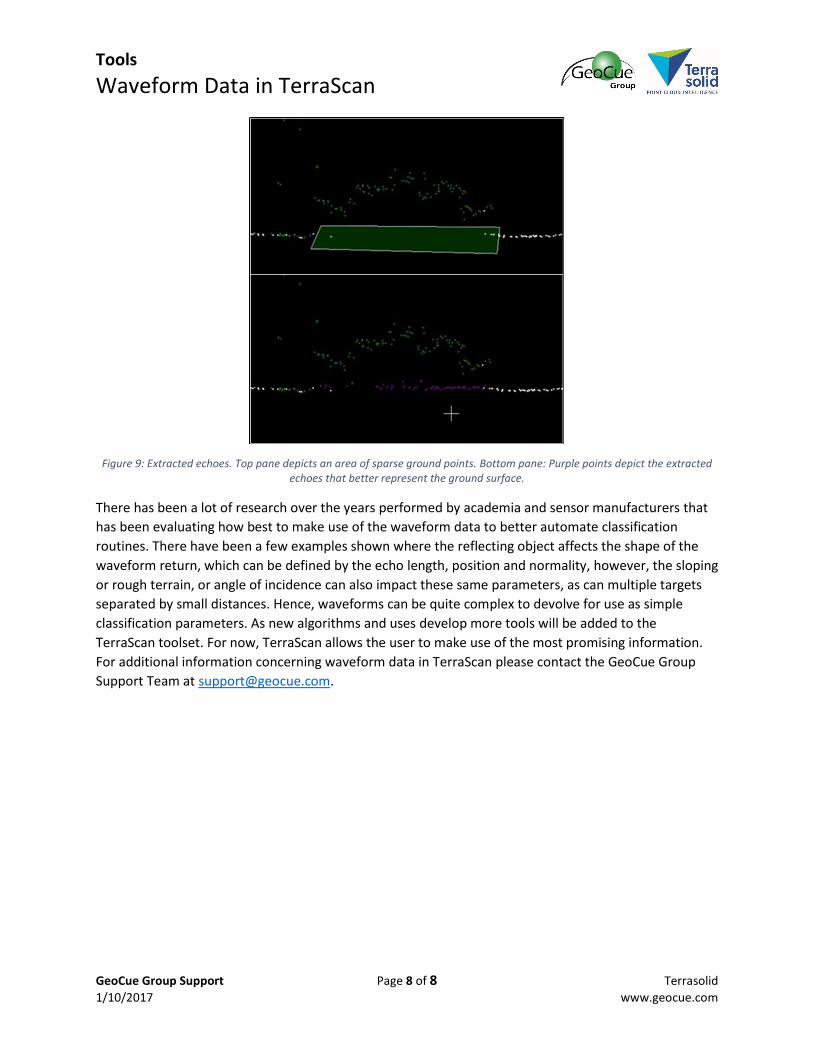
Figure 9: Extracted echoes. Top pane depicts an area of sparse ground points. Bottom pane: Purple points depict the extracted echoes that better represent the ground surface.
There has been a lot of research over the years performed by academia and sensor manufacturers that
has been evaluating how best to make use of the waveform data to better automate classification
routines. There have been a few examples shown where the reflecting object affects the shape of the
waveform return, which can be defined by the echo length, position and normality, however, the sloping
or rough terrain, or angle of incidence can also impact these same parameters, as can multiple targets
separated by small distances. Hence, waveforms can be quite complex to devolve for use as simple
classification parameters. As new algorithms and uses develop more tools will be added to the
TerraScan toolset. For now, TerraScan allows the user to make use of the most promising information.
For additional information concerning waveform data in TerraScan please contact the GeoCue Group
Support Team at [email protected].