wave energy noaatm92
TRANSCRIPT

8/3/2019 Wave Energy NOAATM92
http://slidepdf.com/reader/full/wave-energy-noaatm92 1/186
Ecological Effects of Wave EnergyDevelopment in the Pacific Northwest
A Scientific Workshop, October 11–12, 2007
George W. Boehlert, Gregory R. McMurray, and Cathryn E. Tortorici, editors
U.S. Department of Commerce
National Oceanic and Atmospheric Administration
National Marine Fisheries Service
NOAA Technical Memorandum NMFS-F/SPO-92

8/3/2019 Wave Energy NOAATM92
http://slidepdf.com/reader/full/wave-energy-noaatm92 2/186

8/3/2019 Wave Energy NOAATM92
http://slidepdf.com/reader/full/wave-energy-noaatm92 3/186
Ecological Effects of Wave Energy
Development in the Pacific NorthwestA Scientific Workshop, October 11–12, 2007
George W. Boehlert1, Gregory R. McMurray2, and Cathryn E. Tortorici3, editors
Workshop Steering Committee: George Boehlert, OSU Hatfield Marine Science Center; Robin Hartmann, OregonShores Conservation Coalition; Maurice Hill, U.S. Minerals Management Service; Justin Klure, Oregon WaveEnergy Trust; Greg McMurray, Oregon Department of Land Conservation and Development; John Meyer,Communication Partnership for Science and the Sea, OSU; Cathy Tortorici, NOAA-NMFS
1Oregon State University, Hatfield Marine Science Center, 2030 SE Marine Science Dr., Newport, Oregon 973652Oregon Department of Land Conservation and Development, Ocean and Coastal Services Division, 635 Capitol
Street NE, Suite 150, Salem, Oregon 97301-25403 NOAA-NMFS Northwest Region, 1201 NE Lloyd Blvd., Portland, Oregon 97232
NOAA Technical Memorandum NMFS-F/SPO-92
September 2008
U.S. Department of CommerceCarlos M. Gutiérrez, Secretary
National Oceanic and Atmospheric Administration
Vice Admiral Conrad C. Lautenbacher, Jr., USN (Ret.)
Under Secretary for Oceans and Atmosphere
National Marine Fisheries Service
James W. Balsiger, Acting Assistant Administrator for Fisheries

8/3/2019 Wave Energy NOAATM92
http://slidepdf.com/reader/full/wave-energy-noaatm92 4/186
ii
Suggested citation:
Boehlert, G. W, G. R. McMurray, and C. E. Tortorici (editors). 2008. Ecological effects of wave energyin the Pacific Northwest. U.S. Dept. Commerce, NOAA Tech. Memo. NMFS-F/SPO-92, 174 p.
A copy of this report may be obtained from: Northwest Fisheries Science Center NMFS, NOAA2725 Montlake Boulevard EastSeattle, Washington 98112
Or online at:
http://spo.nmfs.noaa.gov/tm/

8/3/2019 Wave Energy NOAATM92
http://slidepdf.com/reader/full/wave-energy-noaatm92 5/186
iii
Contents
Executive Summary......................................................................................................................................v
Acknowledgments........................................................................................................................................ix
Introduction and Workshop ObjectivesGeorge W. Boehlert, Oregon State University, Hatfield Marine Science Center .........................................1
Presentations—Extended Abstracts .............................................................................................................. 5
Wave Energy Interest in the Oregon Coast: Policy and Economic Considerations Justin Klure, Oregon Wave Energy Trust .................................................................................................5 The Oregon Shelf/California Current System’s Ecological Setting Bill Peterson, NOAA-NMFS, NWFSC ......................................................................................................7 The Technology: Wave Energy Development on the West Coast Mirko Previsic, re vision consulting, LLC ..............................................................................................15 Environmental Risk Analysis and Wave Energy: Examples of How to Assess Potential Impacts of
Wave Energy on the Environment Maurice L. Hill and Fred M. Piltz, U.S. Minerals Management Service ............................................... 22
Wave Energy Ecological Effects Workshop Ecological Assessment Briefing Paper Gregory McMurray, Oregon Department of Land Conservation and Development ..................................25
Introduction ............................................................................................................................................ 25 The Technology......................................................................................................................................25 The Affected Environment: Oregon’s Continental Shelf ....................................................................... 32 Environmental Effects ............................................................................................................................ 51 Bibliography and Literature Cited..........................................................................................................63
Breakout Groups.........................................................................................................................................67
Introduction to the Breakout Groups John Meyer, Oregon State University, and Robin Hartmann, Oregon Shores Conservation
Coalition.................................................................................................................................................67
Receptor Breakout Group Report: The Physical Environment .............................................................. 69 Receptor Breakout Group Report: Pelagic Habitat.................................................................................74 Receptor Breakout Group Report: Benthic Habitat................................................................................78 Receptor Breakout Group Report: Fish and Fisheries............................................................................84 Receptor Breakout Group Report: Marine Birds....................................................................................89 Receptor Breakout Group Report: Marine Mammals.............................................................................95 Stressor Breakout Group Report: Energy Absorbing Structures..........................................................101 Stressor Breakout Group Report: Chemical Effects.............................................................................106 Stressor Breakout Group Report: Hard Structures and Lighting..........................................................110 Stressor Breakout Group Report: Acoustics.........................................................................................114 Stressor Breakout Group Report: Electromagnetic Effects .................................................................. 121 Breakout Group Report: System View and Cumulative Effects .......................................................... 125
Workshop Integration and SynthesisCathy Tortorici, NOAA-NMFS .................................................................................................................133
Glossary, Abbreviations, and Acronyms .................................................................................................. 139
Appendix 1: Workshop Agenda............................................................................................................... 147

8/3/2019 Wave Energy NOAATM92
http://slidepdf.com/reader/full/wave-energy-noaatm92 6/186
iv
Appendix 2: Ecological Effects of Wave Energy Development in the Pacific Northwest:Prospectus for a Science Workshop..........................................................................................................149
Appendix 3: Workshop Participants ........................................................................................................ 153
Appendix 4: Keynote Address— Ocean Zoning: Implications for Wave Energy Development (WED) Richard G. Hildreth ..................................................................................................................................159
Appendix 5: Environmental Consequences of Wave Energy Extraction along the Shores of the U.S.Pacific Northwest: The Physical Environment ......................................................................................... 163
8/3/2019 Wave Energy NOAATM92
http://slidepdf.com/reader/full/wave-energy-noaatm92 7/186
v
Executive Summary
Background
The Pacific Northwest has significantopportunity to develop the capacity to harvestwave energy off its coast as a clean, renewableresource. While the technology and interest isadvancing rapidly, it is important to understandthe potential effects of wave energy technologyon the ecological and physical components of coastal ecosystems. A workshop to addressthese issues was organized at Oregon StateUniversity’s Hatfield Marine Science Center in Newport, Oregon, on October 11–12, 2007. Theworkshop’s problem statement was as follows:
The conversion of ocean waves into
electricity has the potential to provide
clean, reliable, and low-cost electricity
to the economy while producing minimal
impacts on the environment. However,
in order for wave energy to develop and
fulfill these assumptions, we must
reduce the uncertainties about the
technology's effects on the marine
environment. We must assess the
potential environmental impacts of wave
energy, determine what is known and unknown, and identify a rigorous set of
scientific studies to address concerns.
This information is needed to support
the permitting process as well as to
make responsible decisions to site
facilities and to minimize environmental
impacts.
Workshop Objectives and Structure
A diverse group of some 50 marinescientists from around the country participatedin the workshop. Principal objectives were 1) todevelop an initial assessment of the potentialimpacting agents and ecological effects of waveenergy development, and 2) to formulate ageneral conceptual framework of physical and biological relationships that can be applied tospecific wave energy projects. Presentations onthe physical and biological environment, the
wave energy technologies being considered, andframeworks for environmental risk analysis
(which were adopted for this workshop) set thestage for a common understanding among participants. This was followed by a series of breakout sessions to address these questions:
• What is known about important waveenergy facilities, their associatedcomponents (such as cables, anchors,and buoys), and their effect on the physical and biological systems?
• What is unknown about theserelationships, and what are key
information gaps?
• What is the level of uncertainty or agreement among scientists about theseinteractions?
• Can we prioritize important ecologicalissues (e.g., key interactions)?
• What studies, monitoring, or mitigationmeasures should be employed to helpminimize or better understand effects?
Two sets of breakout sessions were
convened. The first dealt with “receptors,” or specific elements of the ecosystem where the potential for a demonstrable response to waveenergy development may exist. The secondfocused on “stressors,” specific wave energycomponents that may interact with a suite of ecosystem elements. Stressors may occur duringinstallation, operation, or decommissioning of facilities. A summary of the initial key findingsfrom each group as reported during theworkshop follows.
Results
Receptor breakout groups
For the Physical Environment, workshop participants suggested there could be significantwave reduction resulting from wave energy production, with possible beach effects (e.g.,changes to sediment transport processes); pilot

8/3/2019 Wave Energy NOAATM92
http://slidepdf.com/reader/full/wave-energy-noaatm92 8/186
vi
projects to understand and model wavereduction effects are needed. Mitigation for physical changes should be developed throughanalysis of project geometry, density, anddistance from shore; additionally, it wassuggested that buoys should not be placed in
sensitive areas (i.e., closer to shore than 40 mdepth).
In the Pelagic Habitat, buoys will likelyhave a minimal impact on phytoplankton, but positive effects (through aggregation) on foragefish species—this in turn could result inattraction of larger predators. Structures need tominimize loose lines to reduce potentialentanglement of marine turtle species. Addingstructure may induce increased settlement of meroplankton species, and potential effects of
electromagnetic fields (EMF) are currentlyunknown.
Immediate changes to the Benthic Habitatwill likely result from modifications to water circulation and currents. Larval distribution andsediment transport may change both in the benthos and on beaches. Additionally, thefouling community growth on buoys, anchors,and lines may adversely affect the benthicenvironment if deposited into accumulations onthe seafloor (e.g., by sloughing off or by routine
maintenance of mooring lines and buoystructures). Effects on the benthos will likelyscale in a nonlinear fashion, affected byconnectivity as multiple facilities interact—for example, as stepping stones for invasive species.
Wave energy development can affectcommunity structure for Fish and Fisheriesthrough changes in species composition and predator effects (e.g., attraction of predators thatwere previously absent). New structures mayaffect migration corridors (e.g., for salmon,Dungeness crabs, elasmobranchs, and sturgeon), potentially mediated through behavioral effectsresulting from EMF, chemical, and acousticsignals. Effects on fishery access and gear entanglement are also anticipated, but were nottopics of this workshop.
For Marine Birds, lighting and above-water structures may result in collisions and attraction
to buoys. Structures may also alter food websand beach processes, in turn affectingshorebirds. Data gaps to be filled include spatialand temporal abundance of birds, bird activity atnight, important areas of bird activity that should be avoided, important migration patterns, and
potential effects on seabird prey.
A diversity of concerns exists for MarineMammals; the nature of mooring cables (slack v.taut; horizontal v. vertical; diameter) is criticalto entanglement issues. Fundamental baselinedata will be needed (mammal biology, presence/absence/species diversity, informationon prey species) to understand projects’ impactsand long-term buildout scenarios. There is someneed for immediate monitoring of cetaceans(e.g., videography, beachings, tagging, vessel
surveys) to understand how they interact withwave energy facilities.
Stressor breakout groups
Energy Absorbing Structures (e.g., buoys,wave snakes, etc.) affect a suite of receptors, andconsequently should not be established withinsensitive habitats and areas. (Shallow coastalwaters are sensitive ecologically; somesuggested that wave energy facilities should stayoutside 100 m.) Impacts can be minimized by
working with industry ahead of time. Energydevices that focus or trap water in the nearshoreenvironment will be especially problematic dueto the sensitive areas nearshore.
When addressing Chemical Effects, it isimportant to distinguish between spills as asource of chemicals (low probability but highimpact) versus continuous release of chemicals,for example in fouling paints. It will beimportant to understand effects at thecommunity level—do chemicals bioaccumulateand pass through trophic levels? Chemicals canmove over a large area, depending on thecurrents. Information is needed on the nature of toxic compounds to be used, potential amountsthat could be released, responses of receptors,and the fate of the contaminants.
New Hard Structures and Lighting will be a part of any wave energy structure, requiring the

8/3/2019 Wave Energy NOAATM92
http://slidepdf.com/reader/full/wave-energy-noaatm92 9/186
vii
industry to consider mitigation measures for devices breaking loose and debris accumulation.Important regulations under several laws (e.g.,the ESA, EFH, MMPA, NEPA, and MBTA)must be closely followed as the industrydevelops. It is important to understand how new
hard surfaces may alter bottom communities, aswell as to synthesize existing data and use it tohelp answer questions about impacts andidentify important environmentally sensitiveareas that can be avoided.
The Acoustics group noted thatunderstanding noise coming from the buoys andcables and how fish and marine mammals willor could react is critical. It is possible to modelnoise from buoys and cables and use thatinformation to assess impacts from various
scales of wave energy facility buildout, but itwas noted that the synchrony of noise from buoys could exacerbate noise or create noise not previously considered. Wave energy facilities,depending on their size and layout, could createa sound barrier that mammals would avoid.Some fish species are especially sensitive toacoustics; this could result in food chain effectssince some species are prey for marinemammals.
Electromagnetic Effects from both induced
and galvanic fields are most likely to affectanimals that use EMF for orientation or feeding.Induced or galvanic fields are most likely toaffect feeding, whereas magnetic fields willlikely have greater effects on orientation.Salmon, crab, sturgeon, and sharks and rays (and
albacore under certain oceanographicconditions) are the species most likely to beaffected. Major areas of uncertainty exist on theeffect of EMF on receptors, so before-and-after baseline assessment of local magnetic fields isneeded. Controlled experiments are difficult and
complex (confounded with other stressors).
The System View/Cumulative Effects groupfocused on issues likely to occur as projectsscale up; risks are a function of the extent,density, and duration of project operation. Inorder to understand effects, impact thresholdsneed to be established. As projects scale up inlocation or implementation, new risk end pointscome into play that were not initially part of theassessment. Other activities can be displaced(e.g., fishing pressure allocated to other areas,
marine mammals altering migration paths, etc.).Therefore, adaptive management is critical toaddress long-term impacts.
Conclusions
There is an urgency to the need for environmental studies of wave energyconversion. Throughout the workshop, theimportance of evaluating ecological effects atany wave energy demonstration study sites or pilot scale facilities was stressed. These
evaluations will help reduce uncertainty of effects for all stressors and all receptor groups,leading to improvements in the best practices for design of devices and arrays and to performancestandards and monitoring requirements that can be applied to commercial-scale development.

8/3/2019 Wave Energy NOAATM92
http://slidepdf.com/reader/full/wave-energy-noaatm92 10/186

8/3/2019 Wave Energy NOAATM92
http://slidepdf.com/reader/full/wave-energy-noaatm92 11/186
ix
Acknowledgments
It took a great deal of work to develop this workshop; it would not have been possible without thesupport of many organizations and individuals. Organization of the workshop was developed by a
Steering Committee consisting of seven individuals: George Boehlert, OSU; Robin Hartmann, OregonShores Conservation Coalition; Maurice Hill, U.S. Minerals Management Service; Justin Klure, OregonWave Energy Trust; Greg McMurray, Oregon DLCD; John Meyer, COMPASS; and Cathy Tortorici, NOAA-NMFS. Amy Windrope, formerly of COMPASS, was involved in the early organization. Wealso thank Keith Kirkendall of NOAA-NMFS for stepping in at the last minute as one of our breakoutgroup facilitators.
For financial support of workshop costs (e.g., logistics, travel, editing and publication), we gratefullyacknowledge the federal agencies (NOAA National Marine Fisheries Service, Minerals ManagementService, Department of Energy’s National Renewable Energy Laboratory), State of Oregon agencies(Department of Land Conservation and Development, Department of State Lands, Department of Energy,Parks and Recreation Department), Oregon State University (Institute for Natural Resources, Hatfield
Marine Science Center), private and public utilities (Portland General Electric, PacifiCorp, CentralLincoln People’s Utility District), Lincoln County, the Communication Partnership for Science and theSea, Oregon Wave Energy Trust, and the Yaquina Bay Economic Foundation.
We thank OSU’s Hatfield Marine Science Center for hosting the workshop; arrangements andlogistics were ably supported there by Ken Hall, Joel Colvin, Dann Cutter, and Shawn Brateng. TheOregon Coast Aquarium hosted the evening event. Peter Vince and the Toledo High School VideoProduction Team did a great job of recording the proceedings of the plenary and keynote presentations.Michele Redmond of Scientific Notations LLC, South Beach, Oregon, edited the proceedings, bringingmany disparate reports to a common and understandable format. Finally, we thank several anonymousreviewers for comments on selected breakout groups, and for review of the entire document, we thank Rod Fujita (Environmental Defense Fund) and Roger Bedard (Electric Power Research Institute).

8/3/2019 Wave Energy NOAATM92
http://slidepdf.com/reader/full/wave-energy-noaatm92 12/186

8/3/2019 Wave Energy NOAATM92
http://slidepdf.com/reader/full/wave-energy-noaatm92 13/186
Introduction and Workshop Objectives
George W. Boehlert,
Oregon State University, Hatfield Marine Science Center
Development of renewable energy resourcesis a major priority in many parts of the world,and some contend that it represents one of mankind’s best hopes of minimizing globalwarming (Krupp and Horn 2008). Wind, solar,and biomass energy are all in various stages of development. Ocean energy is an area of great promise that has yet to be highly developed.Hydrokinetic energy from tidal, current, andwave sources represents immense potential for
electrical energy generation; ocean thermalenergy conversion in tropical regions also holds promise. Marine wind energy in coastal areas isunder active development, particularly inregions where terrestrial wind farms are notappropriate due to lack of wind or lack of usableland area. In this context, development of renewable ocean energy is occurring rapidly, butis not without environmental and social concerns(Pelc and Fujita 2002, EMEC 2005, Cada et al.2007, Weiss et al. 2007). Displacement of other ocean uses and environmental concerns must be
taken into account.Ocean wave energy can provide clean and
renewable power in many parts of the world.The wave climate along the west coast of NorthAmerica represents one of the best prospects for development. In addition to the relativelyconsistent and predictable wave energy produced across the long fetch in the NorthPacific, this region possesses the coastalinfrastructure and the demand for electrical power generation (Bedard et al. 2005).Accordingly, the move to develop wave energyhas been proceeding rapidly. Directedgovernment action has been taken to move thisactivity forward. In Oregon, for example, theestablishment of the Oregon Wave Energy Trust(OWET) highlights the importance of waveenergy resources, and tax benefits for renewableenergy projects (such as the existing BusinessEnergy Tax Credit) add stimulus for
development. Concurrent development of thetechnologies for wave energy extraction isevident in both the private sector and inacademic institutions. Power companies andothers are rapidly establishing claims to regionsof the coastal ocean through applications to theFederal Energy Regulatory Commission(FERC).
Lagging behind the development of
technology and movements to identify thelocation of coastal wave energy facilities,however, has been the assessment of potentialimpacts. Any renewable ocean energy projectwill have associated environmental effects aswell as other costs and benefits (Pelc and Fujita2002, Weiss et al. 2007). More effort is requiredin two broad areas, either of which has the potential to stall or hinder projects in the coastalocean (see, for example, Williams andWhitcomb 2007). First, the socioeconomic andcultural impacts on other ocean users and on
coastal communities are far-reaching. Waveenergy installations have the potential todisplace existing ocean uses, and stakeholdersfrom those user groups must be consulted in a participatory manner as plans for a project aredeveloped. Second, as with any newtechnology, insufficient information on theenvironmental effects of wave energy extractionis available. Little is known about thetechnology, much of which is under development (Callaway 2007; Previsic, thisvolume). Construction processes and site preparation, deployment, operation, power transmission, servicing, decommissioning, andthe physical structures of the wave energydevices and the mooring systems all may havean uncertain level of impact on the marineenvironment. The most comprehensiveexamination of potential environmental effectsto date has been in Scotland (e.g., Wilson andDownie 2003, Faber Maunsell and METOC

8/3/2019 Wave Energy NOAATM92
http://slidepdf.com/reader/full/wave-energy-noaatm92 14/186
2
PLC 2007a). A flow chart (Figure 1) from theScottish Environmental Assessmentdemonstrates the degree of complexity. Similar efforts in the United States have been instituted by the U.S. Minerals Management Service(Michel et al. 2007).
This workshop was designed with a focus onthe Pacific Northwest. A steering committee* was formed to develop the workshop concept,and decided to limit the scope to environmentalissues associated with wave energydevelopment. Socioeconomic questions broadenthe area of discussion and the number of stakeholders who must participate—they arethus deserving of a separate, focused discussion.The committee identified two principal goals for the workshop: 1) to develop an initial
assessment of the potential impacting agents andecological effects of wave energy developmentin the coastal ocean, and 2) to develop a generalframework that can applied to specific waveenergy projects. We also identified thefollowing problem statement:
The conversion of ocean waves into
electricity has the potential to provide
clean, reliable, and low-cost electricity
to the economy while producing minimal
impacts on the environment. However,
in order for wave energy to develop and fulfill these assumptions, we must
reduce the uncertainties about the
technology’s effects on the marine
environment. We must assess the
potential environmental impacts of wave
energy, determine what is known and
unknown, and identify a rigorous set of
scientific studies to address concerns.
This information is needed to support
the permitting process as well as to
* Steering Committee: George Boehlert, OSUHatfield Marine Science Center; Robin Hartmann,Oregon Shores Conservation Coalition; Maurice Hill,U.S. Minerals Management Service; Justin Klure,Oregon Wave Energy Trust; Greg McMurray,Oregon Department of Land Conservation andDevelopment; John Meyer, CommunicationPartnership for Science and the Sea, OSU; CathyTortorici, NOAA-NMFS.
make responsible decisions to site
facilities and to minimize environmental
impacts.
The general framework was laid out in a plenary presentation (see Hill and Piltz, this
volume). The workshop was structured toevaluate a broad range of environmental impactsas they relate to the development and operationof wave energy facilities. Workshop participants were chosen for their technical andecological expertise, as opposed to knowledge of wave energy; this resulted in a diverse group of scientists from academia, government, industry,and nongovernmental organizations (seeAppendix 3). They were provided with background on wave energy in two ways. First,all participants were sent a background paper
explaining the concepts and technologyassociated with wave energy development, and a preliminary assessment of potentialenvironmental and ecological considerations;that paper is included in this volume. Second,the first half-day of the workshop was devotedto plenary presentations on technology, policy,the ecological and physical setting of the coastalocean in the Pacific Northwest, and the contextfor environmental risk analysis (Agenda,Appendix 1).
Specific focus for the workshop wasdeveloped through breakout groups examiningreceptors (elements of the ecosystem potentiallyimpacted by wave energy development) andstressors (changes that wave energy will bringthat may have impacts). These small groupsaddressed specific questions with the intent of examining the risks and uncertainty associatedwith wave energy development, as well as waysto mitigate those risks.
This workshop developed a framework toevaluate the possible environmental andecological impacts of wave energy development.As the product of the workshop, this documentis intended to serve as a starting point for further discussion. The breakout groups have identifiedthe principal issues in their respective areas, butwe acknowledge that a workshop less than twodays in duration cannot comprehensivelyidentify the issues within each specific topic. As

8/3/2019 Wave Energy NOAATM92
http://slidepdf.com/reader/full/wave-energy-noaatm92 15/186
3
we move forward with the development of sustainable, renewable energy in the coastalocean, we hope that this document can serve as a basis for evaluating projects along our coast.
Literature Cited
Bedard, R., G. Hagerman, M. Previsic, O. Siddiqui,R. Thresher, and B. Ram. 2005. Offshore wave
power feasibility demonstration project: Finalsummary report, project definition study, EPRIGlobal WP 009– US Rev 1, Jan. 14, 2005.Electrical Power Research Institute, Palo Alto,CA.
Cada, G., J. Ahlgrimm, M. Bahleda, T. Bigford, S. D.Stavrakas, D. Hall, R. Moursund, and M. Sale.2007. Potential impacts of hydrokinetic andwave energy conversion technologies on aquatic
environments. Fisheries 32:174–181.Callaway, E. 2007. To catch a wave. Nature
450:156–159.
EMEC. 2005. Environmental impact assessment(EIA) guidance for developers at the EuropeanMarine Energy Centre. European Marine EnergyCentre, Ltd., Orkney, Scotland. Online athttp://www.emec.org.uk/emec_documents.asp[accessed 23 August 2008].
Faber Maunsell and METOC PLC. 2007a. Scottishmarine renewables strategic environmental
assessment report. Prepared for the ScottishExecutive by Faber Maunsell and METOC PLC.Online at http://www.seaenergyscotland.co.uk/[accessed 7 May 2008].
Faber Maunsell and METOC PLC. 2007b.Informing the future development of marinerenewable energy. Environmental report sectionE: Scottish marine renewables strategic
environmental assessment report. Prepared for the Scottish Executive by Faber Maunsell andMETOC PLC. Online at http://www.seaenergyscotland.co.uk/ [accessed 7 May2008].
Pelc, R., and R. Fujita. 2002. Renewable energy
from the ocean. Mar. Pol. 26:471–479.
Krupp, F., and M. Horn. 2008. Earth: The sequel:The race to reinvent energy and stop globalwarming. Norton and Company, New York.
Michel, J., H. Dunagan, C. Boring, E. Healy, W.Evans, J. M. Dean, A. McGillis, and J. Hain.2007. Worldwide synthesis and analysis of existing information regarding environmentaleffects of alternative energy uses on the outer continental shelf. MMS OCS Report 2007-038.U.S. Dept. of the Interior, Minerals Management
Service, Herndon, VA.Weiss, J. C., B. B. Boehlert, and R. E. Unsworth.
2007. Assessing the costs and benefits of electricity generation using alternative energyresources on the outer continental shelf. OCSStudy MMS 2007-013. U.S. Dept. of theInterior, Minerals Management Service,Offshore Environmental Division, Herndon, VA.
Williams, W., and R. Whitcomb. 2007. Cape Wind:Money, celebrity, class, politics, and the battlefor our energy future on Nantucket Sound.Perseus Books, Cambridge, MA.
Wilson, S., and A. J. Downie. 2003. A review of possible marine renewable energy development projects and their natural heritage impacts from aScottish perspective. Scottish Natural HeritageCommissioned Report F02AA414.

8/3/2019 Wave Energy NOAATM92
http://slidepdf.com/reader/full/wave-energy-noaatm92 16/186
4
Figure 1. Factors that must be considered in the development of wave energy. From Faber Maunsell and
METOC PLC (2007b).

8/3/2019 Wave Energy NOAATM92
http://slidepdf.com/reader/full/wave-energy-noaatm92 17/186
5
Presentations—Extended Abstracts
Wave Energy Interest in the Oregon Coast: Policy and Economic
Considerations
Justin Klure, Oregon Wave Energy Trust
There is a need to develop new forms of energy to meet worldwide demand for electricity, which the Energy InformationAdministration estimates will increaseapproximately two percent each year.Investments in renewable energy, includingwave energy, can create new jobs and economic
development while producing no carbon dioxideemissions. The United States currently relies onfossil energy (coal, oil, and natural gas) tosupply over 87% of its energy needs. Fossilresources are finite and are currently facingglobal supply constraints. Oregonians spent $10 billion on energy in 2006. The northwesternregion of the United States generatesapproximately 45% of its energy fromhydroelectric facilities in rivers. However, asignificant amount of this energy is sold intoother regions of the United States andcompensated by electricity produced from coalto meet the Northwest demand.
The Oregon Wave Energy Trust (OWET) isa newly formed not-for-profit organizationdesigned to help guide the development of waveenergy in Oregon. The mission of OWET is to build and share the expertise needed toaccelerate the development of the wave energyindustry in a responsible manner. Goals of theorganization include developing safe, reliable,renewable energy; promoting the industry andcreating new jobs; ensuring responsible
development; diversifying Oregon’s technology;and leveraging Oregon’s investment. OWET issponsored by the Oregon CommunityDevelopment Fund and guided by the OregonInnovation Council.
The Energy Information Administrationestimates national energy demand to be 4,200terawatt hours per year (TWh/yr) by the year
2010. The Electric Power Research Instituteestimates the amount of wave energy potentialalong the U.S. West Coast to be 440 TWh/yr,representing approximately 10% of U.S energydemands in the year 2010.
Currently over 1,000 patents have been filedfor the multiple technologies capable of harnessing energy from the ocean waves. Waveenergy technologies can be categorized into four main areas: point absorbers, oscillating water columns, attenuators, and overtopping devices.A point absorber utilizes the heaving motion (upand down) of the ocean wave to produceelectricity. The oscillating water column takesadvantage of the pressure variance of the oceanwave as it moves in and out of the device. Theovertopping device takes advantage of the waveas it crests over the device and then is gravity-fed into a turbine. The attenuator utilizes boththe up-and-down and side-to-side motions as itinteracts with the ocean wave to generateelectricity.
The ocean is the largest, most concentratedsource of renewable energy on Earth. Waveenergy is a form of solar energy. Water isextremely dense when compared to air, andtherefore contains more energy. Wave energyhas many advantages including but not limitedto availability (stable resource), predictability,close proximity to electrical load centers,
transmission grid firming, low visual impact, nofuel input or price volatility, and no carbondioxide emissions. Ocean energy has the potential to provide a significant amount of theUnited States’ electricity needs.
Significant challenges exist to thedevelopment of wave energy in Oregon.Education and outreach to local coastal

8/3/2019 Wave Energy NOAATM92
http://slidepdf.com/reader/full/wave-energy-noaatm92 18/186
6
communities are critical for the development of the industry. Local communities must beengaged in the process of siting ocean wave projects. The cost of converting the oceanwaves into electricity is more expensive thanconventional resources, and the optimal
technology for conversion of energy intoelectricity has yet to be identified. There is asignificant lack of environmental data for theOregon coast and the interaction of wave energyfacilities with the ocean ecosystem is unknown.The territorial sea and waters beyond are heavilyutilized for fishing, recreation, and other activities. Wave energy projects must becompatible with other ocean uses. Theregulatory framework for wave energy projectsrelies on existing state and federal hydroelectriclaws designed for dams in rivers, and does not
apply to the issues of siting a wave energy project. An Oregon-coast-wide comprehensive plan is needed that will incorporate past, present,and future uses of the ocean resource.
The most significant Oregon policy driver for the development of renewable energy is theRenewable Portfolio Standard (RPS) established by the 2007 Oregon State Legislature. The RPSrequires that investor-owned utilities mustgenerate 25% of their electricity supplies fromrenewable energy resources by the year 2025.
The State of Oregon also administers tax creditsand energy loans that support renewable energy
development. In addition, utility policyconsiderations are being discussed at BonnevillePower Administration regarding public power contracts and transmission issues. The OceanPolicy Advisory Council (appointed by theGovernor) is responsible for developing ocean
policy for Oregon’s ocean resource.
Seven wave energy projects are currently proposed in Oregon. The Federal EnergyRegulatory Commission (FERC) has jurisdictionfor licensing hydrokinetic energy projects. TheFERC licensing process is extensive andrequires public outreach and a robustenvironmental study and monitoring plan prior to the awarding of a hydroelectric license.
The wave energy industry is commonly
compared to the wind industry of 15–20 yearsago. The wind industry currently represents a$60 billion (and growing) market, and is nowcost-competitive with other conventional energyresources. Wave energy development in Oregonhas the potential to create new jobs and other forms of economic development. Oregon hasthe potential to lead the development of thewave energy industry in the United States.However, the burden of proof remains on theindustry to create new jobs, deliver clean energyto consumers, and exist and operate in harmony
with the natural environment and existing oceanusers.

8/3/2019 Wave Energy NOAATM92
http://slidepdf.com/reader/full/wave-energy-noaatm92 19/186
7
The Oregon Shelf/California Current System’s Ecological Setting
Bill Peterson, NOAA-NMFS, NWFSC
Upwelling and Productivity
The purpose of this presentation is to broadly set the stage of the ecological settingand the major processes in the coastal ocean off the Pacific Northwest. The marine andanadromous resources along the west coast of the United States occupy diverse habitats in thecoastal ocean off Washington, Oregon, andCalifornia—a biogeographic region that iscollectively termed the Coastal UpwellingDomain (Ware and McFarlane 1989). Withinthis domain, several smaller-in-scale physicalzones are recognized:
1. A nearshore zone where mysids, juvenile fall Chinook salmon(Oncorhynchus tshawytscha), sand lance( Ammodytes hexapterus), smelts,Dungeness crabs (Cancer magister ), andgray whales ( Eschrichtius robustus )reside, and which includes sand, rockyshore, and intertidal habitats. Smallestuaries and river mouths also play arole in this zone.
2. The middle and outer continental shelf where juvenile and adult coho(Oncorhychus kisutch) and Chinook salmon reside along with abundant krilland seasonally changing fish and plankton communities.
3. The upper 10–20 m of the water columnacross the continental shelf and slopewhere many of the pelagic fishes,including juvenile coho and Chinook,reside.
4. The benthic and demersal habitats wherevarious fishery resources reside,including the continental shelf (Dungeness crabs , English sole[Parophrys vetulus]), the shelf break (whiting, rockfish), and beyond the shelf break to depths of 1,500 m (sablefish
[ Anoplopoma fimbria], Dover sole[ Microstomus pacificus], andthornyheads [Sebastolobus spp.]).
Each of these physical zones has uniquecirculation patterns that affect spawning andlarval transport, and each is subject to differenttypes of physical forcing that lead to species-specific variations in growth, survival, andrecruitment. Moreover, since many of thespecies have pelagic larval and/or juvenilestages, broad-scale variations in ocean productivity (that affect the feeding environment
of larval and juvenile fish) and variations inlarge-scale ocean circulation (that affecttransport of eggs and larvae) can both affectrecruitment.
The very nearshore zone is strongly affected by alongshore currents, sediment transport, waveenergy, and tides. From a system productionstandpoint, the physical process that is probablymost important to plants and animals residing incontinental shelf waters is coastal upwelling. Akey fact related to the upwelling process is that
the water that upwells only reaches the seasurface within the first few miles of the beach.Thus when upwelling is strong, temperatures arevery cold on the beach and in surface waters outto about 5 miles (8 kilometers) from shore,dipping as low as 46°F (7.8°C) when the windsare strong. The upwelled water is rich innutrients required for growth of microscopic planktonic plants (phytoplankton) and as a result phytoplankton biomass is highest closest toshore (Figure 1). These plants fuel a productivefood chain, resulting in high abundances of
copepods (the next step in the food chain above phytoplankton) in this nearshore zone (Figure 2).Large jellyfish are abundant and conspicuous inthis nearshore zone, particularly in mid to latesummer. Abundances of copepods are also highfarther to sea, out to water depths of at least100 m (50 fathoms). It is in this region theeuphausiids (krill) start to become abundant.

8/3/2019 Wave Energy NOAATM92
http://slidepdf.com/reader/full/wave-energy-noaatm92 20/186
8
June
Water Depth (m)
0 100 200 300 400 500 600
0
20
40
60
110May
0 100 200 300 400 500 600
C h l o r o p h y l l a
( µ g L - 1 )
0
5
10
15
20September
0 100 200 300 400 500 600
0
10
20
30
40
Chlorophyll (an index of phytoplankton biomass)
May
0 50 100 150 200
C h l o r o p h y l l
a
( µ g L - 1 )
0
5
10
15
20June
Water Depth (m)
0 50 100 150 200
0
20
40
60
110September
0 50 100 150 200
0
10
20
30
40
Figure 1. Phytoplankton biomass as indexed by chlorophyll-a concentration, measured at stations from the
nearshore zone out to beyond the continental shelf. The lower panel shows data from the continental
shelf only, so as to see the cross-shelf distributions in greater detail.
Copepod Biomass
Water Depth (m)
0 200 400 600 800 1000 1200
C
o p e p o d B i o m a s s ( m g m - 3 )
0
10
20
30
40
50
60
70
June
September
Neg exp model
Water Depth (m)
0 50 100 150 200
C o p e p o d B i o m a s s ( m g m - 3 )
0
10
20
30
40
50
60
70
Figure 2. Copepod biomass measured at stations from the nearshore zone out to water depths of 1,200 m in
June and September during salmon sampling cruises at stations from Newport, Oregon, north to La
Push, Washington (see Figure 3). The panel on the right shows only the continental shelf stations so as to
highlight the cross-shelf distributions.

8/3/2019 Wave Energy NOAATM92
http://slidepdf.com/reader/full/wave-energy-noaatm92 21/186
9
Beyond that point in an offshore direction,copepod biomass begins to decline quickly, butkrill biomass increases. Krill seem to have their maximum biomass offshore at the shelf break and beyond, in water depths of 200 to 800 m.
Furthermore, the high biomass and rates of production by plankton in the inner-to-middlecontinental shelf zone, from the beach out toabout 100 m, fuel a productive food chain thatsupports high numbers of baitfish such asherring, anchovy and smelt (Figure 3). Thesefishes are in turn fed upon by salmon andseabirds such as murres, shearwaters,cormorants, and pelicans. Also, a large proportion of the production by plankton sinksto the sea floor where it is consumed by mysids,amphipods, and small clams; these in turn
support gray whales and vast quantities of Dungeness crabs. Close to shore, the poundingsurf chops up seaweeds into bits and pieces that become detritus upon which mysids andamphipods also feed. This process further contributes to high productivity within the firstfew miles of the shores.
Long-term Variability in Upwelling and
Plankton Production
Variability in productivity of the California
Current occurs at interannual and decadal timescales, due to variations in the strength of theatmospheric pressure fields. These variationsmust be taken into account when consideringupwelling-induced productivity. Years of weak upwelling result in lower salmon production.When upwelling is weak, however, offshoreoceanic waters move onshore, and with thiswarm water come albacore tuna (Thunnus
alalunga) that can be easily exploited. It hasnow been well established that the entire NorthPacific experiences dramatic climate shifts
caused by eastward-westward jumps in thelocation of the Aleutian Low in winter (and the North Pacific High in summer) that result inchanges in wind strength and direction.Changes in large-scale wind patterns lead toalternate states of either “a warm ocean climateregime” or “cold water regime,” with a warmocean less productive than a cold ocean.Recently the northern California Current has
oscillated between warm and cold states everyfour years (cold regime from 1999–2002; warmfrom 2003–2006; cold from 2007–?). One mustkeep these longer term states in mind whenconsidering harvest levels of marine fishes, andof course when evaluating the impacts of man-
made structures such as wave energy buoys. For example, if the cause of some “negativeecosystem impact” is thought to be a cluster of wave energy buoys, one would want to makecertain that the impact was not due to the ocean being in a warm and unproductive regime. Thisof course argues for the need to include oceanmonitoring sites near a cluster of buoys as wellas at control sites far away from the buoys.
El Niño events also disrupt coastal marineecosystems and as with the alternating cold and
warm regimes, one must be attentive to theoccurrence of El Niño when evaluating potentialimpacts of clusters of wave energy buoys. Sincethe early 1980s, the California Current has beenexperiencing an increased frequency of El Niñoevents, with large El Niño events occurringevery 5–6 years: 1976–1977, 1982–1983, 1986– 1987, 1991–1992, 1997–1998, and again in2002–2004. A higher frequency of El Niñoevents appears to be a characteristic of theextended periods of warm ocean conditions.Prior to 1982, El Niño events seldom reached as
far north as Oregon. However the events of 1982–1983, 1986–1997, and the extended periodof El Niño-like conditions from 1992–1998clearly led to the demise of coho and Chinook stocks in coastal waters.
Climate change is another variable that must be accounted for, especially in light of the recentIPCC Climate Assessment Report. Climatemodels project the 21st century will featuregreater annual precipitation in the Pacific Northwest, extreme winter precipitation events
in California, and a more rapid spring meltleading to a shorter, more intense spring periodof river flow and freshwater discharge. This willgreatly alter coastal stratification and mixing,riverine plume formation and evolution, and thetiming of transport of anadromous populationsto and from the ocean. Current allocation of western U.S. water resources between salmonand human requirements has been a critical

8/3/2019 Wave Energy NOAATM92
http://slidepdf.com/reader/full/wave-energy-noaatm92 22/186
10
Pacific sardine
0-10 0-20 20-30 30-40 0-50 0-600
500
1000
1500
2000
2500
Distance from shore (km)
N u m b e r ( 1 0
6 m
3 ) - 1
Northern anchovy
-10 0-20 0-30 30-40 0-50 0-600
2500
5000
7500
Distance from shore (km)
N u m b e r ( 1 0
6 m
3 ) - 1
Pacific herring
-10 0-20 0-30 30-40 0-50 0-600
1000
2000
3000
4000
5000
Distance from shore (km)
N u m b e r ( 1 0 6 m
3 ) - 1
Whitebait smelt
-10 0-20 0-30 30-40 0-50 0-600
3000
6000
9000
12000
Distance from shore (km)
N u m b e r ( 1 0 6 m
3 ) - 1
199819992000
20022001
2003
Figure 3. Cross-shelf distribution of baitfish measured in waters off the Columbia River and Willapa Bay
(see Figure 4) by Dr. Bob Emmett, NOAA-NMFS, NWFSC, Hatfield Marine Science Center. Each of
these baitfish can be most abundant very close to shore; smelt and anchovies are particularly abundant
within 10–20 km of shore.
factor in the success of many salmon populations, and will be more so if future water availability is altered.
Some global climate models predict thatglobal warming will lead to a higher frequency
of El Niño events, while others predict theintensity of these events will be stronger. Ineither event, primary and secondary productionwill be greatly reduced in the California Currentecosystem, with negative effects transmitted upthe food chain. The potential for differences incoastal upwelling in a warmer world is still being debated. Some argue that upwelling may become stronger because of greater contrasts
between warming of the land (resulting in lower atmospheric pressure over the continent) relativeto ocean warming. The greater cross-shelf pressure gradient will result in higher alongshorewind speeds and the potential for moreupwelling (Bakun 1990). One regional climate
model projects that upwelling-favorable windswill be stronger in summer, but that the peak inseasonal upwelling will occur later in thesummer (Snyder et al. 2003). If upwelling isdelayed, the annual cycle of production will shiftto later in the year, thus animals that rely upon adependable seasonal cycle of production for their reproduction will have to make adjustments

8/3/2019 Wave Energy NOAATM92
http://slidepdf.com/reader/full/wave-energy-noaatm92 23/186
11
Figure 4. Location of Newport Line (at lat
44°40′N). Since 1996 the inner portion, to 25
miles from shore, has been sampled biweekly
for hydrography and zooplankton. Since
1998, hydrography-zooplankton-salmon
surveys have been conducted along eight
transects from Newport north to LaPush, inMay, June, and September. Transects from
Newport south to Crescent City were sampled
for hydrography and zooplankton from 1998
to 2003, and are now sampled 1–3 times per
year.
in the timing of their spawning or reproductivecycles.
Finally, generally warmer ocean conditionswill cause a northward shift in the distribution of most species, and possibly the creation of reproductive populations in new regions.Existing faunal boundaries are likely to remainas strong boundaries, but their resiliency toshifts in ocean conditions due to global climatechange is not known.
Transport
Despite the existence of high plankton biomass and productivity, coastal upwellingenvironments present unique problems to fishand invertebrate populations who must complete
their life cycles there. This is because theupwelling process transports surface waters andthe associated pelagic larvae and juvenile lifestages away from the coast and towards thesouth, and away from productive habitats.Typical transport rates of surface waters are1 km per day in an offshore direction and 20– 30 km per day southward. Zooplankton andlarval and juvenile fishes that live in the food-rich surface layers (i.e., the upper 15 m of thewater column) can be transported rapidlyoffshore, out of the upwelling zone, and into
relatively oligotrophic waters. Bakun (1996)argues that for any animal to be successful insuch environments, the adults must locatehabitats that are characterized by enrichment,with some mechanism for concentrating food for larvae, and that offer a way for larvae to beretained within the system.
Perhaps because of problems related totransport and loss, many species do not spawnduring the upwelling season. They either spawnduring winter months before the onset of
upwelling (Dover sole, sablefish, Dungenesscrabs, and pink shrimp); perform an extendedspawning migration and spawn in regions wherethere is no upwelling (hake); spawn in restricted parts of an upwelling system where advectivelosses are minimized, such as in bays or estuaries (English sole); spawn in rivers(salmonids and eulachon smelt [Thaleichthys
pacificus]); or bypass the egg and larval stageand give birth to live precocious “juvenile”individuals (most rockfish). Hake, for example,undertake an extended spawning migration
during which the adults swim south to spawn inthe South California Bight in autumn and winter,outside of the upwelling region and season. Themigration is from as far north as Vancouver Island (about lat 49º N) to southern California(lat 35º N), a distance of several thousandkilometers. The return migration of adults andthe northward drift of larvae and juveniles takes

8/3/2019 Wave Energy NOAATM92
http://slidepdf.com/reader/full/wave-energy-noaatm92 24/186
12
place at depth where fish take advantage of the poleward undercurrent.
Ongoing Monitoring of Coastal Waters
off Oregon
The nearshore and intertidal environment inwaters off the central Oregon coast has beenmonitored for several years by the PISCO(Partnership for Interdisciplinary Science in theCoastal Ocean) program (see http://www.piscoweb.org/what/campuses/osu). This program, added to a variety of other, but lesssystematic studies, could provide valuablereference points for evaluation and monitoringof new wave energy facilities. In the pelagicenvironment, a joint OSU-NOAA research program led by members of the Fish Ecology
Division of the Northwest Fisheries ScienceCenter is monitoring seasonal to interannualvariations in ocean conditions in coastal watersof the Pacific Northwest. This program hasresulted in a solid fundamental understanding of the ecology of hydrography, zooplankton, and pelagic fishes; and provides a baseline set of measurements of ocean conditions that can beused to evaluate impacts of a large cluster of wave energy buoys.
Two parts of the program are germane.
First, monitoring off Newport, Oregon(Figure 4), has included oceanographic cruisesthat have sampled hydrography and zooplanktonevery two weeks since 1996. We began thethirteenth year of these efforts in January 2008.Seven stations are sampled across thecontinental shelf, from 1 mile (1.6 km) fromshore (water depth 20 m) to 25 miles (40.2 km)from shore (300 m water depth). Measurementsat each station include vertical profiles of temperature, salinity, fluorescence, and oxygen;water transparency with a Secchi disc; and
plankton net tows for zooplankton, euphausiids,and fish eggs and larvae. In addition to the biweekly cruises off Newport, sampling of hydrography and zooplankton took place alongthe Newport transect to 85 miles (137 km) fromshore and along the Heceta Head, Coos Bay,Rogue River, and Crescent City, California,transects (Figure 4) five times per year from
1998 to 2003. We continue to sample thesetransects, but only one to three times per year.
A second research effort involves sampling juvenile salmonids along eight transects from Newport, Oregon, north to La Push, Washington
(Figure 4), in May, June, and September. This program was initiated in 1998 and will continueinto the future. Sampling at each station issimilar to the Newport time series and includeswater column profiles of temperature, salinity,fluorescence, oxygen, and transparency; and plankton tows for zooplankton, fish eggs andlarvae, and macrozooplankton.. In addition, pelagic fish (including salmon) are sampled witha large rope trawl, 20 m high by 30 m wide by200 m long. The height of the net is equivalentto a five-story building. This sampling effort is
augmented by a time series of sampling alongtwo transects (Columbia River and Willapa Bay,Figure 3) from late April through August, inwhich all of the above measurements are made.This generates a time series of difference inabundance of zooplankton, small pelagic fish(including salmon), and piscine predators of juvenile salmon (mackerels and hake). Thework is done at night to better sample the larger adult predatory fishes.
Because of these long-term studies we have
a very good understanding of the localhydrography and the ecology of zooplankton,small pelagic fishes, juvenile salmonids, and predatory fishes. Moreover, we have a goodunderstanding of seasonal and interannualvariability, important if we are to evaluate thelong-term impacts of wave energy facilities.
The nearshore zone is a “hot spot” for biological activity up and down the coast;however little is known about feeding, growth,reproduction, or mortality rates of any of thenearshore species due to difficulty in samplingso close to shore. Of particular interest andconcern are the fall Chinook salmon becausethey live very close to shore as juveniles, fromthe surf zone out to distances of a fewkilometers. Other key species include mysids,Dungeness crabs, gray whales, and nearshoreseabirds such as murres and cormorants.

8/3/2019 Wave Energy NOAATM92
http://slidepdf.com/reader/full/wave-energy-noaatm92 25/186
13
What Kinds of Monitoring may be
Necessary for Wave Energy Facilities?
Zooplankton— Measurements of hydrography; and the distribution and abundanceof zooplankton (emphasis on euphausiids and
mysids, and on the seasonal cycle of occurrenceof larvae of benthic invertebrates that will settleon the buoy and cause fouling), fish eggs andlarvae, and small pelagic fishes (emphasis on juvenile salmonids) made at and near thelocations of wave energy complexes are neededso as to compare to baselines for Newport andwaters to the north.
Oxygen —Oxygen measurements are alsocritical. Low oxygen has come to be identifiedas a problem in shelf waters (Chan et al. 2008)
from Newport north to Grays Harbor,Washington. We need to determine if regions tothe south of Newport, such as that off theReedsport area, are also subject to low oxygenconditions (and hypoxia) before any waveenergy facility becomes operational. This isneeded so that we can determine if the cleaningof fouling organisms from the buoys andmooring lines results in rapid deposition of massive quantities of organic debris to the seafloor, and subsequently results in low oxygenconditions. That is, if fish kills are observed in
the vicinity of the wave energy facility, are theydue to low oxygen and hypoxia caused by theincreased load of organic matter falling to thesea floor because of the wave buoys, or is lowoxygen a general problem all along the coast? If there are fish kills, we will need to know if thewave energy facilities caused them, or if lowoxygen in general caused them.
New research —Emphasis should be placedon new research directed at the ecology of thenearshore region, especially on fall Chinook
salmon, mysids, euphausiids, the small baitfishthat inhabit the nearshore zone, and seabirds.We define the nearshore region as extendingfrom the surf zone out to water depths of approximately 100 m (8–16 km from shore).The very nearshore zone (within a kilometer or two of the beach) is the habitat of the fallChinook during their first year at sea, and of thespring Chinook during their first few months at
sea. The inshore part of this zone is among theleast-studied regions of the coast, primarily because large research vessels do not usuallywork closer to shore than the 25-m isobath.
Long-term monitoring —The overall goal
of the baseline observations is to developmetrics that could capture any changes caused by a wave energy project. Because oceanconditions change greatly from year to year,long-term monitoring will be needed. Becauselong time-series of past ocean and ecologicalconditions are available from Newport, we canuse this knowledge to assess differences thatmay be caused by a wave energy complex.
Special studies —Apart from the studiesdiscussed above, special studies will be required:
• Vertical flux of organic matter—Weshould measure the rate at whichorganic matter is deposited on the seafloor within a wave energy complex.This would involve launching sedimenttraps during oceanographic cruises. Weneed to establish “normal” flux toevaluate the potential for the excessorganic debris sloughing from buoysand mooring lines, events that couldcause hypoxic or anoxic conditions in
and near the wave energy complexes.• Wave energy facilities as fish attraction
devices—Video and diver surveys will be needed, perhaps as frequently asmonthly, once the first wave energy buoys are launched.
• Wave energy facilities and Dungenesscrabs—The Dungeness crab fishery isamong Oregon’s most lucrative, thusstudy of the impact of the facilities onthese crabs is essential.
• Fish tagging studies—It would be beneficial to determine residence time of fishes in the vicinity of a wave energycomplex. Tagging studies would revealif fishes chose to remain near the buoys,and/or if the facilities disrupt normalmigration patterns, e.g, of salmonids.

8/3/2019 Wave Energy NOAATM92
http://slidepdf.com/reader/full/wave-energy-noaatm92 26/186
14
Literature Cited
Bakun, A. 1990. Global climate change andintensification of coastal ocean upwelling.Science 247:198–201.
Bakun, A. 1996. Patterns in the Ocean: Ocean processes and marine population dynamics.California Sea Grant College System, NOAAand Centro de Investigaciones Biological del
Noroests, La Paz, BCS, Mexico.
Chan, F., J. A. Barth, J. Lubchenco, A. Kirincich, H.Weeks, W. T. Peterson, and B. A. Menge. 2008.Emergence of anoxia in the California currentlarge marine ecosystem. Science 319:320.
Snyder, M. A., L. C. Sloan, N. S. Diffenbaugh, andJ. L. Bell. 2003. Future climate change andupwelling in the California Current. Geophys.Res. Lett. 30(15):1823. Online at http://dx.doi.org/ [DOI number 10.1029/2003GL017647,accessed 20 August 2008].
Ware, D. M., and G. A. McFarlane. 1989. Fisheries production domains in the northeast PacificOcean. In R.J. Beamish and G.A. McFarlane(eds.), Effects of ocean variability on recruitmentand an evaluation of parameters used in stock assessment models. Can. Spec. Publ. Fish.Aquat. Sci. 108:359–379.

8/3/2019 Wave Energy NOAATM92
http://slidepdf.com/reader/full/wave-energy-noaatm92 27/186
15
The Technology: Wave Energy Development on the West Coast
Mirko Previsic, re vision consulting, LLC
Introduction
The total electricity generation potentialalong the U.S. West Coast (California, Oregonand Washington) is significant. The annualaverage energy meeting these shorelines isgreater than 440 TWh per year. The upper limitthat is extractable economically is estimated atabout 15%, which results in an electricitygeneration potential of more than 66 TWh per year. To put this number into perspective,Oregon’s electricity consumption in 2006 wasabout 53 TWh.
In 2004, the Electric Power ResearchInstitute (EPRI) performed an offshore waveenergy conversion (WEC) feasibility definitionstudy examining five locations and two WECtechnologies. Design, performance, cost, andeconomic assessments have been made for sitesin Hawaii, Oregon, California, Massachusetts,and Maine for both demonstration-scale andcommercial-scale power plants. These studiesshowed that the Oregon coast has an excellentwave energy resource and good infrastructure
(grid interconnection and port infrastructure) in place to take advantage of this resource.
The advantages of ocean energy arenumerous, including providing clean andrenewable energy with the associated benefit of displacing pollution-generating alternatives;easing transmission constraints with minimal, if any, aesthetic concerns; reducing dependence onimported energy supplies and increasing nationalenergy security; reducing the risk of futurefossil-fuel price volatility; and stimulating local
job creation and economic development.
The Wave Energy Resource
Ocean waves are generated under theinfluence of wind on the ocean surface. Once
ripples are created on the surface, there is a steepside available against which the wind can pushand waves begin to grow. In deep water, wavescan travel for thousands of miles without losingmuch power until their energy is dissipated on adistant shore. Representing an integration of allthe winds on an ocean surface, ocean wavesrepresent a consistent energy resource that hasless variability than wind, and sea states can be predicted accurately more than 48 hours inadvance using computational models.
Ocean waves are an oscillatory system in
which water particles travel in orbits (Figure 1).As the water depth decreases, the oscillation becomes smaller. Close to shore, in shallowwater, the ocean waves lose energy because of the friction of water particles on the ocean floor.
Short-term, wave-to-wave variability issignificant (Figure 2); waves vary considerablyin height, period and direction. However,average power levels remain relatively constantover periods of hours; typically wave groupingoccurs with repeating patterns having a
timeframe of a few minutes. Over a period of afew hours, they comprise a sea state that can bedescribed by a directional spectrum. In order todescribe such sea states and to determine their characteristics relevant to wave energyutilization, statistical parameters derived fromthe wave energy spectrum must be used. Seastates are often summarized in terms of waveheight, period, and direction parameters. Thevariation in sea states during a period of time(e.g., month, season, year) can be represented bya scatter diagram (Figure 3), which indicates
how often a sea state with a particular combination of the significant wave height (Hs)and energy period (Te) occurs.

8/3/2019 Wave Energy NOAATM92
http://slidepdf.com/reader/full/wave-energy-noaatm92 28/186
16
Figure 1. Water particle orbits of an ocean wave.
Figure 2. Short-term variability of ocean waves.
Figure 3. Typical scatter diagram.
In deep water (i.e., when the wavelength issmaller than twice the water depth), the power level (P) in each sea state can be computed by
P = 0.49 Hs2 Te = 0.412 Hs
2 T p
If Hs is expressed in meters and T p in seconds, Pis given in kW/m. The average wave power level Pave during a period of time can bedetermined from a scatter diagramcorresponding to the same time period by
Pave = ΣPi Wi / ΣWi
where Wi is the number of times that sea stateswith power levels Pi occur. Due to the strongseasonal and interannual variability of oceanwaves, assessment of wave energy resourcesshould be based on a long time-series of wavedata.
In the deep waters of the open ocean, thewave energy resource is consistent over distances on the order of a few hundredkilometers. This applies to large ocean basins,such as the Pacific Ocean. As waves approachthe shore through waters of decreasing depth,waves are modified by a number of phenomenasuch as refraction and diffraction. As a result,the wave energy resource can vary significantlyover distances of 1 km or much less in shallowwaters, depending on the local bathymetry. Theenergy level close to shore is usually
8/3/2019 Wave Energy NOAATM92
http://slidepdf.com/reader/full/wave-energy-noaatm92 29/186
17
significantly lower than offshore due to bottomfriction. In addition, wave crests tend to become parallel to the shoreline in shallow waters. Thelocal influence of the bathymetry can also have afocusing effect on ocean waves, resulting inlocal “hot-spots” that are favorable for nearshore
or shore-based wave power conversion.
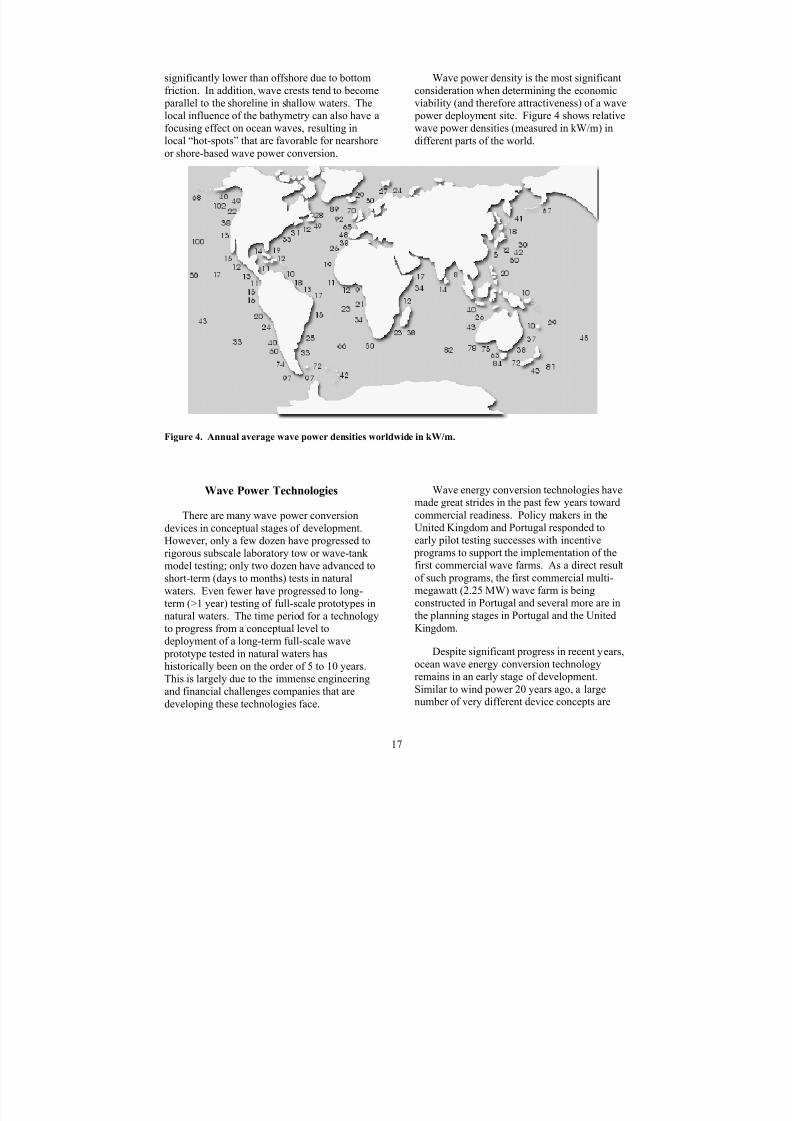
Wave power density is the most significantconsideration when determining the economicviability (and therefore attractiveness) of a wave power deployment site. Figure 4 shows relativewave power densities (measured in kW/m) indifferent parts of the world.
Figure 4. Annual average wave power densities worldwide in kW/m.
Wave Power Technologies
There are many wave power conversiondevices in conceptual stages of development.However, only a few dozen have progressed torigorous subscale laboratory tow or wave-tank model testing; only two dozen have advanced toshort-term (days to months) tests in naturalwaters. Even fewer have progressed to long-
term (>1 year) testing of full-scale prototypes innatural waters. The time period for a technologyto progress from a conceptual level todeployment of a long-term full-scale wave prototype tested in natural waters hashistorically been on the order of 5 to 10 years.This is largely due to the immense engineeringand financial challenges companies that aredeveloping these technologies face.
Wave energy conversion technologies havemade great strides in the past few years towardcommercial readiness. Policy makers in theUnited Kingdom and Portugal responded toearly pilot testing successes with incentive programs to support the implementation of thefirst commercial wave farms. As a direct resultof such programs, the first commercial multi-megawatt (2.25 MW) wave farm is being
constructed in Portugal and several more are inthe planning stages in Portugal and the UnitedKingdom.
Despite significant progress in recent years,ocean wave energy conversion technologyremains in an early stage of development.Similar to wind power 20 years ago, a largenumber of very different device concepts are
8/3/2019 Wave Energy NOAATM92
http://slidepdf.com/reader/full/wave-energy-noaatm92 30/186
18
being pursued at various scales by differentdevelopers and there is no consensus as to whichtechnology is superior. This is typical for emerging industries and it will take full-scale in-ocean testing for industry to optimize their technology and find ways to drive down cost.
Economic projections indicate that oceanwave energy can become cost-competitive withother forms of energy generation in Oregon inthe long term if appropriate policies are createdto support early adoption of technologies. Aswith any renewable technology, the economicsof wave power generation schemes are sensitiveto energy levels at the deployment site and as aresult the choice of appropriate site is critical.Although Scotland and Ireland, where most of these technologies are being developed, feature
higher wave power densities offshore (50–60kW/m) than Oregon, the wave energy climate inOregon can be considered good from a wavefarm developer’s point of view (20–40 kW/m).
As with any power generation technology,cost of energy from early systems is high and issubsequently reduced as the installed capacity base grows. Learning curves in the windindustry indicate progress ratios of 82%. If thesame progress ratios hold true for wave energy,it can be expected that the economic
performance of wave energy systems would beon par with that of wind energy in the long term.
Pilot wave farms will likely start with a fewunits and installed capacities of less than10 MW. This is required to reduce technicaluncertainties and proof the technologies andassociated cost profiles (i.e., operation andmaintenance, and capital cost). Small-scaleinitial adoption is also required to properlydemonstrate and measure environmental impactsof these technologies. Grid interconnection andother infrastructure expenses are often fixedexpenses that impact the cost of electricity of small developments more prominently thanlarger scale adoptions. In addition, the smallscale results in higher manufacturing cost andthe higher risk perceived by investors willrequire a shorter payback period than for large-scale projects. All the above issues compoundand result in a significantly higher cost of
electricity for the first commercial installations.These early stage wave farms are, however, avery important learning tool from a commercialas well as from an environmental point of view.
Environmental Effects
Environmental impacts from wave energyconversion devices are site- and technology-specific. Structures associated with wave energycan have environmental impacts similar to other structures placed offshore, by virtue of their physical presence in the water, as well asenvironmental effects unique to wave energydevices. Adverse impacts to the environmentcan often be avoided or reduced by careful project design and site location. Potentialenvironmental issues posed by wave energy
devices can occur in the areas of
• Coastal processes
• Marine biology
• Onshore effects
• Water quality
• Air quality
• Visual resources
• Use conflicts
• Geology
The construction, operation, anddecommissioning of structures in the water andon land have the potential to affect terrestrialand marine environmental resources. Each project will have unique effects on theenvironment, depending on two things: thedesign of the device (including the size of thearray), and the specific environmentalcharacteristics of the project site. This paper cannot assess the potential environmental
impacts of all wave energy devices anywhere off the coast of Oregon. Rather, the goal of thissection is to alert the reader to the different typesof potential impacts wave energy structuresmight have on the environment. In many cases,adverse impacts can be avoided or reduced bycareful project design (e.g., structural design,site location, materials used, and constructionand operation requirements).
8/3/2019 Wave Energy NOAATM92
http://slidepdf.com/reader/full/wave-energy-noaatm92 31/186
19
To date, there is very little data availablespecifically on the environmental impacts of wave energy conversion devices. Some studiesin Europe are beginning to examineenvironmental impacts and to documentdemonstrations. We refer the reader to Section
E (Generic Technologies) of the European WaveEnergy Thematic Network at http://www.wave-energy.net. In the United States, EPRIhas published several reports on wave energyconversion, available for download athttp://oceanenergy.epri.com (see LiteratureCited below).
In 2003, the U.S. Department of the Navy prepared an Environmental Assessment under the National Environmental Policy Act (NEPA)for the proposed installation and testing of a
wave energy technology project at Marine CorpsBase Hawai‘i (MCBH) Kane‘ohe Bay. The proposed project involved the phased installationand operational testing of up to six WEC buoysoff the North Beach at MCBH Kane‘ohe Bay for a period of up to 5 years. Each buoy wasexpected to produce an average of 20 kW of power, with a peak output of 40 kW. The WEC buoys would be anchored in about 100 feet(30.5 m) of water at a distance from shore of approximately 3,900 feet (1,189 m). Mechanicalenergy generated from the up and down motion
of the buoy would be converted into electricalenergy. The power would be transmitted toshore by means of an armored and shieldedundersea power cable connected to a landtransmission cable. The land cable would berouted to the existing MCBH Kane‘ohe Bayelectrical grid system.
In the Environmental Assessment, the Navyidentified the following issue areas for analysisunder NEPA: shoreline physiography,oceanographic conditions (i.e., coastal
processes), marine biological resources,terrestrial biological resources, land and marineresource use compatibility, cultural resources,infrastructure, recreation, public safety, andvisual resources. None of these were found to be significantly affected by the proposedinstallation and operational testing. Installation procedures were designed to minimize impactson living coral and benthic communities by
avoiding areas of rich biological diversity andhigh coral coverage.
While the detailed discussion of environmental impacts is beyond the scope of this technology overview paper, some focus is
given to the level of wave energy removed fromthe shoreline as a direct result of offshore wavefarms. The removal of wave energy will likely be too small to have any environmental effectsfor small wave energy facilities, but could proveto have cumulative impacts as deploymentscales increase.
Level of Wave Energy Removed
One of the key discussions during theworkshop was how much energy we can expect
a typical wave energy facility to extract from theocean. To address the concerns raised duringdiscussions and to understand the likely level of energy removal from a wave farm, threeexamples using different technologies areoutlined based on feasibility design studiescarried out by the author. The technologieschosen provide a range of significant extractionlevels that cover most devices under development today.
A wave farm needs to face the principal
wave direction and is installed at a suitablewater depth. In Oregon, the principal wavedirection is between W and NW and waveenergy facilities will ideally be arranged in rowsof devices along the coastline at a suitable water depth. A wave energy conversion device needsto be exposed directly to the wave action. If adevice is placed behind a row of wave energyconverters that already take power from thewaves, the performance will be reduced and as aresult economics are suboptimal. Some floatingtechnologies require large interdevice spacing,
because the device is able to swing around aslack mooring, which allows for some “device-stacking” without reducing device performance.
A wave farm consisting of 40 Pelamisdevices would occupy an area 0.6 km wide by2.1 km long. Based on EPRI’s work, a Pelamisdevice in a 21 kW/m wave climate would putout 1,337 MWh/year. For a wave farm
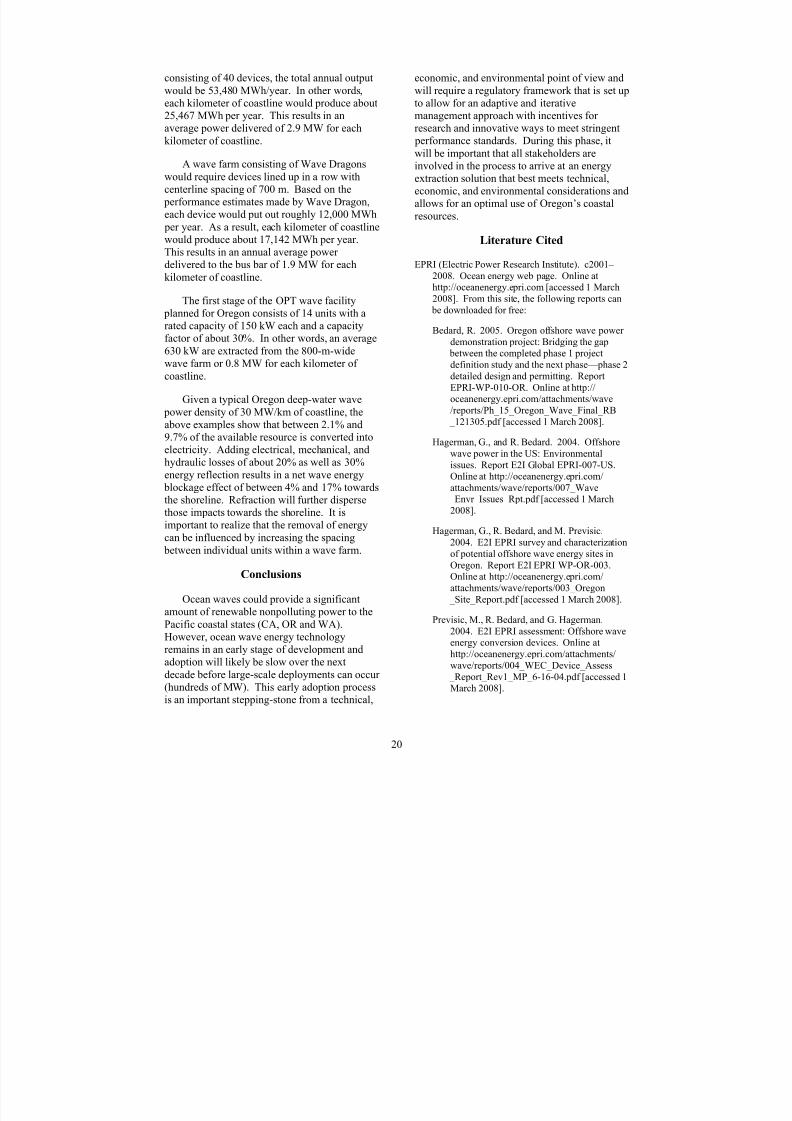
8/3/2019 Wave Energy NOAATM92
http://slidepdf.com/reader/full/wave-energy-noaatm92 32/186
20
consisting of 40 devices, the total annual outputwould be 53,480 MWh/year. In other words,each kilometer of coastline would produce about25,467 MWh per year. This results in anaverage power delivered of 2.9 MW for eachkilometer of coastline.
A wave farm consisting of Wave Dragonswould require devices lined up in a row withcenterline spacing of 700 m. Based on the performance estimates made by Wave Dragon,each device would put out roughly 12,000 MWh per year. As a result, each kilometer of coastlinewould produce about 17,142 MWh per year.This results in an annual average power delivered to the bus bar of 1.9 MW for eachkilometer of coastline.
The first stage of the OPT wave facility planned for Oregon consists of 14 units with arated capacity of 150 kW each and a capacityfactor of about 30%. In other words, an average630 kW are extracted from the 800-m-widewave farm or 0.8 MW for each kilometer of coastline.
Given a typical Oregon deep-water wave power density of 30 MW/km of coastline, theabove examples show that between 2.1% and9.7% of the available resource is converted into
electricity. Adding electrical, mechanical, andhydraulic losses of about 20% as well as 30%energy reflection results in a net wave energy blockage effect of between 4% and 17% towardsthe shoreline. Refraction will further dispersethose impacts towards the shoreline. It isimportant to realize that the removal of energycan be influenced by increasing the spacing between individual units within a wave farm.
Conclusions
Ocean waves could provide a significantamount of renewable nonpolluting power to thePacific coastal states (CA, OR and WA).However, ocean wave energy technologyremains in an early stage of development andadoption will likely be slow over the nextdecade before large-scale deployments can occur (hundreds of MW). This early adoption processis an important stepping-stone from a technical,
economic, and environmental point of view andwill require a regulatory framework that is set upto allow for an adaptive and iterativemanagement approach with incentives for research and innovative ways to meet stringent performance standards. During this phase, it
will be important that all stakeholders areinvolved in the process to arrive at an energyextraction solution that best meets technical,economic, and environmental considerations andallows for an optimal use of Oregon’s coastalresources.
Literature Cited
EPRI (Electric Power Research Institute). c2001– 2008. Ocean energy web page. Online athttp://oceanenergy.epri.com [accessed 1 March
2008]. From this site, the following reports can be downloaded for free:
Bedard, R. 2005. Oregon offshore wave power demonstration project: Bridging the gap
between the completed phase 1 projectdefinition study and the next phase—phase 2detailed design and permitting. ReportEPRI-WP-010-OR. Online at http://oceanenergy.epri.com/attachments/wave/reports/Ph_15_Oregon_Wave_Final_RB
_121305.pdf [accessed 1 March 2008].
Hagerman, G., and R. Bedard. 2004. Offshore
wave power in the US: Environmentalissues. Report E2I Global EPRI-007-US.Online at http://oceanenergy.epri.com/attachments/wave/reports/007_Wave
_Envr_Issues_Rpt.pdf [accessed 1 March2008].
Hagerman, G., R. Bedard, and M. Previsic.2004. E2I EPRI survey and characterizationof potential offshore wave energy sites inOregon. Report E2I EPRI WP-OR-003.Online at http://oceanenergy.epri.com/attachments/wave/reports/003_Oregon
_Site_Report.pdf [accessed 1 March 2008].
Previsic, M., R. Bedard, and G. Hagerman.2004. E2I EPRI assessment: Offshore waveenergy conversion devices. Online athttp://oceanenergy.epri.com/attachments/wave/reports/004_WEC_Device_Assess
_Report_Rev1_MP_6-16-04.pdf [accessed 1March 2008].

8/3/2019 Wave Energy NOAATM92
http://slidepdf.com/reader/full/wave-energy-noaatm92 33/186
21
Previsic, M., R. Bedard, G. Hagerman, and O.Siddiqui. 2004. System level design,
performance and costs—Oregon Stateoffshore wave power plant. Online athttp://oceanenergy.epri.com/attachments/wave/reports/006_Oregon_System_Level
_Design_RB_11-29-04.pdf [accessed 1March 2008].
European Wave Energy Thematic Network. No date.The European thematic network. Online athttp://www.wave-energy.net/index3.htm[accessed 1 March 2008].

8/3/2019 Wave Energy NOAATM92
http://slidepdf.com/reader/full/wave-energy-noaatm92 34/186
22
Environmental Risk Analysis and Wave Energy: Examples of How to Assess
Potential Impacts of Wave Energy on the Environment
Maurice L. Hill and Fred M. Piltz, U.S. Minerals Management Service
This presentation provides an introductionand overview of an approach to the analysis of impacts of offshore wave energy projects on theenvironment. The approach is directedspecifically to the “Ecological Effects of WaveEnergy Development in the Pacific Northwest”workshop, but is similar to that used by analystsin the preparation of National EnvironmentalPolicy Act (NEPA) and other similar reviews. Itdraws heavily from the “Wave EnergyEcological Effects Workshop Ecological
Assessment Briefing Paper” (this volume); theEuropean Marine Energy Centre document(EMEC 2005); the European Union’s researchand development center for alternative energydevelopment; and the framework for ecologicalrisk assessment that was developed by the U.S.Environmental Protection Agency during theearly 1990s (USEPA 1998).
The process begins with the development of a complete and detailed project description. Allaspects of the project that could potentially
result in ecological effects should beidentified—from initial site assessment activities(e.g., biological, archaeological, geophysical,and geotechnical surveys), constructionactivities, operational activities, and nonroutineactivities to decommissioning. It is critical towork closely with a project applicant todetermine the full extent and details of the entire project—from “cradle to grave.”
The next step is to identify the impact agents(or “stressors”) for each of the project activities.The key sources of stressors for wave energy projects are emplacement, operation (buoys,transmission system, anchoring system),decommissioning, and routine and emergencymaintenance.
The major stressors associated with theseactivities are wave and current modification,new hard structures (water column and benthic),
electromagnetic fields, chemical toxicity,acoustics, and cumulative effects.
With the knowledge of the projectdescription and stressors, the geographic scopeof the project can be identified. This scopedelineates the area or boundary in which potential impacts may occur. Also, the temporalscope of the project is identified—the period of time that impacts may occur. Note that this period may extend beyond the actual project
activities to cover any residual impacts.
The biological resources (or “receptors”)that could be affected by the project and arewithin the geographical scope are identified andtheir baseline is described. A receptor’s baselineshould describe the current status of thereceptor—e.g., the size of the population, itsdistribution, and other stressors that may beaffecting the receptor. Impact significancethreshold(s) for the receptors are developed.
A critical component of any environmentalreview is to conduct a public scoping process toidentify issues and concerns, data sources, etc.This process may take place throughout theenvironmental review.
Once the above information is obtained, theidentification of direct and indirect impacts tothe receptor may be made for each projectstressor. The probability or risk of these impactsactually occurring should also be presented. Anoverall impact level should be derived based onthe current status of the receptor and a
summation of all the project-related stressor effects. This overall impact level should bediscussed on both a local and regional basis andthe significance of this impact to the receptor should be stated. Finally, a cumulative impactanalysis should be made for the receptor.Cumulative impacts are defined in the Councilon Environmental Quality regulations as “the

8/3/2019 Wave Energy NOAATM92
http://slidepdf.com/reader/full/wave-energy-noaatm92 35/186
23
impact on the environment [or receptor] whichresults from the incremental impact of the actionwhen added to other past, present, andreasonably foreseeable future actions regardlessof what agency or person undertakes such other actions.” Reasonably foreseeable future actions
may be defined as those actions that have proposals that have been submitted to an agencyfor review and decision.
Mitigation measures (impact avoidance,minimization, reduction, elimination, etc.)should be developed where feasible for eachimpact. Also, alternative approaches to the proposed action should be developed, whenfeasible.
Because wave energy development is in its
infancy, the use of an adaptive managementstrategy is critical to the successful conduct of projects. A monitoring plan should bedeveloped for the project. Methods to measuremitigation effectiveness should also bedeveloped. Real-time monitoring may result inthe need to adjust components of the project on a
real-time basis. Additional research or studymay be necessary when data gaps are identifiedfor specific projects.
The European Marine Energy Centre(EMEC 2005) impact matrix was introduced and
discussed. The columns of the impact matrixcorrespond to groups of receptors, and the rowscorrespond to groups of stressors. The matrixmay be filled in to show levels of impact, risk of impact, levels of concern, levels of residualimpact following mitigation, etc.
Literature Cited
EMEC. 2005. Environmental impact assessment(EIA) guidance for developers at the EuropeanMarine Energy Centre. European Marine EnergyCentre, Ltd., Orkney, Scotland. Online athttp://www.emec.org.uk/emec_documents.asp[accessed 23 August 2008].
USEPA. 1998. Guidelines for ecological risk assessment. U.S. Environmental ProtectionAgency, Risk Assessment Forum, Washington,DC. EPA/630/R-95/002F.

8/3/2019 Wave Energy NOAATM92
http://slidepdf.com/reader/full/wave-energy-noaatm92 36/186

8/3/2019 Wave Energy NOAATM92
http://slidepdf.com/reader/full/wave-energy-noaatm92 37/186
25
Wave Energy Ecological Effects WorkshopEcological Assessment Briefing Paper
Gregory McMurray,Oregon Department of Land Conservation and Development
Introduction
Wave Energy Development and the
Larger Policy Context
There are a myriad of federal and state lawsand regulations that must be addressed in order for wave energy development to take place on
Oregon’s continental shelf. The agenciesresponsible for implementing these requirementsare under an increasing number of mandates tomanage for communities instead of species, andwide geographic areas and multiple habitatsinstead of narrow areas. These mandates areessentially a charge to manage on the basis of large ecosystems (so-called ecosystem-basedmanagement) and in a manner that will providesustainable ocean resources for futuregenerations (sustainability).
The precautionary approach has also become an important part of the policy context.In practical terms, it focuses the burden of proof of acceptable environmental effects onto the proponents of proposals for ocean activities, andthe agencies permitting them. The precautionaryapproach is also important as agencies attempt tomanage resources in an ocean that may bechanging in fundamental and unpredictableways. Hence, the mandates in the policy contextare driving the management community towardsmore rigorous and complete consideration of
environmental issues.
Content of This Briefing Paper
The approach for this briefing paper was toget the technology, ecological setting, andeffects issues documented, with needed publicsector documents provided to the workshop participants. The paper is organized in a format
parallel to a NEPA Environmental Assessmentor Environmental Impact Statement: theProposed Action (i.e., the technology, since thisis a programmatic approach); the AffectedEnvironment; and the approach to consideringthe Environmental Consequences (effects).Alternative development proposals, except for the differing technologies, are not discussed in
this paper, but it was hoped that workshop participants would consider possibledevelopment alternatives with differingenvironmental effects. As stated above, theTechnology section is presented at the programmatic level, but concludes with aspecific description of one proposed project.
Key to the workshop process was the use of the impact matrix described in theEnvironmental Effects section, which forms adeconstructed conceptual approach to theecological risk analysis (e.g., USEPA 1998). Itallows explicit treatment of stressors andreceptors at any level of specificity, as well asuncertainty and mitigation potential. TheBibliography and Literature Cited section is akey to papers cited in the briefing paper or available in the public sector.
The views, premises, hypotheses, and anyconclusions expressed in this briefing paper aresolely those of the author, and do not representthe views of any of the participating or sponsoring individuals, agencies, or entities.
The Technology
The review of existing technology isfollowed by a more detailed description of theintended Reedsport Wave Energy Park as a casein point. This information is intended tointroduce some consideration of the types of

8/3/2019 Wave Energy NOAATM92
http://slidepdf.com/reader/full/wave-energy-noaatm92 38/186
26
stressors that will be expressed through waveenergy development.
Existing Technology
The following section has been extracted
from the Minerals Management Service’s Technology White Paper on Wave Energy
Potential on the U.S. Outer Continental Shelf
(2006). At the time of writing, Finavera
(AquaBuoy® – point absorber), Energetech(terminator – oscillating water column) , OceanPower Delivery (attenuator), and Ocean Power Technology (PowerBuoy® – point absorber)have all expressed interest in, or applied for FERC (Federal Energy Regulatory Commission)
Preliminary Permits, on the Oregon coast.
RESOURCE UTILIZATION TECHNOLOGIES
A variety of technologies have been proposed to capture the energy from waves; however, each is intoo early a stage of development to predict which technology or mix of technologies would be most prevalent in future commercialization. Some of the technologies that have been the target of recentdevelopmental efforts and are appropriate for the offshore applications being considered in thisassessment are terminators, attenuators, point absorbers, and overtopping devices.
Terminators
Terminator devices extend perpendicular to the direction of wave travel and capture or reflect the power of the wave. These devices are typically installed onshore or nearshore; however, floating versionshave been designed for offshore applications. The oscillating water column (OWC) is a form of terminator in which water enters through a subsurface opening into a chamber with air trapped above it.The wave action causes the captured water column to move up and down like a piston to force the air through an opening connected to a turbine. A full-scale, 500-kW, prototype OWC designed and built byEnergetech (2006)(Figure 1) is undergoing testing offshore at Port Kembla in Australia, and a further project is under development for Rhode Island.
In an Electric Power Research Institute (EPRI)-cosponsored study (Bedard et al. 2005), a design, performance, and cost assessment was conducted for an Energetech commercial-scale OWC with a 1,000-kW rated capacity, sited 22 km from the California shore. With the wave conditions at this site (20 kW/maverage annual), the estimated annual energy produced was 1,973 MWh/yr. For a scale-up commercialsystem with multiple units producing 300,000 MWh/yr, the estimated cost of electricity would be on theorder of $0.10/kWh.
Another floating OWC is the “Mighty Whale” offshore floating prototype, which has been under development at the Japan Marine Science and Technology Center since 1987 (JAMSTC 2006).
Attenuators
Attenuators are long multisegment floating structures oriented parallel to the direction of the wave
travel. The differing heights of waves along the length of the device causes flexing where the segmentsconnect, and this flexing is connected to hydraulic pumps or other converters. The attenuators with themost advanced development are the McCabe wave pump and the Pelamis by Ocean Power Delivery, Ltd.(2006).
The McCabe wave pump (Figure 2) has three pontoons linearly hinged together and pointed parallelto the wave direction. The center pontoon is attached to a submerged damper plate, which causes it toremain still relative to fore and aft pontoons. Hydraulic pumps attached between the center and end pontoons are activated as the waves force the end pontoons up and down. The pressurized hydraulic fluid
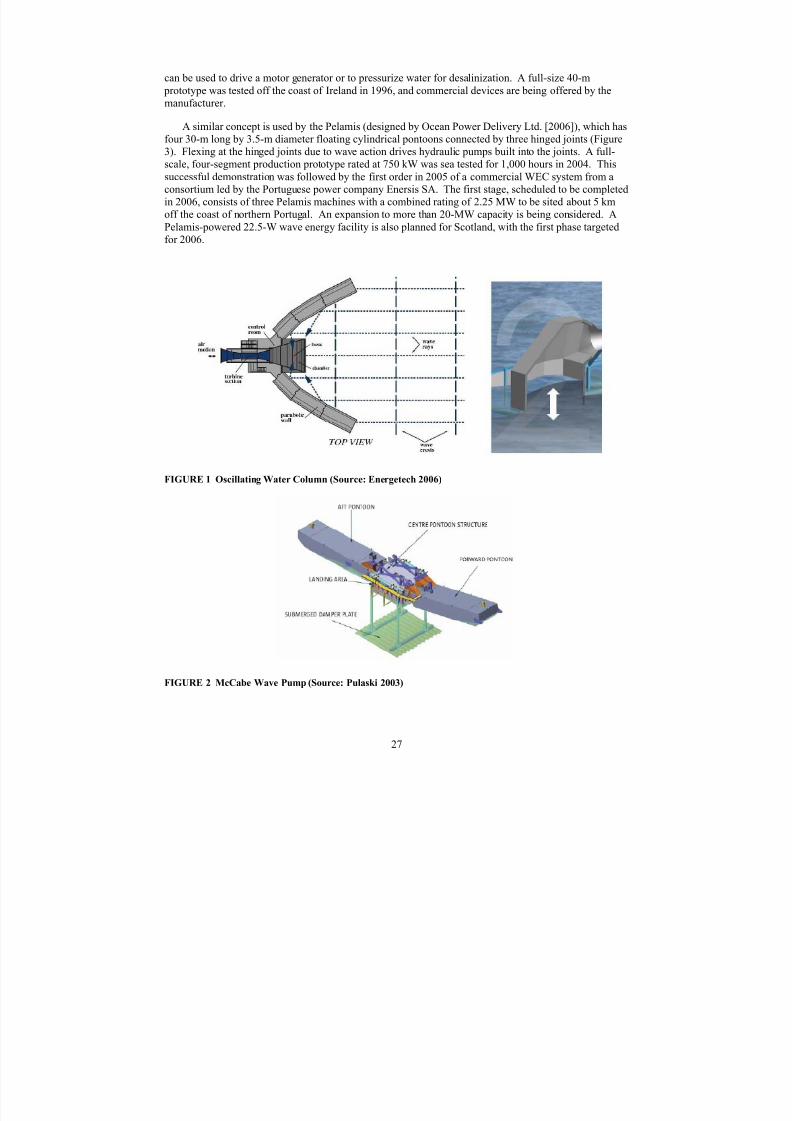
8/3/2019 Wave Energy NOAATM92
http://slidepdf.com/reader/full/wave-energy-noaatm92 39/186
27
can be used to drive a motor generator or to pressurize water for desalinization. A full-size 40-m prototype was tested off the coast of Ireland in 1996, and commercial devices are being offered by themanufacturer.
A similar concept is used by the Pelamis (designed by Ocean Power Delivery Ltd. [2006]), which hasfour 30-m long by 3.5-m diameter floating cylindrical pontoons connected by three hinged joints (Figure
3). Flexing at the hinged joints due to wave action drives hydraulic pumps built into the joints. A full-scale, four-segment production prototype rated at 750 kW was sea tested for 1,000 hours in 2004. Thissuccessful demonstration was followed by the first order in 2005 of a commercial WEC system from aconsortium led by the Portuguese power company Enersis SA. The first stage, scheduled to be completedin 2006, consists of three Pelamis machines with a combined rating of 2.25 MW to be sited about 5 kmoff the coast of northern Portugal. An expansion to more than 20-MW capacity is being considered. APelamis-powered 22.5-W wave energy facility is also planned for Scotland, with the first phase targetedfor 2006.
FIGURE 1 Oscillating Water Column (Source: Energetech 2006)
FIGURE 2 McCabe Wave Pump (Source: Pulaski 2003)

8/3/2019 Wave Energy NOAATM92
http://slidepdf.com/reader/full/wave-energy-noaatm92 40/186
28
FIGURE 3 Pelamis Wave Energy Converter (Source: Ocean Power Delivery Ltd. 2006)
The EPRI wave energy feasibilitydemonstration project has selected the Pelamisas one of the technologies for design, performance, cost, and economic assessment(Bedard et al. 2005). Sites for evaluation wereselected off the coasts of Hawaii (15.2 kW/maverage annual wave energy), Oregon (21.2kW/m), California (11.2 kW/m), Massachusetts(13.8 kW/m), and Maine (4.9 kW/m). For systems at these sites scaled to a commerciallevel generating 300,000 MWh/yr, the cost of electricity ranged from about $0.10/kWh for theareas with high wave energy, to about$0.40/kWh for Maine, which has relativelylower levels of wave energy.
FIGURE 4 PowerBuoy Point Absorber WaveEnergy Converter (Source: Ocean Power
Technologies 2006)
Point Absorbers
Point absorbers have a small horizontal dimension compared with the vertical dimension and utilizethe rise and fall of the wave height at a single point for WEC.
One such device is the PowerBuoy™ developed by Ocean Power Technologies (2006) (Figure 4).The construction involves a floating structure with one component relatively immobile, and a secondcomponent with movement driven by wave motion (a floating buoy inside a fixed cylinder). The relativemotion is used to drive electromechanical or hydraulic energy converters. A PowerBuoy demonstration
unit rated at 40 kW was installed in 2005 for testing offshore from Atlantic City, New Jersey. Testing inthe Pacific Ocean is also being conducted, with a unit installed in 2004 and 2005 off the coast of theMarine Corps Base in Oahu, Hawaii. A commercial-scale PowerBuoy system is planned for the northerncoast of Spain, with an initial wave park (multiple units) at a 1.25-MW rating. Initial operation isexpected in 2007.
The AquaBuOY™ WEC (Figure 5) being developed by the AquaEnergy Group, Ltd. (2005) is a point absorber that is the third generation of two Swedish designs that utilize the wave energy to pressurize a fluid that is then used to drive a turbine generator. The vertical movement of the buoy drives

8/3/2019 Wave Energy NOAATM92
http://slidepdf.com/reader/full/wave-energy-noaatm92 41/186
29
FIGURE 5 AquaBuOY Point Absorber Wave Energy Converter (Source: AquaEnergy Group, Ltd. 2005)
a broad, neutrally buoyant disk acting as a water piston contained in a long tube beneath the buoy. Thewater piston motion in turn elongates and relaxes a hose containing seawater, and the change in hosevolume acts as a pump to pressurize the seawater. The AquaBuOY design has been tested using a full-scale prototype, and a 1-MW pilot offshore demonstration power plant is being developed offshore atMakah Bay, Washington. The Makah Bay demonstration will include four units rated at 250 kW placed5.9 km (3.2 nautical miles) offshore in water approximately 46 m deep.
Other point absorbers that have been tested at prototype scale include the Archimedes Wave Swing(2006), which consists of an air-filled cylinder that moves up and down as waves pass over. This motionrelative to a second cylinder fixed to the ocean floor is used to drive a linear electrical generator. A 2-MW capacity device has been tested offshore of Portugal.
Overtopping Devices
Overtopping devices have reservoirs that are filled by impinging waves to levels above the average
surrounding ocean. The released reservoir water is used to drive hydro turbines or other conversiondevices. Overtopping devices have been designed and tested for both onshore and floating offshoreapplications. The offshore devices include the Wave Dragon™ (Wave Dragon 2005), whose designincludes wave reflectors that concentrate thewaves toward it and thus raises the effectivewave height. Wave Dragon developmentincludes a 7-MW demonstration project off thecoast of Wales and a precommercial prototype project performing long-term and real sea testson hydraulic behavior, turbine strategy, and power production to the grid in Denmark. TheWave Dragon design has been scaled to 11 MW
(Christensen 2006), but larger systems arefeasible since the overtopping devices do notneed to be in resonance with the waves as is thecase for point absorbing devices.
FIGURE 6 Wave Dragon Overtopping Device
(Source: Wave Dragon 2005)
The WavePlane™ (WavePlane Production 2006) overtopping device has a smaller reservoir. Thewaves are fed directly into a chamber that funnels the water to a turbine or other conversion device.

8/3/2019 Wave Energy NOAATM92
http://slidepdf.com/reader/full/wave-energy-noaatm92 42/186
30
Case Study: The Reedsport Wave Energy Facility
At the time of writing, Ocean Power Technology (OPT) is working towards applyingfor a FERC operating license for 14 buoys (a
2.1-MW facility) during late fall 2007, withintended deployment during spring 2009. The14-buoy project would encompassapproximately ½ square mile (1.3 km2) in area.OPT proposes that the 14 buoys would be builtout to approximately 200 units, for a 50-MWfacility in the ensuing years. OPT manufacturesthe PowerBuoy®, which at the intended scale(150 kW) is 41 m high, 12 m at the widest point(the surge plate) and 11 m at the floating collar;and has 8 m above the surface and 34 m belowthe surface (Figure 7). The wave energy facility
would be centered over the 50-m isobath, about2 ½ miles (4.0 km) offshore of Reedsport,Oregon. The 14 buoys would be arranged in agrid as shown in Figure 8 below. The full build-out of 200 buoys (four rows of 50, parallel toshore) would have a footprint of about ½ mile by 3 miles (0.8 km by 4.8 km), plus any requiredstandoff zone.
The spacings between the buoys areintended to be about 100 m. The anchoringsystem for a single buoy is shown in Figure 9.
The subsurface buoys between the tendon andcatenary lines are intended to have significant positive buoyancy in order to limit the buoys toa small area. Anchors are now intended to be precast concrete blocks measuring 6 x 6 x 3 m.
The power will be generated asasynchronous alternating current (1/8 to 1/12Hertz AC) , but will be converted to 60-cycle,three-phase AC at the subsea pod. The buoys’electrical cables will be joined at the subsea pod,which houses a transformer and switchgear and
steps up the voltage. That unit is now designedto be 6 ft (about 1.8 m) in diameter and 15 ft(4.6 m) long, and is held down with concrete ballast blocks. A sketch is shown in Figure 10.
Figure 7. PowerBuoy® layout and dimensions.
(FERC 2007).
Figure 8. Proposed PowerBuoy® Array (FERC
2007).

8/3/2019 Wave Energy NOAATM92
http://slidepdf.com/reader/full/wave-energy-noaatm92 43/186
31
Figure 9. Reedsport Wave Energy Park anchoring schematic (FERC 2007); anchor spacing at about 100
meters.
Figure 10. Reedsport Wave Energy Park subsea pod schematic (FERC 2007).

8/3/2019 Wave Energy NOAATM92
http://slidepdf.com/reader/full/wave-energy-noaatm92 44/186
32
The Affected Environment:
Oregon’s Continental Shelf
The area of interest is the nearshore zonealong Oregon’s coast, from near the 50-meter
depth contour to the shoreline. The “sweet spot”for wave energy development along Oregon’scoast, at least for most of the technologies proposed at this time, is about 50 m depth, or just inside 30 fathoms. This depth is roughly theclosest distance from shore that long-period,large wave forms have yet to begin to react toshoaling. This area is also the focus of theOregon Department of Fish & Wildlife’srecently published Nearshore Strategy (ODFW Nearshore Team 2006), and this section of the briefing paper relies heavily on the content of
that report. Figure 11 is taken from the Nearshore Strategy and shows the area of interest, depth, and rocky versus sandy shorelinetypes (ODFW Nearshore Team 2006).
Wave Climate and Currents
Oregon’s wave climate is the major reasonfor the high level of industry interest, along witheasy access to transmission infrastructure. Therelative amount of annual wave energyworldwide is shown in Figure 12 (Bedard 2005),and shows that the best U.S. resource is the WestCoast, resulting from the prevailing Westerliesand the large fetch of the open Pacific.Significant wave heights (the average height,trough to crest, of the one-third highest wavesvalid for the time period) at Coquille from 1984to 1996 reached 7.8 m, with a maximum waveheight on the order of 15 m (Bedard 2005). Themonthly average wave energy flux, shown inFigure 13, illustrates that the seasonal energyduring winter and summer differs by a factor of about eight. Whereas other markets arecharacterized by higher demands in summer for
air conditioning, the Oregon coast marketcorresponds roughly to the resource.
Currents on the Oregon shelf are stronglyseasonal. Winter is characterized by low pressure systems that drive episodic, strongsouthwesterly winds, and result in the northerlyflowing Davidson Current and downwelling
conditions. Summer is characterized byepisodes of high pressure offshore and strongnortherly or northwesterly winds that drive theCalifornia Current and upwelling conditions.The spring transition takes place in March–Apriland fall transition in late September–October;
both are characterized by very calm localweather and seas. The seasonal prevailingwinds and resulting sea surface temperatures areillustrated in Figure 14, from the ReedsportWave Energy Preliminary ApplicationDocument (FERC 2007).
Littoral Transport System
There exist eighteen identified littoralcirculation cells on the Oregon coast, as shownin a map developed by the Oregon Department
of Geology and Mineral Industries (DOGAMI;Figure 15). Reedsport, location of the intendedfirst wave energy facility in Oregon, is in themiddle of the Coos cell. Subcell information isnot available at the time of writing.
Pelagic Habitat Physical Characterization
The pelagic habitat on Oregon’s nearshorecontinental shelf is generally reflective of either winter or summer conditions. During winter,very nearshore surface temperatures are on the
order of 9–10°C and salinities on the order of 30–32 PSU (Landry et al. 1989). Winter currents nearshore are generally northwards withthe Davidson current, and large waves comefrom the southwest and west, corresponding toepisodic major winter storms (see Figure 14).During summer upwelling, surface temperaturesare on the order of 12–14°C and salinities on theorder of 30–32 PSU with colder, more salinewater on the inner shelf (see Figure 14; Landryet al. 1989). During upwelling relaxationevents, warmer surface water moves towards
shore. In winter, the Columbia River plumeswings north very close to shore, and duringsummer, swings south and offshore covering avery large area (Landry et al. 1989). Lighttransmission is generally higher in winter (awayfrom river mouths) and lower after the springtransition, when phytoplankton begin to bloom.

8/3/2019 Wave Energy NOAATM92
http://slidepdf.com/reader/full/wave-energy-noaatm92 45/186
33
Figure 11. Oregon’s nearshore ocean showing the 30-fathom (about 50 m) depth contour and the 3-nautical
mile (about 5.6 km) demarcation of the Territorial Sea (ODFW Nearshore Team 2006). Red areas are
rocky shore habitats; areas not blocked in red are sedimented shorelines.

8/3/2019 Wave Energy NOAATM92
http://slidepdf.com/reader/full/wave-energy-noaatm92 46/186
34
Figure 12. Annual wave energy averages worldwide in kW/m wave front (Bedard 2005).
Figure 13. Monthly average wave energy flux in KW/m (Bedard 2005).

8/3/2019 Wave Energy NOAATM92
http://slidepdf.com/reader/full/wave-energy-noaatm92 47/186
35
Figure 14. Visual display of current patterns along the Oregon coast (left); and winds and correlating water
temperatures along the southern Oregon coast (right)(FERC 2007).

8/3/2019 Wave Energy NOAATM92
http://slidepdf.com/reader/full/wave-energy-noaatm92 48/186
36
Figure 15. Map of the littoral cells of the Oregon coast (DOGAMI).

8/3/2019 Wave Energy NOAATM92
http://slidepdf.com/reader/full/wave-energy-noaatm92 49/186
37
Table 1. Grain size distributions from seabed surface sediment samples collected in the vicinity of the
Reedsport Wave Energy Project (FERC 2007).
Ocean “fronts” (regions of high rates of change in temperature and salinity) on the edgesof upwelling surface structure are well known as biological hotspots and may be bathymetrically
controlled (and geographically recurrent) insome locations (see for example GLOBEC1996). Regime transitions during spring(March–April) and fall (September–October)exhibit generally calm conditions of wind andwaves.
Benthic Habitat Physical
Characterization
The wave energy industry has thus far shown a strong preference for locating in
sedimented areas with no known rocky outcrops,so that concrete block can be used as anchors.The high energy coastline yields a gradient insediment size from sand on the beaches to mudin deep water. The sediment at 50–100 m variesfrom fine sand at 50 m to sandy silt towards100 m depth, as shown by Table 1 from theReedsport preliminary application (FERC 2007).Samples from the EPA’s EnvironmentalAssessment and Monitoring Program (EMAP)from depths of 20 to 120 m during 2003 yieldedsimilar sediment size results (from 50.1% to
99.1% sand), and organics percentages from0.30 to 1.4 (LASAR 2007).
The Biota
For purposes of this briefing paper, the biotawill be addressed as assemblages in the habitat,including the assemblages in the water column(pelagic), those at the bottom of the water
column (demersal/epibenthic) and those withinthe sediment (benthic infauna). Seabirds andmarine mammals are treated in their ownsections. This section leans heavily on the
ODFW Nearshore Strategy (ODFW NearshoreTeam 2006), as that work is the most recent andcomplete synthesis of nearshore biology,especially as it relates to Oregon’s fishresources.
Epipelagic/pelagic species assemblage
Phytoplankton— Phytoplankton are the base of the food web and thrive in Oregon’snutrient-rich upwelling conditions. Springtransition (March–April) generally leads to an
annual diatom bloom that is an importantcomponent of the food base for copepods,euphausiids, mysids, and other grazers in the plankton community. Many other groups of phytoplankton are found in the community,including toxic diatoms (Pseudonitzschia sp.)that can cause amnesiac shellfish poisoning(ASP) and certain species of dinoflagellates thatcan cause paralytic shellfish poisoning (PSP).The phytoplankton species respond to major ocean changes as do the zooplankton (below).
Zooplankton —The zooplankton includeholozooplankton (animals found in the water column throughout their life history) andmeroplankton (animals found in the water column during an early part of their life history).The Reedsport Wave Energy project brieflyreviewed the holozooplankton (FERC 2007):

8/3/2019 Wave Energy NOAATM92
http://slidepdf.com/reader/full/wave-energy-noaatm92 50/186
38
Plankton is found throughout the OregonCoast, but concentrated populationsgenerally occur near the continental shelf.Lamb and Peterson (2005) found the highestconcentration of zooplankton inshore of the300-foot isobath. Within that isobath,species are separated by preferences in water temperature and salinity (Sutor et al. 2005).Actual offshore location and density of
plankton is directly affected by seasonalvariations in wind and current (Keister andPeterson 2003). Generally, upwellingevents occur in late summer. Uncommon El
Niño years tend to upset the usual pattern of upwelling events and can alter timing andoccurrence of plankton abundance, speciescomposition, and blooms (Keister andPeterson 2003).
Fouling community— The foulingcommunity consists of meroplanktonicinvertebrates whose larvae have evolved to settleon hard substrates, and thus will settle on man-made surfaces as well. Many of thesemeroplanktonic organisms are found in theneuston, plants and animals that are attracted toand often found in the upper 10 cm of the water column, at least during calm weather and seas.There are also some invasive species in thiscommunity that may make opportunistic use of new hard structures, like wave energy devices,
to extend their range.Krill— Krill is a term applied to numerous
species of euphausiids, vertically migratingshrimp-like crustaceans; they are a veryimportant source of forage for many small fishand invertebrates, as well as some baleenwhales. Key species on the Oregon shelf are Euphausia pacifica and Thysanoessa spinifera 1.The Pacific Fishery Management Council(PFMC) recently took action to preclude anykrill fisheries on the West Coast of the UnitedStates (PFMC 2006).
1 W. T. Peterson, NOAA-NMFS, NWFSC, Newport,OR. Pers. commun., July 2007
Market squid— The market squid( Doryteuthis opalescens , formerly Loligo
opalescens) is a key, schooling invertebratespecies that provides important forage for Oregon’s fish communities and is included inODFW’s list of watch species (see below).
Fish— The Pacific Fisheries ManagementCouncil (PFMC) is given authority over WestCoast fisheries under the Magnusen-StevensFishery Conservation Act (MSA). In its latestiteration, the MSA requires the regional councilsto identify Essential Fish Habitat (EFH): “thosewaters and substrates necessary to fish for spawning, breeding, feeding, or growth tomaturity.” All aquatic habitat that washistorically accessible to groundfish species,coastal pelagic species, coho salmon, Chinook
salmon, and pink salmon is designated as EFH. NOAA Fisheries has listed the species (both pelagic and demersal) with essential fish habitatin the nearshore area (Table 2).
ODFW’s Nearshore Strategy (ODFW Nearshore Team 2006) listed the key pelagicspecies with respect to nearshore fisheries planning. Their table is show in its entirety asTable 3. Strategy species are defined asimportant nearshore species in need of greatestmanagement attention, and watch list species are
defined as those that do not require immediatemanagement attention, but may in the future. Note that some invertebrate species (e.g, marketsquid) are included in the ODFW tables, and thatthere is some crossover between the pelagic andepibenthic/demersal table species.

8/3/2019 Wave Energy NOAATM92
http://slidepdf.com/reader/full/wave-energy-noaatm92 51/186
39
Table 2. Species with designated Essential Fish Habitat (EFH) in the nearshore area.
Groundfish Species
SpeciesCommon Name
Species Scientific Name Lifestage Activity Prey
Arrowtoothflounder
Atheresthes stomias Adults Clupeids, gadids, krill, shrimp,Theragra chalcogramma
Atheresthes stomias Larvae Copepod eggs, copepod nauplii,copepods
Bank rockfish Sebastes rufus Adults gelatinous plankton, krill, smallfishes, tunicates
Sebastes rufus Juveniles gelatinous plankton, krill, smallfishes, tunicates
Big skate Raja binoculata Adults Crustaceans, fish
Black rockfish Sebastes melanops Adults Amphipods, cephalopods,clupeids, euphausiids, mysids,
polychaetes, salpsBlue rockfish Sebastes mystinus Adults Feeding algae, crab, juvenile fish, fish
larvae, hydroids, jellyfish, krill,
salps, tunicatesSebastes mystinus Juveniles Feeding algae, copepods, crab, euphausiids,
juvenile fish, hydroids, krill, salps,tunicates
Sebastes mystinus Juveniles All algae, copepods, crab, euphausiids, juvenile fish, hydroids, krill, salps,tunicates
Bocaccio Sebastes paucispinis Adults Feeding Juvenile rockfish, molluscs, smallfishes
Sebastes paucispinis Juveniles Feeding Copepods, euphausiidsButter sole Isopsetta isolepis Adults Amphipods, decapod crustaceans,
molluscs, polychaetes, sea stars,shrimp
Cabezon Scorpaenichthysmarmoratus
Adults Crabs, fish eggs, lobsters,molluscs, small fishes
Canary rockfish Sebastes pinniger Adults Euphausiids, fish, krill
Chilipepper Sebastes goodei Adults Clupeids, euphausiids, krill,Merluccius productus,squids
Sebastes goodei Juveniles Copepods, euphausiids
Copper rockfish Sebastes caurinus Adults Crustaceans, fish, molluscs,shrimp
Cowcod Sebastes levis Adults Fish, octopi, squidsCurlfin sole Pleuronichthys
decurrens
Adults All Crustacean eggs, echiurid proboscises, nudibranchs, polychaetes
DarkblotchedrockfishSebastes crameri Adults Amphipods, euphausiids, octopi,salps, small fishes
English sole Parophrys vetulus Adults Amphipods, crustaceans,cumaceans, molluscs, ophiuroids,
polychaetesParophrys vetulus Juveniles Amphipods, copepods, cumaceans,
molluscs, mysids, polychaetes
Flag rockfish Sebastes rubrivinctus Adults Crabs, fish, octopi, shrimp

8/3/2019 Wave Energy NOAATM92
http://slidepdf.com/reader/full/wave-energy-noaatm92 52/186
40
Table 2 continued. Species with designated Essential Fish Habitat (EFH) in the nearshore area.
Groundfish Species
SpeciesCommon Name
Species Scientific Name Lifestage Activity Prey
Flathead sole Hippoglossoides
elassodon
Adults Clupeids, fish, molluscs, mysids, polychaetes, shrimp
Grass rockfish Sebastes rastrelliger Adults Cephalopods, crabs, crustaceans,fish, gastropod, shrimp
Greenstripedrockfish
Sebastes elongatus Adults Copepods, euphausiids, shrimp,small fishes, squids, tunicates
Kelp greenling Hexagrammos
decagrammus
Adults Brittle Stars, crabs, octopi, shrimp,small fishes, snails, worms
Hexagrammos
decagrammus
Larvae Amphipods, brachyuran, copepodnauplii, copepods, euphausiids,fish larvae
Lingcod Ophiodon elongatus Adults Unknown Demersal fish, juvenile crab,octopi, squid,
Ophiodon elongatus Larvae Unknown amphipods, copepod eggs,
copepod nauplii, copepods,decapod larvae, euphausiids
Pacific cod Gadus macrocephalus Adults Amphipods, crabs, mysids,sandlance, shrimp, Theragrachalcogramma
Gadus macrocephalus Juveniles Amphipods, copepods, crabs,shrimp
Gadus macrocephalus Larvae Copepods
Gadus macrocephalus Larvae Copepods
Pacific hake Merluccius productus Juveniles Euphausiids
Merluccius productus Adults All Amphipods, clupeids, crabs,Merluccius productus, rockfish,squids
Pacific ocean perch
Sebastes alutus Adults Copepods, euphausiids, mysids,shrimp, small fishes, squids
Sebastes alutus Juveniles Copepods, euphausiids,
Pacific sanddab Citharichthys
sordidus
Adults Clupeids, crab larvae, octopi,squids
Petrale sole Eopsetta jordani Adults Eopsetta jordani, euphausiids,ophiuroids, pelagic fishes, shrimp
Quillback rockfish
Sebastes maliger Adults Amphipods, clupeids, crabs,euphausiids, juvenile fish,molluscs, polychaetes, shrimp
Redstriperockfish
Sebastes proriger Adults Clupeids, juvenile fish, squid
Rex sole Glyptocephalus zachirus
Adults Cumaceans, euphausidds,larvacea, polychaetes
Rock sole Lepidopsetta bilineata Adults echinoderms, echiurans, fish,molluscs, polychaetes, tunicates
Rosethornrockfish
Sebastes
helvomaculatus
Adults Amphipods, copepods,euphausiids
Rosy rockfish Sebastes rosaceus Adults Crabs, shrimp

8/3/2019 Wave Energy NOAATM92
http://slidepdf.com/reader/full/wave-energy-noaatm92 53/186
41
Table 2 continued. Species with designated Essential Fish Habitat (EFH) in the nearshore area.
Groundfish Species
SpeciesCommon Name
Species Scientific Name Lifestage Activity Prey
Sablefish Anoplopoma fimbria Juveniles Growthto
Maturity
Amphipods, cephalopods,copepods, demersal fish,
euphausiids, krill, small fishes,squids, tunicates
Anoplopoma fimbria Larvae Feeding Copepod eggs, copepod nauplii,copepods
Sand sole Psettichthys
melanostictus
Adults Clupeids, crabs, fish,molluscs,mysids, polychaetes,shrimp
Sand sole Psettichthys
melanostictus
Juveniles Euphausiids, molluscs, mysids, polychaetes, shrimp
Sharpchinrockfish
Sebastes zacentrus Adults Amphipods, copepods,euphausiids, shrimp, small fishes
Sebastes zacentrus Juveniles Amphipods, copepods,
euphausiids, shrimp, small fishesShortbellyrockfish
Sebastes jordani Adults Copepods, euphausiids
Shortraker rockfish
Sebastes borealis Adults bathylagids, cephalopods, decapodcrustaceans, fish, molluscs,myctophids, mysids, shrimp
Shortspinethornyhead
Sebastolobus
alascanus
Adults Amphipods, copepods, crabs, fish, polychaetes, Sebastolobusalascanus, Sebastolobus altivelis,shrimp
Soupfin shark Galeorhinus galeus Juveniles GrowthtoMaturity
Fish, invertebrates
Galeorhinus galeus Adults Fish, invertebratesSpiny dogfish Squalus acanthias Adults All Invertebrates, pelagic fishes
Squalus acanthias Adults Feeding Invertebrates, pelagic fishes
Splitnoserockfish
Sebastes diploproa Juveniles Amphipods, cladocerans,copepods
Spotted ratfish Hydrolagus colliei Adults algae, amphipods, annelids, brittlestars, fish, hydrolagus collei,molluscs, nudibranchs,opisthobranchs, ostracods, smallcrustacea, squid
Hydrolagus colliei Juveniles algae, amphipods, annelids, brittlestars, fish, hydrolagus collei,
molluscs, nudibranchs,opisthobranchs, ostracods, smallcrustacea, squid
Starry flounder Platichthys stellatus Adults Crabs, fish juveniles, molluscs, polychaetes
Platichthys stellatus Juveniles Amphipods, copepods, polychaetes
Stripetailrockfish
Sebastes saxicola Adults Copepods, euphausiids

8/3/2019 Wave Energy NOAATM92
http://slidepdf.com/reader/full/wave-energy-noaatm92 54/186
42
Table 2 continued. Species with designated Essential Fish Habitat (EFH) in the nearshore area.
Groundfish Species
SpeciesCommon Name
Species Scientific Name Lifestage Activity Prey
Sebastes saxicola Juveniles Copepods
Tiger rockfish Sebastes nigrocinctus Adults Amphipods, clupeids, crabs, juvenile fish, juvenile rockfish,shrimp
Vermilionrockfish
Sebastes miniatus Adults Clupeids, juvenile rockfish, krill,octopi, squid
Widow rockfish Sebastes entomelas Adults Amphipods, copepods,euphausiids, Merluccius
productus, salps, shrimp, squidsSebastes entomelas Juveniles Copepod eggs, copepods,
euphausiid eggsYelloweyerockfish
Sebastes ruberrimus Adults Clupeids, cottids, crabs, gadids, juvenile rockfish, sea urchin,shrimp, snails
Yellowtailrockfish Sebastes flavidus Adults Clupeids, euphausiids, krill,Merluccius productus, mysids,salps, squids, tunicates
Pacific Salmon
Coho salmon Oncorhynchus kisutch
Chinook salmon Oncorhynchus tshawytscha
Coastal Pelagic Species
Pacific sardine Sardinops sagax
Pacific (chub)mackerel
Scomber japonicus
Northernanchovy
Engraulis mordax
Jack mackerel Trachurus symmetricus
Californiamarket squid
Loligo opalescens*
* now Doryteuthis opalescens
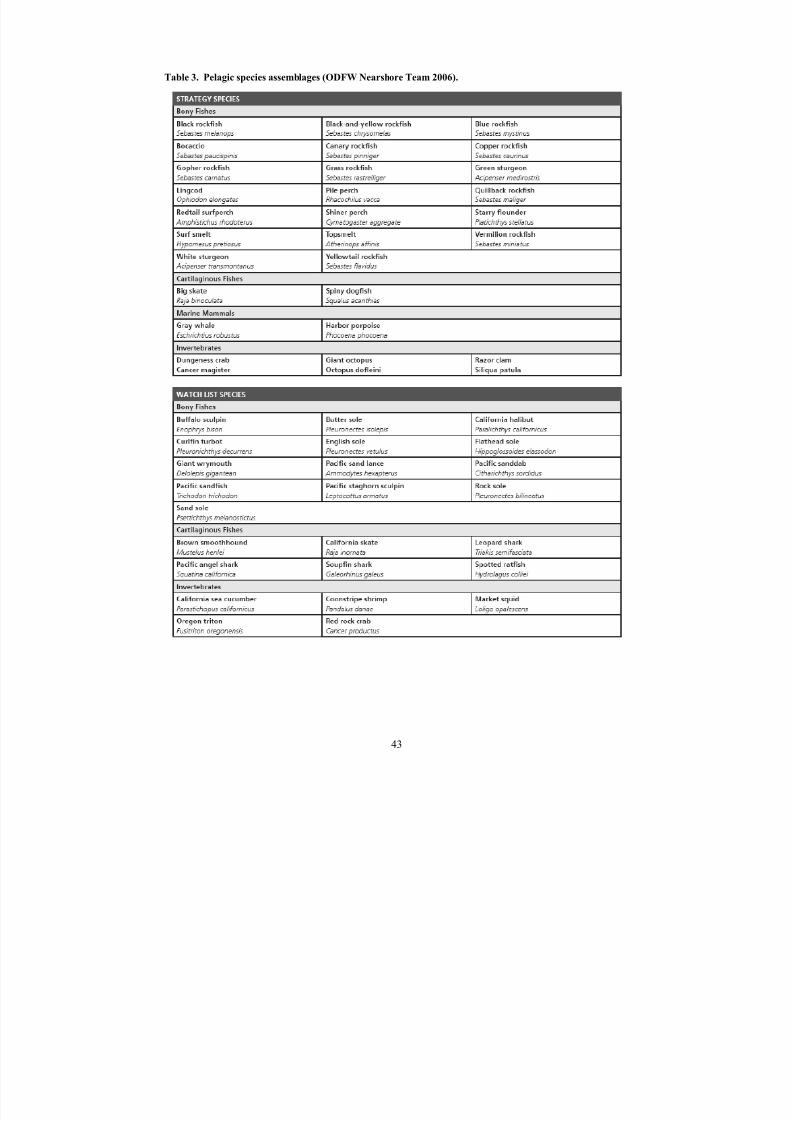
8/3/2019 Wave Energy NOAATM92
http://slidepdf.com/reader/full/wave-energy-noaatm92 55/186
43
Table 3. Pelagic species assemblages (ODFW Nearshore Team 2006).

8/3/2019 Wave Energy NOAATM92
http://slidepdf.com/reader/full/wave-energy-noaatm92 56/186
44
Table 3 continued. Pelagic species assemblages (ODFW Nearshore Team 2006).
Epibenthic/demersal organisms
ODFW’s Nearshore Strategy (ODFW Nearshore Team 2006) also listed the strategyand watch list soft-bottom demersal/epibenthicspecies with respect to nearshore fisheries planning. Their table is show in its entirety as
Table 4.
Epibenthic macroinvertebrates —Decapodcrustaceans in this group are commerciallyimportant and include the Pacific pink shrimp(Pandalus jordani) and Dungeness crab (Cancer
magister ). Other important groups include bothcephalopod and bivalve mollusks, andechinoderms, represented by seastars and seaurchins.
Forage fishes— In addition to the forage
fishes that are treated above, Pacific sandlance( Ammodytes hexapterus) are also important inthe region, but are characteristically
undersampled or not sampled, because they can burrow into the sediment to avoid trawl capture2.
Demersal fishes— Groundfish in themanaged community are numerous, includingthe principally Sebastes complex, whichincludes the many rockfish species and the kelp
greenling and lingcod (see Table 3). There arealso a number of flatfish species, such assanddabs, in the assemblage.
Elasmobranchs —Common soft-bonedfishes (elasmobranchs) on the Oregon shelf include the dogfish shark (Squalus acanthias), bat ray ( Myliobatis californica), and the bigskate ( Raja binoculata). White sharks(Carcharadon carcharias) inhabit the Oregoncoast year round, and are of great concern to thesurfing community. Elasmobranchs are of
interest here because of their ability to perceiveelectromagnetic fields.
2 R. Emmett, NOAA-NMFS, NWFSC, Newport, OR.Pers. commun., July 2007

8/3/2019 Wave Energy NOAATM92
http://slidepdf.com/reader/full/wave-energy-noaatm92 57/186
45
Table 4. Soft-bottom epibenthic/demersal species assemblages (ODFW Nearshore Team 2006).

8/3/2019 Wave Energy NOAATM92
http://slidepdf.com/reader/full/wave-energy-noaatm92 58/186
46
Table 4 continued. Soft-bottom epibenthic/demersal species assemblages (ODFW Nearshore Team 2006).
Benthic infauna
EPA’s Environmental Assessment andMonitoring Program conducted a randomstratified sampling program on the Oregon shelf in 2003 that included benthic infauna analysis.Fifty stations between 20 m and 120 m water depth were sampled, and the benthic infaunaidentified to species or to the most specifictaxonomic group feasible. The results are still provisional, but a 79-m sample was taken verynear the intended Reedsport wave energy project. The infauna was numerically andtaxonomically dominated by polychaete worms,and also included gastropods, amphipods, brittlestars, bivalves, ribbon worms, shrimp,scaphopods, cumaceans, oligochaete worms, andanemones in the 76 taxa identified3. The mostnumerous species were Magelona longicornis ,Galathowena oculata and Scoletoma luti—all polychaetes.
Braun (2005) recently reviewed the existingliterature for the area near the mouth of theColumbia River with a focus on depths under 30m, and offered some insight into the lifehistories of the dominant species found in sandto mud substrates in high energy environments:
Spiophanes bombyx, a small, slender bristleworm (5 to 6 cm long by 0.15 cmwide), is found in clean sand from thelow water mark to about 60 meters.Spiophanes bombyx is regarded as a
3 L. Edmond, EPA Region X, Seattle, WA. Pers.commun., June 2007
typical 'r'-selected species with a shortlife span, high dispersal potential, and ahigh reproductive rate (Kröncke 1980, Niermann et al. 1990). It is often found
at the early successional stages of variable, unstable habitats that it is quick to colonize following perturbation(Pearson and Rosenberg 1978). Itslarval dispersal phase may allow thespecies to colonize remote habitats.Tube-building worms, includingSpiophanes bombyx, modify thesediment making it suitable for later colonization and succession (Gallagher et al. 1983).
Magelona spp. typically burrows in fine
sand at low water and in the shallowsublittoral. It does not produce a tube. Magelona spp. is adapted for life inhighly unstable sediments, characterized by surf, strong currents, and sedimentmobility.
Owenia fusiformis is a thin, cylindrical,segmented worm, up to 10 cm long, thatlives in a tough, flexible tube buried inthe sand with its anterior end just protruding from the surface. It is found buried in sand or muddy sand, at or below low water, on fairly sheltered beaches.
Spio filicornis is found in clean sand,from the low water mark into theshallow sublittoral. It inhabits a tubemade of sediment grains and detritusstuck together with mucus. Tube- building worms, including Spio

8/3/2019 Wave Energy NOAATM92
http://slidepdf.com/reader/full/wave-energy-noaatm92 59/186
47
filicornis, modify the sediment, makingit suitable for later colonization andsuccession (Gallagher et al. 1983).
Hippomedon denticulatus is alysianassid amphipod. They are
scavengers on muddy and sandysediments in bays, the continental shelf,and the deep sea where they clean up thecarcasses of dead fishes andinvertebrates. This species of lysianassid amphipod is large (14 mm),shiny, and white, with a pair of fatantennae attached to the front of thehead and a small hook on the last side- plate of the abdomen.
This is useful context when considering theresponse of the benthic infaunal community to
physical disturbances.
Turtles
Turtles that can be found on the Oregonnearshore shelf, and could thus be affected bywave energy development, include theleatherback turtle ( Dermochelys coriacea) andloggerhead turtle (Caretta caretta).
Seabirds
The Reedsport Wave Energy Project hasrecently reviewed seabird observations from thecentral Oregon coast. Dominant species in 1989surveys are shown in Table 5 (FERC 2007); andtiming of occurrence for common speciesoffshore Douglas County is shown in Table 6.
Marine mammals
The Reedsport Wave Energy Project provided a good summary table of marinemammals possibly found in the Reedsportvicinity (FERC 2007). This is presented as
Table 7, and includes information on prior sightings, distribution and preferred habitat, and
population status. Whale species found on theOregon continental shelf include the gray whale( Eschrichtius robustus ), humpback whale( Megaptera novaeangliae), blue whale( Balaenoptera musculus), fin whale ( B.
physalis), sei whale ( B. borealis), and sperm
whale (Physeter macrocephalus).
Gray whales —Gray whales are of particular concern because the entire populationof 18,000–20,000 animals in the eastern NorthPacific transits the length of the Oregon coasttwice a year (Herzing and Mate 1984). Mateand Harvey (1984) used VHF radio tags to track northbound migrating whales during 1979 and1980 from Mexico to Alaska. More recently,gray whales have been tagged in Mexico toestimate use of reproductive habitats (Mate et al.
2003) and tracked northward with satellite-monitored radio tags (Mate and Urban 2003).These studies provide more locations and precision about distances from shore, water depths, and speeds than previous research.Some gray whale mothers with calves weretracked up to 77º N and for as long as 320 days.The tracks have established the first goodestimates of home ranges for the entire summer feeding season as well as individual estimatescharacterizing the southbound migration.
Sea otters— Sea otters ( Enhydra lutris)were extirpated in Oregon’s nearshore waters bythe end of the 19th century (Lance et al. 2004).They are thought to be a keystone species in theCalifornia Current’s kelp forest environments,mediating kelp grazing by controlling sea urchin populations (Lance et al. 2004). Although seaotter issues were not a focal point of thisworkshop, any predictions of wave energydevelopment effects on the success of localindividuals or possible future reintroductionswould be of value to natural resource managers.

8/3/2019 Wave Energy NOAATM92
http://slidepdf.com/reader/full/wave-energy-noaatm92 60/186
48
Table 5. Seabirds identified during the 1989 Oregon and Washington marine mammal and seabird survey
(FERC 2007).
Table 6. Expected
abundance and timing of
select seabird species
found along the Oregon
coast of Douglas County
(FERC 2007).
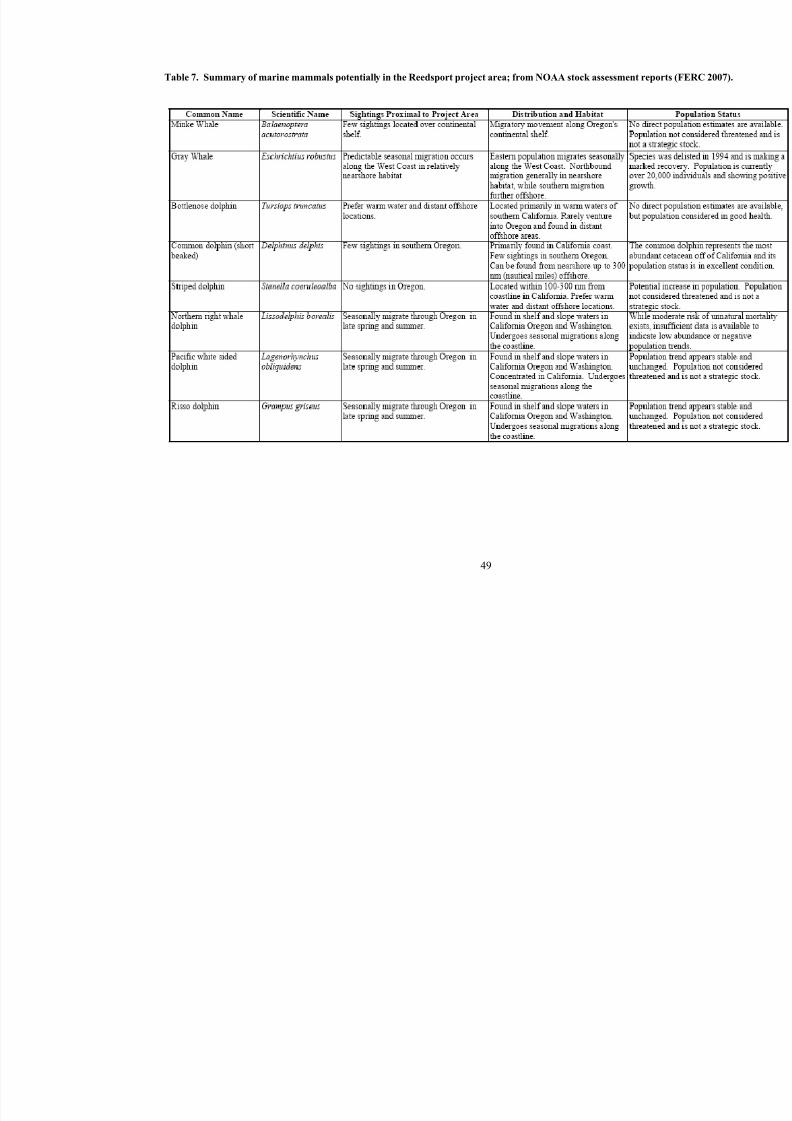
8/3/2019 Wave Energy NOAATM92
http://slidepdf.com/reader/full/wave-energy-noaatm92 61/186
49
Table 7. Summary of marine mammals potentially in the Reedsport project area; from NOAA stock assessment repor

8/3/2019 Wave Energy NOAATM92
http://slidepdf.com/reader/full/wave-energy-noaatm92 62/186
50
Table 7 continued. Summary of marine mammals potentially in the Reedsport project area; from NOAA stock assess

8/3/2019 Wave Energy NOAATM92
http://slidepdf.com/reader/full/wave-energy-noaatm92 63/186
51
Environmental Effects
Conceptual Approach
A generic framework for ecological risk assessment was developed by the U.S.Environmental Protection Agency during theearly 1990s (USEPA 1998). This approach provides a simple conceptual model of ecological risk that is valuable in the context of developing a systematic view of possibleecological effects. For purposes of thisworkshop, a “conceptual model” was defined asan ecosystems-based diagram that illustratesintegrated physical and biological relationshipsfor understanding the potential ecological effectson the ecosystem off the Oregon coast. Theconceptual model also helps to clarify risks anduncertainties, guides the analysis of effects, andcould provide a framework for an adaptivemanagement program.
The needed terminology for this modelrequires defining stressors and receptors:stressors are agents of change in theenvironment; and receptors are characteristics of the environment (generally ecological entities)in which change from stressors can result and,hopefully, be measured. The terms stressor andagent are synonymous in the parlance of
ecological risk assessment.
The assessment of ecological risk additionally requires the characterization of twocomplementary components of the risk in themodel. First, e xposure is defined as “the contactor co-occurrence of a stressor with a receptor”(USEPA 1998). Hence, a very important part of ecological risk assessment is the analysis thatleads to estimates of exposure for key species or assemblages or habitats. Second, the“characterization of ecological effects describes
the ability of a stressor(s) to cause adverseeffects under a particular set of circumstances”(USEPA 1998). An ecological effect may be assimple as a basic toxicological dose-responsecurve, or as complicated as the modification of acomplex behavioral repertoire. An estimate of ecological risk accordingly requires estimates of the magnitudes of both the exposure and theeffects. The focus of this briefing paper, and the
related workshop exercise, is principally toassess the magnitude of the exposure of thereceptors to the stressors. In some cases it may be appropriate to begin to assess the magnitudeof the effects.
In order to be comprehensive, manyenvironmental analyses utilize one or a set of impact matrices. Such a matrix is employed bythe European Marine Energy Centre (EMEC2005), the European Union’s research anddevelopment center for alternative energydevelopment, to summarize the possible effectsof wave energy devices deployed at the center.Table 8 is a wave energy development summaryimpact matrix modified from the EMEC model.The columns correspond to groups of receptors,whereas the rows correspond to groups of
stressors. It may be helpful to differentiate between the exposure and effects factors for each box in the matrix, however specific. Table9 shows a hypothetical summary matrix for theoperations stressors that could be used tocommunicate information about level of concern, possible mitigation effectiveness, andlevel of confidence.
The summary matrix lumps stressors andreceptors, but in practice, it may be expanded tothe level specific to the risk analysis. For
example, the mooring lines, not the anchors or subsurface floats, may be the Mooring Systemstressor of concern for whale entanglement.However, different species of whales (e.g., baleen whales or toothed whales) may havedifferent levels of exposure or differentresponses to the stressor, whereas the summarymatrix includes only a column for cetaceans.The matrix may be expanded to the levelnecessary at the appropriate level of theassessment (the present level is regional). Table10 shows a matrix that addresses the acoustics
stressor at a more specific level that may beuseful in considering specific stressors or receptors.
Finally, it may be helpful to use a smallsubmatrix to structure the discussion. Table 11shows a submatrix that includes estimates of exposure and response to a given stressor, potential effectiveness of mitigation, and

8/3/2019 Wave Energy NOAATM92
http://slidepdf.com/reader/full/wave-energy-noaatm92 64/186
52
Table 8. Summary impact matrix for wave energy development on the Oregon continental shelf.
Activity (agent or stressor) Receptors
O c e a n W a v e
s
O c e a n C u r r e n t s
S e d i m e n t s
P l a n k t o n
F o u l i n g
C o m m u n i t y
M i g r a t o r y F i
s h
F o r a g e F i s h a n d
I n v e r t e b r a t e s
D e m e r s a l F i s h
E p i b e n t h i c
Emplacement
Mooring System
Electrical Transmission Infrastructure
Operation
Mooring System
Buoy or Other Generation Device
Electrical Transmission Infrastructure
Chemical Coatings
Decommissioning
Buoy or Device Removal
Transmission Infrastructure Removal
Anchor Removal or Decommissioning

8/3/2019 Wave Energy NOAATM92
http://slidepdf.com/reader/full/wave-energy-noaatm92 65/186
53
Table 9. Portion of hypothetical summary impact matrix for project operations with annotations for level of concern
yellow – of moderate concern; orange – of major concern), level of confidence (?), and possible mitigation effe
boxes are only for presentation purposes.

8/3/2019 Wave Energy NOAATM92
http://slidepdf.com/reader/full/wave-energy-noaatm92 66/186
54
Table 10. Hypothetical summary impact matrix for a specific set of stressors, in this case, acoustics.
Activity (agent or stressor) Receptors
O c e a n W a v e
s
O c e a n C u r r e n t s
B e n t h i c H a b i t a t s
P l a n k t o n
F o u l i n g
C o m m u n i t
P e l a g i c F i s h
F o r a g e F i s h a n d
I n v e r t e b r a t e s
D e m e r s a l F i s h
E p i b e n t h i c
i
b
Acoustic Frequency Signatures
Point Absorber
Attenuator
Oscillating Water Column
Overtopping
Mild Weather Acoustics (Quiet Days)
Heavy Weather Acoustics (Loud Days)
Important Frequencies for Key Biota
Acoustic Guidance Systems
Echo Effects?
Amplitude Effects (Overpressure)
Service Boats and Equipment

8/3/2019 Wave Energy NOAATM92
http://slidepdf.com/reader/full/wave-energy-noaatm92 67/186
55
Table 11. Submatrix for discussion and evaluation of specific matrix intersection points.
Category/Rank Low Medium HighLevel of
confidencePotential for Exposure to Stressor
Potential for Response to Stressor
Potential Effectiveness of Mitigation
Residual Environmental Effect
residual effect—that is, effect after anymitigation. Levels of confidence may beestimated as low, medium, or high for each row;this would ultimately affect the prioritization of effects and a gap analysis. Stochasticcomponents might take part in predictions of both exposure (e.g., proportion of a whale
population actually encountering a stressor waveenergy buoy) and response (e.g., proportion of a population seriously injured by a collision).Level of confidence is meant to include level of uncertainty (measured or not) and level of scientific agreement. Ideally, such a submatrixmight underpin each call made in an overalleffects matrix.
Reasonably Likely and Foreseeable
Effects
Reasonably likely and foreseeable effectsmay be considered as a product of exposure andresponse in a four-way contingency table.Where both exposure and response are minor or of low likelihood, the issue may well be scopedout of the analysis. Where either the level of exposure or the response is of great cause for concern, the issue will not likely be scoped outof the analysis. Ultimately, the intent is to givea sense of priority for the meaningful allocationof limited resources to the right issues.
Emplacement/Deployment Effects
Deployment of wave energy devices willinclude service boat and barge use and their attendant risks; and considerable bottomdisturbance during deployment of bottomstructures, including the anchoring systems or mooring and the transmission systems. This bottom disturbance will impact the infauna and
the epifauna that are not motile enough to leavethe area.
Operational Stressor Signals
The operational stressors are considered inturn below, and high points of the findings of the
significant reviews or syntheses are very brieflyreported. The key references for this section arethe Scottish Executive’s StrategicEnvironmental Assessment (Faber Maunsell andMETOC PLC 2007), with two supportingdocuments on vertebrate collisions (Wilson et al.2007) and acoustics (Richards et al. 2007); theEnvironmental Assessment for the Makah Bay(WA) project (FERC 2006); the preliminaryapplication for the Reedsport (OR) project(FERC 2007); the Minerals ManagementService’s (MMS) worldwide assessment (Michel
et al. 2007); MMS’ programmatic draft EIS for alternative energy (MMS 2007); a technicalreview in support of the Kaneohe Bay (HI) project (Sound & Sea Technology 2002); and amemorandum on electromagnetic field insupport of the Cape Wind (MA) wind energy project (Valberg 2005).
In applying the evolving literature onalternative energy effects in coastal seas, particularly the work coming from Europe (e.g.,Faber-Maunsell and METOC PLC 2007), a focal
consideration is the effect of the array. Buoy or device effects may be considered individually, but the effect of a full commercial array, up tothree miles long and comprised of hundreds of buoys or other devices, may create more than anadditive risk for a given stressor. Long, linear arrays may, in fact, act as barriers to certaingroups of biota, depending on the signature of concern; for example, sound. The distance of

8/3/2019 Wave Energy NOAATM92
http://slidepdf.com/reader/full/wave-energy-noaatm92 68/186
56
the devices from one another (e.g., 100 m atReedsport) will also be a major factor in arrayeffects. Moreover, the effects of the array needto be considered in the context and scale of theecosystem component, whether it is the littoralcell, or subcell, in the physical process, or the
life history context of migratory species such aswhales, seabirds, or anadromous fish.Mitigation is intended in the following section tomean minimization or avoidance of effects, notto mean ecological or monetary compensation.Mitigation may be very effective in some cases,especially through siting decisions that take intoaccount the physical or ecological processcontext.
Physical signatures on wave energy, currents,
and sediment transport
Issue: Wave energy devices will necessarilyremove some energy from the wave train, andthus, the littoral system. Resultant effects mayinclude alterations in currents and sedimenttransport.
Findings:
Makah Bay: The environmental assessmentfor Makah Bay concluded that there would be anegligible effect on littoral transport from asingle buoy and that the deployment depth(150 ft, about 46 m) was well below the so-called wave closure depth of about 56 ft (about17 m; 2.28 times the maximum 12 hour waveheight) such that changes in bathymetry wouldnot be expected (FERC 2006).
Programmatic Draft EIS: MMS’ PDEIS for alternative energy estimated that a wave energyfacility could reduce wave height by 10% to15% with maximum effect within 2 km inshore,and could result in an interruption of littoral driftdepending on placement in the littoral cell.
Structural drag on currents is not expected to bea significant component (MMS 2007).
Worldwide Assessment : This assessmentfound that wave energy reduction has beenestimated at between 3% and 13% at theshoreline and recognized that the effect onwaves, currents, and sediment transport will betechnology- and location-specific; hence,
underscoring the importance of appropriatesiting (Michel et al. 2007).
Reedsport Project : The PreliminaryApplication Document (PAD) cites cumulativewave strength attenuation of up to 12% to 15%
for an array of 14 buoys. Modeling predicted amaximum instantaneous attenuation of waveamplitude of 2.1%, and OPT concluded that the project will have an insubstantial effect onerosion/accretion at the shoreline (FERC 2007).
Scottish Executive: The strategicenvironmental analysis found that, with realisticcalculations, a maximum of 10% of the energyand 5% of the wave height arriving at theshoreline might be absorbed by a wave energyarray 3 km long. The report concluded there
would be only minor effects, but with lowconfidence, and recommended appropriateanalysis and siting within local littoral cells(Faber Maunsell and METOC PLC 2007).
Mitigation: Some mitigation of the physicaleffects of energy absorption may be achieved byappropriate siting and choice of appropriatetechnologies.
Hard surfaces: buoys and anchoring
systems—collision, entanglement and/or
entrapment
Issue: The deployment of structures in a previously clear area brings the risk of collisionand/or entanglement of animals; primarily thelarger fish, the seabirds, and the marinemammals.
Findings:
Kaneohe Bay: The risk of cetaceanentanglement was considered minimal for this project because the four buoys were attached to
the seafloor instead of being anchored by buoyswith lines, and the cable was intended to runalong the seafloor. Entrapment risk wasminimized by buoy design, and collision risk was not assessed (Sound & Sea Technology2002).
Makah Bay: The Environmental Assessmentconcluded that risk of cetacean entanglement

8/3/2019 Wave Energy NOAATM92
http://slidepdf.com/reader/full/wave-energy-noaatm92 69/186
57
was minimal because the exposure of a single buoy was low, and the anchor lines would havesufficient tension to avoid the entanglementcharacteristically seen with smaller and lighter tensions (FERC 2006).
Programmatic Draft EIS: The MMS PDEISfor alternative energy (MMS 2007) states thatwave energy facilities may have as many as2,500 mooring lines securing the wave energydevices to the ocean floor. Thus, marinemammals swimming through a wave energyfacility may strike and become entangled inthese lines, becoming injured or drowning.Depending on the species affected, entanglementmay result in minor to major impacts to marinemammals.
Worldwide Assessment : This assessmentfound it likely that migrating gray whales wouldinteract with wave energy devices on the U.S.West Coast and that entanglement in mooringcables could cause an impact. It also found thatseabird exposure would likely increase due toattraction to fish responding to the FishAttraction (or Aggregation) Devices (FAD) (see below) effect (Michel et al. 2007).
Reedsport Project : This document addressesthe possible collision or entanglement of
cetaceans by recommending mitigation viaacoustic “guidance” devices. Seabirds are notexpected to have significant collision risk because all structures will be large enough to bevisible. The document also states that designcharacteristics of the buoys themselves will prevent hauling-out by pinnipeds (FERC 2007).
Scottish Executive: This report dealt withvertebrate collision risk in some detail, citingmany conclusions of a supporting study by theScottish Association for Marine Science thatmade clear the complexity of vertebrate behavioral responses (Wilson et al. 2007). Thestrategic environmental assessment concludedthat risk of collision for marine mammals andseabirds was very uncertain and that theconclusion was made with very low confidence(Faber Maunsell and METOC PLC 2007).
Mitigation: Mitigation for collision andentanglement can include visual cues, such ashighly visible paints, and acoustic “guidance” tocause animals to perceive the structures or avoidthem. Entanglement may also be avoided byusing thick, high-tension mooring lines.
Entrapment mitigation may be achieved both byvisual or acoustic avoidance, but more likely byappropriate device design considerations.
Hard surfaces: buoys and anchoring
systems—trophic effects
Issue: Wave energy arrays will provide amatrix of hard structures in areas previouslydevoid of any hard structure: this will include buoys at the surface and through much of thewater column, subsea pods (see Figure 10), and
anchors on sedimented substrates. This willlikely have ecological consequences from thefouling community up through the highest levelsof trophic structure.
Findings:
Makah Bay: The Environmental Assessmentconcluded that there would be no effect of thefour buoys on rockfish, surf smelt, or other marine fish. It further concluded that “Instead, project construction may result in a net gain for fish and other marine life that will benefit fromthe protection from fishing……and potentialdevelopment of small artificial reef areas alongthe transmission cable” (FERC 2006).
Programmatic Draft EIS (MMS 2007): TheMMS PDEIS states that placement of structures,such as pilings on the OCS, would introduce anartificial hard substrate that opportunistic benthic species that prefer such substrate couldcolonize; and that minor changes in speciesassociated with softer sediments could occur dueto scouring around the pilings. Fishes, including
pelagic species, would likely be attracted tothese artificial habitats, and fish populationnumbers in the immediate vicinity of the platforms are likely to be higher than insurrounding waters away from the structures.The overall change in habitat could result inchanges in local community assemblage anddiversity. Although the anchors or pilings

8/3/2019 Wave Energy NOAATM92
http://slidepdf.com/reader/full/wave-energy-noaatm92 70/186
58
needed to install an individual wave energy unitwould represent only a small amount of artificialhabitat that would likely have little effect onoverall fish populations, there is a possibilitythat major projects that cover large areas couldresult in substantial changes in the abundance
and diversity of particular fish species within thearea. Effects on diversity and fish abundancewould be project-specific since they would belargely dependent on the prevalence of varioustypes of habitats and fish species withinsurrounding areas.
Worldwide Assessment : This assessmentconcludes that wave energy device arrays willfunction as Fish Attraction (or Aggregation)Devices (FADs), and that the ultimatecommunity of resident fish will change to an
assemblage with more place-based affinity(Michel et al. 2007).
Reedsport Project : This documentrecognizes the potential for the anchoringsystem to act as hard substrate for the foulingcommunity and consequent potential for changesin the other resident biota, especially fishspecies. The fouling community is alsoexpected to colonize the mooring lines, whichwill need periodic maintenance for removal(FERC 2007).
Scottish Executive: The report on collisionrisks detailed the effect of arrays as FADs, andconcluded that this effect might attract birds andmarine mammals as well as fish (Wilson et al.2007).
Mitigation: The mitigation potential for trophic changes due to hard surfaces andstructure is not known at this time.
Chemicals: coatings, metals, and organics
Issue: Wave energy devices will create the potential for chemical effects from a variety of sources, including toxins in antifouling paints;metals including lead and zinc; and organics,such as those used for hydraulic fluids.
Findings:
Makah Bay: The environmental assessmentnoted that the Aquabuoy® uses seawater as itshydraulic fluid, and the project applicant agreedto “try different brands of antifouling paints to
identify those that work best.” (FERC 2006).
Programmatic Draft EIS (MMS 2007): ThePDEIS for alternative energy stated that copper-or tin-containing compounds could be used tocontrol fouling, and that tin would remaineffective for longer, but no attempt was made toassess the environmental impact. Hydraulicspills are also a risk (MMS 2007).
Worldwide Assessment : This assessmentrecognized the importance of nonimpacting
antifouling coatings, noting that the UnitedStates has banned domestic use of tributyl tin(TBT) products and is working to have their use banned worldwide (Michel et al. 2007).
Reedsport Project : This document addressesthe issue of hydraulic leaks by stating that nodevice will contain more than 400 gallons of vegetable-based, biodegradable hydraulic fluid(FERC 2007). Other sources of toxicity are notdiscussed.
Mitigation: Partial mitigation for hydraulicspills is achieved through the use of vegetable- based, rather than petroleum-based, hydraulicfluids. New, less toxic antifouling chemicals arecontinuously being tested in an effort to find lesstoxic and more specifically targeted agents.
Electromagnetic fields
Issue: Wave energy devices will necessarilygenerate electrical (E) and magnetic (B) fields(EMF) as they produce and transmit electricalcurrents. At issue is the sensitivity of particular
groups of the biota, especially the potentialresponses of elasmobranchs (attraction,repulsion, or other behavioral taxis), and theeffectiveness of mitigation, primarily throughshielding.

8/3/2019 Wave Energy NOAATM92
http://slidepdf.com/reader/full/wave-energy-noaatm92 71/186
59
Findings:
Cape Wind : The Cape Wind study concludesthat trenching and shielding would effectively prevent any effects to the biota (Valberg 2005), but this report considered only the cabling.
Kaneohe Bay: This report found that effectsof electrical fields could be minimized byshielding, as shown by studies on existing cables(e.g., in New Zealand). It also found thatelasmobranchs, sea turtles and cetaceans mightsense the magnetic field surrounding the cablingfrom the project, but any effects were uncertain(Sound & Sea Technology 2002). This studydid not consider the EMF effects of the buoysthemselves.
Makah Bay: The Makah Bay EnvironmentalAssessment concluded that EMF effects would be “minor and temporary ranging from noimpact to avoidance for organisms inhabiting theseafloor near the cable.” This conclusion was based on the Kanehoe Bay findings, the amountof power passing through the cable, and the factthat the signal would be DC, thereby creatingless of an EMF than AC (FERC 2006). Noanalysis was made of the EMF signature or effects of the buoy itself.
Programmatic Draft EIS: The PDEIS for alternative energy found that EMF effects from asubmarine power cable would be negligible, butunderscored the lack of information on effects(MMS 2007). Again, no analysis was made of the EMF signature or effects of the buoysthemselves.
Worldwide Assessment : This assessmentnotes that Pacific salmon may be affected bymagnetic fields and also that there is substantialuncertainty about the response of marinemammals to EMF (Michel et al. 2007).
Reedsport Project : The PreliminaryApplication Document for the Reedsport projectincludes a good review of the literature alsocited here. It states that the electricity generated by the buoys will be at 1/12 to 1/8 Hertz, presumably corresponding to an 8- to 12-second period reciprocation time. (This is well belowthe 7–8 Hertz lower limit above which sharks
and rays apparently cannot perceive AC.) Thecurrent will be rectified at the subsea pod to 60Hertz. The report states categorically that theelectrical field around the buoys and the subsea pods will be completely eliminated by theFaraday cage effect of the surrounding steel
structures. Any EMF impacts to migratingsalmon are expected to be minimal due to thisgroup’s brief period of exposure. Magneticfields around the transmission cables areexpected to be minimal (FERC 2007).
Scottish Executive: The strategicenvironmental assessment concludes that DCand low-frequency AC electrical fields are of concern, mainly for elasmobranchs. The reportnoted that wave energy “devices themselves willalso have an electrical signature, however this
will be specific to the individual devices” andthat this is an unknown at the present time(Faber Maunsell and METOC PLC 2007).
Mitigation: Armoring and trenching areclaimed to be effective EMF mitigation for submarine cables. The use of so-called Faradaycages to eliminate EMF fields around waveenergy devices or subsea pods has a basis intheory, but has not to date been demonstrated in practice.
Acoustics
Issue: Wave energy devices will haveacoustic signatures, from the impingement of waves on above-water structures to generatorsand switching systems. Fish and seabirds aresensitive to sounds and many marine mammalsare dependent on sound for life processes fromfeeding to mating. Acoustic guidance systemsthemselves may also have ecological effectsother than those intended.
Findings:
Kaneohe Bay: This report treats acoustics insome detail and provides a good review of thesensitivity of the biota in the area. The reportconcludes that only humpback whales, twospecies of dolphins and green sea turtles could be affected, and that there is no evidence that thefrequency or amplitude of the sound from the

8/3/2019 Wave Energy NOAATM92
http://slidepdf.com/reader/full/wave-energy-noaatm92 72/186
60
four buoys would cause harm to these species(Sound & Sea Technology 2002).
Makah Bay: The Environmental Assessmentclaimed that there would be no adverse effect onwhales due to the relative strengths of the device
versus ambient (ocean) noise and the fact thatthe devices would be well below 145 dB; thisfinding was also applicable to fish (FERC 2006).
Programmatic Draft EIS: This reviewindicates that although underwater noise would be produced by the hydraulic machineryassociated with wave energy generation devices,it is currently unclear what the sound levelswould be. Noise and vibrations associated withthe operation of the generation units would betransmitted into the water column and,
depending on the anchoring system used, thesediment. Depending on the intensity, suchnoises could potentially disturb or displace somemarine mammals and fish within surroundingareas or could mask sounds used by theseanimals for communicating and/or detecting prey (MMS 2007).
Worldwide Assessment : This assessmentcited Hagerman and Bedard (2004) in findingthat expected wave energy generation devicenoises would be “light” as compared to
transportation noises (Michel et al. 2007). (Thetwo prior reports [FERC 2006, MMS 2007]considered amplitude but not frequency in their evaluations.)
Reedsport Project : This documentacknowledges the potential use of acousticguidance devices to mitigate the potential for collision and entanglement of cetaceans; theoverall effect of either passive (the buoys’ ownsounds) or active (use of sound generatingdevices) sound to cause whales to avoid the buoy array is not yet known (FERC 2007).
Scottish Executive: The strategic assessmentwas supported by a detailed study that concludedmajor overpressures (loudness) leading totemporary or permanent hearing loss were not amajor risk during operations, even within squarearrays, but rather that arrays could act as physical barriers due to the responses to fields of
sound. This report recommended appropriatestudies of acoustic signatures of devices and of site-specific ambient sound in a wide array of conditions (Richards et al. 2007).
Mitigation: Known mitigation for
operational noises is limited to design factorsand appropriate siting.
Lighting effects
Issue: The lighting required by the U.S.Coast Guard to address safety considerationsmay attract biota, especially seabirds, to thegeneration devices.
Findings:
Reedsport Project : This document reportsthat a 14-buoy array will have “at least four toeight lights”, and concludes that lighting mayaffect the potential for nighttime seabirdcollisions (FERC 2007).
Mitigation: Mitigation may be limited to theminimum use of nighttime lighting to achievesafety goals.
Cumulative Effects
The National Environmental Policy Act
(NEPA) defines cumulative impact as: “theimpact on the environment which results fromthe incremental impact of the action when addedto other past, present, and reasonablyforeseeable future actions regardless of whatagency (Federal or non-Federal) or personundertakes such other actions. Cumulativeimpacts can result from individually minor butcollectively significant actions taking place over a period of time.”
For purposes of this workshop, the
consideration of cumulative operational waveenergy effects included the summary effects of all of the stressors and receptors in the system.Cumulative effects also go beyond the effects of a single wave energy array to assess the effectsof multiple arrays. Ultimately, three keyquestions may be appropriate for considerationof cumulative effects in a given oceanographicregion like the Pacific Northwest:

8/3/2019 Wave Energy NOAATM92
http://slidepdf.com/reader/full/wave-energy-noaatm92 73/186
61
1. How large can a single array of devicesget before effects begin to accumulate?
2. How many arrays can be deployed in aregion before effects begin toaccumulate?
3. Over what time-frame is/are the effect(s)going to occur?
One breakout session at the workshop wastasked with a systems view of cumulativeimpacts.
Maintenance Effects
Wave energy devices will require routinemaintenance. Low-level maintenance will likelyinvolve the use of service boats to performmaintenance activities in situ. Higher levelmaintenance or overhaul will likely requiretransport of devices by service boat to portwhere the work will take place. Effects wouldinclude those associated with operation of thevessel class of the service boats.
Accident Effects
System survivability is an issue with thisnew technology and the effects analysis shouldinclude some consideration of the effects of wave energy devices coming loose from their
moorings. Maintenance may also be required in
inclement conditions, thereby increasing the probability of accidents. A potential accidentaleffect is the loss of electrical insulating oil(mineral oil) which is housed with thetransformers located in the subsea pods.
Decommissioning Effects
Decommissioning of wave energy facilitieswill include the use of service boats and/or barges to remove all deployed equipment,devices, anchoring systems, and transmissionsystems from the site. Removal of very largeanchors may require jetting and could possiblycause more bottom disturbance thandeployment. Balancing of decommissioningcost and benefits will also involve considerationof any artificial reef benefits from structures
such as anchors.
Policy Linkages for Effects Analysis
One area in which natural resourcemanagement policy impacts the scientificdiscussion is the existence of federal and statelists of Threatened and Endangered speciesunder the Endangered Species Act (ESA). A preliminary list of ESA species possibly affected by wave energy development on the Oregonshelf is shown in Table 12 below. The
workshop participants were asked to give somesense of priority to these resources that arealready at risk.

8/3/2019 Wave Energy NOAATM92
http://slidepdf.com/reader/full/wave-energy-noaatm92 74/186
62
Table 12. Federal and state listed species found in the Oregon nearshore ocean.
Common Name Scientific Name Lister Status
Fish
Snake River Chinook Salmon(spring/summer)
Onchorhynchus tshawaytscha F T
Snake River Chinook Salmon(fall)
Onchorhynchus tshawaytscha F T
Upper Willamette River Chinook Salmon
Onchorhynchus tshawaytscha F E
Oregon Coast Coho Salmon Onchorhynchus kisutch F T*
Lower Columbia River Coho Salmon Onchorhynchus kisutch F E
Columbia River Chum Salmon Onchorhynchus keta F T
Upper Willamette River Steelhead Onchorhynchus mykiss irideus F T
Lower Columbia River Steelhead Onchorhynchus mykiss irideus F T
Upper Columbia River Steelhead Onchorhynchus mykiss gairdneri F TSnake River Steelhead Onchorhynchus mykiss gairdneri F T
Snake River Sockeye Salmon Onchorhynchus nerka F E
Reptiles
Green Sea Turtle Chelonia mydas F E
Leatherback Turtle Dermochelys coriacea F E
Loggerhead Sea Turtle Caretta caretta F T
Pacific Ridley Sea Turtle Lepidochelys olivacea F T
Birds
Short-tailed Albatross Diomedea albatrus F E
Brown Pelican Pelecanus occidentalis F E
Western Snowy Plover Charadrius alexandrinus nivosus F T
California Least Tern Sterna antillarum browni F E
Marbled Murrelet Brachyramphus marmoratus F T
Mammals
Sei Whale Balaenoptera borealis F E
Blue Whale Balaenoptera musculus F E
Fin Whale Balaenoptera physalus F EGray Whale Eschrichtius robustus S E North Pacific Right Whale Eubalaena japonica F EHumpback Whale Megaptera novaeangliae F ESperm Whale Physeter macrocephalus F E Northern (Steller) Sea Lion Eumetopias jubatus F TKey: Lister – S = State; F = Federal. Status – T = Threatened; E = Endangered; * = In litigation.

8/3/2019 Wave Energy NOAATM92
http://slidepdf.com/reader/full/wave-energy-noaatm92 75/186
63
Bibliography and Literature Cited
AquaEnergy Group, Ltd. 2005. AquaBuOY WaveEnergy Converter. Formerly online athttp://www.aquaenergygroup.com. Currently:Finavera Renewables. c2007. Online at
http://finavera.com [accessed 5 March 2008].
Archimedes Wave Swing. 2006. Archimedes waveswing website. c2004–2008, AWS OceanEnergy Ltd. Online at http://www.waveswing.com [accessed 5 March 2008].
Bedard, R. 2005. Oregon offshore wave energydemonstration project: Bridging the gap betweenthe completed phase 1 project definition studyand the next phase – phase 2 detailed design and
permitting. Electrical Power Research InstituteReport E2I EPRI WP-010 OR. Palo Alto, CA.Online at http://oceanenergy.epri.com/
attachments/wave/reports/Ph_15_Oregon _Wave_Final_RB_121305.pdf [accessed 1March 2008].
Bedard, R., G. Hagerman, M. Previsic, O. Siddiqui,R. Thresher, and B. Ram. 2005. Offshore wave
power feasibility demonstration project: Finalsummary report, project definition study, EPRIGlobal WP 009–US Rev 1, Jan. 14, 2005.Electrical Power Research Institute. Palo Alto,CA.
Bottom, D., J. A. Lichatowich, and C. A. Frissell.1998. Variability of Pacific Northwest marineecosystem and relation to salmon production. In McMurray, G. R. and R. J. Bailey (eds.), Changein Pacific Northwest coastal ecosystems. NOAACoastal Ocean Program Decision Analysis Series
No. 11, NOAA National Centers for CoastalOcean Science, Silver Spring, MD.
Braun, G. M. 2005. Benthic infauna at the mouth of the Columbia River. Draft White Paper.Institute for Natural Resources, Oregon StateUniv., Corvallis.
Cada, G., J. Ahlgrimm, M. Bahleda, S. D. Stavrakas,
D. Hall, R. Moursund and M. Sale. 2007.Potential impacts of hydrokinetic and waveenergy conversion technologies on aquaticenvironments. Fisheries 32:174–181.
Christensen, L. 2006. Electronic mail fromChristensen (Wave Dragon ApS, Copenhagen,Denmark) to L. Habegger (Argonne NationalLaboratory, Argonne, IL, U.S.A.), 22 June 2006.
Cox, D. 2005. Sediment transport and nearshorehydrodynamics at the mouth of the ColumbiaRiver. Draft White Paper. Institute for NaturalResources, Oregon State Univ., Corvallis.
Department of the Navy. 2003. EnvironmentalAssessment, Proposed Wave Energy TechnologyProject, Marine Corps Base Hawaii, KaneoheBay, Hawaii, Jan. 2003.
EMEC. 2005. Environmental impact assessment(EIA) guidance for developers at the EuropeanMarine Energy Centre. European Marine EnergyCentre, Ltd., Orkney, Scotland. Online athttp://www.emec.org.uk/emec_documents.asp[accessed 23 August 2008].
Energetech. 2006. Media release: Port Kembla trial
deployment results, Nov. 2005. Current citation:Oceanlinx. 2007. Online at http://www.oceanlinx.com/uploads/MediaUpdateNov2005.pdf [accessed 5 March 2008].
European Thematic Network on Wave Energy(ETNWE). 2003. Results from the work of theEuropean Thematic Network on wave energy,ERK5-CT-1999-2001, 2000–2003. Online athttp://www.wave-energy.net [accessed 5 March2008].
Faber Maunsell and METOC PLC. 2007. Scottishmarine renewables strategic environmental
assessment report. Prepared for the ScottishExecutive by Faber Maunsell and METOC PLC.Online at http://www.seaenergyscotland.co.uk/[accessed 7 May 2008].
FERC (Federal Energy Regulatory Commission).2006. Preliminary draft environmentalassessment: Makah Bay offshore wave energy
pilot project. FERC Docket No. DI02-3-002.FERC, Washington, DC.
FERC (Federal Energy Regulatory Commission).2007. Pre-application document: Reedsport OPT
wave park. Reedsport Wave Energy Project,LLC, FERC Project No. 12713. FERC,Washington, DC.
Gallagher, E. D., P. A. Jumars, and D. D. Trueblood.1983. Facilitation of soft-bottom benthicsuccession by tube builders. Ecology 64:1200– 1216.

8/3/2019 Wave Energy NOAATM92
http://slidepdf.com/reader/full/wave-energy-noaatm92 76/186
64
GLOBEC (U.S. Global Ocean EcosystemDynamics). 1996. North Pacific ClimateChange and Carrying Capacity (CCCC) SciencePlan. Report Number 16. Online at http://www.usglobec.org/reports/pdf/rep16.pdf [accessed 5 March 2008].
GLOBEC (U.S. Global Ocean EcosystemDynamics). 2001. Ocean surface driftersreleased off the Oregon coast; wind drivencirculation off Oregon. GLOBEC NortheastPacific Program. Online at http://diana.oce.orst.edu/drift/wind-driven.shtml [accessed 5March 2008].
Greenland, D. 1998. Variability and stability of climatic/oceanic regimes in the Pacific
Northwest. In McMurray, G.R. and R.J.Bailey(eds.), Change in Pacific Northwest coastalecosystems. NOAA Coastal Ocean Program
Decision Analysis Series No. 11, NOAA National Centers for Coastal Ocean Science,Silver Spring, MD.
Hagerman, G, and R. Bedard. 2004. Offshore wave power in the US: Environmental issues. GlobalEnergy Partners, LLC Report E2I Global EPRI-007-US. Online at http://oceanenergy.epri.com/attachments/wave/reports/007_Wave
_Envr_Issues_Rpt.pdf [accessed 1 March 2008].
Hagerman, G., R. Bedard, and M. Previsic. 2004.E2I EPRI survey and characterization of
potential offshore wave energy sites in Oregon.
Electrical Power Research Institute Report E2IEPRI WP-OR-003. Palo Alto, CA. Online athttp://oceanenergy.epri.com/attachments/wave/reports/003_Oregon_Site_Report.pdf [accessed 1March 2008].
Herzing, D. L., and B. R. Mate. 1984. Gray whalemigrations along the Oregon coast, 1978–1981. In M. L. Jones, S. Swartz and S. Leatherwood(eds.), The gray whale, p. 289–307. AcademicPress, New York.
Hodder, J. 2005. Marine mammal use of thenearshore waters along Clatsop Spit: Anassessment of distribution, abundance, and
potential effects from dredge spoil depositionadjacent to the south jetty of the Columbia River.Review Draft. Institute for Natural Resources,Oregon State Univ., Corvallis.
Keister J., and W. Peterson. 2003. Zonal andseasonal variations in zooplankton community
structure off the central Oregon coast, 1998– 2000. Prog. Oceanogr. 57:341–361.
Kosro, P. M. 2007. Ocean currents mapping lab.Online at http://bragg.coas.oregonstate.edu/[accessed 6 March 2008].
Kröncke, I. 1990. Macrofauna standing stock of theDogger Bank. A comparison: II. 1951–1952versus 1985–1987. Are changes in thecommunity of the northeastern part of theDogger Bank due to environmental changes?
Neth. J. Sea Res. 25:189-198.
JAMSTEC (Japan Marine Science and TechnologyCenter). 2006. Wave Energy Research andDevelopment at JAMSTEC, Offshore FloatingWave Energy Device, Mighty Whale. Online athttp://www.jamstec.go.jp/jamstec/MTD/Whale/index.html [accessed 6 March 2008].
Lamb, J., and W. Peterson. 2005. Ecologicalzonation of zooplankton in the COAST studyregion off central Oregon in June and August2001 with consideration of retentionmechanisms. J. Geophys. Res.110, C10S15,doi:10.1029/2004JC002520.
Lance, M. M., S. A. Richardson and H. A. Allen.2004. Sea Otter Recovery Plan. WashingtonDepartment of Fish and Wildlife, WildlifeProgram, Olympia, WA. Online at http://wdfw.wa.gov/wlm/diversity/soc/recovery/seaotter/final_seaotter_recovery_plan_dec2004
.pdf [accessed 6 March 2008].
Landry, M. R., J. R. Postel, W. K. Peterson and J. Newman. 1989. Broad-scale patterns in thedistribution of hydrographic variables. p. 1–41. In M.R. Landry and B.M. Hickey. Coastaloceanography of Washington and Oregon.Elsevier Press, Amsterdam.
Lane, N. 2007. Issues affecting tidal, wave, and in-stream generation projects. CongressionalResearch Service Report RL33883. Online at
National Council for Science and theEnvironment, CRS reports, http://www
.ncseonline.org/NLE/CRSreports/07Sep/RL33883.pdf [accessed 6 March 2008].
LASAR. 2007. Preliminary laboratory results for EPA-funded Coastal Environmental Monitoringand Assessment Program (EMAP). LabAnalytical Storage and Retrieval (LASAR)System, Oregon Department of EnvironmentalQuality, Laboratory Division, Portland.

8/3/2019 Wave Energy NOAATM92
http://slidepdf.com/reader/full/wave-energy-noaatm92 77/186
65
Mate, B. R., and J. Harvey. 1984. Oceanmovements of radio-tagged gray whales. In M.L. Jones, S. Swartz, and S. Leatherwood (eds.),The gray whale, p. 577–589. Academic Press,
New York.
Mate, B. R., B. A. Lagerquist, and J. Urban-Ramirez.
2003. A note on using satellite telemetry todocument the use of San Ignacio Lagoon by graywhales ( Eschrichtius robustus) during their reproductive season. J. Cetacean Res. Manage.5:149–154.
Mate, B. R., and J. Urban-Ramirez. 2003. A note onthe route and speed of a gray whale on itsnorthern migration from Mexico to centralCalifornia, tracked by satellite-monitored radiotag. J. Cetacean Res. Manage. 5:155–157.
Michel, J., H. Dunagan, C. Boring, E. Healy, W.
Evans, J. M. Dean, A. McGillis, and J. Hain.2007. Worldwide synthesis and analysis of existing information regarding environmentaleffects of alternative energy uses on the outer continental shelf. MMS OCS Report 2007-038.U.S. Dept. of the Interior, Minerals ManagementService, Herndon, VA.
MMS (Minerals Management Service). 2006.Technology white paper on wave energy
potential on the U.S. outer continental shelf.Renewable Energy and Alternate Use Program,MMS, Reston, VA.
MMS (Minerals Management Service). 2007.Programmatic draft environmental impactstatement for alternative energy development andalternate uses on the OCS. MMS, Reston, VA.
Niermann, U., E. Bauerfeind, W. Hickel, and H. V.Westernhagen. 1990. The recovery of benthosfollowing the impact of low oxygen content inthe German Bight. Neth. J. Sea Res. 25:215– 226.
NMFS (National Marine Fisheries Service). 2003.Large whale entanglement report 2001 (updated2003). NOAA National Marine Fisheries
Service, Protected Resources Division,Gloucester, MA.
NMFS (National Marine Fisheries Service). 2005.Pacific coast groundfish fishery management
plan: Essential fish habitat designation andminimization of adverse impacts. FinalEnvironmental Impact Statement. NOAA
National Marine Fisheries Service, Seattle, WA.
Ocean Power Delivery Ltd. 2006. World’s firstwave farm–shipping of first machine to Portugal,Press Release, March 14. Formerly online athttp://www.oceanpd.com. Currently Greenjobs.c2004, 2006. Renewable Energy Industry News.Online at http://www.greenjobs.com/Public/IndustryNews/i_news_00411.htm [accessed 6March 2008].
Ocean Power Technologies. 2006. Making Wavesin Power. Online at http://www.oceanpower technologies.com [accessed 6 March 2008].
ODFW Nearshore Team. 2006. The Oregonnearshore strategy. Oregon Department of Fish& Wildlife, Marine Resources Program,
Newport.
Pearcy, W. G. 2005. Marine fishes. Draft WhitePaper. Institute for Natural Resources, Oregon
State Univ., Corvallis.Pearson, W. H. 2005. Issues concerning Dungeness
crabs and the demonstration project for theColumbia River Nearshore Beneficial UseProject. Review Draft. Institute for NaturalResources, Oregon State Univ., Corvallis.
Pearson, T. H. and R. Rosenberg. 1978.Macrobenthic succession in relation to organicenrichment and pollution of the marineenvironment. Oceanogr. Mar. Biol. Annu. Rev.16:229–311.
PFMC. 2006. Measures to prohibit fishing for krillin the Exclusive Economic Zone off the WestCoast. Pacific Fishery Management Council,Portland, OR.
Polaski, K. 2003. Waiting for the Waves. The IEAOcean Energy Systems Newsletter, Issue 2,September. Online at http://www.iea-oceans.org/newsletters/ [accessed 7 March2008].
Rhinefrank, K. 2005. Wave energy research,development, and demonstration at Oregon StateUniversity. Presented at Energy Ocean 2005,
April 26– 28, Washington, DC.
Richards, S. D., E. J. Harland, and S. A. S. Jones.2007. Underwater noise study supportingScottish Executive strategic environmentalassessment for marine renewables. QinetiQ Ltd.,Farnborough, Hampshire.
Sound & Sea Technology Ocean Engineering. 2002.Wave energy (WET) environmental impacts of

8/3/2019 Wave Energy NOAATM92
http://slidepdf.com/reader/full/wave-energy-noaatm92 78/186
66
selected components. Report 02-06. Preparedfor Belt Collins Hawaii.
Strong, C. 2005. Marine bird use of the nearshorewaters along Clatsop Spit: an assessment of composition, abundance, and potential effectsfrom dredge spoil deposition adjacent to the
south jetty of the Columbia River. ReviewDraft. Institute for Natural Resources, OregonState Univ., Corvallis.
Sutor, M., T. Cowles, W. Peterson, and S. Pierce.2005. Acoustic observations of finescalezooplankton distributions in the Oregonupwelling region. Deep-Sea Res. Part II Top.Stud. Oceanogr. 52:109–121.
Thorpe, T. W. 1999. A Brief Review of WaveEnergy. ETSU Report R-122, prepared for theUnited Kingdom Department of Trade and
Industry (as of 2007, the Department for Business, Enterprise and Regulatory Reform).
USDOE (U.S. Department of Energy). 2006.Proceedings of the hydrokinetic and wave energytechnologies technical and environmental issuesworkshop. Prepared by RESOLVE, Inc. for U.S.Department of Energy, Office of EnergyEfficiency and Renewable Energy, Wind andHydropower Technologies Program,Washington, DC.
USEPA (U.S. Environmental Protection Agency).1998. Guidelines for ecological risk assessment.U.S. Environmental Protection Agency, Risk Assessment Forum, Washington, DC.EPA/630/R-95/002F.
Valberg, P. A. 2005. Memorandum addressing
electric and magnetic field (EMF) questions.Cape Wind Energy Project, Nantucket Sound.Online at http://www.mms.gov/offshore/PDFs/CWFiles/141.pdf [accessed 7 March2008].
Wave Dragon. 2005. Technology. Online athttp://www.wavedragon.net [accessed 7 March2008].
WavePlane Production A/S (WPP A/S). 2006.Home page. Currently: WavePlane A/S. c2007.Home page. Online at http://www.waveplane
.com [accessed 7 March 2008].Wilson, B., R. S. Batty, F. Daunt, and C. Carter.
2007. Collision risk between marine renewableenergy devices and mammals, fish and diving
birds. Report of the Scottish Executive for Marine Science, Oban, Scotland. PA37 1QA.

8/3/2019 Wave Energy NOAATM92
http://slidepdf.com/reader/full/wave-energy-noaatm92 79/186
67
Breakout Groups
Introduction to the Breakout Groups
John Meyer, Oregon State University, and Robin Hartmann, Oregon Shores Conservation Coalition
In order to vet the important interactions between wave energy projects and the naturalenvironment, breakout sessions convened on both days of the workshop. Specifically, the breakouts were designed to accomplish thefollowing:
1. Initial assessment of the potential
impacting agents and ecological effectsof wave energy development inOregon’s coastal ocean
2. Development of a general conceptualframework of physical and biologicalrelationships that can be applied tospecific wave energy projects
The goal of answering the breakout groupquestions was to document
1. What we know
2. What we don’t know, including keyinformation gaps
3. Level of uncertainty, level of agreement
4. A sense of priority about environmentalissues
5. Any recommended studies or monitoring programs
Breakouts on the first day consisted of workshop participants addressing the potentialimpacts of wave energy projects on specific
sectors of the environment (i.e., receptors, suchas benthic habitat and sea birds). On the secondday, participants focused on specific aspects of awave energy project (i.e., stressors, such asacoustics and energy-absorbing structures) andtheir potential effects on the environment as awhole. A final breakout group consideredcumulative effects.
The Steering Committee determined breakout group membership based on a person’sexpertise on the subject, as well as the need toinclude participants with a diversity of knowledge. Each participant was assignedmembership to one breakout group on the firstday and to another on the second day.
RECEPTOR breakout groups (Day 1):
• Physical Environment
• Pelagic Habitat
• Benthic Habitat
• Fish and Fisheries
• Marine Birds
•
Marine Mammals
STRESSOR breakout groups (Day 2):
• Energy Absorbing Structures
• Chemical Effects
• Hard Structures and Lighting
• Acoustics
• Electromagnetic Effects
• System View and Cumulative Effects

8/3/2019 Wave Energy NOAATM92
http://slidepdf.com/reader/full/wave-energy-noaatm92 80/186
68
Questions for the stressor groups includedthe following:
• What is the status of knowledge of stressor X and the propagation/transmission of its direct
and indirect effects?• What are the key information gaps and
uncertainties about stressor X or itseffects?
• What are the key/vulnerable receptorsfor stressor X?
• What are the appropriate baseline andmonitoring parameters and possiblemanagement triggers for stressor X?
• What are the known mitigation
strategies for stressor X and their possible effectiveness?
• Given our knowledge of stressor X andthe system variability in time and space,can recommendations about the utilityand applicability of control areas bemade?
Questions for the receptor groups includedthe following:
• What are the key stressors of interest for
receptor X?• What are the key information gaps for
exposure and response for receptor X?
• Given our knowledge of receptor X andthe system variability over space andtime, can key baseline and monitoring parameters be recommended?
• Given our knowledge of receptor X and
the system variability over space andtime, can recommendations about theutility and applicability of control areas be made?
• Can stressors for receptor X beestimated or ranked?
• Can a response factor for receptor X beestimated or ranked?
In the final breakout group, System Viewand Cumulative Effects, the above questionswere integrated across the stressors, stressor
processes, and receptors, culminating in thespecific question: Are there any systemvulnerabilities not apparent in the stressor- or receptor-specific analyses?
Workshop participants were given severalhours each day to work through the questions,facilitated by a single member from the SteeringCommittee. Discussions were captured onflipcharts and by one participant assigned to takenotes in each group. All workshop participantsreconvened at the end of each session to report
the key points from their deliberations to the restof the group.

8/3/2019 Wave Energy NOAATM92
http://slidepdf.com/reader/full/wave-energy-noaatm92 81/186
69
Receptor Breakout Group Report: The Physical Environment
Participants:
Jonathan C. Allan, DOGAMIJack Barth, OSU
Tuba Özkan-Haller, OSUKeith Kirkendall, NOAA-NMFS (Facilitator)Paul D. Komar, OSU (Chair)Curt Peterson, PSUMirko Previsic, EPRI Ocean Energy ProgramMaria Stefanovich, OSU (Rapporteur)
Key Findings
The potential impacts of wave energyextraction facilities on the physical environment
could be extensive depending upon the fractionof wave energy extracted. Concerns includeconsequences of the reduction in wave energylevels along the shore, potentially affecting the processes and stabilities of the beaches, and theeffects of the structures on ocean currents, whichin turn could alter the magnitudes and patternsof sediment transport and accumulation.Details, along with discussion of the literatureand a proposed monitoring program, can befound in Appendix 5. Specific points of concerninclude the following:
• Wave energy extraction units vary indesign, in how they extract energy, intheir efficiency, and in the amount of energy they reflect back seaward. Thesevariations, as well as their site of installation, affect their impact on wavereduction and on ocean currents.
• The magnitudes of the reduced waveheights become significantly greater,wave patterns more complex, and potential alterations of currents greater,
when multiple extraction units are present.
• Numerical models of wave reduction bywave energy complexes on other coastssuggest that lowered wave heights will be experienced on the beaches of thePacific Northwest, affecting (bothnegatively and positively) a range of
natural processes and the recreationalactivities of beach visitors.
• There is a need for field investigationsof the environmental changes that result
from the construction of wave energyfacilities. This is critical for thoseconstructed on the Pacific Northwestcoast, due to its extreme waves andcurrents and the fairly unique processesand responses of its beaches.
• Our committee believes it is imperativethat monitoring and experiments beundertaken at the first few sitesdeveloped along the Pacific Northwestcoast.
• A dialog needs to be established between the developers of the proposedwave facilities, specifically their engineers and scientists responsible for the technical analyses, experts in thoseareas available at the state universitiesand government agencies,nongovernmental organizations, andother stakeholder groups. It is importantthat we work together to address thecomplex issues raised.
Top Environmental Issues
Energy extraction technologies
Wave energy extraction devices vary in their designs and fundamental mechanisms for deriving energy from the waves. The degree of wave reduction in the lee of the extraction unit

8/3/2019 Wave Energy NOAATM92
http://slidepdf.com/reader/full/wave-energy-noaatm92 82/186
70
depends on the amount of energy removed togenerate electricity (about 5% to 20%), theamount of energy reflected seaward (about 10%to almost 100%), and the site of installation.Similarly, the different unit designs will haveunique effects on ocean currents and water-
column stratification, depending on their size,shape, and location.
Most of our discussions focused on the useof multiple buoys placed in an array, as buoysystems are most feasible for application in thePacific Northwest, and a buoy system will beused for the first Oregon facility at Reedsport.
Collective impact of multiple units
Having extracted and reflected energy from
the waves arriving from offshore, a single unitwill create a “shadow zone” of lowered waveheights in its lee. The magnitudes of thereduced wave heights become significantlygreater and wave patterns more complex whenmultiple extraction units are present. Waveenergy complexes will almost always consist of multiple lines of units, designed to maximize thewave energy extraction; there would be a greater reduction in wave heights in a multi-unit shadowzone compared with that for a single line of units(see the models of Venugopal and Smith 2007).
It can therefore be expected that with thedevelopment of a full-scale wave energycomplex consisting of a large number of extracting units in a two-dimensional array,there could be significant reductions in waveheights and energies along the coast, potentiallyextending for kilometers in the shorewarddirection and affecting the beaches.Furthermore, the development of numericalmodels for such an array will be considerablymore complex than that for a single line,increasing the uncertainties in the model’scapacity to predict the environmental impacts.
In addition to affecting wave energies and patterns of diffraction and refraction, the presence of a wave farm will become anobstacle to the flow of wind-driven currents inthe shallow-water continental shelf, and couldalter the structure of the water column(variations in temperature and salinity with
depth). While there will be some effect byindividual extraction units, the collectiveimpacts of a large number of units in an arraycould produce a measurable effect on thecurrents and the water column.
Potential environmental impacts
Sediment transport patterns —With waveenergies on average being reduced, there will bea tendency for sediments to accumulate in thelee of the array, producing some shoaling and possibly a change in bottom sediment grain size(likely a shift to finer sediment, and possibly achange from a rocky seafloor to sand). Thosechanges will have a feedback effect on the processes, for example altering the patterns of wave refraction if shoaling significantly changes
the water depths. Such a modification of thewave refraction will be carried to the shore, thealtered angles of waves breaking on the beachesaffecting the longshore currents and sandtransport.
Changes in beach processes —The range of beach processes can be expected to be directlyaffected by the installation of a wave energyfacility, as most of those processes in shallowwater are driven by the heights and energies of the waves (Komar 1998). With a reduction in
wave heights on the beaches, surf-zone widthscould be significantly reduced from their naturalwidths, and because the magnitudes of thelongshore currents and sand-transport ratesdepend on the heights of the breaking waves,they could also experience reductions. Changesin nearshore currents and sand-transport could produce significant shifts in the shorelines, witherosion focused along some stretches of beach,and accumulation of the eroded and transportedsand widening other stretches of beach.
Reduction in surf energy —The existenceof a high-energy surf is important to the mixingand dilution of pollutants that reach thenearshore, with the seaward-directed rip currentsflushing them offshore; with coastal pollutionincreasingly becoming a problem along theOregon and Washington shores, it could beexacerbated by the reduction in wave-energylevels. Significant negative impacts could also

8/3/2019 Wave Energy NOAATM92
http://slidepdf.com/reader/full/wave-energy-noaatm92 83/186
71
occur along the rocky shores to the tidepool lifethat is adapted to the presence of high waves anddepends on their oscillations and wave-drivencurrents for the delivery of food and dispersal of larvae (discussed in other sections of thisreport).
Scientific Uncertainty and Agreement
The wave energy facility designs for thePacific Northwest, as elsewhere, will be based inlarge part on numerical models. The modelsapplied thus far have focused on analyses of thewave diffraction and refraction, beginning withthe reduced wave heights after a significant portion of their energy has been extracted andfollowing the waves as they move toward theshore. For the most part those wave models
should yield reasonable results when applied tothe Pacific Northwest; however, areas of uncertainty remain.
Unit design
As discussed by Venugopal and Smith(2007), problems remain if the analyses need toinclude the dynamics of the energy-extractionunits, as will be the case when the units consistof buoys whose motions have a feedback effecton the waves. This may be important on the
Pacific Northwest coast in that energy-extracting buoys are likely the most viable technology.
Process investigations
Modeling and investigations, such asdescribed by Venugopal and Smith (2007) andMiller et al. (2007), provide guidance as to whatthe impacts on the physical environment might be and where they would be greatest. However,at this stage in the development of wave energyfacilities, there has been only limited reporteduse of numerical models extended to
assessments of the processes that would beresponsible, such as the transport of sediment onthe continental shelf and beaches. Of particular importance, there have yet to be reported fieldexperiments to document on a prototype scalethe impacts of individual unit designs, and noexperience from the construction of a complete
wave energy complex consisting of multipleunits.
Sediment transport
It is unfortunate that there have been only
limited investigations of sediment-transport processes on the continental shelves of thePacific Northwest. The one region of concentrated research has been that in proximityto the mouth of the Columbia River (theColumbia River Littoral Cell), but theextrapolation of its results to the Oregoncontinental shelf is uncertain. Althoughnumerical models may eventually includeassessments of sediment transport affected bythe construction of a wave energy facility, their predictions for the Oregon coast would be
uncertain. For example, while it can beexpected that there would be sedimentaccumulation in the shadow zone of a facility, itis doubtful whether one could predict withconfidence whether that sediment wastransported there by shelf currents modified bythe array, or was carried offshore from the ocean beach.
Particularly problematic in the design process will be the use of numerical modelsapplied to analyze the transport of sediment by
the modified waves and currents, to predict areasof seafloor erosion or sediment accumulation.In general the application of such models is achallenge with uncertain results. This is evenmore so in applications to the Pacific Northwest, because the physics of the processes on thesehigh-energy, low-sloping (dissipative) beachesdiffer significantly from laboratory wave tanksand low-energy beaches (e.g., U.S. East Coastand European) where those models have beentested.
Key Information Gaps
• Applications of wavediffraction/refraction numerical modelsrequire accurate data on water depths,the bathymetry of the seafloor. This isseldom available from recent surveysalong the Pacific Northwest coast, particularly for the intermediate water

8/3/2019 Wave Energy NOAATM92
http://slidepdf.com/reader/full/wave-energy-noaatm92 84/186
72
depths from 50 meters to the shore,including profiles of the beaches at thesite of interest.
• Design information on the wave energyunits is needed for independently
modeled assessments of wave energyfacility impacts on the physicalenvironment.
• Experimental field data documentingenvironmental impacts, from both prototype-scale and multiple-unit waveextraction facilities, is lacking.
Recommendations for Baseline and
Monitoring Studies
There has been little experience in thedesign, construction and operation of waveenergy systems along the world’s coastlines.Therefore, the development of wave energycomplexes along the Pacific Northwest coastshould proceed with caution, requiring thatduring the design process analyses include projections of the potential environmentalconsequences, and that prior to and followingconstruction the installation be monitoredthrough the implementation of a data-collection program. The program of data collection in any
proposed development site needs to be initiatedduring the design stage to supply the requireddepth surveys and preconstruction data onnatural conditions that is needed for comparisons with the environmental changesthat occur following construction.
The extreme Pacific Northwest environmentwill place special demands on the wave energydevice designs. It is important that the ensuingenvironmental responses be carefullydocumented, at least for the first fewdevelopments that will serve as tests of the
designs and impacts. Our committee proposed amonitoring and sampling program designedspecifically for the wave energy facility being proposed for development at Reedsport, becauseit is expected to be the first (Appendix 5).Although such a monitoring program would becomplex and demanding, requiring a team of experienced investigators, it would be a goodinvestment leading to the improved design of wave energy facilities that minimize the impactson the physical environment and ecology.
Literature Cited
Allan, J. C., and P. D. Komar. 2006. Climatecontrols on U.S. West Coast erosion processes.J. Coastal Res. 22:511–529.
Komar, P. D. 1998. Beach processes andsedimentation. 2nd edition. Prentice Hall, NewJersey.
Miller, D. L., H. C. M. Smith, and D. E. Reeve.2007. Modelling analysis of the sensitivity of shoreline change to a wave farm. Ocean Eng.34:884–901.
Venugopal, V., and G. H. Smith. 2007. Waveinvestigation for an array of wave power devices. In Proc. 7th European Wave and Tidal EnergyConference, Porto, Portugal, 11–13 September 2007.
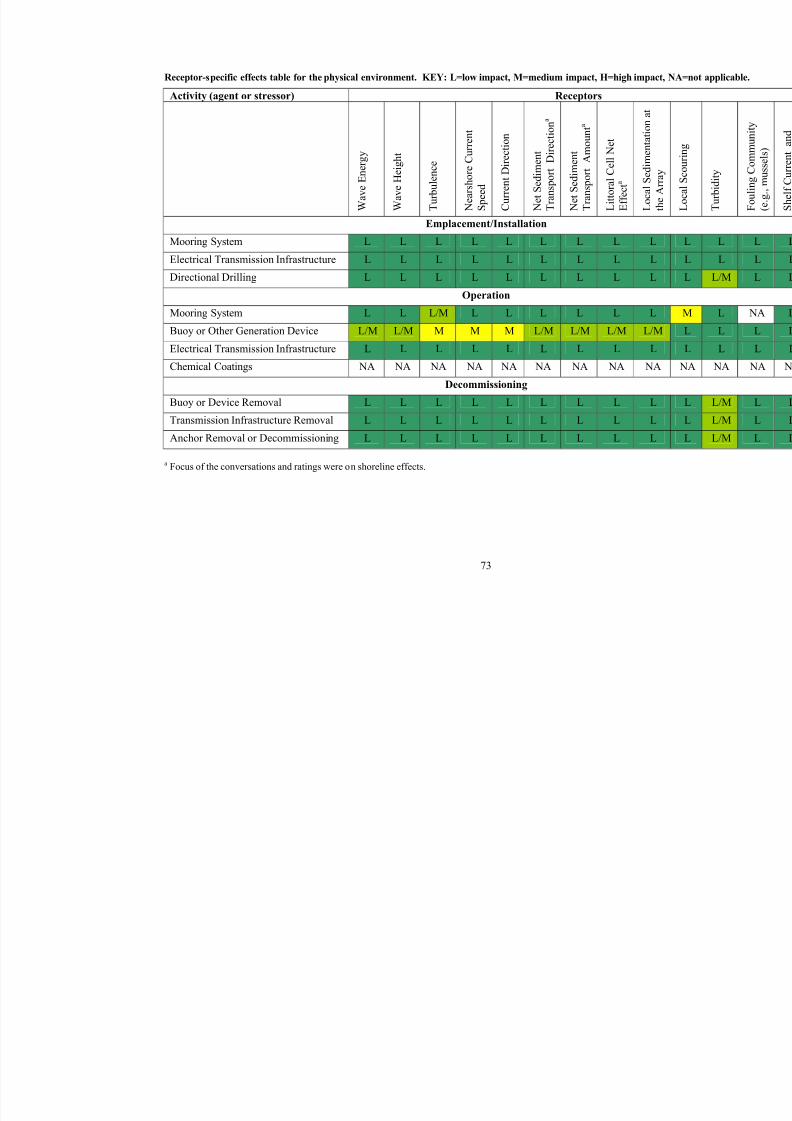
8/3/2019 Wave Energy NOAATM92
http://slidepdf.com/reader/full/wave-energy-noaatm92 85/186
73
Receptor-specific effects table for the physical environment. KEY: L=low impact, M=medium impact, H=high impact
Activity (agent or stressor) Receptors
W a v e E n e r g y
W a v e H e i g h t
T u r b u l e n c e
N e a r s h o r e C u r r e n t
S p e e d
C u r r e n t D i r e c t i o n
N e t S e d i m e n t
T r a n s p o r t D i r e c t i o n a
N e t S e d i m e n t
T r a n s p o r t A m
o u n t a
L i t t o r a l C e l l N
e t
E f f e c t a
L o c a l S e d i m e n t a t i o n a t
t h e A r r a y
Emplacement/Installation
Mooring System L L L L L L L L L
Electrical Transmission Infrastructure L L L L L L L L L
Directional Drilling L L L L L L L L L
Operation
Mooring System L L L/M L L L L L L
Buoy or Other Generation Device L/M L/M M M M L/M L/M L/M L/M
Electrical Transmission Infrastructure L L L L L L L L L
Chemical Coatings NA NA NA NA NA NA NA NA NA
Decommissioning
Buoy or Device Removal L L L L L L L L L
Transmission Infrastructure Removal L L L L L L L L L
Anchor Removal or Decommissioning L L L L L L L L L
a Focus of the conversations and ratings were on shoreline effects.
8/3/2019 Wave Energy NOAATM92
http://slidepdf.com/reader/full/wave-energy-noaatm92 86/186
74
Receptor Breakout Group Report: Pelagic Habitat
Participants:
Richard Brodeur, NOAA-NMFS, NWFSCSelina Heppell, OSU
Susan Holmes, OSU (Rapporteur)Justin Klure, Oregon Wave Energy Trust (Facilitator)Bill Peterson, NOAA-NMFS, NWFSCAlan Shanks, Univ. of Oregon (Chair)
Key Findings
• The wave energy structures will likelyhave little or no effect on phytoplankton.
• Antifouling coatings may have adverseaffects on plankton if the coatings leach
toxins. Nonleaching antifoulingcoatings should be used if at all possible.
• The electromagnetic signals generated by the facilities may confuse fishes thatuse an electrical sense to orient toward prey or use a sense of earth magnetismfor navigation. We know theseorganisms are very sensitive, so theshielding of the electromagnetic signalsmust be very good.
• Wave energy extractors that aredependent on water movement throughthe apparatus will likely kill or damagelarge zooplankton such as jellyfish andctenophores.
• Benthic organisms will colonize thewave energy structures extensively. For most populations, the loss of larvae tosettlement on the structures will beunimportant. For some populations(e.g., rockfish populations recovering
from overfishing), this loss may beimportant. If juvenile rockfishassociated with the wave energystructures are unable to successfullytransition to a permanent adult habitat,then settlement of larval rockfish on thestructures may represent a sink for theselarvae.
• The structures will act as Fish AttractionDevices (FADs). They will attract fishthat feed on benthic organisms, a varietyof water column fishes, and fish predators.
Top Ecological Issues, Uncertainty, andRecommendations
Antifouling coatings
Antifouling coatings that work by releasingtoxins into the water may harm any organism(phyto-, mero- or holoplankton) in the planktoncommunity. Most of the effect will be localizedto near the power-generating structures and willextend downstream for an unknown distance.The effect of one structure leaching toxins from
antifouling coatings will probably be minimal, but the effect of leaching toxins from manystructures in a wave energy facility and manyfacilities along the coast may not be minimal, particularly if there are bioaccumulativecompounds. Utilization of antifouling coatingsthat rely on leaching toxins should be avoided in preference to nonleaching coating, but it is possible that grazing organisms may facilitatethe release of these compounds.
Water inflow entrainment
Some of the devices designed to extractenergy from waves pass water through themechanism. During the passage of water through the device, large delicate organisms will be killed or damaged. Large zooplankton suchas jellyfish, salps, and ctenophores are particularly susceptible to this type of damage.This stressor can be avoided by utilizing energy

8/3/2019 Wave Energy NOAATM92
http://slidepdf.com/reader/full/wave-energy-noaatm92 87/186
75
extraction devices that do not require the water to pass through a mechanism.
Electromagnetic effects
The wave energy extractors themselves and
the generation of electricity by the devices will produce weak electric and magnetic fields.Elasmobranchs (sharks and rays) and some bonyfishes are capable of detecting even very weak electric and magnetic fields. In general, inmarine organisms, the electric sense is used toorient toward prey. Even the weak electricsignal generated by dissimilar metals in contactwith each other in seawater can disorient someshark species. In experimental settings, sharkscan sense the electric signal from a clam buriedin sediment. Several marine organisms can
sense the earth’s magnetic field and may use itto aid in navigation. Few organisms have beeninvestigated so we have no idea how widespreadthis capacity is. These organisms are quitelikely very sensitive to magnetic signals if the best-studied organism (the pigeon) is anyindication of the general sensory ability of organisms that navigate with earth magnetism.We know some marine organisms are verysensitive to both of these electromagneticoutputs and we are assured that the infrastructureutilized in wave energy extraction will be
shielded to minimize the effect, but we currentlydo not have a clear idea as to how muchshielding is adequate. Given the extremesensitivity we suspect, shielding will have to bevery very good if it is to minimize the effect onmarine life.
Entanglement on mooring lines
Mooring lines are used in most of the proposed wave energy extractors and in somedesigns there are a number of mooring lines.These will entangle some organisms. Large jellyfish with long tentacles (e.g., Pelagia sp.andChrysaora sp.) will tangle on the mooring lines.This will kill or at least damage these organisms.Sea turtles and marine mammals can becomeentangled by lines, particularly slack mooringlines, leading to drowning. We could think of no way to mitigate against entanglement of jellyfish, but the major problem for sea turtles
and marine mammals is slack lines. Hence,mitigation would be the avoidance of all looselines.
Effect of wave energy structures
This report is based upon the assumptionthat the combined structures in wave energyfacilities would have little or no effect on inner shelf currents or water structure. If this provesnot to be the case, some of our conclusions willhave to be modified.
Most of the potential effects of the waveenergy structures are related to the attraction of organisms to energy generating structures,mooring lines, anchors, etc.
The wave energy facilities will be placed innearshore areas of sandy bottom, areas with noor very little hard substrate. Larvae settling outof the plankton will quickly colonize this newhard substrate. The situation is very much likewhat has happened around offshore oil platformsin southern California, and many of the sameorganisms that have colonized those oil platforms will likely colonize the hard surfaceassociated with wave energy extractors placedoff Oregon. Organisms that settle on the waveenergy structures, obviously, will not have theopportunity to settle on other hard substrates; thewave energy structures could, by removinglarvae, be viewed as a sink. Most benthicorganisms produce vast numbers of larvae andeven at the end of the pelagic larvaldevelopment phase, when larvae are ready tosettle out of the plankton, there are generally far more competent larvae than needed to sustain populations.
There are perhaps some exceptions to thisgeneralization. Structures in the water, likefloating rafts of seaweed and the wave energy
structures, attract larval and juvenile fish fromthe plankton. Many of the rockfish speciesdisplay this behavior. In the case of the waveenergy structures, larval fish that “settle” inassociation with the structures may adopt anadult benthic existence associated with thestructure. The oil platforms in southernCalifornia do support populations of associated
8/3/2019 Wave Energy NOAATM92
http://slidepdf.com/reader/full/wave-energy-noaatm92 88/186
76
fishes including rockfish. It is not clear,however, that the wave energy structures willactually represent adequate habitat for adult benthic fishes. If the structures associated withthe wave energy extractors prove to beinadequate substrates for supporting adult fishes
then the structures may be a drain on the larval pool. Current adult populations of somerockfish species are low due to overfishing andare in the process of recovery. Due to the low population sizes, larval production may also below and the loss of larvae to the wave energyfacilities may represent an important loss of larvae, which may slow the recovery of the populations. If like the oil platforms, the hardsubstrate associated with the wave energyextractors is adequate adult habitat, then thesituation may be beneficial, providing new
habitat into which populations of fishes canexpand. The situation is ambiguous and onlystudy of initial deployments of wave energyextractors will provide the information needed toaddress this question.
Many of the jellyfish have complex lifecycles with a planktonic sexual reproductivestage and a benthic asexual stage. The waveenergy structures will definitely be colonized byhydrozoans and likely by the asexual stage of true jellyfish (Scyphozoans). By providing more
habitat for the benthic asexual stage, waveenergy structures may increase jellyfish population sizes.
Many types of adult fishes are attracted toobjects in the water. This behavior is socommon that fishers in many parts of the world
exploit it. Almost any structure placed in thewater column can be used as an FAD. The waveenergy extractors will act as FADs. Some of thefish attracted to FADs feed on the organismsclinging to the FAD. This will certainly be thecase in the wave energy facilities as the
structures not protected by antifouling coatingswill rapidly become colonized. There are anumber of species of fish that associate withFADs, but it is not clear what benefit they derivefrom this association. These are often smaller forage fish. Lastly, the accumulation of fisharound FADs attracts fish predators (e.g., sharks,larger fish, sea lions, dolphins, etc.). After some period, a whole community of fish can becomeassociated with a FAD.
Species of fish that feed on the benthic
organisms associated with the structures may benefit from the new hard-substrate habitats.The attraction of predators to the structures mayenhance predation rates and on some types of fish (e.g., juvenile fall Chinook salmon[Oncorhynchus tshawytscha]) this may haveadverse affects. The plan for sighting of thewave energy facilities places them right in thehabitat of juvenile fall Chinook salmon. Thehabitat for fall Chinook during their first year atsea is the nearshore zone, from the surf zone outto only a few kilometers from shore. Although
we do not know how or if the wave energystructures will impact these fishes, it is clear thatthe nearshore zone is where these endangeredand threatened species do live. Thus, it isimperative that we work to determine if there isany negative conflict between the devices andthe fishes.

8/3/2019 Wave Energy NOAATM92
http://slidepdf.com/reader/full/wave-energy-noaatm92 89/186
77
Receptor-specific effects table for pelagic habitat. KEY: L=low impact, M=medium impact, H=high impact, U=unkno
associated with the estimate, + positive effect, - negative effect
Activity (agent or stressor) Receptors
P h y t o p l a n k t o
n
N e u s t o n i c P l a n k t o n
M e r o p l a n k t o
n
H o l o z o o p l a n
k t o n a
M y s i d s
b
J e l l y f i s h a n d
C t e n o p h o r e s
M a r k e t S q u i d c
S h a r k s
M i g r a t o r y F i s h e s
d
F o r a g e F i s h e
s
Alteration of Currents f,g L?
Antifouling Coatings h L b La L
Hydraulic Fuel Spill i L b
Water Flow Entrainment j Ua Ua, n U Ha
Structure:Habitat k H?+/- b,n U b,o
Accumulation near k M+? M-H U HGrowth on k H H+ b,n
Attraction to k M-H L+a,p H+?a,b,p
Prey attraction to or growth on k
M+?a L+a,p M+a,b,p
Predator attraction to k M-H
Avoidance of k L+a,p
Mooring Lines (Entanglement) Ha,k
EMF Effects on Navigation l L? b M-H?a,b M-H?a,b M-H?a,b
a effect on individual
b effect at local population levelc Doryteuthis opalescens(formerly Loligo opalescens)d most migratory fish live further offshore than the proposed facility areae Dermochelys coriacea f can mitigate effect by appropriate facility designg effect at community levelh effects will be low if coatings do not leach toxins into the water; can mitigate byusing appropriate coatingsi low if double-walled containment is used
j physical damage, device-specific; mitigate
inflowk mitigation probably not possiblel may be able to mitigate by using enough shm effect on individual, or population in case oloose mooring linesn species-dependento may affect spawning habitat, which is loca
placing wave-energy facilities at known spaw p effect on schools

8/3/2019 Wave Energy NOAATM92
http://slidepdf.com/reader/full/wave-energy-noaatm92 90/186
78
Receptor Breakout Group Report: Benthic Habitat
Participants:
Ray Buckley, WDFWJohn Chapman, HMSC
Bob Emmett, NOAA-NMFS, NWFSCJack Engle, UCSBHugh Link, Oregon Dungeness Crab CommissionBruce Menge, OSUJohn Meyer, OSU (Facilitator)Fred Piltz, MMSErin Richmond, OSU (Rapporteur)Gil Rilov, OSU (Chair)
Key Findings
Benthos is the community of organisms thateither live on the seabed substrate (epifauna), inthe substrate (infauna), or have strong affinity tothe substrate (for example, reef fish). Anystructure added to the coastal environment andconnected to the seabed will impact benthiccommunities and can be regarded as a stressor (Gill 2005). Stress is any type of change,whether “negative,” e.g., reduction/deletion of species, or “positive,” e.g., addition of species tothe community.
The vision of wave energy technology is toestablish multiple facilities, each with multipleunits, along the shore. The effect of a single unitdoes not necessarily scale up linearly withmultiple units. Communities developing onmultiple units and at multiple complexes caninteract through connectivity and thus these projects could have net effects greater than thesum of their parts. We therefore used a “worst-case scenario” approach when dealing with the potential ecological effects of this technology.There are many potential technological designsthat may be implemented in the future along theOregon shore, but because all designs involvemassive anchoring systems that will rest on the bottom, and objects with large volumes at or near the surface, we addressed this problemgenerically. As far as we know, all structuresare planned to be situated on soft bottoms,therefore our discussion reflected this
assumption. Specific key findings included thefollowing:
1. Assuming that wave energy facilitieswill include high numbers of large unitsat multiple locations along the coast,their ecological impact on the benthoscould be considerable. Their physical presence will increase habitatcomplexity by adding structure to thesoft bottom directly by the anchoringsystem and by altering localhydrodynamics; and indirectly by debrisshedding off the mid- and surface-water structures during maintenance, or naturally as fouling grows and becomesheavy. The effects can scale up beyonda simple linear increase with size.
2. Highest effects are expected duringtechnology operation, less duringdeployment and decommissioning(unless those processes involve draggingstructures across the bottom or abandoning structures).
3. The structures could affect bothnearshore hydrodynamics and sediment
transport, indirectly affecting bottomcommunities, water velocities, andlarval transport.
4. If toxic antifouling paints are used onwave energy structures, considerable pollution effects are expected on themarine community within and beyondthe location of the facilities.

8/3/2019 Wave Energy NOAATM92
http://slidepdf.com/reader/full/wave-energy-noaatm92 91/186
79
5. More basic information is needed beforewave energy projects can beimplemented sustainably. Areas withlarge information gaps include seafloor mapping, and modeling of changes inocean circulation and wave energy
patterns. Modeling can reveal potentialeffects of these changes on nearshorecurrents, and on sediment and larvaltransport. Models should examinechanges resulting from multiplestructures, and incorporate a broad rangeof seawater densities and offshoredistances. Models should be validatedas pilot scale facilities develop.
6. A proper scientific approach should beused to test for possible ecologicaleffects on the benthos while pilot waveenergy studies are underway, and closemonitoring should continue as full build-out occurs. This includes aBefore-After-Control-Impact (BACI)study design.
7. Useful information can be readilyobtained concerning existingcommunities on and below nearshore buoys or other upper water columnstructures already placed along theOregon coast.
Top Ecological Issues
Anchoring system
Community composition and species
interactions —Based on the suggested designs,each unit will have a large anchoring systemmade of concrete and/or metal that will create alarge footprint on the sea floor. This structure, plus bottom structures such as the subsea podunit in the Reedsport OPT project and pipescontaining electrical cables, will add structuralcomplexity to the seabed. This will create defacto artificial reefs that will recruit hard- benthos organisms and change the local soft- bottom community structure. Apart fromincreasing local biological diversity, someorganisms that will recruit or be attracted tothose structures could affect organisms in
adjacent habitats. For example, hard-bottom predators such as fish and crabs will probably prey on the surrounding natural soft-bottom epi-or infauna, thus expanding the impact beyondthe footprint of the structures themselves(Langlois et al. 2005).
Hydrodynamics and sediment
composition— Large bottom structures alter bottom water flow and shear, which alter sediment deposition and composition. Benthiccommunities are highly sensitive to sedimentcomposition and thus threatened by thesechanges.
Mid- and surface-water structures
Community composition and species
interactions— Large mid- and surface-water structures proposed in the different technologieswill be home for massive fouling communitiesunless coated by highly effective antifouling paints. These fouling communities will increasedeposition to the bottom, as organisms fall off,or when they are cleaned off during maintenanceto increase efficiency or reduce corrosion of theunits. In Oregon, the fouling communityincludes many “ecosystem engineers” such aslarge mussels and barnacles. Therefore, it isexpected that the shells of fouling organisms
will pile on the bottom and over the years willincrease the bottom structural complexitysurrounding these units (see an example from oilrigs, Love et al. 1999). Furthermore, oceanwaves and strong currents have the potential tospread the debris beyond the units’ area.Shedding is expected to be facilitated duringwinter storms. Large amounts of decayingorganic matter on the bottom can also reducedissolved oxygen levels, potentially contributingto the “dead-zone” phenomenon that hasdeveloped along Oregon shores in recent years.
Hydrodynamics and sediment
composition —The large piles of fouling debriscould alter bottom water flow and sedimentdeposition and composition, potentiallyimpacting benthic communities. Verticalmovement of floating mid-water structures canalso create vertical currents and suspend

8/3/2019 Wave Energy NOAATM92
http://slidepdf.com/reader/full/wave-energy-noaatm92 92/186
80
sediments, affecting sediment dynamics andcommunity structure.
Trapping algal drift mats —Surfacestructures and mooring lines can entangle largekelp mats floating on the ocean surface.
Trapped mats will affect local communities by providing extra shelter and food for invertebrates and fish. Pelagic juvenilerockfishes recruited to the drift mat habitats willhave normal migration patterns (i.e., drifttrajectories) disrupted, and may suffer increasedmortality. Drift mats could also facilitate kelpgrowth on the hard structures by shedding kelp propagules, as well as add organic matter to the benthos as they decay.
Circulation— Many large, stationary,
floating devices influence wave and currentregimes. These changes can affect nearshoresediment flow and beach erosion. The floatingunits can affect larval fronts (for example inupwelling fronts) and thus dispersal andrecruitment to the benthic habitat at the site or upstream or downstream of it.
Dislodged structures —Storms, collisionswith ships, or equipment failure can dislodgeunits or their components. These structures cantangle with other structures, drag along the
bottom, find their way to the bottom and addstructure there (see above for potential effects),or wash up on a sandy beach or a rocky shore.The huge structures proposed in most designswill not be easily removed from the shore andthus could have considerable effects onlongshore sediment transport on sandy beaches,and on intertidal benthic communities.
Antifouling
If toxic antifouling paints are used on thefloating devices, pollution of the water column
and bioaccumulation through the food web iscertain. The magnitude of the pollution dependson the compound, the matrix in which it isembedded, erosion rate (dependent on degree of water movements including swells and currents),and the number and size of units.
Scale
One or several sparingly spaced units will probably serve mostly as population sinks withina network of metapopulations. However, manylarge units spread over large areas could create
extensive connected communities that couldinteract by movement of adults and/or larvae andwill become population sources for other artificial and natural hard substrata in the region.Pollution from antifouling paints from hundredsof large units could affect marine organisms on acoastal scale.
Stepping-stones for invasive species
The Oregon coast has large expanses of sandy beaches and seabed with no hard
substrate. This natural seascape can potentiallyreduce the spread of hard-substrate-dwellinginvasive species with short dispersal ranges.Dotting soft-bottom areas with many large hardstructures increases the potential for suchspecies located north or south of the Oregoncoast to spread along the shore by supplyinghabitat necessary for recruitment and growth,creating populations that can then serve assources of dispersal further along the shore.
Effective closure of wave energy project
areas—the protected areas effect
The effective closure of portions of theocean floor from extractive activities can resultin an increase in the abundance and size of soft- bottom-dwelling organisms such as crabs andfish. This may result in a spillover effect, i.e.,the export of adults or young outside of the protected area to the potential benefit of fisheriesaround it (Gell and Roberts 2003). Thecommunity that forms on the hard structures willalso be protected and as stated above couldexport adults and young to other areas.
Scientific Uncertainty and Agreement
There are many levels of uncertainty withregard to the potential direct and indirect effectsof the proposed wave energy technologies onOregon’s nearshore benthic habitat. Nothing of the magnitude of the proposed projects has ever

8/3/2019 Wave Energy NOAATM92
http://slidepdf.com/reader/full/wave-energy-noaatm92 93/186
81
been placed in the Oregon ocean, or perhapsanywhere else. The only equivalents may be oiland gas rigs, and recently, nearshore wind farms.Publications on the assessed ecologicalimplications of offshore renewable energydevelopment projects (Gill 2005) are not yet
available, except for the effects on birds by windturbines. Our assessments here are therefore based on general knowledge of benthic ecology,and on the long-known effects of artificial reefs(e.g., Davis et al. 1982, Rilov and Benayahu2002).
Key Information Gaps
Lacking first and foremost are detailed mapsof the seafloor along the Oregon coast. Mapswill reveal where placements will be most likely
to avoid rocky reefs. We encourage theimplementation of a detailed inner-shelf seafloor mapping program before any large-scaledeployment of the technology takes place. Thismapping should include both physical (type of substrate and its features) and biological(communities) information. There is already benthos data out there (most in gray literature)that needs to be compiled, synthesized, andanalyzed. The Dungeness crab (Cancer
magister ) fishers could also provide informationon areas that are “biological hot spots” that need
some degree of protection. These types of datawould help identify areas where wave energy project activity should preferably be avoided.
Another large knowledge gap is the effectsof large stationary objects in the nearshore onocean currents and larval transport. Such effectscan vary greatly among designs of individualtechnologies, and the number and distance between units and complexes. Models of nearshore oceanography will assist efforts toestimate larval transport effects and effects on
sediment transport.Information on the fouling communities that
develop on large stationary floating structuresalong the Oregon shore, and their rates of development in different ocean conditions, islacking. Monitoring of fouling of existingnearshore buoys (and of the debris that piles onthe bottom underneath them) might be a first
step in that direction, and monitoring of waveenergy structures placed for any pilot study will be highly valuable.
Feasibility and Effectiveness of Mitigation
There is no way to effectively reduce theimpact of the bottom structures except for scraping organisms off the surface, packingthem, and bringing them back to shore, or alternately using antifouling paints that couldcause pollution if toxic. Burying the anchorsentirely under the sediments when in use andremoving them at the end of their use willreduce their effects. Nontoxic antifouling paints(see for example Perez et al. 2007, and Univ.of California 1998–2007 for epoxy alternatives) onmid- and surface-water structures will reduce
impacts, but we are not sure that epoxy paintsare effective on stationary structures.
Placing structures farther offshore isrecommended to reduce potential effects onnearshore currents and onshore communities, asis keeping the units as small as possible.
Recommendations for Baseline and
Monitoring Studies
Testing and monitoring the potential
ecological effects of the developing technologyon the benthos requires Before-After-Control-Impact approaches with sufficient replication for statistical analyses.
Potential sites for deployment should bemonitored before deployment for at least a year (to capture seasonal variability). Multipleadjacent sites to the north and south (distance to be determined by the size of units and of theentire complex) should be monitored as controls.The size of the monitoring plots and their
distance should be based on ecologicalconsiderations, including dispersal andmovement ranges of dominant organisms.Samples of water, sediment, and organismsshould be taken at increasing distances from point sources to test the potential effects of toxicantifouling paints. If bioindicators for thespecific pollutants exist, they should also beused.

8/3/2019 Wave Energy NOAATM92
http://slidepdf.com/reader/full/wave-energy-noaatm92 94/186
82
Literature Cited
Davis, N., G. R. VanBlaricom, and P. K. Dayton.1982. Man-made structures on marinesediments: effects on adjacent benthiccommunities. Mar. Biol. 70:295–303.
Gell, F. R., and C. M. Roberts. 2003. Benefits beyond boundaries: the fishery effects of marinereserves. Trends Ecol. Evol. 18:448–455.
Gill, A. B. 2005. Offshore renewable energy:ecological implications of generating electricityin the coastal zone. J. Appl. Ecol. 42:605–615.
Langlois, T. J., M. J. Anderson, and R. C. Babcock.2005. Reef-associated predators influenceadjacent soft-sediment communities. Ecology86:1508–1519.
Love, M. S., J. Caselle, and L. Snook. 1999. Fishassemblages on mussel mounds surroundingseven oil platforms in the Santa Barbara Channeland Santa Maria Basin. Bull. Mar. Sci. 65:497– 513.
Perez, M., M. Garcia, G. Blustein, and M. Stupak.
2007. Tannin and tannate from the quebrachotree: an eco-friendly alternative for controllingmarine biofouling. Biofouling 23:151–159.
Rilov, G., and Y. Benayahu. 2002. Rehabilitation of coral reef-fish communities: the importance of artificial-reef relief to recruitment rates. Bull.Mar. Sci. 70:185–197.
University of California, Sea Grant ExtensionProgram. c1998–2007. Nontoxic antifoulingstrategies project. Online at http://seagrant.ucdavis.edu/nontoxicdemo.htm [accessed 28
August 2008]

8/3/2019 Wave Energy NOAATM92
http://slidepdf.com/reader/full/wave-energy-noaatm92 95/186
83
Receptor-specific effects table for benthic habitat. KEY: L=low impact, M=medium impact, H=high impact
Activity (agent or stressor) Receptors
S e d i m e n t G r a i n S i z e
P e r c e n t O r g a
n i c s
C u r r e n t S p e e
d s
T u r b u l e n c e
F o u l i n g C o m
m u n i t y
P o l y c h a e t e W
o r m s
M o l l u s c s
C r u s t a c e a n I n f a u n a
Emplacement
Mooring System L L L L L L L L Electrical Transmission Infrastructure L L L L L L L L
Operation
Mooring System H H H H H H H H Buoy or Other Generation Device H H H H H H H H
Electrical Transmission Infrastructure a Chemical Coatings b L L L L L L L L Equipment Loss L L L L H H H H
Decommissioning
Buoy or Device Removal L L L L L L L L Transmission Infrastructure Removal L L L L L L L L Anchor Removal or Decommissioning L L L L L L L L
Routine Maintenance
Vessel Traffic, Maintenance Activities L L L L L L L L Biofouling Removal c M H L L H H H H
a If buried, impacts will be all low; if above the sediment surface, impacts will all be medium to high. b Impacts will be low if U.S. Coast Guard recommendations are followed.c Cleaning the buoys, lines, etc., will require care to prevent deposition of raining organic matter on the seafloor.d Ammodytes hexapterus

8/3/2019 Wave Energy NOAATM92
http://slidepdf.com/reader/full/wave-energy-noaatm92 96/186
84
Receptor Breakout Group Report: Fish and Fisheries
Participants:
David Baldwin, NOAA-NMFS, NWFSCGeorge Boehlert, OSU (Facilitator)
Ann Scarborough Bull, MMSMatt Cutlip, FERCJohn Ferguson, NOAA-NMFS, NWFSC (Chair)Mike Fitzpatrick, FINEDavid Fox, ODFWKaety Hildenbrand, OSUSteve Kajiura, Florida Atlantic UniversityLaurel Kellner, OSU (Rapporteur)Bob Thresher, National Wind Technology Center Waldo Wakefield, NOAA-NMFS, NWFSC
Key Findings
Discussions focused on the positive andnegative effects on fish and fisheries that mayresult from installing, operating, and maintainingwave energy generating structures in nearshoreecosystems along the Oregon coast. A highdegree of diversity exists in the habitats and inthe biological communities that are present inthe areas proposed for wave energy facilities,and in the various fisheries that target thisdiversity. There is a lack of adequate
information and a high level of scientificuncertainty regarding the effects these structuresmay have on the diverse fish communities andtheir associated commercial and recreationalfisheries communities. We reached thefollowing overall conclusions from the breakoutsession:
1. The installation, operation, andmaintenance of wave energy generatingdevices in the nearshore ecosystems willchange the physical structure of the benthic and pelagic habitat available tofishes and limit its accessibility tofishers. Physical structures will be placed in the water column and on the bottom where none currently exist. Thestructures may function to attract fishesand affect the species composition of fish populations that occupy thesehabitats on daily, seasonal, annual, and
decadal scales. They may affect therelationships between predators andtheir prey, and thus the food web andtrophic structure of the nearshoreecosystems at wave energy installationsites.
2. The wave energy devices are being placed in the corridors some species useto migrate along the coast or up onto thecontinental shelf. This may have directeffects on certain species such as juvenile and adult salmonids, Dungeness
crab (Cancer magister ), green sturgeon( Acipenser medirostris), andelasmobranchs, whose behavior maychange in the vicinity of the developedarea during migrations. The energydevices may also indirectly affect fishusing such migration corridors byemitting electromagnetic, acoustic, andchemical fields at levels that interferewith fish navigation and orientationsystems; by altering their preferences for certain habitat types; and by deterring
fish from entering the area.3. The amount of data on the impacts wave
energy devices may have on the biologyof fishes and their physical environment,and how those impacts scale with thesize of a given installation, is verylimited. This lack of information resultsin a high degree of uncertainty

8/3/2019 Wave Energy NOAATM92
http://slidepdf.com/reader/full/wave-energy-noaatm92 97/186
85
associated with our ability to quantifyand forecast potential effects on fish,coastal ecosystems and communities,and the associated fisheries. To addressthis uncertainty, we recommend that biological and ecological study sites be
established or incorporated into proposed wave facility demonstrationsites. In study sites, baseline and postinstallation information should begathered to quantify any shifts in speciescomposition, community structure, and predator-prey relationships. Studiesshould also assess offsite effects such as1) changes in fishing effort; 2) physicalchanges in nearshore habitat structureand function (due to altered waveenergy patterns and current attenuation)
and their effects on the type and amountof habitat available to fishes; and 3)effects from irregular but potentiallysignificant events such as oil or chemical spills and structures dislodgedduring storm events.
Top Ecological Issues
New structures
The addition of cables, floats, mooringsystems, and energy-generating devicesthemselves will add physical structure to benthicand pelagic habitats where none exists currently.This may change the access fishes have to thesehabitats, the food-web structure, and the fishcommunities that use the habitat. Depending onthe species, this could be a positive change (e.g.,the structure attracts forage fish species that are prey), or a negative change (e.g., the physicalnature of the wave energy attenuation changesthe structure of sand waves on the bottom andalters crab migration corridors).
Protected areas
The wave energy facility sites may functionas surrogate marine protected areas (MPAs) because fishing activities may be excluded bychanges to either regulations or physical accessto the sites. Studies of fish responses andchanges in community structure within existing
MPAs could be a source of information for evaluating the potential effects of wave energydevelopment along the coast.
Fish populations in nondeveloped areas may be depleted due to a shift in fishing pressure
from the wave energy complex area to other fishing sites.
Noise, EMF, and chemicals
The wave energy structures, mooring cables,and devices may emit noise; electromagneticfields (EMF); and chemicals from antifoulingcoatings, zinc anodes, and hydraulic or vegetable oil reservoirs. If the noise, EMF, andchemicals are above sensory threshold levels,they may affect fish sensory systems and the
ability of individual fish to orient to their environment, find prey, and avoid predators.
Dislodged structures
The impact on coastal ecosystems fromwave energy structures breaking away duringhigh storm events is unknown. The group feltthat these events are certain to occur, but their frequency, and any impacts that equipment lossor associated maintenance activities may haveon benthic habitat, shoreline structure, and local biological communities are unknown.
Wave attenuation
Wave energy structures will convert the physical energy contained in waves intomechanical energy, which will change themagnitude and patterns of waves approachingthe shoreline. The physical effects of waveattenuation on bottom habitat structure areunknown, as is the response of biologicalcommunities to any such changes.
Cumulative effects
The cumulative impacts of several waveenergy facilities may be greater than impactsthat can be anticipated from a single site.Consideration of cumulative impacts needs to beincorporated into any program examining theeffects of wave energy development.

8/3/2019 Wave Energy NOAATM92
http://slidepdf.com/reader/full/wave-energy-noaatm92 98/186
86
Scientific Uncertainty and Agreement
Although the level of uncertainty associatedwith any of our comments is high, courses of action are available to reduce this uncertainty.
First, specific experiments that examine theeffects of wave energy devices on the variousspecies of fish and invertebrates in the waveenergy facility area should be conducted. For example, these could include studies of effectsof acoustic, electromagnetic, and chemical levelsthat are produced by wave energy generators onfish olfactory, hearing, and navigation sensorysystems. The “dose” could be measured andrelated to the “response” by individual fish inthe laboratory, and ultimately scaled to population-level effects through quantitative
modeling.
Second, impact studies that measureecological characteristics over time should beconducted to look for evidence of differences(impacts) between developed and control sites.Presumably, any differences will be attributed tothe impact, but close attention will have to be paid to the experimental design, therandomization of study sites, and replication.The timing of the installation must be known inadvance so that baseline information can be
collected, and data should be collected over a period of several years to incorporateinterannual environmental variability. Theecosystems along the Oregon coast arecharacterized by a high degree of variabilityover daily, seasonal, annual and decadal scales,and this variability will have to be factored intoany study designs, such as those using a BACI(Before-After-Control-Impact) design.
Key Information Gaps
The following are unknown:1. Effects of electromagnetic emissions on
fish behavior, especially feeding andmigration.
2. Effects of noise emissions on fish behavior.
3. Effects of wave energy facilities andenergy generating devices on thestructure of the demersal and pelagiccommunities within the wave energyfacility and surrounding areas.
4. The leaching rates of chemicals used inwave energy facilities (e.g., antifoulingchemicals, epoxy resins, and oils andlubricants necessary for fabrication andmaintenance); the effects of ambientlevels of these chemicals on fish andcrab behavior and toxicology; and thedegree that chemicals enter the foodchain and bioaccumulate.
5. Effects wave energy facilities will haveon crab migrations from deep to shallowhabitats. The Dungeness crab fishery is
the largest fishery (based on dollars)along the Oregon coast.
6. Effects on green sturgeon. Wave energyfacilities may be placed in the depthzone of green sturgeon migrationcorridors. This species migrates northand south seasonally each year at depthsaround 28 fathoms (about 51 m). Greensturgeon populations are depleted and atrisk.
7. Effects on salmon. Wave energy
facilities may also affect the migrationsof juvenile salmon along the shore,onshore, and offshore; and adult salmonduring homing migrations to natal riversand while waiting near river mouths for river hydraulic conditions to improve.
8. Effects on the ontogenetic migrations of demersal fishes.
9. Effects of maintenance activities on thelocal demersal and pelagic communities.These would include the use of high-
velocity water jets to remove organismsthat have attached to buoys and cables,and their subsequent accumulation onthe bottom.

8/3/2019 Wave Energy NOAATM92
http://slidepdf.com/reader/full/wave-energy-noaatm92 99/186
87
Feasibility and Effectiveness of Mitigation
Generating electrical energy from waveenergy is a relatively new and untestedtechnology. Thus, the feasibility andeffectiveness of mitigation measures for key
ecological impacts are unknown. The potentialeffects of wave energy structures and how tomitigate for their effects in coastal Oregonecosystems could be examined through severalconcurrent approaches. First, the results of studies that have been conducted on prototypewave energy structures and facilities in Europeover the past 10 years should be reviewed for applicability in the Pacific Northwest. Second, baseline biological information should becollected at proposed development sites. Third,small-scale experiments with prototype
structures should be conducted at locationsdedicated for such research. One such site has been proposed by Pacific Gas & Electric for thenorthern California coast, and a seconddemonstration site is planned for the coast off Newport, Oregon. Studies of the physicalimpacts to both sandy and rocky substratesshould be evaluated, along with the concomitantresponses by the biological communitiesassociated with each type of habitat.
Recommendations for Baseline and
Monitoring Studies
1. Wave energy demonstration facilitiesshould also be biological and ecologicalmonitoring sites, whereby baseline biological information is gatheredalongside the engineering, deployment,and operational tests of prototypesystems.
2. Close attention will have to be given tothe experimental designs associated with
efforts to measure biological impacts(see Scientific Uncertainty andAgreement above).
3. Uniform monitoring protocols need to be developed so that sampling results
from before and after installation arecomparable.
4. Fish and benthic community populationsizes should be monitored throughoutthe sampling period (year) to evaluateseasonality effects and monitor aggregation behavior and periods.
5. Information on how fish communitiesrespond to existing MPAs could be usedto inform wave energy facility sitingconsiderations, and develop baseline/control study areas.
6. Changes in the behavior of migratoryfish in and near wave energy facilitiesshould be monitored using taggingtechnologies and telemetry procedures.
7. The tissues of fish and benthicorganisms should be sampled if chemical leaching is suspected or has been documented. Ideally, tissuesamples should be taken and archived prior to the installation of facilities toallow for the establishment of baselinelevels of contaminants.
8. Unique, site-specific monitoringrequirements should be identified andincorporated into sample design andevaluation protocols. For example, aspecific wave energy facility locationmay include a unique feature such asstrong upwelling or a physical featurethat warrants special consideration.

8/3/2019 Wave Energy NOAATM92
http://slidepdf.com/reader/full/wave-energy-noaatm92 100/186
88
Receptor-specific effects table for fish and fisheries. KEY: L=low impact, M=medium impact, H=high impact, U=unk
associated with the estimate, + positive effect
Activity (agent or stressor) Receptors
M a r k e t S q u i d a
D u n g e n e s s C r a b
P i n k S h r i m p
b
S h a r k s
S a l m o n a n d
S t e e l h e a d c
A l b a c o r e T u n a
b , d
S m e l t s ,
h e r r i n g ,
s a r d i n e s , a n c h o
v i e s
R o c k f i s h ,
L i n g c o d e
Emplacement
Mooring System L L L L L L L L Electrical Transmission Infrastructure L L L L L L L L
Operation
Mooring System & benthic habitat (shell mounts) H+ H M+ M+ Mg M+ L H+
Buoy or Other Generation Device L L L M+ Mg
M+ L H+ Electrical Transmission Infrastructure(EMF) L M? L H H? L L M? Chemical Coatings L H L L H L L M Wave and Current Attenuation U U U U U U U U Acoustics L L L L H? L M M?
Decommissioning
Buoy or Device Removal L L L L L L L L Transmission Infrastructure Removal M M M L M L L M Anchor Removal or Decommissioning M M M L M L L M
Routine Maintenance
Vessel Traffic, Maintenance Activities L? L? L? L? L? L? L? L?
a Doryteuthis opalescens (formerly Loligo opalescens) b Low vulnerability given our understanding of the current wave energy
structures and technologyc Sea-run rainbow trout, Oncorhynchus mykissd Thunnus alalungae Ophiodon elongates
f Ammodytes hexapterusg positive effect for adults, negative for jh positive or negative effect, varies with
8/3/2019 Wave Energy NOAATM92
http://slidepdf.com/reader/full/wave-energy-noaatm92 101/186
89
Receptor Breakout Group Report: Marine Birds
Participants:
Holly Campbell, OSU (Rapporteur)Robin Hartmann, Oregon Shores Conservation Coalition (Facilitator)
Jan Hodder, OIMB (Chair)Roy Lowe, USFWSRob Suryan, OSUJen Zamon NOAA-NMFS, NWFSC
Key Findings
For purposes of this document, our definition of “marine birds” included not onlyseabirds that spend their entire lives in marinewaters, but also waterbirds, waterfowl, and
shorebirds that are seasonal visitors to marinewaters or use marine flyways during migration.
We divided the stressors introduced byfacilities harvesting wave energy into two broadcategories: 1) direct effects from wave energystructures, which include impacts such asmortality, injury, and attraction/avoidance of anarea, and 2) indirect effects such as changes in bird habitat or food webs. Stressors may be newstressors that are introduced to the environmentas a result of wave energy infrastructure; or
enhanced existing stressors that are already present in the environment but whose impactwill be increased due to the addition of waveenergy infrastructure. Following are specificconclusions from our discussion:
• Given currently existing information,collisions with structures above the seasurface have the largest potential directimpacts on marine birds. Lighting andstructures may result in unusualattraction and collisions.
• The most important indirect effects arelikely to be the alteration of coastalocean food webs and the physicaleffects of wave energy alteration on the beach, which have the potential to affectshorebirds that forage and nest there.
• We have significant data gaps in thespatial and temporal abundance of birds.
In particular, we do not know if thereare important areas of bird activity in theocean to avoid, or what birds do atnight, particularly during migration.
Top Ecological Issues
Direct effects of wave energy structures
New stressors for marine birds —New keystressors for marine birds include any wavefacility structures above the sea surface.Specific issues identified with new stressors areas follows:
1. Presence of any continuous lightingassociated with wave energy facilitieswill attract birds to the structure at night,
thus causing distribution or behavior changes that may lead to collisions.
2. Flying birds may collide with hardstructures above the surface duringtimes of high winds or poor visibility(storm conditions, fog, and darkness).
3. Oil leakage from any part of thestructures, even nontoxic oils, will foulfeathers and disrupt their waterproofingand thermoregulatory functions.
Collision hazards for flying birds aredocumented by studies that monitor wind energyharvesting devices. The greatest direct mortalityoccurs when improper site selection places windenergy structures within a migration corridor.We are therefore very concerned about proper site selection for wave energy structures.

8/3/2019 Wave Energy NOAATM92
http://slidepdf.com/reader/full/wave-energy-noaatm92 102/186
90
It is possible to collect information onmarine bird migrations and commuter flyways,and thus increase the probability of low-impactsite selection (see below). However, unlike theland-based collision hazard studies, we currentlylack an effective methodology to detect and
measure collision injury or collision mortality of birds at sea. This critical uncertainty about oneof the most significant direct stressor impactswill remain unless a method for measuring birdcollisions with wave energy structures can bedeveloped.
Enhancement of existing stressors for
marine birds —Stressor types (e.g., vessels,mooring lines) already present within theenvironment due to existing human uses, butwhich will be added to or enhanced by wave
energy structures, include vessel activity andsubsurface lines associated with wave energyfacilities. Specific key issues identified withenhancement of existing stressors include thefollowing:
1. Deck lights from installation or maintenance vessel activity at night willattract birds.
2. Vessel accidents or vessel collisionswith wave energy structures could resultin oil spills.
3. Subsurface structures may alter food-web dynamics, food distribution,habitat, or habitat accessibility for birds.
Indirect effects of wave energy structures on
habitat and food webs
We anticipate that arrays of wave energystructures will have effects on physical habitat aswell as on other marine organisms such as benthic invertebrates and fish. Specific effectsare contained in reports from other receptor
groups. Those impacts likely to affect marine birds include the following:
1. Food-web changes (e.g., distribution,abundance, or behavior of fishes andinvertebrates) may have positive or negative impacts on foraging by marine birds.
2. “Shadow” effects caused by energyabsorption in the structures may affectthe physical environment of the sandyshore, thus affecting shorebird habitat.Effects on sanderlings (Calidris alba)and snowy plovers (Charadrius
alexandrinus) are the principal concerns.
Scientific Uncertainty and Agreement
Available data
There are limited contemporary data onOregon marine birds. These data were collectedunder a variety of mandates and methods, andinformation has not been synthesized. Below isa summary of contacts and information sources
of which we are aware:1. Scientific literature and presentations
address historical species presence or absence and community composition onthe Oregon coast, and approximatedepth ranges within which species aremost abundant.
2. Roy Lowe (USFWS) has a catalog withlocations of Oregon coast seabird breeding sites, and information onsnowy plovers. The Habitat
Conservation Plan for the snowy plover (OPRD 2005) and Designation of Snowy Plover Critical Habitat (USFWS2005) are available online.
3. Jen Zamon (NOAA-NMFS, NWFSC)has at-sea bird distribution data from Newport, Oregon, north to theWashington state border, collected primarily in May and June from 1 to 25nautical miles (1.85–46.3 km) offshoreduring 2003 to 2007.
4. Rob Suryan (OSU) has at-sea birddistribution data from the NewportHydrographic line from 1 to 25 nmioffshore during 2007, and satellitetelemetry on endangered albatross(Suryan et al. 2007).
5. Craig Strong (Crescent CoastalResearch) has at-sea bird distribution

8/3/2019 Wave Energy NOAATM92
http://slidepdf.com/reader/full/wave-energy-noaatm92 103/186
91
data from the surf zone to about 3 nmi(about 5.5 km) offshore, as part of themarbled murrelet ( Brachyramphus
marmoratus) surveys during 1992–1996and 2000–2004; and a dredged-materialassessment report for Clatsop Spit,
Oregon (Strong 2005).
6. Dave Ainley (HT Harvey & Associates)has at-sea bird distribution data from Newport, Oregon, south to theCalifornia border in 2000 and 2002(Ainley et al. 2005, Ainley and Tynan2005).
7. Lisa Ballance (NOAA-NMFS, SWFSC)has at-sea bird distribution data fromthree biannual offshore CSCAPE(Collaborative Survey of Cetacean
Abundance and the Pelagic Ecosystem)survey lines in Oregon.
8. Glenn Ford (R. G. Ford Consulting) hascompiled some of these disparate datasets, including MMS aerial surveys(Ford et al. 2004).
9. Greg Gillson (The Bird Guide, Inc.) hasqualitative information on distributionand seasonal occurrence in centralOregon and elsewhere from pelagic bird-watching trips (Gillson 1994).
10. Range Bayer (Bayer Research,[email protected]; http://www.orednet.org/~rbayer/), Phil Pickering(private citizens) and Mike Patterson(Celeta Research Associates) havequalitative, land-based bird observationdata from headlands, especiallyconcerning seasonal occurrence andmigrations.
Items of common knowledge, but lacking
quantitative data
Two items of common knowledge aboutmarine birds and habitat use were highlighted:
1. Large numbers of marine (andnonmarine) birds migrate within statewaters of the territorial sea (0 to 3 nmi
from shore), particularly during thespring and fall.
2. Large numbers of birds make dailyfeeding commutes from river mouthsand breeding colonies to feeding areas
in nearshore or open ocean areas. Theseflyways occur within or cross throughstate waters of the territorial sea.
Key Information Gaps
Distribution and habitat use data
Comprehensive spatial and temporal data onthe distribution and habitat use for marine birdsalong the Oregon coast are lacking. Methods for obtaining these data include ship-, aircraft-, or
land-based surveys for daytime distribution; andsatellite or radio tagging for habitat use andresidence time.
Maps are needed of important bird feedingor staging areas (“hot spots”) along the Oregoncoast. Data for these maps could be obtained byaircraft or ship surveys for daytime distributions,and satellite or radio tagging for habitat use bothday and night.
We do not know which species fly at night
or how far above the sea surface flight paths are.Information on migration patterns and behavior,including flight patterns at night and in storms,could be obtained through radar studies at night,and satellite or radio tagging.
Existing stressor analogs may provide useful
insight
We have no information on wave energystructure impacts for Oregon coast marine birdsor marine ecosystems because, at this time, onlysingle devices have been deployed in Oregon for engineering tests or proof-of-concept. However,there is information available from other ecosystems that may provide useful insight, suchas the following:
• Offshore wind-energy farms
• Offshore oil platforms

8/3/2019 Wave Energy NOAATM92
http://slidepdf.com/reader/full/wave-energy-noaatm92 104/186
92
• Wave energy development in other partsof the world
Feasibility and Effectiveness of Mitigation
It is possible that direct and indirect effectsof stressors can be decreased with appropriatedesign and deployment strategies. Several ideasthat should be investigated were mentionedduring the workshop discussion:
1. Avoid installing wave energy structuresnear breeding colonies, primary foragingareas, and migration corridors.
2. Constant bright light at night will attract birds or interfere with night-vision birds.Intermittent light should reduce light
impacts. Intermittent lights should beoff more than on during each lightingcycle.
3. Birds are probably attracted more tocertain colors of light than others, socolor of lighting could be a mitigationmeasure. This would require specificdata or experiments.
4. Night work by vessels is moredetrimental than daytime work.
5. Design of surface structures shouldminimize potential for roosting by birds.Simple and proven devices already existto discourage roosting.
6. Underwater lines should be rigid andlarge to minimize underwater collision potential.
7. Structures should use multiple layers of containment for oils.
8. Above-surface structures shouldminimize height above the sea surface to
reduce collision potential.
Recommendations for Baseline and
Monitoring Studies
It will be impossible to provide responsiblemeasures of stressor impacts or minimize suchimpacts through wise site-selection or design
improvements without data on existingcoastwide bird use and distribution.Furthermore, site-specific data must be collectedto make Before-After-Control-Impactcomparisons of positive, negative, and negligibleimpacts on marine birds. Below are some
recommendations for the types of data needed toexamine stressor impacts.
Baseline studies
Coastwide baseline studies prior to siteselection should be used to recommend wherestressor impacts are likely to be lowest andshould consider
• Spatial and temporal distributions,habitat use by marine birds
• Migration and flight patterns
• Ecologically sensitive habitats (e.g., breeding, feeding areas)
Preinstallation studies
Once a site is selected, but prior toinstallation of wave energy structures, site-specific studies need to document preinstallationconditions, such as
• Bird distribution, abundance, behavior,and habitat use
• Comparisons within, near, and outsidethe spatial footprint of the installation
Postinstallation studies
Site-specific monitoring while structures arein place should document both positive andnegative impacts, such as
•
Bird distribution, abundance, behavior,and habitat use
• Comparisons within, near, and outsidethe site of the installation
• Comparisons with nearby control sites
• Direct mortality caused by collision or oiling

8/3/2019 Wave Energy NOAATM92
http://slidepdf.com/reader/full/wave-energy-noaatm92 105/186
93
Literature Cited
Ainley, D. G., L. B. Spear, C. T. Tynan, J. A. Barth,S. D. Pierce, R. G. Ford, and T. J. Cowles. 2005.Physical and biological variables affectingseabird distributions during the upwelling season
of the northern California Current. Deep-SeaRes. Part II Top. Stud. Oceanogr. 52:123–143.
Ainley, D. G., and C. T. Tynan. 2005. GLOBEC NEP Northern California current bird data, andcurrent bird metadata, R/V New Horizon cruises
NH0005 and 0007. Online at http://globec.whoi.edu/jg/dir/globec/nep/ccs/ [accessed 3February 2008].
Ford, R. G., D. G. Ainley, J. L. Casey, C. A. Keiper,L. B. Spear, and L. T. Ballance. 2004. The
biogeographic patterns of seabirds in the central portion of the California Current. Mar.Ornithol.
32:77–96.
Gillson, G. 1994. The Bird Guide, Inc. Online athttp://thebirdguide.com [accessed 2 February2008].
OPRD (Oregon Parks and Recreation Department).2005. Habitat conservation plan for the westernsnowy plover. Draft. Online at http://www.oregon.gov/OPRD/PLANS/docs/masterplans/osmp_hcp/HCP11-17-04.pdf [accessed 3February 2008].
Strong, C. S. 2005. Marine birds of the near shorewaters of Clatsop Spit: An assessment of composition, abundance, and potential effectsfrom dredge spoil deposition adjacent to thesouth jetty of the Columbia River. CrescentCoastal Research, Crescent City. Online athttp://inr.oregonstate.edu/download/marine
_birds_final_strong.pdf [accessed 3 February2008].
Suryan, R. M., K. S. Dietrich, E. F. Melvin, G. R.Balogh, F. Sato, and K. Ozaki. 2007. Migratoryroutes of short-tailed albatrosses: use of exclusive economic zones of North Pacific Rimcountries and spatial overlap with commercialfisheries in Alaska. Biol. Conserv. 137:450–460.
USFWS (U.S. Fish and Wildlife Service). 2005.Endangered and threatened wildlife and plants;Designation of critical habitat for the Pacific
Coast population of the western snowy plover;Final rule. Federal Register [RegulationIdentifier Number 1018-AT89, 26 September 2005] 70(188):56970–57119. Online athttp://frwebgate.access.gpo.gov/cgi-bin/getdoc.cgi?dbname=2005_register&docid=fr29se05-14 or at http://www.gpoaccess.gov/fr/retrieve.html [accessed 3 February 2008].

8/3/2019 Wave Energy NOAATM92
http://slidepdf.com/reader/full/wave-energy-noaatm92 106/186
94
Receptor-specific effects table for marine birds. KEY: L=low impact, M=medium impact, H=high impact
Activity (agent or stressor) Receptors
L o o n s a n d G r e b e s
A l b a t r o s s e s
P e t r e l s
S h e a r w a t e r s a n d
F u l m a r s
P e l i c a n s
C o r m o r a n t s
G u l l s
T e r n s
C o m m o n M u
r r e s
M a r b l e d M u r
r e l e t s
P i g e o n G u i l l e m o t s
Emplacement
Mooring System M L L M L M L L M M LElectrical Transmission M L L M L M L L M M LLighting on vessels andequipment
L L H H L L M L L L L
Operation
Mooring System M L L M L M L L M M LBuoy or Other Generation H L L H L H L L H H LElectrical Transmission M L L M L M L L M M LChemical Coatings L L L L L L L L L L LLighting on Buoys L L H H L L L L L L L
Decommissioning
Buoy or Device Removal L L L L L L L L L L LTransmission Infrastructure M L L M L M L L M M LAnchor Removal or Decommissioning
L L L L L L L L L L L
Lighting L L H H L L L L L L LRoutine Maintenance
Vessel Traffic, Maintenance L L L L L L L L L M LLighting L L H H L L M L L L L

8/3/2019 Wave Energy NOAATM92
http://slidepdf.com/reader/full/wave-energy-noaatm92 107/186
95
Receptor Breakout Group Report: Marine Mammals
Participants:
Steve Bartell, E2 Consulting EngineersRobin Brown, ODFW
Debbie Duffield, guest Nelio Barros, PSUJim Hastreiter, FERCBruce Mate, OSUDavid Mellinger, OSU, NOAABrycen Swart, OSU (Rapporteur)Cathy Tortorici, NOAA-NMFS (Chair and Facilitator)Kate Wing, NRDC
Key Findings
• Information about the effects of wave
energy on cetaceans and pinnipeds islacking. It is critical to synthesize basic baseline data (e.g., cetacean and pinniped biology, presence or absence,species diversity, information on preyspecies) in areas where these species areseasonally abundant to identify their migration corridors and home ranges,and to understand potential impacts in both the short- and long-term.
• It is important to monitor cetaceans and pinnipeds (e.g., strandings, movements,
dive behavior, and habits) by tagging,videography, vessel surveys, etc., tounderstand how they interact with waveenergy buoy facilities. Monitoringshould be expanded to include other components of the coastal marineecosystem (primary and secondary producers and consumers).
• Of all agents or stressors considered,mooring cable design (slack vs. taut,horizontal vs. vertical, diameter,
density) is most likely to affect themagnitude of cetacean entanglementincidents for large whales. Cable designis even more critical for slack “attendant” lines attached to adjacent buoy lines, which may be used (picked-up) by service vessels to secure thewave energy buoy. Similar, but smaller,“double” buoys on commercial crab pots
form the major present risk to graywhales ( Eschrichtius robustus) fromcommercial fisheries off of Oregon.
• Harbor porpoises (Phocena phocena)were considered to have the potential for high impact from acoustic disturbances.Pinnipeds as a group might sustainlower impact from wave energy devicesunless the devices were near a rookery.
Top Ecological Issues
The following list is prioritized by likelysignificance of impacts. The group emphasized
the need for monitoring to determine if these arethe most significant impacts for both pilot- andcommercial-scale projects. These prioritiesshould be thought of as a preliminary list of potential factors to be included in developmentof subsequent impact statements.
Mooring cables
The biggest potential biological andecological threat to cetaceans is probablymooring and “attendant” cables. The groupdoubted that whales would actually see themooring cables, and as a result could strike themor become entangled in them and be injured or killed. Depending on the density, spacing, anddistance of the cables from the water’s surfaceand ocean floor in a wave energy buoy array, themooring lines could have a “wall effect” thatwould force whales around them, potentiallychange migration routes of gray whales in

8/3/2019 Wave Energy NOAATM92
http://slidepdf.com/reader/full/wave-energy-noaatm92 108/186
96
particular, and block feeding habitat underneaththe array. Presently, designers are suggesting50- to 100-meter spacing.
Thin mooring cables are more dangerousthan thick ones because they may cause
lacerations and entanglements, although thick cables may cause blunt-force trauma. Slack cables are more dangerous than taut ones for entanglement risk, and depending on where theyare in the water column, horizontal cables aremore dangerous than vertical lines. In thisrespect, even short tag lines attached to a buoywith a slack horizontal line pose a significantrisk for entanglement.
In addition, if the transmission cables and/or anchor lines associated with a wave energy array
are buried less than 1 m, gray whales could digthem up while feeding, so this point needs to befactored in as arrays are designed.
Buoys
Effects on gray whales could be high if project construction and decommissioning occur when whales are migrating through the area or in areas of significant feeding.Decommissioning or demolition (withexplosives) should not be done while graywhales are in the area. Collision and injurycould occur if a whale swam into a buoy. Thegreater the surface area of the buoy occurring below the ocean surface, the greater the chancethere is for a whale strike. Loud acoustic outputfrom buoys could disrupt feeding or migration behavior for whales and dolphins. Modestacoustic noise from buoys may be an asset for whales to detect the buoys themselves, but anydesirable effect may vary with sea state as thesignal-to-noise ratio changes.
It will be important to install pinniped
exclusion devices on the wave energy buoys thatare oriented vertically or diagonally in the water column to ensure that seals and sea lions do nothaul out on the devices and thus be targets for possible illegal shootings and endanger the buoyitself. Although California sea lions ( Zalophus
californianus) are the most likely to attemptusing buoys as haulouts, Steller sea lions
( Eumetopias jubatus) are the species of mostconcern (due to their ESA status) during openocean implementation and decommissioning as aresult of vessel traffic in the ocean. Harbor seals(Phoca vitulina) are most likely to be affected by the same vessel traffic, but in estuaries before
the ships move out to sea. Elephant seals( Mirounga angustirostris ) are probably the leastlikely to be affected by wave energy buoy arrays because they are deep water feeders at sea andabsolute numbers are relatively low in Oregon,the northern extent of their range.
The group strongly agreed that horizontal“Pelamis” type devices present the highest risk of whale strikes. It may also be difficult to keepseals and sea lions off their large surfaces. For both buoy configurations and larger “Pelamis”
type devices, if the devices attract fish, thiscould compound interactions with marinemammals, as harbor seals, California sea lions,and Steller sea lions would be drawn to feed onthose fish.
Acoustics
Depending on the sound emitted from a buoy array, the sound could warn cetaceans tostay away from the array or attract them to it.Either situation could have an impact.
Avoidance behavior associated with sound couldresult in changes to cetacean migration routes,especially the nearshore gray whale. If themooring cables form any type of essential barrier, then cetaceans pushed together into asmaller migration corridor could be morevulnerable to predators, like killer whales(Orcinus orca), and have reduced foragingability. Killer whales could also then interpretsounds from an array as a signal for aggregation,which could result in increased exposure to predation for other species.
Chemicals
Chemical spills are not a high threat tocetaceans and pinnipeds. However, the groupemphasized that prompt cleanup of chemicalspills from wave energy buoys (especially thosewashed up on the shore) is critical to minimizingexposure to cetaceans and pinnipeds, and to

8/3/2019 Wave Energy NOAATM92
http://slidepdf.com/reader/full/wave-energy-noaatm92 109/186
97
shallow water benthic habitats where graywhales feed.
Electromagnetic fields
Not much is known about the effects of
electromagnetic fields on cetaceans and pinnipeds. If predatory fish like sharks areattracted to wave energy arrays, this could createa dangerous situation for marine mammals, particularly dolphins and porpoises, which arenaturally occurring nearshore (especially harbor porpoises) and may also be attracted to thevicinity of a wave energy array.
Scientific Uncertainty and Agreement
The level of uncertainty and scientific
agreement concerning the impacts of waveenergy generating devices on cetaceans and pinnipeds depends on the species, device,number of devices, and the mooring cablearrangement for the array. The Receptor-Specific Effects Table below details impacts andlevels of uncertainty.
Feasibility and Effectiveness of Mitigation
Impact minimization measures for mooringcables must consider the cable diameter, length,and density; and whether the cables are slack or taut. It might be possible to develop a modeland crude approximation of cable density to probability of strike or entanglement, to identifyconfigurations that pose sufficient risk to requireappropriate minimization and mitigation actions.
It might also be possible to place acousticwarning systems on buoys. There is someevidence from NMFS’ Southwest FisheriesScience Center that acoustic warning systemshave worked on fishing nets to minimizeentanglement. The strongest evidence on theuse of acoustic warning systems has beendemonstrated in studies on aquaculture facilities.These warning devices were designed to keep pinnipeds away, but have been shown to driveaway harbor porpoises as well. However, thereis still a high level of uncertainty concerningwhether such a system would deter whales at awave energy buoy array. In designing such a
system, it is important to consider soundemission levels that are loud enough to deter theanimal, but not loud enough to damage hearing.Such devices should not exclude whales fromidentified foraging areas. The devices also needto adapt to varying levels of background noise
associated with different sea states to avoidexcessive noise (and affected areas) when lowsea states do not require loud sources.
The group also considered if there is an“ocean corridor” outside of known migratoryroutes that could be identified and considered bythe industry for placement of wave energy buoyarrays, to minimize impacts to pinnipeds andcetaceans. For pinnipeds, the grouprecommended specifically that these projects not be sited near rookeries (i.e., Cape Arago), and
that seasonal buffer zones be placed around therookeries so as not to disturb them.
Recommendations for Baseline and
Monitoring Studies,
Key Information Gaps
The most important information needed is baseline information prior to the development of wave energy facilities. The general habits of most of the cetaceans and pinnipeds that could be affected by the development of wave energy
off the Oregon coast are not well understood.The following data collection needs wereidentified as top priorities:
• General biological information oncetaceans and pinnipeds, starting with aliterature review of availableinformation. Initial information could be obtained from the petroleum industryand regulatory authorities, and/or thevarious NMFS’ Fisheries ScienceCenters.
• Seasonal distribution, migration patterns, and residency information on aspecies-by-species basis.
• Dietary information on a species-by-species basis.
• Abundance and distribution informationon a species-by-species basis.

8/3/2019 Wave Energy NOAATM92
http://slidepdf.com/reader/full/wave-energy-noaatm92 110/186
98
• Information on bottom habitats wherewave energy arrays are proposed to be placed.
• Assessment of behavioral interactions of marine mammals with wave energy
conversion devices and cables.The group emphasized that baseline and
survey work should include an average weather year, an El Niño year, and a La Niña year. Thisinformation should be collected over a 3–5 year period to account for variability in oceanconditions, and cetacean and pinniped speciesabundance and behavior. An importantcomponent of baseline data collection could bethe development of a migration corridor modelfor cetaceans and pinnipeds based on tagging.The baseline information should form the
building block of any monitoring work conducted on any single wave energy project, or group of projects, along the Oregon coast. Thegroup specifically discussed different
monitoring techniques that could be used for cetaceans and pinnipeds:
• Animal spotting from the beach or frommoored vessels in areas of proposeddevelopment
• Forensic diagnostics (necropsy) on all beach-cast (dead or injured) marinemammals to identify if a strike or injuryhas occurred and the nature of thatinjury
• Tagging whales to track them usingsatellite data, including pop-off tags onmigrating whales
• Aerial surveys
Due to low water visibility conditions off the Oregon coast, videotaping would not beeffective to monitor cetacean and pinniped behavior in and around the array.
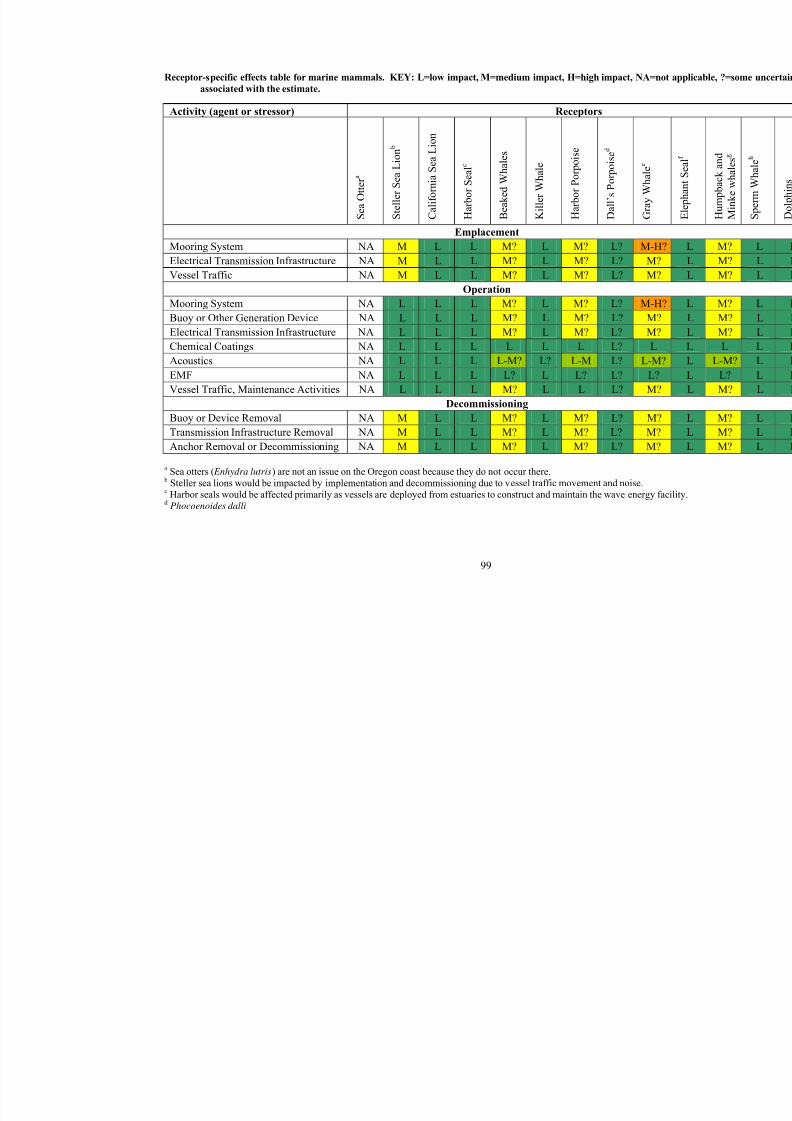
8/3/2019 Wave Energy NOAATM92
http://slidepdf.com/reader/full/wave-energy-noaatm92 111/186
99
Receptor-specific effects table for marine mammals. KEY: L=low impact, M=medium impact, H=high impact, NA=n
associated with the estimate.
a Sea otters ( Enhydra lutris) are not an issue on the Oregon coast because they do not occur there. b Steller sea lions would be impacted by implementation and decommissioning due to vessel traffic movement and noise.c Harbor seals would be affected primarily as vessels are deployed from estuaries to construct and maintain the wave energy fd Phocoenoides dalli
Activity (agent or stressor) Receptors
S e a O t t e r a
S t e l l e r S e a L i o n b
C a l i f o r n i a S e a L
i o n
H a r b o r S e a l c
B e a k e d W h a l e s
K i l l e r W h a l e
H a r b o r P o r p o i s e
D a l l ’ s P o r p o i s e d
G r a y W h a l e e
Emplacement
Mooring System NA M L L M? L M? L? M-HElectrical Transmission Infrastructure NA M L L M? L M? L? M? Vessel Traffic NA M L L M? L M? L? M?
Operation
Mooring System NA L L L M? L M? L? M-HBuoy or Other Generation Device NA L L L M? L M? L? M? Electrical Transmission Infrastructure NA L L L M? L M? L? M? Chemical Coatings NA L L L L L L L? L Acoustics NA L L L L-M? L? L-M L? L-M?EMF NA L L L L? L L? L? L? Vessel Traffic, Maintenance Activities NA L L L M? L L L? M?
Decommissioning
Buoy or Device Removal NA M L L M? L M? L? M? Transmission Infrastructure Removal NA M L L M? L M? L? M? Anchor Removal or Decommissioning NA M L L M? L M? L? M?

8/3/2019 Wave Energy NOAATM92
http://slidepdf.com/reader/full/wave-energy-noaatm92 112/186
100
e Effects to the gray whale population for a pilot project rate as medium. For a commercial project, the effects could be high.If installation is done when whales are there, then the effect could be high. If the population has seasonally migrated to Baja,
be low, but overall effect would remain a medium.f Elephant seals are deep-water feeders and because of this behavior are not predicted to be greatly affected by construction org Uncertainty for humpback ( Megaptera novaeangliae) and minke ( Balaenoptera acutorostrata) whales relates to whether theconstruction and operation.h
Physeter catodon

8/3/2019 Wave Energy NOAATM92
http://slidepdf.com/reader/full/wave-energy-noaatm92 113/186
101
Stressor Breakout Group Report: Energy Absorbing Structures
Participants:
Keith Kirkendall, NOAA-NMFS (Chair and Facilitator)Hugh Link, Oregon Dungeness Crab Commission
Bill Peterson, NOAA-NMFS, NWFSCMaria Stefanovich, OSU (Rapporteur)Jen Zamon, NOAA-NMFS, NWFSC
Key Findings
The discussion centered on the potentialimpacts of energy absorbing structures (of alltypes) on the ecology of the nearshoreenvironment. All issues were intimately relatedto the topics discussed by other working groups.
The reader should consult those working groupreports for more detail, especially for receptors.
Three main ideas arose as themes:
• The inshore area (depths < 100 m, butespecially < 40 m) off the coast of Oregon is a particularly sensitiveecological zone. Any energy absorbingstructure placed here will have impactson not just one or two receptors, but ona suite of related ecological receptors.Wise site-selection before installation isone of the least expensive and mosteffective ways to avoid undesirableimpacts on both the ecology.
• Energy absorbing structures that trapwater (overtopping devices) are likely to be the most problematic designs,especially in nearshore environments, because they will also trap or focusmarine organisms or debris. This willaffect the functioning of the device aswell as ecological functions.
• Effective cleaning and maintenanceschedules for energy absorbingstructures need to take into account whatis known about naturally occurring physical and biological cycles.
This list should be viewed only as a starting point for continued discussion of stressor
impacts, not a comprehensive list of all possibleissues of concern.
Top Ecological Issues
The biologically productive nearshore zone
Because of the combination of tidally drivenmixing, wind mixing, and upwelling, shelf habitat inshore of 100 m depth, and particularlyinshore of 40 m depth, is the most biologically productive marine zone (see overview byPeterson in this volume, as well as reports fromreceptor working groups).
The productivity in this zone includesimportant pelagic and benthic food webs. Inaddition to supporting communities of marine birds, mammals, fishes, invertebrates, and evena reptile (the leatherback turtle, Dermochelys
coriacea); each of these food webs supportsimportant commercial and recreational harvestsof finfish and shellfish (e.g., salmon, sardines, bottom fish, rockfish, and Dungeness crab[Cancer magister ]). Several protected speciesalso include this zone in their critical habitat;impacts on those species are significant for legal purposes.
Many potential impacts were discussed based on what is known about energy absorbingstructure design and how organisms, human and
nonhuman, might react to those structures. Theseverity of actual impacts will remain unknown,however, unless well-designed monitoring programs are in place to measure those impacts by documenting the response of the biota.
Exclusion zone —Any device or array of devices will necessarily have an exclusion zonesurrounding it to prevent collisions or

8/3/2019 Wave Energy NOAATM92
http://slidepdf.com/reader/full/wave-energy-noaatm92 114/186
102
entanglements between the device and ships or fishing gear. Exclusion zones will haveimmediate impacts on existing uses by maritimevessel traffic and fishing.
Microscopic organisms —While
microscopic organisms at the base of the foodweb (phytoplankton, zooplankton) might not beadversely affected by any one individual energyharvesting structure, arrays of many structuresare expected to have impacts on distribution andabundance of such organisms by changingcurrents, mixing, and wave energy within andnear the array (see results from the physicalenvironment receptor working group).
Migration paths —Devices and arrays inthe nearshore zone will be in the path of
migrating birds, mammals, and fishes. Of particular concern are
• Birds colliding with above-surfacestructures, especially during lowvisibility and adverse weather (seeadditional discussion in the marine birdreceptor working group report).
• California gray whales (Eschrichtiusrobustus), especially cows and calves, becoming either herded further offshorewhere calves may be more vulnerable to
predation, or becoming trapped or entangled in mooring lines of densearrays (see additional discussion in themarine mammal receptor working groupreport). Calves in distress are of specialconcern because mothers will remainwith them.
• Salmon migrations becoming disruptedin some fashion (physically, chemically,or electrically) when juveniles migratealongshore during their first summer at
sea, or when adults make their returnmigration to spawning grounds.
Biofouling —Any structure or device belowthe waterline will be subject to biofouling.Fouling communities are known to affect benthic habitats below and adjacent to them because organisms in those communitiesgenerate excreta and detritus. Decreased
buoyancy and increased drag caused by foulingmay also make the device itself more vulnerableto being torn away during extreme weather events.
Electromagnetic fields and acoustics —
Many organisms are known to be sensitive tochanges in electromagnetic fields andunderwater sounds. There are concerns, particularly in the fishing community, that largemetal structures generating electromagneticfields and underwater sound, or the use of certain metals such as those used in sacrificialanodes, will cause certain species to avoid areasoccupied by energy absorbing structures.
Overtopping structures
Overtopping devices (which trap andcontain surface water) will serve as collectorsfor near-surface organisms and debris. Not onlythe items being collected, but also the performance and function of the devices will beaffected.
Impacts of biology on devices: clogging — Natural physical and biological cycles in thenearshore can generate dense aggregations of certain organisms or debris. If these organismsare trapped or focused into certain parts of theenergy harvesting device, then that device could become clogged or its operation could be lessthan optimal. For example, it is known fromresearch surveys that very dense aggregations of a coastal jellyfish, Chrysaora fucescens, occur inthe nearshore waters of Oregon during summer and early autumn. This jellyfish bloom is likelyto clog water intakes. In some years, large raftsof “by-the-wind-sailors” (Velella velella), a typeof jellyfish, are found off the coast and thesewill certainly become trapped by overtoppingdevices. Perhaps more importantly, endangeredsteelhead trout (Oncorhynchus mykiss), whichlive at the sea surface, will almost certainly becaptured (and likely killed) by overtoppingdevices. Finally, the onset of winter rains canwash large amounts of debris, such as logs, intothe coastal ocean from rivers. This debris mayalso impair the function of devices that focus or trap near-surface water.

8/3/2019 Wave Energy NOAATM92
http://slidepdf.com/reader/full/wave-energy-noaatm92 115/186
103
Impacts of devices on biology:
entrapment —Near-surface organisms willlikely become trapped or concentrated withinany water-trapping device. This trapping or concentration could result in the followingnegative impacts:
• Injury or death of organisms passingthrough the energy harvestingmechanism
• Injury or death of organisms trying toescape
• Increased vulnerability of trappedorganisms to predation
• Trapping of attracted predators, with possible consequent damage to the
device
Cleaning and maintenance
Any device deployed in the marineenvironment—regardless of the mechanism ituses to convert wave energy to electricalenergy—will be subject to biofouling by marineorganisms. These organisms could change thefollowing properties of the device:
• Buoyancy
• Drag
• Turbulence
Changes in those properties could affect theefficiency of the device, if fouling affectsmoving parts essential to buoy function, as wellas device vulnerability to damage or dislocationduring heavy weather.
Regular cleaning and checks of the deviceswill be necessary and to be most effective,cleaning and maintenance should account for
natural cycles of organism settlement andgrowth. Fouling organisms will settle onmooring lines and hard structures primarily inspring with greatest growth in summer. It would be wise to clean the structures during latesummer and early autumn so that the drag onmooring lines is decreased before storms arrive.We also recommend that cleaning be carried
over an extended period of time so that there isnot a single massive deposition of material to theseafloor over the course of a few days.
Key Information Gaps
At this time, the State of Oregon lacks acomprehensive, integrated inventory of coastwide marine resources. If the State of Oregon is going to proceed with wisedevelopment of wave energy as a renewableresource, then it is imperative that the Stategenerate such information. Lacking thisinformation, it is much more difficult to evaluategood locations vs. bad locations during the site-selection process.
Feasibility and Effectiveness of Mitigation
Suggestions for how to mitigate theundesirable impacts of wave energy structuresincluded the following:
1. Locate devices/arrays at depths that donot compromise highly productivewaters; certainly greater than 40 m, and possibly greater than 100 m. Thisavoids use conflicts with nearshorevessel traffic and fishers, known
nearshore migratory pathways for protected species, and placement of stressors in sensitive environmentswhere effects on suites of interdependent receptors is likely.
2. Avoid using devices that physically trapwater, as they will also trap organisms,such as endangered steelhead trout, anddebris. Trapped organisms or debriscould also compromise functioning of the device.
3. Use what is known about seasonalcycles in physics and biology to designeffective cleaning and maintenanceroutines. Work with biologists tooptimize cleaning intervals.

8/3/2019 Wave Energy NOAATM92
http://slidepdf.com/reader/full/wave-energy-noaatm92 116/186
104
Recommendations for Baseline and
Monitoring Studies
The development of wave energy facilitieswithin the Oregon coastal ecosystem is a newevent. The type and magnitude of impacts—
either positive or negative—that such facilitieswill have on the ecology of Oregon will remainonly educated speculation unless well-plannedstudies are in place to monitor and measurethose impacts.
Studies of potential impacts need to consider the following:
• Effect of a single device vs. an array of devices
• Effect of array design on impacts
• Water depths in which the devices are placed
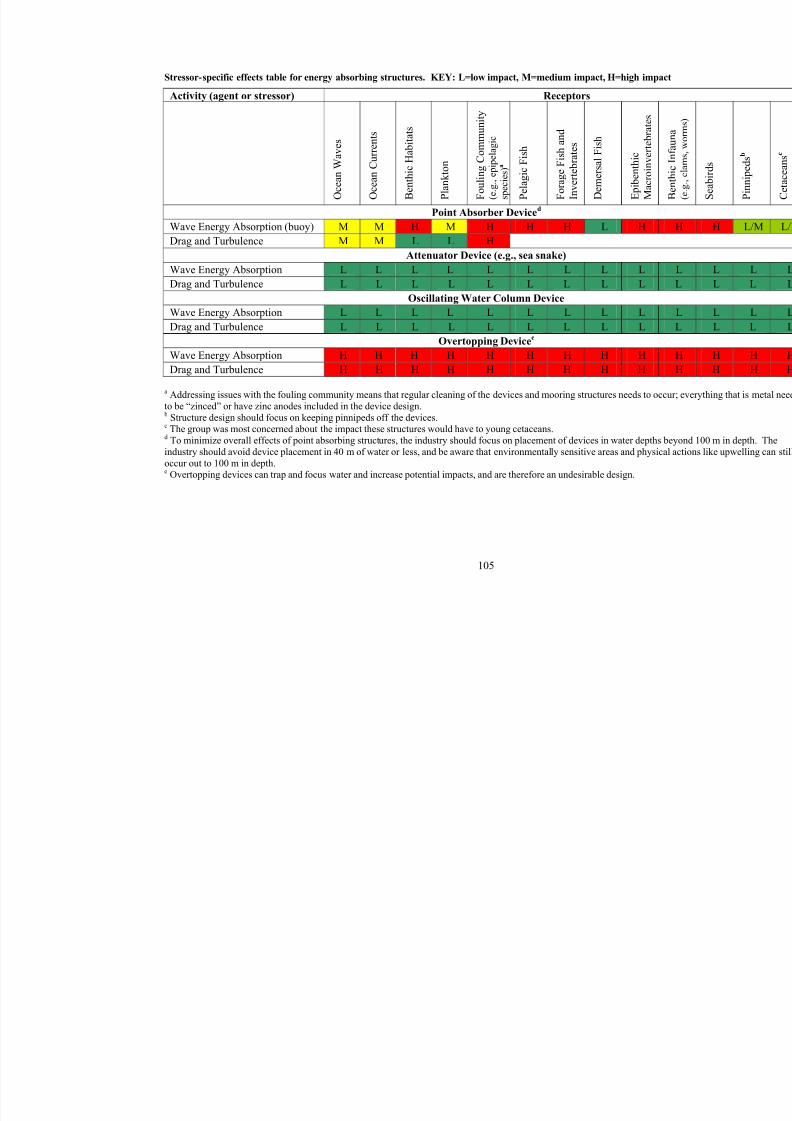
8/3/2019 Wave Energy NOAATM92
http://slidepdf.com/reader/full/wave-energy-noaatm92 117/186
105
Stressor-specific effects table for energy absorbing structures. KEY: L=low impact, M=medium impact, H=high impa
Activity (agent or stressor) Receptors
O c e a n W a v e s
O c e a n C u r r e n t s
B e n t h i c H a b i t a t s
P l a n k t o n
F o u l i n g C o m m u n i t y
( e . g . , e p i p e l a
g i c
s p e c i e s ) a
P e l a g i c F i s h
F o r a g e F i s h
a n d
I n v e r t e b r a t e
s
D e m e r s a l F i s h
E p i b e n t h i c
M a c r o i n v e r t e b r a t e s
Point Absorber Deviced
Wave Energy Absorption (buoy) M M H M H H H L H Drag and Turbulence M M L L H
Attenuator Device (e.g., sea snake)
Wave Energy Absorption L L L L L L L L L Drag and Turbulence L L L L L L L L L
Oscillating Water Column DeviceWave Energy Absorption L L L L L L L L L Drag and Turbulence L L L L L L L L L
Overtopping Devicee
Wave Energy Absorption H H H H H H H H H Drag and Turbulence H H H H H H H H H
a Addressing issues with the fouling community means that regular cleaning of the devices and mooring structures needs to octo be “zinced” or have zinc anodes included in the device design. b Structure design should focus on keeping pinnipeds off the devices.c The group was most concerned about the impact these structures would have to young cetaceans.d To minimize overall effects of point absorbing structures, the industry should focus on placement of devices in water depths
industry should avoid device placement in 40 m of water or less, and be aware that environmentally sensitive areas and physicoccur out to 100 m in depth.e Overtopping devices can trap and focus water and increase potential impacts, and are therefore an undesirable design.

8/3/2019 Wave Energy NOAATM92
http://slidepdf.com/reader/full/wave-energy-noaatm92 118/186
106
Stressor Breakout Group Report: Chemical Effects
Participants:
David Baldwin, NOAA-NMFS, NWFSC (Chair)Matt Cutlip, FERC
Debbie Duffield, PSUSusan Holmes, OSU (Rapporteur)Justin Klure, Oregon Wave Energy Trust (Facilitator)Bruce Menge, OSUGil Rilov, OSU
Key Findings
In assessing the impacts of chemicals, thegroup found it useful to distinguish theunintentional release from leaks or spills from
the expected release from antifouling paints or sacrificial anodes. Examples of the former would include the release of hydraulic fluid froma device, or fuel from a vessel due to a collision.This could be considered to have a low probability of occurrence, but to have a highimpact. Examples of the latter would includethe release of dissolved metals such as copper or zinc. This could be considered to be continuallyoccurring, but to perhaps have a lower impact.However, as mentioned elsewhere, themagnitude of these impacts is uncertain and
likely variable.Chemical effects are of low concern for
ocean waves and ocean currents, but of concernfor all biological receptors.
Top Ecological Issues
Extent of chemical exposure
Released chemicals are likely to spread over a large area and, in high concentrations or with prolonged exposure, affect entire communities
of organisms. For example, since dissolvedmetals do not degrade, they can be transportedsome distance by currents. Additionally, because they will persist in the environment,they can accumulate in tissue and be transferred between trophic levels (i.e., in the diet). Finally,if a device breaks free and washes ashore, the
location of any impacts of chemicals would shiftfrom offshore habitat to shoreline habitat.
Lethal and sublethal effects
Chemical effects do not have to be lethal for important biological responses to occur. Manychemicals, dissolved metals such as copper andzinc being good examples, are known to havesublethal effects on many aspects of a species’ biology such as sensory systems, growth, and behavior. These effects can occur at lower concentrations of exposure than those producingmortality. Reductions in the sensory function or growth of an individual can reduce thelikelihood of survival or reproduction.Behavioral responses to chemicals that aredetectable can include avoidance. By causinganimals to avoid the area of a device, chemicalscould alter migration routes used by residentspecies to travel to and from feeding areas or bytransient species to pass through the area. If these changes lead to increases in predation or decreases in feeding, they could also reduce thelikelihood of survival or reproduction for ananimal. The potential for chemicals to producesublethal effects such as these needs to beassessed.
Indirect effects
In addition to the direct effects of chemicalexposures on a species discussed above (whether lethal or sublethal), the potential indirect effectsof chemicals on a species should also beconsidered. For example, even if a species is notitself affected by a chemical, if a prey species isaffected, e.g., through mortality, the indirecteffect of the chemical on the predator species

8/3/2019 Wave Energy NOAATM92
http://slidepdf.com/reader/full/wave-energy-noaatm92 119/186
107
could be a reduction in growth due to areduction in available food.
Key Information Gaps
In order to assess the potential effects of
chemicals on receptor species it is necessary todefine the chemical exposure. This represents acritical information gap and requires answers toseveral questions:
1. What are the specific chemicalcompounds present in the devices thatmight be released to the environment?For example, while copper fromantifouling paint was discussed, it wasalso mentioned that epoxy-based paintswould likely be used instead. Similarly,
whether the devices would havesacrificial zinc anodes or not wasunclear.
2. For each of the chemicals, how much is being released into the environment?For example, for copper-basedantifouling paints, estimates should beavailable of the leaching rate of copper from the device based on the applicationof the paint. This would allow anestimate of the concentration of dissolved copper likely to be observed
in the water near the devices.
3. What is the fate of each chemical oncein the environment? For example,dissolved metals will not degrade andcould travel with prevailing currents or attach to particulate material and settleto the bottom with the potential of resuspension.
The better the definitions of the chemicalexposures, the better the impacts on receptor species can be addressed.
Feasibility and Effectiveness of Mitigation
The best form of mitigation would beavoiding the use of toxic chemicals in the first place. This would include the appropriatechoice of hydraulic fluids and antifouling paints.The use of epoxy-based antifouling paint would,for example, reduce concerns over the continual
leaching of dissolved copper into theenvironment. There was recognition by thegroup that mitigation efforts such as this willlikely have other consequences, such as morefrequent cleaning of devices, hence moreservicing trips, and a greater buildup of fouling
detritus below the devices. However, not usingtoxic compounds was considered a feasible andimportant mitigation strategy.
For chemical releases from spills or leaks,mitigation involves accident prevention andcleanup preparedness. Minimizing servicingtrips by vessels, for example, would reduce therisk of spills or collisions. Having the ability tocontain and clean spills always on standbywould mitigate the impacts should a spill occur.
Recommendations for Baseline andMonitoring Studies
Monitoring studies will be critical inassessing the impacts of chemicals. Suchstudies, however, need to be carefully designedand implemented. Several issues in the designof monitoring studies were identified:
• To help define the chemical exposures,samples of water, tissue, and sedimentneed to be analyzed for the specific
chemicals that may be released to theenvironment (e.g., zinc and copper).
• Monitoring for the effects of chemicalson organisms needs to include not justthe presence of mortality, but alsochanges in abundance and movement.Changes in movement may, however, bedue to behavioral responses to the physical structure of the devices as wellas any chemicals released. This is oneinstance where controlled studies may be useful, in this case perhaps
monitoring the same structure but withand without antifouling paint. Numerous other controlled studies mayalso be warranted.
• Multiple locations and times should bemonitored, since the chemical exposuresand effects are likely to be variable. For example, identifying how far and in

8/3/2019 Wave Energy NOAATM92
http://slidepdf.com/reader/full/wave-energy-noaatm92 120/186
108
which direction a specific chemical willmove requires sampling multiplelocations in and around the area of adevice. Similarly, even reference or control sites may vary in time dependingon what is being monitored (e.g., species
abundance). Ideally baseline monitoringshould occur before the installation of adevice, for comparison with monitoringat the same location after installation.Other locations to be used as referencesites need to be chosen carefully tomatch as many of the important featuresof the device location as possible.
• Finally, any monitoring study needs toconsider that while the impact of asingle device may be subtle and hard to
detect, the cumulative impact of dozensto hundreds of devices may beappreciable. The effects of chemicalexposure are likely to increase withincreased numbers of devices.Monitoring studies involving only a fewdevices need to be able to detectexposures and effects that are as smallas possible.

8/3/2019 Wave Energy NOAATM92
http://slidepdf.com/reader/full/wave-energy-noaatm92 121/186
109
Stressor-specific effects table for chemical effects. KEY: L=low impact, M=medium impact, H=high impact, ?=some u
estimate.
Activity (agent or stressor) Receptors
O c e a n W a v e s
O c e a n C u r r e n t s
B e n t h i c H a b i t a t s
P l a n k t o n
F o u l i n g C o m m u n i t y
P e l a g i c F i s h
F o r a g e F i s h a n d
I n v e r t e b r a t e s
D e m e r s a l F i s h
E p i b e n t h i c
M a c r o i n v e r t e b r
a t e s
Organicsa
Hydraulic Fluids L L L/M L? M? H? H M L/M
Spills (Fuel, Oil) L L L/M L? M? H? H M L/M
Metalsb
Sacrificial Anodes (Zn++
) L L M M? M? H? H? M? M? Toxicsb
Tributyltin (Sn+++) L L M M? M?/Hc H? H? M? M?
Antifouling Coatings (Cu++) L L M M? M?/Hc H? H? M? M?
a Mitigation for organics is to prevent spills, reduce likelihood, and prepare for cleanup. b Mitigation for metals and toxics is to not use or minimize use of chemicals.c Impact high on buoy community, but not on community in general.

8/3/2019 Wave Energy NOAATM92
http://slidepdf.com/reader/full/wave-energy-noaatm92 122/186
110
Stressor Breakout Group Report: Hard Structures and Lighting
Participants:
Robin Brown, ODFWRay Buckley, WDFW
Ann Bull, MMSJan Hodder, OIMBRoy Lowe, USFWSJohn Meyer, OSU (Facilitator)Fred Piltz, MMS (Chair)Erin Richmond, OSU (Rapporteur)Rob Suryan, OSU
Key Findings
High interactions between receptors and
hard structures and lighting associated withwave energy facilities were those interactionsthat the group concluded had a higher probability of occurrence and/or potentiallysignificant impacts: These included thefollowing:
• Exposed surfaces provide perches for seabirds or haul-outs for pinnipeds.
• Lighting on surface structures mayattract seabirds. Birds could be injuredafter flying into small structures on the
exposed parts of wave energy devices;these include radio telemetry towers andlines, and meteorological instruments.
• Hard structures may act as FishAttraction Devices (FADs); this may be both a positive and negative interaction.
• Mooring lines from the wave energystructures to anchors on the sea bottommay entangle algal drift mats andfishing gear (causing ghost fishing).Anchor lines, depending upon their size
and distribution, may be a hazard tocetaceans.
• Mooring lines and anchors may bringchanges to the benthic habitat andassociated benthic communitiessurrounding wave energy devices.Fouling communities naturally developon any hard structure in the ocean.
Changes will occur because of thenatural sloughing-off of these foulingcommunities or because of their removal
during periodic maintenance cleaning of the wave energy device.
Top Ecological Issues
Dislodged structures
Top ecological issues included the potentialecological impacts that would occur if and whena large wave energy device broke loose of itsmoorings during a severe Pacific storm event.Such an event could create ecological effects
from bottom scouring as a large device movedalong the bottom and similar physical damage toshoreline habitats such as rocky intertidal areas.Should a large array of wave energy devices break free, blockage of estuarine habitats mightoccur for some time until the devices could beremoved.
Litter fall from fouling communities
Changes in the benthic habitat will occur due to the litter fall from marine fouling
communities that will form on the wave energydevices, mooring lines, and anchors.Discussions focused on wave energy facilities insoft-bottom or unconsolidated sedimentenvironments, but we did not conclude that theecological changes caused by the litter fall onsuch benthic habitats would be either good or bad. They would, however, present significantchanges in the benthic communities from those

8/3/2019 Wave Energy NOAATM92
http://slidepdf.com/reader/full/wave-energy-noaatm92 123/186
111
characteristic of soft sediments to communitiesassociated with coarser sediments or cobble-typeenvironments.
Seabird encounters
There is a potential for negative effects onseabirds and seabird populations fromencounters with the exposed wave energydevices. Of most concern is that lighting thatmay be required on the wave energy devicescould attract birds that may collide with the hardsurfaces that are above the water. These includeradio antennae, small-diameter wires, or smallmeteorological instruments that might be part of the device.
Legal protection issues
A significant issue was raised that isecologically-based but more significantly relatedto federal legal protection for marine mammalsand seabirds. The Marine Mammal ProtectionAct, Endangered Species Act, Migratory BirdTreaty Act, and Essential Fish Habitat laws willgreatly influence the development of waveenergy facilities on the Oregon coast. Further analysis should indicate whether interactions of animals protected by these laws cross thresholdsthat require mitigation, selective placement, or other limits or special conditions for the waveenergy device or facility.
Scientific Uncertainty and Agreement
There was good general agreement amongthe participants in this breakout group as to thesignificant findings and key ecological issuesdescribed above. Additionally, there was goodagreement as to the scientific bases for our conclusions related to benthic effects and theinteraction between hard structures and fish.The conclusions with regard to potential
significant effects on the benthic communitiesand habitats were based upon similar effectsdemonstrated under offshore oil and gas platforms in southern California and describedin the literature. The scientific bases for concerns related to the interactions between hardstructures, mooring lines, anchors, and themarine mammal and seabird fauna were not
fully explored in the breakout group. Much of the uncertainty associated with these animalsand wave energy devices and facilities is better defined in the reports from the breakout sessionsconcerning marine mammals and seabirds.
It should be noted that participants in this breakout group identified the uncertainty of theeventual extent of wave energy development off the Oregon coast as a major unknown that willlimit more exact analysis of potentialenvironmental impacts. This was coupled tosome extent with uncertainty about the type or types of wave energy devices that might actually be deployed offshore Oregon. The devicesdescribed to participants in the plenary sessionsdiffer widely and therefore significantly in the potential for ecological effects, and in some
cases differ in the types of ecological effects thatthey might create. The uncertainty about theextent of wave energy development and theactual devices to be used in commercially scaledenergy projects will remain as a source of uncertainty in environmental analysis for sometime.
Key Information Gaps
• Coastal habitat mapping (at a minimum)needs to be done early in site selection
to understand the area being consideredfor wave energy development. Suchmaps, when ground truthed viaRemotely Operated Vehicle (ROV)observations to characterize the benthichabitat, can be used to determine areasthat need to be avoided. A coastwidemap and analysis is needed.
• Sampling in the proposed wave energy project area and in a buffer zone aroundit should begin as soon as possible toestablish a preinstallation and therefore
preimpact baseline against which tomeasure any changes. The samplingmay need to be expanded, and scaled upas wave energy facilities grow in size.The data collected will form the basis of a long-term data set.

8/3/2019 Wave Energy NOAATM92
http://slidepdf.com/reader/full/wave-energy-noaatm92 124/186
112
• Existing data need to be synthesized toidentify areas of greatest potential biological effects (“hotspots”).
• The rate of change in bottomcharacteristics that affect benthic
communities needs to be understood.• The first wave energy project needs to
be tied to a long-term study to helpshape future projects; state and federalgovernments need to fund this effort if they are genuinely interested.
Feasibility and Effectiveness of Mitigation
• Mitigation for surface structure impactscould include lowering structures into
the water as much as possible, reducing bird interactions by lowering antennaeand other projections, and making steephaul-out structures to minimize pinnipedhaul-out opportunities.
• Entanglement of fishing gear and ghostfishing could be a major problem;monitoring of entanglement and regular cleanup should be required.
• Mooring and cable lines need to be largeand tight; tag lines should be minimized.
• Service and maintenance should belimited as much as possible to thedaytime because of lighting issues for
birds. This depends on the extent of lighting for maintenance boats atnight—one boat might not create a big problem, but many boats could.
Recommendations for Baseline and
Monitoring Studies
As discussed above, the first wave energy project needs to be tied to a long-term study tohelp shape future projects. Ecosystemmonitoring should start with the ReedsportProject.

8/3/2019 Wave Energy NOAATM92
http://slidepdf.com/reader/full/wave-energy-noaatm92 125/186
113
Stressor-specific effects table for new hard structures and lighting. KEY: L=low impact, M=medium impact, H=high
Activity (agent or stressor) Receptors
O c e a n W a v e
s
O c e a n C u r r e n t s
B e n t h i c H a b i t a t s
P l a n k t o n
F o u l i n g C o m
m u n i t y
P e l a g i c F i s h
F o r a g e F i s h a n d
I n v e r t e b r a t e s
D e m e r s a l F i s h
E p i b e n t h i c
M
i
t
b
t
Exposed Surface (Landing or Haul-out) L L L L L L L L L
Hard Surface Area (i.e., Cross-section) L L H L H H H L L
Mooring Lines L L H L H H L L L
Anchors L L H L H L H H H
Lighting L L L L L L L L L

8/3/2019 Wave Energy NOAATM92
http://slidepdf.com/reader/full/wave-energy-noaatm92 126/186
114
Stressor Breakout Group Report: Acoustics
Participants:
John Ferguson, NOAA-NMFS, NWFSCDavid Fox, ODFW
Bruce Mate, OSUDavid Mellinger, OSUBrycen Swart, OSU (Rapporteur)Bob Thresher, National Wind Technology Center Cathy Tortorici, NOAA-NMFS (Chair and Facilitator)Waldo Wakefield, NOAA-NMFS, NWFSC
Key Findings
• The level of noise that will be generated by wave energy structures off the
Oregon coast is unknown, but may havea significant impact on the behavior andfeeding ecology of both resident andmigratory cetaceans and fish.
• It is possible to measure or model themagnitude, frequencies, and duration of noises generated by wave energystructures. Field observations or laboratory studies should be conducted,and both these physical changes and anyeffects they have on the coastalenvironment, such as effects on fish and
marine mammals, should be measured.Quantifying impacts to resident andmigratory organisms would aid in theidentification of possible mitigationstrategies.
• Wave energy facilities (buoy arrays)could create a sound barrier that certaincetaceans and fish species may avoid.
Top Ecological Issues
Our discussion was based on wave energyfacilities being located 2.5 to 3 miles (4 to 4.8km) off the Oregon coast. That may not always be the case. As the industry evolves, theserecommendations must be revisited toaccommodate new siting conditions.
Noise generation
Noise associated with wave energy facilitydevelopment can be generated from a variety of
different sources, both natural andanthropogenic. All these sources of noise needto be considered when generating conclusionsabout the environmental impact of noise fromthe development of wave energy buoy arrays:
• Wind (background sound as well asnoise associated with a buoy).
• Waves (background sound as well asnoise associated with a buoy).
• Rain (background sound as well as noiseassociated with a buoy).
• Internal waves (under the water).
• Internal machinery of buoys.
• Waves slapping on buoys.
• Transmission cables, substations, and power convertors used to connectindividual buoy cables back to shore.
• Synchronous movement of arraycomponents—depending on how buoysand mooring cables are arranged and the
direction and spacing of swell, the partsof the array could move synchronously,creating a much louder noise than if theywere moving separately from oneanother.
• Installation and maintenance equipmentused to construct and service the buoyarray. This includes the vessels needed

8/3/2019 Wave Energy NOAATM92
http://slidepdf.com/reader/full/wave-energy-noaatm92 127/186
115
to install, service, monitor, and respondto emergencies at the wave energyfacility.
• Strum and other flow noise of mooringcables (varying with thickness, number,
tension, and orientation).• Breaking of cables during storm events.
• Organisms (e.g., snapping shrimp) thatcould be attracted to the wave energyfacility.
General effects
Noise generated from wave energy buoys islikely to be low frequency. That being the case,one would expect animals with sensitivity to low
frequencies, such as baleen whales and fish, to be most affected. The more variable thegenerated noise is, the more likely it is to affectmarine mammals such as cetaceans. Effects onanimals probably would be mostly behavioralrather than physical, but that determinationneeds to be confirmed during actual testing of noise being produced by a buoy or array of buoys.
Depending on the sound emitted from a buoy array, the noise could warn cetaceans
and/or fish to stay away from the array or conversely, attract them to the site. Either situation would have an impact. Avoidance behavior associated with a noise could alter acetacean’s migration route. Fish and marinemammals may assume that a wave energy buoyarray could be a rock or shore because it createsan acoustic barrier to be avoided. This couldresult in pushing them or “choking” themtogether into a smaller migration corridor thatcould then reduce their ability to forage andmake them more vulnerable to predators like
killer whales (Orcinus orca). Constructionnoises like pile driving, vessel traffic fromroutine maintenance of the arrays, or repetitivenoises from old or malfunctioning machinerycould all cause an avoidance response incetaceans.
Noise could also be interpreted as a signalfor aggregation, which could also result in
whales and/or fish having additional exposure toincreased predation.
The group discussed key receptors (i.e.,cetaceans, pinnipeds, and fish) and how eachmarine mammal or fish species discussed might
respond to noise generated by wave energy buoys and the associated equipment in the waveenergy facility.
Gray whales
Gray whales ( Eschrichtius robustus)respond to anthropogenic sounds: 50% of observed whales were affected at a receivedlevel of 120 dB re 1 µPa continuous (Moore andClarke 2002). Since ambient noise in the oceanis roughly 90 dB re 1 µPa, depending on weather
and wave conditions, noise generated from awave energy facility could be masked by background noise. Anthropogenic noise canhave more impact when there is relatively littleambient noise (during calm weather conditions)than when there is a great deal of ambient noise(during rough weather conditions). In addition,these whales react more strongly to mobilesounds than static sounds. So if the noisegenerated by the wave energy facility is notmasked by background noises, whales couldveer away from it, especially when migrating,
resulting in them getting “choked” into anarrower migration route along the beach. For non-migrating whales, the noise disturbancemay be such that they will simply leave the areaand not come back. For both migrating and non-migrating whales, this behavioral avoidancereaction could result in their having less food, areduced feeding area, and increasedvulnerability to predation by killer whales.
Humpback whales
While humpback whales ( Megaptera
novaeangliae) periodically can be found close toshore, they transit primarily farther offshore thanthe current location of all of the proposed waveenergy facilities off the Oregon coast. They areseasonally resident, most likely for feeding, insome areas. These include Heceta Bank andsouth of Cape Blanco (Tynan et al. 2005), areasthat should be avoided for wave energy

8/3/2019 Wave Energy NOAATM92
http://slidepdf.com/reader/full/wave-energy-noaatm92 128/186
116
installations. Potential impacts to them fromnoise generation from wave energy facilitieswould be similar to that of gray whales, but atlower impact levels because they transit farther offshore. Impacts would also vary from year toyear as the humpback population size changes.
Killer whales
Killer whales are found off the Oregon coastall year long, with most being sighted in the latespring and early summer. It is possible that background noise could mask the noisegenerated from wave energy facilities for killer whales. It is likely that killer whales could beinitially startled by encountering an array, butwould soon desensitize to them and even beattracted to an array. Killer whales could react
to wave energy arrays in the same manner thatthey do to large ships when searching for prey.Killer whales will chase prey up against theship’s side and in effect “corner” it to catch it.Thus wave energy arrays could act similarly, asa bottleneck, forcing prey such as fish and other whales into a bottleneck or choke point, makingthem more vulnerable to predation.
Dolphins and porpoises
Dolphins and porpoises are less likely to beaffected by wave energy facilities than whales because they are more likely to swim around anywave energy buoys encountered. Dolphins and porpoises are also sensitive to high-frequencysound rather than the low-frequency sound thegroup assumed would come from wave energydevices. However, that assumption needs to beconfirmed during actual testing of noise produced by a buoy or array of buoys.
Sea lions and seals
While Steller sea lions ( Eumetopias jubatus)
are more sensitive to noise than California sealions ( Zalophus californianus ), pinnipeds ingeneral are not likely to be greatly affected bythe noise generated from wave energy facilities.They are most likely to avoid the facility, or bedesensitized to the noise and be attracted in if prey fish are also attracted to the area.
Fish
Virtually all fish have some form of auditorysensory mechanisms that allow them to sensetheir sound-filled, hydrodynamic environment.Fishes use their inner ear for sound detection
and balance, and their lateral line system tosense movement of water (Moyle and Cech2000). In addition to being able to detectsounds, many species of fish are known to besound-producing or soniferous. Recently, it has been estimated that over 800 species of fishfrom 109 families are soniferous; however,many more species are likely to have thiscapability (Rountree et al. 2006). Sound production as a form of communication isassociated with feeding, schooling, reproduction,etc. Salmon, sardines, herring, rockfish,
midshipman (Porichthys sp.), and a number of other groundfish species are all thought to be particularly noise-sensitive. For example,midshipman are more acoustically oriented thanother fish species and courting midshipmanmales hum to attract egg-laying females.Herring hearing may be sensitive enough todetect predator ultrasound in a manner that may parallel the evolution of a mechanism by mothsto detect their bat predators.
There are two potential effects on fish ear
and/or lateral line function from noise generated by wave energy structures: the immediate (and possibly temporary) effects on hearing or lateralline detection of hydrodynamic stimuli (Popper et al. 2003), and longer term effects that lead to permanent loss of sensory capabilities. Themost likely cause of temporary or permanentloss of sensitivity is alteration of the capabilitiesor health of the mechanosensory hair cells foundin the ear and lateral line. However, it is not yetclear whether damage to sensory hair cells infishes is permanent or temporary because in
fishes, unlike in humans, there is a constant proliferation of sensory hair cells for most of afish’s life. There is also some evidence of repair to these cells after damage (Lombarte et al.1993). The fundamental question becomes howlong the impairment lasts and whether it becomes permanent.

8/3/2019 Wave Energy NOAATM92
http://slidepdf.com/reader/full/wave-energy-noaatm92 129/186
117
Because fish are food sources for other fishand marine mammals, any effects wave energydevelopment might have on their abundance,feeding ecology, or behavior could result indisruption to the food chain for other fishspecies, including commercially important
species, and cetaceans. Species like crab, tuna,and sharks would be the least impacted fromnoises generated from wave energy facilities.
Scientific Uncertainty and Agreement
The level of uncertainty and scientificagreement concerning wave energy facility noiseimpacts on cetaceans, pinnipeds, and fishdepends on an analysis of the species that could be found near these arrays in relationship to thenoise generated (see Receptor-Specific Effects
table below).
Key Information Gaps
There is a substantial lack of informationconcerning the hearing sensitivity and capabilityof cetaceans, pinnipeds, and fish that couldencounter a wave energy buoy array. Thefollowing information gaps need to be filled as baseline information is developed prior to project construction:
•
What ambient sounds are being produced in the location of a potentialwave energy facility?
• What is the hearing sensitivity of cetaceans, pinnipeds, and fish (allspecies), and how do they respond tonoise of frequencies that could begenerated by a wave energy buoy or buoy array?
• What is generally known about theschooling behavior of fish in
relationship to pressure waves andacoustics?
While one buoy would provide an initialstart on monitoring sound, a small array of buoys (at least three) would be necessary togenerate data to assess effects statistically. It isalso important to model the sound field (outputfrom buoy and buoy array) and do so on a
seasonal basis to encompass the full array of noises that could be generated.
Feasibility and Effectiveness of Mitigation
A variety of potential mitigation measures
could reduce noise generation from wave energy buoy arrays:
• Varying the array design (buoy andmooring cable arrangements in thewater) could reduce the production of synchronous sound.
• Looser cables strum at lower levels thantighter cables and would not produce asmuch noise, but this must be balancedagainst the need to reduce the potentialfor cetacean entanglement.
• Thicker cables produce a lower frequency sound than thinner cables.Therefore, to reduce noise generation,limit the total number of cables to fewer,larger, vertical cables.
• Use antistrum (sheath/fairing) deviceson cables where possible.
• Companies developing wave energytechnology should include noisereduction of internal parts of their buoys
and underwater substations as a designcriterion.
• Sounds that sweep in frequency aremore likely to disturb marine mammalsthan constant-frequency sounds.Devices that emit a constant frequencyare preferred to ones that vary. Thesame is true, though perhaps to a lesser extent, for sounds that change inamplitude.
• Because cable fouling might change the
noise spectrum of cables, decisionsabout when and how often to cleancables should include noise as a factor indecision-making.
8/3/2019 Wave Energy NOAATM92
http://slidepdf.com/reader/full/wave-energy-noaatm92 130/186
118
Recommendations for Baseline and
Monitoring Studies
The group discussed a variety of potentialmonitoring actions necessary to understand theeffects of wave energy buoy arrays.
Monitoring of sound levels
It is critical to monitor the sound level of asingle wave energy buoy and multiple buoys inan array:
• To measure the acoustic signature for each device and group of devices, bothinside and outside of the array. This isespecially important to address thegeneration of synchronous or
asynchronous noise generated by anarray.
• To study noise under different oceanconditions to differentiate backgroundnoise from the buoy/array noise, and tounderstand how noise generationchanges under different environmentalconditions.
• To monitor buoy and mooring cablenoise over time, to see how it changes asthe devices age and mooring cables
become fouled.
Modeling
The noise generated by a buoy/array can andshould be modeled to predict noise generationfor differently sized and shaped arrays over avariety of environmental conditions. An arrayof four rows of three or four buoys each would be a starting point for such an experiment. Suchmodeling is possible since analogous modelsexist for wind power devices.
Studies of marine mammal and fish behavior
Surveys— Marine mammal and fish behavior around buoys and arrays should besurveyed to determine changes in behavior as aresult of noise.
Morphological studies —Somemorphological studies have shown loss of sensory hair cells for a few species followingexposure to intense sounds (Hastings et al. 1996;McCauley et al. 2003), but other studies havenot found an effect (Popper et al. 2005). The
problem with morphological studies is that theyonly show the most severe damage, and do notshow if there is transient damage to the sensorysystem.
Physiological methods —A better approachhas been to use some physiological method toassess hearing response immediately followingexposure to a signal. This approach hasdemonstrated temporary, and recoverable,hearing loss in response to exposure to puretones, seismic air-guns, boats, and sonar, and to
long-term exposure to lower intensity sounds.The method known as auditory brainstemresponse (ABR) measures evoked signals in the brain of fish to sounds of different levels. Thismethod is noninvasive, can be done immediatelyafter or even during exposure to sounds, and ishighly automated. ABR basically measures theresponse of the ear (and possibly first levels of the auditory portion of the brain) to soundstimuli, and measures of auditory sensitivity(thresholds) can be made. The same methodcould also be easily adapted to the lateral line.
However, ABR measures the response of the ear (and possibly brain) but does not indicate how afish would respond to the sound, and themeasure of sensitivity provided is not the bestsensitivity of the animal since the technique doesnot examine the processing that may occur in the brain which could improve sensitivity (e.g., byimproving the signal-to-noise ratio byaveraging). Thus, use of ABR requires theextensive use of controls that exposed animalsare compared to, and any changes in sensitivityare relative to these controls. Finally, the
acoustic setup for the tests must be verycarefully defined; animals that are pressuresensitive must be tested with a pressurestimulus, and animals sensitive to particlemotion (most fish) need to be tested with respectto that stimulus.
Tagging —Fish monitoring also could beaccomplished using sonic or passive integrated

8/3/2019 Wave Energy NOAATM92
http://slidepdf.com/reader/full/wave-energy-noaatm92 131/186
119
transponder tags. Marine mammal tagsincorporating acceleration sensors (e.g., Johnsonand Tyack 2003) can be used to observe fine-scale behavior and responses to noise. Fishfinders can be placed into the array to monitor movement. It is also critical to have a control
area with which to compare animal movementand behavior in the array area.
Wave energy research facility
The group agreed that since many of thequestions being asked about the generation of noise from a buoy/array are so basic in nature,they would be best addressed in a “wave energyresearch facility” before full-scale developmentof wave energy begins. The cost of developingthe wave energy research facility should be
funded in a cooperative fashion by private, state,and federal funds. A facility like this could alsoserve as a control area for comparison againstactual wave energy facilities.
Literature Cited
Hastings, M. C., A. N. Popper, J. J. Finneran, andP. J. Lanford. 1996. Effect of low frequencyunderwater sound on hair cells of the inner ear and lateral line of the teleost fish Astronotus
ocellatus. J. Acoust. Soc. Am. 99:1759–1766.
Johnson, M., and P. L. Tyack. 2003. A digitalacoustic recording tag for measuring theresponse of wild marine mammals to sound.IEEE J. Oceanic Engr. 28:3–12.
McCauley, R. D., J. Fewtrell, and A. N. Popper.2003. High intensity anthropogenic sounddamages fish ears. J. Acoust. Soc. Am.113:638–642.
Moyle, P. B. and J. J. Cech, Jr. 2000. Fishes: anintroduction to ichthyology. 4th edition, PrenticeHall.
Lombarte, A., H. Y. Yan, A. N. Popper, J. C. Chang,and C. Platt. 1993. Damage and regeneration of hair cell ciliary bundles in a fish ear following
treatment with gentamicin. Hear. Res. 66:166– 174.
Moore, S. E., and J. T. Clarke. 2002. Potentialimpact of offshore human activities on graywhales ( Eschrichtius robustus). J. Cetacean Res.Manage. 4:19–25.
Popper, A. N., R. R. Fay, C. Platt, and O. Sand.2003. Sound detection mechanisms andcapabilities of teleost fishes. In S. P. Collin and
N. J. Marshall (eds.), Sensory processing inaquatic environments, p.3–38. Springer-Verlag,
New York.Popper, A. N., M. E. Smith, P. A. Cott, B. W. Hanna,
A. O. MacGillivray, M. E. Austin, and D. A.Mann. 2005. Effects of exposure to seismicairgun use on hearing of three fish species. J.Acoust. Soc. Am. 117:3958–3971.
Rountree, R .A., R. G. Gilmore, C. A. Goudey, A. D.Hawkins, J. J. Luczkovich, and D. A. Mann.2006. Listening to fish: applications of passiveacoustics to fisheries science. Fisheries 31:433– 445.
Tynan, C. T., D. G. Ainley, J. A. Barth, T. J. Cowles,S. D. Pierce, and L. B. Spear. 2005. Cetaceandistributions relative to ocean processes in thenorthern California Current System. Deep SeaRes. Part II Top. Stud. Oceanogr. 52:145–167.

8/3/2019 Wave Energy NOAATM92
http://slidepdf.com/reader/full/wave-energy-noaatm92 132/186
120
Stressor-specific effects table for acoustics. KEY: L=low impact, M=medium impact, H=high impact, NA=not applica
associated with the estimate
Activity (agent or stressor) Receptors
O c e a n W a v e s a
n d
C u r r e n t s
B e n t h i c H a b i t a t s ,
P l a n k t o n ,
F o u l i n g
C o m m u n i t y
F i s h a
F o r a g e F i s h a n d
I n v e r t e b r a t e s
D e m e r s a l F i s h
E p i b e n t h i c
M a c r o i n v e r t e b r a t e s
B e n t h i c I n f a u n a
S e a b i r d s
P i n n i p e d s
Acoustic Frequency Signatures NA NA H? H? H? L L L? L
Point Absorber NA NA H? H? H? L L L? L
Attenuator NA NA H? H? H? L L L? L
Oscillating Water Column NA NA H? H? H? L L L? L
Overtopping NA NA H? H? H? L L L? L
Mild Weather Acoustics (Quiet Days)d NA NA H? H? H? L L L? LHeavy Weather Acoustics (Loud Days)d NA NA H? H? H? L L L? L
Important Frequencies for Key Biota NA NA H? H? H? L L L? L
Amplitude Effects (Overpressure) NA NA NA NA NA L L L? L
Service Boats and Equipment NA NA M? M? M? L L L? L
Calm Weather Daye NA NA H? H? H? L L L? L
a Most concern is for acoustically sensitive fish like herring and midshipman. b Harbor porpoises (Phocoena phocoena) are very affected by acoustic pingers and the use of pingers at wave energy facilitiec The effect of a lack of acoustic signature of the wave energy facility is of special concern for gray whales.d Based on Bruce Mate’s statement that about 90% of ocean sound on a stormy day is nonanthropogenic (natural), whereas a
anthropogenic; ergo, a possible rationale for considering differential effects.e Calm is different from mild weather, as the threat in calm weather is the complete lack of sound and consequent risk of the aor cables and blundering into them.

8/3/2019 Wave Energy NOAATM92
http://slidepdf.com/reader/full/wave-energy-noaatm92 133/186
121
Stressor Breakout Group Report: Electromagnetic Effects
Participants:
George Boehlert, OSU (Facilitator)Ric Brodeur, NOAA-NMFS, NWFSC
Bob Emmett, NOAA-NMFS, NWFSCMike Fitzpatrick, Fishermen Interested in Natural EnergyStephen Kajiura, Florida Atlantic Univ.Laurel Kellner, OSU (Rapporteur)Greg McMurray, Oregon DLCD (Chair)
Key Findings
The electromagnetic field (EMF) iscomprised of an electric field (E field) and amagnetic field (B field). The E field is
contained by the insulation within the generationdevices, subsea pods, and cables. The B field isgenerally detectable outside of this componentryand can induce a second electric field (the iEfield) which is produced when conductiveanimals move through it. Galvanic fields arecaused by electrochemical interactions of metalsin contact with seawater (an electrolyte).
Following are our key findings on potentialelectromagnetic effects of wave energyfacilities:
• EMF is most likely to affect animals thatuse magnetic fields for orientation or electrical fields for feeding.
• The key receptors for EMF are salmon,crab, sturgeon, sharks and rays, andalbacore tuna (Thunnus alalunga, for offshore waters).
• Both induced and galvanic electricalfields are of concern and may haveimpacts.
• There are major areas of uncertainty onreceptors for both electrical (E) andmagnetic (B) fields.
• Baseline measurements before and after development are needed to establishextent and magnitude of local magneticfields.
• Armoring and trenching are likelyeffective mitigation for cabling, but weneed demonstration of Faraday cageeffectiveness in the field for allgeneration devices and also for the
subsea (rectifying) pods, when and if used.
• The participants recommended that the2007 COWRIE mesocosm experiments be used as a guide to the value of stressor-response experiments prior totrying to test local species.
Top Ecological Issues
• Galvanic or induced electrical fields
may modify behavior of animals thatuse electrical fields for feeding. Speciesaffected probably include sharks andrays (elasmobranchs), crab, sturgeon,albacore tuna (if present), and possiblymarine birds.
• Attraction or repulsion of prey species by EMF may affect foraging ability of other prey species, such as seabirds.
• Magnetic fields may affect movementand behavior patterns of animals that
use magnetic fields for orientation.Affected animals include salmon,elasmobranchs, sturgeon, albacore tuna(if present), and likely some cetaceans.
• System breakages resulting in groundfaults (i.e., short circuits to the ocean)would likely have lethal but very localeffects.

8/3/2019 Wave Energy NOAATM92
http://slidepdf.com/reader/full/wave-energy-noaatm92 134/186
122
• Both galvanic electrical fields andinduced electrical fields may haveecological effects.
• Due to physical proximity, EMF fromgeneration devices would likely affect
only the pelagic biota, whereas EMFfrom subsea pods would likely affectonly the demersal biota. However,some species utilize the entire water column over a diurnal cycle (for example, Chinook salmon[Oncorhynchus tshawytscha]).
Scientific Uncertainty and Agreement
• There was a high level of uncertaintyabout the response of pinnipeds,cetaceans, plankton, turtles, squid and baitfish, and benthic infauna to EMF asexpressed by magnetic and inducedelectrical fields.
• There was a significant level of uncertainty about the response of salmon to electrical fields. These fieldscan affect catch rates for salmon trollers.
• There was a high level of scientificagreement among the participants in the breakout group about the major ecological issues, levels of uncertainty,key information gaps, and likelyfeasibility of mitigation.
Key Information Gaps
There is a general lack of information aboutthe sensitivity of many animal groups to EMF,including that for pinnipeds and cetaceans,seabirds, sturgeon, squid and baitfish, flatfish,rockfish and lingcod (Ophiodon elongatus), and
plankton.
Feasibility and Effectiveness of Mitigation
• Conversion of electricity to 60 Hertzsynchronous AC and armoring andtrenching of the cabling from therectifying pods to the shore are very
likely effective mitigation measures for the undersea cables.
• Ground-fault interruption (similar tohome GFI circuits) is likely effectivemitigation for short circuiting of all
components of the system, but should be backed up with real-time datatelemetered to a control station.
• Mitigation for magnetic fields (andtherefore, induced electrical fields) isdependent on both the effectiveness of the application of Faraday caging in thegeneration devices and subsea pods, andthe conversion of asynchronous AC atless than 1 Hertz to 60 Hertz AC.
• Adequate armoring should protect
vertical transmission cables fromgenerating devices to subsea pods from biting by sharks and rays, as hasoccurred with communication cables.
• Areas of outcrop (i.e., reefs) along the paths of transmission cables should beavoided, as they will make burialunfeasible.
Recommendations for Baseline and
Monitoring Studies
• Baseline studies should includemagnetic surveys of sites before andafter deployment of energy-generatingand transmission equipment in order toestablish local magnetic background and possible relevance of superimposedmagnetic fields from the electricalcurrents produced and transmitted.
• Monitoring for wave energy generatedelectric and magnetic fields shouldaccompany facility buildouts.
• Studies of animal responses to EMFconducted in situ will be difficult andlikely expensive. Dedicated controlareas may not be very helpful inassessing EMF effects. The possibilityof studying the equipment with andwithout electrical current productionwould likely be a better approach, and

8/3/2019 Wave Energy NOAATM92
http://slidepdf.com/reader/full/wave-energy-noaatm92 135/186
123
would help address the difficulty of separating the effects of multiplestressors. This approach would probably require the ability to switchfrom transmission to dummy loads.
Other Information
At the time of this writing, COWRIEmesocosm studies are intended to be conductedin the British Isles during the 2007 field seasonand should be completed by February 2008 andreported on by June 2008. The results of thesestudies, when published, should be valuable inscoping studies of the response of local speciesto EMF. Further information is available at twoweb sites:
COWRIE (Collaborative Offshore Wind ResearchInto the Environment). No date. Offshorewindfarms: putting energy into the UK. Onlineat http://www.offshorewindfarms.co.uk/Research/ResearchAreas/ElectromagneticFields/EMFPhase1.aspx [accessed 8 February 2008].
Gill, A.B., I. Gloyne-Phillips, K.J. Neal, and J.A.Kimber. 2005. Cowrie 1.5 Electromagneticfields review. The potential effects of electromagnetic fields generated by sub-sea
power cables associated with offshore wind farmdevelopments on electrically and magneticallysensitive marine organisms—a review. Online athttp://www.offshorewindfarms.co.uk/Downloads/1351_emf_phase_one_half_report.pdf [accessed 8 February 2008].

8/3/2019 Wave Energy NOAATM92
http://slidepdf.com/reader/full/wave-energy-noaatm92 136/186
124
Stressor-specific effects table for electromagnetic effects. KEY: L=low impact, M=medium impact, H=high impact, U
associated with the estimate
Activity (agent or stressor) Receptors
S a l m o n
D u n g e n e s s c r a b
S t u r g e o n
P i n n i p e d s
S h a r k s ( p e l a g i c
)
S h a r k s & s k a t e s
( d e m e r s a l )
R o c k f i s h & l i n g c o d
F l a t f i s h
P l a n k t o n – m y s
i d s
a n d c u m a c e a n s
C e t a c e a n s
Generating Devices
Galvanic E field U L L U H L L L U U
Induced E field U L L U H L L L U U
Magnetic field H L L U H L L L U U
Collecting/Rectifying DevicesGalvanic E field U H H U L H U U U U
Induced E field U H H U L H U U U U
Magnetic field H U H U L H U U U U
Transmission System
Galvanic E field U H H U L H U U U U
Induced E field U H H U L H U U U U
Magnetic field H U H U L H U U U U
Catastrophic Ground Fault H H H H H H H H H H

8/3/2019 Wave Energy NOAATM92
http://slidepdf.com/reader/full/wave-energy-noaatm92 137/186
125
Breakout Group Report: System View and Cumulative Effects
Participants:
S.M. Bartell, E2 Consulting Engineers, Inc. (Chair)Holly Campbell, OSU (Rapporteur)
John Chapman, HMSCJack Engle, UCSBRobin Hartmann, Oregon Shores Conservation Coalition (Facilitator)Selina Heppell, OSUKaety Hildenbrand, OSUCurt Peterson, PSUAlan Shanks, OIMBKate Wing, NRDC
Introduction
The breakout session participants werechallenged to address the cumulativeenvironmental effects of wave energytechnologies within the coastal ecosystem. The purpose was not to perform the actualassessment, but to discuss importantenvironmental aspects and issues of such acomprehensive analysis. The socioeconomicand policy considerations attendant tocumulative effects assessment were recognizedas important. However, the participants agreedto focus on the environmental effects—
consistent with the overall technical theme of theworkshop.
There was no substantive discussion of therequirements of a cumulative effects assessment(e.g., under the National Environmental PolicyAct [NEPA] and the Council on EnvironmentalQuality [CEQ]) and it was not clear that aframework for assessing cumulative effects of wave energy technologies produced by thesessions need conform to such requirements. Nevertheless, brief attention to these programmatic approaches helped to organize theresults of the session discussion and mightsuggest a useful path forward towards acumulative assessment of the environmentaleffects of wave energy technologies.
Cumulative impact is defined under NEPAas follows:
“Cumulative impact” is the impact on theenvironment which results from theincremental impact of the action when addedto other past, present, and reasonablyforeseeable future actions regardless of whatagency (Federal or non-Federal) or personundertakes such other actions. Cumulativeimpacts can result from individually minor
but collectively significant actions taking place over a period of time. [40 CFR 1508.7, CEQ 1987]
The CEQ (1997) recommends 11 steps for assessing cumulative effects. These steps can beconveniently categorized as scoping, organizing,screening, evaluating, and mitigating (includingmonitoring and adaptive management). Senner et al. (2002) attempt to simplify the process, yet provide a systematic and consistent framework for assessment. Halpern et al. (2008) developeda qualitative, subjective framework for assessingthe cumulative effects of various environmentalstressors on marine ecosystems, includingcoastal systems.
Characterizing the incremental effects inrelation to past and current actions underscoresthe technical and analytical perspectives inassessing cumulative effects (e.g., Bedford andPreston 1988). Characterizing impacts inrelation to the reasonably foreseeable futuresuggests an intractable assessment from ananalytical perspective. However, an emphasis

8/3/2019 Wave Energy NOAATM92
http://slidepdf.com/reader/full/wave-energy-noaatm92 138/186
126
on future actions emphasizes cumulative effectsassessment as an exercise in environmental planning (e.g., Stakhiv 1988). In practice, bothanalysis and planning contribute valuably to acumulative assessment (Smit and Spaling 1995).Although the implications of future actions
garnered less attention, both perspectives wereevident in the breakout session discussions.
Key Findings
The session participants identified thefollowing as key aspects in assessing thecumulative environmental effects of waveenergy technologies:
1. The cumulative effects of wave energytechnologies will depend importantly on
the number, size, location, andconfiguration of wave energy projectsthat become operational within thenearshore coastal environment.Assessment of cumulative impacts willrequire periodic, systematic, multistepevaluations as the energy facilitiesincrease in scale and extent.
2. As the number and extent of waveenergy facilities increase, new effects or risk assessment endpoints might emergethat were not evident at smaller scales.
As the wave energy landscape increasesthroughout the coastal zone, thresholdsmight be surpassed whereby wholesalemodifications of the physical circulationand sediment dynamics of the nearshoreenvironment become evident.
3. Adaptive management, long-termmonitoring, and public involvement arenecessary components of a cumulativeassessment that continues as the waveenergy industry increases in its scale of
deployment.4. A significant deployment of wave
energy technologies might redirect and potentially focus other ongoing coastalzone activities (e.g., shipping,commercial fishing, whale migration),with associated environmental impactsthat should be included in thecumulative assessment.
High Uncertainty: Incomplete
Understanding and Sparse Data
Session participants repeated concerns thatthe lack of information and data describing thenature of the wave energy technologies, and the
incomplete understanding of marine resourcesand coastal zone dynamics, introduce substantialuncertainty into the assessment of cumulativeeffects. The nature of the technologies actuallyimplemented will influence the number andspacing of cables used to anchor these devices.Injury and death due to entanglement or collision were considered the major impacts onmarine mammals resulting from thesetechnologies. Spatial-temporal distributions and population sizes of potentially impacted marineorganisms are poorly quantified. The coastal
zone physical environment, including waveenergies, patterns of circulation, sedimenttransport, and deposition remain incompletelydescribed for the areas potentially occupied bywave energy complexes. Such basic informationis needed to undertake a meaningful cumulativeeffects assessment. The participants questionedif other states or countries might provideexamples of effective programs for assessingcumulative effects.
One interesting and important unknown is
whether the physical conditions favorable for selecting locations for wave energy projects arealso favorable conditions for attracting marineresources or increasing biological productivity.If so, the potential for continuing and cumulativeenvironmental impacts will be increased. If not,the impacts of wave energy technologies might be substantially reduced.
Site-selection and location could be used inmitigating effects. For example, avoidingknown areas of whale migration in locating
wave energy devices could reduce the likelihoodof entanglement or collision.
Spatial and Temporal Scale
Session participants considered theimportance of spatial and temporal scalesimplied by a cumulative effects assessment of wave energy technologies. As indicated, a small

8/3/2019 Wave Energy NOAATM92
http://slidepdf.com/reader/full/wave-energy-noaatm92 139/186
127
number of widely spaced facilities might proveto be of minimal risk to marine resources or thelocal coastal physical environment. However, asthe number, size, and proximity of wave energyfacilities increase, thresholds might be exceededwhere impacts become sudden and dramatic. A
small array of buoys might simply dampen waveenergy, while a large array could modifysand/sediment transport and deposition, with amajor cumulative impact in the nearshoreenvironment. Similarly, smaller arrays mightresult in minor rates of associated injury or mortality to marine mammals. However,compounding of these mortalities by multipleand larger arrays could produce significant population-level impacts, especially for populations characterized by low numbers andlow rates of reproduction. One animal killed
might be one too many.
Concerns were also expressed thatdeleterious effects might require considerabletime to manifest. For example, significantlonger term consequences of an accumulation of minor short-term impacts could require years of monitoring before the significance was realized.Therefore, it appears imperative to implementsome level of assessment from the very beginning of technology deployment.
Wave Energy Technologies
The session participants recognized that thedifferent technologies for capturing wave energymight pose different risks to the coastalenvironment and associated biota. Given thedifferent performance characteristics of thesetechnologies and attendant risk, a risk:benefitanalysis might contribute meaningfully to anassessment of cumulative effects. Technologiesthat were efficient transformers of wave energyinto electricity and posed minimal
environmental risks would logically be favored.Clearly, the cost of the technologies wouldfactor into such an assessment.
Regardless of the specific technology, cableswould be necessary to maintain the position of the device. The number, size, and geometry of the anchoring cables represent important aspectsof each technology in determining the likelihood
of collision or entanglement with marineorganisms, particularly marine mammals. Loosethin cables likely pose greater risks for entanglement than taut thick cables. However,taut thick cables might pose greater risks for collision and injury or death. The geometrical
complexity of the anchoring cables increases inimportance, perhaps nonlinearly, as the number of deployed devices increases.
Modeling and Monitoring
The group expressed considerable optimismthat the effects of wave energy technologies andwave facilities could be mathematicallymodeled. This was particularly emphasized for physical aspects of the coastal marineenvironment between the wave project and the
shore. Changes in wave energies, currentvelocities, and water depths might be modeledwith sufficient accuracy to inform thecumulative assessment process. The importanceof using models to characterize the dynamics of sand scour, transport, deposition, underwater dune formation, and dune migration was alsodiscussed. Simple models that estimate the probability of encounter with a cable might beconstructed from knowledge of the physicaldimensions of marine mammals, swimming behavior, and the geometry of the cable system
defined by a technology and the dimensions of the wave energy facility.
Given information on the physical attributesof the anchoring system, it might also prove possible to model the accumulation andassociated productivity of marine foulingcommunities that inhabit the cables. Thespatial-temporal accumulation of hard-bottomhabitat (e.g., mussel shell mounds) could also bemodeled. It is conceivable that the distributionand magnitude of this habitat type would
increase substantially during the operational lifecycle of the wave energy facilities. Anunderwater landscape dominated by physicallyconnected mussel mounds might interfere withthe cross-shelf movements or migrations of critically important benthic resources (e.g.,Dungeness crab [Cancer magister ]). At thesame time, soft-bottom habitat of value to other

8/3/2019 Wave Energy NOAATM92
http://slidepdf.com/reader/full/wave-energy-noaatm92 140/186
128
marine resources might correspondinglydecrease.
In addition to modeling, the groupunderscored the importance of using deployedwave energy facilities (or individual devices or
buoys) as opportunities for long-termmonitoring. The results of the monitoring could be used to evaluate model predictions. Thesedata could also directly inform an adaptivemanagement process for assessing andmitigating the cumulative effects of wave energytechnologies.
Decommissioning
Session participants recognized the potentialrisks posed by the removal of wave energy
technologies at the end of their usefulness.Particular attention was paid to the removal of the large concrete blocks used as anchors. If these structures demonstrate ecological value interms of their attached communities andassociated fisheries, political pressures might be brought to leave the structures in place.However, some states (e.g., Oregon) alreadyhave taken positions that these structures shall be removed regardless. If underwater demolition is required, additional risks must beincluded in the cumulative effects assessment.
Increases in navigation by vessels involved inthe decommissioning process might poseadditional risks to be considered.
Stressor-Response Functions, Risk, and
Effects Assessment
Cumulative effects can to some degree beassessed by simply adding up risks posed byeach stressor to each receptor. This requires thederivation of separate stressor-responsefunctions for the relevant combinations of
stressors and receptors. Initial functions might be more qualitative and subjective in form untilthe necessary data are developed. Where data permit, the functions can be quantitativelydescribed and used in a manner consistent with probabilistic risk estimation. Previousexperience suggests that the cumulativeassessment might well distill to a small number of key risks involving subsets of stressors and
receptors (e.g., cables and marine mammals).Session participants emphasized the need for detailed quantitative assessments of risks posedto Dungeness crabs and endangered salmonids.
A matrix wherein columns define the
stressors associated with wave energytechnologies (i.e., construction, operation andmaintenance, decommissioning) and rowsidentify the responses (i.e., effects) of interestshould be developed as a framework for assessing cumulative effects. Risks should beestimated for each (applicable) combination of stressor and response. Risks can be integratedover stressors (column “sums”) or effects (row“sums”) to characterize cumulative effects andoverall risk. Inspection of the matrix wouldquickly identify key stressors and effects.
Developing this matrix based on existinginformation and data might be fraught withuncertainty. Key combinations of stressors andresponses that appear significant, but uncertain,could be used to guide research and monitoringefforts. Subsequent revisions to the matrixcould be performed until the remaininguncertainties were acceptable and the resultssummarized in the matrix usefully informed anadaptive risk management and mitigation process.
The matrix can be expanded to includeadditional columns that identify other past andcontinuing human and natural stressors thatmight generate additional effects. These should be included in the cumulative effects assessment(CEQ 1997). For example, current recreationalor commercial fishing will be dislocated fromwave energy facilities and relocated in other areas. The net effect might be an increase infishing pressures in these areas outside of thewave energy facilities. Risks to the fishingindustry would be a component of the
cumulative effects assessment. The location of wave energy projects might alter the migrationhabits of whales and force them into deeper waters and shipping lanes, where opportunitiesfor collision might increase.
Finally, columns should be added thatspeculate concerning additional stressors(human or natural) that might be relevant for the

8/3/2019 Wave Energy NOAATM92
http://slidepdf.com/reader/full/wave-energy-noaatm92 141/186
129
reasonably foreseeable future (CEQ 1997).Continuing changes in climate and associatedupwelling characteristics of the coastal marineenvironment might exacerbate some risks posed by the operation of the wave energy facilities;alternatively, other risks might be reduced.
Clearly, speculation of future risk remainshighly uncertain.
The cumulative effects assessment wouldthen require integration across all the stressors(past, present, and future) that are associateddirectly with the wave energy technologies, aswell as other actions in the affected environmentthat could conceivably bear upon the responsesof concern.
Cumulative Effects Matrix
Much of the session discussion focused onindividual stressors and receptors. It wasinevitable that important issues raised duringday one of the workshop were revisited. Thediscussion of individual stressors and receptorshas been summarized in the cumulative effectsmatrix below. The matrix uses a ranking systemof low, medium and high, but within eachranking the magnitude and potential of theeffect, if any, would be a function of the scaleand extent of deployment. This matrix has been
expanded to include stressors and receptors notspecifically discussed during the cumulativeeffects session.
Related Issues
Related topics addressed during the sessionthat pertain to cumulative effects, but notspecifically identified in the cumulative effectsmatrix, included the following:
• Magnetic fields should be carefullyexamined because small changes mightresult in impacts to fish. Additionalconsideration of noise as a disturbanceis similarly suggested.
• Fishers know ways to reduce the seabird perching and nesting problem. Thesemethods are well understood and might be used to reduce potential problemsassociated with wave energy devices.
• Assessing cumulative effects mightrequire the consideration of anyincreased dredging in rivers and harborsnecessary to support the vessels thatservice the wave energy industry.Dredging has the potential to negatively
impact nursery areas and other criticalmarine habitats.
• “Bounding” the cumulative effectsassessment was further discussed. For example, if the deployment of waveenergy technologies permits reductionsof other energy technologies (e.g., damremovals), should the correspondingreductions in environmental effectsassociated with these other technologies be included in the cumulative
assessment of wave energytechnologies?
• One approach to mitigation of cumulative effects might be toconcentrate deployment of wave energycomplexes, rather than distribute themwidely throughout the coastal ocean.
• There needs to be some kind of anorganization responsible for monitoringand assessing the effects of wave energytechnologies coastwide.
Literature Cited
Bedford, B. L. and E. M. Preston. 1988. Developingthe scientific basis for assessing cumulativeeffects of wetland loss and degradation onlandscape functions: status, perspectives, and
prospects. Environ. Manage. 12:751–771.
Council on Environmental Quality (CEQ). 1997.Considering cumulative effects under the
National Environmental Policy Act. Prepared bythe CEQ, Executive Office of the President,
Washington, D.C.
Halpern, B., S. Walbridge, K. A. Selkoe, C. V.Kappel, F. Micheli, C. D’Agrosa, J. Bruno, K. S.Casey, C. Ebert, H. E. Fox, R. Fujita,D. Heinemann, H. S. Lenihan, E. M. P. Madden,M. Perry, E. R. Selig, M. Spalding, R. Stenek,and R. Watson. 2008. A global map of humanimpact on marine ecosystems. Science 319:948– 952.

8/3/2019 Wave Energy NOAATM92
http://slidepdf.com/reader/full/wave-energy-noaatm92 142/186
130
Senner, R. G. B., J. M. Colonell, J. D. Isaacs, S. K.Davis, S. M. Ban, J. P. Bowers, and D. E.Erikson. 2002. A systematic but not-too-complicated approach to cumulative effectsassessment. 22nd Annual Conference of theInternational Association for Impact Assessment,The Hague, June 15–21, 2002.
Smit, B., and H. Spaling. 1995. Methods for cumulative effects assessment. Environ. ImpactAssess. Rev. 15:81–106.
Stakhiv, E. Z. 1988. An evaluation paradigm for cumulative impact analysis. Environ. Manag.12:725–748.

8/3/2019 Wave Energy NOAATM92
http://slidepdf.com/reader/full/wave-energy-noaatm92 143/186
131
Stressor-receptor matrix for cumulative effects. KEY: L=low impact, M=medium impact, H=high impact.
Stressors Emplacement Operation Decommissioning O
Receptors/
responses
C o n s t r u c t i o n
n a v i g a t i o n
M o o r i n g s y s t e m
T r a n s m i s s i o n
i n f r a s t r u c t u r e
M o o r i n g s y s t e m
G e n e r a t i o n
d e v i c e
T r a n s m i s s i o n
i n f r a s t r u c t u r e
C h e m i c a l
c o a t i n g s
D e c o m m i s s i o n
n a v i g a t i o n
D e v i c e r e m o v a l
M o o r i n g c a b l e
r e m o v a l
A n c h o r r e m o v
a l
F i s h i n g p r e s s u
r e
Ocean waves M L Ocean currents L M L L L Sediments L L L M L L L Plankton L L Fouling community H H H L H H H
Migratory fish L L L M L L L L L M Forage fish L L L M L L L L L M Demersal fish L L M M L L L L M Invertebrates L L L M L L L L L L Epibenthicmacroinvertebrates
L L M M L L L L L
Benthic infauna L L M M L L L L Seabirds M L M L M Pinnipeds L L L L L L L M Cetaceans L L L H M M L L L L H

8/3/2019 Wave Energy NOAATM92
http://slidepdf.com/reader/full/wave-energy-noaatm92 144/186

8/3/2019 Wave Energy NOAATM92
http://slidepdf.com/reader/full/wave-energy-noaatm92 145/186
133
Workshop Integration and Synthesis
Cathy Tortorici, NOAA-NMFS
The goals of the workshop were to develop1) an initial assessment of the potentialimpacting agents and ecological effects of waveenergy development in the coastal ocean and 2)a general framework that can be applied tospecific wave energy projects. To accomplishthese goals, we explored key questions in aseries of breakout sessions:
1. What is known about wave energyfacilities, their associated components
(such as cables, anchors, and buoys),and their effect on the physical and biological components of theecosystem?
2. What is unknown about theserelationships, and what are keyinformation gaps?
3. What is the level of uncertainty or agreement among scientists about theseinteractions?
4. Can we prioritize important ecological
issues (e.g., key interactions)?5. What studies, monitoring, or mitigation
measures should be employed to helpminimize effects?
As stated in the workshop prospectus,
This workshop [did] not attempt to discussand vet policy issues pertaining to wave[facilities]; rather, it [focused] on buildingcapacity to more adequately address the
potential ecosystem impacts of wave energydevelopment along the Oregon coast. In
addition, the broader U.S. marine sciencecommunity may not be aware of the oceanenergy momentum building in Oregon andwill benefit from understanding the
proposed projects and a framework for theecological context in which they willoperate.
The workshop shared current understandingand initiated a broad discussion of the potential
ecological effects of ocean energy. The morning plenary session presentations provided acommon understanding of wave energytechnology and scientific issues involved. Theafternoon and following morning provided aforum of structured breakout groups andinteraction among the groups. These discipline- based groups generated written summaries for this proceedings volume to disseminate theworkshop results. Below is a summation of keycross-cutting messages from all breakout groups.
Importance of the Ocean Environment is
Vital to Keep in Mind
Both in the plenary session and in the breakout groups, the importance of the nearshoreocean environment was emphasized as anunderlying principle. All agreed that workshop participants should keep this in mind as theyconsidered the ecological effects of wave energydevelopment off the Oregon coast.
The Energy Absorbing Structures breakoutgroup summarized this sentiment best when theywrote,
Because of the combination of tidally drivenmixing, wind mixing, and upwelling, shelf habitat inshore of 100 m depth, and
particularly inshore of 40 m depth, is themost biologically productive marinezone ….
The productivity in this zone includesimportant pelagic and benthic food webs. Inaddition to supporting communities of
marine birds, mammals, fishes,invertebrates, and even a reptile (theleatherback turtle, Dermochelys coriacea);each of these food webs supports importantcommercial and recreational harvests of finfish and shellfish (e.g., salmon, sardines,
bottom fish, rockfish, and Dungeness crab[Cancer magister ]). Several protectedspecies also include this zone in their critical

8/3/2019 Wave Energy NOAATM92
http://slidepdf.com/reader/full/wave-energy-noaatm92 146/186
134
habitat; impacts on those species aresignificant for legal purposes.
Lack of Information around Potential
Effects Needs to be Recognized as Wave
Energy Projects are Considered
A major concern was the lack of information by which to judge ecological and physicaleffects from the development of wave energy projects. For example, the Cumulative Effects breakout group said, “Session participantsrepeated concerns that the lack of informationand data describing the nature of the waveenergy technologies, and the incompleteunderstanding of marine resources and coastalzone dynamics, introduce substantial uncertainty
into the assessment of cumulative effects.” TheElectromagnetic Effects (EMF) group said,“There is a general lack of information about thesensitivity of many animal groups to EMF,including that for pinnipeds and cetaceans,seabirds, sturgeon, squid and baitfish, flatfish,rockfish and lingcod,…and plankton.” The Fishand Fisheries breakout group stated, “There is alack of adequate information and a high level of scientific uncertainty regarding the effects thesestructures may have on the diverse fishcommunities and their associated commercial
and recreational fisheries communities.”All emphasized the need to collect data and
general baseline information at each waveenergy buoy array and specific informationthrough monitoring to assess impacts onindividual species and the overall nearshore andocean ecosystems. For example, the following pieces of information were judged necessary to begin to understand the impacts of wave energy buoy arrays on seabird populations:
• Comprehensive spatial and temporaldata on the distribution and habitat usefor marine birds along the Oregon coast
• Maps of important bird feeding or staging areas along the Oregon coast
• Information on migration patterns and behavior, including flight patterns atnight and in storms
Modeling is an Important Tool that can
Help Answer Questions
Modeling was highlighted as a method toobtain information about the effects of waveenergy on the physical and biological
environment. For example, the PhysicalEnvironment breakout group emphasized thatmodeling can be used to assess the impact of the physical location of wave energy buoy arraysand their effects on changes in wave heights andsedimentation processes along the Oregon coast.Their detailed report (Appendix 5) stated,“There are numerical models that have beendeveloped to quantitatively evaluate sedimenttransport rates under combined waves andcurrents, so there is the potential that modelanalyses can be expanded to assess the changes
in sediment-transport patterns in the shadowzone of a proposed wave farm.”
Those participants evaluating acousticeffects noted that it is possible to measure or model the magnitude, frequencies, and durationof noises generated by wave energy structures:
The noise generated by a buoy/array can andshould be modeled to predict noisegeneration for differently sized and shapedarrays over a variety of environmentalconditions. An array of four rows of threeor four buoys each would be a starting pointfor such an experiment. Such modeling is
possible since analogous models exist for wind power devices.
We note here that model validation studiesshould be conducted on demonstration, pilot,and commercial facilities as they are developed.
Monitoring is a Must to Understand
Effects
All groups pointed out that given the lack of baseline information and information concerningeffects of the construction and operation of waveenergy structures, monitoring is a keycomponent to the development of wave energy projects. Monitoring specific fauna (e.g., sea birds, marine mammals) is needed to understandthe changes that could occur for projectconstruction and implementation.

8/3/2019 Wave Energy NOAATM92
http://slidepdf.com/reader/full/wave-energy-noaatm92 147/186
135
For example, the Acoustics breakout groupsaid,
It is critical to monitor the sound level of asingle wave energy buoy and multiple buoysin an array:
• To measure the acoustic signature for each device and group of devices, bothinside and outside of the array. This isespecially important to address thegeneration of synchronous or asynchronous noise generated by anarray.
• To study noise under different oceanconditions to differentiate backgroundnoise from the buoy/array noise, and tounderstand how noise generationchanges under different environmentalconditions.
• To monitor buoy and mooring cablenoise over time, to see how it changesas the devices age and mooring cables
become fouled.
The Chemical Effects breakout groupsuggested that “Monitoring for the effects of chemicals on organisms needs to include not justthe presence of mortality, but also changes inabundance and movement. … Multiplelocations and times should be monitored, sincethe chemical exposures and effects are likely to
be variable.”
The Benthic Habitat breakout groupsuggested,
Potential sites for deployment should bemonitored before deployment for at least ayear (to capture seasonal variability).Multiple adjacent sites to the north andsouth (distance to be determined by the sizeof units and of the entire complex) should bemonitored as controls. The size of themonitoring plots and their distance should
be based on ecological considerations,including dispersal and movement ranges of dominant organisms. Samples of water,sediment, and organisms should be taken atincreasing distances from point sources totest the potential effects of toxic antifouling
paints. If bioindicators for the specific pollutants exist, they should also be used.
The Marine Mammal breakout group agreedthat the most important information needed tocollect is baseline information prior to thedevelopment of wave energy:
The general habits of most of the cetaceans
and pinnipeds that could be affected by thedevelopment of wave energy off the Oregoncoast are not well understood. Thefollowing data collection needs wereidentified as top priorities:
• General biological information oncetaceans and pinnipeds, starting with aliterature review of availableinformation. Initial information could
be obtained from the petroleum industryand regulatory authorities, and/or thevarious NMFS’ Fisheries ScienceCenters.
• Seasonal distribution, migration patterns, and residency information on aspecies-by-species basis.
• Dietary information on a species-by-species basis.
• Abundance and distribution informationon a species-by-species basis.
• Information on bottom habitats wherewave energy arrays are proposed to be
placed.
•
Assessment of behavioral interactionsof marine mammals with wave energyconversion devices and cables.
The EMF breakout group suggested thatmonitoring for wave energy generated electricand magnetic fields should accompany facility build outs.
The Physical Environment breakout groupemphasized that it is “imperative” thatmonitoring/experiments, e.g,, as outlined in their detailed report (Appendix 5), be undertaken at
the first few wave energy sites developed alongthe Pacific Northwest coast.
Risk and Uncertainty are Important to
Characterize
A number of the breakout groupsemphasized that understanding the risk anduncertainty surrounding wave energy

8/3/2019 Wave Energy NOAATM92
http://slidepdf.com/reader/full/wave-energy-noaatm92 148/186
136
development is critical to the ultimatedevelopment of this industry. For example, theEMF breakout group noted that “There was ahigh level of uncertainty about the response of pinnipeds, cetaceans, plankton, turtles, squid and baitfish, and benthic infauna to EMF as
expressed by magnetic and induced electricalfields. There was a significant level of uncertainty about the response of salmon toelectrical fields.” The Hard Structure andLighting breakout group noted that “theuncertainty about the extent of wave energydevelopment and the actual devices to be used incommercially scaled energy projects will remainas a source of uncertainty in environmentalanalysis for some time.”
The Physical Environment breakout group
noted, “As things stand, there will be significantlevels of uncertainty in the design of wave farmsto be constructed in the Pacific Northwest. It istherefore important that the ensuing responses of the environments be carefully documented, atleast for the first few developments that willserve as tests of the designs and impacts”(Appendix 5).
The Fish and Fisheries breakout group notedthat uncertainty could be reduced throughspecific experiments that examine the effects of
wave energy devices on the various species of fish and invertebrates, and through studies thatlook for evidence of differences (impacts) between treatment and control sites bymeasuring ecological characteristics over time.
The Acoustics breakout groupacknowledged that there is uncertainty aroundthe impacts of noise generated from waveenergy facilities on cetaceans, pinnipeds, andfish. The level of uncertainty depends on ananalysis of the species that could be found near these arrays in relationship to the noisegenerated from a single buoy and/or a buoyarray.
Cumulative Effects Must be Understood
Cumulative effects were a key point of conversation in the closing session at theworkshop. Workshop participants described the
need to address cumulative effects in the contextof necessary modeling, monitoring, adaptivemanagement, and balancing the scientific andsocial aspects of project impacts. Cautiousdevelopment by the wave energy industry was a primary message of the entire workshop.
The Cumulative Effects breakout groupsummarized this need in the following manner:“The cumulative effects of wave energytechnologies will depend importantly on thenumber, size, location, and configuration of wave energy projects that become operationalwithin the nearshore coastal environment.Assessment of cumulative impacts will require periodic, systematic, multistep evaluations as theenergy facilities increase in scale and extent.”
This group also emphasized that, “Thecumulative effects assessment [requires]integration across all the stressors (past, present,and future) that are associated directly with thewave energy technologies, as well as other actions in the affected environment that couldconceivably bear upon the responses of concern.”
Mitigation may be Possible
A number of groups identified potential
mitigation measures that could be tested andemployed to ameliorate the physical and biological effects as wave energy buoy arraysare constructed and implemented.
The Acoustics breakout group discussed avariety of potential mitigation measures toreduce noise generation from wave energy buoyarrays:
• Varying the array design (buoy andmooring cable arrangements in thewater) could reduce the production of
synchronous sound.
• Looser cables strum at lower levels thantighter cables and would not produce asmuch noise, but this must be balancedagainst the need to reduce the potentialfor cetacean entanglement.
• Thicker cables produce a lower frequency sound than thinner cables.

8/3/2019 Wave Energy NOAATM92
http://slidepdf.com/reader/full/wave-energy-noaatm92 149/186
137
Therefore, to reduce noise generation,limit the total number of cables tofewer, larger, vertical cables.
• Use antistrum (sheath/fairing) deviceson cables where possible.
•
Companies developing wave energytechnology should include noisereduction of internal parts of their buoysand underwater substations as a designcriterion.
• Sounds that sweep in frequency aremore likely to disturb marine mammalsthan constant-frequency sounds.Devices that emit a constant frequencyare preferred to ones that vary. Thesame is true, though perhaps to a lesser extent, for sounds that change inamplitude.
• Because cable fouling might change thenoise spectrum of cables, decisionsabout when and how often to cleancables should include noise as a factor in decision-making.
The Chemical Effects breakout group notedthat the best form of mitigation would beavoiding the use of toxic chemicals in theconstruction of the wave energy buoys. Theystated that
The use of epoxy-based antifouling paint, would, for example, reduce concernsover the continual leaching of dissolvedcopper into the environment… For chemicalreleases from spills or leaks, mitigationinvolves accident prevention and cleanup
preparedness. Minimizing servicing trips byvessels, for example, would reduce the risk of spills or collisions. Having the ability tocontain and clean spills always on standbywould mitigate the impacts should a spilloccur.
The Marine Birds breakout group notedeight mitigation techniques that should beconsidered during the siting and development of a wave energy facility:
• Avoid installing wave energy structuresnear breeding colonies, primaryforaging areas, and migration corridors.
• Constant bright light at night will attract birds or interfere with night-vision birds. Intermittent light should reducelight impacts. Intermittent lights should
be off more than on during each lightingcycle.
• Birds are probably attracted more tocertain colors of light than others, socolor of lighting could be a mitigationmeasure. This would require specificdata or experiments.
• Night work by vessels is moredetrimental than daytime work.
• Design of surface structures shouldminimize potential for roosting by
birds. Simple and proven devicesalready exist to discourage roosting.
•
Underwater lines should be rigid andlarge to minimize underwater collision potential.
• Structures should use multiple layers of containment for oils.
• Above-surface structures shouldminimize height above the sea surfaceto reduce collision potential.
The Fish and Fisheries breakout groupsuggested that looking to other similar examplesof wave energy development off the coast of Europe may be helpful as one method to gather ideas about mitigation.
The Marine Mammal breakout group statedthat
Impact minimization measures for mooring cables must consider the cablediameter, length and density, and whether the cables are slack or taut. It might be
possible to develop a model and crudeapproximation of cable density to
probability of strike or entanglement, toidentify configurations that pose sufficientrisk to require appropriate minimization andmitigation actions.
It might also be possible to placeacoustic warning systems on buoys. Thereis some evidence from NMFS’ SouthwestFisheries Science Center that acousticwarning systems have worked on fishingnets to minimize entanglement. The

8/3/2019 Wave Energy NOAATM92
http://slidepdf.com/reader/full/wave-energy-noaatm92 150/186
138
strongest evidence on the use of acousticwarning systems has been demonstrated instudies on aquaculture facilities. Thesewarning devices were designed to keep
pinnipeds away, but have been shown todrive away harbor porpoises as well.However, there is still a high level of uncertainty concerning whether such asystem would deter whales at a wave energy
buoy array. In designing such a system, it isimportant to consider sound emission levelsthat are loud enough to deter the animal, butnot loud enough to damage hearing. Suchdevices should not exclude whales fromidentified foraging areas. The devices alsoneed to adapt to varying levels of
background noise associated with differentsea states to avoid excessive noise (andaffected areas) when low sea states do notrequire loud sources.
The group also considered if there is an“ocean corridor” outside of knownmigratory routes that could be identified andconsidered by the industry for placement of wave energy buoy arrays, to minimizeimpacts to pinnipeds and cetaceans. For
pinnipeds, the group recommendedspecifically that these projects not be sitednear rookeries (i.e., Cape Arago), and thatseasonal buffer zones be placed around therookeries so as not to disturb them.
The EMF breakout group noted that
• Conversion of electricity to 60 Hertzsynchronous AC and armoring andtrenching of the cabling from the
rectifying pods to the shore are verylikely effective mitigation measures for the undersea cables.
• Ground fault interruption…is likelyeffective mitigation for short circuitingof all components of the system, but
should be backed up with real-time datatelemetered to a control station.
• Adequate armoring should protectvertical transmission cables fromgenerating devices to subsea pods from
biting sharks and rays...
The Benthic Habitat group suggested thatmitigation include burying wave buoy anchorsentirely under the surface of the seafloor, placing structures farther offshore to reduce theeffects on nearshore currents and onshorecommunities, and keeping the units as small as possible.
Conclusions
There is an urgency to the need for environmental studies of wave energyconversion. Throughout the workshop, theimportance of evaluating ecological effects atany wave energy demonstration study sites or pilot scale facilities was stressed. Theseevaluations will help reduce uncertainty of effects for all stressors and all receptor groups,leading to improvements in the best practices for design of devices and arrays and to performancestandards and monitoring requirements that can be applied to commercial-scale development.

8/3/2019 Wave Energy NOAATM92
http://slidepdf.com/reader/full/wave-energy-noaatm92 151/186
139
Glossary, Abbreviations, and Acronyms
ABR auditory brainstem response
AC alternating currentAdaptive management an approach to natural resource management that involves evaluating
the results of management actions and modifying subsequent actions
Advective referring to the effect of large-scale ocean currents (as opposed to verysmall-scale processes)
Ambient signals or stressors of nonhuman origin; background
Amphipods a group of small benthic or planktonic crustaceans
Amplitude the height of a wave from trough to crest
Anthropogenic signals or stressors of human origin
Antifouling paint a toxic paint that is used to inhibit growth of the fouling community onmanmade surfaces
Array a gridwork; in this context, comprised by columns and rows of waveenergy generation devices
ASP amnesiac shellfish poisoning
Asynchronous not occurring at predefined intervals; as alternating current, not as 60-Hertz
B Field the magnetic portion of an electromagnetic field
BACI before-after-control-impact (study design)
Baseline preproject conditions; the studies that establish preproject conditions
Benthos living on or in the substrate at the bottom of the water column
Bioaccumulate the tendency for some chemicals, especially toxicants, to increase inthe food web
Biofouling the buildup of fouling community organisms on manmade structures
Bioindicator a species that is sensitive to specific pollutants or stressors and used toindicate their presence
Bivalves molluscs having two opposing shells
Bristleworms a group within the polychaete worms

8/3/2019 Wave Energy NOAATM92
http://slidepdf.com/reader/full/wave-energy-noaatm92 152/186
140
Brittle stars a group of invertebrates closely related to seastars, but having long,thin, whip-like arms
Bus bar the electrical infrastructure at which all the energy of a wave energydevelopment will be amassed
Capacity the maximum amount of electricity that can be generated by a givendevice under optimal conditions
Catenary line the line connecting the subsurface float to the generating buoy
CEQ Council on Environmental Quality (federal)
Cetaceans the group of marine mammals that includes both the baleen andtoothed whales
Closure depth the depth at which littoral transport processes cease to act, effectivelythe seaward boundary of a littoral cell
COMPASS Communication Partnership for Science and the Sea
Copepods a group of small planktonic crustaceans that is a key importantcomponent of marine pelagic food webs
COWRIE Collaborative Offshore Wind Research Into the Environment
Ctenophores a planktonic group of animals that are similar to jellyfish
Cumaceans a group of small benthic crustaceans resembling tiny shrimps
dB decibels; a measure of sound pressure
Demersal large organisms, like fishes or crabs, that live near or on the sea floor
Dissipative tending to reduce the amount of energy
DLCD Oregon Department of Land Conservation and Development
DOGAMI Oregon Department of Geology and Mineral Industries
Downwelling a process whereby surface waters are forced downwards
E Field the electrical portion of an electromagnetic field
EFH Essential Fish Habitat
Elasmobranchs soft-boned fishes that include the sharks, bats and rays; many are ableto sense weak electrical fields
EMAP U.S. EPA’s Environmental Monitoring and Assessment Program
EMEC European Marine Energy Centre

8/3/2019 Wave Energy NOAATM92
http://slidepdf.com/reader/full/wave-energy-noaatm92 153/186
141
EMF electromagnetic field
Epifauna bottom-dwelling animals that live at the surface of the bottomsubstrate
EPRI Electrical Power Research Institute
ESA Endangered Species Act (federal)
Euphausiids a group of crustacean invertebrates that migrates up into the planktonat night; important forage for fish, birds, and cetaceans
Exposure the contact or co-occurrence of a stressor with a receptor
FAD fish attraction device
Faraday cage a metal shield that blocks electromagnetic radiation
FERC Federal Energy Regulatory Commission
Fetch the distance over which both wind and waves move unimpeded
FINE Fishermen Interested in Natural Energy
Flux a flow of matter or energy
Forage fishes smaller fishes that are important sources of food for larger fish, birdsand mammals
Fouling community a group of plants and animals that settles on hard substrates
Front an ocean region of high rates of change in temperature and salinity
Galvanic electrical field an electrical field produced by the chemical process of electrolysis
Gastropods snails
GFI Ground fault interruptor
Ghost fishing the loss of fish or other species to derelict fishing nets or traps
GLOBEC GLOBal ocean ECosystems dynamics
Hertz cycles per second
HMSC Hatfield Marine Science Center
Holoplankton planktonic organisms that spend their entire life history as plankton
Hs significant wave height
Hydrography measures of temperature, salinity, and density in seawater; they defineocean water masses
8/3/2019 Wave Energy NOAATM92
http://slidepdf.com/reader/full/wave-energy-noaatm92 154/186
142
Hydrozoans attached animals that are related to jellyfish; a component of thefouling community
IE field the electrical field induced by motion of a conductor through amagnetic field
Infauna bottom-dwelling animals that live within the bottom sediments
Invasive species undesirable species that tend to dominate habitats at the expense of more desirable species; almost all are non-indigenous
Isobath a line on a chart that indicates a contour of equal bottom depth
kHz kiloHertz
Krill a group of epibenthic and planktonic crustaceans that is importantforage for fish, birds, and cetaceans; generally refers to the euphausiidsand the mysids
kW kiloWatts
LASAR Lab Analytical Storage and Retrieval System
Lateral line a pressure-sensitive structure in fishes
Leaching rate the rate at which a chemical is dissolved into seawater
Littoral cell the area within which nearshore sediments tend to circulate
MBTA Migratory Bird Treat Act
MCBH Marine Corps Base Hawaii
Mechanosensory sensitive to mechanical stimulation
Meroplankton planktonic animals that spend only an early part of their life history as plankton; most benthic invertebrates and many fishes have planktoniclarvae
Mesocosm an experimental enclosure or container used for experiments requiringvery large volumes of water
Mitigation an action taken to prevent or avoid an ecological effect
MMPA Marine Mammal Protection ActMMS U.S. Minerals Management Service
Morphological referring to physical structure or appearance
MPA marine protected area
MSA Magnusen-Stevens Fishery Conservation Act (federal)
8/3/2019 Wave Energy NOAATM92
http://slidepdf.com/reader/full/wave-energy-noaatm92 155/186
143
MW megawatt
MWh megawatt hour
Mysids a group of crustacean invertebrates that forms swarms near the seafloor and is important forage for fish, birds, and cetaceans
Nearshore the ocean area closest to the shoreline, generally within 1–2 km, withinwhich key oceanographic processes take place
Necropsy forensic analysis of a carcass to find cause(s) of death or injury
NEPA National Environmental Policy Act (federal)
Neuston plankton living in the upper 10 cm or so of the water column
NMFS National Marine Fisheries Service
NOAA National Oceanic and Atmospheric Administration
NRDC Natural Resources Defense Council
NWFSC Northwest Fisheries Science Center
O&M Operations and maintenance
ODFW Oregon Department of Fish and Wildlife
OIMB Oregon Institute of Marine Biology
Olfactory referring to the sense of smell
Oligochaete worms segmented worms not having parapodia and with few bristles; closelyrelated to earthworms
Oligotrophic referring to ocean regions having low overall productivity
OPT Ocean Power Technologies
OSU Oregon State University
OWET Oregon Wave Energy Trust
Pelagic an organism living in the water column; the water column habitat
Pelamis a wave energy generation device; so named after the genus of the seasnake
Period the length of time taken for the full wave to pass a given point
Physiography physical geography; in this context, of the shoreline
Phytoplankton planktonic plants; the basis of most marine food webs

8/3/2019 Wave Energy NOAATM92
http://slidepdf.com/reader/full/wave-energy-noaatm92 156/186
144
Pinnipeds a group of marine mammals comprising the seals and sea lions
Piscine related to fish
PISCO Partnership for Interdisciplinary Studies of Coastal Oceans
Plankton plants or animals that drift in water without sufficient swimmingcapability to counter currents
PMFC Pacific Marine Fisheries Council
Polychaete worms segmented worms having parapodia (protrusions) with bristles; theyare a major component of the marine infauna
Power the amount of energy in a wave; measured in kW/m as wave power density
Progress ratio a measure of learning in industry; in this context, the annual percentage rate at which the cost of the power generated decreases
Propagules biological units capable of propagating new individuals or colonies;may be vegetative or reproductive
PSP Paralytic shellfish poisoning
PSU Portland State University
Receptor a characteristic of the environment, generally an ecological entity, inwhich change from stressors can result
Recruitment the process by which young are added to a population
Residual effect the remaining ecological effect of a stressor or stressors after any possible mitigation has been taken into account
Ribbon worms a widely distributed group of nonsegmented (i.e., smooth) worms alsocalled the proboscis worms
Risk assessment an evaluation of the potential adverse effects of an action; in this paper, the evaluation of ecological risk gained from rigorousassessment of the exposure and effects of stressors on receptors
Risk assessment endpoint another term for ecological effects
Risk benefit analysis an analysis of the comparative risks and benefits of a proposal or situation
Rookery a place where pinnipeds haul out to reproduce and rear their young
ROV Remotely operated vehicle
RPS Renewable Portfolio Standard

8/3/2019 Wave Energy NOAATM92
http://slidepdf.com/reader/full/wave-energy-noaatm92 157/186
145
Sacrificial anode an expendable piece of metal, generally zinc, that protects iron andsteel from electrolysis in seawater
Salps planktonic animals with gelatinous bodies; they resemble jellyfish butare more closely related to vertebrates
Scaphopods tusk or tooth shells; a molluscan component of the benthos
Scoping process a process that defines the bona fide environmental issues relating to ahuman action; drawn from the National Environmental Policy Act
Shoaling becoming shallower
Signature the specific characteristics of a signal; in this context, includeschemical, acoustic, and electromagnetic signals
Significant wave height the average height, trough to crest, of the one-third highest waves validfor a time period
Soniferous producing sound
Spatial temporal in space and time
Stressor an agent of change in the environment
Sublittoral past the seaward boundary of a littoral cell; deeper than closure depth
Subsea pod a vault on the seafloor that contains equipment to refine electricalsignals from ocean generators before cabling to shore
Synchronous occurring at regular intervals
Taxis a specific behavioral response by an animal to a specific stimulus
Te energy period
Tendon line the line connecting the subsurface float to the anchor
Territorial sea the portion of the ocean owned by the state; in Oregon it is measuredas three nautical miles seaward from the shoreline or any rocks or islands
Transmission grid firming the concept of providing reliable sources of power as a backup for lessreliable sources such as wind
Transponder an acoustic or radio frequency device that responds to a query; used toestablish location
TWh terawatt hours
UCSB University of California at Santa Barbara
USGS U.S. Geological Survey

8/3/2019 Wave Energy NOAATM92
http://slidepdf.com/reader/full/wave-energy-noaatm92 158/186
146
Wave refraction the tendency of ocean waves to curve around obstructions
WDFW Washington Department of Fish and Wildlife
WEC wave energy conversion
Zooplankton planktonic animals

8/3/2019 Wave Energy NOAATM92
http://slidepdf.com/reader/full/wave-energy-noaatm92 159/186
147
Appendix 1:
Workshop Agenda
Ecological Effects of Wave Energy Development in the Pacific Northwest
A Scientific Workshop
October 11–12, 2007
Hatfield Marine Science Center
Newport, Oregon
Agenda
Day One
Morning Session: Hennings Auditorium, HMSC Visitor Center (open)
9:00 a.m. Welcome and Overview of Workshop Objectives George Boehlert, Hatfield Marine Science Center, OSU
9:10 a.m. Wave Energy Interest in the Oregon Coast: Policy and Economic Considerations Justin Klure, Oregon Wave Energy Trust
9:30 a.m. The Ocean and Ecological Setting: The Oregon Shelf/California Current System Jack Barth, Oregon State University (Physical Setting) Bill Peterson, NMFS Northwest Fisheries Science Center (Ecological Setting)
10:00 a.m. The Technology: Wave Energy Development on the West Coast Mirko Previsic, Technology Lead, EPRI Ocean Energy Programs
10:30 a.m. Environmental Risk Analysis and Wave Energy: Examples of how to assess
potential impacts of wave energy on the environment Fred Piltz, Minerals Management Service
11:15 a.m. Box Lunch – for invited participants (HMSC Housing, Dining Hall)
Afternoon Session: Guin Library Seminar Room (invited participants only)
1:00 p.m. Instructions and Question Review for Breakout Groups #1 John Meyer, Communication Partnership for Science and the Sea (COMPASS)
Receptor Groups
1. Physical environment (i.e., waves, currents, sediment)2. Pelagic habitat3. Benthic habitat4. Fish effects5. Sea Birds6. Mammals

8/3/2019 Wave Energy NOAATM92
http://slidepdf.com/reader/full/wave-energy-noaatm92 160/186
148
3:00 p.m. Break
3:30 p.m. Breakout Groups #1: Receptors (continued)
5:00 p.m. Adjourn
6:00 pm – 8:00 pm
Social Hour, Dinner and Keynote Address, Oregon Coast AquariumKeynote Speaker: Professor Richard Hildreth, Director, University of Oregon Ocean andCoastal Law Center. “Ocean Zoning: Implications for Wave Energy Development”
Day Two
8:00 a.m. Recap from Day One Cathy Tortorici, National Marine Fisheries Service
8:30 a.m. Instructions and Questions for Breakout Groups #2 Robin Hartmann, Oregon Shores Conservation Coalition
Stressor Groups
1. Energy absorbing structures2. Chemical effects (e.g., anti-fouling coatings, other toxic effects)3. New hard structures/Lighting4. Acoustics5. Electromagnetic effects6. System view/cumulative effects
10:30 a.m. Break
11:00 a.m. Report Out from Stressor Breakout Groupings John Meyer, Communication Partnership for Science and the Sea (COMPASS)
11:30 p.m. Integration/Synthesis Session Cathy Tortorici, National Marine Fisheries Service
12:15 p.m. Wrap-up and Next Steps George Boehlert, Hatfield Marine Science Center, OSU
12:30 p.m. Adjourn

8/3/2019 Wave Energy NOAATM92
http://slidepdf.com/reader/full/wave-energy-noaatm92 161/186
149
Appendix 2:
Ecological Effects of Wave Energy Development
in the Pacific Northwest:
Prospectus for a Science Workshop October 11–12, 2007
Hatfield Marine Science Center
Newport, Oregon
Contact: Greg McMurray ([email protected])
What: The Ecological Effects of Wave Energy Development Workshop will be a one and one-half day meeting with goals of 1) developing an initial assessment of the potential impacting agents andecological effects of wave energy development in the coastal ocean and 2) developing a general
framework that can be used to apply to specific wave energy projects. The workshop will share currentunderstanding and initiate a broad discussion of the potential ecological effects of ocean energy. Themorning will be a plenary session with presentations that provide a common understanding of waveenergy technology and scientific issues involved. The afternoon and following morning will offer aforum of structured breakout groups and interaction among the groups. These discipline-based groupswill generate written summaries that will be put in a proceedings volume to disseminate the workshopresults.
This workshop will not attempt to discuss and vet policy issues pertaining to wave parks; rather, itwill focus on building capacity to more adequately address the potential ecosystem impacts of waveenergy development along the Oregon coast. In addition, the broader U.S. marine science communitymay not be aware of the ocean energy momentum building in Oregon and will benefit from understandingthe proposed projects and a framework for the ecological context in which they will operate.
Why: Wave energy is renewable power. The Governor’s Office is encouraging the development of this technology. Several different projects are likely to develop along the Pacific Northwest coast. Thereare currently 12 proposed wave energy projects along the Pacific coast, of which seven reside off thecoast of Oregon. One project gaining momentum is being developed by a company called Ocean Power Technologies (OPT). OPT is planning to build a 50-megawatt wave park off the town of Gardiner, on thecentral Oregon coast over the next 5–10 years and has filed a preliminary permit application with theFederal Energy Regulatory Commission (FERC). The application describes an experimental 150 kW buoy to be launched in spring 2008 and an additional 13 buoys in the fall of 2008. The Reedsport wave park at peak capacity could power 60,000 households. As this and other proposed projects move forward,a variety of unknowns could stand in the way of the timely assessment and development of thistechnology. Stakeholder dialogue is underway, but significant issues around the environmental impacts
to coastal ecosystems have yet to be identified. There is a pressing need to begin examining how oceanwave energy development might impact the marine environment, biological communities, and individualspecies. This workshop will take the first step by developing a framework for evaluating theseenvironmental impacts. It will also highlight the science from undersea cable projects and other existingocean technologies that have a larger body of literature on the ecological impacts and may be applicablefor wave energy.
Oregon’s governor is committed to helping the wave energy companies move to this state anddevelop wave energy off the Oregon Coast. Mechanisms to “fast track” wave energy are being developed
8/3/2019 Wave Energy NOAATM92
http://slidepdf.com/reader/full/wave-energy-noaatm92 162/186
150
through the “Oregon Solutions” process. All known stakeholders and all levels of government areinvolved with this effort. The Department of State Lands is requesting permission from the State LandBoard to start a rule-making process for wave energy in the Territorial Sea. The Governor’s citizenadvisory council on ocean issues, the Ocean Policy Advisory Council (OPAC), has created a workinggroup to address ocean wave energy issues. Meanwhile, Lincoln and Douglas Counties have also filed preliminary permit applications with FERC and may be a direct part of the future equation of wave
energy facility permitting.
It is time for Oregon’s scientific community to begin to respond to some of the most commonly askedquestions about the impact of wave generation on the local ocean. The Reedsport Wave Park will be thefirst utility-scale facility in the United States and is likely to be a model for future projects.
Who: Wave energy is new: Europe is leading the world in its development. In the United States thereare just three projects, and they are all experimental sites with a single device deployed: Makah Bay,Washington; Kaneohe Bay, Hawaii; and off the coast of New Jersey. Expertise in understanding oceanimpacts is still in the formative stages and developing the scientific capacity to better understand waveenergy’s potential ecological impacts is the primary objective of this meeting.
Invitees to this meeting will include scientists with a present expertise in ecological impacts, scientistswho do not have a present expertise but would be helpful in expanding Oregon’s science capacity in waveenergy, and scientists whose expertise is transferable to understanding wave energy ocean impacts. Thismeeting will not focus on policy, details of wave energy engineering, or the socioeconomic impacts of wave energy. Separate meetings to address these topics might be a recommended next step.
The scientists invited to the workshop will guide and provide the basic input to the proceedings of themeeting. The focus of the workshop will include topic areas such as
• Physical Effects
Currents and wavesLittoral transport
• Effects on Fish
Electromagnetic field effects (sensory systems, orientation)Changes in migration
• Habitat Effects
Fouling community effects and interactionsAggregation effects in pelagic environment (FADs)Planktonic community
• Effects of Benthic Disturbance
Benthic-pelagic coupling
• Marine Mammals and Seabirds
Electromagnetic field effects (sensory systems, orientation)Changes in migration; use of acoustic harassment devices (AHD)Entanglement
When: The Reedsport Wave Park has entered a multi-year permitting process with FERC that willinvolve stakeholders and a series of resource studies. Oregon’s 2007 legislative session will deliberate on potential incentive packages for wave energy, leading the Coastal Caucus looking into the positive and

8/3/2019 Wave Energy NOAATM92
http://slidepdf.com/reader/full/wave-energy-noaatm92 163/186
151
negative impacts of wave energy on coastal communities. In order to provide useful and timelyinformation to both coastal communities as well as the questions likely to be generated by OPAC and theCoastal Caucus, the science meeting is planned to occur on October 11–12, 2007.
Where: The workshop will be located at Oregon State University’s Hatfield Marine Science Center in Newport, Oregon.
Workshop Steering Committee:
George Boehlert, Director, Hatfield Marine Science Center, Oregon State UniversityRobin Hartmann, Ocean Program Director, Oregon Shores Conservation CoalitionMaurice Hill, U.S. Mineral Management Service, OCS Alternative Energy Coordinator Justin Klure, Executive Director, Oregon Wave Energy TrustGreg McMurray, Marine Affairs Coordinator, Oregon DLCDJohn Meyer, COMPASS, Oregon State UniversityCathy Tortorici, Chief, Oregon Coast/Lower Columbia River Branch, NOAA-NMFS

8/3/2019 Wave Energy NOAATM92
http://slidepdf.com/reader/full/wave-energy-noaatm92 164/186

8/3/2019 Wave Energy NOAATM92
http://slidepdf.com/reader/full/wave-energy-noaatm92 165/186
153
Appendix 3:
Workshop Participants
Jonathan Allan, Ph.D.Marine GeologistOregon Department of Geology and MineralIndustries Newport, OR 97365(541) 574-6642 [email protected]
David H. Baldwin, Ph.D.Ecotoxicology and Environmental Fish HealthProgramEnvironmental Conservation Division
NOAA-NMFS, NWFSC2725 Montlake Blvd. E.Seattle, WA 98112(206) [email protected]
Nelio BarrosPortland State UniversityDepartment of BiologyP.O. Box 751Portland, OR 97207-0751(503)725-4078
Steven M. Bartell, Ph.D.Principal Scientist and Manager E2 Consulting Engineers, Inc.339 Whitecrest DriveMaryville, TN 37801(865) [email protected]
Jack Barth, Ph.D.Professor
College of Oceanic and Atmospheric SciencesOregon State UniversityCorvallis, OR 97331(541) 737-1607 [email protected]
George Boehlert, Ph.D.Professor and Director Oregon State UniversityHatfield Marine Science Center 2030 SE Marine Science Dr. Newport, OR 97365(541) [email protected]
Richard D. Brodeur, Ph.D. NOAA-NMFS, NWFSCHatfield Marine Science Center
2030 SE Marine Science Dr. Newport, OR 93965(541) [email protected]
Robin F. BrownMarine Mammals Research ProgramOregon Department of Fish and Wildlife7118 NE Vandenberg Ave.Corvallis, OR 97330(541) [email protected]
Ray Buckley, Ph.D.Senior Research ScientistWashington Dept. of Fish and Wildlife600 Capitol Way NorthOlympia, WA 98501-1091(360) 902-2828 [email protected]
Ann Scarborough Bull, Ph.D.Marine BiologistChief, Environmental Analysis Section
U.S. Minerals Management Service PacificRegion770 Paseo CamarilloCamarillo, CA 93010(805) [email protected]

8/3/2019 Wave Energy NOAATM92
http://slidepdf.com/reader/full/wave-energy-noaatm92 166/186
154
Holly CampbellMarine Resource ManagementCollege of Oceanic and Atmospheric SciencesOregon State UniversityCorvallis, OR [email protected]
John Chapman, Ph.D.Hatfield Marine Science Center 2030 SE Marine Science Drive Newport OR 97365(541) 867-0235 [email protected]
Matt CutlipFish BiologistFederal Energy Regulatory CommissionOffice of Energy Projects
Portland Regional Office101 S.W. Main Street, #905Portland, OR 97204(503) [email protected]
Debbie Duffield, Ph.D.Portland State UniversityDepartment of BiologyP.O. Box 751Portland, OR 97207-0751(503)725-4078
Robert Emmett, Ph.D. NOAA-NMFS, NWFSCHatfield Marine Science Center 2030 SE Marine Science Dr. Newport, OR 97365-5296(541) [email protected]
Jack Engle, Ph.D.Associate Research Biologist
Marine Science InstituteUniversity of CaliforniaSanta Barbara, CA 93106-6150(805) 893-8547
John Ferguson, Ph.D. NOAA Fisheries, NWFSC2725 Montlake Boulevard EastSeattle, WA 98112(206) 860-3287 [email protected]
Mike Fitzpatrick Fishermen Interested in Natural Energy (FINE)P.O. Box 983Lincoln City, OR 97367(541) [email protected]
David FoxMarine Program Assistant Manager Oregon Department of Fish and Wildlife2040 S.E. Marine Science Dr.
Newport, OR 97365(541) 867-0300 ext. [email protected]
Robin HartmannOregon Shores Conservation Coalition1721 SE Main StRoseburg, OR 97470(541) 672-3694 [email protected]
Jim Hastreiter
Federal Energy Regulatory Commission101 SW Main Street, Suite 905Portland, OR 97204(503) 552-2760 [email protected]
Selina S. Heppell, Ph.D.Associate Professor Dept. Fisheries and WildlifeOregon State UniversityCorvallis, OR 97331(541) 737-9039
[email protected] HildenbrandMarine Fisheries Extension FacultyOSU Extension Service Lincoln County29 SE 2nd St. Newport, OR 97365-4496(541) 574-6537 ext. [email protected]

8/3/2019 Wave Energy NOAATM92
http://slidepdf.com/reader/full/wave-energy-noaatm92 167/186
155
Richard Hildreth, Professor Director University of Oregon Ocean & Coastal LawCenter Knight Law Center 1515 Agate St.
Eugene, OR 97403(541) [email protected]
Maurice L. HillOffice of Alternative Energy ProgramsU.S. Minerals Management Service770 Paseo Camarillo, Suite 228Camarillo, CA 93010(805) [email protected]
Jan Hodder, Ph.D.Associate Professor Oregon Institute of Marine BiologyP.O. Box 5389Charleston, OR 97420(541) 888-2581 ext.215 [email protected]
Susan HolmesMarine Resource ManagementCollege of Oceanic and Atmospheric SciencesOregon State University
Corvallis, OR [email protected]
Stephen Kajiura, Ph.D.Department of Biological SciencesFlorida Atlantic UniversityBoca Raton, FL 33431(561) [email protected]
Laurel Kellner Marine Resource Management
College of Oceanic and Atmospheric SciencesOregon State UniversityCorvallis, OR [email protected]
Keith Kirkendall NOAA-NMFS1201 NE Lloyd Blvd.Portland, OR 97232(503) [email protected]
Justin KlureOregon Wave Energy TrustPO Box 8626Portland, OR 97207-8626(503) 475-2999 [email protected]
Paul Komar, Ph.D.Professor (Emeritus)College of Oceanic and Atmospheric SciencesOregon State UniversityCorvallis, OR 97331
(541)737-5210 [email protected]
Hugh Link Oregon Dungeness Crab Commission964 Central AvenueCoos Bay, OR 97420(541) [email protected]
Roy W. LoweOregon Coast National Wildlife Refuge
ComplexU.S. Fish and Wildlife Service2127 SE Marine Science Drive Newport, OR 97365-5258(541) [email protected]
Bruce Mate, Ph.D.Professor and Director, Marine MammalInstituteHatfield Marine Science Center 2030 SE Marine Science Drive
Newport OR 97365(541) 867-0202 [email protected]

8/3/2019 Wave Energy NOAATM92
http://slidepdf.com/reader/full/wave-energy-noaatm92 168/186
156
Greg McMurray, Ph.D.Marine Affairs Coordinator Oregon Department of Land Conservation andDevelopmentOcean and Coastal Services Division635 Capitol Street NE, Suite 150
Salem, OR 97301-2540(503) 373-0050 [email protected]
David Mellinger, Ph.D.Cooperative Institute for Marine ResourcesStudiesHMSC/Oregon State University Newport, OR 97365(541) [email protected]
Bruce Menge, Ph.D.Professor, Department of ZoologyCordley 3029Oregon State UniversityCorvallis, OR 97331-2914(541) [email protected]
John Meyer COMPASS Program AssociateDepartment of ZoologyOregon State University
Corvallis, OR 97331(541) [email protected]
Bill Peterson, Ph.D. NOAA-NMFS, NWFSCHatfield Marine Science Center Newport, OR 97365(541) [email protected]
Curt Peterson, Ph.D.
Professor, Portland State UniversityGeology DepartmentP.O. Box 751Portland, OR 97207-0751(503) 725-3375 [email protected]
Fred Piltz, Ph.D.U.S. Minerals Management Service770 Paseo Camarillo, Suite 228Camarillo, CA 93010(805)[email protected]
Mirko Previsicre vision consulting LLC5115 11th AveSacramento, CA 95820(916) [email protected]
Erin RichmondPISCO ProgramOregon State UniversityCorvallis, OR 97331
Gil Rilov, Ph.D.Partnership for Interdisciplinary Studies of Coastal Oceans (PISCO)Department of ZoologyOregon State UniversityCorvallis, OR 97331-2914(541) [email protected]
Alan Shanks, Ph.D.
Professor Oregon Institute of Marine BiologyUniversity Of Oregon618 Boat Basin Dr., PO Box 5389Charleston, OR 97420(541) 888-2581 [email protected]
Rob Suryan, Ph.D.Oregon State UniversityHatfield Marine Science Center 2030 SE Marine Science Dr.
Newport, OR 97365(541) [email protected]
Maria StefanovichEnvironmental SciencesOregon State UniversityCorvallis, OR [email protected]

8/3/2019 Wave Energy NOAATM92
http://slidepdf.com/reader/full/wave-energy-noaatm92 169/186
157
Brycen SwartMarine Resource ManagementCollege of Oceanic and Atmospheric SciencesOregon State UniversityCorvallis, OR 97331 [email protected]
Robert Thresher, Ph.D. National Wind Technology Center National Renewable Energy Laboratory1617 Cole Blvd.Golden, CO 80401-3393(303) [email protected]
Cathy Tortorici NOAA-NMFS1201 NE Lloyd Blvd.
Portland, OR 97232(503) [email protected]
Waldo Wakefield, Ph.D. NOAA-NMFS, NWFSCHatfield Marine Science Center 2030 SE Marine Science Dr. Newport, OR 97365-5296(541) 867-0542
Kate WingSenior Ocean Policy Analyst Natural Resources Defense Council111 Sutter St., 20th Floor San Francisco, CA 94104(415) [email protected]
Jen Zamon, Ph.D. NOAA-NMFS, NWFSC
P.O.Box 155Hammond, OR 97121-0155(503)861-1818 [email protected]

8/3/2019 Wave Energy NOAATM92
http://slidepdf.com/reader/full/wave-energy-noaatm92 170/186

8/3/2019 Wave Energy NOAATM92
http://slidepdf.com/reader/full/wave-energy-noaatm92 171/186
8/3/2019 Wave Energy NOAATM92
http://slidepdf.com/reader/full/wave-energy-noaatm92 172/186
160
Other U.S. federal ocean zoning schemes include 13 National Marine Sanctuaries whose total areaincludes about 1% of U.S. state and federal EEZ waters. Four of those sanctuaries are located off California and 1 off Washington. In 2005 Oregon Governor Kulongoski proposed that the entirecontinental shelf off Oregon be designated a sanctuary—it would be 4 times as large as the next largestsanctuary, the Monterey Bay National Marine Sanctuary off the central California coast. Within mostsanctuaries, bottom trawling is banned and some other fishing activities are also regulated. Most
significantly for my topic, wave and other renewable energy facilities are prohibited in federal sanctuarywaters and stringently regulated in state sanctuary waters.
The Florida Keys and California Channel Islands sanctuaries contain networks of “no take” marinereserves. In state waters off the central California coast, the state recently established a network of 12marine reserves. Almost all federal and state definitions of marine reserves exclude “extractive”activities. Under California’s Marine Life Protection Act, activities which would “change the dynamicsof the ecosystem” also are prohibited. WED probably will not be viewed as an “extractive” activity likeoffshore oil and gas development or commercial fishing, but it does have impacts on local ecosystemdynamics of varying levels of significance which are being assessed as part of this state-of-the-artinternational workshop.
Currently off Oregon there are no marine reserves in state or federal waters and ocean zoning islimited to essential fish habitat areas designated by the federal regional Pacific Fishery ManagementCouncil and protected from damaging activities under the federal Fisheries Conservation andManagement Act. Should more zoning be implemented before WED proceeds? My answer for the shortterm is no, WED may proceed without additional zoning. I base that conclusion in part on regulationsrecently adopted by the Oregon Department of State Lands which among other things require that WEDin state waters not “substantially impair lawful uses or developments already occurring within the area”such as fishing. Furthermore, Oregon Ocean Resources Management Goal 19 which has the force of lawrequires that a precautionary approach be used with regard to the scientific uncertainties involved indetermining whether there are significant use conflicts or adverse ecosystem impacts. Under the federalCoastal Zone Management Act, both requirements are potentially applicable to federal approval of WEDin federal waters off Oregon as well.
Under the framework of Goal 19, when trans-Pacific fiber optic cables laid off Oregon displacedsome fishing activity, appropriate compensation for that displacement was negotiated and paid to theaffected fishermen as a means of resolving the use conflict. A similar process could be used for fishingactivity displaced by the installation and operation of WED facilities offshore and their associatedtransmission cables to shore.
Over the longer term, expanded ocean zoning off Oregon could offer WED developers security of tenure at preferred seabed, water column, and surface locations through a lessened likelihood thatexpiring state and federal permits and leases up for renewal would not be renewed and the locationallocated to some other use. That additional security of tenure would be supported by the use of zoning toharmonize WED to the maximum extend possible with existing and future uses in the area. In this regard,it is increasingly clear that WED facilities offshore will have to be protected by some form of “no entry”zone.
And if WED does expand up and down the west coast, the 2006 West Coast Governors’ Agreementon Ocean Health specifically supports a coordinated three-state approach to ocean renewable energydevelopment. And on the research side, the three states are developing a Regional Marine Research Planfor the California Current Ecosystem adjacent to all three states. Much of the research funded and carriedout pursuant to that plan could be relevant to assessing the potential for and ecological impacts of WEDon the west coast and the need for expanded ocean zoning.

8/3/2019 Wave Energy NOAATM92
http://slidepdf.com/reader/full/wave-energy-noaatm92 173/186
161
Are there any downside risks for WED through expanded ocean zoning? Yes, at least in theory. Oneonly has to recall the initial hostile response to the proposed Cape Wind wind farm in federal waters off Massachusetts and the west coast federal and state “zoning out” of any more offshore oil and gasdevelopment to the see the possibility of WED being zoned out. And of course further research followingup on this workshop might reveal WED impacts which would require mitigation or compensation toaffected users, or in a worst-case scenario, lead to WED’s exclusion from certain areas.
But personally, as one concerned like many of you about the environmental implications of our continued heavy reliance on fossil fuels, I am hopeful that room can be made for WED off Oregon andelsewhere.

8/3/2019 Wave Energy NOAATM92
http://slidepdf.com/reader/full/wave-energy-noaatm92 174/186

8/3/2019 Wave Energy NOAATM92
http://slidepdf.com/reader/full/wave-energy-noaatm92 175/186
163
Appendix 5:
Environmental Consequences of Wave Energy Extraction along the
Shores of the U.S. Pacific Northwest: The Physical Environment
Paul D. Komar a, Jonathan C. Allan b, Jack Bartha, Tuba Özkan-Haller a, Curt Petersonc, Mirko Previsicd,and Keith Kirkendalle aCollege of Oceanic & Atmospheric Sciences, Oregon State University bOregon Department of Geology & Mineral IndustriescDepartment of Geology, Portland State Universitydre vision consulting LLC, Sacramento, CAe NOAA, Portland, OR
Introduction
The wave climate of the Pacific Northwest,the shores of Oregon and Washington, isrecognized for its severity, the waves being the product of energy derived from winds blowingacross the expanse of the North Pacific. Winter storms reaching this coast commonly generatedeep-water significant wave heights1 greater than 10 meters, with the most extreme storms inrecent decades having achieved significant waveheights of 15 meters. It is noteworthy that therehas been a marked and progressive increase inthe wave heights measured by NOAA buoyssince they became operational in the mid-1970s,an increase that likely is a response to globalwarming and can be expected to continue infuture decades (Allan and Komar 2006). Withinthat net decadal increase in wave energies have been marked variations from year to year instorm intensities and their generated waves,which in some cases can be attributed to climateevents such as a major El Niño, whereas thecauses of other extreme years remain uncertain.
The high waves along this coast haveattracted interest as a potential source of renewable energy. Plans are advancing at a
1 The significant wave height is the average of the highestone-third of the measured wave heights, this average havingneglected the lowest “insignificant” waves. Measurementsshow that the highest waves are on the order of 1.5 to 2.0times as large as the significant wave height.
rapid pace toward the installation of energy-
extraction units (“wave farms”) to collect thearriving wave energy and convert it intoelectrical power that is transmitted to shore bycables. If these initial plans are successful, it isanticipated that they will be followed by a rapidexpansion of such systems along the shores of the Pacific Northwest.
Concerns about the impacts of suchdevelopments to the physical environmentinclude the consequences of the reduction inwave-energy levels along this shore, potentiallyaffecting the processes and stabilities of the beaches and recreational activities such assurfing. Also of concern are the effects of thestructures on ocean currents, which in turn couldalter the magnitudes and patterns of sedimenttransport and accumulation.
Our objective is to summarize our review of the potential consequences of reduced wave-energy levels and modified ocean currents thatcould result from commercial energy extraction.Our considerations range from the likelychanges in sedimentation processes offshore, in proximity to the extraction units, to significantimpacts to our beaches and rocky shores withecological consequences (discussed in other sections of this report).
Energy-extraction technologies
Complicating a review of the issues pertaining to the impacts on the physical

8/3/2019 Wave Energy NOAATM92
http://slidepdf.com/reader/full/wave-energy-noaatm92 176/186
164
environment is the range of designs of wave-energy extraction units. These variously involve buoys floating on the water’s surface, tethered tothe seafloor to hold them in position; andmassive concrete structures that rest reef-like onthe bottom, extracting energy from the waves
that pass over them. A variation on the latter that is meant to operate in relatively shallowwater is an extraction unit that consists of rigidflaps extending upward from the seafloor. Theunit oscillates under the reversing orbitalmotions of the waves, thereby extracting someof their energy.
As well as differing in their fundamentalmechanisms to derive energy from the waves,each unit design is unique in the portion of waveenergy that can be extracted, this being the unit’s
basic efficiency (as defined for any machine);these efficiencies range from approximately 5%to 20%. Moreover, these units will reflect a portion of the arriving wave energy so it returnsseaward rather than reaching the shore; analysescompleted for various designs indicate that thiscould be on the order of 10% to 30%, but ridgedstructures projecting through the water’s surfacecould have a reflection approaching 100%. Thedegree of wave reduction in the lee of theextraction unit depends on both the amount of energy removed to generate electricity and that
being reflected. Similarly, the different unitdesigns will have unique effects on oceancurrents and water-column stratification,depending on their size and shape.
The dynamic characteristics of each energy-extracting unit therefore depend on its design, but also on the site of installation including theranges of wave heights and periods that occur.It is our understanding that these dynamic properties of the units are generally documented by their developers, based on numerical-model
analyses of wave interactions with the designedstructure, and possibly from scaled-downlaboratory wave-basin tests of their responses.While these fundamental characteristics areknown by the commercial developers, itgenerally is the case that this information is proprietary, not being available to other interested parties. It is important that thisdocumentation be made available to the State of
Oregon and interested engineers and scientists;without that availability, assessments of the potential impacts of wave-energy extraction onthe physical environment cannot beindependently made by others.
Our consideration was directed primarilytoward buoy systems and their potential impactson the physical environment, as they are mostfeasible for application in the Pacific Northwest,and a buoy system is under development for installation at Reedsport2 on the southernOregon coast, expected to be “first in the water.”Most of the following discussions thereforefocus on those systems that feature the use of multiple buoys placed in an array.
The collective impact of multiple units
Having extracted and reflected energy fromthe waves arriving from offshore, a single unitwill create a “shadow zone” of lowered waveheights in its lee. This reduction is greatestimmediately shoreward of the unit, with thewaves thereafter progressively recovering someenergy as they continue to travel toward theshore, by a process that is termed wavediffraction3. However, the energy gained by thewaves in the shadow zone is derived from theadjacent portions of the wave crests, so their
heights outside that directly sheltered area arereduced by this diffraction process. The effectof having locally extracted energy from thewaves therefore spreads, having started out asthe effective width of the extracting unit but progressively widening as the waves movetoward the shore. By the time the waves reach
2 The Reedsport Wave Energy Park is being developed byOcean Power Technology on the southern Oregon coast,about 4 kilometers (2.5 miles) offshore in about 50-meters
water depth. The plan is to initially deploy 10 energy-extraction buoys (PowerBuoy) in the summer or fall of 2009, later to be expanded to 200 units.3 Diffraction is the movement of energy along the crest of awave due to variations in the height and energy level of thewave (Komar 1998). It is often accompanied by waverefraction where the speed of the advancing wave crestdepends on the water depth (fastest where the depth isgreatest), resulting in a bending of the crests and changes intheir directions of approach to the shore.

8/3/2019 Wave Energy NOAATM92
http://slidepdf.com/reader/full/wave-energy-noaatm92 177/186
165
the beach, the potentially impacted area couldhave widened considerably, affecting a longstretch of shore, although the degree of wave-height and energy reduction in the line extendingfrom the unit to the shore would not be as greatas that which had occurred in the immediate lee
of the unit.
The magnitudes of the reduced wave heights become significantly greater and the diffraction patterns more complex when multiple extractionunits are present (forming a “wave farm”), asthey will always be in commercial systemsdesigned to maximize the derived electricalenergy. Each individual unit will tend to produce a wave-diffraction pattern as describedabove, but their respective modified wavesinteract and combine as they move toward the
shore. This is illustrated in Figure 1, derivedfrom the numerical diffraction/refraction modelsdeveloped by Venugopal and Smith (2007) toanalyze the wave reduction created by ahypothetical series of five extracting units.While the extraction system is hypothetical andits dynamics assumed, the site modeled is theEuropean Marine Energy Centre (EMEC) on thewestern shore of the Orkney Islands, Scotland,established to become a prototype-testing sitefor unit designs. The water depths (65 to 2.5meters) in the analyzed area represent the actual
bathymetry of the EMEC, as does the waveclimate; the models in Figure 1 are for a deep-water significant wave height of 4 meters and a10-second wave period.
The examples in Figure 1 for the series of models by Venugopal and Smith (2007) are for an array of five extraction units in a lineapproximately parallel to the coast (which isrocky and irregular), positioned 3.5 to 4kilometers offshore in 50-meter water depth.The individual units are bottom mounted and
ridged, this “design” having been determined bythe numerical models employed, which cannotaccount for wave-induced motions of the unitsand therefore cannot be satisfactorily applied toanalyses of floating buoys. Each extraction unitin the model is 10 meters wide by 160 meterslong, with 160-meter spaces (gaps) where thearriving wave energy can pass through the array.
The series of models involved a range of assumed “porosities”, representing the loss inenergy due to wave reflection and the energyextracted by the individual units.
The first model in the series, Figure 1(a),
represents the natural condition in the absence of a wave farm. In addition to serving as acomparison where an array is included, thisanalysis demonstrates that there are naturalvariations in the significant wave heights in theshoreward direction. The wave heights areaffected by the normal shoaling transformationsof waves, but in this example there is a markedreduction in wave heights caused by bottomfriction. Thus, according to the model results, atthis site there is a natural trend of decreasingwave heights in the onshore direction, which
locally will be enhanced by the presence of anarray of extraction units. The most extremeexample is seen in Figure 1(b) where the porosity is close to zero, in effect representing aseries of solid structures with short gaps between. It is seen that according to the model,the significant wave heights in the shadow zoneare smaller than 1 meter, a substantial reductionfrom their original 4-meter heights in theoffshore.
The third model run, Figure 1(c), is a more
realistic assessment of the effects of a series of extracting units, with a porosity = 0.7 having been assumed for the individual units. Asexpected there are reduced wave heights in theshadow zones of the individual units, but againenergy diffracts into those zones from the wavesthat pass through the gaps. That initial recoveryis followed by a general reduction in waveheights in the shoreward direction as theexpanding sheltered zones behind the series of 5units merge, also affected by bottom friction asdepicted in Figure 1(a). Overall the reduction in
wave heights is noticeably greater than seen for the natural condition in Figure 1(a), but having acomplex pattern of variations due to theinclusion of multiple extraction units. It should be recognized that this pattern changes as theheights, periods, and directions of wavesarriving from deep water vary from day to day.

8/3/2019 Wave Energy NOAATM92
http://slidepdf.com/reader/full/wave-energy-noaatm92 178/186
166
Figure 1. Model analyses by Venugopal and Smith (2007) of the reduced wave heights shoreward of a
hypothetical wave farm off the Orkney Islands. (a) natural condition in absence of wave farm (b) wave
array with porosity close to zero (c) wave array with porosity=0.7.
While these model results were for hypothetical fixed extraction units placed on theseafloor and for conditions specific to the EMECin Scotland, the results provide guidance as to
the expected patterns of wave-height and energyreductions in the shadow zone of a wave farmconstructed on the U.S. Pacific Northwest coast.However, wave farms will almost always consist

8/3/2019 Wave Energy NOAATM92
http://slidepdf.com/reader/full/wave-energy-noaatm92 179/186
167
of multiple lines of units, with the second lineextracting energy that had passed through thefirst. Typically the second line of buoys would be set shoreward of the first with positions tooccupy the gaps in the first line of buoys,extracting energy from the waves that had
passed through the gaps. There might be a thirdline, again offset to occupy the gaps in thesecond line. Such an array is designed tomaximize the wave energy extraction, but it isapparent that there would be a greater reductionin wave heights in its shadow zone comparedwith that seen in Figure 1 from the models of Venugopal and Smith (2007) for a single line of units. It can therefore be expected that with thedevelopment of a full-scale wave farmconsisting of a large number of extracting unitsin a two-dimensional array, there could be
significant reductions in wave heights andenergies along the coast, potentially extendingfor kilometers in the shoreward direction andaffecting the beaches. Furthermore, thedevelopment of numerical models for such anarray will be considerably more complex thanthat for a single line, increasing the uncertaintiesin the model’s capacity to predict theenvironmental impacts.
In addition to affecting wave energies and patterns of diffraction and refraction, the
presence of a wave farm will become anobstacle to the flow of wind-driven currents inthe shallow-water continental shelf, and couldalter the structure of the water column(variations in temperatures and salinity withdepth). While there will be some effect byindividual extraction units, the collectiveimpacts of a large number of units in an arraywill be important. It is expected that when fullydeveloped, a wave farm would consist of hundreds of units extending along anappreciable length of coast, so there could be a
measurable effect on the currents and amodification of the water column. In addition,the water currents in the nearshore—on theocean beaches—are driven by the waves, so anyreduction in wave heights or altered angles of arrival at the shore could change the magnitudesand directions of those currents, in turn affectingthe longshore transport of sand on the beaches.
Potential environmental impacts
From the magnitudes of the potentialreductions in wave energies and the effects onocean currents, there is a distinct possibility of there being significant changes in the physical
environment resulting from the construction of awave farm. Analyses like those in Figure 1 provide guidance as to what those impacts might be, and where they would be greatest. However,at this stage in the development of wave farms,this unfortunately remains somewhatspeculative. There has been only limitedreported use of numerical models extended toassessments of the processes that would beresponsible, such as the transport of sediment onthe continental shelf and beaches. And of particular importance, no field experiments have
documented the impacts of individual unitdesigns on a prototype scale, and no experiencehas been derived from the construction of acomplete wave farm consisting of multiple units.The objective here is to consider what thoseimpacts might be, framed in the context of thePacific Northwest.
Environmental changes in the offshore cancertainly be expected, particularly in theimmediate lee of the wave farm where the wave-height reductions are greatest. From the
complicated patterns of the affected waves,evident in Figure 1(c) for even a single line of buoys, it can be expected that there would be a parallel complexity in the responses of theseafloor sediments. That would be further complicated by the presence of superimposedshelf currents (also affected by the wave farm)with the transport of sediment and resulting patterns of erosion versus sediment deposition being the product of the combined waves andcurrents. There are numerical models that have been developed to quantitatively evaluate
sediment transport rates under combined wavesand currents, so there is the potential that modelanalyses can be expanded to assess the changesin sediment-transport patterns in the shadowzone of a proposed wave farm. With the waveenergies on average being reduced, there would be a tendency for sediments to accumulate in thelee of the array, producing some shoaling and possibly a change in grain sizes of the bottom

8/3/2019 Wave Energy NOAATM92
http://slidepdf.com/reader/full/wave-energy-noaatm92 180/186
168
sediments (likely a shift to finer sediment, and possibly a change from a rocky seafloor tosand). Those changes would have a feedback effect on the processes, for example altering the patterns of wave refraction if shoaling hadsignificantly changed the water depths. Such a
modification of the wave refraction would becarried to the shore, the altered angles of waves breaking on the beaches affecting the longshorecurrents and sand transport.
It is unfortunate that there have been onlylimited investigations of sediment-transport processes on the continental shelves of thePacific Northwest, and research elucidating thecauses of long-term sediment erosion areasversus accumulation areas. The one region of concentrated research has been that in proximity
to the mouth of the Columbia River (theColumbia River Littoral Cell), but theextrapolation of its results to the Oregoncontinental shelf is uncertain, there being nocounterpart to the Columbia River and thereforeonly limited sources of sediment. Althoughnumerical models may eventually includeassessments of sediment transport affected bythe construction of a wave farm, their predictions for the Oregon coast would beuncertain. For example, while it can beexpected that there would be sediment
accumulation in the shadow zone of a wavefarm, it is doubtful whether one could predictwith confidence whether that sediment wastransported there by shelf currents modified bythe array, or was carried offshore from the ocean beach.
The range of beach processes can beexpected to be directly affected by theinstallation of a wave farm, as most of those processes in shallow water are driven by theheights and energies of the waves (Komar
1998). With a reduction in wave heights on the beaches, surf-zone widths could be significantlyreduced from their natural widths. Themagnitudes of the longshore currents and sand-transport rates could also experience reductions because they depend on the heights of the breaking waves. As indicated above, changes inwave refraction and shoaling would affect theangles at which the waves break on the beaches,
also altering the nearshore currents and sand-transport rates, and in some instances even their directions along the shore. This potentiallycould produce significant shifts in the shorelines,with erosion focused along some stretches of beach and accumulation of eroded transported
sand widening other stretches of beach.
Only recently have researchers begun toanalyze the consequences of the energyreductions by a wave farm, having extended theanalyses to the shore to assess the wave-heightreductions. Miller et al. (2007) have undertakensuch investigations, though still limited in scope:analyses of the potential impacts of the futuredevelopment of the Wave Hub system off thecoast of southwest England. The proposed sitewould be at a depth of 50 to 60 meters, but well
offshore, some 20 kilometers seaward of St. IvesBay, Cornwall. The objective of their study wasto estimate how much the shoreline waveclimate would be changed; specifically, theanalyses were for the 10-meter water depthcontour, but did not actually address the effectson the beaches (even though “the sensitivity of shoreline change” is part of the title of their paper). In many respects their investigation wascomparable to that of Venugopal and Smith(2007) discussed above, having focused on themagnitudes and patterns of the combined wave
diffraction and refraction of the reduced wavesin the shadow zone as the waves move towardthe coast. The analyses by Miller et al. (2007)were again for a hypothetical wave farm, because it has not been determined whichextraction-unit technology will be used. The primary advance of their study was that their analyses included the full range of wave heights, periods, and directions for the coast of Cornwall,with results provided for the wave-heightreductions at the 10-meter depth for nearly a100-kilometer length of that coast. Their overall
conclusion was that the wave-height reductionswould be small, and “There is little cause for concern that effects introduced by the Wave Hubwill be felt by shoreline users of the sea.”(Miller et al. 2007, p. 900). However, thisconclusion cannot be extended to all wavefarms, it largely being the result of the 20-kilometer offshore distance of the proposedWave Hub site. Their investigation does serve

8/3/2019 Wave Energy NOAATM92
http://slidepdf.com/reader/full/wave-energy-noaatm92 181/186
169
as an example of the types of analyses that areneeded to assess the potential impacts of a wavefarm on a coast, but it is also necessary toconsider the changes in the range of beach processes and the potentially induced shorelineerosion.
It can be expected that there will beconsequences from the construction andoperation of wave farms to people who livealong the coast and those who visit for recreation. There likely will be positivereactions by some individuals to the prospects of the reduction in wave energies at the shore, particularly those who own shore-front properties and believe that this will reduce their threat of erosion by winter storms. That broadlywill be the case, but as noted above, in detail the
changes in wave energies and beach widths will be more complex than that simple view.Furthermore, there can be expected to beimpacts that are more definitely negative. In particular, the reduction in wave heights will not be welcomed by most surfers. The existence of high-energy surf is also important to the mixingand dilution of pollutants that reach thenearshore, with the seaward-directed rip currentsflushing them offshore. With coastal pollutionincreasingly becoming a problem along theOregon and Washington shores, it could be
exacerbated by the reduction in wave-energylevels. Significant negative impacts could alsooccur along the rocky shores, to the tidepool lifethat is adapted to the presence of high waves anddepends on their oscillations and wave-drivencurrents for the delivery of food and dispersal of their larvae (discussed in other sections of thisreport).
It is our conclusion that the potentialimpacts of wave-energy extraction to the physical environment could be extensive. It is
important that research be directed toward these possible consequences, drawing on the studies being undertaken on other coasts, as well asalong the shores of Oregon and Washington.
Monitoring the environmental responses
Extreme waves and currents will beexperienced by wave farms developed along the
coast of the Pacific Northwest, with theenvironmental responses likely exceeding those produced by installations on other coasts. Thiswill place special demands on their designs, andas discussed here, require the implementation of a program to document the resulting
environmental responses. Such a programwould be more than simple “monitoring”— instead it should be viewed as being an“experiment,” conducted so that future designscan benefit from the experiences at thedeveloped wave-farm sites and reduce impactsto the physical environments and ecosystems.
The wave farm designs for the Pacific Northwest, as elsewhere, will be based in large part on numerical models. It was seen in theabove review that the models applied thus far
have focused on analyses of the wave diffractionand refraction, beginning with the reduced waveheights after a significant portion of their energyhas been extracted, and following the waves asthey move toward the shore. For the most partthose wave models should yield reasonableresults when applied to the Pacific Northwest.However, as discussed by Venugopal and Smith(2007), problems remain if the analyses need toinclude the dynamics of the energy-extractionunits, as would be the case when the unitsconsist of buoys whose motions have a feedback
effect on the waves. This may be important onthe Pacific Northwest coast in that energy-extracting buoys are likely the most viabletechnology.
Applications of wave diffraction/refractionnumerical models require accurate data on water depths, the bathymetry of the seafloor. This isseldom available from surveys along the Pacific Northwest coast with the desired accuracy andof recent vintage, particularly for theintermediate water depths from 50 meters to the
shore and including profiles of the beaches at thesite of interest. Hence, the program of datacollection in any proposed development siteneeds to be initiated during the design stage tosupply the required depth surveys and preconstruction data that is also needed for comparisons with the environmental changesthat occur following construction.

8/3/2019 Wave Energy NOAATM92
http://slidepdf.com/reader/full/wave-energy-noaatm92 182/186
170
Particularly problematic in the design process will be the use of numerical modelsapplied to analyze the transport of sediment bythe modified waves and currents, to predict areasof seafloor erosion or sediment accumulation.As discussed above, in general the application of
such models is a challenge with the resultsuncertain, being even more so in applications tothe Pacific Northwest due to the extreme energylevels of the processes, well above thoseincluded in the testing and calibration of themodels. This includes the models applied to the processes and morphologic responses of thePacific Northwest beaches. Our experience isthat their results may be particularly unreliable,since the physics of the processes on these high-energy, low-sloping (dissipative) beaches differ significantly from laboratory wave tanks and
low-energy beaches (e.g., U.S. East Coast andEuropean) where those models have been tested.
As things stand there will be significantlevels of uncertainty in the design of wave farmsto be constructed in the Pacific Northwest. It istherefore important that the ensuing responses of the environments be carefully documented, atleast for the first few developments that willserve as tests of the designs and impacts. Inview of this importance we considered whatwould be needed to document the changes in the
processes and environmental responses, thescope of a monitoring program. Thisconsideration was directed specifically towardthe wave farm being proposed for developmentat Reedsport, because it is expected to be thefirst, though our recommended “experiment”could have been directed toward any proposedwave farm in the Pacific Northwest.
The components of the experiment aredepicted schematically in Figure 2. The depthcontours represent 10-meter increments, with the
rectangular box being the aerial extent of the proposed energy-extraction array. The criticalcomponent of the recommended measurement program is directed toward a documentation of the waves and currents in the sheltered lee of thewave farm, guided at this stage by the modelresults in Figure 1 and to be refined once similar analyses have been completed specifically for this development site. From the complex
patterns of the reduced waves seen in Figure 1, itis apparent that the wave-measurement sites inFigure 2 need to span what is expected to be theapproximate width of the expanding wave-diffraction zone shoreward of the wave farm.An additional two sites up- and down-coast from
the diffraction zone are included to measure thenatural changes in waves and currents beyondthe impacts of the proposed wave farm. Eachdata-collection system would be equipped tomeasure wave heights, periods, and directions athourly intervals, the times corresponding tomeasurements being collected in deep water offshore by the National Data Buoy Center of NOAA.
In addition to measuring the waves at eachof these sites, the mean currents also need to be
measured to determine the extent to which theyare modified by the drag of the array of multiple buoys. Two of the data-collection systems inFigure 2 are designated for measuring water temperatures and salinities, relevant tointerpretations of the origins of the measuredmean currents and potential changes in theupper-ocean structure. The data derived fromthis core set of measurements would befundamental to documenting the effects of thewave farm on ocean processes, and would serveas the basis for analyses of the resulting
environmental (and biological) alterationsexperienced at this site.
Accompanying this documentation of thechanges in waves and currents would be surveysof the altered seafloor bathymetry and bottomsediments. Surveys of the water depths canrealistically be undertaken only with personalwatercraft (jet-skis), because the depths rangefrom 50 meters offshore to the shallow-water surf of the beaches. The use of jet-skis in suchsurveys has been shown to yield good
bathymetric data, including that in studies alongthe Oregon and Washington coasts (Ruggiero etal. 2005). Surveys of the dry portions of the beaches are also needed, and thanks to the recentdevelopment of Global Positioning System(GPS) survey technologies this can beaccomplished at relatively little expense. The beach surveys can extend to wading depths,overlapping with the jet-ski surveys, but

8/3/2019 Wave Energy NOAATM92
http://slidepdf.com/reader/full/wave-energy-noaatm92 183/186
171
Figure 2: Sketch of the recommended monitoring program directed toward the proposed wave farm at
Reedsport, Oregon.
undertaken at least on a monthly basis toaccount for the seasonal cycles in beach profilesexperienced along the Pacific Northwest coast(Komar 1997). As noted above, surveysoffshore and on the beaches need to be initiated prior to the construction of the wave farm, in
order to document the natural conditions beforedevelopment.
Figure 2 includes a sampling program for the periodic collection of seafloor sediments, todocument their changes in response to theconstruction of the wave farm. Data would berelated to the altered seafloor bathymetry and provide evidence for whether the sedimentsource was offshore or from the landward beaches. Such a sampling program is alsoexpected to be important to investigations of
potential changes in the bottom fauna, so anysampling program needs input from marine biologists; that shown in Figure 2 is only atentative suggestion. If in the design stage theanalyses indicate that significant degrees of seafloor erosion or sediment accumulation can be anticipated from the construction of the wavefarm, it is recommended that several cores becollected across the study area, to be analyzed to
determine the site’s long-term history of sedimentation (hundreds of years to a thousandyears).
There are additional components in Figure 2that if included in the monitoring would
considerably improve documentation of theeffects of the wave farm on the physicalenvironment. First, radar measurements of water currents, based on analyses of the effect of currents on wave advance, have demonstratedthat this technology can provide detaileddocumentation of the water currents across theentire area, beyond the few sites where directmeasurements from in situ data-collectionsystems are obtained (McGregor et al. 1998,Bell et al. 2004, Kosro 2005). Also depicted isthe inclusion of a video tower, the analyses of
video records having become common for measuring beach processes (e.g., longshore-current velocities and runup levels of waves atthe shore). This technique can also providedocumentation of the changing bathymetry of the beaches, especially needed during stormswhen wave energies are too extreme for jet-skisurveys (Holland et al. 1997, Holman andStanley 2007).

8/3/2019 Wave Energy NOAATM92
http://slidepdf.com/reader/full/wave-energy-noaatm92 184/186
172
We believe it is imperative that monitoringand experiments as outlined here be undertakenat the first few sites developed along the Pacific Northwest coast. The estimated costs of such anundertaking would be relatively minor incomparison with the costs of design and
construction. At the same time the demands andcomplexity of such an undertaking should not beunderestimated; a team of experiencedinvestigators will be required.
Summary and discussion
At this stage in the development of wavefarms along the shores of the Pacific Northwestwe are close to “flying blind.” There has beenlittle experience in the design, construction, andoperation of such systems along the world’s
coastlines, so we have little to guide us on thePacific Northwest coast. To date detailedconsideration and analyses of the potentialenvironmental impacts of wave energyextraction have been minimal during the designstage, but what few analyses have beencompleted imply that they could be significant.Most lacking is documentation of the impacts of constructed prototypes on the physical (and biological) environments, although it isunderstood that monitoring of European sites isunderway. Therefore, the development of wave
farms along the Pacific Northwest coast should proceed with caution. During the design process, analyses should include projections of the potential environmental consequences, and prior to and following construction theinstallation should be monitored through theimplementation of a data-collection programalong the lines of that depicted in Figure 2.
Specific findings of this review of the potential changes in the physical environmentinclude the following:
• Numerical models of the wave reduction by wave farms indicate that waveheights in the sheltered lee of thestructure could be significantly lowered,and the patterns of diffraction andrefraction of the waves as they movetoward the shore would be complex,extending for at least 10 kilometers with
consequences to the beaches (bothnegative and positive).
• There is a need for field investigationsof the environmental changes that resultfrom the construction of wave farms.
This is critical for wave farmsconstructed on the coast of the Pacific Northwest, due to its extreme waves andcurrents and the fairly unique processesand responses of its beaches.
• Based on evidence from numericalmodels that have analyzed wavereductions shoreward of typical wavefarms (Venugopal and Smith 2007,Miller et al. 2007), it is probable thatlowered waves will be experienced onthe beaches of the Pacific Northwest,
affecting a range of natural processesand the recreational activities of beachvisitors.
The high wave energy along the shores of the Pacific Northwest has considerable potentialas a renewable resource. On the other hand,there are potential environmental consequences,especially when those developments achievetheir fully planned-for extents, with each wavefarm potentially consisting of hundreds of energy-extracting units extending for kilometersalong the shore. It is important that we have a better understanding of these potentialconsequences before the implementation of whole-scale deployment along the Pacific Northwest coast. To accomplish this, a dialogneeds be established between the developers of the proposed wave farms, specifically their engineers and scientists responsible for thetechnical analyses, and experts in those areasavailable at the state universities andgovernment agencies. There is considerableexperience available from those local experts,including applications of the most advancednumerical models available for analyses of theeffects of a wave farm on the waves andcurrents, the collection and analysis of field datafor the waves and currents, and investigations of the sediment and morphology responses on thecontinental shelf and beaches. As reviewedhere, the development of a wave farm is acomplex technological undertaking with

8/3/2019 Wave Energy NOAATM92
http://slidepdf.com/reader/full/wave-energy-noaatm92 185/186
173
uncertain environmental consequences. It isimportant that we work together to address theseissues.
Literature Cited
Allan, J. C., and P. D. Komar. 2006. Climatecontrols on US West Coast erosion processes. J.Coastal Res. 22:511–529.
Bell, P. S., J. J. Williams, S. Clark, B. D. Morris, andA. Vila-Concejo. 2004. Nested radar systemsfor remote observations. J. Coastal Res. SpecialIssue 39.
Holland, K. T., R. A. Holman, T. C. Lippmann,J. Stanley, and N. Plant. 1997. Practical use of video imagery in nearshore oceanographic fieldstudies. J. Ocean Eng. 22:81–92.
Holman, R. A., and J. Stanley. 2007. A history andtechnical capabilities of Argus. Coast. Eng.54:477–491.
Komar, P. D. 1997. The Pacific Northwest Coast:Living with the shores of Oregon andWashington. Duke University Press, Durham,
North Carolina.
Komar, P. D. 1998. Beach processes andsedimentation. 2nd edition. Prentice Hall, NewJersey.
Kosro, P. M. 2005. On the spatial structure of coastal circulation off Newport, Oregon, duringspring and summer 2001 in a region of varyingshelf width. J. Geophys. Res. 110:C10S06,Online at http://dx.doie.ort [DOI number 10.1029/2004JC002769, accessed 1 March2008].
McGregor, J. A., E. M. Poulter, and M. J. Smith.1998. S band Doppler radar measurements of
bathymetry, wave energy fluxes, and dissipationacross an offshore bar. J. Coastal Res.103:28779–18789.
Miller, D. L., H. C. M. Smith, and D. E. Reeve.2007. Modelling analysis of the sensitivity of shoreline change to a wave farm. Ocean Eng.34:884–901.
Ruggiero, P., G. M. Kaminsky, G. Gelfenbaum, and
B. Voight. 2005. Seasonal to interannualmorphodynamics along a high-energy dissipativelittoral cell. J. Coastal Res. 21:553–578.
Venugopal, V., and G. H. Smith. 2007. Waveinvestigation for an array of wave power devices. In Proc. 7th European Wave and Tidal EnergyConference, Porto, Portugal, 11–13 September 2007.

8/3/2019 Wave Energy NOAATM92
http://slidepdf.com/reader/full/wave-energy-noaatm92 186/186