wave 4 - trinity college dublin · email: [email protected] website: isbn: 978-1-907894-22-0. ... trends...
TRANSCRIPT
Wellbeing and Healthin Ireland’s over 50s2009-2016
Wave
4

Towards making Ireland the bestplace in the world to grow old.
Le go mbeidh Éire ar an tír is fearrar domhan le dul in aois ann.
Cover artwork - Mercers Institute for Successful Ageing, ‘Tír na nÓg’ mural by Desmond Kinney.

Wellbeing and Healthin Ireland’s over 50s
2009-2016
Editors:
Niall Turner1, Orna Donoghue1, and Rose Anne Kenny1
Contributors:
Daniel Carey1, Orna Donoghue1, Sarah Gibney2, Joanne Feeney1,
Rose Anne Kenny1, Eamon Laird1, Christine McGarrigle1, Sinead McLoughlin1,
Triona McNicholas1, Irene Mosca1, Charles Normand3,
Aisling O’Halloran1, Mary O’Shea1,Lorna Roe1,3,4,
Siobhan Scarlett1, Katie Tobin1,4, Stephen Thomas3,
Dominic Trepel1,4, Niall Turner1, Mark Ward1.
1. The Irish Longitudinal Study on Ageing, Trinity College Dublin;
2. Department of Health
3. Centre for Health Policy and Management, Trinity College Dublin
4. Global Brain Health Institute
On behalf of the TILDA team
November 2018

Copyright © The Irish Longitudinal Study on Ageing 2018
The Irish Longitudinal Study on Ageing
Chemistry Extension Building
Trinity College Dublin
Dublin 2
Republic of Ireland
Tel: +353 1 896 2509
Email: [email protected]
Website: www.tilda.ie
ISBN: 978-1-907894-22-0

Acknowledgements
The principal investigator Professor Rose Anne Kenny and co authors would like to thank
the funders of TILDA - Atlantic Philanthropies, Department of Health, the Health Research
Board and Irish Life. The views expressed in this report are not necessarily those of the
funders, and responsibility for any errors or omissions rests with the authors alone.
The authors are extremely grateful to the members of the TILDA Scientific Advisory Board,
Oversight Board, Steering Committee and Executive Committee, who provide invaluable
advice on the design, implementation and strategic objectives of TILDA. Members of these
groups are listed below.
A large number of individuals were involved in the preparation of this Report. The fieldwork
for Wave 4 was conducted by Behaviour and Attitudes, who co-ordinated an experienced
team of dedicated interviewers. Particular thanks to TILDA team members, Margaret
Harkin, Oscar James, Deirdre O’Connor, Kevin Organ, Silvin Knight, Belinda Hernandaz,
Louise Newman and John O’Connor for their work in preparing the final report for
publication.
Finally, and most importantly, we would like to thank our valued participants. Without their
time and effort, neither this Report nor the resource for future research offered by TILDA
would be possible.
Scientific Advisory Board
Dr. James Smith, Professor John C Henretta, Professor Finbarr Martin, Professor David
Weir, Professor Ian Young, Professor Andrew Steptoe, Professor Carol Brayne, Dr. Robert
Clarke, Dr. Elaine Douglas, Professor James Banks, Professor Axel Boersch-Supan,
Professor James Nazroo, Professor Stacy Tessler Lindau, Professor Aartjan Beekman.
Professor Carol Ryff, Professor Anne Newman, Professor Lisa Berkman, Dr. Bernadette
McGuinness
Oversight Committee
Mr. Brendan McEvoy, Ms. Helen McDonald, Professor Rose Anne Kenny, Dr. Teresa
Maguire, Dr. Ann Hever, Mr. Niall Turner, Mr. Brendan Touhy, Professor Hannah McGee,
Dr. Roger O’Sullivan, Ms. Mairead Creed, Dr. Breda Smyth, Professor James Wickham,
Professor Martina Hennessy, Mr. Maurice O’Connell, Mr. Muiris O’Connor, Ms. Orla
O’Hanlon, Dr. Orna Donoghue.
Steering Committee
Ms. Celine Brosnan, Dr. Hilary Cronin, Dr. Orna Donoghue, Ms. Lucy Doogan, Professor
Tom Fahey, Professor Louise Gallagher, Dr. Ann Hever, Professor Anne Hickey, Professor
Patricia Kearney, Professor Frank Kee, Professor Rose Anne Kenny, Professor Richard
Layte, Professor Mary McCarron, Professor Anne Nolan, Professor Charles, Normand,
Dr. Zhanna O’Clery, Professor Philip O’Connell, Professor Richard Reilly, Mr. Niall Turner,
Dr. Kieran Walsh.
Executive Committee
Professor Charles Normand, Dr. Orna Donoghue, Ms. Lucy Doogan, Dr. Ann Hever,
Professor Rose Anne Kenny, Professor Richard Layte, Dr. Zhanna O’Clery, Professor
Stephen Thomas, Mr. Niall Turner.

Contents
Key Findings ............................................................................................................. 1
1. Introduction ........................................................................................................... 9
Rose Anne Kenny, Niall Turner and Orna Donoghue
2. Methodology ....................................................................................................... 17
Dan Carey
3. Quality of Life and relationships ......................................................................... 25
Christine McGarrigle and Mark Ward
4. Volunteering and social participation .................................................................. 47
Mark Ward, Sarah Gibney and Irene Mosca
5. Living conditions of adults in Ireland................................................................... 65
Sinead McLoughlin and Siobhan Scarlett
6. Change in chronic disease prevalence and health behaviours over the first four waves of TILDA ...................................................................... 89
Triona McNicholas and Eamon Laird
7. Frailty ................................................................................................................ 117
Aisling O’Halloran and Mary O’Shea
8. Cognitive change over time .............................................................................. 135
Joanne Feeney and Katy Tobin
9. Trends in healthcare cover and healthcare use for older adults in Ireland during the austerity years of 2009 to 2016 ....................................................... 151
Lorna Roe, Steve Thomas, Dominic Trépel and Charles Normand
List of Tables2 Methodology
Table 2.1: Questions and measures included in assessments at wave 4 ������������������������������������������ 19
Table 2.2: Wave 4 CAPI self-interview response rates (%, n), by age and gender ����������������������������� 20
Table 2.3: Reasons for sample attrition ���������������������������������������������������������������������������������������������� 20
Table 2.4: Wave 4 SCQ response rates (%, n) by age and gender ���������������������������������������������������� 21
3 Quality of Life and relationships
Table 3.1: Quality of life domains ������������������������������������������������������������������������������������������������������� 28
Table 3.2: Quality of life by marital status and gender ������������������������������������������������������������������������ 31
4 Volunteering and social participation
Table 4.1: Quality of life (CASP-12) and depressive symptoms (CES-D8) by volunteering
and age group ������������������������������������������������������������������������������������������������������������������� 54
Table 4.2: Mean quality of life (CASP-12) and CES-D8 depression scores by active and
social leisure activities, and organised groups, by age group ������������������������������������������ 55
Table 4.3: The percentage of older adults who volunteer, participate in active and social
leisure activities, and participate in organised groups, pre- and post-retirement ��������������� 60
Table 4.4: The percentage of older adults who volunteer or participate in active and social
leisure activities or participate in organised groups, pre- and post-retirement ������������������� 61
5 Living conditions of adults in Ireland
Table 5.1:Modifications to home stratified by age, construction date,
disability and self-rated health �������������������������������������������������������������������������������������������� 70
Table 5.2:Classification of problematic housing condition categories ������������������������������������������������ 71
Table 5.3:Change in number of reported problematic housing conditions between Wave 3
and Wave 4 ������������������������������������������������������������������������������������������������������������������������ 72
Table 5.4:Problematic housing condition by age group, location and construction date �������������������� 74
Table 5.5 Changes in problematic housing conditions in the population
between Wave 3 and Wave 4 ��������������������������������������������������������������������������������������������� 75
Table 5.6:Statements used for measuring neighbourhood social cohesion ��������������������������������������� 78
Table 5.7. Demographic characteristics of neighbourhood social cohesion tertiles ���������������������������� 79
Table 5.8. Proportion of social integration by neighbourhood social cohesion tertiles ������������������������ 80
6 Change in chronic disease prevalence and health behaviours over the first
four waves of TILDA
Table 6.1:Self-rated health at Waves 1 to 4, by age group �������������������������������������������������������������� 108
Table 6.2:Prevalence of cardiovascular disease at Waves 1 to 4, by sex ���������������������������������������� 109
Table 6.3: Prevalence of cardiovascular disease at Wave 1 to Wave 4, by age group ��������������������� 110
Table 6.4 Prevalence of non-cardiovascular chronic conditions, falls and fractures at Wave 1
to Wave 4, by age group ���������������������������������������������������������������������������������������������������111
Table 6.5: Prevalence of non-cardiovascular chronic conditions, falls and fractures at Wave 1
to Wave 4, by age group in men ��������������������������������������������������������������������������������������� 112

Table 6.6: Prevalence of non-cardiovascular chronic conditions, falls and fractures at Wave 1
to Wave 4, by age group in women ���������������������������������������������������������������������������������� 113
Table 6.7:Smoking status at Wave 1 to Wave 4, by age group �������������������������������������������������������� 114
Table 6.8:Problem alcohol use at Wave 1 to Wave 4, by age group ������������������������������������������������ 115
Table 6.9:Proportion of adults who walked ≥150 minutes per week at Wave 1 to Wave 4,
by age group��������������������������������������������������������������������������������������������������������������������� 116
7 Frailty
Table 7.1: Prevalence of frailty status (robust, pre-frail and frail) at Waves 1, 2, 3 and 4
using the FI measure �������������������������������������������������������������������������������������������������������� 121
Table 7.2: Incidence of frailty status (robust, pre-frail and frail) at Waves 2, 3 and 4 if robust
at Wave 1 using the FI measure� �������������������������������������������������������������������������������������� 121
Table 7.3:Incidence of transitions in frailty status (robust, pre-frail and frail) between Waves
1 and 4 using the FI measure (n = 5,304) ������������������������������������������������������������������������ 122
Table 7.4:Age and frailty at Waves 1 - 4 using the FI measure (n = 5,304) ������������������������������������� 122
Table 7.5:Gender and frailty at Waves 1 - 4 using the FI measure (n = 5,304) ������������������������������� 123
Table 7.6: Highest level of educational attainment and frailty at Waves 1 - 4 using the
FI measure (n = 5,304)� ���������������������������������������������������������������������������������������������������� 123
Table 7.7: Marital status and frailty at Waves 1 - 4 using the FI measure (n = 5,304) ���������������������� 124
Table 7.8: Falls outcomes and frailty at Waves 1 - 4 using the FI measure (n = 5,304) ������������������� 126
Appendix
Table 7.9:Components of 32-item FI based on TILDA CAPI variables from Waves 1-4 ����������������� 134

8 Cognitive change over time
Table 8.1:Verbal fluency score across Waves 1-4, by persistent self-rated memory decline����������� 147
9 Trends in healthcare cover and healthcare use for older Irish adults during
the austerity years of 2009 to 2016
Table 9.1:Timelines for data collection at each wave ���������������������������������������������������������������������� 156
Table 9.2:Proportion of older adults with additional health cover
between 2009 and 2016 by age group ���������������������������������������������������������������������������� 159
Table 9.3:Proportion of older adults who purchased private health insurance
between 2009 and 2016 by age group ���������������������������������������������������������������������������� 160
Table 9.4: Proportion of older adults with public or private healthcare coverage
between 2009 and 2016 by age group ����������������������������������������������������������������������������� 162
Table 9.5Proportion of older adults visiting each service in the previous year
between 2009 and 2016 by their frailty status ����������������������������������������������������������������� 164
Table 9.6:Average number of times each older adult visited a service in the previous year between
2009 and 2016 by their frailty classification ��������������������������������������������������������������������� 165
Table 9.7:Proportion of older adults visiting each service in the previous year between 2009 and
2016 by their frailty status ������������������������������������������������������������������������������������������������ 167
Table 9.8: Proportion of older adults visiting each service in the previous year between 2009 and
2016 by their frailty status ������������������������������������������������������������������������������������������������ 169
Table 9.9:Proportion of the home help service allocated to older adults with different levels and types
of disabilities between 2009 and 2016 ����������������������������������������������������������������������������� 170
Appendices
Table 9.10 Aggregate number of home help clients, older adults aged 50 years and older and older
adults aged 85 years and older between 2006 and 2016 ����������������������������������������������� 175

Table 9.11Changes in healthcare coverage between 2009 and 2018 (Source: authors own based on
a previous version by Nolan et al, 2014) �������������������������������������������������������������������������� 176
Table 9.12The 32 items which formed the Frailty Index used in this Chapter ����������������������������������� 177

List of Figures2 Methodology
Figure 2.1: CAPI response rates (%) across waves, by baseline age and gender ����������������������������� 21
3 Quality of life and relationships
Figure 3.1:Changing trajectories of quality of life between Waves 1 and 4 ���������������������������������������� 29
Figure 3.2:Quality of life between Wave 1 and Wave 4 by age group and gender ����������������������������� 29
Figure 3.3:Quality of life between Wave 1 and Wave 4 by gender, educational attainment and age
group ���������������������������������������������������������������������������������������������������������������������������������� 30
Figure 3.4:Changing quality of life by number of chronic conditions Wave 4 and Wave 1, by
gender ������������������������������������������������������������������������������������������������������������������������������� 32
Figure 3.5:Mean number of IADL limitations in Wave 1 to Wave 4, by age group and sex ���������������� 33
Figure 3.6:Mean number of ADL limitations in Wave 1 to Wave 4, by age group and sex ����������������� 34
Figure 3.7:Quality of life by IADL limitations Wave 1 and Wave 4 by gender ������������������������������������� 34
Figure 3.8:Quality of life by increasing ADL limitations Wave 1 and Wave 4 by gender �������������������� 35
Figure 3.9:Quality of life by social integration score Wave 1 and Wave 4 by gender ������������������������� 36
Figure 3.10:Quality of life by positive relationship with friends by gender �������������������������������������������� 37
Figure 3.11:Change in quality of life between Wave 1 and Wave 4, by age and gender ��������������������� 38
Figure 3.12:Change in IADL limitations between Wave 1 and Wave 4 , by age group and gender ����� 39
Figure 3.13:Change in ADL limitations between Wave 1 and Wave 4, by age group and gender ������� 39

Figure 3.14:Change in quality of life by changing IADL limitations between Wave 1 and Wave 4
by gender ��������������������������������������������������������������������������������������������������������������������������� 40
Figure 3.15:Change in quality of life by changing ADL limitations between Wave 1 and Wave 4
by gender ��������������������������������������������������������������������������������������������������������������������������� 40
Figure 3.16:Change in quality of life by changing number of IADL limitations Wave 1 to Wave 4,
by level of social integration and gender ��������������������������������������������������������������������������� 40
Figure 3.17:Change in quality of life by changing number of ADL limitations Wave 1 to Wave 4,
by level of social integration and gender ��������������������������������������������������������������������������� 41
Figure 3.18:Changing quality of life scores with changing IADL limitations between Wave 1 and
Wave 4, the moderating effects of positive supportive relationships with friends �������������� 42
Figure 3.19:Changing quality of life scores with changing ADL limitations between Wave 1 and
Wave 4, the moderating effects of positive relationships with friends ������������������������������� 43
4 Volunteering and social participation
Figure 4.1:Frequency of volunteering, by gender and age group ������������������������������������������������������� 51
Figure 4.2: Proportion (%) of older people who participated in active and social leisure activities and
organised groups, by gender and age group �������������������������������������������������������������������� 52
Figure 4.3: Proportion (%) of older people who volunteered weekly at each wave by gender and age
group ��������������������������������������������������������������������������������������������������������������������������������� 56
Figure 4.4: Proportion (%) of older people who engaged in active and social leisure activities at each
wave by gender and age group ����������������������������������������������������������������������������������������� 57
Figure 4.5: Proportion (%) of older people who participated in organised groups at each wave by
gender and age group ������������������������������������������������������������������������������������������������������� 58
Figure 4.6: Proportion (%) of older adults moving from employment to retirement between waves 1
and 4 by gender and age group ���������������������������������������������������������������������������������������� 59

5 Living conditions of adults in Ireland
Figure 5.1 Percentage of heating difficulties by central heating and location ������������������������������������� 76
Figure 5.2 Percentage of heating difficulties by self-rated health ������������������������������������������������������� 77
Figure 5.3: Self-rated health, by tertiles of neighbourhood social cohesion ���������������������������������������� 81
Figure 5.4: Mean depressive symptoms score (CES-D8) by neighbourhood social cohesion tertiles
and location ����������������������������������������������������������������������������������������������������������������������� 82
Figure 5.5: Mean anxiety symptoms (HADS-A) by neighbourhood social cohesion tertiles
and location ����������������������������������������������������������������������������������������������������������������������� 83
Figure 5.6 Mean quality of life score (CASP-12) by neighbourhood social cohesion tertiles
and location ����������������������������������������������������������������������������������������������������������������������� 84
6 Change in chronic disease prevalence and health behaviours over the first
four waves of TILDA
Figure 6.1: Self-rated health across waves by age group ������������������������������������������������������������������� 92
Figure 6.2. Self-rated health by participation in social clubs, church groups, charitable bodies or
other community groups at Wave 4 ����������������������������������������������������������������������������������� 93
Figure 6.3: Self-rated health by volunteering status at Wave 4 ����������������������������������������������������������� 93
Figure 6.4: Self-rated health by caring status at Wave 4 ��������������������������������������������������������������������� 94
Figure 6.5: Prevalence of cardiovascular conditions from Waves 1 to 4 ��������������������������������������������� 95
Figure 6.6: Incidence of newly reported cardiovascular conditions at Waves 2, 3 and 4 �������������������� 96
Figure 6.7. Prevalence of non-cardiovascular conditions across the four waves �������������������������������� 97
Figure 6.8. Incident non-cardiovascular conditions at Waves 2, 3 and 4 �������������������������������������������� 98

Figure 6.9: Proportion of sample who reported a fall – ever, in the last year or recurrent - from
Wave 1 to Wave 4 ������������������������������������������������������������������������������������������������������������� 99
Figure 6.10. Proportion of current smokers from Waves 1 to 4, by sex and age group ���������������������� 100
Figure 6.11: Prevalence of alcohol intake per week at Wave 4, by age group and sex ���������������������� 101
Figure 6.12: Prevalence of problematic alcohol use from Waves 1 to 4, by sex and age group ��������� 102
Figure 6.13: Proportion of older adults walking 150 minutes or more per week at each wave,
by sex and age group ������������������������������������������������������������������������������������������������������ 103
7 Frailty
Figure 7.1: Living arrangement and frailty at Waves 1 - 4 using the FI measure (n = 5,304) ������������ 125
Figure 7.2: Fear of falling and frailty at Waves 1 - 4 using the FI measure (n = 5,304) ��������������������� 126
Figure 7.3: Disability at Waves 1 - 4 using the FI measure (n = 5,304) ��������������������������������������������� 127
Figure 7.4: Global cognitive function (MMSE score, maximum score =30) by frailty at Waves
1 - 4 using the FI measure (n = 4,308) ���������������������������������������������������������������������������� 128
Figure 7.5: Depressive symptoms (CES-D8 score, maximum score =24) by frailty at Waves
1 - 4 using the FI measure (N=5,217)� ���������������������������������������������������������������������������� 129
8 Cognitive change over time
Figure 8.1: Measures of cognitive function in the TILDA CAPI ��������������������������������������������������������� 137
Figure 8.2:Immediate word recall total score across Waves 1 to 4, by age group at baseline ��������� 139
Figure 8.3. Delayed word recall score across Waves 1 to 4, by age group and sex ������������������������� 140
Figure 8.4:Verbal fluency score across Waves 1 to 4, by age group and education level ��������������� 141

Figure 8.5: Percentage of older adults who were successfully completed the prospective memory task
across Waves 1 to 4, by age group ��������������������������������������������������������������������������������� 142
Figure 8.6: Mini-Mental State Exam (MMSE) score across Waves 1 to 4, by age group ������������������ 143
Figure 8.7: Verbal fluency score across Waves 1 to 4, by level of social integration at Wave 1 ������� 144
Figure 8.8: The percentage of older adults with fair/poor self-rated memory, at Waves 1 and 4, by age
group and sex ������������������������������������������������������������������������������������������������������������������� 145
Figure 8.9: Delayed word recall score across Waves 1 to 4, by persistent self-rated memory
decline ������������������������������������������������������������������������������������������������������������������������������ 146
Figure 8.10: Mini-Mental State Examination (MMSE) score across Waves 1 to 4, by persistent self-rated
memory decline ���������������������������������������������������������������������������������������������������������������� 147
9 Trends in healthcare cover and healthcare use for older Irish adults during
the austerity years of 2009 to 2016
Figure 9.1Percentage change in the number of home help users, hours of home help care provided,
older adults aged ≥50 years & ≥85 years 2006–2016 ����������������������������������������������������� 154


1
Key Findings
Chapter 2 - Methodology
Key Findings
• A response rate of 84% was achieved with rates largely similar across genders and
was highest in those aged 65-74 years.
• Proxy interviews for those unable to take part in an interview was conducted with 64%
of participants requiring such an approach.
• A return rate of 86% was achieved for the self-completion questionnaire.
Chapter 3 – Quality of life and relationships
Key Findings
• The average quality of life score measured though CASP-12, among TILDA
participants was 27.3 out of 30 in Wave 4. This score suggests that, on average, older
people in Ireland experience a good quality of life.
• Quality of life doesn’t decline linearly with age, but instead increases to a peak at age
68 and then starts to gradually decline, reaching the value observed among 50 year
olds at age 80, decreasing steadily from that age onwards.
• The factors which predominantly influence quality of life are social factors, including
social networks and social activities, while health-related factors like functional
limitations are also important.
• Quality of life decreases with increasing number of chronic health conditions
• Quality of life decreases as the number of activities of daily living (ADL) and
instrumental ADL (IADL) limitations increase.
• Increased social integration, through maintenance of a large social network and
positive supportive relationships with friends is associated with higher quality of life.
Key Findings

2
Wellbeing and Health in Ireland’s over 50s 2009-2016
• One third of women (31%) report positive supportive friendships in Wave 4, compared
to 16% of men, similar to that reported in Wave 1. Relationship quality within social
networks is important, and those who report positive supportive relationships with
friends report higher quality of life relative to those with less supportive relationships.
• Over 21% of TILDA respondents reported the highest level of social integration in
Wave 4, with 39% moderately integrated, 29% moderately isolated and 11% most
isolated, similar to that reported in Wave 1. Men and women reporting highest levels
of social integration had higher mean quality of life scores than those reporting lower
levels of social integration.
Chapter 4 – Volunteering and social participation
Key Findings
• Volunteering and other forms of social participation are important components of
successful ageing.
• Overall, 18% of older adults in Ireland volunteer weekly while 56% have volunteered
at some time over the previous two years. A similar percentage of men and women
volunteer with rates of volunteering highest among the 65 to 74 year old age group.
• Almost three quarters of older adults participate in active and social leisure activities
each week, while 52% participate in organised groups such as sports groups, book
clubs, or charitable organisations.
• Volunteering and participation in both active and social leisure activities and organized
groups are associated with better quality of life and fewer depressive symptoms.
• The percentage of older adults who volunteer at least monthly and who participate in
social and organised activities was consistent across the four waves of TILDA.
• By Wave 4, 28% of participants were in paid employment and 51% were retired.
• Among those who retired over the course of TILDA, there is little evidence of an
increase in their rates of volunteering or social participation immediately after
retirement.
• While rates of social participation are high, efforts to increase volunteering and social
participation among older adults should be encouraged as these activities provide
benefits not only to the participants themselves but to society more generally.

3
Key Findings
Chapter 5 – Living conditions of adults in Ireland
Key Findings
• Adults living in homes constructed prior to 1971 were twice as likely to have added
modifications to their home then those living in newer builds (24-28% vs. 12-13%).
• 19.1% of adults have added modifications to their home, with average costs spent on
these modifications higher in Dublin city or county (E8,574), compared to another town
or city (E5,098) or a rural area (E5,097).
• 57.8% of adults reported problematic housing conditions. 21.6% of adults who reported
three or more problematic housing conditions at Wave 3, reported the same at Wave 4.
• The most prevalent housing condition at Wave 2 was damp, mould or moisture, and
this remains the case at Wave 4 (46.3%).
• There was a decrease of 4.6% in adults reporting problems heating their home from
Wave 3 to Wave 4 possibly attributable to new policy initiatives.
• Similar to findings from Wave 2, there was a large disparity in problems with heating
the home between dwellings in Dublin city or county (50.4%) compared to a rural area
(24.4%).
• Location differences were apparent in reporting of neighbourhood social cohesion.
54.3% of participants living in rural areas reported high neighbourhood social cohesion
compared to 18.6% of participants living in Dublin city or county.
• Adults who report low neighbourhood social cohesion are more likely to report their
health as fair or poor (20%) compared to those who report high neighbourhood social
cohesion (14%).
• Lowest quality of life scores were reported by participants experiencing low neighbourhood
social cohesion living in another town or city (24.8) compared to those living in Dublin city
or county (30.1).
Chapter 6 – Change in chronic disease prevalence and health behaviours over the first four waves of TILDA
Key Findings
• From Wave 1 to Wave 4, there was a decrease in the proportion of people aged 50-64
years (21% to 16%) and 65-74 years (23% to 16%) who rated their health as fair or
poor. Social engagement had a positive impact on self-rated health.
4
Wellbeing and Health in Ireland’s over 50s 2009-2016
• In terms of cardiovascular disease, there was an increased prevalence of hypertension
(35% to 38%), diabetes (8% to 11%), heart attack (4% to 6%), stroke (1% to 2%), and
transient ischaemic attack (2% to 4%) between Waves 1 and 4.
• In terms of non-cardiovascular disease, there was an increased prevalence of arthritis
(26% to 39%), osteoporosis (9% to 17%), cataracts (9% to 14%) and lung disease (4%
to 5%) from Wave 1 to 4.
• Pain affected 1 in 3 people aged 50 and over, and this was consistent at all waves.
• The number of people who reported recurrent falling in the last year increased from
Wave 1 to Wave 4 (7% to 9%).
• The proportion of women aged 50-64 years who reported current smoking decreased
between Waves 1 and 4 (24% to 17%).
• Problematic alcohol use was more prevalent in men than women (15% versus 9% at
Wave 4).
• A large proportion (45% on average) of adults aged 50 and over walked less than
the recommended 150 minutes per week across all four waves. This was particularly
evident in those aged 75 and older.
Chapter 7 – Frailty
Key Findings
• Frailty is a common condition affecting 12.7% of adults aged 50 years and over and
21.5% of people aged 65 and over in Ireland.
• Frailty is a dynamic process that can change over time and people living with frailty can
transition in either direction between the different states of frailty namely robustness,
pre-frailty (an intermediate state) and frailty.
• The prevalence of frailty among women is twice that of men at Wave 4 (24.9% versus
12.6%) and increases with age in both sexes. Frailty is also more prevalent among
people who are living alone, are widowed, and those with lower levels of educational
attainment.
• Frailty is a risk factor for single and recurrent falls, fear of falling and disability among
adults aged 50 and over.

5
Key Findings
• People living with frailty are more likely to experience declines in mental health
including lower levels of cognitive function and higher levels of depressive symptoms.
• Frailty is not inevitable and can be avoided, delayed and reversed with timely and
appropriate interventions.
Chapter 8 – Cognitive change over time
Key Findings
• The majority of older adults continue to perform well on core cognitive tests at an
average follow-up of six years, with only minor decreases in task performance.
• There was a slight decline in verbal memory scores observed over time for adults
aged 65 years and older. Decline was greatest on the 10-word delayed recall task, and
among adults aged 75 and older, who recalled one word less on average at Wave 4
compared to Wave 1.
• Verbal fluency declined across the four waves in adults aged 50 and over. Decline was
most pronounced in individuals aged 75 years and older; on average, they named four
fewer animals at Wave 4 than at Wave 1.
• There was no decline in prospective memory over time in adults aged 50-64 and 65-74
years. However, the success rate for adults aged 75 and older dropped from 53% at
Wave 1 to 40% by Wave 4.
• Older adults who were the most socially integrated at Wave 1 had higher verbal fluency
scores initially than adults who were the most isolated, but this difference did not
persist over time.
• The proportion of adults aged 50 and older who reported that their memory was ‘Fair’
or ‘Poor’ increased from 15% at Wave 1 to almost 20% at Wave 4.
• Seven percent of older adults felt that their memory was continuously declining over
the waves. These individuals also had a slightly larger decrease in delayed word recall,
verbal fluency, and MMSE scores over the four waves.
6
Wellbeing and Health in Ireland’s over 50s 2009-2016
Chapter 9 – Trends in healthcare cover and healthcare use for older adults in Ireland during the austerity years of 2009 to 2016
Key Findings
Following the financial crash in 2008, Ireland entered a period of austerity. This report
examines trends from 2009 to 2016 to explore potential effects of this period in healthcare
cover and healthcare utilisation. Key trends are summarised here:
• The proportion with a medical card increased (from 45% to 53%) but, dropped in the
over 70s (from 90% to 74%). A means testing system for medical card entitlement
for the over 70s was introduced in January 2009 and the threshold decreased during
subsequent Budgets.
• The proportion with a GP visit card increased (from 2% to 9%) and, within the over 70s,
increased substantially (from 1% to 19%) between Waves 1 and 4. A universal GP visit
card for the over 70s was introduced in 2015.
• We did not detect any changes in the rate of purchasing private health insurance
among older adults in Ireland.
• We found an increase in the proportion of older adults in Ireland who visited a range of
medical care services at least once in the previous year including visits to their General
Practitioner (from 87% to 92%), the Emergency Department (15% to 18%) and hospital
admissions (12% to 26%). We detected a marginal increase in the average number of
nights spent in hospital (1.0 to 2.0 nights).
• For older adults with frailty, the proportion with at least one overnight hospital
admission increased (from 23% to 31%) while the average number nights spent in
hospital more than doubled (from 2.7 nights to 6.5 nights). The proportion with at least
one outpatient clinic visit fell (from 69% to 59%) and the average number of outpatient
clinic visits decreased (from 3.1 visits to 2.1 visits).
• Dental care use reduced (from 11% to 9%); though the rate of decline was most
notable for those who were classified as frail (from 17% to 11%).9
• Community services (e.g. respite, day centre, meals on wheels, occupational therapy
or community nursing) are accessed infrequently and we found minimal change in the
utilisation of these services across the waves.

7
Key Findings
• Home help and personal care provision increased marginally (from 3% to 5%)
however, the users of the home help service changed – 19% of users had concurrent
limitations in activities of daily living (ADL) and instrumental activities of daily living
(IADL) in 2010 compared to 41% in 2016. The HSE changed the objective of the home
help service in 2012 from provision of ‘domestic help’ to provision of ‘personal care’.
• Informal care (i.e. care from family or friend) use increased (5% to 9%), and particularly
among older adults with frailty (27% to 36%) between Wave 1 and Wave 4.

Wellbeing and Health in Ireland’s over 50s 2009-2016
8
9
1 Introduction
1 IntroductionRose Anne Kenny, Niall Turner, Orna O’Donoghue
Contents
1.1 TILDA data collection ................................................................................................ 10
1.2 Larger social networks and positive supportive friendships help to maintain quality
of life, even in the presence of increasing disability .................................................. 11
1.3 Volunteering and social participation, which are associated with higher quality
of life and lower depressive symptoms, should be promoted for adults aged
75 years and over . .................................................................................................... 12
1.4 High levels of neighbourhood social cohesion are associated with better mental and
physical health, highlighting the need to target social isolation in older adults ......... 12
1.5 Prevalence of chronic conditions and outcomes such as falls and fracture increase
over time due to advancing age but there are opportunities to improve health
through modifying health behaviours ........................................................................ 13
1.6 Frailty, while common and often associated with negative consequences, is not an
inevitable condition and early recognition of risk factors can help avoid, delay and
reverse frailty ............................................................................................................ 13
1.7 Cognitive function is relatively consistent across the four waves indicating that
participants continue to perform well at Wave 4 ........................................................ 14
1.8 Healthcare utilisation changed in line with changes in health policy ......................... 14
1.9 Conclusion ................................................................................................................ 15
1.10 References . .............................................................................................................. 15

Wellbeing and Health in Ireland’s over 50s 2009-2016
10
The Irish Longitudinal Study on Ageing (TILDA) was designed to provide an evidence-base
for addressing current and emerging issues associated with population ageing in Ireland
across health, economic and social systems. Before the establishment of this study, only
minimal national information was available on the prevalence and incidence of age-related
disease, disability, health service utilisation or economic and social data. TILDA has
changed this landscape, enabling both cross-sectional and longitudinal evidence-based
research. Once the collected data has been thoroughly validated, it is archived for public
access at two sites - the Irish Social Science Data Archive (ISSDA) at University College
Dublin (https://www.ucd.ie/issda/data/tilda/) and the Inter-University Consortium of Political
and Social Research at University of Michigan (https://www.icpsr.umich.edu/icpsrweb/
ICPSR/), thereby maximising analyses in addition to affording opportunities for education
and training of Irish and international researchers.
Given its comprehensive multi-domain, longitudinal design, TILDA provides the essential
research evidence to inform policy and practice, advancements in technology and
innovation, and tailored education and training through an enhanced ageing research
infrastructure in Ireland.
1.1 TILDA data collection
The sampling frame is based on the Irish Geodirectory, a comprehensive and up-to-date
listing and mapping of all residential addresses in the Republic of Ireland. Participants
were randomly selected so that each residential address had an equal probability of
selection. After 4 years of pilot studies to ensure that TILDA achieved highest quality
research standards, baseline interviews with 8,504 participants commenced in 2009.
Eligible participants were community-dwelling adults aged 50 years and over and their
spouses (of any age) who were non-demented and able to provide informed consent.
TILDA represents 1 in 156 people aged 50 and over in Ireland (at Wave 1). Further
details about the study design and initial cohort are available elsewhere (1, 2). The initial
cohort response rate was 62% and follow-up at consecutive waves (every two years) has
maintained a response rate of over 84% (3). Replenishment of the sample aged 50-59
years will commence in 2020 (Wave 6).
There are three components to data collection (i) a computer-assisted personal interview
(CAPI) administered by trained social interviewers in the participants’ own homes (on
average 1.5 hours) which includes detailed questions on socio-demographics, health,
wealth, lifestyle and social support; (ii) a self-completion questionnaire (SCQ) completed
privately by the participant and designed for the collection of more sensitive information
such as alcohol use and relationships and (iii) a comprehensive health assessment carried
out every second or third wave to allow an appropriate time interval to detect subtle

11
1 Introduction
physical and cognitive changes. In Wave 4, the CAPI and SCQ were carried out but not
the health assessment.
Although TILDA is nationally representative of the older community-dwelling population in
Ireland, patterns of response to each component of the study (CAPI, SCQ) vary across
certain subgroups of the sample. Participation in later waves of the study is also influenced
by levels of participation at earlier waves and by sample attrition. To account for these
systematic differences in responses and to ensure that the estimates derived from the
sample remain representative of the target population, weights were calculated and
applied to different analyses to ensure that subgroups within the sample are represented
proportionate to the number of that subgroup present in the population of Ireland.
After each wave, TILDA provides a comprehensive research report (4-6). The Wave
4 report includes current status at Wave 4 and changes that occurred between Wave
1 (conducted in 2009-2011) and Wave 4 (conducted in 2016), in quality of life, social
engagement, physical and brain health, living conditions, health care cover and utilisation.
A consistent theme for this report is the benefit that social engagement, volunteering and
friendships convey on quality of life, mental and physical health and wellbeing.
1.2 Larger social networks and positive supportive friendships help to maintain quality of life, even in the presence of increasing disability
Quality of life reflects the overall wellbeing of an individual. The average quality of life
score in TILDA participants is high (27.3/36 in Wave 4) suggesting that they experience a
good quality of life. It also did not decline linearly with age, but instead steadily increased
to peak at age 68 and then gradually declined, reaching the value observed for 50 year
olds at 80 years of age. Adults who have the highest levels of social integration, such as
large social networks, and positive supportive friendships, reported highest quality of life,
however women are twice as likely to report positive supportive friendships compared to
men (31% versus 16% at Wave 4). Unsurprisingly, increases in chronic health conditions
and disabilities negatively impact quality of life, however higher social integration and
higher supportive friendships moderate the effect of increasing disability on quality of life
between Waves 1 and 4, particularly in men. This highlights the importance of the quality
of social relationships within social support networks for long-term health and wellbeing.
Policies promoting and enabling continued social participation and engagement in older
age could significantly improve health outcomes, enhance healthy and active ageing and
maintain quality of life in ageing populations.

Wellbeing and Health in Ireland’s over 50s 2009-2016
12
1.3 Volunteering and social participation, which are associated with higher quality of life and lower depressive symptoms, should be promoted for adults aged 75 years and over
Social participation, and particularly productive activities such as caregiving, volunteering,
and informal caring, have huge benefits for the health and wellbeing of older adults (7-
9). As previously highlighted by TILDA, volunteering is an important feature of Irish life -
older adults in Ireland have the second highest volunteering rate among the 28 European
Member States after Austria (10). At Wave 4, 18% of adults volunteer at least once per
week while 56% volunteer at least occasionally; volunteering was highest among the 65-
74 year olds. There was little change in the proportion of adults who volunteer between
Waves 1 and 4. In addition, 74% of older adults participate weekly in active and social
activities, although participation levels were lower in those aged 75 and older, while 52%
participate in organised groups such as sports groups or book clubs. Both types of social
participation are associated with better quality of life and fewer depressive symptoms.
Among those who retired between Waves 1 and 4, there were trends for an increase
in volunteering and social participation after retirement, but these were not significant
suggesting that these patterns were established for most people before retirement. Given
the clear benefits accrued from volunteering and social participation, not only to the
participants themselves but to society more generally, it is important to identify enablers
and barriers to these activities, particularly in those aged 75 and over.
1.4 High levels of neighbourhood social cohesion are associated with better mental and physical health, highlighting the need to target social isolation in older adults
Poor housing conditions, difficulties heating the home and low neighbourhood social
cohesion are significant issues for many community-dwelling adults aged 56 and over
in Ireland. The most prevalent housing problem was damp, mould or moisture, affecting
46.3% of adults. The reduction in reported heating difficulties (25.6% at Wave 3 to 21% at
Wave 4) shows that these problems can be resolved and this can be positively impacted
by intervention schemes and initiatives to improve housing conditions and energy
efficiency. High levels of neighbourhood social cohesion, reflecting a network of trusting
relationships within the area, are most prevalent for adults aged 65-74 years, those
living in rural areas and adults who are more socially integrated. High social cohesion is
associated with better quality of life, physical health and mental health, highlighting the
need for policies and initiatives to combat loneliness and social isolation at a community
level.
13
1 Introduction
1.5 Prevalence of chronic conditions and outcomes such as falls and fracture increase over time due to advancing age but there are opportunities to improve health through modifying health behaviours
Self-rated health appears to be improving in those under 75 years, for example, the
proportion of 65-74 year olds reporting fair or poor health declined from 23% to 16%
between Waves 1 and 4. As expected with an ageing population, the same period saw an
increase in the prevalence of many health conditions, including any falls (20% to 52%),
arthritis (26% to 39%), osteoporosis (9% to 17%), cataracts (9% to 14%), hypertension
(35% to 38%), diabetes (8% to 11%), wrist fractures (12% to 14%), heart attacks (4%
to 6%), transient ischaemic attacks (2% to 4%), lung disease (4% to 5%) and strokes
(1% to 2%). For some conditions, there was a spike in incidence at Wave 2, possibly
due to the effects of feedback after the Wave 1 health assessment, however incidence
was consistent thereafter. The number of current smokers declined, mostly driven by the
reduction observed in women aged 50-64 years (from 24% at Wave 1 to 17% at Wave 4)
while only 52% of adults at Wave 4 achieved the target of 150 minutes of brisk walking
per week, down from 62% at Wave 1. Modifying these health behaviours would not only
improve physical health but also psychological health, highlighting the importance of recent
legislation and policy initiatives which target improvements in these areas.
1.6 Frailty, while common and often associated with negative consequences, is not an inevitable condition and early recognition of risk factors can help avoid, delay and reverse frailty.
The prevalence of frailty in adults aged 50 years and over in Ireland is almost 13% which
is equivalent to 160,000 adults. The prevalence of pre-frailty is 31%, equivalent to 370,000
adults. However, frailty is not inevitable; it is a dynamic process in which a person can
transition in both directions between the different states of frailty, namely robustness, pre-
frailty (an intermediate state) and frailty – almost one third transitioned from frailty at Wave
1 to pre-frailty at Wave 4. In TILDA, adults most at risk of becoming frail are more likely to
be older, female, widowed, living alone and with lower educational attainment. Of note, and
consistent with the benefits to overall health and wellbeing, forms of social engagement
such as emotional support and volunteering have been shown to be protective for the
development of pre-frailty and frailty respectively (11, 12). TILDA is currently developing
new research strategies for early identification of risk factors, thus allowing timely and
appropriate interventions to help avoid, delay and reverse frailty. Since 2017, TILDA has
delivered a one-day frailty education programme, run in conjunction with the National
Clinical Programme for Older People (NCPOP). The purpose of this education day is to

Wellbeing and Health in Ireland’s over 50s 2009-2016
14
train healthcare professionals to understand the risk factors for frailty enabling them to
implement programmes for early detection, prevention and management.
1.7 Cognitive function is relatively consistent across the four waves indicating that participants continue to perform well at Wave 4
The majority of adults aged 50 and over in Ireland continue to perform well on the
core cognitive tests, assessing global cognition, memory and executive function, at an
average of six years follow-up. Where a decline did occur, the changes were small and
predominantly evident in those aged 75 and older. For example, this age group recalled
1 word less at Wave 4 compared to Wave 1 in the delayed recall task; they named 4
fewer animals at Wave 4 in the verbal fluency test and the success rate in the prospective
memory test dropped from 53% at Wave 1 to 40% at Wave 4. This is consistent with
international evidence, which suggests acceleration in cognitive decline, at least in some
domains, from age 75-80 years onwards (13, 14). Only 7% of adults felt that their memory
was continuously declining at each wave and they had a slightly larger decrease in
delayed word recall, verbal fluency and global cognitive scores over the four Waves.
1.8 Healthcare utilisation changed in line with changes in health policy
The period during which the first four waves of TILDA took place was a period of
substantial change in healthcare spending and policy, the effects of which can be seen in
the data. For example, the proportion of those 70 and over with a medical card dropped
from 90% at Wave 1 to 74% at Wave 4 after a means testing system for this age group
was introduced in January 2009 and the threshold decreased during subsequent Budgets.
Similarly, the proportion with a GP visit card increased from 1% to 19%, likely attributable
to the introduction of the universal GP visit card for the over 70s in 2015. The proportion of
participants accessing dental care decreased at Wave 4 compared to Wave 1 (11% to 9%),
most notably in those who were frail (17% to 11%); this followed a number of cuts to dental
care entitlements. Overall, there was no change in the rate of purchasing private health
insurance among older adults in Ireland (54-57% at each wave) with no difference in cover
between age groups at Wave 4.
Medical care utilisation increased between Wave 1 and Wave 4 including GP visits (87%
to 92%), Emergency Department visits (15% to 18%), outpatient clinic visits (41% to 44%)
and overnight admissions (12% to 16%). The average number of nights spent in hospital
also increased from 1 to 2 nights. These changes are mostly driven by changes observed
for older adults with frailty (e.g. overnight admissions increased from 23% to 31%; average

15
1 Introduction
number of nights more than doubled 2.7 to 6.5 nights) although the proportion with at least
one outpatient visit fell from 69% to 59%).
Overall, the proportion accessing community services (e.g. respite, day centre, meals on
wheels, occupational therapy or community nursing) is low at ≤6% and shows minimal
change across the waves although home help provision or personal care provision
increased marginally (2% to 4%). However, the characteristics of users of the home help
service changed – 19% of users had limitations in activities of daily living (ADL) and
instrumental activities of daily living (IADL) at Wave 1 compared to 41% at Wave 4. This is
most likely attributable to a 2012 policy change, where the HSE changed the criteria from
providing ‘domestic help’ to providing ‘personal care’. Conversely, informal care (i.e. care
from family or friend) increased substantially from 5% at Wave 1 to 9% at Wave 4. The
reasons for this increase require further study but it suggests that the burden of care was
transferred from the state to the families during this period.
1.9 Conclusion
In summary, Wave 4 underscores the benefits of social engagement, supportive
friendships, volunteering and membership of organisations, on health and wellbeing.
Quality of life continues to improve with age before gradually declining after age 68.
Policies which enhance social engagement should enhance quality of life. Changes in
cognitive health are minimal over the average follow-up of six years while timely and
appropriate interventions can help delay, avoid or reverse the onset of frailty. Modifying
health behaviours such as stopping smoking, reducing alcohol consumption and increasing
physical activity can also help to improve both physical and mental health. Recent changes
in healthcare policies and provision are reflected in health care access and utilisation.
References
1. Whelan BJ, Savva GM. Design and methodology of the Irish Longitudinal Study on
Ageing. J Am Geriatr Soc. 2013; 61 Suppl 2:S265-8.
2. Kearney PM, Cronin H, O’Regan C, Kamiya Y, Savva GM, Whelan B, et al. Cohort
Profile: The Irish Longitudinal Study on Ageing. Int J Epidemiol. 2011;40(4):877-84.
3. Donoghue OA, McGarrigle CA, Foley M, Fagan A, Meaney J, Kenny RA. Cohort
Profile Update: The Irish Longitudinal Study on Ageing (TILDA). Int J Epidemiol.
2018;47(5):1398-l.
4. Barrett A, Savva G., Timonen V, Kenny RA. Fifty Plus in Ireland 2011: First Results
from The Irish Longitudinal Study on Ageing. Dublin: Trinity College Dublin; 2011.
http://tilda.tcd.ie/publications/reports/pdf/w1-key-findings-report/Tilda_Master_First_
Findings_Report.pdf

Wellbeing and Health in Ireland’s over 50s 2009-2016
16
5. Nolan A, O’Regan C, Dooley C, Wallace D, Hever A, Cronin H, et al. The Over 50s in
a Changing Ireland: Economic Circumstances, Health and Well-Being. Dublin: Trinity
College Dublin; 2014. http://tilda.tcd.ie/publications/reports/pdf/w2-key-findings-report/
Wave2-Key-Findings-Report.pdf
6. McGarrigle CA, Donoghue O, Scarlett S, Kenny R. Health and Wellbeing: Active
Ageing for Older Adults in Ireland. Dublin: Trinity College Dublin; 2017. http://tilda.tcd.
ie/publications/reports/pdf/w3-key-findings-report/TILDA%20Wave%203%20Key%20
Findings%20report.pdf
7. Matz-Costa C, James JB, Ludlow L, Brown M, Besen E, Johnson C. The Meaning and
Measurement of Productive Engagement in Later Life. Social Indicators Research.
2014;118(3):1293-314.
8. Ward M, McGarrigle C. The Contribution of Older Adults to their Families and
Communities. In: McGarrigle C, Donoghue O, Scarlett S, Kenny RA, editors. Health
and Wellbeing: Active Ageing for Older Adults in Ireland Evidence from The Irish
Longitudinal Study on Ageing. Dublin: Dublin; 2017. p. 15-46. http://tilda.tcd.ie/
publications/reports/pdf/w3-key-findings-report/Chapter%202.pdf
9. McMunn A, Nazroo J, Wahrendorf M, Breeze E, Zaninotto P. Participation in socially-
productive activities, reciprocity and wellbeing in later life: baseline results in England.
Ageing and Society. 2009;29(5):765-82.
10. Department of Health, Positive Ageing 2016 - National Indicators Report. Dublin; 2016.
11. Kamiya Y, Kenny RA. Does Social Engagement Predict Frailty and Mortality in the
Older Population? In: Hoque M, Pecotte B, McGehee M, editors. Applied Demography
and Public Health in the 21st Century. Applied Demography Series. 8. Cham: Springer;
2017.
12. Jung Y, Gruenewald TL, Seeman TE, Sarkisian CA. Productive activities
and development of frailty in older adults. J Gerontol B Psychol Sci Soc Sci.
2010;65B(2):256-61.
13. Finkel D, Reynolds CA, McArdle JJ, Pedersen NL. Age changes in processing speed
as a leading indicator of cognitive aging. Psychol Aging. 2007;22(3):558-68.
14. Zaninotto P, Batty GD, Allerhand M, Deary IJ. Cognitive function trajectories and their
determinants in older people: 8 years of follow-up in the English Longitudinal Study of
Ageing. Journal of Epidemiology and Community Health. 2018;72(8):685-94.
ContentsKey Findings
2.1 Introduction ................................................................................................................. 18
2.2 Computer-assisted personal interview response rates ............................................... 19
2.3 Reasons for attrition at Wave 4 .................................................................................. 20
2.4 Self-completion questionnaire response rates ........................................................... 20
2.5 Computer-assisted personal interview response rates across waves ........................ 21
2.6 Dataset ....................................................................................................................... 22
2.7 Analytical methods employed in this report ................................................................ 22
2�7�1 Point estimates and confidence intervals ���������������������������������������������������������� 22
2�7�2 Weighting ����������������������������������������������������������������������������������������������������������� 22
2�7�3 Software ������������������������������������������������������������������������������������������������������������ 22
2.8 References ................................................................................................................. 23
2 Methodology
17
2 MethodologyDan Carey
18
Wellbeing and Health in Ireland’s over 50s 2009-2016
Key Findings
• A response rate of 84% was achieved with rates largely similar across genders and
was highest in those aged 65-74 years.
• Proxy interviews for those unable to take part in an interview was conducted with 64%
of participants requiring such an approach.
• A return rate of 86% was achieved for the self-completion questionnaire.
2.1 Introduction
Details of the sampling methods used in Waves 1-3 of TILDA have been reported
previously (1,2,3,4). At Wave 4, interviews were sought from 7,462 respondents.
Data collection consisted of two components: a computer-assisted personal interview
(CAPI) and a self-completion questionnaire (SCQ). The CAPI included questions on
health, economic, social and family circumstances and was administered by a trained
social interviewer in the respondent’s own home. In households with more than one
respondent, respondents were asked to nominate a ‘family’ and a ‘financial’ respondent.
Typically, these were the individuals in the household with the better knowledge of family
and financial circumstances, who were comfortable answering on behalf of the household.
In some cases, the family and financial respondents were the same person.
Following completion of the interview, respondents were provided with the SCQ, to be
completed and returned to TILDA in the pre-paid envelope provided. The SCQ included
questions on more sensitive matters such as quality of life, interpersonal relationships, and
alcohol consumption. Topics covered in the CAPI and SCQ are listed in Table 2.1.
As per Waves 2 and 3, Wave 4 included proxy and end-of-Life (EOL) interviews. Where
respondents were unable to complete an interview themselves due to physical or
cognitive impairment, a proxy interview was sought from a close relative or friend. Proxy
respondents were invited to complete the CAPI but not the SCQ. If a respondent moved
into residential care ahead of Wave 3, the appropriate type of interview (i.e. with the
2 Methodology

2 Methodology
19
respondent or with a proxy) was completed. EOL interviews were sought with a spouse,
relative or friend in cases where a respondent had passed away.
Table 2�1: Questions and measures included in assessments at Wave 4�
Domain Measures
Demographics Marital status; marriage history; education; migration history; childhood.
Social circumstances
Transfers to/from children/parents/others; help with (instrumental) activities of daily living; social connectedness; social networks; volunteering; caring; social participation; religion; relationship quality.
Health and healthcare
Physical (self-rated health; limiting long-standing illness; sensory function; cardiovascular and non-cardiovascular disease; falls; fear of falling; fractures; pain; oral health; health screening); cognitive (self-rated memory; word-list learning; verbal fluency; prospective memory); psychological (depressive symptoms; anxiety; resilience; life satisfaction; loneliness; worry; quality of life; perceived stress); behavioural (smoking; physical activity; sleep; alcohol; dietary intake); medications; healthcare utilisation; health insurance.
Employment, retirement & assets, lifelong learning
Employment situation; job history; planning for retirement; sources of income; home ownership; other assets; expectations; health literacy.
2.2 Computer-assisted personal interview response rates
Of the 7,462 eligible respondents at Wave 4, there were 13 new respondents identified
during fieldwork who had not previously taken part. A form of interview (i.e., self, proxy or
EOL) was collected from 6,149 respondents. As in previous waves, self-interviews were
the most common form of interview (n=5,856), with lower numbers completing proxy
(n=121) and EOL (n=172) interviews. The Wave 4 response rate was calculated as the
number of self-respondents that completed an interview at Wave 4, relative to the total
sample eligible for Wave 4 CAPI (i.e. excluding those requiring a proxy interview, or who
were known to have withdrawn, passed away, or moved outside the target area, before
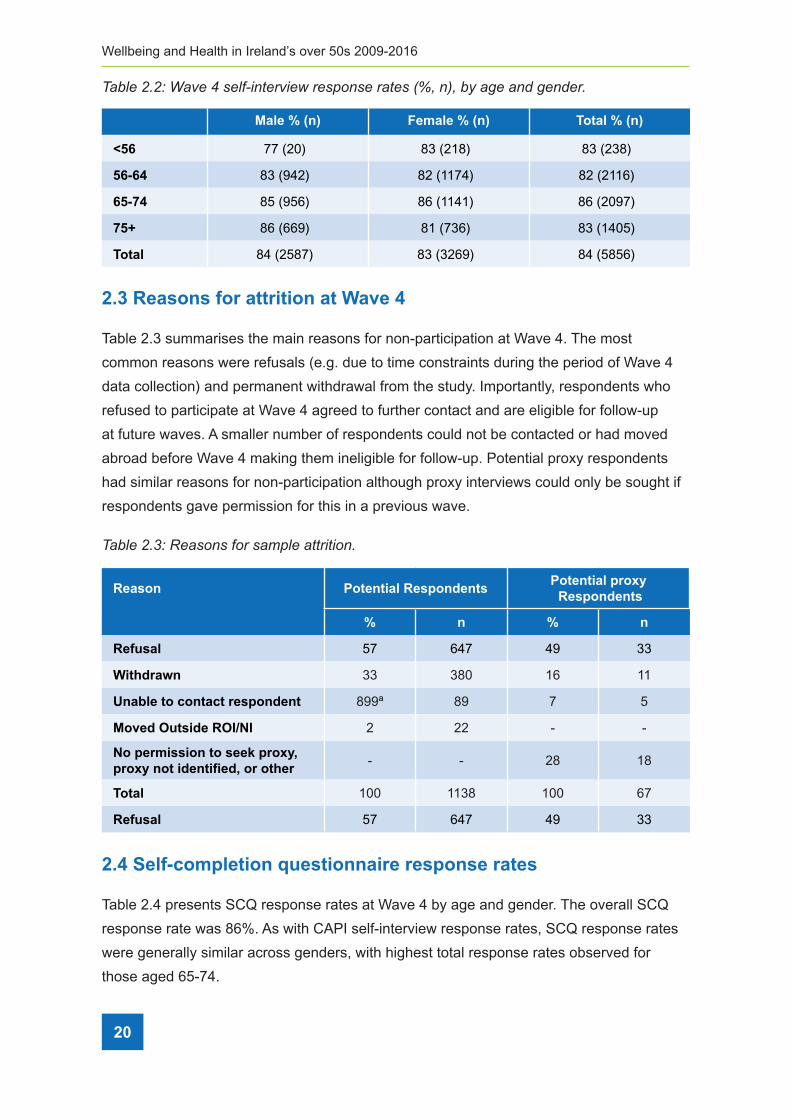
Wave 4). Table 2.2 presents the Wave 4 CAPI response rates (and counts) by age group
and gender. The total CAPI response rate was 84%; response rates were largely similar
across genders and were highest in those aged 65-74 years. The proxy interview response
rate was calculated as the number of proxy interviews completed relative to the total
number of participants identified as eligible for proxy interview throughout fieldwork. The
total proxy interview response rate was 64% (age breakdown not shown).
20
Wellbeing and Health in Ireland’s over 50s 2009-2016
Table 2�2: Wave 4 self-interview response rates (%, n), by age and gender�
Male % (n) Female % (n) Total % (n)
<56 77 (20) 83 (218) 83 (238)
56-64 83 (942) 82 (1174) 82 (2116)
65-74 85 (956) 86 (1141) 86 (2097)
75+ 86 (669) 81 (736) 83 (1405)
Total 84 (2587) 83 (3269) 84 (5856)
2.3 Reasons for attrition at Wave 4
Table 2.3 summarises the main reasons for non-participation at Wave 4. The most
common reasons were refusals (e.g. due to time constraints during the period of Wave 4
data collection) and permanent withdrawal from the study. Importantly, respondents who
refused to participate at Wave 4 agreed to further contact and are eligible for follow-up
at future waves. A smaller number of respondents could not be contacted or had moved
abroad before Wave 4 making them ineligible for follow-up. Potential proxy respondents
had similar reasons for non-participation although proxy interviews could only be sought if
respondents gave permission for this in a previous wave.
Table 2�3: Reasons for sample attrition�
Reason Potential RespondentsPotential proxy Respondents
% n % n
Refusal 57 647 49 33
Withdrawn 33 380 16 11
Unable to contact respondent 899ª 89 7 5
Moved Outside ROI/NI 2 22 - -
No permission to seek proxy, proxy not identified, or other
- - 28 18
Total 100 1138 100 67
Refusal 57 647 49 33
2.4 Self-completion questionnaire response rates
Table 2.4 presents SCQ response rates at Wave 4 by age and gender. The overall SCQ
response rate was 86%. As with CAPI self-interview response rates, SCQ response rates
were generally similar across genders, with highest total response rates observed for
those aged 65-74.

2 Methodology
21
Table 2�4: Wave 4 SCQ response rates (%, n) by age and gender�
Male % (n) Female % (n) Total % (n)
<56 95 (19) 86 (188) 87 (207)
56-64 84 (791) 87 (1017) 85 (1808)
65-74 88 (843) 90 (1024) 89 (1867)
75+ 84 (561) 84 (621) 84 (1182)
Total 86 (2214) 87 (2850) 86 (5064)
2.5 Computer-assisted personal interview response rates across waves
Figure 2.1 displays CAPI response rates at Wave 2, Wave 3 and Wave 4, by age
categories at baseline and gender; response rates are expressed as the percentage of
participants who provided a self-interview at a particular wave, relative to the sample
eligible for self-interview at that wave. CAPI response rates have remained high across
waves since the first follow-up interviews at Wave 2. In particular, patterns of attrition
following Wave 2 have largely stabilised, indicating relatively consistent engagement with
the study by self-interviewees. The apparent increase in response rate between Waves
2 and 3 for those aged 75+ at Wave 1 may be due to loss to follow-up of some of the
oldest members of the sample following Wave 2 (e.g., due to withdrawal or passing away),
reducing the total eligible for Wave 3 and the numbers likely to drop out at later waves.
Nevertheless, this pattern appears to have stabilised at Wave 4.
Figure 2�1: CAPI response rates (%) across waves, by baseline age category and gender�
<50 50 - 64 75+65 - 74 <50 50 - 64Male Female
75+65 - 74
100
8983
9158 84
87 85 8576
87 84
96
85 8591
85 84 88 86 8275
84 82
Wave 1 Wave 2 Wave 3
22
Wellbeing and Health in Ireland’s over 50s 2009-2016
2.6 Dataset
The results in this report were generated from the following TILDA datasets: CAPI v4.5.0; SCQ v4.3.3; AuditTracker_W1-W4 v2018.05.06. The CAPI dataset includes observations from 5,977 respondents (5,739 aged 56 years and over) who completed a self or a proxy interview during Wave 4. These respondents form the basis of much of the report, although different sub-samples are used throughout the Chapters. The SCQ dataset includes records for 5,064 respondents (4,857 aged 56 years and over). The AuditTracker is an internal dataset that tracks participation of all respondents in each component of the study at each wave, in addition to reasons for non-response and attrition. An anonymised dataset will shortly be archived at the Irish Social Science Data Archive (ISSDA) at University College Dublin (https://www.ucd.ie/issda/data/tilda/).
2.7 Analytical methods employed in this Report
Statistical methods used to calculate the estimates presented in this Report are described below. These methods aim to correct for potential biases in survey data estimates, in addition to determining correctly the uncertainty surrounding those estimates.
2.7.1 Point estimates and confidence intervals
Throughout this Report, the majority of estimates reflect the percentage of Irish adults aged 50 and older that fall within specific age groups, cohorts, or other analysis criteria. Means or medians of specific continuous quantities are reported where appropriate.
TILDA is a nationally representative study: each member of the study cohort hence corresponds with a given number of individuals in the Irish population aged 50 and older. Due to the random nature of the population sampling process, there is some inherent uncertainty in the derived estimates. To account for this, most estimates in this Report are presented with 95% confidence intervals (CI). Formally, the 95% CI indicates that with repeated sampling, 95% of the CIs calculated would contain the true population parameter. The 95% CI can therefore be interpreted as the range within which there is a 95% chance that the true population parameter will lie.
2.7.2 Weighting
Although TILDA is nationally representative of the older community-dwelling population in Ireland, patterns of response to each component of the study (CAPI, SCQ) vary across certain subgroups of the sample. Participation in later waves of the study is also influenced by levels of participation at earlier waves and by sample attrition.

2 Methodology
23
To account for these systematic differences in responses and to ensure that the estimates derived from the sample remain representative of the target population, a number of weights were calculated and applied to different analyses. Weighting ensures that for the estimates calculated, subgroups within the sample are represented proportionate to the number of that subgroup present in the population of Ireland.
In practice, the weights reflect the reciprocal of the probability of a participant being included in the study, based on characteristics such as age, gender, education level, marital status, and the participant’s membership of the target population. Separate longitudinal CAPI weights were used for different analyses in each Chapter, depending on the respondents included within each analysis. Longitudinal weights (for CAPI or SCQ) were calculated by multiplying the base CAPI weight by the reciprocal of the probability that a participant completed Waves 2, 3 and 4 (following participation at Wave 1). The probability was calculated using a multivariate logistic regression model, with the following baseline predictors: age, gender, level of education, marital status, urban or rural residence, self-rated physical health, smoking, health insurance, medications, socioeconomic stratum, disability, mental health, employment status, cardiac illness, immediate word recall, verbal fluency, and wrist and hip fractures. Versions of these longitudinal weights that included attrition between Waves 1 and 4 (i.e., participation in all waves except for either Wave 2 or Wave 3) were also calculated. Finally, two sets of these longitudinal weights were also calculated also, separated according to self-interviews only (i.e., proxy interviews were treated as attrition), or as self and proxy interviews (i.e., proxy interviews treated as participation). This accommodated the differing inclusion of proxy respondents in analyses throughout the Report, dependent upon the data analysed.
2.7.3. Software
All analyses in this report were conducted using STATA 12 or 14.

24
Wellbeing and Health in Ireland’s over 50s 2009-2016
2.8 References
1. Kenny R, Whelan B, Cronin H, Kamiya Y, Kearney P, O’Regan C, et al. The Design of
the Irish Longitudinal Study on Ageing. Dublin: Trinity College Dublin; 2010. http://tilda.
tcd.ie/publications/reports/pdf/Report_DesignReport.pdf
2. Barrett A, Savva G, Timonen V, Kenny R. Fifty Plus in Ireland 2011. First Results from
the Irish Longitudinal Study on Ageing (TILDA). Dublin: The Irish Longitudinal Study on
Ageing. Dublin: Trinity College Dublin; 2011 http://tilda.tcd.ie/publications/reports/pdf/
w1-key-findings-report/Tilda_Master_First_Findings_Report.pdf
3. Nolan A, O’Regan C, Dooley C, Wallace D, Hever A, Cronin H, et al. The Over 50s in a
Changing Ireland: Economic Circumstances, Health and Well-Being. Dublin: The Irish
Longitudinal Study on Ageing. Dublin: Trinity College Dublin; 2014 http://tilda.tcd.ie/
publications/reports/pdf/w2-key-findings-report/Wave2-Key-Findings-Report.pdf
4. McGarrigle C, Donoghue O, Scarlett S, Kenny RA. Health and Wellbeing: Active
Ageing for Older Adults in Ireland. Dublin: The Irish Longitudinal Study on Ageing.
Dublin: Trinity College Dublin; 2016 http://tilda.tcd.ie/publications/reports/pdf/w3-key-
findings-report/TILDA%20Wave%203%20Key%20Findings%20report.pdf

3 Quality of Life
25
ContentsKey Findings
3.1 Introduction .............................................................................................................. 27
3.2 Quality of Life ........................................................................................................... 28
3�2�1 Quality of Life and socio-demographics ��������������������������������������������������������� 28
3�2�2 Quality of life and marital status ��������������������������������������������������������������������� 31
3�2�3 Quality of life and chronic conditions �������������������������������������������������������������� 32
3�2�4 Quality of life and functional limitations ��������������������������������������������������������� 32
3�2�5 Quality of life and social integration ��������������������������������������������������������������� 35
3�2�6 Quality of life by quality of relationships �������������������������������������������������������� 36
3.3 Longitudinal change in quality of life with changing functional limitations ................. 37
3�3�1 Longitudinal change in quality of life and functional limitations ���������������������� 37
3�3�2 Longitudinal change in quality of life by change in functional limitations
between Wave 1 and Wave 4 ������������������������������������������������������������������������� 40
3�3�3 Change in quality of life with change in functional limitations between
Waves 1 and 4 by social integration and gender �������������������������������������������� 41
3�3�4 Change in quality of life with increasing disability moderated by
positive supportive relationships with friends ������������������������������������������������ 42
3.4 Discussion ................................................................................................................. 43
3.5 Conclusion ................................................................................................................. 44
3.6 References ................................................................................................................ 44
3 Quality of life and relationshipsChristine McGarrigle and Mark Ward

26
Wellbeing and Health in Ireland’s over 50s 2009-2016
Key Findings
• The average quality of life score measured though CASP-12, among TILDA
participants is 27.3 in Wave 4. This score suggests that, on average, older people in
Ireland experience a good quality of life.
• Quality of life doesn’t decline linearly with age, but instead increases to a peak at age
68 and then starts to gradually decline, reaching the value observed among 50 year
olds at age 80, decreasing steadily from that age onwards.
• The factors which predominantly influence quality of life are social factors, including
social networks and social activities, while health-related factors like functional
limitations are also important.
• Quality of life decreases with increasing number of chronic health conditions.
• Quality of life decreases as the number of activities of daily living (ADL) and
instrumental ADL (IADL) limitations increase.
• Increased social integration, through maintenance of a larger social network and
positive supportive relationships with friends is associated with higher quality of life.
• One third of women (31%) report positive supportive friendships in Wave 4, compared
to 16% of men, similar to that reported in Wave 1. Relationship quality within social
networks is important, and those who report positive supportive relationships with
friends report higher quality of life relative to those with less supportive relationships.
• Over 21% of TILDA respondents reported the highest level of social integration in
Wave 4, with 39% moderately integrated, 29% moderately isolated and 11% most
isolated, similar to that reported in Wave 1. Men and women reporting highest levels
of social integration had higher mean quality of life scores than those reporting lower
levels of social integration.
3 Quality of life andrelationships

3 Quality of Life
27
3.1 Introduction
Quality of life is recognised as an important measure of wellbeing as people get older.
It encompasses not just physical measures of health but the overall wellbeing of an
individual. It is a multi-dimensional construct and includes, for example, when individuals
stay active and social interactions are maintained with productive activities, thus improving
quality of life by improving self-esteem. In previous research, we determined that quality
of life peaked at age 68, and declined rapidly past 80 years (1). We found that social
networks and integration into family and society were important for higher quality of life (1)
and that an increase in ADL and IADL limitations over a two-year period was associated
with a decline in quality of life (2).
Disability increases with advancing age and among community-dwelling people in Ireland,
11% of men and 14% of women aged 50 or over have at least one limitation in daily
activities (3). Disability in older people has been associated with depression, lower quality
of life, social isolation and loneliness (4,5). The influence of poor health on loneliness
may be amplified in rural areas (6). This can be due to a number of influences, including
physical conditions like pain, or an inability to continue accessing one’s social circle and
participate in social activities in their wider community (6).
Social integration has been established to have positive health effects (7-9). However,
the quality of relationships that people maintain has also been shown to be important and
has direct effects on both health and wellbeing (10-13). Ireland is unique in the quantity
of social relationships available to individuals due to family size, although this is counter-
balanced by large-scale migration of both past and current generations of younger people,
thus breaking the continuity of family relations.
In this Chapter, information from those who participated in the first four waves of TILDA
are included. Participants are divided into three age groups, based on their age at Wave
1: 50 to 64 years (n=3,284), 65 to 74 years (n=1,409), and 75 years and older (n=605).
Education consists of three levels: primary education or less (n=1,309), secondary level
education (n=2,196) and third level education (n=1,800). The majority of the information
provided in this Chapter was collected during the computer assisted personal interview
(CAPI), while the quality of life, and supportive relationship information was collected
through the self-completion questionnaire (SCQ).
The aim of the Chapter is to describe changing functional limitations in community-dwelling
older adults in Ireland between the first four waves of data collection and to examine how
these changes impact on quality of life. To do this we carry out a cross-wave analysis
where we compare the cross-sectional distributions of quality of life in Wave 1 and Wave 4,

28
Wellbeing and Health in Ireland’s over 50s 2009-2016
and examine whether these vary with age, gender, educational attainment, marital status,
functional limitations and close relationships. Additionally, we carry out a longitudinal
analysis of change in functional limitations within individuals, and compare this to the
corresponding change in quality of life. We also identify if social integration and supportive
relationships with friends lessen the negative impact of functional limitations on quality of
life.
3.2 Quality of Life
3.2.1 Quality of life and socio-demographics
TILDA uses the 12-item self-report measurement, (CASP-12), to assess quality of life in
Wave 4 (14). The scale covers the four domains considered to encompass quality of life
(Table 3.1). The items included in CASP-12 consist of statements such as: ‘I can do the
things I want to do’, ‘I look forward to every day’ and ‘I feel that life is full of opportunities’.
These statements are presented to participants in the SCQ and they are asked to indicate
how often (often, sometimes, not often or never), they feel each statement applies to
their life. Each item is summed to give an overall score (range 0 to 36) with higher scores
denoting better quality of life.
Table 3�1: Quality of life domains�
Quality of life domain
Control The ability to actively participate in one’s environment.
AutonomyThe right of the individual to be free from the unwanted interference of others.
Self-realisation The fulfilment of one’s potential.
Pleasure The sense of happiness or enjoyment derived from engaging with life.
The average quality of life score measured with CASP-12, among TILDA participants is
27.3 (range 4 to 36) in Wave 4. This score suggests that, on average, older people in
Ireland experience a good quality of life. Figure 3.1 shows how the average quality of life
scores change over time for adults aged 50 years and over.

3 Quality of Life
29
Figure 3�1: Changing trajectories of quality of life between Waves 1 and 4.
2526
2728
29
erocs 21-PSA
C detciderP
50 55 60 65 70 75 80 85 90Age
Each arrow in the figure shows the average change in quality of life, based on age at Wave
1, over 6 years of follow-up. Quality of life doesn’t decrease linearly with age as might be
expected, but instead increases to a peak at age 68 and then starts to gradually decline,
reaching the value observed among 50 year olds at age 80 and decreasing steadily from
that age onwards. The patterns of change were similar for men and women, as shown in
Figure 3.2 where quality of life is highest in the 65-74 year age group and decreases over
time in most age groups for both men and women.
Figure 3�2: Quality of life between Wave 1 and Wave 4 by age group and gender�
0.0
10.0
20.0
30.0
50-64 65-74 75+ 50-64 65-74 75+
Male Female
Wave 1Wave 4
elacS efiL fo ytilauQ 21-
PSA
C
Note. N = 3683; Missing obs = 5033; Error bars correspond to 95% confidence intervals
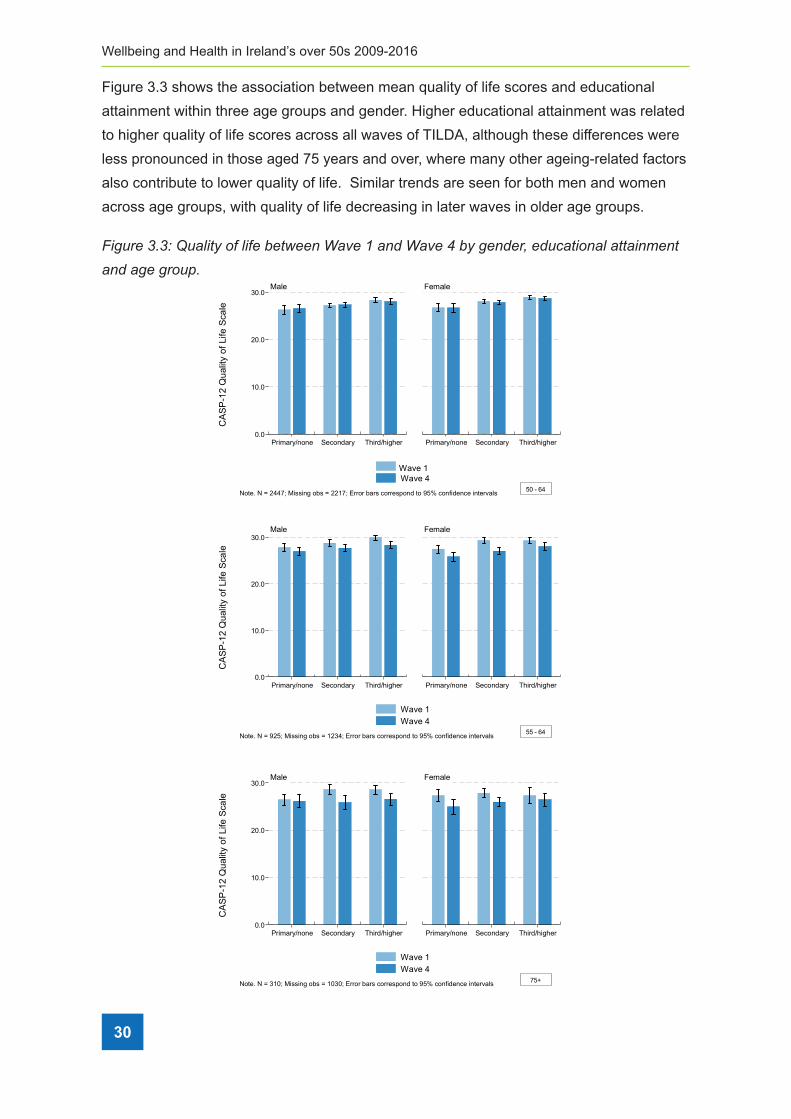
30
Wellbeing and Health in Ireland’s over 50s 2009-2016
Figure 3.3 shows the association between mean quality of life scores and educational
attainment within three age groups and gender. Higher educational attainment was related
to higher quality of life scores across all waves of TILDA, although these differences were
less pronounced in those aged 75 years and over, where many other ageing-related factors
also contribute to lower quality of life. Similar trends are seen for both men and women
across age groups, with quality of life decreasing in later waves in older age groups.
Figure 3�3: Quality of life between Wave 1 and Wave 4 by gender, educational attainment
and age group�
0.0
10.0
20.0
30.0
Primary/none Secondary Third/higher Primary/none Secondary Third/higher
Male Female
Wave 1Wave 4
elacS efiL fo ytilauQ 21-
PSA
C
Note. N = 2447; Missing obs = 2217; Error bars correspond to 95% confidence intervals 50 - 64
0.0
10.0
20.0
30.0
Primary/none Secondary Third/higher Primary/none Secondary Third/higher
Male Female
Wave 1Wave 4
elacS efiL fo ytilauQ 21-
PSA
C
Note. N = 925; Missing obs = 1234; Error bars correspond to 95% confidence intervals 55 - 64
0.0
10.0
20.0
30.0
Primary/none Secondary Third/higher Primary/none Secondary Third/higher
Male Female
Wave 1Wave 4
elacS efiL fo ytilauQ 21-
PSA
C
Note. N = 310; Missing obs = 1030; Error bars correspond to 95% confidence intervals 75+

3 Quality of Life
31
3.2.2 Quality of life and marital status
Many studies, including TILDA, have shown that married people have higher quality of life
and life satisfaction than those who have never married or are separated or divorced (1,
5, 15, 16), while depressive symptoms are higher in older people who have never married
(17). In Wave 4, quality of life was higher in those who were married, and lowest in those
individuals who were separated or divorced, for both men and women. In men who were
widowed, quality of life was similar to those who were married, however in widowed
women, quality of life was lower and similar to women who were separated or divorced.
These differences remained between Wave 1 and Wave 4, although mean quality of life
scores were lower in Wave 4 for each group.
Table 3�2: Quality of life by marital status and gender�
W1
Mean (95% CI)
W2
Mean (95% CI)
W3
Mean (95% CI)
W4
Mean (95% CI)
Male
Married 28.09 (27.83,28.35) 27.54 (27.27,27.81) 27.32 (27.04,27.59) 27.65 (27.38,27.92)
Never married 25.78 (24.84,26.71) 24.84 (23.88,25.81) 25.10 (24.22,25.98) 26.02 (25.12,26.93)
Sep/divorced 25.85 (24.52,27.19) 24.29 (22.84,25.74) 24.12 (22.79,25.45) 25.37 (24.04,26.71)
Widowed 28.66 (27.67,29.66) 27.65 (26.89,28.41) 27.57 (26.66,28.47) 27.79 (26.91,28.67)
Female
Married 28.45 (28.16,28.74) 27.49 (27.19,27.80) 27.26 (26.93,27.60) 27.93 (27.62,28.23)
Never married 28.25 (27.37,29.13) 27.11 (26.21,28.00) 26.17 (25.24,27.09) 27.36 (26.47,28.26)
Sep/divorced 26.55 (25.70,27.40) 25.93 (25.06,26.80) 24.97 (23.98,25.96) 26.02 (25.01,27.03)
Widowed 27.80 (27.17,28.43) 26.69 (26.08,27.29) 25.94 (25.36,26.51) 26.26 (25.71,26.81)
Total
Married 28.26 (28.05,28.47) 27.52 (27.30,27.74) 27.29 (27.06,27.53) 27.78 (27.56,28.00)
Never married 26.88 (26.20,27.56) 25.86 (25.17,26.55) 25.59 (24.96,26.22) 26.63 (25.98,27.28)
Sep/divorced 26.24 (25.48,27.00) 25.26 (24.47,26.05) 24.59 (23.78,25.41) 25.74 (24.93,26.54)
Widowed 27.99 (27.45,28.52) 26.94 (26.45,27.42) 26.34 (25.86,26.82) 26.62 (26.15,27.09)
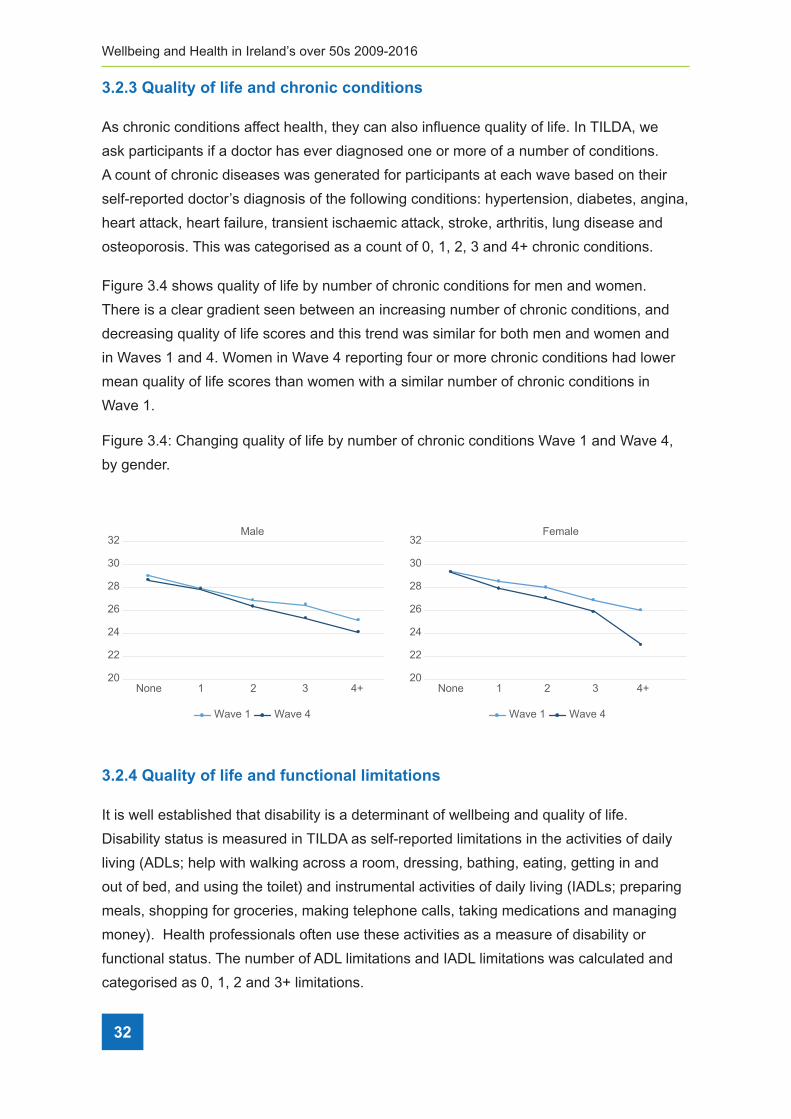
32
Wellbeing and Health in Ireland’s over 50s 2009-2016
3.2.3 Quality of life and chronic conditions
As chronic conditions affect health, they can also influence quality of life. In TILDA, we
ask participants if a doctor has ever diagnosed one or more of a number of conditions.
A count of chronic diseases was generated for participants at each wave based on their
self-reported doctor’s diagnosis of the following conditions: hypertension, diabetes, angina,
heart attack, heart failure, transient ischaemic attack, stroke, arthritis, lung disease and
osteoporosis. This was categorised as a count of 0, 1, 2, 3 and 4+ chronic conditions.
Figure 3.4 shows quality of life by number of chronic conditions for men and women.
There is a clear gradient seen between an increasing number of chronic conditions, and
decreasing quality of life scores and this trend was similar for both men and women and
in Waves 1 and 4. Women in Wave 4 reporting four or more chronic conditions had lower
mean quality of life scores than women with a similar number of chronic conditions in
Wave 1.
Figure 3.4: Changing quality of life by number of chronic conditions Wave 1 and Wave 4,
by gender.
20
22
24
26
28
30
32
None 1 2 3 4+ None 1 2 3 4+
Male
20
22
24
26
28
30
32Female
Wave 1 Wave 4 Wave 1 Wave 4
3.2.4 Quality of life and functional limitations
It is well established that disability is a determinant of wellbeing and quality of life.
Disability status is measured in TILDA as self-reported limitations in the activities of daily
living (ADLs; help with walking across a room, dressing, bathing, eating, getting in and
out of bed, and using the toilet) and instrumental activities of daily living (IADLs; preparing
meals, shopping for groceries, making telephone calls, taking medications and managing
money). Health professionals often use these activities as a measure of disability or
functional status. The number of ADL limitations and IADL limitations was calculated and
categorised as 0, 1, 2 and 3+ limitations.

3 Quality of Life
33
The number of IADL and ADL limitations reported at Wave 1 and Wave 4, by age group
and gender are shown in Figures 3.5 and 3.6. In Wave 4, 8% of men and 11% of women
reported at least one ADL compared to 8% of men and 7% of women in Wave 1. While 6%
of men and 7% of women reported at least one IADL impairment in Wave 4, compared to
4% and 7% in Wave 1 respectively. The highest number of limitations are seen in men and
women aged 75 and over, and these increased between Wave 1 and Wave 4.
Figure 3�5: Mean number of IADL limitations in Wave 1 and Wave 4, by age group and
gender�
0.0
0.2
0.4
0.6
0.8
1.0
50-64 65-74 75+ 50-64 65-74 75+
Male Female
Wave 1Wave 4
snoitatimil L
DAI fo reb
mun naeM
Note. N = 5566; Missing obs = 3150; Error bars correspond to 95% confidence intervals
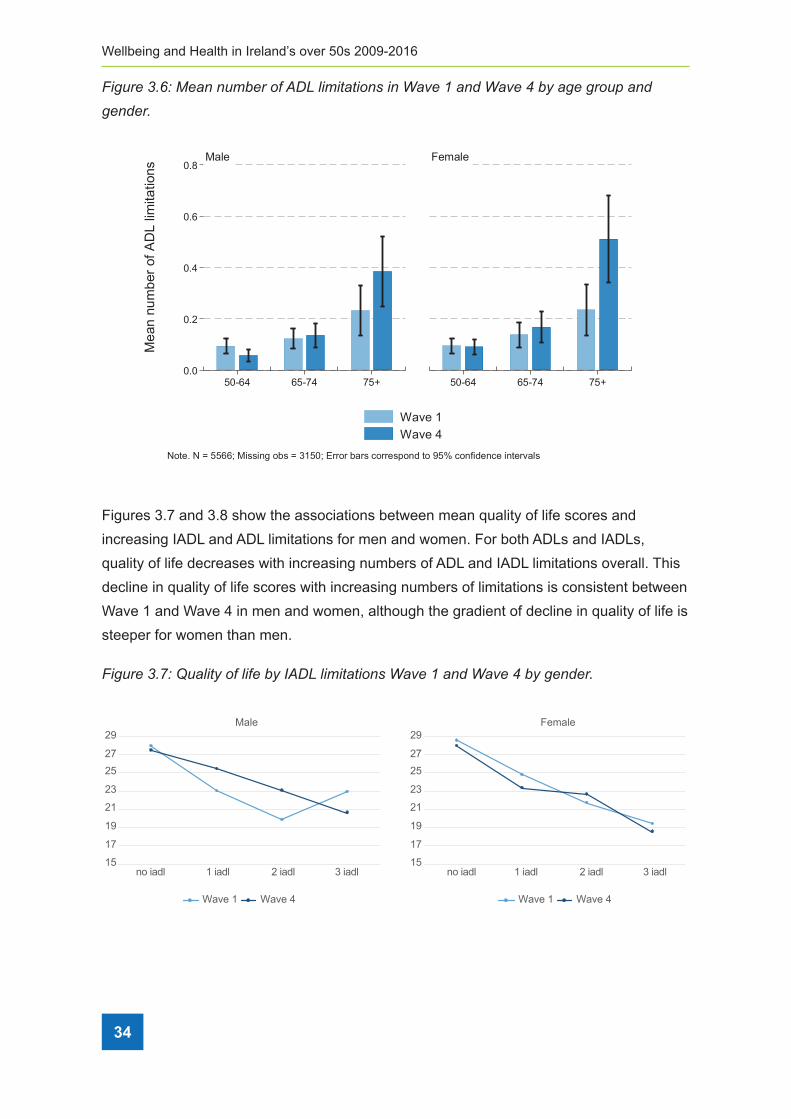
34
Wellbeing and Health in Ireland’s over 50s 2009-2016
Figure 3�6: Mean number of ADL limitations in Wave 1 and Wave 4 by age group and
gender�
0.0
0.2
0.4
0.6
0.8
50-64 65-74 75+ 50-64 65-74 75+
Male Female
Wave 1Wave 4
snoitatimil L
DA fo reb
mun naeM
Note. N = 5566; Missing obs = 3150; Error bars correspond to 95% confidence intervals
Figures 3.7 and 3.8 show the associations between mean quality of life scores and
increasing IADL and ADL limitations for men and women. For both ADLs and IADLs,
quality of life decreases with increasing numbers of ADL and IADL limitations overall. This
decline in quality of life scores with increasing numbers of limitations is consistent between
Wave 1 and Wave 4 in men and women, although the gradient of decline in quality of life is
steeper for women than men.
Figure 3�7: Quality of life by IADL limitations Wave 1 and Wave 4 by gender�
Wave 1 Wave 4 Wave 1 Wave 4
15
17
19
21
23
2527
29
no iadl 1 iadl 2 iadl 3 iadl
Male
15
17
19
21
23
2527
29
no iadl 1 iadl 2 iadl 3 iadl
Female

3 Quality of Life
35
Figure 3�8: Quality of life by increasing ADL limitations Wave 1 and Wave 4 by gender�
Wave 1 Wave 4 Wave 1 Wave 4
15
17
19
21
23
2527
29
no iadl 1 iadl 2 iadl 3 iadl
Male
15
17
19
21
23
2527
29
no iadl 1 iadl 2 iadl 3 iadl
Female
3.2.5 Quality of life and social integration
There is consensus that supportive social ties are beneficial for mental health and
wellbeing (18, 19). This is thought to work both through promotion of positive emotions and
buffering the harmful effects of stress (18). Social support structures and social interaction
are recognised as being important for older people with disability and declining functional
ability and health (20). Furthermore, previous research has shown that there are socio-
economic inequalities in disability, and report a clear wealth gradient in disability among
older English adults (21, 22), especially for those with elevated depressive symptoms (21).
Social integration is measured in TILDA using the Berkman-Syme Social Network Index.
This is a composite scale scored 0-4 quantifying four types of social connection: married;
number of close ties with friends, family and children; member of a church; member of
voluntary organisations including clubs. A score of 0-1 indicates a participant who is most
isolated, while a score of 4 indicates that they are most integrated.

36
Wellbeing and Health in Ireland’s over 50s 2009-2016
Figure 3�9: Quality of life by social integration score Wave 1 and Wave 4 by gender�
222324252627282930
Most Isolated
Moderately Isolated
Moderately Intergrated
Most Intergrated
Male Female
222324252627282930
Most Isolated
Moderately Isolated
Moderately Intergrated
Most Intergrated
Wave 1 Wave 4 Wave 1 Wave 4
Over 21% of TILDA respondents reported the highest level of social integration in Wave
4, with 39% moderately integrated, 29% moderately isolated and 11% most isolated. This
was similar to figures of 24%, 41%, 27% and 8% reported in Wave 1 respectively. Men and
women reporting highest levels of social integration had higher mean quality of life scores
than those reporting lower levels of social integration (Figure 3.9). Comparisons between
Wave 1 and Wave 4 show that overall, this association did not change over time (Figure
3.9). The strength of the relationship between quality of life and social integration scores
remained the same, however, in Wave 4, the most isolated women had lower quality of life
relative to women reporting similar levels of isolation in Wave 1.
3.2.6 Quality of life by quality of relationships
While being integrated into social networks has positive implications for health and
wellbeing, it is not only the quantity of social relationships that is important, but also the
quality of those relationships. In TILDA, we determine the quality of social support received
from friends using questions asked in the SCQ. Positive relationships with friends are
assessed through a series of questions, ‘Do you feel you can rely on them if you have a
serious problem’, ‘how much do they understand the way you feel about things’, and ‘how
much can you open up to them if you need to talk about your worries’. Answer options
varied from ‘not at all’, to ‘a lot’ (0-9). These scores are grouped into tertiles, with the
highest tertile indicating positive supportive relationships, and the lowest tertile, indicating
the least supportive relationships with friends.
One third of women (31%) report positive supportive friendships in Wave 4, compared to
16% of men, similar to that reported in Wave 1. While 27% of women report low supportive
friendships, this proportion has decreased (from 38% in Wave 1). A similar decreasing
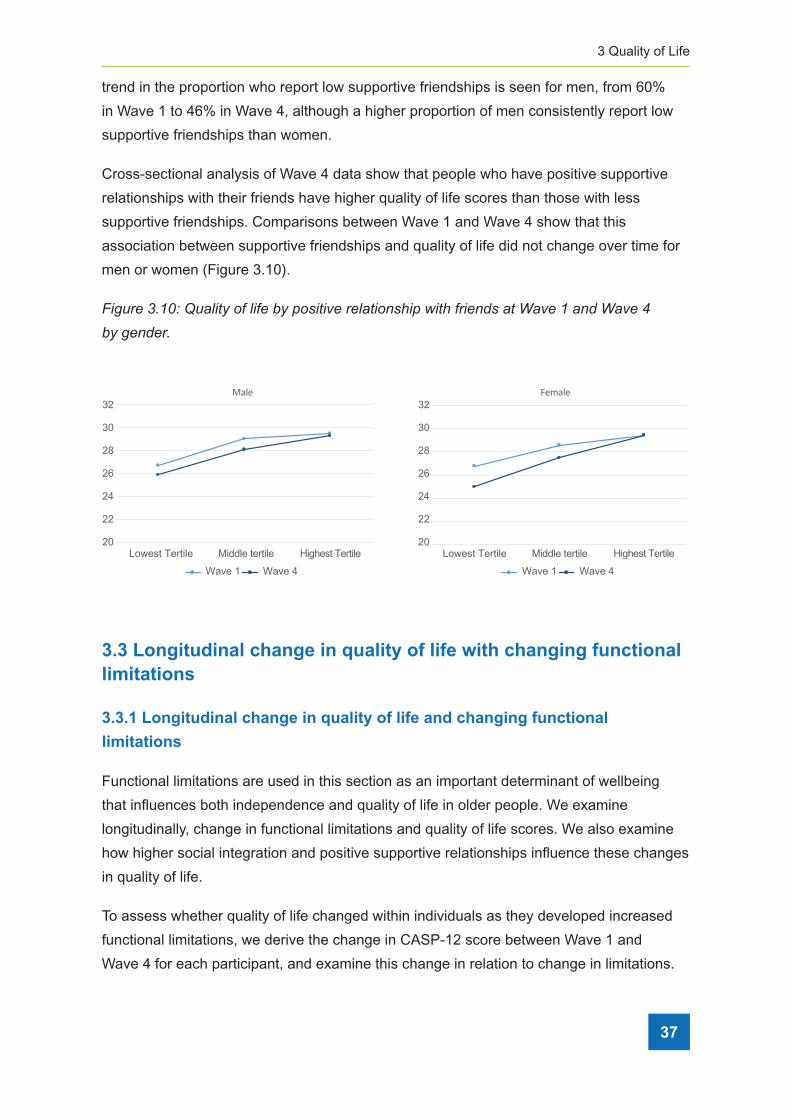
3 Quality of Life
37
trend in the proportion who report low supportive friendships is seen for men, from 60%
in Wave 1 to 46% in Wave 4, although a higher proportion of men consistently report low
supportive friendships than women.
Cross-sectional analysis of Wave 4 data show that people who have positive supportive
relationships with their friends have higher quality of life scores than those with less
supportive friendships. Comparisons between Wave 1 and Wave 4 show that this
association between supportive friendships and quality of life did not change over time for
men or women (Figure 3.10).
Figure 3�10: Quality of life by positive relationship with friends at Wave 1 and Wave 4
by gender�
Wave 1 Wave 4 Wave 1 Wave 4
Lowest Tertile Middle tertile Highest Tertile
FemaleMale
20
22
24
26
28
30
32
Lowest Tertile Middle tertile Highest Tertile20
22
24
26
28
30
32
3.3 Longitudinal change in quality of life with changing functional limitations
3.3.1 Longitudinal change in quality of life and changing functional
limitations
Functional limitations are used in this section as an important determinant of wellbeing
that influences both independence and quality of life in older people. We examine
longitudinally, change in functional limitations and quality of life scores. We also examine
how higher social integration and positive supportive relationships influence these changes
in quality of life.
To assess whether quality of life changed within individuals as they developed increased
functional limitations, we derive the change in CASP-12 score between Wave 1 and
Wave 4 for each participant, and examine this change in relation to change in limitations.
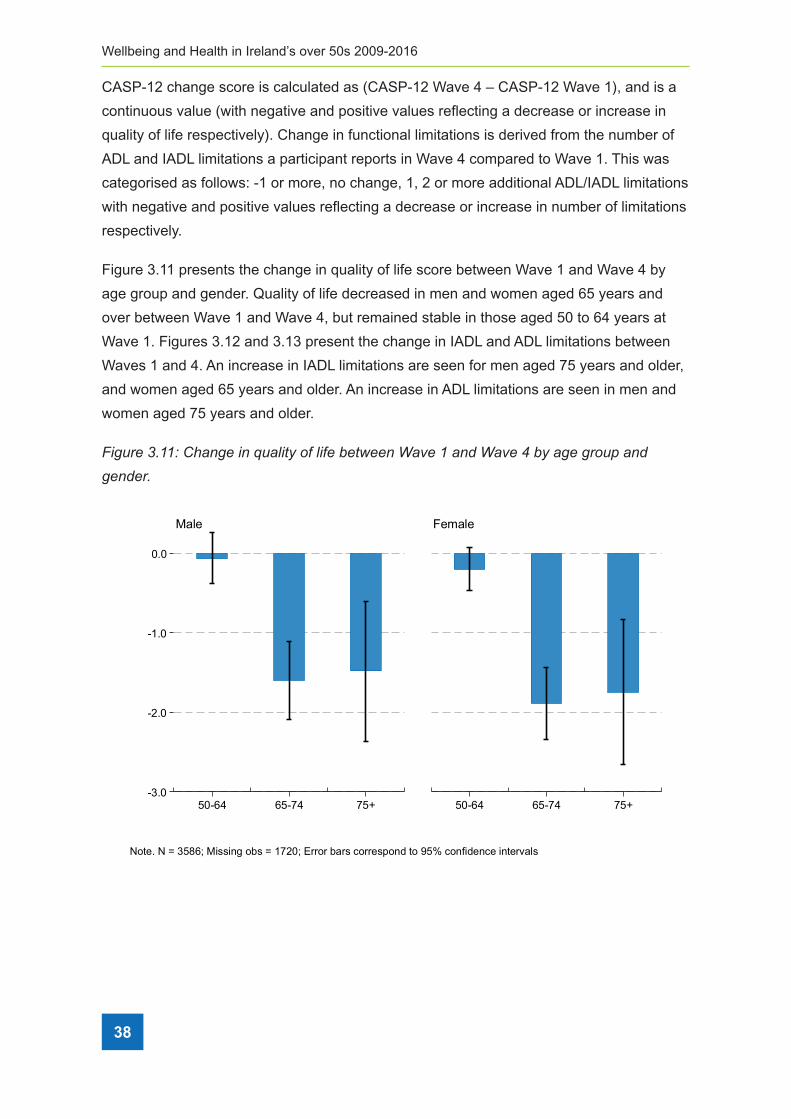
38
Wellbeing and Health in Ireland’s over 50s 2009-2016
CASP-12 change score is calculated as (CASP-12 Wave 4 – CASP-12 Wave 1), and is a
continuous value (with negative and positive values reflecting a decrease or increase in
quality of life respectively). Change in functional limitations is derived from the number of
ADL and IADL limitations a participant reports in Wave 4 compared to Wave 1. This was
categorised as follows: -1 or more, no change, 1, 2 or more additional ADL/IADL limitations
with negative and positive values reflecting a decrease or increase in number of limitations
respectively.
Figure 3.11 presents the change in quality of life score between Wave 1 and Wave 4 by
age group and gender. Quality of life decreased in men and women aged 65 years and
over between Wave 1 and Wave 4, but remained stable in those aged 50 to 64 years at
Wave 1. Figures 3.12 and 3.13 present the change in IADL and ADL limitations between
Waves 1 and 4. An increase in IADL limitations are seen for men aged 75 years and older,
and women aged 65 years and older. An increase in ADL limitations are seen in men and
women aged 75 years and older.
Figure 3�11: Change in quality of life between Wave 1 and Wave 4 by age group and
gender�
-3.0
-2.0
-1.0
0.0
50-64 65-74 75+ 50-64 65-74 75+
Male Female
Note. N = 3586; Missing obs = 1720; Error bars correspond to 95% confidence intervals

3 Quality of Life
39
Figure 3�12: Change in IADL limitations between Wave 1 and Wave 4, by age group and
gender�
0.0
0.2
0.4
0.6
0.8
50-64 65-74 75+ 50-64 65-74 75+
Male Female
Note. N = 5298; Missing obs = 8; Error bars correspond to 95% confidence intervals
Figure 3�13: Change in ADL limitations between Wave 1 and Wave 4, by age group and
gender�
0.0
0.1
0.2
0.3
50-64 65-74 75+ 50-64 65-74 75+
Male Female
Note. N = 5298; Missing obs = 8; Error bars correspond to 95% confidence intervals

40
Wellbeing and Health in Ireland’s over 50s 2009-2016
3.3.2 Longitudinal change in quality of life by change in functional limitations
between Wave 1 and Wave 4
We examine whether quality of life changes in older people as disability increases. Figures
3.14 and 3.15 show that there is a small decline in quality of life for both men and women
with no change in functional limitations between Waves 1 and 4. Quality of life decreases
in women with an increasing number of ADL and IADL limitations at Wave 4, and although
there is a similar trend in men, the change in quality of life is not significant.
Figure 3�14: Change in quality of life by changing IADL limitations between Wave 1 and
Wave 4 by gender�
-8.0
-6.0
-4.0
-2.0
0.0
2.0
-1 or more IADLs no change +1 IADL 2+ IADLs
Male Female
Note. N = 3590; Missing obs = 1715; Error bars correspond to 95% confidence intervals
Figure 3�15: Change in Quality of Life by changing ADL limitations between Wave 1 and
Wave 4 by gender�
-8.0
-6.0
-4.0
-2.0
0.0
2.0
-1 or more ADLs no change +1 ADL 2+ ADLs
Male Female
Note. N = 3590; Missing obs = 1715; Error bars correspond to 95% confidence intervals
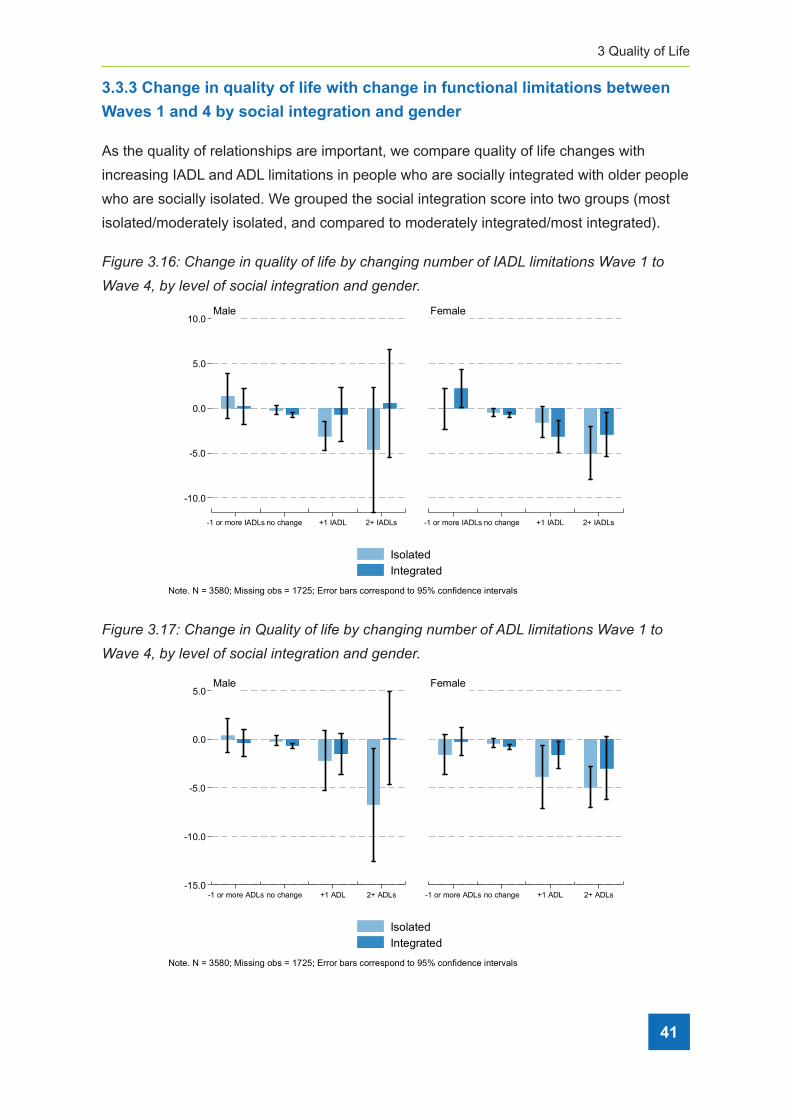
3 Quality of Life
41
3.3.3 Change in quality of life with change in functional limitations between
Waves 1 and 4 by social integration and gender
As the quality of relationships are important, we compare quality of life changes with
increasing IADL and ADL limitations in people who are socially integrated with older people
who are socially isolated. We grouped the social integration score into two groups (most
isolated/moderately isolated, and compared to moderately integrated/most integrated).
Figure 3�16: Change in quality of life by changing number of IADL limitations Wave 1 to
Wave 4, by level of social integration and gender�
-10.0
-5.0
0.0
5.0
10.0
-1 or more IADLs no change +1 IADL 2+ IADLs -1 or more IADLs no change +1 IADL 2+ IADLs
Male Female
IsolatedIntegrated
Note. N = 3580; Missing obs = 1725; Error bars correspond to 95% confidence intervals
Figure 3�17: Change in Quality of life by changing number of ADL limitations Wave 1 to
Wave 4, by level of social integration and gender�
-15.0
-10.0
-5.0
0.0
5.0
-1 or more ADLs no change +1 ADL 2+ ADLs -1 or more ADLs no change +1 ADL 2+ ADLs
Male Female
IsolatedIntegrated
Note. N = 3580; Missing obs = 1725; Error bars correspond to 95% confidence intervals

42
Wellbeing and Health in Ireland’s over 50s 2009-2016
Level of social integration is related to the change in quality of life in older people as ADL
and IADL limitations increase. Figure 3.16 and 3.17 show that quality of life did not decline
as number of IADL and ADL limitations increased in men who are more socially integrated.
A similar trend, with less decline in more socially integrated women is also seen. However,
those who are most isolated and particularly women, had notable declines in quality of life
with increasing ADL and IADL limitations.
3.3.4 Change in quality of life with increasing disability moderated by positive
supportive relationships with friends
Similarly, supportive relationships with friends moderate the effect of increasing functional
limitations on quality of life, particularly in women who report that they feel their friends
were able to offer them the support they need. Figure 3.18 shows that quality of life did
not decline with increasing number of IADL limitations for women who report the highest
supportive relationships with their friends, and there is some evidence of a gradient in
decline by decreasing level of positive support. Figure 3.19 shows a similar relationship for
ADL limitations.
Figure 3�18: Changing quality of life scores with changing IADL limitations between Wave
1 and Wave 4, the moderating effects of positive supportive relationships with friends�
-20.0
-10.0
0.0
10.0
-1 or more IADLs no change +1 IADL 2+ IADLs -1 or more IADLs no change +1 IADL 2+ IADLs
Male Female
Lowest tertileMiddle tertileHighest tertile
Note. N = 3479; Missing obs = 1827; Error bars correspond to 95% confidence intervals
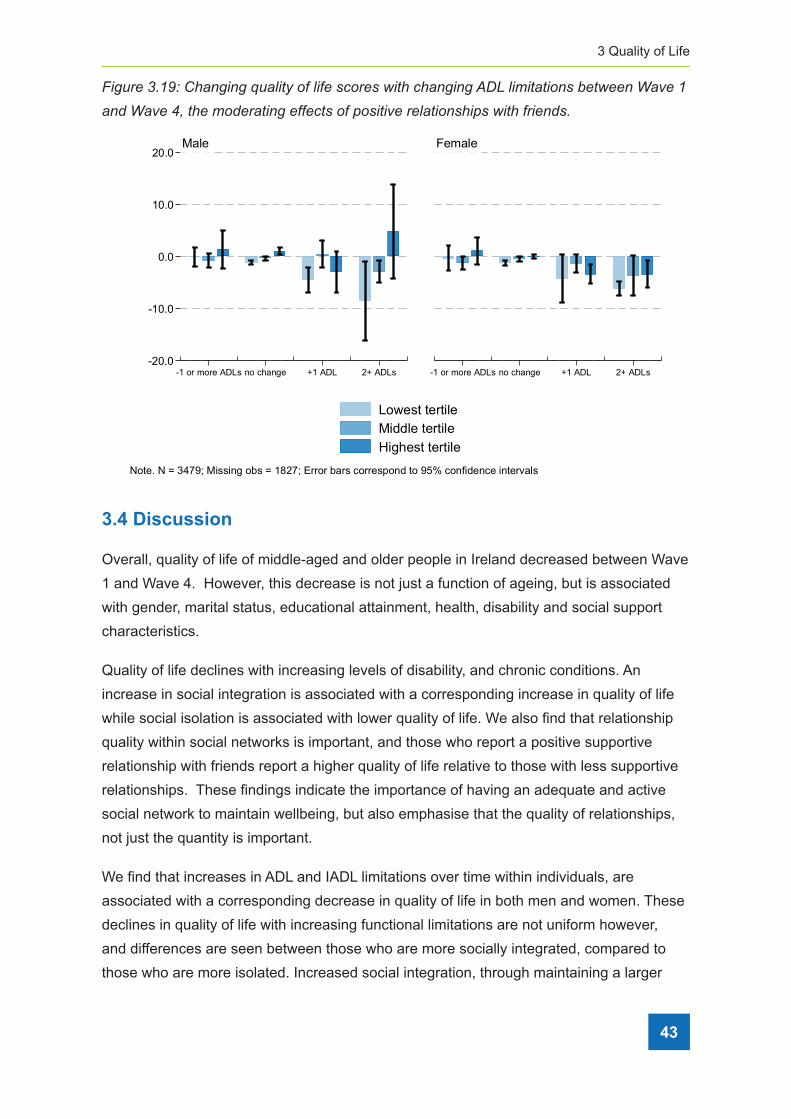
3 Quality of Life
43
Figure 3�19: Changing quality of life scores with changing ADL limitations between Wave 1
and Wave 4, the moderating effects of positive relationships with friends�
-20.0
-10.0
0.0
10.0
20.0
-1 or more ADLs no change +1 ADL 2+ ADLs -1 or more ADLs no change +1 ADL 2+ ADLs
Male Female
Lowest tertileMiddle tertileHighest tertile
Note. N = 3479; Missing obs = 1827; Error bars correspond to 95% confidence intervals
3.4 Discussion
Overall, quality of life of middle-aged and older people in Ireland decreased between Wave
1 and Wave 4. However, this decrease is not just a function of ageing, but is associated
with gender, marital status, educational attainment, health, disability and social support
characteristics.
Quality of life declines with increasing levels of disability, and chronic conditions. An
increase in social integration is associated with a corresponding increase in quality of life
while social isolation is associated with lower quality of life. We also find that relationship
quality within social networks is important, and those who report a positive supportive
relationship with friends report a higher quality of life relative to those with less supportive
relationships. These findings indicate the importance of having an adequate and active
social network to maintain wellbeing, but also emphasise that the quality of relationships,
not just the quantity is important.
We find that increases in ADL and IADL limitations over time within individuals, are
associated with a corresponding decrease in quality of life in both men and women. These
declines in quality of life with increasing functional limitations are not uniform however,
and differences are seen between those who are more socially integrated, compared to
those who are more isolated. Increased social integration, through maintaining a larger

44
Wellbeing and Health in Ireland’s over 50s 2009-2016
social network and positive supportive relationships with friends is associated with higher
quality of life and moderate the association between increasing functional limitations and
lower quality of life. Quality of life remains stable over time for men who have higher social
integration and report positive supportive relationships with friends, even as functional
limitations increase over the six-year period of the study. This moderating effect of social
integration and social relationships is also seen in women, although to a lesser extent.
While social networks may decrease in older people, these findings highlight the
importance of the quality of the social relationships within social support networks for
long-term health and wellbeing. Therefore, consideration should be given to the promotion
of participation in social activities and community groups when treating older adults with
chronic physical health conditions. Maintaining social participation and engagement as we
age is critical to sustain good physical and mental health.
Conclusions
Physical disability should be the target of preventive strategies aiming to enhance
wellbeing in older ages because of its close association with quality of life. Furthermore,
maintaining social relationships and participation is important, but particularly so as people
age and have increasing levels of functional limitations. While functional limitations may be
associated with lower quality of life, supportive social networks and close relationships can
change that association. Policies promoting and enabling continued social participation
and engagement in older age could significantly improve health outcomes, and enhance
healthy and active ageing and maintain quality of life in the ageing population.
3.5 References
1. Ward M, McGarrigle CA, Kenny RA. More than health: quality of life trajectories among
older adults-findings from The Irish Longitudinal Study of Ageing (TILDA). Quality of
life research: an international journal of quality of life aspects of treatment, care and
rehabilitation. 2018.
2. McCrory C, Leahy S, McGarrigle CA. What Factors are Associated with Change in
Older People’s Quality of Life? In: Nolan A, O’Regan C, Dooley C, Wallace D, Hever A,
Cronin H, et al., editors. The Over 50s in a Changing Ireland Economic Circumstances,
Health and Well-Being. Dublin: The Irish Longitudinal Study on Ageing; 2014.
3. Kamiya Y, Murphy C, Savva G, Timonen V. Profile of Community-Dwelling Older
People with Disability and their Caregivers in Ireland. Dublin: The Irish Longitudinal
Study on Ageing; 2012. http://tilda.tcd.ie/publications/reports/pdf/Report_
CaregiversProfile.pdf

3 Quality of Life
45
4. Barry LC, Soulos PR, Murphy TE, Kasl SV, Gill TM. Association between indicators of
disability burden and subsequent depression among older persons. The Journals of
gerontology Series A, Biological Sciences and Medical Sciences. 2013;68(3):286-92.
5. Sexton E, King-Kallimanis BL, Layte R, Hickey A. CASP-19 special section: how
does chronic disease status affect CASP quality of life at older ages? Examining the
WHO ICF disability domains as mediators of this relationship. Aging Ment Health.
2015;19(7):622-33.
6. Burholt V, Scharf T. Poor health and loneliness in later life: the role of depressive
symptoms, social resources, and rural environments. The Journals of Gerontology
Series B, Psychological Sciences and Social Sciences. 2014;69(2):311-24.
7. Seeman TE. Social ties and health: the benefits of social integration. Annals of
epidemiology. 1996;6(5):442-51.
8. Nieminen T, Harkanen T, Martelin T, Borodulin K, Koskinen S. Social capital and all-
cause mortality among Finnish men and women aged 30-79. European Journal of
Public Health. 2015;25(6):972-8.
9. Holt-Lunstad J, Smith TB, Layton JB. Social relationships and mortality risk: a meta-
analytic review. PLoS Medicine. 2010;7(7):e1000316.
10. Wahrendorf M, Siegrist J. Are changes in productive activities of older people
associated with changes in their well-being? Results of a longitudinal European study.
Eur J Ageing. 2010;7(2):59-68.
11. Windsor TD, Anstey KJ. Age differences in psychosocial predictors of positive and
negative affect: a longitudinal investigation of young, midlife, and older adults.
Psychology and Aging. 2010;25(3):641-52.
12. McMunn A, Nazroo J, Wahrendorf M, Breeze E, Zaninotto P. Participation in socially-
productive activities, reciprocity and wellbeing in later life : baseline results in England.
Ageing & Society. 2009;29:765-82.
13. Santini ZI, Koyanagi A, Tyrovolas S, Haro JM. The association of relationship quality
and social networks with depression, anxiety, and suicidal ideation among older
married adults: Findings from a cross-sectional analysis of the Irish Longitudinal Study
on Ageing (TILDA). Journal of Affective Disorders. 2015;179:134-41.

46
Wellbeing and Health in Ireland’s over 50s 2009-2016
14. Sexton E, King-Kallimanis BL, Conroy RM, Hickey A. Psychometric evaluation of
the CASP-19 quality of life scale in an older Irish cohort. Quality of Life Research.
2013;22(9):2549-59.
15. Jivraj S, Nazroo J. Determinants of socioeconomic inequalities in subjective well-
being in later life: a cross-country comparison in England and the USA. Quality of Life
Research. 2014;23(9):2545-58.
16. Carr D, Freedman VA, Cornman JC, Schwarz N. Happy Marriage, Happy Life? Marital
Quality and Subjective Well-Being in Later Life. Journal of Marriage and the Family.
2014;76(5):930-48.
17. Kamiya Y, Doyle M, Henretta JC, Timonen V. Depressive symptoms among older
adults: the impact of early and later life circumstances and marital status. Aging Ment
Health. 2013;17(3):349-57.
18. Berkman LF, Glass T, Brissette I, Seeman TE. From social integration to health:
Durkheim in the new millennium☆. Social Science & Medicine. 2000;51(6):843-57.
19. House J, Robbins C, Metzner H. The association of social relationships and activities
with mortality: Prospective evidence from the Tecumseh Community Health Study. Am
J Epidemiol. 1982;116:123-40.
20. Torres JL, Lima-Costa MF, Marmot M, de Oliveira C. Wealth and Disability in Later Life:
The English Longitudinal Study of Ageing (ELSA). PloS one. 2016;11(11):e0166825.
21. Grundy E, Glaser K. Socio-demographic differences in the onset and progression of
disability in early old age: a longitudinal study. Age Ageing. 2000;29(2):149-57.
22. Gjonca E, Tabassum F, Breeze E. Socioeconomic differences in physical disability at
older age. Journal of Epidemiology and Community Health. 2009;63(11):928-35.
4 Volunteering and social participation
47
ContentsKey Findings
4.1 Introduction ................................................................................................................... 49
4.2 Volunteering and social participation at Wave 4 ........................................................... 50
4.3 Benefits of volunteering and social participation at Wave 4 ......................................... 52
4.4 Weekly volunteering across Waves 1 to 4 .................................................................... 56
4.5 Social participation across Waves 1 to 4 ...................................................................... 57
4.6 Retirement patterns ...................................................................................................... 59
4.7 Volunteering and social participation post retirement ................................................... 60
4.8 Conclusions .................................................................................................................. 61
4.9 References ................................................................................................................... 63
4 Volunteering and social particationMark Ward, Sarah Gibney and Irene Mosca

48
Wellbeing and Health in Ireland’s over 50s 2009-2016
Key Findings
• Volunteering and other forms of social participation are important components of
successful ageing.
• Overall, 18% of older adults in Ireland volunteer weekly while 56% have volunteered
at some time over the previous two years. A similar percentage of men and women
volunteer with rates of volunteering highest among the 65 to 74 year old age group.
• Almost three quarters of older adults participate in active and social leisure activities
each week, while 52% participate in organised groups such as sports groups, book
clubs, or charitable organisations.
• Volunteering and participation in both active and social leisure activities and organised
groups are associated with better quality of life and fewer depressive symptoms.
• The percentage of older adults who volunteer at least monthly and who participate in
social and organised activities was consistent across the four waves of TILDA.
• By Wave 4, 28% of participants were in paid employment and 51% were retired.
• Among those who retired over the course of TILDA, there is little evidence of an
increase in their rates of volunteering or social participation immediately after
retirement.
• While rates of social participation are high, efforts to increase volunteering and social
participation among older adults should be encouraged as these activities provide
benefits not only to the participants but to society.
4 Volunteering andsocial partication
4 Volunteering and social participation
49
4.1 Introduction
Social participation, and particularly productive activities such as caregiving, volunteering,
and informal helping, have been shown to greatly benefit the health and wellbeing of
older adults (1,2). These benefits are wide ranging and include better quality of life,
improved physical and psychological health, and reduced mortality (3–5). As such, social
participation is considered an essential component of successful ageing (6,7). At a
societal level, these activities also strengthen ties within communities by promoting robust
social networks and inter-personal ties which in turn encourage interpersonal trust, and
reciprocity (8,9).
Volunteering is also an important feature of Irish life, as evidenced by the fact that adults
aged 50 years and older in Ireland have the second highest engagement in unpaid
volunteering, after Austria, among the 28 European Member States (6 : p.39). TILDA has
previously highlighted the important and sizeable contribution that older adults make to
society through volunteering their time and expertise to organisations working to better
their communities (7). There is also extensive evidence of the benefits that individuals
accrue from volunteering in terms of their physical (10), psychological (11), and social
wellbeing (12).
In TILDA, information about three different types of social participation - volunteering;
active and social leisure activities; and organised groups - is collected at each wave. As
part of the self-completion questionnaire (SCQ), participants are asked whether they ever
volunteered during the last year and if so, how often they did so: at least once per week; at
least once per month; a few times a year or less; and, never.
There are 14 active and social leisure activities about which information is collected as part
of the SCQ, and these activities are then grouped into four domains using a classification
scheme defined by House et al. (13). These four domains are: intimate social relationships;
formal organisational involvement outside of employment; active and social leisure
activities; and passive and social leisure activities. Our analysis of these activities is limited
to one of these four domains, participation in active and social leisure activities. Active
and social leisure activities include going to films, plays or concerts; attending classes or
lectures; playing cards, bingo, games in general; going to the pub; eating out of the house;
taking part in sport activities or exercise.
Finally, during the main computer-assisted personal interview (CAPI), participants are
asked if they “participate in any groups such as a sports or social group or club, a church
connected group, a self-help or charitable body or other community group or a day care

50
Wellbeing and Health in Ireland’s over 50s 2009-2016
centre?” While this question is distinct from the one asked about volunteering there is
some overlap as participation in some of these groups can involve volunteering.
Over the course of their involvement in TILDA, many participants have retired from paid
employment. The period post-retirement can signal a change in social participation
and volunteering patterns and has been described as an intrusive transition for day-
to-day activities and wellbeing (14). In negative circumstances, retirement can lead
to a loss of purpose and identity, and increase the risk of social marginalisation and
material deprivation. However, retirement may also be associated with increased social
participation and improved mental health and wellbeing, as people are freer to spend their
time as they choose (15). Whether retirement entails increased social activities or a retreat
from social outlets may depend on how prepared individuals are for retirement, the nature
of their retirement, and financial security post-retirement. For example, a greater sense
of control over the decision to retire, rather than being forced to do so, is associated with
more positive outcomes (16).
This Chapter is presented in two sections. In the first section, we describe the rates of
participation in volunteering activities, active and social leisure activities, and organised
groups in adults aged 56 years and over in Ireland at Wave 4 of TILDA. Furthermore, we
show the benefits of each type of activity to older adults’ quality of life and mental health
(depressive symptoms). We then discuss changes in social participation between Wave 1
(2009-2011) and Wave 4 (2016). In the second section, we describe social participation in
among those who retired from paid employment at some point between Wave 1 and Wave
4. Given that more time is available to older adults’ post-retirement to pursue personal
pursuits outside of work, we hypothesised that participation rates would increase among
this cohort.
The sample consists of 3,963 community-dwelling older adults in the Republic of Ireland
who returned a completed SCQ at each of the four waves. All participants were aged
50 years or older during the first Wave in 2009-2011 and over 56 years by Wave 4.
Participants’ age at Wave 4 was used to create age categories (56 to 64 years, 65 to 74
years, and 75 years and older) when presenting results.
4.2 Volunteering and social participation at Wave 4.
In this section, we describe the rates of volunteering and social participation among
participants at Wave 4. We also examine whether different forms of social participation
are associated with differences in quality of life and depressive symptomology. Overall,
18% of older adults in Ireland volunteer at least once per week, 13% volunteer monthly,
25% volunteer less than monthly, while 44% never volunteer. The percentage of men and
4 Volunteering and social participation
51
women who volunteered weekly were similar at 16% and 18% respectively. As shown in
Figure 4.1, men aged 65 to 74 were significantly more likely than their younger peers to
volunteer weekly. The possibility that this difference might be explained by men taking up
regular volunteering upon leaving paid employment at the statutory retirement age of 65
years, is explored more fully later in this Chapter.
Figure 4�1: Frequency of volunteering, by gender and age group�
0.0
20.0
40.0
60.0
56-64 65-74 75+ 56-64 65-74 75+
Male Female
Never Less than monthlyMonthly Daily/weekly
Note. N = 3862; Missing obs = 101; Error bars correspond to 95% confidence intervals
Overall, 74% of adults participate in active and social leisure activities each week, while
52% participate in organised groups such as sports groups, book clubs, or charitable
organisations. Figure 4.2 shows that social participation rates are similar in men and
women. There was a significant decrease in weekly active and social leisure activities
among those 75 and over, while in women only, participation in organised groups was
higher among the 65 to 74 years age group compared to those aged 50 to 64 years.

52
Wellbeing and Health in Ireland’s over 50s 2009-2016
Figure 4�2: Proportion (%) of older people who participated in active and social leisure
activities and organised groups, by gender and age group�
0.0
20.0
40.0
60.0
80.0
Active & social Organised groups Active & social Organised groups
Male Female
56-64 65-74 75+Note. N = 3961; Missing obs = 2; Error bars correspond to 95% confidence intervals
4.3 Benefits of volunteering and social participation at Wave 4
In this section, we examine the associations of social participation with the quality of life
and depressive symptomology of older adults. Increased life expectancy has led to an
attendant increase in interest in the quality of life of older adults. At the same time, our
conceptualisation of quality of life has broadened to encapsulate a more wide-ranging,
holistic assessment of wellbeing beyond the previously narrow view which was defined
rather exclusively as the absence of ill-health. Quality of life has been measured at each
wave of data collection in TILDA using the previously validated Control, Autonomy, Self-
realisation and Pleasure Scale (CASP-12) measurement tool (17,18). This scale captures
information on four domains of the quality of life of older adults. Control refers to the ability
to actively participate in one’s environment; Autonomy is the right of the individual to be
free from the unwanted interference of others; Self-realisation concerns the fulfilment of
one’s potential; while Pleasure refers to the sense of happiness or enjoyment derived from
engaging with life. CASP-12 consists of 12 statements including: I feel left out of things; I
feel satisfied with the way my life has turned out; and I feel free to plan for the future. For
each statement, participants are asked to indicate how often (often, sometimes, not often,
or never) they feel each statement applies to their life. Each item is scored from 0 to 3 and
summed to give an overall score (range 0 to 36) with higher scores denoting better quality
of life.

4 Volunteering and social participation
53
Depressive symptoms were measured using the shorter 8-item version of the Centre for
Epidemiological Studies-Depression (CES-D8) scale (19,20). This validated measurement
tool captures the frequency that participants have experienced a variety of depressive
symptoms within the past week. The total number of positive and negative responses to
the eight statements are summed to give a total CES-D8 score (range 0 to 24) with higher
scores indicating increased depressive symptomology.
Overall, the average quality of life score was high at 27.7 (maximum 36). Quality of life
scores are highest among the 65 to 74 years age group (mean = 28.2) and although lower
among the oldest age group (mean = 26.7), the score remains in the upper quartile. The
average number of depressive symptoms recorded using the CES-D8 was low at 3.0
(maximum 24). Unlike quality of life, there were no significant age related differences in the
number of reported depressive symptoms.
Table 4.1 shows the average CASP-12 and CES-D8 scores by age group and frequency of
volunteering. In general, quality of life increases with increasing frequency of volunteering
and this pattern is consistent within each age group. Similarly, depressive symptoms were
lowest among older adults who volunteer most frequently and highest overall among those
who do not volunteer at all.
54
Wellbeing and Health in Ireland’s over 50s 2009-2016
Table 4�1: Quality of life (CASP-12) and depressive symptoms (CES-D8) by volunteering
and age group�
CASP-12 CES-D8
Mean (95% CI) N Mean (95% CI) N
56-64
Never 26.89 (26.34,27.44) 481 3.33 (2.99,3.67) 516
Less than monthly 28.08 (27.53,28.63) 435 2.85 (2.51,3.19) 445
Monthly 28.23 (27.45,29.02) 191 2.89 (2.40,3.39) 199
Weekly/daily 28.35 (27.59,29.11) 222 2.53 (2.14,2.92) 235
65-74
Never 27.56 (27.08,28.05) 572 3.28 (2.94,3.62) 623
Less than monthly 28.14 (27.61,28.68) 334 2.74 (2.42,3.07) 365
Monthly 29.04 (28.35,29.74) 198 2.54 (2.06,3.01) 208
Weekly/daily 28.98 (28.37,29.58) 304 2.76 (2.38,3.15) 330
75+
Never 25.84 (25.26,26.43) 390 3.62 (3.25,3.99) 464
Less than monthly 26.79 (26.06,27.53) 160 2.54 (2.07,3.01) 180
Monthly 28.16 (27.41,28.91) 106 2.86 (2.31,3.41) 120
Weekly/daily 28.52 (27.82,29.22) 135 3.05 (2.43,3.67) 159
Total
Never 26.89 (26.57,27.21) 1443 3.39 (3.18,3.60) 1603
Less than monthly 27.89 (27.54,28.25) 929 2.76 (2.54,2.97) 990
Monthly 28.56 (28.08,29.03) 495 2.74 (2.43,3.05) 527
Weekly/daily 28.68 (28.27,29.08) 661 2.74 (2.49,3.00) 724
Table 4.2 shows the association between weekly participation in active and social leisure
activities, and organised groups, quality of life and depressive symptoms stratified by age
group. Quality of life was significantly higher among adults who reported both types of
social participation, overall and in each age group. Depressive symptoms were lower in
the 65-74 age group who participate in social activities with a similar trend in the 56-64 age
group. There was no significant difference in depressive symptomology among the over 75s.
4 Volunteering and social participation
55
Table 4�2: Mean quality of life (CASP-12) and CES-D8 depression scores by active and
social leisure activities, and organised groups, by age group�
Active and social leisure activities
CASP-12 CES-D
Mean (95% CI) N Mean (95% CI) N
56-64
No 26.50 (25.79,27.22) 293 3.49 (3.03,3.95) 317
Yes 28.03 (27.68,28.38) 1055 2.86 (2.64,3.07) 1100
65-74
No 26.59 (25.91,27.27) 308 3.50 (3.06,3.94) 346
Yes 28.63 (28.32,28.93) 1134 2.80 (2.58,3.02) 1223
75+
No 25.63 (24.89,26.36) 258 3.44 (3.01,3.87) 310
Yes 27.27 (26.84,27.71) 556 3.11 (2.80,3.42) 649
Total
No 26.28 (25.87,26.69) 859 3.48 (3.21,3.74) 973
Yes 28.14 (27.93,28.35) 2745 2.89 (2.74,3.03) 2972
Organised groups
56-64
No 27.07 (26.60,27.54) 649 3.27 (2.97,3.58) 688
Yes 28.30 (27.88,28.72) 699 2.73 (2.49,2.98) 729
65-74
No 27.27 (26.81,27.74) 602 3.31 (3.00,3.61) 662
Yes 28.91 (28.56,29.26) 839 2.67 (2.43,2.91) 906
75+
No 25.70 (25.13,26.27) 359 3.53 (3.12,3.94) 436
Yes 27.64 (27.18,28.11) 454 2.94 (2.64,3.23) 522
Total
No 26.85 (26.56,27.15) 1610 3.35 (3.14,3.55) 1786
Yes 28.42 (28.18,28.66) 1992 2.75 (2.60,2.90) 2157
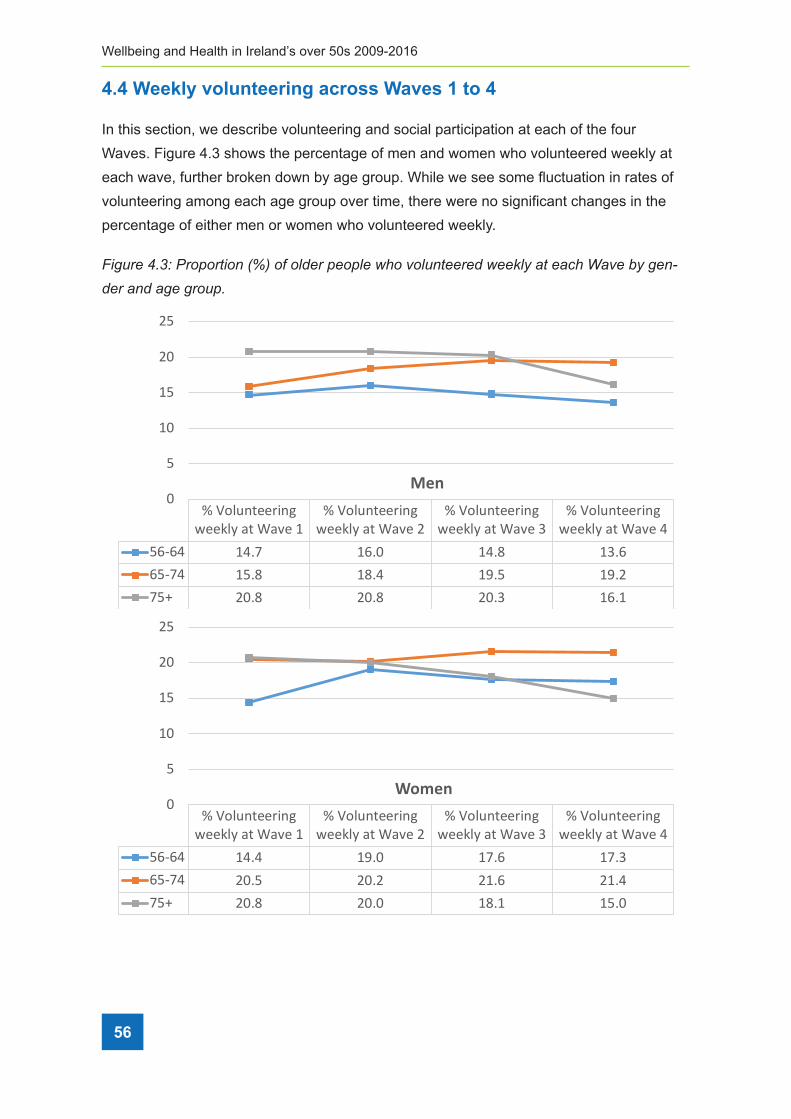
56
Wellbeing and Health in Ireland’s over 50s 2009-2016
4.4 Weekly volunteering across Waves 1 to 4
In this section, we describe volunteering and social participation at each of the four
Waves. Figure 4.3 shows the percentage of men and women who volunteered weekly at
each wave, further broken down by age group. While we see some fluctuation in rates of
volunteering among each age group over time, there were no significant changes in the
percentage of either men or women who volunteered weekly.
Figure 4�3: Proportion (%) of older people who volunteered weekly at each Wave by gen-
der and age group�b,>:#/%67B]#c#3@3#9,3.%RNS%3D%3='/#%@/3@=/%O*3%A3=:.9//#/'%O//$=0%"9%/"5*%O"A/%-0%>/.'/#%".'%">/%>#3:@#
#
##!"J#A-3+&.#4&10+3+4&0+-'#&31-**#>&,)*#9#0-#!#b,>:#/%676%4*3O4%9*/%@/#5/.9">/%3D%H/.%".'%O3H/.%O*3%@"#9,5,@"9/'%,.%"59,A/%".'%435,"=%
=/,4:#/%"59,A,9,/4%"9%/"5*%O"A/7%),H,="#%93%9*/%@"99/#.%3-4/#A/'%D3#%A3=:.9//#,.>1%9*/#/%.3%
5*".>/%,.%9*/%@/#5/.9">/%3D%H/.%".'%O3H/.%@"#9,5,@"9,.>%,.%"59,A/%".'%435,"=%=/,4:#/%
"59,A,9,/4%"5#344%"==%O"A/47%P>",.1%9*,4%@"99/#.%O"4%53.4,49/.9%O,9*,.%/"5*%3D%9*/%9*#//%">/%
>#3:@47%%
%
%
!"#$%&'())*+',-)).%/"0("102)"3
!"#$%&'())*+',-)).%/"0("102)"4
!"#$%&'())*+',-)).%/"0("102)"5
!"#$%&'())*+',-)).%/"0("102)"6
78986 36:; 38:< 36:= 35:8879;6 37:= 3=:6 3>:7 3>:4;7? 4<:= 4<:= 4<:5 38:3
<
7
3<
37
4<
47
!"#
!"#$%&'())*+',-)).%/"0("102)"3
!"#$%&'())*+',-)).%/"0("102)"4
!"#$%&'())*+',-)).%/"0("102)"5
!"#$%&'())*+',-)).%/"0("102)"6
78986 36:6 3>:< 3;:8 3;:5879;6 4<:7 4<:4 43:8 43:6;7? 4<:= 4<:< 3=:3 37:<
<
7
3<
37
4<
47
$%&"#

4 Volunteering and social participation
57
4.5 Social participation across Waves 1 to 4
Figure 4.4 shows the percentage of men and women who participated in active and social
leisure activities at each wave. Similar to the pattern observed for volunteering, there was
no change in the percentage of men and women participating in active and social leisure
activities across the waves. Again, this pattern was consistent within each of the three age
groups.
Figure 4�4: Proportion (%) of older people who engaged in active and social leisure activi-
ties at each wave by gender and age group�b,>:#/%676]#c#3@3#9,3.%RNS%3D%3='/#%@/3@=/%O*3%/.>">/'%,.%"&$%*+)"(,)-'&%".).+%-/#+)"&$%*%$%+-)"9%/"5*%&"A/%-0%>/.'/#%".'%">/%>#3:@%
%%
%
%#b,>:#/%67E%4*3O4%9*"9%9*/#/%O"4%43H/%D=:59:"9,3.%-/9O//.%O"A/4%,.%9*/%@/#5/.9">/%3D%3='/#%
"':=94%O*3%@"#9,5,@"9/'%O//$=0%,.%3#>".,4/'%>#3:@47%PH3.>%H/.1%9*/#/%O"4%43H/%/A,'/.5/%
3D%".%,.5#/"4/%,.%9*,4%D3#H%3D%@"#9,5,@"9,3.%"H3.>%9*/%3='/49%">/%>#3:@4%-/9O//.%&"A/4%8%
".'%;1%*3O/A/#1%9*,4%5*".>/%O"4%.39%4,>.,D,5".97%T*/%9#/.'%"D9/#%&"A/%;1%O"4%D3#%"%'/5#/"4/%
,.%@"#9,5,@"9,3.%,.%3#>".,^/'%>#3:@4%"=9*3:>*%">",.1%9*/%'/5=,./%O"4%.39%4,>.,D,5".97%%
%
!"@A(+2)"0'BC$A+0%"%)+C&*)0A(+2+(+)C/"0(
102)"3
!"@A(+2)"0'BC$A+0%"%)+C&*)
0A(+2+(+)C"0("102)4
!"@A(+2)"0'BC$A+0%"%)+C&*)
0A(+2+(+)C"0("102)5
!"@A(+2)"0'BC$A+0%"%)+C&*)
0A(+2+(+)C"0("102)6
78986 ;8:5 ;8:5 ;5:5 ;7:4879;6 =3:6 =<:8 =<:6 ;>:5;7? ;5:> ;4:6 ;<:> 8;:7
<3<4<5<6<7<8<;<=<><
!"#
!"@A(+2)"0'BC$A+0%"%)+C&*)
0A(+2+(+)C"0("102)3
!"@A(+2)"0'BC$A+0%"%)+C&*)
0A(+2+(+)C"0("102)4
!"@A(+2)"0'BC$A+0%"%)+C&*)
0A(+2+(+)C"0("102)5
!"@A(+2)"0'BC$A+0%"%)+C&*)
0A(+2+(+)C"0("102)6
78986 ;8:5 ;7:4 ;;:8 ;;:;879;6 ;6:4 ;7:> ;6:8 ;7:<;7? 8;:4 85:7 86:= 85:6
<3<4<5<6<7<8<;<=<><
$%&"#
b,>:#/%676]#c#3@3#9,3.%RNS%3D%3='/#%@/3@=/%O*3%/.>">/'%,.%"&$%*+)"(,)-'&%".).+%-/#+)"&$%*%$%+-)"9%/"5*%&"A/%-0%>/.'/#%".'%">/%>#3:@%
%%
%
%#b,>:#/%67E%4*3O4%9*"9%9*/#/%O"4%43H/%D=:59:"9,3.%-/9O//.%O"A/4%,.%9*/%@/#5/.9">/%3D%3='/#%
"':=94%O*3%@"#9,5,@"9/'%O//$=0%,.%3#>".,4/'%>#3:@47%PH3.>%H/.1%9*/#/%O"4%43H/%/A,'/.5/%
3D%".%,.5#/"4/%,.%9*,4%D3#H%3D%@"#9,5,@"9,3.%"H3.>%9*/%3='/49%">/%>#3:@4%-/9O//.%&"A/4%8%
".'%;1%*3O/A/#1%9*,4%5*".>/%O"4%.39%4,>.,D,5".97%T*/%9#/.'%"D9/#%&"A/%;1%O"4%D3#%"%'/5#/"4/%
,.%@"#9,5,@"9,3.%,.%3#>".,^/'%>#3:@4%"=9*3:>*%">",.1%9*/%'/5=,./%O"4%.39%4,>.,D,5".97%%
%
!"@A(+2)"0'BC$A+0%"%)+C&*)0A(+2+(+)C/"0(
102)"3
!"@A(+2)"0'BC$A+0%"%)+C&*)
0A(+2+(+)C"0("102)4
!"@A(+2)"0'BC$A+0%"%)+C&*)
0A(+2+(+)C"0("102)5
!"@A(+2)"0'BC$A+0%"%)+C&*)
0A(+2+(+)C"0("102)6
78986 ;8:5 ;8:5 ;5:5 ;7:4879;6 =3:6 =<:8 =<:6 ;>:5;7? ;5:> ;4:6 ;<:> 8;:7
<3<4<5<6<7<8<;<=<><
!"#
!"@A(+2)"0'BC$A+0%"%)+C&*)
0A(+2+(+)C"0("102)3
!"@A(+2)"0'BC$A+0%"%)+C&*)
0A(+2+(+)C"0("102)4
!"@A(+2)"0'BC$A+0%"%)+C&*)
0A(+2+(+)C"0("102)5
!"@A(+2)"0'BC$A+0%"%)+C&*)
0A(+2+(+)C"0("102)6
78986 ;8:5 ;7:4 ;;:8 ;;:;879;6 ;6:4 ;7:> ;6:8 ;7:<;7? 8;:4 85:7 86:= 85:6
<3<4<5<6<7<8<;<=<><
$%&"#
activities at Wave1
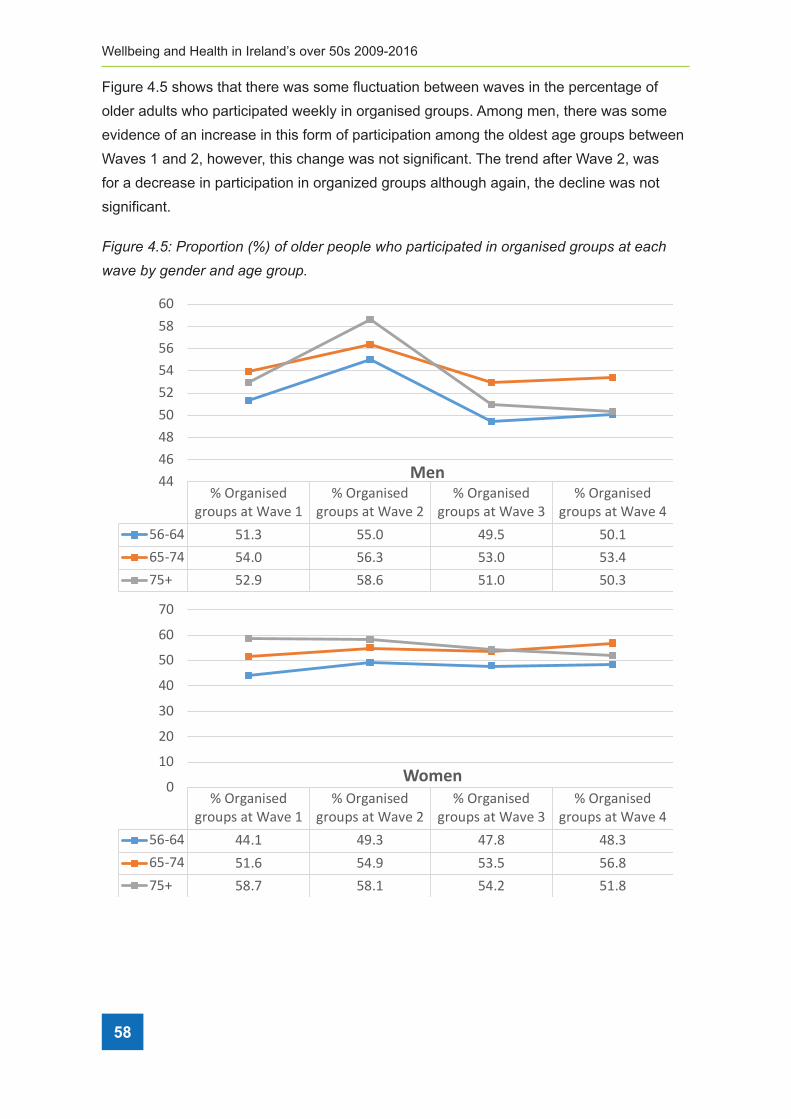
58
Wellbeing and Health in Ireland’s over 50s 2009-2016
Figure 4.5 shows that there was some fluctuation between waves in the percentage of
older adults who participated weekly in organised groups. Among men, there was some
evidence of an increase in this form of participation among the oldest age groups between
Waves 1 and 2, however, this change was not significant. The trend after Wave 2, was
for a decrease in participation in organized groups although again, the decline was not
significant.
Figure 4�5: Proportion (%) of older people who participated in organised groups at each
wave by gender and age group�b,>:#/%67E]#c#3@3#9,3.%RNS%3D%3='/#%@/3@=/%O*3%@"#9,5,@"9/'%,.%3#>".,4/'%>#3:@4%"9%/"5*%&"A/%-0%>/.'/#%".'%">/%>#3:@%
%
%%
%
!"N#T)0+1)U)'0#4&00)1'*#G/9,#/H/.9%D#3H%@",'%/H@=30H/.9%=/"'4%93%H".0%5*"==/.>/4%".'%3@@3#9:.,9,/4%D3#%3='/#%
"':=941%"H3.>%9*/H%,.5#/"4/'%"A",="-,=,90%3D%9,H/%,.%O*,5*%93%@:#4:/%@/#43."=%@:#4:,94%
3:94,'/%3D%9*/%/53.3H,5%'3H",.7%+,A/.%9*/%53H@"#"9,A/=0%*,>*%#"9/4%3D%A3=:.9//#,.>%,.%
2#/=".'%WFX1%,9%,4%#/"=,49,5%93%*0@39*/4,4/%9*"9%,.',A,':"=4%H"0%-/%H3#/%=,$/=0%93%@"#9,5,@"9/%,.%
A3=:.9"#0%"59,A,9,/4%:@3.%9*/,#%#/9,#/H/.97%T3%9/49%O*/9*/#%9*,4%*0@39*/4,4%,4%9#:/1%O/%'/45#,-/%
9*/%#/9,#/H/.9%@"99/#.4%3-4/#A/'%"H3.>%T2UVP%@"#9,5,@".94%-/D3#/%9/49,.>%O*/9*/#%9*34/%
!"D*,0'+C)B,*$&EC"0("102)"3
!"D*,0'+C)B,*$&EC"0("102)"4
!"D*,0'+C)B,*$&EC"0("102)"5
!"D*,0'+C)B,*$&EC"0("102)"6
78986 73:5 77:< 6>:7 7<:3879;6 76:< 78:5 75:< 75:6;7? 74:> 7=:8 73:< 7<:5
66686=7<7476787=8<
!"#
!"D*,0'+C)B,*$&EC"0("102)"3
!"D*,0'+C)B,*$&EC"0("102)"4
!"D*,0'+C)B,*$&EC"0("102)"5
!"D*,0'+C)B,*$&EC"0("102)"6
78986 66:3 6>:5 6;:= 6=:5879;6 73:8 76:> 75:7 78:=;7? 7=:; 7=:3 76:4 73:=
<
3<
4<
5<
6<
7<
8<
;<
$%&"#
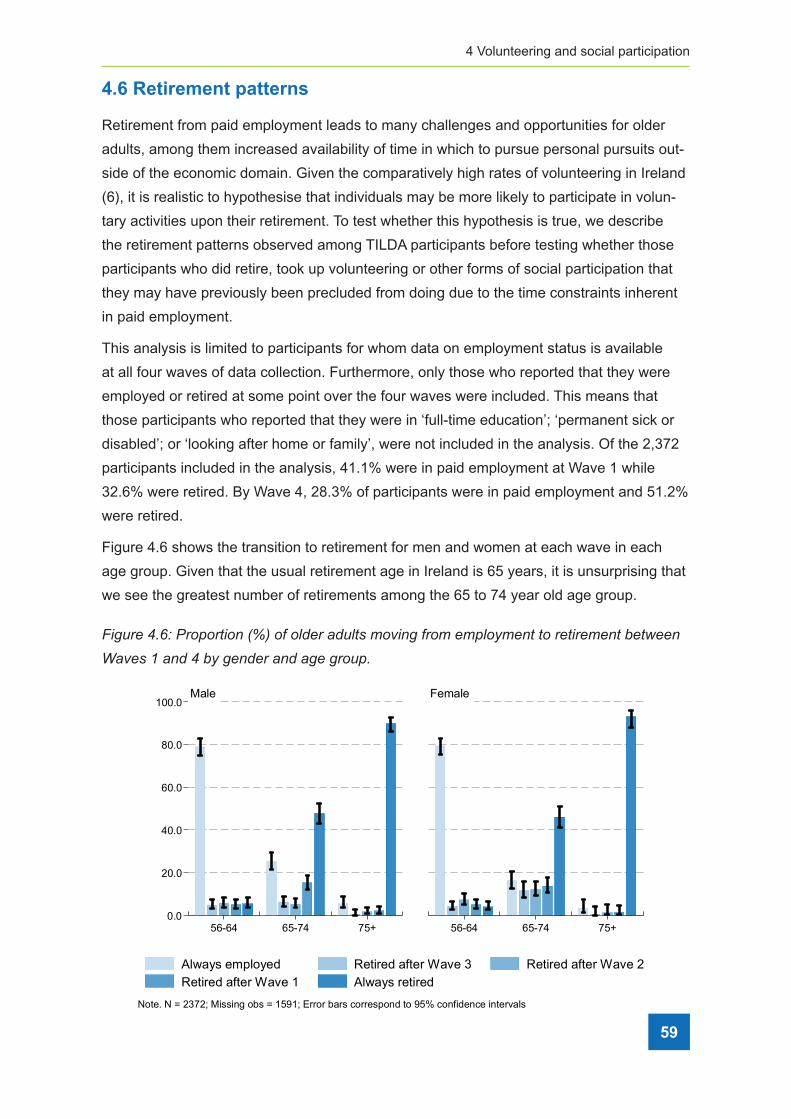
4 Volunteering and social participation
4.6 Retirement patterns
Retirement from paid employment leads to many challenges and opportunities for older
adults, among them increased availability of time in which to pursue personal pursuits out-
side of the economic domain. Given the comparatively high rates of volunteering in Ireland
(6), it is realistic to hypothesise that individuals may be more likely to participate in volun-
tary activities upon their retirement. To test whether this hypothesis is true, we describe
the retirement patterns observed among TILDA participants before testing whether those
participants who did retire, took up volunteering or other forms of social participation that
they may have previously been precluded from doing due to the time constraints inherent
in paid employment.
This analysis is limited to participants for whom data on employment status is available
at all four waves of data collection. Furthermore, only those who reported that they were
employed or retired at some point over the four waves were included. This means that
those participants who reported that they were in ‘full-time education’; ‘permanent sick or
disabled’; or ‘looking after home or family’, were not included in the analysis. Of the 2,372
participants included in the analysis, 41.1% were in paid employment at Wave 1 while
32.6% were retired. By Wave 4, 28.3% of participants were in paid employment and 51.2%
were retired.
Figure 4.6 shows the transition to retirement for men and women at each wave in each
age group. Given that the usual retirement age in Ireland is 65 years, it is unsurprising that
we see the greatest number of retirements among the 65 to 74 year old age group.
Figure 4�6: Proportion (%) of older adults moving from employment to retirement between
Waves 1 and 4 by gender and age group�
0.0
20.0
40.0
60.0
80.0
100.0
56-64 65-74 75+ 56-64 65-74 75+
Male Female
Always employed Retired after Wave 3 Retired after Wave 2Retired after Wave 1 Always retired
Note. N = 2372; Missing obs = 1591; Error bars correspond to 95% confidence intervals
59
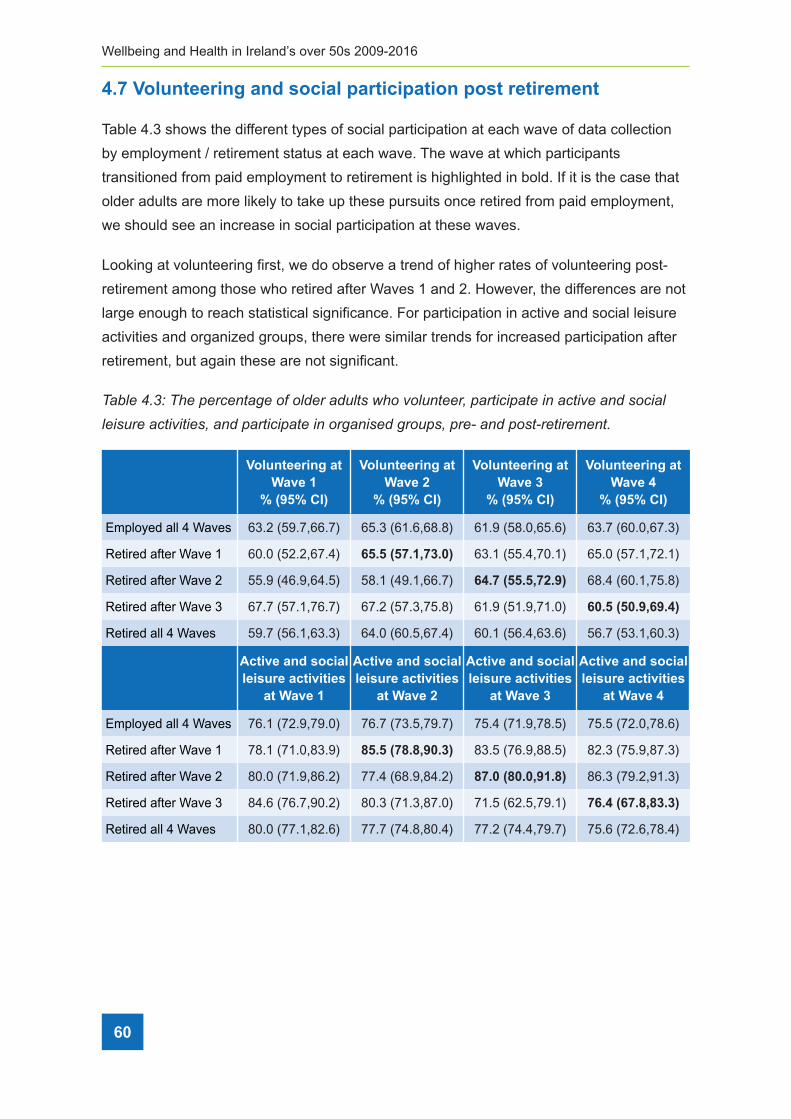
60
Wellbeing and Health in Ireland’s over 50s 2009-2016
4.7 Volunteering and social participation post retirement
Table 4.3 shows the different types of social participation at each wave of data collection
by employment / retirement status at each wave. The wave at which participants
transitioned from paid employment to retirement is highlighted in bold. If it is the case that
older adults are more likely to take up these pursuits once retired from paid employment,
we should see an increase in social participation at these waves.
Looking at volunteering first, we do observe a trend of higher rates of volunteering post-
retirement among those who retired after Waves 1 and 2. However, the differences are not
large enough to reach statistical significance. For participation in active and social leisure
activities and organized groups, there were similar trends for increased participation after
retirement, but again these are not significant.
Table 4�3: The percentage of older adults who volunteer, participate in active and social
leisure activities, and participate in organised groups, pre- and post-retirement�
Volunteering at Wave 1
% (95% CI)
Volunteering at Wave 2
% (95% CI)
Volunteering at Wave 3
% (95% CI)
Volunteering at Wave 4
% (95% CI)
Employed all 4 Waves 63.2 (59.7,66.7) 65.3 (61.6,68.8) 61.9 (58.0,65.6) 63.7 (60.0,67.3)
Retired after Wave 1 60.0 (52.2,67.4) 65.5 (57.1,73.0) 63.1 (55.4,70.1) 65.0 (57.1,72.1)
Retired after Wave 2 55.9 (46.9,64.5) 58.1 (49.1,66.7) 64.7 (55.5,72.9) 68.4 (60.1,75.8)
Retired after Wave 3 67.7 (57.1,76.7) 67.2 (57.3,75.8) 61.9 (51.9,71.0) 60.5 (50.9,69.4)
Retired all 4 Waves 59.7 (56.1,63.3) 64.0 (60.5,67.4) 60.1 (56.4,63.6) 56.7 (53.1,60.3)
Active and social leisure activities
at Wave 1
Active and social leisure activities
at Wave 2
Active and social leisure activities
at Wave 3
Active and social leisure activities
at Wave 4
Employed all 4 Waves 76.1 (72.9,79.0) 76.7 (73.5,79.7) 75.4 (71.9,78.5) 75.5 (72.0,78.6)
Retired after Wave 1 78.1 (71.0,83.9) 85.5 (78.8,90.3) 83.5 (76.9,88.5) 82.3 (75.9,87.3)
Retired after Wave 2 80.0 (71.9,86.2) 77.4 (68.9,84.2) 87.0 (80.0,91.8) 86.3 (79.2,91.3)
Retired after Wave 3 84.6 (76.7,90.2) 80.3 (71.3,87.0) 71.5 (62.5,79.1) 76.4 (67.8,83.3)
Retired all 4 Waves 80.0 (77.1,82.6) 77.7 (74.8,80.4) 77.2 (74.4,79.7) 75.6 (72.6,78.4)

4 Volunteering and social participation
61
Organised groups at
Wave 1
Organised groups at
Wave 2
Organised groups at
Wave 3
Organised groups at
Wave 4
Employed all 4 Waves 53.6 (50.0,57.2) 57.1 (53.6,60.6) 51.1 (47.3,54.8) 51.7 (47.9,55.4)
Retired after Wave 1 48.7 (41.3,56.2) 56.5 (48.6,64.0) 60.2 (52.6,67.4) 62.2 (54.5,69.3)
Retired after Wave 2 57.7 (49.3,65.6) 60.3 (51.9,68.1) 68.5 (59.9,76.1) 65.0 (56.5,72.6)
Retired after Wave 3 55.2 (45.6,64.3) 50.3 (41.0,59.5) 51.6 (42.1,61.0) 53.2 (43.9,62.4)
Retired all 4 Waves 60.2 (57.0,63.4) 62.5 (59.0,65.8) 55.7 (52.1,59.2) 57.2 (53.7,60.6)
Finally, we show the percentage of adults who participate in any of the three types of
activities (volunteering; participation in active and social leisure activities; and participation
in organised groups) at each wave by employment/retirement status. Encouragingly, more
than 90% of adults participate in at least one of these activities, with many participating in
more than one. Table 4.4 shows the percentage doing so at each wave, again broken into
groups according to the timing of their transition from employment to retirement. Similar
to above, the largest increase in participation was observed among those who first report
being retired after Wave 2.
Table 4�4: The percentage of older adults who volunteer or participate in active and social
leisure activities or participate in organised groups, pre- and post-retirement�
Any participation at
Wave 1
Any participation at
Wave 2
Any participation at
Wave 3
Any participation at
Wave 1
Employed all 4 Waves 92.1 (89.9,93.9) 93.8 (91.8,95.3) 90.5 (88.0,92.5) 92.4 (90.2,94.2)
Retired after Wave 1 92.2 (86.6,95.6) 92.1 (86.8,95.4) 94.4 (89.5,97.1) 95.2 (90.5,97.6)
Retired after Wave 2 91.7 (85.3,95.4) 90.5 (83.7,94.6) 97.3 (92.7,99.1) 96.5 (90.6,98.7)
Retired after Wave 3 94.6 (87.6,97.8) 92.0 (84.5,96.1) 88.4 (80.7,93.3) 90.4 (83.0,94.8)
Retired all 4 Waves 93.0 (91.0,94.6) 92.4 (90.4,94.1) 91.0 (88.7,92.8) 91.4 (89.3,93.2)
4.8 Conclusions
There are high rates of volunteering and participation in both active and social leisure
activities and organised groups among older adults in Ireland. Taking part in these
activities is associated with better quality of life and fewer depressive symptoms. While this
clearly demonstrates that volunteering and social participation are important features of
successful ageing, the fact that more than half (56%) of older adults volunteered their time
and expertise at some stage, and almost one-in-five do so on a weekly basis, highlights
the important contribution that older adults make to the economic, social, cultural, and

62
Wellbeing and Health in Ireland’s over 50s 2009-2016
community wellbeing of the population. Similarly, the high rates of participation in active
and social leisure activities suggests that a large majority of older adults maintain active
friendships and kinship into middle and older age. This benefits all participants in terms of
reciprocity which is an essential feature of these relationships as well as being essential to
social cohesion.
There was little or no change in participation rates across the four waves among this
cohort. This suggests that these behaviours may be established in earlier adulthood
meaning that individuals who volunteer or are socially active continue these activities into
older age rather than withdrawing from or taking them up for the first time at this stage
of their lives. This is somewhat unsurprising when viewed within the context of the high
overall participation rates. For example, the fact that three quarters of participants are
engaged weekly in active and social leisure activities means that there is limited scope
to detect an increase in participation rates over the short, six year period between the
first and last Wave of data collection. Furthermore, the comparatively small number of
participants who do not take part in these activities may have any number of reasons
for not doing so, ranging from personal preference to disabilities. Future research can
potentially identify some of these inhibitors to greater participation.
Retirement from paid employment is clearly an important transitional period in people’s
lives and is a time when one might expect to see change in their involvement in social
activities. While we found some evidence of a general trend of increased volunteering
immediately after retirement, in the main, the observed increases were not significant.
Again, there are a number of potential reasons for this. On the one hand, many
participants may prefer not to replace paid employment with other activities. On the
other hand, there may be structural reasons such as a lack of opportunities for social
participation, or indeed, an absence of information on the types of activities available to
people.
Despite the fact that large numbers of older adults are socially active, a sizeable proportion
are not, and it appears that this is not solely due to constraints on available time due
to employment commitments. From a research perspective, it is therefore important to
identify enablers and barriers to social participation among older adults in Ireland. In terms
of policy, current efforts to promote and support participation should be further extended to
include even more people. This is especially important in light of the benefits accrued from
social participation, not only to the participants themselves but to society more generally.

4 Volunteering and social participation
63
4.9 References
1. Matz-Costa C, James JB, Ludlow L, Brown M, Besen E, Johnson C. The Meaning
and Measurement of Productive Engagement in Later Life. Soc Indic Res.
2014;118(3):1293–314.
2. McMunn A, Nazroo J, Wahrendorf M, Breeze E, Zaninotto P. Participation in socially-
productive activities, reciprocity and wellbeing in later life: Baseline results in England.
Ageing Soc. 2009;29(5):765–82.
3. Bowling A, Banister D, Sutton S, Evans O, Windsor J. A multidimensional model of the
quality of life in older age. Aging Ment Heal. 2002;6(4):355–71.
4. Huxhold O, Miche M, Schüz B. Benefits of having friends in older ages: Differential
effects of informal social activities on well-being in middle-aged and older adults.
Journals Gerontol - Ser B Psychol Sci Soc Sci. 2014;69(3):366–75.
5. Layte R, Sexton E, Savva G. Quality of life in older age: Evidence from an Irish cohort
study. J Am Geriatr Soc. 2013;61(SUPPL2):299–305.
6. Department of Health. Positive Ageing 2016. National Indicators Report. 2016;135.
Dublin; Department of Health.
7. Ward M, Mcgarrigle C. The Contribution of Older Adults to their Families and
Communities. In: McGarrigle C, Donoghue O, Scarlett S, Kenny RA, editors. Health
and Wellbeing: Active Ageing for Older Adults in Ireland Evidence from The Irish
Longitudinal Study on Ageing. Dublin; 2017.
http://tilda.tcd.ie/publications/reports/pdf/w3-key-findings-report/Chapter%202.pdf
8. Putnam RD. Bowling alone: The collapse and revival of American community. New
York: Simon & Schuster; 2000.
9. Nummela O, Sulander T, Rahkonen O, Karisto A, Uutela A. Social participation, trust
and self-rated health: A study among ageing people in urban, semi-urban and rural
settings. Heal Place. 2008;14(2):243–53.
10. Jung Y, Gruenewald TL, Seeman TE, Sarkisian CA. Productive Activities and
Development of Frailty in Older Adults. Geriatrics. 2010;(August):256–61.
11. Lum TY, Lightfoot E. The effects of volunteering on the physical and mental health of
older people. Res Aging. 2005;27(1):31–55.
12. Son J, Wilson J. Volunteer Work and Hedonic, Eudemonic, and Social Well-Being.
Sociol Forum. 2012;27(3):658–81.

64
Wellbeing and Health in Ireland’s over 50s 2009-2016
13. House J, Robbins C MH. The association of social relationships and activities with
mortality: Prospective evidence from the Tecumseh Community Health Study. Am J
Epidemiol. 1982;116:123–40.
14. Weiss RS. The Experience of Retirement. New York: Cornell University Press; 2005.
15. Van den Bogaard L, Kalmijn M. So now what ? Effects of retirement on civic
engagement. 2013.
16. de Vaus D, Wells Y, Kendig H, Quine S. Does gradual retirement have better
outcomes than abrupt retirement? Results from an Australian panel study. Ageing Soc.
2007;27(5):667–82.
17. Sexton E, King-Kallimanis BL, Conroy RM, Hickey A. Psychometric evaluation of the
CASP-19 quality of life scale in an older Irish cohort. Qual Life Res. 2013;22(9):2549–
59.
18. Wiggins RD, Netuveli G, Hyde M, Higgs P, Blane D. The evaluation of a self-
enumerated scale of quality of life (CASP-19) in the context of research on
ageing: A combination of exploratory and confirmatory approaches. Soc Indic Res.
2008;89(1):61–77.
19. Briggs R, Carey D, O’Halloran AM, Kenny RA. Validation of the 8-item Centre for
Epidemiological Studies Depression Scale in a cohort of community-dwelling older
people: data from The Irish Longitudinal Study on Ageing (TILDA). Eur Geriatr Med.
2018;9(1):121–6.
20. Radloff LS. A Self-Report Depression Scale for Research in the General Population.
Appl Psychol Meas. 1977;1(3):385–401.
5 Living conditions of adults in Ireland
65
ContentsKey findings ........................................................................................................................ 66
Introduction ......................................................................................................................... 67
5.1 Housing characteristics ................................................................................................ 68
5�1�1 Location of home ����������������������������������������������������������������������������������������������� 68
5�1�2 Construction dates ��������������������������������������������������������������������������������������������� 68
5�1�3 Ownership details ���������������������������������������������������������������������������������������������� 69
5�1�4 Living situation ��������������������������������������������������������������������������������������������������� 69
5.2 Housing modifications .................................................................................................. 69
5�2�1 Cost of modifications by age group ������������������������������������������������������������������� 71
5�2�2 Cost of modifications by location ����������������������������������������������������������������������� 71
5.3 Housing conditions ....................................................................................................... 71
5�3�1 Distribution of reported housing problems ��������������������������������������������������������� 73
5�3�2 Changes in problematic housing conditions between Wave 3 and Wave 4 ������ 75
5.4 Heating ......................................................................................................................... 75
5�4�1 Central heating and heating difficulties �������������������������������������������������������������� 75
5�4�2 Heating difficulties and self-rated health ������������������������������������������������������������ 76
5.5 Neighbourhood social cohesion ................................................................................... 77
5�5�1 Demographic characteristics of neighbourhood social cohesion ����������������������� 78
5�5�2 Neighbourhood social cohesion and social integration ������������������������������������� 80
5�5�3 Neighbourhood social cohesion and self-rated health ��������������������������������������� 80
5�5�4 Neighbourhood social cohesion and depressive symptoms ������������������������������ 81
5�5�5 Neighbourhood social cohesion and anxiety ����������������������������������������������������� 82
5�5�6 Neighbourhood social cohesion and quality of life �������������������������������������������� 83
5.6 Conclusions .................................................................................................................. 84
5.7 References ................................................................................................................... 86
5 Living conditions of adults in IrelandSinéad McLoughlin and Siobhán Scarlett

Wellbeing and Health in Ireland’s over 50s 2009-2016
66
Key Findings
• Adults living in homes constructed prior to 1971 were twice as likely to have added
modifications to their home than those living in newer builds (24-28% vs. 12-13%).
• 19.1% of adults have added modifications to their home, with average costs spent on
these modifications higher in Dublin city or county (€8,574), compared to another town
or city (€5,098) or a rural area (€5,097).
• 57.8% of adults reported problematic housing conditions. 21.6% of adults who reported
three or more problematic housing conditions at Wave 3, reported the same at Wave 4.
• The most prevalent housing condition at Wave 2 was damp, mould or moisture, and
this remains the case at Wave 4 (46.3%).
• There was a decrease of 4.6% in adults reporting problems heating their home from
Wave 3 to Wave 4 possibly attributable to new policy initiatives.
• Similar to findings from Wave 2, there was a large disparity in problems with
heating the home between dwellings in Dublin city or county (50.4%) compared
to a rural area (24.4%).
• Location differences were apparent in reporting of neighbourhood social cohesion.
54.3% of participants living in rural areas reported high neighbourhood social cohesion
compared to 18.6% of participants living in Dublin city or county.
• Adults who reported low neighbourhood social cohesion are more likely to report their
health as fair or poor (20%) compared to those who report high neighbourhood social
cohesion (14%).
• Lowest quality of life scores were reported by participants experiencing low
neighbourhood social cohesion living in another town or city (24.8) compared to those
living in Dublin city or county (30.1).
5 Living conditions of adults in Ireland

5 Living conditions of adults in Ireland
67
Introduction
A suitable living environment is important to maintain the ability to live independently (1).
Life satisfaction of older people has been shown to be impacted by the conditions of their
home (2). As people age, they may experience lower functional abilities and poorer health
which can lead to the home becoming unsuitable for their needs (3). It has been shown
that the majority of older persons want to age in place, therefore modifications to homes
become increasingly necessary to ensure suitability as care needs increase.
A TILDA report on the housing conditions of Ireland’s older population was published in
2012 (4). The report highlighted that the majority of older adults (59%) experienced a
problem with the condition of their home such as damp/mould, structural, pests or noise
problems, while around a quarter reported difficulties in heating their home (4). Adults aged
50 years and over who reported heating difficulties were more likely to have poorer self-
rated health and depressive symptoms (4). Recommendations within the report suggest
that policies targeting housing quality and heating could potentially improve physical and
mental health.
The Sustainable Energy Authority of Ireland (SEAI) provides a number of grants targeting
energy performance, efficiency and warmth in homes. The Better Energy Homes scheme
(5) is available to all homeowners in dwellings constructed prior to 2006 (for insulation
and heating control system grants), or 2011 (for heat pump and solar thermal grants).
The Better Energy Warmer Homes scheme (6) is available to homeowners in dwellings
built prior to 2006 and who are in receipt of certain welfare payments including the fuel
allowance. The Warmth and Wellbeing scheme (7) launched in 2016 and aimed to
supplement the Better Energy Homes scheme. Warmth and Wellbeing is available for
children aged 0-12 and adults aged 55 years and over who live with a chronic respiratory
disease. The scheme was initially only available to residents in Dublin 12 and 24. In
2017, it was announced that the Warmth and Wellbeing scheme would receive additional
funding and be extended to Dublin 8, 10 and 22. The impact of the Warmth and Wellbeing
scheme will be seen in coming years. Additional schemes targeting the needs of the older
population and administered through local authorities are also available. The Mobility
Aids Grant scheme (8) provides funding for older adults, or adults with a disability who
require works to address mobility issues in their home (e.g. grab rails, ramps, stair lift). The
Housing Aid for Older Persons scheme (9) is available for adults aged 66 years and older,
providing funding to improve the condition of older peoples’ homes.

Wellbeing and Health in Ireland’s over 50s 2009-2016
68
Household characteristics also incorporate who is living in the household. The proportion
of older adults living alone increases with advancing age in most countries in Western
Europe. Living alone can allow older adults to maintain independence and build self-
esteem (10, 11). However, social isolation and loneliness can be exacerbated by living
alone and can lead to poor psychological well-being (12). In 2012, it was reported that a
quarter of older adults in Ireland live alone (4). The National Positive Ageing Strategy (13)
seeks to enable people to age with confidence, security and dignity in their own homes
and communities for as long as possible. Additionally, it sets out to remove barriers to
participation and provide more opportunities for continued involvement of people as they
age in cultural, economic and social life. The Seniors Alert scheme (14) launched in 2017,
provides adults aged 65 years and over with a free personal monitored alarm worn on the
wrist. The scheme intends to provide older people with a sense of security and peace of
mind in their own homes, connecting them with a local volunteer or emergency services
when the alarm is activated.
In this Chapter, we describe the living environment of adults aged 56 and over living
in Ireland. We examine housing characteristics and modifications, housing conditions,
heating and neighbourhood social cohesion. Analysis of housing characteristics and
modifications are based on the 5,977 participants aged 56 and over who took part in the wave
4 computer-assisted personal interview (CAPI), while analysis on housing conditions, heating
and neighbourhood cohesion are based on participants who returned the self-completion
questionnaire (SCQ) (n=5,064).
5.1 Housing characteristics
5.1.1 Location of home
26.0% of adults aged 56 years and over in Ireland resided in Dublin city or county, 30.4%
resided in another town or city, while 43.7% resided in a rural area.
5.1.2 Construction dates
The majority of homes were constructed after 1970 (1971-2000: 45.7%; 2001 or later:
8.0%). Adults aged 75 years and over were more likely to live in homes constructed prior
to 1971 (66.5%), whilst only 35.0% of adults aged 56-64 years lived in homes constructed
during the same period.

5 Living conditions of adults in Ireland
69
5.1.3 Ownership details
The majority of adults aged 56 and over in Ireland owned their home (81.5% outright,
10.8% with a mortgage). 4.8% of adults were in local authority rented property while 2.8%
rented privately. Older adults aged 75 years and over were more likely to own their home
(93.0%) compared to adults aged 56-64 years (89.2%).
5.1.4 Living situation
In Wave 4, 28.5% of adults aged 56 and over in Ireland lived alone. The prevalence of
those living alone was slightly higher for women (31.8%) than men (25.0%). The proportion
living alone increased with advancing age, with 20.5% of adults aged 56-64 years living
alone, compared to 45.2% of adults aged 75 and over. More adults over the age of 56
reported living alone in another town or city (33.4%), than Dublin city or county (26.6%) or
a rural area (26.3%).
5.2 Housing modifications
TILDA participants were asked if they had ever modified their home to make it easier
or safer for an older person to live there. Examples of modifications included grab
bars, railings, ramps, or remodelling of existing buildings. 19.1% of adults had added
modifications to their home. Table 5.1 shows a breakdown of prevalence of modifications
added and participant characteristics.
Modifications were more likely to have been added in households based in Dublin city
or county (26.7%). Over a quarter of adults residing in Dublin city or county reporting
added modifications. In comparison, 15.7% of adults living in a rural area reported added
modifications and 17.7% of those living in another town or city.
Adults aged 75 years and over were over twice as likely to have modified their home
compared to those aged 65-74 years (38.6% vs 16.4%). Just 8.8% of adults aged 56-64
years added modifications to their homes.
Construction date played a role in the likelihood of dwellings being modified. 27.7% of
adults living in homes built between 1941-1970 reported modifications. The prevalence
decreased in homes constructed more recently, with 13.2% of those living in homes
constructed in 1971-2000 reporting modifications and 11.9% of those in homes constructed
in 2001 or later.
Participants were asked if they had any difficulties with activities of daily living (ADLs) (e.g.
walking, bathing, dressing and eating) or instrumental activities of daily living (IADLs) (e.g.

Wellbeing and Health in Ireland’s over 50s 2009-2016
70
meal preparation, grocery shopping and medication management) which were expected to
last longer than three months. In Dublin city or county, adults who reported an ADL or IADL
were 3.5 times more likely to have modified their homes compared to those who reported
no disability (73.0% versus 21%) while adults in rural areas were over five times more
likely to modify their homes (66.7% versus 12.6%). Self-rated health was similarly related
to home modifications. 29.9% of those who reported ‘fair’ health and 46.3% who reported
‘poor’ health added modifications compared with 11.2% of those who reported ‘excellent’
health.
Table 5�1: Modifications to home stratified by age, construction date, disability
and self-rated health�
VariableDublin city or
county % (95% CI)
Another town or city
% (95% CI)
A rural area % (95% CI)
Total % (95% CI)
Age
56-64 years 12.4 (9.1-16.6) 6.7 (4.3-10.2) 8.3 (6.1-11.0) 8.8 (7.3-10.6)
65-74 years 22.4 (18.3-27.1) 16.3 (12.3-21.2) 13.0 (10.5-16.0) 16.4 (14.3-18.6)
75+ years 52.9 (43.8-61.8) 37.5 (30.5-45.1) 30.5 (25.1-36.5) 38.6 (34.5-43.0)
Construction Date
Pre-1919 29.2 (17.9-43.8) 18.3 (9.7-32.1) 24.6 (18.5-32.1) 24.1 (19.2-29.7)
1919-1940 37.8 (26.7-50.2) 20.9 (12.1-33.8) 19.4 (12.9-28.2) 26.3 (20.6-32.9)
1941-1970 33.6 (27.2-40.6) 28.3 (22.7-34.6) 20.1 (14.6-27.0) 27.7 (24.2-31.6)
1971-2000 19.2 (15.1-24.2) 10.7 (8.1-14.1) 11.6 (9.0-14.8) 13.2 (11.4-15.3)
2001 or later 16.5 (4.1-47.6) 17.3 (10.1-27.9) 7.9 (4.2-14.4) 11.9 (8.0-17.3)
Disability
Not disabled 21.0 (17.8-24.5) 13.5 (11.2-16.2) 12.6 (10.8-14.7) 15.0 (13.6-16.5)
IADL Disability only
55.7 (37.0-72.8) 54.8 (38.0-70.6) 62.0 (43.3-77.6) 57.1 (46.7-67.0)
ADL Disability only
68.1 (53.7-79.7) 23.2 (11.2-41.8) 24.1 (13.9-38.5) 40.5 (31.5-50.3)
IADL or ADL Disability
73.0 (49.4-88.2) 65.4 (46.7-80.3) 66.7 (47.1-81.8) 67.8 (56.3-77.4)
Self-Rated Health
Excellent 19.1 (13.2-27.0) 9.1 (5.4-15.0) 6.7 (4.1-10.9) 11.2 (8.5-14.5)
Very Good 19.4 (15.1-24.5) 12.0 (8.7-16.2) 9.8 (7.4-12.8) 13.0 (11.0-15.2)
Good 28.5 (23.2-34.4) 19.4 (15.3-24.2) 18.4 (15.2-22.3) 21.1 (18.7-23.7)
Fair 39.8 (30.9-49.5) 25.3 (18.2-34.0) 27.8 (21.6-35.0) 29.9 (25.5-34.7)
Poor 66.3 (47.5-81.1) 53.2 (31.8-73.5) 22.2 (10.3-41.7) 46.3 (34.6-58.4)
Total 26.7 (23.2-30.5) 17.7 (14.9-20.9) 15.7 (13.6-18.0) 19.1 (17.5-20.9)

5 Living conditions of adults in Ireland
71
5.2.1 Cost of modifications by age group
The mean overall cost of modifications for adults in Ireland was €6,367. Participants who
reported that they had added modifications to their homes were asked what the total cost
of these modifications were. Adults aged 56-64 years reported a mean cost of €11,936,
with lower reported costs in the older age groups (65-74 years: €6,495, ≥75 years: €3,987).
5.2.2 Cost of modifications by location
For adults residing in Dublin city or county, the mean cost of modifications was €8,574.
Adults living in another town or city reported average costs of €5,098. Adults living in a
rural area reported similar average costs of €5,097 for modifications to their home.
5.3 Housing conditions
Housing conditions were assessed in the SCQ where participants were asked to record
whether they have problems with the condition of the home. For the purposes of this
Chapter, the categories of problematic housing conditions are defined in Table 5.2.
Table 5�2: Classification of problematic housing condition categories�
Housing conditions Category
• A leaking roof• Leaking or moisture getting in through walls• Leaking or moisture getting in at doors or windows• Leaks from water pipes• Rising damp• Condensation dampness• General dampness from unknown sources• Mould on walls/ceilings, etc
Damp, mould or moisture
• Corrosion or rot around any external door(s)• Badly fitting doors• Corrosion or rot around any window(s)• Leaky or draughty windows• Windows that don’t open/close properly• Rot in timbers other than windows/doors,
such as rot in joists, floor boards, etc• Structural cracks in internal or external support walls• Subsidence in floors
Structural
• Pests – rats, mice, cockroaches Pest
• Noise from neighbouring houses Noise
• Difficulty in heating accommodation Heating

Wellbeing and Health in Ireland’s over 50s 2009-2016
72
The previously published report showed that 59% of participants reported problematic
housing conditions in Wave 2 (4). For those who completed an SCQ at Wave 3 and Wave
4 (n=4,459), the change in number of reported problematic housing conditions between
waves is shown in Table 5.3. 56.7% of the population reported having a problem in their
home at Wave 4, compared to 60.0% in Wave 3.
21.6% of participants who reported three or more problematic housing conditions at
Wave 3 reported a similar number of problems at Wave 4. 14.1% of adults who reported
problems at Wave 3, reported no problematic housing conditions at Wave 4. 11.4% who
reported no problematic housing conditions in Wave 3 reported a problem at Wave 4.
Overall, the proportion of participants who reported problematic housing conditions was
similar across Waves.
Table 5�3: Change in number of reported problematic housing conditions between Wave 3
and Wave 4�
No problem (W4)One or two
problems (W4)Three or more problems (W4)
Total (W4)
% (95% CI) % (95% CI) % (95% CI) % (95% CI)
No problem (W3)
29.1 (27.3-31.0) 8 (7.0-9.1) 3.4 (38.6-42.6) 40.6 (38.6-42.6)
One or two problems (W3)
9.6 (8.6-10.7) 10.5 (9.4-11.7) 6.7 (5.8-7.8) 24.9 (23.4-26.6)
Three or more problems (W3)
4.5 (3.7-5.5) 6.5 (5.6-7.7) 21.6 (20.0-23.4) 32.8 (31.0-34.6)
Total (W3) 40 (38.1-42.0) 25.9 (24.4-27.6) 34.1 (32.2-36.0) 100

5 Living conditions of adults in Ireland
73
5.3.1 Distribution of reported housing problems
At Wave 2, damp, mould or moisture was the most commonly reported problematic hous-
ing condition of adults in Ireland with 46% reporting this problem (4). Table 5.4 shows the
breakdown of housing problems in Wave 4. Adults aged 56-64 reported more problematic
housing conditions than their older counterparts. Those living in rural areas were less likely
to report problematic housing conditions (53.8%) compared to other locations (Dublin city
or county: 59.9%, Another town or city: 61.1%). Modern building regulations should en-
sure better insulation and structural quality (15, 16). This is reflected in these findings with
adults in older dwellings built pre-1940 more likely to report problems (64.9% compared to
51.4% of homes constructed in 2001 or later).
Damp, mould or moisture was the most commonly reported problematic housing condition
(46.3%) followed by structural issues (31.9%) (Table 5.3). Noise issues were more preva-
lent in Dublin city and county compared to rural areas (18.4% vs. 5.1%). 65.2% of partic-
ipants with a reported IADL disability reported housing problems, compared to 57.1% of
participants with no disability (Table 5.3).
Damp, mould or moisture, structural problems and pest problems were higher in homes
constructed pre-1940. 57.9% reported damp, mould or moisture and 38.5% reported struc-
tural problems in homes constructed pre-1940, compared to 32.1% and 26.9% respective-
ly in homes constructed in 2001 or later. A similar trend was seen with pest problems, as
22.4% of participants living in homes constructed pre-1940 reported this issue, compared
to 9.6% in homes constructed in 2001 or later.
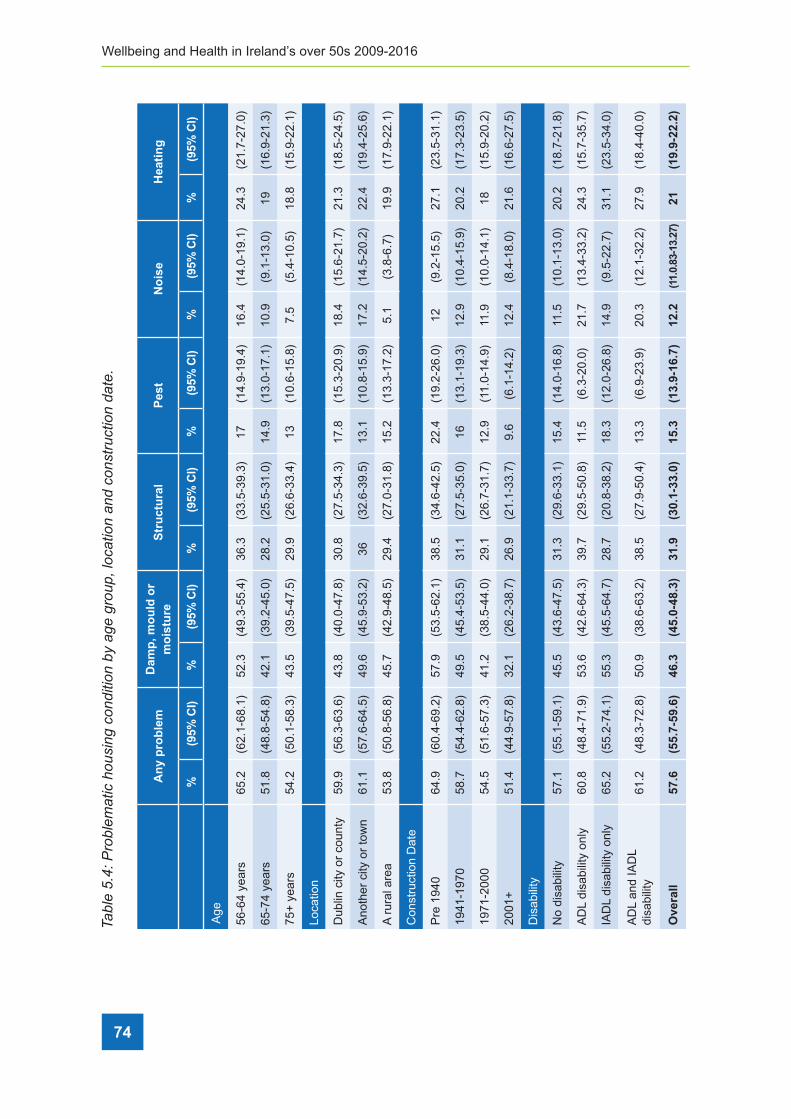
Wellbeing and Health in Ireland’s over 50s 2009-2016
74
Tabl
e 5�
4: P
robl
emat
ic h
ousi
ng c
ondi
tion
by a
ge g
roup
, loc
atio
n an
d co
nstr
uctio
n da
te�
An
y p
rob
lem
Dam
p, m
ou
ld o
r m
ois
ture
Str
uct
ura
lP
est
No
ise
Hea
tin
g
%(9
5% C
I)%
(95%
CI)
%(9
5% C
I)%
(95%
CI)
%(9
5% C
I)%
(95%
CI)
Age
56-6
4 ye
ars
65.2
(62.
1-68
.1)
52.3
(49.
3-55
.4)
36.3
(33.
5-39
.3)
17(1
4.9-
19.4
)16
.4(1
4.0-
19.1
)24
.3(2
1.7-
27.0
)
65-7
4 ye
ars
51.8
(48.
8-54
.8)
42.1
(39.
2-45
.0)
28.2
(25.
5-31
.0)
14.9
(13.
0-17
.1)
10.9
(9.1
-13.
0)19
(16.
9-21
.3)
75+
yea
rs54
.2(5
0.1-
58.3
)43
.5(3
9.5-
47.5
)29
.9(2
6.6-
33.4
)13
(10.
6-15
.8)
7.5
(5.4
-10.
5)18
.8(1
5.9-
22.1
)
Loca
tion
Dub
lin c
ity o
r co
unty
59.9
(56.
3-63
.6)
43.8
(40.
0-47
.8)
30.8
(27.
5-34
.3)
17.8
(15.
3-20
.9)
18.4
(15.
6-21
.7)
21.3
(18.
5-24
.5)
Ano
ther
city
or
tow
n61
.1(5
7.6-
64.5
)49
.6(4
5.9-
53.2
)36
(32.
6-39
.5)
13.1
(10.
8-15
.9)
17.2
(14.
5-20
.2)
22.4
(19.
4-25
.6)
A r
ural
are
a53
.8(5
0.8-
56.8
)45
.7(4
2.9-
48.5
)29
.4(2
7.0-
31.8
)15
.2(1
3.3-
17.2
)5.
1(3
.8-6
.7)
19.9
(17.
9-22
.1)
Con
stru
ctio
n D
ate
Pre
194
064
.9(6
0.4-
69.2
)57
.9(5
3.5-
62.1
)38
.5(3
4.6-
42.5
)22
.4(1
9.2-
26.0
)12
(9.2
-15.
5)27
.1(2
3.5-
31.1
)
1941
-197
058
.7(5
4.4-
62.8
)49
.5(4
5.4-
53.5
)31
.1(2
7.5-
35.0
)16
(13.
1-19
.3)
12.9
(10.
4-15
.9)
20.2
(17.
3-23
.5)
1971
-200
054
.5(5
1.6-
57.3
)41
.2(3
8.5-
44.0
)29
.1(2
6.7-
31.7
)12
.9(1
1.0-
14.9
)11
.9(1
0.0-
14.1
)18
(15.
9-20
.2)
2001
+51
.4(4
4.9-
57.8
)32
.1(2
6.2-
38.7
)26
.9(2
1.1-
33.7
)9.
6(6
.1-1
4.2)
12.4
(8.4
-18.
0)21
.6(1
6.6-
27.5
)
Dis
abili
ty
No
disa
bilit
y57
.1(5
5.1-
59.1
)45
.5(4
3.6-
47.5
)31
.3(2
9.6-
33.1
)15
.4(1
4.0-
16.8
)11
.5(1
0.1-
13.0
)20
.2(1
8.7-
21.8
)
AD
L di
sabi
lity
only
60.8
(48.
4-71
.9)
53.6
(42.
6-64
.3)
39.7
(29.
5-50
.8)
11.5
(6.3
-20.
0)21
.7(1
3.4-
33.2
)24
.3(1
5.7-
35.7
)
IAD
L di
sabi
lity
only
65.2
(55.
2-74
.1)
55.3
(45.
5-64
.7)
28.7
(20.
8-38
.2)
18.3
(12.
0-26
.8)
14.9
(9.5
-22.
7)31
.1(2
3.5-
34.0
)
AD
L an
d IA
DL
disa
bilit
y61
.2(4
8.3-
72.8
)50
.9(3
8.6-
63.2
)38
.5(2
7.9-
50.4
)13
.3(6
.9-2
3.9)
20.3
(12.
1-32
.2)
27.9
(18.
4-40
.0)
Ove
rall
57.6
(55.
7-59
.6)
46.3
(45.
0-48
.3)
31.9
(30.
1-33
.0)
15.3
(13.
9-16
.7)
12.2
(11.
0.83
-13.
27)
21(1
9.9-
22.2
)
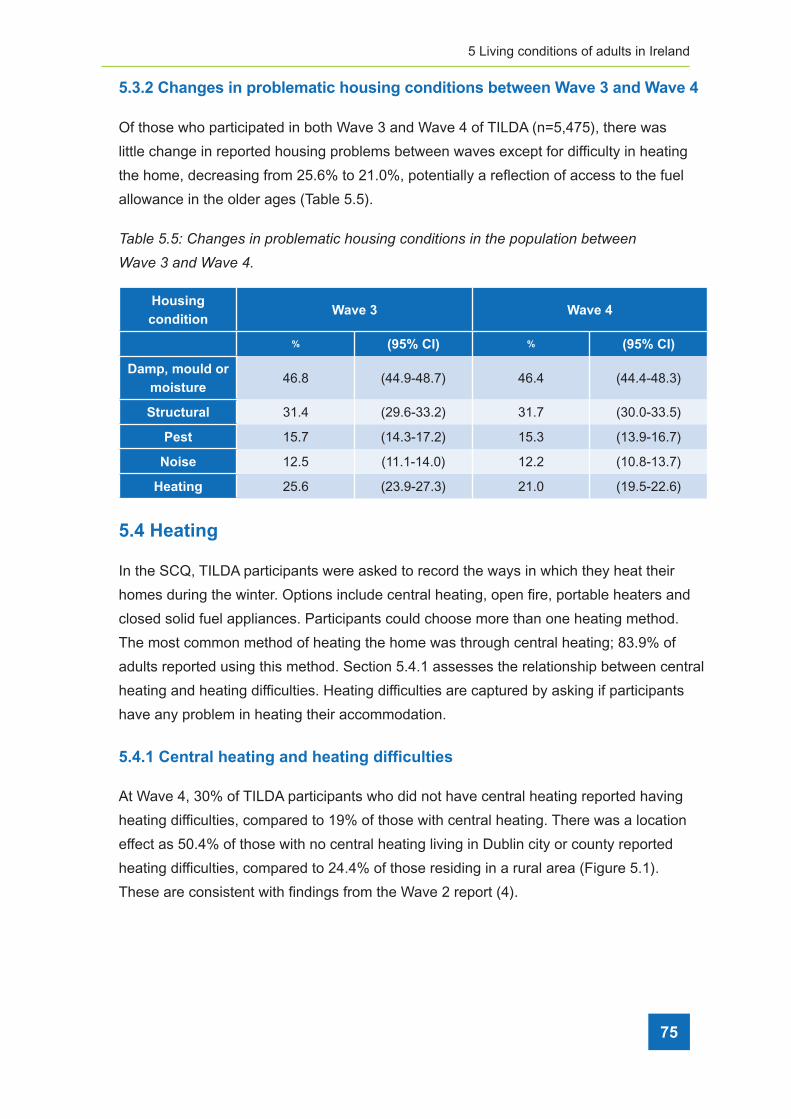
5 Living conditions of adults in Ireland
75
5.3.2 Changes in problematic housing conditions between Wave 3 and Wave 4
Of those who participated in both Wave 3 and Wave 4 of TILDA (n=5,475), there was
little change in reported housing problems between waves except for difficulty in heating
the home, decreasing from 25.6% to 21.0%, potentially a reflection of access to the fuel
allowance in the older ages (Table 5.5).
Table 5�5: Changes in problematic housing conditions in the population between
Wave 3 and Wave 4�
Housing condition
Wave 3 Wave 4
% (95% CI) % (95% CI)
Damp, mould or moisture
46.8 (44.9-48.7) 46.4 (44.4-48.3)
Structural 31.4 (29.6-33.2) 31.7 (30.0-33.5)
Pest 15.7 (14.3-17.2) 15.3 (13.9-16.7)
Noise 12.5 (11.1-14.0) 12.2 (10.8-13.7)
Heating 25.6 (23.9-27.3) 21.0 (19.5-22.6)
5.4 Heating
In the SCQ, TILDA participants were asked to record the ways in which they heat their
homes during the winter. Options include central heating, open fire, portable heaters and
closed solid fuel appliances. Participants could choose more than one heating method.
The most common method of heating the home was through central heating; 83.9% of
adults reported using this method. Section 5.4.1 assesses the relationship between central
heating and heating difficulties. Heating difficulties are captured by asking if participants
have any problem in heating their accommodation.
5.4.1 Central heating and heating difficulties
At Wave 4, 30% of TILDA participants who did not have central heating reported having
heating difficulties, compared to 19% of those with central heating. There was a location
effect as 50.4% of those with no central heating living in Dublin city or county reported
heating difficulties, compared to 24.4% of those residing in a rural area (Figure 5.1).
These are consistent with findings from the Wave 2 report (4).

Wellbeing and Health in Ireland’s over 50s 2009-2016
76
Figure 5�1: Percentage of heating difficulties by central heating and location�
5.4.2 Heating difficulties and self-rated health
Participants who reported difficulties in heating their home were more likely to report fair
or poor health (22.5%) compared to those with no heating difficulties (15.0%) (Figure 5.2).
This is marginally less compared to Wave 2, where 24.0% of adults with heating difficulties
reported their health as fair/poor (4).

5 Living conditions of adults in Ireland
77
Figure 5�2: Percentage of heating difficulties by self-rated health�
5.5 Neighbourhood social cohesion
Neighbourhood social cohesion was measured in the SCQ through a number of
statements (see Table 5.6). Participants are shown a positive statement which is anchored
by an opposing negative statement and were asked to what degree they agree with each
on a scale of one to seven. These scores were grouped into tertiles, with the highest tertile
indicating highest neighbourhood social cohesion, and the lowest tertile indicating the
lowest neighbourhood social cohesion.

Wellbeing and Health in Ireland’s over 50s 2009-2016
78
Table 5�6: Statements used for measuring neighbourhood social cohesion�
Neighbourhood social cohesion
Positive statement Negative statement
I really feel part of this area I feel that I don’t belong in this area
Most people in this area will always treat you fairly People in this area will take advantage of you
Most people in this area are friendly Most people in this area are unfriendly
If you were in trouble, there are lots of people in this area who would help you
If you were in trouble, there is nobody in this area who would help you
Most people in this area can be trusted Most people in this area can’t be trusted
Neighbourhood social cohesion was measured at Wave 2 and Wave 4, and rates of
reported neighbourhood social cohesion did not change across waves, potentially
reflecting a low number of participants moving neighbourhoods and the stability of social
cohesion within the communities that participants reside. Of those who completed an SCQ
at Wave 2 and Wave 4 (n=4,468), little change was seen between neighbourhood social
cohesion between waves. Consequently, the following section only describes the findings
from Wave 4.
5.5.1 Demographic characteristics of neighbourhood social cohesion
Table 5.7 reports neighbourhood social cohesion by sample characteristics.
Neighbourhood social cohesion varied by sex, as more women reported high
neighbourhood social cohesion than men (53.8% vs 46.2%). 54.3% of participants living
in rural areas reported high social cohesion compared to 18.6% of participants living in
Dublin city or county.

5 Living conditions of adults in Ireland
79
Table 5�7: Demographic characteristics of neighbourhood social cohesion tertiles�
Social cohesion
Lowest Middle Highest
% 95% CI % 95% CI % 95% CI
Sex
Men 55.1 (52.3-57.9) 46 (43.1-49.0) 46.2 (43.4-48.9)
Women 44.9 (42.1-47.7) 54 (43.1-49.0) 53.8 (51.1-56.6)
Age
56-64 49.3 (46.1-52.6) 38.1 (35.0-41.0) 29.4 (26.5-32.5)
65-74 33 (30.2-36.0) 37.9 (34.9-41.0) 39.4 (36.2-42.8)
75+ 17.7 (15.3-20.3) 24 (21.1-27.2) 31.2 (28.1-34.3)
Location
Dublin city or town 32.3 (27.4-37.2) 27.4 (23.2-32.0) 18.6 (15.3-22.4)
Other city or town 32.6 (28.0-37.6) 31.2 (26.8-35.9) 27.2 (23.1-31.7)
A rural area 35.2 (31.0-39.7) 41.4 (36.9-46.1) 54.3 (49.5-58.9)
Disability
Not disabled 88.5 (86.2-90.5) 89.4 (86.9-91.4) 91.8 (89.7-93.5)
IADL Disability only 4 (2.7-5.9) 4.1 (2.9-5.7) 2.2 (1.4-3.4)
ADL Disability only 4.4 (3.3-5.8) 3.3 (2.3-4.8) 3.5 (2.5-4.7)
IADL and ADL Disability 3.1 (2.1-4.5) 3.2 (2.1-4.8) 2.6 (1.6-4.0)
Living Situation
Living alone 25.3 (22.4-28.4) 30.8 (27.7-34.2) 27.2 (24.3-30.3)
Living with others 74.7 (716-77.6) 69.2 (65.8-72.3) 72.8 (70.4-74.0)
Total 34.4 (32.5-36.4) 34.1 (32.4-35.8) 31.6 (29.8-33.4)
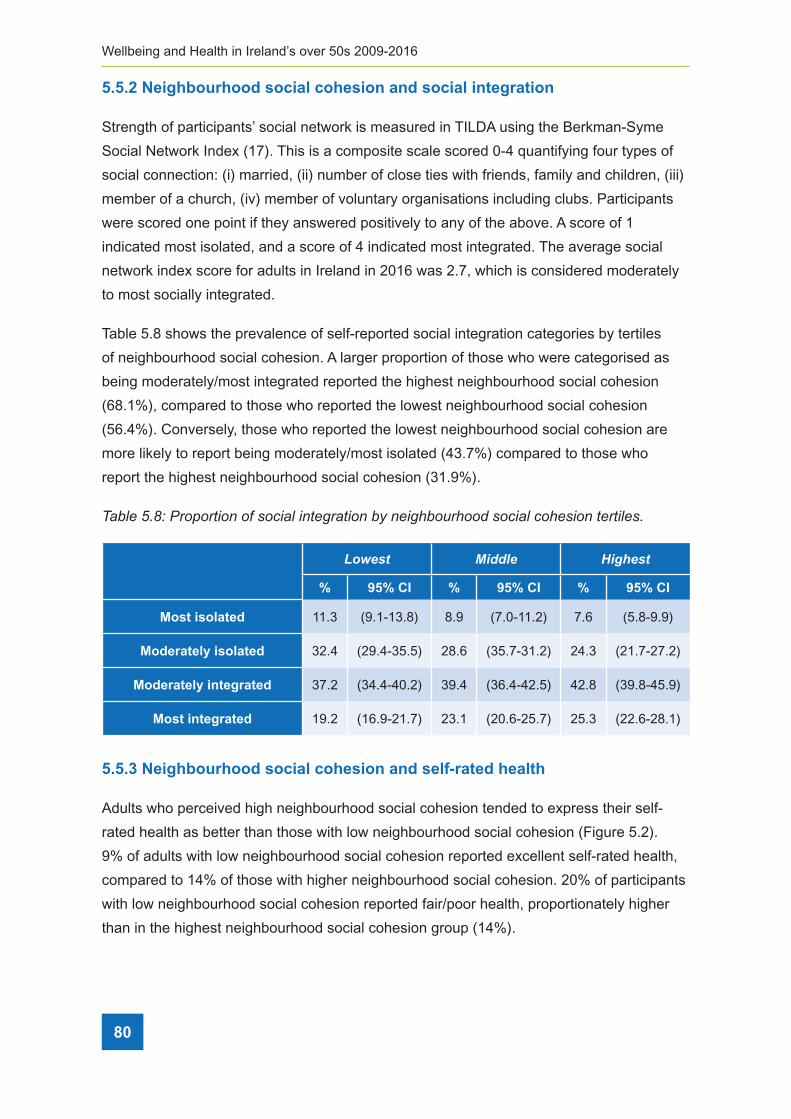
Wellbeing and Health in Ireland’s over 50s 2009-2016
80
5.5.2 Neighbourhood social cohesion and social integration
Strength of participants’ social network is measured in TILDA using the Berkman-Syme
Social Network Index (17). This is a composite scale scored 0-4 quantifying four types of
social connection: (i) married, (ii) number of close ties with friends, family and children, (iii)
member of a church, (iv) member of voluntary organisations including clubs. Participants
were scored one point if they answered positively to any of the above. A score of 1
indicated most isolated, and a score of 4 indicated most integrated. The average social
network index score for adults in Ireland in 2016 was 2.7, which is considered moderately
to most socially integrated.
Table 5.8 shows the prevalence of self-reported social integration categories by tertiles
of neighbourhood social cohesion. A larger proportion of those who were categorised as
being moderately/most integrated reported the highest neighbourhood social cohesion
(68.1%), compared to those who reported the lowest neighbourhood social cohesion
(56.4%). Conversely, those who reported the lowest neighbourhood social cohesion are
more likely to report being moderately/most isolated (43.7%) compared to those who
report the highest neighbourhood social cohesion (31.9%).
Table 5�8: Proportion of social integration by neighbourhood social cohesion tertiles�
Lowest Middle Highest
% 95% CI % 95% CI % 95% CI
Most isolated 11.3 (9.1-13.8) 8.9 (7.0-11.2) 7.6 (5.8-9.9)
Moderately isolated 32.4 (29.4-35.5) 28.6 (35.7-31.2) 24.3 (21.7-27.2)
Moderately integrated 37.2 (34.4-40.2) 39.4 (36.4-42.5) 42.8 (39.8-45.9)
Most integrated 19.2 (16.9-21.7) 23.1 (20.6-25.7) 25.3 (22.6-28.1)
5.5.3 Neighbourhood social cohesion and self-rated health
Adults who perceived high neighbourhood social cohesion tended to express their self-
rated health as better than those with low neighbourhood social cohesion (Figure 5.2).
9% of adults with low neighbourhood social cohesion reported excellent self-rated health,
compared to 14% of those with higher neighbourhood social cohesion. 20% of participants
with low neighbourhood social cohesion reported fair/poor health, proportionately higher
than in the highest neighbourhood social cohesion group (14%).

5 Living conditions of adults in Ireland
81
Figure 5�3: Self-rated health, by tertiles of neighbourhood social cohesion�
5.5.4 Neighbourhood social cohesion and depressive symptoms
Depressive symptoms were measured with the 8-item short form Centre for Epidemiologic
Studies Depression (CES-D8) scale (18). The data were scored and summed to create
a scale of 0-24, with a higher score indicating more depressive symptoms experienced
within the week prior to the participant’s interview. The average CES-D8 score for adults in
Ireland at Wave 4 was 3.2.
Average CES-D8 scores varied by location, and tended to be higher in city locations
than rural areas (Figure 5.4). Scores were highest in areas of low neighbourhood social
cohesion within Dublin city or county (3.9) and lowest in areas of high neighbourhood
social cohesion in another town or city (2.4) (Figure 5.3).
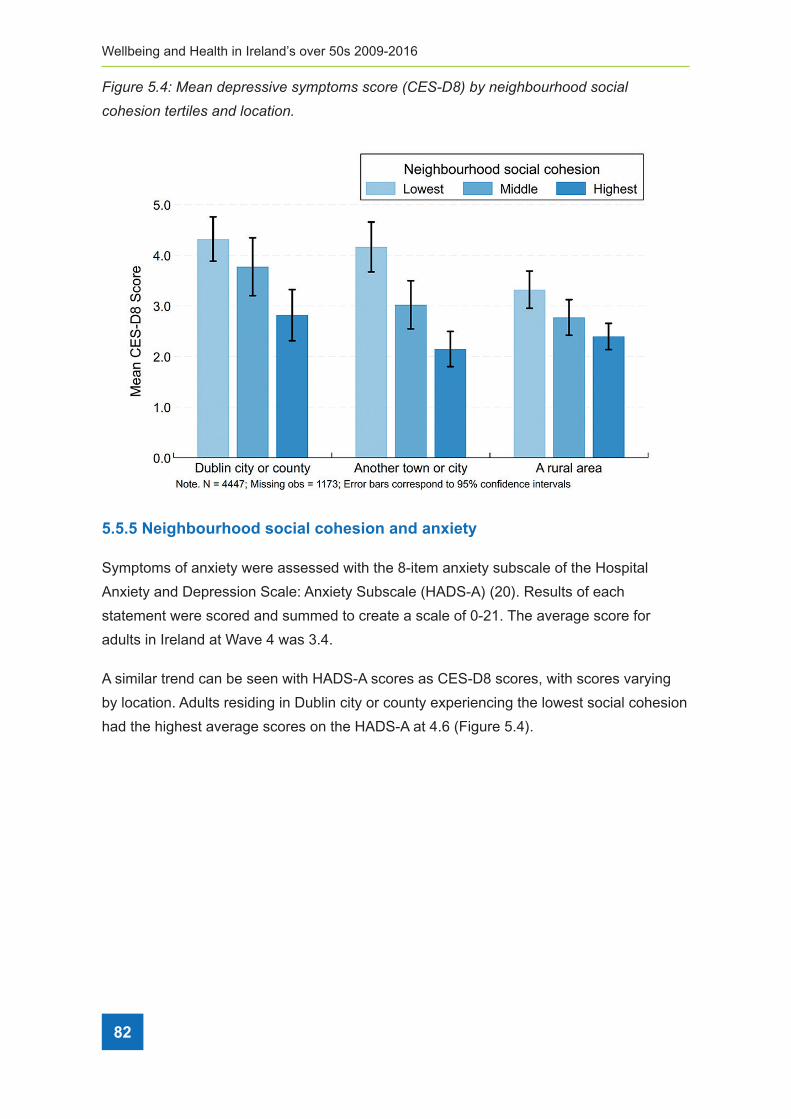
Wellbeing and Health in Ireland’s over 50s 2009-2016
82
Figure 5�4: Mean depressive symptoms score (CES-D8) by neighbourhood social
cohesion tertiles and location�
5.5.5 Neighbourhood social cohesion and anxiety
Symptoms of anxiety were assessed with the 8-item anxiety subscale of the Hospital
Anxiety and Depression Scale: Anxiety Subscale (HADS-A) (20). Results of each
statement were scored and summed to create a scale of 0-21. The average score for
adults in Ireland at Wave 4 was 3.4.
A similar trend can be seen with HADS-A scores as CES-D8 scores, with scores varying
by location. Adults residing in Dublin city or county experiencing the lowest social cohesion
had the highest average scores on the HADS-A at 4.6 (Figure 5.4).
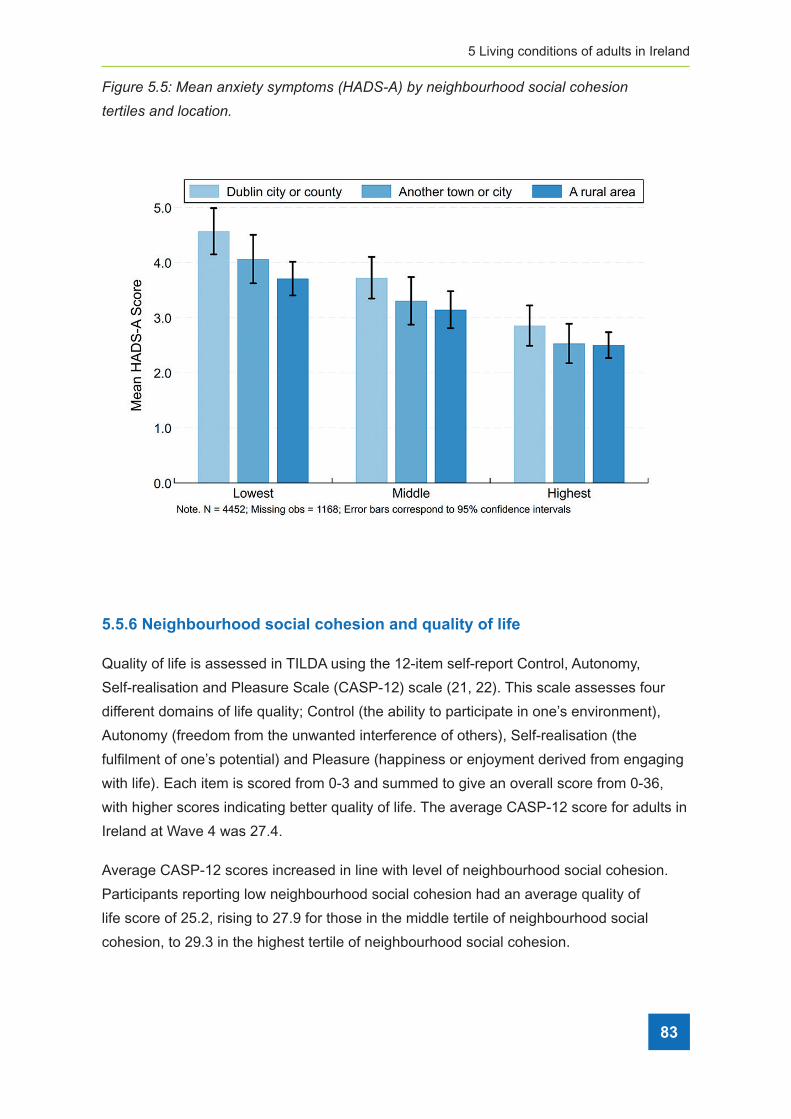
5 Living conditions of adults in Ireland
83
Figure 5�5: Mean anxiety symptoms (HADS-A) by neighbourhood social cohesion
tertiles and location�
5.5.6 Neighbourhood social cohesion and quality of life
Quality of life is assessed in TILDA using the 12-item self-report Control, Autonomy,
Self-realisation and Pleasure Scale (CASP-12) scale (21, 22). This scale assesses four
different domains of life quality; Control (the ability to participate in one’s environment),
Autonomy (freedom from the unwanted interference of others), Self-realisation (the
fulfilment of one’s potential) and Pleasure (happiness or enjoyment derived from engaging
with life). Each item is scored from 0-3 and summed to give an overall score from 0-36,
with higher scores indicating better quality of life. The average CASP-12 score for adults in
Ireland at Wave 4 was 27.4.
Average CASP-12 scores increased in line with level of neighbourhood social cohesion.
Participants reporting low neighbourhood social cohesion had an average quality of
life score of 25.2, rising to 27.9 for those in the middle tertile of neighbourhood social
cohesion, to 29.3 in the highest tertile of neighbourhood social cohesion.

Wellbeing and Health in Ireland’s over 50s 2009-2016
84
Participants living in another town or city experiencing low neighbourhood social cohesion
reported the lowest quality of life scores (24.8). Highest quality of life scores was reported
by participants experiencing high neighbourhood social cohesion living in Dublin city or
county (30.1) (Figure 5.5).
Figure 5�6: Mean quality of life score (CASP-12) by neighbourhood social cohesion tertiles
and location�
5.6 Conclusions
This Chapter analysed the living conditions of community-dwelling adults aged 56 years
and over in Ireland in 2016. The current characteristics of homes in Ireland were explored
in order to learn more about the effect that physical changes in the home have on the
mental and physical health of our older population. The results have highlighted that
problematic housing conditions remain an issue. Additionally, variation in neighbourhood
social cohesion was found amongst TILDA participants with a potential impact on social
integration, self-rated and mental health, reinforcing the issue that housing and living
conditions need to be a key policy area to provide a healthy and happy ageing
experience in Ireland.

5 Living conditions of adults in Ireland
85
Reported difficulties with heating have decreased compared to previous waves of TILDA,
possibly a reflection of increased uptake and spending on schemes targeting energy and
heating or increased uptake of the government fuel allowance scheme as the sample
ages. Almost half of adults aged 56 and over reported problems with damp, mould or
moisture (46.4%) (Table 5.5). The Warmth and Wellbeing scheme seeks to address
these problematic housing conditions, with a view to improving overall health, ease the
symptoms of respiratory diseases and reduce the reliance on medications and health
services (7). Ireland reports mortality rates 40.3% higher than the EU28 average for
respiratory diseases (23), a condition further exacerbated by damp conditions.
The results show that homes constructed prior to 1971 and those which belonged to adults
who reported poorer self-rated health and disability are more likely to have been modified
to make them more suitable for living in, reflecting the increased needs of these groups.
The Better Energy Homes scheme targets homes constructed prior to a certain date with
a view to improving energy usage in homes, while the Mobility Aids Grant scheme and the
Housing Aid for Older People scheme provide financial assistance for older adults requiring
home improvements. As our population experiences a shift in the ageing demographic and
care needs increase, the demand for suitable housing grows. It is important for individuals
to reside somewhere suitable for their requirements. Delayed hospital discharges can be
experienced where suitable accommodation is not available for the patient.
The report on housing conditions using TILDA data in 2012 recommended policy initiatives
to target improvements in heating and housing quality (4). In Wave 4, a lower proportion of
people reported difficulty in heating the home.
Adults aged 56 or more who report lower neighbourhood social cohesion report worse
self-rated health, higher levels of depressive and anxiety symptoms, and lower quality
of life. However, social integration is shown to have a positive impact on perceptions
of neighbourhood social cohesion, suggesting that the goals set out by the National
Positive Ageing Strategy to improve social participation in older people should have a
positive impact on their physical and mental well-being. In 2011, participants of the study
Loneliness and Social Isolation Among Older Irish People reported that one coping
mechanism for feelings of isolation was to have a security system such as a personal
alarm (11). Therefore, the Seniors Alert scheme may have a positive impact in reducing
feelings of isolation and enhancing perceptions of safety by providing alarms to older adults.

Wellbeing and Health in Ireland’s over 50s 2009-2016
86
Independent living is important for the quality of life of our older population but can only be
possible where homes are suitable for the changing needs of the ageing population. It has
been found that problematic housing conditions, and low neighbourhood social cohesion
are significant issues for many community-dwelling adults aged 56 and over in Ireland. The
reduction in reported heating difficulties shows that these problems can be resolved and
this can be positively impacted by intervention schemes and initiatives to improve housing
conditions and energy efficiency. Future waves of TILDA will allow reported problems to be
monitored over the coming years, in addition to tracking the impact of new schemes and
the expansion of already established schemes.
5.7 References
1. Breen C. Focus on Housing and the Health of Older People. Centre for Ageing
Research and Development in Ireland; 2013. Available from:
http://www.cardi.ie/ userfiles/Focus%20on%20Housing%20and%20the%20Health
%20of%20Older%20 People.pdf .
2. Fernández-Porteroa C, Alarcóna D, Barrios Padurab, A. 2017. Dwelling conditions
and life satisfaction of older people through residential satisfaction. Journal of
Environmental Psychology. 49:1-7.
3. Housing for Older People – Thinking Ahead Report. Housing Agency. 2016. Available
from https://www.housingagency.ie/Housing/media/Media/About%20Us/Report-
Housing-for-Older-People-Thinking-Ahead-(2016).pdf.
4. Orr, J., Scarlett, S., Donoghue O., McGarrigle, C., Housing conditions of Ireland’s older
population. 2016, Trinity College Dublin. https://tilda.tcd.ie/publications/reports/pdf/
Report_HousingConditions.pdf
5. Better Energy Homes Scheme. Sustainable Energy Authority of Ireland. 2009. https://
www.seai.ie/resources/publications/Homeowner-Application-Guide.pdf.
6. Better Energy Warmer Homes Scheme. Sustainable Energy Authority of Ireland. 2009.
https://www.seai.ie/resources/publications/Scheme-and-Application-Guidelines.pdf.
7. Warmth and Wellbeing Pilot Scheme. Sustainable Energy Authority of Ireland. 2016.
https://www.seai.ie/grants/home-grants/warmth-and-wellbeing/
8. Mobility Aids Grant Scheme. 2007.
http://www.irishstatutebook.ie/eli/2007/si/670/made/en/print.

5 Living conditions of adults in Ireland
87
9. Housing Aids for Older People Grant Scheme. 2007.
http://www.irishstatutebook.ie/eli/2007/si/670/made/en/print.
10. Brenner, H. and Shelley, E. (1998), Adding years to life and life to years.
A Health Promotion Strategy for Older People (Dublin: National Council on
Ageing and Older People).
11. Pearl, T., Michelle, B., Anne, B., Jonathan, D., Gerard, F., Kate, F. and Kate, I. 2014.
Loneliness and Social Isolation Among Older Irish People. Dublin: National Council
on Ageing and Older People. Available at: http://www.ncaop.ie/publications/research/
reports/84_Lone_Soc_Iso.pdf
12. Coyle, CE., Dugan, E,. Social isolation, loneliness and health among older adults.
2012. Journal of aging and health. 24(8):1346-63.
13. National Positive Ageing Strategy. 2013. Available from: https://health.gov.ie/wp-
content/uploads/2014/03/National_Positive_Ageing_Strategy_English.pdf
14. Seniors Alert Scheme. Pobal. 2017.
https://www.pobal.ie/programmes/seniors-alert-scheme-sas/
15. Building Control Act, 1990. http://www.irishstatutebook.ie/eli/1990/act/3/enacted/en/html.
16. SI 496 of 1997 Building Control Regulations.
http://www.irishstatutebook.ie/eli/1997/si/496/made/en/print.
17. Berkman, L.F. and S.L. Syme, Social networks, host resistance, and mortality:
a nine-year follow-up study of Alameda County residents. Am J Epidemiol, 1979.
109(2): p. 186-204.
18. Karim J, Weisz R, Bibi Z, Rehman SU. Validation of the Eight-Item Center for
Epidemiologic Studies Depression Scale (CES-D) Among Older Adults.
Curr Psychol. 2015;34(4):681-92.
19. Regan, C.O., et al., Age and sex differences in prevalence and clinical correlates
of depression: first results from the Irish Longitudinal Study on Ageing. Int J Geriatr
Psychiatry, 2013. 28(12): p. 1280-7.
20. Zigmond, A.S. and R.P. Snaith, The hospital anxiety and depression scale. Acta
Psychiatr Scand, 1983. 67(6): p. 361-70.
21. Sexton E, King-Kallimanis BL, Conroy RM, Hickey A. Psychometric evaluation
of the CASP-19 quality of life scale in an older Irish cohort. Qual Life Res.
2013;22(9):2549– 59.
88
Wellbeing and Health in Ireland’s over 50s 2009-2016
22. Wiggins RD, Netuveli G, Hyde M, Higgs P, Blane D. The evaluation of a
selfenumerated scale of quality of life (CASP-19) in the context of research on
ageing: A combination of exploratory and confirmatory approaches. Soc Indic Res.
2008;89(1):61–77.
23. Department of Health. Health in Ireland Key Trends (Internet). 2016. Available from:
https://health.gov.ie/blog/publications/health-in-ireland-key-trends-2016.

6 Chronic conditions and health behaviours
89
ContentsKey findings ........................................................................................................................ 90
6.1 Introduction ................................................................................................................... 91
6.2 Self-rated health ........................................................................................................... 92
6.3 Chronic disease ............................................................................................................ 94
6�3�1 Prevalence of cardiovascular conditions at Waves 1 to 4 ��������������������������������� 94
6�3�2 Incident cardiovascular conditions at Wave 2, 3 and 4�������������������������������������� 95
6�3�3 Prevalence of non-cardiovascular conditions at Waves 1 to 4 �������������������������� 96
6�3�4 Incidence of non-cardiovascular conditions at Waves 2, 3 and 4 ���������������������� 97
6.4 Falls and fractures ........................................................................................................ 98
6.5 Behavioural health ........................................................................................................ 99
6�5�1 Smoking ������������������������������������������������������������������������������������������������������������� 99
6�5�2 Alcohol ������������������������������������������������������������������������������������������������������������� 100
6�5�3 Physical Activity ����������������������������������������������������������������������������������������������� 101
6.6 Conclusions ................................................................................................................ 102
6.7 References ................................................................................................................. 103
Apendices ......................................................................................................................... 107
6 Change in chronic disease prevalence and health behaviours over the first four waves of TILDATriona McNicholas and Eamon Laird
Wellbeing and Health in Ireland’s over 50s 2009-2016
90
Key findings
• From Wave 1 to Wave 4, there was a decrease in the proportion of people aged 50-64
years (21% to 16%) and 65-74 years (23% to 16%) who rated their health as fair or
poor. Social engagement had a positive impact on self-rated health.
• In terms of cardiovascular disease, there was an increased prevalence of hypertension
(35% to 38%), diabetes (8% to 11%), heart attack (4% to 6%), stroke (1% to 2%), and
transient ischaemic attack (2% to 4%) between Waves 1 and 4.
• In terms of non-cardiovascular disease, there was an increased prevalence of arthritis
(26% to 39%), osteoporosis (9% to 17%), cataracts (9% to 14%) and lung disease (4%
to 5%) from Wave 1 to 4.
• Pain affected 1 in 3 people aged 50 and over, and this was consistent at all waves.
• The number of people who reported recurrent falling in the last year increased from
Wave 1 to Wave 4 (7% to 9%).
• The proportion of women aged 50-64 years who reported current smoking decreased
between Waves 1 and 4 (24% to 17%).
• Problematic alcohol use was more prevalent in men than women (15% versus 9% at
Wave 4).
• A large proportion (45%) of adults aged 50 and over walked less than the
recommended 150 minutes per week across all four waves. This was particularly
evident in those aged 75 and older compared to those aged 50-64 years
(63% versus 42% at Wave 4).
6 Change in chronic disease prevalence and health behaviours over the first four waves of TILDA

6 Chronic conditions and health behaviours
91
6.1 Introduction
With increasing age, there is an increasing burden of chronic disease, and a subsequent
demand on our health services. This has been demonstrated in many studies worldwide
(1). The opportunities and challenges associated with population ageing have been
addressed in Ireland’s health reform policy “Healthy Ireland – A Framework for Improved
Health and Well-being 2013-2025” (2) and in “The National Positive Ageing Strategy”(3),
which aims to increase the proportion of people who are healthy at all stages of life; to
improve or manage their physical heath, mental health and well-being; and to use an
evidence-based approach to better inform policy responses to population ageing. Data
collected by The Irish Longitudinal Study on Ageing (TILDA), including information on
chronic health conditions and health behaviours can help to inform policy and achieve
these Government objectives.
In this Chapter, we present self-rated health, the prevalence and incidence of chronic
health conditions (cardiovascular and non-cardiovascular), falls and fractures as well as
indicators of behavioural health (smoking, alcohol intake and walking) across four waves
of data collection. Prevalence refers to the cumulative proportion of people who report ever
having a condition at each wave. Incidence refers to the proportion of new cases at each
wave, which had not been reported by the participants in previous waves. For example,
incident cases at Wave 3 refers to the proportion of new cases reported by participants at
Wave 3, not already self-reported at Waves 1 and 2.
As part of the TILDA data collection, participants completed a computer-assisted
personal interview (CAPI) at each wave. This is carried out by trained interviewers in the
participant’s home. They were also invited to complete a self-completion questionnaire
(SCQ), in their own time, which they then returned by post to the TILDA centre. Data
obtained during the CAPI and SCQ at each of the first four waves of TILDA are presented
in this Chapter. To facilitate an accurate comparison between Waves 1 to 4, only adults
who completed a self-interview at all four waves are included in the analysis (n=5,200).
The majority of measures presented in this Chapter were obtained in the CAPI, with the
exception of alcohol intake which was obtained from the SCQ. 4,557 of the participants
included in this analysis completed an SCQ at Wave 4, while 3,961 participants completed
the SCQ at all four waves. Where participants are separated into age groups, it is age at
the reported wave that is used to categorise participants. All reported data are weighted to
account for probability of selection, survey non-response and attrition.
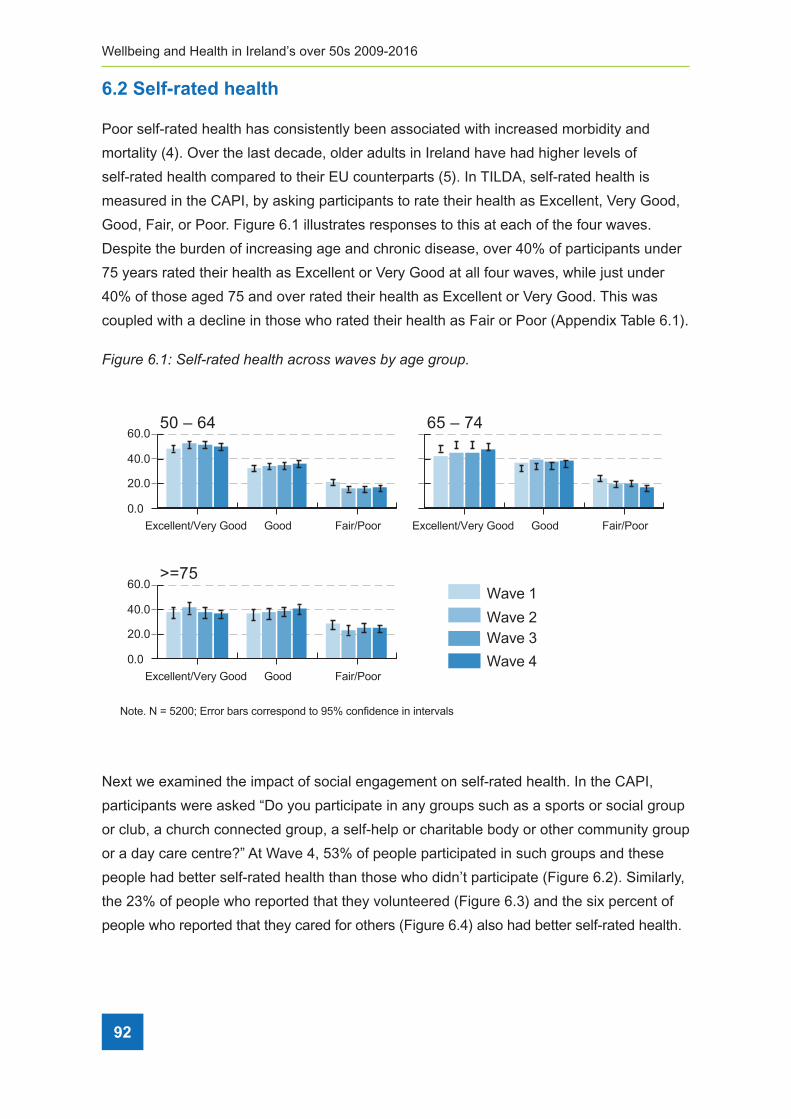
Wellbeing and Health in Ireland’s over 50s 2009-2016
92
6.2 Self-rated health
Poor self-rated health has consistently been associated with increased morbidity and
mortality (4). Over the last decade, older adults in Ireland have had higher levels of
self-rated health compared to their EU counterparts (5). In TILDA, self-rated health is
measured in the CAPI, by asking participants to rate their health as Excellent, Very Good,
Good, Fair, or Poor. Figure 6.1 illustrates responses to this at each of the four waves.
Despite the burden of increasing age and chronic disease, over 40% of participants under
75 years rated their health as Excellent or Very Good at all four waves, while just under
40% of those aged 75 and over rated their health as Excellent or Very Good. This was
coupled with a decline in those who rated their health as Fair or Poor (Appendix Table 6.1).
Figure 6�1: Self-rated health across waves by age group�
40.0
Excellent/Very Good
Wave 1Wave 2Wave 3Wave 4
Note. N = 5200; Error bars correspond to 95% confidence in intervals
Good Fair/Poor
60.0>=75
0.0
20.0
40.0
Excellent/Very Good Good Fair/Poor
60.050 – 64
0.0
20.0
Excellent/Very Good Good Fair/Poor
65 – 74
Next we examined the impact of social engagement on self-rated health. In the CAPI,
participants were asked “Do you participate in any groups such as a sports or social group
or club, a church connected group, a self-help or charitable body or other community group
or a day care centre?” At Wave 4, 53% of people participated in such groups and these
people had better self-rated health than those who didn’t participate (Figure 6.2). Similarly,
the 23% of people who reported that they volunteered (Figure 6.3) and the six percent of
people who reported that they cared for others (Figure 6.4) also had better self-rated health.

6 Chronic conditions and health behaviours
93
Figure 6�2: Self-rated health by participation in social clubs, church groups, charitable
bodies or other community groups at Wave 4�
Note. N = 5200; Error bars correspond to 95% confidence in intervals
FairGoodExcellent/Very Good
40.0
60.0
0.0No Yes
20.0
Figure 6�3: Self-rated health by volunteering status at Wave 4�
Note. N = 5200; Error bars correspond to 95% confidence in intervals
FairGoodExcellent/Very Good
40.0
60.0
0.0No Yes
20.0
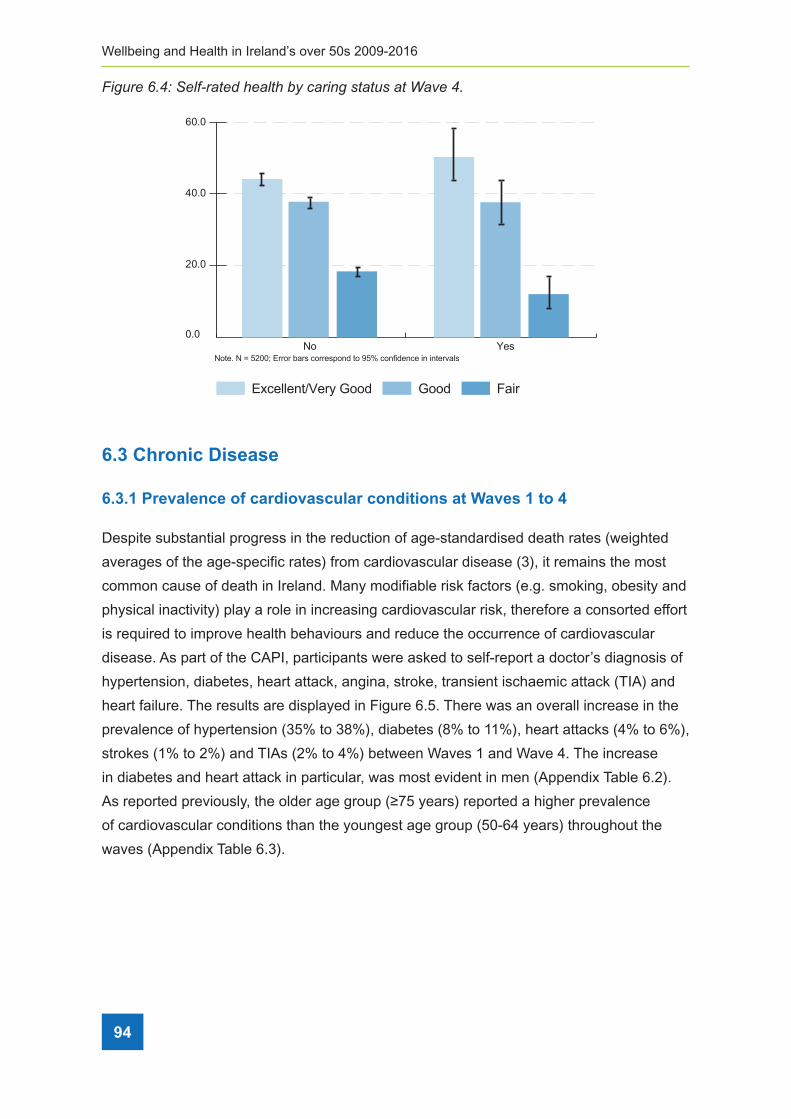
Wellbeing and Health in Ireland’s over 50s 2009-2016
94
Figure 6�4: Self-rated health by caring status at Wave 4�
Note. N = 5200; Error bars correspond to 95% confidence in intervals
FairGoodExcellent/Very Good
40.0
60.0
0.0No Yes
20.0
6.3 Chronic Disease
6.3.1 Prevalence of cardiovascular conditions at Waves 1 to 4
Despite substantial progress in the reduction of age-standardised death rates (weighted
averages of the age-specific rates) from cardiovascular disease (3), it remains the most
common cause of death in Ireland. Many modifiable risk factors (e.g. smoking, obesity and
physical inactivity) play a role in increasing cardiovascular risk, therefore a consorted effort
is required to improve health behaviours and reduce the occurrence of cardiovascular
disease. As part of the CAPI, participants were asked to self-report a doctor’s diagnosis of
hypertension, diabetes, heart attack, angina, stroke, transient ischaemic attack (TIA) and
heart failure. The results are displayed in Figure 6.5. There was an overall increase in the
prevalence of hypertension (35% to 38%), diabetes (8% to 11%), heart attacks (4% to 6%),
strokes (1% to 2%) and TIAs (2% to 4%) between Waves 1 and Wave 4. The increase
in diabetes and heart attack in particular, was most evident in men (Appendix Table 6.2).
As reported previously, the older age group (≥75 years) reported a higher prevalence
of cardiovascular conditions than the youngest age group (50-64 years) throughout the
waves (Appendix Table 6.3).

6 Chronic conditions and health behaviours
95
Figure 6�5: Prevalence of cardiovascular conditions from Waves 1 to 4�
Note. N = 5200; Error bars correspond to 95% confidence in intervalsHypertension Diabetes Heart Attack Angina Stroke TIA Heart Failure
20.0
30.0
0.0
10.0
40.0
Wave 3 Wave 4Wave 2Wave 1
6.3.2 Incident cardiovascular conditions at Waves 2, 3 and 4
Incident cases of cardiovascular disease, i.e. a condition reported by the participant at
the current wave, but not in any of the previous waves, is presented in Figure 6.6. While
prevalence increased, there was a decline in incident cases of hypertension (6% to 4%)
and diabetes (2% to 1%) after Wave 2. Higher incident cases of hypertension at Wave
2 may have been due to feedback received after the Wave 1 health centre assessment,
which prompted participants to seek advice from their GP. The proportion of new cases at
Waves 3 and 4 were stable.

Wellbeing and Health in Ireland’s over 50s 2009-2016
96
Figure 6�6: Incidence of newly reported cardiovascular conditions at Waves 2, 3 and 4�
Wave 3 Wave 4Wave 2
6.3.3 Prevalence of non-cardiovascular conditions at Waves 1 to 4
Non-cardiovascular conditions such as osteoporosis and cataracts are associated with
increased morbidity, decreased quality of life, and increased mortality (6). Osteoporosis is
an increasingly common, chronic condition estimated to affect over 200 million individuals
worldwide (7) and has been estimated to cause over 8.9 million fractures annually.
Osteoporotic fractures account for 0.8% of the global burden of non-communicable
disease and the annual loss of over 5.8 million disability-adjusted life years (DALYs) (8).
Cataracts are one of the most common causes of vision loss in people over age 40 and
are the principal cause of blindness in the world. The global prevalence of cataract in
adults >50 years is estimated at 47.8% while it 19.3% within Europe (9). According to a
recent survey by the Association of Optometrists, the average wait for cataract surgery
in Ireland is 28 months but up to five years in some areas (Association of Optometrists
Ireland, 2018 Children’s Eye-Care & Cataract Services Report).
During the CAPI, participants were asked if they had ever received a doctor’s diagnosis of
cataracts, osteoporosis, arthritis or lung disease and whether they were often troubled by
pain. From Wave 1 to Wave 4, there was an increased prevalence of cataracts (9% to 14%),
osteoporosis (9% to 17%), arthritis (26% to 39%) and lung disease (4% to 5%) (Figure 6.7).

6 Chronic conditions and health behaviours
97
Figure 6�7: Prevalence of non-cardiovascular conditions across the four waves�
Wave 3 Wave 4Wave 2Wave 1
Older women (age ≥75) reported the highest burden of both osteoporosis and arthritis,
with an increased level across all four waves (Appendix Tables 6.4, 6.5, and 6.6). This
could potentially increase the risk of disability and reduced physical activity in older
women in Ireland. Cataracts were common, particularly in the older age group (age ≥75),
however it was within women aged 50-64 years that there was an increased prevalence
of the condition between Waves 1 and 4 (Appendix Tables 6.4 and 6.6). At Wave 1, 38%
of participants reported that they were often troubled by pain and this was consistent
across all subsequent waves (Figure 6.7). Again, this could potentially increase the risk of
disability and reduced physical activity in this group.
6.3.4 Incidence of non-cardiovascular conditions at Waves 2, 3 and 4
Incident new non-cardiovascular disease cases at Waves 2 to 4 are presented in Figure
6.8. Despite an increased prevalence across the waves, the proportion of incident
cataracts, arthritis, osteoporosis and pain decreased from Wave 2 to Wave 4. In the case
of osteoporosis, this may have been due to feedback on bone density (from the heel
ultrasound test) provided to the participants after the Wave 1 health centre assessment.

Wellbeing and Health in Ireland’s over 50s 2009-2016
98
Figure 6�8: Incident non-cardiovascular conditions at Waves 2, 3 and 4�
Wave 3 Wave 4Wave 2
6.4. Falls and fractures
Falls are the dominant cause of injuries among older adults, and are linked to poorer
overall function and early admission to institutional care facilities (10). One in three adults
over the age of 65 falls each year (11), with a single fall significantly increasing the risk
of subsequent falls (12). An Economic Burden of Illness Study estimated that fall-related
injuries in older people cost €402 million to the Irish economy in 2006 and would increase
to €922-1077 by 2020 in the absence of a National Fall and Fracture Prevention Strategy
being implemented (13). Hip fracture is the most common disabling injury in older adults,
and can cause accidental death. Research has shown a 5-10% mortality rate after one
month, rising to 30% after one year (14), with only 40-60% of surviving patients regaining
their pre-fracture level of mobility (15).
Participants were asked a number of questions pertaining to falls history in the CAPI at
each wave the proportion of people who ever reported falling, that is they reported falling
at any of the waves up to Wave 4; the proportion of those who reported a fall in the last
year prior to interview; and the proportion of those who reported recurrent falls in the last
year at each wave. The prevalence of those who ever reported a fall cumulatively up to the
reported wave increased from 20% to 52% between Waves 1 and 4. The number of people
who reported recurrent falling also increased from 7% to 9%. The proportion of people who
reported falling in the year prior to interview, rose from Wave 1 to Wave 3, however we did
not see an increase at Wave 4.

6 Chronic conditions and health behaviours
99
Figure 6�9: Proportion of sample who reported a fall – ever, in the last year or recurrent -
from Wave 1 to Wave 4�
Wave 3 Wave 4Wave 2Wave 1
6.5 Behavioural health
The prevalence of chronic disease, including cardiovascular disease, has increased in
older adults in Ireland since Wave 1 data collection in 2009-2011. Behavioural health
refers to the modifiable risk factors, such as smoking, alcohol and physical inactivity that
can negatively influence health and contribute to chronic disease. In this section, smoking
habits, alcohol intake, problem drinking, and time spent walking are examined in order to
identify any change in behavioural health patterns across the four waves.
6.5.1 Smoking
Smoking is a well-known risk factor for a variety of conditions, in particular, cardiovascular
and lung disease. It also plays a role in other non-life-threatening chronic conditions such
as cataracts and osteoporosis (16). The “Tobacco Free Ireland” policy (17) introduced
in 2013, aims to reduce the prevalence and initiation of smoking. It included a piece on
developing legislation for the introduction of standardised/plain packaging, which was
implemented in the Public Health (Standardised Packaging of Tobacco) Act 2015 and the
EU Tobacco Products Directive.
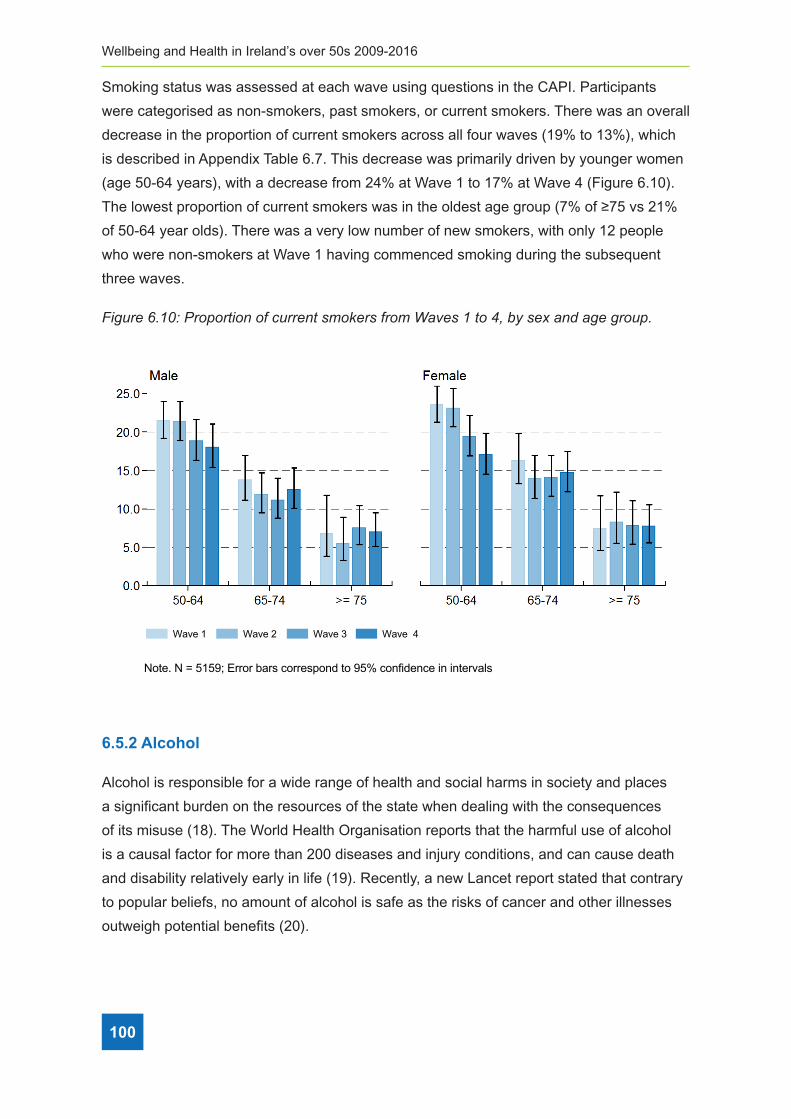
Wellbeing and Health in Ireland’s over 50s 2009-2016
100
Smoking status was assessed at each wave using questions in the CAPI. Participants
were categorised as non-smokers, past smokers, or current smokers. There was an overall
decrease in the proportion of current smokers across all four waves (19% to 13%), which
is described in Appendix Table 6.7. This decrease was primarily driven by younger women
(age 50-64 years), with a decrease from 24% at Wave 1 to 17% at Wave 4 (Figure 6.10).
The lowest proportion of current smokers was in the oldest age group (7% of ≥75 vs 21%
of 50-64 year olds). There was a very low number of new smokers, with only 12 people
who were non-smokers at Wave 1 having commenced smoking during the subsequent
three waves.
Figure 6�10: Proportion of current smokers from Waves 1 to 4, by sex and age group�
Note. N = 5159; Error bars correspond to 95% confidence in intervals
Wave 3 Wave 4Wave 2Wave 1
6.5.2 Alcohol
Alcohol is responsible for a wide range of health and social harms in society and places
a significant burden on the resources of the state when dealing with the consequences
of its misuse (18). The World Health Organisation reports that the harmful use of alcohol
is a causal factor for more than 200 diseases and injury conditions, and can cause death
and disability relatively early in life (19). Recently, a new Lancet report stated that contrary
to popular beliefs, no amount of alcohol is safe as the risks of cancer and other illnesses
outweigh potential benefits (20).

6 Chronic conditions and health behaviours
101
In TILDA, alcohol consumption levels were assessed in the SCQ. At Wave 4, participants
were asked if they drink alcohol, what drink they typically consumed, how often they
drank alcohol and how much they drank in an average sitting. They were also asked
whether they had attempted to cut down their alcohol intake. This information was used to
calculate the number of units of alcohol intake per week. At Wave 4, 14% of participants
who completed the SCQ questions on alcohol (total n=4,454) reported that they had never
consumed alcohol, while 33% reported that they had attempted to cut down their alcohol
intake in the last 2 years. Levels of alcohol consumption were higher in men than women
at all age groups, while the actual levels of consumption decreased with age (Figure 6.11).
It is notable that over 40% of women over the age of 75 drank no alcohol.
Figure 6�11: Prevalence of alcohol intake per week at Wave 4, by age group and sex�
To assess for harmful drinking patterns, participants were asked about their drinking
habits using the “Cut down, Annoyed, Guilty, Eye-opener” (CAGE) questionnaire (21), a
screening tool for problematic drinking. Questions in the CAGE questionnaire included
‘Have you ever felt you should cut down on your drinking’, ‘Have people annoyed you by
criticizing your drinking?’, Have you ever felt bad or guilty about your drinking?’, ‘Have you
ever had a drink first thing in the morning to steady your nerves or get rid of a hangover
(eye-opener)?’ A CAGE score of ≥2 indicated problem alcohol use.
101

Wellbeing and Health in Ireland’s over 50s 2009-2016
102
Figure 6.12 demonstrates the proportion of men and women aged 50 and over in Ireland
who reported problematic alcohol use based on the CAGE questionnaire from Waves 1
to 4. Further breakdown of these results can be found in Appendix Table 6.8. Problematic
alcohol use was more prevalent in men than women (15% versus 9% at Wave 4) and
decreased with age in both genders (Figure 6.13). There was no significant change in the
prevalence of alcohol misuse from Wave 1 to Wave 4 (13% to 12%).
Figure 6�12: Prevalence of problematic alcohol use from Waves 1 to 4, by sex and age group�
Note. N = 3826; Error bars correspond to 95% confidence in intervals
Wave 3 Wave 4Wave 2Wave 1
6.5.3 Physical Activity
There is comprehensive evidence that moderate levels of physical activity can help
prevent disease, improve quality of life and promote physical and mental health (21).
Physical inactivity is recognised by the World Health Organisation as the fourth leading
risk factor for global mortality. The National Guidelines on Physical Activity for Ireland
recommend that all adults take part in at least 150 minutes of moderate activity per week
(22). Walking is the most common and accessible activity for older adults and brisk walking
for 150 minutes per week is also sufficient to meet the physical activity guidelines.
During the CAPI, participants were asked how many days they walked for at least 10
minutes at a time in the last week and on these days, how many minutes did they spend
walking. These results were then used to determine whether participants were meeting
the recommended 150 minutes per week. Overall, a large proportion of the TILDA sample
(48% at Wave 4) did not walk at least 150 minutes per week. This observation was most

6 Chronic conditions and health behaviours
103
notable in adults aged 75 and older – 63% versus 42% of 50-64 year olds at Wave 4
(Figure 6.14 and Appendix Table 6.8). While women aged 75 and older were less likely to
walk at least 150 minutes compared to men (31% versus 45% at Wave 4, Figure 6.13),
there was no gender difference in the younger age groups (Figure 6.13).
Figure 6�13: Proportion of older adults walking 150 minutes or more per week at each wave,
by sex and age group�
Wave 3Wave 4
Wave 2Wave 1
Note. N = 5182; Error bars correspond to 95% confidence in intervals
6.6 Conclusion
There was an overall increase in the prevalence of chronic health conditions across
the first four waves of TILDA (average follow-up 6 years). Only participants who were
present at all four waves were included in the analysis and they were asked if they have
ever suffered from each condition. However, there was a decrease in the number of new
cases of certain conditions such as hypertension, cataracts and osteoporosis. The notable
increase at Wave 2 may have been augmented, due to feedback on blood pressure
and bone density received at the Wave 1 health assessment which may have prompted
participants to seek further assessment from their GP.
The most prevalent conditions among adults aged 50 years and over in Ireland were
hypertension (38% at Wave 4), arthritis (39% at Wave 4) and pain (35% at Wave 4), each
being equivalent to almost half a million adults. Awareness of the proportion of adults
with conditions such as hypertension is important, given its association with multiple
cardiovascular conditions such as ischaemic heart disease and stroke. Arthritis and
pain are commonly disabling for older adults, and awareness of the increasing burden
is relevant for planning of care needs in the future, as well as highlighting the need for
improving treatment and pain management in these individuals.

Wellbeing and Health in Ireland’s over 50s 2009-2016
104
Notably, there was an increase in the proportion of participants who reported falling in the
last year between Waves 1 and 3. There was no further increase in falls from Wave 3 to
Wave 4 which may reflect an increased awareness following a number of public health
reports addressing the issue of falls, including reports from TILDA (23). However, falls
remain an important public health issue – by Wave 4, 52% of TILDA participants reported
at least one fall, equivalent to 660,000 adults in Ireland of this age.
Despite the increased prevalence of chronic conditions, the proportion of adults under
75 years of age who rated their health as Fair or Poor decreased from Wave 1 to Wave
4, however this was not as evident in the 75 and older age group. This may reflect the
increased burden of chronic disease in this age group. Social participation, volunteering
and caring were associated with the highest levels of self-rated health at Wave 4.
Therefore, encouraging social participation amongst older adults may help improve levels
of self-rated health.
Encouragingly, there were some improvements evident in health behaviours across the
waves. Most notably there was a reduction in the proportion of current smokers (driven
largely by females aged 50-64 years), and very low numbers commenced smoking for the
first time. Ireland has been progressive in introducing measures to try to reduce smoking,
in particular being the first country to introduce a workplace smoking ban. The reduction in
smoking could also be due to the 56% increase in the price of cigarettes between Wave 1
and Wave 4. There was no significant change in levels of problem alcohol use, suggesting
more public health strategies are required to target this issue. The new Public Alcohol
Bill (2018) has been officially signed into law and legislates that all alcohol products will
now have to feature health warnings including the link between alcohol and cancers.
Additionally, new measures such as minimum unit pricing and restrictions on how alcohol
is displayed in shops are also forthcoming. The effectiveness of this legislation in reducing
alcohol consumption can be examined in future waves of TILDA.
Of concern is the observation that there was an increased proportion of adults aged 50
and over who walked for less than the recommended 150 minutes per week at Wave 4
(48%) compared to Wave 1 (38%). Despite multiple policy initiatives to support increased
physical activity, a low proportion of the oldest group (≥75 years old) walked at least 150
minutes per week (37% at Wave 4). An increased focus on this specific group is needed to
support them in achieving adequate activity levels.

6 Chronic conditions and health behaviours
105
It is important to note that the data presented in this Chapter were based on self-reported
information, however a major benefit is that we presented information on health and
health behaviours in adults in Ireland across multiple time points. It is envisaged that the
longitudinal nature of this data will be a useful resource in health policy and planning for
older adults particularly in regards to planning resources for chronic disease and positive
behavioural health initiatives.
6.7 References
1. Salive ME. Multimorbidity in older adults. Epidemiol Rev. 2013;35:75-83.
2. Department of Health and Children. Healthy Ireland - A Framework for Improved Health
and Well-being 2013-2025. Government Publications, Dublin, Ireland. 2013.
3. Department of Health and Children. The National Positive Ageing Strategy.
Government Publications, Dublin, Ireland. 2011.
4. Idler EL, Benyamini Y. Self-rated health and mortality: a review of twenty-seven
community studies. J Health Soc Behav. 1997;38(1):21-37.
5. Department of Health and Children. Health in Ireland: Key Trends 2017. DoH.
2017:https://health.gov.ie/wp-content/uploads/2018/01/Key-Trends.pdf.
6. Prince MJ, Wu F, Guo Y, Gutierrez Robledo LM, O’Donnell M, Sullivan R, et al. The
burden of disease in older people and implications for health policy and practice.
Lancet. 2015;385(9967):549-62.
7. Cooper C. Epidemiology of osteoporosis. Osteoporos Int. 1999;9 Suppl 2:S2-8.
8. Laird E, Molloy AM, McNulty H, Ward M, McCarroll K, Hoey L, et al. Greater yogurt
consumption is associated with increased bone mineral density and physical function
in older adults. Osteoporos Int. 2017;28(8):2409-19.
9. Prokofyeva E, Wegener A, Zrenner E. Cataract prevalence and prevention in Europe: a
literature review. Acta Ophthalmol. 2013;91(5):395-405.
10. Guideline for the prevention of falls in older persons. American Geriatrics Society,
British Geriatrics Society, and American Academy of Orthopaedic Surgeons Panel on
Falls Prevention. J Am Geriatr Soc. 2001;49(5):664-72.
11. Bergen G SM, Burns ER. Falls and Fall Injuries Among Adults Aged ≥65 Years —
United States, 2014. MMWR Morb Mortal Wkly Rep 2016;65:993–998.

Wellbeing and Health in Ireland’s over 50s 2009-2016
106
12. O’Loughlin JL, Robitaille Y, Boivin JF, Suissa S. Incidence of and Risk-Factors for
Falls and Injurious Falls among the Community-Dwelling Elderly. Am J Epidemiol.
1993;137(3):342-54.
13. Health Service Executive, Department of Health and Children. Strategy to Prevent
Falls and Fractures in Ireland’s Ageing Population. Report of the National Steering
Group on the Prevention of Falls in Older People and the Prevention and Management
of Osteoporosis throughout Life,. June 2008.
14. Parker M, Johansen A. Hip fracture. BMJ. 2006;333(7557):27-30.
15. Dyer SM, Crotty M, Fairhall N, Magaziner J, Beaupre LA, Cameron ID, et al. A critical
review of the long-term disability outcomes following hip fracture. BMC Geriatr.
2016;16:158.
16. Wald NJ, Hackshaw AK. Cigarette smoking: an epidemiological overview. Br Med Bull.
1996;52(1):3-11.
17. Department of Health. Tobacco Free Ireland. Government Publications, Dublin, Ireland.
2013.
18. Steering Group Report on a National Substance Misuse Strategy. February 2012.
19. WHO. Global status report on alcohol and health. 2014.
20. Collaborators GBDA. Alcohol use and burden for 195 countries and territories, 1990-
2016: a systematic analysis for the Global Burden of Disease Study 2016. Lancet.
2018;392(10152):1015-35.
21. Mayfield D, McLeod G, Hall P. The CAGE questionnaire: validation of a new alcoholism
screening instrument. Am J Psychiatry. 1974;131(10):1121-3.
22. Department of Health and Children. Get Active Ireland Guidelines. 2019
23. O’Connell MD, Kenny RA, Donoghue O. Measures of Health and Function that Predict
Future Falls? . TILDA Report 2016. 2016;6. Trinity College Dublin 2016. https://tilda.
tcd.ie/publications/reports/pdf/w3-key-findings-report/Chapter%206.pdf

6 Chronic conditions and health behaviours
107
Appendices

Wellbeing and Health in Ireland’s over 50s 2009-2016
108
Tabl
e 6�
1: S
elf-
rate
d he
alth
at W
aves
1 to
4, b
y ag
e gr
oup�
Cat
arac
ts
(%)
(95%
CI)
Ost
eop
o-
rosi
s
(%)
(95%
CI)
Art
hri
tis
(%)
(95%
CI)
Lu
ng
D
isea
se
(%)
(95%
CI)
Wri
st
Fra
ctu
re
(%)
(95%
CI)
Hip
F
ract
ure
(%
)(9
5% C
I)P
ain
(%
)(9
5% C
I)E
ver
rep
ort
ed a
fa
ll (%
)(9
5% C
I)R
ecu
rren
t F
alls
(9
5% C
I)
50-6
4
Wav
e 1
3(2
.1-4
.2)
1(0
.6-1
.7)
15.5
(13.
4-17
.8)
2.9
(2.1
-4.1
)13
.9(1
2.0-
16.1
)2.
6(1
.7-3
.8)
33.6
(30.
8-36
.6)
17.7
(15.
6-20
.0)
7.6
(6.2
-9.3
)
Wav
e 2
2.5
(1.7
-3.6
)2.
6(1
.8-3
.7)
19.1
(16.
8-21
.7)
2.8
(1.9
-4.1
)15
.4(1
3.3-
17.8
)2.
5(1
.6-3
.8)
30.8
(28.
1-33
.7)
27.2
(24.
6-30
.1)
7(5
.6-8
.8)
Wav
e 3
4.4
(3.2
-6.0
)3.
2(2
.2-4
.6)
20.6
(18.
0-23
.4)
3.2
(2.2
-4.8
)16
.1(1
3.8-
18.7
)2.
3(1
.4-3
.6)
30.1
(27.
1-33
.1)
35.4
(32.
4-38
.6)
7.1
(5.6
-9.0
)
Wav
e 4
4.3
(3.0
-6.2
)4.
5(3
.1-6
.4)
22.4
(19.
5-25
.6)
3.5
(2.3
-5.5
)17
.4(1
4.8-
20.4
)2.
1(1
.2-3
.5)
31.5
(28.
1-35
.2)
39.3
(35.
8-42
.8)
5.8
(4.2
-7.8
)
Tota
l3.
4(2
.6-4
.5)
2.6
(1.9
-3.5
)18
.9(1
6.8-
21.2
)3.
1(2
.2-4
.2)
15.5
(13.
4-17
.8)
2.4
(1.6
-3.5
)31
.7(2
9.4-
33.9
)28
.4(2
6.1-
30.8
)7
(5.9
-8.2
)
65-7
4
Wav
e 1
8.6
(6.7
-11.
1)2
(1.1
-3.5
)27
.1(2
3.5-
31.1
)3.
8(2
.4-6
.0)
10.2
(8.0
-13.
0)3.
5(2
.2-5
.3)
26.7
(23.
2-30
.5)
18.4
(15.
4-22
.0)
7.1
(5.3
-9.4
)
Wav
e 2
9.3
(7.2
-12.
0)4
(2.8
-5.7
)29
.8(2
6.4-
33.4
)3.
6(2
.4-5
.5)
10.8
(8.6
-13.
5)3.
7(2
.4-5
.6)
27.8
(24.
6-31
.3)
31.6
(27.
8-35
.7)
10.4
(8.3
-12.
9)
Wav
e 3
10.6
(8.6
-13.
0)4.
8(3
.5-6
.6)
32.9
(29.
5-36
.5)
4.3
(2.9
-6.2
)13
(10.
5-16
.1)
4.3
(2.9
-6.3
)29
.6(2
6.3-
33.2
)41
.5(3
7.6-
45.5
)7.
9(6
.2-1
0.1)
Wav
e 4
10.2
(8.3
-12.
5)5.
2(3
.9-6
.8)
31.7
(28.
5-35
.1)
4.8
(3.4
-6.8
)13
(10.
6-15
.8)
4.1
(2.8
-6.1
)29
.2(2
6.0-
32.6
)45
.1(4
1.3-
48.9
)8.
1(6
.3-1
0.4)
Tota
l9.
8(8
.3-1
1.5)
4.2
(3.2
-5.4
)30
.7(2
8.0-
33.5
)4.
2(3
.1-5
.7)
12(9
.9-1
4.3)
3.9
(2.8
-5.6
)28
.5(2
6.1-
31.0
)35
.9(3
2.9-
39.0
)8.
4(7
.1-9
.8)
>=
75
Wav
e 1
28.3
(22.
6-34
.8)
2.6
(1.1
-6.0
)30
.5(2
4.4-
37.4
)3
(1.3
-6.9
)10
.3(6
.7-1
5.6)
4(1
.9-8
.1)
28(2
2.0-
35.0
)23
.3(1
7.9-
29.8
)5.
8(3
.1-1
0.7)
Wav
e 2
21.7
(17.
3-26
.9)
3.6
(1.9
-6.5
)39
.8(3
4.2-
45.8
)3.
9(2
.1-7
.2)
10.3
(7.1
-14.
7)4.
1(2
.3-7
.3)
30.6
(25.
5-36
.2)
38.2
(32.
7-44
.0)
8(5
.3-1
1.9)
Wav
e 3
24.8
(20.
7-29
.4)
4.3
(2.7
-6.8
)39
.1(3
4.4-
44.0
)4.
8(3
.0-7
.4)
10.7
(7.9
-14.
2)5
(3.1
-8.0
)29
.9(2
5.7-
34.6
)47
.3(4
2.5-
52.2
)10
.8(8
.0-1
4.5)
Wav
e 4
21.2
(17.
8-25
.1)
5.9
(4.2
-8.2
)42
(37.
9-46
.3)
4.3
(2.8
-6.4
)11
.3(8
.8-1
4.5)
5.8
(3.9
-8.5
)25
.4(2
1.9-
29.3
)55
.1(5
0.7-
59.3
)11
(8.4
-14.
3)
Tota
l23
.5(2
0.7-
26.5
)4.
4(2
.9-6
.6)
38.8
(34.
6-43
.3)
4.1
(2.8
-6.0
)10
.8(8
.0-1
4.3)
4.9
(3.2
-7.6
)28
.2(2
5.0-
31.6
)44
.1(3
9.9-
48.3
)9.
5(7
.6-1
1.7)
Tota
l
Wav
e 1
7.3
(6.2
-8.5
)1.
4(1
.0-2
.0)
20(1
8.2-
21.9
)3.
1(2
.4-4
.0)
12.6
(11.
2-14
.3)
2.9
(2.2
-3.9
)31
.3(2
9.1-
33.7
)18
.5(1
6.8-
20.3
)7.
3(6
.1-8
.6)
Wav
e 2
7.2
(6.1
-8.5
)3.
1(2
.4-4
.0)
25.1
(23.
2-27
.2)
3.2
(2.5
-4.1
)13
.3(1
1.8-
15.0
)3.
1(2
.3-4
.0)
29.9
(28.
0-32
.0)
30.1
(28.
0-32
.2)
8.1
(6.9
-9.4
)
Wav
e 3
10.3
(9.1
-11.
8)4
(3.2
-4.9
)28
.2(2
6.2-
30.3
)3.
9(3
.1-4
.9)
14(1
2.5-
15.7
)3.
4(2
.6-4
.5)
29.9
(27.
8-32
.0)
39.7
(37.
5-41
.9)
8.1
(7.0
-9.3
)
Wav
e 4
10.6
(9.3
-12.
0)5.
1(4
.2-6
.1)
30.6
(28.
6-32
.7)
4.2
(3.3
-5.3
)14
.3(1
2.8-
16.0
)3.
7(2
.9-4
.8)
29.2
(27.
2-31
.3)
45.3
(43.
1-47
.4)
7.9
(6.7
-9.3
)
Tota
l8.
9(7
.9-9
.9)
3.4
(2.8
-4.1
)26
(24.
2-27
.9)
3.6
(2.9
-4.4
)13
.6(1
2.1-
15.2
)3.
3(2
.5-4
.3)
30.1
(28.
5-31
.7)
33.4
(31.
5-35
.3)
7.8
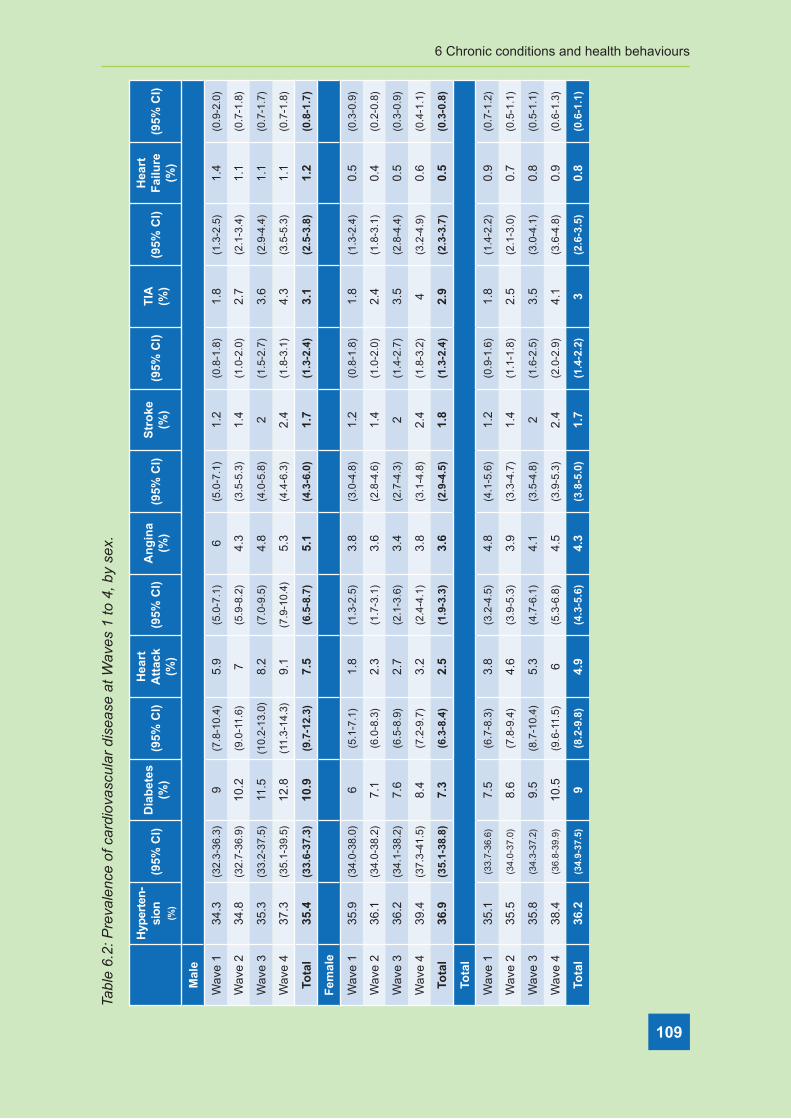
6 Chronic conditions and health behaviours
109
Tabl
e 6�
2: P
reva
lenc
e of
car
diov
ascu
lar
dise
ase
at W
aves
1 to
4, b
y se
x�
Hyp
erte
n-
sio
n
(%)
(95%
CI)
Dia
bet
es
(%)
(95%
CI)
Hea
rt
Att
ack
(%
)(9
5% C
I)A
ng
ina
(%)
(95%
CI)
Str
oke
(%
)(9
5% C
I)T
IA
(%)
(95%
CI)
Hea
rt
Fai
lure
(%
)(9
5% C
I)
Mal
e
Wav
e 1
34.3
(32.
3-36
.3)
9(7
.8-1
0.4)
5.9
(5.0
-7.1
)6
(5.0
-7.1
)1.
2(0
.8-1
.8)
1.8
(1.3
-2.5
)1.
4(0
.9-2
.0)
Wav
e 2
34.8
(32.
7-36
.9)
10.2
(9.0
-11.
6)7
(5.9
-8.2
)4.
3(3
.5-5
.3)
1.4
(1.0
-2.0
)2.
7(2
.1-3
.4)
1.1
(0.7
-1.8
)
Wav
e 3
35.3
(33.
2-37
.5)
11.5
(10.
2-13
.0)
8.2
(7.0
-9.5
)4.
8(4
.0-5
.8)
2(1
.5-2
.7)
3.6
(2.9
-4.4
)1.
1(0
.7-1
.7)
Wav
e 4
37.3
(35.
1-39
.5)
12.8
(11.
3-14
.3)
9.1
(7.9
-10.
4)5.
3(4
.4-6
.3)
2.4
(1.8
-3.1
)4.
3(3
.5-5
.3)
1.1
(0.7
-1.8
)
Tota
l35
.4(3
3.6-
37.3
)10
.9(9
.7-1
2.3)
7.5
(6.5
-8.7
)5.
1(4
.3-6
.0)
1.7
(1.3
-2.4
)3.
1(2
.5-3
.8)
1.2
(0.8
-1.7
)
Fem
ale
Wav
e 1
35.9
(34.
0-38
.0)
6(5
.1-7
.1)
1.8
(1.3
-2.5
)3.
8(3
.0-4
.8)
1.2
(0.8
-1.8
)1.
8(1
.3-2
.4)
0.5
(0.3
-0.9
)
Wav
e 2
36.1
(34.
0-38
.2)
7.1
(6.0
-8.3
)2.
3(1
.7-3
.1)
3.6
(2.8
-4.6
)1.
4(1
.0-2
.0)
2.4
(1.8
-3.1
)0.
4(0
.2-0
.8)
Wav
e 3
36.2
(34.
1-38
.2)
7.6
(6.5
-8.9
)2.
7(2
.1-3
.6)
3.4
(2.7
-4.3
)2
(1.4
-2.7
)3.
5(2
.8-4
.4)
0.5
(0.3
-0.9
)
Wav
e 4
39.4
(37.
3-41
.5)
8.4
(7.2
-9.7
)3.
2(2
.4-4
.1)
3.8
(3.1
-4.8
)2.
4(1
.8-3
.2)
4(3
.2-4
.9)
0.6
(0.4
-1.1
)
Tota
l36
.9(3
5.1-
38.8
)7.
3(6
.3-8
.4)
2.5
(1.9
-3.3
)3.
6(2
.9-4
.5)
1.8
(1.3
-2.4
)2.
9(2
.3-3
.7)
0.5
(0.3
-0.8
)
Tota
l
Wav
e 1
35.1
(33.
7-36
.6)
7.5
(6.7
-8.3
)3.
8(3
.2-4
.5)
4.8
(4.1
-5.6
)1.
2(0
.9-1
.6)
1.8
(1.4
-2.2
)0.
9(0
.7-1
.2)
Wav
e 2
35.5
(34.
0-37
.0)
8.6
(7.8
-9.4
)4.
6(3
.9-5
.3)
3.9
(3.3
-4.7
)1.
4(1
.1-1
.8)
2.5
(2.1
-3.0
)0.
7(0
.5-1
.1)
Wav
e 3
35.8
(34.
3-37
.2)
9.5
(8.7
-10.
4)5.
3(4
.7-6
.1)
4.1
(3.5
-4.8
)2
(1.6
-2.5
)3.
5(3
.0-4
.1)
0.8
(0.5
-1.1
)
Wav
e 4
38.4
(36.
8-39
.9)
10.5
(9.6
-11.
5)6
(5.3
-6.8
)4.
5(3
.9-5
.3)
2.4
(2.0
-2.9
)4.
1(3
.6-4
.8)
0.9
(0.6
-1.3
)
Tota
l36
.2(3
4.9-
37.5
)9
(8.2
-9.8
)4.
9(4
.3-5
.6)
4.3
(3.8
-5.0
)1.
7(1
.4-2
.2)
3(2
.6-3
.5)
0.8
(0.6
-1.1
)

Wellbeing and Health in Ireland’s over 50s 2009-2016
110
Tabl
e 6�
3: P
reva
lenc
e of
car
diov
ascu
lar
dise
ase
at W
ave
1 to
Wav
e 4,
by
age
grou
p�
Hyp
erte
n-
sio
n
(%)
(95%
CI)
Dia
bet
es
(%)
(95%
CI)
Hea
rt
Att
ack
(%
)(9
5% C
I)A
ng
ina
(%)
(95%
CI)
Str
oke
(%
)(9
5% C
I)T
IA
(%)
(95%
CI)
Hea
rt
Fai
lure
(%
)(9
5% C
I)
50-6
4
Wav
e 1
28.9
(27.
2-30
.6)
5.8
(5.0
-6.7
)2.
4(1
.9-3
.1)
2.3
(1.8
-3.1
)0.
8(0
.5-1
.3)
0.9
(0.6
-1.3
)0.
8(0
.5-1
.2)
Wav
e 2
28.6
(26.
8-30
.4)
6.2
(5.3
-7.3
)2.
6(2
.0-3
.4)
1.7
(1.2
-2.4
)1
(0.6
-1.5
)1.
1(0
.7-1
.6)
0.8
(0.5
-1.3
)
Wav
e 3
27.6
(25.
7-29
.6)
6.9
(5.8
-8.1
)3.
1(2
.3-4
.1)
1.8
(1.3
-2.6
)1.
2(0
.8-1
.9)
1.4
(0.9
-1.9
)0.
6(0
.3-1
.1)
Wav
e 4
29.3
(27.
1-31
.7)
7.7
(6.5
-9.2
)3.
8(2
.8-5
.0)
1.8
(1.2
-2.7
)1.
4(0
.9-2
.2)
1.8
(1.2
-2.6
)0.
8(0
.4-1
.5)
Tota
l28
.6(2
7.0-
30.2
)6.
5(5
.7-7
.5)
2.9
(2.3
-3.7
)1.
9(1
.5-2
.6)
1.1
(0.7
-1.6
)1.
2(0
.9-1
.7)
0.7
(0.4
-1.2
)
65-7
4
Wav
e 1
42.4
(39.
6-45
.3)
10.7
(9.0
-12.
6)5.
5(4
.3-7
.0)
7.8
(6.2
-9.7
)2
(1.4
-3.0
)2.
1(1
.4-3
.2)
1.2
(0.7
-2.0
)
Wav
e 2
41.9
(39.
2-44
.5)
11.9
(10.
3-13
.7)
6.6
(5.4
-8.2
)5.
1(3
.9-6
.6)
1.8
(1.2
-2.7
)3
(2.2
-4.0
)0.
7(0
.3-1
.3)
Wav
e 3
40.2
(37.
8-42
.7)
12(1
0.5-
13.7
)5.
7(4
.6-7
.2)
4.4
(3.5
-5.7
)2.
2(1
.6-3
.1)
3.9
(3.1
-4.9
)0.
7(0
.4-1
.4)
Wav
e 4
40.3
(37.
9-42
.8)
11.8
(10.
3-13
.4)
5.4
(4.4
-6.8
)4.
1(3
.2-5
.2)
2.1
(1.5
-2.9
)3.
6(2
.9-4
.6)
0.6
(0.3
-1.2
)
Tota
l41
.1(3
9.1-
43.1
)11
.6(1
0.3-
13.1
)5.
8(4
.8-7
.0)
5.1
(4.2
-6.3
)2
(1.5
-2.8
)3.
3(2
.6-4
.0)
0.8
(0.5
-1.2
)
>=
75
Wav
e 1
50.7
(46.
0-55
.4)
9.4
(7.1
-12.
4)6.
9(5
.0-9
.4)
11(8
.3-1
4.5)
1.5
(0.7
-3.0
)5.
1(3
.4-7
.4)
0.9
(0.4
-2.3
)
Wav
e 2
47.6
(43.
6-51
.7)
10.9
(8.7
-13.
6)7.
4(5
.7-9
.7)
9.1
(6.9
-11.
9)2.
1(1
.2-3
.7)
6.4
(4.7
-8.6
)0.
7(0
.3-1
.8)
Wav
e 3
46.5
(43.
3-49
.9)
11.4
(9.5
-13.
8)9.
5(7
.8-1
1.6)
8.4
(6.6
-10.
5)3.
2(2
.2-4
.8)
7.7
(6.0
-9.8
)1.
2(0
.6-2
.3)
Wav
e 4
48.6
(45.
5-51
.7)
12.8
(10.
9-14
.9)
10(8
.3-1
1.9)
9.1
(7.4
-11.
1)4.
2(3
.1-5
.7)
8.2
(6.7
-10.
1)1.
4(0
.8-2
.4)
Tota
l48
.2(4
5.2-
51.2
)11
.4(9
.5-1
3.6)
8.8
(7.1
-10.
7)9.
2(7
.5-1
1.3)
3(2
.1-4
.3)
7.1
(5.6
-9.0
)1.
1(0
.6-1
.9)
Tota
l
Wav
e 1
35.1
(33.
7-36
.6)
7.5
(6.7
-8.3
)3.
8(3
.2-4
.5)
4.8
(4.1
-5.6
)1.
2(0
.9-1
.6)
1.8
(1.4
-2.2
)0.
9(0
.7-1
.2)
Wav
e 2
35.5
(34.
0-37
.0)
8.6
(7.8
-9.4
)4.
6(3
.9-5
.3)
3.9
(3.3
-4.7
)1.
4(1
.1-1
.8)
2.5
(2.1
-3.0
)0.
7(0
.5-1
.1)
Wav
e 3
35.8
(34.
3-37
.2)
9.5
(8.7
-10.
4)5.
3(4
.7-6
.1)
4.1
(3.5
-4.8
)2
(1.6
-2.5
)3.
5(3
.0-4
.1)
0.8
(0.5
-1.1
)
Wav
e 4
38.4
(36.
8-39
.9)
10.5
(9.6
-11.
5)6
(5.3
-6.8
)4.
5(3
.9-5
.3)
2.4
(2.0
-2.9
)4.
1(3
.6-4
.8)
0.9
(0.6
-1.3
)
Tota
l36
.2(3
4.9-
37.5
)9
(8.2
-9.8
)4.
9(4
.3-5
.6)
4.3
(3.8
-5.0
)1.
7(1
.4-2
.2)
3(2
.6-3
.5)
0.8
(0.6
-1.1
)

6 Chronic conditions and health behaviours
111
Tabl
e 6�
4: P
reva
lenc
e of
non
-car
diov
ascu
lar
chro
nic
cond
ition
s, fa
lls a
nd fr
actu
res
at W
ave
1 to
Wav
e 4,
by
age
grou
p�
Cat
arac
ts
(%)
(95%
CI)
Ost
eop
o-
rosi
s
(%)
(95%
CI)
Art
hri
tis
(%)
(95%
CI)
Lu
ng
D
isea
se
(%)
(95%
CI)
Wri
st
Fra
ctu
re
(%)
(95%
CI)
Hip
F
ract
ure
(%
)(9
5% C
I)P
ain
(%
)(9
5% C
I)E
ver
rep
ort
ed a
fa
ll (%
)(9
5% C
I)R
ecu
rren
t F
alls
(9
5% C
I)
50-6
4
Wav
e 1
3.3
(2.7
-4.0
)6.
7(5
.9-7
.6)
18.7
(17.
3-20
.3)
3.3
(2.7
-4.1
)11
.3(1
0.1-
12.6
)1.
8(1
.3-2
.5)
36.1
(34.
1-38
.2)
18.5
(17.
0-20
.2)
7.4
(6.4
-8.6
)
Wav
e 2
3.2
(2.5
-4.0
)10
.2(9
.1-1
1.3)
22.8
(21.
1-24
.5)
3.7
(3.0
-4.7
)12
.4(1
1.1-
13.9
)1.
9(1
.4-2
.7)
34.4
(32.
4-36
.5)
30.4
(28.
4-32
.3)
7.5
(6.5
-8.8
)
Wav
e 3
4.9
(4.0
-6.1
)10
.7(9
.5-1
2.0)
25.5
(23.
6-27
.6)
4.1
(3.2
-5.2
)13
.8(1
2.3-
15.5
)1.
8(1
.3-2
.7)
34.5
(32.
3-36
.7)
39.6
(37.
4-41
.8)
8.4
(7.2
-9.8
)
Wav
e 4
5.3
(4.2
-6.6
)12
.4(1
0.8-
14.1
)27
.1(2
5.0-
29.3
)4.
4(3
.4-5
.7)
14.7
(13.
0-16
.6)
1.9
(1.2
-2.9
)33
.5(3
1.1-
35.9
)45
.3(4
2.7-
47.9
)7.
9(6
.6-9
.4)
Tota
l4
(3.4
-4.7
)9.
6(8
.7-1
0.6)
23(2
1.4-
24.5
)3.
8(3
.2-4
.6)
12.8
(11.
5-14
.3)
1.9
(1.3
-2.6
)34
.8(3
3.1-
36.5
)31
.6(2
9.9-
33.3
)7.
8(7
.0-8
.6)
65-7
4
Wav
e 1
11.4
(9.8
-13.
4)11
.7(9
.9-1
3.8)
35.1
(32.
2-38
.2)
4.4
(3.3
-6.0
)10
.4(8
.8-1
2.3)
2.5
(1.7
-3.6
)35
.6(3
2.6-
38.7
)21
.3(1
8.7-
24.1
)7.
4(6
.0-9
.2)
Wav
e 2
12.7
(11.
0-14
.6)
17.6
(15.
8-19
.6)
39.2
(36.
4-42
.0)
4.6
(3.6
-6.0
)11
.4(9
.8-1
3.3)
2.4
(1.7
-3.5
)35
.1(3
2.4-
37.8
)36
.5(3
3.9-
39.2
)10
(8.5
-11.
7)
Wav
e 3
13.8
(12.
1-15
.7)
17.3
(15.
5-19
.2)
41.1
(38.
5-43
.8)
5.1
(4.1
-6.4
)12
.8(1
1.1-
14.8
)3
(2.2
-4.1
)35
.3(3
2.7-
37.9
)46
.2(4
3.6-
48.7
)9.
2(7
.8-1
0.7)
Wav
e 4
13.7
(12.
2-15
.4)
17.8
(16.
1-19
.6)
40.2
(37.
9-42
.7)
5.9
(4.7
-7.2
)12
.9(1
1.3-
14.7
)2.
9(2
.1-4
.0)
35.1
(32.
8-37
.5)
51.4
(48.
8-53
.9)
7.9
(6.6
-9.3
)
Tota
l13
.1(1
1.8-
14.4
)16
.4(1
5.0-
18.0
)39
.2(3
7.1-
41.4
)5.
1(4
.2-6
.2)
12.1
(10.
6-13
.7)
2.7
(2.1
-3.6
)35
.2(3
3.3-
37.2
)40
.6(3
8.6-
42.7
)8.
6(7
.7-9
.6)
>=
75
Wav
e 1
32.7
(28.
5-37
.2)
17.5
(14.
3-21
.2)
42.7
(38.
0-47
.5)
4(2
.5-6
.3)
13.7
(10.
9-17
.1)
3.9
(2.5
-6.2
)38
.3(3
3.7-
43.2
)24
(20.
1-28
.4)
7.3
(5.1
-10.
2)
Wav
e 2
24.8
(21.
4-28
.6)
21.7
(18.
6-25
.2)
51(4
6.7-
55.2
)5.
4(3
.8-7
.6)
14.4
(11.
8-17
.5)
4.6
(3.2
-6.7
)39
.5(3
5.5-
43.7
)41
.1(3
7.1-
45.3
)10
.1(7
.7-1
3.1)
Wav
e 3
30(2
6.8-
33.3
)23
.1(2
0.3-
26.1
)51
.3(4
7.8-
54.9
)5.
8(4
.4-7
.7)
14.6
(12.
3-17
.3)
5.3
(4.0
-7.2
)37
.9(3
4.5-
41.4
)54
.9(5
1.4-
58.5
)14
.1(1
1.8-
16.8
)
Wav
e 4
27.1
(24.
5-29
.9)
23.6
(21.
1-26
.3)
52.8
(49.
7-56
.0)
5.5
(4.3
-7.1
)15
.3(1
3.3-
17.7
)5.
7(4
.4-7
.5)
38.3
(35.
4-41
.3)
60.7
(57.
6-63
.6)
13.5
(11.
4-16
.0)
Tota
l28
.4(2
6.3-
30.6
)22
(19.
4-24
.8)
50.2
(46.
9-53
.5)
5.3
(4.1
-6.8
)14
.7(1
2.4-
17.3
)5.
1(3
.8-6
.7)
38.5
(35.
8-41
.2)
48.4
(45.
4-51
.4)
11.8
(10.
3-13
.6)
Tota
l
Wav
e 1
9.3
(8.4
-10.
3)9.
3(8
.5-1
0.3)
26(2
4.5-
27.4
)3.
7(3
.1-4
.4)
11.5
(10.
5-12
.5)
2.3
(1.8
-2.8
)36
.3(3
4.6-
38.0
)19
.9(1
8.6-
21.3
)7.
4(6
.6-8
.3)
Wav
e 2
9.5
(8.6
-10.
5)14
.2(1
3.2-
15.2
)32
.1(3
0.6-
33.6
)4.
3(3
.6-5
.0)
12.5
(11.
5-13
.6)
2.5
(2.0
-3.1
)35
.5(3
3.9-
37.0
)33
.9(3
2.3-
35.4
)8.
6(7
.8-9
.6)
Wav
e 3
13.2
(12.
1-14
.3)
15.5
(14.
5-16
.6)
36.1
(34.
6-37
.6)
4.8
(4.2
-5.5
)13
.7(1
2.6-
14.8
)3
(2.4
-3.6
)35
.5(3
3.9-
37.1
)45
(43.
4-46
.6)
9.9
(9.0
-10.
8)
Wav
e 4
14.1
(13.
0-15
.2)
17.3
(16.
2-18
.5)
38.6
(37.
1-40
.1)
5.2
(4.6
-6.0
)14
.2(1
3.2-
15.4
)3.
3(2
.7-4
.0)
35.3
(33.
8-36
.9)
51.5
(49.
9-53
.1)
9.4
(8.5
-10.
4)
Tota
l11
.5(1
0.7-
12.3
)14
.1(1
3.2-
15.0
)33
.2(3
1.8-
34.6
)4.
5(4
.0-5
.1)
13(1
1.9-
14.0
)2.
8(2
.3-3
.4)
35.6
(34.
4-36
.9)
37.6
(36.
2-38
.9)
8.8
(8.2
-9.5
)

Wellbeing and Health in Ireland’s over 50s 2009-2016
112
Tabl
e 6�
5: P
reva
lenc
e of
non
-car
diov
ascu
lar
chro
nic
cond
ition
s, fa
lls a
nd fr
actu
res
at W
ave
1 to
Wav
e 4,
by
age
grou
p in
men
�
Cat
arac
ts
(%)
(95%
CI)
Ost
eop
o-
rosi
s
(%)
(95%
CI)
Art
hri
tis
(%)
(95%
CI)
Lu
ng
D
isea
se
(%)
(95%
CI)
Wri
st
Fra
ctu
re
(%)
(95%
CI)
Hip
F
ract
ure
(%
)(9
5% C
I)P
ain
(%
)(9
5% C
I)E
ver
rep
ort
ed a
fa
ll (%
)(9
5% C
I)R
ecu
rren
t F
alls
(9
5% C
I)
50-6
4
Wav
e 1
3(2
.1-4
.2)
1(0
.6-1
.7)
15.5
(13.
4-17
.8)
2.9
(2.1
-4.1
)13
.9(1
2.0-
16.1
)2.
6(1
.7-3
.8)
33.6
(30.
8-36
.6)
17.7
(15.
6-20
.0)
7.6
(6.2
-9.3
)
Wav
e 2
2.5
(1.7
-3.6
)2.
6(1
.8-3
.7)
19.1
(16.
8-21
.7)
2.8
(1.9
-4.1
)15
.4(1
3.3-
17.8
)2.
5(1
.6-3
.8)
30.8
(28.
1-33
.7)
27.2
(24.
6-30
.1)
7(5
.6-8
.8)
Wav
e 3
4.4
(3.2
-6.0
)3.
2(2
.2-4
.6)
20.6
(18.
0-23
.4)
3.2
(2.2
-4.8
)16
.1(1
3.8-
18.7
)2.
3(1
.4-3
.6)
30.1
(27.
1-33
.1)
35.4
(32.
4-38
.6)
7.1
(5.6
-9.0
)
Wav
e 4
4.3
(3.0
-6.2
)4.
5(3
.1-6
.4)
22.4
(19.
5-25
.6)
3.5
(2.3
-5.5
)17
.4(1
4.8-
20.4
)2.
1(1
.2-3
.5)
31.5
(28.
1-35
.2)
39.3
(35.
8-42
.8)
5.8
(4.2
-7.8
)
Tota
l3.
4(2
.6-4
.5)
2.6
(1.9
-3.5
)18
.9(1
6.8-
21.2
)3.
1(2
.2-4
.2)
15.5
(13.
4-17
.8)
2.4
(1.6
-3.5
)31
.7(2
9.4-
33.9
)28
.4(2
6.1-
30.8
)7
(5.9
-8.2
)
65-7
4
Wav
e 1
8.6
(6.7
-11.
1)2
(1.1
-3.5
)27
.1(2
3.5-
31.1
)3.
8(2
.4-6
.0)
10.2
(8.0
-13.
0)3.
5(2
.2-5
.3)
26.7
(23.
2-30
.5)
18.4
(15.
4-22
.0)
7.1
(5.3
-9.4
)
Wav
e 2
9.3
(7.2
-12.
0)4
(2.8
-5.7
)29
.8(2
6.4-
33.4
)3.
6(2
.4-5
.5)
10.8
(8.6
-13.
5)3.
7(2
.4-5
.6)
27.8
(24.
6-31
.3)
31.6
(27.
8-35
.7)
10.4
(8.3
-12.
9)
Wav
e 3
10.6
(8.6
-13.
0)4.
8(3
.5-6
.6)
32.9
(29.
5-36
.5)
4.3
(2.9
-6.2
)13
(10.
5-16
.1)
4.3
(2.9
-6.3
)29
.6(2
6.3-
33.2
)41
.5(3
7.6-
45.5
)7.
9(6
.2-1
0.1)
Wav
e 4
10.2
(8.3
-12.
5)5.
2(3
.9-6
.8)
31.7
(28.
5-35
.1)
4.8
(3.4
-6.8
)13
(10.
6-15
.8)
4.1
(2.8
-6.1
)29
.2(2
6.0-
32.6
)45
.1(4
1.3-
48.9
)8.
1(6
.3-1
0.4)
Tota
l9.
8(8
.3-1
1.5)
4.2
(3.2
-5.4
)30
.7(2
8.0-
33.5
)4.
2(3
.1-5
.7)
12(9
.9-1
4.3)
3.9
(2.8
-5.6
)28
.5(2
6.1-
31.0
)35
.9(3
2.9-
39.0
)8.
4(7
.1-9
.8)
>=
75
Wav
e 1
28.3
(22.
6-34
.8)
2.6
(1.1
-6.0
)30
.5(2
4.4-
37.4
)3
(1.3
-6.9
)10
.3(6
.7-1
5.6)
4(1
.9-8
.1)
28(2
2.0-
35.0
)23
.3(1
7.9-
29.8
)5.
8(3
.1-1
0.7)
Wav
e 2
21.7
(17.
3-26
.9)
3.6
(1.9
-6.5
)39
.8(3
4.2-
45.8
)3.
9(2
.1-7
.2)
10.3
(7.1
-14.
7)4.
1(2
.3-7
.3)
30.6
(25.
5-36
.2)
38.2
(32.
7-44
.0)
8(5
.3-1
1.9)
Wav
e 3
24.8
(20.
7-29
.4)
4.3
(2.7
-6.8
)39
.1(3
4.4-
44.0
)4.
8(3
.0-7
.4)
10.7
(7.9
-14.
2)5
(3.1
-8.0
)29
.9(2
5.7-
34.6
)47
.3(4
2.5-
52.2
)10
.8(8
.0-1
4.5)
Wav
e 4
21.2
(17.
8-25
.1)
5.9
(4.2
-8.2
)42
(37.
9-46
.3)
4.3
(2.8
-6.4
)11
.3(8
.8-1
4.5)
5.8
(3.9
-8.5
)25
.4(2
1.9-
29.3
)55
.1(5
0.7-
59.3
)11
(8.4
-14.
3)
Tota
l23
.5(2
0.7-
26.5
)4.
4(2
.9-6
.6)
38.8
(34.
6-43
.3)
4.1
(2.8
-6.0
)10
.8(8
.0-1
4.3)
4.9
(3.2
-7.6
)28
.2(2
5.0-
31.6
)44
.1(3
9.9-
48.3
)9.
5(7
.6-1
1.7)
Tota
l
Wav
e 1
7.3
(6.2
-8.5
)1.
4(1
.0-2
.0)
20(1
8.2-
21.9
)3.
1(2
.4-4
.0)
12.6
(11.
2-14
.3)
2.9
(2.2
-3.9
)31
.3(2
9.1-
33.7
)18
.5(1
6.8-
20.3
)7.
3(6
.1-8
.6)
Wav
e 2
7.2
(6.1
-8.5
)3.
1(2
.4-4
.0)
25.1
(23.
2-27
.2)
3.2
(2.5
-4.1
)13
.3(1
1.8-
15.0
)3.
1(2
.3-4
.0)
29.9
(28.
0-32
.0)
30.1
(28.
0-32
.2)
8.1
(6.9
-9.4
)
Wav
e 3
10.3
(9.1
-11.
8)4
(3.2
-4.9
)28
.2(2
6.2-
30.3
)3.
9(3
.1-4
.9)
14(1
2.5-
15.7
)3.
4(2
.6-4
.5)
29.9
(27.
8-32
.0)
39.7
(37.
5-41
.9)
8.1
(7.0
-9.3
)
Wav
e 4
10.6
(9.3
-12.
0)5.
1(4
.2-6
.1)
30.6
(28.
6-32
.7)
4.2
(3.3
-5.3
)14
.3(1
2.8-
16.0
)3.
7(2
.9-4
.8)
29.2
(27.
2-31
.3)
45.3
(43.
1-47
.4)
7.9
(6.7
-9.3
)
Tota
l8.
9(7
.9-9
.9)
3.4
(2.8
-4.1
)26
(24.
2-27
.9)
3.6
(2.9
-4.4
)13
.6(1
2.1-
15.2
)3.
3(2
.5-4
.3)
30.1
(28.
5-31
.7)
33.4
(31.
5-35
.3)
7.8

6 Chronic conditions and health behaviours
113
Tabl
e 6�
6: P
reva
lenc
e of
non
-car
diov
ascu
lar
chro
nic
cond
ition
s, fa
lls a
nd fr
actu
res
at W
ave
1 to
Wav
e 4,
by
age
grou
p in
wom
en�
Cat
arac
ts
(%)
(95%
CI)
Ost
eop
oro
sis
(%)
(95%
CI)
Art
hri
tis
(%)
(95%
CI)
Lu
ng
Dis
ease
(%)
(95%
CI)
Wri
st
Fra
ctu
re
(%)
(95%
CI)
Hip
Fra
ctu
re
(%)
(95%
CI)
Pai
n (
%)
(95%
CI)
Eve
r
rep
ort
ed a
fall
(%)
(95%
CI)
Rec
urr
ent
Fal
ls (
%)
(95%
CI)
50-6
4
Wav
e 1
3.6
(2.7
-4.7
)12
.4(1
0.8-
14.1
)22
(20.
0-24
.1)
3.7
(2.8
-4.8
)8.
7(7
.4-1
0.3)
1.1
(0.6
-1.9
)38
.6(3
5.9-
41.3
)19
.3(1
7.2-
21.6
)7.
2(5
.9-8
.8)
Wav
e 2
3.9
(3.0
-5.1
)17
.7(1
5.9-
19.7
)26
.4(2
4.1-
28.8
)4.
7(3
.5-6
.1)
9.4
(7.9
-11.
2)1.
4(0
.8-2
.4)
38(3
5.3-
40.8
)33
.4(3
0.8-
36.2
)8.
1(6
.6-9
.8)
Wav
e 3
5.5
(4.2
-7.1
)18
.2(1
6.1-
20.5
)30
.5(2
7.7-
33.4
)4.
9(3
.7-6
.6)
11.5
(9.7
-13.
7)1.
4(0
.8-2
.6)
38.9
(35.
9-41
.9)
43.7
(40.
7-46
.7)
9.7
(8.0
-11.
8)
Wav
e 4
6.1
(4.7
-8.1
)20
(17.
5-22
.8)
31.7
(28.
6-34
.9)
5.3
(3.8
-7.2
)12
(9.9
-14.
5)1.
7(1
.0-3
.2)
35.3
(32.
2-38
.5)
51.1
(47.
6-54
.6)
9.9
(7.9
-12.
4)
Tota
l4.
6(3
.7-5
.6)
16.6
(15.
0-18
.3)
26.9
(24.
9-29
.1)
4.5
(3.6
-5.7
)10
.2(8
.7-1
1.9)
1.4
(0.8
-2.4
)37
.9(3
5.7-
40.2
)34
.7(3
2.4-
37.1
)8.
5(7
.4-9
.8)
65-7
4
Wav
e 1
14.1
(11.
5-17
.1)
20.7
(17.
5-24
.3)
42.7
(38.
7-46
.7)
5.1
(3.4
-7.5
)10
.6(8
.3-1
3.4)
1.5
(0.7
-3.1
)43
.9(3
9.8-
48.1
)24
(20.
2-28
.1)
7.8
(5.8
-10.
4)
Wav
e 2
15.9
(13.
4-18
.8)
30.4
(27.
2-33
.9)
48.1
(44.
2-52
.0)
5.6
(4.0
-7.8
)12
(9.8
-14.
7)1.
2(0
.6-2
.5)
41.9
(38.
2-45
.7)
41.1
(37.
4-44
.9)
9.6
(7.6
-12.
1)
Wav
e 3
16.9
(14.
4-19
.7)
29.3
(26.
2-32
.5)
49(4
5.4-
52.6
)6
(4.5
-7.9
)12
.6(1
0.5-
15.2
)1.
8(1
.0-3
.1)
40.7
(37.
2-44
.3)
50.7
(47.
3-54
.0)
10.4
(8.4
-12.
7)
Wav
e 4
17.2
(14.
9-19
.8)
30.3
(27.
4-33
.3)
48.7
(45.
5-51
.9)
6.9
(5.3
-8.9
)12
.9(1
0.9-
15.3
)1.
8(1
.1-2
.9)
41(3
7.8-
44.3
)57
.6(5
4.5-
60.6
)7.
6(5
.9-9
.7)
Tota
l16
.2(1
4.4-
18.2
)28
.2(2
5.7-
30.8
)47
.4(4
4.5-
50.3
)6
(4.7
-7.6
)12
.2(1
0.3-
14.3
)1.
6(1
.0-2
.6)
41.7
(39.
1-44
.4)
45.2
(42.
5-47
.8)
8.8
(7.7
-10.
2)
>=
75
Wav
e 1
35.7
(29.
9-41
.8)
27.6
(22.
5-33
.3)
50.9
(44.
5-57
.3)
4.6
(2.6
-8.0
)15
.9(1
2.1-
20.7
)3.
9(2
.1-7
.1)
45.3
(39.
2-51
.6)
24.4
(19.
4-30
.3)
8.3
(5.4
-12.
6)
Wav
e 2
27.1
(22.
3-32
.4)
34.8
(29.
8-40
.3)
59(5
3.3-
64.5
)6.
4(4
.1-9
.9)
17.4
(13.
7-21
.8)
4.9
(3.0
-8.0
)46
(40.
4-51
.8)
43.3
(37.
8-48
.9)
11.6
(8.3
-16.
0)
Wav
e 3
33.8
(29.
3-38
.7)
37.1
(32.
6-41
.9)
60.5
(55.
5-65
.2)
6.7
(4.7
-9.5
)17
.6(1
4.3-
21.5
)5.
6(3
.7-8
.2)
43.9
(38.
9-48
.9)
60.7
(55.
6-65
.6)
16.5
(13.
3-20
.4)
Wav
e 4
31.8
(28.
1-35
.8)
37.7
(33.
5-42
.1)
61.4
(57.
0-65
.7)
6.5
(4.7
-8.9
)18
.5(1
5.5-
22.0
)5.
7(4
.0-8
.1)
48.5
(44.
2-52
.9)
65.1
(60.
8-69
.2)
15.6
(12.
6-19
.1)
Tota
l32
.1(2
9.1-
35.2
)35
.1(3
0.9-
39.5
)58
.7(5
4.2-
63.1
)6.
2(4
.5-8
.5)
17.6
(14.
3-21
.3)
5.2
(3.5
-7.6
)46
.1(4
2.4-
49.9
)51
.7(4
7.5-
55.8
)13
.6(1
1.4-
16.3
)
Tota
l
Wav
e 1
11.1
(9.8
-12.
6)16
.7(1
5.2-
18.3
)31
.5(2
9.5-
33.5
)4.
2(3
.4-5
.2)
10.4
(9.1
-11.
7)1.
6(1
.1-2
.3)
40.9
(38.
8-43
.1)
21.2
(19.
4-23
.1)
7.5
(6.4
-8.8
)
Wav
e 2
11.6
(10.
2-13
.1)
24.4
(22.
7-26
.2)
38.5
(36.
4-40
.6)
5.3
(4.3
-6.4
)11
.7(1
0.4-
13.1
)2
(1.4
-2.8
)40
.6(3
8.5-
42.7
)37
.4(3
5.4-
39.5
)9.
2(8
.0-1
0.5)
Wav
e 3
15.8
(14.
3-17
.5)
26.2
(24.
4-28
.1)
43.5
(41.
4-45
.5)
5.7
(4.7
-6.8
)13
.3(1
2.0-
14.8
)2.
5(1
.9-3
.4)
40.7
(38.
6-42
.8)
49.9
(47.
8-52
.0)
11.5
(10.
2-13
.0)
Wav
e 4
17.3
(15.
8-18
.9)
28.6
(26.
8-30
.5)
46(4
3.9-
48.1
)6.
2(5
.2-7
.3)
14.2
(12.
8-15
.7)
2.9
(2.2
-3.8
)41
(38.
8-43
.2)
57.3
(55.
3-59
.3)
10.8
(9.5
-12.
3)
Tota
l14
(12.
9-15
.1)
24(2
2.4-
25.6
)39
.9(3
8.0-
41.7
)5.
3(4
.5-6
.3)
12.4
(11.
1-13
.8)
2.3
(1.7
-3.0
)40
.8(3
9.1-
42.5
)41
.5(3
9.7-
43.2
)9.
8(8
.9-1
0.7)
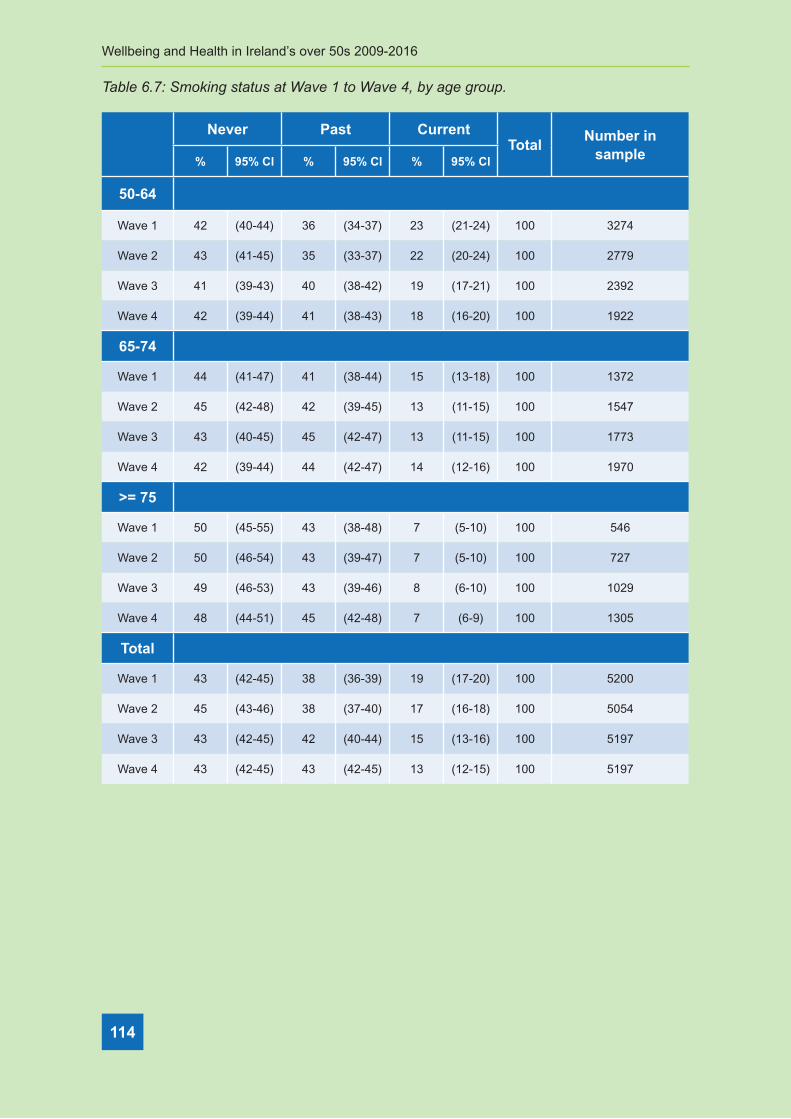
Wellbeing and Health in Ireland’s over 50s 2009-2016
114
Table 6�7: Smoking status at Wave 1 to Wave 4, by age group�
Never Past CurrentTotal
Number in sample% 95% Cl % 95% Cl % 95% Cl
50-64
Wave 1 42 (40-44) 36 (34-37) 23 (21-24) 100 3274
Wave 2 43 (41-45) 35 (33-37) 22 (20-24) 100 2779
Wave 3 41 (39-43) 40 (38-42) 19 (17-21) 100 2392
Wave 4 42 (39-44) 41 (38-43) 18 (16-20) 100 1922
65-74
Wave 1 44 (41-47) 41 (38-44) 15 (13-18) 100 1372
Wave 2 45 (42-48) 42 (39-45) 13 (11-15) 100 1547
Wave 3 43 (40-45) 45 (42-47) 13 (11-15) 100 1773
Wave 4 42 (39-44) 44 (42-47) 14 (12-16) 100 1970
>= 75
Wave 1 50 (45-55) 43 (38-48) 7 (5-10) 100 546
Wave 2 50 (46-54) 43 (39-47) 7 (5-10) 100 727
Wave 3 49 (46-53) 43 (39-46) 8 (6-10) 100 1029
Wave 4 48 (44-51) 45 (42-48) 7 (6-9) 100 1305
Total
Wave 1 43 (42-45) 38 (36-39) 19 (17-20) 100 5200
Wave 2 45 (43-46) 38 (37-40) 17 (16-18) 100 5054
Wave 3 43 (42-45) 42 (40-44) 15 (13-16) 100 5197
Wave 4 43 (42-45) 43 (42-45) 13 (12-15) 100 5197

6 Chronic conditions and health behaviours
115
Table 6�8: Problem alcohol use at Wave 1 to Wave 4, by age group�
Never Past CurrentTotal
Number in sample% 95% Cl % 95% Cl % 95% Cl
50-64
Wave 1 83 (82-85) 17 (15-18) 100 2900 100 3274
Wave 2 81 (79-83) 19 (17-21) 100 2454 100 2779
Wave 3 83 (81-84) 17 (16-19) 100 2051 100 2392
Wave 4 82 (80-84) 18 (16-20) 100 1630 100 1922
65-74
Wave 1 91 (89-93) 9 (7-11) 100 1247 100 1372
Wave 2 91 (89-93) 9 (7-11) 100 1382 100 1547
Wave 3 90 (88-92) 10 (8-12) 100 1550 100 1773
Wave 4 89 (87-90) 11 (10-13) 100 1726 100 1970
>= 75
Wave 1 96 (94-97) 4 (3-6) 100 490 100 546
Wave 2 93 (91-95) 7 (5-9) 100 588 100 727
Wave 3 95 (93-97) 5 (3-7) 100 809 100 1029
Wave 4 95 (94-97) 5 (3-6) 100 1057 100 1305
Total
Wave 1 87 (86-88) 13 (12-14) 100 4643 100 5200
Wave 2 86 (85-87) 14 (13-15) 100 4425 100 5054
Wave 3 88 (87-89) 12 (11-13) 100 4412 100 5197
Wave 4 88 (87-89) 12 (11-13) 100 4416 100 5197

Wellbeing and Health in Ireland’s over 50s 2009-2016
116
Table 6.9: Proportion of adults who walked ≥150 minutes per week at Wave 1 to Wave 4, by age group�
<150 mins per week
>=150 mins per week Total
Number in sample
% 95% Cl % 95% Cl
50-64
Wave 1 35 (33-37) 65 (63-67) 100 3274
Wave 2 37 (35-39) 63 (61-65) 100 2882
Wave 3 41 (39-43) 59 (57-61) 100 2364
Wave 4 42 (39-44) 58 (56-61) 100 1922
65-74
Wave 1 37 (34-40) 63 (60-66) 100 1372
Wave 2 39 (36-42) 61 (58-64) 100 1580
Wave 3 43 (40-46) 57 (54-60) 100 1759
Wave 4 45 (43-47) 55 (53-57) 100 1970
>= 75
Wave 1 52 (47-57) 48 (43-53) 100 546
Wave 2 58 (54-62) 42 (38-46) 100 737
Wave 3 63 (60-67) 37 (33-40) 100 1019
Wave 4 63 (60-66) 37 (34-40) 100 1305
Total
Wave 1 38 (36-39) 62 (61-64) 100 5200
Wave 2 41 (39-43) 59 (57-61) 100 5200
Wave 3 46 (45-48) 54 (52-55) 100 5144
Wave 4 48 (47-50) 52 (50-53) 100 5197

7 Frailty
117
ContentsKey findings
7.1 Introduction ................................................................................................................. 119
7.2 Frailty prevalence, incidence and transitions.............................................................. 120
7.3 The sociodemographics of frailty ................................................................................ 122
7.4 Frailty, falls, fear of falling and disability ..................................................................... 125
7.5 Frailty and mental health ............................................................................................ 121
7.6 Conclusion .................................................................................................................. 129
7.8 References ................................................................................................................. 122
Appendices ....................................................................................................................... 134
Key Findings
7 FrailtyAisling O’Halloran and Mary O’Shea

Wellbeing and Health in Ireland’s over 50s 2009-2016
118
• Frailty is a common condition affecting 12.7% of adults aged 50 years and over and
21.5% of people aged 65 and over in Ireland.
• Frailty is a dynamic process that can change over time and people living with frailty can
transition in either direction between the different states of frailty namely robustness,
pre-frailty (an intermediate state) and frailty.
• The prevalence of frailty among women is twice that of men at Wave 4 (24.9% versus
12.6%) and increases with age in both sexes. Frailty is also more prevalent among
people who are living alone, are widowed, and those with lower levels of educational
attainment.
• Frailty is a risk factor for single and recurrent falls, fear of falling and disability among
adults aged 50 and over.
• People living with frailty are more likely to experience declines in mental health
including lower levels of cognitive function and higher levels of depressive symptoms.
• Frailty is not inevitable and can be avoided, delayed and reversed with timely and
appropriate interventions.
7 Frailty

7 Frailty
119
7.1 Introduction
Frailty is described as a distinctive health state related to the ageing process in which
multiple body systems gradually lose their in-built reserves. Older adults living with
frailty are at an increased risk of unpredictable deterioration in their health following
minor stressor events such as an infection, dehydration or adverse effects related to a
new medication (1). Frailty is a common condition in older adults although it is not an
inevitable part of the ageing process (2). Frailty can occur at any age but becomes more
prevalent with advancing age, with the prevalence in community living older adults aged
65 years and older ranging from 4% to 59% (3). This association with increasing age has
implications for Ireland which has an ageing population. Frailty is becoming a key concept
in healthcare service planning, development and delivery for our ageing population (4).
Frailty is a dynamic process that changes over time and can be viewed on a continuum. An
older person can transition in either direction between the different states of frailty namely
robustness, pre-frailty (an intermediate state) and frailty (5). Robust older people may have
some health problems but these problems are being managed well. Older people with pre-
frailty are at an increased risk of adverse outcomes but are coping; and older people with
frailty have complex health problems and functional limitations that put them at the highest
risk of adverse health outcomes such as falls, disability, hospitalisation, nursing home
admission and even death (6). Identification of frailty in older adults is important as it has
modifiable risk factors for disability and death. Identifying people living with, or at risk for,
frailty provides an opportunity to prevent or intervene in the development of subsequent
adverse health consequences (7). Proactive and preventative health care responses can
improve quality of life and reduce costs of healthcare for older adults.
Although frailty is a recognisable and common phenomenon in ageing, it is difficult to
accurately define and diagnose. The gold standard for the assessment and management
of frailty is the Comprehensive Geriatric Assessment (CGA). CGA is a holistic and
interdisciplinary assessment of an individual and has been demonstrated to reduce
adverse outcomes including disability, cognitive decline, long-term residential care and
death (8). However, CGA is time consuming and must be carried out by trained clinicians
so it is not feasible for everyone living with frailty to undergo a full multidisciplinary review.
Despite a lack of agreement on an internationally accepted and easily administered
consensus measure of frailty, two methods of screening are commonly used (9). One
method is the Frailty Phenotype model which views frailty as the presence of three or
more of the following characteristics: unintended weight loss, exhaustion, weakness,
slow gait speed and low physical activity. A person is considered pre-frail if they have 1-2
characteristics and robust if they have none of these characteristics (6, 10).

Wellbeing and Health in Ireland’s over 50s 2009-2016
120
The second method is the Cumulative Deficit or Frailty Index (FI) model which views
frailty as a state of system breakdown due to the accumulation of physical, social and
psychological health symptoms and conditions, described as health deficits. The FI
measures the number of health deficits present as a proportion of the total number of
potential health deficits tested to determine whether a person is in robust health, living with
pre-frailty or living with frailty (11, 12).
Population based cohort studies such as TILDA commonly use the Frailty Phenotype
and the FI to measure frailty in large population representative samples and to explore
relationships between frailty and potential risk factors and health outcomes. Using the
FI, this Chapter provides information on the prevalence, incidence and transitions of
frailty in adults aged 50 and over, and examines the associations between frailty and
sociodemographic factors, physical health outcomes and mental health outcomes. The
information presented is based on cross-sectional analyses of the same 5,304 TILDA
participants at each wave of data collection - Wave 1 (2009-2011), Wave 2 (2012-2013),
Wave 3 (2014-2015) and Wave 4 (2016) of TILDA.
7.2 Frailty prevalence, incidence and transitions
7.2.1 Prevalence of frailty at Waves 1 to 4
A deficit accumulation FI was constructed using 32 self-reported health deficits identified
during the TILDA home interview at Waves 1, 2, 3 and 4, following the previously published
methodology (11-13). The 32 deficits were associated with poor health, were distributed
across several health domains and were associated with advancing age. Each deficit was
coded as present (1) or absent (0). Deficits with more than two categories were coded as a
proportion of the number and order of responses (e.g. five answer categories – Excellent,
Very Good, Good, Fair and Poor were coded as 0, 0.25, 0.5, 0.75 and 1.0). The 32 deficits
included in the FI are listed in Appendix 7.1. The total was then summed and divided by
32. This produced FI scores between 0.0 and 1.0. Scores of <0.10, 0.10-0.24 and ≥0.25
were used to classify participants as robust, pre-frail and frail respectively.
The prevalence, or the proportion of the community-dwelling population aged 50 years and
over, by frailty status at Waves 1 to 4 are provided in Table 7.1. The prevalence of frailty
increased from 12.7% to 19.0% between Waves 1 and 4, while pre-frailty increased from
30.9% to 39.2%. Correspondingly the prevalence of robustness decreased from 56.4% at
Wave 1 to 41.8% at Wave 4. These data indicated that frailty and pre-frailty were common
among older adults in Ireland. The increasing prevalence of pre-frailty and frailty at each
wave was mainly due to the ageing of the cohort between Waves 1 and 4.
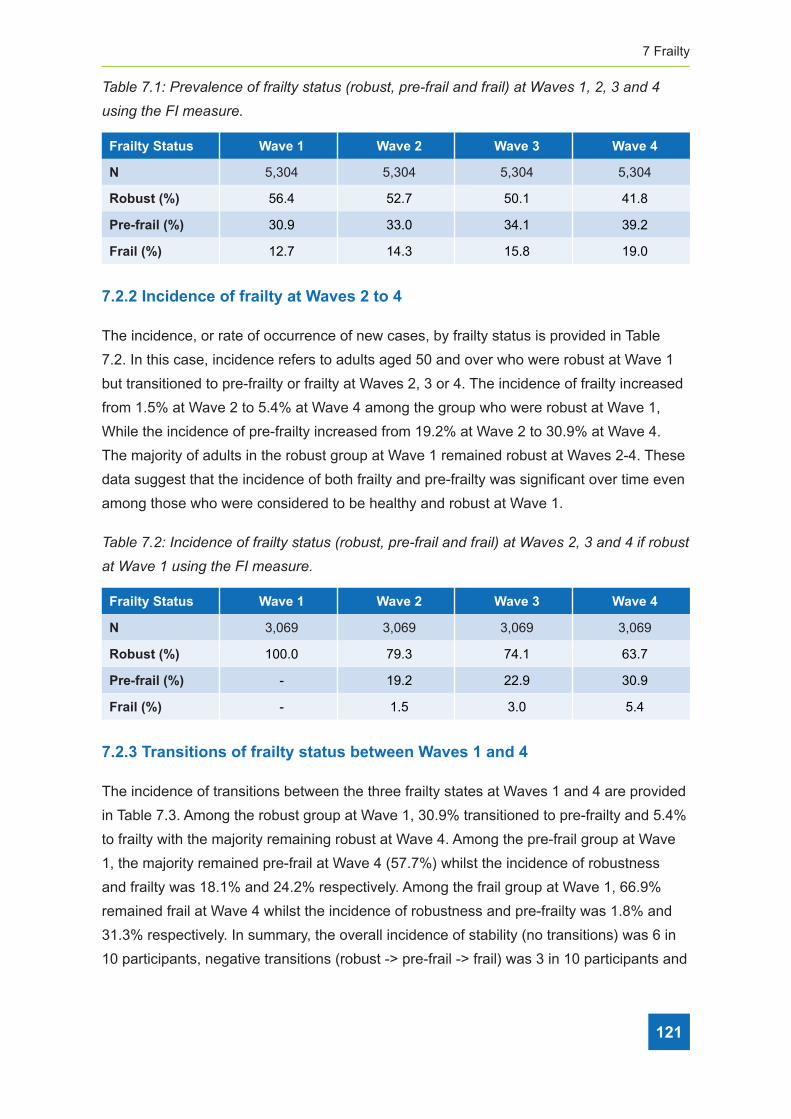
7 Frailty
121
Table 7�1: Prevalence of frailty status (robust, pre-frail and frail) at Waves 1, 2, 3 and 4
using the FI measure�
Frailty Status Wave 1 Wave 2 Wave 3 Wave 4
N 5,304 5,304 5,304 5,304
Robust (%) 56.4 52.7 50.1 41.8
Pre-frail (%) 30.9 33.0 34.1 39.2
Frail (%) 12.7 14.3 15.8 19.0
7.2.2 Incidence of frailty at Waves 2 to 4
The incidence, or rate of occurrence of new cases, by frailty status is provided in Table
7.2. In this case, incidence refers to adults aged 50 and over who were robust at Wave 1
but transitioned to pre-frailty or frailty at Waves 2, 3 or 4. The incidence of frailty increased
from 1.5% at Wave 2 to 5.4% at Wave 4 among the group who were robust at Wave 1,
While the incidence of pre-frailty increased from 19.2% at Wave 2 to 30.9% at Wave 4.
The majority of adults in the robust group at Wave 1 remained robust at Waves 2-4. These
data suggest that the incidence of both frailty and pre-frailty was significant over time even
among those who were considered to be healthy and robust at Wave 1.
Table 7�2: Incidence of frailty status (robust, pre-frail and frail) at Waves 2, 3 and 4 if robust
at Wave 1 using the FI measure�
Frailty Status Wave 1 Wave 2 Wave 3 Wave 4
N 3,069 3,069 3,069 3,069
Robust (%) 100.0 79.3 74.1 63.7
Pre-frail (%) - 19.2 22.9 30.9
Frail (%) - 1.5 3.0 5.4
7.2.3 Transitions of frailty status between Waves 1 and 4
The incidence of transitions between the three frailty states at Waves 1 and 4 are provided
in Table 7.3. Among the robust group at Wave 1, 30.9% transitioned to pre-frailty and 5.4%
to frailty with the majority remaining robust at Wave 4. Among the pre-frail group at Wave
1, the majority remained pre-frail at Wave 4 (57.7%) whilst the incidence of robustness
and frailty was 18.1% and 24.2% respectively. Among the frail group at Wave 1, 66.9%
remained frail at Wave 4 whilst the incidence of robustness and pre-frailty was 1.8% and
31.3% respectively. In summary, the overall incidence of stability (no transitions) was 6 in
10 participants, negative transitions (robust -> pre-frail -> frail) was 3 in 10 participants and

Wellbeing and Health in Ireland’s over 50s 2009-2016
122
positive transitions (frail -> pre-frail -> robust) was 1 in 10 participants between Waves 1
and 4. These data indicate that frailty is a dynamic process and that an older person can
transition between the different states of frailty over time. It also highlights that frailty is a
modifiable and potentially reversible condition, amenable to prevention and intervention
strategies to halt or ameliorate the development of frailty itself and related adverse health
outcomes.
Table 7�3: Incidence of transitions in frailty status (robust, pre-frail and frail) between
Waves 1 and 4 using the FI measure (n = 5,304)�
Wave 1
Robust (%) Pre-frail (%) Frail (%)
Wav
e 4
Robust (%) 63.7 18.1 1.8
Pre-frail (%) 30.9 57.7 31.3
Frail (%) 5.4 24.2 66.9
Total 100.0 100.0 100.0
N 3,069 1,631 604
7.3 Sociodemographics of frailty
The development of frailty at older ages is related to demographic and social factors that
are determined much earlier during the life-course. Here we examined the impact on
frailty of self-reported demographic and social data regarding age, gender, highest level
of educational attainment, marital status and living arrangements, provided by participants
during the home interview.
7.3.1 Age and frailty
The prevalence of frailty and pre-frailty increased with increasing age in all age groups
and at all waves as summarised in Table 7.4. There was a progressive increase in
the prevalence of frailty in the 75+ age group from 30.2% to 39.1% between Waves 1
and 4, however this trend was not observed for pre-frailty. These data support the well
documented relationship between increasing prevalence of frailty with advancing age.
Table 7�4:� Age and frailty at Waves 1 - 4 using the FI measure (n = 5,304)�
Wave 1 Wave 2 Wave 3 Wave 4
Age Robust Pre-frail Frail Robust Pre-frail Frail Robust Pre-frail Frail Robust Pre-frail Frail
50-64 (%) 67 25.5 7.5 67.1 25.0 7.9 66.6 25.9 7.5 60.1 31.2 8.7
65-74 (%) 46.7 37.1 16.2 43.0 40.5 16.5 45.4 39.9 14.7 40.7 44.4 14.9
>=75 (%) 25 44.8 30.2 21.4 46.9 31.7 21.9 42.8 35.3 17.2 43.7 39.1

7 Frailty
123
7.3.2 Gender and frailty
The prevalence of frailty among women was higher at all waves and was approximately
twice that of men at Waves 2-4 as summarised in Table 7.5. The change in prevalence
of frailty between Waves 1 and 4 was three times higher for women compared to men
(9.2% versus 3.2%). There is no statistical difference in the prevalence of pre-frailty among
men and women at any wave. These data support the documented relationship between
increasing prevalence of frailty among women compared to men.
Table 7�5: Gender and frailty at Waves 1 - 4 using the FI measure (n = 5,304)�
Wave 1 Wave 2 Wave 3 Wave 4
Gender Robust Pre-frail Frail Robust Pre-frail Frail Robust Pre-frail Frail Robust Pre-frail Frail
Male (%) 61.3 29.3 9.4 58.5 32.1 9.4 56.1 33.0 10.9 48.0 39.4 12.6
Female (%) 51.9 32.4 15.7 47.2 33.9 18.8 44.4 35.1 20.5 36.0 39.1 24.9
7.3.3 Education and frailty
Among the older adult population, 46% attained a secondary education level, 29% attained
a primary education level and 25% attained third level education as described in Table
7.6. Frailty was twice as prevalent among those who attained a primary level of education
only compared to those who attained secondary level and over three-times more prevalent
compared to those who attained third level education. The prevalence of frailty increased
from 22.2% at Wave 1 to 30.6% at Wave 4 for participants who attained a primary level
of education. The prevalence of pre-frailty follows a similar pattern with a smaller but still
significant effect.
Table 7�6: Highest level of educational attainment and frailty at Waves 1 - 4 using the FI
measure (n = 5,304)�
Wave 1 Wave 2 Wave 3 Wave 4
Robust Pre-frail Frail Robust Pre-frail Frail Robust Pre-frail Frail Robust Pre-frail Frail
Primary (%) 43.5 36.3 22.2 38.8 38.6 22.6 34.8 38.6 26.6 27.0 42.4 30.6
Secondary (%) 59.7 29.0 11.3 54.7 32.4 12.9 52.9 33.2 13.9 44.3 38.4 17.3
Third level (%) 65.6 28.0 6.4 64.7 28.0 7.3 62.1 30.5 7.4 53.7 37.1 9.2
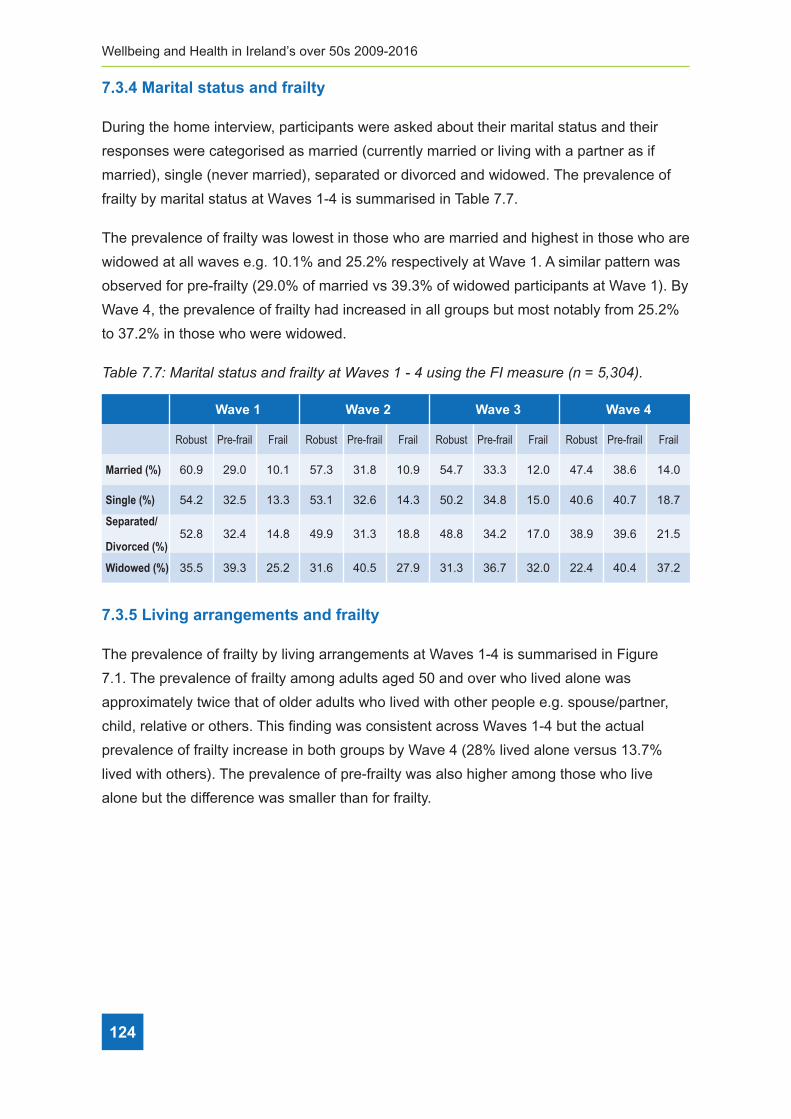
Wellbeing and Health in Ireland’s over 50s 2009-2016
124
7.3.4 Marital status and frailty
During the home interview, participants were asked about their marital status and their
responses were categorised as married (currently married or living with a partner as if
married), single (never married), separated or divorced and widowed. The prevalence of
frailty by marital status at Waves 1-4 is summarised in Table 7.7.
The prevalence of frailty was lowest in those who are married and highest in those who are
widowed at all waves e.g. 10.1% and 25.2% respectively at Wave 1. A similar pattern was
observed for pre-frailty (29.0% of married vs 39.3% of widowed participants at Wave 1). By
Wave 4, the prevalence of frailty had increased in all groups but most notably from 25.2%
to 37.2% in those who were widowed.
Table 7�7: Marital status and frailty at Waves 1 - 4 using the FI measure (n = 5,304)�
Wave 1 Wave 2 Wave 3 Wave 4
Robust Pre-frail Frail Robust Pre-frail Frail Robust Pre-frail Frail Robust Pre-frail Frail
Married (%) 60.9 29.0 10.1 57.3 31.8 10.9 54.7 33.3 12.0 47.4 38.6 14.0
Single (%) 54.2 32.5 13.3 53.1 32.6 14.3 50.2 34.8 15.0 40.6 40.7 18.7
Separated/
Divorced (%)52.8 32.4 14.8 49.9 31.3 18.8 48.8 34.2 17.0 38.9 39.6 21.5
Widowed (%) 35.5 39.3 25.2 31.6 40.5 27.9 31.3 36.7 32.0 22.4 40.4 37.2
7.3.5 Living arrangements and frailty
The prevalence of frailty by living arrangements at Waves 1-4 is summarised in Figure
7.1. The prevalence of frailty among adults aged 50 and over who lived alone was
approximately twice that of older adults who lived with other people e.g. spouse/partner,
child, relative or others. This finding was consistent across Waves 1-4 but the actual
prevalence of frailty increase in both groups by Wave 4 (28% lived alone versus 13.7%
lived with others). The prevalence of pre-frailty was also higher among those who live
alone but the difference was smaller than for frailty.

7 Frailty
125
Figure 7�1: Living arrangement and frailty at Waves 1 - 4 using the FI measure (n = 5,304)�
0
10
20
30
40
50
60
70
Rob
ust
Pre
-fal
l
Frai
l
Rob
ust
Pre
-fal
l
Frai
l
Rob
ust
Pre
-fal
l
Frai
l
Rob
ust
Pre
-fal
l
Frai
l
Wave 1 Wave 2 Wave 3 Wave 4
% P
reva
lenc
e
Lives with others Lives alone
7.4 Frailty, falls, fear of falling and disability
Frailty is a known risk factor for falls, fear of falling and disability. Self-reported information
regarding the number of falls, whether participants had fear of falling and whether they
had any disabilities in performing the basic and/or instrumental activities of daily living was
provided by participants during the home interview.
7.4.1 Frailty and single and recurrent falls
During each interview, participants were asked if they had fallen in the past year. Falls
reported at each Wave were used to define the falls outcomes i.e. no falls, single fall or
recurrent falls (none, one or more than one fall in the past year). The prevalence of frailty
by falls outcomes at Waves 1-4 is summarised in Table 7.8.
The prevalence of single falls was highest among people living with frailty compared to
those with pre-frailty or those who were robust. This was consistent across Waves 1-4.
The prevalence of recurrent falls also followed the same pattern with recurrent falls highest
among adults living with frailty. Notably, those who were robust were much less likley to
have recurrent falls compared to single falls across Waves 1-4. The higher prevalence of
single falls could be the result of trips/slips among the robust rather than an underlying
pathology among those who are living with pre-frailty or frailty.

Wellbeing and Health in Ireland’s over 50s 2009-2016
126
Table 7�8: Falls outcomes and frailty at Waves 1 - 4 using the FI measure (n = 5,304)�
Wave 1 Wave 2 Wave 3 Wave 4
Robust Pre-frail Frail Robust Pre-frail Frail Robust Pre-frail Frail Robust Pre-frail Frail
No falls (%) 85 76.8 68.1 84.9 75.3 60.4 86.3 78.0 64.0 87.0 80.7 62.2
1 fall (%) 10.4 14.4 16.3 11.1 14.1 18.3 10.7 14.1 19.4 10.5 12.6 18.1
>=2 falls (%) 4.5 8.9 15.6 4.0 10.6 21.3 3.0 6.9 16.4 2.5 6.6 19.7
7.4.2 Frailty and fear of falling
During each interview, fear of falling was identified by asking participants “Are you afraid of
falling?” to which they responded “Yes” or “No”. The prevalence of frailty by fear of falling
at Waves 1-4 is summarised in Figure 7.2.
The prevalence of fear of falling was at least four times higher among people living with
frailty and twice as high among people living with pre-frailty compared to those who were
robust. This was consistent across Waves 1-4. The highest prevalence of fear of falling
was at Wave 4 when 12.6%, 30.1% and 60.2% reported fear of falling among the robust,
pre-frail and frail groups respectively.
Figure 7�2: Fear of falling and frailty at Waves 1 - 4 using the FI measure (n = 5,304)�
44##
*@FG8#!"P"#,@GG?#CDAECN8?#@<=#:B@;GA9#@A#)@I8?#4#5#Q#D?;<>#AL8#,%#N8@?DB8#W<#f#UJK3QX"#! =7:&!0! =7:&!5! =7:&!@! =7:&!>!
! B#C3'%! 92&G*27+8! 627+8! B#C3'%! 92&G*27+8! 627+8! B#C3'%! 92&G*27+8! 627+8! B#C3'%! 92&G*27+8! 627+8!
A#!*788'!DEF! PU# !6"P# 6P"4# PQ"Y# !U"K# 63"Q# P6"K# !P"3# 6Q"3# P!"3# P3"!# 62"2#
0!*788!DEF! 43"Q# 4Q"Q# 46"K# 44"4# 4Q"4# 4P"K# 43"!# 4Q"4# 4Y"Q# 43"U# 42"6# 4P"4#
PQ5!*788'!DEF! Q"U# P"Y# 4U"6# Q"3# 43"6# 24"K# K"3# 6"Y# 46"Q# 2"U# 6"6# 4Y"!#
#
./>/5!627+8%)!7$,!6&72!#*!6788+$-!
1DB;<>#8@EL#;<A8BI;8VJ#:8@B#C:#:@GG;<>#V@?#;=8<A;:;8=#F9#@?[;<>#O@BA;E;O@<A?#j.B8#9CD#@:B@;=#C:#
:@GG;<>kl#AC#VL;EL#AL89#B8?OC<=8=#j/8?l#CB#j'Cl"#*L8#OB8I@G8<E8#C:#:B@;GA9#F9#:8@B#C:#:@GG;<>#
@A#)@I8?#45Q#;?#?DNN@B;?8=#;<#,;>DB8#!"2"#
*L8#OB8I@G8<E8#C:#:8@B#C:#:@GG;<>#V@?#@A#G8@?A#:CDB#A;N8?#L;>L8B#@NC<>#O8COG8#G;I;<>#V;AL#
:B@;GA9#@<=#AV;E8#@?#L;>L#@NC<>#O8COG8#G;I;<>#V;AL#OB85:B@;GA9#ECNO@B8=#AC#ALC?8#VLC#V8B8#
BCFD?A"#*L;?#V@?#EC<?;?A8<A#@EBC??#)@I8?#45Q"#*L8#L;>L8?A#OB8I@G8<E8#C:#:8@B#C:#:@GG;<>#V@?#
@A#)@I8#Q#V;AL#42"6TJ#K3"4T#@<=#63"2T#B8OCBA8=#@NC<>#AL8#BCFD?AJ#OB85:B@;G#@<=#:B@;G#
>BCDO?#B8?O8EA;I8G9"##
#
,;>DB8#!"2#,8@B#C:#:@GG;<>#@<=#:B@;GA9#@A#)@I8?#4#5#Q#D?;<>#AL8#,%#N8@?DB8#W<#f#UJK3QX#
##
./>/@!627+8%)!7$,!,+'7C+8+%)!
H@BA;E;O@<A?#V8B8#@?[8=#;:#AL89#L@I8#@<9#=;::;EDGA;8?#V;AL#F@?;E#@EA;I;A;8?#C:#=@;G9#G;I;<>#W.1$?X#
CB#;<?ABDN8<A@G#@EA;I;A;8?#C:#=@;G9#G;I;<>#W%.1$?XJ#8ZEGD=;<>#@<9#=;::;EDGA;8?#8ZO8EA8=#AC#G@?A#
G8??#AL@<#ALB88#NC<AL?"#.1$?#;<EGD=8#A@?[?#?DEL#@?#V@G[;<>J#F@AL;<>J#=B8??;<>#@<=#8@A;<>J#
3
23
Q3
63
P3
-CFD
?A
HB85:B@
;G
,B@;G
-CFD
?A
HB85:B@
;G
,B@;G
-CFD
?A
HB85:B@
;G
,B@;G
-CFD
?A
HB85:B@
;G
,B@;G
)@I8#4 )@I8#2 )@I8#K )@I8#Q
T#HB8I@G8<E8
,8@B#C:#:@GG;<>
7.4.3 Frailty and disability
Participants were asked if they have any difficulties with basic activities of daily living
(ADLs) or instrumental activities of daily living (IADLs), excluding any difficulties expected
to last less than three months. ADLs included tasks such as walking, bathing, dressing

7 Frailty
127
and eating, while IADLs included tasks such as preparing meals, shopping for groceries
and managing medications, all tasks which help support an independent lifestyle. The
prevalence of frailty by the presence of having at least one ADL or IADL disability at Waves
1-4 is summarised in Figure 7.3.
The prevalence of having at least one ADL or IADL disability was significantly higher
among adults living with frailty compared to their counterparts living with pre-frailty or
in robust health (45.7%, 12.1% and 1.8% respectively at Wave 1). This corresponds to
almost one in two older adults with frailty having a disability, compared to one in eleven
older people with pre-frailty and just one in fifty robust older adults having a disability.
These findings were generally consistent across Waves 1-4.
Figure 7�3: Disability and frailty at Waves 1 - 4 using the FI measure (n = 5,304)�
42##
VL;G8#%.1$?#;<EGD=8#A@?[?#?DEL#@?#OB8O@B;<>#N8@G?J#?LCOO;<>#:CB#>BCE8B;8?#@<=#N@<@>;<>#
N8=;E@A;C<?J#@GG#A@?[?#VL;EL#L8GO#?DOOCBA#@<#;<=8O8<=8<A#G;:8?A9G8"#*L8#OB8I@G8<E8#C:#:B@;GA9#
F9#AL8#OB8?8<E8#C:#L@I;<>#@A#G8@?A#C<8#.1$#CB#%.1$#=;?@F;G;A9#@A#)@I8?#45Q#;?#?DNN@B;?8=#;<#
,;>DB8#!"K"#
*L8#OB8I@G8<E8#C:#L@I;<>#@A#G8@?A#C<8#.1$#CB#%.1$#=;?@F;G;A9#V@?#?;><;:;E@<AG9#L;>L8B#@NC<>#
@=DGA?#G;I;<>#V;AL#:B@;GA9#ECNO@B8=#AC#AL8;B#ECD<A8BO@BA?#G;I;<>#V;AL#OB85:B@;GA9#CB#;<#BCFD?A#
L8@GAL#WQU"!TJ#42"4T#@<=#4"PT#B8?O8EA;I8G9#@A#)@I8#4X"#*L;?#ECBB8?OC<=?#AC#@GNC?A#C<8#;<#
AVC#CG=8B#@=DGA?#V;AL#:B@;GA9#L@I;<>#@#=;?@F;G;A9J#ECNO@B8=#AC#C<8#;<#8G8I8<#CG=8B#O8COG8#V;AL#
OB85:B@;GA9#@<=#dD?A#C<8#;<#:;:A9#BCFD?A#CG=8B#@=DGA?#L@I;<>#@#=;?@F;G;A9"#*L8?8#:;<=;<>?#V8B8#
>8<8B@GG9#EC<?;?A8<A#@EBC??#)@I8?#45Q"#
#
,;>DB8#!"K#1;?@F;G;A9#@<=#:B@;GA9#@A#)@I8?#4#5#Q#D?;<>#AL8#,%#N8@?DB8#W<#f#UJK3QX#
#!
./O!627+8%)!7$,!S&$%78!X&78%K!
,B@;GA9#L@?#F88<#?LCV<#AC#L@I8#@#F;5=;B8EA;C<@G#B8G@A;C<?L;O#V;AL#N8<A@G#L8@GAL#;<#CG=8B#
@=DGA?J#ALD?#:B@;GA9#N@9#F8#@#B;?[#:@EACB#:CB#@<=#@#EC<?8^D8<E8#C:#=8EG;<8#;<#EC><;A;I8#
:D<EA;C<"#M8G:5B8OCBA8=#;<:CBN@A;C<#B8>@B=;<>#AVC#@?O8EA?#C:#N8<A@G#L8@GAL#<@N8G9#>GCF@G#
EC><;A;I8#:D<EA;C<#@<=#=8OB8??;I8#?9NOACN?#V8B8#>@AL8B8=#:BCN#O@BA;E;O@<A?#=DB;<>#AL8#
LCN8#;<A8BI;8V#@A#)@I8?#45Q"###
#
./O/0!627+8%)!7$,!-8#C78!4#-$+%+:&!*3$4%+#$!
3
43
23
K3
Q3
U3
63
-CFD
?A
HB85:B@
;G
,B@;G
-CFD
?A
HB85:B@
;G
,B@;G
-CFD
?A
HB85:B@
;G
,B@;G
-CFD
?A
HB85:B@
;G
,B@;G
)@I8#4 )@I8#2 )@I8#K )@I8#Q
T#HB8I@G8<E8
ef4#%i.1$#=;?@F;G;A9
7.5 Frailty and mental health
Frailty has been shown to have a bi-directional relationship with mental health in older
adults, thus frailty may be a risk factor for and a consequence of decline in cognitive
function. Self-reported information regarding two aspects of mental health namely global
cognitive function and depressive symptoms were gathered from participants during the
home interview at Waves 1-4.
7.5.1 Frailty and global cognitive function
The mini–mental state examination (MMSE) is a 20-item test that was used to screen
for cognitive impairment (14, 15). It is commonly used in clinical practice to screen for
dementia. It is also used to estimate the severity of cognitive impairment at a given point in
time and to follow the course of cognitive changes in an individual over time. It assesses

Wellbeing and Health in Ireland’s over 50s 2009-2016
128
orientation, recall, attention, calculation, language abilities and visuospatial ability. The
average score on the MMSE was 28.5-28.7 at each wave. The prevalence of frailty by
global cognitive function (MMSE score) at Waves 1-4 is summarised in Figure 7.4.
Individuals living with frailty exhibited the lowest scores on the MMSE followed by those
living with pre-frailty and robust individuals had the highest MMSE scores indicating better
cognitive function. On average, adults with frailty and pre-frailty scored 0.9-1.4 and 0.4-
0.5 points lower on the MMSE respectively across Waves 1-4 compared to robust older
adults. On average, females scored 0.2-0.3 points higher than males and the 65-74 and
>=75 years age groups scored 0.2-0.6 and 0.7-1.1 points lower than the 50-64 age group
across Waves 1-4. After adjusting for the effect of age group and gender, adults with frailty
and pre-frailty scored 0.6-1.1 and 0.2-0.4 points lower on the MMSE scale compared to the
robust group. This indicates a progressive decline in global cognitive function among those
living with pre-frailty and frailty.
Figure 7�4: Global cognitive function (MMSE score, maximum score =30) by frailty at
Waves 1 - 4 using the FI measure (n = 4,308)�
25
26
27
28
29
30
Robu
st
Pre-
frail
Frai
l
Robu
st
Pre-
frail
Frai
l
Robu
st
Pre-
frail
Frai
l
Robu
st
Pre-
frail
Frai
l
Wave 1 Wave 2 Wave 3 Wave 4
Mea
n M
MSE
Sco
re
7.5.2 Frailty and depression
Depressive symptoms were assessed using the short 8-item version of the Centre for
Epidemiological Studies-Depression (CES-D8) scale (16, 17). This scale measures the
frequency that respondents have experienced a variety of depressive symptoms within the
past week. It consists of 8 items and the total number of positive and negative responses
are summed to give a total score ranging from 0 to 24 with higher scores indicating
increased depressive symptomology. The average score on the CES-D8 depression scale
was 3.0, 2.8, 3.3 and 3.3 at Waves 1-4 respectively. The prevalence of frailty by depressive
symptoms (CES-D8 score) at Waves 1-4 is summarised in Figure 7.5.

7 Frailty
129
At each wave, the group with frailty reported higher levels of depressive symptoms than
the pre-frail and robust groups (a CES-D8 score of 6 in the frail group versus 2 in robust
group at Wave 4). Depressive symptoms are higher in women and decreased with
increasing age. When the effect of age group and gender was adjusted for older adults
with frailty and pre-frailty still scored 4.0-4.5 and 1.3-1.6 points higher on the CES-D8
scale compared to the robust group – indicating progressively more depressive symptoms
among those older adults with pre-frailty and frailty.
Figure 7�5: Depressive symptoms (CES-D8 score, maximum score =24) by frailty at
Waves 1 - 4 using the FI measure (N=5,217)�
#
0
1
2
3
4
5
6
7
8
Robu
st
Pre-
frail
Frai
l
Robu
st
Pre-
frail
Frai
l
Robu
st
Pre-
frail
Frai
l
Robu
st
Pre-
frail
Frai
l
Wave 1 Wave 2 Wave 3 Wave 4
Mea
n CE
S-D8
Sco
re
Depressive symptoms
7.6 Conclusion
The prevalence of frailty in community living adults aged 50 years and over in Ireland was
12.7% at Wave 1 which is equivalent to 160,000 adults. The prevalence of pre-frailty was
31%, equivalent to 370,000 adults. The prevalence increased to 21.5% for frailty and 40%
for pre-frailty in those aged 65 and over. In Ireland, currently 13% of the population is 65
years or older and this number is expected to double by 2040 (Central Statistics Office,
2016); the burden of frailty may also double in that time. Indeed, at each successive waves
of TILDA, the incidence of frailty almost doubled from 1.5% at Wave 2 to 3.0% at Wave 3
and 5.4% at Wave 4. This underscores the importance of targeting frailty to improve the
health and well-being of older adults in Ireland. The impact of frailty on the Irish health and
social care system is considerable (13) and will be covered in Chapter 9.

Wellbeing and Health in Ireland’s over 50s 2009-2016
130
Frailty increases with age and the prevalence doubled with each successive age group
from 50-64, 65-74 and 75+ years. Frailty is more common in women, those with lower
education and those who are widowed or living alone. This highlights the need to provide
social interventions and promote social engagement and connectedness in older adults to
help them to remain robust, staving off the development of frailty.
Adults aged 50 and over in Ireland who live with frailty are more likely to experience falls
and report fear of falling compared to their counterparts who are pre-frail or robust. Given
falls have very serious consequences including hip and wrist fracture it is important to to
reduce risk factors for falls through appropriate fall prevention programmes (18). A further
consequence of living with frailty is disability. Almost half of people living with frailty report
having at least one disability in basic and/or instrumental activities of daily living. For
this reason, frailty is viewed as a transition between healthy ageing and disability and is
considered a risk factor and intervention target for disability in older adults (1).
A bi-directional relationship between frailty and declines in cognitive function have been
shown in the scientific and medical literature suggesting that frailty may be a risk factor
for and a consequence of decline in cognitive function (19). Global cognitive function is
lower while depressive symptoms are higher among adults with frailty in Ireland compared
to those with pre-frailty or who are in robust health. Given the increasing prevalence and
incidence of dementia and cognitive impairment as well as frailty among adults aged 50
and over in Ireland and worldwide, prevention and intervention strategies that can delay or
halt progression of both frailty and cognitive decline are warranted.
An important finding in this Chapter is that the prevalence of frailty and the frailty-related
sociodemographic physical health and mental health outcomes all increased over time
moving from Wave 1 (2009-2011) to Wave 4 (2016). A significant proportion of this
increase may be attributed to the ageing of the cohort but this too is important to note
given current and projected ageing of the population of Ireland over the next thirty years
(Central Statistics Office, 2016). As mentioned earlier, we are likely to see a doubling in the
proportion of adults, particularly those aged 65 and older, presenting with frailty and related
adverse health outcomes for which we must be prepared.
The significance of frailty as an impediment to healthy ageing was highlighted at a focus
meeting on “Frailty and Intrinsic Capacity” by the World Health Organisation (WHO)
Clinical Consortium on Healthy Ageing in December 2016. In particular, they stated that
active case findings of older people with frailty is essential for the reorientation of health
services to meet people’s needs; that proactive identification of people in the community at
risk of frailty provides opportunities to intervene and so prevent or delay functional decline
7 Frailty
131
and disability (20). The significance of frailty to healthy ageing, health care planning and
delivery in Ireland is recognised by the National Clinical Programme for Older People
(NCPOP) and the Integrated Care Programme for Older People (ICPOP). A National
Frailty Education Programme, in partnership with TILDA, was initiated in 2016 to train
health professionals to understand the risk factors for frailty enabling them to implement
programmes for early detection, prevention and management (21).
Frailty is not an inevitable consequence of ageing, three in five people aged 75+ and one
in two people aged 80+ years are classified as robust or pre-frail. Frailty is a dynamic
process and people can experience positive transitions reverting to pre-frailty from frailty
and robustness from pre-frailty. Frailty is modifiable, it may be delayed, halted and even
reversed with timely and appropriate prevention, detection and intervention strategies. With
a concerted effort there is a very real opportunity to improve the lifespan and healthspan of
older adults in Ireland by assertively targeting frailty as a condition that can be ameliorated.
7.7 References
1. Clegg A, Young J, Iliffe S, Rikkert MO, Rockwood K. Frailty in elderly people. Lancet.
2013;381(9868):752-62.
2. Fit for Frailty - Consensus best practice guidance for the care of older people living in
community and outpatient settings. British Geriatrics Society 2014.
3. Collard RM, Boter H, Schoevers RA, Oude Voshaar RC. Prevalence of frailty
in community-dwelling older persons: a systematic review. J Am Geriatr Soc.
2012;60(8):1487-92.
4. HSE. Urgent Care Needs for Older People - Frailty at the Front Door 2017.
5. Gill TM, Gahbauer EA, Allore HG, Han L. Transitions between frailty states among
community-living older persons. Arch Intern Med. 2006;166(4):418-23.
6. Fried LP, Ferrucci L, Darer J, Williamson JD, Anderson G. Untangling the concepts
of disability, frailty, and comorbidity: implications for improved targeting and care. J
Gerontol A Biol Sci Med Sci. 2004;59(3):255-63.
7. Turner G, Clegg A, British Geriatrics Society, Age UK, Royal College of General
Practitioners. Best practice guidelines for the management of frailty: a British Geriatrics
Society, Age UK and Royal College of General Practitioners report. Age Ageing.
2014;43(6):744-7.

Wellbeing and Health in Ireland’s over 50s 2009-2016
132
8. Ellis G, Whitehead MA, Robinson D, O’Neill D, Langhorne P. Comprehensive geriatric
assessment for older adults admitted to hospital: meta-analysis of randomised
controlled trials. BMJ. 2011;343:d6553.
9. Sternberg SA, Wershof Schwartz A, Karunananthan S, Bergman H, Mark Clarfield
A. The identification of frailty: a systematic literature review. J Am Geriatr Soc.
2011;59(11):2129-38.
10. Fried LP, Tangen CM, Walston J, Newman AB, Hirsch C, Gottdiener J, et al.
Frailty in older adults: evidence for a phenotype. J Gerontol A Biol Sci Med Sci.
2001;56(3):M146-56.
11. Rockwood K, Mitnitski A. Frailty in relation to the accumulation of deficits. J Gerontol A
Biol Sci Med Sci. 2007;62(7):722-7.
12. Searle SD, Mitnitski A, Gahbauer EA, Gill TM, Rockwood K. A standard procedure for
creating a Frailty Index. BMC Geriatr. 2008;8:24.
13. Roe L, Normand C, Wren MA, Browne J, O’Halloran AM. The impact of frailty on
healthcare utilisation in Ireland: evidence from the Irish longitudinal study on ageing.
BMC Geriatr. 2017;17(1):203.
14. Folstein MF, Folstein SE, McHugh PR. “Mini-mental state”. A practical method
for grading the cognitive state of patients for the clinician. J Psychiatr Res.
1975;12(3):189-98.
15. Kenny RA, Coen RF, Frewen J, Donoghue OA, Cronin H, Savva GM. Normative values
of cognitive and physical function in older adults: findings from the Irish Longitudinal
Study on Ageing. J Am Geriatr Soc. 2013;61 Suppl 2:S279-90.
16. Karim J, Weisz R, Bibi Z, ur Rehman S. Validation of the Eight-Item Center for
Epidemiologic Studies Depression Scale (CES-D) Among Older Adults. . Curr Psychol
2015;34(4):681–92.
17. Radloff LS. A Self-Report Depression Scale for Research in the General Population. .
Appl Psychol Meas 1977;1(3):385–401.
18. Panel on Prevention of Falls in Older Persons, American Geriatrics Society and British
Geriatrics Society. Summary of the Updated American Geriatrics Society/British
Geriatrics Society clinical practice guideline for prevention of falls in older persons.
J Am Geriatr Soc 2011;59(1):148-57.

7 Frailty
133
19. Robertson DA, Savva GM, Kenny RA. Frailty and cognitive impairment--a review of the
evidence and causal mechanisms. Ageing Res Rev. 2013;12(4):840-51.
20. WHO Clinical Consortium on Healthy Ageing. Topic focus: frailty and intrinsic capacity.
Report of consortium meeting 1–2 December 2016 in Geneva Switzerland.
21. Lang D, Hoey C, O’Shea D, Whitty H. A National Frailty Education Programme.
International Journal of Integrated Care. . International Journal of Integrated Care
2017;17(5).

Wellbeing and Health in Ireland’s over 50s 2009-2016
134
Appendices
Appendix 7�9: Components of 32-item FI based on TILDA CAPI variables from Waves 1-4�
Variables in Tilda Cut-points
1. Difficulty walking 100m Yes = 1; No = 0
2. Difficulty rising from a chair Yes = 1; No = 0
3. Difficulty climbing stairs Yes = 1; No = 0
4. Difficulty stooping, kneeling or crouching Yes = 1; No = 0
5. Difficulty reaching above shoulder height Yes = 1; No = 0
6. Difficulty pushing/pulling large objects Yes = 1; No = 0
7. Difficulty lifting/carrying weights ≥10lb Yes = 1; No = 0
8. Difficulty picking up a coin from a table Yes = 1; No = 0
9. Feeling lonelyRarely or none of the time=0; Some or a little of the time=0.33; Occasionally or a moderate amount of time=0.66; All of the time=1.
10. Poor self-rated physical health Excellent=0; Very good=0.25; Good=0.5; Fair=0.75; Poor=1.
11. Poor self-rated vision Excellent=0; Very good=0.25; Good=0.5; Fair=0.75; Poor=1
12. Poor self-rated hearing Excellent=0; Very good=0.25; Good=0.5; Fair=0.75; Poor=1
13. Poor self-rated memory Excellent=0; Very good=0.25; Good=0.5; Fair=0.75; Poor=1.
14. Difficulty following a conversation None=0; Some=0.5; Much/Impossible=1.
15. Daytime sleepinessWould never doze=0; Slight chance of dozing=0.33; Moderate chance of dozing=0.66; High chance of dozing=1.
16. Polypharmacy Yes = 1; No = 0
17. Knee pain Yes = 1; No = 0
18. Hypertension Yes = 1; No = 0
19. Angina Yes = 1; No = 0
20. Heart attack Yes = 1; No = 0
21. Diabetes Yes = 1; No = 0
22. Stroke and transient ischemic attack Yes = 1; No = 0
23. High cholesterol Yes = 1; No = 0
24. Irregular heart rhythm Yes = 1; No = 0
25. Other CVD Yes = 1; No = 0
26. Cataracts Yes = 1; No = 0
27. Glaucoma and age-related macular degeneration Yes = 1; No = 0
28. Arthritis Yes = 1; No = 0
29. Osteoporosis Yes = 1; No = 0
30. Cancer Yes = 1; No = 0
31. Varicose ulcer Yes = 1; No = 0
32. Incontinence Yes = 1; No = 0
Adapted from Roe et al, 2017 (13)
134
Wellbeing and Health in Ireland’s over 50s 2009-2016

8 Cognitive change over time
135
ContentsKey Findings ..................................................................................................................... 136
8.1 Introduction ............................................................................................................... 137
8.2 Six-year change in objective cognitive performance
8�2�1 Verbal memory ������������������������������������������������������������������������������������������������ 138
8�2�2 Verbal fluency �������������������������������������������������������������������������������������������������� 140
8�2�3 Prospective memory ���������������������������������������������������������������������������������������� 141
8�2�4 Mini-Mental State Examination (MMSE) ���������������������������������������������������������� 142
8.3 Change in cognitive performance by level of social integration ................................ 143
8.4 Self-rated memory ability and memory decline
8�4�1 Self-rated memory ������������������������������������������������������������������������������������������� 144
8�4�2 Self-rated memory decline ������������������������������������������������������������������������������� 145
8�4�3 The relationship between objective cognitive test performance
and self-rated memory decline ��������������������������������������������������������������������������������� 146
8.5 Discussion ................................................................................................................ 147
8.6 References ............................................................................................................... 149
8 Cognitive change over timeJoanne Feeney and Katy Tobin

Wellbeing and Health in Ireland’s over 50s 2009-2016
136
Key Findings
• The majority of older adults continue to perform well on core cognitive tests at an
average follow-up of six years, with only minor decreases in task performance.
• There was a slight decline in verbal memory scores observed over time for adults
aged 65 years and older. Decline was greatest on the 10-word delayed recall task, and
among adults aged 75 and older, who recalled one word less on average at Wave 4
compared to Wave 1.
• Verbal fluency declined across the four waves in adults aged 50 and over. Decline was
most pronounced in individuals aged 75 years and older; on average, they named four
fewer animals at Wave 4 than at Wave 1.
• There was no decline in prospective memory over time in adults aged 50-64 and 65-74
years. However, the success rate for adults aged 75 and older dropped from 53% at
Wave 1 to 40% by Wave 4.
• Older adults who were the most socially integrated at Wave 1 had higher verbal fluency
scores initially than adults who were the most isolated, but this difference did not
persist over time.
• The proportion of adults aged 50 and older who reported that their memory was ‘Fair’
or ‘Poor’ increased from 15% at Wave 1 to almost 20% at Wave 4.
• Seven percent of older adults felt that their memory was continuously declining over
the waves. These individuals also had a slightly larger decrease in delayed word recall,
verbal fluency, and MMSE scores over the four waves.
8 Cognitive changeover time
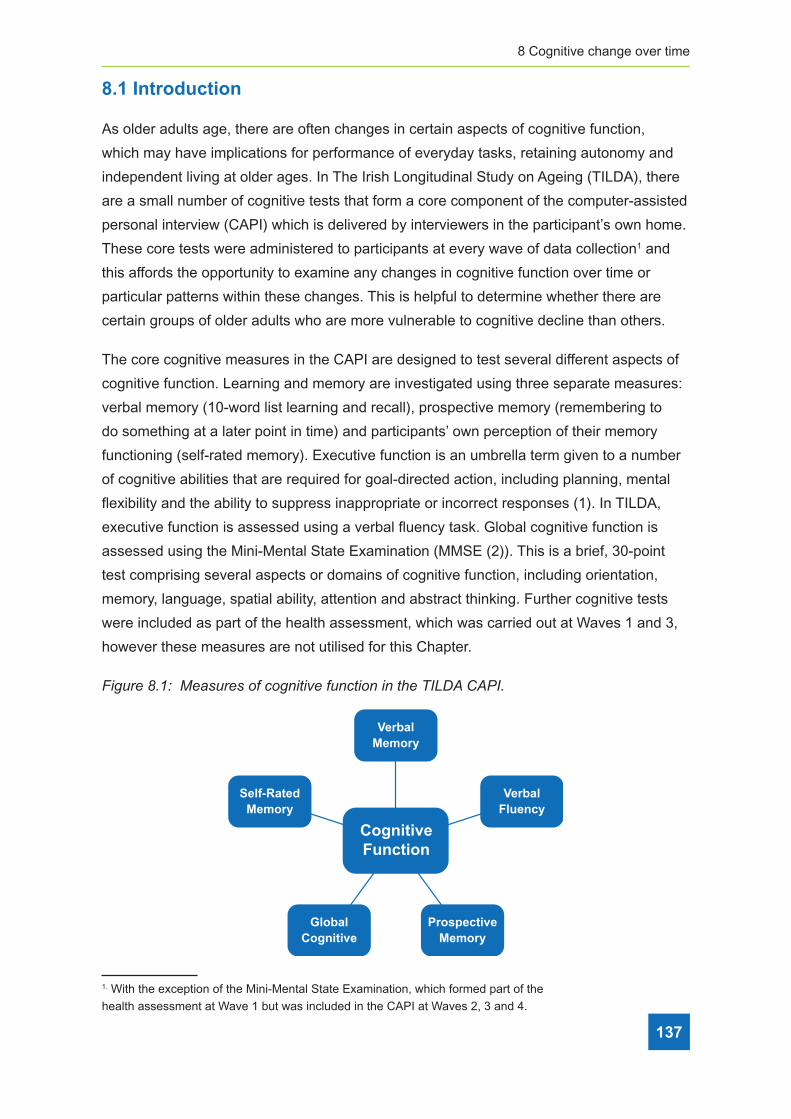
8 Cognitive change over time
137
8.1 Introduction
As older adults age, there are often changes in certain aspects of cognitive function,
which may have implications for performance of everyday tasks, retaining autonomy and
independent living at older ages. In The Irish Longitudinal Study on Ageing (TILDA), there
are a small number of cognitive tests that form a core component of the computer-assisted
personal interview (CAPI) which is delivered by interviewers in the participant’s own home.
These core tests were administered to participants at every wave of data collection1 and
this affords the opportunity to examine any changes in cognitive function over time or
particular patterns within these changes. This is helpful to determine whether there are
certain groups of older adults who are more vulnerable to cognitive decline than others.
The core cognitive measures in the CAPI are designed to test several different aspects of
cognitive function. Learning and memory are investigated using three separate measures:
verbal memory (10-word list learning and recall), prospective memory (remembering to
do something at a later point in time) and participants’ own perception of their memory
functioning (self-rated memory). Executive function is an umbrella term given to a number
of cognitive abilities that are required for goal-directed action, including planning, mental
flexibility and the ability to suppress inappropriate or incorrect responses (1). In TILDA,
executive function is assessed using a verbal fluency task. Global cognitive function is
assessed using the Mini-Mental State Examination (MMSE (2)). This is a brief, 30-point
test comprising several aspects or domains of cognitive function, including orientation,
memory, language, spatial ability, attention and abstract thinking. Further cognitive tests
were included as part of the health assessment, which was carried out at Waves 1 and 3,
however these measures are not utilised for this Chapter.
Figure 8�1: Measures of cognitive function in the TILDA CAPI�
VerbalMemory
CognitiveFunction
Self-RatedMemory
VerbalFluency
ProspectiveMemory
GlobalCognitive
1. With the exception of the Mini-Mental State Examination, which formed part of the
health assessment at Wave 1 but was included in the CAPI at Waves 2, 3 and 4.
Wellbeing and Health in Ireland’s over 50s 2009-2016
138
The TILDA Wave 1 Key Findings Report (3) detailed the average performance and
difference in performance across age, sex and education for the CAPI cognitive tests
and self-rated memory at baseline. The main purpose of this Chapter is to build on those
observations by examining change in objective and self-rated cognitive performance from
Wave 1 through to Wave 4, by age, sex and education. A further aim is to investigate
the change in objective cognitive performance according to how well socially integrated
participants were at Wave 1. The degree to which a person is socially integrated rather
than isolated can influence their psychological and physical health (4). Furthermore, there
is evidence that social engagement may be important for maintaining good cognitive
function in later life (5). A final aim is to examine the association between objective
cognitive function and self-rated cognitive function, i.e. whether self-rated memory decline
reflects an actual change in cognitive performance.
The sample consists of 4,975 adults in the Republic of Ireland aged 50 years or older at
Wave 1, who gave a self-interview and answered all of the cognitive elements in the CAPI
at each Wave. From Wave 2 onward, in the event that an individual was not physically
or cognitively capable of giving an interview, a proxy interview was sought where prior
consent had been given for this. This involved someone close to the participant (either a
spouse/partner, close relative, friend or carer) answering the questions on their behalf. In
the case of a proxy interview, cognitive tests were not administered to the participant, and
those individuals are not included in the current analyses. The results presented herein
therefore reflect the change in cognitive function over an average of six years among
community dwelling adults aged 50 and older, who were physically and cognitively well
enough to give an interview at every wave. We have applied statistical weights to account
for the fact that certain groups of individuals are less likely to participate in the study at the
outset and are also more likely to drop out of the study over time. Findings are presented
with respect to differences across waves, age group at baseline (50-64 years, 65-74 years,
75 years and older), sex and education level (none/primary, secondary level, and third
level/tertiary education). Changes in cognitive performance according to level of social
integration at Wave 1 and self-rated memory decline between waves are also presented.
8.2 Six-year change in objective cognitive performance
8.2.1 Verbal memory
Verbal memory is particularly susceptible to age-related declines in performance (6, 7) and
is one of the aspects of cognitive function most often affected early in mild cognitive impair-
ment and dementia (8). Verbal memory is assessed in TILDA using a 10-word list learning
and recall task. Participants hear a list of 10 words and are asked to recall as many words as
possible. They immediately hear the same 10 words and are again asked to recall as many

8 Cognitive change over time
139
words as possible. The scores from both immediate recall attempts are added together to
give an immediate recall total score (range: 0-20 words). Delayed recall is tested after a
time delay of approximately 15 minutes when participants are asked to recall the words they
heard earlier (delayed recall score, range: 0-10 words).
Performance on the immediate recall task decreased with increasing age with a small
decline in performance over time evident in individuals aged 75 years and older (see
Figure 8.2). Women performed slightly better than men at all waves (mean: 13.8 words
versus 13.2 words). Performance was higher among those with a higher level of education
(None/primary = 11.9; secondary = 13.8; third level =14.9).
Figure 8�2: Immediate word recall total score across Waves 1 to 4, by age group at
baseline�
16
14
12
10
8
6Wave 1 Wave 2 Wave 3 Wave 4
Num
ber o
f wor
ds re
calle
d
50-64 65-74 75 and older
Error bars correspond to 95% confidence intervals.
A similar pattern of performance on the delayed recall task by age group, sex and wave
was observed (see Figure 8.3). The number of words recalled decreased between Wave
1 and Wave 4 among participants aged 65-74 years but more markedly for those aged 75
years and older, amounting to a decrease of about 1 word. Again, women outperformed
men, but only among those aged less than 75 years.

Wellbeing and Health in Ireland’s over 50s 2009-2016
140
Figure 8�3: Delayed word recall score at Waves 1 and 4, by age group and sex�
0.0
2.0
4.0
6.0
8.0
50-64 65-74 >=75 50-64 65-74 >=75
Male Female
Wave 1Wave 4
dellacer sdrow fo reb
muN
Note. N = 4,975; Error bars correspond to 95% confidence intervals
8.2.2 Verbal fluency
Executive function, which includes planning, mental flexibility and the ability to suppress
inappropriate or incorrect responses (inhibition) was assessed using a verbal fluency task.
Such tasks typically require participants to generate as many words as possible within
a short time period, usually either items belonging to a particular subject category (e.g.
animals, foods), or words beginning with a particular letter. Performance is dependent on a
variety of executive processes such as self-monitoring, mental flexibility and inhibition, and
also on language processing (9, 10). In TILDA, participants were asked to name as many
animals as they could in one minute; the total number reflects the verbal fluency score.
Figure 8.4 shows the mean verbal fluency score by age and education level across Waves
1-4. Younger adults and those with higher levels of education named more animals on av-
erage than those who were older or had a lower level of education. Despite these age and
education gradients, all groups displayed a decline over time in the average number of
animals named (the overall change was from 20.6 at Wave 1 to 18.1 at Wave 4), however
the decline in performance was greatest for those aged 75 years and older, from a mean of
17.8 words at Wave 1 to 14.2 words at Wave 4. Among individuals aged 75 and older, men
performed better than women (16.7 versus 15.5 words), however they experienced a similar
decline over time.
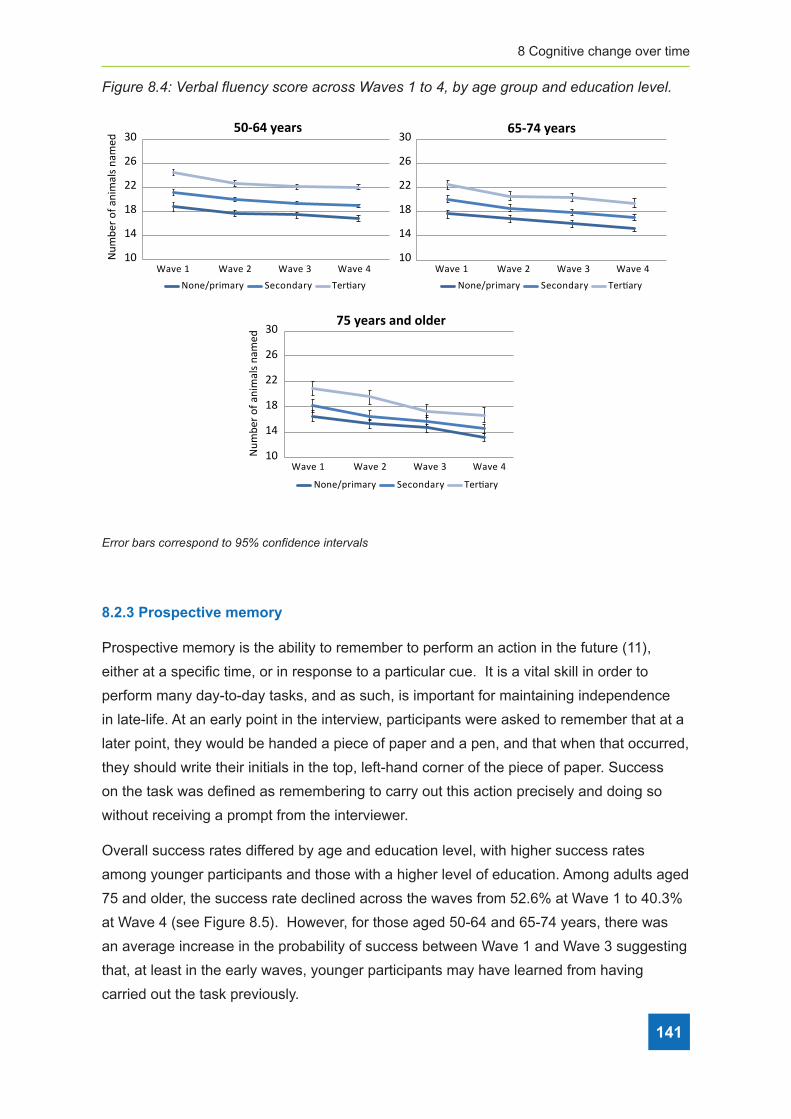
8 Cognitive change over time
141
Figure 8�4: Verbal fluency score across Waves 1 to 4, by age group and education level�
50-64 years 65-74 years
30
26
22
18
14
10
Wave 1 Wave 2 Wave 3 Wave 4
Num
ber o
f ani
mal
s nam
ed
75 years and older
None/primary Secondary Tertiary None/primary Secondary Tertiary
None/primary Secondary Tertiary
Wave 1 Wave 2 Wave 3 Wave 4
Wave 1 Wave 2 Wave 3 Wave 4
30
26
22
18
14
10
30
26
22
18
14
10Num
ber o
f ani
mal
s nam
ed
Error bars correspond to 95% confidence intervals
Error bars correspond to 95% confidence intervals
8.2.3 Prospective memory
Prospective memory is the ability to remember to perform an action in the future (11),
either at a specific time, or in response to a particular cue. It is a vital skill in order to
perform many day-to-day tasks, and as such, is important for maintaining independence
in late-life. At an early point in the interview, participants were asked to remember that at a
later point, they would be handed a piece of paper and a pen, and that when that occurred,
they should write their initials in the top, left-hand corner of the piece of paper. Success
on the task was defined as remembering to carry out this action precisely and doing so
without receiving a prompt from the interviewer.
Overall success rates differed by age and education level, with higher success rates
among younger participants and those with a higher level of education. Among adults aged
75 and older, the success rate declined across the waves from 52.6% at Wave 1 to 40.3%
at Wave 4 (see Figure 8.5). However, for those aged 50-64 and 65-74 years, there was
an average increase in the probability of success between Wave 1 and Wave 3 suggesting
that, at least in the early waves, younger participants may have learned from having
carried out the task previously.

Wellbeing and Health in Ireland’s over 50s 2009-2016
142
Figure 8�5: Percentage of older adults who successfully completed the prospective
memory task across Waves 1 to 4, by age group�
100908070605040302010
0Wave 1 Wave 2 Wave 3 Wave 4
Succ
ess r
ate
(%)
50-64 65-74 75 and older
Error bars correspond to 95% confidence intervals.
8.2.4 Mini-Mental State Examination (MMSE)
The MMSE (2) is a 10-minute test of cognitive function and is commonly used a screening
tool for cognitive impairment in hospital settings. The maximum score on the test is 30
points. While it can be useful clinically for identifying individuals who may need more
in-depth cognitive assessment, it has been shown to be relatively insensitive to subtle
changes over time in community-dwelling older adults.
Figure 8.6 displays mean MMSE scores across the four waves by age group. Individuals
aged 50-64 performed better on this task at all waves, relative to individuals aged 65-74
years and 75 years and older. However, there was no significant change in scores over
the average six year follow up for any age group. Women and men performed similarly on
the task. Scores were greater among those with a higher level of education (none/primary
= 27.6; secondary = 28.8; third level = 29.2), but change in performance over time did not
differ according to education level.
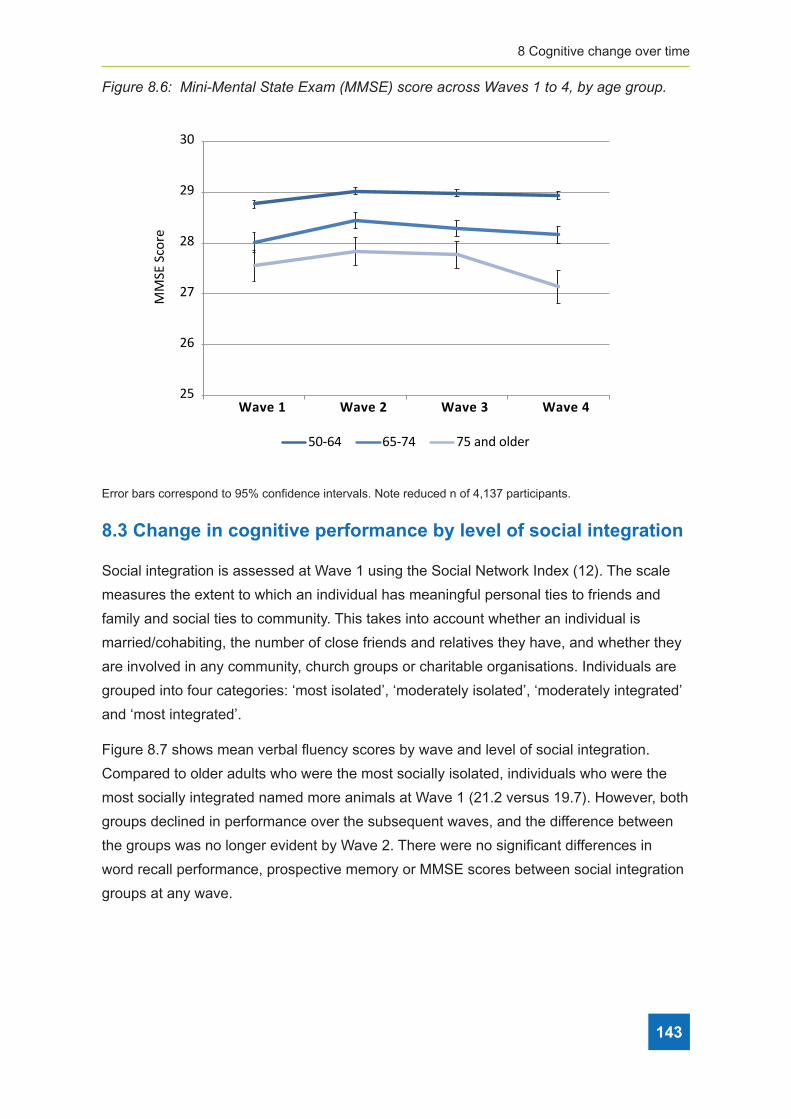
8 Cognitive change over time
143
Figure 8�6: Mini-Mental State Exam (MMSE) score across Waves 1 to 4, by age group�
30
29
28
27
26
25Wave 1 Wave 2 Wave 3 Wave 4
MM
SE S
core
50-64 65-74 75 and older
Error bars correspond to 95% confidence intervals. Note reduced n of 4,137 participants.
8.3 Change in cognitive performance by level of social integration
Social integration is assessed at Wave 1 using the Social Network Index (12). The scale
measures the extent to which an individual has meaningful personal ties to friends and
family and social ties to community. This takes into account whether an individual is
married/cohabiting, the number of close friends and relatives they have, and whether they
are involved in any community, church groups or charitable organisations. Individuals are
grouped into four categories: ‘most isolated’, ‘moderately isolated’, ‘moderately integrated’
and ‘most integrated’.
Figure 8.7 shows mean verbal fluency scores by wave and level of social integration.
Compared to older adults who were the most socially isolated, individuals who were the
most socially integrated named more animals at Wave 1 (21.2 versus 19.7). However, both
groups declined in performance over the subsequent waves, and the difference between
the groups was no longer evident by Wave 2. There were no significant differences in
word recall performance, prospective memory or MMSE scores between social integration
groups at any wave.
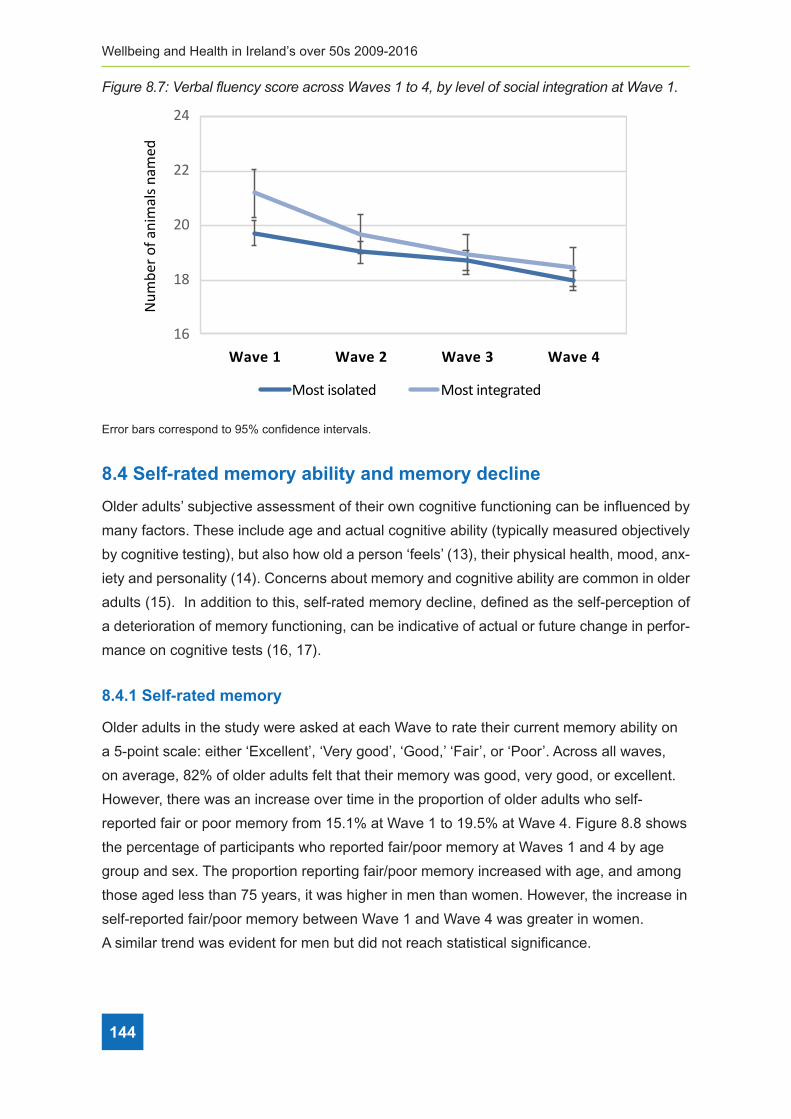
Wellbeing and Health in Ireland’s over 50s 2009-2016
144
Figure 8�7: Verbal fluency score across Waves 1 to 4, by level of social integration at Wave 1�
24
22
20
18
16Wave 1 Wave 2 Wave 3 Wave 4
Num
ber o
f ani
mal
s nam
ed
Most isolated Most integrated
Error bars correspond to 95% confidence intervals.
8.4 Self-rated memory ability and memory decline
Older adults’ subjective assessment of their own cognitive functioning can be influenced by
many factors. These include age and actual cognitive ability (typically measured objectively
by cognitive testing), but also how old a person ‘feels’ (13), their physical health, mood, anx-
iety and personality (14). Concerns about memory and cognitive ability are common in older
adults (15). In addition to this, self-rated memory decline, defined as the self-perception of
a deterioration of memory functioning, can be indicative of actual or future change in perfor-
mance on cognitive tests (16, 17).
8.4.1 Self-rated memory
Older adults in the study were asked at each Wave to rate their current memory ability on
a 5-point scale: either ‘Excellent’, ‘Very good’, ‘Good,’ ‘Fair’, or ‘Poor’. Across all waves,
on average, 82% of older adults felt that their memory was good, very good, or excellent.
However, there was an increase over time in the proportion of older adults who self-
reported fair or poor memory from 15.1% at Wave 1 to 19.5% at Wave 4. Figure 8.8 shows
the percentage of participants who reported fair/poor memory at Waves 1 and 4 by age
group and sex. The proportion reporting fair/poor memory increased with age, and among
those aged less than 75 years, it was higher in men than women. However, the increase in
self-reported fair/poor memory between Wave 1 and Wave 4 was greater in women.
A similar trend was evident for men but did not reach statistical significance.

8 Cognitive change over time
145
Figure 8�8: The percentage of older adults with fair/poor self-rated memory, at Waves 1
and 4, by age group and sex�
0.0
10.0
20.0
30.0
40.0
50-64 65-74 >=75 50-64 65-74 >=75
Male Female
Wave 1Wave 4
)%( yro
mem detar-fles roop/riaF
Note. N = 4,975; Error bars correspond to 95% confidence intervals
The proportion of participants with fair/poor self-rated memory also differed by level of
education, from 25.8% of older adults with none/primary level education to 11.5% of those
with third level education. There was a slight increase in the proportion reporting fair/poor
memory over time among those participants with none/primary or secondary education,
but no change for those with third level education.
8.4.2 Self-rated memory decline
At Waves 2, 3 and 4, in addition to being asked to rate their current memory ability, participants
were also asked if they felt that their memory had changed i.e. whether it was better, the
same, or worse than at the previous interview. The proportion of older adults who indicated
at any of Waves 2, 3 or 4 that their memory had declined since the previous interview was
high, at 42%. However, only 7% of adults reported persistent memory decline i.e. a decline
at all three waves. The percentage of participants with persistent self-rated memory decline
increased with age from 5% of adults aged 50-64 years to 14% of participants aged 75 years
and older. However, there was no difference between men and women or by level of education.
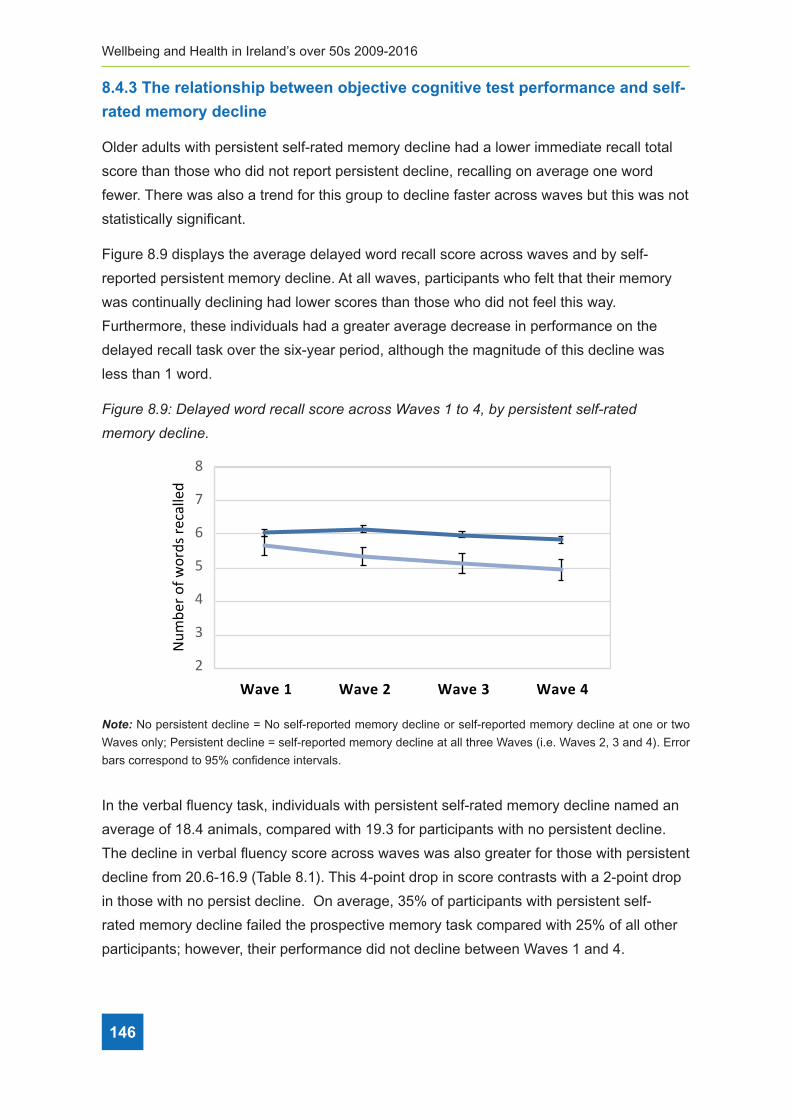
Wellbeing and Health in Ireland’s over 50s 2009-2016
146
8.4.3 The relationship between objective cognitive test performance and self-
rated memory decline
Older adults with persistent self-rated memory decline had a lower immediate recall total
score than those who did not report persistent decline, recalling on average one word
fewer. There was also a trend for this group to decline faster across waves but this was not
statistically significant.
Figure 8.9 displays the average delayed word recall score across waves and by self-
reported persistent memory decline. At all waves, participants who felt that their memory
was continually declining had lower scores than those who did not feel this way.
Furthermore, these individuals had a greater average decrease in performance on the
delayed recall task over the six-year period, although the magnitude of this decline was
less than 1 word.
Figure 8�9: Delayed word recall score across Waves 1 to 4, by persistent self-rated
memory decline�
8
7
6
5
4
3
2Wave 1 Wave 2 Wave 3 Wave 4
Num
ber o
f wor
ds re
calle
d
No persistent decline Persistent decline
Note: No persistent decline = No self-reported memory decline or self-reported memory decline at one or two
Waves only; Persistent decline = self-reported memory decline at all three Waves (i.e. Waves 2, 3 and 4). Error
bars correspond to 95% confidence intervals.
In the verbal fluency task, individuals with persistent self-rated memory decline named an
average of 18.4 animals, compared with 19.3 for participants with no persistent decline.
The decline in verbal fluency score across waves was also greater for those with persistent
decline from 20.6-16.9 (Table 8.1). This 4-point drop in score contrasts with a 2-point drop
in those with no persist decline. On average, 35% of participants with persistent self-
rated memory decline failed the prospective memory task compared with 25% of all other
participants; however, their performance did not decline between Waves 1 and 4.
8 Cognitive change over time
147
Table 8�1: Verbal fluency score across Waves 1-4, by persistent self-rated memory decline�
Mean number of animals named
(N = 4,975) Wave 1 Wave 2 Wave 3 Wave 4
No persistent decline 20.6 19.4 18.7 18.2
Persistent decline 20.6 18.3 17.8 16.9
Note: No persistent decline = No self-report memory decline or self-report memory decline at one or two Waves
only; Persistent decline = self-report reported decline at all three Waves (i.e. Waves 2, 3 and 4).
Figure 8.10 shows MMSE scores across Waves 1 to 4 by persistent self-rated memory de-
cline. There were no differences in baseline score between groups, but by Waves 3 and 4
a small difference in performance, of approximately half a point on average, was evident.
Figure 8�10: Mini-Mental State Examination (MMSE) score across Waves 1 to 4, by
persistent self-rated memory decline�
Wave 1 Wave 2 Wave 3 Wave 4
No persistent decline Persistent decline
30
29
28
27
26
25
MM
SE sc
ore
Note: No persistent decline = No self-reported memory decline or self-reported memory decline at one or two
Waves only; Persistent decline = self-reported reported decline at all three Waves (i.e. Waves 2, 3 and 4).
N = 4,137.
8.5 Discussion
This Chapter explored the change in cognitive function over four waves: between baseline
and an average of six-years follow up. Overall, there was little change in cognitive function
across the four waves, particularly in adults who were aged less than 75 years at Wave
1. The greatest evidence of decline in performance was in verbal memory, verbal fluency
and prospective memory among adults aged 75 and over. The overall level of cognitive
performance was impacted by education whereby individuals who had more years of
formal education consistently performed better on the tasks than those who had received

Wellbeing and Health in Ireland’s over 50s 2009-2016
148
less education. The sex of participants also affected performance on the immediate and
delayed recall tasks with women recalling more words than men. Conversely, men in the
oldest age group performed better than women on the test of verbal fluency. Despite these
overall differences by education level and sometimes by sex, neither characteristic affected
whether or by what degree, cognitive performance changed over time.
The observation of only small changes in performance on the cognitive tests over six
years is a positive finding. It is likely, in part, reflects the fact that adults recruited at
baseline were community dwelling, and that the current analysis was carried out only on
adults who were interviewed in person at all four waves, and so does not include proxy
interviews. Therefore, in general, the results reflect individuals without severe cognitive
impairment. In addition, as the majority of TILDA participants are still relatively young, we
would not expect much cognitive decline to have occurred, even after six years. We did
however, observe a small decline in cognitive function in those aged 75 years and over
at baseline. This is in keeping with international evidence, which suggests acceleration in
cognitive decline, at least in some domains, from age 75-80 years onwards (e.g.(18, 19)).
Nonetheless, the average drop in test scores between waves was small, suggesting that
for most individuals, this would likely have a negligible effect on their everyday functioning.
The lack of significant decline among those aged less than 75 years at baseline is
evidence that the majority of community dwelling older adults in their 50s, 60s and early
70s function very well. This lends support to recent European Union policy initiatives to
extend working lives, and to the move by the Irish government in particular, to raise the
state pension age to 68.
Social engagement and social participation are associated with better health in later life
and evidence suggests that they may help to reduce deterioration in cognitive abilities with
age (5, 20). Our results show that while there was an initial difference in verbal fluency
according to how socially integrated adults were at Wave 1, this difference did not persist
across waves.
By Wave 4, there was an increase in the proportion of participants who self-reported their
memory as fair or poor, and this increased with age. Although there are many factors that
influence self-rated memory on any given occasion, evidence increasingly suggests that
subjective memory decline can predict the future development of mild cognitive impairment
and/or dementia (21, 22). While a high proportion of adults reported at some point that
they felt their memory had declined since the previous wave, only a small percentage of
adults reported persistent memory decline wave on wave. Self-reported persistent decline
over a period of years may be important in predicting future dementia risk (23), and this
group also showed a decline in verbal fluency, delayed recall and MMSE scores over time.

8 Cognitive change over time
149
Once again, however, the size of these decreases was small, indicating that at the group
level, there was no major deterioration in cognitive abilities over the six years.
8.6 References
1. Buckner RL. Memory and executive function in aging and AD: multiple factors that
cause decline and reserve factors that compensate. Neuron. 2004;44(1):195-208.
2. Folstein MF, Folstein SE, McHugh PR. “Mini-mental state”. A practical method
for grading the cognitive state of patients for the clinician. J Psychiatr Res.
1975;12(3):189-98.
3. Barrett A SG, Timonen V, Kenny R. Fifty Plus in Ireland 2011. First results from the Irish
Longitudinal Study on Ageing (TILDA). Dublin; 2012.
http://tilda.tcd.ie/publications/reports/pdf/w1-key-findings-report/Tilda_Master_First_
Findings_Report.pdf
4. Holt-Lunstad J. Why Social Relationships Are Important for Physical Health: A Systems
Approach to Understanding and Modifying Risk and Protection. Annu Rev Psychol.
2018;69:437-58.
5. Evans IEM, Martyr A, Collins R, Brayne C, Clare L. Social Isolation and Cognitive
Function in Later Life: A Systematic Review and Meta-Analysis. J Alzheimers Dis.
2018.
6. Park DC, Lautenschlager G, Hedden T, Davidson NS, Smith AD, Smith PK. Models
of visuospatial and verbal memory across the adult life span. Psychol Aging.
2002;17(2):299-320.
7. Naveh-Benjamin M, Hussain Z, Guez J, Bar-On M. Adult age differences in episodic
memory: further support for an associative-deficit hypothesis. J Exp Psychol Learn
Mem Cogn. 2003;29(5):826-37.
8. Backman L, Small BJ, Fratiglioni L. Stability of the preclinical episodic memory deficit in
Alzheimer’s disease. Brain. 2001;124(Pt 1):96-102.
9. Whiteside DM, Kealey T, Semla M, Luu H, Rice L, Basso MR, et al. Verbal Fluency:
Language or Executive Function Measure? Appl Neuropsychol Adult. 2016;23(1): 29-34.
10. Shao Z, Janse E, Visser K, Meyer AS. What do verbal fluency tasks measure?
Predictors of verbal fluency performance in older adults. Front Psychol. 2014;5:772.
11. Brandimonte M, Einstein, GO, McDaniel MA. Prospective memory: Theory and
applications. Mahwah, NJ, US: Lawrence Erlbaum Associates; 1996.
Wellbeing and Health in Ireland’s over 50s 2009-2016
150
12. Berkman LF, Syme SL. Social networks, host resistance, and mortality: a nine-year
follow-up study of Alameda County residents. Am J Epidemiol. 1979;109(2):186-204.
13. Chen YT, Holahan CK, Holahan CJ, Li X. Leisure-Time Physical Activity, Subjective
Age, and Self-Rated Memory in Middle-Aged and Older Adults. Int J Aging Hum Dev.
2018;87(4):377-91.
14. Jorm AF, Masaki KH, Davis DG, Hardman J, Nelson J, Markesbery WR, et al. Memory
complaints in nondemented men predict future pathologic diagnosis of Alzheimer
disease. Neurology. 2004;63(10):1960-1.
15. Chen ST, Siddarth P, Ercoli LM, Merrill DA, Torres-Gil F, Small GW. Modifiable risk
factors for Alzheimer disease and subjective memory impairment across age groups.
PLoS One. 2014;9(6):e98630.
16. Jonker C, Launer LJ, Hooijer C, Lindeboom J. Memory complaints and memory
impairment in older individuals. J Am Geriatr Soc. 1996;44(1):44-9.
17. Reid LM, Maclullich AM. Subjective memory complaints and cognitive impairment in
older people. Dement Geriatr Cogn Disord. 2006;22(5-6):471-85.
18. Finkel D, Reynolds CA, McArdle JJ, Pedersen NL. Age changes in processing speed
as a leading indicator of cognitive aging. Psychol Aging. 2007;22(3):558-68.
19. Zaninotto P, Batty GD, Allerhand M, Deary IJ. Cognitive function trajectories and their
determinants in older people: 8 years of follow-up in the English Longitudinal Study of
Ageing. J Epidemiol Community Health. 2018;72(8):685-94.
20. Seeman TE, Miller-Martinez DM, Stein Merkin S, Lachman ME, Tun PA, Karlamangla
AS. Histories of social engagement and adult cognition: midlife in the U.S. study. J
Gerontol B Psychol Sci Soc Sci. 2011;66 Suppl 1:i141-52.
21. Gauthier S, Reisberg B, Zaudig M, Petersen RC, Ritchie K, Broich K, et al. Mild
cognitive impairment. Lancet. 2006;367(9518):1262-70.
22. Reisberg B, Gauthier S. Current evidence for subjective cognitive impairment (SCI) as
the pre-mild cognitive impairment (MCI) stage of subsequently manifest Alzheimer’s
disease. Int Psychogeriatr. 2008;20(1):1-16.
23. Jessen F, Amariglio RE, van Boxtel M, Breteler M, Ceccaldi M, Chetelat G, et al.
A conceptual framework for research on subjective cognitive decline in preclinical
Alzheimer’s disease. Alzheimers Dement. 2014;10(6):844-52.

9 Healthcare utilisation
151
ContentsKey findings ...................................................................................................................... 152
9.1 Introduction ................................................................................................................. 154
9.2 Healthcare cover ........................................................................................................ 158
9.3 Utilisation of medical care........................................................................................... 163
9.4 Utilisation of public allied healthcare .......................................................................... 166
9.5 Utilisation of public home care.................................................................................... 168
9.6 Discussion .................................................................................................................. 170
9.7 Conclusion .................................................................................................................. 172
9.8 References ................................................................................................................. 173
Appendices ....................................................................................................................... 178
9Trends in healthcare cover and healthcare use for older adults in Ireland during the austerity years of 2009 to 2016Lorna Roe, Steve Thomas, Dominic Trépel, and Charles Normand

Wellbeing and Health in Ireland’s over 50s 2009-2016
152
Key Findings
Following the financial crash in 2008, Ireland entered a period of austerity. This report
examines trends from 2009 to 2016 to explore potential effects of this period in healthcare
cover and healthcare utilisation. Key trends are summarised here:
• The proportion with a medical card increased (from 45% to 53%) but, dropped in the
over 70s (from 90% to 74%). A means testing system for medical card entitlement
for the over 70s was introduced in January 2009 and the threshold decreased during
subsequent Budgets.
• The proportion with a GP visit card increased (from 2% to 9%) and, within the over 70s,
increased substantially (from 1% to 19%) between Waves 1 and 4. A universal GP visit
card for the over 70s was introduced in 2015.
• We did not detect any changes in the rate of purchasing private health insurance
among older adults in Ireland.
• We found an increase in the proportion of older adults in Ireland who visited a range of
medical care services at least once in the previous year including visits to their General
Practitioner (from 87% to 92%), the Emergency Department (15% to 18%) and hospital
admissions (12% to 26%). We detected a marginal increase in the average number of
nights spent in hospital (1.0 to 2.0 nights).
• For older adults with frailty, the proportion with at least one overnight hospital
admission increased (from 23% to 31%) while the average number of nights spent in
hospital more than doubled (from 2.7 nights to 6.5 nights). The proportion with at least
one outpatient clinic visit fell (from 69% to 59%) and the average number of outpatient
clinic visits decreased (from 3.1 visits to 2.1 visits).
• Dental care use reduced (from 11% to 9%); though the rate of decline was most
notable for those who were classified as frail (from 17% to 11%).
9Trends in healthcare cover and healthcare use for older adults in Ireland during the austerity years of 2009 to 2016
9 Healthcare utilisation
153
• Community services (e.g. respite, day centre, meals on wheels, occupational therapy
or community nursing) were accessed infrequently and we found minimal change in the
utilisation of these services across the waves.
• Home help and personal care provision increased marginally (from 3% to 5%)
however, the users of the home help service changed – 19% of users had concurrent
limitations in activities of daily living (ADL) and instrumental activities of daily living
(IADL) in 2010 compared to 41% in 2016. The HSE changed the objective of the home
help service in 2012 from provision of ‘domestic help’ to provision of ‘personal care.’
• Informal care (i.e. care from family or friend) use increased (5% to 9%), and particularly
among older adults with frailty (27% to 36%) between Wave 1 and Wave 4.

Wellbeing and Health in Ireland’s over 50s 2009-2016
154
9.1 Introduction
Older people’s health service utilisation and healthcare cover is captured at each wave of
TILDA, beginning with Wave 1 in 2009. By Wave 4, we have captured a seven year period
allowing us to examine changes in these areas between 2009 and 2016. This was a period
of significant change in Ireland – the so called ‘austerity years’ where public revenue for
the health sector was substantially reduced and private incomes and employment fell.
Government non-capital spending on health fell from €14.4 billion in 2009 to €13.1 billion1
in 2015 while a public sector recruitment embargo and a voluntary redundancy scheme
introduced in March 2009 resulted in the loss of over 8,000 whole time equivalent positions
from the health service between 2008 and 2014 (1). At the same time, aggregate demand
for healthcare increased, as more people became entitled to means-tested medical cards
and the number of older adults, who are the main users of health services, increased.
Figure 9.1 shows the percentage change in the number of older adults in the population,
the number of home help users2 and the number of home help hours provided relative to
the values recorded in 2008, see Table 9.10 in the appendices for the aggregate data.
Figure 9�1: Percentage change in the number of home help users, hours of home help
care provided, older adults aged ≥50 years & ≥85 years 2006–2016.
-30%
-20%
-10%
-0%
10%
20%
30%
40%
2006 2007 2008 2009 2010 2011 2012 2013 2014 2015 2016
Per
cent
age
chan
ge (i
ndex
:200
8)
% change in the number of home help service users
% change in the number of home help hours provided
% change in the number of adults aged ≥50 years
% change in the number of adults aged ≥85 years
1 Later increasing to ☆14.6 billion in 20162 Not including users of home care packages
9 Healthcare utilisation
155
This HSE data shows that the number of home help hours provided declined relative to the
levels provided in 2008 while the proportion of people in the older age groups increased,
requiring the home help service to be shared among a greater number of people. The rules
governing the allocation of the service also changed. Prior to 2012, the home help service
prioritised the provision of ‘domestic help’ (e.g. household cleaning, shopping), but this was
changed to prioritise the provision of ‘personal care’ (e.g. assistance into or out of bed,
bathing); a more stringent test for allocating the home help service (2)3 .
While greater efficiencies in hospital care were noted between 2008 and 2012 such as
an increase in hospital day case activities4 (4), 2012 was marked as a tipping point where
the ‘fat had been trimmed’ and further budget cuts meant that the healthcare system was
forced to do ‘less with less’ (5). From the end of 2012, through 2013 and 2014, inpatient
activity decreased and day case activity levelled off despite increased demand, leading to
even longer waiting lists for planned hospital care (5). At the end of 2013, health service
managers reported that over 25% of their time was taken up with two activities - living
within budget and managing change (6).
In addition to changes made to service provision, a substantial number of changes were
made to healthcare cover, which is the protection that people have from being exposed to
the full cost of healthcare. In the Irish healthcare system, any individual who is ordinarily
a resident in Ireland is entitled to subsidised hospital care and prescribed medications
financed through taxation (7). Those on low incomes are offered additional protection with
the provision of a medical card5, or a GP visit card6. Some people purchase private health
insurance which is typically used for quicker access to hospital care. Between 2009 and
2016, healthcare cover changed substantially (Table 9.11).
In 2009, the universal ‘over 70s’ medical card was changed to a means-tested benefit and
the income at which an individual could qualify for this benefit was lowered in subsequent
budgets7. A charge on each item prescribed to those with a medical card, the ‘prescription
charge’, was introduced in 2010 and this charge was increased incrementally. Entitlements
to free dental and aural care were stopped as a medical card benefit.
3 “…Re-focusing home help services to prioritise personal care…There will be reductions of 4.5% nationally in the level of home help hours provided but this reduction will be compensated by a more rigorous approach to the allocation of these supports to ensure that the people most in need receive them by deprioritising non-personal care.” (2 pg 7)
4 A ‘day patient’ is admitted to hospital for treatment on an elective (rather than an emergency) basis and is discharged alive, as scheduled, on the same day…Births are not included (3).
5 Provides access free at the point of use to GP care, hospital care, community care and subsidised medications. 6 Provides access free at the point of use to GP care only.7 In July 2015, a universal GP-visit card was introduced for the over-70s who were no longer entitled to a medical card.

Wellbeing and Health in Ireland’s over 50s 2009-2016
156
For those who did not have a medical card, the charges for public healthcare increased.
The threshold for the Drugs Payment Scheme increased from €90 to €144, charges for
an Emergency Department (ED) visit without a General Practitioner (GP) referral rose
from €66 to €100 and charges for each night spent as an inpatient rose from €66 to €80
(capped at €800 per annum). Also the entitlements to dental and optical care were cut in
2010 and the entitlement to hearing aids was cut in 2012. Finally, the tax relief available to
those who purchase private health insurance was lowered and in 2015, the Government
introduced ‘Lifetime Community Rating’ which was a policy that incentivised people to
purchase private health insurance. Within the population in Ireland, the proportion with private
health insurance fell from 51% in 2008 to 43% in 2014 before increasing to 45% in 2017 (8).
Overall, the period 2009-2016 represents a period of significant change. A number of
policy decisions were made that were driven by a financial imperative. The aim of this
Chapter is to determine how entitlements to a medical card or a GP visit card, trends of
purchasing private health insurance and health service utilisation changed over this period
among the community-dwelling population aged 50 years and older. Data for this Chapter
were obtained from the computer assisted personal interview (CAPI) conducted during four
waves of TILDA.
Table 9�1: Timelines for data collection at each wave�
Wave Data collection periodWave 1 October 2009 – February 2011
Wave 2 February 2012 – March 2013
Wave 3 March 2014 – October 2015
Wave 4 January 2016 – December 2016
As our aim was to examine change at each time point, only those TILDA respondents who
participated in all four waves were included in the analysis. Of the 8,175 participants in TILDA
aged 50 years or more at baseline, 2,869 individuals who did not participate in all four waves
were excluded, leaving us with an analytical sample of 5,306. We employed an attrition weight
to deal with attrition bias and report on weighted means and proportions8 at each wave.
We recommend interpreting changes using the point estimates and confidence intervals.
8 As only participants who completed all four waves were included in this analysis, there may be small differences in the estimates reported for a wave compared to previous reports.
9 Healthcare utilisation
157
There are three parts to our analysis. Firstly, we examine participant’s health cover at each
wave, and categorised according to their age at the given wave.
Secondly, as we know that there is a relationship between frailty and service use (9),
we examined the frailty status of service users to establish if there were changes in
resource allocation on the basis of severity of need (i.e. frailty). Frailty occurs when people
experience failure in multiple bodily systems leading to whole system breakdown. Frailty
in older adults is viewed on a continuum and can change over time. Older adults classified
as ‘robust’ may have health problems but these problems are being managed well. Older
adults classified as ‘pre-frail’ are at an increased risk of adverse outcomes but are coping;
and older adults classified as ‘frail’ are at highest risk of adverse health outcomes such
as falls, disability, hospitalisation, nursing home admission and even death (10). Frailty
was measured using a ‘frailty index’ which consists of 32 problems including chronic
disease, functional measures and quality of life measures (Table 9.13). Participants were
categorised as robust (0-3 health problems), pre-frail (4-7 health problems) or frail (8 or
more health problems) at each wave.
Finally, we examined if the type and severity of disability of home help users changed over
the waves in keeping with the policy change mentioned earlier. We measured disability
with instrumental activities of daily living (IADL) and activities of daily living (ADL). IADLs
are understood as higher order functional limitations (such as taking medications correctly,
shopping, using the telephone, housekeeping, preparing meals and managing money)
which align with the domestic management of the household (11). ADLs are the basic
tasks of everyday life such as eating, bathing, dressing, toileting, and moving about
(12). We examine the severity of an individual’s functional limitations by reporting on the
following categories: (1) “No ADL or IADL limitations”; (2) “one or more IADL limitations”;
(3) “one or more ADL limitations”; (4) “one or more ADL and IADL limitations.”
When examining a participant’s health cover or patterns of service use stratified by their
age, frailty status or disability status, it is important to note that we are reporting their
status at each wave. As these characteristics will change over time, the corresponding
numbers within each category will change at each wave. For example, a person who is
classified as pre-frail in Wave 1, might be frail by Wave 3.
Wellbeing and Health in Ireland’s over 50s 2009-2016
158
A description of the analytical sample
As the same participants took part in each wave, it is important to note the effects of cohort
ageing. In Wave 1, the sample was aged a minimum of 50 years and this increased to 52
years and older in Wave 2, 54 years and older in Wave 3, and 56 years and older in Wave
4. This ageing of the sample is linked to the increasing proportion of the sample who were
classified as frail or pre-frail over time in Chapter 7 (frail: 12.7% to 19.0% between Waves
1 and 4; pre-frail: 30.9% to 39.2% between Waves 1 and 4).
9.2 Health care cover
Healthcare cover refers to the protection that people have from being exposed to the full
cost of healthcare. We describe healthcare cover from three different perspectives. Firstly,
by examining the proportion of older adults in Ireland with additional public cover from
a medical card or a GP visit card. Secondly, by examining the proportion with additional
private cover from having purchased private health insurance. Thirdly, by examining the
distribution of additional public or private healthcare cover across five categories: (1)
‘None’ indicates no medical card, GP visit card or private health insurance; (2) ‘Medical
card’ indicates having a medical card only; (3) ‘PHI’ indicates having private health
insurance only; (4) ‘GP visit card’ indicates having a GP visit card only and (5) ‘Dual cover’
indicates adults with either a medical card or GP visit card in addition to having private
health insurance. These patterns are likely driven by the ageing of the cohort as the
means-test thresholds for medical cards change as people age. Therefore, we examine
the distribution of public and private healthcare cover by age group at each wave. Age has
been categorised into three groups (50-65 years, 66-69 years, 70 years or more) that match
those of public entitlements to a medical card or GP visit card (13, 14) to aid interpretation.
9.2.1 Additional public cover: Medical card or a GP visit card
Between 2009 and 2016, the proportion of people who had a medical card increased from
45% to 53% while the proportion with a GP visit card increased – from 2% to 9%, (Table
9.2). At each wave, approximately a third of 50 to 65 year olds had public healthcare cover
indicating a persistent proportion of people pre-retirement on low household incomes.
Approximately half of 66 to 69 year olds had public healthcare cover. The higher rate of
public cover in this age group is likely explained by the combination of a drop in income
following retirement and the slightly lower means-test threshold for additional public
entitlements for this age group.

9 Healthcare utilisation
159
The majority of those aged 70 years or older had public cover at each wave, however the
proportion with a medical card fell from 90% to 74% between 2009 and 2016 while the
proportion with a GP visit card was 19% in 2016. This reflects the changing thresholds for
the medical card and the policy decision to introduce a universal GP visit card for the over
70s in 2015.
Table 9�2: Proportion of older adults with additional public health cover between 2009 and
2016 by age group�
No Medical/GP Visit Card Medical Card GP Visit Card
TotalNumber
in sample% 95% CI % 95% CI % 95% CI
50-65 years
Wave 1 68 (66-71) 29 (27-32) 2 (2-3) 100 3479
Wave 2 65 (62-67) 33 (31-36) 2 (2-3) 100 3071
Wave 3 65 (62-67) 33 (31-35) 3 (2-3) 100 2593
Wave 4 64 (61-67) 34 (31-37) 2 (1-3) 100 2148
66-69 years
Wave 1 52 (48-56) 46 (41-50) 2 (1-4) 100 620
Wave 2 50 (46-55) 46 (42-51) 3 (2-6) 100 733
Wave 3 51 (46-55) 46 (41-50) 4 (3-6) 100 818
Wave 4 52 (48-56) 45 (41-49) 3 (2-5) 100 833
70 years or more
Wave 1 9 (8-12) 90 (88-92) 0 (0-1) 100 1200
Wave 2 12 (10-14) 88 (86-89) 1 (0-1) 100 1482
Wave 3 16 (14-18) 79 (77-81) 5 (4-7) 100 1886
Wave 4 8 (7-9) 74 (71-76) 19 (17-21) 100 2315
Total
Wave 1 53 (51-55) 45 (43-47) 2 (1-2) 100 5299
Wave 2 48 (46-50) 50 (48-52) 2 (2-2) 100 5286
Wave 3 45 (43-47) 51 (49-53) 4 (3-4) 100 5297
Wave 4 38 (36-40) 53 (51-54) 9 (8-10) 100 5296
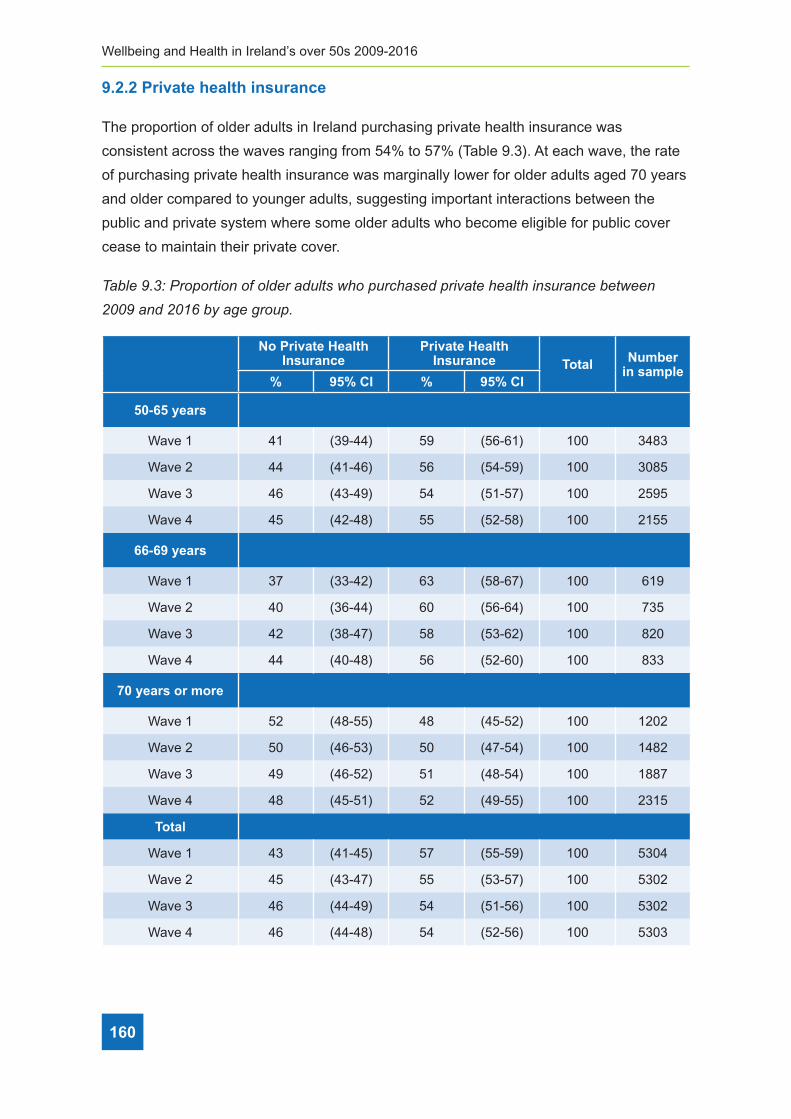
Wellbeing and Health in Ireland’s over 50s 2009-2016
160
9.2.2 Private health insurance
The proportion of older adults in Ireland purchasing private health insurance was
consistent across the waves ranging from 54% to 57% (Table 9.3). At each wave, the rate
of purchasing private health insurance was marginally lower for older adults aged 70 years
and older compared to younger adults, suggesting important interactions between the
public and private system where some older adults who become eligible for public cover
cease to maintain their private cover.
Table 9�3: Proportion of older adults who purchased private health insurance between
2009 and 2016 by age group�
No Private Health Insurance
Private Health Insurance Total Number
in sample% 95% CI % 95% CI
50-65 years
Wave 1 41 (39-44) 59 (56-61) 100 3483
Wave 2 44 (41-46) 56 (54-59) 100 3085
Wave 3 46 (43-49) 54 (51-57) 100 2595
Wave 4 45 (42-48) 55 (52-58) 100 2155
66-69 years
Wave 1 37 (33-42) 63 (58-67) 100 619
Wave 2 40 (36-44) 60 (56-64) 100 735
Wave 3 42 (38-47) 58 (53-62) 100 820
Wave 4 44 (40-48) 56 (52-60) 100 833
70 years or more
Wave 1 52 (48-55) 48 (45-52) 100 1202
Wave 2 50 (46-53) 50 (47-54) 100 1482
Wave 3 49 (46-52) 51 (48-54) 100 1887
Wave 4 48 (45-51) 52 (49-55) 100 2315
Total
Wave 1 43 (41-45) 57 (55-59) 100 5304
Wave 2 45 (43-47) 55 (53-57) 100 5302
Wave 3 46 (44-49) 54 (51-56) 100 5302
Wave 4 46 (44-48) 54 (52-56) 100 5303

9 Healthcare utilisation
161
9.2.3 The distribution of public and private healthcare cover
With respect to the distribution of public and private cover, the proportion of those with no
additional cover or with private health insurance only decreased while those with a medical
card only or dual cover increased between the waves (Table 9.4).
We did not find any significant change in the distribution of public and private cover over
time among adults aged 50 to 65 years. This age group had the highest proportion of
people with no additional cover or private health insurance only and the lowest proportion
of people with dual cover in comparison to other age groups. Among older adults aged 66
to 69 years, the proportion with dual cover decreased from 19% in Wave 1 to 13% in Wave
4. Among those aged 70 years or more, the proportion with private health insurance only
fell from 9% in Wave 1 to 7% in Wave 4. Very few adults aged 70 years or more had no
additional cover or a GP visit card only, it was more common to have either a medical card
only or dual cover. This reflects the higher income limits available for the medical card for
people aged 70 years or older.

Wellbeing and Health in Ireland’s over 50s 2009-2016
162
Tabl
e 9�
4: P
ropo
rtio
n of
old
er a
dults
with
pub
lic o
r pr
ivat
e he
alth
care
cov
erag
e be
twee
n 20
09 a
nd 2
016
by a
ge g
roup
�
No
ad
dit
ion
al
cove
rM
edic
al c
ard
on
lyP
riva
te H
ealt
h
Insu
ran
ce o
nly
Du
al c
ove
rG
P v
isit
car
d o
nly
Tota
lN
um
ber
in
sa
mp
le%
95%
CI
%95
% C
I%
95%
CI
%95
% C
I%
95%
CI
50-6
5 ye
ars
Wav
e 1
16(1
5-18
)24
(22-
26)
52(5
0-55
)7
(6-8
)1
(1-2
)10
034
78
Wav
e 2
16(1
4-17
)27
(25-
29)
49(4
6-51
)7
(6-8
)1
(1-2
)10
030
70
Wav
e 3
16(1
4-18
)28
(26-
31)
49(4
6-51
)5
(5-6
)2
(1-2
)10
025
93
Wav
e 4
16(1
4-18
)28
(25-
31)
48(4
5-51
)7
(5-8
)1
(1-2
)10
021
48
66-6
9 ye
ars
Wav
e 1
8(6
-10)
28(2
4-33
)44
(40-
49)
19(1
6-23
)1
(0-3
)10
061
9
Wav
e 2
7(5
-9)
32(2
8-36
)44
(39-
48)
16(1
3-20
)1
(1-3
)10
073
2
Wav
e 3
7(6
-10)
33(2
9-37
)43
(39-
47)
15(1
2-17
)2
(1-3
)10
081
8
Wav
e 4
8(6
-11)
34(3
0-39
)43
(39-
48)
13(1
0-15
)1
(1-2
)10
083
3
70 y
ears
or
mo
re
Wav
e 1
1(0
-2)
51(4
7-55
)9
(7-1
1)40
(36-
43)
0(0
-1)
100
1200
Wav
e 2
1(0
-1)
49(4
5-52
)11
(9-1
3)39
(36-
42)
0(0
-1)
100
1481
Wav
e 3
2(1
-2)
47(4
4-50
)14
(12-
16)
37(3
4-39
)0
(0-1
)10
018
84
Wav
e 4
1(0
-1)
46(4
3-49
)7
(6-8
)45
(42-
48)
1(1
-2)
100
2313
Tota
l
Wav
e 1
12(1
1-13
)31
(29-
32)
41(3
9-43
)16
(14-
17)
1(1
-1)
100
5297
Wav
e 2
10(9
-11)
34(3
2-36
)38
(36-
39)
17(1
6-19
)1
(1-1
)10
052
83
Wav
e 3
10(8
-11)
36(3
4-38
)36
(34-
38)
18(1
6-19
)1
(1-2
)10
052
95
Wav
e 4
8(7
-9)
37(3
5-39
)30
(28-
32)
24(2
3-26
)1
(1-2
)10
052
94
9 Healthcare utilisation
163
9.3 Utilisation of medical care
At each wave, TILDA participants were asked about the number of times they visited a
range of medical services including the General Practitioner (GP), an outpatient clinic and
the Emergency Department (ED), the number of overnight hospital admissions and the
number of nights spent in hospital over the previous 12 months.
We examine both the proportion of older adults in Ireland who had at least one visit
to these medical services, and the average number of visits to each service. We
distinguished between planned hospital care where a visit is determined by a medical
referral (e.g. an outpatient clinic visit) and an unplanned visit which is determined by a
medical crisis (e.g. an ED visit, overnight hospital admission and nights spent in hospital).
We found a higher proportion of older adults who were classified as frail visit each of the
services in comparison to the robust or pre-frail at each time point. However, a higher
proportion of older adults classified as frail report overnight hospital admissions, while a
lower proportion report outpatient clinic visits in Wave 4 versus Wave 1.
163
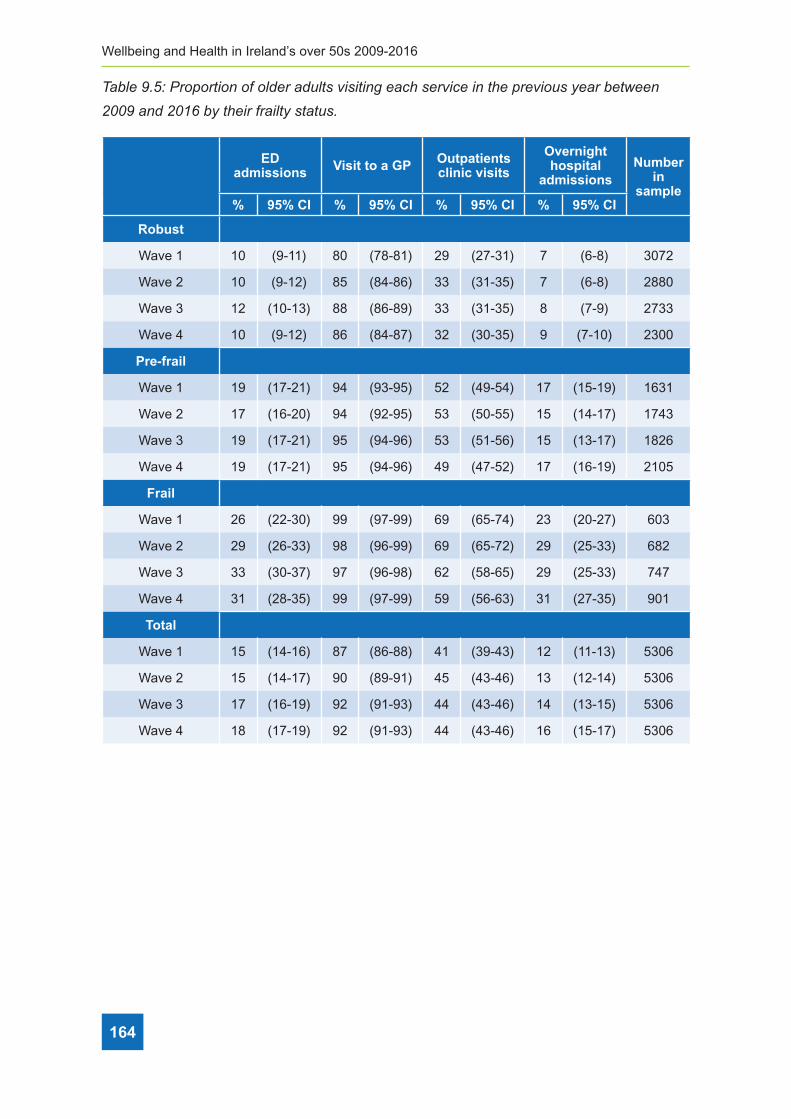
Wellbeing and Health in Ireland’s over 50s 2009-2016
164
Table 9�5: Proportion of older adults visiting each service in the previous year between
2009 and 2016 by their frailty status�
ED admissions Visit to a GP Outpatients
clinic visits
Overnight hospital
admissionsNumber
in sample
% 95% CI % 95% CI % 95% CI % 95% CI
Robust
Wave 1 10 (9-11) 80 (78-81) 29 (27-31) 7 (6-8) 3072
Wave 2 10 (9-12) 85 (84-86) 33 (31-35) 7 (6-8) 2880
Wave 3 12 (10-13) 88 (86-89) 33 (31-35) 8 (7-9) 2733
Wave 4 10 (9-12) 86 (84-87) 32 (30-35) 9 (7-10) 2300
Pre-frail
Wave 1 19 (17-21) 94 (93-95) 52 (49-54) 17 (15-19) 1631
Wave 2 17 (16-20) 94 (92-95) 53 (50-55) 15 (14-17) 1743
Wave 3 19 (17-21) 95 (94-96) 53 (51-56) 15 (13-17) 1826
Wave 4 19 (17-21) 95 (94-96) 49 (47-52) 17 (16-19) 2105
Frail
Wave 1 26 (22-30) 99 (97-99) 69 (65-74) 23 (20-27) 603
Wave 2 29 (26-33) 98 (96-99) 69 (65-72) 29 (25-33) 682
Wave 3 33 (30-37) 97 (96-98) 62 (58-65) 29 (25-33) 747
Wave 4 31 (28-35) 99 (97-99) 59 (56-63) 31 (27-35) 901
Total
Wave 1 15 (14-16) 87 (86-88) 41 (39-43) 12 (11-13) 5306
Wave 2 15 (14-17) 90 (89-91) 45 (43-46) 13 (12-14) 5306
Wave 3 17 (16-19) 92 (91-93) 44 (43-46) 14 (13-15) 5306
Wave 4 18 (17-19) 92 (91-93) 44 (43-46) 16 (15-17) 5306

9 Healthcare utilisation
165
The average number of nights spent in hospital increased from 1 to 2 nights between 2009
and 2016 (Table 9.6). This was mostly driven by the fact that the number of nights that
older adults classified as frail spent in hospital had doubled between 2009 and 2016 (2.7
nights to 6.5 nights). By comparison, the average number of visits to the outpatient clinic
(3.1 visits to 2.1 visits) had fallen among older adults classified as frail.
Table 9�6: Average number of times each older adult visited a service in the previous year
between 2009 and 2016 by their frailty status�
GP visits Nights spent in hospital
Overnight hospital
admissions
Outpatient clinic visits
ED admissions
Number in sample
Mean (95% CI)
Mean (95% CI)
Mean (95% CI)
Mean (95% CI)
Mean (95% CI)
Robust
Wave 1 2.5 (2.3,2.6) 0.4 (0.3,0.5) 0.1 (0.1,0.1) 0.7 (0.6,0.8) 0.1 (0.1,0.2) 3070
Wave 2 2.6 (2.5,2.8) 0.4 (0.3,0.5) 0.1 (0.1,0.1) 0.9 (0.7,1.0) 0.1(0.1,0.2) 2880
Wave 3 2.7 (2.4,3.0) 0.7 (0.2,1.1) 0.1 (0.1,0.2) 0.8 (0.7,0.9) 0.1 (0.1,0.1) 2731
Wave 4 2.6 (2.5,2.8) 0.7 (0.4,1.0) 0.1 (0.1,0.1) 0.9 (0.7,1.0) 0.1 (0.1,0.1) 2613
Pre-frail
Wave 1 4.6 (4.3,4.8) 1.3 (0.9,1.7) 0.2 (0.2,0.3) 2.0 (1.7,2.3) 0.3 (0.2,0.4) 1630
Wave 2 4.5 (4.3,4.8) 1.2 (1.0,1.4) 0.2 (0.2,0.3) 1.9 (1.6,2.2) 0.3 (0.2,0.3) 1742
Wave 3 4.4 (4.2,4.5) 1.6 (1.2,2.0) 0.2 (0.2,0.3) 1.8 (1.7,2.0) 0.2 (0.2,0.3) 1825
Wave 4 4.3 (4.0,4.5) 1.5 (1.2,1.8) 0.3 (0.2,0.3) 1.9 (1.6,2.2) 0.3 (0.2,0.3) 1865
Frail
Wave 1 8.0 (7.2,8.9) 2.7 (2.0,3.4) 0.4 (0.3,0.5) 3.1 (2.6,3.6) 0.4 (0.3,0.5) 601
Wave 2 7.1 (6.4,7.8) 3.6 (2.6,4.5) 0.7 (0.5,0.9) 3.1 (2.6,3.6) 0.5 (0.4,0.6) 681
Wave 3 6.9 (6.3,7.6) 4.2 (3.1,5.2) 0.5 (0.4,0.6) 2.4 (2.1,2.8) 0.5 (0.4,0.6) 746
Wave 4 6.7 (6.2,7.3) 6.5 (4.7,8.2) 0.6 (0.5,0.7) 2.1 (1.9,2.4) 0.5 (0.4,0.6) 824
Total
Wave 1 3.8 (3.6,4.0) 1.0 (0.8,1.1) 0.2 (0.2,0.2) 1.4 (1.3,1.5) 0.2 (0.2,0.3) 5301
Wave 2 3.9 (3.7,4.1) 1.1 (0.9,1.2) 0.2 (0.2,0.2) 1.5 (1.4,1.7) 0.2 (0.2,0.3) 5304
Wave 3 3.9 (3.7,4.1) 1.5 (1.2,1.8) 0.2 (0.2,0.3) 1.4 (1.3,1.5) 0.2 (0.2,0.2) 5302
Wave 4 3.9 (3.8,4.1) 2.0 (1.6,2.3) 0.2 (0.2,0.3) 1.5 (1.3,1.6) 0.2 (0.2,0.3) 5302

Wellbeing and Health in Ireland’s over 50s 2009-2016
166
9.4 Utilisation of public allied healthcare
We also examined care services other than those provided by GPs and hospitals. At each
wave, participants were asked if they had utilised any of the allied healthcare services in
the preceding twelve months - excluding any services for which they had paid anything
other than a token or nominal amount. This included any state provided physiotherapy,
dietician, hearing, dental, optician, psychological and social work services (Table 9.7).
Unlike utilisation of medical care which increased between 2009 and 2016, at an
aggregate level the proportion of older adults who accessed public allied healthcare did not
change substantially. The proportion who utilised the hearing increased from 2% in 2009 to
3% in 2016, while the proportion utilising dental care decreased from 11% in 2009 to 9% in
2016.
Being an older adult classified as frail in comparison to robust or pre-frail was associated
with an increased use of most services across all waves. However, in older adults with
frailty, we found a decreased use of dental services (17% to 11%) and dietician services
(5% to 2%) between Waves 1 and 4. Older adults classified as robust or pre-frail were
associated with a decreased use of dental, optician services and physiotherapy services
between Waves 1 and 4.

9 Healthcare utilisation
167
Tabl
e 9�
7: P
ropo
rtio
n of
old
er a
dults
vis
iting
eac
h se
rvic
e in
the
prev
ious
yea
r be
twee
n 20
09 a
nd 2
016
by th
eir
frai
lty s
tatu
s�
Ph
ysio
ther
apy
Die
titi
anH
eari
ng
Ser
vice
Den
tal
Op
tici
anP
sych
olo
gic
alS
oci
al W
ork
Nu
mb
er in
sa
mp
le%
95%
CI
%95
% C
I%
95%
CI
%95
% C
I%
95%
CI
%95
% C
I%
95%
CI
Ro
bu
st
Wav
e 1
2(2
-3)
0(0
-1)
1(0
-1)
9(8
-10)
8(7
-9)
1(1
-1)
0(0
-0)
3072
Wav
e 2
2(2
-3)
1(0
-1)
1(1
-2)
8(6
-9)
8(7
-9)
1(0
-1)
0(0
-0)
2880
Wav
e 3
2(2
-3)
0(0
-1)
1(0
-1)
5(4
-6)
6(5
-7)
1(0
-1)
0(.
-.)
2733
Wav
e 4
1(1
-2)
0(0
-1)
1(1
-1)
6(5
-7)
5(4
-6)
0(0
-1)
0(.
-.)
2298
Pre
-fra
il
Wav
e 1
7(6
-8)
2(1
-2)
2(2
-3)
13(1
2-16
)17
(15-
19)
1(0
-2)
0(0
-1)
1631
Wav
e 2
7(6
-8)
1(1
-2)
4(3
-5)
10(9
-12)
17(1
5-19
)1
(1-2
)1
(0-1
)17
43
Wav
e 3
7(6
-8)
1(1
-2)
3(2
-4)
9(8
-10)
13(1
1-15
)1
(0-1
)0
(0-0
)18
26
Wav
e 4
5(4
-6)
1(1
-2)
3(2
-4)
10(9
-12)
13(1
2-15
)1
(0-1
)0
(0-1
)20
98
Fra
il
Wav
e 1
15(1
2-18
)5
(3-7
)4
(3-7
)17
(14-
20)
22(1
9-26
)2
(1-4
)1
(0-2
)60
3
Wav
e 2
15(1
2-19
)4
(2-5
)7
(5-9
)17
(14-
20)
29(2
5-33
)2
(1-4
)0
(0-1
)68
2
Wav
e 3
14(1
1-16
)3
(2-4
)6
(5-9
)9
(7-1
1)18
(15-
21)
1(0
-2)
0(0
-2)
747
Wav
e 4
13(1
1-15
)2
(1-3
)7
(6-1
0)11
(9-1
4)20
(18-
24)
1(1
-3)
0(0
-1)
882
Tota
l
Wav
e 1
5(4
-6)
1(1
-2)
2(1
-2)
11(1
0-13
)12
(11-
13)
1(1
-1)
0(0
-0)
5306
Wav
e 2
6(5
-7)
1(1
-2)
3(2
-3)
10(9
-11)
14(1
3-15
)1
(1-1
)0
(0-1
)53
06
Wav
e 3
5(5
-6)
1(1
-1)
2(2
-3)
7(6
-8)
10(9
-11)
1(0
-1)
0(0
-0)
5306
Wav
e 4
5(4
-5)
1(1
-1)
3(3
-4)
9(8
-10)
11(1
0-12
)1
(1-1
)0
(0-0
)52
78

Wellbeing and Health in Ireland’s over 50s 2009-2016
168
9.5 Utilisation of public home care
Public home care reflects services which are provided by the State to support older adults
to live independently at home and include; the home help and personal care service9,
community nursing10, meals on wheels, day centre care, occupational therapy and respite care.
Data were not collected on the use of home care packages11 until Wave 3 so it is not
possible to look at use of this service in this Report. As informal carers (or family carers)
are an important part of the overall care provided to older adults in Ireland we also
examined respondents who reported having an informal carer at each wave (Table 9.8).
Overall, it was uncommon for adults aged 50 years and over in Ireland to use public home
care services. Informal carers are the most common type of home based care provided,
followed by community nursing and the home help or personal care service. During the
study period, use of informal care nearly doubled (5% to 9%) as did the home help or
personal care service (3% to 5%) while the use of community nursing remained the same
(5/6%). An increase in the proportion of older adults classified as frail also reported having
an informal carer at Wave 4 compared to Wave 1 (36% versus 27%). This may indicate that
the burden of care was transferred from the State to families during this period.
9 Home Help services are provided to assist people to maximise their independence; remain in their own home; support their informal carers; avoid where possible going into long-term care. The service provides a number of hours’ assistance each week to success-ful applicants to deliver: personal care (washing, changing, oral hygiene, help at mealtimes); essential domestic duties related only to the individual client (lighting a fire / bringing in fuel, essential cleaning of the person’s personal space) (15)
10 In TILDA this includes Public Health Nurses, Community Registered General Nurses, Community Mental Health Nurses, Clinical Nurse Specialists and Advanced Nurse Practitioners
11 The Home Care Packages scheme aims to help people with medium-to-high support needs to continue to live at home inde-pendently. There are two types of Home Care Packages provided by the HSE: Standard HCP - inclusive of the Delayed Discharge Initiative (DDI); Intensive packages – prioritises delayed discharges and acute hospital pressures providing higher levels of resourc-es than standard HCPs. The services are provided to clients in their own homes and support is primarily aimed at older people who are: (I) living in the community or (II) who are in-patients in acute hospitals and are at risk of admission to long-term care, or (III) who are in long-term care, but who, with support, could return to limited independent living. (15)

9 Healthcare utilisation
169
Tabl
e 9�
8: P
ropo
rtio
n of
old
er a
dults
vis
iting
eac
h se
rvic
e in
the
prev
ious
yea
r be
twee
n 20
09 a
nd 2
016
by th
eir
frai
lty s
tatu
s�
Info
rmal
/F
amily
Car
erR
esp
ite
Day
cen
tre
Mea
ls o
n
wh
eels
Occ
up
atio
nal
th
erap
y
Eit
her
ho
me
hel
p o
r p
erso
nal
car
e
Co
mm
un
ity
Nu
rsin
gN
um
ber
in
sa
mp
le%
95%
CI
%95
% C
I%
95%
CI
%95
% C
I%
95%
CI
%95
% C
I%
95%
CI
No
n-f
rail
Wav
e 1
1(0
-1)
0(0
-0)
0(0
-1)
0(0
-1)
0(0
-0)
1(0
-1)
2(1
-2)
3072
Wav
e 2
0(0
-1)
0(0
-0)
0(0
-1)
0(0
-1)
0(0
-0)
1(0
-1)
1(1
-2)
2880
Wav
e 3
1(0
-1)
0(.
-.)
0(0
-0)
0(0
-1)
0(0
-0)
1(0
-1)
1(1
-1)
2733
Wav
e 4
1(0
-1)
0(.
-.)
0(.
-.)
0(0
-1)
0(0
-0)
1(0
-1)
1(1
-2)
2298
Pre
-fra
il
Wav
e 1
4(3
-5)
0(0
-1)
1(0
-1)
1(0
-1)
1(1
-2)
2(1
-3)
5(4
-7)
1631
Wav
e 2
5(4
-6)
0(0
-1)
1(1
-2)
1(0
-2)
1(0
-1)
3(2
-4)
5(4
-6)
1743
Wav
e 3
4(3
-6)
0(0
-1)
1(0
-1)
1(0
-1)
1(1
-2)
2(2
-3)
4(3
-5)
1826
Wav
e 4
5(4
-7)
0(0
-1)
1(0
-1)
1(0
-1)
1(0
-1)
3(3
-5)
5(4
-6)
2098
Fra
il
Wav
e 1
27(2
3-31
)2
(1-4
)4
(2-6
)2
(1-5
)7
(5-1
0)13
(10-
17)
19(1
6-23
)60
3
Wav
e 2
28(2
4-32
)1
(0-2
)4
(2-6
)3
(1-5
)6
(4-8
)13
(11-
17)
16(1
3-20
)68
2
Wav
e 3
33(2
9-37
)2
(1-4
)5
(3-7
)3
(2-5
)4
(3-6
)17
(14-
20)
15(1
3-19
)74
7
Wav
e 4
36(3
3-40
)2
(1-3
)3
(2-4
)3
(2-5
)4
(3-6
)20
(17-
24)
17(1
4-20
)88
2
Tota
l yea
r o
n
year
Wav
e 1
5(4
-6)
0(0
-1)
1(1
-1)
1(0
-1)
1(1
-2)
3(2
-3)
5(4
-6)
5306
Wav
e 2
6(5
-7)
0(0
-1)
1(1
-1)
1(0
-1)
1(1
-2)
3(3
-4)
4(4
-5)
5306
Wav
e 3
7(6
-8)
0(0
-1)
1(1
-1)
1(1
-1)
1(1
-2)
4(3
-4)
4(4
-5)
5306
Wav
e 4
9(8
-10)
1(0
-1)
1(1
-1)
1(1
-1)
1(1
-2)
5(4
-6)
6(5
-6)
5278

Wellbeing and Health in Ireland’s over 50s 2009-2016
170
We were particularly interested in identifying any change in the characteristics of those
receiving the home help service, specifically, if the re-prioritisation of the home help service
in 2012 from ‘domestic help’ to ‘personal care’ was borne out in the data. We examine this
by looking at the home help user’s disability status at each wave (Table 9.9).
The proportion of home help users with both difficulties in ADLs and IADLs doubled (20%
at Wave 2 to 41% at Wave 4) indicating a trend of targeting the service to those with a
more severe burden of disability after 2012.
Table 9�9: Proportion of the home help service allocated to older adults with different levels
and types of disabilities between 2009 and 2016�
Home Help service only
No disability
IADL disability
only
ADL disability
only
IADL and ADL disability Total (%)
Number in
sample% 95% CI % 95% CI % 95% CI % 95% CI
Wave 1 50 (40-61) 21 (13-31) 10 (5-19) 19 (12-28) 100 101
Wave 2 48 (39-57) 26 (18-35) 6 (2-14) 20 (14-29) 100 119
Wave 3 50 (41-59) 15 (10-22) 2 (1-6) 33 (25-43) 100 138
Wave 4 38 (30-46) 15 (10-22) 6 (3-12) 41 (33-49) 100 175
9.6 Discussion
Between 2009 and 2016, public healthcare entitlements and dual healthcare cover
increased among older adults aged 50 years and over in Ireland. This is likely a result of
the safety net of the social welfare system and the effect of cohort ageing. For example, a
69-year old might not have been entitled to a medical card but might be the following year
on turning 70 due to the different medical card income thresholds. However, approximately
1 in 4 of the cohort aged 70 years or more in 2016 did not have a medical card and its
associated benefits including access to publicly provided allied health and community
services.
Private health insurance cover was consistent between 2009 and 2016 suggesting that
this cohort prioritised payment for private health insurance during this period. This also
suggests the small increase in private insurance coverage noted by the Health Insurance
Authority was likely driven by younger people who were responding to the Governments
community rating policy.
Between 2009 and 2016 there was an increase in the proportion of older adults aged 75

9 Healthcare utilisation
171
years or more with ADL or IADL limitations (Chapter 3), an increase in the prevalence of
cardiovascular diseases.12 In terms of cardiovascular disease, there was an increased
prevalence of hypertension (35% to 38%), diabetes (8% to 11%), heart attack (4% to 6%),
stroke (1% to 2%), and transient ischaemic attack (2% to 4%) between Waves 1 and 4.
In terms of non-cardiovascular disease, there was an increased prevalence of arthritis
(26% to 39%), osteoporosis (9% to 17%), cataracts (9% to 14%) and lung disease (4%
to 5%) from Wave 1 to 4 (Chapter 6) and an increase in the prevalence of frailty (Chapter
7). These epidemiological patterns are an important context with which to frame our
discussion on patterns in healthcare provision.
Overall, our preliminary findings point to an increase in unplanned hospital care utilisation
(ED visits, hospital admissions, length of stay), a decrease in planned hospital care
utilisation (outpatient clinic visits), while the proportion of older adults utilising services
such as community nursing, physiotherapy and occupational therapy remained the same.
Our evidence suggests that the cut to public dental benefits (for both medical card and
non-medical card holders) may have contributed to a decline in the use of dental care
services within this cohort between 2009 and 2016.
We found an increased use of the home help service between 2009 and 2016 which
contrasts with an overall pattern of decreased provision noted in the HSE data (Table
9.10). There are two possible explanations for this. Firstly, the HSE estimates include
home help users of all ages, while this report only reports on users aged 50 years and
older. Secondly, our estimates are likely to include participants who received a home help
as part of their home care package which are recorded separately by the HSE.
With respect to hospital care, our data suggest that significant change occurred in Irish
hospitals during the course of the recession, notably that use of planned hospital care
(e.g. outpatient clinics) decreased from 69% to 59% among older adults classified as frail
between 2009 and 2016 while unplanned hospital care (e.g. overnight hospital admissions
and ED admissions) increased from 23% to 31% among the same group during the same
period. This is consistent with previous findings about the impact of austerity on the Irish
healthcare system (5) but also reflects the increasing age and care needs
12 In terms of cardiovascular disease, there was an increased prevalence of hypertension (35% to 38%), diabetes (8% to 11%), heart attack (4% to 6%), stroke (1% to 2%), and transient ischaemic attack (2% to 4%) between Waves 1 and 4.

Wellbeing and Health in Ireland’s over 50s 2009-2016
172
By examining the characteristics of users of hospital care, we found that frailty was driving
utilisation and that hospital admissions and lengths of stay increased. In unpicking why
this occurred, firstly, it is possible that the volume of older people with frailty presenting to
the ED and admitted to hospital, could have crowded out the capacity of Irish hospitals to
deliver its planned elective care. Secondly, the increase in the average number of nights
that an older person with frailty spent in hospital is potentially a result of pressures in the
community sector where provision of services was not increased to match increased need.
Thirdly, the increased use of the home help service in those with higher levels of disability
could be a result of strategies such as the delayed discharge initiative which relied on the
home help service among others, to support safe hospital discharges and alleviate some
of the pressure on the hospital system.
9.7 Conclusion
In conclusion, despite increases in the prevalence of chronic disease, frailty and disability,
healthcare provision did not increase suggesting that policy changes made during this
period influenced healthcare cover and may have made it more difficult for older adults to
access services that they required. This preliminary analysis will be progressed with more
sophisticated statistical modelling allowing us to unpick the effects of these policies in
more detail.

9 Healthcare utilisation
173
9.8 References
1. Williams D and S Thomas (2017) The impact of austerity on the health workforce and
the achievement of human resources for health policies in Ireland (2008–2014) Human
Resources for Health201715:62
2. Health Service Executive (2012) National Service Plan 2012, Dublin: Health Service
Executive.
3. Healthcare Pricing Office (2016) Activity in Acute Public Hospitals in Ireland Annual
Report, 2015. Dublin. Health Service Executive.
4. Thomson S, Jowett M and P Mladovsky (2014) Health system responses to financial
pressures in Ireland Policy options in an international context. A report by the European
Observatory on Health Systems and Policies http://www.euro.who.int/__data/assets/
pdf_file/0006/260088/Health-system-responses-to-financial-pressures-in-Ireland.pdf
5. Burke S, Thomas S, Barry S and C Keegan (2014) Indicators of health system
coverage and activity in Ireland during the economic crisis 2008-2014 - From
‘more with less’ to ‘less with less’, Health policy (Amsterdam, Netherlands), 117, (3),
2014, p275-8
6. Barry S, Burke S, Tyrrell E and S Thomas (2017) ‘Is someone going to saw off the
plank behind me?’ - Healthcare managers priorities, challenges and expectations for
service delivery and transformation during economic crisis. Health Systems, Policy and
Research, 4, (1:39), 2017, p1 - 7
7. Citizens Information Office (2018a) Entitlement to health services.
http://www.citizensinformation.ie/en/health/health_system/entitlement_to_public_
health_services.html
8. Health Insurance Authority of Ireland (2017) Annual Report and accounts. Dublin, Ireland.
9. Roe L, Normand C, Wren MA, Browne J and AM O’Halloran (2017) The impact of frailty
on healthcare utilisation in Ireland: evidence from the Irish longitudinal study on ageing.
BMC Geriatr. Sep 05 2017;17(1):203.
10. Roe L, O’Halloran AM, Normand C and C Murphy (2016) The impact of frailty on public
health nurse service utilisation: Findings from The Irish Longitudinal Study on Ageing.
Dublin: TILDA

Wellbeing and Health in Ireland’s over 50s 2009-2016
174
11. Lawton MP and EM Brody (1969) Assessment of Older People: Self-Maintaining and
Instrumental Activities of Daily Living. The Gerontologist. 1969;9(3 Part 1):179 -186.
12. Katz S, Ford AB, Moskowitz RW, Jackson BA and MW Jaffe (1963) Studies of illness
in the aged, the index of ADL: A standardized measure of biological and psychosocial
function. JAMA. 1963 21;185:914-919. 4.
13. Citizens Information Office (2018b) Medical Card Means Test: Aged Under 70 http://
www.citizensinformation.ie/en/health/medical_cards_and_gp_visit_cards/medical_
card_means_test_under_70s.html Accessed on 26th October 2018
14. Citizens Information Office (2018c) Medical Card Means Test: Aged over 70 http://www.
citizensinformation.ie/en/health/medical_cards_and_gp_visit_cards/medical_card_
means_test_over_70s.html Accessed on 26th October 2018
15. Health Service Executive (2016) Services for Older People Activity & Resource
Review: Home Care Services https://www.lenus.ie/bitstream/handle/10147/621444/
Activity.pdf?sequence=1&isAllowed=y
16. Nolan A, Barry S, Burke S and S Thomas (2014) ‘The impact of the crisis on the
health system and health in Ireland’ in Maresso A, Mladovsky P, Thomson S, Sagan
A, Karanikolos M, Richardson E, Cylus J, Evetovits T, Jowett M, Figueras J and
H Kluge (eds.) ‘Economic Crisis, Health Systems And Health In Europe. Country
Experience’ Copenhagen: WHO Regional Office for Europe/European Observatory
on Health Systems and Policies (Policy Summary) http://www.euro.who.int/__data/
assets/pdf_file/0010/279820/Web-economic-crisis-health-systems-and-health-web.
pdf?ua=1Appendices

9 Healthcare utilisation
175
Appendices

Wellbeing and Health in Ireland’s over 50s 2009-2016
Table 9�10: Aggregate number of home help clients, home help hours, older adults aged
50 years and older and older adults aged 85 years and older between 2006 and 2016�
Annual estimated number of home
help clients recorded by the Health Service
Executive1
Annual estimated number of home
help hours recorded by the Health Service
Executive1
Annual estimated number of adults in Ireland aged 50 years and older2
Annual estimated number of adults in Ireland aged 85 years and older2
2006 49,578 10,800,000 1,112,400 47,800
2007 54,736 12,351,088 1,142,900 49,400
2008 55,366 12,631,602 1,174,200 51,900
2009 53,791 11,970,323 1,204,600 54,000
2010 54,011 11,690,515 1,236,000 56,100
2011 50,986 11,090,000 1,265,800 58,200
2012 45,705 9,880,000 1,296,000 59,800
2013 46,454 9,740,000 1,326,300 60,700
2014 47,061 10,300,000 1,360,800 62,700
2015 47,915 10,400,000 1,396,900 64,900
2016 46,948 10,547,393 1,433,000 67,300
1. Health Service Estimates (HSE) estimates of home help clients can be found in the annual report for each respective year found at: https://www.hse.ie/eng/services/publications/corporate/annualrpts.html Note: HSE estimate of users of the home help service include individuals of any age
2 Annual population estimates for 2006 to 2016 come from the Central Statistics Office Statbank Table (PEA01)
176
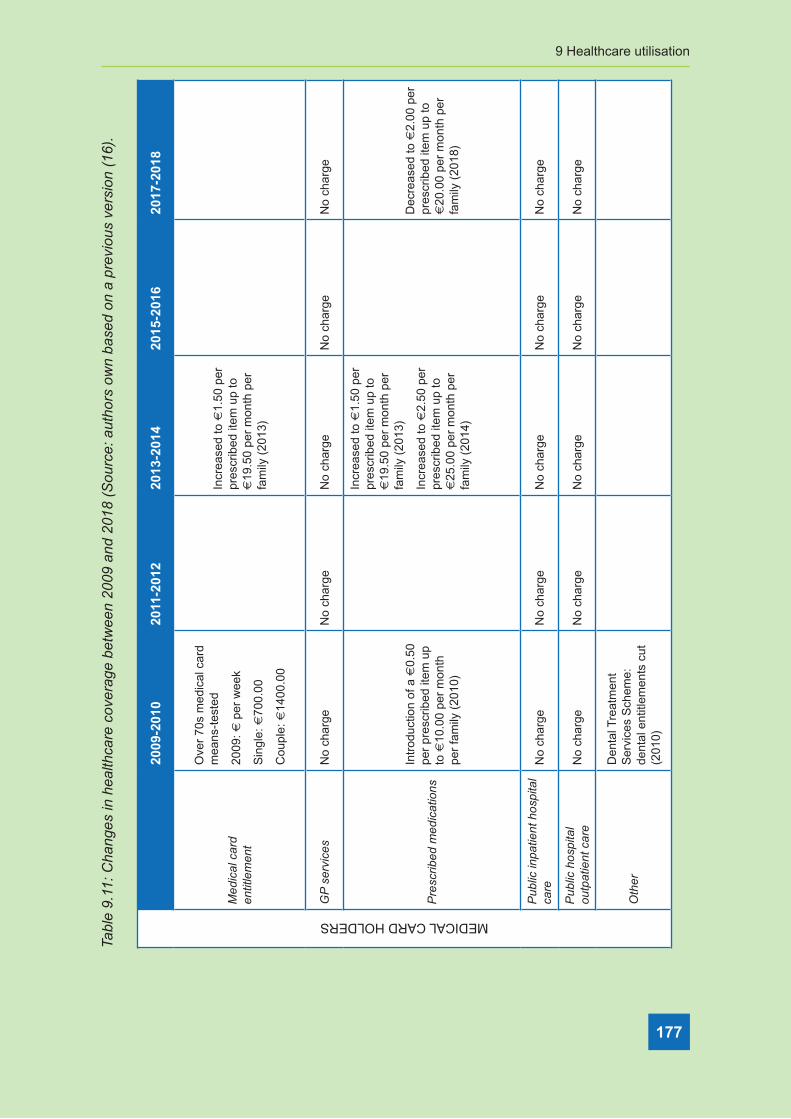
9 Healthcare utilisation
177
Tabl
e 9�
11: C
hang
es in
hea
lthca
re c
over
age
betw
een
2009
and
201
8 (S
ourc
e: a
utho
rs o
wn
base
d on
a p
revi
ous
vers
ion
(16)
�
MEDICAL CARD HOLDERS
2009
-201
020
11-2
012
2013
-201
420
15-2
016
2017
-201
8
Med
ical
car
d en
title
men
t
Ove
r 70
s m
edic
al c
ard
mea
ns-t
este
d
2009
: € p
er w
eek
Sin
gle:
€70
0.00
Cou
ple:
€14
00.0
0
Incr
ease
d to
€1.
50 p
er
pres
crib
ed it
em u
p to
€
19.5
0 pe
r m
onth
per
fa
mily
(20
13)
GP
ser
vice
sN
o ch
arge
No
char
geN
o ch
arge
No
char
geN
o ch
arge
Pre
scrib
ed m
edic
atio
ns
Intr
oduc
tion
of a
€0.
50
per
pres
crib
ed it
em u
p to
€10
.00
per
mon
th
per
fam
ily (
2010
)
Incr
ease
d to
€1.
50 p
er
pres
crib
ed it
em u
p to
€
19.5
0 pe
r m
onth
per
fa
mily
(20
13)
Incr
ease
d to
€2.
50 p
er
pres
crib
ed it
em u
p to
€
25.0
0 pe
r m
onth
per
fa
mily
(20
14)
Dec
reas
ed to
€2.
00 p
er
pres
crib
ed it
em u
p to
€
20.0
0 pe
r m
onth
per
fa
mily
(20
18)
Pub
lic in
patie
nt h
ospi
tal
care
No
char
geN
o ch
arge
No
char
geN
o ch
arge
No
char
ge
Pub
lic h
ospi
tal
outp
atie
nt c
are
No
char
geN
o ch
arge
No
char
geN
o ch
arge
No
char
ge
Oth
er
Den
tal T
reat
men
t S
ervi
ces
Sch
eme:
de
ntal
ent
itlem
ents
cut
(2
010)

Wellbeing and Health in Ireland’s over 50s 2009-2016
178
Tabl
e 9�
11: C
hang
es in
hea
lthca
re c
over
age
betw
een
2009
and
201
8 (S
ourc
e: a
utho
rs o
wn
base
d on
a p
revi
ous
vers
ion�
NON MEDICAL CARD HOLDERS
2009
-201
020
11-2
012
2013
-201
420
15-2
016
2017
-201
8
GP
ser
vice
sP
ay fu
ll ch
arge
Pay
full
char
geP
ay fu
ll ch
arge
Pay
full
char
geP
ay fu
ll ch
arge
Pre
scrib
ed m
edic
atio
ns
Dru
gs P
aym
ent
Sch
eme:
thre
shol
d in
crea
sed
from
€90
.00
to €
100.
00 p
er m
onth
(2
009)
Incr
ease
d to
€12
0.00
pe
r m
onth
(20
10)
Dru
gs P
aym
ent
Sch
eme
thre
shol
d in
crea
sed
to €
132.
00
per
mon
th (
2012
)
Incr
ease
d to
€1.
50 p
er
pres
crib
ed it
em u
p to
€
19.5
0 pe
r m
onth
per
fa
mily
(20
13)
Incr
ease
d to
€2.
50 p
er
pres
crib
ed it
em u
p to
€
25.0
0 pe
r m
onth
per
fa
mily
(20
14)
Dru
gs P
aym
ent
Sch
eme
thre
shol
d in
crea
sed
to €
144.
00
per
mon
th (
2013
)
Dru
gs P
aym
ent
Sch
eme
thre
shol
d de
crea
sed
to €
134.
00
per
mon
th (
2018
)
Pub
lic in
patie
nt h
ospi
tal
care
Inpa
tient
cha
rges
in
crea
sed
from
€66
.00
to €
75.0
0 pe
r ni
ght
(200
9)
ED
atte
ndan
ce w
ithou
t a
refe
rral
cha
rge
incr
ease
d fr
om €
66.0
0 to
€10
0.00
(20
09)
No
char
geIn
patie
nt c
harg
es
incr
ease
d to
€80
.00
per
nigh
t (20
13)
No
char
geN
o ch
arge
Pub
lic h
ospi
tal
outp
atie
nt c
are
No
char
geN
o ch
arge
No
char
geN
o ch
arge
No
char
ge
Oth
er
Tax
relie
f on
med
ical
ex
pens
es r
estr
icte
d to
th
e st
anda
rd r
ate
(20%
) (2
009)
Tre
atm
ent B
enef
it S
chem
e: d
enta
l and
op
htha
lmic
ent
itlem
ents
cu
t (20
09)
Hea
lth le
vy d
oubl
ed
and
inco
me
thre
shol
d lo
wer
ed fo
r hi
gher
rat
e (2
009)
Tre
atm
ent B
enef
it S
chem
e: a
ural
st
atut
ory
entit
lem
ents
cu
t (20
12)
Gov
ernm
ent a
bolis
hes
the
heal
th le
vy a
nd
repl
aces
it w
ith a
(no
n-ea
rmar
ked)
uni
vers
al
soci
al c
harg
e (U
SC
) (2
012)
Tax
relie
f on
priv
ate
heal
th in
sura
nce
cont
ribut
ions
red
uced
to
€10
00.0
0 fo
r ad
ults
and
€
500.
00 fo
r ch
ildre
n (2
013)
Tre
atm
ent B
enef
it S
chem
e: €
42.0
0 pa
ymen
t tow
ards
an
nual
sca
le a
nd p
olis
h;
bian
nual
ent
itlem
ent
to fr
ee s
ight
test
and
€
42.0
0 to
war
ds c
ost o
f gl
asse
s (2
017)

9 Healthcare utilisation
179
Table 9�12: The 32 items which formed the Frailty Index used in this Chapter�
Frailty Index items in the 32-item measure
Difficulty walking 100m Polypharmacy
Difficulty rising from chair Knee pain
Difficulty climbing stairs Hypertension
Difficulty stooping, kneeling or crouching Angina
Difficulty reaching above shoulder height Heart attack
Difficulty pushing/pulling large objects Diabetes
Difficult lifting/carrying weights ≥10lb Stroke or Transient ischemic attack
Difficulty picking up coin from table High cholesterol
Difficulty following a conversation Irregular heart rhythm
Feeling lonely Other Cardiovascular disease
Absentmindedness Cataracts
Poor self-rated physical health Glaucoma or age related macular degeneration
Poor self-rated vision Arthritis
Poor self-rated hearing Osteoporosis
Poor self-rated memory Cancer
Daytime sleepiness Varicose ulcer

Wellbeing and Health in Ireland’s over 50s 2009-2016
180

