watertown, massachusetts, u.s.a. - biokin, ltd. · 1 binding and kinetics for experimental...
TRANSCRIPT

1
Binding and Kinetics for Experimental Biologists
Lecture 6
Enzyme kinetics: Analysis of reaction progress
Petr Kuzmič, Ph.D.BioKin, Ltd.
WATERTOWN, MASSACHUSETTS, U.S.A.
BKEB Lec 6: Enzyme Kinetics - Pt 2 2
Lecture outline
• Goal:
Demonstrate KM determination from progress curves using numerical methods.Use a “real-world” problem arising from the instructor’s consulting practice.
• Topics:
The Michaelis constant: theory and practice.The illusion of linearity in enzyme assays.Global vs. local fit of multiple data sets: Mechanistic implications.The choice of proper time interval to measure the “initial” rates.Assessing the randomness of residual plots.Enzyme deactivation mechanisms.
• Implementation:
The DynaFit software package.

2
BKEB Lec 6: Enzyme Kinetics - Pt 2 3
Determination of “KM” – a Case Study
or
A Day in the Life of an Enzymology Consultant
BKEB Lec 6: Enzyme Kinetics - Pt 2 4
The setup: FDA put a “hold” on a drug application
FDA = UNITED STATES FOOD AND DRUG ADMINISTRATION AGENCY
• The drug candidate is an enzyme.
• This is a small biotech company – no kineticist on staff.
• The solution: Hire a consultant to- design a biochemical assay; and - propose a method of data analysis.

3
BKEB Lec 6: Enzyme Kinetics - Pt 2 5
The raw data
data 10/8/2010, row B, col 1-5 (E = 5 nM)
0
0.05
0.1
0.15
0.2
0.25
0.3
0.35
0.4
0.45
0.5
0 100 200 300 400 500 600
time, sec
A40
5
S=3.5
S=7
S=14
S=28
S=56
• vary [Substrate] from 3.5 to 56 µM• add [Enzyme] at 5 nM• observe UV/Vis absorbance at 405 nM
KM ?
BKEB Lec 6: Enzyme Kinetics - Pt 2 6
Michaelis constant: Mechanistic definition
“KM” HAS TWO DIFFERENT MEANINGS, EVEN FOR THE SIMPLEST POSSIBLE ENZYME MECHANISM
E + S ES E + Pk1
k2
k3KM =
k1
k2 + k3
kcat = k3equilibrium dissociation constant
Kd = k2 / k1
“strength of enzyme/substrate binding”
special case: when dissociation (k2) is much faster than chemical reaction (k3)
k2 >> k3 k2 + k3 ≈ k2 KM = (k2 + k3) / k1 ≈ k2 / k1 = Kd
KM
kcat
substrate binding
reactivity to form product
4
BKEB Lec 6: Enzyme Kinetics - Pt 2 7
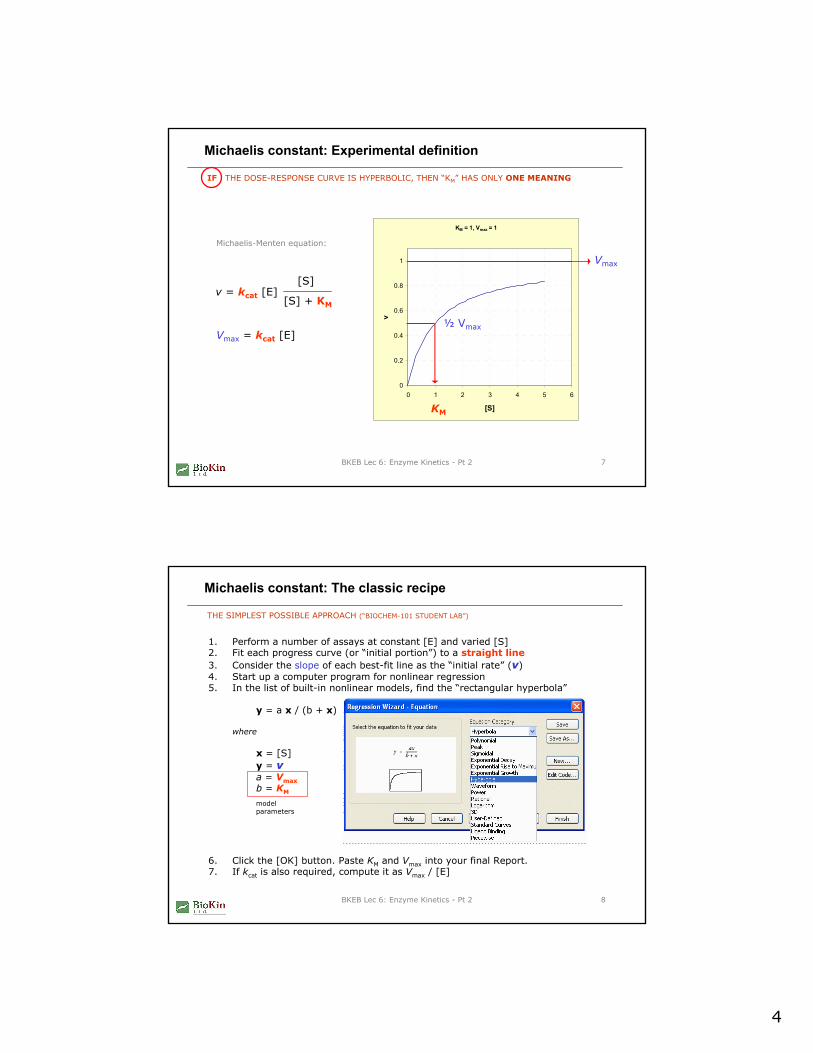
Michaelis constant: Experimental definition
IF THE DOSE-RESPONSE CURVE IS HYPERBOLIC, THEN “KM” HAS ONLY ONE MEANING
v = kcat [E] [S]
[S] + KM
Michaelis-Menten equation:
Vmax = kcat [E]
KM = 1, Vmax = 1
0
0.2
0.4
0.6
0.8
1
0 1 2 3 4 5 6
[S]
v
Vmax
½ Vmax
KM
BKEB Lec 6: Enzyme Kinetics - Pt 2 8
Michaelis constant: The classic recipe
1. Perform a number of assays at constant [E] and varied [S]2. Fit each progress curve (or “initial portion”) to a straight line3. Consider the slope of each best-fit line as the “initial rate” (v) 4. Start up a computer program for nonlinear regression5. In the list of built-in nonlinear models, find the “rectangular hyperbola”
y = a x / (b + x)
where
x = [S]y = va = Vmaxb = KM
6. Click the [OK] button. Paste KM and Vmax into your final Report.7. If kcat is also required, compute it as Vmax / [E]
THE SIMPLEST POSSIBLE APPROACH (“BIOCHEM-101 STUDENT LAB”)
modelparameters

5
BKEB Lec 6: Enzyme Kinetics - Pt 2 9
The human eye is very bad at seeing nonlinearity
WE EVOLVED TO SEE STRAIGHT LINES - EVEN WHEN THERE ARE NONE!
9/22/2010 + PS80, well D5: absorbance
0
0.05
0.1
0.15
0.2
0.25
0.3
0.35
0.4
0.45
0 100 200 300 400 500 600 700
time, sec
abso
rban
cedoes this look like a “linear portion”of the progress curve?
If this were a “linear portion”, our problems would be over:We could get the initial rate by fitting a straight line to the first 100 seconds.
BKEB Lec 6: Enzyme Kinetics - Pt 2 10
Derivatives approximated as “finite differences”
9/22/2010 + PS80, well D5: absorbance
0
0.05
0.1
0.15
0.2
0.25
0.3
0.35
0.4
0.45
0 100 200 300 400 500 600 700
time, sec
abso
rban
ce
rate ≈ Δ[Signal] / Δtime
relativerate
Vr = 1.00
Vr = 0.62
By the time the assay reached 100 seconds,the reaction rate decreased by almost one half!
CHECKING LINEARITY BY SIMPLE COMPUTATIONS

6
BKEB Lec 6: Enzyme Kinetics - Pt 2 11
The plot of instantaneous rates
9/22/2010 + PS80, well D5: absorbance
0
0.05
0.1
0.15
0.2
0.25
0.3
0.35
0.4
0.45
0 100 200 300 400 500 600 700
time, sec
abso
rban
ce
By the time the assay reached 100 seconds,the reaction rate decreased by almost one half!
9/22/2010 + PS80, well D5: rate
0
0.2
0.4
0.6
0.8
1
1.2
1.4
1.6
1.8
2
0 100 200 300 400 500 600 700
time, sec
rate
signal rate ≈ Δ [Signal] / Δ time
“constant rate”
IF THERE WERE A “LINEAR PORTION”, THE RATE PLOT SHOULD BE STRICTLY HORIZONTAL
BKEB Lec 6: Enzyme Kinetics - Pt 2 12
Trying the straight-line fit anyway
9/22/2010 + PS80, well D5: absorbance
y = 0.001606x + 0.081567R2 = 0.996890
0.07
0.09
0.11
0.13
0.15
0.17
0.19
0.21
0.23
0.25
0 20 40 60 80 100
time, sec
A40
5
HOW BAD COULD IT BE, REALLY?
9/22/2010 + PS80, well D5: residual: straight line fit
-0.008
-0.006
-0.004
-0.002
0
0.002
0.004
0.006
0.008
0 20 40 60 80 100
time, sec
resi
dual
quite bad, actually:this plot should look completely “random”

7
BKEB Lec 6: Enzyme Kinetics - Pt 2 13
What about a quadratic polynomial?
CAREFUL HERE: POLYNOMIALS ARE UNSUITABLE FOR EXTRAPOLATIONS!
quite bad, actually:this plot should look completely “random”
9/22/2010 + PS80, well D5: absorbance
y = -0.00000327x2 + 0.00192642x + 0.07670882R2 = 0.99987003
0.07
0.09
0.11
0.13
0.15
0.17
0.19
0.21
0.23
0.25
0 20 40 60 80 100
time, sec
A40
59/22/2010 + PS80, well D5: residual: quadratic fit
-0.008
-0.006
-0.004
-0.002
0
0.002
0.004
0.006
0.008
0 20 40 60 80 100
time, sec
resi
dual
Why would we need to extrapolate?
BKEB Lec 6: Enzyme Kinetics - Pt 2 14
Mixing delay time
enzyme is UV/Vis transparentsubstrate concentration is the same
absorbance at time zeroshould be identical...
... unless a lot of product wasformed already at “t = 0”
IN MOST KINETIC EXPERIMENTS WE NEVER “SEE” THE VERY INITIAL TIME POINT
data 082410 - row F: varied [E], nM
0
0.1
0.2
0.3
0.4
-100 0 100 200 300
time, sec
A40
5
E=30E=25E=20E=15E=10E=5
-40
actual start of the assay: “time = -40 sec”

8
BKEB Lec 6: Enzyme Kinetics - Pt 2 15
The devil in the details: Initial reaction rates
A FEW INNOCENT-SOUNDING CHALLENGES IN ANALYZING THE PROGRESS OF ENZYME ASSAYS:
1. The time-course of enzyme reaction is nonlinear.It can be considered “almost linear” only in special cases.
2. There is a finite mixing delay requiring extrapolation.In our experiments we always “miss” the initial rate.
3. Extrapolation is dangerous - unless we use a mechanistic model.Generic mathematical models such as polynomials are “out”.
All these problems would disappear if/whenthe progress of enzyme assays can be treated as linear.
This is almost never the case.
BKEB Lec 6: Enzyme Kinetics - Pt 2 16
We hit the brick wall with algebraic models...
... so why not do it the right way?
linear, polynomial

9
BKEB Lec 6: Enzyme Kinetics - Pt 2 17
Mechanistic mathematical model
MECHANISTIC MODELS ARE WELL SUITED FOR EXTRAPOLATIONS
E + S ES E + Pk1
k2
k3
Mathematical model for reaction progress:
Michaelis-Menten mechanism:
requires numerical(iterative) solutionusing a specializedcomplex algorithm
BKEB Lec 6: Enzyme Kinetics - Pt 2 18
Specialized numerical software: DynaFit
MORE THAN 600 PAPERS PUBLISHED WITH IT (1996 – 2009)
http://www.biokin.com/dynafitDOWNLOAD
1. Kuzmic (1996) Anal. Biochem. 237, 260-2732. Kuzmic (2009) Meth. Enzymol. 467, 247-280
2009
REFERENCES

10
BKEB Lec 6: Enzyme Kinetics - Pt 2 19
The Van Slyke – Cullen mechanism
JUST AS GOOD AS MICHAELIS-MENTEN
E + S ES E + Pk1 k3
Mathematical model for reaction progress:
Van Slyke-Cullen mechanism:
[task]
task = fitdata = progress
[mechanism]
E + S ---> E.S : k1E.S ---> E + P : k3
...
DynaFit input:
Application of the Van Slyke–Cullen irreversible mechanism in the analysis of enzymatic progress curvesKuzmic (2009) Anal. Biochem. 394, 287-289
BKEB Lec 6: Enzyme Kinetics - Pt 2 20
Global vs. “local” analysis
Meth. Enzymol. 210, 37-54 (1992)
A VERY IMPORTANT CONCEPT
data 10/8/2010, row B, col 1-5 (E = 5 nM)
0
0.05
0.1
0.15
0.2
0.25
0.3
0.35
0.4
0.45
0.5
0 100 200 300 400 500 600
time, sec
A40
5
S=3.5
S=7S=14
S=28S=56
global analysis:analyze all five curves togetheras a single data set
local analysis:analyze each curve individuallyas five separate data sets

11
BKEB Lec 6: Enzyme Kinetics - Pt 2 21
Local analysis to determine initial reaction rates
WE NEED INITIAL RATES FOR THE MICHAELIS-MENTEN EQUATION
BKEB Lec 6: Enzyme Kinetics - Pt 2 22
Reading off the initial rates
“INITIAL RATE” IS COMPUTED AT A SPECIFIC REACTION TIME (E.G. 1 SEC)

12
BKEB Lec 6: Enzyme Kinetics - Pt 2 23
Plot of state variables (species concentrations)
ALWAYS EXTREMELY HELPFUL
E
E.S
“steady state”:when E.S stays constant
(at least briefly)
BKEB Lec 6: Enzyme Kinetics - Pt 2 24
Logarithmic plot: Identify the steady-state range
WHEN A BIOCHEMICAL ASSAY REACHES THE STEADY-STATE IS SYSTEM-SPECIFIC
E
E.S
0.01 1 100 sec0.1 10
50 ms – 1 s
tell DynaFit at what timewe want to read-off the“initial” reaction rate

13
BKEB Lec 6: Enzyme Kinetics - Pt 2 25
Initial rates from local fit of progress curves
FINALLY READY TO COMPUTE THE KM
data 10/8/2010, row B, col 1-5 (E = 5 nM)
0
0.05
0.1
0.15
0.2
0.25
0.3
0.35
0.4
0.45
0.5
0 100 200 300 400 500 600
time, sec
A40
5
S=3.5
S=7
S=14
S=28
S=56
KM ?
1.0981
0.9022
0.7456
0.4530
0.2674
initialrates absorbance units / sec
BKEB Lec 6: Enzyme Kinetics - Pt 2 26
Fit initial rates – initial estimate
“File .. Try” initial estimate

14
BKEB Lec 6: Enzyme Kinetics - Pt 2 27
Fit initial rates – results
KM = (13.1 ± 1.6) [6.5 .. 26.8] µM
standard error
confidence interval(99% probability
log KM
sumof
squares
REMEMBER: THE STANDARD ERROR (± VALUE FREQUENTLY REPORTED) IS MEANINGLESS
BKEB Lec 6: Enzyme Kinetics - Pt 2 28
The Michaelis constant from initial rates
data 10/8/2010, row B, col 1-5 (E = 5 nM)
0
0.05
0.1
0.15
0.2
0.25
0.3
0.35
0.4
0.45
0.5
0 100 200 300 400 500 600
time, sec
A40
5
S=3.5
S=7
S=14
S=28
S=56
KM = 13.1 µM
are we done yet?
ALMOST DONE .... MAYBE

15
BKEB Lec 6: Enzyme Kinetics - Pt 2 29
A closer look:
what else we can learn from the same data?
BKEB Lec 6: Enzyme Kinetics - Pt 2 30
Global fit of all five progress curves
VAN-SLYKE CULLEN MECHANISM (SAME AS BEFORE, IN THE LOCAL FIT)
File .. Run
looks “reasonably good”
or does it ?!

16
BKEB Lec 6: Enzyme Kinetics - Pt 2 31
Global fit – residual plot
DOES NOT LOOK GOOD AT ALL
If you see a residual plotas bad as this one,
completely ignore any otherresult from DynaFit.
Always look at residual plots.
BKEB Lec 6: Enzyme Kinetics - Pt 2 32
“Good” and “bad” residual plots
GOOD:
BAD:
Draper & Smith (1981) Applied Regression Analysis, p. 146
ASSESSING RESIDUAL PLOTS IS ONE OF THE MOST IMPORTANT SKILLS OF A DATA ANALYST
random sequenceno “trend” or “pattern”
non-random sequenceshows a “trend” or a “pattern”
17
BKEB Lec 6: Enzyme Kinetics - Pt 2 33
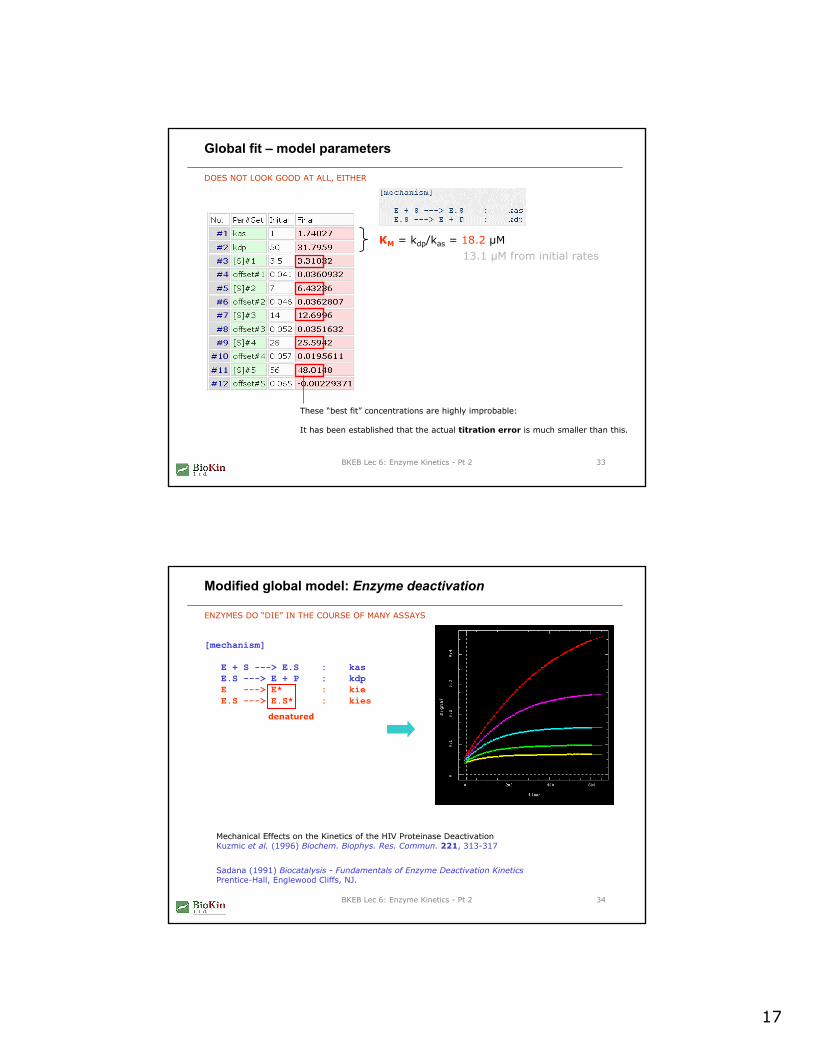
Global fit – model parameters
DOES NOT LOOK GOOD AT ALL, EITHER
KM = kdp/kas = 18.2 µM13.1 µM from initial rates
These “best fit” concentrations are highly improbable:
It has been established that the actual titration error is much smaller than this.
BKEB Lec 6: Enzyme Kinetics - Pt 2 34
Modified global model: Enzyme deactivation
ENZYMES DO “DIE” IN THE COURSE OF MANY ASSAYS
[mechanism]
E + S ---> E.S : kasE.S ---> E + P : kdpE ---> E* : kieE.S ---> E.S* : kies
denatured
Mechanical Effects on the Kinetics of the HIV Proteinase DeactivationKuzmic et al. (1996) Biochem. Biophys. Res. Commun. 221, 313-317
Sadana (1991) Biocatalysis - Fundamentals of Enzyme Deactivation KineticsPrentice-Hall, Englewood Cliffs, NJ.

18
BKEB Lec 6: Enzyme Kinetics - Pt 2 35
Enzyme deactivation model: Results
IT LOOKS GOOD EVEN UP CLOSE (RESIDUALS AND PARAMETERS)
residuals
KM = 13.6 µM
13.1 µMinitial rates
These concentration look OK.
BKEB Lec 6: Enzyme Kinetics - Pt 2 36
Residual plots: A “good” vs. “bad” comparison
with enzyme deactivation without enzyme deactivation
ASSESSING RESIDUAL PLOTS IS ONE OF THE MOST IMPORTANT SKILLS OF A DATA ANALYST
no recognizable pattern:random
a clear “zig-zag” patternnon-random

19
BKEB Lec 6: Enzyme Kinetics - Pt 2 37
Concentration plot: How much deactivation?
E
E.S
E*
E.S*
example assay: [S] = 14 µM
denatured enzyme is the mainmolecular form at the end of the assay
BKEB Lec 6: Enzyme Kinetics - Pt 2 38
KM determination: Summary
1. The progress curves must be treated as nonlinear
There is no “linear” portion, even if it seems that there is one.
2. Michaelis constant, KM, was determined by two independent methods
A. local fit of progress curves → fit of initial rates (KM = 13.1 µM)B. global fit of progress curves (KM = 13.6 µM)
Both methods gave the same results.
3. Global fit revealed that the enzyme undergoes deactivation.
Deactivation (denaturation) is almost complete after 15 minutes.
4. Deactivation does not interfere with KM determination.
If we use the initial rate method; orif we take deactivation into account in the global fit.
5. Overall: This substrate is very suitable for a KM assay.
If we use an appropriate (nonlinear) method of data analysis.

20
BKEB Lec 6: Enzyme Kinetics - Pt 2 39
What about kcat ?
THE FDA WANTS US TO DO TWO THINGS: KM AND kcat
v = Vmax
[S]
[S] + KM
Vmax = kcat [E]
Michaelis-Menten equation:Even with the differential-equation model,we can (essentially) measure only KM and Vmax.
The problem:
kcat = Vmax / [E]
At some point we must determine the concentrationof active enzyme [E] (active site concentration).
The solution:
1. Determine “apparent kcat”, from [E] as totalprotein, for a reference sample of enzyme.
2. Relate every other “apparent kcat” valueto the reference sample in the future.
The only other possibility:
BKEB Lec 6: Enzyme Kinetics - Pt 2 40
Summary and conclusions
1. Even a “simple task” such as KM determination can be quite trickyif it is to be done correctly and rigorously.
2. DynaFit can help in dealing with the nonlinearity of reaction progress.
3. Local fit of individual progress curves is not sufficiently powerfulto reveal the true kinetic mechanism.
4. Global fit of multiple curve is much preferred for mechanistic studies.
5. Residual plots are crucially important for model validation.
6. DynaFit is not a “silver bullet”: You must still use your brain a lot.