watershed development development: experience from the wala program consultant christopher michael...
TRANSCRIPT
Watershed Development:
Experience from the WALA Program
Consultant
Christopher Michael Reichert
May 5, 2014
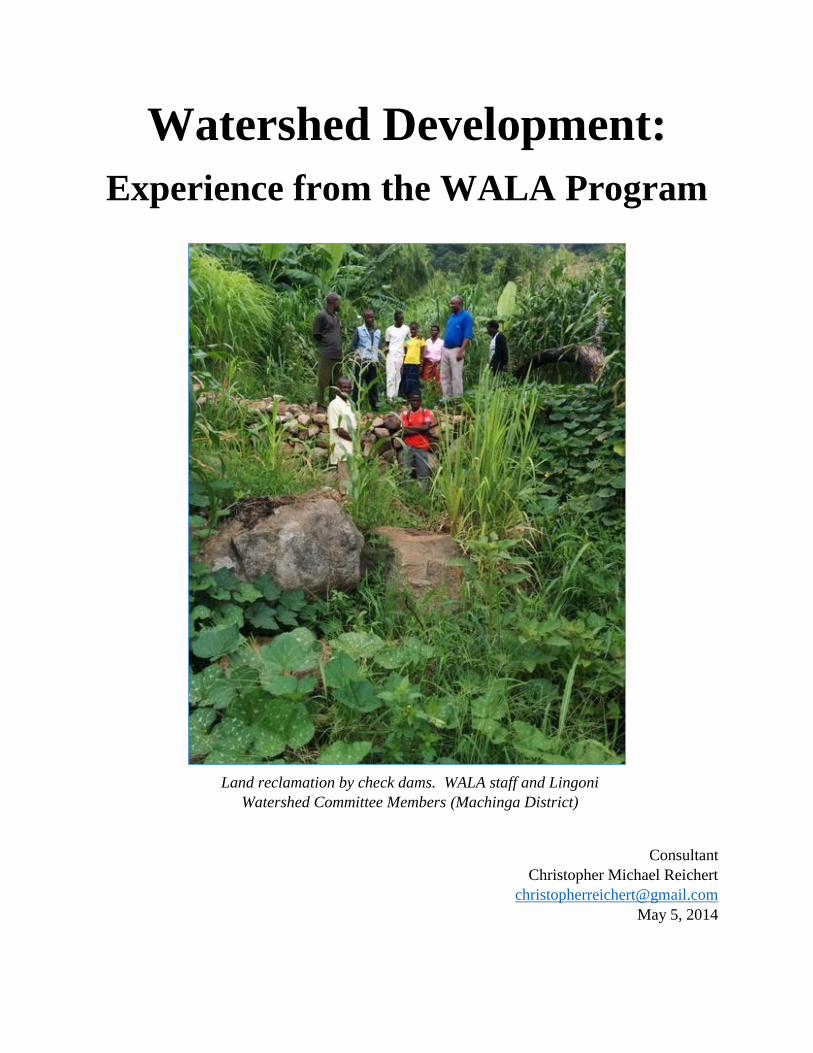
Land reclamation by check dams. WALA staff and Lingoni
Watershed Committee Members (Machinga District)
Executive Summary
WALA Watershed Synopsis. The Wellness and Agriculture for Life Advancement program
(WALA) is a five-year $81m1 food security program funded by USAID’s Food for Peace office.
WALA is led by Catholic Relief Services (CRS) and implemented by a consortium of Private
Voluntary Organizations (PVOs), including ACDI/VOCA, Africare, Chikwawa Diocese,
Emmanuel International, Project Concern International, Total Land Care, and World Vision.
WALA’s goal is to improve the food security of nearly 215,000 chronically food insecure
households across eight Southern Malawi districts by mid-2014.
WALA’s chronically food insecure households typically cultivate the most marginal land, which
often is characterized by slopes prone to severe erosion. In marginal lands, water capture is
more difficult, soils rapidly erode, and productivity subsequently declines. Since a centimeter of
topsoil takes 100 years2 to form, erosion control is paramount to soil and livelihoods protection.
Therefore, WALA has implemented watershed management activities in 32 areas across eight
districts. Over three years, WALA selected communities, formed watershed committees, trained
technical staff, mapped watersheds with GIS technology, and facilitated construction of
watershed treatments. WALA treated 2,883 hectares with 1,981 km of erosion control
measures,3 or over three times the length of Lake Malawi.4 The watershed treatments included:
water absorption trenches (33 km), continuous contour trenches (919 km), stone bunds (318 km),
check dams (333), marker ridges (377 km), and 339,336 planted trees. WALA invested over
$2.2m in Food For Work (FFW) incentives representing a cost of $1.11 per structure-meter.5
Objectives and Outputs. The main objective of the WALA Watershed study was to document
two main pieces, the WALA Watershed approach and achievements, and the community and
staff perceptions of the watershed benefits and results. Specific tasks included: literature
reviews, stakeholder interviews, site visits, and mini-learning workshop facilitation. The core
products included the watershed learning event, WALA Watershed Report, and WALA
Watershed Synopsis Prezi.
Methodology. Over 13 days, the consultant employed qualitative methods6 interviewing 88
people with a semi-structured interview guide7 in key informant interviews or informal focus
groups.8 In-depth interviews conducted with 16 WALA and PVO staff, five external Subject
1 WALA Mid-Term Evaluation Report, April 2012. 2 Manual: Natural Resource Management: Basic concepts and strategies, page 36. In-depth interview, Agriculture
and Environment Senior Tech Advisor. February 12, 2014. However, topsoil may take up to 500 years to form.
(Wikipedia). 3 Figure includes: water absorption trenches, continuous contour trenches, stone bunds, check dams, and marker
ridges. 4 Wikipedia.com. Length of Lake Malawi is 580 km. 5 Ibid 3. To obtain USD figures for this report, Malawian Kwacha was converted using the midpoint value average
rounded to nearest Kwacha for the month of February 2014 (424 per USD on www.oanda.com) 6 When possible the qualitative data was complemented and augmented by quantitative data. 7 See Annex 1. Watershed Interview Guide. Note that this guide was the interview team’s high-level tool rather than
a script or checklist. 8 A complete list is found in Annex 2. List of Contacts by Name, Organization and Title.
Matter Experts, and one government staff member.9 Over the course of six days, the interview
team (WALA Irrigation Technical Quality Coordinator and consultant) visited five of the 32
watersheds in four PVOs, which represented nearly one-fifth of the watershed area, by
hectares.10 The focus group team conducted five semi-structured focus group discussions with
the Watershed Development Committees (67 people, 30 of whom were female).
Observations. The report is structured into three main themes including: behavior change,
technological diffusion and impact. Behavior change required for watershed development has
occurred through technological adoption and examples were observed of non-FFW-driven
sustainability. Committees have developed a continuum of rules and regulations enforced
through a decentralized, self-regulated system. Finally, both supply and demand-driven
technological diffusion was reported from WALA watershed areas to non-project areas.
Impact focused on three areas11: land reclamation, yield increases, and a rising water table.
First, land reclamation was linked to check dam construction in farm fields and in the wider
community. Farm field gulley reclamation translated to material gains in arable land. The most
visible evidence was found in Lingoni Watershed, where a series of nearly twenty 12m check
dams had already reclaimed a two-meter deep barren gulley, and farmers had cultivated half of
the gulley.
Second, watershed infrastructure was tied to increased yields because of increased moisture and
water retention, principally through water absorption trenches and continuous contour trenches.
A female committee member summarized the overall responses, “Before the treatments, dry
spells would take over half my yield, and I’d reap five bags of maize. But now, during the last
dry spell, my field yielded eight bags of maize.”
Third, communities reported a rising water table and additional surface water encompassing:
village streams, deep bore hole wells, and shallow wells. Streams that formally dried up were
now perennials. In most communities, bore holes and shallow wells were now perennial. Two-
year quantitative time-series data from the Makande Watershed (Chavala District) corroborates
the community’s observations. From October 2011 to October 2013, the stream’s flow rate
nearly tripled12 and the two observation wells’ metrics increased by 49 and 64%, respectively.13
9 Only one government member was interviewed due to the scope, detail and level of data that was desired. The
intent was to focus on the PVO and community’s data and perceptions of the WALA watershed interventions. 10 The visited areas constituted 616 hectares of the 2,833 treated hectares, or 22%. 11 Although there were several other impacts cited by communities, these three were the most cited, by the most
respondents across both females and males. 12 Data: Oct 2011 3.2 L/s to Oct 2013 9.1 L/s. 13 Data for Oct 2011 to Oct 2013: Observation well #1 (low on the watershed) was 50.5 cm to 82.8 cm, or 63.4%.
Observation well #2 (high on the watershed) rose from 39 cm to 57.9 cm, or 48.5%.

Acronyms/glossary
ACDI/VOCA Agricultural Cooperative Development International and Volunteers in
Overseas Cooperative Assistance
CATCH Consortium Administration and Technical Coordination Hub
CCT Continuous Contour Trench
CRS Catholic Relief Services
EI Emmanuel International
FFP Food for Peace
FFW Food for Work
GoM Government of Malawi
GVH Group Village Headman (Oversees several Village Headmen)
LDF Local Development Fund
M&E Monitoring and Evaluation
PCI Project Concern International
PVO Private Voluntary Organization (synonym: International Non-
governmental Organization)
ROI Return on Investment
SCI Save the Children International
SOW Scope of Work
TA Traditional Authority (governmental level above GVH)
TLC Total Land Care
USAID United States Agency for International Development
Vetiver Chrysopogon zizanioides a perennial grass of the Poaceae family, planted
to protect watersheds
WALA Wellness and Agriculture for Life Advancement program
WAT Water Absorption Trench
WOTR Watershed Organisation Trust (India)
WVI World Vision International

Table of Contents
Executive Summary 2
Acronyms/glossary 4
Table of Contents 5
Objectives and Methodology 6
Watershed Treatments 8
Observations 11
Behavior Change 11
Technological Adoption 11
Sustainability 13
Guarding the Commons 14
Technological Diffusion 16
Supply-Driven (Autonomous and Facilitated) 16
Demand-Driven (Voluntary and Remunerated) 17
Impact 18
Land Reclamation 18
Increased Crop Yield 20
Rising Water Table 21
Monitoring & Evaluation 23
Top Learning Points 24
List of boxes, tables and graphs
Table 1. List of Watershed Sites Visited 7
Box 1. Water Absorption Trench Innovation 8
Box 2. Affecting Change: Watershed Committee and Trees 10
Box 3. Associating Apiculture and Agroforestry 11
Box 4. Opportunity Costs: “Is deforested land worth less than forested?” 13
Box 5. Allocating Return on Investment – Reclaimed Land 20
Graph 1. Makande Observational Well and Flow Rate from Apr 2011 to Feb 2014 21
Annexes
1. Watershed Interview Guide
2. List of Contacts by Name, Organization and Title
3. Summary of Watershed Treatments, Area Treated and Total Cost, by PVO
4. Makande Watershed Rainfall Data and Graph
5. Makande Observation Well and Flow Rate Data and Graph
6. WALA Watershed Learning Mini-Workshop Agenda
7. WALA Watershed M&E Form
Objectives and Methodology
The main objective of this report was to document the WALA watershed approach and
achievements, and the community and staff perceptions of the watershed benefits and results. The
core products and services included: watershed learning event facilitation, the report “Watershed
Development: Experience from WALA Program,” and the WALA Watershed Prezi. The scope
of the consultancy focused on formative learning and synthesis of achievements rather than an
evaluation or operations research.
The methodology encompassed seven activities:
1) Literature review (internal and external documentation and resources);
2) Introductory and background interviews (Watershed Organization Trust) Consultant, CRS
Southern Africa Regional Office Agriculture and Environment Senior Technical Advisor,
CRS watershed technical staff, Haiti Watershed Program Manager and a former Tanzania
Watershed Program Manager);
3) In-depth interviews (PVO staff, WALA CATCH staff, and the Mulanje Government of
Malawi Agroforestry Assistant District Forestry Officer for Extension);
4) Five semi-structured focus group discussions with Watershed Committees (67 members,
30% female);
5) Five watershed site visits in four PVOs;
6) Consolidation of watershed outputs14 (See Annex 3 Summary of Watershed Treatments,
Area Treated and Total Cost, by PVO;
7) WALA Watershed Sharing and Learning Event.
Site visit duration ranged from six to nine hours (from February 20 – 26, 2014) in Makande
(Chivala District), Chigwirizano (Thyolo District), Mitumbira (Mulanje District), Domasi (Zomba
District), and Lingoni (Machinga District). The five watersheds visited covered 616 hectares of
treated land, representing more than one-fifth of all the treated WALA hectares (2,833). The
visited watershed areas were heterogeneous, categorized as bushveld rocky terrain, farmland, or
farmland contiguous to forest. The data collection team (consultant and WALA Irrigation
Technical Quality Coordinator) divided the field work into three phases, in-depth interviews with
PVO technical field staff, physical treatment/watershed inspection, and semi-structured focus
group discussions with the Watershed Committee.
A WALA Watershed mini-workshop was conducted on February 28, 2014 for 19 people,
including: 14 PVO technical staff, three CATCH staff, and two WALA Senior Management
Team. The workshops objectives were to: share observations from the watershed data collection,
conduct watershed learning exchange, and identify key Monitoring and Evaluation (M&E)
strengths/gaps. (See Annex 6. WALA Watershed Learning Mini-Workshop Agenda)
14 Although, out-put level M&E data was maintained at the PVO or watershed level, the data had not been
consolidated and aggregated to the WALA program level.

Table 1. List of Watershed Sites Visited (in chronological order)
PVO Watershed
Name
District
Name
Attributes Treatments Hectares
treated
Chikwawa
Diocese
Makande Chavala Bushveld,
including non-
cultivated areas
Water Absorption
Trench (WAT),
Continuous Contour
Trench (CCT), stone
bunds, check dams,
trees, Vetiver
217
WVI Chigwirizano Thyolo Farmland,
surrounded by tea
estates
WAT, CCT, stone
bunds, check dams,
trees, Vetiver
141
Africare Mitumbira Mulanje Farmland CCT, stone bunds, check
dams, marker ridges,
trees, Vetiver
80
Emmanuel
International
Domasi Zomba Adjacent to
highly degraded
forest
CCT, stone bunds, check
dams, trees
43
Emmanuel
International
Lingoni Machinga Adjacent to
partially intact
forest
WAT, CCT, stone
bunds, check dams,
trees, Vetiver
135
Watershed Treatments
This section summarizes the WALA watershed treatments
(see Annex 3), provides a description of each treatment, and
describes how WALA employed FFW. This is a snapshot of
WALA’s treatments rather than a list of technical
specifications found in the reference documents. WALA
used three main reference sources: 1) WOTR – Training for
WALA on Micro-watershed Development, 2) WALA
Watershed Guidelines, and 3) Rainwater Harvesting:
Technical Field Manual on Rainwater Harvesting. WALA
developed watershed treatments drawn primarily from the
WOTR technical guide. However, some treatments were
modified and simplified to the Malawian context, often
aligned to the Malawi Government’s Watershed manual.
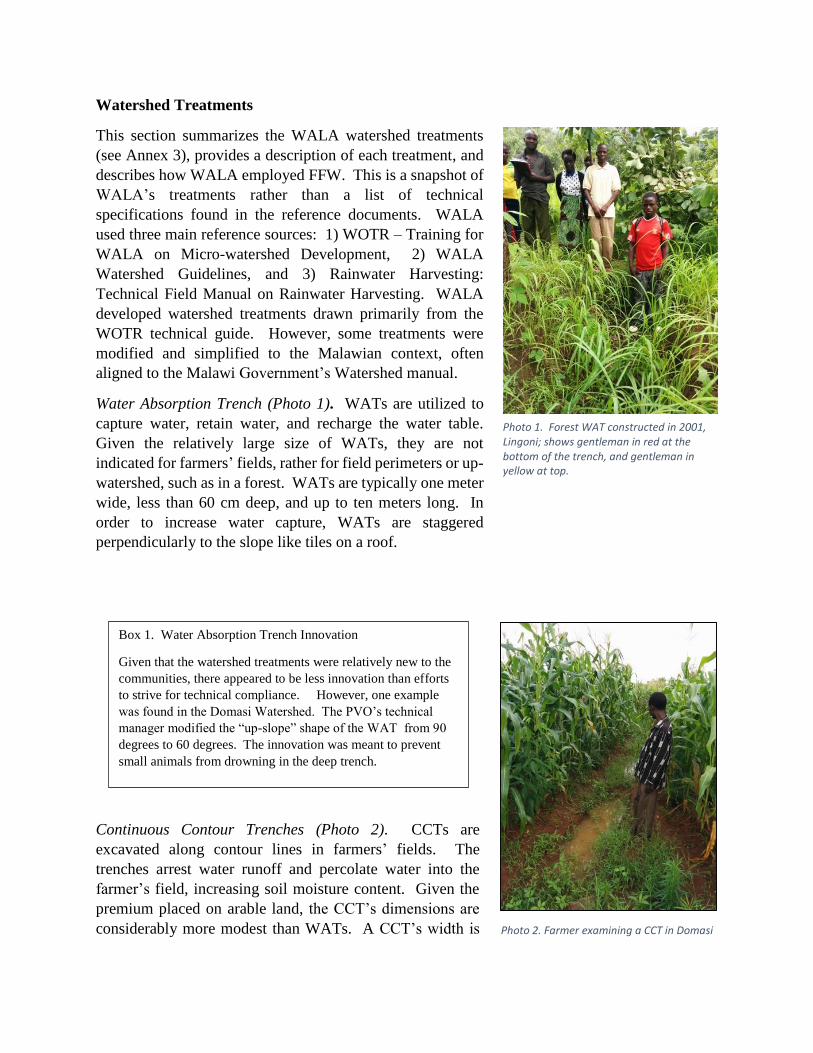
Water Absorption Trench (Photo 1). WATs are utilized to
capture water, retain water, and recharge the water table.
Given the relatively large size of WATs, they are not
indicated for farmers’ fields, rather for field perimeters or up-
watershed, such as in a forest. WATs are typically one meter
wide, less than 60 cm deep, and up to ten meters long. In
order to increase water capture, WATs are staggered
perpendicularly to the slope like tiles on a roof.
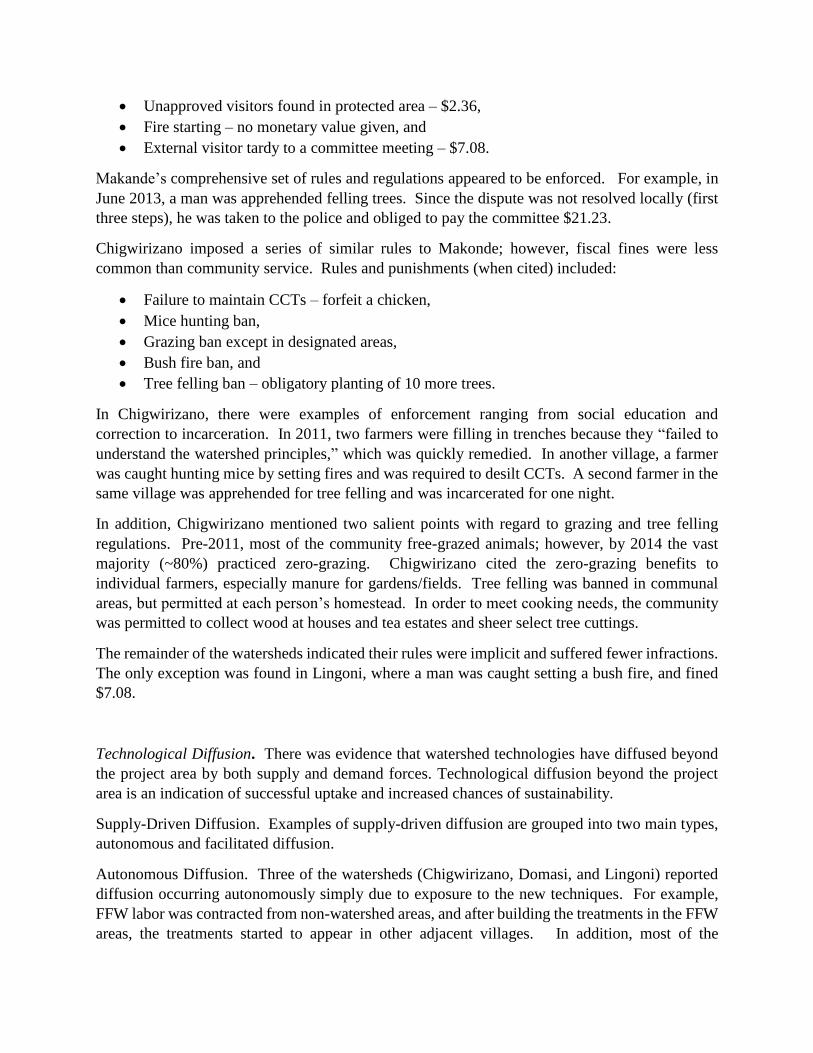
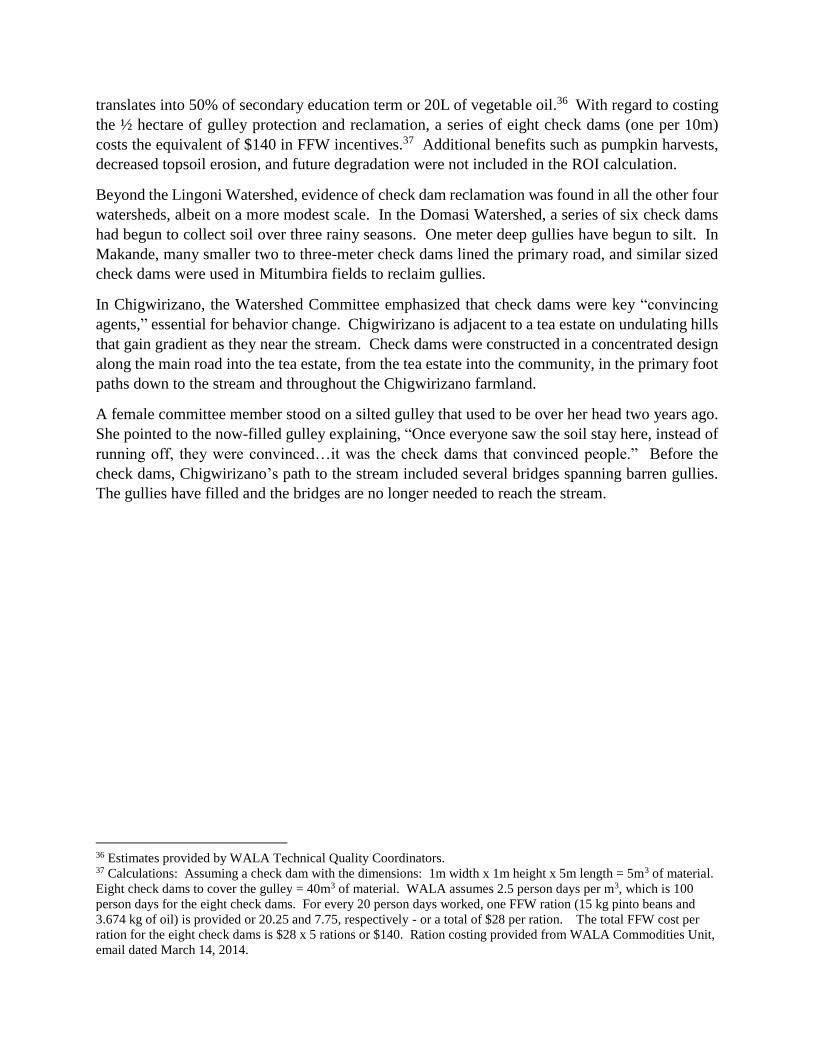
Continuous Contour Trenches (Photo 2). CCTs are
excavated along contour lines in farmers’ fields. The
trenches arrest water runoff and percolate water into the
farmer’s field, increasing soil moisture content. Given the
premium placed on arable land, the CCT’s dimensions are
considerably more modest than WATs. A CCT’s width is
Photo 1. Forest WAT constructed in 2001, Lingoni; shows gentleman in red at the bottom of the trench, and gentleman in yellow at top.
Photo 2. Farmer examining a CCT in Domasi
Box 1. Water Absorption Trench Innovation
Given that the watershed treatments were relatively new to the
communities, there appeared to be less innovation than efforts
to strive for technical compliance. However, one example
was found in the Domasi Watershed. The PVO’s technical
manager modified the “up-slope” shape of the WAT from 90
degrees to 60 degrees. The innovation was meant to prevent
small animals from drowning in the deep trench.

30 cm and depth is between 30 and 60 cm.15 A crucial structural component is the CCT berm,
which reduces lateral water movement every five meters. Without the berm, the CCT’s integrity
is compromised and may lead to unintended gullies in the field.
Stone Bunds (Photo 3). Stone bunds are low rock walls following a slope’s contour. The semi-
permeable barriers slow runoff rate, filter water,
and spread water over a treated field. Where a
plethora of loose stone is available, stone bunds
are an indicated treatment. Typically stone bunds
are a meter high and wide, and the length depends
on the landscape. The critical construction issue
is to ensure large boulders form the foundation
using smaller stones as fill. Over time, a once
stone filled slope may morph into arable terraced
farmland.
Check Dams (Photo 4). Check dams are basic
stone walls, or plugs, erected in eroded gullies or
adjacent to footpaths and roads, in order to
reclaim trenches or prevent gully formation. The
specifications of the check dams must be suited
to the locality, particularly the flow rate. Most of
the WALA check dams’ dimensions are between
50 cm and 150 cm in height and up to 150 cm in
width. Lengths varies considerably, but most are
between two and twelve meters. In a relatively
short period (one to two rainy seasons), gullies can
be reclaimed either in a protected forest or in
farmland.
Marker ridges. A marker ridge refers to the
construction of crop ridges following a contour.
The ground along a contour is level as such water
stays in situ. Planting ridges are constructed along
the contour line at a recommended spacing of 75
cm. The main purpose of marker ridges is to hold
the water within the field, allowing more water to
percolate into the soil, thereby increasing soil
moisture and recharging the ground water aquifer.
Vetiver grass is planted on the contour marker
ridge to arrest run-off velocity and reduce erosion.
15 The Malawi CCT specifications differs from the WOTR guidelines, as WOTR indicates a 60 cm x 60 cm trench.
Photo 3. Members of the Makande Watershed Committee standing on a stone bund.
Photo 4. Members of the Watershed Committee standing on a large (~12m) check dam reclaiming a barren gulley, Lingoni

Afforestation (Photo 5). WALA afforestation
activities include the raising and transplanting of
trees (indigenous), fruit trees and grass.
Afforestation assists in ground water recharging
through increased cover and soil retention. In
WALA, the most common indigenous species
planted were the Cassod Tree,16 Lebbeck Tree,17
and the Accacia polylicatha (Mthethe). The most
common propagated fruit trees were mango,
papaya, banana and peach.18 Finally, Vetiver
grass was raised in nurseries and transplanted
throughout the watershed. Vetiver grass grows
quickly and reduces erosion along embankments
or reinforces watershed treatments.
Watershed Treatments and the Role of FFW. The WALA watershed approach utilized FFW as
an incentive to communities for the watershed construction. The incentive consisted of one ration
for every 23 days of work (three and four hours/day), of which 15% was considered the
community’s in-kind contribution. Each ration was comprised of 15 kg of pinto beans and 3.674
kg of vegetable oil, valued at $28.19 WALA assumed an average of “2.5 person days” to erect
16 Senna siamea 17 Albizia lebbeck (Mtangatanga) 18 The Watershed Committees did not track tree survival rates, a recommendation that is found in the M&E section.
Anecdotally, three communities stated a survival rate of between 50-70%. 19 Ration costing provided from WALA Commodities Unit, email March 14, 2014.
Photo 5. Tree nursery in Domasi
Box 2. Affecting Change: Watershed Committee and
Trees
Examples were encountered exhibiting how watershed
committees have affected change above and beyond
their community. For example, in Chigwirizano, the
community’s stream originates and passes through the
Makwasa Tea Estate. The tea estate’s stream was lined
by a myriad of Eucalyptus trees, planted primarily for
fast growing timber, but known also for its insatiable
thirst relative to indigenous species. After WALA’s
watershed trainings, Chigwirizano met with the
Makwasa Tea Estate advocating supplanting of the
Eucalyptus trees with alternatives. Starting in December
2012, the tea estate began felling the Eucalypts trees,
replacing them with mahogany and pine.
Pull out quote.
“My child pointed to an indigenous fruit and
asked me, ‘what are these’?
My child had never tasted our own indigenous
fruits before.” – Makande Committee Member

one cubic meter, thus after one month (23 person days of work) nearly 10m3 of structure20 was
constructed with one ration. WALA conducted FFW-incentivized construction during the dry
season –the six months when farmers were less occupied with cultivation.
Observations
The observation section is divided into three parts
behavior change, technological diffusion and impact. Behavior change includes three themes:
technological adoption, sustainability and guarding the commons. The impact section focuses on
three themes: land reclamation, increasing yields and rising water tables. Finally, the diffusion
section covers how the watershed treatments and approach have spread from project areas to non-
project areas including supply-driven and demand-driven forces.
Behavior change (adoption, sustainability and guarding the commons). Given that the watershed
approach and treatments were relatively new as a concentrated effort in the selected areas, behavior
change was critical. How communities adopted watershed technologies, how they viewed
sustainability and how they enforced the new rules, were essential.
Technological Adoption. In the watersheds visited, three main types of farmers were found: early
adopters, mainstream adopters, and refusers. With regards to the early adopters, watershed
treatment adoption rates were fairly homogenous save one positive outlier. The majority of early
adoption rates (four of the five watersheds) were approximately 50 - 70%; and one community
reported near complete adoption of watershed technologies. Most communities employed an opt-
out model (four of the five watersheds), in which farmers could refuse treatments, even though
20 Figures: 23 days divided by 2.5 person days per 1m3 = 9.2 m3.
Photo 6. One of six bee hives in Lingoni Watershed.
Box 3. Associating Apiculture and Agroforestry (Photo 6).
All visited sites either had plans to introduce, or recently started,
apiculture. The most advanced pilot was found in the Lingoni
Watershed. Lingoni has a tripartite structure: indigenous forest,
timber-bearing forest (primarily Eucalyptus), and farmland. In
2012, WALA staff trained and equipped 18 community members
to manage six beehives over the last year. The group hired a
local carpenter ($7.07 per hive) to replicate a model hive from
Mulanje District. Using goat dung fires, two harvests yielded
10L of honey per harvest per hive, or a total of 120 liters per year.
The group sold the honey from the six hives on the local market
for $5.66 per liter or a total first year revenue of $675.25. In
addition to the possible revenue and plans to expand the pilot,
the Watershed Committee members highlighted the importance
of how apiculture protects the forest from tree felling since
apiculture requires trees for hanging hives and flowers to
pollinate. Another member added that people fear bees, which
also helps protect the forest.

this may weaken the ridge to valley model. Most of communities reported that those farmers that
were not part of the early adopters became mainstream adopters in the subsequent season.
The watershed structures were considered community-based assets, but households were expected
to maintain the structures within their respective fields. Although a comprehensive maintenance
survey was not conducted, approximately half of the visited treatments were either in good
working order or clearly maintained. The other half exhibited signs of degradation (mostly dams
partially-fallen or silted CCTs) or clear lack of maintenance (only a very few). The most common
critical issue encountered was lack of CCT maintenance as some trenches were nearly filled or
filling with soil.21
On the lower end of the adoption rate continuum, Watershed Committee members highlighted that
the main resistance factor for the adoption refuser was low risk tolerance. A female member said,
“Our farmers are very conservative.” Another stated, “Few farmers want to try new things
independently.” There was no consistent refuser profile. Older and younger and male and female
farmers, tended to refuse equally. However, the committee mentioned that the younger farmer
refusers were most likely heavily influenced by their parents. A Mitumbira watershed committee
member summarized a core refuser complaint, “Farmers complain because the treatments
[especially the CCTs] take space from their field, and they think these structures disturb the land.”
WALA attempted to mitigate this concern by allowing farmers to reduce the CCT’s width from
60cm to 30cm (see treatment section for more).
One watershed reported near 100% adoption, which was attributed to senior leadership precedent.
In the Lingoni Watershed, Machinga, the Traditional Authority in Chamba insisted that his field
be treated before all other fields. The Watershed Committee boisterously exclaimed, “Since the
TA’s field received the treatments first, nobody could refuse!” and declared, “Unlike others, we
had no problems with farmers accepting the treatments.”
Although there may be negative consequences with this top-down approach, the Lingoni watershed
did not encounter adoption issues reported in the other areas. Possible negative effects could
include technical implications and program’s benefit distribution. For example, the TA’s field
should have been sequenced latter as it was “down-watershed,” hence possibly weakening the
ridge to valley approach if up-watershed was insufficiently treated. The sense of the interview
team, was that the positive precedence with regard to a new technology requiring behavior change
through technological adoption outweighed the negative aspects (with the caveat that the ridge-to-
valley approach remain intact).
21 This observation indicated that post-project follow-up and/or verification could be a critical component.

Sustainability. One key development issue is sustainability, particularly once external incentives
cease. All communities purported continued treatment construction (without FFW) and
maintenance (of FFW-created structures). However, only Mitumbira provided clear evidence of
organized watershed reporting and planning. During the site visit, Mitumbira provided a
comprehensive flip-chart presentation to the data collection team, including: a Mitumbira
Watershed map, detailed achievements of all treatments per year, the committee structure, and a
detailed implementation plan for 2014. Mitumbira presented evidence (targets) that they were
planning significant non-FFW activities, both in specific watershed treatments, and non-watershed
activities, such as road building. For 2014, Mitumbira plans over 91 km of structures, including:
CCTs (over 20 km), stone bunds (18 km), Vetiver (25 km) and marker ridges (28 km). (Photos 8
and 9)
Photo 7. One farmer disagreed with the Watershed Committee and cleared his land in Domasi.
Box 4. Opportunity Costs: “Is deforested land worth less
than forested?” (Photo 7).
Although the WALA processes for community
engagement1 focused on inclusion, education and
mobilization, there was one example encountered in
which a farmer felt threatened by the watershed approach.
In Domasi, a farmer disagreed to the watershed concept
and the overall idea of conservation. A Watershed
Committee member recalls the farmer an saying, “If trees
are what you want, if there are no trees, you can’t manage
my land.” He cut them down, as he feared the community
would usurp his decision-making power and potentially
his land. Fortunately, the Watershed Committee
discussed the issues with him and he stopped just shy of
the ridge, thus sparing at a small strip of land at the top of
the ridge.
Photo 8. Mitumbira’s Watershed plan for 2014. Photo 9. Mitumbira’s Watershed structure and achievements.

Of the watershed’s visited, Mitumbira was unique in the sense that the community pro-actively
and unilaterally requested the watershed interventions. Mitumbira community members saw the
pilot village and were exposed to watershed theory through Field Days. (See diffusion section)
This explained, at least in part, the higher level of organization and commitment observed in
Mitumbira.
Although the other four watersheds cited non-FFW (new) treatment construction and on-going
maintenance of FFW-supported treatments, there was a paucity of evidence compared to
Mitumbira. Some small counter examples were given. In Chigwirizano, an older female
watershed committee member said she has constructed new CCTs in her field with the help of her
sons. All Watershed Committees reported they sporadically visit farmer’s fields in order to help
ensure maintenance is continued. In general, non-FFW outputs are not tracked. One committee
member stated flatly, “We thought these records were for WALA only.”
Aside from the Mitumbira example, the greatest evidence of watershed sustainability was found
through sheer technological diffusion beyond the project areas. (See Diffusion section)
Guarding the Commons. All of the communities visited had created watershed regulatory systems
meant to guard the commons. The control systems are characterized by self-defined membership
fees, watershed rules and decentralized enforcement mechanisms. Regulatory infractions passed
through an escalation algorithm, summarized in four steps, (including the approximate frequency
of its use):
1. The watershed committee discussed the issue and attempted conflict resolution together
with the alleged. (most common)
2. If unsatisfactory, the village headman was involved. (several examples)
3. If unsatisfactory, the Group Village Headman was consulted. (uncommon)
4. The police were involved. (rare)
Rules and punishments ranged from explicit in Makande and Chigwirizano to more implicit in
Mitumbira, Domasi and Lingoni.22 The most comprehensive set of rules and punishments was
found in Makande including a mix of cash fines and community service. The committee referred
to their watershed as “a protected area.”
Watershed membership infractions and fees included:
Membership fee – 49 cents,
Member tardy to meeting – 24 cents, and
Inebriated at meeting – 24 cents and dismissed.
Watershed infractions included:
Tree felling – goat payment and planting seedlings,
Breaking CCTs – $1.79,
22 Rules and regulations were not documented, but the committee was clear on the detail.
Unapproved visitors found in protected area – $2.36,
Fire starting – no monetary value given, and
External visitor tardy to a committee meeting – $7.08.
Makande’s comprehensive set of rules and regulations appeared to be enforced. For example, in
June 2013, a man was apprehended felling trees. Since the dispute was not resolved locally (first
three steps), he was taken to the police and obliged to pay the committee $21.23.
Chigwirizano imposed a series of similar rules to Makonde; however, fiscal fines were less
common than community service. Rules and punishments (when cited) included:
Failure to maintain CCTs – forfeit a chicken,
Mice hunting ban,
Grazing ban except in designated areas,
Bush fire ban, and
Tree felling ban – obligatory planting of 10 more trees.
In Chigwirizano, there were examples of enforcement ranging from social education and
correction to incarceration. In 2011, two farmers were filling in trenches because they “failed to
understand the watershed principles,” which was quickly remedied. In another village, a farmer
was caught hunting mice by setting fires and was required to desilt CCTs. A second farmer in the
same village was apprehended for tree felling and was incarcerated for one night.
In addition, Chigwirizano mentioned two salient points with regard to grazing and tree felling
regulations. Pre-2011, most of the community free-grazed animals; however, by 2014 the vast
majority (~80%) practiced zero-grazing. Chigwirizano cited the zero-grazing benefits to
individual farmers, especially manure for gardens/fields. Tree felling was banned in communal
areas, but permitted at each person’s homestead. In order to meet cooking needs, the community
was permitted to collect wood at houses and tea estates and sheer select tree cuttings.
The remainder of the watersheds indicated their rules were implicit and suffered fewer infractions.
The only exception was found in Lingoni, where a man was caught setting a bush fire, and fined
$7.08.
Technological Diffusion. There was evidence that watershed technologies have diffused beyond
the project area by both supply and demand forces. Technological diffusion beyond the project
area is an indication of successful uptake and increased chances of sustainability.
Supply-Driven Diffusion. Examples of supply-driven diffusion are grouped into two main types,
autonomous and facilitated diffusion.
Autonomous Diffusion. Three of the watersheds (Chigwirizano, Domasi, and Lingoni) reported
diffusion occurring autonomously simply due to exposure to the new techniques. For example,
FFW labor was contracted from non-watershed areas, and after building the treatments in the FFW
areas, the treatments started to appear in other adjacent villages. In addition, most of the

Watershed Committees were composed of watershed villagers themselves; however, in one
watershed (Lingoni), the committee was purposely composed of people from other villages. Over
the course of three years, autonomous diffusion had started. In both examples of autonomous
diffusion, the committee were unable to describe the scale of the diffusion.
Project-Facilitated Diffusion. Diffusion was facilitated through WALA’s project activities,
specifically the Field Days, Review Meetings, and learning exchanges. Field Days and Review
Meetings were systemic processes to WALA’s operating model23; whereas, learning exchange
visits were ad hoc tailored to specific gaps. Africare is used as an example because the pilot
watershed24 was cited as less successful, but the visited watershed (Mitumbira) was more
successful. Mitumbira proactively requested the watershed intervention, which was primarily due
to the Field Days and Review Meetings.
Africare reported conducting eight Field Days25 over two years (2012 and 2013). At the field days,
Africare shared WALA’s activities from the community’s perspective. In a public space,
technologies were show-cased and the community was given an opportunity for question and
answer sessions. Africare invited the broader community but also targeted specific invitees such
as religious leaders, government officials, Group Village Headmen, village headman, and
influential people in the community.
The Field Days were designed for a wider audience whereas the Review Meetings focused on a
smaller audience at a higher level.26 Participants in the Review Meetings included a specific
community/committee, the GVH, and Africare. On a quarterly basis, Africare presented to the
Area Development Committee, conducted a question and answer session, and attended field visits.
Finally, WALA facilitated diffusion through learning exchange visits. For example, in December
2012 WALA organized a two-day exchange visit for twelve committee members to Save the
Children in Zomba. Four Mitumbira watershed committee members indicated that there were
technical problems in the Zomba watersheds:
WATs mimicked CCTs, thus they easily burst,
Check dams sagged in middle,
Stone bunds were too low (only 50cm high), and
Stone bund lacked structural integrity (large foundational stones weren’t filled with smaller
stones).
23 Interview with CATCH Irrigation, Agriculture, and Natural Resource Management Technical Quality
Coordinators. March 4, 2014. 24 The Africare Pilot Watershed was not visited. This information is taken from the key informant interview with
Africare. 25 Also called Open Days. 26 At the Traditional Authority Level.

Demand-Driven Diffusion. Several examples of unsolicited requests from non-watershed areas to
the watershed committees were noted. Most of the requests were for voluntary support, however,
in two instances remunerated technical support occurred. The remunerated technical support
indicated the relatively high value that was placed on the watershed skills.
Voluntary Diffusion. In Chigwirizano, the watershed committee was approached in August and
September of 2013. First, four farmers from an adjacent non-WALA village, called Chalingala (a
different GVH and different TA)27 stumbled upon the treatment construction and inquired if
Chigwirizano could teach them the treatments. Four committee members (secretary, executive
chair, technical chair, and a member) spent a few hours over three days including: meetings with
the village chief, technical theory teaching, and demonstration provision. Three farmers followed
the basic “ridge to valley” principle. However, one farmer (down-watershed) did not follow the
technical advice, and thus most of his treatments were washed away with the rains.
Remunerated diffusion.28 There were two examples from the Mulanje District highlighting how
the committee had monetized watershed knowledge. In both examples the Watershed Committees
were beneficiaries of Malawi’s Local Development Fund, which is a standardized and
decentralized financial mechanism.29
In August 2013, the Nkhonya Development Committee (non-project area) hired twenty people
from the Khoviwa Watershed Committee and Core Technical Team. Khoviwa trained and
mentored 180 Local Development Fund beneficiaries over twelve days in Mandozo Village. The
team demonstrated treatment construction techniques including: marker ridges, CCTs, stone
bunds, check dams and Vetiver grass planting. The participants were divided into four groups,
each group comprised of 50 beneficiaries, led by the Khoviwa team. The Local Development Fund
Program used Cash for Work to pay the watershed members and beneficiaries. Each beneficiary
received 93 cents per day, for a net transfer of $2,232. Construction output included: 3,600 CCTs,
420 check dams, ~ 9 km of Vetiver grass strips, ~29 km of marker ridges and over 12 km stone
bunds.30
In August and September 2013, three members31 of Namwalizaone Watershed provided technical
advice to beneficiaries of the Local Development Fund in Mtambo Village (Group Village
Headman Mthilamanja). Thuchila Extension Planning Area Government Officials hired
Namwalizaone to train the Local Development Fund beneficiaries. First, Namwalizaone trained
twelve people in CCTs and marker ridge construction. Then, the trained twelve members and the
three watershed members led the Sub Work Groups (200 Local Development Fund beneficiaries).
The leaders mentored their respective groups for 48 days. All beneficiaries received wages of 71
27 There was one report that the Watershed Committee received $11.79 for the three days of training; however, this
was not corroborated by the committee itself. 28 Both examples of the monetized diffusion come from Africare sites (Submitted March 7, 2014). 29 The goal of the LDF is to empower local communities to take part in the decision making process through
improved local governance and development management, in order to reduce poverty and improve services delivery. 30 The reports from the PVO did not provide uniform outputs as some are cited as total number and others in length. 31 The Farmer Extension Volunteer, Watershed Development Committee Secretary, and a Watershed Development
Committee member.
cents per day for a period of 48 days. Total outputs included 622 CCTs and 2,885 m of marker
ridges.
Impact. Three impacts were clearly cited by all committees: land reclamation, increased yields,
and a higher water table.
Land reclamation. Land reclamation was not only the most cited impact of watershed
management, but also the most visible impact in a relatively short period of time. During site
visits, stone bunds indicated signs of incipient terracing32 and check dams exhibited the most
amount of reclamation.
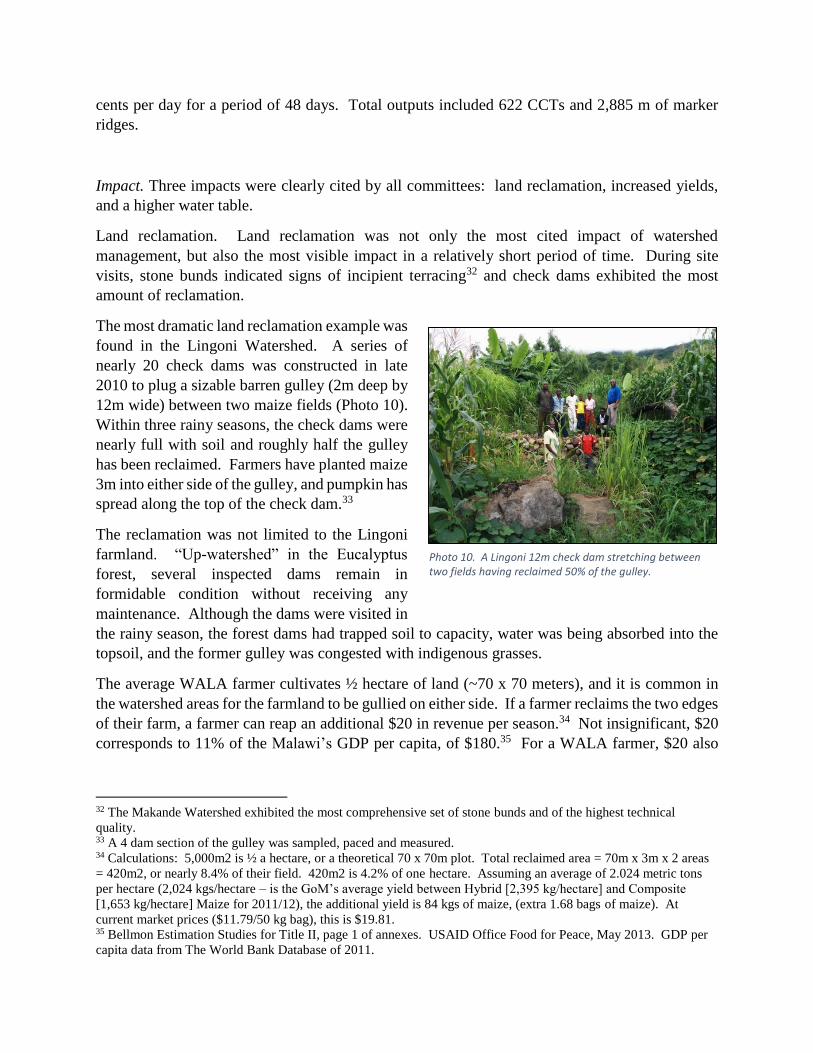
The most dramatic land reclamation example was
found in the Lingoni Watershed. A series of
nearly 20 check dams was constructed in late
2010 to plug a sizable barren gulley (2m deep by
12m wide) between two maize fields (Photo 10).
Within three rainy seasons, the check dams were
nearly full with soil and roughly half the gulley
has been reclaimed. Farmers have planted maize
3m into either side of the gulley, and pumpkin has
spread along the top of the check dam.33
The reclamation was not limited to the Lingoni
farmland. “Up-watershed” in the Eucalyptus
forest, several inspected dams remain in
formidable condition without receiving any
maintenance. Although the dams were visited in
the rainy season, the forest dams had trapped soil to capacity, water was being absorbed into the
topsoil, and the former gulley was congested with indigenous grasses.
The average WALA farmer cultivates ½ hectare of land (~70 x 70 meters), and it is common in
the watershed areas for the farmland to be gullied on either side. If a farmer reclaims the two edges
of their farm, a farmer can reap an additional $20 in revenue per season.34 Not insignificant, $20
corresponds to 11% of the Malawi’s GDP per capita, of $180.35 For a WALA farmer, $20 also
32 The Makande Watershed exhibited the most comprehensive set of stone bunds and of the highest technical
quality. 33 A 4 dam section of the gulley was sampled, paced and measured. 34 Calculations: 5,000m2 is ½ a hectare, or a theoretical 70 x 70m plot. Total reclaimed area = 70m x 3m x 2 areas
= 420m2, or nearly 8.4% of their field. 420m2 is 4.2% of one hectare. Assuming an average of 2.024 metric tons
per hectare (2,024 kgs/hectare – is the GoM’s average yield between Hybrid [2,395 kg/hectare] and Composite
[1,653 kg/hectare] Maize for 2011/12), the additional yield is 84 kgs of maize, (extra 1.68 bags of maize). At
current market prices ($11.79/50 kg bag), this is $19.81. 35 Bellmon Estimation Studies for Title II, page 1 of annexes. USAID Office Food for Peace, May 2013. GDP per
capita data from The World Bank Database of 2011.
Photo 10. A Lingoni 12m check dam stretching between two fields having reclaimed 50% of the gulley.
translates into 50% of secondary education term or 20L of vegetable oil.36 With regard to costing
the ½ hectare of gulley protection and reclamation, a series of eight check dams (one per 10m)
costs the equivalent of $140 in FFW incentives.37 Additional benefits such as pumpkin harvests,
decreased topsoil erosion, and future degradation were not included in the ROI calculation.
Beyond the Lingoni Watershed, evidence of check dam reclamation was found in all the other four
watersheds, albeit on a more modest scale. In the Domasi Watershed, a series of six check dams
had begun to collect soil over three rainy seasons. One meter deep gullies have begun to silt. In
Makande, many smaller two to three-meter check dams lined the primary road, and similar sized
check dams were used in Mitumbira fields to reclaim gullies.
In Chigwirizano, the Watershed Committee emphasized that check dams were key “convincing
agents,” essential for behavior change. Chigwirizano is adjacent to a tea estate on undulating hills
that gain gradient as they near the stream. Check dams were constructed in a concentrated design
along the main road into the tea estate, from the tea estate into the community, in the primary foot
paths down to the stream and throughout the Chigwirizano farmland.
A female committee member stood on a silted gulley that used to be over her head two years ago.
She pointed to the now-filled gulley explaining, “Once everyone saw the soil stay here, instead of
running off, they were convinced…it was the check dams that convinced people.” Before the
check dams, Chigwirizano’s path to the stream included several bridges spanning barren gullies.
The gullies have filled and the bridges are no longer needed to reach the stream.
36 Estimates provided by WALA Technical Quality Coordinators. 37 Calculations: Assuming a check dam with the dimensions: 1m width x 1m height x 5m length = 5m3 of material.
Eight check dams to cover the gulley = 40m3 of material. WALA assumes 2.5 person days per m3, which is 100
person days for the eight check dams. For every 20 person days worked, one FFW ration (15 kg pinto beans and
3.674 kg of oil) is provided or 20.25 and 7.75, respectively - or a total of $28 per ration. The total FFW cost per
ration for the eight check dams is $28 x 5 rations or $140. Ration costing provided from WALA Commodities Unit,
email dated March 14, 2014.

Increased crop yields. All visited watersheds reported crop
yields had increased after the development of the watershed
treatments.
In Chigwirizano, increased crop yields were framed as a
function of food availability and market prices. A female
committee member stated, “As of August we’d usually have
to buy food to supplement our stores, but now only one in
ten households buys food in the lean season.” Her colleague commented, “The price of maize has
decreased during the lean season. We used to spend $2.36 for five kg of maize (e.g. was in 2010)
to supplement our own maize. But now during lean seasons the price has dropped to $1.06 per
five kg.”
In addition to crop yields increasing, one committee spoke specifically to yield resiliency. In
Mitumbira, a female committee member explained, “Before we had CCTs and check dams, the
seasons with dry spells would take over half my yield, and I’d get only five bags of maize. But
now, during the last dry spell, my field yielded eight bags of maize.”
In Mitumbira, a community member in her late 50s linked conservation agriculture and watershed
activities. She said, “My yield without conservation agriculture and contours was one bag of
maize, and now with two seasons of conservation agriculture and watershed treatment, I get up to
eight bags, and this year I am expecting ten bags.” Her colleague added, “Our crops used to get
washed away before the watershed treatments helped us control water.”
Additional related watershed benefits were highlighted, but not by all communities. Makande and
Mitumbira explicitly linked increased food security with nutritional outcomes, “Our children are
healthier,” and “We have more fruits and vegetables.” Chigwirizano has proactively internalized
the idea of basic comparison plots. The committee chair pointed to three different plots and stated,
“You can see the difference between no CCT, CCTs only and CCT + conservation agriculture.”
Photo 11. As land is reclaimed, conflicts may occur on how to divide the ROI. One farmer destroyed part of the check so that “his claim” included the gulley.
Box 5. Allocating Return on Investment – Reclaimed Land (Photo
11)
There were a of couple examples indicating that although land was
reclaimed from gullies, the allocation of that ROI could be
problematic. In communities, barren gullies are often used for
property delineation. A reclaimed gulley is reclaimed arable land,
and thus a created surplus resource. In Mitumbira, a long gulley
was in the process of being reclaimed. Check dams had reduced
the depth of the gulley by half. One farmer altered the check dam
so the water would flow along his neighbor’s land, thus asserting
his claim to the new arable land.
Rising Water Table. Although only two communities (Makande and Lingoni) explicitly used the
terms “rising water table,” all communities referenced at least one impact on water availability,
such as stream flow, bore hole water availability or shallow well water availability.
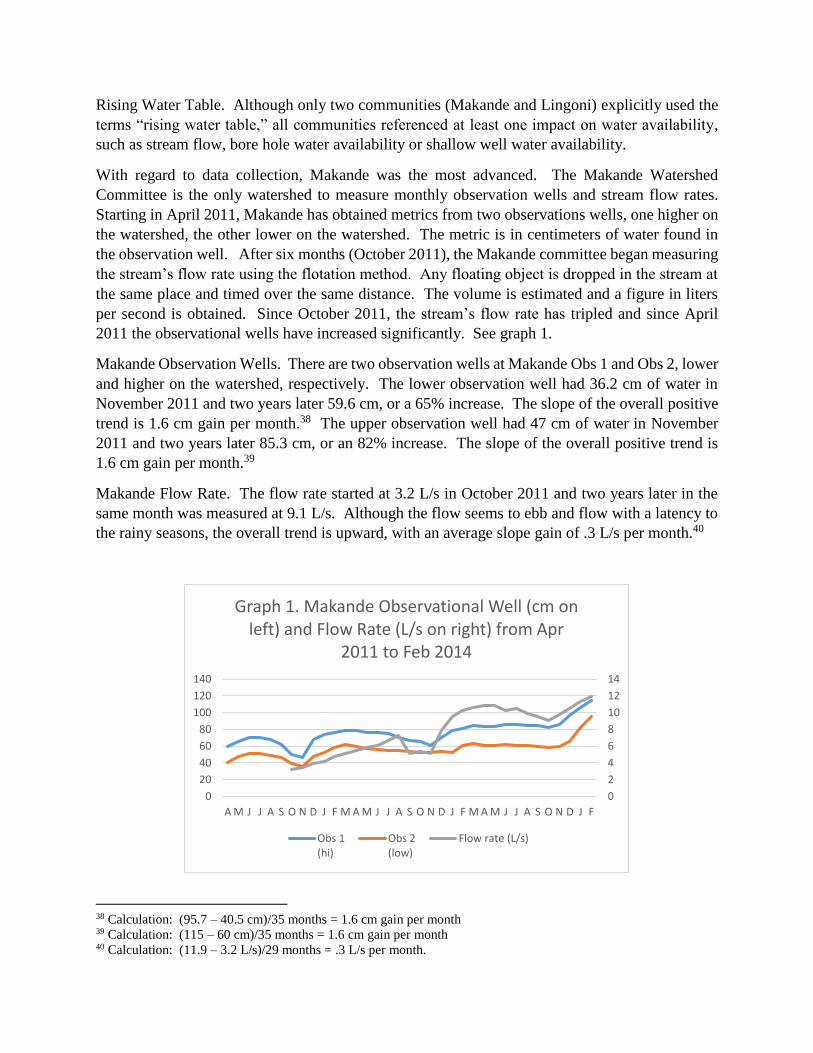
With regard to data collection, Makande was the most advanced. The Makande Watershed
Committee is the only watershed to measure monthly observation wells and stream flow rates.
Starting in April 2011, Makande has obtained metrics from two observations wells, one higher on
the watershed, the other lower on the watershed. The metric is in centimeters of water found in
the observation well. After six months (October 2011), the Makande committee began measuring
the stream’s flow rate using the flotation method. Any floating object is dropped in the stream at
the same place and timed over the same distance. The volume is estimated and a figure in liters
per second is obtained. Since October 2011, the stream’s flow rate has tripled and since April
2011 the observational wells have increased significantly. See graph 1.
Makande Observation Wells. There are two observation wells at Makande Obs 1 and Obs 2, lower
and higher on the watershed, respectively. The lower observation well had 36.2 cm of water in
November 2011 and two years later 59.6 cm, or a 65% increase. The slope of the overall positive
trend is 1.6 cm gain per month.38 The upper observation well had 47 cm of water in November
2011 and two years later 85.3 cm, or an 82% increase. The slope of the overall positive trend is
1.6 cm gain per month.39
Makande Flow Rate. The flow rate started at 3.2 L/s in October 2011 and two years later in the
same month was measured at 9.1 L/s. Although the flow seems to ebb and flow with a latency to
the rainy seasons, the overall trend is upward, with an average slope gain of .3 L/s per month.40
38 Calculation: (95.7 – 40.5 cm)/35 months = 1.6 cm gain per month 39 Calculation: (115 – 60 cm)/35 months = 1.6 cm gain per month 40 Calculation: (11.9 – 3.2 L/s)/29 months = .3 L/s per month.
0
2
4
6
8
10
12
14
0
20
40
60
80
100
120
140
A M J J A S O N D J F M A M J J A S O N D J F M A M J J A S O N D J F
Graph 1. Makande Observational Well (cm on left) and Flow Rate (L/s on right) from Apr
2011 to Feb 2014
Obs 1(hi)
Obs 2(low)
Flow rate (L/s)
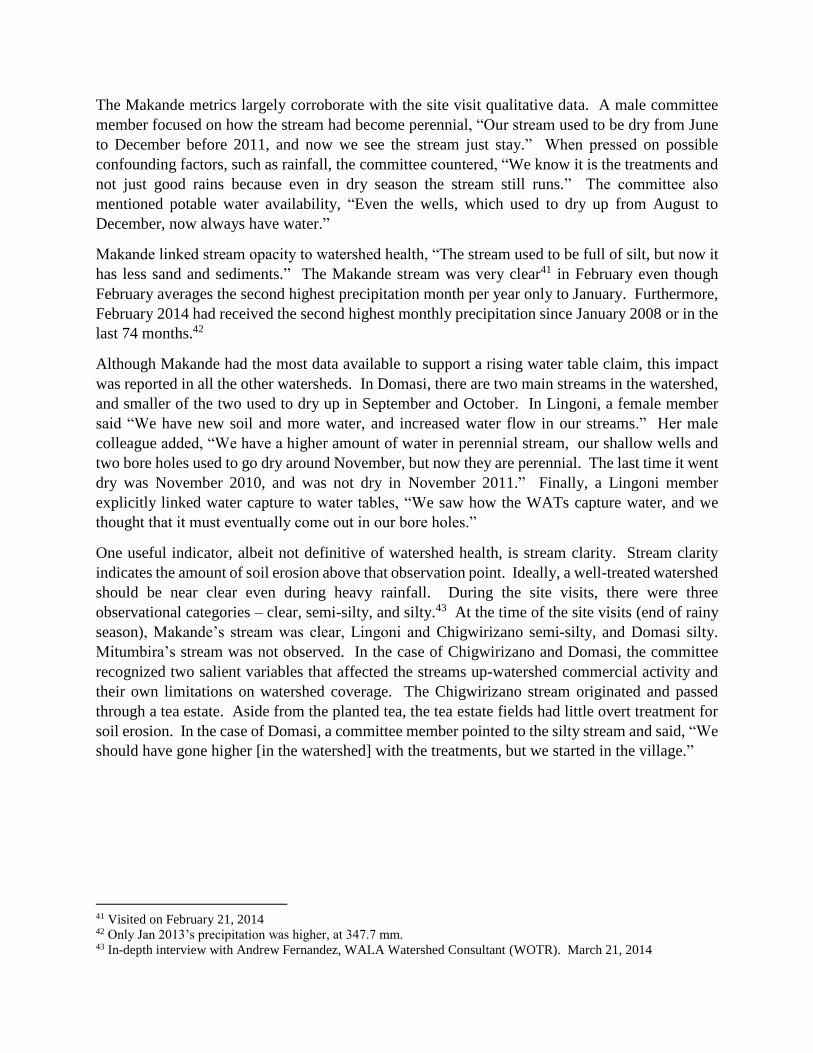
The Makande metrics largely corroborate with the site visit qualitative data. A male committee
member focused on how the stream had become perennial, “Our stream used to be dry from June
to December before 2011, and now we see the stream just stay.” When pressed on possible
confounding factors, such as rainfall, the committee countered, “We know it is the treatments and
not just good rains because even in dry season the stream still runs.” The committee also
mentioned potable water availability, “Even the wells, which used to dry up from August to
December, now always have water.”
Makande linked stream opacity to watershed health, “The stream used to be full of silt, but now it
has less sand and sediments.” The Makande stream was very clear41 in February even though
February averages the second highest precipitation month per year only to January. Furthermore,
February 2014 had received the second highest monthly precipitation since January 2008 or in the
last 74 months.42
Although Makande had the most data available to support a rising water table claim, this impact
was reported in all the other watersheds. In Domasi, there are two main streams in the watershed,
and smaller of the two used to dry up in September and October. In Lingoni, a female member
said “We have new soil and more water, and increased water flow in our streams.” Her male
colleague added, “We have a higher amount of water in perennial stream, our shallow wells and
two bore holes used to go dry around November, but now they are perennial. The last time it went
dry was November 2010, and was not dry in November 2011.” Finally, a Lingoni member
explicitly linked water capture to water tables, “We saw how the WATs capture water, and we
thought that it must eventually come out in our bore holes.”
One useful indicator, albeit not definitive of watershed health, is stream clarity. Stream clarity
indicates the amount of soil erosion above that observation point. Ideally, a well-treated watershed
should be near clear even during heavy rainfall. During the site visits, there were three
observational categories – clear, semi-silty, and silty.43 At the time of the site visits (end of rainy
season), Makande’s stream was clear, Lingoni and Chigwirizano semi-silty, and Domasi silty.
Mitumbira’s stream was not observed. In the case of Chigwirizano and Domasi, the committee
recognized two salient variables that affected the streams up-watershed commercial activity and
their own limitations on watershed coverage. The Chigwirizano stream originated and passed
through a tea estate. Aside from the planted tea, the tea estate fields had little overt treatment for
soil erosion. In the case of Domasi, a committee member pointed to the silty stream and said, “We
should have gone higher [in the watershed] with the treatments, but we started in the village.”
41 Visited on February 21, 2014 42 Only Jan 2013’s precipitation was higher, at 347.7 mm. 43 In-depth interview with Andrew Fernandez, WALA Watershed Consultant (WOTR). March 21, 2014

Monitoring and Evaluation
Based on an observed paucity of systematic, standardized and aggregated watershed M&E data,
WALA Watershed M&E should be strengthened. The aggregated output and impact data cited in
this report was consolidated and analyzed during the consultancy (see Annexes 3 through 5). For
M&E strengthening two types of recommendations should be considered, a minimal watershed
M&E system and a comprehensive M&E system, the former if no additional funding is acquired,
the latter if additional funding is secured.
Minimal M&E. The strategy for the minimal M&E should emphasize internal transfer of the
decentralized ad hoc M&E activity within WALA. Standardization and aggregation is less
important than ensuring each watershed committee has the basic management abilities to plan and
track achievements and basic impacts. Watershed planning and tracking systems should be taken
from Mitumbira and transplanted to the other watersheds. Mitumbira presented the sole cogent
evidence of planned 2014 watershed treatments without continued FFW support. Outputs
achieved and planned should be tracked. Impact data systems should be rolled out from Makande
to the other watersheds including three key data points: observational wells, stream flow rate and
rainfall. Makande has collected the first two data points for over two years and was able to source
the third data point in a timely manner. If training in the collection of rainfall data via rain gauges
is not possible, the watershed committee might collect and consolidate data from the closest
government station.
A summary of the minimum M&E indicators:
1. Watershed outputs planned and achieved, by watershed, bi-annually.
2. Observation well metrics, monthly
3. Flow rate metrics, monthly
4. Rainfall metrics, gathered daily and reported monthly.
Comprehensive M&E system. If the watersheds secure additional funding above and beyond the
current project, a more comprehensive and standardized M&E system should be considered. The
M&E system approach should include standardization, aggregation, and data quality mechanisms.
In additional to the set of M&E indicators above, the watershed technical staff are interested in
collecting: tree survival rates, vegetative cover over time, flooding (frequency and area covered),
fire (number of fires and area affected / burned), and small scale irrigation farming.44 Two
additional resources should be used to develop a more comprehensive M&E system if additional
funding is secured. WOTR developed an M&E form (see Annex 7) in late 2010 that was not
implemented. The M&E form should be adapted and honed to suit the new funding source. In
addition to this form, the WOTR training manual (Training for WALA on Micro-watershed
Development) includes a section on impact monitoring on page 122 in chapter IV.
44 Contributions of the WALA watershed technical staff during the watershed learning mini-workshop.

Top Learning Points
1. Communities Perceived Benefits of Watershed Management. The interviewed
communities uniformly perceived significant benefits of watershed management,
particularly, but not limited to land reclamation, increased productivity and increased
availability of water.
2. FFW Return on Investment and Scale-up. To construct over 1,980 km of erosion control
treatment, WALA invested $2.2m in Food For Work (FFW) incentives translating to a cost
of $1.11 per structure-meter. There was no evidence found that significant and
considerable scale-up is not possible, especially with integration of the issues raised in the
learning points.
3. Check Dam ROI. An average WALA farmer reclaiming gullies of their farm can reap an
additional $20 in revenue per season, or 11% of the Malawi’s GDP per capita ($180). For
a WALA farmer, $20 translates into 50% of secondary education term or 20L of vegetable
oil. This series of check dams costs the equivalent of $140 in FFW incentives, thus the
dams “pay for themselves” in seven seasons.
4. Local Development Fund Opportunity. In the Africare areas, the GoM has used the Local
Development Fund to hire Watershed Committees for technical training resulting in
diffusion of watershed technologies beyond WALA project areas. WALA should facilitate
cross learning between the GoM, Africare and other PVOs in order to scale up the use of
the Local Development Fund mechanism or other local funding options. Although beyond
the scope of this report, lessons from other sectors should be gleaned for application to
watersheds. In particular, WALA has substantial experience with the Private Service
Provider (PSP) approach in Savings and Internal Lending Communities (SILC) programs.
If Watershed Committees and or technical staff are able to charge for services to other
communities, this may be a source of sustainability.
5. Spreading Watershed Technologies. One community proactively requested watershed
treatments due to exposure to pilot village during Field Days. Of the five watersheds
visited, this community provided the most evidence of sustainable and autonomous
watershed work. Field Days should be continued as not only a learning tool but as a
marketing mechanism. Entirely new geographic project areas should create exposure
forums, such as Field Days so that watershed management is demanded proactively from
new villages.
6. Treatment Marketing and FFW Targeting. The Ridge to Valley approach encourages
complete treatment of a designated area starting with the upper most part of the watershed,
and this should continue. Given that the treatments are relatively new to most villages,
explicit marketing of particular treatments may have advantages. For example, of all the
treatments, check dams convinced communities in one rainy season that watershed
treatments are effective. Check dams provided quick wins for land reclamation translating

into palatable fiscal returns for farmers. Thus, one option may be to reserve use of FFW or
other incentives for the more physically challenging treatments that require longer time
frames for visible returns, such as stone bunds and afforestation. Another approach would
be to reserve FFW or tailor FFW to focus on the community-based treatments (e.g. WATs,
stone bunds, and indigenous afforestation) and use less FFW for treatments in individual
farmers (e.g. CCTs, check dams, and homestead fruit trees ).
7. Importance of Leadership Precedence. Although not the sole predictor of success, local
leadership is pivotal. When local leaders insisted that their fields be treated first,
subsequent adoption was less of an issue among other farmers. There was good evidence
that support from local leadership significantly increases adoption of watershed treatments
by farmers in the targeted areas. New watersheds should consider employing a similar
strategy to garner community support.
8. Incentives and Allocating ROI. Extrapolating from the amount of check dams created (330
km), a significant amount of gullied and barren land between fields were reclaimed.
Subsequent conflict has arisen in a few cases on how to divide the new arable land, a
tangible return on their investment in check dams. In order to avoid future conflict
watershed committees should define how returns from the treatments will be divided. It
may be that reclaimed land is simply divided between farmers, or it may be more prudent
to suggest another strategy that encourages individual ownership. For example, assigning
a farmer to an entire gulley and allocating all arable land reclaimed, would provide an
incentive for that farmer to not only construct check dams, but also to maintain the
structures. This may be a more cogent approach to link a farmer’s fiscal returns to their
individual investments.
9. Affecting Change: Committee Organization. There are examples of committee affecting
significant change and directing their own resources which may be partially controlled by
external bodies. Committees lobbied a large tea estate to replace Eucalyptus with Pine and
Mahogany. In addition, Watershed Committees stymied tree felling, field burning and
open-grazing. WALA should continue support to the Watershed Committees particularly
in two key areas: how to lobby at the community level and beyond the community level,
and how to better manage themselves. Although a significant and laudable amount of
output was noted, evidence the watershed’s capabilities to manage information and
planning was lackluster.
10. Contextualizing and Capturing Change. The Watershed Committees provided extensive
and credible detail as to how the treatments have impacted their lives; however, visual
documentation could be a useful tool in order to convince new communities of potential
impacts. This should not be limited to the community level, as the individual PVOs did
not capture before and after evidence.

11. M&E. Although there was a dearth of systematic and aggregated Watershed M&E
available, there was decentralized ad hoc M&E occurring within the program. WALA
should either spread the current ad hoc decentralized M&E activities (if no further funding
is secured) or scale up and scale out M&E (if further funding is secured). At a minimum,
Makande should train the other watersheds in observation well, flow rate and rainfall data
collection.
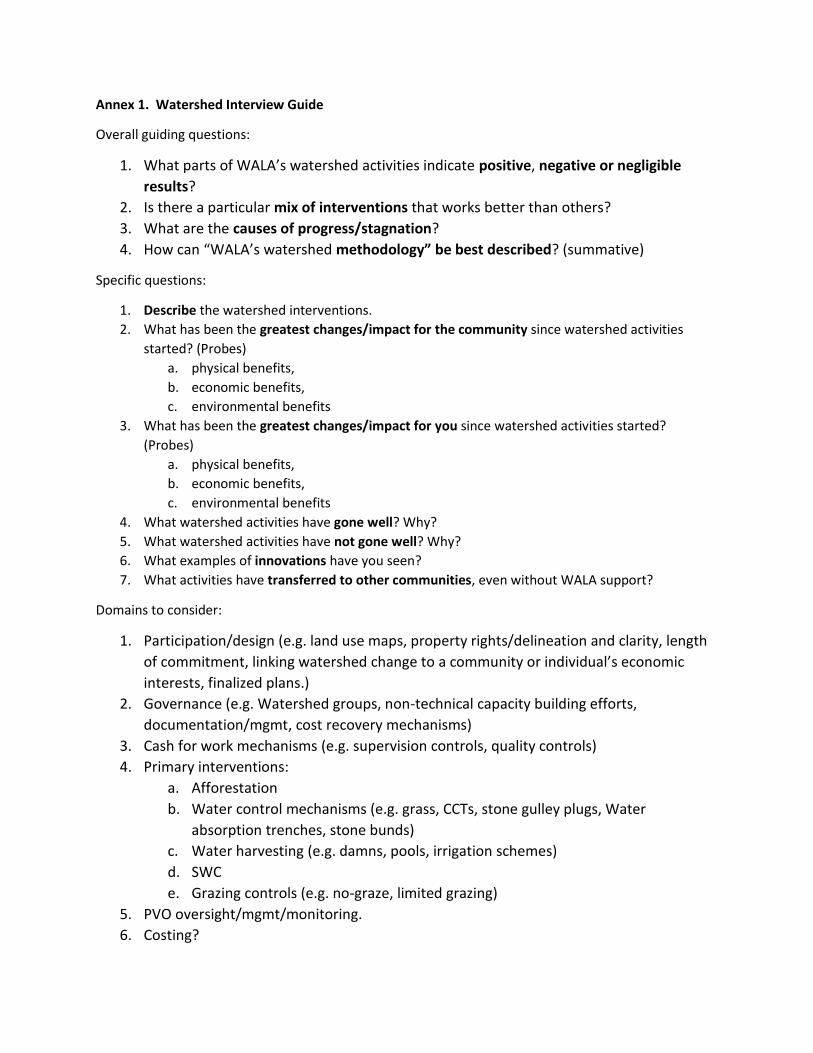
Annex 1. Watershed Interview Guide
Overall guiding questions:
1. What parts of WALA’s watershed activities indicate positive, negative or negligible
results?
2. Is there a particular mix of interventions that works better than others?
3. What are the causes of progress/stagnation?
4. How can “WALA’s watershed methodology” be best described? (summative)
Specific questions:
1. Describe the watershed interventions.
2. What has been the greatest changes/impact for the community since watershed activities
started? (Probes)
a. physical benefits,
b. economic benefits,
c. environmental benefits
3. What has been the greatest changes/impact for you since watershed activities started?
(Probes)
a. physical benefits,
b. economic benefits,
c. environmental benefits
4. What watershed activities have gone well? Why?
5. What watershed activities have not gone well? Why?
6. What examples of innovations have you seen?
7. What activities have transferred to other communities, even without WALA support?
Domains to consider:
1. Participation/design (e.g. land use maps, property rights/delineation and clarity, length
of commitment, linking watershed change to a community or individual’s economic
interests, finalized plans.)
2. Governance (e.g. Watershed groups, non-technical capacity building efforts,
documentation/mgmt, cost recovery mechanisms)
3. Cash for work mechanisms (e.g. supervision controls, quality controls)
4. Primary interventions:
a. Afforestation
b. Water control mechanisms (e.g. grass, CCTs, stone gulley plugs, Water
absorption trenches, stone bunds)
c. Water harvesting (e.g. damns, pools, irrigation schemes)
d. SWC
e. Grazing controls (e.g. no-graze, limited grazing)
5. PVO oversight/mgmt/monitoring.
6. Costing?

Annex 2. List of Contacts by Name, Organization and Title
Name Organization Title
Shane Lennon CRS Malawi WALA Chief of Party
Hazel Simpson CRS Malawi WALA Deputy Chief of Party - Programming
Jay Chandran CRS Malawi WALA M&E Officer
Juma Masumba CRS Malawi WALA Technical Quality Coordinator - Irrigation
David Nthakomwa CRS MalawiWALA Senior Project Officer - Agriculture & Natural
Resource Management
Wales Magumbi Africare MalawiWALA Technical Quality Coordinator - Agriculture and
Natural Resources Management
Solomon Chirwa Chikwawa DioceseIrrigation and Natural Resources Management
Coordinator
Evans Matthews Chikwawa Diocese Agriculture Tech Coordinator
Steven Kawaina Chikwawa Diocese Field Supervisor
Thokozani Banda WVI Agriculture Coordinator
Innocent Ntenjera Africare Agriculture Coordinator
Benjamin Muharu Africare Field Officer
Lucius Suwedi Africare Field Officer
Besta BandaMukhuna Africare Field Officer
Absalom Guluza Africare Agriculture Business Coordinator
Yobu Mkwinda Emmanuel International Irrigation and Watershed Development Coordinator
Mr. Bared Nangwale
Department of Forestry;
Improved Forestry for
Sustainable livelihoods
Program
Assistant District Forestry Officer for Extension
Makande Watershed Committee (23
people, 3 female)Chikwawa Diocese Executive and Technical Members
Chigwirizano Watershed Committee
(8 people, 4 female)WVI Executive and Technical Members
Mitumbira Watershed Committee
(18 people, 10 female)Africare Executive and Technical Members
Domasi Watershed Committee (10
people, 5 female)Emmanuel International Executive and Technical Members
Lingoni Watershed Committee (8
people, 3 female)Emmanuel International Executive and Technical Members
Geoff HeinrichCRS Southern Africa
Regional Office Agriculture and Environment Senior Technical Advisor
Ehsan Rizvi CRS LesothoFormer Program Manager of Tanzania Watershed
Activities
Kelli Mineard CRS HaitiIWRM Program Manager – Watersheds, DRR, Climate,
Emergency WaSH
Andrew Fernandez Independent Watershed Consultant
Dadi Legesse CRS EthiopiaAgriculture and Natural Resource Management Program
Manager
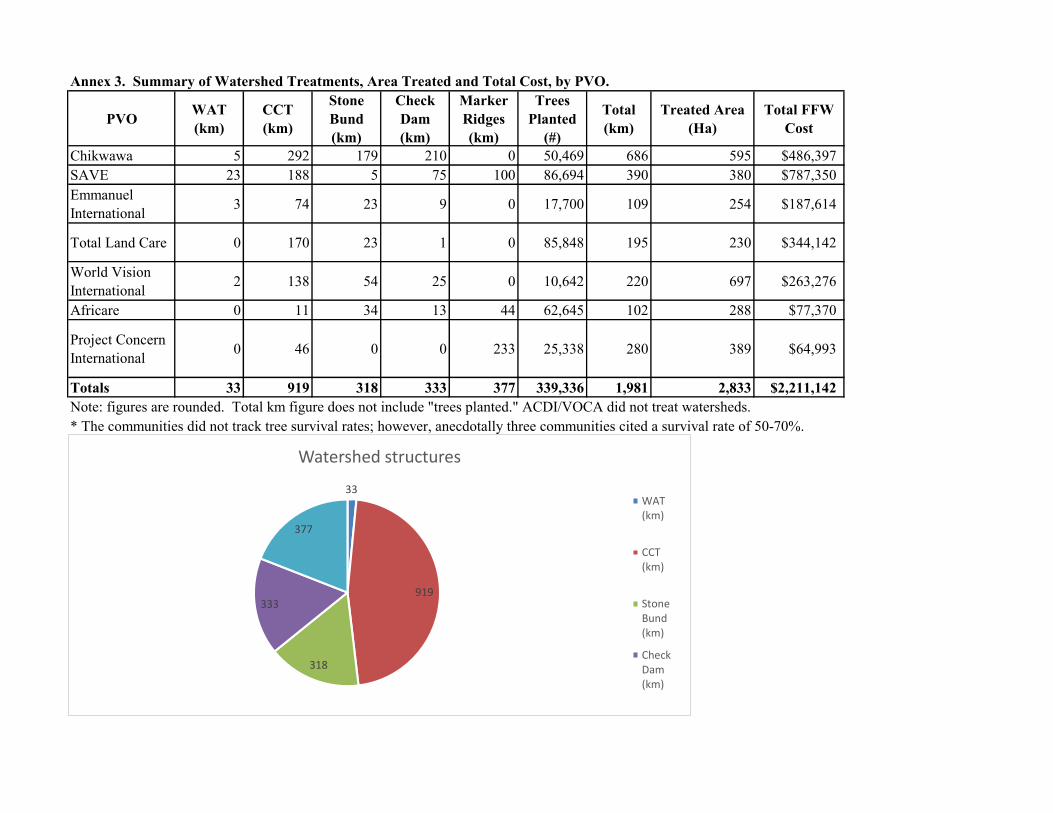
Annex 3. Summary of Watershed Treatments, Area Treated and Total Cost, by PVO.
PVOWAT
(km)
CCT
(km)
Stone
Bund
(km)
Check
Dam
(km)
Marker
Ridges
(km)
Trees
Planted
(#)
Total
(km)
Treated Area
(Ha)
Total FFW
Cost
Chikwawa 5 292 179 210 0 50,469 686 595 $486,397
SAVE 23 188 5 75 100 86,694 390 380 $787,350
Emmanuel
International3 74 23 9 0 17,700 109 254 $187,614
Total Land Care 0 170 23 1 0 85,848 195 230 $344,142
World Vision
International2 138 54 25 0 10,642 220 697 $263,276
Africare 0 11 34 13 44 62,645 102 288 $77,370
Project Concern
International0 46 0 0 233 25,338 280 389 $64,993
Totals 33 919 318 333 377 339,336 1,981 2,833 $2,211,142
Note: figures are rounded. Total km figure does not include "trees planted." ACDI/VOCA did not treat watersheds.
* The communities did not track tree survival rates; however, anecdotally three communities cited a survival rate of 50-70%.
33
919
318
333
377
Watershed structures
WAT(km)
CCT(km)
StoneBund(km)
CheckDam(km)
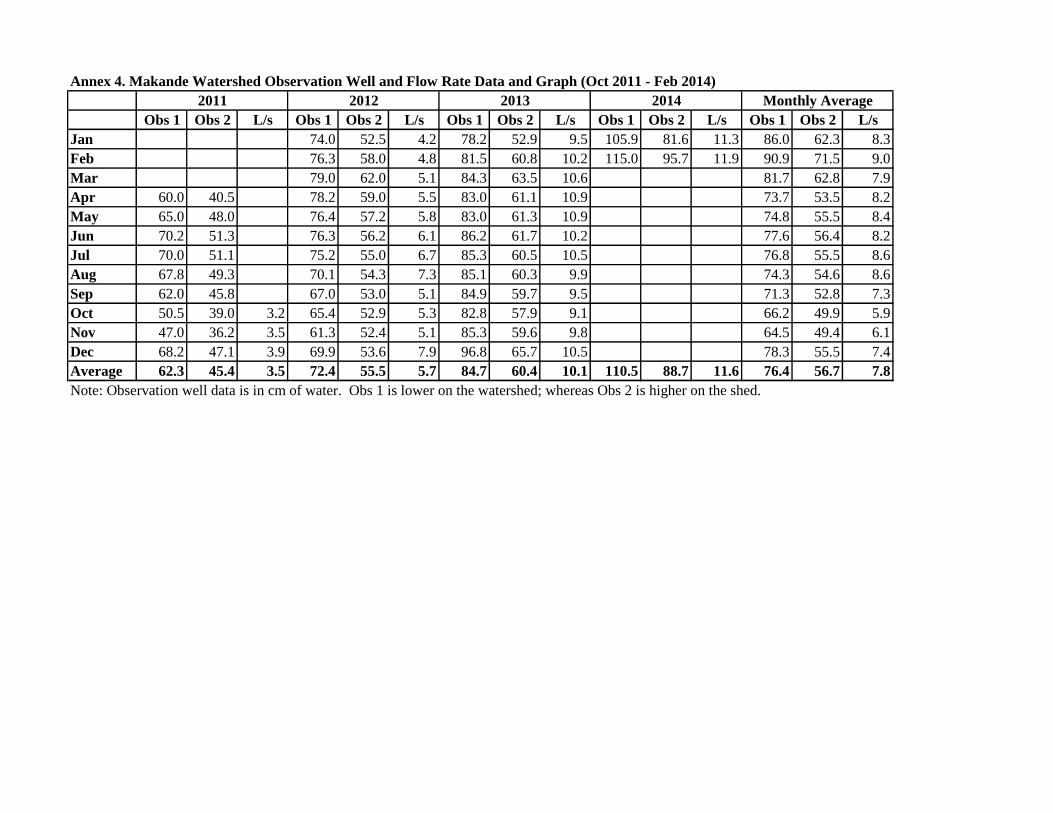
Annex 4. Makande Watershed Observation Well and Flow Rate Data and Graph (Oct 2011 - Feb 2014)
Obs 1 Obs 2 L/s Obs 1 Obs 2 L/s Obs 1 Obs 2 L/s Obs 1 Obs 2 L/s Obs 1 Obs 2 L/s
Jan 74.0 52.5 4.2 78.2 52.9 9.5 105.9 81.6 11.3 86.0 62.3 8.3
Feb 76.3 58.0 4.8 81.5 60.8 10.2 115.0 95.7 11.9 90.9 71.5 9.0
Mar 79.0 62.0 5.1 84.3 63.5 10.6 81.7 62.8 7.9
Apr 60.0 40.5 78.2 59.0 5.5 83.0 61.1 10.9 73.7 53.5 8.2
May 65.0 48.0 76.4 57.2 5.8 83.0 61.3 10.9 74.8 55.5 8.4
Jun 70.2 51.3 76.3 56.2 6.1 86.2 61.7 10.2 77.6 56.4 8.2
Jul 70.0 51.1 75.2 55.0 6.7 85.3 60.5 10.5 76.8 55.5 8.6
Aug 67.8 49.3 70.1 54.3 7.3 85.1 60.3 9.9 74.3 54.6 8.6
Sep 62.0 45.8 67.0 53.0 5.1 84.9 59.7 9.5 71.3 52.8 7.3
Oct 50.5 39.0 3.2 65.4 52.9 5.3 82.8 57.9 9.1 66.2 49.9 5.9
Nov 47.0 36.2 3.5 61.3 52.4 5.1 85.3 59.6 9.8 64.5 49.4 6.1
Dec 68.2 47.1 3.9 69.9 53.6 7.9 96.8 65.7 10.5 78.3 55.5 7.4
Average 62.3 45.4 3.5 72.4 55.5 5.7 84.7 60.4 10.1 110.5 88.7 11.6 76.4 56.7 7.8
Note: Observation well data is in cm of water. Obs 1 is lower on the watershed; whereas Obs 2 is higher on the shed.
2011 2012 2013 2014 Monthly Average

0
2
4
6
8
10
12
14
0
20
40
60
80
100
120
140
A M J J A S O N D J F M A M J J A S O N D J F M A M J J A S O N D J F
Makande Observational Well (cm on left) and Flow Rate (L/s on right) from Apr 2011 to Feb 2014
Obs 1(hi)
Obs 2(low)
Flow rate (L/s)

Annex 5. Makande Watershed Rainfall Data and Graph (Oct 2008 – Feb 2014, mm Rain)
Month 2008/9 2009/2010 2010/11 2011/12 2012/13 2013/14*Monthly
Average
Oct 16.4 0.0 0.0 14.9 3.5 40.0 12.5
Nov 1.2 76.3 79.2 26.7 14.6 35.6 38.9
Dec 135.5 54.4 167.2 83.5 90.3 103.8 105.8
Jan 85.5 72.2 89.2 289.9 347.7 177.3 177.0
Feb 51.6 214.9 39.4 20.0 328.8 330.1 164.1
Mar 190.8 21.8 161.6 101.1 9.9 97.0
Apr 47.8 58.1 53.5 78.7 13.7 50.4 `
May 10.5 26.5 3.4 19.9 10.5 14.2
Jun 5.0 7.3 0.5 13.2 8.7 6.9
Jul 21.3 26.4 17.0 0.0 0.0 12.9
Aug 2.4 37.9 2.7 0.0 10.0 10.6
Sep 0.0 0.3 0.0 0.0 58.1 11.7
Total 568.0 596.1 613.7 647.9 895.8 686.8 668.1
*Incomplete total for this year from Govt Malawi site ~30km from Makande.
0.0
50.0
100.0
150.0
200.0
250.0
300.0
350.0
400.0
O N D J F M A M J J A S O N D J F M A M J J A S O N D J F M A M J J A S O N D J F M A M J J A S O N D J F M A M J J A S O N D J F
Makande Rainfall Graph by Month (Oct 2008 - Feb 2014)

Annex 6. WALA Watershed Learning Mini-Workshop Agenda
Friday February 28, 2014 from 8h30 to 12h30; WALA Conference Room
Objectives:
1. To share observations from the Watershed data collection
2. To conduct watershed learning exchange (innovation/adaptations/diffusion)
3. To identify key M&E strengths/gaps carrying forward – how to measure WSD?
4. To clarify output data collection process
Participants: ~ 18 people
1. CATCH SMT, objective 1 especially, but invited for all
2. CATCH tech staff
3. PVO technical staff
4. Consultant
Agenda:
1. Intro/synopsis of SOW, 10 - 15 min, Shane or delegate (plenary)
2. Presentation of key observations, 20 min, Chris (plenary)
3. Discussion, 40 min, Juma (plenary – focused on observations, save contributions for #4)
4. Facilitated watershed learning focused on: innovation, adaptation, impact and diffusion domains,
60 min, Chris (World Café methodology)
5. Watershed M&E, 45 min (modified SWOT), Chris (plenary)
6. Watershed outputs discussion, 45 min, (small groups) Juma/Chris
7. Closing, 10 – 15 min, Shane or delegate (plenary)
Information req from PVO technical staff:
1. Bring available output level data per watershed – see attached EXCEL sheet
2. Conduct a quick buzz with office/community staff on: a) what innovations/adaptations have we
seen FROM the theory? b) what watershed diffusion have we seen from the watersheds to other
WALA or non-WALA areas? (be specific: who? What, when, how, why?)
3. Bring any pre-post pictures and videos that show watershed impact or watershed innovations

Annex 7. WALA Watershed M&E Form – original
PVO NAME
NAME OF THE WATERSHED:_____________________ LOCATION; TA:_______________________
DISTRICT:_______________ BEARING:____________________N:________________E:_______________
QUARTER:___________________________ YEAR:__________________
CONTACT PERSON: ______________________________
(NAME)
CELL: ____________________________
E-MAIL:_____________________________
PVO LOGO
WALA MICRO-WATERSHED OUTPUT & IMPACT MONITORING FORM

Watershed output and impact monitoring form-NOV 2010 Page 2
Description of output and impact indicators in watershed development
Preamble
This tool attempts to provide a systematic way of monitoring the impact of watershed development activities
implemented by different PVOs in the WALA program. The areas of concern mainly centre on the physical
parameters thus regular observation and some technical skills are required. In the recognition of the time it takes to
have significant results and appreciate the impacts of the watershed development activities, monitors must ensure
systematic and regular strategy to capture every bit of the impact of the activities initiated in their smallest form, hence
the development of the format. The format looks at different physical parameters as WSD indicatiors;
VIZ:
Indicator
(category)
Definition Purpose for collecting
data
Frequency Level of
collection
Soil and Water
Conservation
(SWC)
treatments
All physical structures
aimed at reducing the
water velocity to ensure
infiltration in order to
improve soil moisture
and recharge the
ground water as well as
soil erosion, e.g.
contour marker ridges,
continuous contour
trenches, water
absorption trenches,
etc.
These are the direct input of
the program to develop the
watershed in question. Their
number, length and area
coverage determine the extent
to which the watershed is
treated
Monthly Field level
Water flow
regime
Discharge of surface
water bodies (streams,
rivers) in l/sec
The discharge is affected by
the presence or absence of the
SWC treatments in a
watershed an increase in the
discharge is one of the
expected results (impact) of
watershed development
Monthly (8
months a
year)
Field level
Ground water
table
The depth of ground
water level from the
surface
The depth is affected by the
presence or absence of the
SWC treatments in a
watershed, a reduction in the
water depth is one of the
expected results (impact) of
Monthly (8
months a
year)
Field level

Watershed output and impact monitoring form-NOV 2010 Page 3
watershed development
Size of Irrigated
land and
frequency
- Holding other factors
constant, area brought under
irrigation and number of
irrigation times in a year is
dependent on the availability
of either surface or ground
water. The indicator is
therefore an impact of WSD
Annually PVO and field
level
Tree population
density
- Increase in number of trees
per unit area is an impact of
aforestation, an integral
activity in watershed
regeneration and their
conservation a sign of behavior
change of a community
towards watershed
development.
Twice a year PVO field
level
Rainfall trend Amount of rainfall
received in a year and its
distribution across the
months
It is an attribute to change in
water flow regime and the
level of ground water table; its
monthly and annual amount
is therefore an important
information to ascertain the
factors that lead to a change
in the water discharge and
levels.
Monthly Field level

Watershed output and impact monitoring form-NOV 2010 Page 4
INDICATOR ONE (OUTPUT): Soil and Water Conservation structures/treatments
WSD treatment Indicator
Area Number Length
Continuous contour
trenches (CCTs)
Water absorption
trenches (WATs)
Contour marker ridges
(CMRs)
Graded bunds
Ridge alignment
INDICATOR TWO (IMPACT): Water flow regime
Month Discharge (l/sec)
Year 1 Year 2 Year 3 Year 4
15 April
15 May
15 June
15 July
15 August
15 Sept

Watershed output and impact monitoring form-NOV 2010 Page 5
15 Oct
15 Nov
.
INDICATOR THREE (IMPACT): The level of the water table
Month Depth of ground water level from the surface (m)
Year 1 Year 2 Year 3 Year 4
15 April
15 May
15 June
15 July
15 August
15 Sept
15 Oct
15 Nov
INDICATOR FOUR (IMPACT): Irrigated land
ITEM DESCRIPTION PERIOD
Year 1 Year 2 Year 3 Year 4
Total irrigated area (Ha)
Number of irrigation times
INDICATOR FIVE (IMPACT): Tree population density due to regeneration
ITEM DESCRIPTION
Year 1 Year 2 Year 3 Year 4
April Oct April Oct April Oct April Oct
Population density (#/Ha)
Size of sampled patches (>15mx15m)
Common tree species noted

Watershed output and impact monitoring form-NOV 2010 Page 6
Rainfall trends
ITEM DESCRIPTION PERIOD (YEARS)
YR1 YR2 YR3 YR4
Total rainfall amount (mm)
Days of rainfall (#)
Average rainfall intensity (mm/Hr)