watershed analysis using gis
TRANSCRIPT

WATERSHED ANALYSIS
Using GIS

From Higherto lower
to lower …. etc

DEM
0
2
4
6
8
10
row0
24
68
10col
725
750
775
800
825
jen1_ele
740 760 780 800 820
jen1_ele
778 765 750 740 747 759 765 766 769 776 786 795
770 758 745 737 741 751 753 761 777 789 802 814
777 763 747 736 735 743 750 767 787 806 820 832
786 767 750 737 733 739 752 769 785 797 808 822
791 773 756 741 733 733 744 759 772 779 789 806
799 782 763 750 737 733 733 745 757 767 782 801
802 788 771 761 751 736 733 738 751 764 779 798
799 790 780 772 762 746 733 737 754 770 784 794
811 799 787 771 757 741 728 730 745 765 779 783
823 807 790 774 762 748 733 725 733 750 764 763
830 814 801 787 776 761 743 728 725 737 748 751
822 818 811 801 791 776 757 739 726 725 735 751

Fill Sinks:Removing Small imperfections in the data.
Sink
Fill to lowest
Neighboring cell
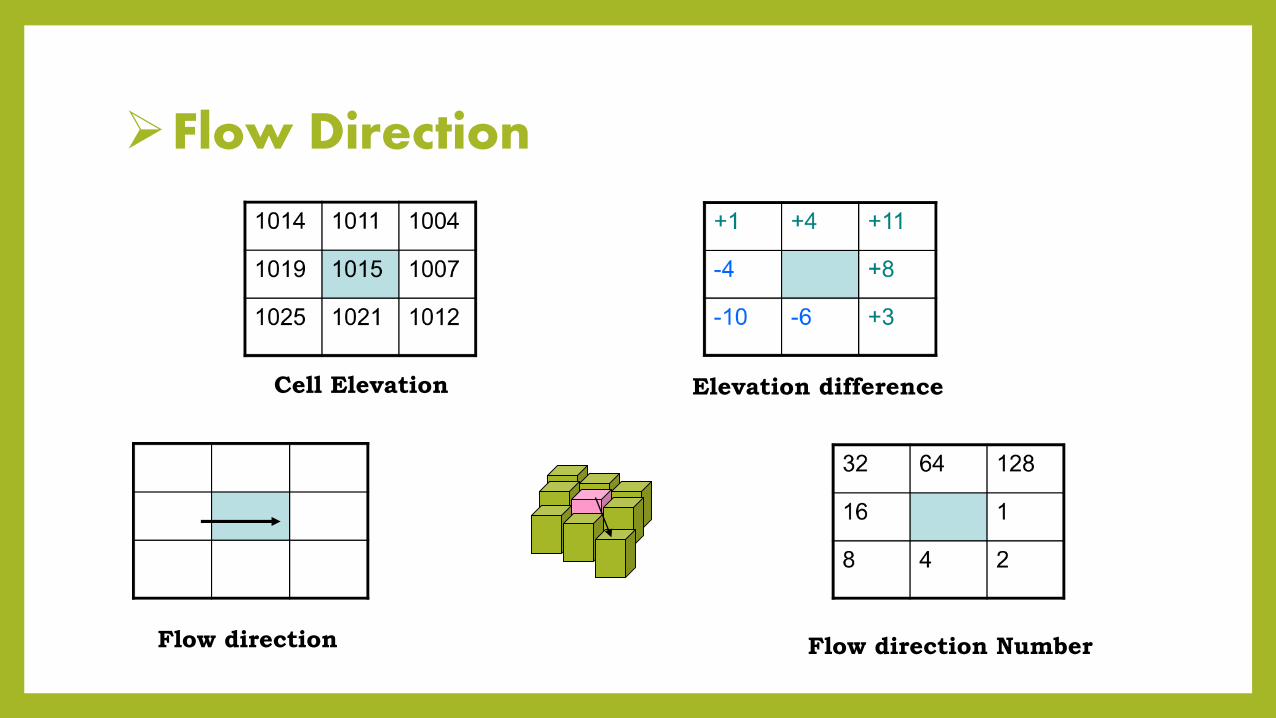
Flow Direction
Cell Elevation Elevation difference
Flow direction Flow direction Number
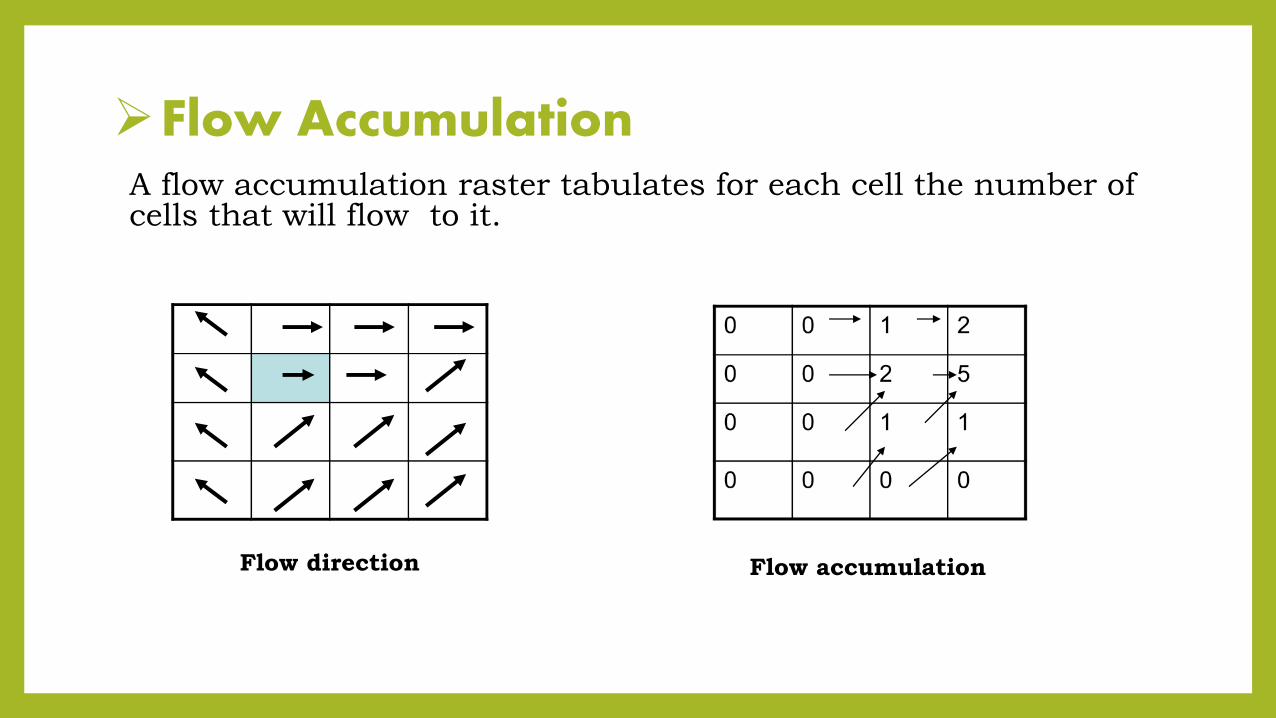
Flow AccumulationA flow accumulation raster tabulates for each cell the number of cells that will flow to it.
Flow direction Flow accumulation

Con (Conditional Elevation)
• put a condition to appear certain values of cell to enhance the visualization of water
flows.
• If condition ( if value > number ) put 1 … so all pixels which have value bigger than this
number will be 1.
60
25
25
55 60
90
0
58
48
5080
72 58
64
13
25
1
ND
ND
1 1
1
ND
1
ND
ND1
1 1
1
ND
ND
Value > 50
Put 1
ND for no data

Stream Order
STRAHLER
Method

Snap Pour Points
Tool used to ensure the selection of points of high accumulation flow where original pour point locations are snapped to locations of higher accumulated flow.
Snap pour point with snapdistance around specified point for cell of high accumulation.

Watershed
Area that defined by the lower elevation .so it carry water after rain or floods.
water channeled in soil makingits way to larger river.

Basin
Is multipurpose environmental analysis to help regional perform watershed and water amount.
Uses of Basin
• Make watershed and water quality study easier
• Useful tool for those interested in watershed management development.

Flow Length
A primary use of the Flow Length tool is to calculate the length of the longest flow path within a given basin. This measure is often used to calculate the time of concentration of a basin.
It’s distance that water travel through area . It compute by upstream or down stream.
• Down stream: distance the drop of water would travel to reach the pour point of the basin.
• Upstream: longest distance along the flow path at the top of basin.

Stream to feature
Tool used to convertraster data to vector.
Make high show for flow.

PRACTICALPART
Using GIS

1-Opening the DEM on ARC map
This DEM which we
will make watershed
for it

Open ARC toolbox
Select on spatial analysis
and click on fill
2-Make fill to the DEM

Output of fill

3-Make flow Direction

Output of flow direction

4- Flow Accumulation

Output of flow accumulation

5- Con Step

Output of con step

6-Covert con_500 from raster to vector

Output of stream to feature

7-stream order

Output of stream order

8-convert stream order from raster to vector

Output of conversion
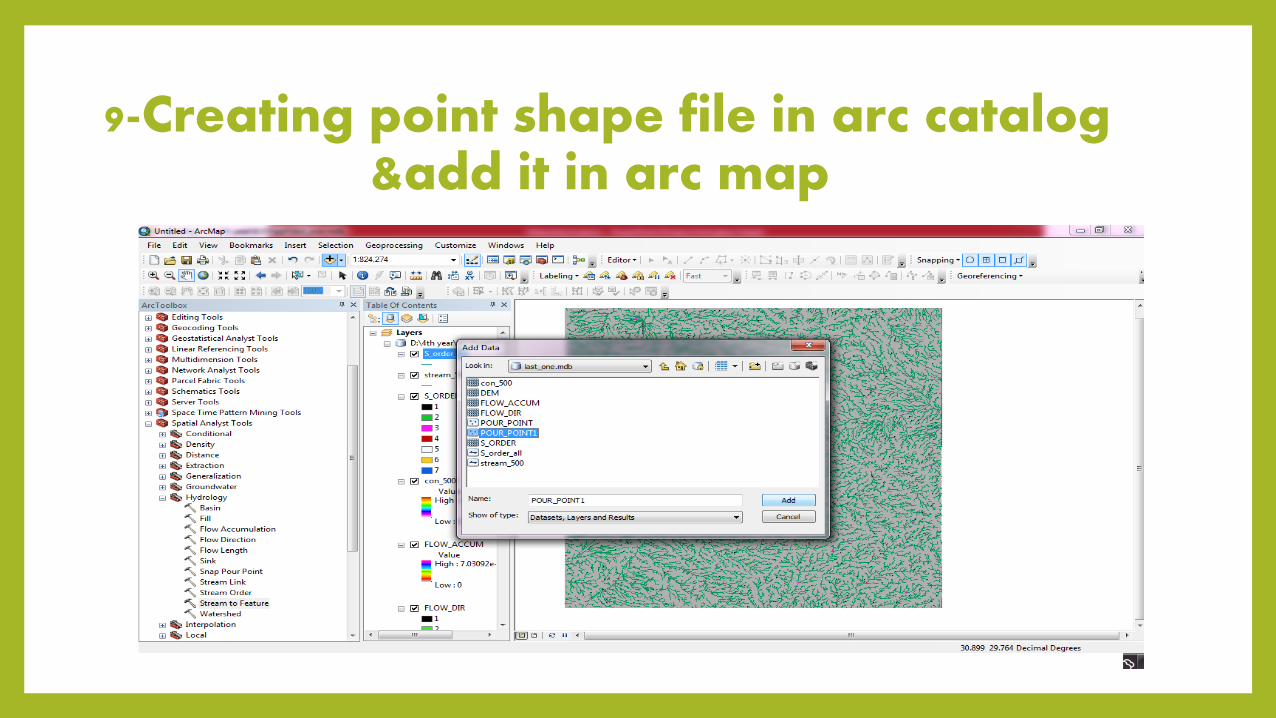
9-Creating point shape file in arc catalog &add it in arc map

10-start edit & select the pour point

11-watershed step

Output of watershed

12-Basin step to get all watersheds in an area

Output of basin step

13-Flow length step

Output of flow length step