watermark board diversity index 2016
TRANSCRIPT

BOARD DIVERSITY INDEX
WATERMARK BOARD
DIVERSITY INDEX
2016
1

2
BOARD DIVERSITY INDEX 3
WELCOME FROM WATERMARK
Welcome, or welcome back if you had a chance to review our 2015 Index. Last year we looked at three aspects of diversity in the
boardroom namely, Gender Diversity, Cultural Diversity and Skills and Experience Diversity. This year we are revisiting those three aspects and have made some changes to the Index, based largely on the feedback to last year’s Diversity Index.
• We have grown the data set to include the ASX300, rather than just the ASX200.
• We have created greater granularity regarding the sector experience that Directors bring to their respective boardrooms.
• We have reviewed the latest studies and reports from around the world on diversity and the relationship to financial performance.
You will see that a number of things have changed for the better in the boardroom and you will also see that there is still more than enough room to make further headway.
We look forward to contributing to the ongoing conversation around diversity in the boardroom; please join us in progressing that conversation.
Please contact me, or any one of my colleagues, if we can be of assistance in working with your board.
Graham WillisManaging Partner+61 2 9233 [email protected]
Watermark Search InternationalLvl 10, 83 Clarence StreetSydney NSW 2000

4
BACKGROUND Having established a baseline last year we have built on that for our analysis in 2016. The issue of gender diversity in both the Boardroom and the Senior Executive ranks of Australian companies remains a topic for discussion and action. The Male Champions of Change, a group set up in 2010 by previous Sex Discrimination Commissioner Elizabeth Broderick, was established on the basis that male leaders visibly stepping up to promote gender equality was a key lever for creating change. In a similar way the Australian Institute of Company Directors has created visibility around Boardroom gender diversity and instituted a range of programs to be part of that change. The issue of gender diversity in the Boardroom is not ‘done and dusted’ by any means however it is highly visible and widely reported on and although it might still take a while to reach parity the old adage “What gets measured gets done” seems apt.
In contrast, there remains very little measurement and reporting on cultural diversity in Australia’s boardrooms…that is only just starting to happen. In a report released by the Diversity Council of Australia (DCA), in collaboration with Deakin University, which reviews the trends in ASX Board Cultural Diversity between 2004 and 2013 it concluded that “Boards are getting more culturally diverse” and that “the percentage of Directors from Asian backgrounds is increasing”. That might well be true, however the shifts, in the larger companies at least, are small and off a low base. As the report also concludes “Boardrooms don’t yet reflect the cultural diversity of the wider community”… especially in the ASX300. Much of the discussion concerning gender equality has been about providing a better
reflection of society thus being better able to understand and appreciate the needs of their organisations’ customers. In addition the different perspectives that women bring to problem solving make a direct contribution to better decision making. Surely it is not just gender that this holds true for?
There remains very little measurement and reporting on ethnic diversity in Australia’s boardroom.
Boardrooms don’t yet reflect the cultural diversity of the wider community.

BOARD DIVERSITY INDEXBOARD DIVERSITY INDEX 5
It would seem to make sense that an ethnically diverse board would potentially bring a better understanding of the population it serves, a diversity of problem solving and thinking styles and a better appreciation of the mind-set of key trading partners.
The same thinking applies to bringing a diversity of skills and experience into the boardroom with the addition of being able to provide specific expertise across a broader range of skills. There are not too many companies that do not have some component of their core values based around their employees and yet those Directors with deep Human Resources or Change Management expertise are a rare commodity in the boardroom. Equally the conversation about digital disruption is right at the forefront of business discussions and yet board members with clear technology expertise are largely absent.
5
Board members with clear technology expertise are largely absent.
Those Directors with deep Human Resources or Change Management expertise are a rare commodity in the boardroom.

It is clear that our largest companies are not just talking about a 70:30 split but are actively moving towards it.
EXECUTIVE SUMMARYWe are covering three areas of diversity amongst the ASX300 boards: • Gender Diversity• Cultural Diversity• Skills Diversity
Gender Diversity
The top 50 ASX companies have further improved their gender diversity in the past 12 months and have lifted from a 77.4% male 22.6% female split to a 74.4% male; 25.6% female split...that is quite a significant shift within 12 months and it is clear that our largest companies are not just talking about a 70:30 split but are actively moving towards it. Also worth noting is that in the top 100 companies the number of boards with no women on the board has shrunk from five to two. We will dig a little further behind the numbers in the body of this review. Once again it is worth noting how much better the top 50 do in regard to gender diversity when compared to the ASX101-200. The ASX201-300 have an even lower representation of women on their boards.
2014 Male 77.4%
Female 22.6% 2015 Male 74.4%
Female 25.6%
Cultural Diversity
There has been an increase in the number of Directors with a non-Australian background. Last year we saw 14.2% of the ASX200 with a culturally different background. This year we see 21% for the same cohort and 18.8% for the ASX300. Scratch the surface however and one sees that 13.7% of that 18.8% are from the USA, New Zealand,
6
We are still a long way from having culturally diverse boards that either reflect the make-up of the Australian population or Australia’s key trading partners.
Top 50 ASX companies gender split

BOARD DIVERSITY INDEX 7
the United Kingdom or South Africa. Last year we noted, despite the recommendations contained within “Australia in the Asian Century”, less than 5% of the ASX200 board members had deep Asian experience; this year that has dropped to 3.2% for the same cohort (ASX200) and is even lower (2.6%) for the ASX300.
We are still a long way from having culturally diverse boards that either reflect the make-up of the Australian population or Australia’s key trading partners. On the 30th of June 2014 the Australian Bureau of Statistics stated that 28% of the population were born outside Australia. Just under 28% of those were born in The United Kingdom or New Zealand and just over 33% of those were born in Asia. Following that through, just under 10% of the Australian population in 2014 was born in Asia. Those with overseas heritage are very under-represented on our boards, with Asian heritage specifically so. The discussion around cultural diversity on boards is getting more coverage and an initiative such as the Cultural Diversity Scholarship Program, jointly funded by the Australian Government and the Australian Institute of Company Directors, is an indication of this. The Diversity Council of Australia’s voice seems to be getting louder and Jane Hyun’s phrase the ‘Bamboo Ceiling’ has migrated from the USA into the Australian Press. We are confident that this will be a growing conversation over the next few years and we will be tracking the progress in this Index.
Skills and Experience Diversity
As we saw last year the ‘heavy hitters’ in the skills and experience area are the Accounting, Finance and Legal areas. This is down somewhat from last year (53.6% in 2015) however looking across the ASX300 rather than the ASX200 could well
be responsible for those changes. Between them, those three areas of experience fill almost 50% of all board roles. Once again those with direct Human Resources experience and skills are significantly under represented with less than 0.5% of all roles and those with Technology expertise remain under strength with 4% of the available board roles. Another way to look at this is that each board has an average of 2.6 Accounting and Finance board members and only 0.25 board members with a Technology background; those with HR depth remain a rounding error in the scheme of things. There are four times as many NEDs with Agricultural expertise as there are with HR expertise. We would suggest that the HR community has a very considerable perception gap to close with regard to the value that its executives provide at the board level.
Each board has an average of 2.6 Accounting and Finance board members and only 0.25 board members with a technology background.
Those with overseas heritage are very under-represented on our boards, with Asian heritage specifically so.

8
WHY SHOULD CHAIRS AND INVESTORS BE INTERESTED IN THE BOARD DIVERSITY?We referred to a number of studies in last year’s Index which were able to draw “a statistically significant relationship between more diverse leadership and better financial performance”. We became aware of another report released by Catalyst in 2013 which has a large number of examples of studies completed by third parties demonstrating the correlations between diversity and positive business performance. There are a variety of reports that you can access to provide a compelling reason to build more diverse boards and we have listed a number of those in the enclosed reference list.
The world’s largest asset manager, BlackRock headquartered in the United States, weighed in to the Australian discussion some years ago noting the absence of gender diversity on Australian boards. This was not out of altruism but out of a desire to change things and so drive greater shareholder returns. It is not too far-fetched to imagine a day when Australian investors will be much more active in driving the diversity agenda because, based on a lot of evidence, diversity-poor boards and companies are costing them improved returns.
THE WATERMARK BOARD DIVERSITY INDEXGender Diversity
There is a fair amount of focus on gender diversity, not only on ASX boards, but also in the executive ranks. As mentioned previously the Male Champions of Change (MCC) Group initiated by Elizabeth Broderick, until recently our Sex Discrimination Commissioner, is one such example. It is self-evident that a broader representation of women at the executive level will, in time, provide a greater number of qualified board Directors. Without that increase in suitably experienced executives the pool of female board Directors will not grow and one of three things will happen: either more board roles will go to fewer people, female representation will diminish or women will be appointed to board roles and to some extent learn on the job. There is some evidence that indicates the current breadth of female board Directors in the ASX300 is causing more board roles to go to fewer people.
If we look at the ASX300 there are 74 Directors with three or more board roles. Of those 74 Directors 31 are female meaning 42% of those with three or more roles are women. When this is put against the
percentage of female NEDs in the ASX300 (20.2%) that is quite a difference. If we then look at the number of women sitting on four or more boards it is even more noticeable. There are nine women with four or more NED roles out of a total of 13 Directors in the same position. This translates to the women having 69.2% of the roles where a Director has four or more seats at the board table.
There is a statistically significant relationship between more diverse leadership and better financial performance.
If we look at the ASX300 there are 13 Directors with four or more board roles; 69% of them are women.
BOARD DIVERSITY INDEX
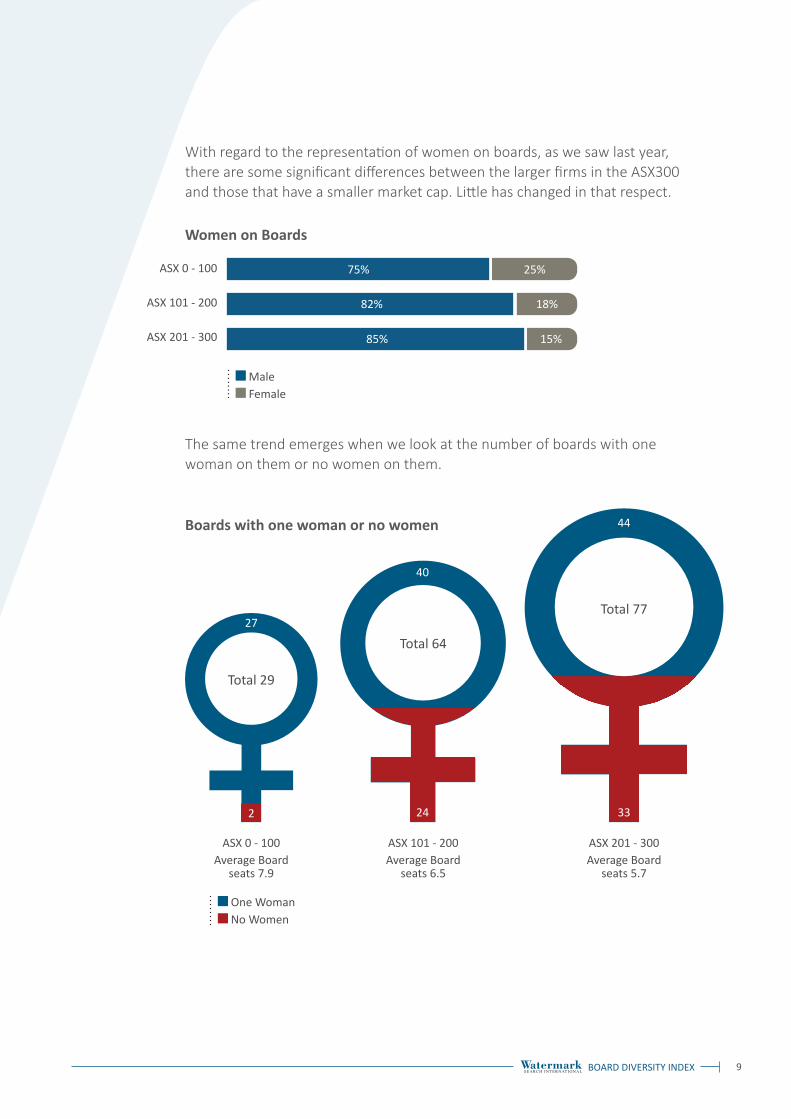
With regard to the representation of women on boards, as we saw last year, there are some significant differences between the larger firms in the ASX300 and those that have a smaller market cap. Little has changed in that respect.
ASX 0 - 100
ASX 101 - 200
ASX 201 - 300
75% 25%
82% 18%
85% 15%
Male Female
One Woman No Women
The same trend emerges when we look at the number of boards with one woman on them or no women on them.
ASX 0 - 100Average Board
seats 7.9
ASX 101 - 200Average Board
seats 6.5
ASX 201 - 300Average Board
seats 5.7
9
Women on Boards
Boards with one woman or no women
24
40
Total 64
2
Total 29 Average Board
seats 7.86
27
33
44
Total 77
Total 29

It is easier to have a greater number of women on a board with a greater number of seats to fill. Given the average board size of those in the ASX201-300 is 5.7 having three women on the board is more of a challenge. Companies with boards of
8 or more, and there are 88 of those in the ASX300, have an easier time of it. We mention three not only because of the spread of the ‘30% club’ message from the UK to Australia but also a five year study of 150 German firms that answered the question of what constituted critical mass with regard to gender diversity; the answer was 30% which translates into 3 for those larger boards.
We should also highlight those boards that have either 30% or more of their board who are women or have three or more female board members. As mentioned above it is more challenging for the smaller boards to achieve those numbers and that is clearly reflected below.
ASX 0 - 100
More than 30% 3 or more
ASX 101 - 200 ASX 201 - 300
28
24
19
57
2
10
Reaching the AICD 30% target by 2018 is not going to be achieved.
Representation of women on boards

With some small changes the ASX100 boards could really tip the gender diversity scales (there being 47 ASX100 boards with two women on them). Reaching the AICD 30% target by 2018 is not going to be achieved across the ASX300. Unless some of those companies create additional board roles, which is a possibility of course, there will simply not be enough rotation in board roles between now and then to achieve that target. The ASX100 however has every opportunity to make that 30% target a reality given the progress made to date and a continued focus.
On a sector by sector basis there are some areas where women are better represented than others. Overall the Banking and Finance sector has the highest representation of women across the ASX300 with 24.6% of all board positions held by women. Within that sector the Insurance segment performs best with 29.7% of all board positions being held by women. They are pipped at the post by the Food Staples Retailing segment with 10 out of 30 board positions being filled by women.
At the other end of the scale is the Capital Goods sector with only 10.8% of their board roles being filled by women. The Materials sector (largely comprised of Miners) also deserves a mention for having 13 companies with no women on their boards. As we have said previously most of the larger companies (ASX100) have a much better representation of women on their boards. Once companies get out of the ‘spotlight’ of being in the ASX100 their focus in this area seems to progressively slip.
BOARD DIVERSITY INDEX 11
With some small changes the ASX100 boards could really tip the gender diversity scales.
The Materials sector (largely Miners) deserves a mention for having 13 companies with no women on their boards.
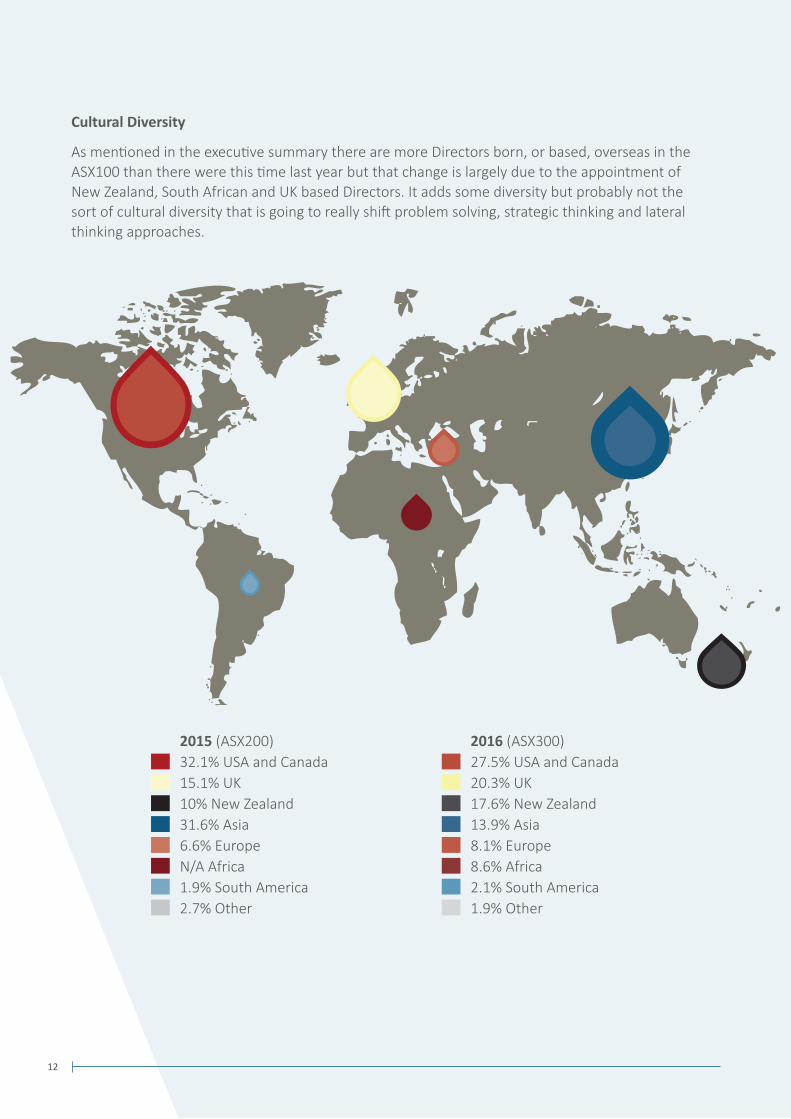
Cultural Diversity
As mentioned in the executive summary there are more Directors born, or based, overseas in the ASX100 than there were this time last year but that change is largely due to the appointment of New Zealand, South African and UK based Directors. It adds some diversity but probably not the sort of cultural diversity that is going to really shift problem solving, strategic thinking and lateral thinking approaches.
12
2015 (ASX200)32.1% USA and Canada15.1% UK10% New Zealand31.6% Asia6.6% EuropeN/A Africa1.9% South America2.7% Other
2016 (ASX300)27.5% USA and Canada20.3% UK17.6% New Zealand13.9% Asia8.1% Europe8.6% Africa2.1% South America1.9% Other

BOARD DIVERSITY INDEX
If we look at where board members with a different cultural background are represented we see that the Capital Goods and Services sector (like the Materials sector largely comprised of Miners) has the highest representation of board positions from non-Anglo-Saxon countries. Just under 10% of their board members are drawn from elsewhere in the world (arguably from a truly different cultural background). The Finance sector has the highest number of board positions with a non-Australian Heritage with just over 22% of them drawn from an international pool however 16% of that 22% are from New Zealand, the USA, Canada and the United Kingdom. For both of these sectors that representation is logical. More of the Mining companies have operations in BRIC or developing countries and at the same time our Finance System is much more aligned to the systems that exist in the United Kingdom, Canada and to some extent the USA.
Our large Consumer sector is a bit more of a mystery and clearly represents neither the make-up of the population it directly serves nor the countries to whom it exports. Only 2% of the sector’s board members are of Asian
Heritage and yet over 10% of the Australian population was born in an Asian country. We would suggest they are potentially missing an opportunity to better align with a key target market as are the Financial Services companies with just under 3% of their board members of Asian heritage. Only two of the eight largest banks have any Asian representation on their boards. It is also worth noting that Australians of direct Middle Eastern heritage now make up 1.5% of the Australian population and that number is growing: they have even less representation than those of Asian heritage.
13
Our large Consumer sector clearly represents neither the make-up of the population it directly serves nor the countries to whom it exports.
The Capital Goods and Services sector (largely Mining) has the highest representation of board positions from non-Anglo-Saxon countries.
Australians of direct Middle Eastern heritage now make up 1.5% of the Australian population and that number is growing: they have even less representation than those of Asian heritage.

Overall our boards have marginally improved the representation from some of our major trading partners but have taken no steps to improve representation amongst our major Asian trading partners – in fact we have gone backwards. The recently released report by the Diversity Council of Australia in collaboration with Deakin University* painted a much improved picture over the period 2004 – 2013, which is good to see, however the improvements, in percentage terms, come off a low base.
Apart from considering the make-up of boards as they might pertain to major trading partners, we should also have a look at how the ASX300 cultural diversity measures up against the Australian population. In most cases the companies listed on the ASX are transacting much of their business in Australia; some reflection of the make-up of the customer population might be another reason to increase board cultural diversity.
14
Place of Birth Representation on ASX300
74.3%
84.9%
10.2%
2.6% 1.0%
5.1%
0.2% 0.4% 2.6% 0.2%
* Australian Bureau of Statistics 2014 update.
Australia/New Zealand
Asia
0.7% 1.6%
AfricaNorth America
South America
Other
0%1.5%
Middle East
9.5%
1.5%
Europe
Place of Birth* compared to Australian Board members’ cultural background
BOARD DIVERSITY INDEX 15
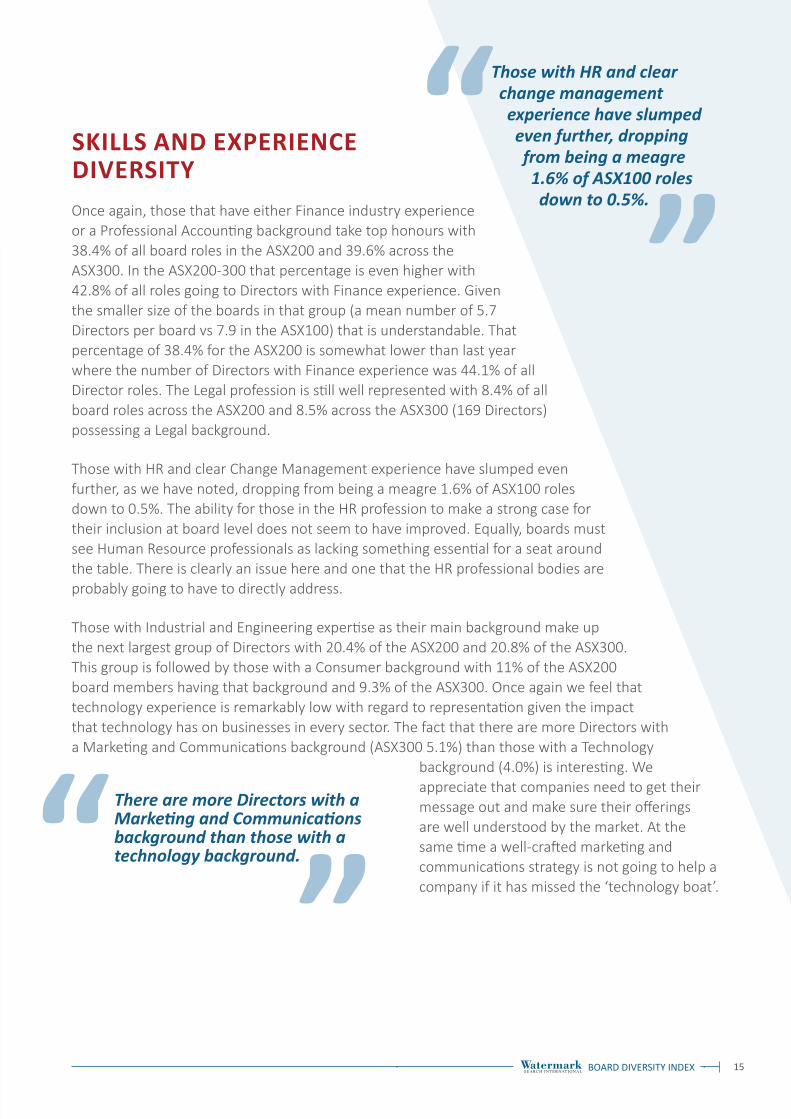
SKILLS AND EXPERIENCE DIVERSITYOnce again, those that have either Finance industry experience or a Professional Accounting background take top honours with 38.4% of all board roles in the ASX200 and 39.6% across the ASX300. In the ASX200-300 that percentage is even higher with 42.8% of all roles going to Directors with Finance experience. Given the smaller size of the boards in that group (a mean number of 5.7 Directors per board vs 7.9 in the ASX100) that is understandable. That percentage of 38.4% for the ASX200 is somewhat lower than last year where the number of Directors with Finance experience was 44.1% of all Director roles. The Legal profession is still well represented with 8.4% of all board roles across the ASX200 and 8.5% across the ASX300 (169 Directors) possessing a Legal background.
Those with HR and clear Change Management experience have slumped even further, as we have noted, dropping from being a meagre 1.6% of ASX100 roles down to 0.5%. The ability for those in the HR profession to make a strong case for their inclusion at board level does not seem to have improved. Equally, boards must see Human Resource professionals as lacking something essential for a seat around the table. There is clearly an issue here and one that the HR professional bodies are probably going to have to directly address.
Those with Industrial and Engineering expertise as their main background make up the next largest group of Directors with 20.4% of the ASX200 and 20.8% of the ASX300. This group is followed by those with a Consumer background with 11% of the ASX200 board members having that background and 9.3% of the ASX300. Once again we feel that technology experience is remarkably low with regard to representation given the impact that technology has on businesses in every sector. The fact that there are more Directors with a Marketing and Communications background (ASX300 5.1%) than those with a Technology
background (4.0%) is interesting. We appreciate that companies need to get their message out and make sure their offerings are well understood by the market. At the same time a well-crafted marketing and communications strategy is not going to help a company if it has missed the ‘technology boat’.
Those with HR and clear change management experience have slumped even further, dropping from being a meagre 1.6% of ASX100 roles down to 0.5%.
There are more Directors with a Marketing and Communications background than those with a technology background.
BOARD DIVERSITY INDEX
In keeping with our review last year we make the following observations:
• Directors with a Legal background are evenly distributed across the ASX300.
• In a shift from our 2015 review more Directors with a Technology background can be found in the ASX101-200 (5.2%) than can be found in the ASX100 (2.3%). Somewhat predictably a much higher percentage of those Director’s roles are on Telecommunications or Software and Services Boards (41.7%). Once again it means that there are very few Technology-experienced Directors (46) to be distributed across 277 non-tech companies.
• Those with Healthcare expertise stick closely to the Healthcare sector (78.5%).
• Those with Accounting, Financial Services, Legal, Consumer or Industrial experience are most likely to be seen as able to contribute to a broad range of sectors.
• Those with HR, Change Management, Technology, Engineering or Healthcare backgrounds are either thinly represented away from their direct sector or are just poorly represented in the NED league tables.
• The ‘Other’ category includes those Directors with experience in areas such as Sport, Education, Aviation and Agriculture and the like.
There have been some shifts in experience by sector but these are not significant and those with HR, Change Management and Technology experience are thinly represented despite the fact that most companies seem to be going through some kind of transformation, enabled, in many cases, by technology. The success of any business transformation is inexorably linked to the HR and Change Management capability within an organisation. At the same time companies are making major technology bets which are strategic in nature. It would seem that many boards have taken the option of relying on the expertise of either their company’s executives or advisors rather than embedding that expertise in the board.
BOARD DIVERSITY INDEX 16
BOARD DIVERSITY INDEX 17
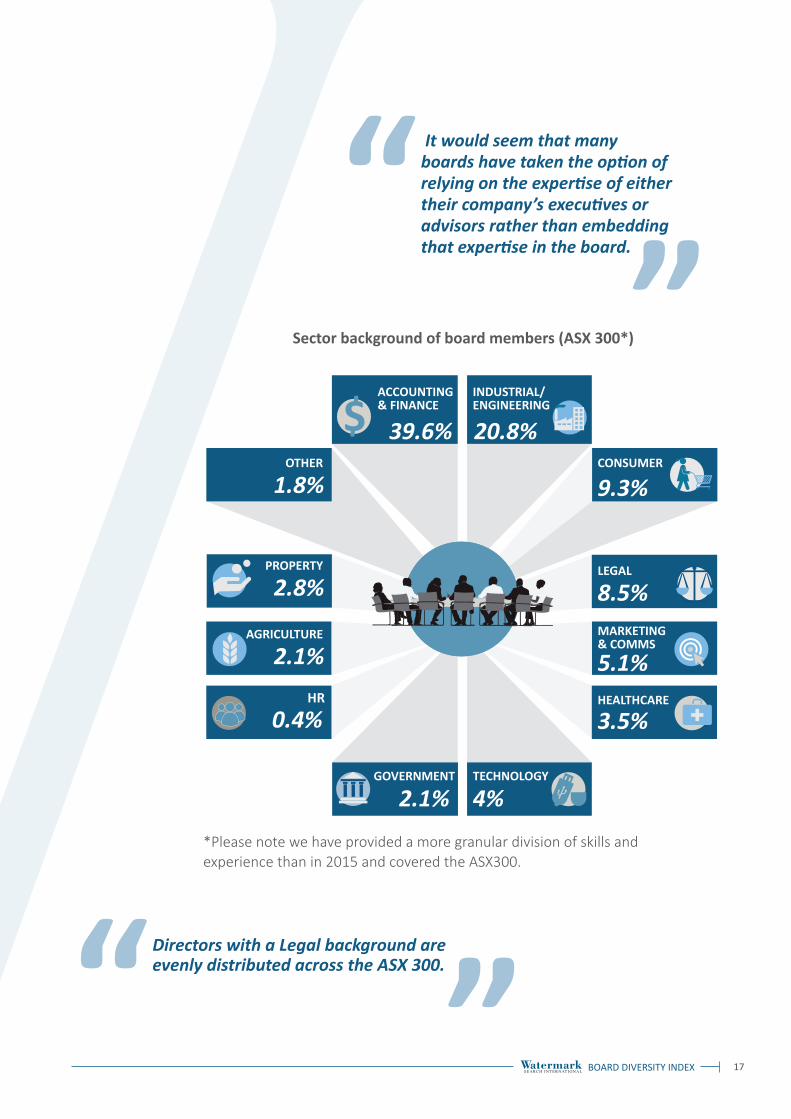
It would seem that many boards have taken the option of relying on the expertise of either their company’s executives or advisors rather than embedding that expertise in the board.
$
Sector background of board members (ASX 300*)
ACCOUNTING & FINANCE
INDUSTRIAL/ENGINEERING
CONSUMER
LEGAL
HEALTHCARE
TECHNOLOGYGOVERNMENT
HR
OTHER
39.6% 20.8%
9.3%
8.5%
3.5%
4%2.1%
0.4%
1.8%
MARKETING & COMMS
5.1%
PROPERTY
2.8%
AGRICULTURE
2.1%
*Please note we have provided a more granular division of skills and experience than in 2015 and covered the ASX300.
Directors with a Legal background are evenly distributed across the ASX 300.
BOARD DIVERSITY INDEX 1818
We hope you find the analysis interesting. We also hope you find the time to read some of the research into the relationship between superior business performance and diversity around the board room table and maybe, as a result, become an activist for diverse boards.
Australian boards are not a diversity desert. That neither acknowledges those boards that have embraced gender, cultural and experience diversity nor the overall progress that continues to be made. There has been a focus on gender diversity at the board level for over 10 years and the progress is plain to see: still more to do, but there is clear progress.
What we wish to do is to raise the breadth of the board diversity conversation so that it spreads from being limited to gender and starts to include diversity of culture and experience.
We want to do that for two reasons:
• Australia is a culturally diverse country conducting business in a globally connected world. To be able to better reflect our own diversity and better understand the diversity of those with whom we do business seems a good move.
• Quite simply it’s good business. Companies that are more diverse demonstrate superior financial returns. As board members, as employees and as shareholders it is in our direct interest to have more diversity in our businesses…starting at the top.
We look forward to measuring the increasing diversity of Australian boards over the next five to ten years.
DATA COLLECTION AND INTERPRETATIONLast year we provided an analysis of the ASX200. This year we have broadened that to the ASX300 in response to feedback from our clients. In many cases, but not every case, we have provided a comparison to last year’s ASX200 data in addition to further analysis on the ASX300.
The data used to create this Index is publicly available information from the board profiles provided by the top 300 companies on their websites. Where that information is no more than a name or short biography, we have accessed information from other publicly available sources. The data used was current as of 1st January 2016.
In counting the number of board members we included the Managing Director but did not include the Chief Financial Officer or Company Secretary as members of the board.
SUMMARY

BOARD DIVERSITY INDEX 19
With regard to skills, we have made a determination that a Director brings one major area of experience to a board. We recognise this is an oversimplification and does not properly acknowledge the range of skills and experience that Directors build over their executive careers; we accept this limitation of the Index. At the same time, based on our board search experience, we know that specific areas of core experience are predominantly the reason a Director is invited to join the board. An NED who has been a CFO is most unlikely to be on the board for their HR experience; it does not follow that they do not have any. Equally just because an NED steeped in Change Management is set to contribute more in their area of expertise it does not follow that they cannot interpret a balance sheet.
We faced some similar issues with regard to cultural diversity. In some less clear cut cases we made a judgement on the NED’s characterisation as say being of Asian or European background. In many cases it is clear and in others it was a judgement based on their other executive or board roles. We would maintain that with regard to the overall percentages of overseas representation on boards it makes very little difference to the key messages. Just as we made a determination, for example, that someone with exposure to HR issues was not an HR ‘expert’, an Australian that has worked in Europe for a period of time is not the same as an NED that has been born and educated there and in some cases still lives there.
CONTACT US
Graham WillisManaging Partner
+61 2 9233 1200 [email protected]
Watermark Search International Lvl 10, 83 Clarence Street
Sydney NSW 2000 watermarksearch.com.au

20
WATERMARK SEARCH INTERNATIONAL: SERVICE OFFERING
EXECUTIVE SEARCHFounded in 1979, we are one of the longest established Australian executive search firms. Despite the fact that we are, above all else, an Australian based firm we have an established track record in attracting, and then securing, candidates from overseas.
We have considerable expertise in senior executive appointments across a broad range of public and private sector organisations. Our practice has been built on a substantial body of work undertaken for publicly listed companies, private companies, state-owned corporations, and government agencies, departments and advisory Boards.
INTERIM EXECUTIVE MANAGEMENTWe provide immediate and high level specialist executives, including senior managers, with the experience to bring stability to and provide guardianship for a company during a period of change, executive absence or performance turnaround. We also assist with providing executives who deliver on projects, programmes or specialist reviews. When clients are ready to appoint an executive we normally complete the assignment in two to three weeks. Our latest survey shows that those executives remain in place for an average of 7.5 months.
BOARD SEARCHWe believe that strong boards make for better organisations and improved business performance. In conducting searches we do not simply look for ‘a name’ but rather search for candidates with the relevant skills to add real value to a board. We often start our board search by working with the client to produce a Board Skills Matrix which then informs the specific brief.
Our track record ensures familiarity with the specific, and often sensitive, challenges involved in appointing Non-Executive Directors and Chairs with the right skill, personal and cultural fit. Our process and experience allows us to generate diverse short lists and consistently find successful candidates who help boards perform at their peak. We often work with our clients to provide an induction process for their new Directors.

BOARD DIVERSITY INDEXBOARD DIVERSITY INDEX 21
DIVERSITYWe pride ourselves on delivering the best candidates in the marketplace for consideration by our clients. We go further than most executive search organisations in ensuring that our clients have a gender diverse range of candidates as part of the process. In 2015 42% of all successful candidates introduced by Watermark were female. This is a significantly greater representation of women executives as successful candidates than any levels indicated by recent third party studies. In addition to our focus on gender diversity we have also had the opportunity to assist a number of Indigenous organisations secure high quality candidates through well targeted executive search.
MARKET INSIGHTSWe have a unique ‘window’ into both the commercial and government worlds and are available to provide informal market insights to our clients on topics such as salary packaging, hiring trends and executive onboarding.
21
EXECUTIVE SEARCH
BOARD SEARCH
DIVERSITY
INTERIM EXECUTIVE MANAGEMENT
MARKET INSIGHTS
22
REFERENCESWebsites and Articles Referred to in the Index
“Capitalising on Culture over time: Trends in ASX Board Cultural Diversity 2004-2013” Diversity Council Australia and Deakin University Australia. https://www.dca.org.au/dca-research/capitalising-on-culture---asx-Directors-2004-2013.html
“Leading in the Asian Century: A National Scorecard of Australia’s Workforce Asia Capability” Diversity Council Australia. https://www.dca.org.au/dca-research/leading-in-the-asian-century.html
“Migration, Australia, 2013–14”. Australian Bureau of Statistics. 29 January 2015.
“Gender Diversity in the Boardroom and Firm Performance: What Exactly Constitutes a ‘Critical Mass’?”, Joecks, Pull and Vetter, Social sciences Research Network, Working Paper Series (February 22,2012).
“Diversity Matters” Hunt, Layton and Prince, November 2014 (re-released February 2015).
“Australia in the Asian Century”. http://www.defence.gov.au/whitepaper/2013/docs/australia_in_the_asian_century_white_paper.pdf
“Breaking the Bamboo Ceiling: Career Strategies for Asians”, Jane Hyun. http://www.hyunassociates.com/books/
“Fifth Annual Australian Interim Management Survey 2015 Watermark Search International”. http://watermarksearch.com.au/files/2015/07/Watermark-Search-International-Interim-Management-Survey-2015.pdf
The 30% Club Growth through Diversity. http://30percentclub.org/
Australian Institute of Company Directors. http://www.companyDirectors.com.au/Director-resource-centre/governance-and-Director-issues/board-diversity
Male Champions of Change. http://malechampionsofchange.com/
Diversity Council Australia. https://www.dca.org.au/dca-research/capitalising-on-culture---asx-Directors-2004-2013.html
Other Reading
“Women on Boards and Firm Financial Performance: A Meta-Analysis” Post and Byron Academy of Management Journal. November 5th 2014. http://www.academia.edu/9824228/Women_on_Boards_and_Firm_Financial_Performance_A_Meta-analysis
“Increasing the Number of Women in Senior Executive Positions”, Business Council of Australia. http://www.bca.com.au/publications/increasing-the-number-of-women-in-senior-executive-positions
“Gender diversity and corporate performance”, Credit Suisse. https://publications.credit-suisse.com/tasks/render/file/index.cfm?fileid=88EC32A9-83E8-EB92-9D5A40FF69E66808

BOARD DIVERSITY INDEX 23
