water treatment experiments - welcome to...
TRANSCRIPT

Water Treatment Experiments
Friday AM
David A. ReckhowUniversity of Massachusetts
1

Introduction
• The water industry spends a lot of money and effort on removal of natural organic matter (NOM) from drinking waters
• Problems with NOM (the more NOM the bigger problem)– NOM interferes with the ability of water treatment systems to remove
substances that cause disease• Pathogenic organisms• Toxic chemicals
– NOM reacts with chlorine‐based disinfectants forming carcinogenic organic byproducts
2

Intro (cont.)
• Thinking about removal of NOM, many questions come to mind. – Which methods are most effective? Are home treatment systems as
good as, better than or worse than community water treatment systems?
– Will alum, the most common method of treatment in cities, really remove colored organic matter? If so, how much removal occurs?
– How does alum compare to chlorine and GAC, the other major types of treatment
– How does chorine compare with the other disinfectants, iodine and chlorine dioxide?
– How do the various home filtration products compare?– Does treatment effectiveness depend on the type of leaves in the
watershed?
3

Materials• Plant leachate
– Yours or mine• Containers for treatment & imaging
– Plastic Culture Flasks (275 mL), • Corning #430720; $3.70 each from Fisher, $2 from Caroline Bio
• Treatment Chemicals & Equipment– Coagulation: alum– Activated Carbon Adsorption: Aquarium charcoal– Disinfection: household bleach, “field” disinfectants– Home Treatment Systems: Brita, etc.– Filtration apparatus
• Camera, computer & ADI software
4

What to Do for the Treatment Tests?
• Decide on plant leachate to treat• Conduct Treatments
– Bottle 1: Alum coagulation (do this first)– Bottle 2: GAC adsorption (two options)– Bottle 3: Disinfection/Oxidation (do one or more)– Bottle 4: Home Treatment (do one or more)
• Some may require paper filtration– If treated waters look cloudy
• Record Images and analyze– Collect at least one photographic image of the treated bottles next to a blank (tap water) and an untreated control (leachate)
5

Alum Coagulation1. Add about 15‐20 drops of the 4% sodium bicarbonate
(NaHCO3) solution you’ll want to reach a pH of about 7‐7.52. to your 250 mL sample, add about 1‐2 drops of the 6%
sodium hydroxide solution (NaOH). Check pH3. Add a sufficient amount of the 10% alum solution (about 15‐
20 drops) to initiate floc formation. You will need to gently shake the bottle (slowly invert about 20 times over 60 seconds) and wait for the slow formation of visible and settleable floc. This step is called flocculation.
4. Check pH, add more NaOH if it is below 7, you may need to add 4‐8 additional drops. Do this 2 drops at a time, checking pH. Remember your target is pH 7‐7.5.
5. Allow the floc to settle for about a half‐hour.6

Granular Activated Carbon (GAC)• There are at least two different methods of GAC treatment used in
water treatment plants. – Both can be simulated in the laboratory, although the first may be
easiest. You’re welcome to select either one:
2. Slurry method : contact then filtration– Add a spoonful of GAC directly to the 250 mL bottle, shake and
allow it to settle. You may need to filter the sample after it settles
1. Filter Bed method: simultaneous contact/filtration– Gently pour half of the 250 mL sample into the filter funnel
containing a layer of pre‐washed GAC1. Slowly turn on the vacuum until the level just starts to drop. Once the first have has been received into the filter flask, repeat with the second half. Don’t discard the GAC; it can be uaed again. Transfer the filtrate back to your culture bottle for image analysis
1GAC was gently introduced over a sandwich of 2 Whatman #1 filter circles (90mm)
or
7

Disinfection & Oxidation
1. Add one of the following: – Chlorine or Household Bleach: 10 drops of the 5%
chlorine solution (each group has a bottle).– Iodine or Potable Aqua: add 1 tablet to the 250 mL
sample (only one set of tablet for the class)– Chlorine Dioxide or Aquamira: add ½ to 1 tablet to
the 250 mL sample (only one set of tablets for the class)2. Shake and wait about 10 minutes for reactions
to occur3. Collect images and analyze
8

Home or Point of Use Treatment
1. Select one or more treatment products– Brita Bottle– Brita Pitcher– ZeroWater Pitcher
2. Pour 250 mL sample into reservoir.3. Allow water to percolate through or squeeze it out
(Brita bottle)4. You may need to filter if the treated water looks
cloudy5. Return it to the culture bottle, image and analyze
9

Brita: Water Bottle
• GAC/ion exchange• Replace cartridge every 75L
Compressed block of activated carbon and zeolite
10

Brita: Pitcher
• Same– Activated Carbon and Ion Exchange resin
• 160 L per cartridge
11

ZeroWater
• 5‐stage dual Ion Exchange
• Replace cartridge when TDS meter reads 6 ppm
• Capacity depends on TDS of water to be treated
12

Data Analysis• Using line or rectangle tool, determine color intensity of red, green & blue
• Tabulate these values and compare with calibration curve– This will show the amount of colored organic matter remaining after treatment
– Comparison with a calibration helps to assign a quantitative “% remaining” or “% removal”
13
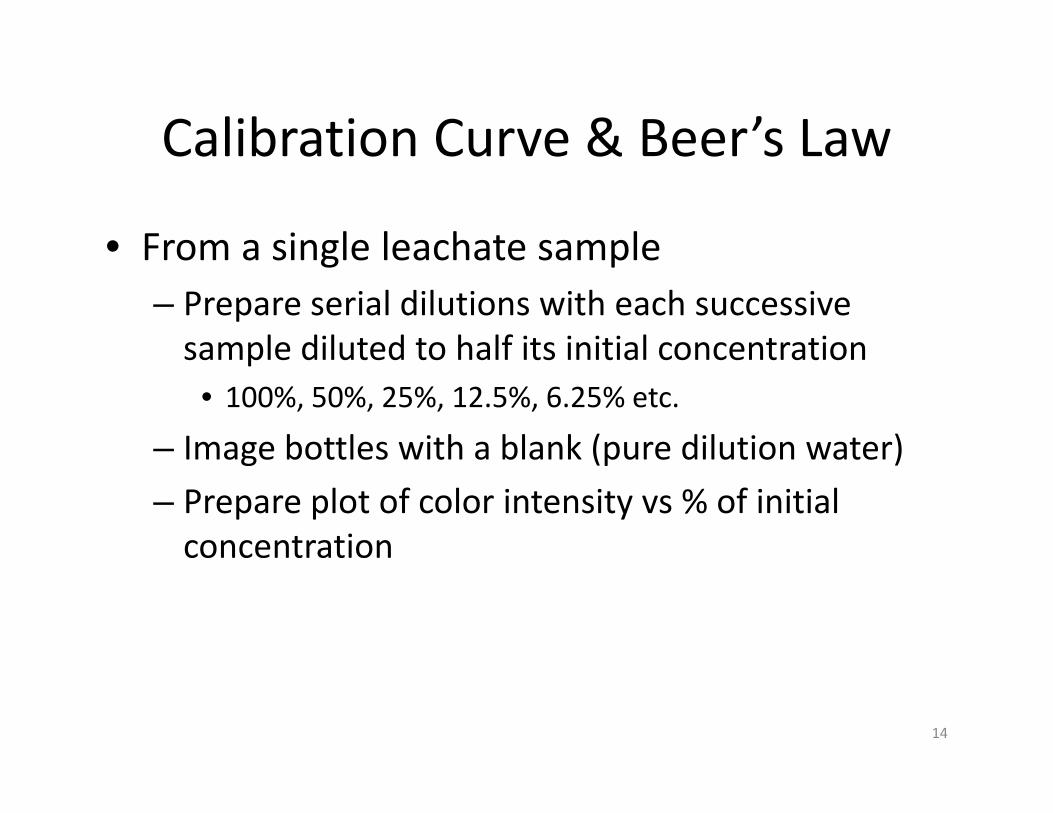
Calibration Curve & Beer’s Law
• From a single leachate sample– Prepare serial dilutions with each successive sample diluted to half its initial concentration
• 100%, 50%, 25%, 12.5%, 6.25% etc.
– Image bottles with a blank (pure dilution water)– Prepare plot of color intensity vs % of initial concentration
14

• ds
15

• sd
16

• das
17
#3

• fds
18
#5

• ads
19
Control

Direct Calibration
20Concentration (% of full strength leachate)
0 20 40 60 80 100 120
Col
or In
tens
ity
0
20
40
60
80
BlueGreenRed
• Non‐linear• All should have the same exponential curvature

Beer’s Law: making it linear• Concentration of a solution of an absorbing compound or a
mixture of compounds with fixed proportions is directly proportional to the logarithm of the light intensity for experimental (I) divided by the light intensity for the blank (Io)– This is the “Absorbance”
Fixed value dependent on your bottle
Fixed value determined by analyzing a “standard”
21What you’re trying
to determine

Culture Bottles: “Absorbance”
22Concentration (% of full strength leachate)
0 20 40 60 80 100 120
Abs
orba
nce
0.0
0.5
1.0
1.5
2.0 BlueGreenRed
slope = 0.0457
slope = 0.0049
slope = 0.0109
• Linear– Conforms to
Beer’s law as long as Absorbance < 1

Spectrophotometer: High Resolution Absorbance Spectra
23Wavelength (nm)
400 500 600 700
Abs
orba
nce
(per
cm
)
0.0
0.2
0.4
0.6
0.8
1.0
100%50%25%12.5%6.25%
• High absorbance at lower wavelength
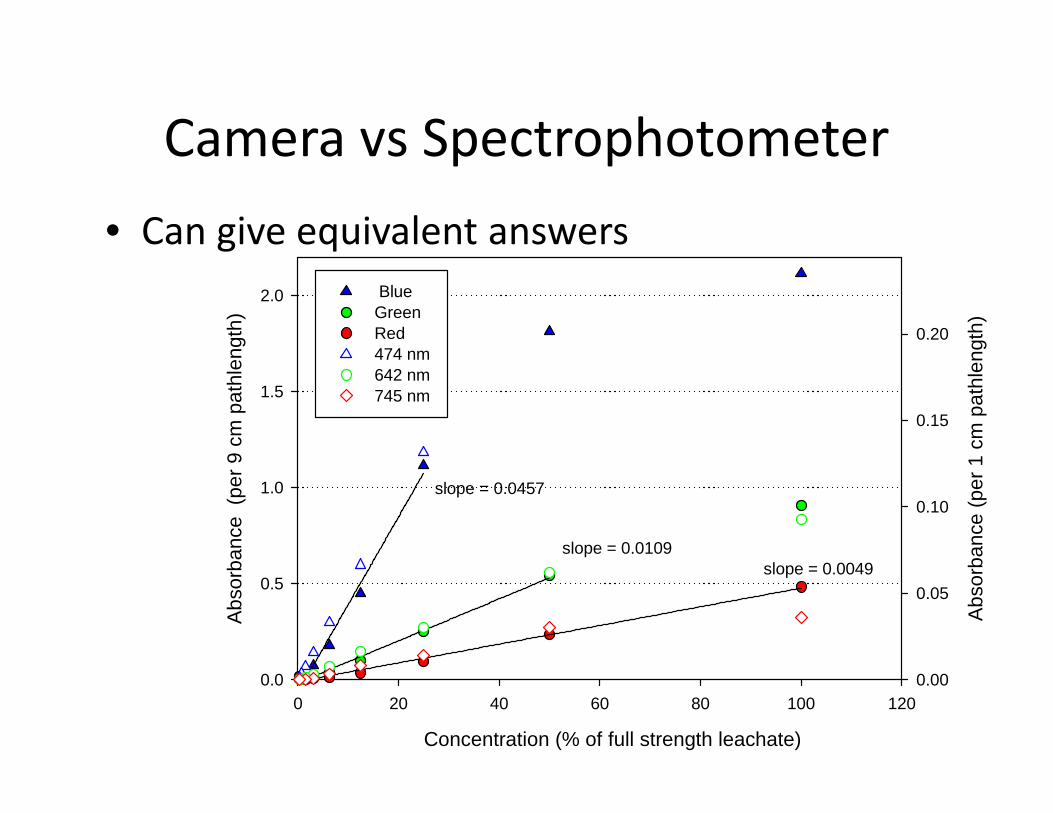
Camera vs Spectrophotometer
24Concentration (% of full strength leachate)
0 20 40 60 80 100 120
Abs
orba
nce
(per
9 c
m p
athl
engt
h)
0.0
0.5
1.0
1.5
2.0
Abs
orba
nce
(per
1 c
m p
athl
engt
h)
0.00
0.05
0.10
0.15
0.20
BlueGreenRed474 nm 642 nm 745 nm
slope = 0.0457
slope = 0.0049slope = 0.0109
• Can give equivalent answers