water supply systems asset management plan · water supply systems asset management plan ......
TRANSCRIPT

TENTERFIELD SHIRE COUNCIL – WATER SUPPLY ASSET MANAGEMENT PLAN
TENTERFIELD SHIRE COUNCIL
WATER SUPPLY SYSTEMS
ASSET MANAGEMENT PLAN
Version 1.01, June 2012

TENTERFIELD SHIRE COUNCIL – WATER SUPPLY ASSET MANAGEMENT PLAN
Document Control
Document ID: 59_07_101209 nams plus_amp template v11 1
Rev No Date Revision Details Author Reviewer Approver
1.01 14 June2012 First Draft N.Heinze Ralf Stoeckeler
© Copyright 2007 – All rights reserved.
The Institute of Public Works Engineering Australia.

TENTERFIELD SHIRE COUNCIL – WATER SUPPLY ASSET MANAGEMENT PLAN
TABLE OF CONTENTS
ABBREVIATIONS ............................................................................................................................................................. i GLOSSARY ....................................................................................................................................................................... i 1. EXECUTIVE SUMMARY ...................................................................................................................................... 1
What Council Provides .......................................................................................................................................... 1 What does it Cost? ................................................................................................................................................ 1 Plans for the Future ............................................................................................................................................... 1 Measuring our Performance .................................................................................................................................. 1
2. INTRODUCTION ................................................................................................................................................... 2 2.1 Background .................................................................................................................................................. 2 2.2 Goals and Objectives of Asset Management ............................................................................................... 3 2.3 Plan Framework ........................................................................................................................................... 3 2.4 Core and Advanced Asset Management ..................................................................................................... 3
3. LEVELS OF SERVICE .......................................................................................................................................... 4 3.1 Customer Research and Expectations ......................................................................................................... 4 3.2 Legislative Requirements ............................................................................................................................. 4 3.3 Current Levels of Service ............................................................................................................................. 4 3.4 Sustainable Level of Service ........................................................................................................................ 5 3.5 Desired Levels of Service ............................................................................................................................ 5
4. FUTURE DEMAND ............................................................................................................................................... 6 4.1 Demand Forecast ........................................................................................................................................ 6 4.2 Changes in Technology ............................................................................................................................... 6 4.3 Demand Management Plan ......................................................................................................................... 6 4.4 New Assets from Growth ............................................................................................................................. 6
5. LIFECYCLE MANAGEMENT PLAN .................................................................................................................... 7 5.1 Background Data ......................................................................................................................................... 7 5.1.1 Physical parameters .......................................................................................................................... 7 5.1.2 Asset capacity and performance ....................................................................................................... 8 5.1.3 Asset condition .................................................................................................................................. 8 5.1.4 Asset valuations ................................................................................................................................ 9 5.2 Risk Management Plan ................................................................................................................................ 9 5.3 Routine Maintenance Plan ........................................................................................................................... 9 5.3.1 Maintenance plan .............................................................................................................................. 9 5.3.2 Standards and specifications .......................................................................................................... 10 5.3.3 Summary of future maintenance expenditures ................................................................................ 10 5.4 Renewal/Replacement Plan ....................................................................................................................... 11 5.4.1 Renewal plan ................................................................................................................................... 11 5.4.2 Renewal standards .......................................................................................................................... 11 5.4.3 Summary of future renewal expenditure ......................................................................................... 11 5.5 Creation/Acquisition/Upgrade Plan ............................................................................................................ 12 5.5.1 Selection criteria .............................................................................................................................. 12 5.5.2 Standards and specifications .......................................................................................................... 12 5.5.3 Summary of future upgrade/new assets expenditure ...................................................................... 12 5.6 Disposal Plan ............................................................................................................................................. 13
6. FINANCIAL SUMMARY ..................................................................................................................................... 13 6.1 Financial Statements and Projections ........................................................................................................ 13 6.1.1 Sustainability of service delivery ..................................................................................................... 13 6.2 Funding Strategy ........................................................................................................................................ 15 6.3 Valuation Forecasts ................................................................................................................................... 15 6.4 Key Assumptions made in Financial Forecasts ......................................................................................... 15
7. ASSET MANAGEMENT PRACTICES ............................................................................................................... 17 8. PLAN IMPROVEMENT AND MONITORING ..................................................................................................... 17
8.1 Performance Measures .............................................................................................................................. 17 8.2 Improvement Plan ...................................................................................................................................... 17 8.3 Monitoring and Review Procedures ........................................................................................................... 17
REFERENCES ............................................................................................................................................................... 18

TENTERFIELD SHIRE COUNCIL – WATER SUPPLY ASSET MANAGEMENT PLAN
i
ABBREVIATIONS
See General Asset Management Plan for Details
GLOSSARY
See General Asset Management Plan for Details

- 1 -
TENTERFIELD SHIRE COUNCIL – WATER SUPPLY ASSET MANAGEMENT PLAN
1. EXECUTIVE SUMMARY
What Council Provides
Council provides an extensive range of infrastructure assets throughout its network to enable services to be provide
This particular plan deals with the Water Supply Systems at Tenterfield, Urbenville and Jennings.
What does it Cost?
There are two key indicators of cost to provide these services.
The life cycle cost being the average cost over the life cycle of the asset, and
The total maintenance and capital renewal expenditure required to deliver existing service levels in the next 10 years covered by Council’s long term financial plan.
The life cycle cost to provide the Water Supply System service is estimated at 2012 Operation and Maintenance budget ($1,044,390) plus depreciation ($798,500) = $1,842,890 per annum.
Council’s planned life cycle expenditure for year 1 of the asset management plan is 2012 Operation and Maintenance budget ($1,044,390) plus planned capital expenditure($384,880) = $1,429,265 which gives a life cycle sustainability index of 0.78 .
The total maintenance and capital renewal expenditure required to provide the water supply service the in the next 10 years is estimated at 10 years of current budget for water supply ( 10x$1,044,390) plus 10 times $798,500 = $18,428,900
This is an average of $1,842,890 per annum.
Council’s maintenance and capital renewal expenditure for year 1 of the asset management plan is $1,429,265 per annum, giving a 10 year sustainability index of 0.78.
Plans for the Future
: NOTES
1. Due to ongoing senior staff resourcing difficulties, it has not been possible to develop a complete Water Supply asset inventory for Tenterfield Shire Council, and there are some gaps. (Possibly a 5-10 % deficiency exists). It is hoped to improve the database in future Water Supply asset management plans.
2. Following on from 1.above, a more accurate database, (and costing), in future revisions of this plan, should enable a more realistic life cycle sustainability index to be calculated.
Council plans to operate and maintain the Water Supply network to achieve the following strategic objectives.
1. Ensure the Water Supply network for
Tenterfield, Urbenville and Jennings is
maintained at a safe and functional standard
as set out in this asset management plan.
2. Ensure the environment is protected by maintaining the highest possible standard of treatment of raw water for public use.
Measuring our Performance
Refer to the Overall Plan for Asset Management for Tenterfield Shire

- 2 -
TENTERFIELD SHIRE COUNCIL – WATER SUPPLY ASSET MANAGEMENT PLAN
2. INTRODUCTION
2.1 Background
This asset management plan is to demonstrate responsive management of assets (and services provided from assets), compliance with regulatory requirements, and to communicate funding required to provide the required levels of service.
The asset management plan is to be read with the following associated planning documents:
Community Strategic Plan
Strategic Management Plan
10 Year Financial Plan
Asset Management Policy
Workforce Management Plan
Council’s Delivery Program
Council’s Operational Plan
Council’s Annual Report
Council’s Asset Registers,
MapInfo Spatial Asset Register
Road Network Management Plan
Each Asset category has been divided into several sub categories which in turn have been divided into sub types of assets.
Table 2.1.3 Assets covered under Water Supply Systems
Each village has independently recorded water supply systems
Asset category Dimension Replacement Value ($M)
Tenterfield Water Treatment Works One of 5 million litres per day capacity $5.538786
Water Storage Reservoirs Two Reservoirs of 2.1 and 2.3 million litres capacity and a water collection and
storage dam of 1300 million litres capacity.
$19.430,360
Water Reticulation System 50.566 km of mains from 100 mm diameter to 225 mm diameter
$8.668,168
Water Pumping Stations A treated water pump station with a 45 kw and a 75 kw pump.
$0.756,984
SUB-TOTAL $34,394,298

- 3 -
TENTERFIELD SHIRE COUNCIL – WATER SUPPLY ASSET MANAGEMENT PLAN
Asset category Dimension Replacement Value ($M)
Urbenville Water Treatment Works One $2,319,763
Water Storage Reservoirs Two Reservoirs and a weir on Tooloom Creek
$507,245
Water Reticulation System 50.566 km of mains from 100 mm diameter to 225 mm diameter
$2,150,530
Water Pumping Stations A 37.5 kw station $123,280
SUB-TOTAL $5,100,819
Asset category Dimension Replacement Value ($M)
Jennings Water Reticulation System 2.757 km of mains from 100 mm diameter to 200 mm diameter
$429,830
SUB-TOTAL $429,830
TOTAL $39,924,947
2.2 Goals and Objectives of Asset Management
See General Asset Management Plan for Details
2.3 Plan Framework
See General Asset Management Plan for Details
2.4 Core and Advanced Asset Management
See General Asset Management Plan for Details

- 4 -
TENTERFIELD SHIRE COUNCIL – WATER SUPPLY ASSET MANAGEMENT PLAN
Key stakeholders in the preparation and implementation of this asset management plan are:
Councillors, Staff and Ratepayers of Tenterfield Shire.
Consultants hired to assist in data collection and reporting.
Council Staff responsible for the development of the plan.
3. LEVELS OF SERVICE
3.1 Customer Research and Expectations
See General Asset Management Plan for Details
3.2 Legislative Requirements
See General Asset Management Plan for Details
3.3 Current Levels of Service
Council has defined service levels in two terms.
Community Levels of Service relate to how the community receives the service in terms of safety, quality, quantity, reliability, responsiveness, cost/efficiency and legislative compliance.
Supporting the community service levels are operational or technical measures of performance developed to ensure that the minimum community levels of service are met. These technical measures in the case of sewage relate to service criteria such as:
Service Criteria Technical measures may relate to
Quality The treated water meeting minimum quality standards set by the relevant State Agency.
Quantity Adequate flow is maintained to meet reasonable demand Availability All town allotments have a potential water connection. Safety Public Health risk is minimised.
Council’s current service levels for each Asset Category are planned for detailing in Table 3.3 of each Asset Category Appendix, in a future asset management plan.
- 5 -
TENTERFIELD SHIRE COUNCIL – WATER SUPPLY ASSET MANAGEMENT PLAN
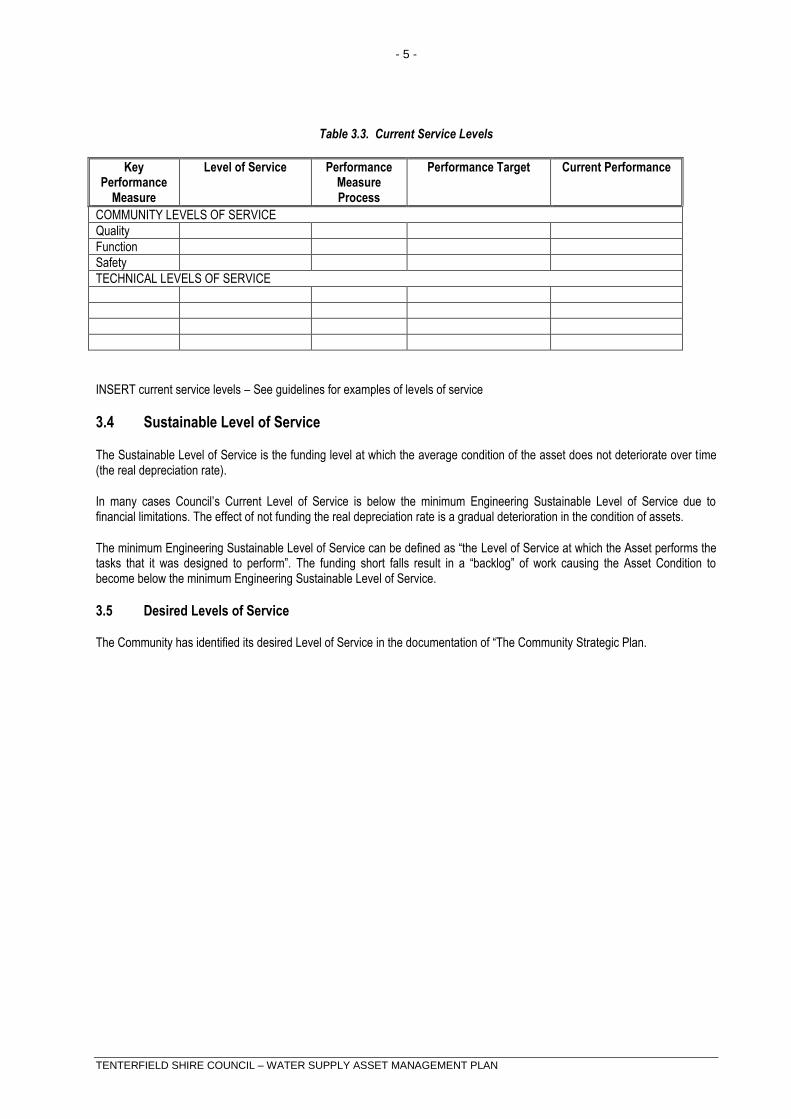
Table 3.3. Current Service Levels
Key Performance
Measure
Level of Service Performance Measure Process
Performance Target Current Performance
COMMUNITY LEVELS OF SERVICE
Quality
Function
Safety
TECHNICAL LEVELS OF SERVICE
INSERT current service levels – See guidelines for examples of levels of service
3.4 Sustainable Level of Service
The Sustainable Level of Service is the funding level at which the average condition of the asset does not deteriorate over time (the real depreciation rate).
In many cases Council’s Current Level of Service is below the minimum Engineering Sustainable Level of Service due to financial limitations. The effect of not funding the real depreciation rate is a gradual deterioration in the condition of assets.
The minimum Engineering Sustainable Level of Service can be defined as “the Level of Service at which the Asset performs the tasks that it was designed to perform”. The funding short falls result in a “backlog” of work causing the Asset Condition to become below the minimum Engineering Sustainable Level of Service.
3.5 Desired Levels of Service
The Community has identified its desired Level of Service in the documentation of “The Community Strategic Plan.
- 6 -
TENTERFIELD SHIRE COUNCIL – WATER SUPPLY ASSET MANAGEMENT PLAN
4. FUTURE DEMAND
4.1 Demand Forecast
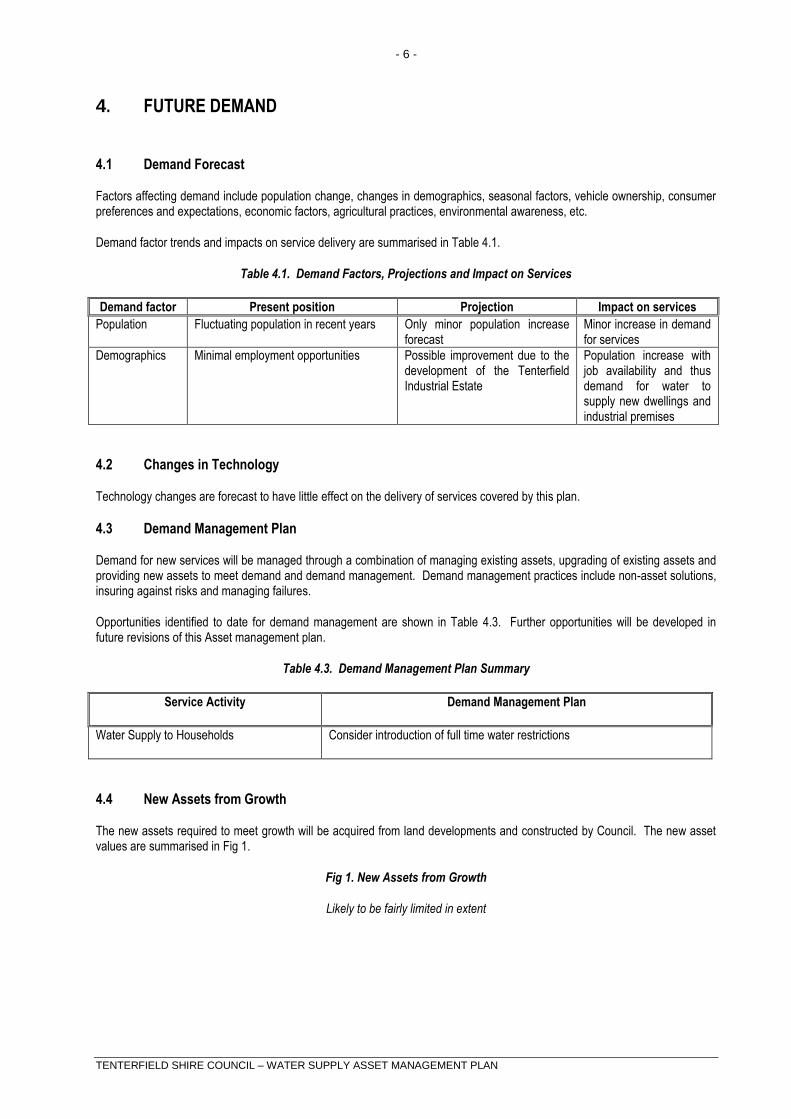
Factors affecting demand include population change, changes in demographics, seasonal factors, vehicle ownership, consumer preferences and expectations, economic factors, agricultural practices, environmental awareness, etc.
Demand factor trends and impacts on service delivery are summarised in Table 4.1.
Table 4.1. Demand Factors, Projections and Impact on Services
Demand factor Present position Projection Impact on services
Population Fluctuating population in recent years Only minor population increase forecast
Minor increase in demand for services
Demographics Minimal employment opportunities Possible improvement due to the development of the Tenterfield Industrial Estate
Population increase with job availability and thus demand for water to supply new dwellings and industrial premises
4.2 Changes in Technology
Technology changes are forecast to have little effect on the delivery of services covered by this plan.
4.3 Demand Management Plan
Demand for new services will be managed through a combination of managing existing assets, upgrading of existing assets and providing new assets to meet demand and demand management. Demand management practices include non-asset solutions, insuring against risks and managing failures.
Opportunities identified to date for demand management are shown in Table 4.3. Further opportunities will be developed in future revisions of this Asset management plan.
Table 4.3. Demand Management Plan Summary
Service Activity Demand Management Plan
Water Supply to Households Consider introduction of full time water restrictions
4.4 New Assets from Growth
The new assets required to meet growth will be acquired from land developments and constructed by Council. The new asset values are summarised in Fig 1.
Fig 1. New Assets from Growth
Likely to be fairly limited in extent
- 7 -
TENTERFIELD SHIRE COUNCIL – WATER SUPPLY ASSET MANAGEMENT PLAN
Acquiring these new assets will commit council to fund ongoing operations and maintenance costs for the period that the service provided from the assets is required. These future costs are identified and considered in developing forecasts of future operating and maintenance costs.
5. LIFECYCLE MANAGEMENT PLAN
The lifecycle management plan details how Council plans to manage and operate the assets at the agreed levels of service (defined in section 3) while optimising life cycle costs.
5.1 Background Data
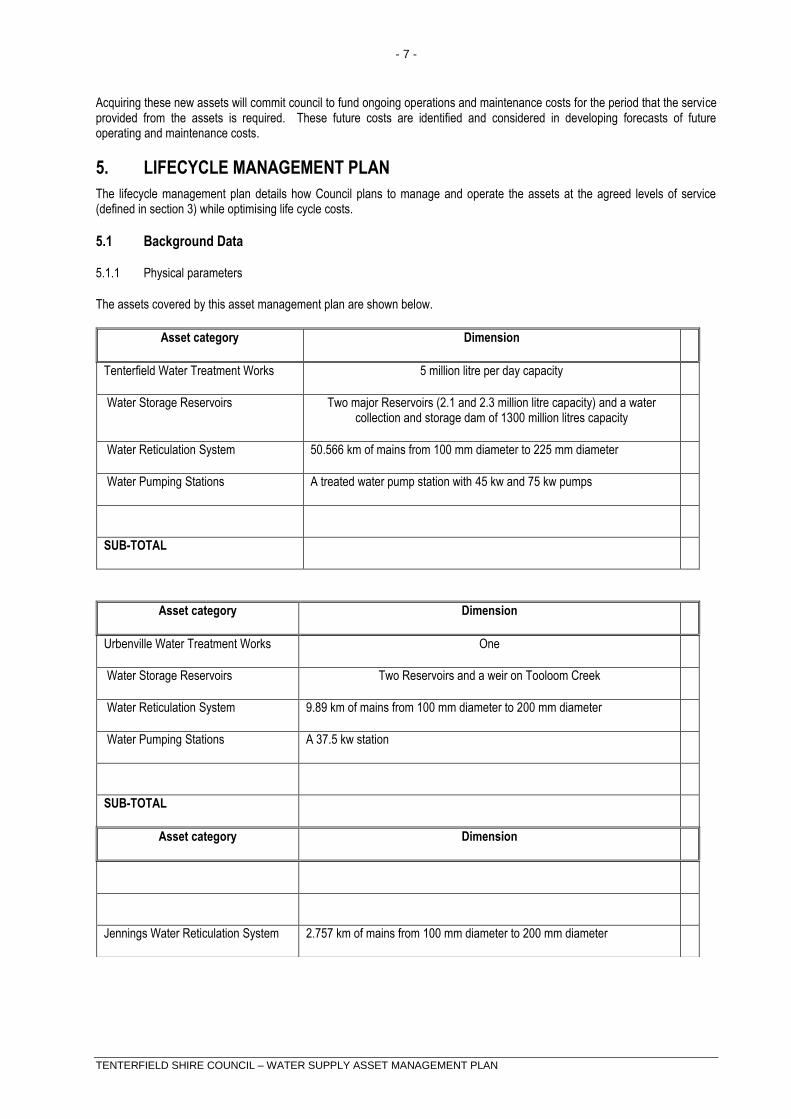
5.1.1 Physical parameters
The assets covered by this asset management plan are shown below.
Asset category Dimension
Tenterfield Water Treatment Works 5 million litre per day capacity
Water Storage Reservoirs Two major Reservoirs (2.1 and 2.3 million litre capacity) and a water collection and storage dam of 1300 million litres capacity
Water Reticulation System 50.566 km of mains from 100 mm diameter to 225 mm diameter
Water Pumping Stations A treated water pump station with 45 kw and 75 kw pumps
SUB-TOTAL
Asset category Dimension
Urbenville Water Treatment Works One
Water Storage Reservoirs Two Reservoirs and a weir on Tooloom Creek
Water Reticulation System 9.89 km of mains from 100 mm diameter to 200 mm diameter
Water Pumping Stations A 37.5 kw station
SUB-TOTAL
Asset category Dimension
Jennings Water Reticulation System 2.757 km of mains from 100 mm diameter to 200 mm diameter

- 8 -
TENTERFIELD SHIRE COUNCIL – WATER SUPPLY ASSET MANAGEMENT PLAN
Fig 2. Asset Age Profile
Graph of asset age profile – Not available at this time
5.1.2 Asset capacity and performance
Council’s services are generally provided to meet design standards where these are available.
Locations where deficiencies in service performance are known are detailed in Table 5.1.2.
Table 5.1.2. Known Service Performance Deficiencies
Location Service Deficiency
Tenterfield Ageing water treatment plant (Initially built in 1930) needs to be considered for replacement in the short to medium term. (Refer to a report from NSW Public Works of January 1996).
Archaic design and decay of much of the civil and mechanical works means that virtually none of the existing plant can be reused, and cost of replacement will need to be estimated on a “brownfield” basis.
Limited dosing capacity for water treatment chemicals.(Currently being addressed).
Also, ageing back up generator needs replacement.
Urbenville None known
Jennings None known
5.1.3 Asset condition
The condition profile of Council’s assets is shown below.
Fig 3. Asset Condition Profile
(This graph is not available at this time
Condition is measured using a 1 – 5 rating system.1
Rating Description of Condition 1 Excellent condition: Only planned maintenance required. 2 Very good: Minor maintenance required plus planned maintenance. 3 Good: Significant maintenance required. 4 Average: Significant renewal/upgrade required. 5 Poor: Unserviceable.
1 IIMM 2006, Appendix B, p B:1-3 (‘cyclic’ modified to ‘planned’)
- 9 -
TENTERFIELD SHIRE COUNCIL – WATER SUPPLY ASSET MANAGEMENT PLAN
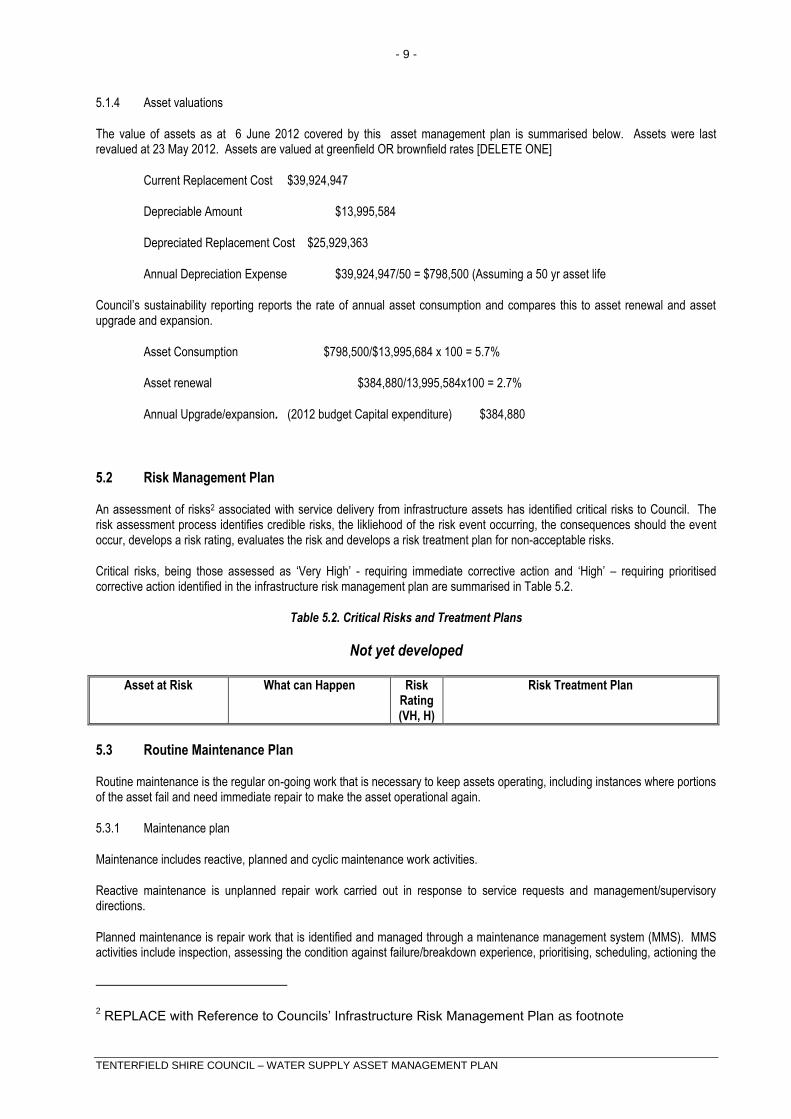
5.1.4 Asset valuations
The value of assets as at 6 June 2012 covered by this asset management plan is summarised below. Assets were last revalued at 23 May 2012. Assets are valued at greenfield OR brownfield rates [DELETE ONE]
Current Replacement Cost $39,924,947
Depreciable Amount $13,995,584
Depreciated Replacement Cost $25,929,363
Annual Depreciation Expense $39,924,947/50 = $798,500 (Assuming a 50 yr asset life
Council’s sustainability reporting reports the rate of annual asset consumption and compares this to asset renewal and asset upgrade and expansion.
Asset Consumption $798,500/$13,995,684 x 100 = 5.7%
Asset renewal $384,880/13,995,584x100 = 2.7%
Annual Upgrade/expansion. (2012 budget Capital expenditure) $384,880
5.2 Risk Management Plan
An assessment of risks2 associated with service delivery from infrastructure assets has identified critical risks to Council. The risk assessment process identifies credible risks, the likliehood of the risk event occurring, the consequences should the event occur, develops a risk rating, evaluates the risk and develops a risk treatment plan for non-acceptable risks.
Critical risks, being those assessed as ‘Very High’ - requiring immediate corrective action and ‘High’ – requiring prioritised corrective action identified in the infrastructure risk management plan are summarised in Table 5.2.
Table 5.2. Critical Risks and Treatment Plans
Not yet developed
Asset at Risk What can Happen Risk Rating (VH, H)
Risk Treatment Plan
5.3 Routine Maintenance Plan
Routine maintenance is the regular on-going work that is necessary to keep assets operating, including instances where portions of the asset fail and need immediate repair to make the asset operational again.
5.3.1 Maintenance plan
Maintenance includes reactive, planned and cyclic maintenance work activities.
Reactive maintenance is unplanned repair work carried out in response to service requests and management/supervisory directions.
Planned maintenance is repair work that is identified and managed through a maintenance management system (MMS). MMS activities include inspection, assessing the condition against failure/breakdown experience, prioritising, scheduling, actioning the
2 REPLACE with Reference to Councils’ Infrastructure Risk Management Plan as footnote
- 10 -
TENTERFIELD SHIRE COUNCIL – WATER SUPPLY ASSET MANAGEMENT PLAN
work and reporting what was done to develop a maintenance history and improve maintenance and service delivery performance.
Cyclic maintenance is replacement of higher value components/sub-components of assets that is undertaken on a regular cycle including repainting, building roof replacement, etc. This work generally falls below the capital/maintenance threshold.
Maintenance expenditure trends are shown in Table 5.3.1
Table 5.3.1. Maintenance Expenditure Trends
Year Maintenance Expenditure
Reactive Planned Cyclic
2004/05 $ $ $
2005/06 $ $ $
2006/07 $ $ $
Planned maintenance work is not yet scheduled.
Maintenance expenditure levels are considered to be adequate OR inadequate to meet required service levels. Future revision of this asset management plan will include linking required maintenance expenditures with required service levels.
Assessment and prioritisation of reactive maintenance is undertaken by Council staff using experience and judgement.
OR
Reactive maintenance is carried out in accordance with response levels of service detailed in Appendix A.
5.3.2 Standards and specifications
Maintenance work is carried out in accordance with the following Standards and Specifications.
List to be developed
5.3.3 Summary of future maintenance expenditures
Future maintenance expenditure is forecast to trend in line with the value of the asset stock as shown in Fig 4.
Fig 4. Planned Maintenance Expenditure
No graph available at this time.
Deferred maintenance, ie works that are identified for maintenance and unable to be funded are to be included in the risk assessment process in the infrastructure risk management plan.
- 11 -
TENTERFIELD SHIRE COUNCIL – WATER SUPPLY ASSET MANAGEMENT PLAN
Maintenance is funded from Council’s operating budget and grants where available. This is further discussed in Section 6.2.
5.4 Renewal/Replacement Plan
Renewal expenditure is major work which does not increase the asset’s design capacity but restores, rehabilitates, replaces or renews an existing asset to its original service potential. Work over and above restoring an asset to original service potential is upgrade/expansion or new works expenditure.
5.4.1 Renewal plan
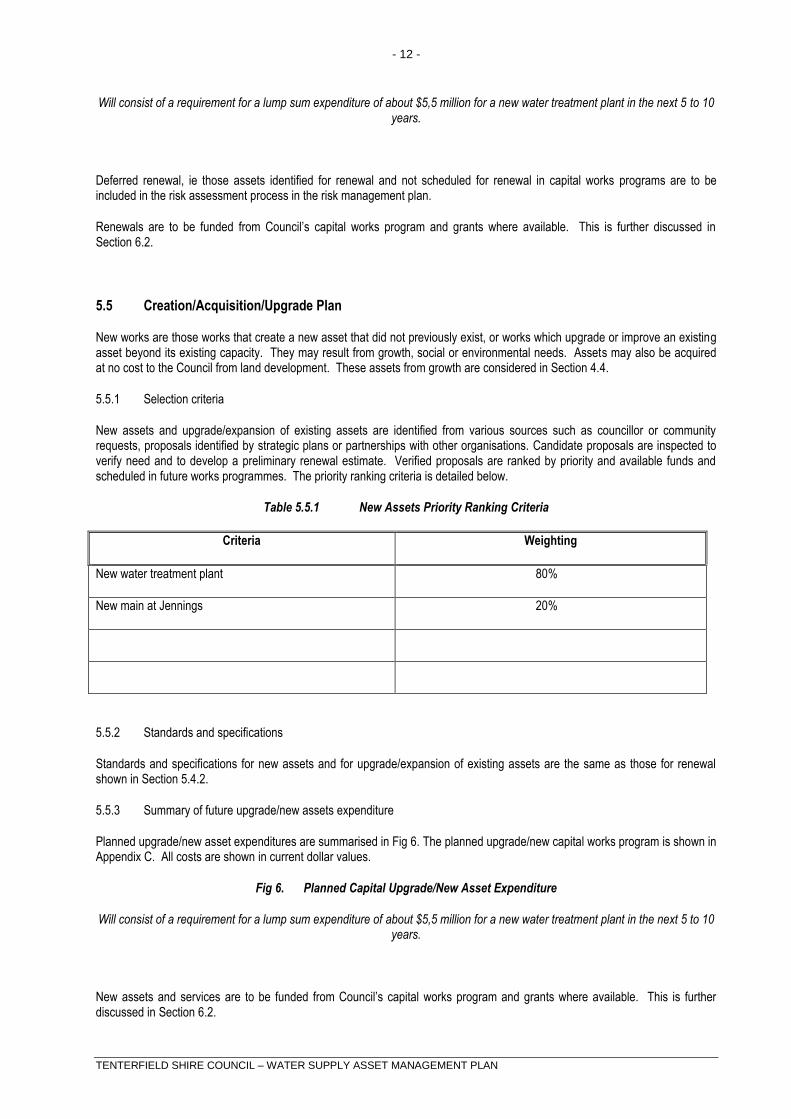
Assets requiring renewal are identified from estimates of remaining life obtained from the asset register worksheets on the ‘Planned Expenditure template’. Candidate proposals are inspected to verify accuracy of remaining life estimate and to develop a preliminary renewal estimate. Verified proposals are ranked by priority and available funds and scheduled in future works programmes. The priority ranking criteria is detailed in Table 5.4.1.
Table 5.4.1 Renewal Priority Ranking Criteria
Criteria Weighting
Replacement/upgrading of ageing water treatment plant Condition rating is “Average” (4) 80%
1 km main replacement (Ballandean Road) at Jennings Condition rating is “ Average:” (4) 20%
Total 100%
Renewal will be undertaken using ‘low-cost’ renewal methods where practical. The aim of ‘low-cost’ renewals is to restore the service potential or future economic benefits of the asset by renewing the assets at a cost less than replacement cost.
Examples of low cost renewal include - Using some of the infrastructure already in place at the old Tenterfield water treatment plant. (Eg reusing the existing sludge lagoon and soon to be installed sludge concentrator).
5.4.2 Renewal standards
Renewal work is carried out in carried out in accordance with the following Standards and Specifications.
Statutory Requirements
5.4.3 Summary of future renewal expenditure
Projected future renewal expenditures are forecast to increase over time as the asset stock ages. The costs are summarised in Fig 5. Note that all costs are shown in current 2012 dollar values.
The projected capital renewal program is shown in Appendix B.
Fig 5. Projected Capital Renewal Expenditure
- 12 -
TENTERFIELD SHIRE COUNCIL – WATER SUPPLY ASSET MANAGEMENT PLAN
Will consist of a requirement for a lump sum expenditure of about $5,5 million for a new water treatment plant in the next 5 to 10 years.
Deferred renewal, ie those assets identified for renewal and not scheduled for renewal in capital works programs are to be included in the risk assessment process in the risk management plan.
Renewals are to be funded from Council’s capital works program and grants where available. This is further discussed in Section 6.2.
5.5 Creation/Acquisition/Upgrade Plan
New works are those works that create a new asset that did not previously exist, or works which upgrade or improve an existing asset beyond its existing capacity. They may result from growth, social or environmental needs. Assets may also be acquired at no cost to the Council from land development. These assets from growth are considered in Section 4.4.
5.5.1 Selection criteria
New assets and upgrade/expansion of existing assets are identified from various sources such as councillor or community requests, proposals identified by strategic plans or partnerships with other organisations. Candidate proposals are inspected to verify need and to develop a preliminary renewal estimate. Verified proposals are ranked by priority and available funds and scheduled in future works programmes. The priority ranking criteria is detailed below.
Table 5.5.1 New Assets Priority Ranking Criteria
Criteria Weighting
New water treatment plant 80%
New main at Jennings 20%
5.5.2 Standards and specifications
Standards and specifications for new assets and for upgrade/expansion of existing assets are the same as those for renewal shown in Section 5.4.2.
5.5.3 Summary of future upgrade/new assets expenditure
Planned upgrade/new asset expenditures are summarised in Fig 6. The planned upgrade/new capital works program is shown in Appendix C. All costs are shown in current dollar values.
Fig 6. Planned Capital Upgrade/New Asset Expenditure
Will consist of a requirement for a lump sum expenditure of about $5,5 million for a new water treatment plant in the next 5 to 10 years.
New assets and services are to be funded from Council’s capital works program and grants where available. This is further discussed in Section 6.2.

- 13 -
TENTERFIELD SHIRE COUNCIL – WATER SUPPLY ASSET MANAGEMENT PLAN
5.6 Disposal Plan
Disposal includes any activity associated with disposal of a decommissioned asset including sale, demolition or relocation. Assets identified for possible decommissioning and disposal are shown in Table 5.6. These assets will be further reinvestigated to determine the required levels of service and see what options are available for alternate service delivery, if any.
Table 5.6 Assets identified for Disposal
None identified
Asset Reason for Disposal Timing Cashflow from disposal
Where cashflow projections from asset disposals are not available, these will be developed in future revisions of this asset management plan.
6. FINANCIAL SUMMARY
This section contains the financial requirements resulting from all the information presented in the previous sections of this asset management plan. The financial projections will be improved as further information becomes available on desired levels of service and current and projected future asset performance.
6.1 Financial Statements and Projections
The financial projections are shown in Fig 7 for projected operating (operations and maintenance) and capital expenditure (renewal and upgrade/expansion/new assets).
Fig 7. Planned Operating and Capital Expenditure
At this point in time, the only information available is the current budget for 2011/2012.
Note that all costs are shown in current 2011/2012 dollar values.
6.1.1 Sustainability of service delivery
There are two key indicators for financial sustainability that have been considered in the analysis of the services provided by this asset category, these being long term life cycle costs and medium term costs over the 10 year financial planning period.
Long term - Life Cycle Cost
Life cycle costs (or whole of life costs) are the average costs that are required to sustain the service levels over the longest asset life. Life cycle costs include maintenance and asset consumption (depreciation expense). The annual average life cycle cost for the services covered in this asset management plan is $1,842,890.
Life cycle costs can be compared to life cycle expenditure to give an indicator of sustainability in service provision. Life cycle expenditure includes maintenance plus capital renewal expenditure. Life cycle expenditure will vary depending on the timing of asset renewals. The life cycle expenditure at the start of the plan is $1,429,265.
A gap between life cycle costs and life cycle expenditure gives an indication as to whether present consumers are paying their share of the assets they are consuming each year. The purpose of this water asset management plan is to identify levels of

- 14 -
TENTERFIELD SHIRE COUNCIL – WATER SUPPLY ASSET MANAGEMENT PLAN
service that the community needs and can afford and develop the necessary long term financial plans to provide the service in a sustainable manner.
The life cycle gap for services covered by this asset management plan is $413,515 per annum. The life cycle sustainability index is 0.78
Medium term – 10 year financial planning period
This asset management plan identifies the estimated maintenance and capital expenditures required to provide an agreed level of service to the community over a 20 year period for input into a 10 year financial plan and funding plan to provide the service in a sustainable manner.
This may be compared to existing or planned expenditures in the 20 year period to identify any gap. In a core asset management plan, a gap is generally due to increasing asset renewals.
Fig 8 shows the projected asset renewals in the 20 year planning period from the asset register. The projected asset renewals are compared to planned renewal expenditure in the capital works program and capital renewal expenditure in year 1 of the planning period as shown in Fig 8. Table 6.1.1 shows the annual and cumulative funding gap between projected and planned renewals.
Fig 8. Projected and Planned Renewals and Current Renewal Expenditure
To be determined
Table 6.1.1 shows the gap between projected and planned renewals.
Table 6.1.1 Projected and Planned Renewals and Expenditure Gap
Year Projected Renewals Planned Renewals Renewal Funding Gap Cumulative Gap
INSERT projected and planned renewals in Table 6.1.1 and calculate yearly and cumulative renewal funding gaps.
Providing services in a sustainable manner will require matching of projected asset renewals to meet agreed service levels with planned capital works programs and available revenue.
A gap between projected asset renewals, planned asset renewals and funding indicates that further work is required to manage required service levels and funding to eliminate any funding gap.
Council will manage the ‘gap’ by developing this asset management plan to provide guidance on future service levels and
resources required to provide these services, and failure to do so will result in a reduced level of service and possible failure to meet statutory environmental standards.
.
Council’s long term financial plan covers the first 10 years of the 20 year planning period. The total maintenance and capital renewal expenditure required over the 10 years is 10 years of current budget for water supply plus 10 times $798,500.= $18,428,900

- 15 -
TENTERFIELD SHIRE COUNCIL – WATER SUPPLY ASSET MANAGEMENT PLAN
.
This is an average expenditure of 2012 water supply budget plus $798,500. Estimated maintenance and capital renewal expenditure in year 1 is 2012 water supply budget plus $384,880. The 10 year sustainability index is 0.78.
6.2 Funding Strategy
Projected expenditure identified in Section 6.1 is to be funded from Council’s operating and capital budgets. The funding strategy is detailed in the Council’s 10 year long term financial plan.
Achieving the financial strategy will possibly require a community sanctioned reduced level of service.
6.3 Valuation Forecasts
Asset values are forecast to increase as additional assets are added to the asset stock from construction and acquisition by Council and from assets constructed by land developers and others and donated to Council. Fig 9 shows the projected replacement cost asset values over the planning period in current 2012 dollar values.
Fig 9. Projected Asset Values
Not likely to increase by more than 5 – 10% over the next 20 years
Depreciation expense values are forecast in line with asset values as shown in Fig 10.
Fig 10. Projected Depreciation Expense
Likely to remain fairly constant-indexed for inflation.
The depreciated replacement cost (current replacement cost less accumulated depreciation) will vary over the forecast period depending on the rates of addition of new assets, disposal of old assets and consumption and renewal of existing assets. Forecast of the assets’ depreciated replacement cost is shown in Fig 11.
Fig 11. Projected Depreciated Replacement Cost
Insert graph of projected depreciated replacement cost – see guidelines for details.
6.4 Key Assumptions made in Financial Forecasts
This section details the key assumptions made in presenting the information contained in this asset management plan and in preparing forecasts of required operating and capital expenditure and asset values, depreciation expense and carrying amount estimates. It is presented to enable readers to gain an understanding of the levels of confidence in the data behind the financial forecasts.
Key assumptions made in this asset management plan are:
Limited population growth (5-10%) in Tenterfield Shire in the next 20 years
- 16 -
TENTERFIELD SHIRE COUNCIL – WATER SUPPLY ASSET MANAGEMENT PLAN
Limited reduction of maintenance costs due to new technology
Ongoing shortage of skilled technical and engineering staff for at least the next 10 years
Ongoing funding difficulties for rural local government.
Accuracy of future financial forecasts may be improved in future revisions of this asset management plan by the following actions.
Securing skilled senior technical staffl experienced in developing asset management plans
Urgent attention to completion of the asset data base on size, age, value, remaining life of the network
- 17 -
TENTERFIELD SHIRE COUNCIL – WATER SUPPLY ASSET MANAGEMENT PLAN
7. ASSET MANAGEMENT PRACTICES
See General Asset Management Plan for Details
8. PLAN IMPROVEMENT AND MONITORING
8.1 Performance Measures
See General Asset Management Plan for Details
8.2 Improvement Plan
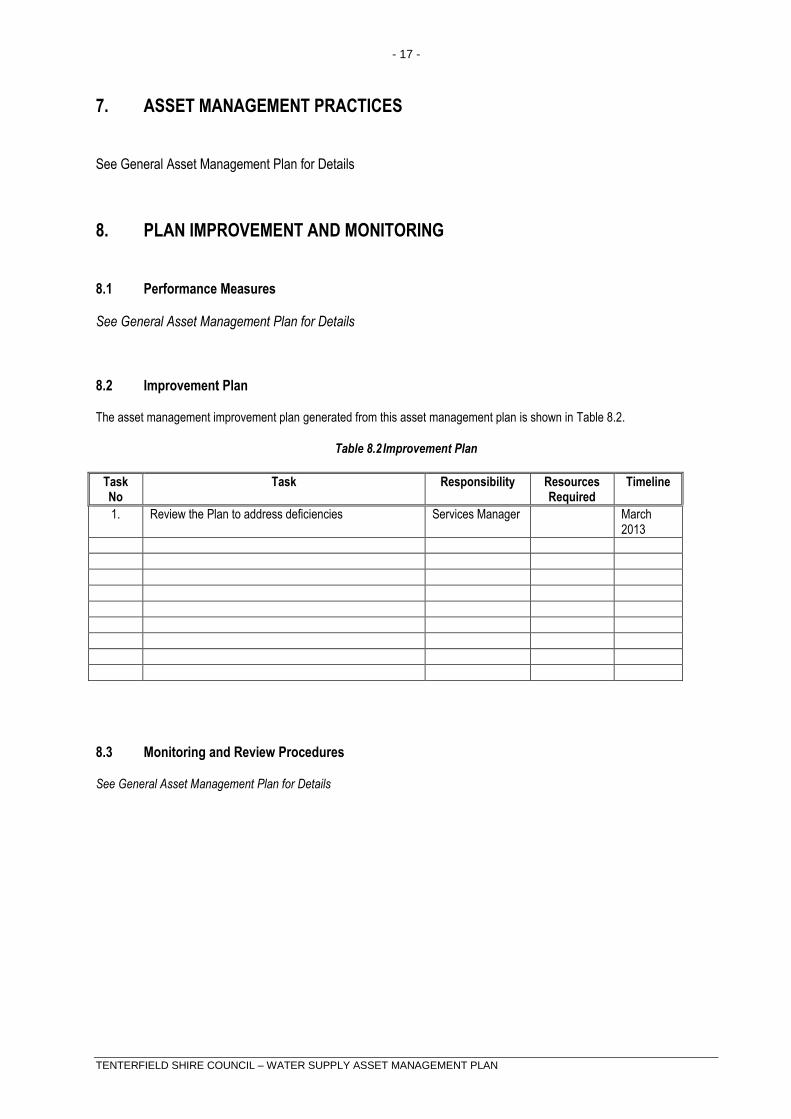
The asset management improvement plan generated from this asset management plan is shown in Table 8.2.
Table 8.2 Improvement Plan
Task No
Task Responsibility Resources Required
Timeline
1. Review the Plan to address deficiencies Services Manager March 2013
8.3 Monitoring and Review Procedures
See General Asset Management Plan for Details

- 18 -
TENTERFIELD SHIRE COUNCIL – WATER SUPPLY ASSET MANAGEMENT PLAN
REFERENCES
Sample Council, ‘Strategic Management Plan 20XX – 20XX,
Sample Council, ‘Annual Plan and Budget.
DVC, 2006, ‘Asset Investment Guidelines’, ‘Glossary’, Department for Victorian Communities, Local Government Victoria, Melbourne, http://www.dvc.vic.gov.au/web20/dvclgv.nsf/allDocs/RWP1C79EC4A7225CD2FCA257170003259F6?OpenDocument
IPWEA, 2006, ‘International Infrastructure Management Manual’, Institute of Public Works Engineering Australia, Sydney, www.ipwea.org.au