water supply asset management plan 2018 - 2028...stoke high level reservoir . nelson city council...
TRANSCRIPT
Nelson City Council
Water Supply
Asset Management Plan
2018 - 2028
Nelson City Council
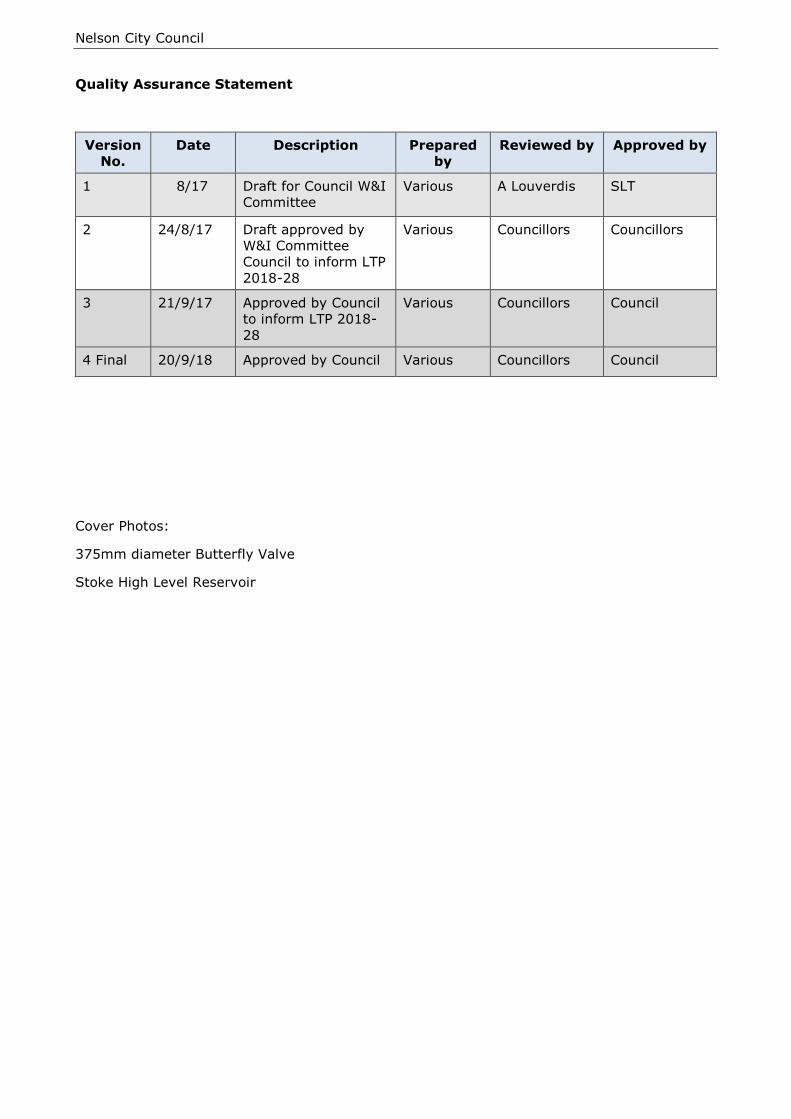
Quality Assurance Statement
Version
No.
Date Description Prepared
by
Reviewed by Approved by
1 8/17 Draft for Council W&I
Committee
Various A Louverdis SLT
2 24/8/17 Draft approved by
W&I Committee
Council to inform LTP
2018-28
Various Councillors Councillors
3 21/9/17 Approved by Council
to inform LTP 2018-
28
Various Councillors Council
4 Final 20/9/18 Approved by Council Various Councillors Council
Cover Photos:
375mm diameter Butterfly Valve
Stoke High Level Reservoir

Nelson City Council
Water Supply Asset Management Plan 2018-2028 (A1620958) Page iii
CONTENTS
Executive summary ........................................................................................ 1
i. The purpose of the plan ........................................................................... 1
ii. Asset description ..................................................................................... 1
iii. Key issues .............................................................................................. 4
iv. Levels of service ................................................................................... 14
v. Future demand ..................................................................................... 17
vi. Lifecycle management plan .................................................................... 20
vii. Risk management plan .......................................................................... 24
viii. Financial summary ................................................................................ 25
ix. Asset management practices .................................................................. 28
x. Monitoring and improvement programme ................................................. 28
1.1. Background .......................................................................................... 31
1.2. Goals and objectives of asset ownership .................................................. 41
1.3. AM Maturity .......................................................................................... 43
2.1. Customer research and expectations ....................................................... 44
2.2. Strategic and corporate goals ................................................................. 48
2.3. Legislative requirements ........................................................................ 48
2.4. Current level of service .......................................................................... 55
2.5. Desired level of service .......................................................................... 70
3.1. Demand drivers .................................................................................... 74
3.2. Demand forecasts ................................................................................. 77
3.3. Demand impacts on assets ..................................................................... 83
3.4. Demand management plan..................................................................... 83
3.5. Asset programmes to meet demand ........................................................ 87
4.1. Background data ................................................................................... 94
4.2. Operations and maintenance plan ......................................................... 117
4.3. Renewal/Replacement Plan ................................................................... 122
4.4. Creation/Acquisition/Augmentation plan ................................................. 128
4.5. Disposal plan ...................................................................................... 134
5.1. Critical assets ..................................................................................... 135

Nelson City Council
Water Supply Asset Management Plan 2018-2028 (A1620958) Page iv
5.2. Risk assessment ................................................................................. 141
5.3. Infrastructure resilience approach ......................................................... 145
6.1. Financial statements and projections ..................................................... 150
6.2. Funding strategy ................................................................................. 155
6.3. Valuation forecasts .............................................................................. 157
6.4. Key assumptions made in financial forecasts .......................................... 159
6.5. Forecast reliability and confidence ......................................................... 159
7.1. Asset management leadership and structure .......................................... 162
7.2. Management systems .......................................................................... 162
7.3. Information systems ............................................................................ 166
7.4. Service delivery models ....................................................................... 169
8.1. Status of AM practice ........................................................................... 170
8.2. Improvement programme .................................................................... 171
8.3. Monitoring and review procedures ......................................................... 172
8.4. Performance measures ........................................................................ 172
APPENDIX A: GLOSSARY OF TERMS ...................................................... 173
APPENDIX B: WATER SUPPLY CONSERVATION STRATEGY ........................ 182
APPENDIX C: LIFELINES ...................................................................... 184
APPENDIX D: NELSON CITY COUNCIL ADVANCED ASSET MANAGEMENT GAP
ANALYSIS - WATER ......................................................... 191
APPENDIX E: WATER LOSSES EVALUATION ........................................... 202
APPENDIX F: ACTIVE LEAKAGE CONTROL PLAN ...................................... 211
APPENDIX G: SCHEMATICS .................................................................. 212
APPENDIX H: PRESSURE REDUCTION PLAN. ........................................... 213
APPENDIX I: INFRASTRUCTURE PLANNING PROCESS FOR GROWTH PROJECTS ...................................................................... 219
APPENDIX J: 30 YEAR INFRASTRUCTURE STRATEGY............................... 220
APPENDIX K: RISK .............................................................................. 225
APPENDIX L: NELSON WATER TREATMENT PLANT ASSET MANAGEMENT PLAN
(A1111654) (A717945) .................................................... 231
APPENDIX M: SOLUTIONS TO FIRE FLOW LEVEL OF SERVIC (A706990) ..... 238
Nelson City Council
Water Supply Asset Management Plan 2018-2028 (A1620958) Page v
LIST OF TABLES
Table ES-1: Summary of Water Services Assets June 2016 ...................... 1
Table ES-2: Levels of Service table 2018 -2028 .................................... 14
Table ES-3: Future demand ................................................................ 17
Table ES-4: Nominal Working Life of Water Assets (Years) ..................... 20
Table ES-5: Water Expenditure Years 1-10 of the 2018/28 Long Term Plan ..................................................................................... 26
Table ES-6: Improvement Programme ................................................. 29
Table 1-1: Backflow Prevention Programme ........................................ 32
Table 1-2: Summary of Water Services Assets (June 2016) .................. 37
Table 1-3: Key Partners and Stake Holders ......................................... 40
Table 2-1: Water Supply Consultation Processes ................................. 44
Table 2-2: Link between Community Outcomes and the Water Supply Activity ........................................................................... 48
Table 2-3: Water Resource Consents ................................................. 51
Table 2-4: Negative Effects – The Water supply Activity ....................... 55
Table 2-5: Outlines the current levels of service for 2015-25 ................ 56
Table 2-6: Ministry of Health Suggested Grading ................................. 60
Table 2-7: Ministry of Health Grading Schedule ................................... 60
Table 2-8: Distribution zone grading .................................................. 61
Table 2-9: Distribution demerit points 2008 – 2016 ............................. 62
Table 2-10: Urgent Maximum Response Times ..................................... 69
Table 2-11: Non Urgent Maximum Response Times ............................... 69
Table 2-12: Proposed Levels of Service ................................................ 70
Table 3-1: Water Demand Drivers ..................................................... 74
Table 3-2: Raw Water and Treated Water Demand .............................. 77
Table 3-3: Peak Daily Demand .......................................................... 79
Table 3-4: Total Annual Demand ....................................................... 80
Table 3-5: Demand Management Strategies ....................................... 83
Table 3-6: Proposed Reservoirs ......................................................... 89
Table 4-1: Asset Lifecycle ................................................................. 90
Table 4-2: Asset Failure Modes ......................................................... 90
Table 4-3: Lifecycle Management Programmes ................................... 91
Table 4-4: Management Strategies .................................................... 92
Table 4-5: Summary of Assets as per June 2016 valuation ................... 95
Table 4-6: Water Mains Lengths by Material as at November 2017 ........ 95
Table 4.7: Working Life of Water Reticulation Assets (Years) .............. 100
Table 4-8: Working Life of Water Assets (Years) ............................... 104
Nelson City Council
Water Supply Asset Management Plan 2018-2028 (A1620958) Page vi
Table 4-9: Current Reservoirs ......................................................... 106
Table 4-10: Small Concrete Tanks in Network..................................... 106
Table 4-11: Reservoir Design Categories ............................................ 107
Table 4-12: Current Reservoirs ......................................................... 111
Table 4-13: Small Concrete Tanks ..................................................... 111
Table 4-14: Best Estimate of Condition of Asbestos Cement Watermains 113
Table 4-15: Best Estimate of Condition of Cast Iron Watermains ........... 113
Table 4-16: Tonkin & Taylor 2016 Dam Safety Review Summary of dam
condition ...................................................................... 114
Table 4-17: Water Supply Asset Valuation - June 2016 ........................ 115
Table 4-18: Operations and Maintenance Strategies ............................ 119
Table 4-19: Water 10 Year Operations and Maintenance Projections ($000) ................................................................................... 121
Table 4-20: Renewal Strategies ........................................................ 123
Table 4-21: Water 10 Year Renewal Projections ($000) ....................... 127
Table 4-22: Selection Strategy ......................................................... 129
Table 4-23: Creation/Acquisition/Augmentation Strategies ................... 130
Table 4-24: Water 10 Year Creation/Acquisition/Augmentation Projections
($000) ......................................................................... 133
Table 4-25: Disposal Strategies ........................................................ 134
Table 5-1: Water Supply Risk Register ............................................ 143
Table 5-2: Water Supply Insurance Provisions .................................. 146
Table 5-3: Risk Reduction, Readiness, Response and Recovery Status . 148
Table 6-1: Water Expenditure Years 1-10 of the 2018/28 Long Term Plan ($000) ......................................................................... 152
Table 6-2: Water Supply Asset Valuation - June 2016 ........................ 157
Table 6-3: 2014 Water Supply Asset Valuation .................................. 158
Table 6-4: Significant Forecasting Assumptions and Uncertainties ....... 159
Table 8-1: Improvement Programme ............................................... 171
Appendix Table A-1: Meaning of Words .......................................................... 173
Appendix Table A-2: Acronyms .................................................................... 179
Appendix Table A-3: Geographical Information System List of Code Definitions used by Nelson City Council .................................................... 180
Appendix Table D-1: Gap Analysis - Water...................................................... 191
Appendix Table D-2: Asset Management Gap Analysis ...................................... 195
Appendix Table D-3: Plan Upgrade History ...................................................... 200
Appendix Table J-1: Water Supply Operation and Maintenance Projections
Figures are in 2015 dollars and will be adjusted for inflation in each Annual Plan. .......................................................... 221
Appendix Table J-2: Water Supply Renewals Projections .................................. 221
Nelson City Council
Water Supply Asset Management Plan 2018-2028 (A1620958) Page vii
Appendix Table J-3: Water Supply Capital Expenditure Projections.................... 222
Appendix Table K-1: Water Supply Risk Register ............................................. 225
Appendix Table K-2: Consequence Rating (Impact) ......................................... 228
Appendix Table K-3: Risk Matrix – Consequences x Likelihood .......................... 229
Appendix Table K-4: Residual Risk Tolerance .................................................. 230
Appendix Table M-1: Maitai Pipeline (over next five years) ................................ 241
Appendix Table M-2: Damwatch Engineering Maitai Dam 2013 Comprehensive Safety Review recommendations: .................................... 242
Appendix Table M-3: Total Monthly Demand ................................................... 245
Appendix Table M-4: Historical Asset Valuations ............................................... 246
Nelson City Council
Water Supply Asset Management Plan 2018-2028 (A1620958) Page viii
LIST OF FIGURES
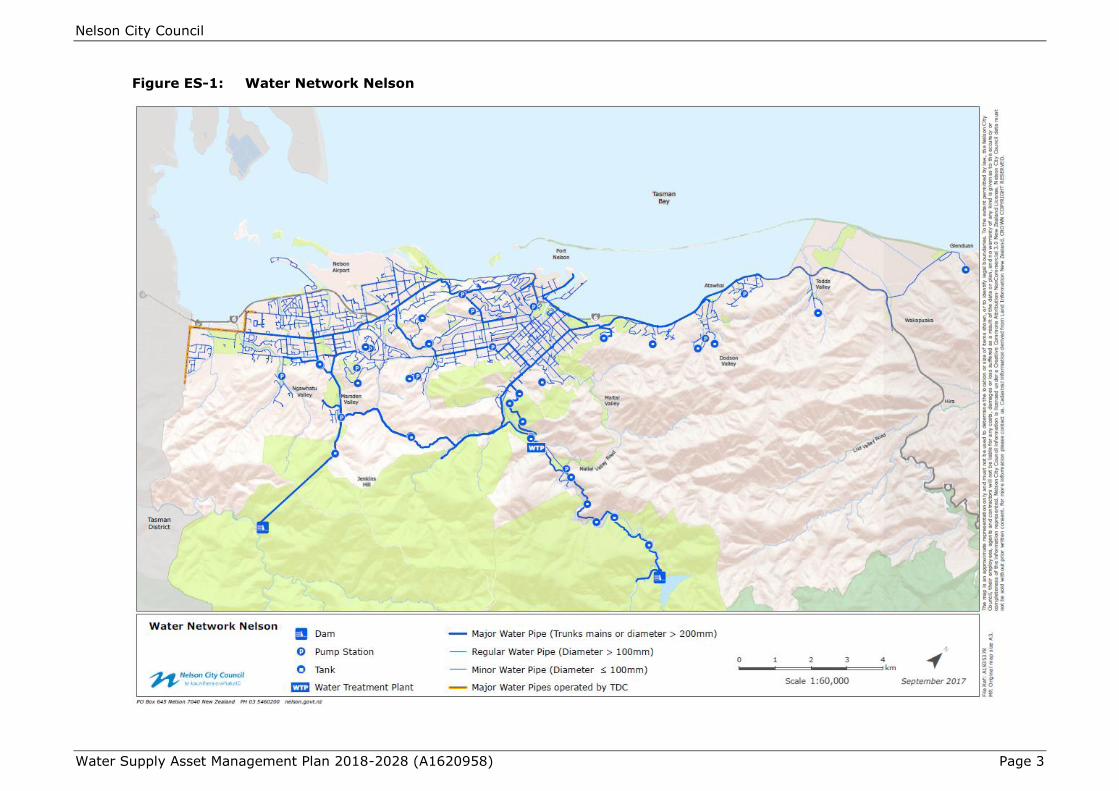
Figure ES-1: Water Network Nelson ........................................................ 3
Figure ES-2: Population and household projections (high), 2018-2028, Nelson ............................................................................ 10
Figure ES-3: Infrastructure Leakage Index for Nelson ............................. 11
Figure ES-4: Nelson Growth Areas and Infrastructure Timing ................... 19
Figure ES-5: Peak Water Demand ........................................................ 20
Figure ES-6: Estimated Replacement Value / Material Distribution ............ 22
Figure ES-7: Theoretical Renewal Year / Material Distribution .................. 23
Figure ES-8: Water proposed expenditure to 2027/28 ............................. 25
Figure 1-1: Water Network Nelson ...................................................... 39
Figure 3-1: Peak Water Demand ........................................................ 78
Figure 3-2: Population and household projections (high), 2018-2028, Nelson ............................................................................ 81
Figure 3-3: Population Age Trends ...................................................... 82
Figure 3-5: Infrastructure Leakage Index for Nelson ............................. 85
Figure 3-6: World Bank Banding System for Infrastructure Leakage Index
..................................................................................... 85
Figure 4-1: Year of Installation / Material Distribution ........................... 97
Figure 4-2: Estimated Replacement Value / Material Distribution ............ 98
Figure 4-3: Theoretical Renewal Year / Material Distribution .................. 99
Figure 4-4: Graph of Recent Expenditure ........................................... 116
Figure 4-5: Water Main Failures ....................................................... 123
Figure 5-1: Interventions for Critical Assets ....................................... 136
Figure 5-2: Interventions for Non-Critical Assets ................................ 136
Figure 5-3: Interdependency Matrix – Business As Usual ..................... 149
Figure 5-4: Interdependency Matrix – During / Post Disaster Event ...... 150
Figure 6-1: Proposed Expenditure .................................................... 154
Figure 6-2: Recent Expenditure ........................................................ 154
Figure 6-3: Forecasts of depreciation ................................................ 158
Figure 7-1: Asset Information Systems ............................................. 166
Figure 8-1: Current and desired state of AM processes, data and systems
................................................................................... 170
Appendix Figure B-1: Maitai Reservoir Level .................................................... 183
Appendix Figure E-1: The Water Balance Data for 2012/13 Financial Year (latest available) ..................................................................... 203
Appendix Figure E-2: Sources of Water Losses ................................................. 203
Appendix Figure E-3: The Four Components of Managing Apparent Losses .......... 208
Appendix Figure E-4: The Four Components of Managing Real Losses ................. 209
Nelson City Council
Water Supply Asset Management Plan 2018-2028 (A1620958) Page ix
Appendix Figure G-1: Supervisory Control and Data Acquisition Schematic. ......... 212
Appendix Figure I-1: Growth Areas ................................................................ 219
Nelson City Council
Water Supply Asset Management Plan 2018-2028 (A1620958) Page 1
Executive summary
i. The purpose of the plan
The Water Supply Asset Management Plan outlines the current and future operational
requirements needed to meet customers’ needs in a cost effective manner.
This plan focuses on ensuring assets are operated and maintained to provide the
desired level of service, and to meet the current and future community outcomes in a
sustainable manner.
The Goal of the Water Supply Activity is to provide a water supply to Nelson
City that is capable of abstracting, treating and distributing potable water in
an efficient, safe, reliable and sustainable way whilst ensuring that the
ecological, recreational and cultural interests of the community in the water
sources are recognised and enhanced.
The overall objective of Asset Management planning is to:
Meet a required level of service, in the most cost effective manner, through
the management of assets for present and future customers.
This plan will provide the substantiation for budget forecasts put forward in the Long
Term Plan (2018-2028) for water supply.
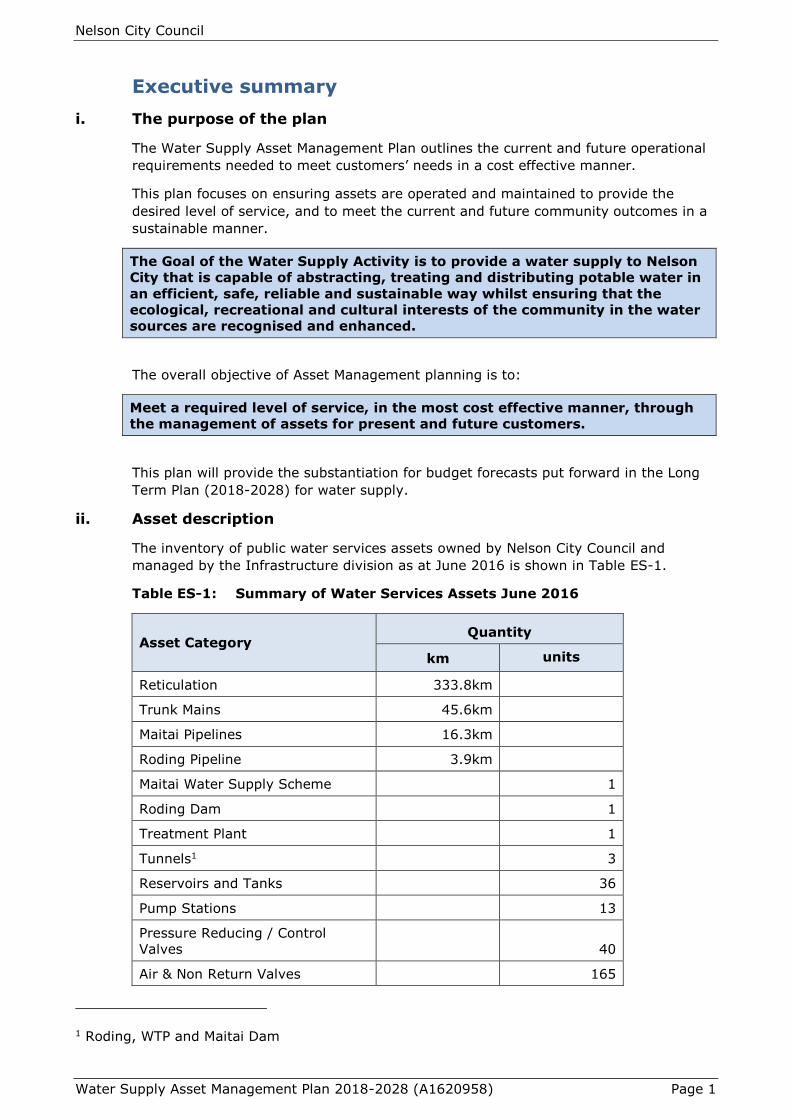
ii. Asset description
The inventory of public water services assets owned by Nelson City Council and
managed by the Infrastructure division as at June 2016 is shown in Table ES-1.
Table ES-1: Summary of Water Services Assets June 2016
Asset Category Quantity
km units
Reticulation 333.8km
Trunk Mains 45.6km
Maitai Pipelines 16.3km
Roding Pipeline 3.9km
Maitai Water Supply Scheme 1
Roding Dam 1
Treatment Plant 1
Tunnels1 3
Reservoirs and Tanks 36
Pump Stations 13
Pressure Reducing / Control
Valves 40
Air & Non Return Valves 165
1 Roding, WTP and Maitai Dam

Nelson City Council
Water Supply Asset Management Plan 2018-2028 (A1620958) Page 2
Asset Category Quantity
km units
Gate Valves 3,634
Manholes 91
Hydrants 2,559
Meters 20,829
Customer Connections 20,260
Nelson City Council
Water Supply Asset Management Plan 2018-2028 (A1620958) Page 3
Figure ES-1: Water Network Nelson

Nelson City Council
Water Supply Asset Management Plan 2018-2028
(A1620958) Page 4
iii. Key issues
Council’s priorities between 2018 and 2028 for the wastewater activity will focus on
the following areas:
Sustainable development.
This needs to be the focus of all parts of the water supply activity in order to
ensure the city can accommodate future growth affordably while recognising the
wider environmental, cultural and social values that the community identify as
making Nelson a special place. The following are some of the current initiatives
that this asset management plan can build on:
o Wider inter-departmental and community involvement to improve
freshwater quality and quantity available to the rivers at the source.
Council’s water supply activity is the single largest abstractor of water from
the Maitai and Roding rivers. As such it directly impacts on the quantity of
water available in these two rivers. Council funds a variety of non-
regulatory environmental and behaviour changing programmes such as
riparian planting and water conservation education.
o Stream water way environmental enhancement eg river bank shade
through vegetation planting adjacent the Maitai dam.
o Streams and rivers to be free of manufactured obstructions that impede
fish passage. Fish ladders are in place on the intake weir of the south
branch of the Maitai River and fish ‘trap and transfer’ programmes are
required for the Maitai and Roding dams to ensure natural fish populations
are supported and replenished in the upper catchments.
o Support for development of alternative/emergency supplies such as
rainwater harvesting, particularly where there is no reticulation.
Compliance with the National Policy Statement for Freshwater
Management and other Central Government freshwater reforms such as the
Clean Water Package.
Council, iwi and the wider community are developing environmental
standards for streams and rivers in Nelson based on the requirements of
the National Policy Statement. These standards are expected to be the
basis of rules in the proposed Whakamahere Whakatū Nelson Plan and will
set the scene for water quality improvements into the future. Although
rules are yet to be finalised, the following activities that impact fresh water
will need to take note of any changes to rules from the date of notification
of the proposed plan:
o Council’s water supply activity relies on water sourced directly from the
Maitai and Roding rivers and as such has a day to day impact on the
quantity of water available in the rivers.
o The Maitai Dam reservoir is used to supplement flows in the Maitai River by
replacing the water abstracted from the south branch with water stored in
the dam. No storage is available at the Roding Dam and flow augmentation
is not possible.
Water quality- Maitai Dam Aeration
The Maitai Dam reservoir is subject to seasonal variations in oxygen content
over its depth. During the summer months this variation becomes pronounced
Nelson City Council
Water Supply Asset Management Plan 2018-2028
(A1620958) Page 5
with lower levels of the dam becoming very low in oxygen (anoxic). The lack of
oxygen creates a number of issues for Council:
o Leads to a challenging environment for aquatic organisms.
o Results in elevated levels of iron and manganese in the water as these
chemicals become soluble. Using this water to supplement flows in the
Maitai River has the potential to lead to adverse environmental impacts in
the river.
o Likewise the water would need to be conditioned before it could be used as
part of the potable supply.
The most appropriate way to overcome this condition is to aerate the reservoir
and mix the water to prevent the loss of oxygen in the bottom layer. The
techniques used to achieve this are already used in New Zealand in some of the
larger water storage lakes in the North Island.
A budget for this work has been shown in the first five years of the plan with
construction in 2022/23.
Development of resilient infrastructure to address climate change
predictions and other natural hazards.
Best advice to date from the Ministry for the Environment and the National
Institute of Water and Atmospheric Studies is that we can anticipate more
extremes in our weather including increased droughts and extreme rainfall
events.
A feature of a largely gravity based run of river supply such as Nelson’s is that
we are dependent upon a continuous flow of clear water in rivers that are some
distance away from the treatment plant. High levels of sediment or organic
material in the water can lead to damage to pipes and infrastructure and
difficulties sterilising the water of harmful bacteria. The distance between intakes
and the treatment plant introduces a vulnerability that comes with very long
pipelines (some of them on above ground benches and within tunnels) that cross
earthquake faults, streams and rivers.
The keys to the resilience of the supply side of the network are:
o The Maitai Dam reservoir. This allows 3.5 million cubic metres of water to
be stored as a buffer against droughts and extended periods of rain that
discolours the rivers.
o The duplicate raw water delivery lines from the Maitai intakes. The original
supply line is largely sited on an above ground bench that follows the
course of the river and the recently installed duplicate line is buried in the
Maitai roadway. These duplicate delivery pipes provide security against
damage to one or the other pipeline.
o The ultra-filtration process at the water treatment plant. The filters in the
water treatment plant can remove dissolved organic material and sediment
and can use a variety of raw water sources. Completion of the renewal of
the existing membranes is programmed for 2018/19.
On the delivery side the network is open to many of the same vulnerabilities,
with above ground trunk mains and pipes crossing earthquake faults, streams
and rivers. In coastal areas liquefaction is recognised as a potential risk to the
network.
Nelson City Council
Water Supply Asset Management Plan 2018-2028
(A1620958) Page 6
Resilience comes in the form of an interlinked network that can direct water
throughout the city when parts may be damaged and water storage reservoirs
that can hold approximately a day’s supply of potable water.
Natural Hazard Security of the network in light of the recent Canterbury
and Kaikoura Earthquakes and storm events, including wider network
hazards- Earthquake fault line and liquefaction.
Recent work by Council has focussed on natural hazards that might impact on
the city, in particular:
o Direct damage from Earthquake shaking;
o Damage from liquefaction in susceptible areas;
o Damage from Tsunami,
o Damage from flooding and major storm events;
o Impact of potential climate change and sea level rise.
Because the Maitai Dam is a vulnerable asset, it was designed to withstand 1 in
1000 year seismic and flood events without damage. Key structures are
designed to withstand maximum credible earthquake and probable maximum
flood without collapse (but not without some damage, possibly requiring
decommissioning and major repair work).
When full, city reservoirs can hold sufficient water for approximately 24 hours
average consumption. The more usual capacity, allowing for filling time and
continuing use, is 8-10 hours of daytime demand.
Construction of a new buried pipeline between the dam and the Water Treatment
Plant was completed in 2013/14 and between the Water Treatment Plant and
Westbrook Terrace in 2016/17.
The Roding Water Scheme has low and moderate risks to structures, other than
a 200m length of pipe between the screenhouse and the chlorinator house. This
pipe is suspended on piers along the riverbank.
While automatic chlorination exists at the water treatment plant, a stand-alone
portable chlorinator unit, run by a small petrol generator and using sodium
hypochlorite is also held there in case of emergency.
As a result of the Christchurch earthquakes Council has undertaken a seismic
review of the critical elements of the above ground network, starting with the
storage reservoirs and sections of the Maitai Dam to the treatment plant trunk
main. This work will continue through this proposed plan and be extended to
investigate impacts of liquefaction on existing and future infrastructure, impacts
of flooding and the long term planning required as a result of climate change
Resource consents for water extraction
Nelson City draws its public water supply from three sources:
o A run of river source from a weir on the Roding River;
o A run of river source from a weir on the South Branch of the Maitai River;
o An intake tower in a storage dam on the North Branch of the Maitai River;
Nelson City Council has three Resource Consents for the water supply covering
the abstraction of raw water from both the Roding and Maitai rivers, the
continued operation of the Maitai Dam on the North Branch and intake weir on

Nelson City Council
Water Supply Asset Management Plan 2018-2028
(A1620958) Page 7
the South Branch of the Maitai River and the Dam/ intake weir on the Roding
River. The consents and expiry dates are as follows:
o RM 960396 Maitai River expired 1/02/2017;
o RM 025151 Maitai River expired 1/02/2017;
o RM 975374 Roding River expired 1/10/2017.
In 2016 applications for consent for the water supply activities on the Maitai and
Roding Rivers were lodged. On 31 May 2017 resource consents RM165239,
RM165317 and RM165318 were granted for the Roding water supply. As at June
2018 the Maitai Resource Consent application is still being processed. Council will
continue to operate the Maitai water supply under the current resource consent
until the replacement consent is completed.
Resource consent conditions such as enhanced fish transfer programmes and
early cease takes will likely require some long term additional expenditure.
Future annual plans will be adjusted as the impact of consent conditions
becomes clearer.
Compliance with the conditions of resource consents is mandatory and a level of
service has been identified for this purpose.
Water quantity / efficiency of use.
Water quality and quantity in our rivers is a key issue for the city. As the city
water supply is drawn from river sources there will be an increasing tension
between the need for potable water to support growth and increased flows in the
rivers, particularly over the summer months. Improving the efficiency of use
through the following strategies is expected to be an increasing feature of this
activity into the future.
o Repairing the original raw water supply pipeline.
o Reducing the level of ‘un-accounted for water’
o Reducing the level of water lost to leaks in both the public and private
networks
o Encouraging rain harvesting and storage for garden watering
o Developing demand management options
o - Improved plumbing and appliance technology, (particularly being
driven by the Australian water shortages), future household use will be
reduced e.g. superlow flush 4.5/3 litre toilet flush (compared with 11 litre
single flush), low use washing machines, low flow shower heads, aerator
taps, reuse of grey water for toilets and irrigation etc.
o - Increasing awareness of low water use gardening e.g. drought
resistant planting, no mow lawns, or no lawns at all
o - With intensification, smaller gardens or no gardens at all for many
household units
o - Reduced use due to reduced supply pressures
o - Consumer education on tap use e.g. turn off while brushing teeth,
shorter duration showers, showers instead of baths, rinsing dishes in a
partially filled sink rather than under a running tap
o - Possible greywater and rainwater storage on site for reuse
Nelson City Council
Water Supply Asset Management Plan 2018-2028
(A1620958) Page 8
o - More stringent hosing restrictions
o - Pricing incentives
Central Government Regulation
The event of the campylobacteriosis outbreak in Havelock North in August 2016
concluded with a Government Inquiry. The focus of the Inquiry was twofold:
The security of the source, particularly subsurface bores; and the regulatory
framework that applies to drinking water suppliers in New Zealand. Numerous
administrative and operational recommendations were made in the two final
reports. The Stage 2 report also has a section with a recommendation that the
Government look at aggregating supplies of water across the country.
Nelson City Council’s water supply is currently well positioned to comply with any
treatment requirements that may arise from future changes to legislation. Raw
water is not sourced from bores and all water from the river sources is currently
subject to a double barrier of ultra-filtration membranes and chlorination.
Council also has a rigorous testing and monitoring regime for chlorine residual
levels and bacteria.
Tasman District Council (TDC) supplies water to the residential area in south
Nelson adjacent to Champion Road and Hill Street North as well as the Wakatu
Industrial Estate and ENZA. This water is sourced from underground bores and
then treated with ultra-violet light prior to supplying the network. While this form
of treatment does not provide residual disinfection in the drinking water, TDC do
have chlorine dosing equipment available for emergencies or if testing identifies
the presence of E.Coli in the reticulation.
The recommendations of the Government Inquiry largely rely on Central
Government enacting legislation before they can be implemented. Some
progress on these is likely during 2018-19. Those recommendations that
encourage treatment of drinking water and improving compliance with existing
regulations have already been actioned by the Ministry of Health.
Raw water source and reticulation quality issues
Council has three raw water sources as described above. Of these the Maitai
Dam is the only one available when river flows are low or unavailable after rain.
In 2016 Council undertook a trial of sourcing all raw water from the Maitai Dam
reservoir to test the ability of the treatment plant to meet the needs of the city
for a prolonged period. The trial delivered the following results:
o Confirmation of the ability to supply the treatment plant with raw water to
match the daily demand curve.
o Confirmation of the ability of the new membrane train to treat the water
for a prolonged period without loss of functionality. The treatment plant
has five separate ‘trains’ of membranes. Four date from the construction of
the plant in 2004 and one from 2015.
o Confirmation of the in-ability of the original four membrane trains to treat
the water for a prolonged period without loss of functionality. The existing
‘trains’ initially performed well and recovered permeability after routine
cleaning but as the trial progressed they soon lost permeability. More
aggressive cleaning was required that impacts the longevity of the
membranes.
o An increase in the number of discoloured water complaints particularly
from hospitality providers in parts of the city. These complaints are

Nelson City Council
Water Supply Asset Management Plan 2018-2028
(A1620958) Page 9
believed to be the result of a significant legacy issue of corrosion products
in the cast-iron and steel pipe that make up part of the reticulation.
Long term it is important for the city to be able to rely on the Maitai Dam as a
raw water source especially in emergency. In order to regain that confidence the
treatment plant membranes are being renewed and the option to pre-treat the
water from the dam via a primary clarifier or more regular replacement of the
membranes is being further investigated. A budget for this work is shown for
years 5-10 of this plan.
Water Treatment Plant membrane renewals
Renewal of two of the four original membrane trains is being undertaken in
2017/18. The remaining two trains are scheduled for renewal in 2018/19.
Bulk Water Supply South Nelson. Tasman District Council - Engineering
Services Agreement
o Tasman District Council supplies water to the residential areas in south
Nelson adjacent Champion Road as well as the Wakatu Industrial
Subdivision, Alliance Freezing Works and ENZA in Nayland Road. Although
the demand from these areas is not great (400,000 – 500,000m3/year)
Council does not have the appropriately sized reticulation in place to be
able to supply the required fire flows. The supply of water by Tasman
District Council is covered in an engineering services agreement between
the two Councils that was reviewed in 2015.
o The ongoing supply of water to these areas is dependent upon Tasman
District Council securing the long term viability of water from the Waimea
Plains via the construction of the Waimea Community Dam. Should this
dam not proceed Council can anticipate that new supply mains will need to
be constructed to service these areas.
o Nelson City Council has contributed funding to Tasman District Council
investigations into the Waimea Dam. For Nelson City to secure a share in
the dam (for water required at some future point) a yet to be determined
payment would have to be made at the time of construction.
o Existing options are expected to provide sufficient water for the city in the
short – medium term and a share in the Waimea Community Dam is not
required for the water supply activity at this stage. Funding has been
allocated in 2020/21 for a grant to the Waimea Dam project subject to the
conditions that access to 22,000m3/d be assured and the grant be
transferred into a shareholding in the Dam Company at any point in future.
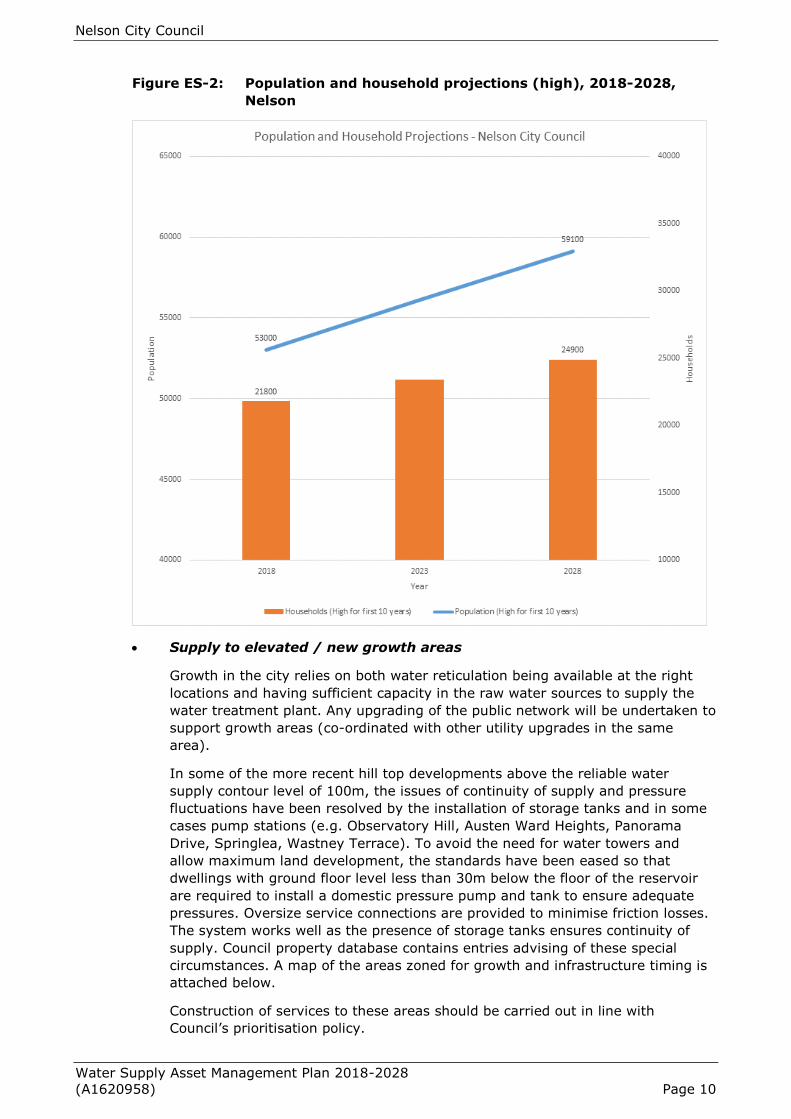
National Policy Statement Urban Development Capacity
The National Policy Statement for Urban Development Capacity (NPS-UDC)
requires local authorities to ensure there is sufficient development capacity to
meet demand in the urban environment in the short term (within 3 years),
medium term (3-10 years) and long term (10-30 years). Short-term capacity
must be feasible, zoned and serviced while long-term capacity must be feasible,
with servicing planned but does not need to be zoned yet. The following graph is
based on statistics New Zealand growth projections for the city out to 2028. An
increase of approximately 12% in population over this time is expected. The city
has adequate water supply sources for this increase.
Nelson City Council
Water Supply Asset Management Plan 2018-2028
(A1620958) Page 10
Figure ES-2: Population and household projections (high), 2018-2028,
Nelson
Supply to elevated / new growth areas
Growth in the city relies on both water reticulation being available at the right
locations and having sufficient capacity in the raw water sources to supply the
water treatment plant. Any upgrading of the public network will be undertaken to
support growth areas (co-ordinated with other utility upgrades in the same
area).
In some of the more recent hill top developments above the reliable water
supply contour level of 100m, the issues of continuity of supply and pressure
fluctuations have been resolved by the installation of storage tanks and in some
cases pump stations (e.g. Observatory Hill, Austen Ward Heights, Panorama
Drive, Springlea, Wastney Terrace). To avoid the need for water towers and
allow maximum land development, the standards have been eased so that
dwellings with ground floor level less than 30m below the floor of the reservoir
are required to install a domestic pressure pump and tank to ensure adequate
pressures. Oversize service connections are provided to minimise friction losses.
The system works well as the presence of storage tanks ensures continuity of
supply. Council property database contains entries advising of these special
circumstances. A map of the areas zoned for growth and infrastructure timing is
attached below.
Construction of services to these areas should be carried out in line with
Council’s prioritisation policy.

Nelson City Council
Water Supply Asset Management Plan 2018-2028
(A1620958) Page 11
Council is reviewing the proposed Whakamahere Whakatū Nelson Plan and
looking at wider prioritisation criteria for future development areas.
Infrastructure planning will align with any new policy that is developed. A specific
project has been identified to continue desktop investigations started in 2015-
17, looking at servicing constraints to areas currently identified for growth.
Water losses / Pressure reduction / Water conservation / Un-Accounted
for Water/Water Losses
The reporting of annual water losses as a percentage of annual water production
is a current level of service measure. As losses are nearly constant each year
and water sales (and therefore production) is weather dependent it is not the
best measure for tracking un-accounted for water. ‘Bench Loss’ software has
been used to calculate the Infrastructure Leakage Index (ILI) which allows year
to year comparisons and also benchmarking between water supply authorities.
The infrastructure leakage index has been calculated since 2001/02. The results
are shown in Figure ES-3.
Figure ES-3: Infrastructure Leakage Index for Nelson
Council has an ongoing project to track real losses within the network and better
quantify the other sources of un-accounted for water. Long term improvements
will lead to a reduction in the leakage index. As of 2016-17 the majority of the
public network in the city had been checked for leaks. While a number of small
leaks were found and repaired no substantial leaks were identified. Ongoing
investigation of the other sources of un-accounted for water use such as
contractor use and fire-fighting services will continue.
2009 bench testing of residential water meters for accuracy confirmed a general
view that some of the meters have been under reporting flows and therefore
some losses must be attributed to meter performance.
The increasing use of automated meter reading technology in the power supply
utility field offers advantages to the water supply activity, principally in reducing
costs of meter reading and billing and providing early warning of excess water
use that may be an indication of leaks. To date a business case concludes that
the cost of installing these meters cannot be justified. Future pricing changes in
electronic reading meters may change this. This will be reviewed in future asset
management plans.
Nelson City Council
Water Supply Asset Management Plan 2018-2028
(A1620958) Page 12
Condition assessments and renewals strategies
Historically asset monitoring to determine condition has been subjective based
on local knowledge and experience. Formal procedures now exist to assess asset
condition.
The development and continued use of condition assessment data will support
preparation of some form of predictive decay curves for some particular asset
types and hence permit prediction of remaining life. Consideration of economic
influences and other factors will also be required in the adopted life for the asset
type. By considering the current condition point on an assumed decay curve, the
profile can predict the effective life (time) before failure. This failure time can be
the physical end of life, minimum level of acceptable service, or limit of capacity
of the asset.
The water network is made up a range of materials such as cast iron, asbestos
cement, concrete, uPVC, polyethylene, concrete lined steel and ductile iron.
Currently Council’s renewal strategy is based on replacing asbestos cement pipes
that were installed in the 1950’s and are showing higher than expected failure
rates. Further investigation of the older sections of the network are needed in
order to confirm the condition of the steel and iron pipes. As the current
asbestos cement pipe renewal programme is expected to continue for the next
8-10 years, enhanced condition assessment of the other pipe types is expected
to be part of the renewal strategy from years 5-8.
Older Maitai pipeline Existing Maitai concrete pipeline
The Maitai pipeline between the Maitai Dam and the Water Treatment Plant
transports the majority of the water used in the City. It has numerous small
shrinkage cracks and is vulnerable to slips from above and below the pipeline.
Council completed the construction of a duplicate Maitai pipeline between the
dam and the Water Treatment Plant in 2014 but will continue to use and
maintain the existing pipeline, to reduce pumping costs, for as long as it is viable
to do so. Repairing the section between the Dam and the Water Treatment Plant
is a multi-year project shown in the operations section of this Asset Management
Plan for the next ten years at $100k/year.
Water meters - mechanical / electronic
The Council installed water meters to every residential property connected to the
city water supply in the mid 1990’s. These meters have been in continuous use
for 20+ years and are nearing the end of their service lives.
Trends in each property’s water usage are tracked and if a meter appears to be
“slowing down”, then it is removed for testing or replacement. Worn meters
tend to under-read and are therefore in that customer’s favour, but true costs
are not being recovered from the customer who is therefore subsidised by other
consumers.
Residential Backflow Prevention – The dual check valves in the water meter
manifold are spring operated and lose effectiveness with time. An increasing
number of the valves are also disintegrating in the manifolds and a programme
to replace these commenced in 2015/16. As the dual check valve is fitted
immediately underneath the meter it was initially considered to be appropriate
for them to be replaced at the same time as the meter. The number of failures
and risk of pieces of the valves impacting the water meters and household water
fittings has led to the need to begin the replacement in advance of the meters.

Nelson City Council
Water Supply Asset Management Plan 2018-2028
(A1620958) Page 13
Commercial and Industrial water meters were installed from 1980 to 1999.
Renewal of commercial and industrial water meters started in 2014/15 and is
approximately 25% complete. The work is scheduled to be completed in
2028/29.
The future proposed renewal of residential water meters, scheduled over a three
year period from 2018/19 at approximately $1,100,000 per year, will be based
on ‘like for like’ replacement. A business case developed by Council concluded
that the installation of electronic reading meters could not be justified on an
economic basis.
Fire flows
The public supply is designed to also provide an effective firefighting network.
Hydrants are installed on all service mains in urban supply areas in accordance
with the New Zealand Fire Service Firefighting Water Supplies Code of Practice.
The New Zealand Fire Service issued a revised Firefighting Water Code of
Practice in 2008 with the result that existing fire flows in the city are now lower
than desired in many areas largely as a result of the changes to how distances
from hydrants are measured.
Previous versions of this code of practice measured the distances from properties
to fire hydrants as a radius centred on the property, the current version now
measures the true “along the road” distance. This had the effect of increasing
the number of properties that did not meet the distance requirement.
Upgrades to the fire flows have been ongoing since 2015 with the result that
most of the smaller projects have been completed and generally the larger street
wide pipe upgrades remain.
$600,000 is included over the ten years of this plan to continue upgrades to the
water network in areas where the fire flows are not being delivered. The areas to
be upgraded will be identified using the water network model.
Safety of dams
Since 2012 central government has signalled a wish to better regulate the
ongoing safety of larger dams. To date the proposed form that this will take and
the legislative vehicle to support it has not been decided. The Maitai Dam is
Nelson City’s largest water storage dam and is also considered a high impact
category owing to the number of people in the downstream path should the dam
fail catastrophically. In recognition of this Council has annual engineering safety
inspections carried out by the design company and five yearly comprehensive
safety reviews by an independent expert.
It is anticipated that the central government policy issues will be resolved in the
first five years of this plan and some form of dam safety scheme will apply to a
wider range of dams e.g. stormwater detention dams. A budget for the first
review of these dams has been included in this plan.
Nelson City Council
Water Supply Asset Management Plan 2018-2028 (A1620958) Page 14
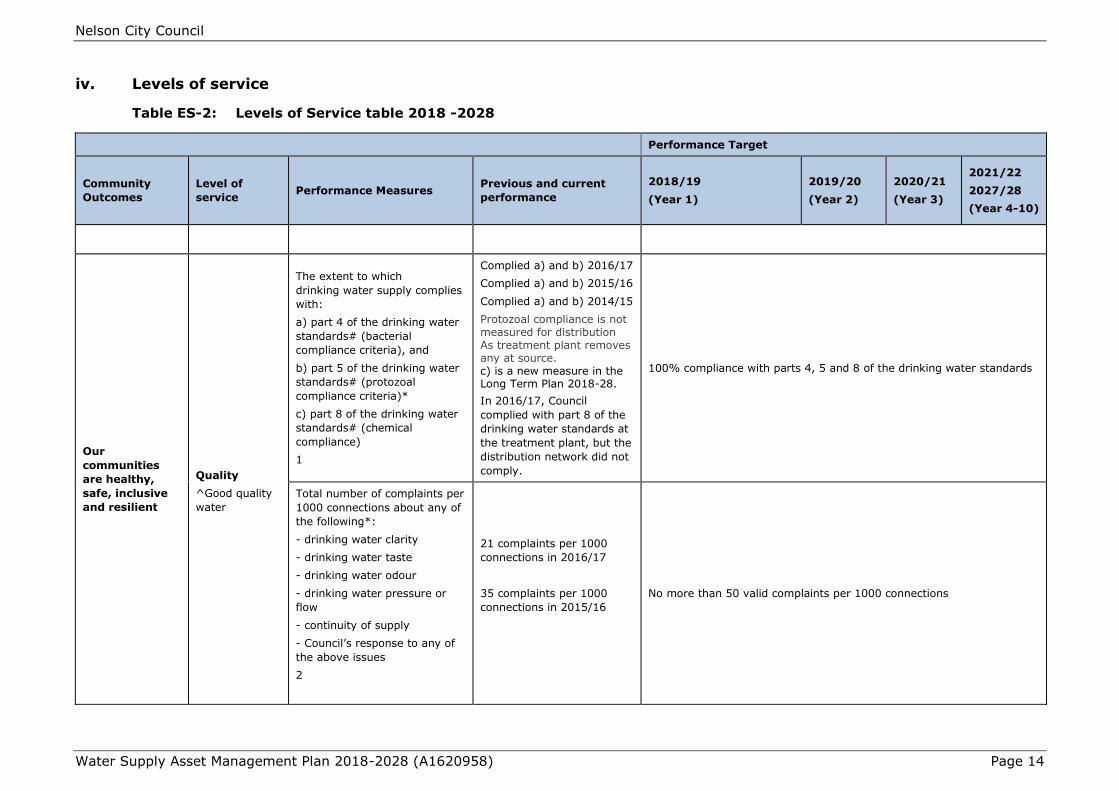
iv. Levels of service
Table ES-2: Levels of Service table 2018 -2028
Performance Target
Community
Outcomes
Level of
service Performance Measures
Previous and current
performance
2018/19
(Year 1)
2019/20
(Year 2)
2020/21
(Year 3)
2021/22
2027/28
(Year 4-10)
Our
communities
are healthy,
safe, inclusive
and resilient
Quality
^Good quality
water
The extent to which
drinking water supply complies
with:
a) part 4 of the drinking water
standards# (bacterial
compliance criteria), and
b) part 5 of the drinking water
standards# (protozoal
compliance criteria)*
c) part 8 of the drinking water
standards# (chemical
compliance)
1
Complied a) and b) 2016/17
Complied a) and b) 2015/16
Complied a) and b) 2014/15
Protozoal compliance is not measured for distribution As treatment plant removes any at source. c) is a new measure in the Long Term Plan 2018-28.
In 2016/17, Council
complied with part 8 of the
drinking water standards at
the treatment plant, but the
distribution network did not
comply.
100% compliance with parts 4, 5 and 8 of the drinking water standards
Total number of complaints per
1000 connections about any of
the following*:
- drinking water clarity
- drinking water taste
- drinking water odour
- drinking water pressure or
flow
- continuity of supply
- Council’s response to any of
the above issues
2
21 complaints per 1000
connections in 2016/17
35 complaints per 1000
connections in 2015/16
No more than 50 valid complaints per 1000 connections
Nelson City Council
Water Supply Asset Management Plan 2018-2028 (A1620958) Page 15
Performance Target
Community
Outcomes
Level of
service Performance Measures
Previous and current
performance
2018/19
(Year 1)
2019/20
(Year 2)
2020/21
(Year 3)
2021/22
2027/28
(Year 4-10)
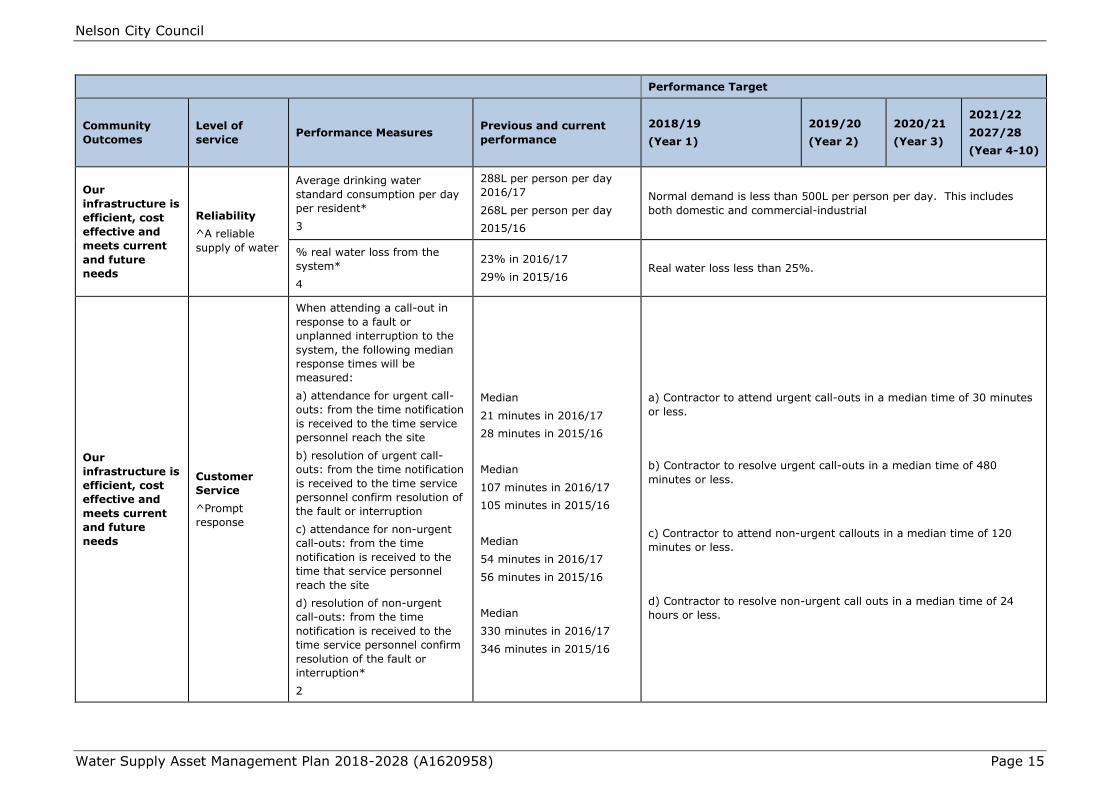
Our
infrastructure is
efficient, cost
effective and
meets current
and future
needs
Reliability
^A reliable
supply of water
Average drinking water
standard consumption per day
per resident*
3
288L per person per day
2016/17
268L per person per day
2015/16
Normal demand is less than 500L per person per day. This includes
both domestic and commercial-industrial
% real water loss from the
system*
4
23% in 2016/17
29% in 2015/16 Real water loss less than 25%.
Our
infrastructure is
efficient, cost
effective and
meets current
and future
needs
Customer
Service
^Prompt
response
When attending a call-out in
response to a fault or
unplanned interruption to the
system, the following median
response times will be
measured:
a) attendance for urgent call-
outs: from the time notification
is received to the time service
personnel reach the site
b) resolution of urgent call-
outs: from the time notification
is received to the time service
personnel confirm resolution of
the fault or interruption
c) attendance for non-urgent
call-outs: from the time
notification is received to the
time that service personnel
reach the site
d) resolution of non-urgent
call-outs: from the time
notification is received to the
time service personnel confirm
resolution of the fault or
interruption*
2
Median
21 minutes in 2016/17
28 minutes in 2015/16
Median
107 minutes in 2016/17
105 minutes in 2015/16
Median
54 minutes in 2016/17
56 minutes in 2015/16
Median
330 minutes in 2016/17
346 minutes in 2015/16
a) Contractor to attend urgent call-outs in a median time of 30 minutes
or less.
b) Contractor to resolve urgent call-outs in a median time of 480
minutes or less.
c) Contractor to attend non-urgent callouts in a median time of 120
minutes or less.
d) Contractor to resolve non-urgent call outs in a median time of 24
hours or less.
Nelson City Council
Water Supply Asset Management Plan 2018-2028 (A1620958) Page 16
^L.O.S. included in LTP
# Ministry of Health (2008), Drinking-water Standards for New Zealand (Revised 2008), Wellington, Ministry of Health
* Performance measures with an asterisk reflect the wording of the Non-Financial Performance Measures of the Department of Internal Affairs
(DIA) incorporated into sec261B Local Government Act 2002. This is to allow the DIA to compare these measures across councils. Targets have
been adjusted where necessary to align.
Measurement procedures:
1. Ministry of Health grading
2. Report from SR system at 1 July
3. Calculated by metered supply divided by Statistics NZ estimated population
4. Council uses a water balance methodology developed by Water NZ to track and report on un-accounted for water.

Nelson City Council
Water Supply Asset Management Plan 2018-2028 (A1620958) Page 17
v. Future demand
Investigations to date confirm that the capacity of the water supply network below the
100m contour is quite strong. Much of the proposed residential growth in the city can
be accommodated for the next 5-10 years without major network upgrades. Some
areas of weakness exist with older asbestos cement pipes which will be addressed as
the network is renewed. Likewise the reduction of water losses and un-accounted for
water also improves the available capacity. The largest unknown is the potential for
future ‘wet’ processing industries to establish in the city.
Table ES-3: Future demand
Water Demand Drivers Changes to Water Supply Activity
Significant population growth and
residential expansion into
greenfield areas
New development areas on the periphery of the
city and increased density in some existing
developed areas leading to increased water
demand. See map of areas of growth below.
New ‘wet’ industries Growth in the commercial sector that involves wet
processing activities increases the demand for
high quality potable water services.
Reduction in house occupancy Activities such as operating washing machines and
dishwashers can generate as much water demand
for single person dwellings as those that house
couples.
Changes in Customer
Expectations
Customer expectations are increasingly tending
towards higher Levels of Service for reliability and
response to complaints.
Community Expectation Community expectations are increasingly focussed
on the uninterrupted supply of good quality water
for residential and commercial uses. Recent
complaints about dis-coloured water suggests that
expectations in some parts of the community are
higher than just potable water.
Climatic Changes In recent years, there has been an increase in the
incidence of extreme weather events around the
world. The general future expected trend for
Nelson is of winters being wetter and the other
seasons being drier. More frequent heavy rainfall
events will impact on the use of water from the
two river sources and drier periods may increase
the city’s dependence on the Maitai Dam.
Legislative
National Policy Statements:
Freshwater Management and
Urban Development Capacity
Freshwater Management is a cornerstone
central government initiative to improve the
quality of freshwater bodies in New Zealand.
This is expected to impact on both abstraction
and discharges to waterways and require an
enhanced recognition of the need for efficient
use of the water to minimise the volume taken
for water supply and improving the quality of
the water discharged as compensation.
Urban Development Capacity will ensure each
territorial authority makes adequate provision
for future population growth in their areas.
This will require Council to undertake strategic

Nelson City Council
Water Supply Asset Management Plan 2018-2028 (A1620958) Page 18
Water Demand Drivers Changes to Water Supply Activity
growth studies and identify the impact on the
demand for water supply services.
Organisational Policies
Environmental Sustainability
Development of sustainability strategies that
include reduction of direct losses from the network
(public and private) and un-accounted for water
use from the network.
Council is concentrating on improving services to developed areas and providing
services to areas that are currently being developed (Residential, Rural Zone High
Density Small Holdings, Suburban Commercial, and Industrial). Servicing of other
areas covered by the Services Overlay, because one or more servicing constraints
have been identified as needing to be addressed prior to the complete development of
that property/area, will be considered as Council develops a policy on prioritising these
areas. The specific projects to facilitate future growth, identified in this Asset
Management Plan, therefore consist of works required to eliminate servicing
constraints on the former.
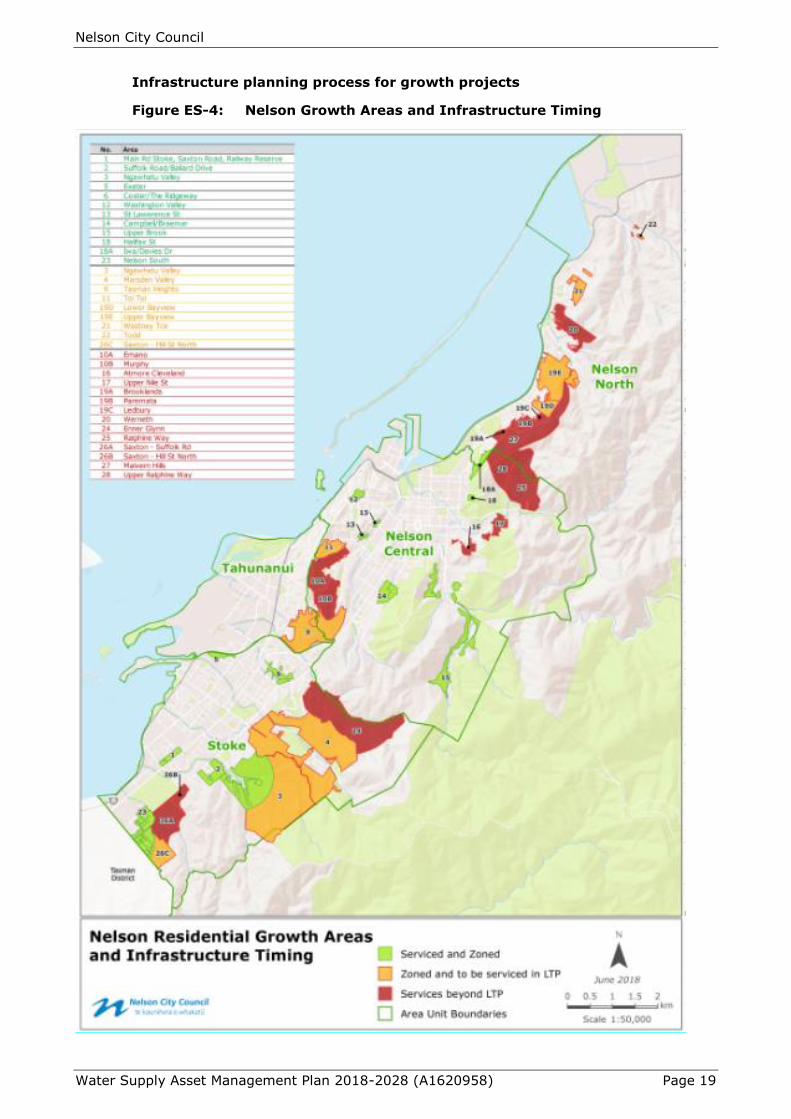
Figure ES-4 below shows the growth areas in the city as they currently stand.
Generally sufficient water is available in most of these areas although developers will
need to install storage tanks and pumps in elevated areas which lie above the 100m
contour.
A review of the residential demand is expected over the next three years as Council
prepares the proposed Whakamahere Whakatū Nelson Plan. The likely impact on the
water network will be reflected in future asset management plans.
Figure ES-5 Peak Water Demand compares the capacity of the water sources and
water treatment plant with the actual peak day water usage over the last 15 years.
With the completion of the renewal of the treatment plant membranes in 2018/19 the
city will be able to treat and supply approximately 50,000m3/day. This is expected to
meet the city’s growth out beyond 2080-2100.
Nelson City Council
Water Supply Asset Management Plan 2018-2028 (A1620958) Page 19
Infrastructure planning process for growth projects
Figure ES-4: Nelson Growth Areas and Infrastructure Timing

Nelson City Council
Water Supply Asset Management Plan 2018-2028 (A1620958) Page 20
Figure ES-5: Peak Water Demand
vi. Lifecycle management plan
Assets have a lifecycle as they move through from the initial concept to the final
disposal. Depending on the type of asset, its lifecycle may vary from 10 years to over
100 years.
Table ES-4: Nominal Working Life of Water Assets (Years)
Type Low
Pressure
High
Pressure
Trunk
Main
Maitai
Pipeline
Roding
Pipeline
Asbestos Cement (Black) 80 70 65
Asbestos Cement (Fibrolite) 80 70 65
Ductile Cast Iron 110 95 90
Pit Cast Iron 120 105 100
Spun Cast Iron 100 90 85
Concrete 65 60 58 75
25
30
35
40
45
50
55
1995 2000 2005 2010 2015 2020 2025 2030 2035 2040 2045 2050 2055
Pea
k O
ne
Day
Dem
and
('0
00
m3 /
day
)
Actual Peak Day
Max Supply Capacity with RodingResidual and Existing Maitai Pipeline
Max Supply Capacity with RodingResidual and Upgraded Maitai Pipeline
Treatment Plant Capacity

Nelson City Council
Water Supply Asset Management Plan 2018-2028 (A1620958) Page 21
Type Low
Pressure
High
Pressure
Trunk
Main
Maitai
Pipeline
Roding
Pipeline
Copper 90 80 75
Galvanised Iron 70 55 50
HDPE 85 70 65
PVC 85 70 65 65
Concrete Lined Steel 90 80 75 75
Pitch Lined Steel 90 80 75 58
The following figure shows the theoretical renewal year of the pipe assets based on
renewal by age.

Nelson City Council
Water Supply Asset Management Plan 2018-2028 (A1620958) Page 22
Figure ES-6: Estimated Replacement Value / Material Distribution
-
$5.0m
$10.0m
$15.0m
$20.0m
$25.0m
2019 2020 2021 2022 2023 2024 2025 2026 2027 2028 2029 2030 2031 2032 2033 2034 2035 2036 2037 2038 2039 2040 2041 2042 2043 2044 2045 2046 2047 2048
Est
Rep
lace
men
t V
alu
eWater Supply Theoretical Renewal Year
PVC
PE
Concrete
Asb Cement
Copper
Iron
Steel
Other
Maitai pipeline, estimate $5m lining to renew.

Nelson City Council
Water Supply Asset Management Plan 2018-2028 (A1620958) Page 23
Figure ES-7: Theoretical Renewal Year / Material Distribution

Nelson City Council
Water Supply Asset Management Plan 2018-2028 (A1620958) Page 24
vii. Risk management plan
Nelson City Council is committed to using risk management principles and techniques
to understand and appropriately manage all internal and external factors and
influences which affect the achievement of its objectives. Doing this will:
Provide a reliable basis for sound decision making
Increase the likelihood of achieving objectives
Provide an agreed basis for prudent risk taking
Enable the organisation to understand the level of risk associated with each
decision as well as the Council’s aggregate exposure to risk
Improve accountability and assurance of control
Enable the Council to avoid threats and seize opportunities
Foster an organisational culture based on reasonable foresight and responsible
hindsight.
The Council’s standardised risk assessment method explicitly follows the process part
(section 5) of AS/NZS 31000:2009.
Risk analysis involves consideration of the sources of risk, their consequences and the
likelihood that those consequences may occur.
The following consequences are considered:
Safety
Health
Asset performance/Service Delivery
Environmental/Historical/Cultural
Financial
Political/Community/Reputational
Relationship with Iwi
Legal compliance
Information/Decision support
Consequences of an event are rated 1 - 5 (Insignificant to Extreme). Likelihood is
then rated 1 – 5 (Rare to Almost certain) to calculate a risk level rated 1 – 5 (Very
Low to Very High).
The objective of risk analysis is to separate the low impact risks from the major
impact risks, and to provide data to assist in the evaluation and treatment of the risks.
The specific objectives that guide the Water supply risk analysis are taken from the
Water supply levels of service:
Quality – good quality water
Quality – Acceptable water pressure
Reliability – a reliable supply of water
Health and Safety – adequate flows of water

Nelson City Council
Water Supply Asset Management Plan 2018-2028 (A1620958) Page 25
Customer service – a prompt response to reported network issues
A network that protects the natural environment
As noted in the priority section, uncertainty around possible future LOS changes (eg
Freshwater NPS) and the risk-based decision framework feature in this area.
viii. Financial summary
Water Expenditure
The following graph charts the proposed expenditure for the next ten years.
Figure ES-8: Water proposed expenditure to 2027/28
Expenditure for the water supply activity varies over the term of the plan. Renewals
expenditure is high in 2018/19 with the renewal of the last two trains of membranes.
The slight spike in year 2022/23 and 2023/24 relates to two larger construction
projects (Atawhai storage reservoir and Maitai Dam aeration) coinciding in the same
years.
0
2,000
4,000
6,000
8,000
10,000
12,000
14,000
16,000
18,000
18/19est
19/20est
20/21est
21/22est
22/23est
23/24est
24/25est
25/26est
26/27est
27/28est
Water
OPEX Renewals Growth LOS enhancments
Nelson City Council
Water Supply Asset Management Plan 2018-2028 (A1620958) Page 26
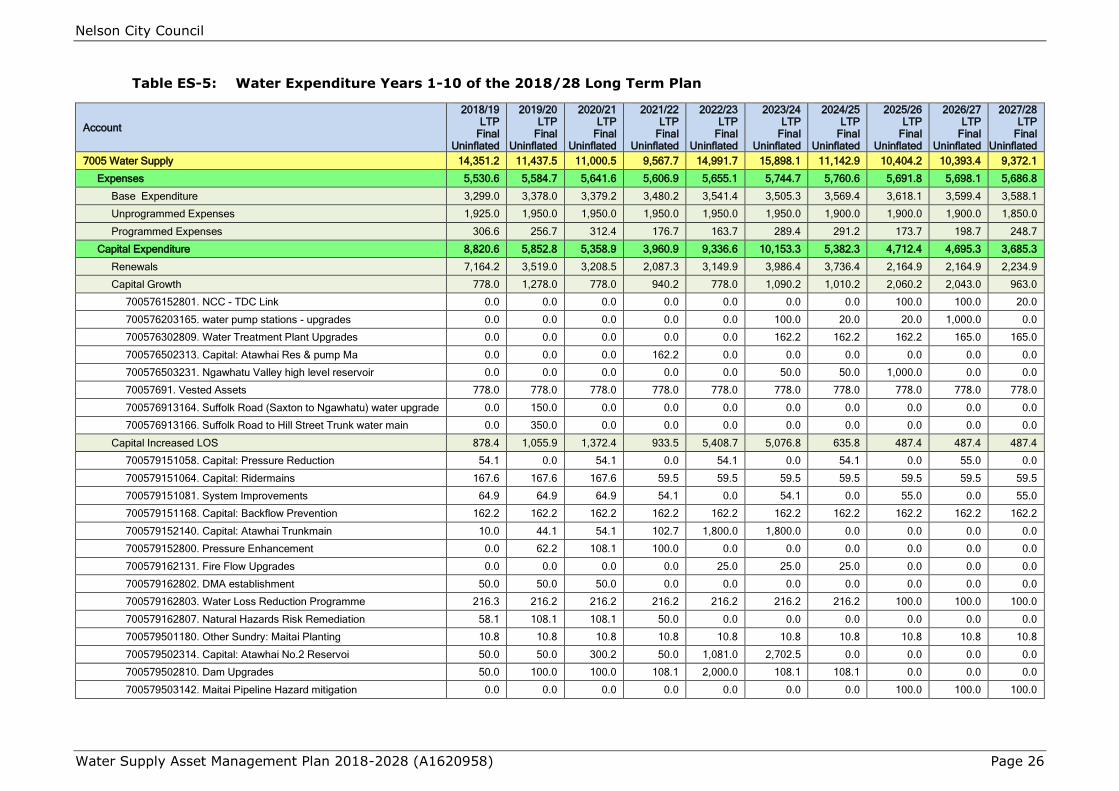
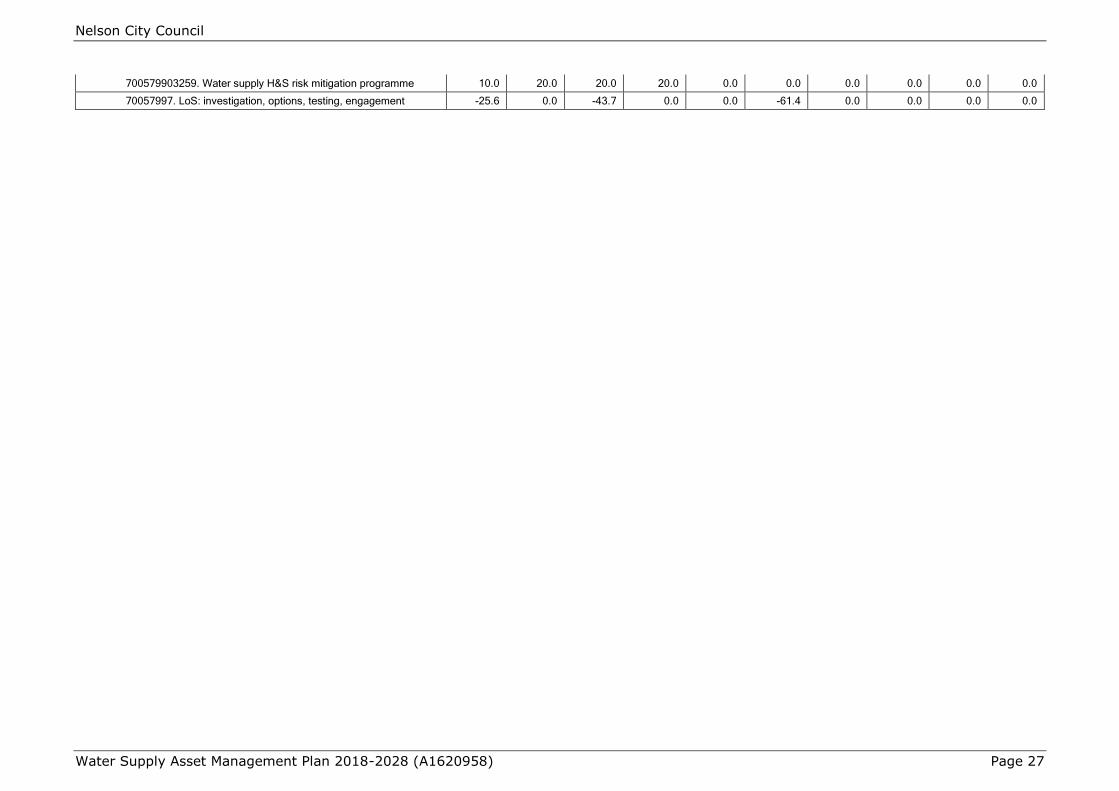
Table ES-5: Water Expenditure Years 1-10 of the 2018/28 Long Term Plan
Account
2018/19 LTP
Final Uninflated
2019/20 LTP
Final Uninflated
2020/21 LTP
Final Uninflated
2021/22 LTP
Final Uninflated
2022/23 LTP
Final Uninflated
2023/24 LTP
Final Uninflated
2024/25 LTP
Final Uninflated
2025/26 LTP
Final Uninflated
2026/27 LTP
Final Uninflated
2027/28 LTP
Final Uninflated
7005 Water Supply 14,351.2 11,437.5 11,000.5 9,567.7 14,991.7 15,898.1 11,142.9 10,404.2 10,393.4 9,372.1
Expenses 5,530.6 5,584.7 5,641.6 5,606.9 5,655.1 5,744.7 5,760.6 5,691.8 5,698.1 5,686.8
Base Expenditure 3,299.0 3,378.0 3,379.2 3,480.2 3,541.4 3,505.3 3,569.4 3,618.1 3,599.4 3,588.1
Unprogrammed Expenses 1,925.0 1,950.0 1,950.0 1,950.0 1,950.0 1,950.0 1,900.0 1,900.0 1,900.0 1,850.0
Programmed Expenses 306.6 256.7 312.4 176.7 163.7 289.4 291.2 173.7 198.7 248.7
Capital Expenditure 8,820.6 5,852.8 5,358.9 3,960.9 9,336.6 10,153.3 5,382.3 4,712.4 4,695.3 3,685.3
Renewals 7,164.2 3,519.0 3,208.5 2,087.3 3,149.9 3,986.4 3,736.4 2,164.9 2,164.9 2,234.9
Capital Growth 778.0 1,278.0 778.0 940.2 778.0 1,090.2 1,010.2 2,060.2 2,043.0 963.0
700576152801. NCC - TDC Link 0.0 0.0 0.0 0.0 0.0 0.0 0.0 100.0 100.0 20.0
700576203165. water pump stations - upgrades 0.0 0.0 0.0 0.0 0.0 100.0 20.0 20.0 1,000.0 0.0
700576302809. Water Treatment Plant Upgrades 0.0 0.0 0.0 0.0 0.0 162.2 162.2 162.2 165.0 165.0
700576502313. Capital: Atawhai Res & pump Ma 0.0 0.0 0.0 162.2 0.0 0.0 0.0 0.0 0.0 0.0
700576503231. Ngawhatu Valley high level reservoir 0.0 0.0 0.0 0.0 0.0 50.0 50.0 1,000.0 0.0 0.0
70057691. Vested Assets 778.0 778.0 778.0 778.0 778.0 778.0 778.0 778.0 778.0 778.0
700576913164. Suffolk Road (Saxton to Ngawhatu) water upgrade 0.0 150.0 0.0 0.0 0.0 0.0 0.0 0.0 0.0 0.0
700576913166. Suffolk Road to Hill Street Trunk water main 0.0 350.0 0.0 0.0 0.0 0.0 0.0 0.0 0.0 0.0
Capital Increased LOS 878.4 1,055.9 1,372.4 933.5 5,408.7 5,076.8 635.8 487.4 487.4 487.4
700579151058. Capital: Pressure Reduction 54.1 0.0 54.1 0.0 54.1 0.0 54.1 0.0 55.0 0.0
700579151064. Capital: Ridermains 167.6 167.6 167.6 59.5 59.5 59.5 59.5 59.5 59.5 59.5
700579151081. System Improvements 64.9 64.9 64.9 54.1 0.0 54.1 0.0 55.0 0.0 55.0
700579151168. Capital: Backflow Prevention 162.2 162.2 162.2 162.2 162.2 162.2 162.2 162.2 162.2 162.2
700579152140. Capital: Atawhai Trunkmain 10.0 44.1 54.1 102.7 1,800.0 1,800.0 0.0 0.0 0.0 0.0
700579152800. Pressure Enhancement 0.0 62.2 108.1 100.0 0.0 0.0 0.0 0.0 0.0 0.0
700579162131. Fire Flow Upgrades 0.0 0.0 0.0 0.0 25.0 25.0 25.0 0.0 0.0 0.0
700579162802. DMA establishment 50.0 50.0 50.0 0.0 0.0 0.0 0.0 0.0 0.0 0.0
700579162803. Water Loss Reduction Programme 216.3 216.2 216.2 216.2 216.2 216.2 216.2 100.0 100.0 100.0
700579162807. Natural Hazards Risk Remediation 58.1 108.1 108.1 50.0 0.0 0.0 0.0 0.0 0.0 0.0
700579501180. Other Sundry: Maitai Planting 10.8 10.8 10.8 10.8 10.8 10.8 10.8 10.8 10.8 10.8
700579502314. Capital: Atawhai No.2 Reservoi 50.0 50.0 300.2 50.0 1,081.0 2,702.5 0.0 0.0 0.0 0.0
700579502810. Dam Upgrades 50.0 100.0 100.0 108.1 2,000.0 108.1 108.1 0.0 0.0 0.0
700579503142. Maitai Pipeline Hazard mitigation 0.0 0.0 0.0 0.0 0.0 0.0 0.0 100.0 100.0 100.0
Nelson City Council
Water Supply Asset Management Plan 2018-2028 (A1620958) Page 27
700579903259. Water supply H&S risk mitigation programme 10.0 20.0 20.0 20.0 0.0 0.0 0.0 0.0 0.0 0.0
70057997. LoS: investigation, options, testing, engagement -25.6 0.0 -43.7 0.0 0.0 -61.4 0.0 0.0 0.0 0.0
Nelson City Council
Water Supply Asset Management Plan 2018-2028 (A1620958) Page 28
ix. Asset management practices
Information systems
All asset information is stored on Arcinfo (a computer based geographical information
system) and Infor Asset Management System.
The Council has a number of information systems (Infor, InTouch, Network Model, and
closed circuit television archive) that are not integrated. The ongoing integration of
these systems will assist in the optimisation of operations, renewals and the ongoing
development of the stormwater activity.
Accounting and Financial Systems
The Nelson City Council uses integrated computer software supplied by MagiQ
Geographical Information System
Data captured is required to be accurate to within a tolerance of +/- 0.3m. In
inaccessible areas, it is not considered economic to search for buried fittings and the
best estimated position has been entered with the accuracy limitation flagged.
Procedures are in place to update new data into the Geographical information system
on a monthly basis via Nelson City Council engineering staff.
Data on assets associated with renewal and upgrade capital are now updated into the
asset register by Nelson City Council Engineering and Finance staff. This ensures a
high level of reliability.
Modelling
Infoworks v.8 is populated from the Geographical Information System. The Network
Model is used to calculate fire hydrant flows, verify design pipe sizes for new works
and check the capacity of the system to cope with future development.
SCADA Telemetry
Council has a “Kingfisher” SCADA (Supervisory Control and Data Acquisition) system
and an “Intouch” system at the base station. The system is used to monitor and
control critical aspects of the network such as the dams, treatment plant, reservoirs,
pumps and control valves.
Asset management Recording System – Infor
The use of the Infor system has enabled the following:
Customer enquiries being logged directly and sent immediately to the contractor
for action.
Contractor directly enters resolution confirmation at completion of job.
Tracking of expenditure on assets to allow assets that have a disproportionately
high maintenance cost to be identified - upgrade or renewal can then be
prioritised.
x. Monitoring and improvement programme
The Nelson City Council water supply Asset Management Plan is a regularly revised
and evolving document and will be reviewed annually and updated at least every three
years to coincide with the Annual and Long Term Plans and to incorporate improved
decision making techniques, updated asset information, and Nelson City Council policy
changes that may impact on the levels of service.
Nelson City Council
Water Supply Asset Management Plan 2018-2028 (A1620958) Page 29
The Asset Management Plan will be improved throughout its life cycle as further
information about the water supply assets are collected in terms of condition,
performance and service delivery. Nelson City Council is committed to advanced data
collection and management systems that will allow for a greater appreciation of the
performance and condition of the Nelson City Council assets.
Nelson City Council will report variations in the adopted annual plan budgets against
the original asset management plan forecasts and explain the level of service
implications of budget variations.
Internal Audit
Internal audits will be taken every three years to assess the effectiveness of the plan
in achieving its objectives. The internal audit will also assess the adequacy of the
asset management processes, systems and data.
Statutory Audit
The Local Government Act requires that an independent, annual audit of the
operations of the Nelson City Council be carried out.
Benchmarking (trending) of the activity through Audit NZ, Local Government NZ and
Water NZ benchmarking initiatives is carried out at the request of these organisations
to give increased understanding of:
The efficiency and efficiency variations of individual activities.
Effects of any programmes instigated by the Asset Management Plan.
Operating costs over range of individual activities.
Examples of types of benchmarking that are to be considered include tracking
progress, responsiveness to service calls, operation costs i.e. $/m/year and energy
costs. As data is obtained and implications understood the benchmarking can be used
for additional or revised Levels of Service and can be incorporated into a graphical
display.
In 2014 Nelson City Council participated in a Local Government New Zealand
benchmarking exercise for water based utilities.
The effectiveness of the Asset Management plan will be monitored by the following
procedures:
Financial expenditure projections prior to year end
Resource consent monitoring as required by consents
Operations and Maintenance reports on a monthly basis
The ongoing updating of the asset register of the pipe assets when repairs are
carried out and the attributes are compared with the asset register attributes
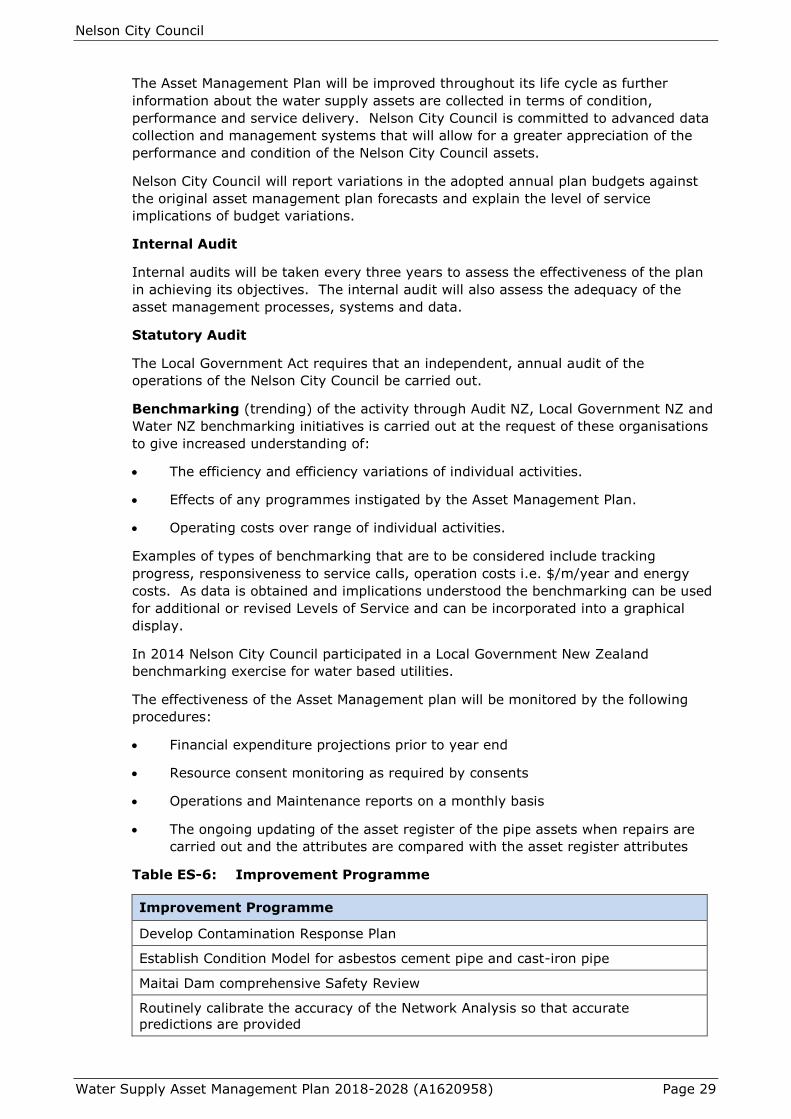
Table ES-6: Improvement Programme
Improvement Programme
Develop Contamination Response Plan
Establish Condition Model for asbestos cement pipe and cast-iron pipe
Maitai Dam comprehensive Safety Review
Routinely calibrate the accuracy of the Network Analysis so that accurate
predictions are provided

Nelson City Council
Water Supply Asset Management Plan 2018-2028 (A1620958) Page 30
Improvement Programme
Improve reporting on levels of service, particularly those that are based on Council
service requests and work orders to contractors. Resolve issues with how the
information is recorded and recovered.
Review asset lives using NAMs– NZ Infrastructure Asset Valuation and Depreciation
Guidelines
Improve accuracy of condition assessments.
Continue the water loss identification and reduction programme
Review the lifelines risk assessment and response
Continue investigations into dis-coloured water issues
Nelson City Council
Water Supply Asset Management Plan 2018-2028 (A1620958) Page 31
Introduction
1.1. Background
Historically, the Nelson City Council has been the predominant water provider to the
residents of Nelson. Over the last 25 years the Nelson City Water Supply has been
significantly improved from a basic supply with a Ministry of Health water supply
grading of Ed (Unacceptable level of risk for source/treatment, Unsatisfactory Level of
risk) for distribution to a modern system with a grading of Ab (Completely satisfactory
– extremely low level of risk, Satisfactory – very low level of risk).
Source
The existing Maitai and Roding sources can provide sufficient water to meet the City’s
needs in a 1 in 60 year drought for the foreseeable future. By provision of a rubber
weir on top of the Maitai Dam spillway the water storage can be increased by
350,000m3, equivalent to 20 years demand growth at current levels. Future wider
demand strategies will enable the existing supply to be adequate until into the 22nd
Century for current projected population increases. Sufficient water of high quality is
therefore available for urban supply for the foreseeable future.
As part of the replacement resource consents for the Nelson water supply from the
Maitai and Roding Rivers Council commissioned an update of the 2007 OPUS drought
study report. WSP-OPUS prepared a number of reports looking at a range of demand
scenarios for the city out to 2100. The reports conclude that under most demand
scenarios the Maitai Dam will provide sufficient drought security for the city in the
medium-long term.
Maitai Pipeline
The Maitai pipeline between the Maitai Dam and the Water Treatment Plant transports
the majority of the water used in the City. It has numerous small shrinkage cracks
and is vulnerable to slips from above and below the pipeline.
Current demand projections show that the Maitai pipeline has sufficient capacity to
supply the City (in conjunction with the Roding pipeline and foothills link) through a 1
in 60 year drought until at least 2100. The Maitai pipeline has been identified as the
highest risk asset and is a “Lifeline” for the city. Council subsequently resolved that
the Maitai pipeline between the dam and the Water Treatment Plant be replaced with a
new main down the Maitai Valley Road, but that the existing pipeline be kept in use to
reduce pumping costs, for as long as it is viable to do so.
Trunk Mains and Reservoirs
With increasing development, demand is spreading north and south beyond the
current trunk main system. Typically demand is spread over a 16 hour period,
whereas water treatment plants and trunk mains function most effectively with
demand spread over 24 hours. Also, in times of emergency water should be available
in the locality it is needed.
A network of trunk mains and reservoirs is therefore necessary to transport and store
water overnight so that peak demand during the day can be met from instantaneous
flow and local storage.
Additional trunk mains and reservoirs are therefore proposed to cope with demand
from growth.
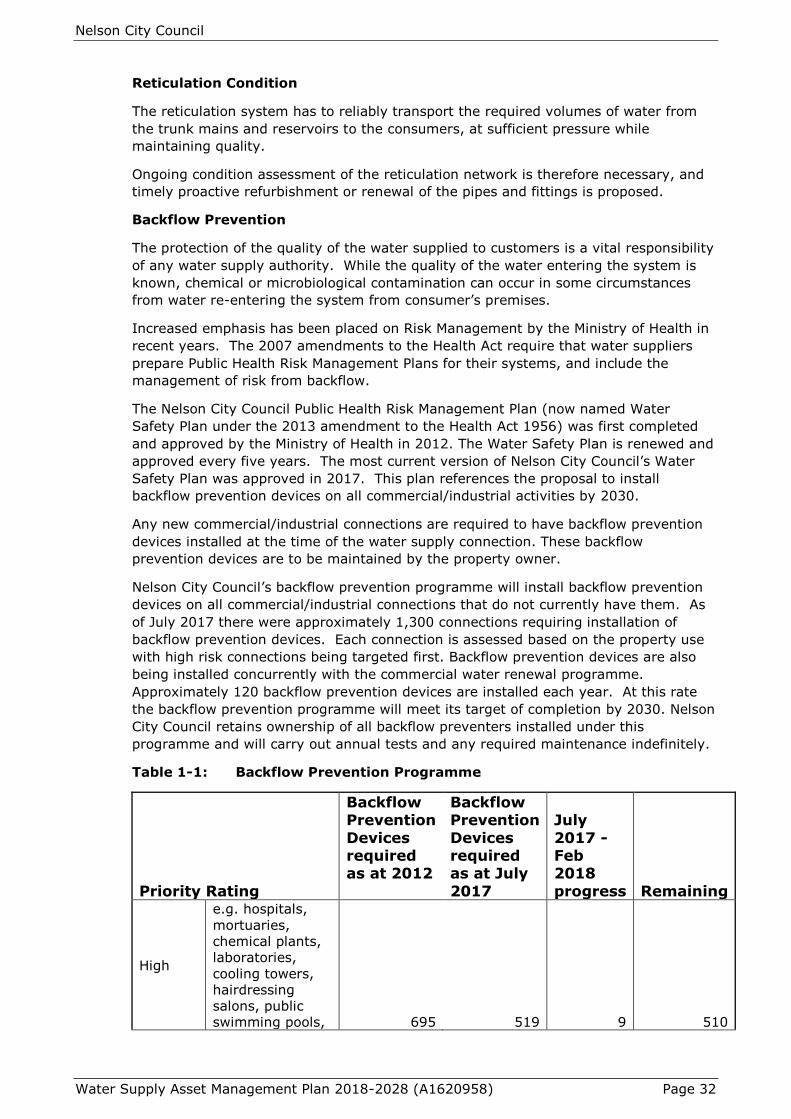
Nelson City Council
Water Supply Asset Management Plan 2018-2028 (A1620958) Page 32
Reticulation Condition
The reticulation system has to reliably transport the required volumes of water from
the trunk mains and reservoirs to the consumers, at sufficient pressure while
maintaining quality.
Ongoing condition assessment of the reticulation network is therefore necessary, and
timely proactive refurbishment or renewal of the pipes and fittings is proposed.
Backflow Prevention
The protection of the quality of the water supplied to customers is a vital responsibility
of any water supply authority. While the quality of the water entering the system is
known, chemical or microbiological contamination can occur in some circumstances
from water re-entering the system from consumer’s premises.
Increased emphasis has been placed on Risk Management by the Ministry of Health in
recent years. The 2007 amendments to the Health Act require that water suppliers
prepare Public Health Risk Management Plans for their systems, and include the
management of risk from backflow.
The Nelson City Council Public Health Risk Management Plan (now named Water
Safety Plan under the 2013 amendment to the Health Act 1956) was first completed
and approved by the Ministry of Health in 2012. The Water Safety Plan is renewed and
approved every five years. The most current version of Nelson City Council’s Water
Safety Plan was approved in 2017. This plan references the proposal to install
backflow prevention devices on all commercial/industrial activities by 2030.
Any new commercial/industrial connections are required to have backflow prevention
devices installed at the time of the water supply connection. These backflow
prevention devices are to be maintained by the property owner.
Nelson City Council’s backflow prevention programme will install backflow prevention
devices on all commercial/industrial connections that do not currently have them. As
of July 2017 there were approximately 1,300 connections requiring installation of
backflow prevention devices. Each connection is assessed based on the property use
with high risk connections being targeted first. Backflow prevention devices are also
being installed concurrently with the commercial water renewal programme.
Approximately 120 backflow prevention devices are installed each year. At this rate
the backflow prevention programme will meet its target of completion by 2030. Nelson
City Council retains ownership of all backflow preventers installed under this
programme and will carry out annual tests and any required maintenance indefinitely.
Table 1-1: Backflow Prevention Programme
Priority Rating
Backflow Prevention
Devices required as at 2012
Backflow Prevention
Devices required as at July
2017
July
2017 - Feb 2018
progress Remaining
High
e.g. hospitals,
mortuaries,
chemical plants,
laboratories,
cooling towers,
hairdressing
salons, public
swimming pools, 695 519 9 510
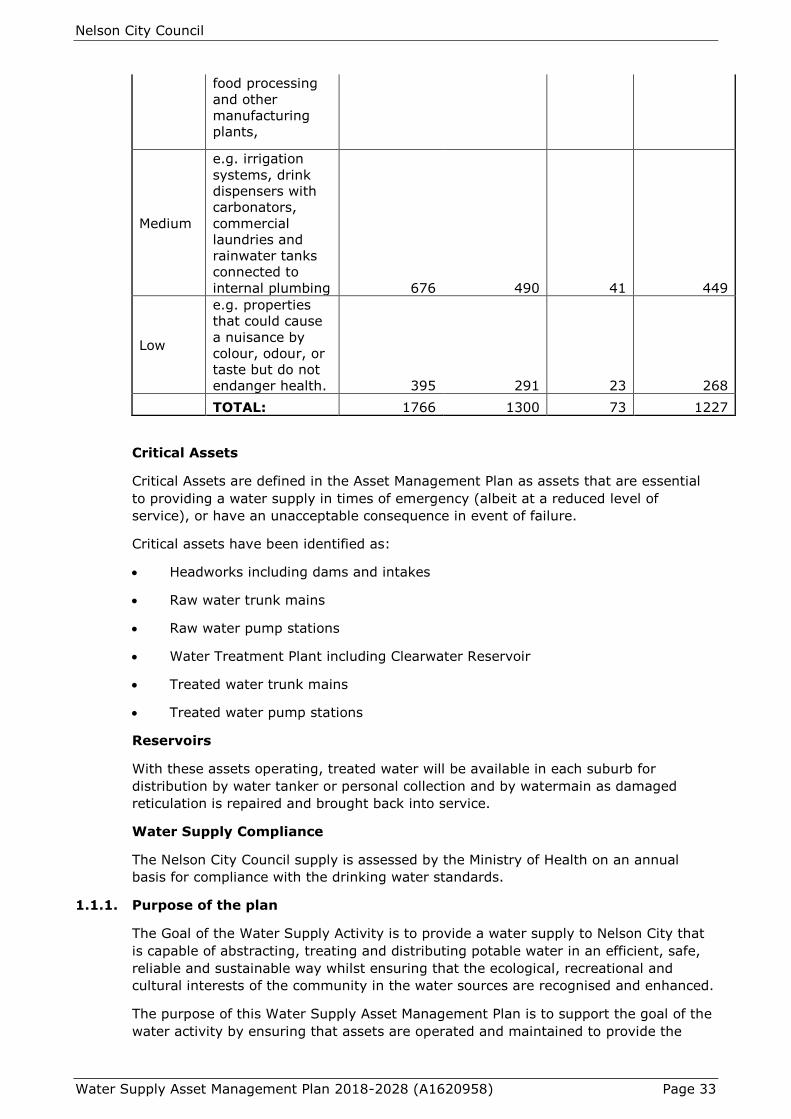
Nelson City Council
Water Supply Asset Management Plan 2018-2028 (A1620958) Page 33
food processing
and other
manufacturing
plants,
Medium
e.g. irrigation
systems, drink
dispensers with
carbonators,
commercial
laundries and
rainwater tanks
connected to
internal plumbing 676 490 41 449
Low
e.g. properties
that could cause
a nuisance by
colour, odour, or
taste but do not
endanger health. 395 291 23 268
TOTAL: 1766 1300 73 1227
Critical Assets
Critical Assets are defined in the Asset Management Plan as assets that are essential
to providing a water supply in times of emergency (albeit at a reduced level of
service), or have an unacceptable consequence in event of failure.
Critical assets have been identified as:
Headworks including dams and intakes
Raw water trunk mains
Raw water pump stations
Water Treatment Plant including Clearwater Reservoir
Treated water trunk mains
Treated water pump stations
Reservoirs
With these assets operating, treated water will be available in each suburb for
distribution by water tanker or personal collection and by watermain as damaged
reticulation is repaired and brought back into service.
Water Supply Compliance
The Nelson City Council supply is assessed by the Ministry of Health on an annual
basis for compliance with the drinking water standards.
1.1.1. Purpose of the plan
The Goal of the Water Supply Activity is to provide a water supply to Nelson City that
is capable of abstracting, treating and distributing potable water in an efficient, safe,
reliable and sustainable way whilst ensuring that the ecological, recreational and
cultural interests of the community in the water sources are recognised and enhanced.
The purpose of this Water Supply Asset Management Plan is to support the goal of the
water activity by ensuring that assets are operated and maintained to provide the
Nelson City Council
Water Supply Asset Management Plan 2018-2028 (A1620958) Page 34
required level of service and to meet community outcomes for present and future
customers in a sustainable and cost effective manner.
The content of the Asset Management Plan further supports the purpose by:
Demonstrating responsible, sustainable management and operation of water
assets which represent a significant, strategic and valuable asset belonging to
Nelson City.
Justify funding requirements.
Demonstrating regulatory compliance under Section 94(1) of the Local
Government Act 2002 which in summary requires the Long Term Council
Community Plan to be supported by:
o Quality information and assumptions underlying forecast information.
o Framework for forecast information and performance measures are
appropriate to assess meaningful levels of service.
Demonstrating clear linkage to community agreed outcomes with stated levels of
service.
The contribution of water services to the Community Outcomes and Asset
Management objectives will be seen through:
Meaningful stakeholder consultation to establish service standards.
Implementing a programme of inspections and monitoring of the network to
assess asset condition and performance.
Undertaking a risk based approach to identify operational, maintenance, renewal
and capital development needs, and applying multi-criteria analysis techniques
to select the most cost effective and sustainable work programme.
Ensuring services are delivered at the right price and quality.
Achieving the appropriate level and quality of asset management practice.
Continuing programme of capital works.
Futureproofing and resilience
The overall objective of Asset Management planning is to:
Meet a required level of service, in the most cost effective manner, through the
management of assets for present and future customers.
This plan will provide the substantiation for budget forecasts put forward in the Long
Term Plan (2018-2028) for water supply.
1.1.2. Relationship with other planning documents
Infrastructure Strategy
In 2014 the Local Government Act 2002 was amended to include section 101B - a
requirement for local authorities to prepare an infrastructure strategy as part of the
Long Term Plan. The strategy is expected to look at least thirty years into the future
and detail the issues that the local authority can reasonably foresee. The office of the
Auditor General has provided guidance documents for authorities to use when
developing the strategy. The National Policy Statement – Urban Development Capacity
impacts on the Infrastructure Strategy. It requires local authorities to ensure there is
Nelson City Council
Water Supply Asset Management Plan 2018-2028 (A1620958) Page 35
sufficient development capacity to meet demand in the short, medium, and long term
(10 – 30 years) with projects required to be identified.
Much of the work required for the strategy comes from the development of this asset
management plan and in order to avoid un-necessary duplication this plan focusses on
the first ten years of the thirty year strategy timeframe.
Proposed Whakamahere Whakatū Nelson Plan
The Nelson City water supply is a run-of-river supply and is the largest abstractor of
water from the Maitai and Roding Rivers. Resource consents are required for most of
the activities that are necessary to operate the water supply. The proposed
Whakamahere Whakatū Nelson Plan is currently being developed by the Nelson City
Council as the replacement for the Nelson Resource Management Plan. While the
impact of the plan on the operation of the water network will become clearer as the
proposed plan rules are developed it is expected that there will be an increased
emphasis on water quality as the proposed plan responds to the National Policy
Statement for Fresh Water Management. Any future water activities will need to meet
the requirements of the proposed Whakamahere Whakatū Nelson Plan when it
becomes operative, with cost implications identified in future asset management plans
as they become obvious. The proposed plan will also include Council’s response to the
requirements of the NZ Coastal Policy Statement and the National Policy Statement
Urban Development Capacity.
Current Nelson Resource Management Plan
The Nelson Resource Management Plan (NRMP) is the operative plan established under
the Resource Management Act 1991. The NRMP is a regulatory document that covers
both district and regional activities. Council seeks to operate the current network in
compliance with this document. To that end Council holds a range of resource
consents for site specific activities including the abstraction of water from the Maitai
and Roding rivers and structures in the rivers.
Environmental Activity & Asset Management Plans
Fresh water quality is a key component of the central government environmental
programme for New Zealand. The National Policy Statement for Fresh Water
Management is expected to halt the decline in fresh water quality and lead
communities to the point of actively improving it.
Council’s investigations of water quality show very good results in upper catchments
where undisturbed native bush predominates and lesser quality through farm/forestry
areas and urban sections of the catchment.
Freshwater quality improvements will be maximised where the source of the negative
impacts can be addressed rather than the community relying on ‘end of pipe’
treatment techniques.
Where water supply activity works involving streams and rivers are undertaken by
Council, environmental protection is considered in the design and resource consent
process. Future emphasis is expected in the following areas:
Stream waterway environmental enhancement from the south branch intake
downstream to the earlier North Branch fork e.g. natural gravel management in
beds where practicable, protection of natural river banks, river bank shade
through vegetation, protection of fish spawning areas, protection of natural ‘pool
and riffle’ stream bed form, natural meanders where possible, free of
manufactured obstructions that impede fish passage where practicable.
Nelson City Council
Water Supply Asset Management Plan 2018-2028 (A1620958) Page 36
Trap and Transfer programmes to ensure fish are assisted past the larger Maitai
and Roding dams where obstructions cannot be remedied.
Improved quality of water discharged to the Maitai River from the Maitai Dam
reservoir.
Among the activities that improve water quality are the following:
various riparian planting initiatives under this asset management plan and the
environment activity plan.
freshwater and sediment contaminant monitoring.
controls on storage and use of hazardous materials under the current and
proposed resource management plans and;
the establishment of re-forestation areas under the reserves asset management
plan.
Community Engagement – Environmental Activity
Council funds a variety of non-regulatory environmental programmes which contribute
to environmental enhancement of freshwater and coastal areas, and encourage the
community to play their part in improving freshwater. Programmes include Nelson
Nature; Healthy Streams; Rainwater Harvesting; Only Rain Down Drains; Riparian
Planting; water conservation education; citizen science stream monitoring; advocacy
for consumer options such as copper free brake pads and zinc free roofing materials;
and behaviour change programmes related to littering, disposal of dog poo, car-
washing and fly tipping behaviours.
Long Term Plan 2018-28
This asset management plan supports Council in the development of the Long Term
Plan 2018-28 by providing the substantiation for budget forecasts put forward in the
Draft Long Term Plan for water supply. As the AMP presents the recommendations of
the authors for the future operations, maintenance and capital works necessary to
meet the levels of service of the utility the Long Term Plan consultation is the means
for the community and Council to provide direction on priorities and affordability for
the next ten years.
Annual Plan
On an annual basis Council reviews the work programme and budgets for the following
year and when changes are required Council will prepare an Annual Plan for public
submissions. The Proposed Annual Plan is measured against the current AMP work
programme and priorities before being adopted.
Future Development Strategy
In response to the National Policy Statement on Urban Development Capacity Nelson
City and Tasman District Council (TDC) are both developing strategies for
accommodating projected growth in population and households, as well as the
attendant business and other demands this growth will bring. The impact on water
volume and quality for these future growth areas is one of the key focus areas for this
asset management plan.
Land Development Manual
The Land Development Manual 2010 is the document that sets out Council’s
engineering requirements for developments under the Nelson Resource Management
Plan and is the basis of Council’s requirements as a network utility operator under the

Nelson City Council
Water Supply Asset Management Plan 2018-2028 (A1620958) Page 37
Building Act 2004. A review of the Land Development Manual 2010 is currently
underway. The proposed new manual is being developed jointly with Tasman District
Council and community stakeholders. As a document that is referenced in the
Proposed Whakamahere Whakatū Nelson Plan it will be subject to a public notification
and submission process.
1.1.3. Infrastructure assets included in the plan
Asset description
The assets covered are from the source water intakes in the water catchments to the
point of supply at individual customers’ boundaries. This includes dams, intake
structures and screens, control equipment, the Water Treatment Plant, tunnels, trunk
mains, secondary mains, rider mains, services, valves, hydrants, non-return valves,
pressure reducing valves, pumps, reservoirs, and water meters.
The extent of the Nelson City Council water system is detailed in Figure 1-1 below and
discussed in detail in the Lifecycle management section.
The inventory of public water services assets owned by Nelson City Council and
managed by the Infrastructure division as at June 2016 is shown in Table 1-2. This
indicates the extent of the water service and reflects the significant investment within
the community.
Table 1-2: Summary of Water Services Assets (June 2016)
Asset Category Quantity
km units
Reticulation 333.8km
Trunk Mains 45.6km
Maitai Pipelines 16.3km
Roding Pipeline 3.9km
Maitai Water Supply Scheme 1
Roding Dam 1
Treatment Plant 1
Tunnels2 3
Reservoirs and Tanks 36
Pump Stations 13
Pressure Reducing / Control
Valves 40
Air & Non Return Valves 165
Gate Valves 3,634
Manholes 91
Hydrants 2,559
Meters 20,829
2 Roding, WTP and Maitai Dam

Nelson City Council
Water Supply Asset Management Plan 2018-2028 (A1620958) Page 38
Asset Category Quantity
km units
Customer Connections 20,260

Nelson City Council
Water Supply Asset Management Plan 2018-2028 (A1620958) Page 39
Figure 1-1: Water Network Nelson
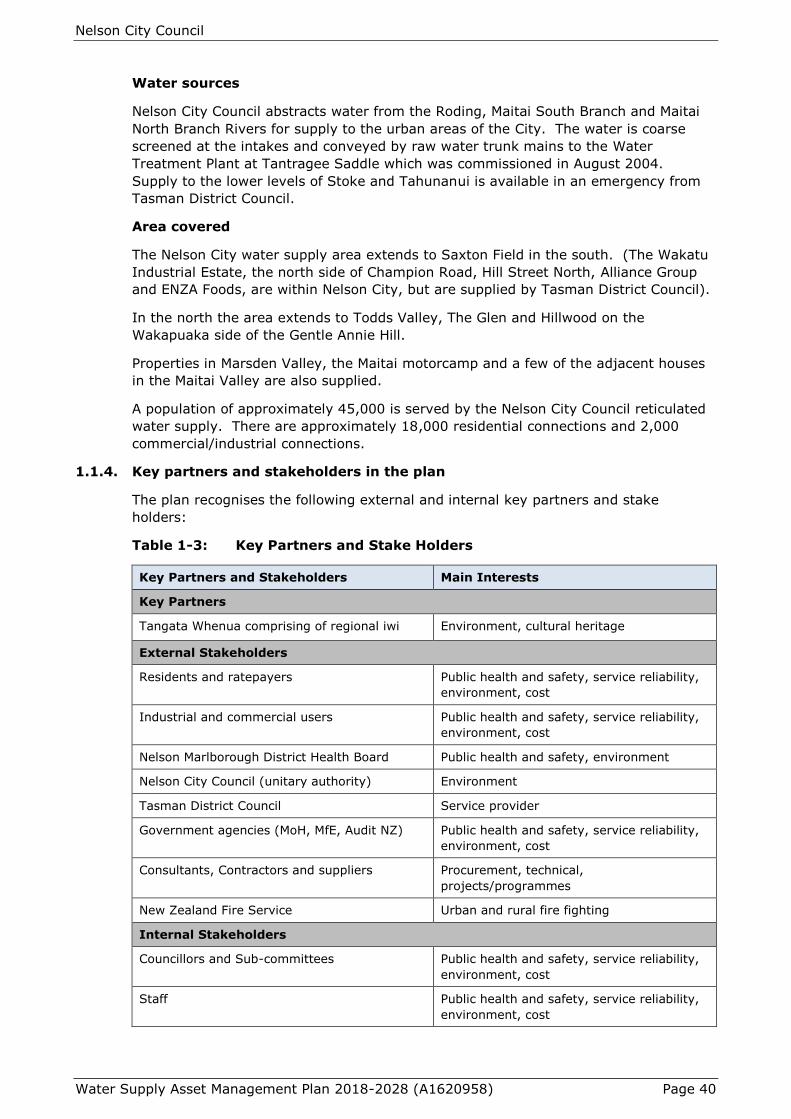
Nelson City Council
Water Supply Asset Management Plan 2018-2028 (A1620958) Page 40
Water sources
Nelson City Council abstracts water from the Roding, Maitai South Branch and Maitai
North Branch Rivers for supply to the urban areas of the City. The water is coarse
screened at the intakes and conveyed by raw water trunk mains to the Water
Treatment Plant at Tantragee Saddle which was commissioned in August 2004.
Supply to the lower levels of Stoke and Tahunanui is available in an emergency from
Tasman District Council.
Area covered
The Nelson City water supply area extends to Saxton Field in the south. (The Wakatu
Industrial Estate, the north side of Champion Road, Hill Street North, Alliance Group
and ENZA Foods, are within Nelson City, but are supplied by Tasman District Council).
In the north the area extends to Todds Valley, The Glen and Hillwood on the
Wakapuaka side of the Gentle Annie Hill.
Properties in Marsden Valley, the Maitai motorcamp and a few of the adjacent houses
in the Maitai Valley are also supplied.
A population of approximately 45,000 is served by the Nelson City Council reticulated
water supply. There are approximately 18,000 residential connections and 2,000
commercial/industrial connections.
1.1.4. Key partners and stakeholders in the plan
The plan recognises the following external and internal key partners and stake
holders:
Table 1-3: Key Partners and Stake Holders
Key Partners and Stakeholders Main Interests
Key Partners
Tangata Whenua comprising of regional iwi Environment, cultural heritage
External Stakeholders
Residents and ratepayers Public health and safety, service reliability,
environment, cost
Industrial and commercial users Public health and safety, service reliability,
environment, cost
Nelson Marlborough District Health Board Public health and safety, environment
Nelson City Council (unitary authority) Environment
Tasman District Council Service provider
Government agencies (MoH, MfE, Audit NZ) Public health and safety, service reliability,
environment, cost
Consultants, Contractors and suppliers Procurement, technical,
projects/programmes
New Zealand Fire Service Urban and rural fire fighting
Internal Stakeholders
Councillors and Sub-committees Public health and safety, service reliability,
environment, cost
Staff Public health and safety, service reliability,
environment, cost
Nelson City Council
Water Supply Asset Management Plan 2018-2028 (A1620958) Page 41
Integrating supply with Tasman District Council
Historically Nelson City and Tasman District have linked water supplies with Tasman
District supplying a small section of the southern part of Nelson City as well as the
Wakatu Industrial Estate. Nelson City supplies Richmond the lesser of 909m3 of
water/day or 1/15 of the Roding authorised supply rate, arising from legislation
covering the construction of the Roding Dam.
The Council has entered into an Engineering Services Agreement (2015) with Tasman
District Council regarding the supply of Roding water to Richmond and the use of the
Waimea Supply to serve the Wakatu Industrial Estate, and development off Champion
Road and Hill Street North. The supply of water to ENZA and the Alliance Group
processing plant is subject to individual contracts between the Tasman District Council
and the customer that expire in June 2020.
This agreement combines the other cross boundary infrastructural service of sewer
reticulation into one agreement with either party required to give a minimum of three
years notice of intention not to renew the agreement.
Under this asset management plan consideration is given to investigating the supply of
these areas by Nelson City should the agreement with Tasman District Council be
terminated prematurely.
1.1.5. Organisation structure
Council has an activity based structure with operations, maintenance and asset
management functions for water supply assets provided by a separate operations and
asset management team. Capital projects are managed by specialist project managers
in a separate service delivery team.
The day to day operations and maintenance of the network are carried out by an
external contractor managed by the team leader – utilities.
Asset management functions are undertaken by separate asset engineers.
1.2. Goals and objectives of asset ownership
1.2.1. Reasons and justification for asset ownership
Council is responsible for the provision of reticulation, treatment and supply along with
strategic planning and management functions.
Council also has a role in regulation and enforcement of the existing legislative and
regulatory framework (including bylaws) to ensure members of the community act
appropriately.
History of Nelson City Council Water Supply
The Nelson City Council and its forebears have been responsible for water supply in
the City since the initial Brook Scheme was constructed in 1874. The following are the
key milestone events:
The Roding supply was introduced in 1940.
The Maitai scheme was commissioned in the early 1960s with a river intake
The Maitai Dam was completed in 1987
Subsequently the Brook system was decommissioned in 2000
The Water Treatment Plant at Tantragee Saddle was commissioned in 2004.
The City has expanded by amalgamation of adjoining areas:

Nelson City Council
Water Supply Asset Management Plan 2018-2028 (A1620958) Page 42
Tahuna Town Board joined to the City in 1950.
Stoke was transferred from Waimea County Council in 1958
Atawhai in 1968
Wakapuaka and Stoke Rural in 1989
Subsequently the Glen reticulation was connected in 1991.
Historically the Nelson City Council has been the predominant water provider to the
residents of Nelson. The Council’s authority to undertake water supply is contained in
Section 12 of the Local Government Act 2002. Under Section 25 of the Health Act
1956, the Minister of Health may require a Council to provide sanitary services, which
includes waterworks. Although it is discretionary whether or not it provides water, the
Council has a long term commitment to carry out this activity.
Nelson City Council does not operate separate rating areas for its water supply zones
as they are essentially operated as one large zone.
The role of Council in the water activity is influenced by the following legislative
requirements.
The Local Government Act:
The Local Government Act 1974: Provides the authority for Nelson City Council to
construct, operate and maintain the Wastewater, Water and Stormwater System.
The Local Government Act 2002: Defines the purpose of local authorities as enabling
local decision-making by and on behalf of the community. The Nelson City Council is a
local authority established under the Local Government Act 2002 (the Act) with
purpose and responsibilities set out in the Act, in particular 10(1)(b), 10(2) and
14(1)(h).
The Health Act 1956:
Places an obligation on Council to improve, promote and protect public health within
the District. The provision of water services helps to promote and improve public
health.
This Asset Management Plan is written on the basis that water supply is an ongoing
core responsibility of Council.
1.2.2. Links to organisation vision, mission, goals and objectives
Vision
Nelson is the Smart Little City
Mission statement
We leverage our resources to shape an exceptional place to live, work and play
Community outcomes
Councils are required by the Local Government Act 2002 to have Community
Outcomes – a statement of the measures of success that Council is working to achieve
for the community. Council has eight current community outcomes in the Long Term
Plan 2018-2028 that are summarised below.
Our unique natural environment is healthy and protected
Our urban and rural environments are people-friendly, well planned and
sustainably managed
Nelson City Council
Water Supply Asset Management Plan 2018-2028 (A1620958) Page 43
Our infrastructure is efficient, cost effective and meets current and future needs
Our region is supported by an innovative and sustainable economy
Our communities are healthy, safe, inclusive and resilient
Our communities have opportunities to celebrate and explore their heritage,
identity and creativity
Our communities have access to a range of social, educational and recreational
facilities and activities
Our Council provides leadership and fosters partnerships, a regional perspective,
and community engagement
Of these eight, four have direct links with the water supply activity and are discussed
in more detail in section 2.2.
Nelson City Council Arts Strategy
Where opportunities present themselves, consideration will be given to the
incorporation of artwork in the water network.
1.2.3. Plan framework and key elements
The framework of the Water Asset Management Plan 2018-28 follows the generic
layout identified in section 4.2 of the International Infrastructure Management Manual
2015.
The plan has the following key elements:
Why we need a plan (Introduction)
What we provide (Levels of service)
Planning for the future (Future demand)
How we provide the service (Lifecycle management)
Dealing with uncertainty (Risk management plan)
What it will cost and how we pay for it (Financial summary)
What we’re doing to improve (Plan improvement and monitoring)
1.3. AM Maturity
Asset Management is recognised as a critical component of Infrastructure
Management globally and this sector has benefited from initiatives to formalise the
practice of asset management since November 1996. The Association of Local
Government Engineering New Zealand (Inc) and the Institute of Public Works
Engineering of Australia have lead the development of the International Infrastructure
Management Manual (IIMM) that forms the basis of Infrastructure Asset Management
Practices at Nelson City Council.
The IIMM provides an AM Maturity Index. The Nelson City Council Asset Management
Policy sets the level of maturity per activity. Refer to the Plan Improvement and
Monitoring – Status of AM Practices section of this plan for details about this activity’s
current maturity status and target levels of maturity.
Levels of service
Asset Management Plans set out the level of service Council seeks to provide the
community for the respective activity.
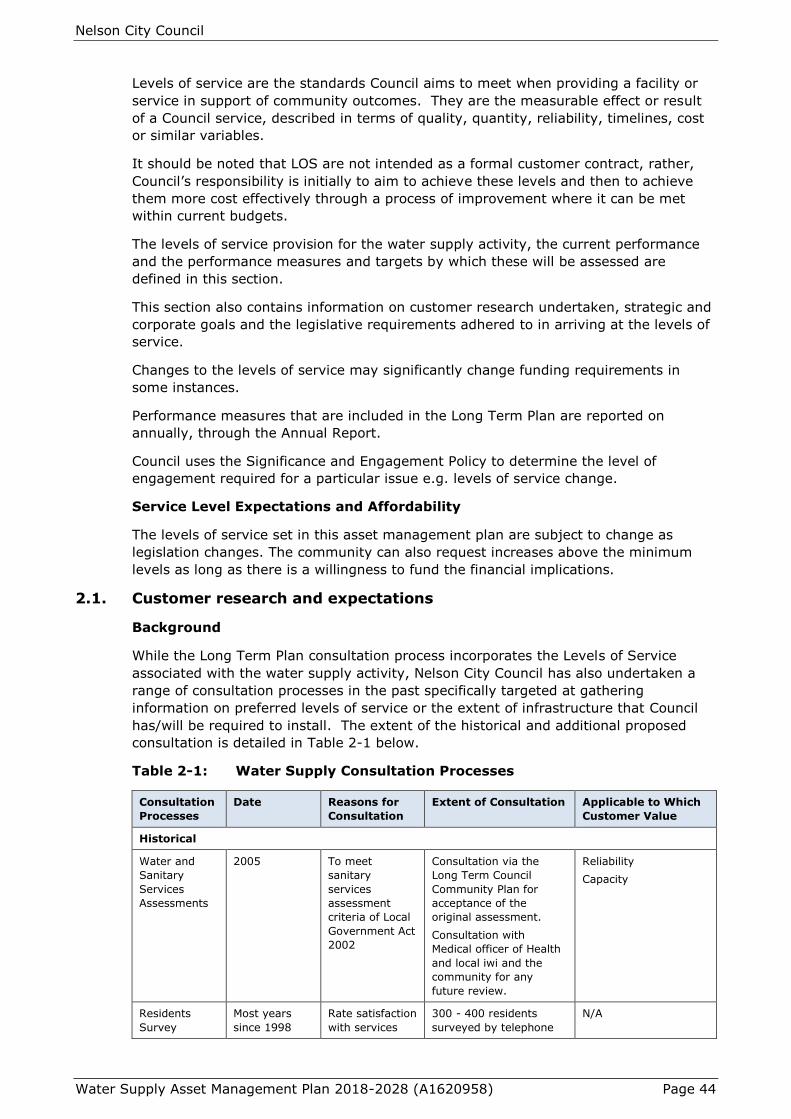
Nelson City Council
Water Supply Asset Management Plan 2018-2028 (A1620958) Page 44
Levels of service are the standards Council aims to meet when providing a facility or
service in support of community outcomes. They are the measurable effect or result
of a Council service, described in terms of quality, quantity, reliability, timelines, cost
or similar variables.
It should be noted that LOS are not intended as a formal customer contract, rather,
Council’s responsibility is initially to aim to achieve these levels and then to achieve
them more cost effectively through a process of improvement where it can be met
within current budgets.
The levels of service provision for the water supply activity, the current performance
and the performance measures and targets by which these will be assessed are
defined in this section.
This section also contains information on customer research undertaken, strategic and
corporate goals and the legislative requirements adhered to in arriving at the levels of
service.
Changes to the levels of service may significantly change funding requirements in
some instances.
Performance measures that are included in the Long Term Plan are reported on
annually, through the Annual Report.
Council uses the Significance and Engagement Policy to determine the level of
engagement required for a particular issue e.g. levels of service change.
Service Level Expectations and Affordability
The levels of service set in this asset management plan are subject to change as
legislation changes. The community can also request increases above the minimum
levels as long as there is a willingness to fund the financial implications.
2.1. Customer research and expectations
Background
While the Long Term Plan consultation process incorporates the Levels of Service
associated with the water supply activity, Nelson City Council has also undertaken a
range of consultation processes in the past specifically targeted at gathering
information on preferred levels of service or the extent of infrastructure that Council
has/will be required to install. The extent of the historical and additional proposed
consultation is detailed in Table 2-1 below.
Table 2-1: Water Supply Consultation Processes
Consultation
Processes
Date Reasons for
Consultation
Extent of Consultation Applicable to Which
Customer Value
Historical
Water and
Sanitary
Services
Assessments
2005 To meet
sanitary
services
assessment
criteria of Local
Government Act
2002
Consultation via the
Long Term Council
Community Plan for
acceptance of the
original assessment.
Consultation with
Medical officer of Health
and local iwi and the
community for any
future review.
Reliability
Capacity
Residents
Survey
Most years
since 1998
Rate satisfaction
with services
300 - 400 residents
surveyed by telephone
N/A
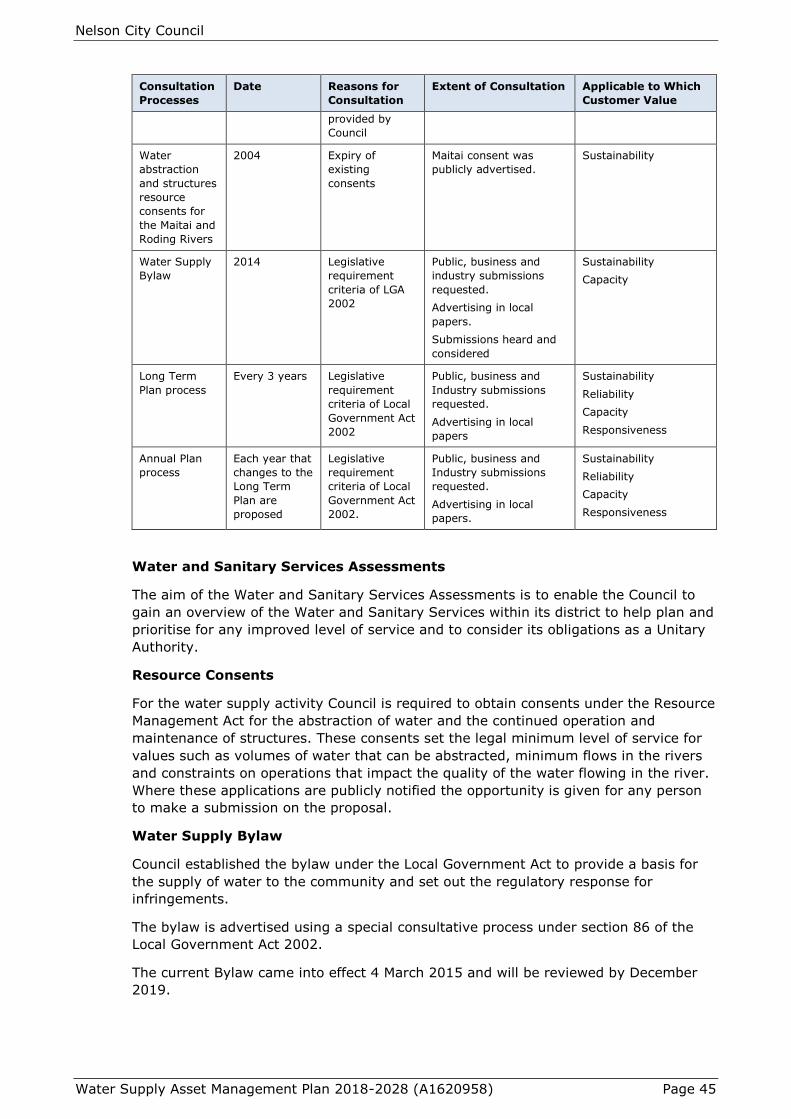
Nelson City Council
Water Supply Asset Management Plan 2018-2028 (A1620958) Page 45
Consultation
Processes
Date Reasons for
Consultation
Extent of Consultation Applicable to Which
Customer Value
provided by
Council
Water
abstraction
and structures
resource
consents for
the Maitai and
Roding Rivers
2004 Expiry of
existing
consents
Maitai consent was
publicly advertised.
Sustainability
Water Supply
Bylaw
2014 Legislative
requirement
criteria of LGA
2002
Public, business and
industry submissions
requested.
Advertising in local
papers.
Submissions heard and
considered
Sustainability
Capacity
Long Term
Plan process
Every 3 years Legislative
requirement
criteria of Local
Government Act
2002
Public, business and
Industry submissions
requested.
Advertising in local
papers
Sustainability
Reliability
Capacity
Responsiveness
Annual Plan
process
Each year that
changes to the
Long Term
Plan are
proposed
Legislative
requirement
criteria of Local
Government Act
2002.
Public, business and
Industry submissions
requested.
Advertising in local
papers.
Sustainability
Reliability
Capacity
Responsiveness
Water and Sanitary Services Assessments
The aim of the Water and Sanitary Services Assessments is to enable the Council to
gain an overview of the Water and Sanitary Services within its district to help plan and
prioritise for any improved level of service and to consider its obligations as a Unitary
Authority.
Resource Consents
For the water supply activity Council is required to obtain consents under the Resource
Management Act for the abstraction of water and the continued operation and
maintenance of structures. These consents set the legal minimum level of service for
values such as volumes of water that can be abstracted, minimum flows in the rivers
and constraints on operations that impact the quality of the water flowing in the river.
Where these applications are publicly notified the opportunity is given for any person
to make a submission on the proposal.
Water Supply Bylaw
Council established the bylaw under the Local Government Act to provide a basis for
the supply of water to the community and set out the regulatory response for
infringements.
The bylaw is advertised using a special consultative process under section 86 of the
Local Government Act 2002.
The current Bylaw came into effect 4 March 2015 and will be reviewed by December
2019.

Nelson City Council
Water Supply Asset Management Plan 2018-2028 (A1620958) Page 46
Residents’ Survey
The purpose of the Residents’ Survey is to get statistically representative resident
feedback on Council performance which is used to report on performance measures
and identify areas for improvement.
Nelson City Council has been conducting annual surveys of residents since the late
1990s, covering a range of topics. Where possible, questions are repeated to enable
comparisons over time. Council’s current approach to annual residents’ surveys is to
run a long (20-minute) survey every three years, timed for the year before the Long
Term Plan (LTP), for example, 2017. This allows a wider range of topics to be covered
to inform LTP decision-making. In the intervening years, such as in 2016, shorter
surveys (up to 10 minutes) are undertaken. These focus on collecting data to report
on LTP performance measures and to inform Asset and Activity Management Plans.
2012 Residents’ Survey
71% responding as satisfied or very satisfied with water supply.
2013 Residents’ Survey
In May 2013 a residents’ survey on behalf of the Nelson City Council was carried out.
This survey was shortened from previous years and did not specifically seek feedback
on the water supply activity.
2014 Residents’ Survey
70% responding as satisfied or very satisfied.
Issues identified within water supply were: Quality, Taste, Price.
2015 Residents’ Survey
A residents’ survey was not carried out in 2015
2016 Residents’ Survey
The 2016 residents’ survey did not seek feedback on the water supply activity.
The 2017 Residents Survey
Water Supply: The level of satisfaction remains high at 72% satisfied or very satisfied.
The three areas of greatest dissatisfaction are Dirty water/poor quality, Chlorine in the
water and Taste of water.
Council has investigated dirty water/poor quality issues across the network. They are
likely to result from iron pipe corrosion products in the network that are a legacy from
the cast-iron and steel pipe sections used in the past. These issues will reduce over
time as the network is renewed. In the interim Council will monitor these and continue
to carry out regular flushing of the network and seek a means of cleaning the cast iron
pipes without disrupting the generally good day to day supply.
Chlorine in the water is used to economically disinfect the water and make it safe to
drink. Council has no plans to reduce the emphasis on safety in this area. In 2017
Central Government conducted an Inquiry into water quality issues following the 2016
campylobacteriosis outbreak in Havelock North. One of the Inquiry recommendations
is to encourage/mandate treatment (chlorination) of water supplies.
Taste may be linked with the comments on chlorine or may also result from some
sections in the reticulation that serve areas where demand is low and water can
remain in the main for some time. Council carries out regular flushing of the areas we
know about.
Nelson City Council
Water Supply Asset Management Plan 2018-2028 (A1620958) Page 47
Conclusions from Residents’ Surveys
Since 2012 the satisfaction level for water supply has remained consistent, rated 4th
highest with respondent, with 70 – 72% responding as satisfied or very satisfied.
Quality, taste, and price have been identified as issues by residents.
Long Term Plan
Every three years Council sets out the proposed plans for the provision of services to
the community for the next ten years. The long term plan covers the operation of the
water supply activity including the reasons for undertaking the activity, levels of
service, description of major projects, financial projections and any key risks that have
been identified.
Annual Plan
When variations to the long term plan are proposed by Council the Local Government
Act requires these be set out in an annual plan for public consultation.

Nelson City Council
Water Supply Asset Management Plan 2018-2028 (A1620958) Page 48
2.2. Strategic and corporate goals
Nelson City Community Outcomes
Councils are required by the Local Government Act 2002 to have Community
Outcomes - a statement of the measure of success that Council is working to achieve
for the community. Council’s community outcomes are set out in the Long Term Plan
2018 – 2028.
Table 2-2: Link between Community Outcomes and the Water Supply
Activity
Community Outcome How this Council activity contributes to the
outcome
Our unique natural environment
is healthy and protected
Nelson’s environment is protected by an
efficiently managed water supply network that
respects the natural, recreational and heritage
values that are present in the rivers that supply
the network and works to protect ecosystem
health.
Our infrastructure is efficient,
cost effective and meets current
and future needs
A good quality, sustainable and affordable water
supply network meets the needs of our current
and future community.
Sufficient and appropriate water supply is
provided to ensure residential and business
growth projections are achieved.
Our region is supported by an
innovative and sustainable
economy
Water resources have an important role in
supporting a range of businesses that rely on
clean and reliable water supplies.
Our communities are healthy,
safe, inclusive and resilient
Safe and well managed water resources deliver
critical health outcomes for the community.
The District and the community outcomes have been developed to provide a link
between community issues and the current water supply goal.
Goal of the water supply activity
To provide a water supply to Nelson City that is capable of abstracting, treating and
distributing potable water in an efficient, safe, reliable and sustainable way whilst
ensuring that the ecological, recreational and cultural interests of the community in
the water sources are recognised and enhanced.
This Asset Management Plan updates the goal, reports on the issues surrounding the
goal and identifies work necessary to meet the goal.
2.3. Legislative requirements
Legislative requirements form the minimum level of service that Council is required to
provide.
The water supply activity is influenced by the following legislative requirements:
Nelson City Council
Water Supply Asset Management Plan 2018-2028 (A1620958) Page 49
Health and Safety at Work Act 2015: Council must ensure the safety of the public
and all workers (including contractors) when carrying out works.
The Local Government Act 2002: The Nelson City Council is a local authority
established under the Local Government Act 2002 (the Act) with purpose and
responsibilities set out in the Act, in particular:
10 Purpose of local government
(1) The purpose of local government is-
(b) to meet the current and future needs of communities for good-quality local
infrastructure, local public services, and performance of regulatory functions in a way
that is most cost-effective for households and businesses.
(2) In this Act, good-quality, in relation to local infrastructure, local public services,
and performance of regulatory functions, means infrastructure, services, and
performance that are-
(a) efficient; and
(b) effective; and
(c) appropriate to present and anticipated future circumstances
Sec 11A sets out core services that Council must consider in performing role:
In performing its role, a local authority must have particular regard to the contribution
that the following core services make to its communities:
(a) network infrastructure:
(b) public transport services:
(c) solid waste collection and disposal:
(d) the avoidance or mitigation of natural hazards:
(e) libraries, museums, reserves, recreational facilities, and other community
infrastructure.
14 Principles relating to local authorities
In performing its role, a local authority must act in accordance with the following
principles:
(h) in taking a sustainable development approach, a local authority should take into
account-
(i) the social, economic, and cultural interests of people and communities; and
(ii) the need to maintain and enhance the quality of the environment; and
(iii) the reasonably foreseeable needs of future generations.
In 2010 an amendment to the Act (sec 261B Local Government Act 2002) required the
Secretary for Local Government to make rules specifying non-financial performance
measures for local authorities to use when reporting to their communities. These have
been developed for water supply and are incorporated into the levels of service.
The Act also requires that local authorities take a sustainable development approach
to everything they do.

Nelson City Council
Water Supply Asset Management Plan 2018-2028 (A1620958) Page 50
Resource Management Act 1991: The Nelson Resource Management Plan (NRMP)
is the operative plan established under the Resource Management Act 1991. Council
seeks to operate the current network in compliance with this document. To that end
Council holds a range of resource consents for site specific activities.
Resource Consents for Water Supply:
Council seeks resource consents where required for all discrete operational activities
and capital work projects.
Resource consents for water extraction
Nelson City draws its public water supply from three sources:
A run of river source from a weir on the Roding River;
A run of river source from a weir on the South Branch of the Maitai River;
An intake tower in a storage dam on the North Branch of the Maitai River;
Nelson City Council had three Resource Consents for the water supply covering the
abstraction of raw water from both the Roding and Maitai rivers, the continued
operation of the Maitai Dam on the North Branch and intake weir on the South Branch
of the Maitai River and the Dam/ intake weir on the Roding River. The consents and
expiry dates are as follows:
RM 960396 Maitai River expired 1/02/2017;
RM 025151 Maitai River expired 1/02/2017;
RM 975374 Roding River expired 1/10/2017.
In 2016 applications for consent for the water supply activities on the Maitai and
Roding Rivers were lodged. On 31 May 2017 resource consents RM165239, RM165317
and RM165318 were granted for the Roding water supply. As at June 2018 the Maitai
Resource Consent application is still being processed. Council will continue to operate
the Maitai water supply under the current resource consent until the replacement
consent is completed.
Compliance with the conditions of resource consents is mandatory and a level of
service has been identified for this purpose.
Resource Consents Held for Water Supply
The resource consents associated with the water supply activity for Nelson City Council
are detailed in Table 2-3 below.
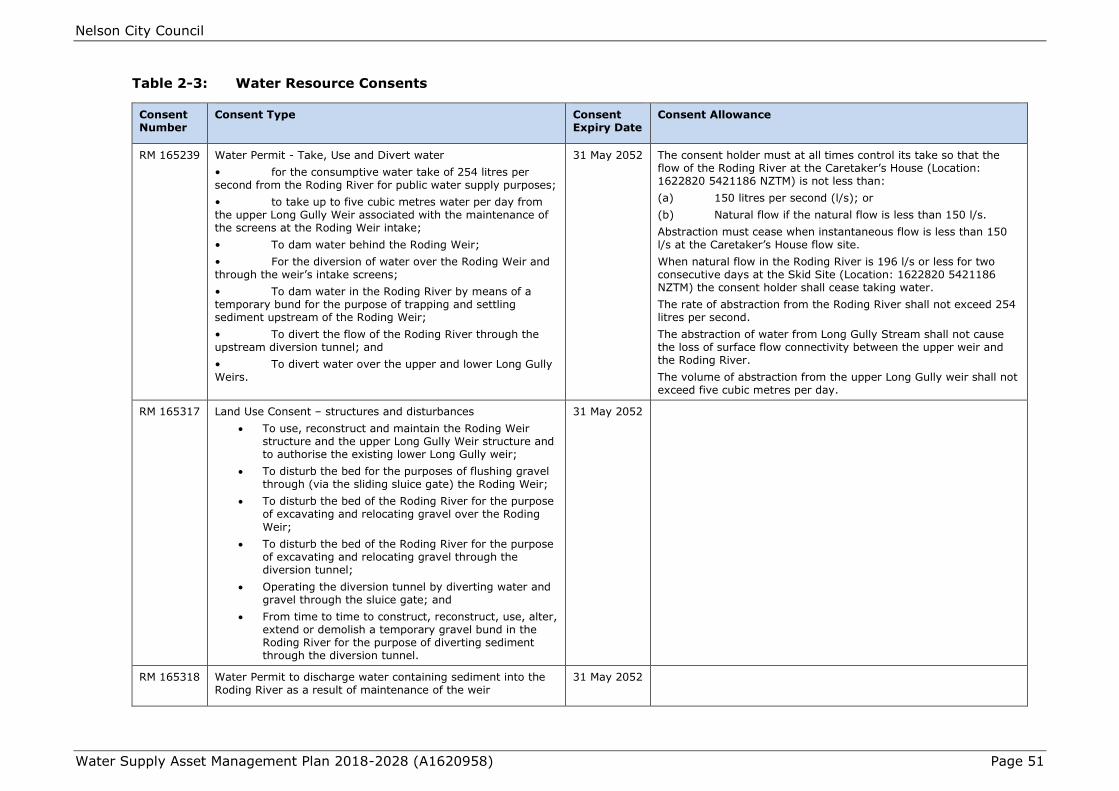
Nelson City Council
Water Supply Asset Management Plan 2018-2028 (A1620958) Page 51
Table 2-3: Water Resource Consents
Consent Number
Consent Type Consent Expiry Date
Consent Allowance
RM 165239 Water Permit - Take, Use and Divert water
• for the consumptive water take of 254 litres per second from the Roding River for public water supply purposes;
• to take up to five cubic metres water per day from the upper Long Gully Weir associated with the maintenance of the screens at the Roding Weir intake;
• To dam water behind the Roding Weir;
• For the diversion of water over the Roding Weir and through the weir’s intake screens;
• To dam water in the Roding River by means of a temporary bund for the purpose of trapping and settling sediment upstream of the Roding Weir;
• To divert the flow of the Roding River through the upstream diversion tunnel; and
• To divert water over the upper and lower Long Gully Weirs.
31 May 2052 The consent holder must at all times control its take so that the flow of the Roding River at the Caretaker’s House (Location: 1622820 5421186 NZTM) is not less than:
(a) 150 litres per second (l/s); or
(b) Natural flow if the natural flow is less than 150 l/s.
Abstraction must cease when instantaneous flow is less than 150 l/s at the Caretaker’s House flow site.
When natural flow in the Roding River is 196 l/s or less for two consecutive days at the Skid Site (Location: 1622820 5421186 NZTM) the consent holder shall cease taking water.
The rate of abstraction from the Roding River shall not exceed 254 litres per second.
The abstraction of water from Long Gully Stream shall not cause the loss of surface flow connectivity between the upper weir and the Roding River.
The volume of abstraction from the upper Long Gully weir shall not exceed five cubic metres per day.
RM 165317 Land Use Consent – structures and disturbances
To use, reconstruct and maintain the Roding Weir structure and the upper Long Gully Weir structure and to authorise the existing lower Long Gully weir;
To disturb the bed for the purposes of flushing gravel through (via the sliding sluice gate) the Roding Weir;
To disturb the bed of the Roding River for the purpose of excavating and relocating gravel over the Roding
Weir;
To disturb the bed of the Roding River for the purpose of excavating and relocating gravel through the diversion tunnel;
Operating the diversion tunnel by diverting water and gravel through the sluice gate; and
From time to time to construct, reconstruct, use, alter, extend or demolish a temporary gravel bund in the Roding River for the purpose of diverting sediment through the diversion tunnel.
31 May 2052
RM 165318 Water Permit to discharge water containing sediment into the Roding River as a result of maintenance of the weir
31 May 2052
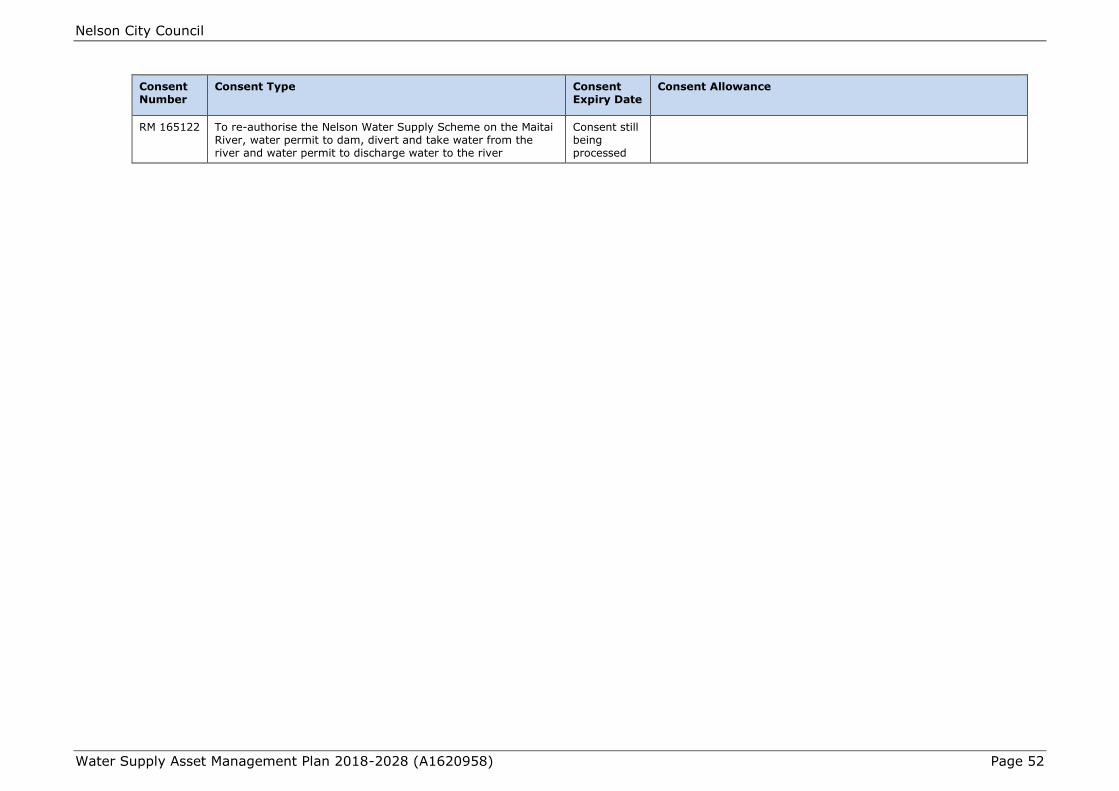
Nelson City Council
Water Supply Asset Management Plan 2018-2028 (A1620958) Page 52
Consent Number
Consent Type Consent Expiry Date
Consent Allowance
RM 165122 To re-authorise the Nelson Water Supply Scheme on the Maitai River, water permit to dam, divert and take water from the river and water permit to discharge water to the river
Consent still being processed
Nelson City Council
Water Supply Asset Management Plan 2018-2028 (A1620958) Page 53
National Policy Statement for Freshwater Management 2014
The NPS-FM sets out how Council’s will manage water quality and quantity. The NPS-
FM requires them to safeguard:
The life-supporting capacity, ecosystem processes and indigenous species
including their associated ecosystems, of fresh water; and
The health of people and communities, at least as affected by secondary contact
with fresh water;
And to ensure the overall quality of freshwater is maintained or improved while:
Protecting the significant values of outstanding freshwater bodies;
Protecting the significant values of wetlands; and
Improving the quality of fresh water in water bodies that have been degraded by
human activities to the point of being over-allocated.
With respect to water quantity the NPS-FM also requires safeguarding of life-
supporting capacity, ecosystem processes and indigenous species and ecosystems;
while also avoiding further over-allocation and phasing out existing over-allocation,
improving and maximising the efficient use and allocation of water, and protecting the
significant values of wetlands and outstanding freshwater bodies.
National Policy Statement Urban Development Capacity
Land use, development and development infrastructure are integrated with each other
in a manner that ensures urban environments have sufficient opportunities to meet
demand.
The National Policy Statement for Urban Development Capacity (NPS-UDC) requires
local authorities to ensure there is sufficient development capacity to meet demand in
the urban environment in the short term (within 3 years), medium term (3-10 years)
and long term (10-30 years). Short-term capacity must be feasible, zoned and
serviced while long-term capacity must be feasible, with servicing planned but does
not need to be zoned yet.
Local authorities with a medium or high growth urban area also need to provide an
additional margin of feasible development capacity over and above projected demand
of at least: 20% in the short and medium term; and 15% in the long term.
Building Act 2004 - Dam Safety Regulations
The Building Act 2004 requires that dam owners assess their dam against regulatory
standards as being high, medium, or low impact in the event of failure, and to provide
that information to their regional authority.
In 2015 the Building and Construction Minister confirmed that these requirements
were to be removed from the Building Act and new requirements would be considered
for inclusion in the Resource Management Act. To date there is no final proposal in
place. The Maitai Dam is subject to an annual safety review by the designers and
every five years a comprehensive safety review is carried out by a separate specialist
dam consultancy.
The National Environmental Standard for Sources of Human Drinking Water
Regulations came into force on 6 June 2008. The purpose of the regulations is to
reduce the risk of contamination of drinking water sources by requiring Regional
Councils to consider the effects of granting water abstraction consents or discharge
consents upstream of drinking water abstraction points. As all the Maitai and Roding

Nelson City Council
Water Supply Asset Management Plan 2018-2028 (A1620958) Page 54
catchments above the intakes are owned by Nelson City Council and managed as a
waterworks reserve, there is no specific level of service that comes from these
regulations.
The Drinking Water Standards for New Zealand 2005/08
The Drinking Water Standards list the maximum concentrations of chemical,
radiological, and microbiological contaminants acceptable for public health in drinking
water. The standards also specify the sampling protocols that must be observed to
demonstrate that the drinking water complies with the standards.
The Health (Drinking Water) Amendment Act 2007
There is a provision that requires water suppliers, when they become aware that the
water is not meeting the drinking water standards to take appropriate steps to correct
the problem.
The Ministry of Health currently offers water suppliers regular grading of water
supplies to measure compliance with the standards. The grading schedule is shown in
Table 2-7 in the Current level of service section.
Havelock North Drinking Water Government Inquiry
The event of the campylobacteriosis outbreak in Havelock North in August 2016
brought about a Government Inquiry.
Recommendations made by the Inquiry broadly fall into the following categories:
Administrative:
o Promulgate six principles of drinking water safety
o Review NZ standards, Health Act and Drinking Water standards and abolish
‘secure’ classification for bores
o Establish an independent drinking water regulator
o Ministry of Health to improve compliance with existing regulations
o Amend the Resource Management Act to improve water source protection
o Accelerate the review of the National Environmental Standard for Sources
of Human Drinking Water.
Operational:
o Encourage/mandate treatment (chlorination) of water supplies
o Encourage formation of joint working groups to oversee drinking water
safety throughout the country
o Introduce licensing and qualification requirements for suppliers and
operators
o Create dedicated and aggregated drinking water suppliers,
o Improve the testing and laboratories regime
o Prohibit high risk bore construction techniques.
The report also has a section with recommendations that the Government look at
aggregating supplies of water.

Nelson City Council
Water Supply Asset Management Plan 2018-2028 (A1620958) Page 55
The recommendations largely rely on Central Government to enact legislation before
they can be implemented. Some progress on these is likely during 2018-19. Those
recommendations that encourage treatment of drinking water and improving
compliance with existing regulations have already been actioned by the Ministry of
Health.
2.4. Current level of service
Significant negative effects
It is a requirement of the Local Government Act 2002 Amendment Act 2010 (2(1)(c))
to outline any significant negative effects that any activity within a group of activities
may have on the social, economic, environmental, or cultural well-being of the local
community.
Table 2-4 below identifies the negative effects for the Nelson city Community that the
water supply activity may have. It indicates the existing approach or proposed action to
address these in future.
Table 2-4: Negative Effects – The Water supply Activity
Effect Status of Effect Type of
Effect
Impact on Well-Being Existing Approach
or Proposed Action
to Address
Exis
tin
g
Po
ten
tial
Neg
ati
ve
Sig
nif
ican
tly
Neg
ati
ve
So
cia
l
Eco
nom
ic
En
vir
on
men
tal
Cu
ltu
ral
Pump Stations
Noise. Static Static √ Minor Nil Minor Nil High degree of noise
mitigation in
residential areas
during storm events.
Environmental
Growth is constrained by
lack of water supply
infrastructure
Static Static √ Minor Mod Minor Minor NPS-UDC work for
Nelson urban area
guides to prioritise
roll out to ensure
demand is met.
High water demand
decreases flow
Static Static √ Minor Minor Mod Mod Resource consent
states that
abstraction must
cease when a
minimum flow is
met. Water
restrictions decrease
water use.
Water restrictions during
extended dry period
Static Static √ Minor Minor Minor Minor Apply water
restrictions in stages
to avoid sudden
heavy restrictions

Nelson City Council
Water Supply Asset Management Plan 2018-2028 (A1620958) Page 56
Table 2-5: Outlines the current levels of service for 2015-25
Performance Target
Community
Outcomes
Level of
service
Performance Measures Previous and current
performance
2018/19
(Year 1)
2019/20
(Year 2)
2020/21
(Year 3)
2021/22
2027/28
(Year 4-
10)
Our
communities
are healthy,
safe, inclusive
and resilient
Quality
^Good
quality water
The extent to which drinking water
supply complies with:
a) part 4 of the drinking water
standards# (bacterial compliance
criteria), and
b) part 5 of the drinking water
standards# (protozoal compliance
criteria)*
1
The 2016-17 review of the city water supply by the Drinking Water Assessment Unit of the Ministry of Health confirmed that compliance with part 4 of the drinking water standards was achieved for both the source and distribution network and compliance with part 5 of the drinking water standards was confirmed for the source. Protozoal compliance is not measured for the distribution network as the city operates an ultra-filtration treatment plant that will remove any protozoa at source.
Achieved 2015/16
Achieved 2014/15
Maintain Ab=
grading and
ensure potable
water supplied to
customers
Maintain Maintain Maintain
The total number of complaints
received about any of the following:
a) drinking water clarity
b) drinking water odour
c) drinking water pressure or flow
d) continuity of supply, and
e) the response to any of these issues
expressed per 1000 connections to the
networked reticulation system*
2
21 complaints per 1000
connections 2016/17
35 complaints per 1000
connections
2015/16
No more than 100
justifiable
complaints.*
Maintain Maintain Maintain
Our
infrastructure
is efficient,
cost effective
Reliable
The average consumption of drinking
water per day per resident*
3
288L per person per day 2016/17
268L per person per day
2015/16
Normal demand is
less than 500L
per person per
day.*
Maintain Maintain Maintain
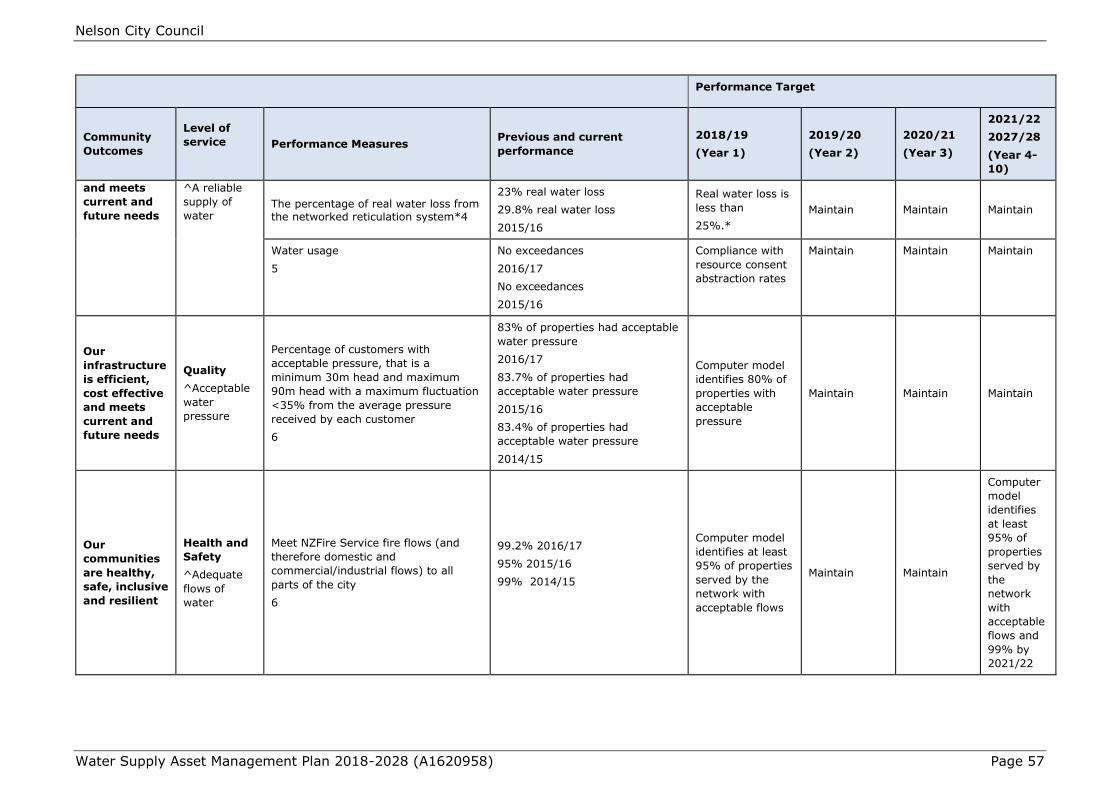
Nelson City Council
Water Supply Asset Management Plan 2018-2028 (A1620958) Page 57
Performance Target
Community
Outcomes
Level of
service
Performance Measures Previous and current
performance
2018/19
(Year 1)
2019/20
(Year 2)
2020/21
(Year 3)
2021/22
2027/28
(Year 4-
10)
and meets
current and
future needs
^A reliable
supply of
water The percentage of real water loss from the networked reticulation system*4
23% real water loss
29.8% real water loss
2015/16
Real water loss is
less than
25%.*
Maintain Maintain Maintain
Water usage
5
No exceedances
2016/17
No exceedances
2015/16
Compliance with
resource consent
abstraction rates
Maintain Maintain Maintain
Our
infrastructure
is efficient,
cost effective
and meets
current and
future needs
Quality
^Acceptable
water
pressure
Percentage of customers with
acceptable pressure, that is a
minimum 30m head and maximum
90m head with a maximum fluctuation
<35% from the average pressure
received by each customer
6
83% of properties had acceptable
water pressure
2016/17
83.7% of properties had
acceptable water pressure
2015/16
83.4% of properties had
acceptable water pressure
2014/15
Computer model
identifies 80% of
properties with
acceptable
pressure
Maintain Maintain Maintain
Our
communities
are healthy,
safe, inclusive
and resilient
Health and
Safety
^Adequate
flows of
water
Meet NZFire Service fire flows (and
therefore domestic and
commercial/industrial flows) to all
parts of the city
6
99.2% 2016/17
95% 2015/16
99% 2014/15
Computer model
identifies at least
95% of properties
served by the
network with
acceptable flows
Maintain Maintain
Computer
model
identifies
at least
95% of
properties
served by
the
network
with
acceptable
flows and
99% by
2021/22

Nelson City Council
Water Supply Asset Management Plan 2018-2028 (A1620958) Page 58
Performance Target
Community
Outcomes
Level of
service
Performance Measures Previous and current
performance
2018/19
(Year 1)
2019/20
(Year 2)
2020/21
(Year 3)
2021/22
2027/28
(Year 4-
10)
Our
infrastructure
is efficient,
cost effective
and meets
current and
future needs
Customer
Service
^A prompt
response to
reported
network
issues
Where attending a call-out in response
to a fault or unplanned interruption to
the networked reticulation system, the
following median response times
measured:
a) attendance for urgent call-outs:
from the time that notification is
received to the time that service
personnel reach the site, and
b) resolution of urgent call-outs: from
the time that notification is received to
the time that service personnel confirm
resolution of the fault or interruption.
c) attendance for non-urgent call-outs:
from the time that notification is
received to the time that service
personnel reach the site, and
d) resolution of non-urgent call-outs:
from the time that notification is
received to the time that service
personnel confirm resolution of the of
the fault or interruption*
2
a) Contractor attended urgent
call-outs in a median time of:
21 minutes 2016/17
28 minutes 2015/16
b) Contractor resolved urgent
call-outs in a
median time of:
107 minutes 2016/17
105 minutes 2015/16
c) Contractor attended non-
urgent call-outs in a median time
of:
54 minutes 2016/17
56 minutes 2015/16
d) Contractor resolved non-
urgent call-outs in a median time
of:
330 minutes 2016/17
345.5 minutes 2015/16
a) Contractor to
attend urgent
call-outs in a
median time of 60
minutes or less.
b) Contractor to
resolve urgent
call-outs in a
median time of
480 minutes or
less.
c) Contractor to
attend non-urgent
callouts
in a median time
of 660 minutes or
less.
d) Contractor to
resolve non-
urgent call outs in
a median time of
1440 minutes or
less.
Maintain Maintain Maintain
Our unique
natural
environment
is healthy and
protected
A network
that protects
the natural
environment
Comply with resource consents
RM025151 and RM975374 conditions
for allowable water abstraction rates,
re-vegetation of stream banks and eel
and fish passage requirements
5
Compliance reporting was
received from the contractor for
2016/17:
Maitai River results showed flow
and temperature conditions were
met. Roding River showed no
breaches of the minimum flows.
Eel transfer from the Maitai River
to the Reservoir was carried out
as required, with a total of 98
eels
being transferred, and fish
passage
100% compliance Maintain Maintain Maintain
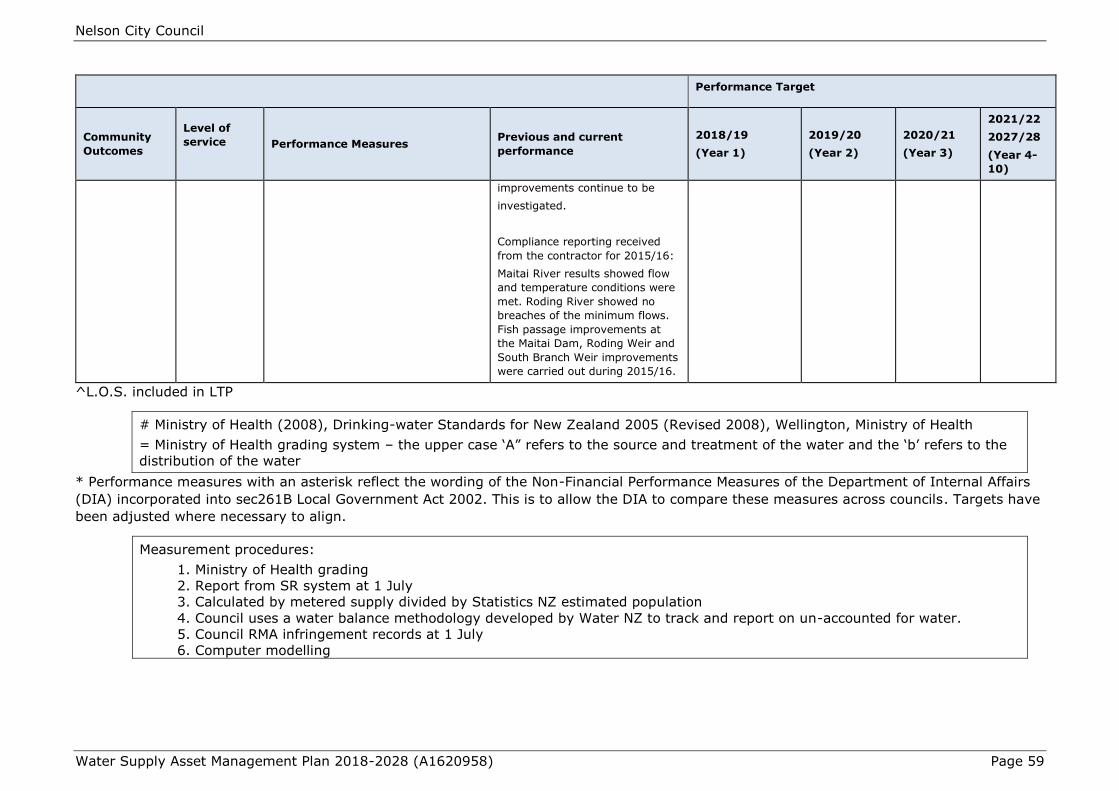
Nelson City Council
Water Supply Asset Management Plan 2018-2028 (A1620958) Page 59
Performance Target
Community
Outcomes
Level of
service
Performance Measures Previous and current
performance
2018/19
(Year 1)
2019/20
(Year 2)
2020/21
(Year 3)
2021/22
2027/28
(Year 4-
10)
improvements continue to be
investigated.
Compliance reporting received
from the contractor for 2015/16:
Maitai River results showed flow
and temperature conditions were
met. Roding River showed no
breaches of the minimum flows.
Fish passage improvements at
the Maitai Dam, Roding Weir and
South Branch Weir improvements
were carried out during 2015/16.
^L.O.S. included in LTP
# Ministry of Health (2008), Drinking-water Standards for New Zealand 2005 (Revised 2008), Wellington, Ministry of Health
= Ministry of Health grading system – the upper case ‘A” refers to the source and treatment of the water and the ‘b’ refers to the
distribution of the water
* Performance measures with an asterisk reflect the wording of the Non-Financial Performance Measures of the Department of Internal Affairs
(DIA) incorporated into sec261B Local Government Act 2002. This is to allow the DIA to compare these measures across councils. Targets have
been adjusted where necessary to align.
Measurement procedures:
1. Ministry of Health grading
2. Report from SR system at 1 July
3. Calculated by metered supply divided by Statistics NZ estimated population
4. Council uses a water balance methodology developed by Water NZ to track and report on un-accounted for water.
5. Council RMA infringement records at 1 July
6. Computer modelling
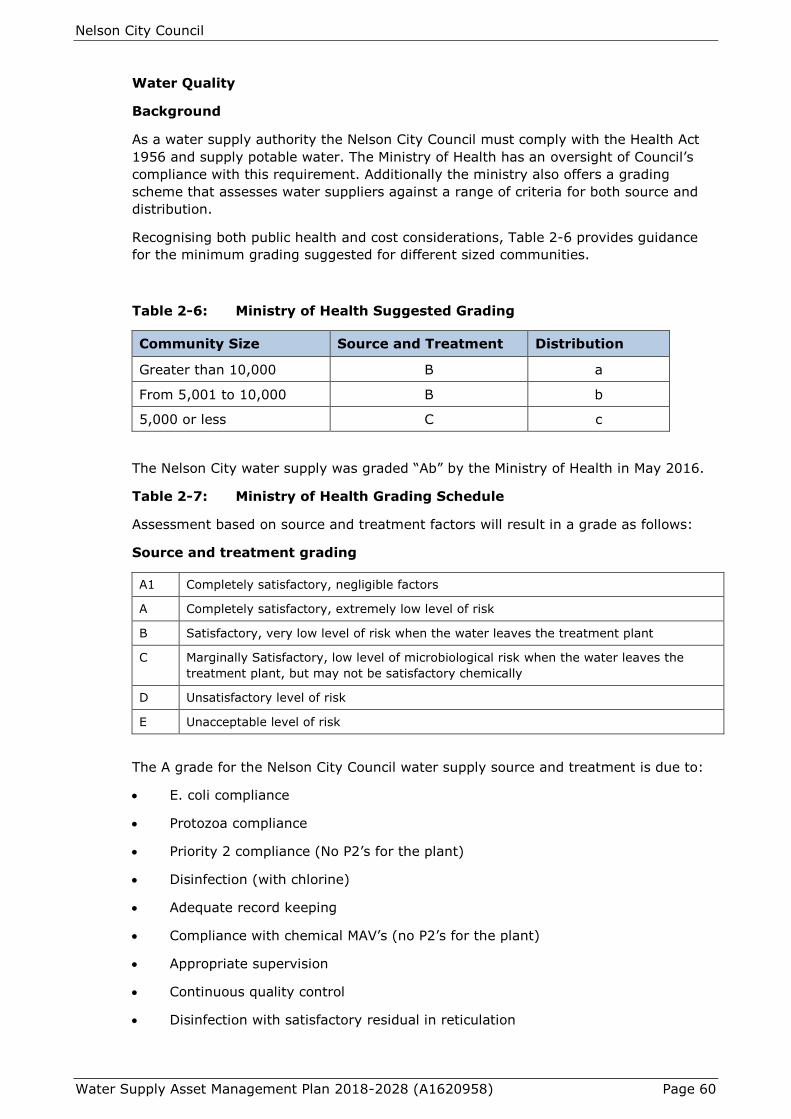
Nelson City Council
Water Supply Asset Management Plan 2018-2028 (A1620958) Page 60
Water Quality
Background
As a water supply authority the Nelson City Council must comply with the Health Act
1956 and supply potable water. The Ministry of Health has an oversight of Council’s
compliance with this requirement. Additionally the ministry also offers a grading
scheme that assesses water suppliers against a range of criteria for both source and
distribution.
Recognising both public health and cost considerations, Table 2-6 provides guidance
for the minimum grading suggested for different sized communities.
Table 2-6: Ministry of Health Suggested Grading
Community Size Source and Treatment Distribution
Greater than 10,000 B a
From 5,001 to 10,000 B b
5,000 or less C c
The Nelson City water supply was graded “Ab” by the Ministry of Health in May 2016.
Table 2-7: Ministry of Health Grading Schedule
Assessment based on source and treatment factors will result in a grade as follows:
Source and treatment grading
A1 Completely satisfactory, negligible factors
A Completely satisfactory, extremely low level of risk
B Satisfactory, very low level of risk when the water leaves the treatment plant
C Marginally Satisfactory, low level of microbiological risk when the water leaves the
treatment plant, but may not be satisfactory chemically
D Unsatisfactory level of risk
E Unacceptable level of risk
The A grade for the Nelson City Council water supply source and treatment is due to:
E. coli compliance
Protozoa compliance
Priority 2 compliance (No P2’s for the plant)
Disinfection (with chlorine)
Adequate record keeping
Compliance with chemical MAV’s (no P2’s for the plant)
Appropriate supervision
Continuous quality control
Disinfection with satisfactory residual in reticulation

Nelson City Council
Water Supply Asset Management Plan 2018-2028 (A1620958) Page 61
The distribution grading system is based on the accrual of “demerit” points for various
attributes not present. The sum of the demerit points determines the grading as
shown in Table 2-8.
Table 2-8: Distribution zone grading
Assessment based on source and treatment factors will result in a grade:
Sum of demerit
points
Grade Description
0-10 a1 Completely satisfactory, negligible level of risk; demonstrably
high quality; meets Aesthetic Guidelines in Appendix C and has
ISO 9001: 2000 accreditation.
0-10 a Completely satisfactory, extremely low level of risk
11-20 b Satisfactory, very low level of risk
21-30 c Marginally satisfactory, moderately low level of risk
31-45 d Unsatisfactory level of risk
46 or more e Unacceptable level of risk
Reference: Report on Public Health Grading of a Drinking Water Supply – Nelson City
Council, Nelson Marlborough District Health Board, May 2008.
The distribution demerit points in the 2008 - 2016 gradings were received for:
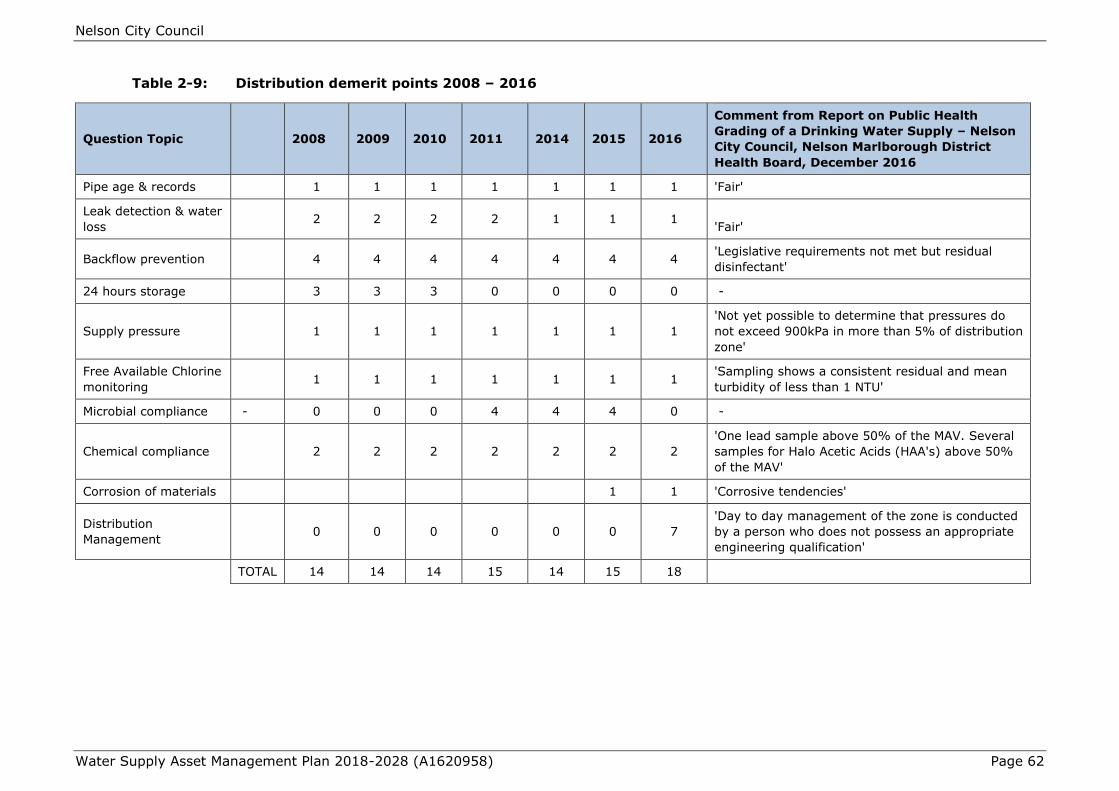
Nelson City Council
Water Supply Asset Management Plan 2018-2028 (A1620958) Page 62
Table 2-9: Distribution demerit points 2008 – 2016
Question Topic 2008 2009 2010 2011 2014 2015 2016
Comment from Report on Public Health
Grading of a Drinking Water Supply – Nelson
City Council, Nelson Marlborough District
Health Board, December 2016
Pipe age & records 1 1 1 1 1 1 1 'Fair'
Leak detection & water
loss 2 2 2 2 1 1 1
'Fair'
Backflow prevention
4 4 4 4 4 4 4 'Legislative requirements not met but residual
disinfectant'
24 hours storage 3 3 3 0 0 0 0 -
Supply pressure
1 1 1 1 1 1 1
'Not yet possible to determine that pressures do
not exceed 900kPa in more than 5% of distribution
zone'
Free Available Chlorine
monitoring 1 1 1 1 1 1 1
'Sampling shows a consistent residual and mean
turbidity of less than 1 NTU'
Microbial compliance - 0 0 0 4 4 4 0 -
Chemical compliance
2 2 2 2 2 2 2
'One lead sample above 50% of the MAV. Several
samples for Halo Acetic Acids (HAA's) above 50%
of the MAV'
Corrosion of materials 1 1 'Corrosive tendencies'
Distribution
Management
0 0 0 0 0 0 7
'Day to day management of the zone is conducted
by a person who does not possess an appropriate
engineering qualification'
TOTAL 14 14 14 15 14 15 18
Nelson City Council
Water Supply Asset Management Plan 2018-2028 (A1620958) Page 63
Grading Gaps
The extreme rain events of December 2011 and April 2013 reduced the available staff
time resource within Council, which together with Central Government proposals to
review the grading initiative lead to suspending grading assessments until 2014.
Current Grading
The greatest level of demerit points (7) accrue from the day to day management of
the zone not being in the hands of a person with an appropriate engineering
qualification. The operations and management team has people with the necessary
qualifications in the senior management and contract supervisor roles and are satisfied
the specific circumstances that attract the demerit points do not pose an un-
acceptable risk to customers.
The second greatest level of demerit points (4) accrue from the ongoing programme
to install backflow prevention devices at each site connected to the network. All
customers with a connection using a residential style water meter also have a double
check valve in the assembly. The programme to complete installation of backflow
prevention devices to all other customer connections is expected to be completed
within the term of this asset management plan.
Chemical compliance (2). A number of chemicals are present in water supplies from
natural sources and resulting from reactions of disinfectants and the constituents of
the water. Testing of the network has identified levels of Haloacetic acids that need to
be monitored. Haloacetic acids result from the interaction of chlorine with the
components of water. In large quantities these can be carcinogenic in some people.
Free Available Chlorine Equivalent (FACE) Monitoring (1). Chlorine is added to the final
stage of the water treatment plant process as a long lasting disinfection product.
Council continuously monitors the levels of chlorine in the water leaving the treatment
plant and at the Stoke high level reservoir but does not continuously monitor for this
in the wider network. Tests for available chlorine levels are carried out multiple times
per week on a rotation of sites through the city when samples are taken to test for the
presence of E.coli. Undertaking a cost/benefit analysis of continuous chlorine level
monitoring would be valuable as a means of comparing the relative merits of the
current practice versus the enhanced option.
Compliance reporting rather than a grading report is currently preferred by the
Ministry of Health. This change has been made in the levels of service going forward.
Reliability
Background
Water Sources
As part of the design of the Maitai Dam, Council has determined that the urban water
supply should have the capacity to withstand a 1 in 60 year drought.
An analysis of the flows in the South Branch of the Maitai river by Tasman District
Council hydrologists has indicated that low flows for the 1, 50, 90 and 100 year return
period droughts are as follows:
1 year: 203 litres per second
50 year: 90 litres per second
90 year: 84 litres per second
Nelson City Council
Water Supply Asset Management Plan 2018-2028 (A1620958) Page 64
100 year: 83 litres per second
The conditions of the existing Resource Consent for the Maitai abstraction require that
a residual flow of 175 litres per second be left in the Maitai River from 1 November to
30 April, and 300 litres per second be left in the river from 1 May to 31 October.
However, if the river flow is naturally low during this period, the residual flow may be
reduced. When the mean daily flow exceeds 140 litres per second the minimum flow
is 300 litres per second. When the mean daily flow is less than or equal to 140 litres
per second the minimum flow is 225 litres per second. When the mean daily flow is
less than 130 litres per second the minimum flow is 190 litres per second. The
storage held in the Maitai dam is used to make up the shortfall in natural flows.
As part of the proposed replacement resource consent for the Maitai River it is
anticipated that minimum instantaneous flows will be increased.
The conditions of the Resource Consent for the Roding abstraction require that a
residual flow of 150 litres per second or the natural flow (whichever is the greater) be
left in the Roding River.
Water reticulation
Water supply networks are historically very reliable, with many customers not
experiencing a single loss of supply event. This extremely high reliability has tended to
make customers assume that reliability is guaranteed.
As a consequence customers are becoming less tolerant of interruptions to the supply.
Some industrial and commercial processes which are reliant on a continuous water
supply have assumed a continual supply and have no provision for standby facilities.
The continuity of supply can never be guaranteed, in part because many causes of
supply failure are beyond the control of the water supply authority. An example is
damage to a service main that could be caused by a contractor excavating in the
street while working on other utilities (such as electricity, telephone, sewer, etc).
Older asbestos cement pipes have deteriorated and are the main source of
spontaneous breaks.
The Nelson City Council Water Supply Bylaw warns that water quality or continuity of
supply is not guaranteed.
Performance Measurement and Monitoring
The following actions are currently undertaken to monitor the network reliability:
Record daily headworks supply and treatment plant supply.
Record the actual time the water supply is interrupted and restored, and number
of properties affected.
Record all complaints regarding “out of water”.
Record time and type of notice of shutdown given to consumers.
Monitor peak daily demands annually and maintain graphical record to develop
future demand curve.
Un-Accounted for Water
Council estimates that the city network has un-accounted for water (UFW) volume of
approximately 30% of the water that leaves the treatment plant. This amounts to an
average 2.4 million cubic metres per year. This figure is arrived at by comparing the
volume of water leaving the treatment plant with the volume that is recorded by
customer’s meters. Being able to quantify this figure is very important and improving

Nelson City Council
Water Supply Asset Management Plan 2018-2028 (A1620958) Page 65
the accuracy of records is currently a focus of the activity. A programme of repairing
reported leaks and proactive leak detection is included in the activity budgets. See
appendix E.
Sources of unaccounted for Water (UFW) are found in the following:
Firefighting and hydrant flow testing;
Overflows at reservoirs and losses during cleaning;
Mains testing and flushing;
Unknown connections;
Use by contractors.
Controlling UFW can significantly reduce demand. UFW control also has an
environmental benefit as it reduces the quantities of water that are required to be
abstracted from the river sources.
Pressure
Background
Public Heath Grading of Community Water Supplies 2003 Explanatory Notes and
Grading Forms imposes distribution grading “demerit points” where there is:
Pressure in excess of 900 kPa in more than 5% of the zone; or
Pressures less than 100 kPa; or
Pressures lower than 150 kPa in significant parts of the zone during high
demand.
New Zealand Fire Service Firefighting Water Supplies Code of Practice 2008 requires
10m head residual running pressure, i.e. pressure remaining in the pipe after
abstraction of the firefighting water.
NZS 4404: 2010 Land Development and Subdivision Engineering recommends water
supply pressure shall be between 250 kPa and 800 kPa (25m to 80m head)
Council endeavours to maintain water pressure between 30m head and 90m head.
New Zealand Fire Service Firefighting Water Supplies Code of Practice 2008 specifies
volume and pressure requirements for the water supply system within the Urban Fire
District.
Pressure fluctuation
The maximum available pressure is called the static pressure. This occurs overnight
during the low flow period. As demand increases in a pipe network, the friction of the
moving water in the mains causes a reduction in pressure known as friction loss.
The working pressure (that experienced by the customer) is the static pressure less
the friction loss. Demand varies though the day and year. With increased demand,
customers experience lower pressures during the day and in summer. A difference
between static pressure and working pressure of more than 35% is considered
excessive.

Nelson City Council
Water Supply Asset Management Plan 2018-2028 (A1620958) Page 66
Minimum Pressure
The minimum working pressure at the ground floor level of buildings should ideally be
not less than 300kPa (30m head) with an absolute minimum of 150kPa (15 metre
head) in exceptional instances. The water supply levels in the 1996 Resource
Management Plan were set at 67m (low level zones) and 110m (high level zones) to
ensure these standards are met for all new developments.
In some of the more recent hill top developments above the water supply level, the
issues of continuity of supply and pressure fluctuations have been resolved by the
installation of storage tanks and in some cases pump stations. To avoid the need for
water towers and allow maximum land development, the standards have been eased
so that:
Dwellings with ground floor level less than 30m below the floor of the reservoir
are required to install a domestic pressure pump and tank to ensure adequate
pressures. Oversize service connections are provided to minimise friction losses.
Conditions Book entries advise of these special circumstances. The system works well
as the presence of the storage tank ensures continuity of supply.
Maximum Working Pressure
The maximum pressure normally targeted would be in the order of 600kPa (60m
head). Due to Nelson’s hilly terrain and the ample pressure generated by the elevation
of the headworks, Nelson City Council pressures are substantially higher.
In the lower areas of the city, static pressures can range from 400kPa to 950kPa.
(40m to 95m head). Pressures in some of these areas have been reduced over the
last 20 years (in particular, the Port and the residential areas of Stoke and Tahunanui
on the seaward side of State Highway 6), by installing new pressure reducing valves,
adjusting down existing pressure reducing valves, or installing new mains. This can
cause difficulties where plumbing and sprinkler systems have been designed for
existing water pressures.
Pressures in the 60 to 95m head range are still acceptable for domestic supply,
although not ideal, and may need reviewing in the future.
Excessive pressures can lead to early failure of mains and contribute to problems of
Unaccounted for Water losses.
Of more concern are the areas on the edge of high pressure zones (in particular, the
bottom of the Port Hills, the Tahunanui Hills, Toi Toi Valley, Washington Valley and the
Grampians. As a cost saving measure when the City was developed, these areas were
served by the high pressure mains that also carry water to the top of the hills. Static
pressure in some of these areas is in the range of 1400kPa to 1800kPa (140m to
180m head).
These pressures are in excess of normal working pressures. It is likely that most of
these residents have installed their own pressure limiting valves. As mains in these
areas are re-laid the opportunity is taken to provide additional capacity and change
them over into the pressure reduced zone.
$500,000 is included in the Capital budget over the next 10 years i.e. $50,000 per
year until 2027/28, for system improvements including the installation of new
pressure reducing valves and mains to address this problem of excess pressure.
In addition to the above the renewal budget over the next 10 years will be used to lay
new mains to better withstand the system pressures.
Nelson City Council
Water Supply Asset Management Plan 2018-2028 (A1620958) Page 67
Performance Monitoring
The following actions are currently undertaken to monitor the network pressures:
Record all complaints regarding “high or low pressure”.
Monitor pressure at pressure reducing valves daily.
Flow rate
Background
The flow rate available to each customer is the greatest influence on the customer’s
impressions as to the adequacy of the water supply. Low flow rates cause water to
dribble from shower heads and fill basins and baths slowly.
Many low flow problems are caused by inadequacies of the plumbing within the
property and this is beyond the control of the Nelson City Council. Therefore the level
of service is defined at the point of supply (the toby or service valve).
Flow rate requirements can be divided into three categories:
Domestic Flow Rates
Customer expectations have changed in the last 35 years and whereas 20 litres per
minute was previously considered adequate customers now expect 30 litres per
minute.
30 litres per minute is the standard aimed for in Nelson. Provided the minimum
pressure standards are achieved then this flow rate should be readily available.
One of the symptoms of excessive pressure is too high a flow rate. This can cause
water from the cold tap to bounce out of sinks and basins and creates water hammer
in both the property’s plumbing and the water reticulation system when automatic
valves in dishwashers and washing machines close off.
To alleviate these symptoms residents partially close the stopcock at the boundary.
This practice shortens the life of the stopcock and increases the Council's maintenance
costs.
Resolution of the excessive pressure problem will solve this problem.
Industrial/Commercial Flow Rates
The flow rates required by industrial processors are specific to each individual site.
These are almost impossible to predict in advance so reticulation systems in industrial
areas are provided with additional capacity.
With the exception of the Port Area, any proposal to use large volumes of water will be
restricted by the capacity of the existing local mains to deliver the water and the
sewerage system to convey and treat the effluent.
Commercial areas as distinct from industrial areas generally have low water demand
except for firefighting.
Fire Fighting Flow Rates
The public supply is designed to provide an effective firefighting network. Hydrants are
installed on all service mains in urban supply areas in accordance with the New
Zealand Fire Service Firefighting Water Supplies Code of Practice.

Nelson City Council
Water Supply Asset Management Plan 2018-2028 (A1620958) Page 68
The New Zealand Fire Service issued a revised Firefighting Water Code of Practice in
2008.
The required firefighting water supply for each building (other than single or multi-unit
housing but excluding multi-storey apartment blocks) must now be calculated for the
floor area of the building and the fire hazard category involved rather than being read
directly from a table as previously. Any deficiencies identified for particular premises
would have to be remedied by the owner by increasing the firefighting water supply,
reducing the fire hazard in order to meet the requirements of the code, or installing a
fire sprinkler system.
The required flow for single or multi-unit housing (but excluding multi-storey
apartment blocks) is 25 litres per second with a minimum of 12.5 litres per second
from a hydrant within 135 metres of the risk and a further minimum of 12.5 litres per
second from another hydrant within 270 metres of the risk. Different flows are
required in Commercial/Industrial areas depending upon the fire hazard (low–medium
hazards require 50l/s – 150l/s from a range of operating hydrants).
Previous versions of this code of practice measured the distances from properties to
fire hydrants as a radius centred on the property, the current version now measures
the true “along the road” distance. This has had the effect of now increasing the
number of properties that do not currently meet the distance requirement.
The Fire Service Code of Practice allows that where there is a reliably calibrated and
accepted system for computer modelling of flows in a reticulated water system, the
Fire Service may accept the outputs from such modelling in place of testing certain fire
hydrants.
Generally domestic demand is not critical and the supply of water for firefighting
purposes will determine the reticulation pipe sizes required.
Problems with inadequate hydrant flows are experienced in some of the older areas of
the City where the original 75mm and 100mm diameter cast iron water mains are
incapable of delivering the flow rates required. Renewal work in recent years has
concentrated on replacing these mains. The programme of replacing all 75mm
diameter cast iron mains in the City was largely completed in 2006/07. This work also
helped to address the problems with fluctuating and low pressures.
A specific project to address the issue of fire flows across the city has been underway
since 2015/16. To date this work has rectified flows to 149 properties. The areas to be
upgraded will be regularly reviewed and identified using the water network model.
Contractors Service Response and System Operation
The Utilities Services Maintenance contract requires that the maintenance contractor
responds to calls within appropriate times depending on the circumstances as follows.
Urgent Works
Urgent works are defined in the first column of the response timetable below in Table
2-10.
Response times apply 24 hours per day every day of the year.
The Contractor must respond to and satisfactorily resolve maintenance works within
the maximum response times for the specified percentage of cases.
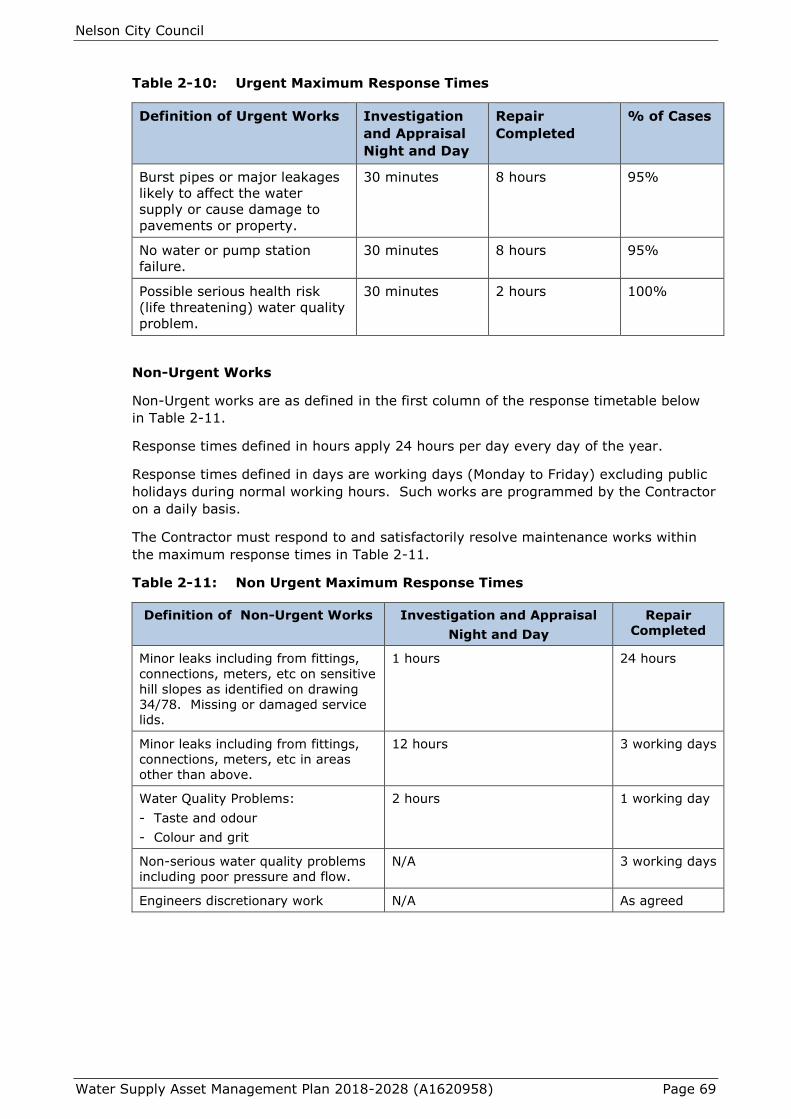
Nelson City Council
Water Supply Asset Management Plan 2018-2028 (A1620958) Page 69
Table 2-10: Urgent Maximum Response Times
Definition of Urgent Works Investigation
and Appraisal
Night and Day
Repair
Completed
% of Cases
Burst pipes or major leakages
likely to affect the water
supply or cause damage to
pavements or property.
30 minutes 8 hours 95%
No water or pump station
failure.
30 minutes 8 hours 95%
Possible serious health risk
(life threatening) water quality
problem.
30 minutes 2 hours 100%
Non-Urgent Works
Non-Urgent works are as defined in the first column of the response timetable below
in Table 2-11.
Response times defined in hours apply 24 hours per day every day of the year.
Response times defined in days are working days (Monday to Friday) excluding public
holidays during normal working hours. Such works are programmed by the Contractor
on a daily basis.
The Contractor must respond to and satisfactorily resolve maintenance works within
the maximum response times in Table 2-11.
Table 2-11: Non Urgent Maximum Response Times
Definition of Non-Urgent Works Investigation and Appraisal
Night and Day
Repair
Completed
Minor leaks including from fittings,
connections, meters, etc on sensitive
hill slopes as identified on drawing
34/78. Missing or damaged service
lids.
1 hours 24 hours
Minor leaks including from fittings,
connections, meters, etc in areas
other than above.
12 hours 3 working days
Water Quality Problems:
- Taste and odour
- Colour and grit
2 hours 1 working day
Non-serious water quality problems
including poor pressure and flow.
N/A 3 working days
Engineers discretionary work N/A As agreed

Nelson City Council
Water Supply Asset Management Plan 2018-2028 A1620958 70
2.5. Desired level of service
Table 2-12: Levels of Service 2018-28
Performance Target
Community
Outcomes
Level of
service Performance Measures
Previous and current
performance
2018/19
(Year 1)
2019/20
(Year 2)
2020/21
(Year 3)
2021/22
2027/28
(Year 4-10)
Our
communities
are healthy,
safe, inclusive
and resilient
Quality
^Good quality
water
The extent to which
drinking water supply complies
with:
a) part 4 of the drinking water
standards# (bacterial
compliance criteria), and
b) part 5 of the drinking water
standards# (protozoal
compliance criteria)*
c) part 8 of the drinking water
standards# (chemical
compliance criteria)
1
Complied a) and b) 2016/17
Complied a) and b) 2015/16
Complied a) and b) 2014/15
Protozoal compliance is not measured for distribution As treatment plant removes any at source. c) is a new measure in the Long Term Plan 2018-28.
In 2016/17, Council
complied with part 8 of the
drinking water standards at
the treatment plant, but the
distribution network did not
comply.
100% compliance with parts 4,5 and 8 of the drinking water standards
Total number of complaints per
1000 connections about any of
the following*:
- drinking water clarity
- drinking water taste
- drinking water odour
- drinking water pressure or
flow
- continuity of supply
- Council’s response to the
above issues
2
21 complaints per 1000
connections in 2016/17
35 complaints per 1000
connections in 2015/16
No more than 50 valid complaints per 1000 connections

Nelson City Council
Water Supply Asset Management Plan 2018-2028 A1620958 71
Performance Target
Community
Outcomes
Level of
service Performance Measures
Previous and current
performance
2018/19
(Year 1)
2019/20
(Year 2)
2020/21
(Year 3)
2021/22
2027/28
(Year 4-10)
Our
infrastructure is
efficient, cost
effective and
meets current
and future
needs
Reliability
^A reliable
supply of water
Average drinking water
standard consumption per day
per resident*
3
288L per person per day
2016/17
268L per person per day
2015/16
Normal demand is less than 500L per person per day. This includes
both domestic and commercial-industrial
% real water loss from the
system*
4
23% in 2016/17
29% in 2015/16 Real water loss less than 25%.
Our
infrastructure is
efficient, cost
effective and
meets current
and future
needs
Customer
Service
^Prompt
response
When attending a call-out in
response to a fault or
unplanned interruption to the
system,
the following median response
times will be measured:
a) attendance for urgent call-
outs: from the time notification
is received to the time service
personnel reach the site
b) resolution of urgent call-
outs: from the time notification
is received to the time service
personnel confirm resolution of
the fault or interruption
c) attendance for non-urgent
call-outs: from the time
notification is received to the
time that service personnel
reach the site
d) resolution of non-urgent
call-outs: from the time
notification is received to the
time service personnel confirm
resolution of the fault or
interruption*
Median
21 minutes in 2016/17
28 minutes in 2015/16
Median
107 minutes in 2016/17
105 minutes in 2015/16
Median
54 minutes in 2016/17
56 minutes in 2015/16
Median
330 minutes in 2016/17
346 minutes in 2015/16
a) Contractor to attend urgent call-outs in a median time of 30 minutes
or less.
b) Contractor to resolve urgent call-outs in a median time of 480
minutes or less.
c) Contractor to attend non-urgent callouts
in a median time of 120 minutes or less.
d) Contractor to resolve non-urgent call outs in a median time of 24
hours or less.
Nelson City Council
Water Supply Asset Management Plan 2018-2028 A1620958 72
Performance Target
Community
Outcomes
Level of
service Performance Measures
Previous and current
performance
2018/19
(Year 1)
2019/20
(Year 2)
2020/21
(Year 3)
2021/22
2027/28
(Year 4-10)
2
^L.O.S. included in LTP
# Ministry of Health (2008), Drinking-water Standards for New Zealand 2005 (Revised 2008), Wellington, Ministry of Health
* Performance measures with an asterisk reflect the wording of the Non-Financial Performance Measures of the Department of Internal Affairs
(DIA) incorporated into sec261B Local Government Act 2002. This is to allow the DIA to compare these measures across councils. Targets have
been adjusted where necessary to align.
Measurement procedures:
1. Ministry of Health grading
2. Report from SR system at 1 July
3. Calculated by metered supply divided by Statistics NZ estimated population
4. Council uses a water balance methodology developed by Water NZ to track and report on un-accounted for water.
Nelson City Council
Water Supply Asset Management Plan 2018-2028 A1620958 73
FUTURE DEMAND
Existing situation
The aim is to have the capacity to withstand a 1 in 60 year drought with only sprinkler
and hosing restrictions until at least 2035. Outputs in this demand section are
therefore calculated on this basis.
Water for the city is extracted directly from both the Maitai and Roding rivers, piped to
the treatment plant at the Tantragee saddle and then delivered to the city.
Water from the Maitai river is extracted from a run of river intake on the South Branch
of the headwaters or from the Dam reservoir on the North Branch. The dam has been
constructed on the North Branch to store water for use in low flow periods and for
supplementary water flows to compensate for extraction from the South Branch.
An analysis of the flows in the South Branch of the Maitai river by Tasman District
Council hydrologists has indicated that low flows for the 1, 50, 90 and 100 year return
periods are as follows:
1 year: 203 litres per second
50 year: 90 litres per second
90 year: 84 litres per second
100 year: 83 litres per second
The Maitai Dam was designed to meet a peak demand of 37,000m3/day through a 75
year return period drought but has the capacity to supply water at the rate of
50,000m3/day through a 60 year return period drought. With the completion of the
Water Treatment Plant a further 900,000m3 of water from the bottom of the Maitai
Lake can be treated and used for city supply. However, pumping will be required to
transport this water to the treatment plant. This additionally available water may
need further conditioning prior to use as potable water to address low oxygen levels,
elevated organic material levels and heavy metal concentrations.
The existing Maitai pipeline has a maximum capacity of approximately 37,000m3/day.
The Roding Dam has only limited storage and is a run of river intake. Provided there
is an adequate flow in the river the Roding pipeline can deliver a maximum of
22,000m3/day. The estimated flow in the Roding River in a 1 in 60 year drought is
11,200m3/day.
However, the Resource Consent for water extraction from the Roding requires that a
minimum flow of 150 litres per second, or the natural flow if less than this, be left in
the river.
150 litres per second equates to 12,960m3/per day. In a 1 in 60 year drought there
is not likely to be any available abstraction from the Roding River.
With the completion of the duplicate Maitai pipeline the 1 in 60 year drought capacity
will be:
Maitai 50,000m3/day
Roding nil
50,000m3/day
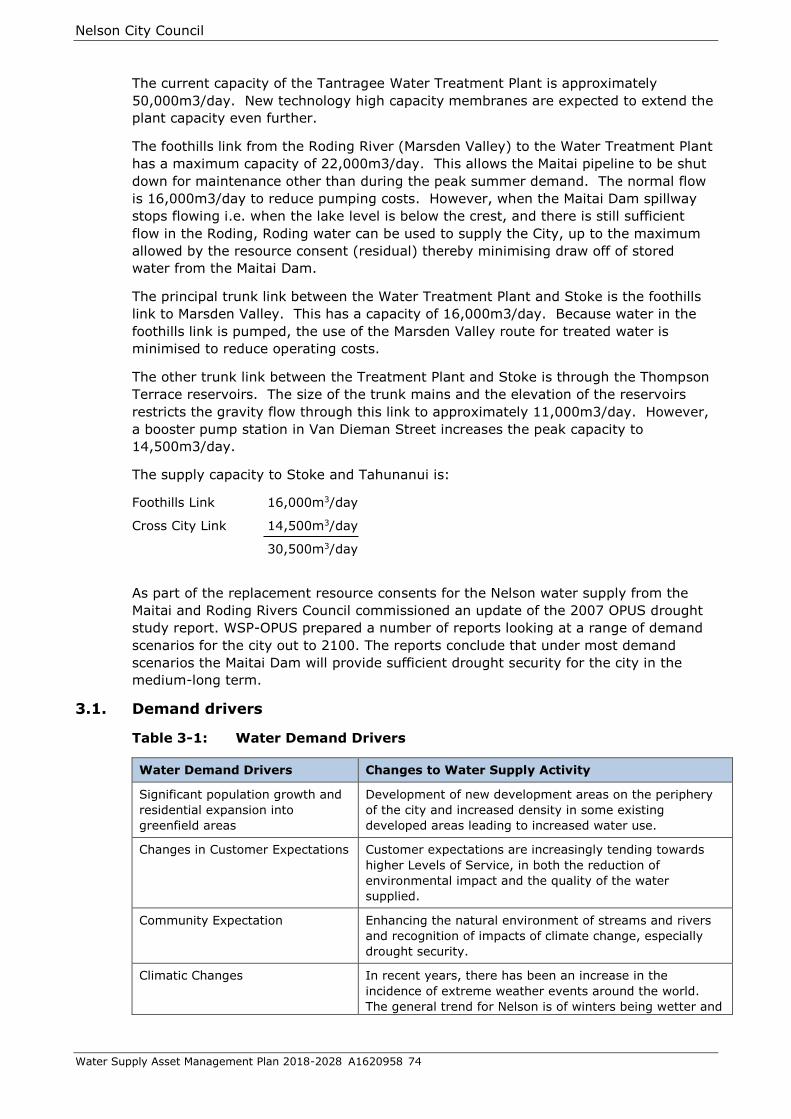
Nelson City Council
Water Supply Asset Management Plan 2018-2028 A1620958 74
The current capacity of the Tantragee Water Treatment Plant is approximately
50,000m3/day. New technology high capacity membranes are expected to extend the
plant capacity even further.
The foothills link from the Roding River (Marsden Valley) to the Water Treatment Plant
has a maximum capacity of 22,000m3/day. This allows the Maitai pipeline to be shut
down for maintenance other than during the peak summer demand. The normal flow
is 16,000m3/day to reduce pumping costs. However, when the Maitai Dam spillway
stops flowing i.e. when the lake level is below the crest, and there is still sufficient
flow in the Roding, Roding water can be used to supply the City, up to the maximum
allowed by the resource consent (residual) thereby minimising draw off of stored
water from the Maitai Dam.
The principal trunk link between the Water Treatment Plant and Stoke is the foothills
link to Marsden Valley. This has a capacity of 16,000m3/day. Because water in the
foothills link is pumped, the use of the Marsden Valley route for treated water is
minimised to reduce operating costs.
The other trunk link between the Treatment Plant and Stoke is through the Thompson
Terrace reservoirs. The size of the trunk mains and the elevation of the reservoirs
restricts the gravity flow through this link to approximately 11,000m3/day. However,
a booster pump station in Van Dieman Street increases the peak capacity to
14,500m3/day.
The supply capacity to Stoke and Tahunanui is:
Foothills Link 16,000m3/day
Cross City Link 14,500m3/day
30,500m3/day
As part of the replacement resource consents for the Nelson water supply from the
Maitai and Roding Rivers Council commissioned an update of the 2007 OPUS drought
study report. WSP-OPUS prepared a number of reports looking at a range of demand
scenarios for the city out to 2100. The reports conclude that under most demand
scenarios the Maitai Dam will provide sufficient drought security for the city in the
medium-long term.
3.1. Demand drivers
Table 3-1: Water Demand Drivers
Water Demand Drivers Changes to Water Supply Activity
Significant population growth and
residential expansion into
greenfield areas
Development of new development areas on the periphery
of the city and increased density in some existing
developed areas leading to increased water use.
Changes in Customer Expectations Customer expectations are increasingly tending towards
higher Levels of Service, in both the reduction of
environmental impact and the quality of the water
supplied.
Community Expectation Enhancing the natural environment of streams and rivers
and recognition of impacts of climate change, especially
drought security.
Climatic Changes In recent years, there has been an increase in the
incidence of extreme weather events around the world.
The general trend for Nelson is of winters being wetter and
Nelson City Council
Water Supply Asset Management Plan 2018-2028 A1620958 75
Water Demand Drivers Changes to Water Supply Activity
the other seasons being drier. More frequent heavy
rainfall events have been predicted as well as the
increasing trend to more extreme dry weather events.
Legislative
National Policy Statements:
Freshwater Management and
Urban Development Capacity
Freshwater Management is a cornerstone central government initiative to improve the quality of freshwater bodies in New Zealand. This is expected to impact on both abstraction and discharges to
waterways and require an enhanced recognition of the need for efficient use of the water to minimise the volume taken for water supply and improving the quality of the water discharged as compensation.
Urban Development Capacity will ensure each territorial authority makes adequate provision for future
population growth in their areas. This will require Council to undertake strategic growth studies and identify the impact on the demand for water supply
services.
Organisational Policies
Environmental Sustainability
Development of sustainability strategies that include
reduction of un-accounted for water volumes.
Industrial and Commercial Demand
Since the water demand was initially calculated in 1996 there have been significant
changes in Industrial and Commercial activities (and therefore water demand) at the
Port.
Fin fish quotas are reduced, catches are down, and more processing is carried out at
sea or in Asia. The Sanford (South Island) Ltd processing factory at the port has
closed and is unlikely to reopen. It is also unlikely that any other similar fish
processing factory will be established in Nelson in the foreseeable future.
Port Nelson has increased container and log marshalling areas with the demolition of
existing buildings, including the Milk Treatment Station. Further expansion of these
areas is likely, until ultimately the area bounded by the existing gated area at Graham
Street, Wildman Avenue, and the Calwell Slipway becomes port storage.
Current engineering activities are likely to remain around the slipway area, and
current boating activities are likely to remain around the marina area. These activities
are not significant water users.
While total demand from the Port area has steadily fallen from 1999, growth of 0.5%
per annum (10.5% over 10 years) has been assumed from 2005 for demand
purposes.
Commercial/industrial growth in the remainder of the City/Atawhai area is expected to
be restricted by lack of suitable land availability and limited sewer capacity. The
Nelson Resource Management Plan limits Trade Waste discharge to the sewer to 0.54
litres per second per hectare. Sites in the Central City and St Vincent/Vanguard
Streets area are generally small and a major wet industry is not likely to set up in this
area. The recent development of New World and Harvey Norman stores in Vanguard
Street, together with their associated car parking, has further reduced
commercial/industrial land available for wet uses. Commercial users generally have a
low water demand.
Recent Commercial/industrial growth in the Stoke/Tahuna area has utilised most of
the existing industrial zoned land.
Nelson City Council
Water Supply Asset Management Plan 2018-2028 A1620958 76
The Nelson- Tasman urban development review has led to co-ordination with Tasman
District Council regarding development of new land in the Richmond vicinity for
industrial uses taking a regional planning approach. i.e. Industrial growth in Nelson
will be low water users on small sites.
A review of the industrial demand is expected over the next three years as Council
reviews the Nelson Resource Management Plan. The likely impact on the water
network will be reflected in future asset management plans.
Residential Demand
Richmond is entitled to the lesser of 909m3 of water/day or 1/15 of the Roding
authorised supply rate.
A plan change to the Nelson Resource Management Plan has been completed
to recognise the subdivision activity in the Saxton Creek area North of
Champion Road. This area is currently supplied with water by Tasman District
Council. If the present supply arrangement with Tasman District Council
continues, this portion of the growth will not need to be supplied from Nelson
City sources. However the agreement may be revoked on 3 years notice by
either Council.
Improved plumbing and appliance technology, (particularly being driven by the
Australian water shortages), future household use will be reduced e.g. superlow flush
4.5/3 litre toilet flush (compared with 11 litre single flush), low use washing machines,
low flow shower heads, aerator taps, reuse of grey water for toilets and irrigation etc.
Increasing awareness of low water use gardening e.g. drought resistant planting, no
mow lawns, or no lawns at all
With intensification, smaller gardens or no gardens at all for many household units
Reduced use due to reduced supply pressures
Consumer education on tap use e.g. turn off while brushing teeth, shorter duration
showers, showers instead of baths, rinsing dishes in a partially filled sink rather than
under a running tap.
Possible greywater and rainwater storage on site for reuse
More stringent hosing restrictions
Pricing incentive
Central Government Regulation
Previous Council Urban Growth Strategy documents also predict that some of the
population growth will be by intensification of housing in Atawhai, Central Nelson,
Hospital, Tahunanui and Stoke areas. This implies that gardens will be smaller and
the peak demand per population will reduce.
Council is concentrating on improving services to developed areas and providing
services to areas that are currently being developed (Residential, Rural Zone High
Density Small Holdings, Suburban Commercial, Industrial). Servicing of other areas
covered by the Services Overlay, because one or more servicing constraints have been
identified as needing to be addressed prior to the complete development of that
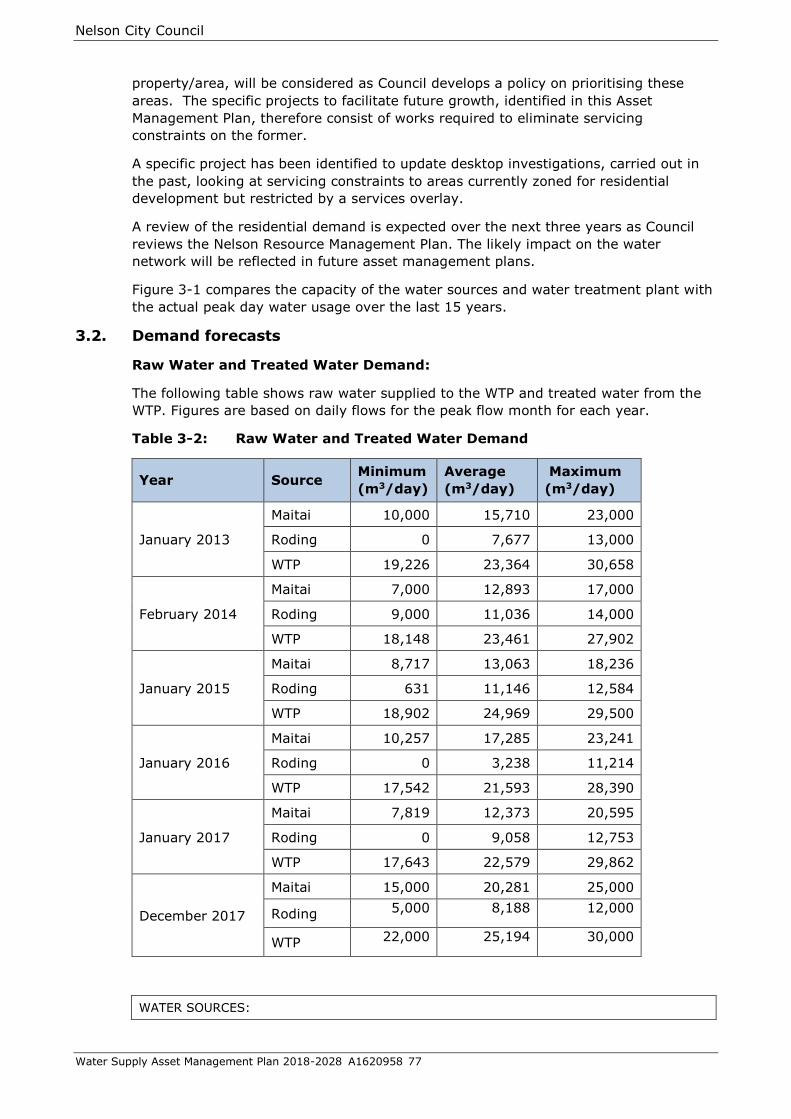
Nelson City Council
Water Supply Asset Management Plan 2018-2028 A1620958 77
property/area, will be considered as Council develops a policy on prioritising these
areas. The specific projects to facilitate future growth, identified in this Asset
Management Plan, therefore consist of works required to eliminate servicing
constraints on the former.
A specific project has been identified to update desktop investigations, carried out in
the past, looking at servicing constraints to areas currently zoned for residential
development but restricted by a services overlay.
A review of the residential demand is expected over the next three years as Council
reviews the Nelson Resource Management Plan. The likely impact on the water
network will be reflected in future asset management plans.
Figure 3-1 compares the capacity of the water sources and water treatment plant with
the actual peak day water usage over the last 15 years.
3.2. Demand forecasts
Raw Water and Treated Water Demand:
The following table shows raw water supplied to the WTP and treated water from the
WTP. Figures are based on daily flows for the peak flow month for each year.
Table 3-2: Raw Water and Treated Water Demand
Year Source Minimum
(m3/day)
Average
(m3/day)
Maximum
(m3/day)
January 2013
Maitai 10,000 15,710 23,000
Roding 0 7,677 13,000
WTP 19,226 23,364 30,658
February 2014
Maitai 7,000 12,893 17,000
Roding 9,000 11,036 14,000
WTP 18,148 23,461 27,902
January 2015
Maitai 8,717 13,063 18,236
Roding 631 11,146 12,584
WTP 18,902 24,969 29,500
January 2016
Maitai 10,257 17,285 23,241
Roding 0 3,238 11,214
WTP 17,542 21,593 28,390
January 2017
Maitai 7,819 12,373 20,595
Roding 0 9,058 12,753
WTP 17,643 22,579 29,862
December 2017
Maitai 15,000 20,281 25,000
Roding 5,000 8,188 12,000
WTP 22,000 25,194 30,000
WATER SOURCES:
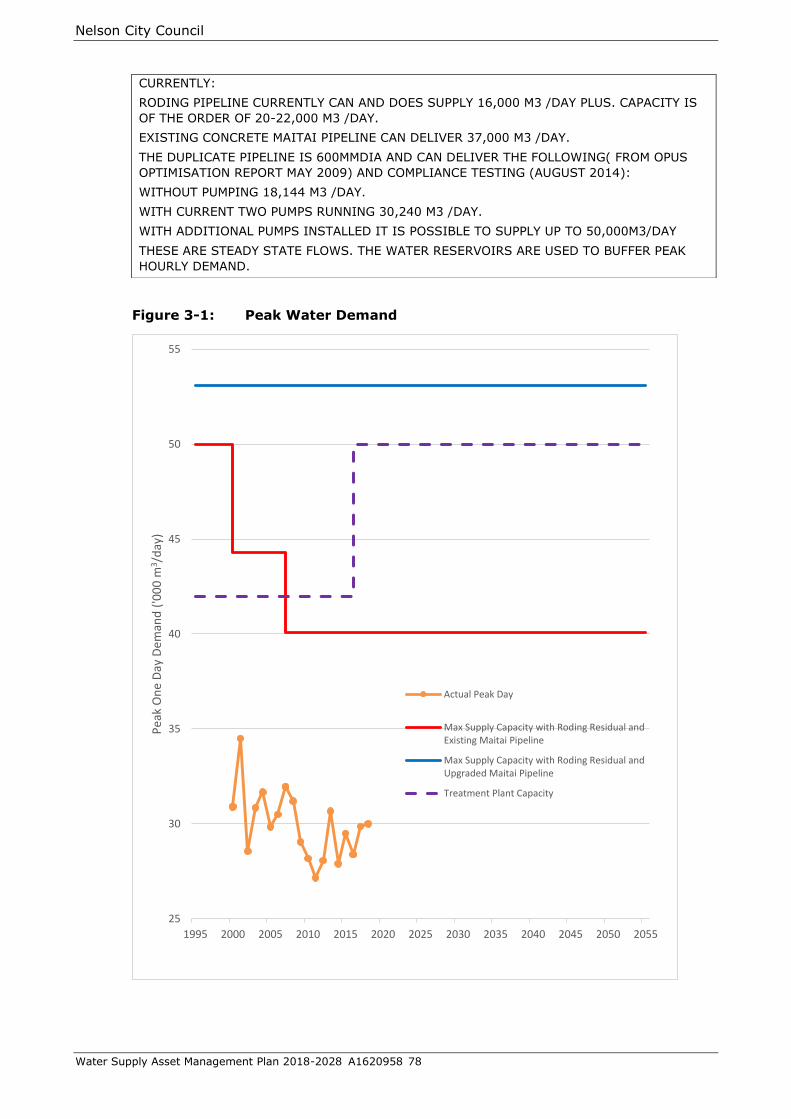
Nelson City Council
Water Supply Asset Management Plan 2018-2028 A1620958 78
Figure 3-1: Peak Water Demand
25
30
35
40
45
50
55
1995 2000 2005 2010 2015 2020 2025 2030 2035 2040 2045 2050 2055
Pea
k O
ne
Day
Dem
and
('0
00
m3/d
ay)
Actual Peak Day
Max Supply Capacity with Roding Residual andExisting Maitai Pipeline
Max Supply Capacity with Roding Residual andUpgraded Maitai Pipeline
Treatment Plant Capacity
CURRENTLY:
RODING PIPELINE CURRENTLY CAN AND DOES SUPPLY 16,000 M3 /DAY PLUS. CAPACITY IS
OF THE ORDER OF 20-22,000 M3 /DAY.
EXISTING CONCRETE MAITAI PIPELINE CAN DELIVER 37,000 M3 /DAY.
THE DUPLICATE PIPELINE IS 600MMDIA AND CAN DELIVER THE FOLLOWING( FROM OPUS
OPTIMISATION REPORT MAY 2009) AND COMPLIANCE TESTING (AUGUST 2014):
WITHOUT PUMPING 18,144 M3 /DAY.
WITH CURRENT TWO PUMPS RUNNING 30,240 M3 /DAY.
WITH ADDITIONAL PUMPS INSTALLED IT IS POSSIBLE TO SUPPLY UP TO 50,000M3/DAY
THESE ARE STEADY STATE FLOWS. THE WATER RESERVOIRS ARE USED TO BUFFER PEAK
HOURLY DEMAND.
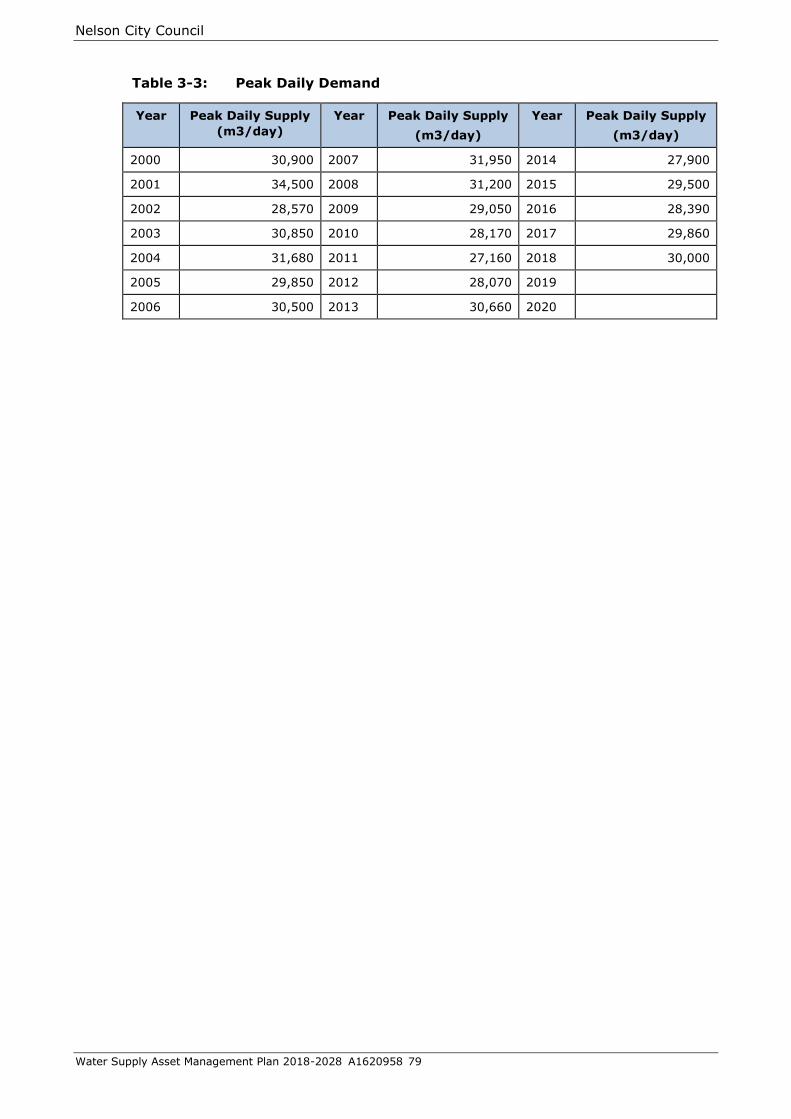
Nelson City Council
Water Supply Asset Management Plan 2018-2028 A1620958 79
Table 3-3: Peak Daily Demand
Year
Peak Daily Supply
(m3/day)
Year Peak Daily Supply
(m3/day)
Year Peak Daily Supply
(m3/day)
2000 30,900 2007 31,950 2014 27,900
2001 34,500 2008 31,200 2015 29,500
2002 28,570 2009 29,050 2016 28,390
2003 30,850 2010 28,170 2017 29,860
2004 31,680 2011 27,160 2018 30,000
2005 29,850 2012 28,070 2019
2006 30,500 2013 30,660 2020
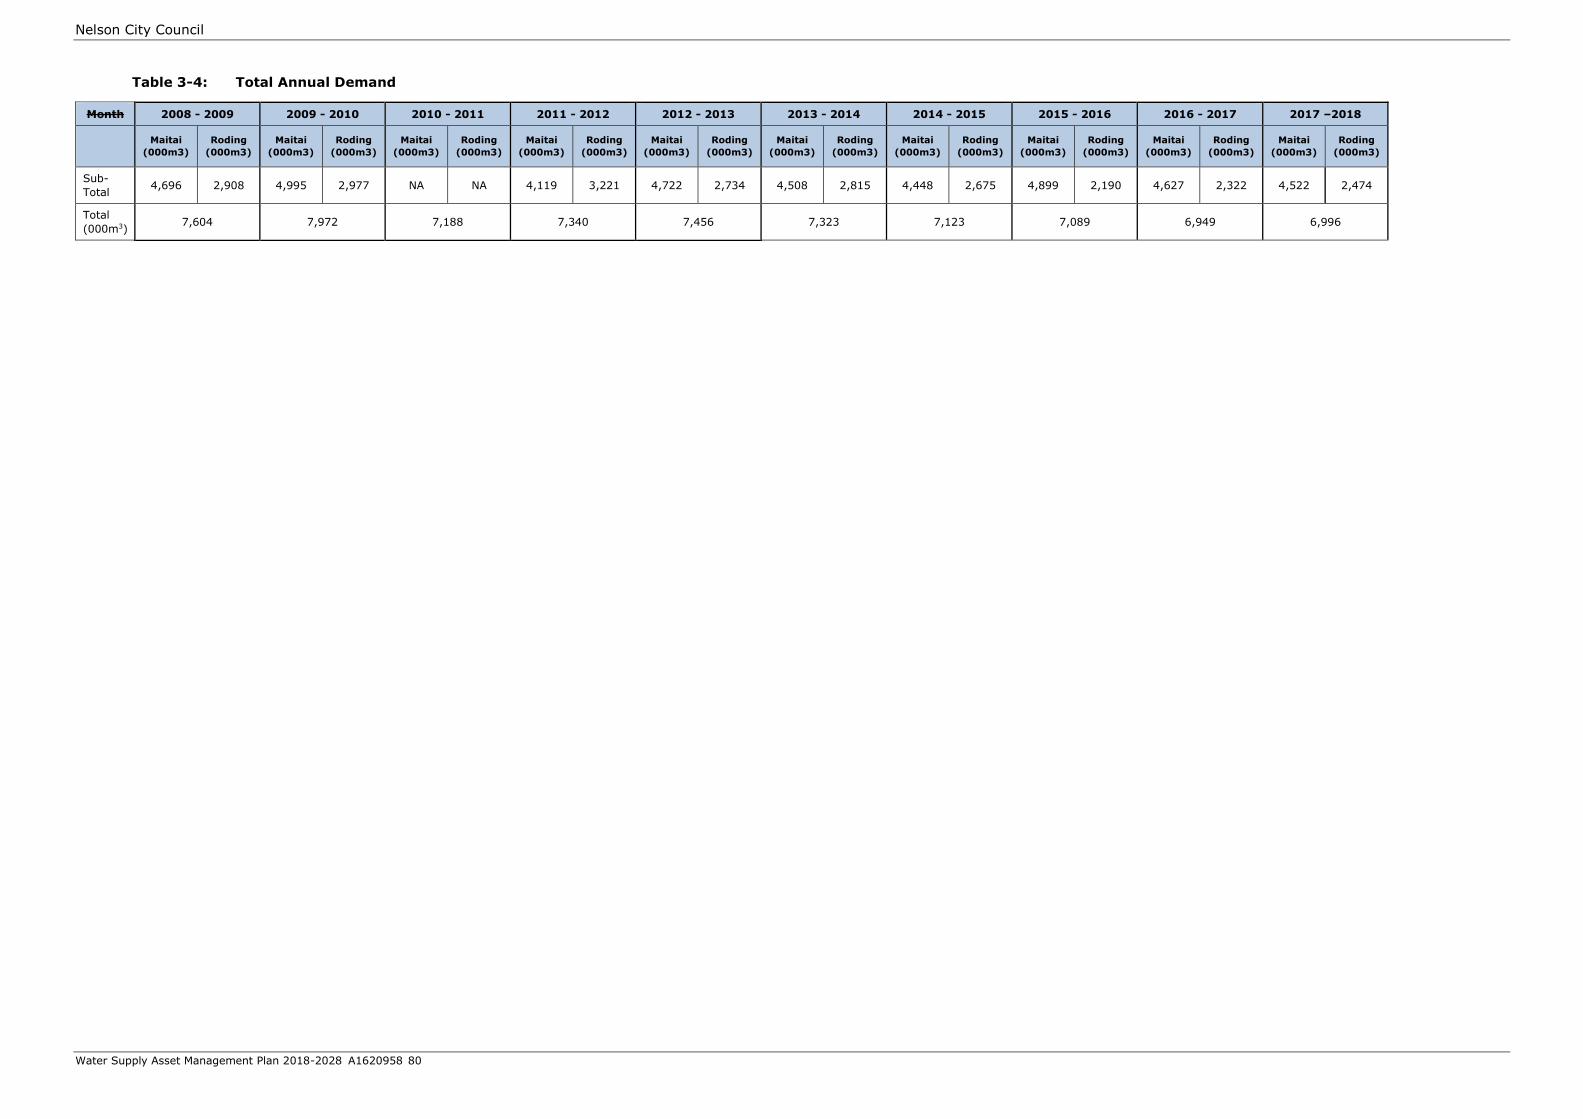
Nelson City Council
Water Supply Asset Management Plan 2018-2028 A1620958 80
Table 3-4: Total Annual Demand
Month 2008 - 2009 2009 - 2010 2010 - 2011 2011 - 2012 2012 - 2013 2013 - 2014 2014 - 2015 2015 - 2016 2016 - 2017 2017 –2018
Maitai
(000m3)
Roding
(000m3)
Maitai
(000m3)
Roding
(000m3)
Maitai
(000m3)
Roding
(000m3)
Maitai
(000m3)
Roding
(000m3)
Maitai
(000m3)
Roding
(000m3)
Maitai
(000m3)
Roding
(000m3)
Maitai
(000m3)
Roding
(000m3)
Maitai
(000m3)
Roding
(000m3)
Maitai
(000m3)
Roding
(000m3)
Maitai
(000m3)
Roding
(000m3)
Sub-
Total 4,696 2,908 4,995 2,977 NA NA 4,119 3,221 4,722 2,734 4,508 2,815 4,448 2,675 4,899 2,190 4,627 2,322 4,522 2,474
Total
(000m3) 7,604 7,972 7,188 7,340 7,456 7,323 7,123 7,089 6,949 6,996
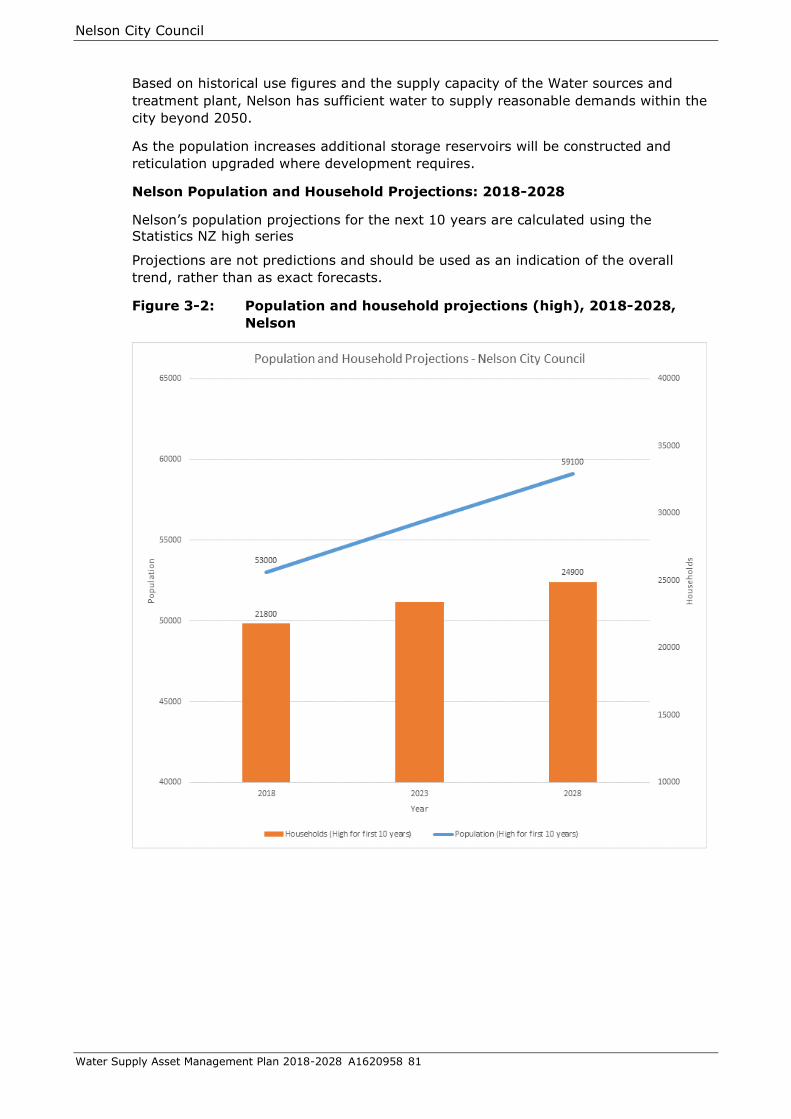
Nelson City Council
Water Supply Asset Management Plan 2018-2028 A1620958 81
Based on historical use figures and the supply capacity of the Water sources and
treatment plant, Nelson has sufficient water to supply reasonable demands within the
city beyond 2050.
As the population increases additional storage reservoirs will be constructed and
reticulation upgraded where development requires.
Nelson Population and Household Projections: 2018-2028
Nelson’s population projections for the next 10 years are calculated using the
Statistics NZ high series
Projections are not predictions and should be used as an indication of the overall
trend, rather than as exact forecasts.
Figure 3-2: Population and household projections (high), 2018-2028,
Nelson

Nelson City Council
Water Supply Asset Management Plan 2018-2028 A1620958 82
Figure 3-2 shows that, under the high growth scenario, population is projected to
increase by 6,100 residents between 2018 and 2028 and the number of households in
Nelson will increase by 3,100 households between 2018 and 2028.
One of the key issues facing Nelson is the aging of its population. An aging in the
population has a significant impact on what sort of services Council will be required to
provide and the ability of future residents to fund rate.
Figure 3-3 shows the projected trends for each age group from 2018-2028.
Figure 3-3: Population Age Trends

Nelson City Council
Water Supply Asset Management Plan 2018-2028 A1620958 83
Projected demand for National Policy Statement – Urban Development
Capacity
The National Policy Statement for Urban Development Capacity (NPS-UDC) requires
local authorities to ensure there is sufficient development capacity to meet demand
plus an additional margin (Nelson a medium/high growth urban area):
in the short term (within 3 years) + minimum 20%
medium term (3-10 years) + minimum 20%
long term (10-30 years) + minimum 15%
The location of actual growth will depend on where there is capacity for residential
growth (residential zoning, infrastructure servicing) and where development is
feasible. Residential growth areas and the sequencing of urban development capacity
in the short, medium and long term are shown in Appendix I.
3.3. Demand impacts on assets
Peak daily demand figures suggest that Nelson has sufficient raw water source
capacity to meet reasonably expected demands for the short-medium term, out to
approximately 2060.
As part of the replacement resource consents for the Nelson water supply from the
Maitai and Roding Rivers Council commissioned an update of the 2007 OPUS drought
study report. WSP-OPUS prepared a number of reports looking at a range of demand
scenarios for the city out to 2100. The reports conclude that under most demand
scenarios the Maitai Dam will provide sufficient drought security for the city in the
medium term.
For the Wakatu estate industrial area and Champion Rd residential subdivisions Nelson
City Council currently does not have adequate network capacity to supply these areas
and the supply from Tasman District Council is expected to continue in the short term.
Changes to wet industry demand can also impact on the network and these will be
monitored over time.
3.4. Demand management plan
Table 3-5: Demand Management Strategies
Strategy Objective / Description
Regulation Nelson Resource Management Plan controls water abstraction from river sources.
Integrating growth planning with infrastructure provision via the Urban Development
Strategy.
Measuring and reporting the average daily demand for drinking water.
Ensuring water is supplied predominantly through metered connections
(emergencies such as fires and natural disasters are likely exceptions).
Education and Enforcement of Water Supply Bylaw requirement to avoid wasting
water.
Track and reduce un-accounted for water volume.
Education Continuation of non-regulatory community engagement programmes to encourage
community to reduce water use especially over the drier months – Link to
Environment Activity Management Plan.
Re-use of grey water where appropriate for private properties.
Encourage use of drought resistant gardens and lawns.

Nelson City Council
Water Supply Asset Management Plan 2018-2028 A1620958 84
Strategy Objective / Description
Alternative supply
strategies
Private detention tanks and community rainwater harvesting and water use
reduction education.
Investigating the reuse of treated wastewater from Bell Island.
Consult with the community on support for the proposed Waimea Dam in Tasman
District.
Universal Metering
The Council resolved to adopt universal metering in 1996 and a capital programme
installed a meter for every property. Universal metering has been in operation since 1
July 1999. The maximum two day average in 1997/98 was 42,300m3/day, whereas
the peak since universal metering has been in operation is less than 35,000m3/day.
Although the peak one day water usage prior to universal metering reached
42,000m3/day the typical winter usage is in the order of 21,000m3/day. Given that
there is virtually no fluctuation in commercial water usage between winter and
summer, the difference of 21,000m3/day must be attributed mainly to residential
sprinkler usage, although the summer holiday influx of visitors in late December and
early January to Nelson does have an impact.
This means that to meet uncontrolled garden watering demand the water supply
system needs up to 100% extra capacity which is only used for approximately 10% of
the time.
As noted above the introduction of universal metering has reduced the summer peak
by over 37%.
Peak demand is most affected by summer drought and consequent garden watering.
The drought of 2000/01 is estimated to have a return period of 1 in 30 years. Other
years have been average or wetter than average and this is reflected in the peak
demands.
The peak one day flows from 2000 are plotted on Figure 3.1.
Other Demand Management
Use of alternative water sources for non-potable water would reduce the demand
from the city water supply, particularly under summer conditions. While
rainwater tanks and greywater reuse have some appeal, there are further
implications with these, such as:
The Ministry of Health/Department of Building and Housing reservations as to
greywater reuse.
Financial cost to householder.
Size of tank versus Nelson rainfall (seasonal pattern and total).
Siting of rainwater tanks on the property.
Rainwater tanks needs to be considered in the wider context of sustainability,
e.g. environmental cost of producing, transporting and disposing of a tank.
Plumbing and appliance technology is rapidly advancing, particularly in Australia
due to the droughts, and these may actually give better water conservation than
tanks/greywater reuse e.g. Very low water usage dual flush toilets 4.5/3 litres
per flush compared with 11 litre standard, and normal 11 / 6 dual flush, low
water use clothes washers, low flow shower heads.
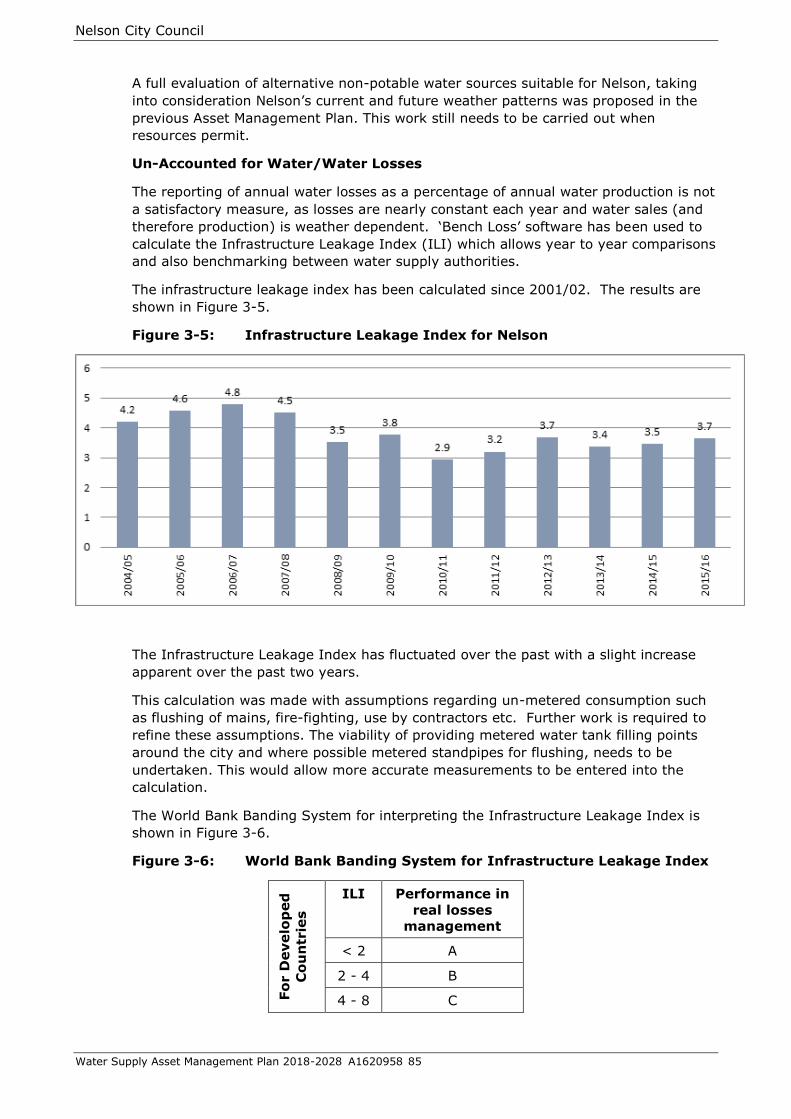
Nelson City Council
Water Supply Asset Management Plan 2018-2028 A1620958 85
A full evaluation of alternative non-potable water sources suitable for Nelson, taking
into consideration Nelson’s current and future weather patterns was proposed in the
previous Asset Management Plan. This work still needs to be carried out when
resources permit.
Un-Accounted for Water/Water Losses
The reporting of annual water losses as a percentage of annual water production is not
a satisfactory measure, as losses are nearly constant each year and water sales (and
therefore production) is weather dependent. ‘Bench Loss’ software has been used to
calculate the Infrastructure Leakage Index (ILI) which allows year to year comparisons
and also benchmarking between water supply authorities.
The infrastructure leakage index has been calculated since 2001/02. The results are
shown in Figure 3-5.
Figure 3-5: Infrastructure Leakage Index for Nelson
The Infrastructure Leakage Index has fluctuated over the past with a slight increase
apparent over the past two years.
This calculation was made with assumptions regarding un-metered consumption such
as flushing of mains, fire-fighting, use by contractors etc. Further work is required to
refine these assumptions. The viability of providing metered water tank filling points
around the city and where possible metered standpipes for flushing, needs to be
undertaken. This would allow more accurate measurements to be entered into the
calculation.
The World Bank Banding System for interpreting the Infrastructure Leakage Index is
shown in Figure 3-6.
Figure 3-6: World Bank Banding System for Infrastructure Leakage Index
Fo
r D
evelo
ped
Co
un
trie
s
ILI Performance in
real losses
management
< 2 A
2 - 4 B
4 - 8 C
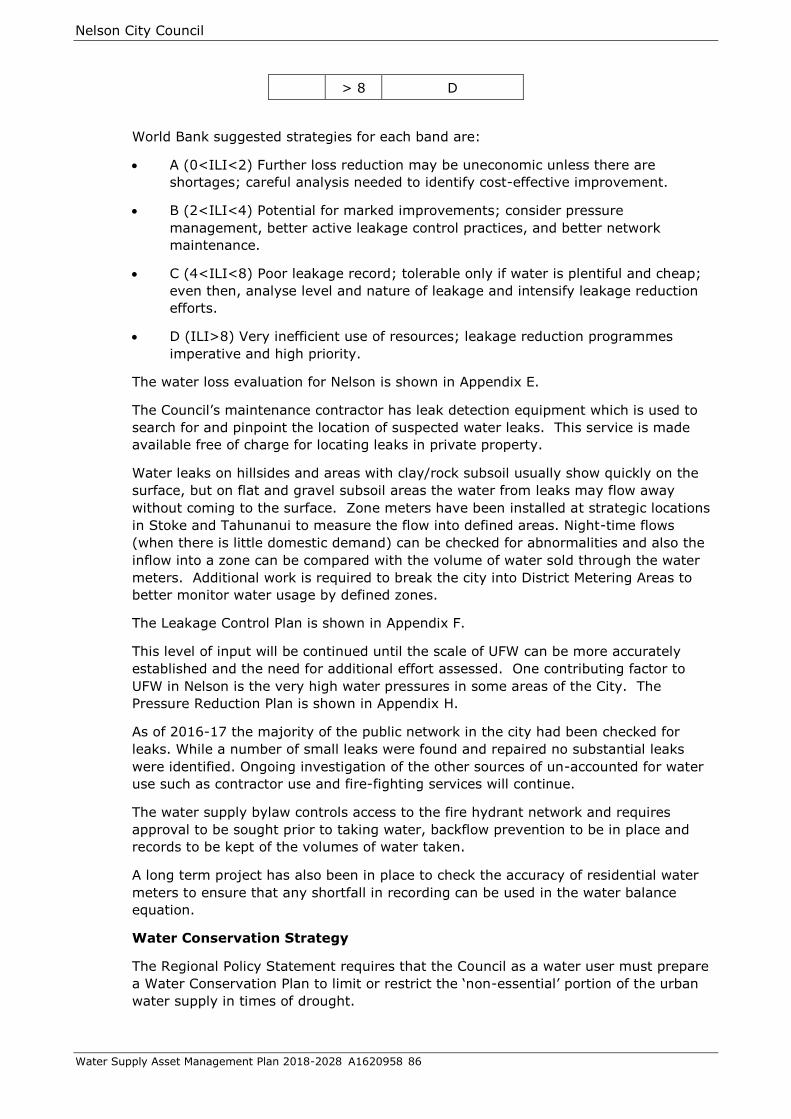
Nelson City Council
Water Supply Asset Management Plan 2018-2028 A1620958 86
> 8 D
World Bank suggested strategies for each band are:
A (0<ILI<2) Further loss reduction may be uneconomic unless there are
shortages; careful analysis needed to identify cost-effective improvement.
B (2<ILI<4) Potential for marked improvements; consider pressure
management, better active leakage control practices, and better network
maintenance.
C (4<ILI<8) Poor leakage record; tolerable only if water is plentiful and cheap;
even then, analyse level and nature of leakage and intensify leakage reduction
efforts.
D (ILI>8) Very inefficient use of resources; leakage reduction programmes
imperative and high priority.
The water loss evaluation for Nelson is shown in Appendix E.
The Council’s maintenance contractor has leak detection equipment which is used to
search for and pinpoint the location of suspected water leaks. This service is made
available free of charge for locating leaks in private property.
Water leaks on hillsides and areas with clay/rock subsoil usually show quickly on the
surface, but on flat and gravel subsoil areas the water from leaks may flow away
without coming to the surface. Zone meters have been installed at strategic locations
in Stoke and Tahunanui to measure the flow into defined areas. Night-time flows
(when there is little domestic demand) can be checked for abnormalities and also the
inflow into a zone can be compared with the volume of water sold through the water
meters. Additional work is required to break the city into District Metering Areas to
better monitor water usage by defined zones.
The Leakage Control Plan is shown in Appendix F.
This level of input will be continued until the scale of UFW can be more accurately
established and the need for additional effort assessed. One contributing factor to
UFW in Nelson is the very high water pressures in some areas of the City. The
Pressure Reduction Plan is shown in Appendix H.
As of 2016-17 the majority of the public network in the city had been checked for
leaks. While a number of small leaks were found and repaired no substantial leaks
were identified. Ongoing investigation of the other sources of un-accounted for water
use such as contractor use and fire-fighting services will continue.
The water supply bylaw controls access to the fire hydrant network and requires
approval to be sought prior to taking water, backflow prevention to be in place and
records to be kept of the volumes of water taken.
A long term project has also been in place to check the accuracy of residential water
meters to ensure that any shortfall in recording can be used in the water balance
equation.
Water Conservation Strategy
The Regional Policy Statement requires that the Council as a water user must prepare
a Water Conservation Plan to limit or restrict the ‘non-essential’ portion of the urban
water supply in times of drought.

Nelson City Council
Water Supply Asset Management Plan 2018-2028 A1620958 87
A “Water Supply Conservation Strategy” was re-adopted by the Council in February
2003 to take account of the reduced abstraction available from the Roding River due
to the residual flow required to be left in the river as a condition of the Resource
Consent.
3.5. Asset programmes to meet demand
Future Urban Development Strategy: Nelson City and Tasman District Council
(TDC) are both developing strategies for accommodating projected growth in
population and households, as well as the attendant business and other demands this
growth will bring and matching it with infrastructure provision as required by NPS-
UDC.
Council is concentrating on providing services to areas that are zoned for development
(Residential, Rural Zone High Density Small Holdings, Suburban Commercial,
Industrial) but are covered by the Services Overlay because one or more servicing
constraints have been identified as needing to be addressed prior to the development
of that property/area. The projects to facilitate future growth identified in this Asset
Management Plan therefore only consist of works required to eliminate servicing
constraints on sites zoned for development or as part of the Housing Accord and
Special Housing Areas Act 2013 and these have been prioritised in accordance with
Council’s strategic planning process. A Map of the areas identified for growth is
attached in Appendix I.
Capital projects in this asset management plan will provide options reports for parts of
these areas and construction of storage reservoirs to buffer demand. Long term
planning for trunk main upgrades will be re-assessed as Council formulates a policy of
future development areas.
As future growth projections are available from the national census, the water
supply demand for the City will be revised.
Reports on the Atawhai No 2 reservoir site will be completed and a report on
the Tasman District – Nelson City link will be commissioned if required from
the outcome of the proposed Waimea Dam in Tasman District.
Continue the water loss identification and reduction programme.
Continue the pressure reduction programme where fire flows allow.
Complete District Metering Areas and monitor demand by area in the city.
Investigate viability of metered contractor filling points and metered
standpipes for flushing to improve UFW results.
The need to ensure resilience in the network to maintain a reduced service in event of
emergency and the projected increase in demand caused by development north of
Cemetery Point means that Atawhai No. 2 reservoir (2500m3) will be required by
about 2021/24. Other reservoirs will be required to serve local growth.
Malvern Hills to serve the ridge between Botanical Hill and Dodson Valley. This
smaller reservoir was shown in the 1998 LTFS for 2001/02 but has been deferred
several times until required by development. An options report to identify the
best solution for the Atawhai No. 2 reservoir and the upper levels reservoir was
completed as a draft in 2016/17. This report will provide the framework for the
project to proceed.
The need for other reservoirs as the city expands has been recognised and
allowed for, in general terms, in the capital expenditure tables but not scheduled
by exact location as the timing and location of future development is uncertain.
Nelson City Council
Water Supply Asset Management Plan 2018-2028 A1620958 88
Supply capacity
At the abstraction rates currently authorised in the resource consents, Nelson City has
sufficient source water to meet predicted demand through a 1 in 60 year drought for
the foreseeable future.
It should be noted that this may change if the resource consent is varied or demand
varies from that predicted.
Possible augmentation options to make up any future deficit were considered by
Council in 2007. It should be noted that these do not replace the existing sources but
merely bridge the difference between existing supply and future demand. Details are
in the following reports prepared by Opus International Consultants:
Maitai Pipeline and Alternative Water Sources – Options and Costs, Opus
International Consultants Ltd, 2006
Feasibility of Raising the Water Level of Maitai Dam, Opus International
Consultants Ltd, and Tonkin and Taylor Ltd, 2007
Options are:
Roding High Dam. A high dam at the Roding could increase the Roding supply.
The estimated cost for 10,000m3/day is $20.9million (2008 dollars) and for
20,000m3/day is $34.0 million (2008 dollars).
Waimea Dam. A fourth possible source of raw or treated water to the city is via
the aquifers under the Waimea Plains and/or through the Tasman District Council
reticulation. The future of this option is dependent upon a separate process
currently underway with the Tasman District Council.
The present capacity of the Nelson Water Treatment Plant at the Tantragee
Saddle is approximately 40,000m3/day with four original membrane trains in
place and one new train installed 2016. It is likely that with improved
technology the flow rate of new replacement membranes will improve with an
increase in capacity to 50,000m3/day. Two trains of the original membranes
have been replaced in 2016/17 and the remaining two are programmed for
renewal in 2018/19.
Raising the top water level at the Maitai Dam. An adjustable weir could be
installed on top of the existing spillway weir so that additional water could be
impounded. Obermyer Spillway gates are bottom hinged spillway gates. They
are most simply described as a row of steel gate panels supported on their
downstream side by inflatable air bladders. By controlling the pressure in the
bladders, the lake elevation can be maintained at user-selected points. The
standard pneumatic controller provides accurate upstream pond control, and
discharges water appropriately to maintain upstream lake elevation through a
range of flows. This means that the existing spillway with such a spillway gate
can be used to increase the water level, whilst allowing flood flows through as
per normal.
If the lake level is raised by one metre, the storage is increased by 350,000m3.
Additional work would be required to alter the auxiliary spillway and to clear an
additional one metre band of vegetation around the lake perimeter. A rough
order cost for the complete project is $0.7 million (2008 dollars).
“Dead” Storage. At present the bottom 900,000m3 of water in the dam cannot
be accessed from the original raw water supply pipeline (The pipeline is above
ground and higher than the base of the dam. Provision was made at the time

Nelson City Council
Water Supply Asset Management Plan 2018-2028 A1620958 89
that the dam was built to install a pump in the control building pipe work to
enable this water to be pumped out and into the existing Maitai pipeline.
However, the new pipeline completed up Maitai Valley Road in 2013/14 is at a
level that will enable the “dead” storage to be accessed by using the booster
pump proposed in the vicinity of the Maitai Motor Camp.
The bottom layer of the Maitai dam lake has some organic material as well as
elevated levels of heavy metals from the surrounding hills. The seasonal anoxic
nature of this layer means that there will likely be additional capital expenditure
required to improve the quality of this water should it be required as a source of
potable water. There will also be additional operational costs in running the
pump when the “dead” storage is utilised.
Extensions to the area supplied
Eastern Foothills
The Foothills Trunk Main is able to provide water to a large area including Upper Brook
Valley, upper Enner Glynn Valley, Marsden Valley, the ridge between the Ngawhatu
and Marsden Valleys, and Ngawhatu Valley.
Nelson North
When the City water supply was extended to the Glen in 1990, high pressure pipework
was laid along State Highway 6 from Allisdair Street to Todds Bush Road, with
provision made for a pressure reducing valve at Todds Bush Road. This was to enable
increased flow in the pipeline as far as Todds Bush Road.
Provision was also made in the pipework for an extension beyond the Glen turnoff. In
2003 the main was extended by a private subdivider from the Glen turnoff to Hillwood
at the foot of Gentle Annie.
Extension over Gentle Annie would provide only a low volume rural restricted supply to
existing properties in the area.
At its meeting on 24 October 2002, Council resolved that the pipeline not be extended
beyond Hillwood subdivision unless a prior change to the Nelson Resource
Management Plan allows more intensive development in the Nelson North area and
the costs would be met by those being served.
Covered Storage
Table 3-6: Proposed Reservoirs
Name Location Year Proposed Capacity
(m3)
Atawhai No. 2 Bayview Road or Marybank. Yet to be
determined.
2018-23 2,500
Ngawhatu Ngawhatu Valley. Yet to be determined.
(to service future subdivisions)
2025-26 1,000
Future Growth Areas Nelson- North and South. Yet to be
determined.
2034-38 5,000
Proposed Total 8,500
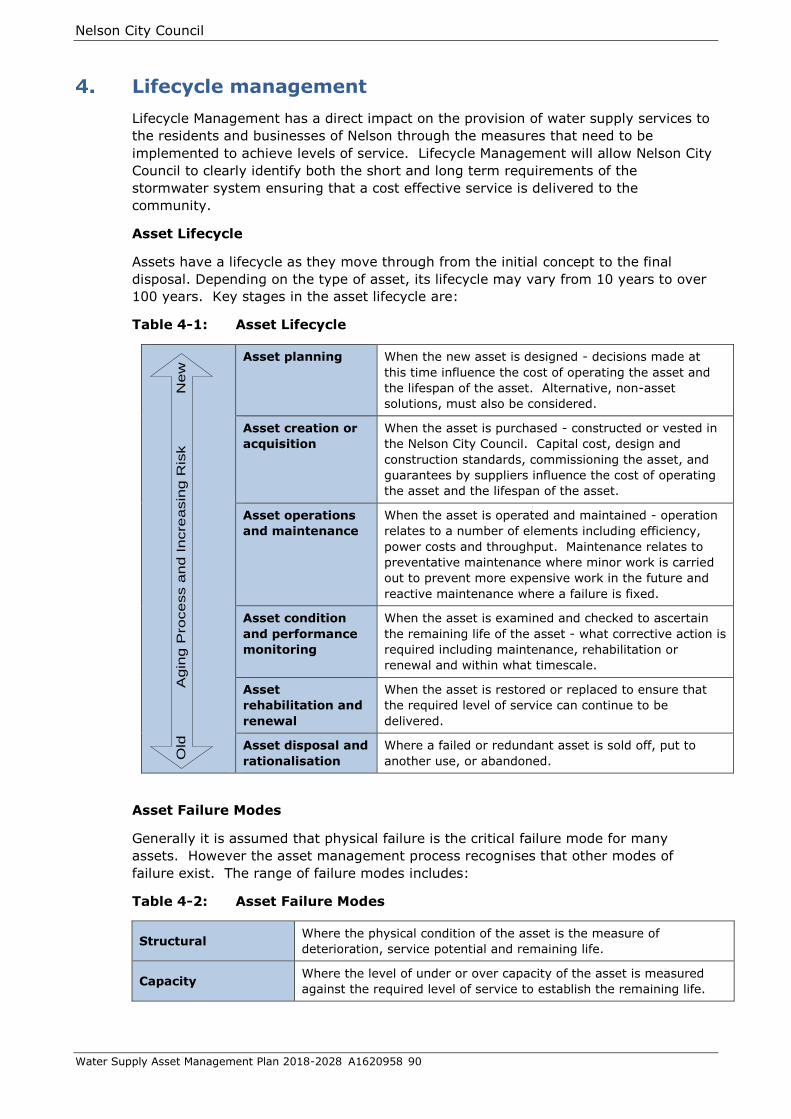
Nelson City Council
Water Supply Asset Management Plan 2018-2028 A1620958 90
Lifecycle management
Lifecycle Management has a direct impact on the provision of water supply services to
the residents and businesses of Nelson through the measures that need to be
implemented to achieve levels of service. Lifecycle Management will allow Nelson City
Council to clearly identify both the short and long term requirements of the
stormwater system ensuring that a cost effective service is delivered to the
community.
Asset Lifecycle
Assets have a lifecycle as they move through from the initial concept to the final
disposal. Depending on the type of asset, its lifecycle may vary from 10 years to over
100 years. Key stages in the asset lifecycle are:
Table 4-1: Asset Lifecycle
Old
A
gin
g P
roce
ss a
nd
In
cre
asin
g R
isk N
ew
Asset planning When the new asset is designed - decisions made at
this time influence the cost of operating the asset and
the lifespan of the asset. Alternative, non-asset
solutions, must also be considered.
Asset creation or
acquisition
When the asset is purchased - constructed or vested in
the Nelson City Council. Capital cost, design and
construction standards, commissioning the asset, and
guarantees by suppliers influence the cost of operating
the asset and the lifespan of the asset.
Asset operations
and maintenance
When the asset is operated and maintained - operation
relates to a number of elements including efficiency,
power costs and throughput. Maintenance relates to
preventative maintenance where minor work is carried
out to prevent more expensive work in the future and
reactive maintenance where a failure is fixed.
Asset condition
and performance
monitoring
When the asset is examined and checked to ascertain
the remaining life of the asset - what corrective action is
required including maintenance, rehabilitation or
renewal and within what timescale.
Asset
rehabilitation and
renewal
When the asset is restored or replaced to ensure that
the required level of service can continue to be
delivered.
Asset disposal and
rationalisation
Where a failed or redundant asset is sold off, put to
another use, or abandoned.
Asset Failure Modes
Generally it is assumed that physical failure is the critical failure mode for many
assets. However the asset management process recognises that other modes of
failure exist. The range of failure modes includes:
Table 4-2: Asset Failure Modes
Structural Where the physical condition of the asset is the measure of
deterioration, service potential and remaining life.
Capacity Where the level of under or over capacity of the asset is measured
against the required level of service to establish the remaining life.

Nelson City Council
Water Supply Asset Management Plan 2018-2028 A1620958 91
Level of Service
Failure
Where reliability of the asset or performance targets are not
achieved.
Obsolescence Where technical change or lack of replacement parts can render
assets uneconomic to operate or maintain.
Cost or Economic
Impact
Where the cost to maintain or operate an asset is greater than the
economic return.
Operator Error Where the available skill level to operate an asset could impact on
asset performance and service delivery.
The Lifecycle Management Programmes cover the four key categories of work
necessary to achieve the required outcomes for the water supply activity. These
programmes are shown in Table 4-3 below.
Table 4-3: Lifecycle Management Programmes
Management Programme:
Management functions required to support the other
Programmes - Developed and Implemented by Nelson
City Council
Operations and Maintenance Programme:
To ensure efficient operation and serviceability of the
assets so that they achieve their service potential over
their useful lives - Developed, Managed and
Implemented by Nelson City Council
Renewal Programme:
To provide for the progressive replacement of
individual assets that have reached the end of their
useful lives - Developed, Managed and Implemented
by Nelson City Council
Maintaining the
service potential of
the assets and
ensuring that the
assets achieve that
potential
Development Programme:
To improve parts of the system currently performing
below target service standards and to allow
development to meet future demand requirements -
Developed, Managed and Implemented by Nelson City
Council
Closing service gaps.
Meeting future
demand

Nelson City Council
Water Supply Asset Management Plan 2018-2028 A1620958 92
Table 4-4: Management Strategies
Strategy Objective/ Description
Strategic Planning
Human Resources Develop the professional skills of the staff through adequate training
and experience
Personal Development Plans will be agreed with staff each year and a
register maintained to record training history. Staff are encouraged to
belong to appropriate professional bodies and to attend appropriate
conferences, seminars and training courses.
Strategic
Alignment
This Asset Management Plan will support the achievement of relevant
Community Outcomes for Nelson City Council.
Community Outcomes for Nelson City Council are set out in the Long
Term Plan. The intended contribution of the Nelson City Council water
supply services to the achievement of Community Outcomes is shown in
this Asset Management Plan.
Service Levels A clear statement of the water supply services provided and standards
to be achieved that directly link to, and support the stated community
outcomes, are shown within this Asset Management Plan.
Sustainable
Management
Ensures all planning for the management, operation, maintenance,
renewal and development of the water supply activity is compatible with
sustainable management principles.
Nelson City Council will pursue ways of limiting the use of natural
resources including energy, valued landscapes (and other natural
heritage) and adverse effects on waterways. This will involve auditing
the systems and materials used, and developing ways to incorporate
sustainable operation and development principles into Nelson City
Council activities.
Data Management and Utilisation
Network modelling
Continue the development of computer-based hydraulic models of the
reticulation network. Computer model of the water supply reticulation
enables Nelson City Council to:
Determine accurately the existing capacity of the system
Identify inadequate sections of the system
Operate the system in the most efficient and sustainable manner
Determine the impact of further development on the system
Identify system upgrading requirements
Compare options for upgrading the water supply network.
Data Collection
Data collection programmes (condition, performance, asset registers)
closely aligned with business needs will be operated in accordance with
documented quality processes
Data collection, maintenance and analysis are expensive and it is
important that programmes and techniques are cost effective and
consistent with business needs. Systematic processes will be
introduced for the collection and upgrading of essential data based on
asset criticality including:
Asset attribute information
Asset performance data
Asset condition data.

Nelson City Council
Water Supply Asset Management Plan 2018-2028 A1620958 93
Strategy Objective/ Description
Geographical
Information
System Data
Geographical information system data will be the subject of defined
quality assurance processes.
Nelson City Council has quality processes to ensure that all data entered
to the Geographical information system meets defined quality standards
and supports Asset Management through connectivity with the asset
register and Asset Management data storage.
Business Processes
Asset Management
Plan Updates
This Asset Management Plan remains a strategic ‘living’ document and
will be updated as required and reviewed at three yearly intervals to
coincide with the Long Term Plan.
The scope of the review will be influenced by changes in Community
Outcomes for Nelson City Council, service standards, improved
knowledge of assets and corporate strategy/ policy and process.
Risk Management Risk Management is an essential part of Asset Management. Water
supply activity risks will be managed by implementing the Risk
Management Register for the Water supply activity and the
implementation of risk controls to maintain risk exposure at agreed
levels.
Risk controls will include maintaining appropriate insurance cover,
emergency response planning, condition monitoring of critical assets,
preventative maintenance, use of Supervisory Control and Data
Acquisition, and operations manuals, review of standards and physical
works programmes.
Infrastructure
Asset valuation
Perform valuations in a manner that is consistent with national
guidelines and Nelson City Council corporate policy for valuation cycles
which are carried out every 1-3 years to reflect international financial
activity and align with the Long Term Plan requirements.
Asset valuations are the basis for several key asset management
processes including asset renewal modelling and financial risk
assessments. Valuations of the water supply system will be carried out
based on data from the Asset Management System to ensure audit
ability and alignment with other processes.
Monitoring
Level of Service
Standards
Continue with the monitoring procedures to ensure water supply activity
is contributing to the community outcomes as stated and that internal
controls (service requests, operational contract requirements) are also
monitored and managed
Asset Performance The performance of the water supply assets are monitored as an input
to asset renewal and asset development programmes. The Monitoring
includes:
Customer service requests
Asset failure records
Asset Maintenance records
Compliance with Resource Consents
Critical asset audits
Supervisory Control and Data Acquisition
Legislative compliance
Financial Management
Budgeting Expenditure programmes for the water supply activity indicates Council
funding and budgets with a 10 year projection.

Nelson City Council
Water Supply Asset Management Plan 2018-2028 A1620958 94
Strategy Objective/ Description
Use the Asset Management Plans to provide sufficient detail to
demonstrate the decision making process for those 10 year projections.
Financial
management
Manage the water supply activity budget in accordance with statutes
and corporate policy. This involves:
Economic appraisal of all capital expenditure
Annual review of Asset Management Plan financial programmes
Recording of significant deferred maintenance and asset renewals
Continuous monitoring of expenditure against budget.
Sustainable
Funding
Ensure the water supply activity is managed in a financially sustainable
manner over the long term.
The financial requirements for the provision of the water supply activity,
sustainable and to acceptable standards over the long term will be
identified and provided for in the budgets. These financial requirements
include:
Management of the water supply activity
Operation and maintenance of the water supply system
Asset replacement
Asset development to ensure that the ability of the water supply activity
to deliver an acceptable level of service is not degraded by growth in
Nelson City Council.
The Operations & Maintenance and Renewal Programmes are focused on maintaining
the current service potential of assets, and are primarily driven by the condition of
assets although asset performance is often an indicator of asset condition.
The Development Programme is focused on closing service gaps by increasing the
service potential of the water system and is primarily driven by the performance of
assets and the need to accommodate growth in the City.
Community infrastructure is installed and maintained on the understanding that the
assets are provided in perpetuity for the benefit of future generations. Longevity of an
asset is a prime consideration when design and planning is undertaken for new or
replacement components in the network. Sustainability has been reflected in the
decision making process when designing and constructing the water supply network.
4.1. Background data
The Council has implemented the Infor Asset Management System. It is used to
generate works instructions or Service Request Instructions to the utility services
maintenance contractor and to link job instructions to the particular section of the
network requiring repair, thereby building up a long term maintenance history of the
network.
Once a history has been established, maintenance history and age will be used to
assist in a deterioration model that will be used to optimise pipe replacements.
With the purchase of Network Analysis software and monitoring equipment, further
work, such as area metering, has been carried out to determine areas of excessive
water loss.

Nelson City Council
Water Supply Asset Management Plan 2018-2028 A1620958 95
4.1.1. Physical parameters
Summary of Assets
Nelson City Council is responsible for a wide variety of assets that constitute the
Nelson City Council water supply network. Table 4-5 sets out the summary of assets
as at June 2016.
Table 4-5: Summary of Assets as per June 2016 valuation
Asset Catagory km units
Reticulation 333.8 km
Trunk Mains 45.6 km
Maitai Pipelines 16.3 km
Roding Pipeline 3.9 km
Maitai Water Supply Scheme 1
Roding Dam 1
Treatment Plant 1
Tunnels 3
Reservoirs and Tanks 36
Pump Stations 13
Pressure Reducing / Control Valves 40
Air & Non Return Valves 165
Gate Valves 3,634
Manholes 91
Hydrants 2,559
Meters 20,829
Customer Connections 20,260
Table 4-6: Water Mains Lengths by Material as at November 2017
Material km
Black Asbestos Cement 13.2
Asbestos Cement 96.2
Blue Brute Pipe .3
Cast Iron .5
Ductile Cast Iron 1.7
Pit Cast Iron 16.3
Spun Cast Iron 29.8
Concrete .6
Copper 19.9
DICL 4.3
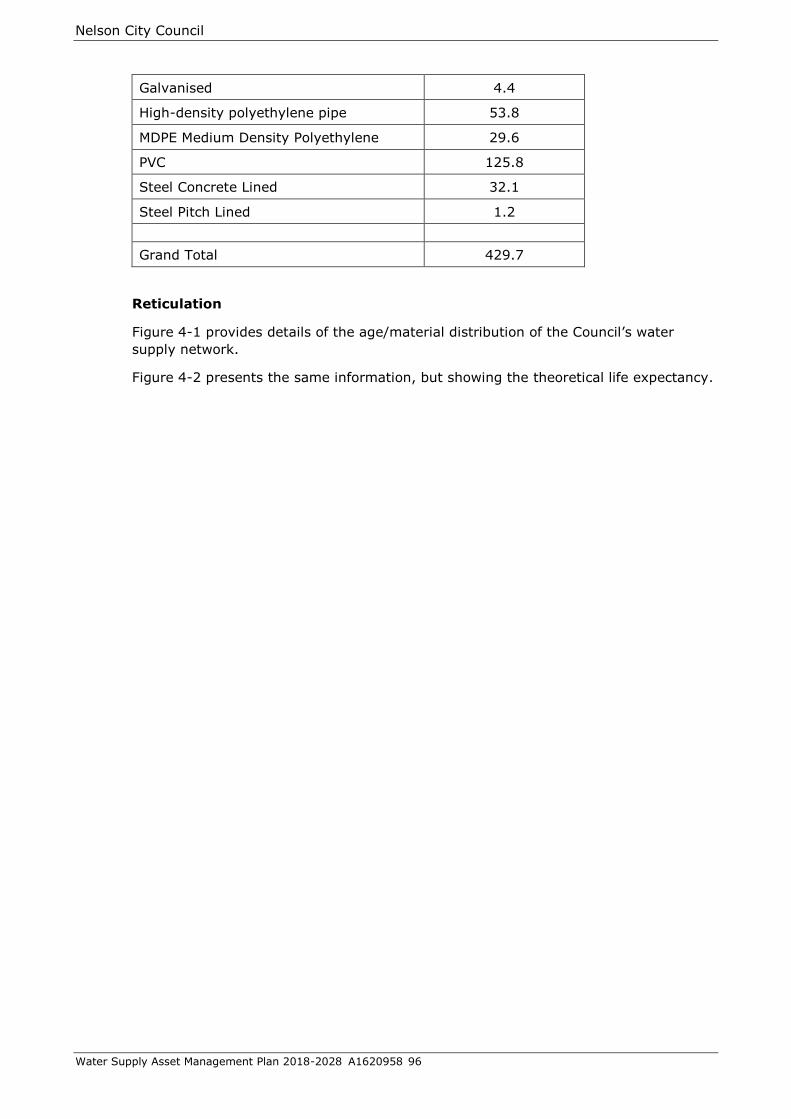
Nelson City Council
Water Supply Asset Management Plan 2018-2028 A1620958 96
Galvanised 4.4
High-density polyethylene pipe 53.8
MDPE Medium Density Polyethylene 29.6
PVC 125.8
Steel Concrete Lined 32.1
Steel Pitch Lined 1.2
Grand Total 429.7
Reticulation
Figure 4-1 provides details of the age/material distribution of the Council’s water
supply network.
Figure 4-2 presents the same information, but showing the theoretical life expectancy.

Nelson City Council
Water Supply Asset Management Plan 2018-2028 A1620958 97
Figure 4-1: Year of Installation / Material Distribution
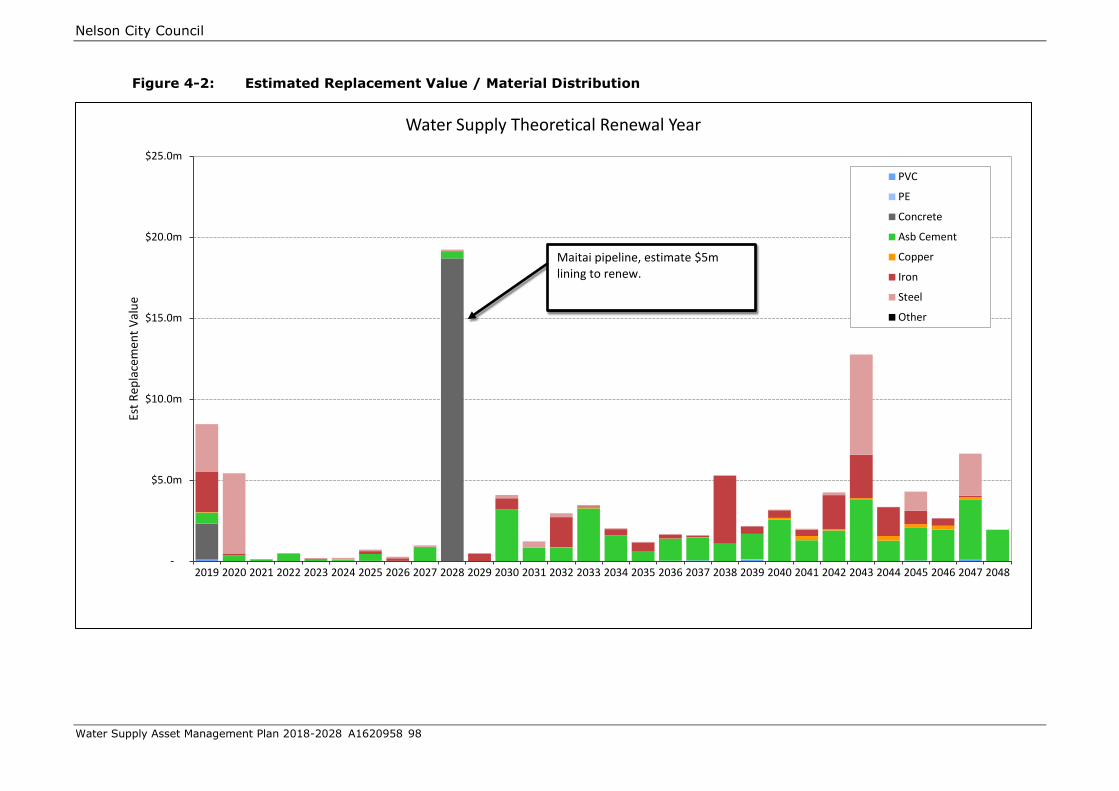
Nelson City Council
Water Supply Asset Management Plan 2018-2028 A1620958 98
Figure 4-2: Estimated Replacement Value / Material Distribution
-
$5.0m
$10.0m
$15.0m
$20.0m
$25.0m
2019 2020 2021 2022 2023 2024 2025 2026 2027 2028 2029 2030 2031 2032 2033 2034 2035 2036 2037 2038 2039 2040 2041 2042 2043 2044 2045 2046 2047 2048
Est
Rep
lace
men
t V
alu
eWater Supply Theoretical Renewal Year
PVC
PE
Concrete
Asb Cement
Copper
Iron
Steel
Other
Maitai pipeline, estimate $5m lining to renew.

Nelson City Council
Water Supply Asset Management Plan 2018-2028 A1620958 99
Figure 4-3: Theoretical Renewal Year / Material Distribution
Theoretical Life Expectancy
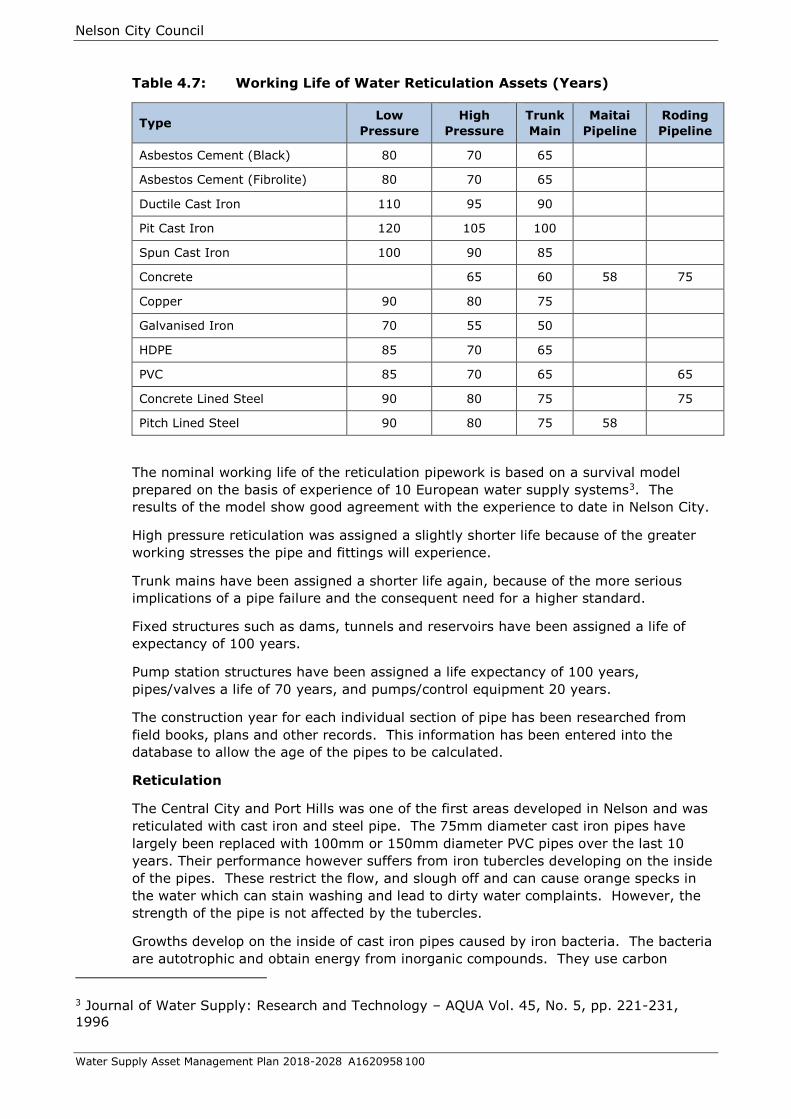
Nelson City Council
Water Supply Asset Management Plan 2018-2028 A1620958 100
Table 4.7: Working Life of Water Reticulation Assets (Years)
Type Low
Pressure
High
Pressure
Trunk
Main
Maitai
Pipeline
Roding
Pipeline
Asbestos Cement (Black) 80 70 65
Asbestos Cement (Fibrolite) 80 70 65
Ductile Cast Iron 110 95 90
Pit Cast Iron 120 105 100
Spun Cast Iron 100 90 85
Concrete 65 60 58 75
Copper 90 80 75
Galvanised Iron 70 55 50
HDPE 85 70 65
PVC 85 70 65 65
Concrete Lined Steel 90 80 75 75
Pitch Lined Steel 90 80 75 58
The nominal working life of the reticulation pipework is based on a survival model
prepared on the basis of experience of 10 European water supply systems3. The
results of the model show good agreement with the experience to date in Nelson City.
High pressure reticulation was assigned a slightly shorter life because of the greater
working stresses the pipe and fittings will experience.
Trunk mains have been assigned a shorter life again, because of the more serious
implications of a pipe failure and the consequent need for a higher standard.
Fixed structures such as dams, tunnels and reservoirs have been assigned a life of
expectancy of 100 years.
Pump station structures have been assigned a life expectancy of 100 years,
pipes/valves a life of 70 years, and pumps/control equipment 20 years.
The construction year for each individual section of pipe has been researched from
field books, plans and other records. This information has been entered into the
database to allow the age of the pipes to be calculated.
Reticulation
The Central City and Port Hills was one of the first areas developed in Nelson and was
reticulated with cast iron and steel pipe. The 75mm diameter cast iron pipes have
largely been replaced with 100mm or 150mm diameter PVC pipes over the last 10
years. Their performance however suffers from iron tubercles developing on the inside
of the pipes. These restrict the flow, and slough off and can cause orange specks in
the water which can stain washing and lead to dirty water complaints. However, the
strength of the pipe is not affected by the tubercles.
Growths develop on the inside of cast iron pipes caused by iron bacteria. The bacteria
are autotrophic and obtain energy from inorganic compounds. They use carbon
3 Journal of Water Supply: Research and Technology – AQUA Vol. 45, No. 5, pp. 221-231,
1996
Nelson City Council
Water Supply Asset Management Plan 2018-2028 A1620958 101
dioxide as a carbon source. They oxidise soluble ferrous iron to less soluble ferric
iron. The bacteria deposit oxidised iron Ferric Hydroxide as a red-brown coloured
slime. Iron bacteria thrive in unlined cast iron pipes.
Another source of dissolved iron was from lower levels of the Maitai Lake when this
water is used in preference to turbid water from upper levels when the river is in
flood.
There is no simple or inexpensive way of controlling iron bacteria in distribution
systems.
The growths can be minimised by using high chlorine residuals, treating the water at
source and lining of unlined cast iron pipes.
Cast Iron Watermains
Cast iron pipes generally have a long life before deterioration failure.
The failure of cast iron is often at the joints.
Older pipes are lead jointed. These joints sometimes work loose due to internal
pressure, earthquake, or traffic vibration. The joints are repaired by re-caulking
where possible or by cutting out the joint area and replacing it with a new section of
pipe and two gibault couplings.
There is also a possible health hazard with the lead dissolving in the water, particularly
near dead ends where there is reduced flow, and the water is in contact with the joint
for longer.
There are proprietary processes to scrape and reline cast iron pipes with either cement
mortar or epoxy coatings. This eliminates the effects of tubercles and lead joints as
noted above.
It is therefore proposed to investigate the feasibility of refurbishment of cast iron
reticulation pipes 100mm diameter and larger rather than abandoning them.
Cast iron pipes may be weakened by changes to the chemical composition of the pipe
material over time, such as graphitisation.
Cast iron pipes, being brittle are liable to damage due to traffic loadings and point load
over or under another service such as stormwater pipe, etc.
In assessing the reason for a cast iron pipe failure the cause of the failure will be
carefully ascertained.
Asbestos Cement Watermains
The Water Supply Managers Group of the New Zealand Water and Waste Association
has produced a report entitled “Condition Rating of Asbestos Cement Watermains”
which includes (on hard copy and diskette) a copy of: the National Specification for
Sampling and Testing, the Life Expectancy Model, the Deterioration/Life Curves, and a
copy of the current database of results.
This document will be used to assess the condition of asbestos cement pipes in
Nelson.
Pipes of larger diameters and pipes of higher pipe pressure classes have thicker walls
to provide the necessary hoop strength.

Nelson City Council
Water Supply Asset Management Plan 2018-2028 A1620958 102
However pipe wall degradation is nearly constant for all pipe sizes and classes,
therefore smaller diameter, lower pressure class pipes will fail earlier, and large
diameter higher pressure class pipes may never fail from deterioration.
Most asbestos cement pipe laid in Nelson is Class D. The exceptions are where higher
pressure classes were required for specific high pressure lines.
It appears that the relationship between ground conditions and deterioration is not
completely proven but may be worth investigating for critical pipelines.
By sampling and testing the remaining wall thickness on existing pipes it may be
possible to predict the year of first deterioration failures in each asbestos cement
pipeline.
Most AC pipelines in Nelson are 100mm and 150mm Class D pipes, laid between the
1950s and 1980s during the subdivision boom in Stoke, Atawhai and the Victory
Square area.
These pipelines are of the same size, class, operating pressure, and ground conditions,
and can therefore be aggregated to derive the top down deterioration model for
Nelson.
Similarly there are some 50mm diameter class D rider mains which can be
aggregated. As noted above these pipes are likely to be the first to fail from
deterioration. They are also most likely to fail due to, for example, traffic loading,
again due to the relatively thin wall thickness required for the low internal pressure
hoop stresses.
A few trunk mains are 200, 300, 375, and 450 mm asbestos cement of varying
pressure classes (e.g. the 375mm trunk main from Neale Park to Vickerman Street is
C28. A 375mm pressure class C dimension pipe, but with a stronger asbestos cement
mix in the wall). As noted above, these pipes are the least likely to fail from
deterioration.
Sampling and testing for pipe wall softening will be carried out using the standard
methods described in the “Condition Rating of Asbestos Cement Watermains” manual.
Asbestos pipe was imported from Britain and Italy in the early 1950s. It is coated
with bitumen and is colloquially known as “Black Asbestos” cement pipe.
New Zealand made “Fibrolite” asbestos cement pipe does not appear to be softening.
A programme of replacing 50mm diameter “Fibrolite” pipe and 100mm diameter
“Black Asbestos” pipe has commenced.
Trunk mains
Maitai Pipeline
The Maitai Pipeline was laid in 1963 using 900mm diameter concrete pipe on concrete
cradles. 750mm diameter steel pipe was used for the syphons where the pipeline
crosses from one side of the valley to the other.
The pipeline is vulnerable to damage from rock fall which can be caused by either
major storms or earthquakes. The leakage that can be caused by a rock fall is far
more serious than weeps from circumferential cracks.
An inspection in 1998 identified movement in a section of the pipeline near Groom
Creek. This was caused by a large earth flow following a period of heavy rain. A
100m long section of affected concrete pipe was replaced by a welded steel pipe,
supported on concrete columns, founded on solid ground beneath the earthflow

Nelson City Council
Water Supply Asset Management Plan 2018-2028 A1620958 103
Stantech (MWH) Ltd have completed a geotechnical assessment of the existing Maitai
Pipeline route in 2017. The level of risk is given a rating from low to very high and
has been based on:
Identification of hazards (e.g. rockfall, slumping, shallow sides, etc);
Likelihood of the event or hazard (e.g. likely to rare);
Consequence of event hazard (e.g. from insignificant – no leaks or obstructions
to major – multiple or greater than 10m of pipe destroyed, access lost, loss of all
flow for over 1 month).
A small number of items were identified as needing immediate attention- removal of
trees that pose a risk to the pipeline if they fall and inspection of the steel sections at
Fiddlers Elbow and adjacent the Maitai Motor Camp. These items will be addressed
2017/18-2018/19.
Since 1989 maintenance effort has been put into repairing the worst of the cracks and
sandblasting and painting the steel syphons. To clear the ground from under the pipe
to allow complete painting, it has been necessary to construct additional concrete
supports under the pipe.
In 2007 Council decided to duplicate the section of the pipeline from the Maitai Dam to
the Water Treatment Plant with a new pipe laid down the Maitai Valley Road. The pipe
size has been optimised by providing pumping for peak flows. It was also decided that
the existing pipeline should be kept in use for as long as possible to minimise pumping
costs. As the breakeven point is about 20 years, painting of the steel syphons should
be continued in future asset management plans.
On 30 July 2008 a section of the pipeline approximately half a kilometre downstream
of the Treatment Plant was damaged by wind thrown trees. Duplication of this section
of pipeline (WTP to Westbrook Terrace) with a pipeline laid in Tantragee Road, Brook
Street, and Westbrook Terrace has been completed in 2016/17.
Roding pipeline
The Roding pipeline was constructed in the early 1940s at the same time as the
Roding weir. The pipeline runs through a 2.7 km long tunnel under the Barnicoat
Range, down Marsden Valley and along SH6 to Tahunanui.
The timber shoring in the tunnel was upgraded in 1992 and is considered to be in
good condition. The tunnel and the concrete pipeline within it are inspected annually.
The remainder of the pipeline is constructed of steel pipe. Replacement should be
programmed within 20 years on an age basis only. Condition inspection was carried
out in 2014 and subsequent analysis will be used to determine the actual replacement
timing.
Foothills Trunk Mains
The Roding Transfer Pipeline was constructed in 2003/04 using 300mm and 375mm
diameter ductile iron pipe. Steel pipe, of the same size, was used where the pipeline
crosses two steeply incised creeks.
The pipeline is made up of two pipes buried full length in the same trench.
One pipeline carries raw Roding water from the Marsden Valley (raw water) trunk
main to the Water Treatment Plant. The other pipeline carries treated water back to
the Marsden Valley (treated water) trunk main.

Nelson City Council
Water Supply Asset Management Plan 2018-2028 A1620958 104
Water is pumped to a high point (250m) at the saddle between Brook and Enner
Glynn valleys. It then falls under gravity the remaining distance. Pressure reducing
valves at the Marsden Valley end reduce the pressure to 170m maximum and at the
Water Treatment Plant to 7m.
The raw water pipeline is also connected to a hydro electricity generator to capture
some of the energy of the water in the pipeline.
Other Trunk Mains
The remainder of the trunk mains in the City have been installed since the 1960s and
are in good condition.
Steel Trunk Mains
Steel pipe is used for trunk mains as they are larger diameter, high pressure mains.
Steel pipe suffers from electrolytic corrosion due to “cell effects” between the steel
pipe, other metals, and the soil. Where electrons leave the pipe, the metal is eaten
away. Properly coated pipe is insulated from the soil and is therefore protected. The
coating can however be incomplete, or have been damaged during pipe laying.
The trunk mains in Brook and Tasman Streets (between Larges Lane and Bridge
Street), and under the Maitai River (at QEII Drive) are protected by an impressed
current system where electrons enter the steel pipe via the coating defect and exit to
the soil in a special anode bed. The Fiddler’s Elbow Syphon on the Maitai Pipeline is
similarly protected, but with a sacrificial zinc anode.
The systems were installed in 1995 and 1996.
In 2000 it was found that the ground anode bed in Bronte Street needed replacement.
This was carried out in the 2001 financial year.
An audit of these systems is required in the next five years.
Table 4-8: Working Life of Water Assets (Years)
Life (Years)
Manholes
Standard < 1250 dia 84
Standard >= 1250 dia 72
Flow measuring manholes 50
Meter manhole 80
Valves
Air/NRTN 35
Pressure Reducing 35
Gate valves <250 dia 84
Gate valves >=250 dia 72
Hydrants
<250 dia 84
>=250 dia 72

Nelson City Council
Water Supply Asset Management Plan 2018-2028 A1620958 105
Life (Years)
Maitai Water Supply Scheme
Dam and platform 200
Concrete structures (spillway etc) 100
South Supply Intake 50
Roding Dam 100+
Other
Reservoirs 100
Tunnels 100
Stoke reservoir overflow pipe 80
Manifold and meter boxes 80
Service laterals 80
Meters 15
Headworks (including Dams and Intakes)
Maitai Water Supply Scheme
The Maitai Water Supply Scheme was commissioned in 1987. The Scheme can
abstract water from the North Branch Reservoir or the run of river intake on the South
Branch.
The Maitai Dam is an earthfill dam with crest height approximately 36m above the
North Branch riverbed.
Roding Dam
The Roding Weir was commissioned in 1940. In 1972 the concrete structure was
raised by 1.5m to its current height of 11m above the downstream riverbed.
The weir initially created approximately 40,000 cubic metres of storage. Major floods
in 1985 severely damaged some of the upper catchment so there are now significant
amounts of gravel and sand coming down the catchment that have filled in the storage
behind the weir. This material has been removed but every time the storage area was
cleaned out nature simply delivered more material to fill it in.
With the need for storage reduced by the presence of the Maitai Dam, the decision
was taken to build an intake on the downstream face of the weir in 1988. As the water
flows over the weir some of it falls through the intake’s screens and into the pipe work
which then delivers it into the water supply system. This has proved very effective and
has stopped a lot of the silt and sand getting into the water supply system. The
volume behind the weir has been allowed to fill in and it now appears to have reached
a stable level. The storage volume behind the weir is now no more than 3,000 cubic
metres. The diversion tunnel gate was renewed in 2002/03. It is now more readily
opened to allow gravel to be flushed through on the falling side of a flood, to prevent
gravel build up.
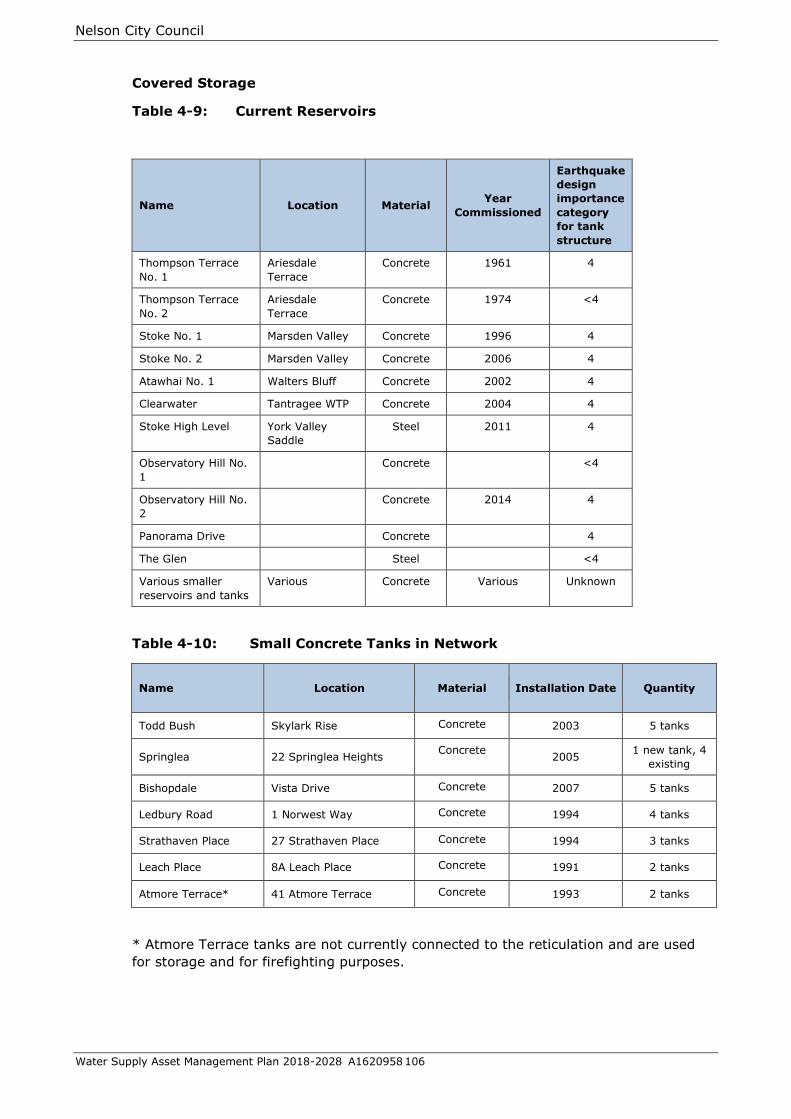
Nelson City Council
Water Supply Asset Management Plan 2018-2028 A1620958 106
Covered Storage
Table 4-9: Current Reservoirs
Name Location Material Year
Commissioned
Earthquake
design
importance
category
for tank
structure
Thompson Terrace
No. 1
Ariesdale
Terrace
Concrete 1961 4
Thompson Terrace
No. 2
Ariesdale
Terrace
Concrete 1974 <4
Stoke No. 1 Marsden Valley Concrete 1996 4
Stoke No. 2 Marsden Valley Concrete 2006 4
Atawhai No. 1 Walters Bluff Concrete 2002 4
Clearwater Tantragee WTP Concrete 2004 4
Stoke High Level York Valley
Saddle
Steel 2011 4
Observatory Hill No.
1
Concrete <4
Observatory Hill No.
2
Concrete 2014 4
Panorama Drive Concrete 4
The Glen Steel <4
Various smaller
reservoirs and tanks
Various Concrete Various Unknown
Table 4-10: Small Concrete Tanks in Network
Name Location Material Installation Date Quantity
Todd Bush Skylark Rise Concrete 2003 5 tanks
Springlea 22 Springlea Heights Concrete
2005 1 new tank, 4
existing
Bishopdale Vista Drive Concrete 2007 5 tanks
Ledbury Road 1 Norwest Way Concrete 1994 4 tanks
Strathaven Place 27 Strathaven Place Concrete 1994 3 tanks
Leach Place 8A Leach Place Concrete 1991 2 tanks
Atmore Terrace* 41 Atmore Terrace Concrete 1993 2 tanks
* Atmore Terrace tanks are not currently connected to the reticulation and are used
for storage and for firefighting purposes.

Nelson City Council
Water Supply Asset Management Plan 2018-2028 A1620958 107
Reservoirs
The two reservoirs at Thompson Terrace were constructed in 1963 and 1974. Both
reservoirs were strengthened in 1991/92 to improve the seismic performance.
Table 4-11: Reservoir Design Categories
Category Description
2 Tanks which are intended to remain functional in the emergency
period for a major earthquake, for example, firefighting water.
3 Tanks which should be functional in the restoration period for a major
earthquake, for example, potable water.
4 Must remain operational and functional post-earthquake
(From NZS 3106: Code of Practice for Concrete Structures for the Storage of Liquids)
In 2000, an engineering inspection was carried out on the roof structure of the
2,500m3 reservoir at Thompson Terrace. It was found that the roof cladding was
perforated and that some of the trusses were badly corroded. The roof was replaced in
2001/02 with fibreglass cladding supported by an external steel structure.
A further engineering inspection was carried out on the rest of the reservoir in 2002
while it was drained for roof construction. It was found that the water seals in the
floor were in need of replacement. This has been completed.
The Stoke Nos.1 and 2 Reservoirs, Stoke High Level Reservoir, Walters Bluff
Reservoir, Clearwater Reservoir and the Observatory Hill Reservoir are of more recent
design and are category 2.
There is both mechanical and electronic equipment at the reservoirs to control and
monitor refilling.
An additional reservoir at Observatory Hill was constructed in 2014 to provide water
storage for the residential subdivisions in the area.
Following the 2011 Christchurch earthquake Council undertook a review of the
reservoirs to identify any improvements that could be made using the knowledge
gained from Christchurch. To date the smaller Thompson Terrace tank and Walters
Bluff reservoir are in the process of being strengthened. A range of minor works to
valves and tank draw off points at other tanks are being carried out under the
operational contract.
Pump Stations
Nelson has a gravity fed system. (The Marsden Supply is at 170m City Datum and the
Clearwater Reservoir at 155m City Datum). There is therefore low dependency on
pumps.
The City has thirteen pump stations. All have been constructed since 1990.
Pump Station Locations:
On main raw water delivery line adjacent the Maitai camp ground, Water treatment
Plant, Marsden Valley, Princes Drive(two pumps), Thompson Terrace, Wastney
Terrace(three pumps), Bishopdale Ave (adjacent no 101), Springlea Ave(two pumps),
Hutson Street, Montebello Ave, Van Dieman Street, Austen Ward Heights(one pump),
Panorama Drive(two pumps).
Nelson City Council
Water Supply Asset Management Plan 2018-2028 A1620958 108
At both ends of the Foothills Trunk Main (commissioned 2004) are large inline pump
stations. These are critical for the transfer of water to and from the Water Treatment
Plant.
There is a large inline underground pump on the cross town trunk watermain in Van
Diemen Street. This was designed to boost the flow from the Treatment Plant to Stoke
via the Thompson Terrace Reservoir at times of high demand. It is regularly used to
part fill Thompson Terrace to maintain the operation of the pump and reduce the risk
of sedimentation in the pipework.
The other relatively small above ground pump stations boost water to higher hillside
properties.
Pressure Reducing Valves
The City has 40 pressure reducing valves in the reticulation system, Their locations
are shown in Figure 1-1 in the Introduction.
Three pressure reducing valves are located at the Marsden Pump Station on the
Clearwater Foothills Trunk Main and one is located at the Water Treatment Plant on
the raw water foothills trunk main. These were installed in 2004 as part of the Water
Treatment project.
At present, pressure gauges linked to the telemetry system monitor the performance
of 10 of the pressure reducing valves. These gauges allow for remote monitoring of
the pressure in the reticulation and generate an alarm if the pressure moves outside
set tolerances. The alarm allows maintenance staff to quickly respond to excess
pressures, reducing the impact of damage caused to both public and private pipework.
It is intended to progressively install new telemetry sites to monitor the performance
of strategically located valves over the next five years where failure could impact large
areas of the city. Target areas for remote monitoring include the CBD, Nelson South
and Atawhai zones.
Service Pipes, Manifolds and Meters
Service pipes are the pipes between the watermain and the property street boundary.
These pipes are part of the water asset. Pipe materials used are galvanised iron,
copper and polyethylene. Galvanised pipes were installed prior to the 1950s. Copper
was installed from the 1950s to the 1990s. In recent years polyethylene or
polybutylene has been used.
The quantity of each type of pipe is unknown. Whenever a street is upgraded or a
new watermain is laid the water service pipes are relaid if they are galvanised. This
procedure has been in force since 1990.
Supply pipes are the pipes between the property boundary and the building on the
site. These pipes may be shared by several properties where there is a Right of Way
or Cross Lease access. Supply pipes are privately owned.
All properties connected to the Water Supply are metered. Meters and manifolds are
generally situated at the property street boundary. The exception is where one or
more properties are served by a common supply pipe. In this case the meter is
located in a practical location where the supply pipe branches to serve only one
property. The meter and manifold is part of the water asset, although it may be sited
on private property on a private supply pipe.
Manifolds were installed as replacements for all residential toby repairs, and on all new
subdivisions from 1993. Manifolds were installed on all other residential properties in

Nelson City Council
Water Supply Asset Management Plan 2018-2028 A1620958 109
1997 and 1998 as part of the Universal Metering Project. Meters were installed into
these manifolds in the first six months of 1999.
In 2009 a small sample (23) of residential water meters were bench tested for
accuracy by Water Meter Services Ltd as part of the water losses investigation. These
tests were carried out at flows or 0.38 litres per minute, 15 litres per minute and 50
litres per minute. The results show readings ranging as follows:
Flow 0.38 litres per minute -27.3% to +3.47%
Flow 15 litres per minute -3.31% to +0.77%
Flow 50 litres per minute -31.87% to -1.02%
The variability confirmed a general view that some losses must be attributed to meter
performance. The testing was repeated in 2013 and 2016/17 to monitor changes and
to begin developing a failure curve. The sample tested was quite small in 2016/17 (19
of) and may not be sufficient to develop a reliable curve.
Renewal of the simple double check valve assembly in the meter manifold has been
identified as a priority, owing to ongoing failure of these units. This work started in
2015/16 and will be ongoing until the meter replacement programme is concluded.
The increasing use of automated meter reading technology in the power supply utility
field offers real advantages to the water supply activity, principally in reducing costs of
meter reading and billing and providing early warning of excess water use that may be
an indication of leaks. To investigate the feasibility of adopting this technology a trial
with 50 meters in a central city residential street began in 2016/17. The meters have
been read using hand held wands to test the system and manually for the purposes of
invoicing. The appropriate software has been installed and tested for compatibility with
the NCC network. It is anticipated that a trial will be carried out in 2017/18 to test the
process of automatically generating invoices.
Water Treatment Plant
Commissioned in August 2004, the Water Treatment Plant is made up of several
hundred components.
In 2012 an S:CAN unit was installed at the treatment plant to measure the following
parameters in the raw water:- total organic carbon, dissolved organic carbon and
turbidity; and automatically adjust chemical coagulation dosing. Early results are
promising with more efficient use of coagulation chemicals possible. As part of the new
abstraction consents for the Maitai and Roding rivers an external review of the water
treatment plant was commissioned. This review noted the use of ferric chloride
coagulant and reticulation problems encountered during a trial using the Maitai dam as
a sole raw water source and recommended a change of coagulant chemical to
Aluminium Chlorohydrate. Community consultation will likely be required before any
change is made.
In 2013 Council commenced a trial of dosing the raw water delivery from the Maitai
with carbon dioxide as a means of adjusting the pH below 8 which will improve the
efficiency of the coagulant chemicals used to remove organic loading in the raw water.
The pilot trial has proven to be successful in reducing chemical use and the
operational contractor is currently making provision for a more permanent installation.
The trial Maitai Dam sole raw water source identified further issues with the soda-ash
plant used for pH correction and recommended a change to caustic soda.
The report recommendations will be investigated in 2017/18-2018/19.

Nelson City Council
Water Supply Asset Management Plan 2018-2028 A1620958 110
Land, Access Roads, Fences, Landscaping and Houses
Land, access roading, fencing and landscaping have now been included in the asset
register. These facilities are regularly maintained and are in good condition. The
houses at the Maitai and Roding waterworks are listed in Council’s fixed asset register.
Pressure
At present, Nelson’s water supply is predominantly gravity fed from covered storage
reservoirs. This means the elevation of the Water Treatment Plant Clearwater
reservoir and Stoke High Level Reservoir determines which areas of the City can be
supplied and how much pressure is provided.
Each supply area is further broken down into high level and low level areas. The high
level areas work on the full mains pressure generated by the difference in elevation
between the reservoirs and the point of supply.
The low level areas have the supply pressure stepped down by pressure reducing
valves. This is to protect the mains and domestic plumbing installations from
continuously operating under excessively high water pressures.
The Clearwater Reservoir at the Water Treatment Plant is normally used to directly
supply the area encompassed by Atawhai, the Brook Valley, Bishopdale, the Port Hills,
the Port, and via the Thompson Terrace Reservoirs to Tahunanui and the Tahunanui
hillside, and at times Stoke. The reservoir has an effective elevation of 155m above
City Datum.
The Saddle Break Pressure Tanks and Stoke High Level Reservoir on the foothills
cross-City link between the Brook and Enner Glynn Valley are at an elevation of 255m
above City Datum (but the pressure is lowered in Marsden Valley by a pressure
reducing valve to 170m above City Datum) and is used to supply Stoke.
The difference in elevation between the two systems means that properties on the
Stoke high level areas can experience pressure fluctuations of at least 150kPa (15m
head). This fluctuation in cold water pressure (and flow rate) adversely affects
showers, washing machines, dishwashers, etc.
4.1.2. Asset capacity/performance
Reticulation
The flow capacity of asbestos cement pipes does not generally deteriorate with time
however the failure performance of the product has not met Council’s expectations.
This is particularly the case with ‘Black’ asbestos cement. Council’s current renewal
strategy targets the replacement of this material as a priority.
The trial use of the Maitai Dam as the sole raw water source in 2016 resulted in a
large number of dis-coloured water complaints to Council. The source of the dis-
colouration is generally believed to be the deposits of iron and manganese in the
network. A review of the issue has made a number of suggestions for further
investigation to better identify the cause of the deposits being released into the
network at that particular time.
Headworks (including Dams and Intakes)
Maitai Water Supply Scheme
The reservoir has a total live storage of 3.3M m3, and dead storage of 900,000m3.

Nelson City Council
Water Supply Asset Management Plan 2018-2028 A1620958 111
Covered Storage
Currently the Maitai and Roding together are capable of meeting the water treatment
plant capacity of approximately 40,000m3/day. However, demand is more typically
spread over a 16-18 hour period. Therefore storage is required to make full use of the
night time supply capacity and to meet peaks in demand during the day.
This storage is also needed to ensure continuity of supply in the event of a major
problem (e.g. headworks damage, or trunk main failure) and to provide opportunities
to carry out planned maintenance.
The Public Health Grading of Community Water Supplies 2003 Explanatory Notes and
Grading Forms imposes distribution grading “demerit points” where there is not
covered secure storage of 24 hours average daily demand.
The targeted level of service is 24 hours storage (at average demand) located in the
area it is to serve. This standard is met for the smaller hilltop reservoirs and tanks
served by pumped systems or night time filling but not for the larger zone reservoirs.
All reservoirs above 100 m3 (10 in total) have level sensors connected to the
telemetry SCADA system. Alarms are monitored 24 hours a day and there is always
someone on-call to respond. There are seismic valves on the outlet pipes of nine of
the reservoirs over 100 m³ (excluding The Glen and Montebello-privately owned).
Table 4-12: Current Reservoirs
Name Location Capacity m3
Thompson Terrace No. 1 Ariesdale Terrace 2,300
Thompson Terrace No. 2 Ariesdale Terrace 5,300
Stoke No. 1 Marsden Valley 2,500
Stoke No. 2 Marsden Valley 2,600
Atawhai No. 1 Walters Bluff 2,500
Clearwater Tantragee WTP 3,000
Stoke High Level York Valley Saddle 2,500
Observatory Hill No. 1 300
Observatory Hill No. 2 440
Panorama Drive 185
The Glen 110
Various smaller
reservoirs and tanks
Various 1,550
TOTAL CAPACITY 23,285
Table 4-13: Small Concrete Tanks
Name Location Number of
22m³ Tanks
Todd Bush Skylark Rise 5
Springlea 22 Springlea
Heights 5
Bishopdale Vista Drive 5
Ledbury Road 1 Norwest Way 4
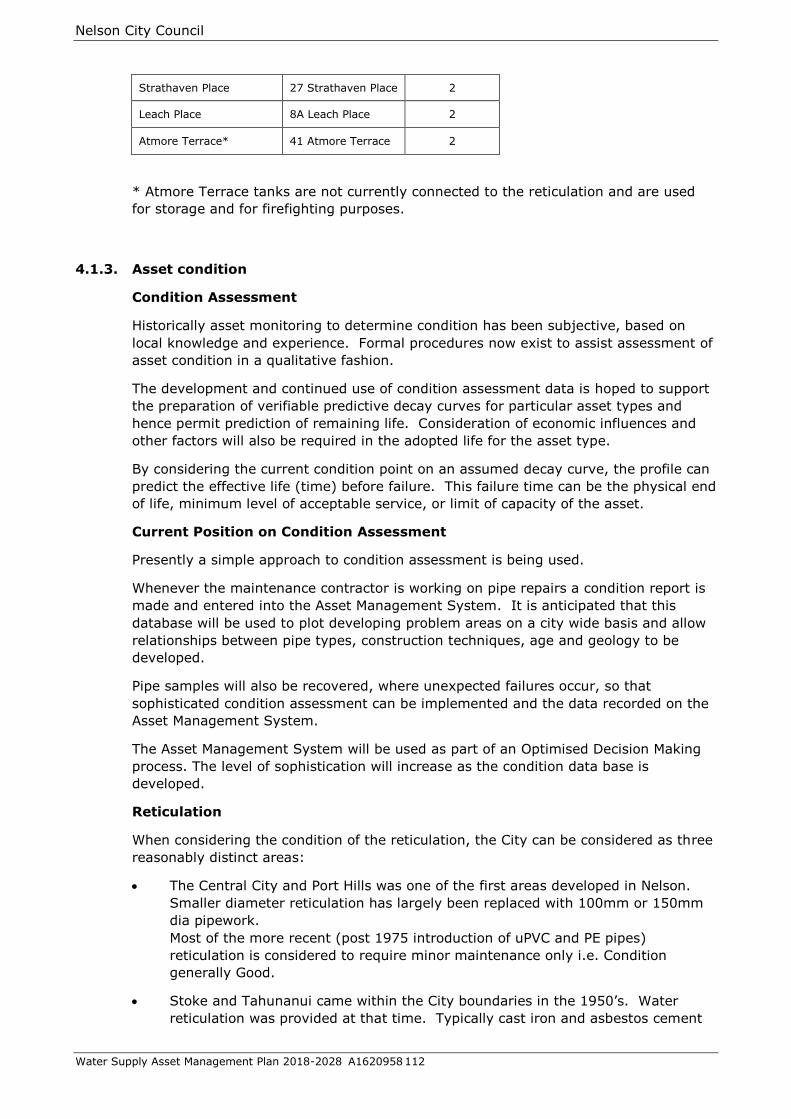
Nelson City Council
Water Supply Asset Management Plan 2018-2028 A1620958 112
Strathaven Place 27 Strathaven Place 2
Leach Place 8A Leach Place 2
Atmore Terrace* 41 Atmore Terrace 2
* Atmore Terrace tanks are not currently connected to the reticulation and are used
for storage and for firefighting purposes.
4.1.3. Asset condition
Condition Assessment
Historically asset monitoring to determine condition has been subjective, based on
local knowledge and experience. Formal procedures now exist to assist assessment of
asset condition in a qualitative fashion.
The development and continued use of condition assessment data is hoped to support
the preparation of verifiable predictive decay curves for particular asset types and
hence permit prediction of remaining life. Consideration of economic influences and
other factors will also be required in the adopted life for the asset type.
By considering the current condition point on an assumed decay curve, the profile can
predict the effective life (time) before failure. This failure time can be the physical end
of life, minimum level of acceptable service, or limit of capacity of the asset.
Current Position on Condition Assessment
Presently a simple approach to condition assessment is being used.
Whenever the maintenance contractor is working on pipe repairs a condition report is
made and entered into the Asset Management System. It is anticipated that this
database will be used to plot developing problem areas on a city wide basis and allow
relationships between pipe types, construction techniques, age and geology to be
developed.
Pipe samples will also be recovered, where unexpected failures occur, so that
sophisticated condition assessment can be implemented and the data recorded on the
Asset Management System.
The Asset Management System will be used as part of an Optimised Decision Making
process. The level of sophistication will increase as the condition data base is
developed.
Reticulation
When considering the condition of the reticulation, the City can be considered as three
reasonably distinct areas:
The Central City and Port Hills was one of the first areas developed in Nelson.
Smaller diameter reticulation has largely been replaced with 100mm or 150mm
dia pipework.
Most of the more recent (post 1975 introduction of uPVC and PE pipes)
reticulation is considered to require minor maintenance only i.e. Condition
generally Good.
Stoke and Tahunanui came within the City boundaries in the 1950’s. Water
reticulation was provided at that time. Typically cast iron and asbestos cement
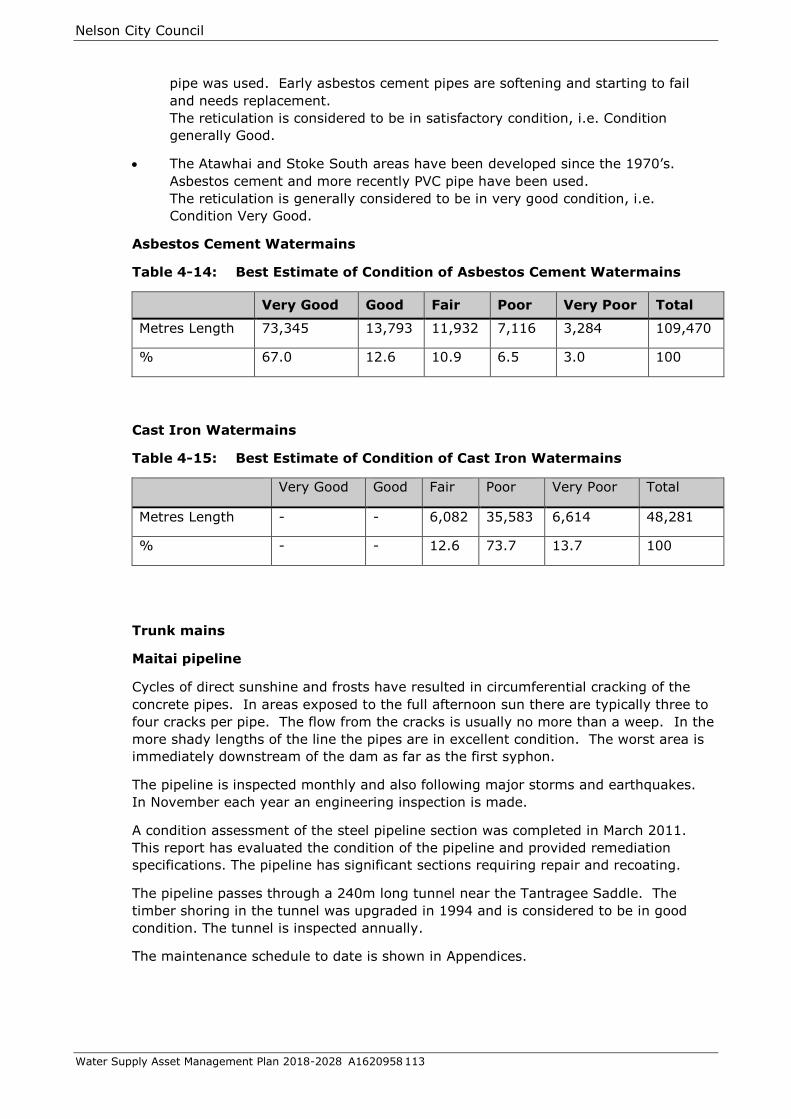
Nelson City Council
Water Supply Asset Management Plan 2018-2028 A1620958 113
pipe was used. Early asbestos cement pipes are softening and starting to fail
and needs replacement.
The reticulation is considered to be in satisfactory condition, i.e. Condition
generally Good.
The Atawhai and Stoke South areas have been developed since the 1970’s.
Asbestos cement and more recently PVC pipe have been used.
The reticulation is generally considered to be in very good condition, i.e.
Condition Very Good.
Asbestos Cement Watermains
Table 4-14: Best Estimate of Condition of Asbestos Cement Watermains
Very Good Good Fair Poor Very Poor Total
Metres Length 73,345 13,793 11,932 7,116 3,284 109,470
% 67.0 12.6 10.9 6.5 3.0 100
Cast Iron Watermains
Table 4-15: Best Estimate of Condition of Cast Iron Watermains
Very Good Good Fair Poor Very Poor Total
Metres Length - - 6,082 35,583 6,614 48,281
% - - 12.6 73.7 13.7 100
Trunk mains
Maitai pipeline
Cycles of direct sunshine and frosts have resulted in circumferential cracking of the
concrete pipes. In areas exposed to the full afternoon sun there are typically three to
four cracks per pipe. The flow from the cracks is usually no more than a weep. In the
more shady lengths of the line the pipes are in excellent condition. The worst area is
immediately downstream of the dam as far as the first syphon.
The pipeline is inspected monthly and also following major storms and earthquakes.
In November each year an engineering inspection is made.
A condition assessment of the steel pipeline section was completed in March 2011.
This report has evaluated the condition of the pipeline and provided remediation
specifications. The pipeline has significant sections requiring repair and recoating.
The pipeline passes through a 240m long tunnel near the Tantragee Saddle. The
timber shoring in the tunnel was upgraded in 1994 and is considered to be in good
condition. The tunnel is inspected annually.
The maintenance schedule to date is shown in Appendices.

Nelson City Council
Water Supply Asset Management Plan 2018-2028 A1620958 114
Foothills Trunk Mains
The pipeline is inspected yearly, but is also continuously monitored by computer for
sudden changes in pressure and flow. It is in very good condition.
Other Trunk Mains
The remainder of the trunk mains are in good condition.
Steel Trunk Mains
Above ground pipes are inspected annually to ensure that the pipe coating (epoxy or
wrapping) is intact.
Because steel pipes corrode through localised action as described in Physical
parameters, sampling is not a reliable means of determining pipe condition.
An assessment of the above ground steel pipe sections was carried out in 2011 by
Inspection and Consultancy Services Ltd. This assessment concluded that the
condition of the protective coating of the above ground pipework on the Maitai raw
water pipeline was “poor”. Re-coating of this main has been completed.
The overall condition of the mains varies from fair to very good condition i.e.
Conditions Grade 1-3.
Headworks (including Dams and Intakes)
Maitai Water Supply Scheme
The performance of the dam is monitored monthly and following major earthquakes.
Tonkin and Taylor Ltd, the designers, carry out an annual inspection of the dam and
maintenance work is programmed in response to their recommendations and those of
the Maitai Caretaker.
Table 4-16: Tonkin & Taylor 2016 Dam Safety Review Summary of dam
condition
While these procedures are effective at ensuring year to year reliability of the main
supply dams, more work is needed on assessing the longer term requirements for
items such as valves, pipework, and electronic equipment.

Nelson City Council
Water Supply Asset Management Plan 2018-2028 A1620958 115
Comprehensive Safety Reviews (CSR) of the Maitai Water Supply Dam are
commissioned by Nelson City Council every five years to independent consultants to
review the original design against current practice. The latest CSR inspection was
carried out in January 2014 by Damwatch Engineering. The final report was received
in June 2014. The next review is to be repeated in 2019.
Recommendations can be found in Appendices
Roding Dam
There is a caretaker living on site at the Roding Weir. Routine maintenance work is
programmed in response to his recommendations.
The scheme is considered to be in very good condition.
Reservoirs
All reservoirs are considered to be in very good condition.
Pump Stations
The condition of the pumps stations is considered to be very good.
Pressure Reducing Valves
The condition of the pressure reducing valves is considered to be good. A number of
water main failures in the central city (2016/17) and Kakenga Road have been
attributed to failures of PRV’s in Franklyn Street and Marsden Valley respectively. A
review of causes and servicing requirements is proposed for 2019/20.
Service Pipes, Manifolds and Meters
The condition of service pipes varies from very good to unserviceable.
Manifolds are in very good condition.
Meters range from near new with a condition assessment of very good to nearly 30
years old.
Water Treatment Plant
The plant and equipment is in very good condition.
4.1.4. Asset Valuations
The replacement costs of the water assets are $248.9m at June 2016 as detailed in
Table 4-10 below. The majority of the replacement costs are the reticulation mains.
Table 4-17: Water Supply Asset Valuation - June 2016
Asset Category
Quantity RV DRV Depr
km units ($) ($) ($)
Reticulation 333.8 81,114,158 43,397,673 1,011,932
Trunk Mains 45.6 22,787,631 10,972,355 309,409
Maitai Pipelines 16.3 22,557,388 13,416,549 320,366
Roding Pipeline 3.9 2,741,626 575,848 30,162
Maitai Water
Supply Scheme
1
20,848,700 14,402,600 226,000
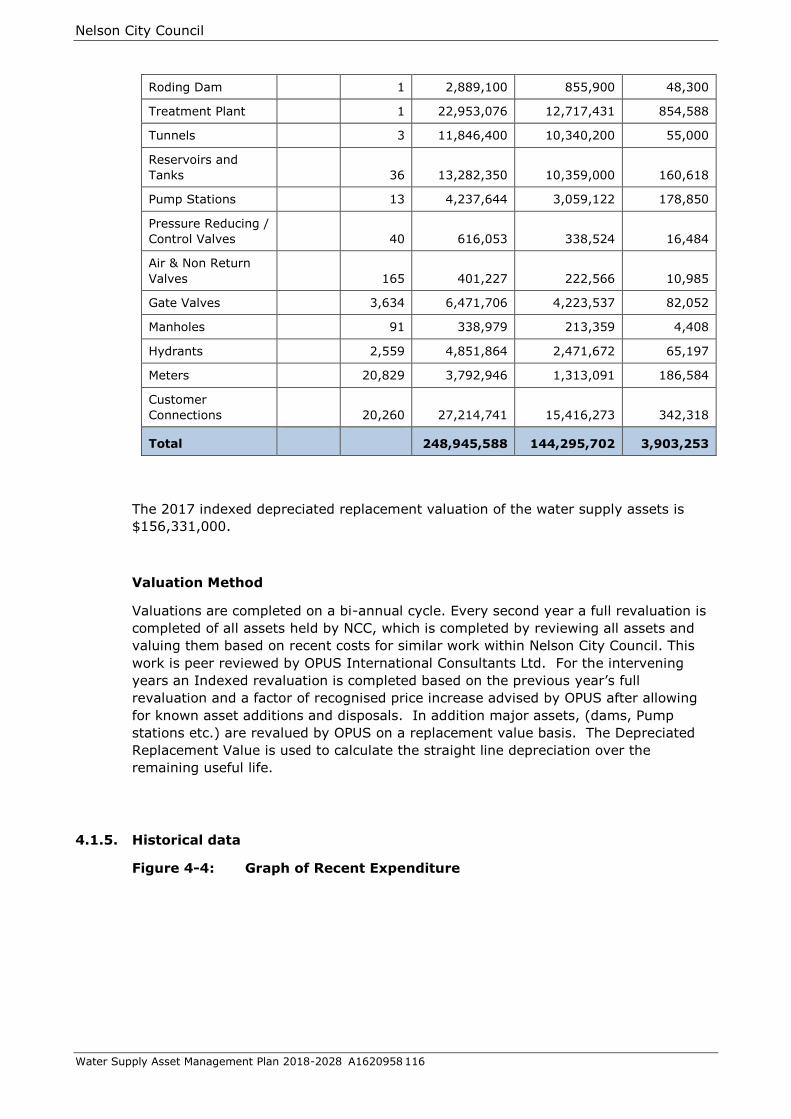
Nelson City Council
Water Supply Asset Management Plan 2018-2028 A1620958 116
Roding Dam 1 2,889,100 855,900 48,300
Treatment Plant 1 22,953,076 12,717,431 854,588
Tunnels 3 11,846,400 10,340,200 55,000
Reservoirs and
Tanks 36 13,282,350 10,359,000 160,618
Pump Stations 13 4,237,644 3,059,122 178,850
Pressure Reducing /
Control Valves 40 616,053 338,524 16,484
Air & Non Return
Valves 165 401,227 222,566 10,985
Gate Valves 3,634 6,471,706 4,223,537 82,052
Manholes 91 338,979 213,359 4,408
Hydrants 2,559 4,851,864 2,471,672 65,197
Meters 20,829 3,792,946 1,313,091 186,584
Customer
Connections 20,260 27,214,741 15,416,273 342,318
Total
248,945,588 144,295,702 3,903,253
The 2017 indexed depreciated replacement valuation of the water supply assets is
$156,331,000.
Valuation Method
Valuations are completed on a bi-annual cycle. Every second year a full revaluation is
completed of all assets held by NCC, which is completed by reviewing all assets and
valuing them based on recent costs for similar work within Nelson City Council. This
work is peer reviewed by OPUS International Consultants Ltd. For the intervening
years an Indexed revaluation is completed based on the previous year’s full
revaluation and a factor of recognised price increase advised by OPUS after allowing
for known asset additions and disposals. In addition major assets, (dams, Pump
stations etc.) are revalued by OPUS on a replacement value basis. The Depreciated
Replacement Value is used to calculate the straight line depreciation over the
remaining useful life.
4.1.5. Historical data
Figure 4-4: Graph of Recent Expenditure
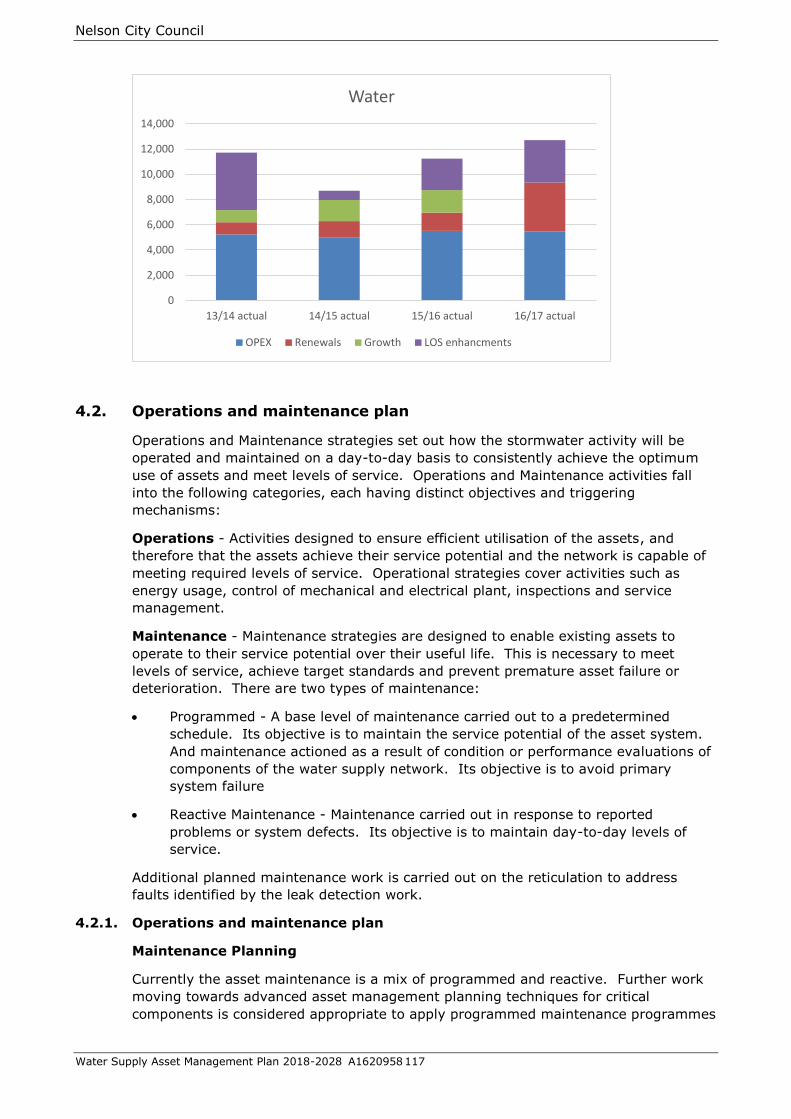
Nelson City Council
Water Supply Asset Management Plan 2018-2028 A1620958 117
4.2. Operations and maintenance plan
Operations and Maintenance strategies set out how the stormwater activity will be
operated and maintained on a day-to-day basis to consistently achieve the optimum
use of assets and meet levels of service. Operations and Maintenance activities fall
into the following categories, each having distinct objectives and triggering
mechanisms:
Operations - Activities designed to ensure efficient utilisation of the assets, and
therefore that the assets achieve their service potential and the network is capable of
meeting required levels of service. Operational strategies cover activities such as
energy usage, control of mechanical and electrical plant, inspections and service
management.
Maintenance - Maintenance strategies are designed to enable existing assets to
operate to their service potential over their useful life. This is necessary to meet
levels of service, achieve target standards and prevent premature asset failure or
deterioration. There are two types of maintenance:
Programmed - A base level of maintenance carried out to a predetermined
schedule. Its objective is to maintain the service potential of the asset system.
And maintenance actioned as a result of condition or performance evaluations of
components of the water supply network. Its objective is to avoid primary
system failure
Reactive Maintenance - Maintenance carried out in response to reported
problems or system defects. Its objective is to maintain day-to-day levels of
service.
Additional planned maintenance work is carried out on the reticulation to address
faults identified by the leak detection work.
4.2.1. Operations and maintenance plan
Maintenance Planning
Currently the asset maintenance is a mix of programmed and reactive. Further work
moving towards advanced asset management planning techniques for critical
components is considered appropriate to apply programmed maintenance programmes
0
2,000
4,000
6,000
8,000
10,000
12,000
14,000
13/14 actual 14/15 actual 15/16 actual 16/17 actual
Water
OPEX Renewals Growth LOS enhancments
Nelson City Council
Water Supply Asset Management Plan 2018-2028 A1620958 118
to the widest area of components required to ensure the safe and efficient operation of
the network. This approach would allow for maximising the useful life of an asset
while minimising the consequences of unforeseen failures.
Method of Delivery
The operation and maintenance of the Nelson City Council water supply activity is
carried out using a combination of Nelson City Council staff and external contractors
consisting of:
Network Services internal utilities business unit for design and Supervision
(Nelson City Council).
NELMAC Limited for all reticulation operations and maintenance (CCTO).
External contractors for specialist activities such as closed circuit television and
major overhauls of mechanical equipment.
Pump stations:
The pump stations are inspected weekly, with monthly routine maintenance carried
out. Full performance and condition assessment are carried out every two years.
The pump stations follow a ‘rolling’ pump overhaul programme.
Reservoirs:
Reservoirs are long life above ground structures. Monthly routine maintenance
inspections are carried out. Full condition and performance assessment are carried
out every five years.
In November 2003 engineering inspections were carried out on Thompson Terrace No.
2, Stoke No. 1, Observatory Hill and The Glen Reservoirs.
Weathering of the concrete dome roof of Thompson Terrace No. 2, corrosion of the
internal steel surface of the Glen reservoir, and blistering of the water seals in the
Stoke Reservoir were noted.
Remedial work of the Glen was completed in 2005/06.
Seals in the Thompson Terrace No 2 reservoir were partly replaced after seepage was
noted in the underdrain collector. Anodes were fitted to the internal ladder to prevent
further corrosion.
Seismic shut off valves have been retrofitted to the Stoke No.1 and Thompson Terrace
Nos.1 and 2 Reservoirs. The newer Atawhai No. 1, Stoke High Level and Stoke No. 2
reservoirs were fitted with seismic valves during construction.
The pipework at the Thompson Terrace reservoirs has been modified to prevent “short
circuiting” of the water flow with possible water quality problems.
Work on replacing the seals to Observatory Hill and Panorama Drive reservoirs was
completed in 2010.
Water Treatment Plant:
Each component is maintained regularly on a scheduled maintenance programme in
accordance with vendor data.
Nelson City Council
Water Supply Asset Management Plan 2018-2028 A1620958 119
Operators stationed at the plant regularly inspect, check and calibrate components of
the plant to ensure they are performing their design function. The cost of routine
maintenance is covered by an operations contract with an external contractor.
Large portions of the plant and the components are computer monitored and alarms
are raised if they go outside predetermined performance limits.
Pressure Reducing Valves
The water maintenance contract has been amended to provide for more preventative
maintenance to be carried out on the pressure reducing valves so the potential for
malfunction is reduced. Further work is required to prevent grit and iron/manganese
deposits impacting the operation of these valves. A review of the PRV network will be
started in 2017/18 with an upgrade programme identified for the 2021/31 LTP.
4.2.2. Operations and maintenance strategies
Day to day operation and maintenance of the network is carried out by contractors
with specific requirements set out in the Maintenance of Utility Services contract.
Level of Service Implications:
For the water supply network to deliver the levels of service it must be intact and
functioning. Reactive maintenance must be carried out promptly. Programmed
maintenance must be carried out to ensure that downtime is minimised by carrying
out maintenance before it becomes reactive.
Demand Implications:
With increasing demand there will be an increase in total variable costs particularly as
more water is transported and pumped.
Risk Implications
Intakes, treatment plant and reticulation mains, must all be maintained, kept secure
and protected from natural hazards so that they can continue to function through an
emergency albeit at a reduced level of service.
Lifecycle Implications
Operations and maintenance is the longest period of the asset lifecycle and ongoing
maintenance is necessary to ensure that the design life of the asset is achieved.
Table 4-18: Operations and Maintenance Strategies
Preventative
Maintenance
Preventative Maintenance will be carried out in terms of defined routine
maintenance items and triggers for these activities to be carried out.
These are set out in the Nelmac contract for maintenance of utility
services.
Reactive
Maintenance
Remedial maintenance will be undertaken as quickly as practically
possible to restore an asset to a satisfactory condition after a failure or
other unsatisfactory condition has been detected.
Repairs The detection and repair of faults causing failure will be undertaken as
quickly as practically possible. The fault will be isolated and
components repaired or replaced as appropriate and then if warranted
the item will be tested to ensure that it meets the relevant operational
standard.
Redesign and
Modification
Redesign may be necessary if an asset or system does not meet its
operational objective? Similarly, modifications may be necessary to
improve the operating characteristics. Redesign and modifications will

Nelson City Council
Water Supply Asset Management Plan 2018-2028 A1620958 120
be undertaken in a methodical manner to ensure alternative options are
considered and optimum decisions made.
Operations
Operations Operational activities for the reticulation will be undertaken via NELMAC
unless specialised advice is required. The water treatment plant
operation and maintenance is currently contracted to Fulton Hogan Ltd.
Staff will be responsible for the determination and optimisation of
planned and unplanned works, work methods and maintenance
scheduling to achieve the target service standards.
Physical Works
Monitoring
Audits of work will be carried out to verify compliance with standards set
out in the appropriate contract.
Operation of
Utilities
Utilities such as pumping stations will be operated in terms of defined
parameters and standards set out in the operations and maintenance
contract.
Incident
management
Effectively respond to and manage incidents to ensure system
availability and service continuity, and mitigate adverse effects.
Maintenance staff and contractors are expected to effectively manage
minor incidents. Nelson City Council staff will become involved in
serious incidents.
System control
and monitoring
Utilise Supervisory Control and Data Acquisition systems to monitor
operation of the water supply facilities.
The Supervisory Control and Data Acquisition system provides
surveillance of the operation of pump stations and reservoirs in the
water supply system and provides alarms when equipment fails or when
operating parameters are exceeded. The Supervisory Control and Data
Acquisition system also records operating data from the pump stations.

Nelson City Council
Water Supply Asset Management Plan 2018-2028 A1620958 121
4.2.3. Summary of future costs
Table 4-19: Water 10 Year Operations and Maintenance Projections ($000)
Account
2018/19
LTP
Final
Uninflated
2019/20
LTP
Final
Uninflated
2020/21
LTP
Final
Uninflated
2021/22
LTP
Final
Uninflated
2022/23
LTP
Final
Uninflated
2023/24
LTP
Final
Uninflated
2024/25
LTP
Final
Uninflated
2025/26
LTP
Final
Uninflated
2026/27
LTP
Final
Uninflated
2027/28
LTP
Final
Uninflated
7005 Water Supply
Expenses 5,530.6 5,584.7 5,641.6 5,606.9 5,655.1 5,744.7 5,760.6 5,691.8 5,698.1 5,686.8
Base Expenditure 3,299.0 3,378.0 3,379.2 3,480.2 3,541.4 3,505.3 3,569.4 3,618.1 3,599.4 3,588.1
Unprogrammed Expenses 1,925.0 1,950.0 1,950.0 1,950.0 1,950.0 1,950.0 1,900.0 1,900.0 1,900.0 1,850.0
Programmed Expenses 306.6 256.7 312.4 176.7 163.7 289.4 291.2 173.7 198.7 248.7
Nelson City Council
Water Supply Asset Management Plan 2018-2028 A1620958 122
4.3. Renewal/Replacement Plan
Renewal is major work that does not increase the asset’s design capacity but restores,
rehabilitates, replaces or renews an existing component to its original capacity. This
includes:
Works that do not increase the capacity of the asset but restores them to their
original size, condition capacity, etc.
The replacement component of augmentation works which increase the capacity
of the asset, i.e. that portion of the work which restores the assets to their
original size, condition, capacity etc;
Reconstruction or rehabilitation works involving improvements and realignment.
Renewal and/or renovation of existing assets, restoring the assets to a new or
fresh condition consistent with the original asset.
Work over and above restoring an asset to original capacity is creation/acquisition/
augmentation expenditure. However if the additional cost is within 10% of the
renewal cost then the total cost will be treated as renewal expenditure.
4.3.1. Renewal identification/strategies
Assets can fail from various modes other than the normally recognised physical,
failure or breakage.
Condition assessment is a typical failure mode assessment activity.
To evaluate cost and obsolescence as failure modes it is necessary to capture the
asset’s operating and maintenance cost information, and to compare this with the
lifecycle cost expectations.
As condition assessment and maintenance histories are built up, these will be used in
determining renewal priorities.
Level of Service Implications
It is necessary to renew pipes and equipment before they impact on levels of service.
Demand Implications
Renewals will be sized to allow for future demand. Where the increase is greater than
10% then the difference will be funded from capital.
Risk Implications
There is a risk to water quality, financial income, and consumer parity by not
undertaking renewals of pipes, meters and dual check valves.
Lifecycle Implications
Pipes and equipment must be renewed before maintenance costs become excessive.
Decisions made at the time of renewal have impact on the whole lifecycle costs of the
asset.
For the purpose of developing asset renewal programmes the water supply assets
have been separated into “discrete” and “non -discrete” assets.
“Discrete” assets are assets such as pumping stations, which are separately
identifiable, accessible and which can readily be inspected.

Nelson City Council
Water Supply Asset Management Plan 2018-2028 A1620958 123
“Non discrete” assets are assets such as buried pipelines which are part of an
extensive network, are generally below ground and which cannot readily be
inspected (other than by techniques such as excavation and closed circuit
television).
This renewal strategy deals with the reticulation portion of the network – pipes, valves
and associated chambers. Pumpstations, telemetry, water treatment plant and head
works are considered separately.
The reticulation system has to reliably transport the required volumes of water from
the trunk mains and reservoirs to the consumers, at sufficient pressure while
maintaining quality. The water network is made up a range of materials such as cast
iron, asbestos cement, concrete, uPVC, polyethylene, concrete lined steel and ductile
iron. Currently Council’s renewal strategy is based on replacing asbestos cement pipes
that were installed in the 1950’s and are showing higher than expected failure rates.
Further investigation of the older sections of the network are needed in order to
confirm the condition of the steel and iron pipes. Figure 4-5 shows an increasing
incidence of failures in materials such as concrete lined steel, PVC and HDPE that
indicates further investigation will be required to identify causes. As the current
asbestos cement pipe renewal programme is expected to continue for the next 8-10
years, enhanced condition assessment of the other pipe types is expected to be part of
the renewal strategy from years 5-8.
Where appropriate Nelson City Council uses longer pipe sections, either coiled
polyethylene or uPVC replacing shorter cast iron, concrete and asbestos cement pipes,
leading to quicker installation and fewer joints.
Figure 4-5: Water Main Failures
Table 4-20: Renewal Strategies
Strategy Objective/ Description
Identification of
Renewal Needs
To avoid a concentration of asset renewals in a short window of
time, when they all reach the end of their life, renewals are set by:
Potential development in the city
Other Council projects
e.g. the condition of water supply pipelines will be inspected prior
to major road works to identify the risk of the road being damaged
0
20
40
60
80
100
120
140
19
40
19
70
20
00
19
50
19
90
19
50
19
80
19
80
19
60
20
00
19
70
20
00
19
10
19
50
19
30
19
60
19
40
19
70
20
00
19
30
19
70
20
00
20
10
19
40
19
70
20
00
19
90
19
00
19
70
20
10
19
30
19
60
19
90
19
20
19
50
19
80
20
10
19
60
19
90
ACBK ACMTBLBT CI CIDT CIPT CISP CONC COPR DICL GALV HDPE MDPEOTHR
PVC STCL STPL
Water Main Failures by Material & Decade

Nelson City Council
Water Supply Asset Management Plan 2018-2028 A1620958 124
Strategy Objective/ Description
by pipeline failure or the need for pipeline replacement in the
short/medium term. Pipelines in poor condition will be
programmed for replacement prior to or in conjunction with the
road works.
Issues identified with asset by location and or materials
through condition reports, maintenance records (asset failure and
expenditure history), request for service (RFS) records, and
observations of public, staff and contractors.
1) Critical assets just before they fail.
2) Others after four or more unexpected failures over the previous
five years (sum of all asset of same material and age for the street)
and
Two breaks occurred on the same asset (individual pipe section) or
breaks on the same material on a street being equivalent to one
break per 100m or less.
3) Assets that do not meet required fire flow demand and
Have two or more failures over the past five years.
4) Alignment with other utility renewals or upgrades where
excavation to renew the water supply asset would be undesirable
within the next ten years.
Project options Decision Criteria are weighed. Then Business Options which
consider benefits (aligned with the Decision Criteria), dis-benefits,
cost, timescale and risks are compared to determine whether to
proceed with a renewal or which renewal option to take.
Prioritisation of
Renewal
Projects
Decisions on renewal works consider the short and long-term
effects on the operating and structural integrity of the system
Design Construct renewal works each year, are generally designed in
advance, to maintain level of service.
Renewal works are designed and undertaken in accordance with
Nelson City Council Land Development Manual that stress the use
of long life materials
Investment is made in new technologies to rehabilitate existing
reticulation where appropriate, rather than excavate and replace.
Deferred
Renewals
The quantity and impact of deferred renewals (if any) is tracked
The Council recognises that although the deferral of some items on
renewal programmes will not impede the operation of many assets
in the short term, repeated deferral will create a future Council
liability. As Council currently funds asset renewals from
depreciation deferred renewals are not expected.
Renewal Plan
Relining of selected 100mm diameter and larger cast iron pipes will be
considered in the future
Asbestos Cement Pipe - 50mm diameter Fibrolite pipes and 100mm diameter
“Black Asbestos” pipes which are identified as being near the end of their
economic life are scheduled for renewal from 2007/08 to 2030/31

Nelson City Council
Water Supply Asset Management Plan 2018-2028 A1620958 125
Steel Pipe - Steel pipes tend to corrode randomly. Individual sections of steel
pipe which fail will be replaced as maintenance expenditure
Water Treatment Plant Filters – Installation of the fifth train was completed in
2016/17 in order to provide greater flexibility with the filter renewal programme
and possibly extend the life of the existing filters. Completion of the renewal of
the existing filters is shown in the renewal projections for 2018/19. As the Water
Treatment Plant has been in operation for ten years and the filters are
guaranteed for 10 years advice from the manufacturer will guide the
replacement timetable.
Water Meters - Residential water meters were installed in 1999, and have a life
of 12-15 years. It is cheaper to replace these sizes rather than test and
refurbish them. These are expected to be replaced under renewal budgets over
3 years from 2018/19. A detailed business case concluded that the renewal of
residential meters should be on a like for like basis with manual read meters.
Residential Backflow Prevention – The dual check valves in the water meter
manifold are spring operated and lose effectiveness with time. An increasing
number of the valves are also disintegrating in the manifolds and a programme
to replace these has commenced in 2015/16. As the dual check valve is fitted
immediately underneath the meter it was initially considered to be appropriate
for them to be replaced at the same time as the meter. The number of failures
and risk of pieces of the valves impacting the water meters and household water
fittings has led to the need to begin the replacement in advance of the meters.
Water Meters
Trends in each property’s water usage are tracked and if a meter appears to be
“slowing down”, then it is removed for testing or replacement. Worn meters tend to
under-read and are therefore in that customer’s favour, but true costs are not being
recovered from the customer who is therefore subsidised by other consumers.
Commercial and Industrial water meters were installed from 1980 to 1999.
Meters on commercial and industrial properties vary in age and size. Most meters
have been installed since 1980 in business groups i.e. all schools, all hotels, all
hairdressers etc. Meters were installed on parks in 1998, on small users such as
offices and small shops as part of the Universal Water Metering project in 1999, and in
new subdivisions and developments as they occur. Larger sizes can be refurbished but
spare parts for early models are not now available.
Renewal of commercial and industrial water meters started in 2014/15 and is
approximately 25% complete. The work is scheduled to be completed in 2028/29.
The future proposed renewal of residential water meters, scheduled over a three year
period from 2018/19 at $1,100,000 per year, is based on replacement ‘like for like’
with mechanical manual read meters.
Existing Maitai concrete pipeline
The Maitai pipeline between the Maitai Dam and the Water Treatment Plant transports
the majority of the water used in the City. It has numerous small shrinkage cracks
and is vulnerable to slips from above and below the pipeline.
Council completed the construction of a duplicate Maitai pipeline between the dam and
the Water Treatment Plant in 2014 but will continue to use and maintain the existing
pipeline, to reduce pumping costs, for as long as it is viable to do so. Repairs of the

Nelson City Council
Water Supply Asset Management Plan 2018-2028 A1620958 126
section between the Dam and the Water Treatment Plant is shown in this Asset
Management Plan to commence in 2018/19.
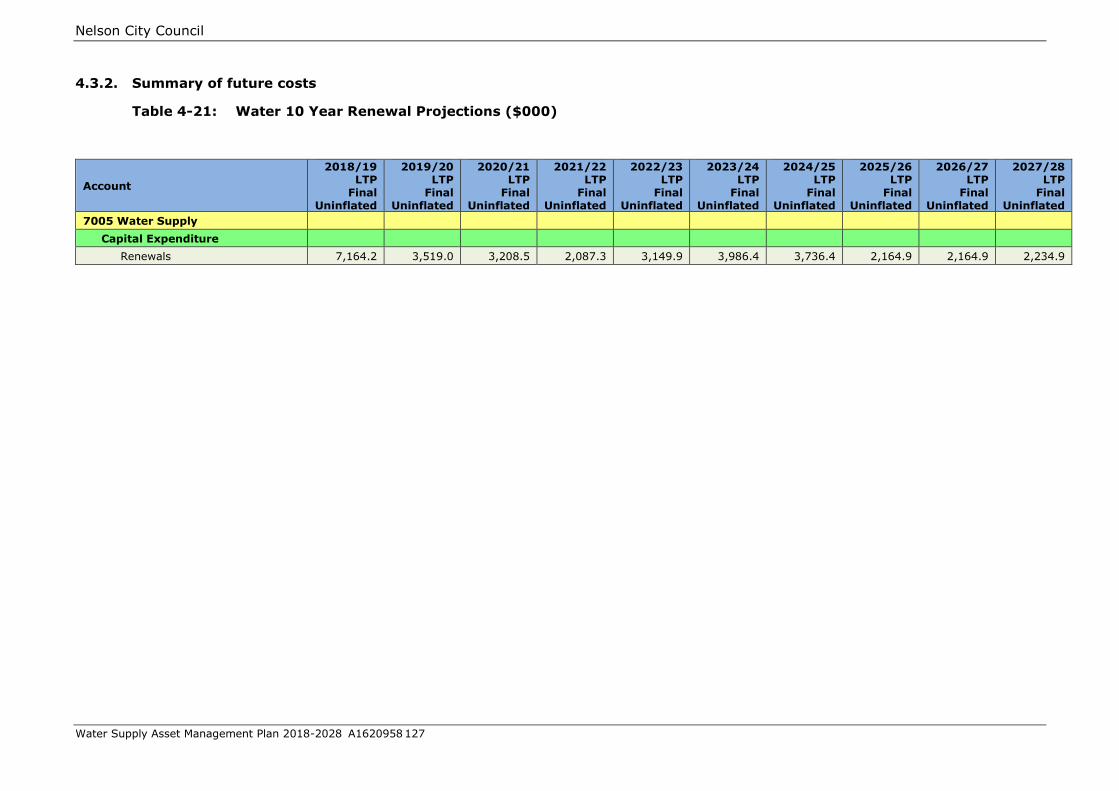
Nelson City Council
Water Supply Asset Management Plan 2018-2028 A1620958 127
4.3.2. Summary of future costs
Table 4-21: Water 10 Year Renewal Projections ($000)
Account
2018/19 LTP
Final Uninflated
2019/20 LTP
Final Uninflated
2020/21 LTP
Final Uninflated
2021/22 LTP
Final Uninflated
2022/23 LTP
Final Uninflated
2023/24 LTP
Final Uninflated
2024/25 LTP
Final Uninflated
2025/26 LTP
Final Uninflated
2026/27 LTP
Final Uninflated
2027/28 LTP
Final Uninflated
7005 Water Supply
Capital Expenditure
Renewals 7,164.2 3,519.0 3,208.5 2,087.3 3,149.9 3,986.4 3,736.4 2,164.9 2,164.9 2,234.9

Nelson City Council
Water Supply Asset Management Plan 2018-2028 A1620958 128
Deferred Renewals
This plan indicates no deferred renewals
Infrastructure strategy
The thirty year infrastructure strategy sets out the longer term renewal forecast for
the water supply activity. The overarching strategy is based on renewing the network
just in time to avoid disruption to the service and as demands of growth or other asset
renewals offer opportunities to reduce cost and community disruption.
4.4. Creation/Acquisition/Augmentation plan
Creation/Acquisition/Augmentation works create a new asset that previously did not
exist, or upgrade or improve an existing asset. They may result from growth, social or
environmental needs, levels of service. This includes:
Expenditure which purchases or creates a new asset (not a replacement) or in
any way improves an asset beyond its original design capacity.
Upgrading works which increase the capacity of the asset e.g. for future growth
demand.
Construction works designed to produce an improvement in the standard and
operation of the asset beyond its present capacity.
Asset development and asset renewal can occur simultaneously. The purpose of asset
renewal is to prevent a decline in the service potential of the assets whereas asset
development is concerned with the service improvements, measured by asset
performance.
4.4.1. Selection criteria
Level of Service Implication
The capital works for system improvements and ridermains are to address problems
with pressure, flow, and continuity of supply to the levels of service required.
Demand Implications
The capital works proposed will address the need for more storage and trunk mains to
meet growth requirements. Failure to meet growth requirements will then impact on
Levels of Service.
Risk Implications
The capital works proposed address the need for decreasing the risk on the Maitai
Pipeline and preventing backflow from commercial and industrial premises.
Lifecycle Implications
Decisions made to construct a capital project will have implications for the life of the
asset, as will subsequent design decisions. Optimised decision making will therefore
be used to identify and prioritise all potential solutions for water supply projects over
$0.5million value.

Nelson City Council
Water Supply Asset Management Plan 2018-2028 A1620958 129
Selection Strategy
Table 4-22: Selection Strategy
Criteria Objective / Description
Identification of
Upgrade Needs
Asset upgrade needs are identified from analysis of:
Demand forecasts
System performance monitoring
Network modelling
Risk assessments (Risk Management Plan), and
Customer service requests.
A provisional forward capital works programme is maintained
and updated at least annually.
Upgrade Project
Categorisation
Upgrade Projects will be separated into projects to close
service gaps and projects required to accommodate growth.
Upgrade projects to close service gaps are generally funded
entirely by Nelson City Council.
Upgrade projects to accommodate growth may be partly or
wholly funded through Development Contributions.
Prioritisation of
Upgrade Projects
Upgrade projects are justified and prioritised using a risk based
process.
Decisions on upgrade works consider the short and long-term
effects on the operating and structural integrity of the water
supply network.
In determining the requirement for capital or asset upgrade
works the short and long-term effects on the operating and
structural integrity of the system are considered, together with
any forecast increase in loading upon the system.
Decisions on priorities for new works and renewal of assets for
the water supply network are based on the following:
Known problem areas with multiple failures
New growth areas
Primary flow conduits – Trunkmains
Security of supply eg reservoirs, Maitai Dam
Criticality of proposed works
Multiple network project (e.g. incorporating road work,
sewer, water assets)
Environmental impacts especially water abstraction, use
and Maitai Dam
Project Approval A long-term upgrade programme is prepared from projects
meeting the assessment criteria, and all projects are approved
through the Annual Plan process.
The actual timing of asset upgrade works will reflect the
community's ability to meet the cost, as determined through
the Annual Plan process.
Scheduled projects meeting assessment criteria not funded are
listed on the forward works programme for the following year.

Nelson City Council
Water Supply Asset Management Plan 2018-2028 A1620958 130
4.4.2. Capital investment strategies
The table below sets out the strategies used for developing capital works programmes
for the water supply network. These strategies are intended to progressively close
gaps between target service standards (taking account of demographic and economic
growth projections) and the current service capability of the asset system.
Table 4-23: Creation/Acquisition/Augmentation Strategies
Strategy Objective / Description
Project Design
All asset upgrade works will be designed and constructed in
accordance with Nelson City Council Engineering
Standards/Land Development Manual that stress the use of
long life materials, and system design loading.
In determining capital or asset upgrade work requirements the
short and long term effects on the operating and structural
integrity of the system are considered, together with the
demands of any forecast increase in loading upon the system.
The system will be designed to minimise supply disruptions as
far as practically possible by building in an appropriate level of
redundancy.
The standardisation of designs and specifications will be
considered in the interest of facilitating replacement and
operational simplicity.
All feasible options, including non-asset demand management
options and the use of second-hand plant, are considered.
Various components of the water supply goal are considered
when developing the final detailed design:
Economics of various options
Efficiency of meeting the network need
Cultural values relating to water abstraction
Future
Development
Identifies sufficient, feasible development capacity in short,
medium and long term and the location, timing and sequencing
if infrastructure to support it.
Gifted Assets
The risk, cost and benefits of accepting any new privately
funded assets constructed in association with property
development will be considered on a case by case basis in
approval decisions.
Such assets will be accepted into public ownership when
satisfactorily completed in accordance with approvals given.
Council will not contribute to the cost of such work unless
there are exceptional service standard or equity issues.
Capital Plan
System Improvements
Minor works to achieve and maintain the levels of service. Minor issues are identified
through modelling, service technician comments and staff knowledge each year.
Initially it is proposed to concentrate on water loss correction work to reduce the
losses.
Nelson City Council
Water Supply Asset Management Plan 2018-2028 A1620958 131
Reservoirs and Tanks
Currently the larger tanks are positioned close to the central city area and Stoke. To
provide a better level of security for the north of the city a further larger reservoir is
proposed for the Bayview/Marybank area within the term of this plan.
Within the next 30 years it is anticipated that development will require additional
reservoirs for supply of potable water in emergencies at the Northern and Southern
ends of the city.
Atawhai Hills Reservoir and Pump Station
To improve supply capacity and facilitate green field development to the upper levels
of the Atawhai foothills, one option considered was a pump station alongside the
Walters Bluff reservoir, pumping up to a small storage reservoir (300-500m3) on the
ridgeline above. A detailed options report has been developed from 2015- 2017/18 to
identify preferred location(s) for the Atawhai No 2 reservoir and upper level
reticulation options.
Ridermains
The renewal budgets allow for the replacement of 50mm and 100mm asbestos cement
watermains. However, the Land Development Manual requires a watermain on one
side of the street and a ridermain on the other. To accommodate this a separate
budget is identified for new ridermain installations.
System Improvements/ Miscellaneous Pipe and Fittings
There is an ongoing need for small improvements to the water network to address
localised issues that arise with flow, pressure, taste and turbidity. A budget for these
is included in the CAPEX tables. Larger issues are addressed as specific CAPEX
projects.
Waimea Community Dam (Lee River Brightwater)
Nelson City Council has contributed funding to investigations led by Tasman District
Council into augmentation of water sources on the Waimea Plains. For Nelson City to
secure a share in the dam (for water required at some future point) a yet to be
determined payment would have to be made at the time of construction.
Other options are expected to provide sufficient water for the city in the short –
medium term and a share in the Lee Valley Dam is not required for the water supply
activity at this stage. Funding has been allocated in 2020/21 for a grant to the
Waimea Dam project subject to the conditions that access to 22,000m3/d be assured
and the grant be transferred into a shareholding in the Dam Company at any point in
future.
Backflow Prevention.
Backflow prevention is one of the factors considered in the Ministry of Health water
gradings. The water supply does not currently meet Ministry of Health requirements
as not all premises have backflow prevention. Backflow is identified as the second
highest risk to the water supply.
Reduced pressure backflow preventors have been installed on all connections to
sewage treatment plants and pump stations and new connections to Reserve facilities.
The meter manifolds installed on domestic and some commercial connections
incorporate a spring loaded dual check valve. While not providing an absolute
guarantee, these valves significantly reduce the possibility of accidental contamination

Nelson City Council
Water Supply Asset Management Plan 2018-2028 A1620958 132
of the water supply from a residential property, which is also considered to be a low
level risk of contamination source.
A survey has begun of all commercial and industrial premises to determine the exact
backflow prevention needs, so that a programme for installation of backflow
preventors can be established. Installation of backflow preventors has been
established as an important means of protecting the network from contamination.
The sum of $1.6 million over 10 years ($160,000 per year) has been shown in the
Capital Works Projections from 2018/19 for the fitting of backflow preventors to
Commercial and Industrial premises in conjunction with meter renewals.
Fire Flows
Budget allowance of $600,000 from 2018/19-2028/99 has been made for works
required to improve the fire flow issues in the city. These issues have largely been
created by the change in the requirement for fire flows to be available within specified
“as measured along the road” distances from fire hydrants, rather than as a straight
line measure direct from the hydrant.
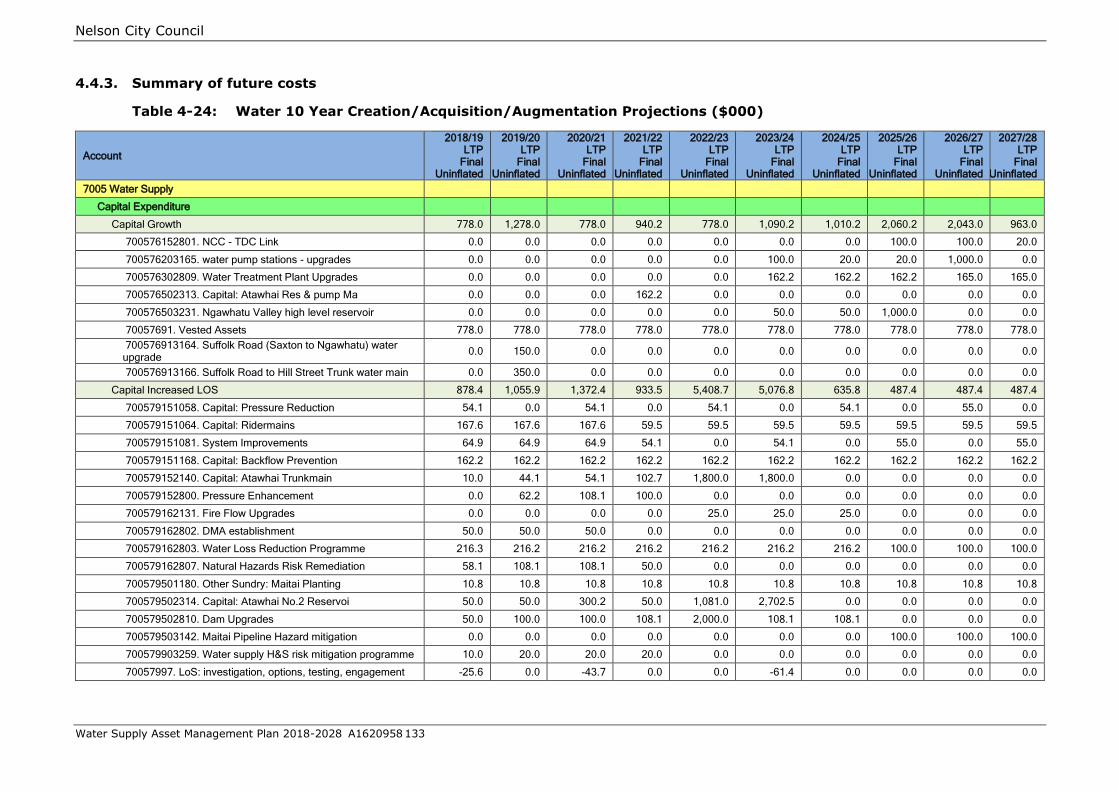
Nelson City Council
Water Supply Asset Management Plan 2018-2028 A1620958 133
4.4.3. Summary of future costs
Table 4-24: Water 10 Year Creation/Acquisition/Augmentation Projections ($000)
Account
2018/19 LTP
Final Uninflated
2019/20 LTP
Final Uninflated
2020/21 LTP
Final Uninflated
2021/22 LTP
Final Uninflated
2022/23 LTP
Final Uninflated
2023/24 LTP
Final Uninflated
2024/25 LTP
Final Uninflated
2025/26 LTP
Final Uninflated
2026/27 LTP
Final Uninflated
2027/28 LTP
Final Uninflated
7005 Water Supply
Capital Expenditure
Capital Growth 778.0 1,278.0 778.0 940.2 778.0 1,090.2 1,010.2 2,060.2 2,043.0 963.0
700576152801. NCC - TDC Link 0.0 0.0 0.0 0.0 0.0 0.0 0.0 100.0 100.0 20.0
700576203165. water pump stations - upgrades 0.0 0.0 0.0 0.0 0.0 100.0 20.0 20.0 1,000.0 0.0
700576302809. Water Treatment Plant Upgrades 0.0 0.0 0.0 0.0 0.0 162.2 162.2 162.2 165.0 165.0
700576502313. Capital: Atawhai Res & pump Ma 0.0 0.0 0.0 162.2 0.0 0.0 0.0 0.0 0.0 0.0
700576503231. Ngawhatu Valley high level reservoir 0.0 0.0 0.0 0.0 0.0 50.0 50.0 1,000.0 0.0 0.0
70057691. Vested Assets 778.0 778.0 778.0 778.0 778.0 778.0 778.0 778.0 778.0 778.0
700576913164. Suffolk Road (Saxton to Ngawhatu) water upgrade
0.0 150.0 0.0 0.0 0.0 0.0 0.0 0.0 0.0 0.0
700576913166. Suffolk Road to Hill Street Trunk water main 0.0 350.0 0.0 0.0 0.0 0.0 0.0 0.0 0.0 0.0
Capital Increased LOS 878.4 1,055.9 1,372.4 933.5 5,408.7 5,076.8 635.8 487.4 487.4 487.4
700579151058. Capital: Pressure Reduction 54.1 0.0 54.1 0.0 54.1 0.0 54.1 0.0 55.0 0.0
700579151064. Capital: Ridermains 167.6 167.6 167.6 59.5 59.5 59.5 59.5 59.5 59.5 59.5
700579151081. System Improvements 64.9 64.9 64.9 54.1 0.0 54.1 0.0 55.0 0.0 55.0
700579151168. Capital: Backflow Prevention 162.2 162.2 162.2 162.2 162.2 162.2 162.2 162.2 162.2 162.2
700579152140. Capital: Atawhai Trunkmain 10.0 44.1 54.1 102.7 1,800.0 1,800.0 0.0 0.0 0.0 0.0
700579152800. Pressure Enhancement 0.0 62.2 108.1 100.0 0.0 0.0 0.0 0.0 0.0 0.0
700579162131. Fire Flow Upgrades 0.0 0.0 0.0 0.0 25.0 25.0 25.0 0.0 0.0 0.0
700579162802. DMA establishment 50.0 50.0 50.0 0.0 0.0 0.0 0.0 0.0 0.0 0.0
700579162803. Water Loss Reduction Programme 216.3 216.2 216.2 216.2 216.2 216.2 216.2 100.0 100.0 100.0
700579162807. Natural Hazards Risk Remediation 58.1 108.1 108.1 50.0 0.0 0.0 0.0 0.0 0.0 0.0
700579501180. Other Sundry: Maitai Planting 10.8 10.8 10.8 10.8 10.8 10.8 10.8 10.8 10.8 10.8
700579502314. Capital: Atawhai No.2 Reservoi 50.0 50.0 300.2 50.0 1,081.0 2,702.5 0.0 0.0 0.0 0.0
700579502810. Dam Upgrades 50.0 100.0 100.0 108.1 2,000.0 108.1 108.1 0.0 0.0 0.0
700579503142. Maitai Pipeline Hazard mitigation 0.0 0.0 0.0 0.0 0.0 0.0 0.0 100.0 100.0 100.0
700579903259. Water supply H&S risk mitigation programme 10.0 20.0 20.0 20.0 0.0 0.0 0.0 0.0 0.0 0.0
70057997. LoS: investigation, options, testing, engagement -25.6 0.0 -43.7 0.0 0.0 -61.4 0.0 0.0 0.0 0.0

Nelson City Council
Water Supply Asset Management Plan 2018-2028 A1620958 134
4.5. Disposal plan
The disposal plan recognises that there can be activities and costs associated with the
decommissioning and disposal of assets which are no longer required as part of the
water supply network. In some situations there can be revenue resulting from asset
disposal.
Table 4-25: Disposal Strategies
Strategy Objective/ Description
Asset Disposal Assess each proposal to dispose of surplus or redundant assets on an
individual basis, subject to the requirements of the relevant
legislation.
Asset disposal will comply with the requirements of the Local
Government Act 2002 and in particular the requirement for councils
to retain a capability to provide water supply services.
Redundant pipes are backfilled or removed where their alignment
clashes with replacement pipelines or where their existence is
considered dangerous. This is to ensure collapse does not occur.
Possible use of abandoned pipes for telecommunication ducts is
reviewed on a case by case basis. Currently Chorus and Network
Tasman lease access to abandoned gas mains and abandoned water
and wastewater pipes.
Disposal for Re-use Mechanical equipment that has been replaced will be reused for parts
or sold as scrap metal unless it is considered to have genuine resale
value. In this case, the piece of surplus equipment will be sold with
income directed to the Nelson City Council account.
Disposal Value The residual value (if any) of assets, which are planned to be
disposed of, will be identified and provided for in financial projections.
Abandoned water pipelines have possible future value for other
purposes (such as ducting for cabling). As the extent of this value (if
any) is uncertain it is not recognised in the asset valuation.
Record of
Abandonment
When a water supply asset is abandoned or replaced the Geographic
Information System and fixed asset register are updated. A system
of job number creation and asset identification is used to document
this process.
Water mains are generally relaid off line. If pipes are left in the ground they are
usually sealed at the connections and retained as a possible duct for cables (subject to
health and safety concerns about accessing asbestos cement pipes).
Mechanical equipment that has been replaced is cannibalised for parts or sold as scrap
metal unless it is considered to have genuine resale value. In this case, the piece of
surplus equipment will be sold with income directed to the water supply account.
Risk management plan
This section describes the risk management procedures used in the water supply
activity.
Applying risk management procedures enables decisions to be made about the best
use of limited resources to achieve as much as possible of the Council’s objectives
from the maintenance and development of the water supply assets.

Nelson City Council
Water Supply Asset Management Plan 2018-2028 A1620958 135
Threats and opportunities are assessed against water supply objectives and levels of
service.
As set out above risk management is not simply about uncertain events with a
downside (such as financial loss or legal proceedings). The process can also be used
to identify and decide on the merits of uncertain opportunities for the Council to do
things more innovatively, sustainably and effectively.
5.1. Critical assets
5.1.1. How critical assets are identified and managed
For practical purposes it is helpful to separately identify critical assets to the delivery
of the water supply activity.
The asset manager applies professional judgement based on experience, considering
risk of failure and lifelines evaluation to identify critical assets. Generally critical
assets are considered to be those assets for which the consequence of failure is
unacceptable given the difficulty of repair and/or the strategic role they play, and
would result in a major disruption or failure in meeting one or more levels of service.
A more robust framework for identification of critical assets is noted in the
improvement programme.
Assets that are considered critical within the Nelson City Council water supply system
are:
Headworks including dams and intakes
Raw water trunk mains
Raw water pump stations
Water Treatment Plant including Clearwater Reservoir
Treated water trunk mains
Treated water pump stations
Reservoirs
With these assets operating treated water will be available in each suburb for
distribution by water tanker or personal collection and by watermain as damaged
reticulation is repaired and brought back into service.
By contrast non-critical assets are relatively quickly and easily repaired or replaced
and their failure do not disrupt a significant number of customers.
Monitoring and intervention strategies are therefore quite different for both categories
of asset. Critical assets attract a greater level of monitoring and ongoing condition
assessment, with physical investigations taking place at a much earlier stage.
Conversely non-critical assets can be expected to undergo a higher level of repair
before complete replacement is considered.
The following shows the nature and timing of interventions for both critical and non-
critical assets.
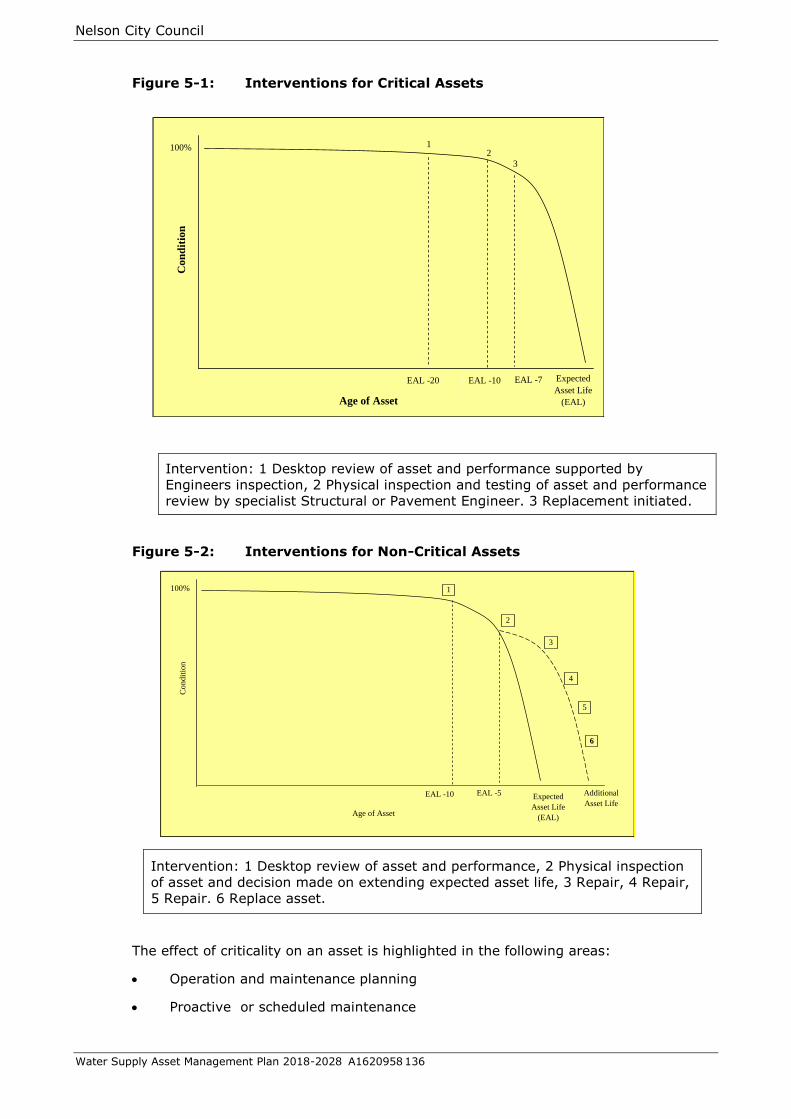
Nelson City Council
Water Supply Asset Management Plan 2018-2028 A1620958 136
Figure 5-1: Interventions for Critical Assets
Intervention: 1 Desktop review of asset and performance supported by
Engineers inspection, 2 Physical inspection and testing of asset and performance
review by specialist Structural or Pavement Engineer. 3 Replacement initiated.
Figure 5-2: Interventions for Non-Critical Assets
Intervention: 1 Desktop review of asset and performance, 2 Physical inspection
of asset and decision made on extending expected asset life, 3 Repair, 4 Repair,
5 Repair. 6 Replace asset.
The effect of criticality on an asset is highlighted in the following areas:
Operation and maintenance planning
Proactive or scheduled maintenance
6
4
5
2
3
100%
Additional
Asset LifeEAL -10 EAL -5
1
Expected
Asset Life
(EAL)Age of Asset
Co
nd
itio
n
2
3
100%
EAL -20 EAL -10EAL -10
1
Expected
Asset Life
(EAL)
EAL -7
Age of Asset
Con
dit
ion

Nelson City Council
Water Supply Asset Management Plan 2018-2028 A1620958 137
Priorities for collecting and determining the required level of reliability of data for
Asset Management systems
Priorities for undertaking condition assessments
Adjusting economic lives with respect to renewal profiles
Prioritising/Deferring renewals
Prioritising expenditure
Prioritising levels of service reviews
A methodology for determining asset criticality to a component level, along with
options, will be determined to integrate criticality into the ongoing operation,
maintenance, renewals and capital programme for the water supply activity.
Risk Implications
Intakes, raw water trunk mains, the Water Treatment Plant, treated water trunk mains
and reservoirs must all be maintained, kept secure and protected from natural hazards
so that they can continue to function through an emergency albeit at a reduced level
of service.
Apart from the need to provide very high levels of continuity to meet customer
expectations, there are good public health reasons for maintaining pressurised mains
at all times.
If watermains are allowed to lose pressure, it is possible that the weight of water in
lower sections of mains will reduce the pressure in higher sections of the mains below
atmospheric pressure. This will cause a vacuum in pipes which can suck back
groundwater into the mains through leaks, or contaminated water from tanks or other
containers not properly isolated from the public supply.
Council has established well defined procedures for shutting down watermains by
Council staff, the Utilities Maintenance Contractor’s staff, and Water Connection
Contractor’s staff.
The objective of the procedures is to minimise the amount of disruption and
inconvenience to customers by using good communication skills and by timing the
work to avoid times of peak demand.
Risk summary
Natural Hazards
Recent work by Council has focussed on natural hazards that might impact on the city,
in particular:
Direct damage from Earthquake shaking;
Damage from liquefaction in susceptible areas;
Damage from Tsunami;
Damage from Flooding and major storm events;
Impact of potential climate change and sea level rise.
The Maitai pipeline between the Dam and Brook Street has been identified as an
extreme risk from damage due to earthquake displacement, windfall trees or slips.

Nelson City Council
Water Supply Asset Management Plan 2018-2028 A1620958 138
The pipeline supplies two thirds of Nelson’s water, is above ground, on a sidling bench
along the hillside. Repair/replacement of, for example, a 5m length of damaged pipe
would take 24-48 hours depending on location (and has proved to be the case in 2008
when high winds brought down trees onto the pipeline). When full, city reservoirs can
hold sufficient water for approximately 24 hours average consumption. The more
usual capacity, allowing for filling time and continuing use, is 8-10 hours of daytime
demand.
Construction of a new buried pipeline between the dam and the Water Treatment Plant
was completed in 2013/14.
Design of a new pipeline between the Water Treatment Plant and Westbrook Terrace
began in 2014/15 with construction completed in 2016/17.
The Roding Water Scheme has low and moderate risks to structures, other than a
200m length of pipe between the screenhouse and the chlorinator house. This pipe is
suspended on piers along the riverbank. A 30m section was washed out in the large
flood of January 1986. Subsequently the pipes were more securely fixed and rock
armouring was constructed in front of the piers. There is a possibility that a similar
large flood could damage the pipe again. Reinstatement would take 2-3 days, during
which time the Maitai river and Tasman District Council would be the only sources
supplying the City. This risk is acceptable given the large storage volume of the Maitai
dam.
Risks posed to the trunk mains range from low to high. The high risk is from
earthquake and storm events where sections of key mains could be damaged.
Presently stocks of repair materials are held to allow single repairs to each main.
Mutual aid would be required from other water supply authorities to reinstate trunk
mains in the event of multiple major breaks.
As a result of the Christchurch earthquakes Council is currently undertaking a seismic
review of the critical elements of the above ground network, starting with the storage
reservoirs and sections of the Maitai Dam to the treatment plant trunk main looking at
the direct impact of earthquake shaking. Future work will focus on near fault proximity
of the network, possible impacts of liquefaction on existing and future infrastructure,
impacts of flooding and the long term planning required as a result of climate change.
Maitai Water Supply Scheme
Because the Maitai Water Supply Scheme is a vulnerable asset, it was designed to
withstand 1 in 100 year seismic and flood events without damage.
Key structures are designed to withstand maximum credible earthquake and probable
maximum flood without collapse (but not without some damage, possibly requiring
decommissioning and major repair work).
Details of the design parameters of the Maitai Water Supply Scheme are contained in
“Nelson City Council Maitai Water Supply Project Design Report”, Tonkin & Taylor
Limited, 1984.
The Maitai pipeline between the Dam and Brook Street has been identified as an
extreme risk from damage due to earthquake displacement or slip.
The pipeline supplies two thirds of Nelson’s water, is above ground, on a sidling bench
along the hillside. Repair/replacement of 5m of pipe would take 24-48 hours, with
town reservoirs holding sufficient water for approximately 8 hours daytime
consumption.

Nelson City Council
Water Supply Asset Management Plan 2018-2028 A1620958 139
Sections of the Maitai pipeline remain close to, or within, the river with some ongoing
risk of flood damage. Identification of these sections and regular inspection and
maintenance are seen to be the best response.
Roding Water Supply Scheme
The Roding Water Scheme poses low and moderate risks to structures other than a
200m length of pipe between the screenhouse and the chlorinator house. This pipe is
suspended on piers along the riverbank. A 30m section was washed out in the large
flood of January 1986. Subsequently the pipes were more securely fixed and rock
armouring was constructed in front of the piers. There is a possibility that a similar
large flood could damage the pipe again. Reinstatement would take 2-3 days, during
which time the Maitai river/dam and Tasman District Council would be the only
sources supplying the City.
A condition assessment of the raw water trunk main was started in 2013/14 and
completed in 2015/16 to allow renewal decisions to be made. A risk assessment of any
new pipeline route will be undertaken as part of any renewal design.
Water Treatment Plant
A portable chlorinator using sodium hypochlorite is held at the Water Treatment Plant.
It is a complete stand-alone unit, run by a small petrol generator. This has the
capacity of dosing 30l/h of sodium hypochlorite, which is sufficient to treat the full
Maitai flow of 37,000m3/day.
A separate Emergency Management Plan has been developed covering Risks and
Actions specific to the Water Treatment Plant.
A portable chlorinator alternatively powered by either a petrol motor or an electric
motor is held at Princes Drive for emergency chlorination using High Test Hypochlorite
(HTH) powder. This has a capacity of dosing 24kg of chlorine per hour. This is
sufficient to treat 12,000 cubic metres of water per hour at 2 grams per cubic metre
(= 2ppm or 2mg per litre).
A small slip occurred to an excavated bank adjacent the plant during the December
2011 rain event. The plant will remain at risk of small surface slips given the
excavations undertaken during construction.
Trunk Mains
Risks posed to the trunk mains range from low to high. The high risk is from
earthquake damage where sections of key mains would be damaged. Presently stocks
of pipes and fittings are held to allow single repairs to each main.
New trunk mains are typically constructed from more ductile materials.
Mutual aid would be required from other water supply authorities to reinstate trunk
mains in the event of multiple major breaks.
Reservoirs
All large reservoirs have been fitted or retrofitted with automatic seismic shut off
valves. When excess flow from the reservoir is detected (such as from a broken outlet
trunk main) the outlet valve is automatically shut and an alarm sent to the Duty
Officer via the SCADA system.
In 2013/14 a project to review the seismic response and protection features of the
reservoirs, intake structures and pipework at the Maitai Dam and the steel siphons on
the Maitai Dam to treatment plant pipeline was initiated. This project has been

Nelson City Council
Water Supply Asset Management Plan 2018-2028 A1620958 140
developed as a result of the damage to the Christchurch water network from the
February 2011 earthquake in that region.
The project has a number of stages which can be modified as results of each stage are
available:
Stage 1- Review the seismicity of the sites and compare with the factors from AS/NZS
1170 Structural Design Actions. This provides a quick view of how design standards
might have changed since the reservoirs were constructed.
Stage 2- Review the on-site construction details of the pipework and valving
arrangements to ensure seismic valves are correctly positioned and pipework details
minimise the risk of water loss in earthquakes. This stage will provide an early benefit
by ensuring the reservoirs can contain stored water under less than ultimate design
level events.
Stage 3- Review the structural adequacy of the reservoir, dams and pipelines. This
stage will look at the structural design and detailing of the major components of the
network and may be undertaken in a number of stages.
Liquefaction
Ongoing hazard investigation in 2013 identified the risk of liquefaction to the network
in parts of Nelson. The initial study was restricted to the Tahunanui area but similar
materials are expected to be part of the Port Nelson reclamation.
The risk to the water network in Tahunanui arises from flotation of chambers and
damage to the mains from extension, shortening and translation arising from ground
movement.
During the operative period of this plan further work will be carried out to better
identify at risk components and current industry response.
Water Quality
Risks posed to water quality range from low to extreme. Completion of The Water
Treatment Plant in August 2004 has reduced the risk to source water to low.
The extreme risk relates to possible backflow from premises into the water
reticulation, thereby putting other consumers in danger. Dual check valves have been
fitted to all residential connections as part of the water meter manifold. These will be
replaced when the water meters are replaced in 2018-2020. Backflow preventors
have been installed at all Nelson City Council drainage pump stations and Council
owned buildings and facilities. However, there are fewer protection devices on
commercial and industrial premises.
Backflow Prevention
The protection of the quality of the water supplied to customers is a vital responsibility
of any water supply authority. While the quality of the water entering the system is
known, chemical or microbiological contamination can occur in some circumstances
from water re-entering the system from consumer’s premises should fittings be
wrongly connected or a temporary vacuum develop in the line. The risk from activities
such as undertakers, doctors and dentist surgeries are readily understood, however
similar issues can also arise in commercial kitchens where food is prepared and
cleaning chemicals are used.
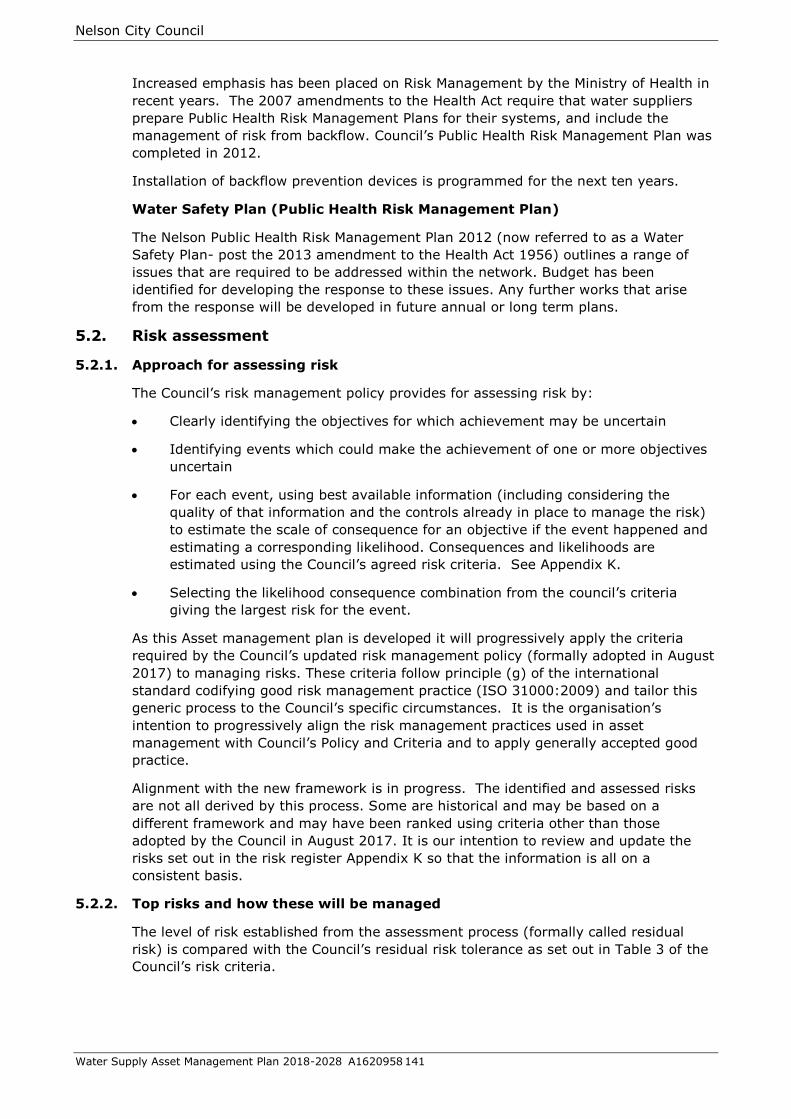
Nelson City Council
Water Supply Asset Management Plan 2018-2028 A1620958 141
Increased emphasis has been placed on Risk Management by the Ministry of Health in
recent years. The 2007 amendments to the Health Act require that water suppliers
prepare Public Health Risk Management Plans for their systems, and include the
management of risk from backflow. Council’s Public Health Risk Management Plan was
completed in 2012.
Installation of backflow prevention devices is programmed for the next ten years.
Water Safety Plan (Public Health Risk Management Plan)
The Nelson Public Health Risk Management Plan 2012 (now referred to as a Water
Safety Plan- post the 2013 amendment to the Health Act 1956) outlines a range of
issues that are required to be addressed within the network. Budget has been
identified for developing the response to these issues. Any further works that arise
from the response will be developed in future annual or long term plans.
5.2. Risk assessment
5.2.1. Approach for assessing risk
The Council’s risk management policy provides for assessing risk by:
Clearly identifying the objectives for which achievement may be uncertain
Identifying events which could make the achievement of one or more objectives
uncertain
For each event, using best available information (including considering the
quality of that information and the controls already in place to manage the risk)
to estimate the scale of consequence for an objective if the event happened and
estimating a corresponding likelihood. Consequences and likelihoods are
estimated using the Council’s agreed risk criteria. See Appendix K.
Selecting the likelihood consequence combination from the council’s criteria
giving the largest risk for the event.
As this Asset management plan is developed it will progressively apply the criteria
required by the Council’s updated risk management policy (formally adopted in August
2017) to managing risks. These criteria follow principle (g) of the international
standard codifying good risk management practice (ISO 31000:2009) and tailor this
generic process to the Council’s specific circumstances. It is the organisation’s
intention to progressively align the risk management practices used in asset
management with Council’s Policy and Criteria and to apply generally accepted good
practice.
Alignment with the new framework is in progress. The identified and assessed risks
are not all derived by this process. Some are historical and may be based on a
different framework and may have been ranked using criteria other than those
adopted by the Council in August 2017. It is our intention to review and update the
risks set out in the risk register Appendix K so that the information is all on a
consistent basis.
5.2.2. Top risks and how these will be managed
The level of risk established from the assessment process (formally called residual
risk) is compared with the Council’s residual risk tolerance as set out in Table 3 of the
Council’s risk criteria.

Nelson City Council
Water Supply Asset Management Plan 2018-2028 A1620958 142
The table sets out priorities for action and at what level of Council decisions should be
taken to either accept (tolerate) the risk or take further actions to manage the risk to
achieve a more acceptable risk level.
In many cases risks have already been acted on by officers in the course of the normal
work of managing the water supply activity and no further action is required.
In other cases specific decisions may be required to either accept the current level of
risk or place actions in this plan to reduce the level of risk.
The following table provides an indication of areas of high residual risk and some
information about how these could be further treated (i.e. further controls
implemented or choices made to reduce risk levels). The complete Risk Resister can
be found in Appendix K.

Nelson City Council
Water Supply Asset Management Plan 2018-2028 A1620958 143
Table 5-1: Water Supply Risk Register
WATER RISK REGISTER
Objectives
Good quality water
A reliable supply of water
Acceptable water pressure
Adequate flows of water
A prompt response to reported network issues
A network that protects the natural environment
Assessed by Phil Ruffell
Analysis: Residual Risk
MOVEMENT FAILURE
CAUSED BY
EARTHQUAKE,
LANDSLIDE OR
SETTLEMENT
TREATMENT PLANT
Worse case: water not available
until temporary chlorination
plant in place and temporary
supply from TDC - 1 day to
organise
Plant has been designed to a high
standard. Regular inspection for likely
problems. Temporary supply from TDCExtreme (5)
Unlikely
(2)High (10) Reduce
Purchase oddition portable chlorine
dosing equipment. Improve supply
options from TDC.
TreatmentsEvent Description Asset Group Consequence Existing Controls
Cu
rren
t R
isk
Level
Identification
Response
Co
nseq
uen
ce
Lik
eli
ho
od

Nelson City Council
Water Supply Asset Management Plan 2018-2028 (A1620958) Page 144
Emergency response
Headworks
The Maitai and Roding headworks are manned by resident caretakers employed by the
Water Treatment Plant contractor. During the caretaker’s absence, resident relief
caretakers are employed.
Water Treatment Plant
The Tantragee Water Treatment Plant is manned during normal working hours. After
hours and on weekends, operators are able to monitor the plant remotely via a
computer dial in system.
The operators also carry cell phones that are linked to the plant control system.
Outside working hours, alarms are immediately sent to cell phones, so that the
operators can respond immediately.
Supervision
The Nelson City Council Utilities operations and maintenance duty staff carry cell
phones on a weekly roster so that at all times a Nelson City Council Operations and
Maintenance staff member is available to respond to major network faults or faults
that have been escalated by the Treatment Contractor or Network Maintenance
Contractor.
Review
The Risk Analysis will be reviewed each year.
In light of the significant seismic activity in Canterbury in 2010/2011 a review of the
water reservoirs and sections of the trunk main for damage prevention and post-event
response has been undertaken in 2013/14. A separate budget item has been included
in the capital works programme for 2018-2028 for any remedial works to the water
reservoirs and raw water trunk main sections that are vulnerable to damage. The
latter are initially expected to be the steel arch siphons from the Maitai Dam to the
water treatment plant.
A more extensive review of the network is required to address the risks identified. This
will be undertaken over the duration of this plan and will support the next review of
the Nelson- Tasman Lifelines initiative.
Potential Risks
Risks can be seen to arise from many areas of the Nelson City Council, both in the
physical aspect for assets and business risks.
Climate Change
Climate change is expected to bring with it more extreme weather in the form of
higher intensity and duration rain events (with associated flood damage) and drought
periods. The issue will be monitored and future asset management plans will be
adjusted to address impacts as they become better understood.
Climate change is an evolving area of research and as such involves significant
assumptions with associated uncertainties. Council seeks to limit the impact of those
uncertainties by relying on expert guidance from Central Government and
programming capital works in a staged fashion. Future upgrades of the water network
are based on ensuring the work is designed for demand and conditions anticipated
during the service life of the asset.
Nelson City Council
Water Supply Asset Management Plan 2018-2028 A1620958 145
5.3. Infrastructure resilience approach
The Maintenance Contractors carry out monthly inspections of assets, which include
identifying any Health and Safety issues.
Internal Audits of Health and Safety practices for construction works on the water
supply assets are carried out periodically.
Development of resilient infrastructure to address climate change
predictions and other natural hazards.
Best advice to date from the Ministry for the Environment and the National
Institute of Water and Atmospheric Studies is that we can anticipate more
extremes in our weather including increased droughts and extreme rainfall
events.
A feature of a largely gravity based run of river supply such as Nelson’s is that
we are dependent upon a continuous flow of clear water in rivers that are some
distance away from the treatment plant. High levels of sediment or organic
material in the water can lead to damage to pipes and infrastructure and
difficulties sterilising the water of harmful bacteria. The distance between intakes
and the treatment plant introduces a vulnerability that comes with very long
pipelines (some of them on above ground benches and within tunnels) that cross
earthquake faults, streams and rivers.
The keys to the resilience of the supply side of the network are:
o The Maitai Dam reservoir. This allows 3.5 million cubic metres of water to
be stored as a buffer against droughts and extended periods of rain that
discolours the rivers.
o The duplicate raw water delivery lines from the Maitai intakes. The original
supply line is largely sited on an above ground bench that follows the
course of the river and the recently installed duplicate line is buried in the
Maitai roadway. These duplicate delivery pipes provide security against
damage to one or the other pipeline.
o The ultra-filtration process at the water treatment plant. The filters in the
water treatment plant can remove dissolved organic material and sediment
and can use a variety of raw water sources. Completion of the renewal of
the existing membranes is programmed for 2018/19.
On the delivery side the network is open to many of the same vulnerabilities,
with above ground trunk mains and pipes crossing earthquake faults, streams
and rivers. In coastal areas liquefaction is recognised as a potential risk to the
network.
Resilience comes in the form of an interlinked network that can direct water
throughout the city when parts may be damaged and water storage reservoirs
that can hold approximately a day’s supply of potable water.
Natural Hazard Security of the network in light of the recent Canterbury
and Kaikoura Earthquakes and storm events, including wider network
hazards- Earthquake fault line and liquefaction.
Recent work by Council has focussed on natural hazards that might impact on
the city, in particular:
o Direct damage from Earthquake shaking;
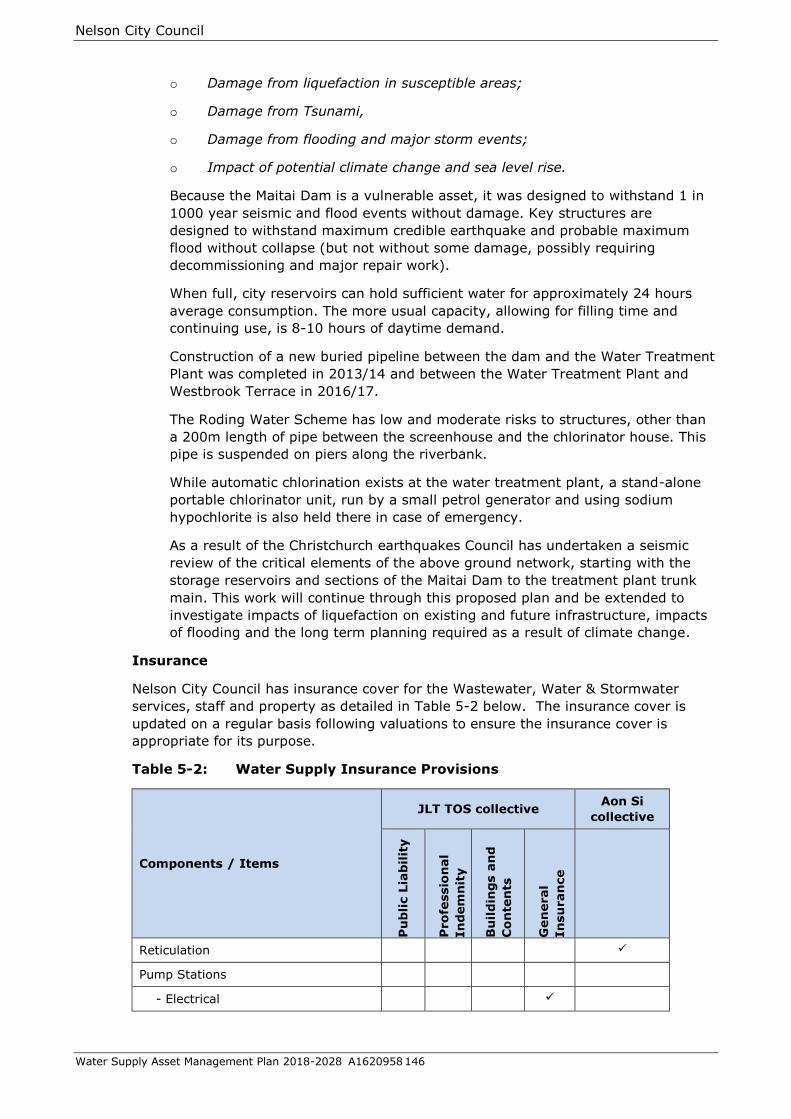
Nelson City Council
Water Supply Asset Management Plan 2018-2028 A1620958 146
o Damage from liquefaction in susceptible areas;
o Damage from Tsunami,
o Damage from flooding and major storm events;
o Impact of potential climate change and sea level rise.
Because the Maitai Dam is a vulnerable asset, it was designed to withstand 1 in
1000 year seismic and flood events without damage. Key structures are
designed to withstand maximum credible earthquake and probable maximum
flood without collapse (but not without some damage, possibly requiring
decommissioning and major repair work).
When full, city reservoirs can hold sufficient water for approximately 24 hours
average consumption. The more usual capacity, allowing for filling time and
continuing use, is 8-10 hours of daytime demand.
Construction of a new buried pipeline between the dam and the Water Treatment
Plant was completed in 2013/14 and between the Water Treatment Plant and
Westbrook Terrace in 2016/17.
The Roding Water Scheme has low and moderate risks to structures, other than
a 200m length of pipe between the screenhouse and the chlorinator house. This
pipe is suspended on piers along the riverbank.
While automatic chlorination exists at the water treatment plant, a stand-alone
portable chlorinator unit, run by a small petrol generator and using sodium
hypochlorite is also held there in case of emergency.
As a result of the Christchurch earthquakes Council has undertaken a seismic
review of the critical elements of the above ground network, starting with the
storage reservoirs and sections of the Maitai Dam to the treatment plant trunk
main. This work will continue through this proposed plan and be extended to
investigate impacts of liquefaction on existing and future infrastructure, impacts
of flooding and the long term planning required as a result of climate change.
Insurance
Nelson City Council has insurance cover for the Wastewater, Water & Stormwater
services, staff and property as detailed in Table 5-2 below. The insurance cover is
updated on a regular basis following valuations to ensure the insurance cover is
appropriate for its purpose.
Table 5-2: Water Supply Insurance Provisions
Components / Items
JLT TOS collective Aon Si
collective
Pu
bli
c L
iab
ilit
y
Pro
fessio
nal
In
dem
nit
y
Bu
ild
ing
s a
nd
Co
nte
nts
Gen
eral
In
su
ran
ce
Reticulation
Pump Stations
- Electrical

Nelson City Council
Water Supply Asset Management Plan 2018-2028 A1620958 147
Components / Items
JLT TOS collective Aon Si
collective
Pu
bli
c L
iab
ilit
y
Pro
fessio
nal
In
dem
nit
y
Bu
ild
ing
s a
nd
Co
nte
nts
Gen
eral
In
su
ran
ce
- Mechanical
- Structural
Staff
Council Vehicles
Private property damage related to
stormwater damage
Indicates coverage by that particular insurance type
Aon South Island (SI) collective
Nelson City Council is a member of an Aon South Island collective of councils from 1
July 2017 after withdrawing from the Local Authority Protection Programme Disaster
Fund.
In the event of a natural disaster, the insurance cover will generally cover 40% of the
reinstatement cost of infrastructure assets that have been damaged and declared for
cover by the Aon SI collective.
The Aon SI collective is a shared program limit, Council has a sub-limit of $160 million
plus AICOW – Additional Increased Cost of Working – this allows for additional costs to
be paid over and above normal operating costs during a loss. The $160m was
deemed to be the mean 1 in 750 ARI (annual return interval) loss estimate.
Emergency Management
Civil Defence and Emergency Response Plans
The following documents are available for guidance in the Civil Defence and
Emergency Management:
Civil Defence Emergency Management Plan.
Nelson City Council Emergency Procedures Manual - exercises are carried out
on a six monthly basis to ensure all staff are familiar with the procedures.
Section 64 of the Civil Defence Emergency Management Act 2002 requires Local
Authorities to:
64 Duties of local authorities
(1) A local authority must plan and provide for civil defence emergency management
within its district.
(2) A local authority must ensure that it is able to function to the fullest possible
extent, even though this may be at a reduced level, during and after an emergency”
Local Civil Defence Emergency Management Arrangements
Nelson-Tasman Civil Defence Emergency Management Group is a joint committee of
both Nelson City Council and Tasman District Council.
Nelson City Council
Water Supply Asset Management Plan 2018-2028 A1620958 148
The Nelson Tasman Civil Defence Emergency Management Group Plan provides for an
‘all hazards’ approach to emergency management planning and activity within the Civil
Defence Emergency Management Group area for Nelson City and Tasman District.
The Civil Defence Emergency Management Group Plan states the civil defence
emergency management structure and systems necessary to manage those hazards,
including the arrangements for declaring a state of emergency in the Group’s area.
The Group Plan is the primary instrument whereby the community identifies and
assesses its hazards and risks, and decides on the acceptable level of risk to be
managed and how it is to be managed.
Lifelines Responsibility
Section 60 of the Civil Defence Emergency Management Act 2002 requires Local
Authorities to support lifeline utilities as follows:
60 Duties of lifeline utilities
Every lifeline utility must—
(a) ensure that it is able to function to the fullest possible extent, even
though this may be at a reduced level, during and after an emergency
Nelson City Council participated in the Nelson-Tasman Engineering Lifelines project as
a life line utility.
Water Supply Mutual Aid Plan
The Nelson City Council is a signatory to the Water Supply Mutual Aid Plan
administered by the Water Managers’ Group of Water New Zealand (New Zealand
Water and Wastes Association).
The purpose of the agreement is to:
Provide a framework for administration and Water Sector co-ordination;
Create a central register of contact details of personnel with designated
authority;
Create a central register of approximate resource levels available at each of the
Agreement signatories (personnel, equipment, specialist materials);
Define protocols and principles for requesting and providing assistance during an
emergency;
Set a policy for charging and reimbursement of costs;
Address liability and indemnity issues.
The following table indicates the status of the stormwater schemes in the areas of Risk
Reduction, Readiness, Response and Recovery.
Table 5-3: Risk Reduction, Readiness, Response and Recovery Status
Activities
Required
Description Stormwater Status
Risk
Reduction
Identifying hazards, describing risks, and
taking actions to reduce the probability or
consequences of potential events.
Asset Management
Plan Risk Register
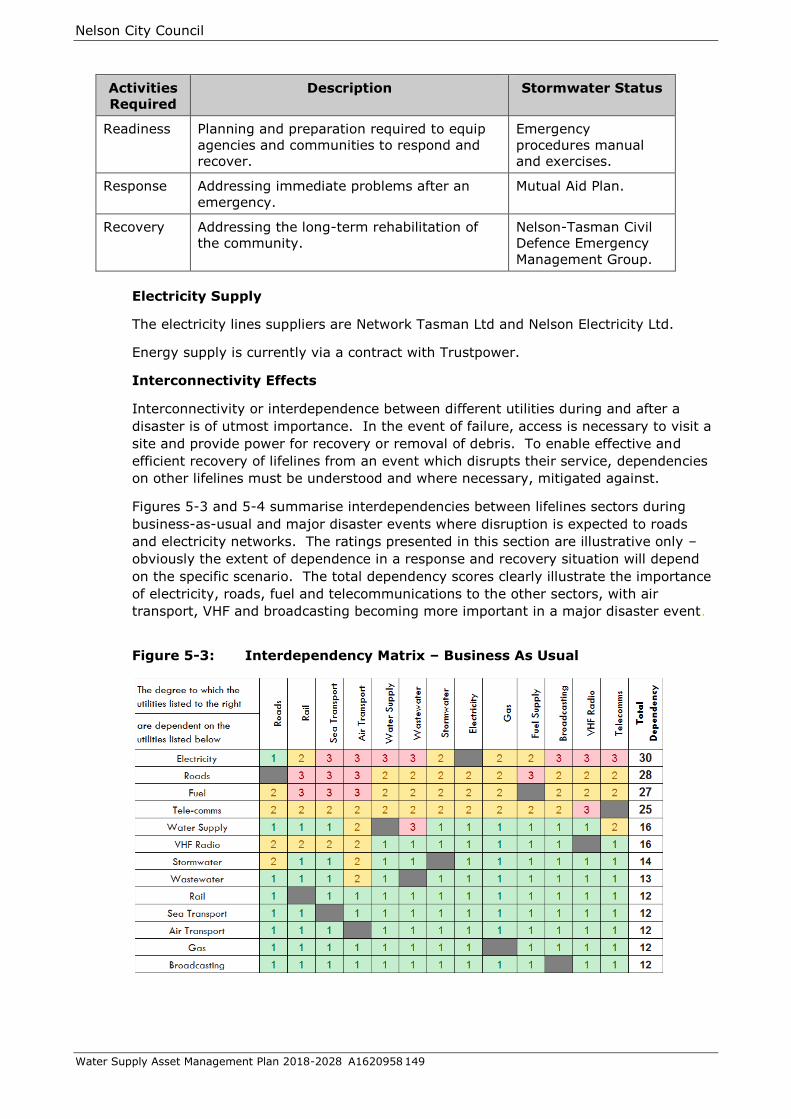
Nelson City Council
Water Supply Asset Management Plan 2018-2028 A1620958 149
Activities
Required
Description Stormwater Status
Readiness Planning and preparation required to equip
agencies and communities to respond and
recover.
Emergency
procedures manual
and exercises.
Response Addressing immediate problems after an
emergency.
Mutual Aid Plan.
Recovery Addressing the long-term rehabilitation of
the community.
Nelson-Tasman Civil
Defence Emergency
Management Group.
Electricity Supply
The electricity lines suppliers are Network Tasman Ltd and Nelson Electricity Ltd.
Energy supply is currently via a contract with Trustpower.
Interconnectivity Effects
Interconnectivity or interdependence between different utilities during and after a
disaster is of utmost importance. In the event of failure, access is necessary to visit a
site and provide power for recovery or removal of debris. To enable effective and
efficient recovery of lifelines from an event which disrupts their service, dependencies
on other lifelines must be understood and where necessary, mitigated against.
Figures 5-3 and 5-4 summarise interdependencies between lifelines sectors during
business-as-usual and major disaster events where disruption is expected to roads
and electricity networks. The ratings presented in this section are illustrative only –
obviously the extent of dependence in a response and recovery situation will depend
on the specific scenario. The total dependency scores clearly illustrate the importance
of electricity, roads, fuel and telecommunications to the other sectors, with air
transport, VHF and broadcasting becoming more important in a major disaster event.
Figure 5-3: Interdependency Matrix – Business As Usual

Nelson City Council
Water Supply Asset Management Plan 2018-2028 A1620958 150
Figure 5-4: Interdependency Matrix – During / Post Disaster Event
3: Required for Service to Function, 2: Important but can partially function and/or has full backup, 1: Minimal requirement for service to function.
Succession Planning
Succession planning within any business is considered necessary to reduce the risk
associated with staff leaving the organisation. Succession planning allows institutional
knowledge to be passed on, and assists in ensuring continuity of organisational
culture.
Currently succession planning is largely by way of multiple staff members involved in
administering the activity and detailing strategies for the future in asset management
plans. In order to ensure greater effectiveness there is a need to improve planning
and recording of strategies over the next three years.
Financial summary
This Section sets out financial statements, funding strategy, depreciation forecast and
charges for the Water supply Services in Nelson City.
The Local Government Act 2002 (Part 6 Subpart 3) requires local authorities to
manage their finances “prudently and in a manner that promotes the current and
future interests of the community. This implies compliance with applicable Financial
Reporting Standards, which include Public Benefit Entity International Public Sector
accounting Standards (PBE IPSAS).
This Asset Management Plan provides the basis for meeting these requirements.
6.1. Financial statements and projections
Definition of Expenditure Categories
All expenditure on infrastructure assets falls into one of three categories:
Operations and Maintenance Expenditure
Capital Expenditure –Renewal/Replacement

Nelson City Council
Water Supply Asset Management Plan 2018-2028 A1620958 151
Capital Expenditure –Creation/Acquisition/Augmentation for both level of service
compliance and growth

Nelson City Council
Water Supply Asset Management Plan 2018-2028 (A1620958) Page 152
Table 6-1: Water Expenditure Years 1-10 of the 2018/28 Long Term Plan ($000)
Account
2018/19 LTP
Final Uninflated
2019/20 LTP
Final Uninflated
2020/21 LTP
Final Uninflated
2021/22 LTP
Final Uninflated
2022/23 LTP
Final Uninflated
2023/24 LTP
Final Uninflated
2024/25 LTP
Final Uninflated
2025/26 LTP
Final Uninflated
2026/27 LTP
Final Uninflated
2027/28 LTP
Final Uninflated
7005 Water Supply 14,351.2 11,437.5 11,000.5 9,567.7 14,991.7 15,898.1 11,142.9 10,404.2 10,393.4 9,372.1
Expenses 5,530.6 5,584.7 5,641.6 5,606.9 5,655.1 5,744.7 5,760.6 5,691.8 5,698.1 5,686.8
Base Expenditure 3,299.0 3,378.0 3,379.2 3,480.2 3,541.4 3,505.3 3,569.4 3,618.1 3,599.4 3,588.1
Unprogrammed Expenses 1,925.0 1,950.0 1,950.0 1,950.0 1,950.0 1,950.0 1,900.0 1,900.0 1,900.0 1,850.0
Programmed Expenses 306.6 256.7 312.4 176.7 163.7 289.4 291.2 173.7 198.7 248.7
Capital Expenditure 8,820.6 5,852.8 5,358.9 3,960.9 9,336.6 10,153.3 5,382.3 4,712.4 4,695.3 3,685.3
Renewals 7,164.2 3,519.0 3,208.5 2,087.3 3,149.9 3,986.4 3,736.4 2,164.9 2,164.9 2,234.9
Capital Growth 778.0 1,278.0 778.0 940.2 778.0 1,090.2 1,010.2 2,060.2 2,043.0 963.0
700576152801. NCC - TDC Link 0.0 0.0 0.0 0.0 0.0 0.0 0.0 100.0 100.0 20.0
700576203165. water pump stations - upgrades 0.0 0.0 0.0 0.0 0.0 100.0 20.0 20.0 1,000.0 0.0
700576302809. Water Treatment Plant Upgrades 0.0 0.0 0.0 0.0 0.0 162.2 162.2 162.2 165.0 165.0
700576502313. Capital: Atawhai Res & pump Ma 0.0 0.0 0.0 162.2 0.0 0.0 0.0 0.0 0.0 0.0
700576503231. Ngawhatu Valley high level reservoir 0.0 0.0 0.0 0.0 0.0 50.0 50.0 1,000.0 0.0 0.0
70057691. Vested Assets 778.0 778.0 778.0 778.0 778.0 778.0 778.0 778.0 778.0 778.0
700576913164. Suffolk Road (Saxton to Ngawhatu) water upgrade 0.0 150.0 0.0 0.0 0.0 0.0 0.0 0.0 0.0 0.0
700576913166. Suffolk Road to Hill Street Trunk water main 0.0 350.0 0.0 0.0 0.0 0.0 0.0 0.0 0.0 0.0
Capital Increased LOS 878.4 1,055.9 1,372.4 933.5 5,408.7 5,076.8 635.8 487.4 487.4 487.4
700579151058. Capital: Pressure Reduction 54.1 0.0 54.1 0.0 54.1 0.0 54.1 0.0 55.0 0.0
700579151064. Capital: Ridermains 167.6 167.6 167.6 59.5 59.5 59.5 59.5 59.5 59.5 59.5
700579151081. System Improvements 64.9 64.9 64.9 54.1 0.0 54.1 0.0 55.0 0.0 55.0
700579151168. Capital: Backflow Prevention 162.2 162.2 162.2 162.2 162.2 162.2 162.2 162.2 162.2 162.2
700579152140. Capital: Atawhai Trunkmain 10.0 44.1 54.1 102.7 1,800.0 1,800.0 0.0 0.0 0.0 0.0
700579152800. Pressure Enhancement 0.0 62.2 108.1 100.0 0.0 0.0 0.0 0.0 0.0 0.0
700579162131. Fire Flow Upgrades 0.0 0.0 0.0 0.0 25.0 25.0 25.0 0.0 0.0 0.0
700579162802. DMA establishment 50.0 50.0 50.0 0.0 0.0 0.0 0.0 0.0 0.0 0.0
700579162803. Water Loss Reduction Programme 216.3 216.2 216.2 216.2 216.2 216.2 216.2 100.0 100.0 100.0
700579162807. Natural Hazards Risk Remediation 58.1 108.1 108.1 50.0 0.0 0.0 0.0 0.0 0.0 0.0
700579501180. Other Sundry: Maitai Planting 10.8 10.8 10.8 10.8 10.8 10.8 10.8 10.8 10.8 10.8
700579502314. Capital: Atawhai No.2 Reservoi 50.0 50.0 300.2 50.0 1,081.0 2,702.5 0.0 0.0 0.0 0.0
700579502810. Dam Upgrades 50.0 100.0 100.0 108.1 2,000.0 108.1 108.1 0.0 0.0 0.0
700579503142. Maitai Pipeline Hazard mitigation 0.0 0.0 0.0 0.0 0.0 0.0 0.0 100.0 100.0 100.0
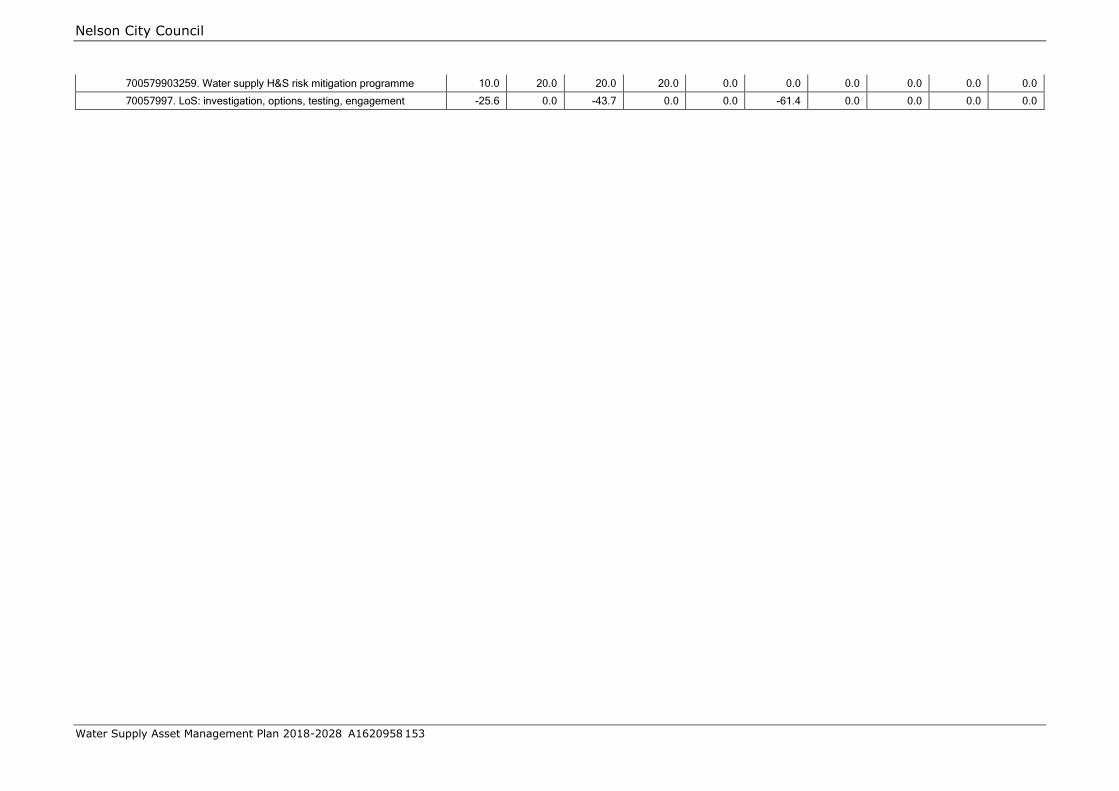
Nelson City Council
Water Supply Asset Management Plan 2018-2028 A1620958 153
700579903259. Water supply H&S risk mitigation programme 10.0 20.0 20.0 20.0 0.0 0.0 0.0 0.0 0.0 0.0
70057997. LoS: investigation, options, testing, engagement -25.6 0.0 -43.7 0.0 0.0 -61.4 0.0 0.0 0.0 0.0

Nelson City Council
Water Supply Asset Management Plan 2018-2028 A1620958 154
Figure 6-1: Proposed Expenditure
Expenditure for the water supply activity varies over the term of the plan. Renewals
expenditure is high in 2018/19 with the renewal of the last two trains of membranes.
The slight spike in year 2021/22 and 2022/23 relates to two larger construction
projects (Atawhai storage reservoir and Maitai Dam aeration) coinciding in the same
years. The spikes in 2026/27 and 2027/28 are due to the proposed upgrade works at
the water treatment plant to install a primary clarifier if demand requires.
6.1.1. Trends from the previous 2 – 3 years
Figure 6-2: Recent Expenditure
0
2,000
4,000
6,000
8,000
10,000
12,000
14,000
16,000
18,000
18/19est
19/20est
20/21est
21/22est
22/23est
23/24est
24/25est
25/26est
26/27est
27/28est
Water
OPEX Renewals Growth LOS enhancments
0
2,000
4,000
6,000
8,000
10,000
12,000
14,000
16,000
15/16 actual 16/17 actual 17/18 budget
Water
OPEX Renewals Growth LOS enhancments
Nelson City Council
Water Supply Asset Management Plan 2018-2028 A1620958 155
6.2. Funding strategy
In determining how activities will be funded local authorities are required to take the
following into consideration:
The contribution to the achievement of Community Outcomes (strategic
alignment)
Beneficiaries of each activity (beneficiary/user pays principles)
The period over which benefits from the activity will occur (intergenerational
equity issues)
The extent to which identifiable individuals contribute to the need to incur
expenditure (exacerbator and user pays principles)
The costs and benefits of funding the activity compared to other activities
(cost/benefit, prioritisation principles)
The impact of funding the activity on the wellbeing of the community (ability to
pay principles)
Contributions
The Resource Management Plan has set a financial contribution so that sub-dividers,
developers and new industry pay their share of the capital expenditure for reserves
purposes each year as part of the costs of growth.
From 1 July 2006 Development Contributions have been collected under the Local
Government Act 2002 as detailed in the Long Term Plan.
The remaining costs of collecting, treating and delivering water are funded from user
charges.
Water by Meter User Charges
From 1 July 1999 universal metering has been in operation and there is no charge in
the general rates for the supply of water.
The Water Pricing Structure Working Party was convened in 2003 and made its
recommendation to the Infrastructure Committee which in turn recommended the
pricing structure to the full Council meeting on 18 December 2003.
The objective of the pricing structure is to:
Encourage water conservation.
Be fair to residential and commercial water users.
Be simple to administer and readily understood by the public.
Recognise the opportunity value and fire-fighting value of the water supply
system and the benefits this provides to empty sections and houses.
Provide regular cash flow while avoiding excessive reading and invoicing costs.
The key points in the pricing structure are:
A house or section without a water connection not be charged a fee.
Nelson City Council
Water Supply Asset Management Plan 2018-2028 A1620958 156
All properties on water by meter (including empty sections) should pay a
minimum annual charge.
The fixed costs are approximately 90% and variable costs approximately 10% of
the total costs of operating the water supply. If the minimum annual charge was
set to recover 90% of costs there would be little incentive to conserve water.
Therefore the minimum annual charge was set to recover only 30% of the total
costs. This encourages water conservation, but still means that low (or no)
volume users do pay a share of the opportunity and fire-fighting value of the
supply.
There being no “entitlement to free water for low usage” associated with the
minimum annual charge.
The minimum annual charge (collected as a daily charge) be set to recover 30%
of the estimated water by meter revenue requirement, and that the remaining
70% be recovered as user charges.
The revenue required from Major Water Users with Even Demand (including
financial and operating costs) be calculated based on the value of water supply
assets used by those users and allocated as a percentage of peak summer
demand for assets sized for peak demand (part of the treatment plant), and as a
percentage of water used for assets sized for water volume.
The charges for Bulk Water Users over 10,000m3 per year, where there is
predominantly summer irrigation, be at the average of the 0-10,000m3 and the
10,000-100,000m3 rates. This recognises that these Users contribute to the
summer peak, but do not use a large part of the reticulation.
The charges for usage in the 10,000-100,000m3 band and 100,000+m3 band be
set to recover the revenue calculated above and in the same ratios as used in
previous years.
A revenue issue may arise in the future, if the water reuse project involving
treated water from Bells Island is developed. This project would supply irrigation
water to the Tahunanui / Stoke area and impact on water sales currently made
for this purpose.
Creation/Acquisition/Augmentation
Nelson City Council will review funding requirements and strategies to achieve
equitable funding of upgrade works through development contributions.
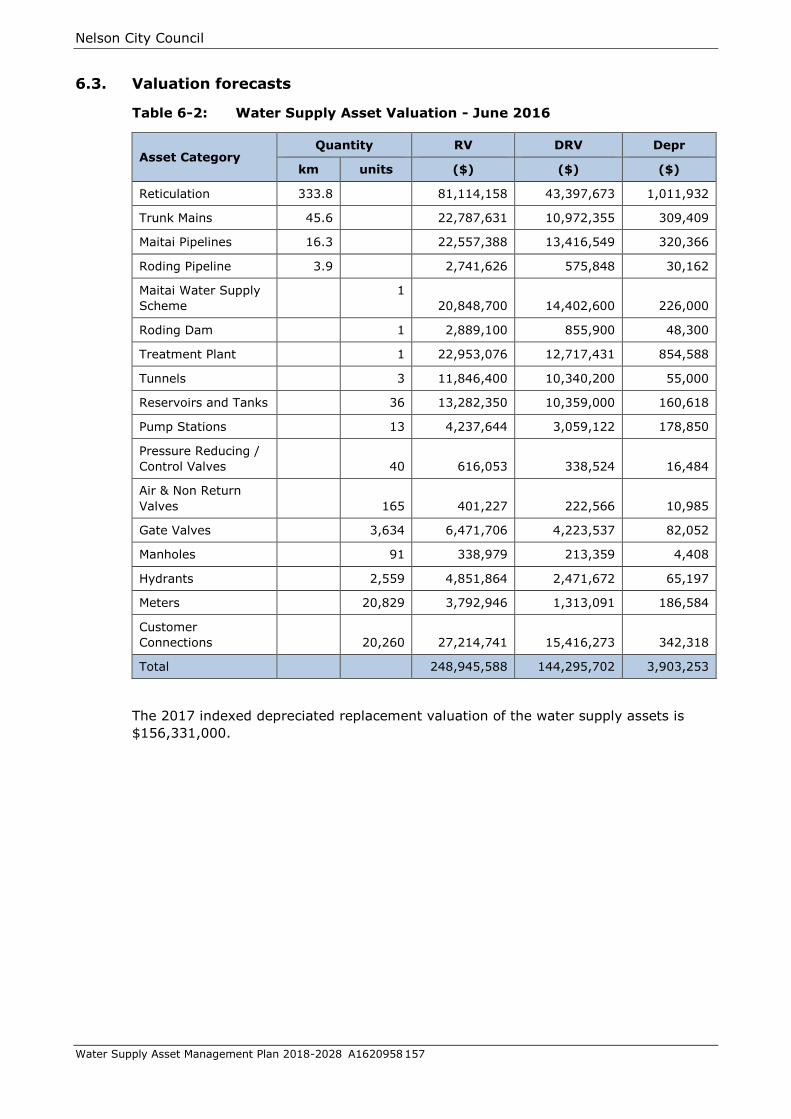
Nelson City Council
Water Supply Asset Management Plan 2018-2028 A1620958 157
6.3. Valuation forecasts
Table 6-2: Water Supply Asset Valuation - June 2016
Asset Category Quantity RV DRV Depr
km units ($) ($) ($)
Reticulation 333.8 81,114,158 43,397,673 1,011,932
Trunk Mains 45.6 22,787,631 10,972,355 309,409
Maitai Pipelines 16.3 22,557,388 13,416,549 320,366
Roding Pipeline 3.9 2,741,626 575,848 30,162
Maitai Water Supply
Scheme
1
20,848,700 14,402,600 226,000
Roding Dam 1 2,889,100 855,900 48,300
Treatment Plant 1 22,953,076 12,717,431 854,588
Tunnels 3 11,846,400 10,340,200 55,000
Reservoirs and Tanks 36 13,282,350 10,359,000 160,618
Pump Stations 13 4,237,644 3,059,122 178,850
Pressure Reducing /
Control Valves 40 616,053 338,524 16,484
Air & Non Return
Valves 165 401,227 222,566 10,985
Gate Valves 3,634 6,471,706 4,223,537 82,052
Manholes 91 338,979 213,359 4,408
Hydrants 2,559 4,851,864 2,471,672 65,197
Meters 20,829 3,792,946 1,313,091 186,584
Customer
Connections 20,260 27,214,741 15,416,273 342,318
Total 248,945,588 144,295,702 3,903,253
The 2017 indexed depreciated replacement valuation of the water supply assets is
$156,331,000.
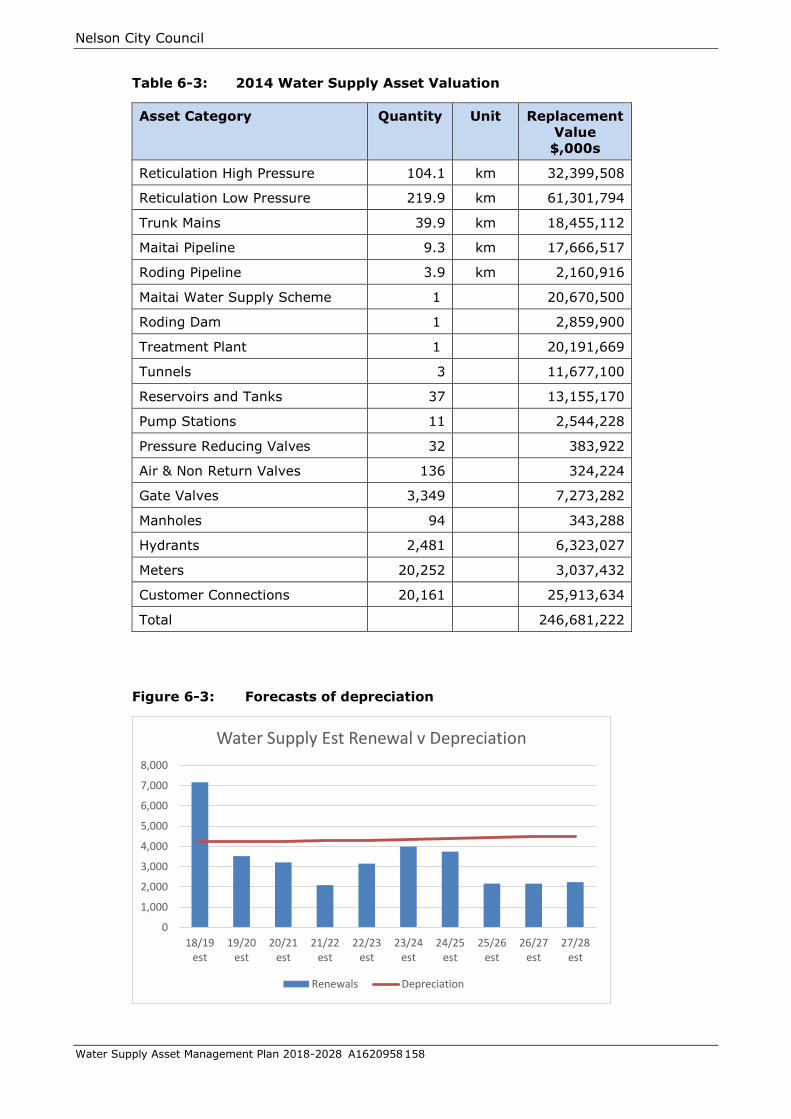
Nelson City Council
Water Supply Asset Management Plan 2018-2028 A1620958 158
Table 6-3: 2014 Water Supply Asset Valuation
Asset Category Quantity Unit Replacement
Value
$,000s
Reticulation High Pressure 104.1 km 32,399,508
Reticulation Low Pressure 219.9 km 61,301,794
Trunk Mains 39.9 km 18,455,112
Maitai Pipeline 9.3 km 17,666,517
Roding Pipeline 3.9 km 2,160,916
Maitai Water Supply Scheme 1 20,670,500
Roding Dam 1 2,859,900
Treatment Plant 1 20,191,669
Tunnels 3 11,677,100
Reservoirs and Tanks 37 13,155,170
Pump Stations 11 2,544,228
Pressure Reducing Valves 32 383,922
Air & Non Return Valves 136 324,224
Gate Valves 3,349 7,273,282
Manholes 94 343,288
Hydrants 2,481 6,323,027
Meters 20,252 3,037,432
Customer Connections 20,161 25,913,634
Total 246,681,222
Figure 6-3: Forecasts of depreciation
0
1,000
2,000
3,000
4,000
5,000
6,000
7,000
8,000
18/19est
19/20est
20/21est
21/22est
22/23est
23/24est
24/25est
25/26est
26/27est
27/28est
Water Supply Est Renewal v Depreciation
Renewals Depreciation

Nelson City Council
Water Supply Asset Management Plan 2018-2028 A1620958 159
6.4. Key assumptions made in financial forecasts
Council is required to identify the significant forecasting assumptions it has made in
preparing its ten year Long Term Plan. Assumptions are necessary to allow Council to
plan for expenditure and costs over the next ten years. They are the best reasonable
assessment made on the basis of currently available information.
The Nelson Long Term Plan details possible and actual significant forecasting
assumptions and uncertainties relating to Nelson City Council activities.
As well as the general assumptions that apply as the basis for forecasting budgets
across Council’s work, the following assumptions apply specifically to water supply:
Council assumes renewals will be continued at a rate that is sustainable, based
on consideration of both resource and financial aspects
It is assumed that Nelson’s climate will remain substantially unchanged for the
next decade, with enough rain to meet our water needs. Factors such as climate
change and population growth will receive increased analysis as the
Infrastructure Strategy is reviewed in future years
It is assumed that new resource consents for the existing sources of water
supply and abstraction volumes will be granted
It is assumed that there will be reductions in water losses
Water supply is expected to continue to be funded from water charges and,
consistent with Council’s financial policies, most of the capital expenditure will be
funded from borrowings
Council will provide education and promotion of the importance of water
conservation; however the demand for water is expected to continue to primarily
be managed through Council’s water charging system
The service delivery strategy is expected to be sustained for the term of this
Long Term Plan
Existing treatment plant membranes will continue to operate satisfactorily.
6.5. Forecast reliability and confidence
Table 6-4 below details the possible and actual significant forecasting assumptions and
uncertainties relating to the Nelson City Council water supply system.
Table 6-4: Significant Forecasting Assumptions and Uncertainties
No. Assumption Degree of
Risk or
Uncertainty
Likely Impact if the
Assumption is (or is Not)
Realised or is Not
Acceptable
1 Interest rates for new loans raised or
existing debt refinanced during the
years are forecasted in the range of
5%.
Low Level of debt is moderate.
Interest costs are not expected
to vary significantly.
2 Growth is based on figures provided by
statistics New Zealand and Nelson City
Council growth projections.
Low Any significant increase in the
growth may require upgrading
of reticulation to occur at an

Nelson City Council
Water Supply Asset Management Plan 2018-2028 A1620958 160
No. Assumption Degree of
Risk or
Uncertainty
Likely Impact if the
Assumption is (or is Not)
Realised or is Not
Acceptable
earlier stage than presently
proposed.
3 The actual remaining lives of assets
will not deviate significantly from those
contained in the asset valuation.
Medium Changes in estimated asset
lives could lead to significant
changes in asset renewal
projections, depreciation and
renewal budgets.
4 The replacement values are a realistic
cost and have taken into consideration
engineering fees, resource consents
etc.
Low Replacement values have gone
through a review process.
5 Upgrade/capital estimates are as
follows:
Concept +/- 30%
Initial & Planning +/-10 to +/- 25%
Delivery/Construction +/- 5%
Projects of unusual complexity or
presenting landowner / regulatory
issues that cannot be quantified and
such that estimating with accuracy is
difficult, may lie outside these figures.
Medium Costs of upgrades are
estimated only without detailed
project planning.
6 Maintenance cost of service for
Reticulation and Treatment will be
within -5% and +10% of budget.
Low Historically maintenance costs
% variations for reticulation
have been low.
7 Depreciation based on estimated
useful lives not on condition of
pipework.
Medium If proposed condition
assessments indicate that
Councils mains have decreased
useful lives, depreciation
presently taken will be less
than that required for
replacement.

Nelson City Council
Water Supply Asset Management Plan 2018-2028 A1620958 161
Asset management practices
The goal of infrastructure asset management is to:
“Deliver the required level of service to existing and future customers in a sustainable
and cost effective manner.”
A formal approach to the management of assets is essential in order to provide
services in the most cost-effective manner, and to demonstrate this to customers and
other stakeholders. The benefits of improved asset management are:
Improved governance and accountability
Enhanced service management and customer satisfaction
Improved risk management
Improved financial efficiency
More sustainable decisions
The key elements of Asset Management are as shown below:
Infrastructure Asset Management
Understanding and meeting the
impact if growth through demand
management and infrastructure
management
Providing a defined Level of
Service and monitoring
performance
Having long term cost effective
management strategies
Having a lifecycle approach
Improvement in asset
management practices to the
desired AM level
Sustainable use of physical
resources
Managing risk associated with
asset failures

Nelson City Council
Water Supply Asset Management Plan 2018-2028 A1620958 162
7.1. Asset management leadership and structure
7.2. Management systems
A management system is defined as the set of procedures an organisation needs to
follow in order to meet its objectives.
Quality Management
The quality management system is process management based on a quality cycle. It
is aligned with ISO 9000, and benchmarked against this standard each year. The
focus of the Quality Management programme is to improve the effectiveness and
efficiency with which Nelson City Council deliver services to the community; ensuring
processes deliver their required outcomes, which are aligned with community
outcomes and organisational goals. Required outcomes are typically defined in terms
of the core key performance areas - customer satisfaction, legislative compliance, and
management of resources (budget and staff time), and employee engagement.
Group Manager
Infrastructure
Steering group
Senior Leadership Team:
Group Manager Strategy and Environment
Group Manager Corporate Services
Group Manage community Services
Group Manager Infrastructure
Senior Strategic Adviser
Senior Asset
Engineers
(Asset
Management
Planning)
Support Services:
GIS Team
Risk and
Procurement
Analyst
Accounting
Contractor
(data)
External
Advisors
Contractors
Roading and
Utilities
Business Unit
Capital
Projects
Business Unit
Contract
Supervisors
(Operations
&
Maintenance)

Nelson City Council
Water Supply Asset Management Plan 2018-2028 A1620958 163
Quality Management Lifecycle:
Process management measures, reports and reviews the outcomes
REQUIREMENT FORCHANGE
PROCEDUREan agreed way of doing things, with required outcomes
PROCESSthe way our people
do things
People involved in the process identify the requirement for change based
on process management
Facilitie
s
Fundin
g
Info
rmation
People
Activitie
s
Policie
s
Changes to procedure in order to
meet required outcomes
Changes in definition of
required outcomes
ADAPTIVE CHANGE
1: Define the Process: Document the Procedure
NCC’s Quality Management system (QMS) is a process-based approach. A process is a set of interrelated or
interacting activities which transforms inputs into outcomes. Required outcomes are achieved more efficiently when
activities and related resources are managed as a process.
A procedure is an agreed way to carry out a process. A procedure includes and defines:
Required outcomes from the procedure (most important)
Definition of the required outcome forms the “quality” standard for the process
o Agreement of the required outcomes tells us what would success look like (our KPIs)
We need to ensure that required outcomes are recorded so that they can be measured later - not just what
needs to be achieved, but when, and how many, and what exceptions
People involved in the procedure (equally important)
Definition of all of the people involved in all aspects of the process, including the customer, those “doing stuff”,
those “accountable for stuff” and any suppliers directly involved in the process
Are the people involved the most effective, most efficient way to do this?
Activities comprising the procedure
Defining all the activities required and undertaken to achieve the required outcomes
Are all the activities undertaken necessary, are they in the right order, are the right people doing them, is this
the most effective, most efficient way to do this?
Enablers that support the procedure
The enablers of the process include things like information (and information systems), policies (and culture),
funding and facilities. These should be documented as part of the process
Documenting the procedure (activities involved, who does what when, what funding and resources are
required) provides a written procedure to support the process.
Processes work together to form end-to-end procedures:
Managing interrelated processes improves the organisation's effectiveness and efficiency in achieving its objectives.
This means consideration of how processes interrelate to form end-to-end procedures with overall outcomes. The

Nelson City Council
Water Supply Asset Management Plan 2018-2028 A1620958 164
1: Define the Process: Document the Procedure
outputs from one procedure often form the trigger for the next procedure. End-to-end procedures have their own
required outcomes.
2: Manage the procedure: Measure, Report and Review
Measuring whether the procedure is being followed and whether outcomes are being met This enables us
to apply a factual approach to decision making and to the need for change.
Measure how the process is going – is the procedure being followed – are interim goals being met? Measure the
outputs of the process – were these met and did these meet the required outcomes?
Reporting tells us whether procedures are being followed and outcomes being met
We need to not just know whether outcomes are being met, but to “know that we know”
Reporting gives us options for remediation or consequences of non-conformity
The procedures and the outcomes are subject to review by those responsible and accountable for the
process
Why did we really do this? What did we think we would gain? Did we get that result?
Are we doing the right things? Are we doing them the right way, and are we doing this consistently? Are we
getting them done well? Are we getting the benefits?
Review provides a tool for continual improvement of the process by re-examination and change to the required
outcome, or by change in the process to achieve the required outcome
3: Improve the procedure: Requirement for Change, then Adaptive Change
Procedure are subject to adaptive improvement to the process and the required outcomes.
People involved with processes identify and initiate change:
Are the required outcomes still required? Is there a requirement for change?
Are the activities and people defined in this process the best way to achieve these outcomes?
Are things being done in the right order, and by the right people, in the right places? Is the process being
followed? Does everyone do it the way that we’ve agreed?
Is there anything listed that isn’t contributing? Is there something that would contribute more?
Project management
NCC processes for project management require that time, cost, and quality/scope
objectives are agreed before project delivery begins. Project management is focussed
on ensuring that the desired benefits, as per the agreed business case, are
delivered. Project management processes are based on the principles of the
PRINCE2TM method. Fiscal approvals, and change approvals are in line with Council
delegations and Officer delegated authority
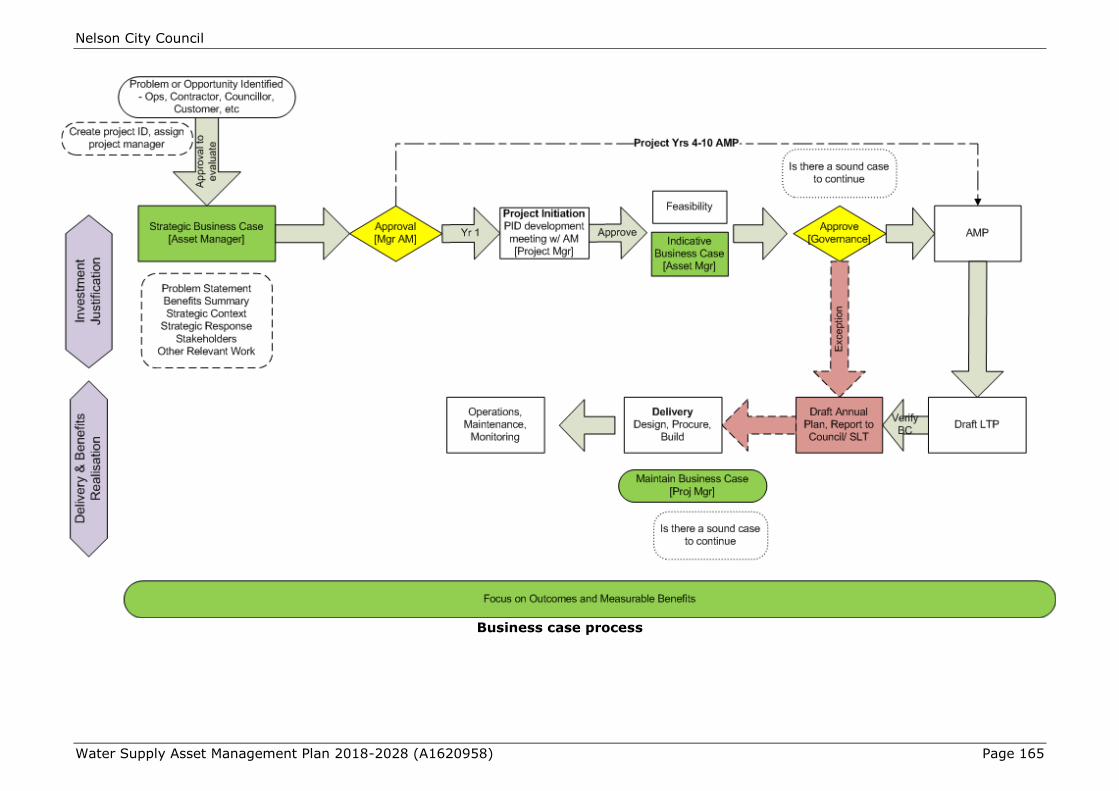
Nelson City Council
Water Supply Asset Management Plan 2018-2028 (A1620958) Page 165
Business case process
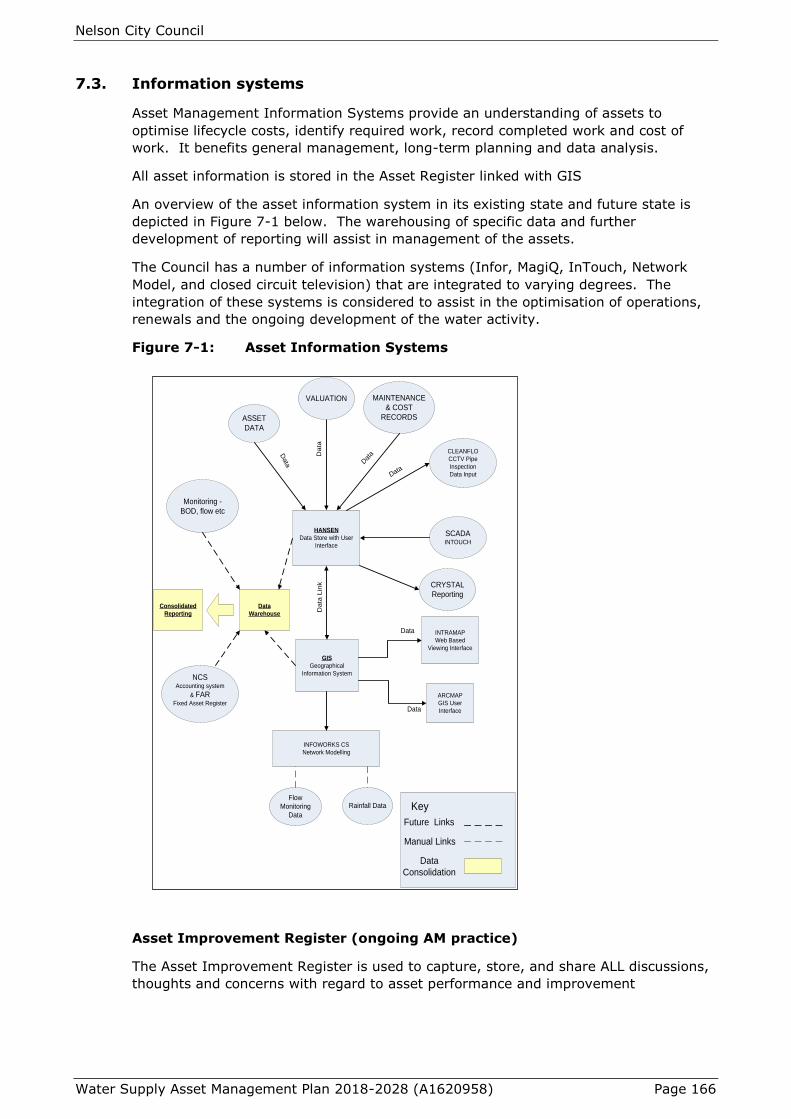
Nelson City Council
Water Supply Asset Management Plan 2018-2028 (A1620958) Page 166
7.3. Information systems
Asset Management Information Systems provide an understanding of assets to
optimise lifecycle costs, identify required work, record completed work and cost of
work. It benefits general management, long-term planning and data analysis.
All asset information is stored in the Asset Register linked with GIS
An overview of the asset information system in its existing state and future state is
depicted in Figure 7-1 below. The warehousing of specific data and further
development of reporting will assist in management of the assets.
The Council has a number of information systems (Infor, MagiQ, InTouch, Network
Model, and closed circuit television) that are integrated to varying degrees. The
integration of these systems is considered to assist in the optimisation of operations,
renewals and the ongoing development of the water activity.
Figure 7-1: Asset Information Systems
Asset Improvement Register (ongoing AM practice)
The Asset Improvement Register is used to capture, store, and share ALL discussions,
thoughts and concerns with regard to asset performance and improvement
HANSEN
Data Store with User
Interface
GIS
Geographical
Information System
INTRAMAP
Web Based
Viewing Interface
ARCMAP
GIS User
Interface
INFOWORKS CS
Network Modelling
MAINTENANCE
& COST
RECORDS
Data
Data
D
ata
Lin
k
Data
ASSET
DATA
CLEANFLO
CCTV Pipe
Inspection
Data Input
Da
ta
Dat
a
Data
Flow
Monitoring
Data
Rainfall Data
VALUATION
Monitoring -
BOD, flow etc
NCSAccounting system
& FARFixed Asset Register
Data
Warehouse
SCADAINTOUCH
Consolidated
Reporting
CRYSTAL
Reporting
Key
Future Links
Manual Links
Data
Consolidation
Nelson City Council
Water Supply Asset Management Plan 2018-2028 (A1620958) Page 167
Integrated Accounting, Financial, Electronic Purchase Order, and Service
Request Systems
Accounting is currently carried out to Generally Accepted Accounting Principles to
comply with the Local Government Act 2002 and Public Benefit Entity International
Public Sector Accounting Standards (PBE IPSAS). The Nelson City Council uses
integrated computer software supplied by MagiQ. The General Ledger is linked to
packages that run Debtors, Creditors, Banking, Rates, Fixed Assets, Invoicing, Water
Billing, Job Costing, and Payroll. Internal monthly financial reports are generated by
Council significant activity and sub-activity categories although real time data is
available at any time. External financial reports by significant activity are published in
the annual report.
Service requests record customer questions, enquiries, and complaints.
Electronic Document and Records Management System (EDRMS)
Nelson City Council uses Objective as its electronic document and records
management system.
Geographical Information System
Geographical information system was implemented in 1994 with data captured using
photogrammetry (1994) and progressively delivered over the following years. Nelson
City Council staff carried out accuracy checks on the geographical co-ordinate data
supplied, searched all the engineering plans and field books for information on pipe
alignment, material and age and entered this information into the Geographical
information system.
Accuracy Limitations
The data captured by photogrammetry was required to be accurate to within a
tolerance of +/- 0.3m. In inaccessible areas, it was not considered economic to search
for buried fittings. Instead, the best estimated position was entered and the accuracy
limitation flagged. Similarly, only limited fieldwork has been done to confirm the pipe
material and sizes. The accuracy of this information is verified through time by asset
data collection procedures.
New assets are recorded from the “as built” plans supplied by the subdivider (for
vested assets) or Council’s engineering project section (for new capital work).
Maintenance of GIS data
Procedures are in place to update new data into the Geographical information system
on a monthly basis via Nelson City Council engineering staff.
Council’s Engineering Standards require that any work on a Council sewer must be
proposed to Council by means of an engineering plan for approval and an “As-built”
record submitted at the completion of works.
Data on assets associated with renewal and upgrade capital are now updated into the
asset register by Nelson City Council Engineering and Finance staff. This ensures a
high level of reliability.
Closed Circuit Television
Currently, Closed Circuit Television condition inspections are carried out by an external
contractor only as required.

Nelson City Council
Water Supply Asset Management Plan 2018-2028 (A1620958) Page 168
The Infor system is used to assist in the selection of pipes to be checked. The Closed
Circuit Television inspection records are inputted into the Infor system via Cleanflow.
Asset management Recording System - Infor
The use of the Infor system has enabled the following:
Customer enquiries being logged directly and sent immediately to the contractor
for action.
Contractor directly enters resolution confirmation at completion of job.
Tracking of expenditure on assets to allow assets that have a disproportionately
high maintenance cost to be identified - upgrade or renewal can then be
prioritised.
Nelson City Council principal contractor Nelmac has a live interface with Infor. Any
work associated with unscheduled maintenance is entered into Infor work order by the
contractor. Completed work orders forms the basis of the contractors’ payment.
There are known issues with the existing implementation of Infor surrounding the
work order processes including a lack of reporting to trend results and alert for
operational issues. With confirming the required reporting outputs for all levels of
management the work order processes and data captured by the contractor and/or
Nelson City Council staff can be refined to ensure the needs of all parties are met.
ProMapp
ProMap is Nelson City Council’s procedures library
Supervisory Control and Data Acquisition System (SCADA)
The Supervisory Control and Data Acquisition system provides surveillance of the
operation of pumping stations in the stormwater system and provides alarms when
equipment fails or when operating parameters are exceeded. The Supervisory Control
and Data Acquisition system also records operating data from the pumping stations.
All of the Nelson City Council’s strategic utility components are monitored remotely, at
Civic House or by duty staff using laptop computers at home, utilising a
telecommunication system.
This system has given Council the ability to ascertain faults and instigate repairs
without affecting the service to the consumer and has significantly increased efficiency
and reliability of the utility schemes. This function has become critical to the operation
of the network and has been supported by Council’s in house Information Management
team up to now. There is a need to upgrade this package and at the same time
consider how the technical requirements can be accommodated with the essentially
office based computer network used by the majority of Council staff.
Council has a “Kingfisher” and “Intouch” system at the base station (rationalisation of
system occurred in 2005). The system is used to monitor and control critical aspects
of all Nelson City Council treatment plants and pump stations, 67 sites are presently
monitored that include:
Waste Water Treatment Plants
Stormwater Pump Stations
Wastewater Pump Stations
Water Treatment Plants

Nelson City Council
Water Supply Asset Management Plan 2018-2028 (A1620958) Page 169
Water Pump Stations and Reservoirs
Appendix G details the over view of the Supervisory Control and Data Acquisition
system. The system is used for:
Monitoring the operation of sites
Reporting, trending and analysing historical data
Alarm monitoring (operators are informed of alarms via text messages to mobile
phones)
Some control functions
Monitoring of water, wastewater and stormwater systems by the Councils Supervisory
Control and Data Acquisition system has grown to the point that without the current
Supervisory Control and Data Acquisition system, maintaining the existing Levels of
Service would be difficult. Supervisory Control and Data Acquisition has given the
ability for Council to ascertain faults and instigate repairs without affecting the service
to the consumer and has significantly increased efficiency and reliability of the utility
schemes. The Supervisory Control and Data Acquisition system is a critical system in
Council’s operation.
Review and Upgrade
In 2016/17 an extensive upgrade of this package was completed.
Future Strategy for Councils Supervisory Control and Data Acquisition
Council’s strategy for the ongoing use of Supervisory Control and Data Acquisition is:
Maintain Supervisory Control and Data Acquisition system at a high level to
ensure system reliability and ongoing reporting ability.
Increase availability of information to the in-house Business Units in a format
that will enable increased efficiencies in operation and management.
Develop the reporting functions of the system.
Develop further use of the system to control plant and equipment.
7.4. Service delivery models
Maintenance contracts have been reviewed and grouped to provide a good balance
between price and quality, and use either prequalification or price/quality supplier
selection methods. The methods used to procure capital projects will differ depending
on the size of the project, but will be either lowest price or price/quality.
Council maintains an in-house professional services capability balanced with external
consultants as required to achieve best value for money. Additional professional
services are sometimes required.

Nelson City Council
Water Supply Asset Management Plan 2018-2028 (A1620958) Page 170
Plan improvement and monitoring
8.1. Status of AM practice
Figure 8-1: Current and desired state of AM processes, data and systems
Aware
Basic
Core
Intermediate
Advanced
-20
0
20
40
60
80
100
Stra
tegi
c D
irec
tio
n
Leve
ls o
f Se
rvic
e
Fore
cast
ing
Futu
re D
em
and
Ass
et In
form
atio
n
Per
f &
Co
nd
itio
n M
on
ito
rin
g
Life
cycl
e D
ecis
ion
Met
ho
ds
Ris
k an
d R
esili
ence
Op
erat
ion
al P
lan
nin
g
Cap
ital
Pla
nn
ing
Fin
anci
al M
anag
eme
nt
AM
Lea
der
ship
an
d T
eam
s
Dev
elo
pin
g A
M P
lan
s
Info
rmat
ion
Sys
tem
s
Serv
ice
De
liver
y M
od
els
Man
agem
ent
Syst
ems
Au
dit
an
d Im
pro
vem
en
t
Ove
rall
Understanding requirements Lifecycle Planning Enablers
Water Asset Management Maturity by Practice Area
Current 3 Year Target 10 Year Target

Nelson City Council
Wastewater Asset Management Plan 2018-2028 (A1620958) Page 171
8.2. Improvement programme
The plan will be reviewed annually and revised every three years to incorporate,
amongst other things, improved decision making techniques, updated asset
information, and Council policy changes which impact on targeted levels of service.
Improving Accuracy and Confidence in Asset Management Plan
Asset management improvements and associated objectives are noted throughout the
Asset Management Plan.
These improvements will improve the accuracy of, and confidence in, the Water Asset
Management Plan.
Table 8-1: Improvement Programme
Improvement Programme
Develop Contamination Response Plan
Establish Condition Model for asbestos cement pipe and cast-iron pipe
Maitai Dam comprehensive Safety Review
Routinely calibrate the accuracy of the Network Analysis so that accurate
predictions are provided
Improve reporting on levels of service, particularly those that are based on Council
service requests and work orders to contractors. Resolve issues with how the
information is recorded and recovered.
Review asset lives using NAMs– NZ Infrastructure Asset Valuation and Depreciation
Guidelines
Improve accuracy of condition assessments.
Continue the water loss identification and reduction programme
Review the lifelines risk assessment and response
Continue investigations into dis-coloured water issues
Data collection programmes (condition, performance, asset registers) closely aligned
with business needs will be operated in accordance with documented quality processes
Data collection, maintenance and analysis are expensive and it is important that
programmes and techniques are cost effective and consistent with business needs.
Systematic processes will be introduced for the collection and upgrading of essential
data based on asset criticality including:
Asset attribute information
Asset performance data
Asset condition data.
A more robust framework for identification of critical assets
A methodology for determining asset criticality to a component level, along with
options, will be determined to integrate criticality into the ongoing operation,
maintenance, renewals and capital programme for the water supply activity.

Nelson City Council
Wastewater Asset Management Plan 2018-2028 (A1620958) Page 172
The risk register will be extended to encompass assets down to a component level
8.3. Monitoring and review procedures
Nelson City Council will:
Implement a continuous improvement approach to asset management planning
in the short term.
Fully review the Asset Management Plan three-yearly in advance of the Long
Term Plan. Annual amendments or updates will be undertaken if significant
asset management changes occur.
Report variations in the adopted annual plan budgets against the original asset
management plan forecasts and explain the level of service implications of
budget variations.
Statutory Audit
The Local Government Act requires that an annual, financial audit of the operations of
the Council be carried out. Audits may include all significant activities such as Asset
Management planning.
Previous Water Asset Management Plans were examined by Audit New Zealand in the
course of audits of the Nelson City Council.
Internal Audit
An internal audit will be taken to assess the effectiveness with which the plan meets
its objectives prior to the development of the 2018-28 Asset Management Plan.
Review and Updates
The Water Asset Management Plan programmes and costs will be reviewed and
updated annually by 30 August each year for incorporation into the Annual Plan.
Performance Monitoring and Management
The effectiveness of the Water Asset Management Plan will be monitored in various
ways and the results used in the updating and revision of the Plan.
Current Level of Service Objectives
Compliance with the current level of service objectives will be monitored by internal
audit.
Annual Performance Monitoring
Throughout this Water Supply Asset Management Plan annual performance and
monitoring measures are noted.
8.4. Performance measures
Outline of performance measures for the AM system
Benchmarking
Benchmarking of service quality and cost efficiency against similar organisations will
be carried out at some future date, most likely once an Asset Management System is
operational, and a history has been established.
Local Government NZ embarked on a benchmarking exercise for Council utilities in
2014. Nelson City Council was a contributor to that exercise.
Nelson City Council
Wastewater Asset Management Plan 2018-2028 (A1620958) Page 173
How the effectiveness of the AM plan will be measured
The effectiveness of the Asset Management plan will be monitored by the following
procedures:
Financial expenditure projections prior to year end
Resource consent monitoring as required by consents
Operations and Maintenance reports on a monthly basis
The continued monitoring of these procedures and ongoing analysis of results will
result in:
Optimisation of expenditure through the asset lifecycle
Service levels actively monitored and reported on
Management of risk and control of failures
Appendices
APPENDIX A: GLOSSARY OF TERMS
The following terms and acronyms (in brackets) are used in this Plan.
Appendix Table A-1: Meaning of Words
Term Definition
Advanced Asset
Management
Asset management which employs predictive modelling, risk
management and optimised decision-making techniques to establish
asset lifecycle treatment options and related long term cash flow
predictions. (See Basic Asset Management).
Annual Plan An Annual Plan is published in years two and three, alternating with the
three-yearly Long Term Plan, that sets out Council’s updated financial
situation, intended activities and work programme for the following
three financial years.
Asset A physical component of a facility which has value, enables services to
be provided and has an economic life of greater than 12 months.
Dynamic assets have some moving parts, while passive assets have
none.
Asset Management The combination of management, financial, economic, engineering and
other practices applied to physical assets with the objective of
providing the required level of service in the most cost-effective
manner.
Asset Management
System
An Asset Management system is a combination of processes, data and
software applied to provide the essential outputs for effective Asset
Management planning such as reduced risk and optimum infrastructure
investment.
Asset Management
Plan
A plan developed for the management of an infrastructure asset that
combines multi-disciplinary management techniques (including

Nelson City Council
Wastewater Asset Management Plan 2018-2028 (A1620958) Page 174
Term Definition
technical and financial) over the lifecycle of the asset in the most cost
effective manner to provide a specified level of service. A significant
component of the plan is a long-term cash flow projection for the
activities.
Asset Register A record of asset information considered worthy of separate
identification including inventory, historical, financial, condition,
construction, technical and financial information about each.
Backflow Prevention
Device
A mechanical device required by the Drinking Water Protection
Regulations to prevent water from private plumbing flowing back into
the water supply system and possibly contaminating the public supply.
May be a column 10.7m high, a double check valve system or a
reduced pressure principle device.
Benefit-Cost Ratio
(B/C)
The sum of the present values of all benefits (including residual value,
if any) over a specified period, or the lifecycle, of the asset or facility,
divided by the sum of the present value of all costs.
Business Plan A plan produced by an organisation (or business units within it) which
translates the objectives contained in an Annual Plan into detailed work
plans for a particular, or range of, business activities. Activities may
include marketing, development, operations, management, personnel,
technology and financial planning.
Capital Expenditure Expenditure used to create new assets or to increase the capacity of
existing assets beyond their original design capacity or service
potential. Capital expenditure increases the value of asset stock.
Cash Flow The stream of costs and/or benefits over time resulting from a project
investment or ownership of an asset.
City Datum The baseline from which heights in the City are measured. It is
approximately 12m below mean sea level (so that all numbers are
positive).
Closed Circuit
Television
A method of inspecting pipes by sending a mobile camera along the
length of the pipe to visually record the interior.
Community Plan See Long Term Council Community Plan.
Components Specific parts of an asset having independent physical or functional
identity and having specific attributes such as different life expectancy,
maintenance regimes, risk or criticality.
Condition-Based
Preventive
Maintenance
Preventive maintenance initiated as a result of knowledge of an items
condition from routine or continuous monitoring.
Condition Monitoring Continuous or periodic inspection, assessment, measurement and
interpretation of the resultant data, to indicate the condition of a
specific component so as to determine the need for some preventive or
remedial action.
Core Asset
Management
Asset management which relies primarily on the use of an asset
register, maintenance management systems, job/resource
management, inventory control, condition assessment and defined
levels of service, in order to establish alternative treatment options and
long-term cash flow predictions. Priorities are usually established on
the basis of financial return gained by carrying out the work (rather
than risk analysis and optimised decision-making).
Nelson City Council
Wastewater Asset Management Plan 2018-2028 (A1620958) Page 175
Term Definition
Corrective
Maintenance
The remedial actions performed as a result of failure, to restore an item
to a specified condition. Corrective maintenance may or may not be
programmed.
Critical Assets Assets for which the financial, business or service level consequences
of failure are sufficiently severe to justify proactive inspection and
rehabilitation. Critical assets have a lower threshold for action than
non-critical assets.
Current Replacement
Cost
The cost of replacing the service potential of an existing asset, by
reference to some measure of capacity, with an appropriate modern
equivalent asset.
Data Warehouse A system that is used to centralise a group of disparate databases in an
organisation to facilitate access into each of those databases.
Deferred
Maintenance
The shortfall in rehabilitation work required to maintain the service
potential of an asset.
Demand
Management
The active intervention in the market to influence demand for services
and assets with forecast consequences, usually to avoid or defer capital
expenditure. Demand management is based on the notion that as
needs are satisfied expectations rise automatically and almost every
action taken to satisfy demand will stimulate further demand.
Depreciated
Replacement Cost
The replacement cost of an existing asset less an allowance for wear or
consumption having regard for the remaining economic life of the
existing asset.
Depreciation The wearing out, consumption or other loss of value of an asset
whether arising from use, passing of time or obsolescence through
technological and market changes. It is accounted for by the allocation
of the cost (or revalued amount) of the asset less its residual value
over its useful life.
Deterioration Rate The rate at which an asset approaches failure.
Economic Life The period from the acquisition of the asset to the time when the asset,
while physically able to provide a service, ceases to be the lowest cost
alternative to satisfy a particular level of service. The economic life is
at the maximum when equal to the physical life; however obsolescence
will often ensure that the economic life is less than the physical life.
Failure Modes,
Effects and Criticality
Analysis
A technique for analysing and evaluating a design to ensure that the
application has the desired reliability characteristics by obviating those
critical failure modes through employment of redundancy, providing
alternate modes of operation, derating, or any other means.
Gap Analysis A method of assessing the gap between a business’s current Asset
Management practices and targeted future objectives/practices. Also
called needs analysis or improvement planning.
Geographic
Information System
Software which provides a means or spatially viewing, searching,
manipulating, and analysing an electronic database.
Infrastructure Assets Stationary systems forming a network and serving whole communities,
where the system as a whole is intended to be maintained indefinitely
at a particular level of service potential by the continuing replacement
and refurbishment of its components. The network may include
normally recognised ordinary assets as components.
l/sec Litres per second. A measure of flow.
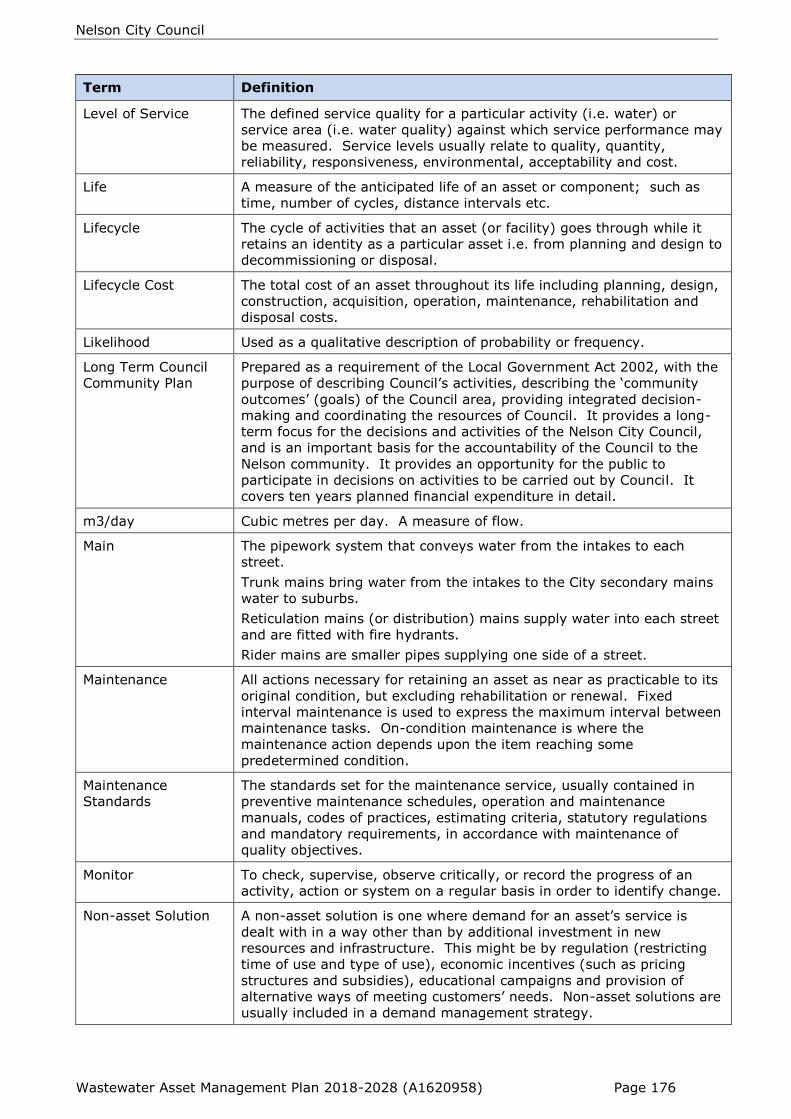
Nelson City Council
Wastewater Asset Management Plan 2018-2028 (A1620958) Page 176
Term Definition
Level of Service The defined service quality for a particular activity (i.e. water) or
service area (i.e. water quality) against which service performance may
be measured. Service levels usually relate to quality, quantity,
reliability, responsiveness, environmental, acceptability and cost.
Life A measure of the anticipated life of an asset or component; such as
time, number of cycles, distance intervals etc.
Lifecycle The cycle of activities that an asset (or facility) goes through while it
retains an identity as a particular asset i.e. from planning and design to
decommissioning or disposal.
Lifecycle Cost The total cost of an asset throughout its life including planning, design,
construction, acquisition, operation, maintenance, rehabilitation and
disposal costs.
Likelihood Used as a qualitative description of probability or frequency.
Long Term Council
Community Plan
Prepared as a requirement of the Local Government Act 2002, with the
purpose of describing Council’s activities, describing the ‘community
outcomes’ (goals) of the Council area, providing integrated decision-
making and coordinating the resources of Council. It provides a long-
term focus for the decisions and activities of the Nelson City Council,
and is an important basis for the accountability of the Council to the
Nelson community. It provides an opportunity for the public to
participate in decisions on activities to be carried out by Council. It
covers ten years planned financial expenditure in detail.
m3/day Cubic metres per day. A measure of flow.
Main The pipework system that conveys water from the intakes to each
street.
Trunk mains bring water from the intakes to the City secondary mains
water to suburbs.
Reticulation mains (or distribution) mains supply water into each street
and are fitted with fire hydrants.
Rider mains are smaller pipes supplying one side of a street.
Maintenance All actions necessary for retaining an asset as near as practicable to its
original condition, but excluding rehabilitation or renewal. Fixed
interval maintenance is used to express the maximum interval between
maintenance tasks. On-condition maintenance is where the
maintenance action depends upon the item reaching some
predetermined condition.
Maintenance
Standards
The standards set for the maintenance service, usually contained in
preventive maintenance schedules, operation and maintenance
manuals, codes of practices, estimating criteria, statutory regulations
and mandatory requirements, in accordance with maintenance of
quality objectives.
Monitor To check, supervise, observe critically, or record the progress of an
activity, action or system on a regular basis in order to identify change.
Non-asset Solution A non-asset solution is one where demand for an asset’s service is
dealt with in a way other than by additional investment in new
resources and infrastructure. This might be by regulation (restricting
time of use and type of use), economic incentives (such as pricing
structures and subsidies), educational campaigns and provision of
alternative ways of meeting customers’ needs. Non-asset solutions are
usually included in a demand management strategy.

Nelson City Council
Wastewater Asset Management Plan 2018-2028 (A1620958) Page 177
Term Definition
Non-return Valve
(NRV)
A mechanical device that allows water to flow in one direction only.
NZ IFRS International Financial Reporting Standard
Optimised Decision
Making (ODM)
An optimisation process for considering and prioritising all options to
rectify existing or potential performance failures of assets. The process
encompasses NPV analysis and risk assessment.
Optimised
Depreciated
Replacement Cost
(ODRC)
The optimised replacement cost after deducting an allowance for wear
or consumption to reflect the remaining economic or service life of an
existing asset. ODRC is the surrogate for valuing assets in use where
there are no competitive markets for assets, or for their services or
outputs.
Optimised
Replacement Cost
(ORC)
The minimum cost of replacing an existing asset with modern
equivalent assets offering the same level of service. The optimisation
process adjusts the value for technical and functional obsolescence,
surplus assets or over- design.
Payback Period The time it takes for the cumulative benefits or savings of an
investment to pay back the original investment and other accrued
costs.
Performance
Measure (PM)
A qualitative or quantitative measure of a service or activity used to
compare actual performance against a standard or other target.
Performance measures commonly relate to statutory limits, safety,
responsiveness, cost, comfort, asset performance, reliability, efficiency,
environmental protection and customer satisfaction.
Performance
Monitoring
Continuous or periodic quantitative and qualitative assessments of the
actual performance compared with specific objectives, targets or
standards.
Planned Maintenance Planned maintenance activities fall into three categories:
Periodic – necessary to ensure the reliability or to sustain the design
life of an asset.
Predictive – condition monitoring activities used to predict failure.
Preventive – maintenance that can be initiated without routine or
continuous checking (e.g. using information contained in maintenance
manuals or manufacturers’ recommendations) and is not condition-
based.
Pressure Reducing
Valve (PRV)
A mechanical device that modulates to maintain a constant lower
pressure downstream irrespective of flow.
Rehabilitation Works to rebuild or replace parts or components of an asset, to restore
it to a required functional condition and extend its life, which may
incorporate some modification. Generally involves repairing the asset
to deliver its original level of service (i.e. heavy patching of roads,
sliplining of sewer mains, etc) without resorting to significant upgrading
or renewal, using available techniques and standards.
Renewal Works to upgrade, refurbish or replace existing facilities with facilities
of equivalent capacity or performance capability.
Remaining Economic
Life
The time remaining until an asset ceases to provide the required
service level or economic usefulness.
Renewal/Replacemen
t
The complete replacement of an asset that has reached the end of its
life, so as to provide a similar or agreed alternative, level of service.

Nelson City Council
Wastewater Asset Management Plan 2018-2028 (A1620958) Page 178
Term Definition
Repair Action to restore an item to its previous condition after failure or
damage.
Replacement Cost The cost of replacing an existing asset with a substantially identical
new asset.
Reservoir A large storage area for water. May be uncovered, e.g. Maitai Lake or
covered, e.g. stressed concrete reservoirs at Thompson Terrace.
Residual Value The net market or recoverable value which would be realised from
disposal of an asset or facility at the end of its life.
Rider Main A small diameter watermain on the opposite side of the road from the
principal watermain.
Risk Management The application of a formal process to the range of possible values
relating to key factors associated with a risk in order to determine the
resultant ranges of outcomes and their probability of occurrence.
Risk Management
Process
The systematic application of management policies, procedures and
practices to the tasks of establishing the context, identifying, analysing,
evaluating, treating, monitoring and communicating risk.
Routine Corrective
Maintenance
Corrective maintenance, excluding emergency corrective and
programmed corrective maintenance.
Routine Maintenance Day to day operational activities to keep the asset operating
(replacement of light bulbs, cleaning of drains, repairing of leaks, etc)
and which form part of the annual operating budget, including
preventive maintenance.
Sensitivity Analysis Testing of the variations in the outcome of an evaluation by altering the
values of key factors about which there might be uncertainty.
Service A service refers to the provisioning of or the actual system of supplying
a public need,
A water service (pipe) is that section of the reticulation between the
main in the street and the property boundary.
Stakeholders Those people and organisations who may affect, be affected by, or
perceive themselves to be affected by, a decision or activity.
Strategic Plan A plan containing the long-term goals and strategies of the Council.
Strategic plans have a strong external focus, cover major portions of
the Council’s operations and identify major targets, actions and
resource allocations relating to the long-term survival, value and
growth of the Council.
Tank A small covered storage area for water. Usually made of concrete and
of 23m3 capacity.
Universal Metering Having water meters fitted to all properties, i.e. ordinary (residential)
and extraordinary (commercial, industrial and other non-residential)
users.
Unplanned
Maintenance
Corrective work required in the short-term to restore an asset to
working conditions so it can continue to deliver the required service or
to maintain its level of security and integrity.
Useful Life May be expressed as either:
The period over which a depreciable asset is expected to be used, or
The number of production or similar units (i.e. intervals, cycles) that is
expected to be obtained from the asset.
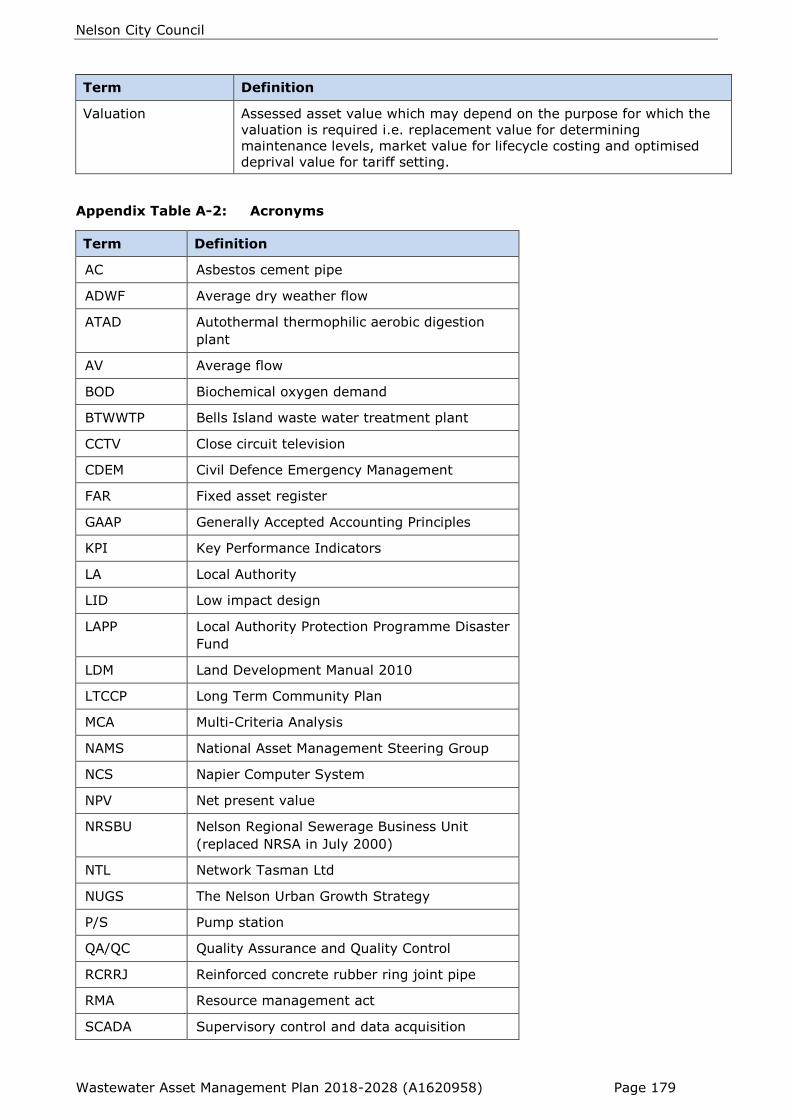
Nelson City Council
Wastewater Asset Management Plan 2018-2028 (A1620958) Page 179
Term Definition
Valuation Assessed asset value which may depend on the purpose for which the
valuation is required i.e. replacement value for determining
maintenance levels, market value for lifecycle costing and optimised
deprival value for tariff setting.
Appendix Table A-2: Acronyms
Term Definition
AC Asbestos cement pipe
ADWF Average dry weather flow
ATAD Autothermal thermophilic aerobic digestion
plant
AV Average flow
BOD Biochemical oxygen demand
BTWWTP Bells Island waste water treatment plant
CCTV Close circuit television
CDEM Civil Defence Emergency Management
FAR Fixed asset register
GAAP Generally Accepted Accounting Principles
KPI Key Performance Indicators
LA Local Authority
LID Low impact design
LAPP Local Authority Protection Programme Disaster
Fund
LDM Land Development Manual 2010
LTCCP Long Term Community Plan
MCA Multi-Criteria Analysis
NAMS National Asset Management Steering Group
NCS Napier Computer System
NPV Net present value
NRSBU Nelson Regional Sewerage Business Unit
(replaced NRSA in July 2000)
NTL Network Tasman Ltd
NUGS The Nelson Urban Growth Strategy
P/S Pump station
QA/QC Quality Assurance and Quality Control
RCRRJ Reinforced concrete rubber ring joint pipe
RMA Resource management act
SCADA Supervisory control and data acquisition

Nelson City Council
Wastewater Asset Management Plan 2018-2028 (A1620958) Page 180
Term Definition
SS Suspended solids
TA Territorial Authority
uPVC Unplasticised Polyvinyl Chloride pipe
WWTP Wastewater treatment plant
Appendix Table A-3: Geographical Information System List of Code Definitions
used by Nelson City Council
Value Description
2000 2000: Meter type
3000 3000: Meter type
ACBK Black Asbestos Cement
ACMT Asbestos Cement
ALUM Aluminium
ARMC ArmourCoil
BLBT Blue Brute Pipe
BLKA Black Asbestos Cement
BRCK Brick
CIDT Ductile Cast Iron
CIPT PitCast Iron
CISP Spun Cast Iron
CNIL Concrete (InsituFORM lined)
CONC Concrete
COPR Copper
DRNC Drainage Coil
EWRE Earthenware
FGLS Fiberglass
FLDT Field Tiles
GALV Galvanised
HDPE High-density polyethylene pipe
HELA Helcoil Aluminium
HELS Helcoil Steel
MDPE Medium Density Pe
NAPP Not Applicable
OTHR Other
PE1H Pe 100 Material
POLE Pole Construction
PRFC Perforated Concrete
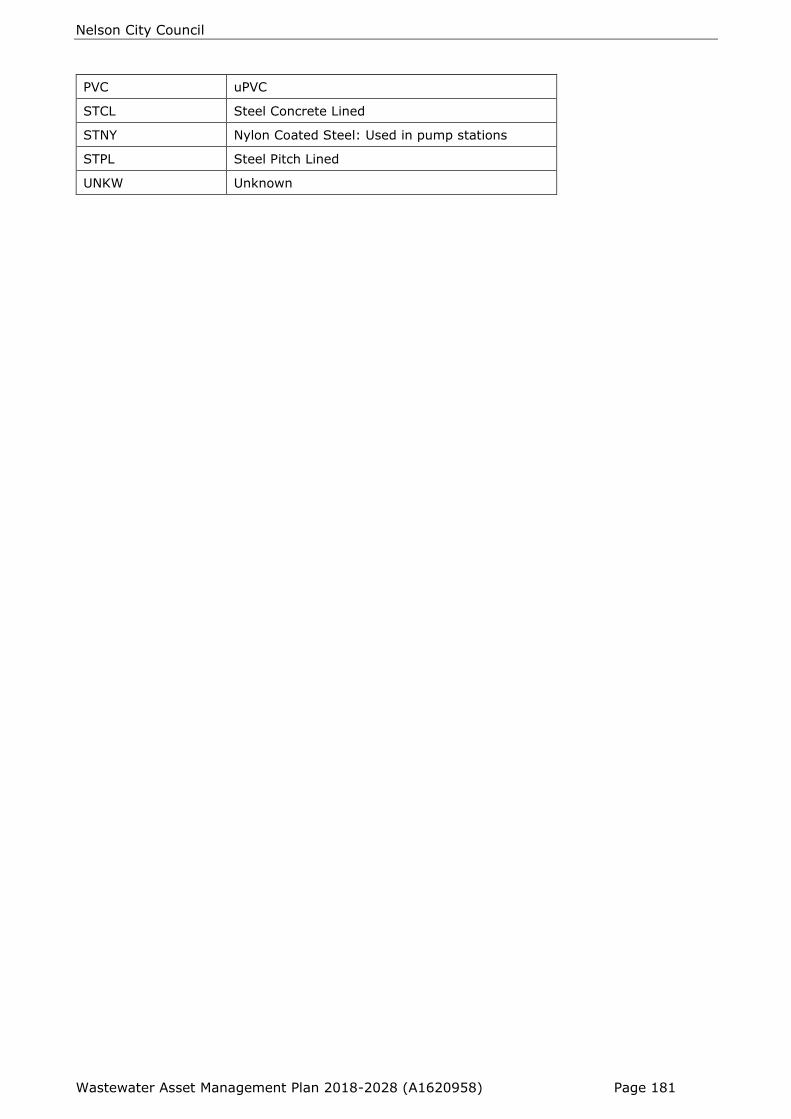
Nelson City Council
Wastewater Asset Management Plan 2018-2028 (A1620958) Page 181
PVC uPVC
STCL Steel Concrete Lined
STNY Nylon Coated Steel: Used in pump stations
STPL Steel Pitch Lined
UNKW Unknown
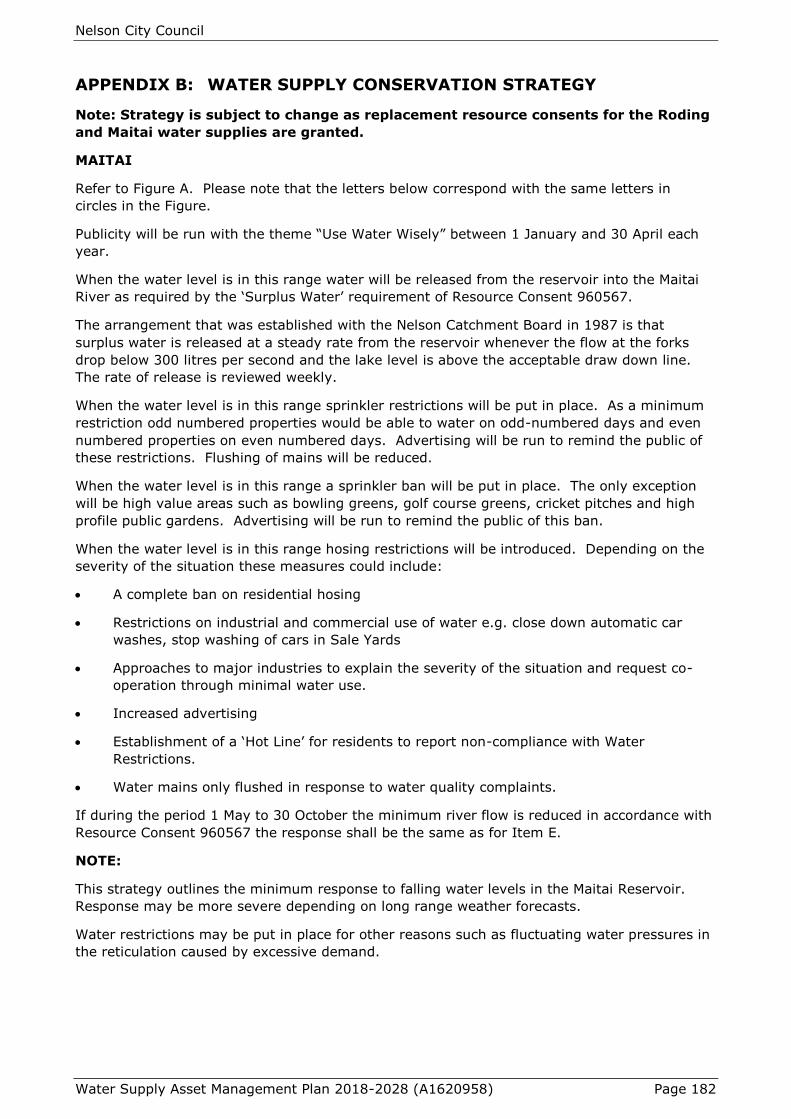
Nelson City Council
Water Supply Asset Management Plan 2018-2028 (A1620958) Page 182
APPENDIX B: WATER SUPPLY CONSERVATION STRATEGY
Note: Strategy is subject to change as replacement resource consents for the Roding
and Maitai water supplies are granted.
MAITAI
Refer to Figure A. Please note that the letters below correspond with the same letters in
circles in the Figure.
Publicity will be run with the theme “Use Water Wisely” between 1 January and 30 April each
year.
When the water level is in this range water will be released from the reservoir into the Maitai
River as required by the ‘Surplus Water’ requirement of Resource Consent 960567.
The arrangement that was established with the Nelson Catchment Board in 1987 is that
surplus water is released at a steady rate from the reservoir whenever the flow at the forks
drop below 300 litres per second and the lake level is above the acceptable draw down line.
The rate of release is reviewed weekly.
When the water level is in this range sprinkler restrictions will be put in place. As a minimum
restriction odd numbered properties would be able to water on odd-numbered days and even
numbered properties on even numbered days. Advertising will be run to remind the public of
these restrictions. Flushing of mains will be reduced.
When the water level is in this range a sprinkler ban will be put in place. The only exception
will be high value areas such as bowling greens, golf course greens, cricket pitches and high
profile public gardens. Advertising will be run to remind the public of this ban.
When the water level is in this range hosing restrictions will be introduced. Depending on the
severity of the situation these measures could include:
A complete ban on residential hosing
Restrictions on industrial and commercial use of water e.g. close down automatic car
washes, stop washing of cars in Sale Yards
Approaches to major industries to explain the severity of the situation and request co-
operation through minimal water use.
Increased advertising
Establishment of a ‘Hot Line’ for residents to report non-compliance with Water
Restrictions.
Water mains only flushed in response to water quality complaints.
If during the period 1 May to 30 October the minimum river flow is reduced in accordance with
Resource Consent 960567 the response shall be the same as for Item E.
NOTE:
This strategy outlines the minimum response to falling water levels in the Maitai Reservoir.
Response may be more severe depending on long range weather forecasts.
Water restrictions may be put in place for other reasons such as fluctuating water pressures in
the reticulation caused by excessive demand.
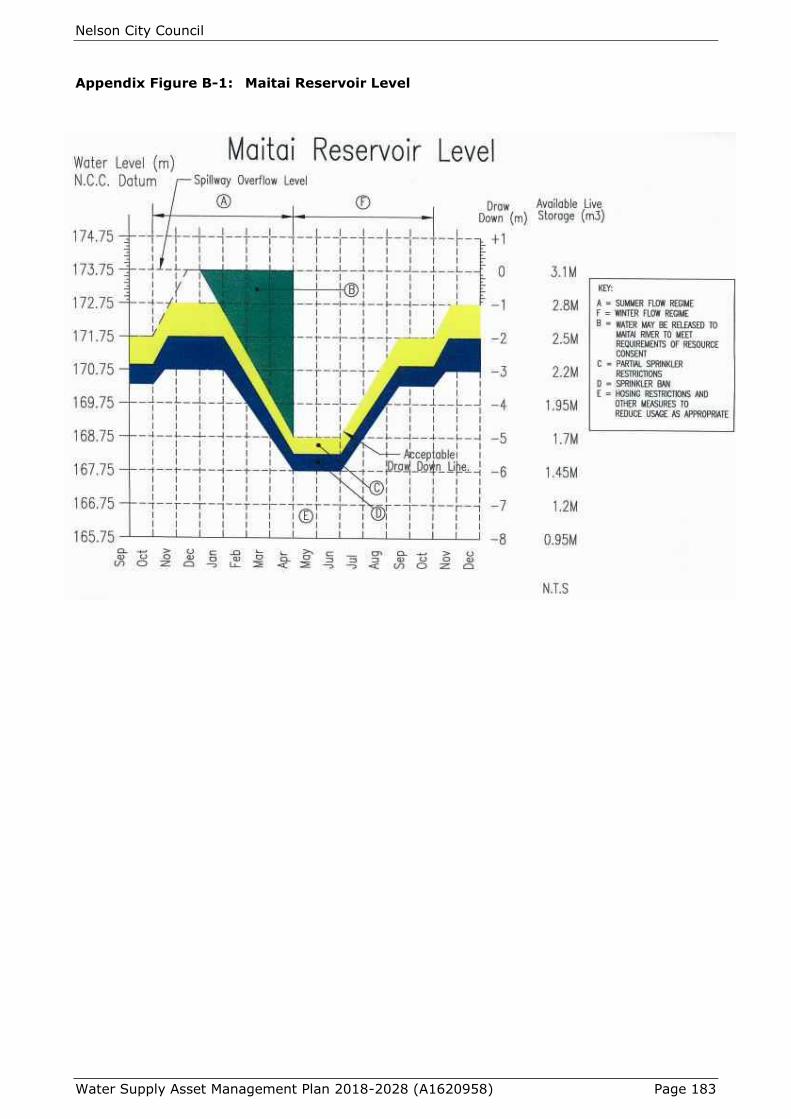
Nelson City Council
Water Supply Asset Management Plan 2018-2028 (A1620958) Page 183
Appendix Figure B-1: Maitai Reservoir Level
Nelson City Council
Water Supply Asset Management Plan 2018-2028 (A1620958) Page 184
RODING
When the natural flow of the Roding River above the weir is 196 litres per second or less for
two consecutive days (5 year return period low flow), restrictions as in Section C will be put in
place.
When the natural flow of the Roding River above the weir is 160 litres per second or less (10
year return period low flow), restrictions as in Section D will be put in place.
When the natural flow of the Roding River above the weir is 140 litres per second or less for
two consecutive days (20 year return period low flow), restrictions as in Section E will be put in
place.
Note: These measures are in accordance with the requirements of Resource Consent No.
975374
APPENDIX C: LIFELINES
Extract from Civil Defence Emergency Management Act 2002
s60. Duties of Lifeline Utilities
Every lifeline utility must:
Ensure that it is able to function to the fullest possible extent, even though this may be
at a reduced level, during and after an emergency;
Make available to the Director in writing, on request, its plan for functioning during and
after an emergency;
Participate in the development of the national civil defence emergency management
plans;
Provide, free of charge, any technical advice to any Civil Defence Emergency
Management Group or the Director that may be reasonably required by that Group or the
Director;
Ensure that any information that is disclosed to the lifeline utility is used by the lifeline
utility, or disclosed to another person, only for the purposes of this Act.
s64. Duties of Local Authorities
A local authority must plan and provide for Civil Defence Emergency Management within its
district.
A local authority must ensure that it is able to function to the fullest possible extent, even
though this may be at a reduced level, during and after an emergency.
Extract from Nelson Tasman Engineering Lifelines Project Report 2004
Civil Water Supply
Nelson City water supply is sourced from Maitai and Roding river catchments. The water supply
network includes dams, intake structures, water treatment plant, tunnels, approximately
320km of pipework, 4 pump stations and reservoir storage of approximately 13,300m3.
The Maitai Water supply scheme, including the Maitai earthfill Dam, was commissioned in 1987
and is considered to be in good condition except for the trunk main between the dam and
Upper Brook Street. The Roding Weir was commissioned in 1940 and is still in good operating
condition. Gravel tends to build up behind the weir and requires regular removal.

Nelson City Council
Wastewater Asset Management Plan 2018-2028 (A1620958) Page 185
The Brook Dam, constructed in 1904 as Nelson’s original water supply scheme, was
decommissioned in 2000. The Maitai trunk pipeline, constructed in 1963, is largely exposed
and is vulnerable to landslip with some sections positioned on benched platforms on steep
geologically unstable slopes and some sections passing through a tunnel. The pipe is identified
as at extreme risk from movement failure caused by earthquake, landslide or settlement. This
segment of the network is marked as highest priority for mitigation measures to ensure
ongoing water supply is secure. The main is nominated for future replacement in the next five
years.
The 65 year old Roding pipeline, which is rated at high risk due to flooding potential, passes
through a 2.7km tunnel under the Barnicoat range, and the pipe is programmed to be replaced
in 20 years. The Central City and Port Hills Cast Iron mains are all at the end of their life and
are all predominantly due to be replaced by 2006/07. Atawhai and Stoke suburbs have more
recent pipe systems constructed of AC or PVC and are in good condition.
Reservoirs in Thompson Terrace have been seismically strengthened in 1992/93 and re-roofed
in 2001/02. Stoke, Atawhai, and Observatory Hill reservoirs are recent and all are in good
condition. Pump stations in Princes Drive, Austen Ward Heights, Van Diemen Street and
Panorama Drive have been constructed since 1990 and are considered to be in good condition.
The recently constructed water treatment plant at the Tantragee Saddle is situated close to
slopes potentially prone to landslip, however the facility is rated to be at low risk and risks to
its operation are assessed in detail in site specific geotechnical reports associated with
construction design.
Walters Bluff (Atawhai) reservoir although sited on a splinter fault has been specifically
designed and constructed to mitigate risks from fault rupture and earthquake shaking and is
rated at low risk to these hazards.
Other mitigation measures identified for Nelson’s water network include installation of seismic
control valves on reservoirs to secure water reserves in existing storage facilities and prevent
loss through failed service lines.
Since this report was completed the Stoke High Level Reservoir has been completed in
2010/11. The reservoir is located on the York/Brook saddle above the land fill site and has a
storage volume of 2500 cubic metres. An additional 440m3 reinforced concrete reservoir has
been constructed at Observatory Hill in 2014. This takes Nelson’s storage to 22,340m3.
The Christchurch Earthquakes of 2010 /2011 lead to significant damage to that city’s
infrastructure including water storage reservoirs and pipe network from direct shaking and
liquefaction. Recognising this, and the results of other natural hazard investigation post the
Nelson storm events of December 2011 and April 2013, Nelson City Council is reassessing the
risk to the network from earthquakes (including liquefaction, tsunami and direct shaking),
flooding, storms and sea level rise.
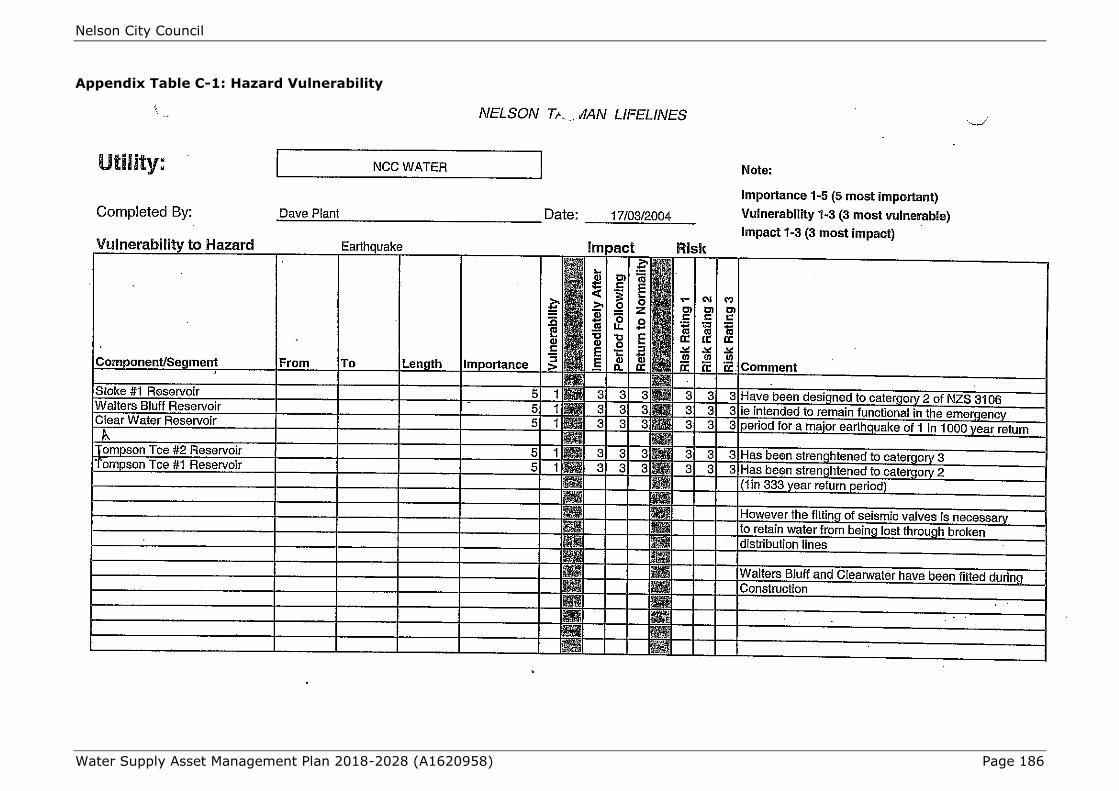
Nelson City Council
Water Supply Asset Management Plan 2018-2028 (A1620958) Page 186
Appendix Table C-1: Hazard Vulnerability
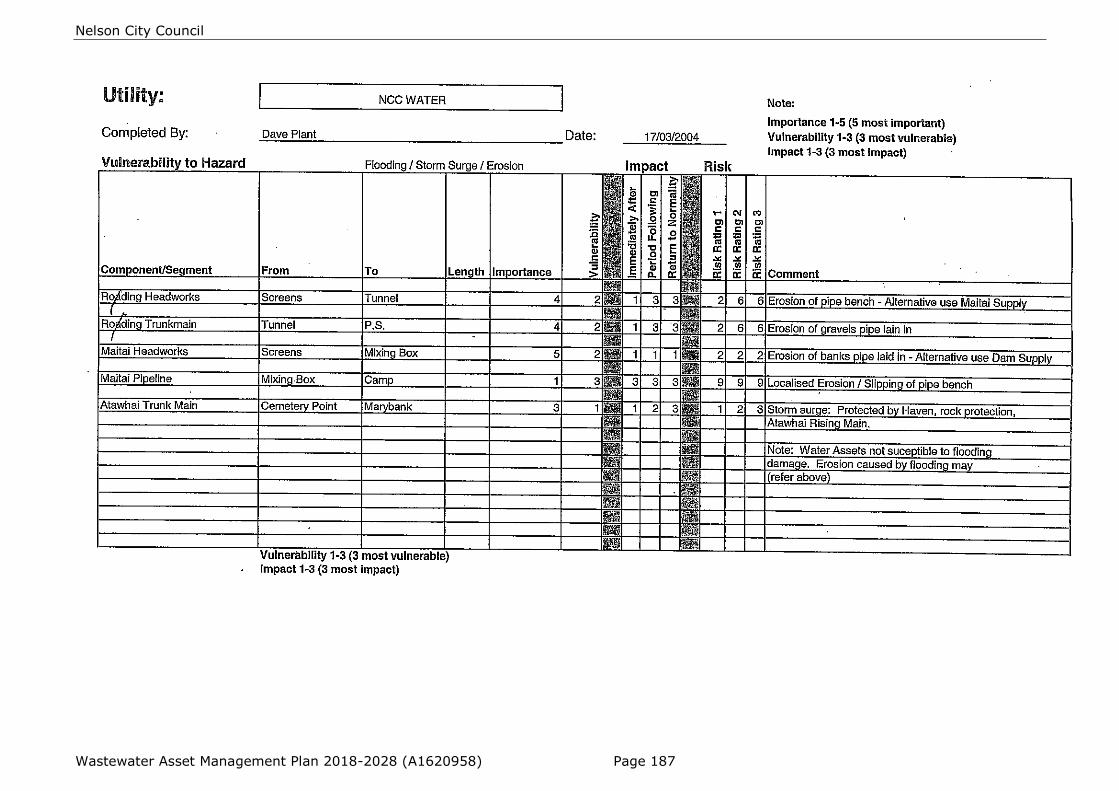
Nelson City Council
Wastewater Asset Management Plan 2018-2028 (A1620958) Page 187

Nelson City Council
Wastewater Asset Management Plan 2018-2028 (A1620958) Page 188

Nelson City Council
Wastewater Asset Management Plan 2018-2028 (A1620958) Page 189
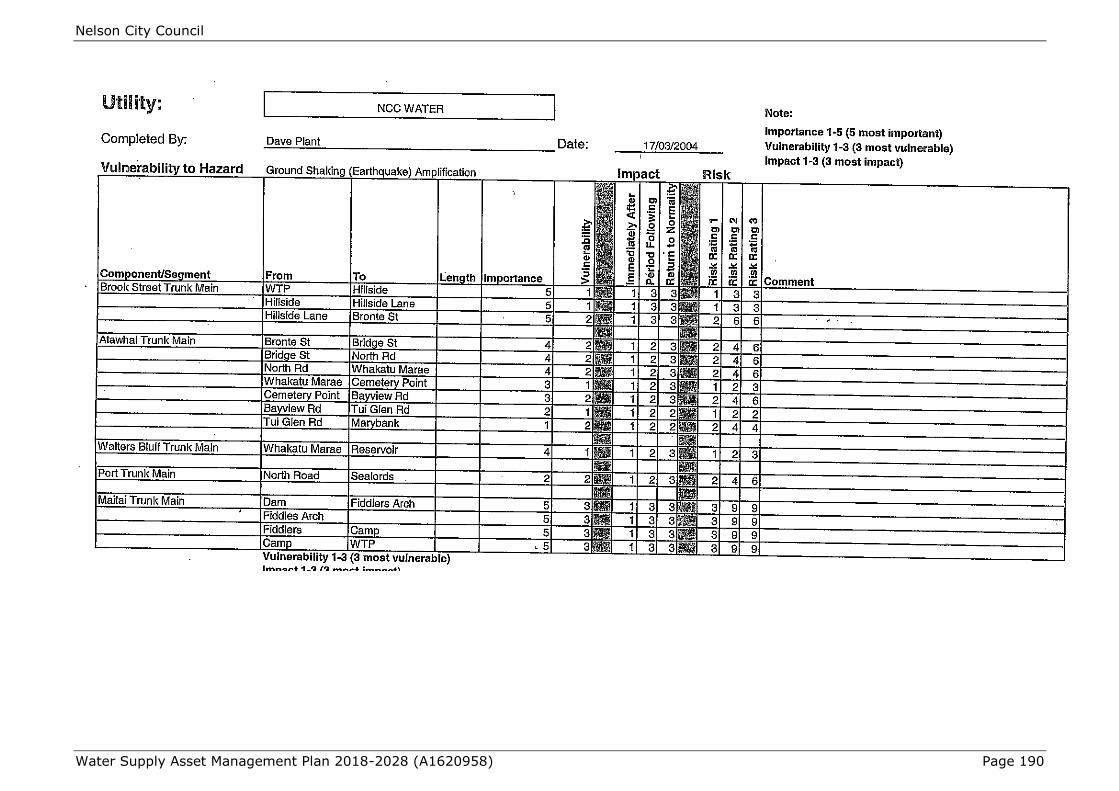
Nelson City Council
Water Supply Asset Management Plan 2018-2028 (A1620958) Page 190
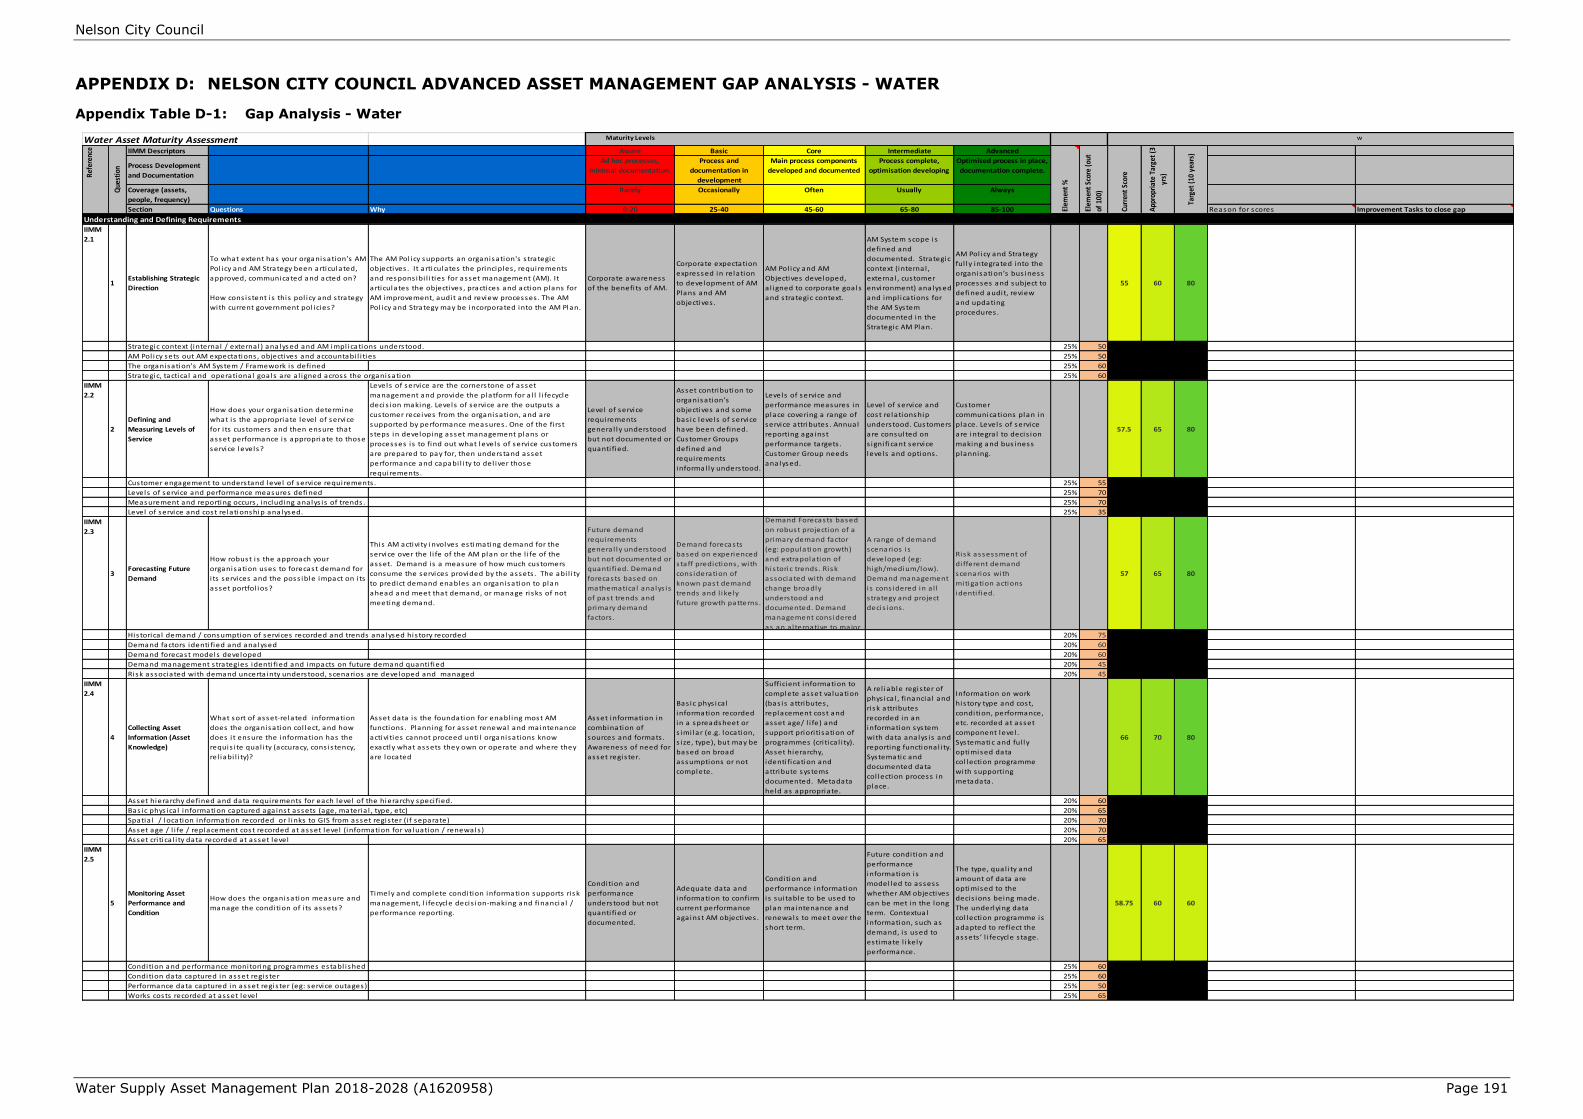
Nelson City Council
Water Supply Asset Management Plan 2018-2028 (A1620958) Page 191
APPENDIX D: NELSON CITY COUNCIL ADVANCED ASSET MANAGEMENT GAP ANALYSIS - WATER
Appendix Table D-1: Gap Analysis - Water
Water Asset Maturity Assessment Maturity Levels w
IIMM Descriptors Aware Basic Core Intermediate Advanced
Process Development
and Documentation
Ad hoc processes,
minimal documentation.
Process and
documentation in
development
Main process components
developed and documented
Process complete,
optimisation developing
Optimised process in place,
documentation complete.
Coverage (assets,
people, frequency)
Rarely Occasionally Often Usually Always
Section Questions Why 0-20 25-40 45-60 65-80 85-100 Reason for scores Improvement Tasks to close gap
Understanding and Defining RequirementsIIMM
2.1
1Establishing Strategic
Direction
To what extent has your organisation’s AM
Pol icy and AM Strategy been articulated,
approved, communicated and acted on?
How cons is tent i s this pol icy and s trategy
with current government pol icies?
The AM Pol icy supports an organisation's s trategic
objectives . It articulates the principles , requirements
and respons ibi l i ties for asset management (AM). It
articulates the objectives , practices and action plans for
AM improvement, audit and review processes . The AM
Pol icy and Strategy may be incorporated into the AM Plan.
Corporate awareness
of the benefi ts of AM.
Corporate expectation
expressed in relation
to development of AM
Plans and AM
objectives .
AM Pol icy and AM
Objectives developed,
a l igned to corporate goals
and s trategic context.
AM System scope is
defined and
documented. Strategic
context (internal ,
external , customer
environment) analysed
and impl ications for
the AM System
documented in the
Strategic AM Plan.
AM Pol icy and Strategy
ful ly integrated into the
organisation’s bus iness
processes and subject to
defined audit, review
and updating
procedures .
55 60 80
Strategic context (internal / external ) analysed and AM impl ications understood. 25% 50
AM Pol icy sets out AM expectations , objectives and accountabi l i ties 25% 50
The organisation's AM System / Framework i s defined 25% 60
Strategic, tactica l and operational goals are a l igned across the organisation 25% 60
IIMM
2.2
2
Defining and
Measuring Levels of
Service
How does your organisation determine
what i s the appropriate level of service
for i ts customers and then ensure that
asset performance is appropriate to those
service levels?
Levels of service are the cornerstone of asset
management and provide the platform for a l l l i fecycle
decis ion making. Levels of service are the outputs a
customer receives from the organisation, and are
supported by performance measures . One of the fi rs t
s teps in developing asset management plans or
processes i s to find out what levels of service customers
are prepared to pay for, then understand asset
performance and capabi l i ty to del iver those
requirements .
Level of service
requirements
genera l ly understood
but not documented or
quanti fied.
Asset contribution to
organisation’s
objectives and some
bas ic levels of service
have been defined.
Customer Groups
defined and
requirements
informal ly understood.
Levels of service and
performance measures in
place covering a range of
service attributes . Annual
reporting against
performance targets .
Customer Group needs
analysed.
Level of service and
cost relationship
understood. Customers
are consulted on
s igni ficant service
levels and options .
Customer
communications plan in
place. Levels of service
are integra l to decis ion
making and bus iness
planning.
57.5 65 80
Customer engagement to understand level of service requirements . 25% 55
Levels of service and performance measures defined 25% 70
Measurement and reporting occurs , including analys is of trends . 25% 70
Level of service and cost relationship analysed. 25% 35
IIMM
2.3
3Forecasting Future
Demand
How robust i s the approach your
organisation uses to forecast demand for
i ts services and the poss ible impact on i ts
asset portfol ios?
This AM activi ty involves estimating demand for the
service over the l i fe of the AM plan or the l i fe of the
asset. Demand is a measure of how much customers
consume the services provided by the assets . The abi l i ty
to predict demand enables an organisation to plan
ahead and meet that demand, or manage risks of not
meeting demand.
Future demand
requirements
genera l ly understood
but not documented or
quanti fied. Demand
forecasts based on
mathematica l analys is
of past trends and
primary demand
factors .
Demand forecasts
based on experienced
s taff predictions , with
cons ideration of
known past demand
trends and l ikely
future growth patterns .
Demand Forecasts based
on robust projection of a
primary demand factor
(eg: population growth)
and extrapolation of
his toric trends . Risk
associated with demand
change broadly
understood and
documented. Demand
management cons idered
as an a l ternative to major
A range of demand
scenarios i s
developed (eg:
high/medium/low).
Demand management
i s cons idered in a l l
s trategy and project
decis ions .
Risk assessment of
di fferent demand
scenarios with
mitigation actions
identi fied.
57 65 80
Historica l demand / consumption of services recorded and trends analysed his tory recorded 20% 75
Demand factors identi fied and analysed 20% 60
Demand forecast models developed 20% 60
Demand management s trategies identi fied and impacts on future demand quanti fied 20% 45
Risk associated with demand uncerta inty understood, scenarios are developed and managed 20% 45
IIMM
2.4
4
Collecting Asset
Information (Asset
Knowledge)
What sort of asset-related information
does the organisation col lect, and how
does i t ensure the information has the
requis i te qual i ty (accuracy, cons is tency,
rel iabi l i ty)?
Asset data i s the foundation for enabl ing most AM
functions . Planning for asset renewal and maintenance
activi ties cannot proceed unti l organisations know
exactly what assets they own or operate and where they
are located
Asset information in
combination of
sources and formats .
Awareness of need for
asset regis ter.
Bas ic phys ica l
information recorded
in a spreadsheet or
s imi lar (e.g. location,
s ize, type), but may be
based on broad
assumptions or not
complete.
Sufficient information to
complete asset va luation
(bas is attributes ,
replacement cost and
asset age/ l i fe) and
support priori ti sation of
programmes (cri tica l i ty).
Asset hierarchy,
identi fication and
attribute systems
documented. Metadata
held as appropriate.
A rel iable regis ter of
phys ica l , financia l and
risk attributes
recorded in an
information system
with data analys is and
reporting functional i ty.
Systematic and
documented data
col lection process in
place.
Information on work
his tory type and cost,
condition, performance,
etc. recorded at asset
component level .
Systematic and ful ly
optimised data
col lection programme
with supporting
metadata.
66 70 80
Asset hierarchy defined and data requirements for each level of the hierarchy speci fied. 20% 60
Bas ic phys ica l information captured against assets (age, materia l , type, etc) 20% 65
Spatia l / location information recorded or l inks to GIS from asset regis ter (i f separate) 20% 70
Asset age / l i fe / replacement cost recorded at asset level (information for va luation / renewals ) 20% 70
Asset cri tica l i ty data recorded at asset level 20% 65
IIMM
2.5
5
Monitoring Asset
Performance and
Condition
How does the organisation measure and
manage the condition of i ts assets?
Timely and complete condition information supports ri sk
management, l i fecycle decis ion-making and financia l /
performance reporting.
Condition and
performance
understood but not
quanti fied or
documented.
Adequate data and
information to confi rm
current performance
against AM objectives .
Condition and
performance information
is sui table to be used to
plan maintenance and
renewals to meet over the
short term.
Future condition and
performance
information is
model led to assess
whether AM objectives
can be met in the long
term. Contextual
information, such as
demand, i s used to
estimate l ikely
performance.
The type, qual i ty and
amount of data are
optimised to the
decis ions being made.
The underlying data
col lection programme is
adapted to reflect the
assets ’ l i fecycle s tage.
58.75 60 60
Condition and performance monitoring programmes establ ished 25% 60
Condition data captured in asset regis ter 25% 60
Performance data captured in asset regis ter (eg: service outages) 25% 50
Works costs recorded at asset level 25% 65
Targ
et (
10 y
ears
)
App
ropr
iate
Tar
get
(3
yrs)R
efer
ence
Que
stio
n
Curr
ent
Scor
e
Elem
ent
Scor
e (o
ut
of 1
00)
Elem
ent
%
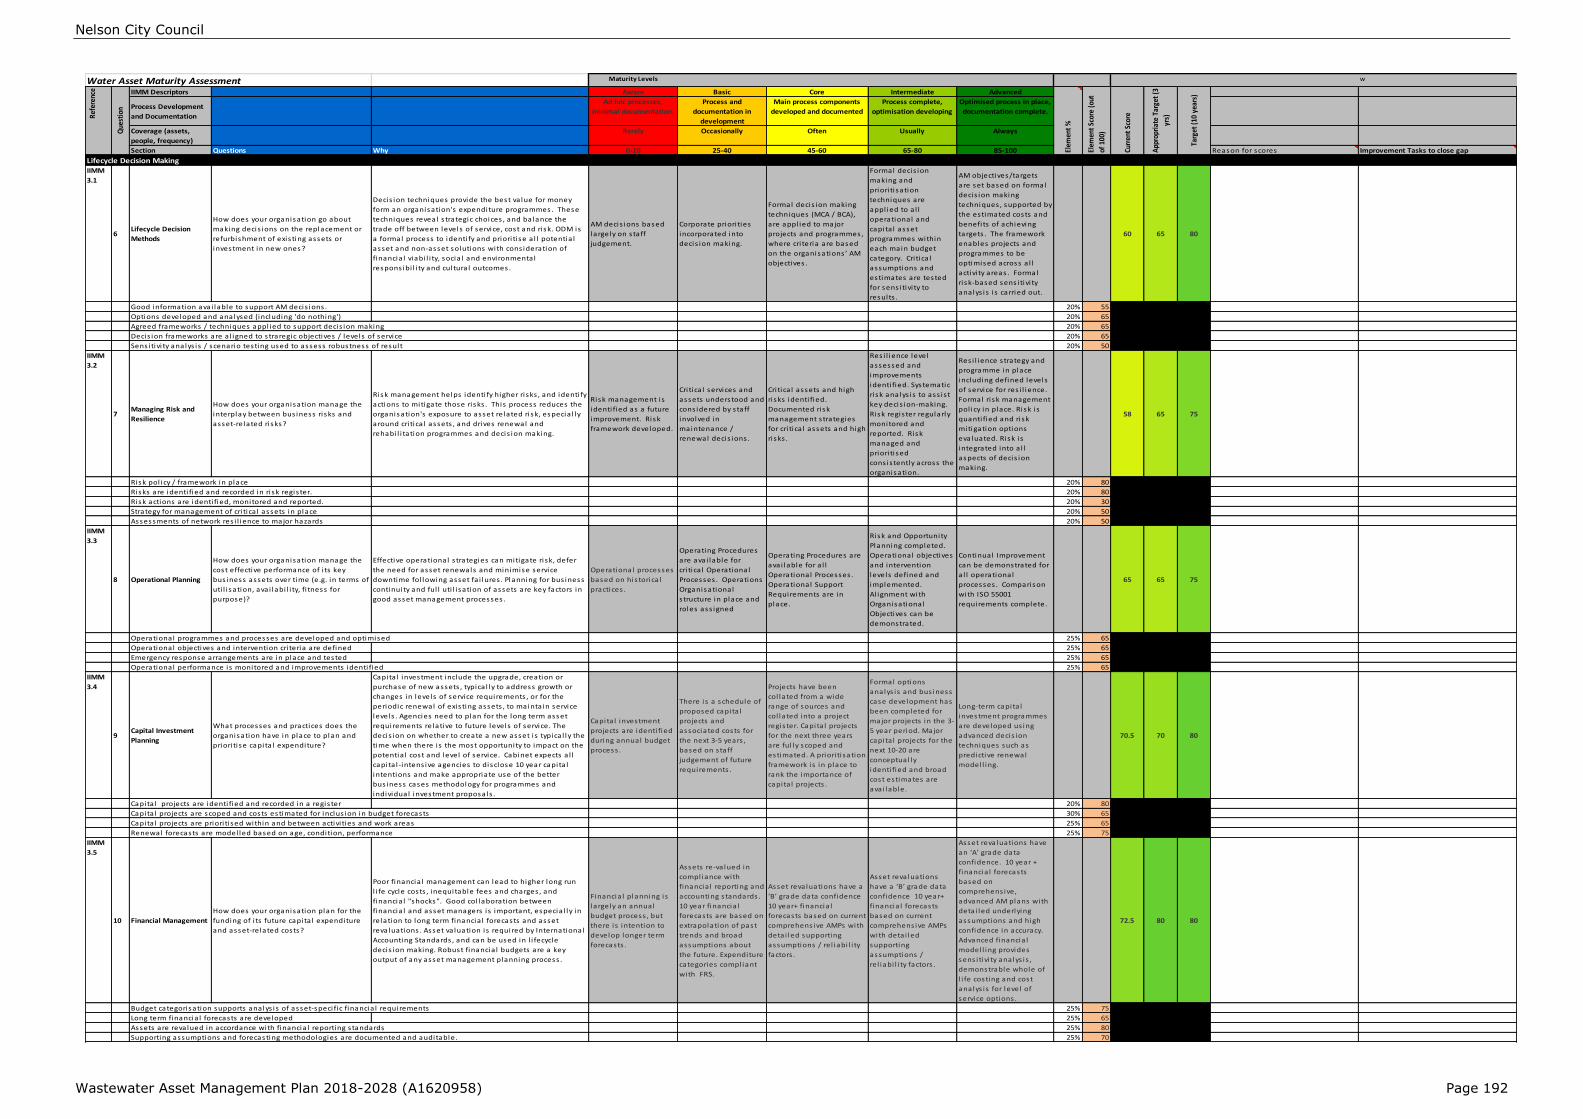
Nelson City Council
Wastewater Asset Management Plan 2018-2028 (A1620958) Page 192
Water Asset Maturity Assessment Maturity Levels w
IIMM Descriptors Aware Basic Core Intermediate Advanced
Process Development
and Documentation
Ad hoc processes,
minimal documentation.
Process and
documentation in
development
Main process components
developed and documented
Process complete,
optimisation developing
Optimised process in place,
documentation complete.
Coverage (assets,
people, frequency)
Rarely Occasionally Often Usually Always
Section Questions Why 0-20 25-40 45-60 65-80 85-100 Reason for scores Improvement Tasks to close gap
Lifecycle Decision MakingIIMM
3.1
6Lifecycle Decision
Methods
How does your organisation go about
making decis ions on the replacement or
refurbishment of exis ting assets or
investment in new ones?
Decis ion techniques provide the best va lue for money
form an organisation's expenditure programmes. These
techniques reveal s trategic choices , and balance the
trade off between levels of service, cost and risk. ODM is
a formal process to identi fy and priori ti se a l l potentia l
asset and non-asset solutions with cons ideration of
financia l viabi l i ty, socia l and environmental
respons ibi l i ty and cul tura l outcomes.
AM decis ions based
largely on s taff
judgement.
Corporate priori ties
incorporated into
decis ion making.
Formal decis ion making
techniques (MCA / BCA),
are appl ied to major
projects and programmes,
where cri teria are based
on the organisations ’ AM
objectives .
Formal decis ion
making and
priori ti sation
techniques are
appl ied to a l l
operational and
capita l asset
programmes within
each main budget
category. Cri tica l
assumptions and
estimates are tested
for sens i tivi ty to
results .
AM objectives/targets
are set based on formal
decis ion making
techniques , supported by
the estimated costs and
benefi ts of achieving
targets . The framework
enables projects and
programmes to be
optimised across a l l
activi ty areas . Formal
ri sk-based sens i tivi ty
analys is i s carried out.
60 65 80
Good information ava i lable to support AM decis ions . 20% 55
Options developed and analysed (including 'do nothing') 20% 65
Agreed frameworks / techniques appl ied to support decis ion making 20% 65
Decis ion frameworks are a l igned to s traregic objectives / levels of service 20% 65
Sens i tivi ty analys is / scenario testing used to assess robustness of result 20% 50
IIMM
3.2
7Managing Risk and
Resilience
How does your organisation manage the
interplay between bus iness ri sks and
asset-related risks?
Risk management helps identi fy higher ri sks , and identi fy
actions to mitigate those ri sks . This process reduces the
organisation's exposure to asset related risk, especia l ly
around cri tica l assets , and drives renewal and
rehabi l i tation programmes and decis ion making.
Risk management i s
identi fied as a future
improvement. Risk
framework developed.
Cri tica l services and
assets understood and
cons idered by s taff
involved in
maintenance /
renewal decis ions .
Cri tica l assets and high
ri sks identi fied.
Documented risk
management s trategies
for cri tica l assets and high
ri sks .
Res i l ience level
assessed and
improvements
identi fied. Systematic
ri sk analys is to ass is t
key decis ion-making.
Risk regis ter regularly
monitored and
reported. Risk
managed and
priori ti sed
cons is tently across the
organisation.
Res i l ience s trategy and
programme in place
including defined levels
of service for res i l ience.
Formal ri sk management
pol icy in place. Risk i s
quanti fied and risk
mitigation options
eva luated. Risk i s
integrated into a l l
aspects of decis ion
making.
58 65 75
Risk pol icy / framework in place 20% 80
Risks are identi fied and recorded in ri sk regis ter. 20% 80
Risk actions are identi fied, monitored and reported. 20% 30
Strategy for management of cri tica l assets in place 20% 50
Assessments of network res i l ience to major hazards 20% 50
IIMM
3.3
8 Operational Planning
How does your organisation manage the
cost effective performance of i ts key
bus iness assets over time (e.g. in terms of
uti l i sation, ava i labi l i ty, fi tness for
purpose)?
Effective operational s trategies can mitigate ri sk, defer
the need for asset renewals and minimise service
downtime fol lowing asset fa i lures . Planning for bus iness
continuity and ful l uti l i sation of assets are key factors in
good asset management processes .
Operational processes
based on his torica l
practices .
Operating Procedures
are ava i lable for
cri tica l Operational
Processes . Operations
Organisational
s tructure in place and
roles ass igned
Operating Procedures are
ava i lable for a l l
Operational Processes .
Operational Support
Requirements are in
place.
Risk and Opportunity
Planning completed.
Operational objectives
and intervention
levels defined and
implemented.
Al ignment with
Organisational
Objectives can be
demonstrated.
Continual Improvement
can be demonstrated for
a l l operational
processes . Comparison
with ISO 55001
requirements complete.
65 65 75
Operational programmes and processes are developed and optimised 25% 65
Operational objectives and intervention cri teria are defined 25% 65
Emergency response arrangements are in place and tested 25% 65
Operational performance is monitored and improvements identi fied 25% 65
IIMM
3.4
9Capital Investment
Planning
What processes and practices does the
organisation have in place to plan and
priori ti se capita l expenditure?
Capita l investment include the upgrade, creation or
purchase of new assets , typica l ly to address growth or
changes in levels of service requirements , or for the
periodic renewal of exis ting assets , to mainta in service
levels . Agencies need to plan for the long term asset
requirements relative to future levels of service. The
decis ion on whether to create a new asset i s typica l ly the
time when there i s the most opportunity to impact on the
potentia l cost and level of service. Cabinet expects a l l
capita l -intens ive agencies to disclose 10 year capita l
intentions and make appropriate use of the better
bus iness cases methodology for programmes and
individual investment proposals .
Capita l investment
projects are identi fied
during annual budget
process .
There i s a schedule of
proposed capita l
projects and
associated costs for
the next 3-5 years ,
based on s taff
judgement of future
requirements .
Projects have been
col lated from a wide
range of sources and
col lated into a project
regis ter. Capita l projects
for the next three years
are ful ly scoped and
estimated. A priori ti sation
framework i s in place to
rank the importance of
capita l projects .
Formal options
analys is and bus iness
case development has
been completed for
major projects in the 3-
5 year period. Major
capita l projects for the
next 10-20 are
conceptual ly
identi fied and broad
cost estimates are
ava i lable.
Long-term capita l
investment programmes
are developed us ing
advanced decis ion
techniques such as
predictive renewal
model l ing.
70.5 70 80
Capita l projects are identi fied and recorded in a regis ter 20% 80
Capita l projects are scoped and costs estimated for inclus ion in budget forecasts 30% 65
Capita l projects are priori ti sed within and between activi ties and work areas 25% 65
Renewal forecasts are model led based on age, condition, performance 25% 75
IIMM
3.5
10 Financial Management
How does your organisation plan for the
funding of i ts future capita l expenditure
and asset-related costs?
Poor financia l management can lead to higher long run
l i fe cycle costs , inequitable fees and charges , and
financia l "shocks". Good col laboration between
financia l and asset managers i s important, especia l ly in
relation to long term financia l forecasts and asset
reva luations . Asset va luation is required by International
Accounting Standards , and can be used in l i fecycle
decis ion making. Robust financia l budgets are a key
output of any asset management planning process .
Financia l planning i s
largely an annual
budget process , but
there i s intention to
develop longer term
forecasts .
Assets re-va lued in
compl iance with
financia l reporting and
accounting s tandards .
10 year financia l
forecasts are based on
extrapolation of past
trends and broad
assumptions about
the future. Expenditure
categories compl iant
with FRS.
Asset reva luations have a
‘B’ grade data confidence
10 year+ financia l
forecasts based on current
comprehens ive AMPs with
deta i led supporting
assumptions / rel iabi l i ty
factors .
Asset reva luations
have a ‘B’ grade data
confidence 10 year+
financia l forecasts
based on current
comprehens ive AMPs
with deta i led
supporting
assumptions /
rel iabi l i ty factors .
Asset reva luations have
an ‘A’ grade data
confidence. 10 year +
financia l forecasts
based on
comprehens ive,
advanced AM plans with
deta i led underlying
assumptions and high
confidence in accuracy.
Advanced financia l
model l ing provides
sens i tivi ty analys is ,
demonstrable whole of
l i fe costing and cost
analys is for level of
service options .
72.5 80 80
Budget categorisation supports analys is of asset-speci fic financia l requirements 25% 75
Long term financia l forecasts are developed 25% 65
Assets are revalued in accordance with financia l reporting s tandards 25% 80
Supporting assumptions and forecasting methodologies are documented and auditable. 25% 70
Targ
et (
10 y
ears
)
App
ropr
iate
Tar
get
(3
yrs)R
efer
ence
Que
stio
n
Curr
ent
Scor
e
Elem
ent
Scor
e (o
ut
of 1
00)
Elem
ent
%

Nelson City Council
Wastewater Asset Management Plan 2018-2028 (A1620958) Page 193
Water Asset Maturity Assessment Maturity Levels w
IIMM Descriptors Aware Basic Core Intermediate Advanced
Process Development
and Documentation
Ad hoc processes,
minimal documentation.
Process and
documentation in
development
Main process components
developed and documented
Process complete,
optimisation developing
Optimised process in place,
documentation complete.
Coverage (assets,
people, frequency)
Rarely Occasionally Often Usually Always
Section Questions Why 0-20 25-40 45-60 65-80 85-100 Reason for scores Improvement Tasks to close gap
Asset Management EnablersIIMM
4.1
11Asset Management
Leadership and Teams
What i s the level of organisational
commitment to asset management?
How is this reflected in exis ting
organisation s tructure, respons ibi l i ties
and resourcing of AM competencies?
Effective asset management requires a committed and co-
ordinated effort across a l l sections of an organisation.
Leadership i s
supportive of AM.
AM functions are
carried out by smal l
groups . Roles reflect
AM requirements .
Pos i tion descriptions
incorporate AM roles . AM
coordination processes
establ ished. Ownership
and support of AM by
leadership. Awareness of
AM across most of the
organisation.
Organisational
s tructures support AM.
Roles reflect AM
resourcing
requirements and
reflected in pos i tion
descriptions for key
roles . Cons is tent
approach to AM across
the organisation.
Internal
communication plan
establ ished.
Roles reflect AM
requirements and
defined in a l l relevant
pos i tion descriptions .
Formal documented
assessment of AM
capabi l i ty and capaci ty
requirements to achieve
AM objectives .
Demonstrable a l ignment
between AM objectives ,
AM systems and
individual
respons ibi l i ties
52 65 70
Leadership supports and actively advocates investment in AM. 20% 60
AM roles and role interfaces are defined. 20% 55
Resources (internal and external ) to support an effective 'AM System' are in place. 20% 55
Al l s taff understand AM and their role / contribution to the AM System. 20% 45
AM capabi l i ty requirements are reviewed and provided 20% 45
IIMM
4.2
12 Developing AM Plans
How does your organisation develop,
communicate, resource and action i ts
asset management plans?
An asset management plan i s a wri tten representation of
intended capita l and operational programmes for i t's
new and exis ting infrastructure, based on the
organisations understanding of demand, customer
requirements and i t's own network of assets .
Stated intention to
develop AM Plans
AM Plans conta ins
bas ic information on
assets , service levels ,
planned works and
financia l forecasts (5-
10 years ) and future
improvements .
AM objectives are defined
with cons ideration of
s trategic context.
Approach to ri sk and
cri tica l assets described,
top-down condition and
performance assessment,
future demand forecasts ,
description of supporting
AM processes , 10 year
financia l forecasts , 3 year
AM improvement plan.
Analys is of asset
condition and
performance trends
(past/future), customer
engagement in setting
levels of service,
ODM/risk techniques
appl ied to major
programmes. Strategic
context analysed with
ri sks , i s sues and
responses described.
Evidence of programmes
driven by comprehens ive
decis ion making
techniques , ri sk
management
programmes and level of
service/cost trade-off
analys is . Improvement
programmes largely
complete with focus on
ongoing maintenance of
current practice.
67 70 75
AMP development includes relevant s taff and s takeholders 20% 60
AMP content in l ine with IIMM 20% 65
AMP document i s of good qual i ty, readable for target audience 20% 65
AMPs are integration with other bus iness processes / plans 20% 55
AMPs are communicated to / approved by Counci l / Executive/ key s takeholders 20% 90
IIMM
4.3
15
Establishing and
Maintaining
Management Systems
How does your organisation ensure that
i t’s asset management processes and
practices are appropriate and effective?
When AM processes are part of a Qual i ty Management
system the organisation is able to operate cons is tent
and rel iable processes ,, provide evidence that what was
planned was del ivered, and ensure that knowledge is
shared. In short, that processes are appropriate and
cons is tently appl ied and understood.
Awareness of need to
formal ize systems and
processes .
Simple process
documentation in
place for service-
cri tica l AM activi ties .
Bas ic Qual i ty
Management System in
place that covers a l l
organisational activi ties .
Cri tica l AM processes are
documented, monitored
and subject to review. AM
System meets the
requirements of ISO 55001.
Process
documentation
implemented in
accordance with the
AM System to
appropriate level of
deta i l . Internal
management systems
are a l igned.
ISO certi fication to
multiple s tandards for
large asset intens ive
organisations , including
ISO 55001. Strong
integration of a l l
management systems
within the organisation.
46.25 60 70
Management systems are in place to support AM. 25% 60
AM processes are documented within a management system framework 25% 45
Processes are subject to review, audit and continual improvement 25% 45
AM System is a l igned / certi fied to ISO 55001 25% 35
Ta
rge
t (1
0 y
ea
rs)
Ap
pro
pri
ate
Ta
rge
t (3
yrs
)Re
fere
nce
Qu
est
ion
Cu
rre
nt
Sco
re
Ele
me
nt
Sco
re (
ou
t
of
10
0)
Ele
me
nt
%
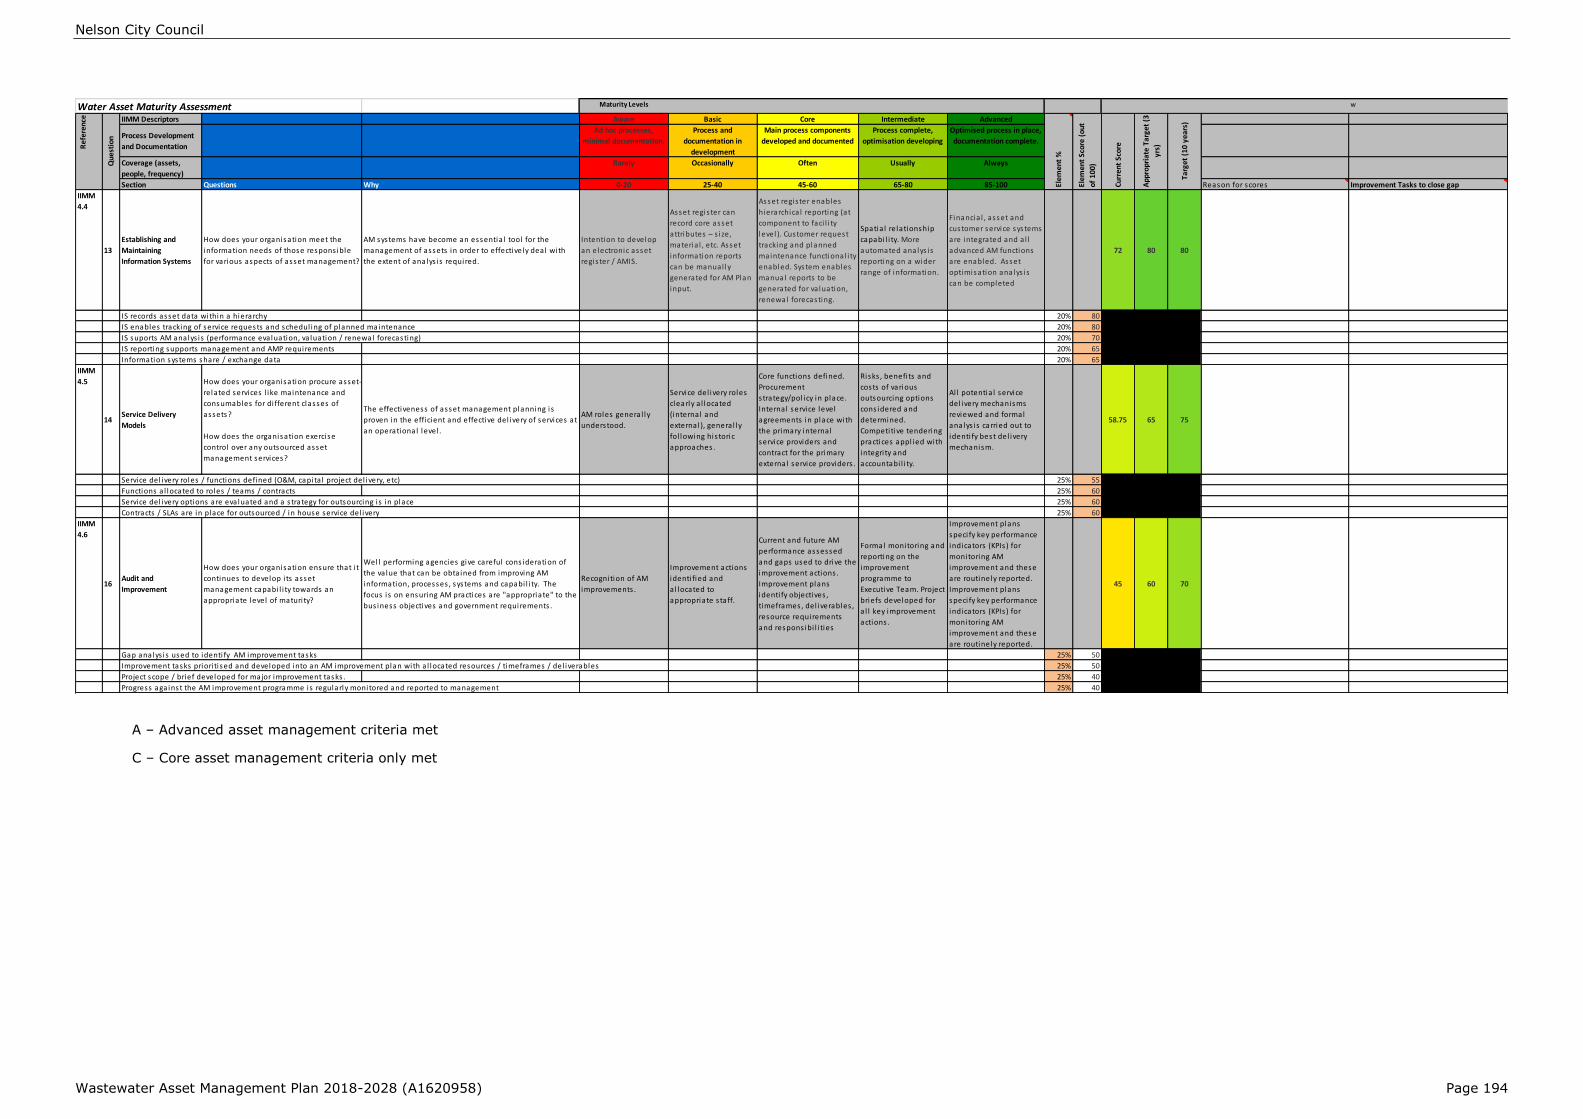
Nelson City Council
Wastewater Asset Management Plan 2018-2028 (A1620958) Page 194
A – Advanced asset management criteria met
C – Core asset management criteria only met
Water Asset Maturity Assessment Maturity Levels w
IIMM Descriptors Aware Basic Core Intermediate Advanced
Process Development
and Documentation
Ad hoc processes,
minimal documentation.
Process and
documentation in
development
Main process components
developed and documented
Process complete,
optimisation developing
Optimised process in place,
documentation complete.
Coverage (assets,
people, frequency)
Rarely Occasionally Often Usually Always
Section Questions Why 0-20 25-40 45-60 65-80 85-100 Reason for scores Improvement Tasks to close gap
IIMM
4.4
13
Establishing and
Maintaining
Information Systems
How does your organisation meet the
information needs of those respons ible
for various aspects of asset management?
AM systems have become an essentia l tool for the
management of assets in order to effectively deal with
the extent of analys is required.
Intention to develop
an electronic asset
regis ter / AMIS.
Asset regis ter can
record core asset
attributes – s ize,
materia l , etc. Asset
information reports
can be manual ly
generated for AM Plan
input.
Asset regis ter enables
hierarchica l reporting (at
component to faci l i ty
level ). Customer request
tracking and planned
maintenance functional i ty
enabled. System enables
manual reports to be
generated for va luation,
renewal forecasting.
Spatia l relationship
capabi l i ty. More
automated analys is
reporting on a wider
range of information.
Financia l , asset and
customer service systems
are integrated and a l l
advanced AM functions
are enabled. Asset
optimisation analys is
can be completed
72 80 80
IS records asset data within a hierarchy 20% 80
IS enables tracking of service requests and schedul ing of planned maintenance 20% 80
IS suports AM analys is (performance evaluation, va luation / renewal forecasting) 20% 70
IS reporting supports management and AMP requirements 20% 65
Information systems share / exchange data 20% 65
IIMM
4.5
14Service Delivery
Models
How does your organisation procure asset-
related services l ike maintenance and
consumables for di fferent classes of
assets?
How does the organisation exercise
control over any outsourced asset
management services?
The effectiveness of asset management planning i s
proven in the efficient and effective del ivery of services at
an operational level .
AM roles genera l ly
understood.
Service del ivery roles
clearly a l located
(internal and
external ), genera l ly
fol lowing his toric
approaches .
Core functions defined.
Procurement
s trategy/pol icy in place.
Internal service level
agreements in place with
the primary internal
service providers and
contract for the primary
external service providers .
Risks , benefi ts and
costs of various
outsourcing options
cons idered and
determined.
Competi tive tendering
practices appl ied with
integri ty and
accountabi l i ty.
Al l potentia l service
del ivery mechanisms
reviewed and formal
analys is carried out to
identi fy best del ivery
mechanism.
58.75 65 75
Service del ivery roles / functions defined (O&M, capita l project del ivery, etc) 25% 55
Functions a l located to roles / teams / contracts 25% 60
Service del ivery options are eva luated and a s trategy for outsourcing i s in place 25% 60
Contracts / SLAs are in place for outsourced / in house service del ivery 25% 60
IIMM
4.6
16Audit and
Improvement
How does your organisation ensure that i t
continues to develop i ts asset
management capabi l i ty towards an
appropriate level of maturi ty?
Wel l performing agencies give careful cons ideration of
the va lue that can be obta ined from improving AM
information, processes , systems and capabi l i ty. The
focus i s on ensuring AM practices are "appropriate" to the
bus iness objectives and government requirements .
Recognition of AM
improvements .
Improvement actions
identi fied and
a l located to
appropriate s taff.
Current and future AM
performance assessed
and gaps used to drive the
improvement actions .
Improvement plans
identi fy objectives ,
timeframes, del iverables ,
resource requirements
and respons ibi l i ties
Formal monitoring and
reporting on the
improvement
programme to
Executive Team. Project
briefs developed for
a l l key improvement
actions .
Improvement plans
speci fy key performance
indicators (KPIs ) for
monitoring AM
improvement and these
are routinely reported.
Improvement plans
speci fy key performance
indicators (KPIs ) for
monitoring AM
improvement and these
are routinely reported.
45 60 70
Gap analys is used to identi fy AM improvement tasks 25% 50
Improvement tasks priori ti sed and developed into an AM improvement plan with a l located resources / timeframes / del iverables 25% 50
Project scope / brief developed for major improvement tasks . 25% 40
Progress against the AM improvement programme is regularly monitored and reported to management 25% 40
Ta
rge
t (1
0 y
ea
rs)
Ap
pro
pri
ate
Ta
rge
t (3
yrs
)Re
fere
nce
Qu
est
ion
Cu
rre
nt
Sco
re
Ele
me
nt
Sco
re (
ou
t
of
10
0)
Ele
me
nt
%
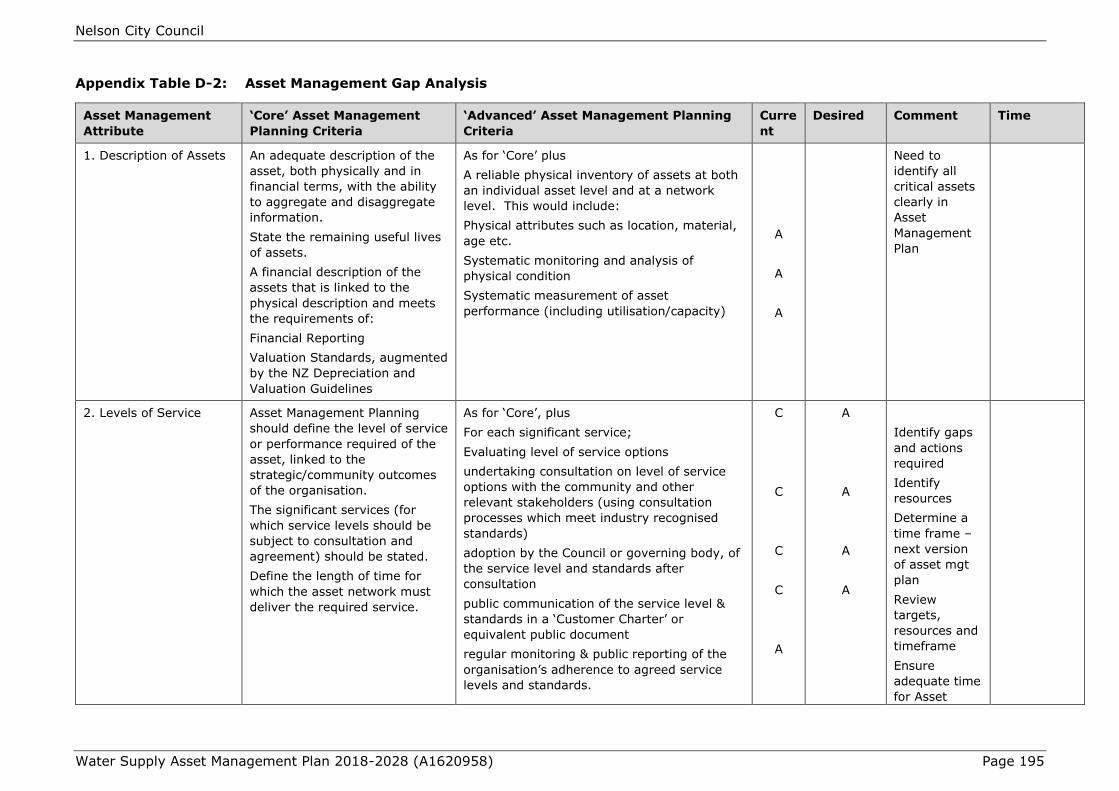
Nelson City Council
Water Supply Asset Management Plan 2018-2028 (A1620958) Page 195
Appendix Table D-2: Asset Management Gap Analysis
Asset Management
Attribute
‘Core’ Asset Management
Planning Criteria
‘Advanced’ Asset Management Planning
Criteria
Curre
nt
Desired Comment Time
1. Description of Assets An adequate description of the
asset, both physically and in
financial terms, with the ability
to aggregate and disaggregate
information.
State the remaining useful lives
of assets.
A financial description of the
assets that is linked to the
physical description and meets
the requirements of:
Financial Reporting
Valuation Standards, augmented
by the NZ Depreciation and
Valuation Guidelines
As for ‘Core’ plus
A reliable physical inventory of assets at both
an individual asset level and at a network
level. This would include:
Physical attributes such as location, material,
age etc.
Systematic monitoring and analysis of
physical condition
Systematic measurement of asset
performance (including utilisation/capacity)
A
A
A
Need to
identify all
critical assets
clearly in
Asset
Management
Plan
2. Levels of Service Asset Management Planning
should define the level of service
or performance required of the
asset, linked to the
strategic/community outcomes
of the organisation.
The significant services (for
which service levels should be
subject to consultation and
agreement) should be stated.
Define the length of time for
which the asset network must
deliver the required service.
As for ‘Core’, plus
For each significant service;
Evaluating level of service options
undertaking consultation on level of service
options with the community and other
relevant stakeholders (using consultation
processes which meet industry recognised
standards)
adoption by the Council or governing body, of
the service level and standards after
consultation
public communication of the service level &
standards in a ‘Customer Charter’ or
equivalent public document
regular monitoring & public reporting of the
organisation’s adherence to agreed service
levels and standards.
C
C
C
C
A
A
A
A
A
Identify gaps
and actions
required
Identify
resources
Determine a
time frame –
next version
of asset mgt
plan
Review
targets,
resources and
timeframe
Ensure
adequate time
for Asset
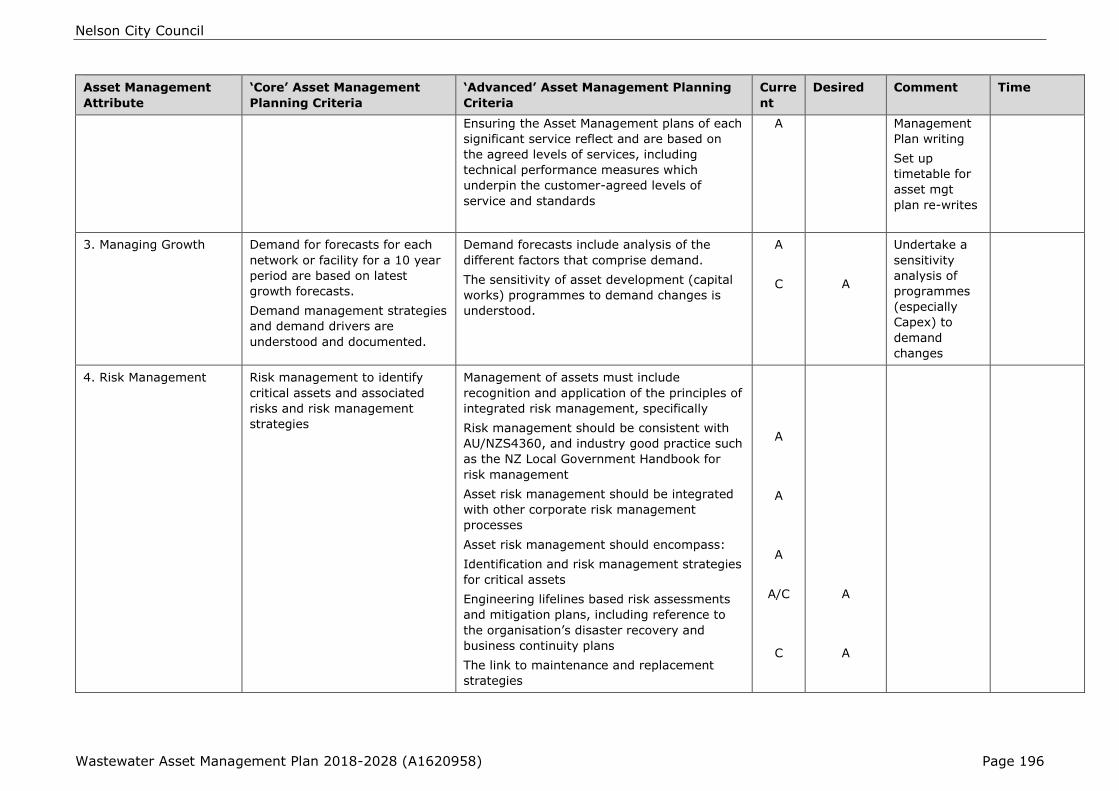
Nelson City Council
Wastewater Asset Management Plan 2018-2028 (A1620958) Page 196
Asset Management
Attribute
‘Core’ Asset Management
Planning Criteria
‘Advanced’ Asset Management Planning
Criteria
Curre
nt
Desired Comment Time
Ensuring the Asset Management plans of each
significant service reflect and are based on
the agreed levels of services, including
technical performance measures which
underpin the customer-agreed levels of
service and standards
A Management
Plan writing
Set up
timetable for
asset mgt
plan re-writes
3. Managing Growth Demand for forecasts for each
network or facility for a 10 year
period are based on latest
growth forecasts.
Demand management strategies
and demand drivers are
understood and documented.
Demand forecasts include analysis of the
different factors that comprise demand.
The sensitivity of asset development (capital
works) programmes to demand changes is
understood.
A
C
A
Undertake a
sensitivity
analysis of
programmes
(especially
Capex) to
demand
changes
4. Risk Management Risk management to identify
critical assets and associated
risks and risk management
strategies
Management of assets must include
recognition and application of the principles of
integrated risk management, specifically
Risk management should be consistent with
AU/NZS4360, and industry good practice such
as the NZ Local Government Handbook for
risk management
Asset risk management should be integrated
with other corporate risk management
processes
Asset risk management should encompass:
Identification and risk management strategies
for critical assets
Engineering lifelines based risk assessments
and mitigation plans, including reference to
the organisation’s disaster recovery and
business continuity plans
The link to maintenance and replacement
strategies
A
A
A
A/C
C
A
A
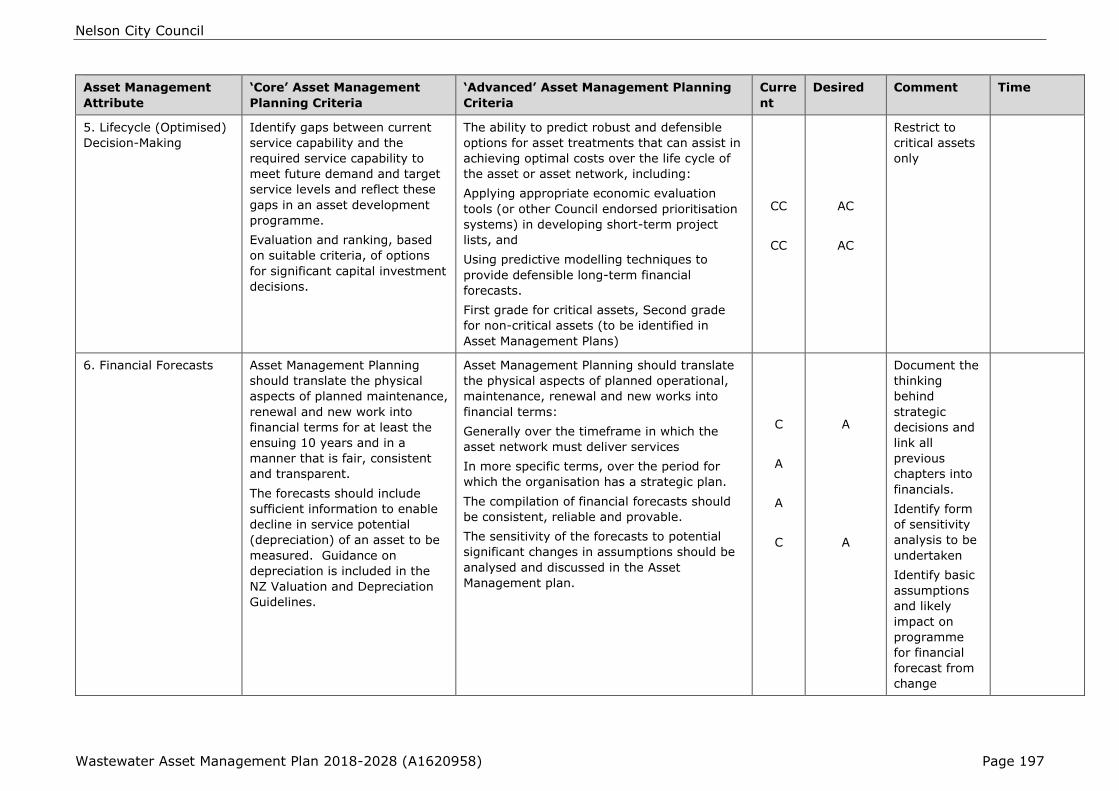
Nelson City Council
Wastewater Asset Management Plan 2018-2028 (A1620958) Page 197
Asset Management
Attribute
‘Core’ Asset Management
Planning Criteria
‘Advanced’ Asset Management Planning
Criteria
Curre
nt
Desired Comment Time
5. Lifecycle (Optimised)
Decision-Making
Identify gaps between current
service capability and the
required service capability to
meet future demand and target
service levels and reflect these
gaps in an asset development
programme.
Evaluation and ranking, based
on suitable criteria, of options
for significant capital investment
decisions.
The ability to predict robust and defensible
options for asset treatments that can assist in
achieving optimal costs over the life cycle of
the asset or asset network, including:
Applying appropriate economic evaluation
tools (or other Council endorsed prioritisation
systems) in developing short-term project
lists, and
Using predictive modelling techniques to
provide defensible long-term financial
forecasts.
First grade for critical assets, Second grade
for non-critical assets (to be identified in
Asset Management Plans)
CC
CC
AC
AC
Restrict to
critical assets
only
6. Financial Forecasts Asset Management Planning
should translate the physical
aspects of planned maintenance,
renewal and new work into
financial terms for at least the
ensuing 10 years and in a
manner that is fair, consistent
and transparent.
The forecasts should include
sufficient information to enable
decline in service potential
(depreciation) of an asset to be
measured. Guidance on
depreciation is included in the
NZ Valuation and Depreciation
Guidelines.
Asset Management Planning should translate
the physical aspects of planned operational,
maintenance, renewal and new works into
financial terms:
Generally over the timeframe in which the
asset network must deliver services
In more specific terms, over the period for
which the organisation has a strategic plan.
The compilation of financial forecasts should
be consistent, reliable and provable.
The sensitivity of the forecasts to potential
significant changes in assumptions should be
analysed and discussed in the Asset
Management plan.
C
A
A
C
A
A
Document the
thinking
behind
strategic
decisions and
link all
previous
chapters into
financials.
Identify form
of sensitivity
analysis to be
undertaken
Identify basic
assumptions
and likely
impact on
programme
for financial
forecast from
change
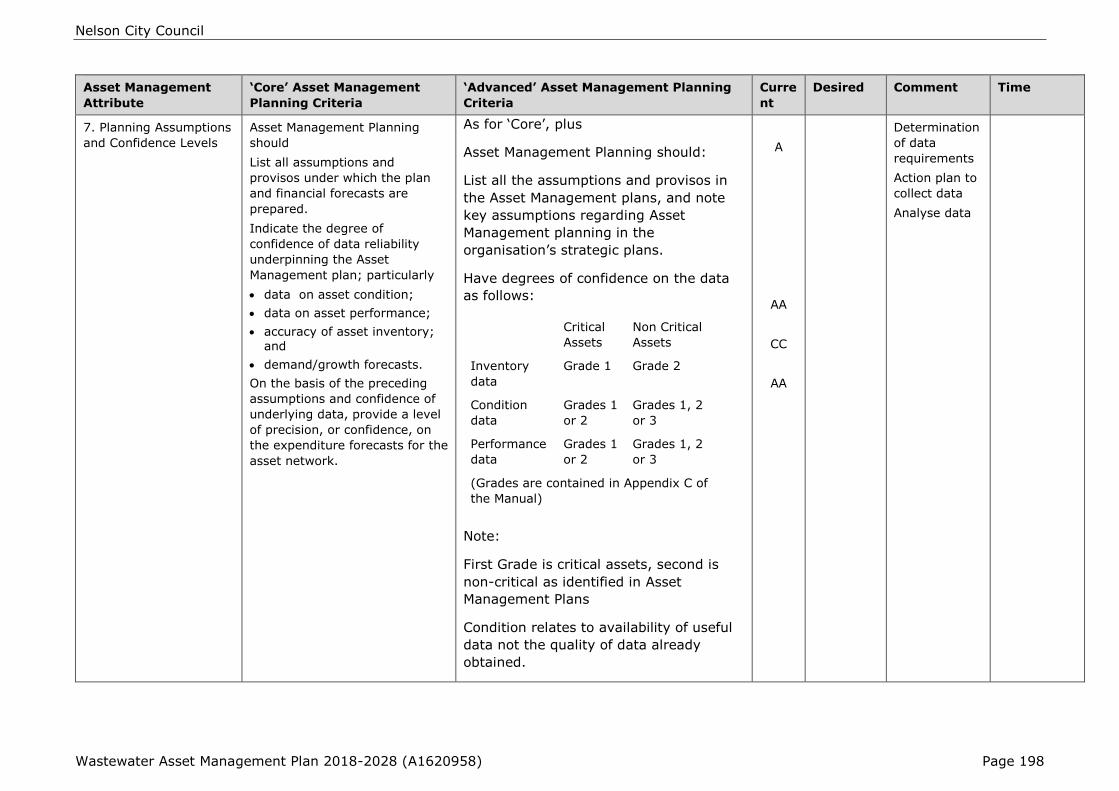
Nelson City Council
Wastewater Asset Management Plan 2018-2028 (A1620958) Page 198
Asset Management
Attribute
‘Core’ Asset Management
Planning Criteria
‘Advanced’ Asset Management Planning
Criteria
Curre
nt
Desired Comment Time
7. Planning Assumptions
and Confidence Levels
Asset Management Planning
should
List all assumptions and
provisos under which the plan
and financial forecasts are
prepared.
Indicate the degree of
confidence of data reliability
underpinning the Asset
Management plan; particularly
data on asset condition;
data on asset performance;
accuracy of asset inventory; and
demand/growth forecasts.
On the basis of the preceding
assumptions and confidence of
underlying data, provide a level
of precision, or confidence, on
the expenditure forecasts for the
asset network.
As for ‘Core’, plus
Asset Management Planning should:
List all the assumptions and provisos in
the Asset Management plans, and note
key assumptions regarding Asset
Management planning in the
organisation’s strategic plans.
Have degrees of confidence on the data
as follows:
Critical
Assets
Non Critical
Assets
Inventory
data
Grade 1 Grade 2
Condition
data
Grades 1
or 2
Grades 1, 2
or 3
Performance
data
Grades 1
or 2
Grades 1, 2
or 3
(Grades are contained in Appendix C of
the Manual)
Note:
First Grade is critical assets, second is
non-critical as identified in Asset
Management Plans
Condition relates to availability of useful
data not the quality of data already
obtained.
A
AA
CC
AA
Determination
of data
requirements
Action plan to
collect data
Analyse data

Nelson City Council
Wastewater Asset Management Plan 2018-2028 (A1620958) Page 199
Asset Management
Attribute
‘Core’ Asset Management
Planning Criteria
‘Advanced’ Asset Management Planning
Criteria
Curre
nt
Desired Comment Time
8. Outline Improvement
Programmes
Asset Management planning
should state what needs to be
done to improve Asset
Management processes and
techniques.
Improvement programmes
should outline:
the weak areas
how weak areas will be
addressed
the timeframe over which the
improvements will occur; and
the resources (human and
financial) needed
As for ‘Core’, plus
Improvement programmes should outline key
performance indicators for monitoring Asset
Management improvement.
The improvement plan should comment
generally on achievements against the
previous plan, and formally report against key
performance indicators.
C
C
A
A
Words are in
document but
need to be
collated in the
improvement
plan section
9. Planning by qualified
persons
Asset Management planning
must be undertaken by a
suitably qualified person, for
example an engineer
specialising in the relevant
activity, or a Level 6 (Tactical)
or Level 7 (Strategic) National
Diploma in Asset Management
or equivalent skill level.
If plans are prepared by persons
not suitably qualified, the plans
should be independently
assessed by a qualified person.
The planning process should be
peer reviewed.
As for ‘Core Asset Management Plan Criteria’. A
10. Commitment The Asset Management Plan
must be approved and adopted
by the governing body, Board or
Council. This includes approval
of the improvement element of
the plan.
As for ‘Core’, plus
The organisation must demonstrate that Asset
Management plan requirements are being
implemented through operational plans, and
formally report discrepancies.
A
A
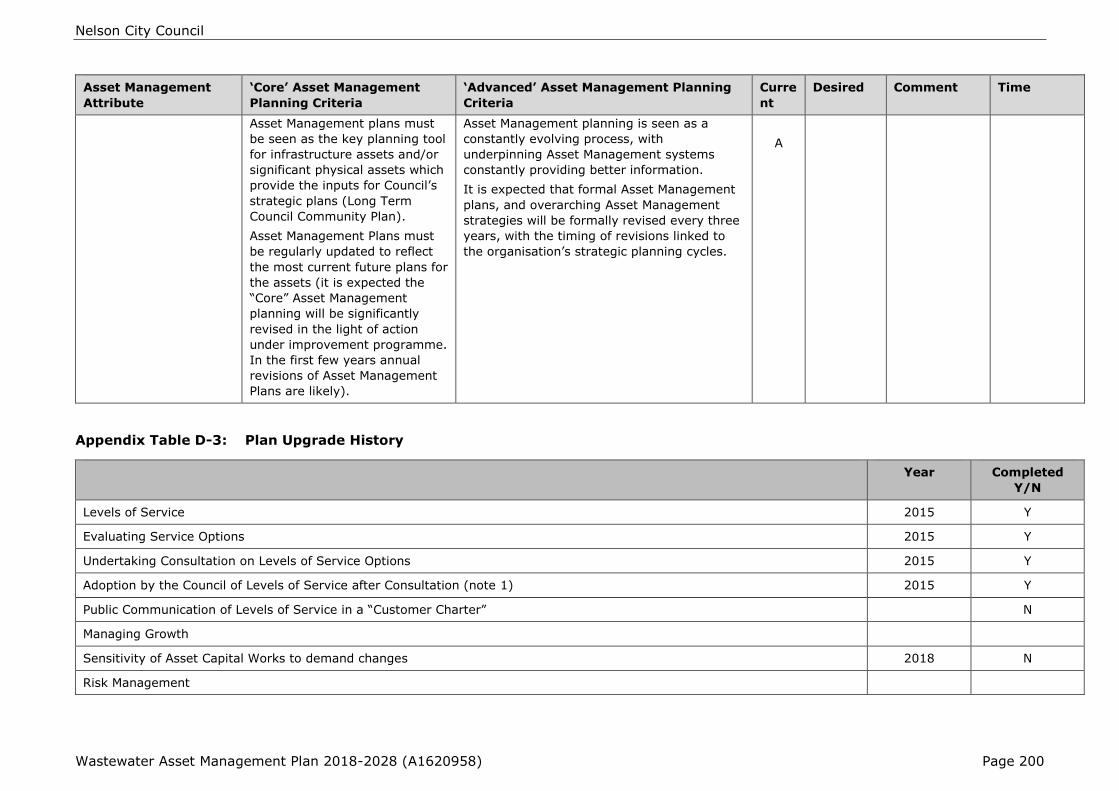
Nelson City Council
Wastewater Asset Management Plan 2018-2028 (A1620958) Page 200
Asset Management
Attribute
‘Core’ Asset Management
Planning Criteria
‘Advanced’ Asset Management Planning
Criteria
Curre
nt
Desired Comment Time
Asset Management plans must
be seen as the key planning tool
for infrastructure assets and/or
significant physical assets which
provide the inputs for Council’s
strategic plans (Long Term
Council Community Plan).
Asset Management Plans must
be regularly updated to reflect
the most current future plans for
the assets (it is expected the
“Core” Asset Management
planning will be significantly
revised in the light of action
under improvement programme.
In the first few years annual
revisions of Asset Management
Plans are likely).
Asset Management planning is seen as a
constantly evolving process, with
underpinning Asset Management systems
constantly providing better information.
It is expected that formal Asset Management
plans, and overarching Asset Management
strategies will be formally revised every three
years, with the timing of revisions linked to
the organisation’s strategic planning cycles.
A
Appendix Table D-3: Plan Upgrade History
Year Completed
Y/N
Levels of Service 2015 Y
Evaluating Service Options 2015 Y
Undertaking Consultation on Levels of Service Options 2015 Y
Adoption by the Council of Levels of Service after Consultation (note 1) 2015 Y
Public Communication of Levels of Service in a “Customer Charter” N
Managing Growth
Sensitivity of Asset Capital Works to demand changes 2018 N
Risk Management

Nelson City Council
Wastewater Asset Management Plan 2018-2028 (A1620958) Page 201
Year Completed
Y/N
Engineering Lifelines based risk assessments including reference to disaster recovery and business continuity plans 2018 N
Link to maintenance and replacement strategies 2018 N
Lifecycle Optimised Decision Making
Ability to predict robust and defensible options for asset treatments that achieve optimal lifecycle costs including:
Applying appropriate economic evaluation tools, and 2018 N
Using predictive modelling techniques to provide defensible long term financial forecasts. 2018 N
Financial Forecasts
Asset Management Plan translates physical aspects of Operations and Maintenance, Renewal and Capital Works in financial
terms:
Over the timeframe the Network must deliver services, and 2018 N
The sensitivity of Forecasts to potential significant changes in assumptions are discussed and analysed in the Asset
Management Plan 2018 N
Planning Assumptions and Confidence Levels
Have confidence levels on condition data 2018 N
Outline Improvement Programmes
Improvement programmes outline key performance indicators for monitoring Asset Management improvement 2018 N
Improvement plan should comment on achievement against the previous plan and formally report against key performance
indicators 2018 N
Note 1: Consultation on levels of Service is carried out via the Community Plan and Annual Plan consultation processes.
Nelson City Council
Wastewater Asset Management Plan 2018-2028 (A1620958) Page 202
APPENDIX E: WATER LOSSES EVALUATION
Background
Water loss, or “un-accounted for water” is identified as the difference between the volume of
water supplied to the network and the summation of the volumes supplied to customers
through metered supplies. In Nelson City the supplied volume is split into two parts: the first is
the raw water supplied to the treatment plant from the Roding and Maitai supplies and the
second is the treated water supplied to the city. The volume of raw water losses is found from
the comparison of meters on the raw water supply lines at the Maitai Dam and Roding Dam
and the raw water lines at the treatment plant. The volume of treated water losses is found
from comparing the recorded volume supplied from the Water Treatment Plant via the three
meters that record flows to the main serving a number of Maitai valley properties, the city
network via the main to Westbrook Terrace and the return main to the York Valley reservoir
and the total volume supplied through the approximately 20,000 metered connections for the
same period. The difference is “un-accounted for” water or “lost” water.
This section examines the components and evaluates their impact on the Nelson City water
supply losses, and defines the work required to reduce each aspect of the losses.
The components of water loss are well documented in the New Zealand Water and Wastes
Association “Benchloss” manual which is based on the International Water Association Water
Loss Task Force “Guidance Notes”, and the definitions are therefore not repeated here.
Figure D1 show the components and their numerical magnitude. Note the boxes are not to
scale.
The following work is being carried out as priorities allow to determine (improve the accuracy
of) the numbers
Collect Water Supply Data
Test Source Meter for Accuracy
Collect and assess metered water use data
Test customer meters for accuracy
Collect data to quantify unmeasured authorized uses e.g. mains flushing, fire-fighting etc
Review water accounting and data handling procedures
Measure water losses including field inspection of reservoirs, tanks, control valves
The following documents set the current Water Loss Reduction Strategy 2015-25:
A1393411 Summary
A1215831 Detail
A1335157 Zone Maps
A1398591 Project Initiation Document
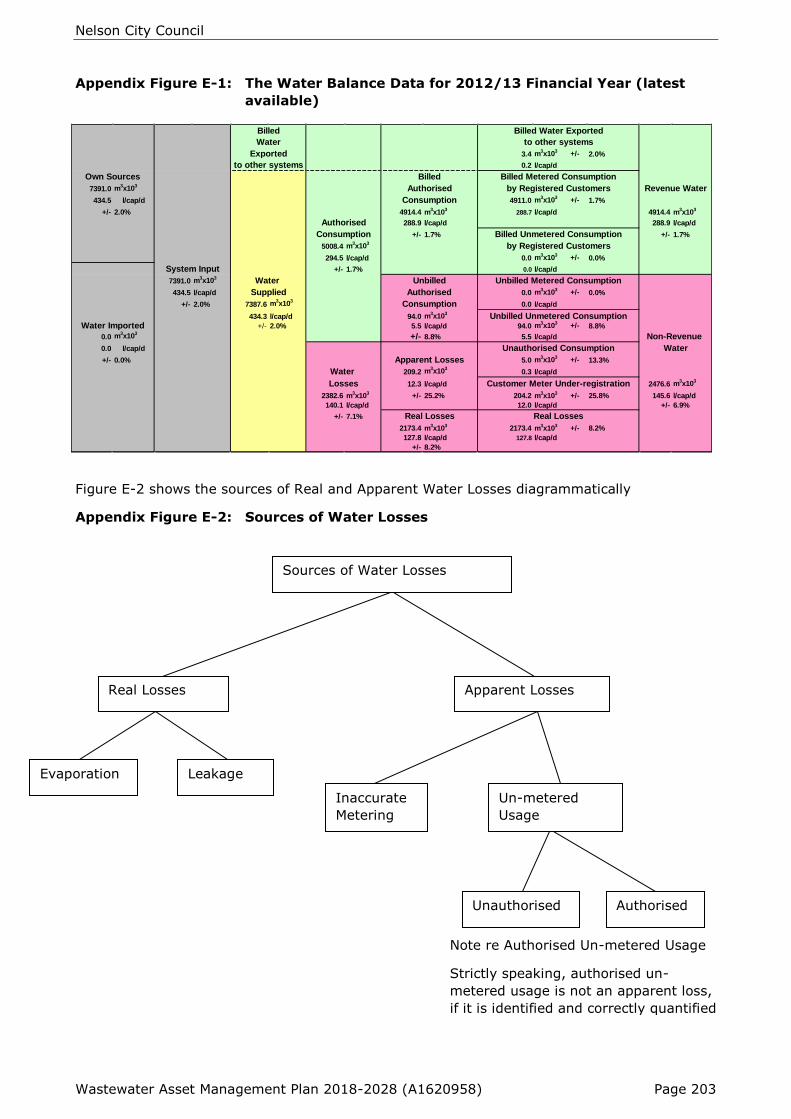
Nelson City Council
Wastewater Asset Management Plan 2018-2028 (A1620958) Page 203
Appendix Figure E-1: The Water Balance Data for 2012/13 Financial Year (latest
available)
Figure E-2 shows the sources of Real and Apparent Water Losses diagrammatically
Appendix Figure E-2: Sources of Water Losses
Sources of Water Losses
Real Losses Apparent Losses
Evaporation Leakage
Inaccurate
Metering
Un-metered
Usage
Unauthorised Authorised
Note re Authorised Un-metered Usage
Strictly speaking, authorised un-
metered usage is not an apparent loss,
if it is identified and correctly quantified
in the water balance.
3.4 m3x10
3 +/- 2.0%
0.2 l/cap/d
7391.0 m3x10
3
434.5 l/cap/d 4911.0 m3x10
3 +/- 1.7%
+/- 2.0% 4914.4 m3x10
3288.7 l/cap/d 4914.4 m
3x10
3
288.9 l/cap/d 288.9 l/cap/d
+/- 1.7% +/- 1.7%
5008.4 m3x10
3
294.5 l/cap/d 0.0 m3x10
3 +/- 0.0%
+/- 1.7% 0.0 l/cap/d
7391.0 m3x10
3
434.5 l/cap/d 0.0 m3x10
3 +/- 0.0%
+/- 2.0% 7387.6 m3x10
30.0 l/cap/d
434.3 l/cap/d 94.0 m3x10
3
+/- 2.0% 5.5 l/cap/d 94.0 m3x10
3 +/- 8.8%
0.0 m3x10
3 +/- 8.8% 5.5 l/cap/d
0.0 l/cap/d
+/- 0.0% 5.0 m3x10
3 +/- 13.3%
209.2 m3x10
30.3 l/cap/d
12.3 l/cap/d 2476.6 m3x10
3
2382.6 m3x10
3 +/- 25.2% 204.2 m
3x10
3 +/- 25.8% 145.6 l/cap/d
140.1 l/cap/d 12.0 l/cap/d +/- 6.9%
+/- 7.1%
2173.4 m3x10
32173.4 m
3x10
3 +/- 8.2%
127.8 l/cap/d 127.8 l/cap/d
+/- 8.2%
Authorised
Customer Meter Under-registration
Water
Non-Revenue
Unbilled Unmetered Consumption
Unauthorised Consumption
Own Sources
Consumption
by Registered Customers
Water
to other systems
to other systems
Exported
Billed
Real Losses
Unbilled Metered Consumption
Billed Unmetered Consumption
Water Imported
Water
Consumption
Apparent Losses
Water
Losses
Unbilled
Billed Water Exported
by Registered Customers
Billed
Authorised Revenue Water
Billed Metered Consumption
Authorised
Consumption
Supplied
System Input
Real Losses

Nelson City Council
Wastewater Asset Management Plan 2018-2028 (A1620958) Page 204
Real Losses
Refer figures E-1 and E-2.
Evaporation
All of Nelson’s treated water storage is covered.
Evaporation is not considered to be a factor in the water losses.
Leakage
Leakage from trunk mains
The trunk mains are operated at high pressure. Trunk mains are laid under roads or in
otherwise visible areas, therefore leaks will show on the surface quickly.
Leakage from trunk mains is not considered to be a factor in the water losses.
Leakage from reticulation pipes
Leakage from reticulation pipes is unquantified. While pipe bursts show at the surface, smaller
leaks may go undetected for some time and infiltrate into the ground, particularly in Stoke,
Tahunanui and The Wood which are on gravel and sand.
Reticulation pipe leaks are considered to be a major factor in the water losses
Leakage from service pipes
Leakage from service pipes is also unquantified. While pipe bursts and large leaks show at the
surface, smaller leaks may go undetected for some time and infiltrate into the ground,
particularly in Stoke, Tahunanui and The Wood which are on gravel and sand. Typically leaks in
service pipes occur at connections to the main or after the meter where they are mostly found
by property owners after the water invoices show a higher than expected usage.
The water leaks in property service pipes that occur after the meter are accounted for, while
being unquantified.
Service pipe leaks are considered to be a major factor in the total volume of water lost from
the network.
Leakage through Scour Valves
Scour valves are situated in low spots near creeks or storm water mains to facilitate draining
of trunk and large diameter reticulation mains. Leaks from scours could go un-noticed for
some time. A system has been set up for Nelmac to regularly check scour valves by inspecting
the outlets and electronically listening on the valve for water passing.
Leakage through scour valves is not considered to be a major factor in the water losses.
Leaking Hydrants
Hydrants usually only leak after use and the fire service (and others) usually report if they are
unable to fully shut off the hydrant. Due to the design of fire hydrants, the shaft glands do not
leak when the hydrant is turned off.
Fire Hydrants are situated in the road or other accessible places and are visible, therefore
leaks quickly fill the hydrant box and show on the surface unless the ground is particularly
porous.
Hydrant leaks are not considered to be a major factor in the water losses.

Nelson City Council
Wastewater Asset Management Plan 2018-2028 (A1620958) Page 205
Leakage from Valves
Unlike hydrants, glands on valves can leak at any position of the valve gate. Valves used to be
checked and “exercised” by Nelmac on a 3 yearly basis. However this procedure was ceased
when it was found that the process actually initiated many valve gland leaks. Leakage normally
fills the valve box and shows on the surface. Valve gland leaks are now repaired on a reactive
basis.
Leaks through “shut” valves allow water into an adjacent zone – normally from a high pressure
zone into a low pressure zone, but water is not lost from the system.
Leakage through reservoir filling valves is discussed in “reservoir overflows” below
Leakage from valves is not considered to be a significant factor in the water losses.
Bursts
Nelson City Council has quick response times in its level of service. Nelmac’s contract requires
them to respond to bursts within 30 minutes. Leakage from bursts is allowed for in the water
balance, but is not significant.
Bursts are not considered to be a major factor in the water losses.
Leakage from reservoirs
All reservoirs and tanks are above ground and inspected monthly by Nelmac. No leakage from
the walls has been noted.
All major reservoirs have underdrains leading to inspection manholes. Nelmac checks these
monthly and any leakage is investigated and repairs made. The only seepage in recent years
has been at the Thompson Terrace #2 reservoir where (in 2007) there was a slight seepage,
and the internal water seals on a sector of the reservoir were renewed.
Reservoir leakage is not considered a factor in the water losses.
Reservoir overflows
All major reservoirs have level recorders, are connected to the SCADA system, and alarmed.
Minor reservoirs and tanks are inspected monthly by Nelmac.
Reservoir overflows are not considered to be a factor in the water losses.
Apparent Losses
Refer figures E-1 and E-2.
Inaccurate Metering
Misreading of meters
Customer meters are read manually and the reading is keyed into a handheld data logger on
site. The data is then downloaded electronically to the computer system, where the bills are
generated. Reports of exceptionally high or low usage are generated, and the meters are re-
read in case there are reading or data entry errors. This process would also identify if the
reading for the previous period (i.e. start reading for the current period) held in the archive is
incorrect.
Misreading of meters, Data Transfer errors, and Data Analysis errors are not considered to be
factors in the water losses.

Nelson City Council
Wastewater Asset Management Plan 2018-2028 (A1620958) Page 206
Residential Meters out of calibration
A sample of 89 manifold water meters has been tested for accuracy over three flow volumes;
0.38lpm, 15lpm and 50lpm (Refer A754715). All were installed as part of the 1999 Universal
metering programme and have been in operation for approximately 15 years. A significant
number of meters under-recorded flows in the 0.38lpm flow range. It is possible that a
component of the water losses may result from under recording flows to consumers.
The water meters will be checked again within the next three years to see if a trend can be
shown.
Residential meter accuracy is considered to be a factor in the water loss equation.
Commercial/Industrial Meters out of Calibration
As at June 2008, commercial/industrial water meters have not been tested for calibration.
Installation of water meters commenced prior to 1980 and was completed in 1999 at the same
time as residential meeting. Therefore some meters are up to 30 years old.
Commercial/industrial meter accuracy is also considered to be a factor in the water losses.
Meters not recording low flows
Large diameter meters do not accurately record low flows. Until recently meters were sized the
same as pipe size, i.e. for maximum flow. Large commercial/industrial water meters will
therefore be under reading normal and low flows. New installations now have combination (low
and high flow) meters installed.
Meters not recording low flows is considered to be a factor in the water losses.
Meters not in System
Occasionally meters are found that have been installed, but have not been entered into Napier
Computer Systems water billing system, and are therefore not being read or charged. One
recent example was where the connection was approved and completion signed off, but not
entered into Napier Computer Systems. A system has been implemented (May 2008) to
correlate the 3 steps - connection applications, meter data returns from approved water
connection contractors (AWCCs), and water meter records in Napier Computer Systems.
Meters not in the system are not considered to be a significant factor in the water losses.
Un-metered Usage
Unauthorised Un-metered Usage
Illegal hydrant use
The use of water from fire hydrants other than for fire-fighting, testing or mains flushing is
contrary to the Water Supply Bylaw. However this has not been enforced to date.
Illegal hydrant use is not considered to be a significant factor in the water losses.
Illegal connections
It is difficult to make illegal connections directly to mains, ridermains and service connections
(within legal road) due to their depth and high pressures. However on cross lease or Right of
Way sections it is possible to turn off the isolating valve at the street boundary and make an
illegal connection on private property before the meter. Most residents would not have the
technical ability to make such a connection. Water would still have to be used through the
meter to avoid suspicion. Illegal use would most likely be used for garden watering or
swimming pool filling. In recent years only one such case was reported by a concerned
neighbour.

Nelson City Council
Wastewater Asset Management Plan 2018-2028 (A1620958) Page 207
Illegal connections are therefore not considered to be a significant factor in the water losses.
Authorised Un-metered Usage
Strictly speaking, authorised un-metered usage is not an apparent loss, if it is identified and
correctly quantified in the water balance. Assumptions have been made on the following uses.
Firefighting
Water suppliers with a reticulated system are required to provide fire-fighting water to the NZ
Fire Service and to not charge for it. The normal fire demand is 25 L/sec (90 m3/hr). Allowing
two full hours use of water per week, the fire demand is less than 10,000 m3/yr. (e.g.
compare with a single leak of 1 L/sec running for 1 year at 32,000 m3/yr).
Fire-fighting use is therefore not considered to be a significant factor in the water losses.
Other approved use of Fire hydrants
When the fire service receives a request for assistance in supplying water for non- fire
purposes they refer their applicant to the Council’s Technical Services section for approval.
Similarly contractors requiring large volumes of water for subdivision or roading purposes
apply for permission to take the water. In both cases the parties are asked to advise the
council of the volume used.
Therefore it is only small users of water from hydrants that are not recorded.
Other approved use of fire hydrants is therefore not considered to be a factor in the water
losses.
Mains flushing
Dead end mains are regularly flushed by Nelmac to prevent any debris build up where the
water velocity is low. Mains are also flushed after repair to remove any debris that has settled.
Nelmac have used metered standpipes for this and the volume of water flushed each year has
been estimated and included in the water balance.
Mains flushing is therefore not considered to be a significant factor in the water losses.
Mains testing
The volume of water used in the testing, chlorination, and flushing of new mains both on
subdivisions and council renewals and capex has been estimated and included in the water
balance.
Mains testing is therefore not considered to be a significant factor in the water losses.
Draining mains
The volume of water used to drain mains for repair has been estimated and included in the
water balance.
Draining mains is therefore not considered to be a significant factor in the water losses.
Draining reservoirs
The volume of water used in draining reservoirs and tanks for repair and to maintain chlorine
residual has been estimated and included in the water balance.
Draining reservoirs is therefore not considered to be a significant factor in the water losses.

Nelson City Council
Wastewater Asset Management Plan 2018-2028 (A1620958) Page 208
Central Business District amenities
Hanging baskets irrigation, Bird scaring tree sprays, Symonds Gas Lamp (in Trafalgar Street
outside the Victorian Rose), and drinking fountains at Church steps and Bridge / Trafalgar
corner are metered.
Central Business District amenities are therefore not considered to be a significant factor in the
water losses.
Reducing Apparent Losses
Figure E-3 shows the components for managing apparent losses by “squeezing the box”.
Taking each corrective action will reduce the apparent losses.
Appendix Figure E-3: The Four Components of Managing Apparent Losses
“Squeezing the box”
Considering the four factors in Apparent Losses
Meter Accuracy
Data Transfer
Unauthorised Consumption
Data analysis
Existing Apparent Losses
Economic Level
Meter Accuracy Error
Meters do not
register actual
volumes passing
Unauthorised
Consumption,
Theft and Illegal
Consumption
Data Transfer
Errors between
meter and
archives,
Poor Customer
Accountability
Data Analysis Errors
between archived data
and data used for
billing/water balance
Unavoidable
Apparent losses

Nelson City Council
Wastewater Asset Management Plan 2018-2028 (A1620958) Page 209
As discussed above, only Meter Accuracy is considered to be a significant factor in the losses
and needing priority attention at this time.
Action Plan
Complete residential meter accuracy testing programme to allow 95% confidence.
Schedule replacement of residential meters
Test all commercial/industrial water meters 100mm dia. and over, and repair or replace as
necessary.
Test all commercial water meters 50 mm dia and over but less than 100mm dia. and replace
as necessary.
If water meters 50 mm dia. and over are to be replaced, consider whether a combination
meter (low flow/high flow) should be installed.
Reducing Real Losses
Figure E-4 shows the components for managing real losses by “squeezing the box”. Taking
each corrective action will reduce the real losses.
Appendix Figure E-4: The Four Components of Managing Real Losses
“Squeezing the box”
Potentially Recoverable
Annual Real Losses
Unavoidable Annual
Real Losses
Pressure
Management
Speed and
Quality of
Repairs
Active
Leakage
Control
Materials
selection, installation,
maintenance,
renewal, replacement
Nelson City Council
Wastewater Asset Management Plan 2018-2028 (A1620958) Page 210
Considering the four factors in Real Losses
Speed and Quality of Repairs. The Nelmac utilities maintenance contract has short response
times that are recorded in Hansen and are met. Repairs are made to a high standard. Little
“squeeze” is therefore available from Speed and Quality of Repairs.
Materials Selection. The Nelson City Council Engineering Standards specifies the materials to
be used in repairs, maintenance, renewals, capital expenditure and assets to be vested. These
are of a high and appropriate standard. Little “squeeze” is therefore available from Materials
Selection.
Active Leakage Control. Leakage is identified above as a major factor in the losses. Significant
“squeeze” is available from Active Leakage Control and it is a matter of priority. The active
leakage control action plan is shown in Appendix F.
Pressure Management. Pressure reduction is identified as a major factor in the losses.
Significant “squeeze” is available from Pressure reduction and it is a matter of priority. The
pressure reduction action plan is shown in Appendix G.

Nelson City Council
Wastewater Asset Management Plan 2018-2028 (A1620958) Page 211
APPENDIX F: ACTIVE LEAKAGE CONTROL PLAN
Proposed Methodology
Divide the water supply system into discrete reservoir/pressure reducing valve supply zones
and designate them as District metering areas;
Test and repair isolation valves for District Metering Areas;
Install district flow meters and data loggers;
Night time low flow tests including reading customer meters at beginning and end to quantify
demand;
Acoustic leak detection survey to identify leak locations;
Repair located leaks;
Repeat night time low flow tests to confirm repair and quantify “background” losses;
Consider more proactive maintenance program;
Reduce time between leak reports and repairs;
Implement pressure management (refer Appendix G);
Continue main replacement program (currently 50 and 100mm dia. asbestos cement);
Moving to “smart meters”, or property owners regularly checking their water meters are good
ways of providing early alerts to leaks which allows for prompt repair. Ongoing public
education is required.

Nelson City Council
Water Supply Asset Management Plan 2018-2028 (A1620958) Page 212
APPENDIX G: SCHEMATICS
Appendix Figure G-1: Supervisory Control and Data Acquisition Schematic.
Maitai Dam
InTouch Runtime
60k with no I/O
Monitor PC
InTouch Runtime
60k with I/O
Citrix ClientHoward, IanAlstom, Bells
Remote access
WakapuakaWaste water
treatment plantInTouch Runtime 60k with I/O
SCADAlarm pager/telephony system
Citrix Server
2 x InTouch Runtime
60k with no I/O
Active Factory
Concurrent Client (2)
Internet
Firewall
NCC LAN
Data
Laptop computer
Nfuse Server
Citrix secure gateway
DMZ
Remote computer connects to
the internet via an ISP. It can
then use the standard browser
(with downloaded plug in) or an
ICA client to connect to the NCC
Citrix server through Nfuse
using the Citrix Secure Gateway
certificate process
Propose fibre ethernet
Tantragee
Water Treatment plant
InTouch Runtime 60k with I/O
SCADAlarm pager/telephony system
PLC
Roding Dam
Kingfisher Base Station
Modem
PLC
NRSBU RTU’s
Citrix ClientHoward, IanAlstom, Bells
Remote access
Belbi PC
Backup InTouch Runtime
60k with I/O
No license required
Hub
Bells Island
Waste water
treatment
plant
PLC concentrator
Backup Intouch PC
InTouch Runtime 60k with no I/O ?
DNP3 OPC Server (Serial & TCP)
or Kingfisher series 2 driver
SCADAlarm pager/telephony system
MS SQL server
IndustrialSQL server 5000 Tag
2 x SCSI disk subsystem
InTouch Runtime 60k with no I/O ?
DNP3 OPC Server (Serial & TCP)
or Kingfisher series 2 driver
SCADAlarm pager/telephony system
Modem
Roading pump station
Fibre repeater
Tantragee
Fibre repeaterHub
ADSL
Router
ISDN
Router
ISDN
Router
ISDN
Router
ISDN
Router
Maitai
Fibre repeater
Maitai
Fibre repeater
Modem
Repeater
NCC RTU’s
64k ISDN A
B used for phone
Nelson City Council
Water Supply Asset Management Plan 2018-2028 (A1620958) Page 213
APPENDIX H: PRESSURE REDUCTION PLAN.
Background
Many areas of the city receive pressures in excess of the Levels of Service specified in the
Water Supply Asset Management Plan.
High pressures result in
More pipe failures (particularly Asbestos Cement pipes)
More water losses from undetected leaks
Higher customer usage
Demerit points in the water supply distribution grading
Reduction in pressure will therefore have long term benefits to the water asset.
Parts of the Stoke area (particularly) have Asbestos Cement pipes that were laid in the 1950’s
and are starting to fail. Lowering the pressure in these pipes will extend their useful life.
However some pipes are under capacity for fire flows when the pressure is reduced so will
have to be renewed with a larger diameter pipe.
The renewal and new ridermain projects seek to strategically combine Capex and Renewal
funding such that pressures can be lowered in the future.
A ridermain in Tosswill Road laid in conjunction with road upgrading will allow houses on the
downhill side of the road to be put on low pressure in the future. Houses on the uphill side will
remain on the existing high pressure main, as will the fire hydrants. This area is not high
priority for pressure reduction, but the opportunity is being taken lay the ridermain at this
time. Additional works yet to be scheduled will include a low pressure pipe from the bottom of
Tamaki Street down the steps to the low pressure main on the opposite side of Tahunanui
Dve., and a new main in Tosswill Road from Tahunanui Dve to the Chamberlain Street
intersection. A similar riderman will also be laid in Chamberlain Street from Tosswill Road to
Maire Street in the future.
Recent work in the Enner Glynn/Wakatu area (Beatson Road to Torlesse St) has allowed this
area to be transferred to low pressure (107m City Datum). The new pipes have been sized to
meet the Fire flow Levels of Service at the reduced pressure. The pressure reducing valve
currently at Cawthron Crescent will have to be relocated to the top of Beatson Road near
Waimea Road.
The Maitland/Ridgeway area is currently on Marsden Valley High Pressure (170 m City Datum).
The proposed works in 2008/09 and 2009/10 will allow this area to be transferred to
Treatment Plant/Thompson Terrace. Reservoir High Pressure (155m City Datum). A new
pressure reducing valve will be required on the Ridgeway near Marsden Road, and the Austen
Ward Heights booster pump station will have to be upgraded to sustain pressures to Leach
Place, and the top of Austen Ward Heights / Calamaras Street.
The additional works noted in 5 and 6 above are proposed for “System Improvements”
funding.
The lower Port Hills (including Haven Road / Wakefield Quay), Washington Valley, Toi Toi
Valley (including Emano / Murphy), Hospital, and Mount Street areas are also on Treatment
Plant/Thompson Terrace Reservoir High Pressure (155m City Datum), but should be on low
pressure (107 m City Datum). No synergies with renewals are possible in this area and
additional funding for Capex is proposed in the Water Supply Asset Management Plan 2009/19.
The City/Atawhai low pressure zone has been split into three zones – Atawhai, The Wood and
the Central City. This has enabled the Wood zone to be put on 83m City Datum while the
Nelson City Council
Water Supply Asset Management Plan 2018-2028 (A1620958) Page 214
other two zones remain on 107m City Datum. This split also allows for smaller District
Metering Areas.
Lowering of night-time pressure in all pressure reducing valve zones will achieve the benefits
listed in 1 above. Additional funding for System Improvements is proposed in the Water Supply
Asset Management Plan 2009/19 for the fitting of a variable controller to one pressure
reducing valve in each zone, and the resetting of other pressure reducing valves to a lower
pressure.
Network Modelling Results
Network Modelling of The Wood Pressure Reduction
Background
The City/Atawhai low pressure zone has been split into three zones – Atawhai, The Wood and
the Central City. This has enabled the Wood zone to be put on 83m City Datum while the
other two zones remain on 107m City Datum. This split also allows for smaller District
Metering Areas.
This was achieved by modelling different scenarios and carrying out the following works:
Completed works as at 2011
Modelling results
The Trafalgar Street pressure reducing valve was reduced from a setting of 107m to 83m.
A new pressure reducing valve was inserted at the corner of Nile and Tory Streets, set to
83m.
Valves were shut at Trafalgar Street bridge (just north of Ajax Avenue), Hardy Street bridge,
Bridge Street bridge and in Atawhai Drive just south of Iwa Road to enclose the new lower
pressure zone.
It was found that fire flows were no longer achievable in Iwa Road and Walters Bluff. A new
pressure reducing valve at the bottom of Walters Bluff (set to 107m) was required to
remedy this.
New pressure reducing valves that have been installed.
At the bottom of Walters Bluff set to 107m
In Tory Street at the intersection with Nile Street, set to 83m
Other Misc New Works that have been completed
New valve in Atawhai Drive just south of Iwa Road
Change setting of Trafalgar Street pressure reducing valve to 83m
Network Modelling of Port Hills / Washington / Victory / Toi Toi Pressure Reduction
Background
Currently the Port Hills / Washington Valley / Victory Square / Toi Toi Valley areas are supplied
directly at Water Treatment Plant / Thompson Terrace Reservoir pressure, but much of the
land is at low level and is therefore receiving excess pressure.
The objective was to model scenarios giving pressures within the Targeted Level of Service in
the Water Supply Asset Management Plan (30 m to 90 m head at each property).
The initial attempt to design alterations to the reticulation to achieve lower pressures was
hampered by the need to maintain high pressure in the cross city links in the reticulation
Nelson City Council
Water Supply Asset Management Plan 2018-2028 (A1620958) Page 215
(Wellington St, Gloucester St, Washington Road, Hampden Street, Alfred Street, Toi Toi Street
etc.).
The second attempt put all the areas onto low pressure and then devised means of providing
high pressure to those areas needing it. This was successful.
Results
A 200 pipe is required in Princes Drive (Day’s Track to Richardson Street) to provide continuity
of supply to the Port Hills / Port area (including Sealord) if the trunkmain from North Road to
Vickerman Street is out of action. Note this pipe is not needed for normal operation.
There are a few houses at the top of the southern end of Montreal Road which are above the
67 m contour and will not receive adequate pressure.
Can’t achieve a fire flow to a couple of houses at the end of Konini Street (numbers 5A and 7).
Can get 12.5 litres per second out of the hydrants outside 16 Konini and 87 Mount Street but
these are both over 135m away.
Fireflows were not adequate at the top of Emano Street without upgrading the main in Orsman
Crescent. Once this is upgraded to a 150 then we can get 12.5 litres per second at the end of
Emano and 12.5 litres per second at the corner of Emano and Orsman which is sufficient.
Cannot achieve 25 litres per second in Mount Street without the non-return valve which brings
water from the low pressure system when there is a fire flow.
New pressure reducing valves
At the corner Russell Street and Stanley Crescent supplying into the new low pressure zone in
Washington Valley and into the new 150 main supplying the Port/Queens Road area.
Toi Toi below Abraham
Laval Heights to replace shut valve – set to 140m – could be lower
Quebec Road to replace shut valve – reduces from Observatory Hill pressure to Maitai High
Level – set to 155m
At the corner of Princes / Richardson supplying into the top of Richardson Street and into
Washington Road
Outside 7 Orsman Crescent
New Links
150 to link the new low level system either side of the newly shut valves in Hampden Street at
the corner of Kawai Street
150 - Corner of St Vincent and Toi Toi to link the 150 on the southern side of Toi Toi to the
200 in Toi Toi
Need to link the Fountain Place main to the 100 low pressure in Haven Road
100 link between the 100 and 150 in Haven Road south of Vickerman Street
New Mains
370m of 150 main up Russell Street from Haven to Queens
385m of 50 ridermain up Russell Street from Haven Road to Stanley Crescent
235m of 100 main from Russell Street to end of Mt Pleasant Avenue
1070m of 200 main along Princes Drive from Princes/Toi Toi to Princes/Richardson

Nelson City Council
Water Supply Asset Management Plan 2018-2028 (A1620958) Page 216
70m of 150 from new 200 in Princes Dve down to the end of The Cliffs via the reserve.
Upgrade Orsman Cr from 100 to 150 – length 330m
Other Miscellaneous New Works
New non-return valve outside 36 Mount Street – required so that upper Mount Street can
achieve fire flows
Small booster Pump (and tank?) Montreal Road / Hutson Street.
New valve outside 41 Wolfe St
New valve outside 17 Mt Pleasant Avenue
New valve outside 16 Albert Road
New valve in Haven Road just north of Russell Street in the 200
New valve by 121 Queens Road
New valve in Haven Road just south of Vickerman Street in the 150 CIPT
Completed works as at 2011
New pressure reducing valve in Laval Heights to replace shut valve – set to 140m – could be
lower
New non-return valve outside 36 Mount Street – required so that upper Mount Street can
achieve fire flows
New valve outside 41 Wolfe Street.
Network Modelling of Pressure Reduction Wakatu / Enner Glynn / Ridgeway
Background
The Wakatu area (Beatson Road to Torlesse Street) is currently on Treatment Plant/Thompson
Terrace Reservoir High Pressure (155m City Datum). The proposed works in 2008/09 and
2009/10 will allow this area to be transferred to low pressure (107 m City Datum). The new
pipes have been sized to meet the Fire Flow Levels of Service at the reduced pressure. The
pressure reducing valve currently at Cawthon Crescent will have to be relocated to the top of
Beatson Road near Waimea Road.
The Maitland/Ridgeway area is currently on Marsden Valley High Pressure (170 m City Datum).
The proposed works in 2008/09 and 2009/10 will allow this area to be transferred to
Treatment Plant/Thompson Terrace Reservoir High Pressure (155m City Datum). A new
pressure reducing valve will be required on the Ridgeway near Marsden Road, and the Austen
Ward Heights booster pumpstation will have to be upgraded to sustain pressures to Leach
Place, and the top of Austen Ward Heights / Calamaras Street.
Results
A pressure reducing valve was inserted in the Ridgeway just north of Marsden Road. This
needs to be set to ‘Thompson Terrace Reservoir’ pressure, but sufficiently low so that water
does not flow north along the new 200 main above. A setting of 142m was sufficient to supply
30m to the top of Arapiki Road and still have the water flowing south along the new main.
This setting will have to be established through experimentation and possibly varied
seasonally.
A pressure reducing valve was inserted in Beatson Road just below the (eastern) intersection
with Scotia Street to achieve fire flows at Beatson / Waimea.

Nelson City Council
Water Supply Asset Management Plan 2018-2028 (A1620958) Page 217
To achieve fire flows in Anglia Street requires upgrading the 100 AC main in Beatson Road to
150 PVC, the 100 AC main in Scotia Street from Beatson to Anglia to 150 PVC and the 100 AC
in Anglia to 100 PVC.
To achieve fire flows in Burrough Place requires upgrading the 100 AC in Waimea, Chings,
Enner Glynn from Beatson to Burrough to 150 PVC
To obtain fire flows in Cherry Avenue requires a connection into the new 200 main at Baigent
/ The Ridgeway, upgrading the 100 AC in Baigent from The Ridgeway to Cherry to 150 PVC
and upgrading the 100 AC in Cherry to 100 PVC.
Other fire flows which were tested and were adequate are as follows:
Can get 12.5 litres per second in Newman Drive at Boyes Place (and 12.5 litres per
second from above non-return valve)
Last hydrant on Enner Glynn Road providing Baigent upgraded as above
Panorama, Arapiki, View Mount, Coster
To achieve the residential pressure level of service in Leach Place, Sophies Way, and the top of
Austen Ward Heights and Calamaras Street, a booster pumpstation is required. (The existing
small pump and 2x25 cu m tanks do not provide a permanent solution).
If the booster pump is sited at the intersection of Torlesse and Jerningham Streets a link
between Torlesse Street and the intersection of Waterhouse and Austen Ward Heights, (or a
pressure reducing valve at the intersection of Waterhouse and Austen Ward Heights) is
required to maintain fire flows to Coster Street and Calamaras Street.
New Pressure Reducing Valves
In The Ridgeway just north of Marsden Road
In Beatson Road
New Mains
500m of 200 main from Waimea Road/The Ridgeway to The Ridgeway/Torlesse (abandon AC
100). Connection at Baigent Road.
Upgrade 535m of 100 AC to 150 PVC main in Waimea Road, Chings Road, Enner Glynn Road
(from Chings Road to Burrough Place) Note : Continue renewal in 100 PVC to Newman Dve.
Upgrade 71m of 100 AC to 150 PVC in Baigent Road from The Ridgeway to Cherry Avenue.
Note : Continue renewal in 150 PVC to high point of Baigent Road (start of existing 100 PVC
Renew 220m of 100 AC to 100 PVC in Cherry.
A new 150 PVC (or PE) link between Torlesse Street and Waterhouse Street, Austen Ward
Heights intersection via the walkway is needed to maintain fire flows if the pump station is
built on the intersection of Torlesse and Jerningham Streets.
Other Misc New Works
New valve in Enner Glynn Road just north of Newman Drive
New valve in Waterhouse just north of Torlesse
Remove the pressure reducing valve in Cawthron Crescent
Future new ridermain at the top end of Scotia Street to Ulster to keep the top houses on high
pressure and reduce the others to low pressure
The initial modelling did not include the Austen Ward Heights area above the NRV.

Nelson City Council
Water Supply Asset Management Plan 2018-2028 (A1620958) Page 218
Subsequently a new PS on the intersection of Torlesse and Jerningham Streets was modelled.
Completed works as at 2011
200 main laid from Waimea Road/Beatson Road to The Ridgeway intersection (abandon AC
100). Connected at Ulster Street
Upgrade 338m of 100 AC to 150 PVC in Beatson Road
Upgrade 188m of 100AC to 150 PVC in Scotia Street from Beatson to Anglia
Renew 262m of 100 AC to 100 PVC in Anglia Street
New valve in Scotia Street just south of Ulster
Network Modelling of Pressure Reduction East side of Waimea Road (Motueka Street
to Boundary Road)
Background
The East side of Waimea Road between Motueka Street and Market Road is currently on
Treatment Plant/Thompson Terrace Reservoir High Pressure (155m City Datum). The proposed
works will allow this area to be transferred to low pressure (107m City Datum). The pipe
capacities have been checked to ensure that the Fire Flow Levels of Service can be maintained
at the reduced pressure.
New Links
100 link from the 100 AC to the 150 CI in Waimea Road just south of the valve to be shut at
Motueka Street
100 link from the 100 AC to the 150 CI in Waimea Road, south of Tukuka Street
100 link from the 100 AC to the 150 CI in Waimea Road, north of Boundary Road
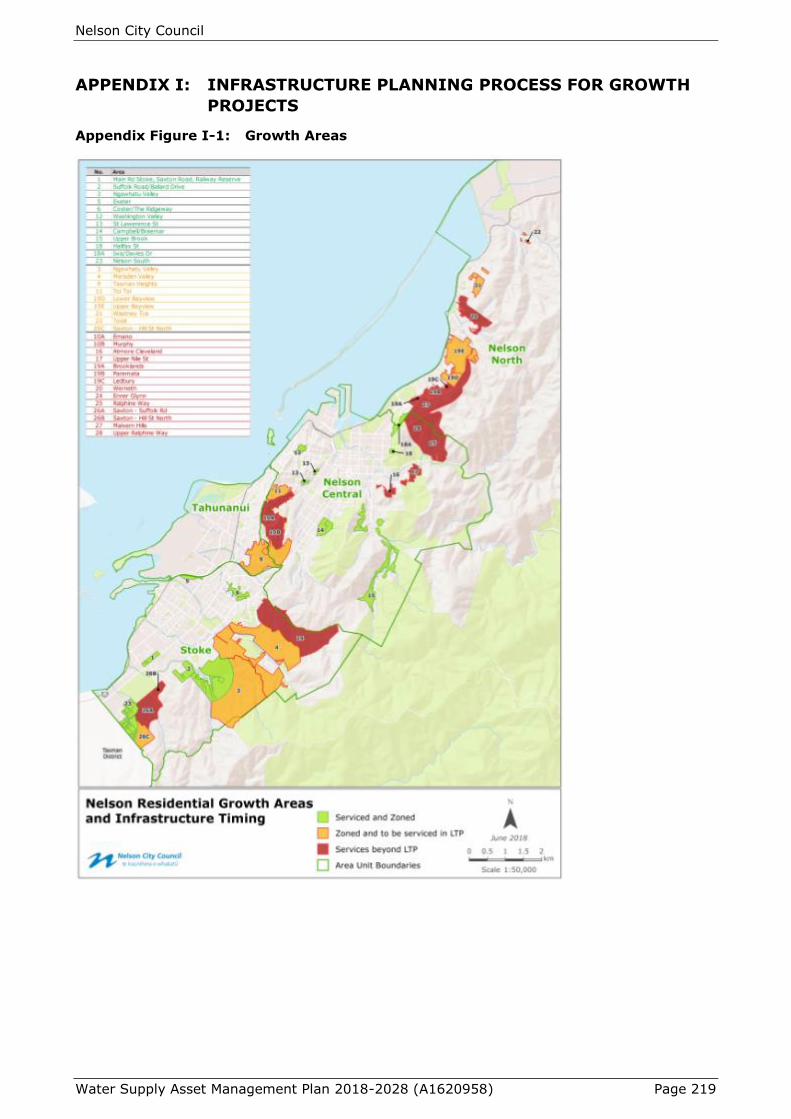
Nelson City Council
Water Supply Asset Management Plan 2018-2028 (A1620958) Page 219
APPENDIX I: INFRASTRUCTURE PLANNING PROCESS FOR GROWTH
PROJECTS
Appendix Figure I-1: Growth Areas

Nelson City Council
Water Supply Asset Management Plan 2018-2028 (A1620958) Page 220
APPENDIX J: 30 YEAR INFRASTRUCTURE STRATEGY 2015-45
The requirement for an infrastructure strategy arose from advice provided by Better Local
Government programme advisory groups. The strategy is intended to improve local
authorities’ delivery of core infrastructure and management of physical assets. It should
identify strategic issues facing the council and the future implications and is intended to add
transparency for residents and ratepayers about these issues and their consequences.
The strategy is included in the LGA 2002 Amendment Act (2014).
This Asset Management Plan contains the information that would form the basis of the water
utility section of an integrated strategy, in particular the following are addressed in the sub
sections of the plan either directly or as areas that will require future work:
What level of infrastructure investment, if any, is necessary to provide for growth in the
community. See section 3.2 -Demand Forecast and section 6.5- Capital Programme;
Managing the timing of investment for growth, to avoid constraints on growth from limited
infrastructure capacity while minimising the costs to the community of underutilised
infrastructure capacity. See section 3.2 -Demand Forecast and section 6.5- Capital
Programme;
What level of investment is needed to maintain, renew and replace existing assets. See
section 6.4-Renewal Strategy;
Balancing service level expectations with affordability in the context of demographic changes
such as depopulation and aging. See section 2- Levels of Service;
What level of investment, if any, is needed to improve the level of service provided by those
assets. See section 2- Levels of Service;
Planning for maintenance, growth and possible increases or decreases in levels of service
provided. See section 2- Levels of Service, section 3- Future Demand, section 6.3 -Operations
and Maintenance Plan;
Managing or improving public health and environmental outcomes, or mitigating adverse
effects on them. See section 2 -Levels of Service;
Managing the risks to and resilience of, infrastructure assets from natural disasters. See
section 4- Emergency and Risk Management;
Managing the financial provision for risks to infrastructure assets from natural disasters. See
section 4- Emergency and Risk Management;
Indicative estimates of the projected operating expenditure and capital requirements for each
year. See section 6.3- Operations and Maintenance Plan, section 6.4- Renewal Strategy,
section 6.5 -Capital Programme;
Assumptions about service levels and asset lives on which the projections are based. See
section 2- Levels of Service and section 6.2- Asset Valuation and Depreciation;
Assumptions involving significant uncertainty- the nature of that uncertainty and its potential
impacts. See section 4- Emergency and Risk Management.

Nelson City Council
Water Supply Asset Management Plan 2018-2028 (A1620958) Page 221
Appendix Table J-1: Water Supply Operation and Maintenance Projections Figures are in 2015 dollars and will be adjusted for inflation in each Annual Plan.
Appendix Table J-2: Water Supply Renewals Projections
Year 1 2 3 4 5 6 7 8 9 10 11 12 13 14 15 16 17 18 19 20 21 22 23 24 25 26 27 28 29 30
Long Term Plan 2015/25 LTP 2018/28 LTP 2021/31 LTP 2024/34 LTP 2027/37 LTP 2030/40 LTP 2033/43 LTP 2036/46 LTP 2039/49 LTP 2042/52 LTP
O&M Expense 2014/
15
2015/
16
2016/
17
2017/
18
2018/
19
2019/2
0
2020/
21
2021/
22
2022/
23
2023/
24
2024/
25
2025/
26
2026/
27
2027/
28
2028/
29
2029/
30
2030/
31
2031/
32
2032/
33
2033/
34
2034/
35
2035/
36
2036/
37
2037/
38
2038/
39
2039/
40
2040/
41
2041/
42
2042/
43
2043/
44
2044/
45
Administration 2,760 1,650 2,109 1,694 1,659 1,649 1,679 1,649 1,650 1,649 1,660 2,830 2,830 2,830 2,830 2,830 2,830 2,830 2,830 2,830 2,830 2,830 2,830 2,830 2,830 2,830 2,830 2,830 2,830 2,830 2,830
Depreciation 3,996 4,010 4,021 4,032 4,041 4,050 4,082 4,137 4,169 4,187 4,187 4,187 4,187 4,187 4,187 4,187 4,187 4,187 4,187 4,187 4,187 4,187 4,187 4,187 4,187 4,187 4,187 4,187 4,187 4,187
Electricity 458 463 463 463 463 463 463 463 463 463 463 463 463 463 463 463 463 463 463 463 463 463 463 463 463 463 463 463 463 463 463
Water
Treatment 1,479 1,600 1,600 1,600 1,600 1,600 1,800 1,800 1,800 1,800 1,800 1,800 1,800 1,800 1,800 1,800 1,800 1,800 1,800 1,800 1,800 1,800 1,800 1,800 1,800 1,800 1,800 1,800 1,800 1,800 1,800
WTP Lagoon
desludge 100
Physical Works
– Programmed 204 205 205 205 205 205 205 205 205 205 205 205 205 205 205 205 205 205 205 205 205 205 205 205 205 205 205 205 205 205 205
Physical Works
– Reactive 2,080 2,070 2,070 2,070 2,070 2,070 2,070 2,070 2,070 2,070 2,070 2,300 2,300 2,332 2,300 2,300 2,332 2,300 2,300 2,332 2,300 2,300 2,332 2,300 2,300 2,332 2,300 2,300 2,332 2,300 2,300
Headworks 310 216 179 179 204 179 179 179 179 204 400 179 179 179 204 179 179 179 179 204 400 179 179 179 204 179 179 179 179 204 400
Roding Dam
Gravel 50 50 5 200
50 50 50 250 50 50 50 250
Fish Passage 20
PHRMP 30
Network
Capacity -
Growth
50 50
Back Flow
mtce 20 30 40 50 60 70 80 90 100 110 150 150 150 150 150 150 150 150 150 150 150 150 150 150 150 150 150 150 150 150
Pressure/Flow
Rate mtce 30 36 36 36 36 36 36 36 36 36 50 50 50 50 50 50 50 50 50 50 50 50 50 50 50 50 50 50 50 50
Prelim CAPEX
reviews 10 10 10 10 10 10 10 10 10 10
Natural
Hazards
Assessment
50 50
Water Loss
Reduction
Strategy
30 30 30 60 60 60 45 15 15 15
Total (a)
($,000s) 10,490
10,89
2
10,35
3
10,58
9 10,373
10,62
2
10,61
9
10,65
5
10,72
1
11,05
6
12,16
4
12,16
4
12,19
6
12,18
9
12,21
4
12,24
6
12,21
4
12,41
4
12,22
1
12,38
5
12,16
4
12,19
6
12,16
4
12,18
9
12,19
6
12,21
4
12,21
4
12,24
6
12,43
9
12,38
5
Year 1 2 3 4 5 6 7 8 9 10 11 12 13 14 15 16 17 18 19 20 21 22 23 24 25 26 27 28 29 30
Long Term Plan 2015/25 LTP 2018/28 LTP 2021/31 LTP 2024/34 LTP 2027/37 LTP 2030/40 LTP 2033/43 LTP 2036/46 LTP 2039/49 LTP 2042/52 LTP
Renewals
Project Area
2014/
15
2015/
16
2016/
17
2017/
18
2018/
19
2019/
20
2020/
21
2021/
22
2022/
23
2023/
24
2024/
25
2025/
26
2026/
27
2027/
28
2028/
29
2029/
30
2030/
31
2031/
32
2032/
33
2033/
34
2034/
35
2035/
36
2036/
37
2037/
38
2038/
39
2039/
40
2040/
41
2041/
42
2042/
43
2043/
44
2044/
45
Pipeline 838 544 794 794 850 850 850 900 900 900 950 950 950 1000 1000 1000 1050 1050 1050 1100 1100 1100 1150 1150 1150 1200 1200 1200 1250 1250 1250
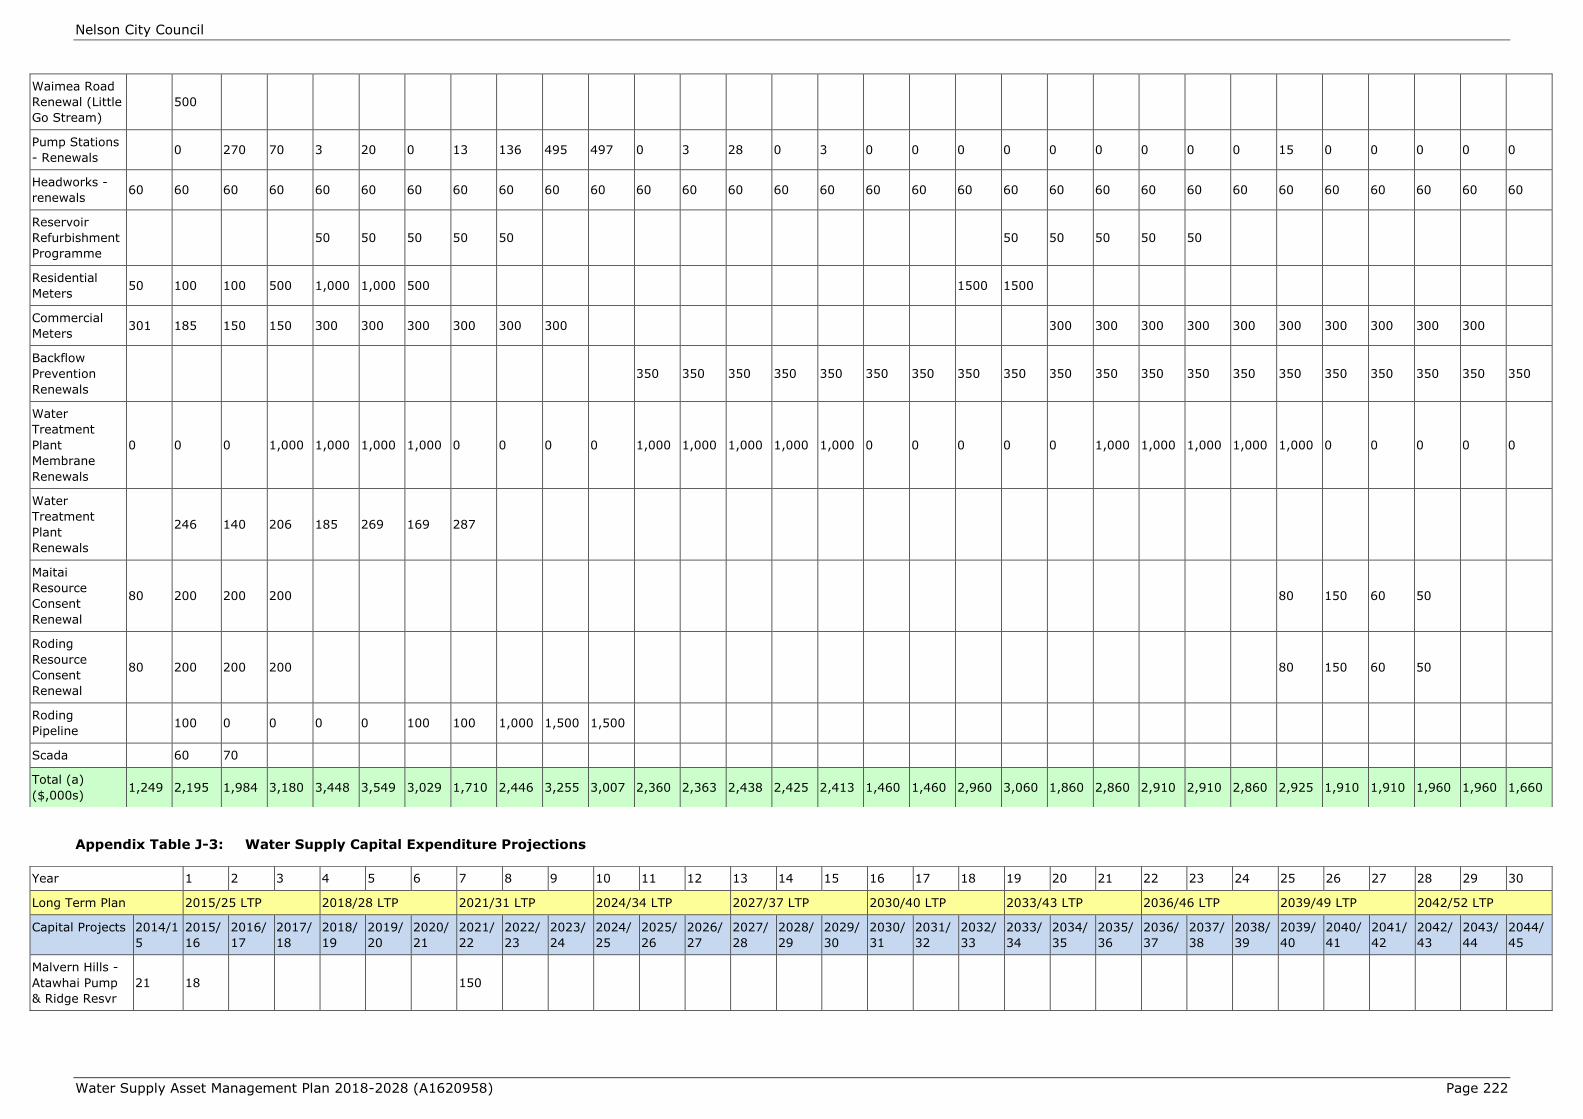
Nelson City Council
Water Supply Asset Management Plan 2018-2028 (A1620958) Page 222
Appendix Table J-3: Water Supply Capital Expenditure Projections
Waimea Road
Renewal (Little
Go Stream)
500
Pump Stations
- Renewals 0 270 70 3 20 0 13 136 495 497 0 3 28 0 3 0 0 0 0 0 0 0 0 0 15 0 0 0 0 0
Headworks -
renewals 60 60 60 60 60 60 60 60 60 60 60 60 60 60 60 60 60 60 60 60 60 60 60 60 60 60 60 60 60 60 60
Reservoir
Refurbishment
Programme
50 50 50 50 50 50 50 50 50 50
Residential
Meters 50 100 100 500 1,000 1,000 500 1500 1500
Commercial
Meters 301 185 150 150 300 300 300 300 300 300 300 300 300 300 300 300 300 300 300 300
Backflow
Prevention
Renewals
350 350 350 350 350 350 350 350 350 350 350 350 350 350 350 350 350 350 350 350
Water
Treatment
Plant
Membrane
Renewals
0 0 0 1,000 1,000 1,000 1,000 0 0 0 0 1,000 1,000 1,000 1,000 1,000 0 0 0 0 0 1,000 1,000 1,000 1,000 1,000 0 0 0 0 0
Water
Treatment
Plant
Renewals
246 140 206 185 269 169 287
Maitai
Resource
Consent
Renewal
80 200 200 200 80 150 60 50
Roding
Resource
Consent
Renewal
80 200 200 200 80 150 60 50
Roding
Pipeline 100 0 0 0 0 100 100 1,000 1,500 1,500
Scada 60 70
Total (a)
($,000s) 1,249 2,195 1,984 3,180 3,448 3,549 3,029 1,710 2,446 3,255 3,007 2,360 2,363 2,438 2,425 2,413 1,460 1,460 2,960 3,060 1,860 2,860 2,910 2,910 2,860 2,925 1,910 1,910 1,960 1,960 1,660
Year 1 2 3 4 5 6 7 8 9 10 11 12 13 14 15 16 17 18 19 20 21 22 23 24 25 26 27 28 29 30
Long Term Plan 2015/25 LTP 2018/28 LTP 2021/31 LTP 2024/34 LTP 2027/37 LTP 2030/40 LTP 2033/43 LTP 2036/46 LTP 2039/49 LTP 2042/52 LTP
Capital Projects 2014/1
5
2015/
16
2016/
17
2017/
18
2018/
19
2019/
20
2020/
21
2021/
22
2022/
23
2023/
24
2024/
25
2025/
26
2026/
27
2027/
28
2028/
29
2029/
30
2030/
31
2031/
32
2032/
33
2033/
34
2034/
35
2035/
36
2036/
37
2037/
38
2038/
39
2039/
40
2040/
41
2041/
42
2042/
43
2043/
44
2044/
45
Malvern Hills -
Atawhai Pump
& Ridge Resvr
21 18 150

Nelson City Council
Water Supply Asset Management Plan 2018-2028 (A1620958) Page 223
Atawhai #2
Reservoir 87 100 285 1,000 2,500
Atawhai Trunk
Main 50 95 3,300
Backflow
Prevention 375 150 150 150 150 150 150 150 150 150 150 200 200 200 200 200
Maitai Pipeline
(Dam-WTP) 2
Maitai Pipeline
(WTP-Westbk
Tce)
100 2,118 2,000
Maitai Planting 10 10 10 10 10 10 10 10 10 10 10 10 10 10 10 10 10 10 10 10 10 10 10 10 10 10 10 10 10 10 10
Telemetry /
control
upgrades
100 100
Pressure
Enhancement 150 100 100
NCC - TDC Link 100 100 1,000 1,000 1,000
DMA
establishment 50 100 100
Water Loss
Reduction
Programme
200 200 200 200 200 200 200 200 200 200
Hira extension 150 1,000 1,000
Future Growth
Additional
Storage
100 100 500 2500 500 500 2,000
Seismic Risk
Upgrades 100 100 100
Water
Treatment Plant
Membranes
1,200 1,066
Natural Hazards
Risk
Assessment
100 100 100 100 250 250 250 1,000 1,000 1,000 1,000
Network
Capacity
Confirmation
for Growth
Areas
100 100 100 1,250 100 100 100 1,250 100 100 100 1,250
Network
Upgrades
Nelson North
100 100 150 50 1,000 1,000 1,000
Network
Upgrades
Nelson Central
100 100 100 1,500
Network
Upgrades
Nelson South
100 100 100 1,500
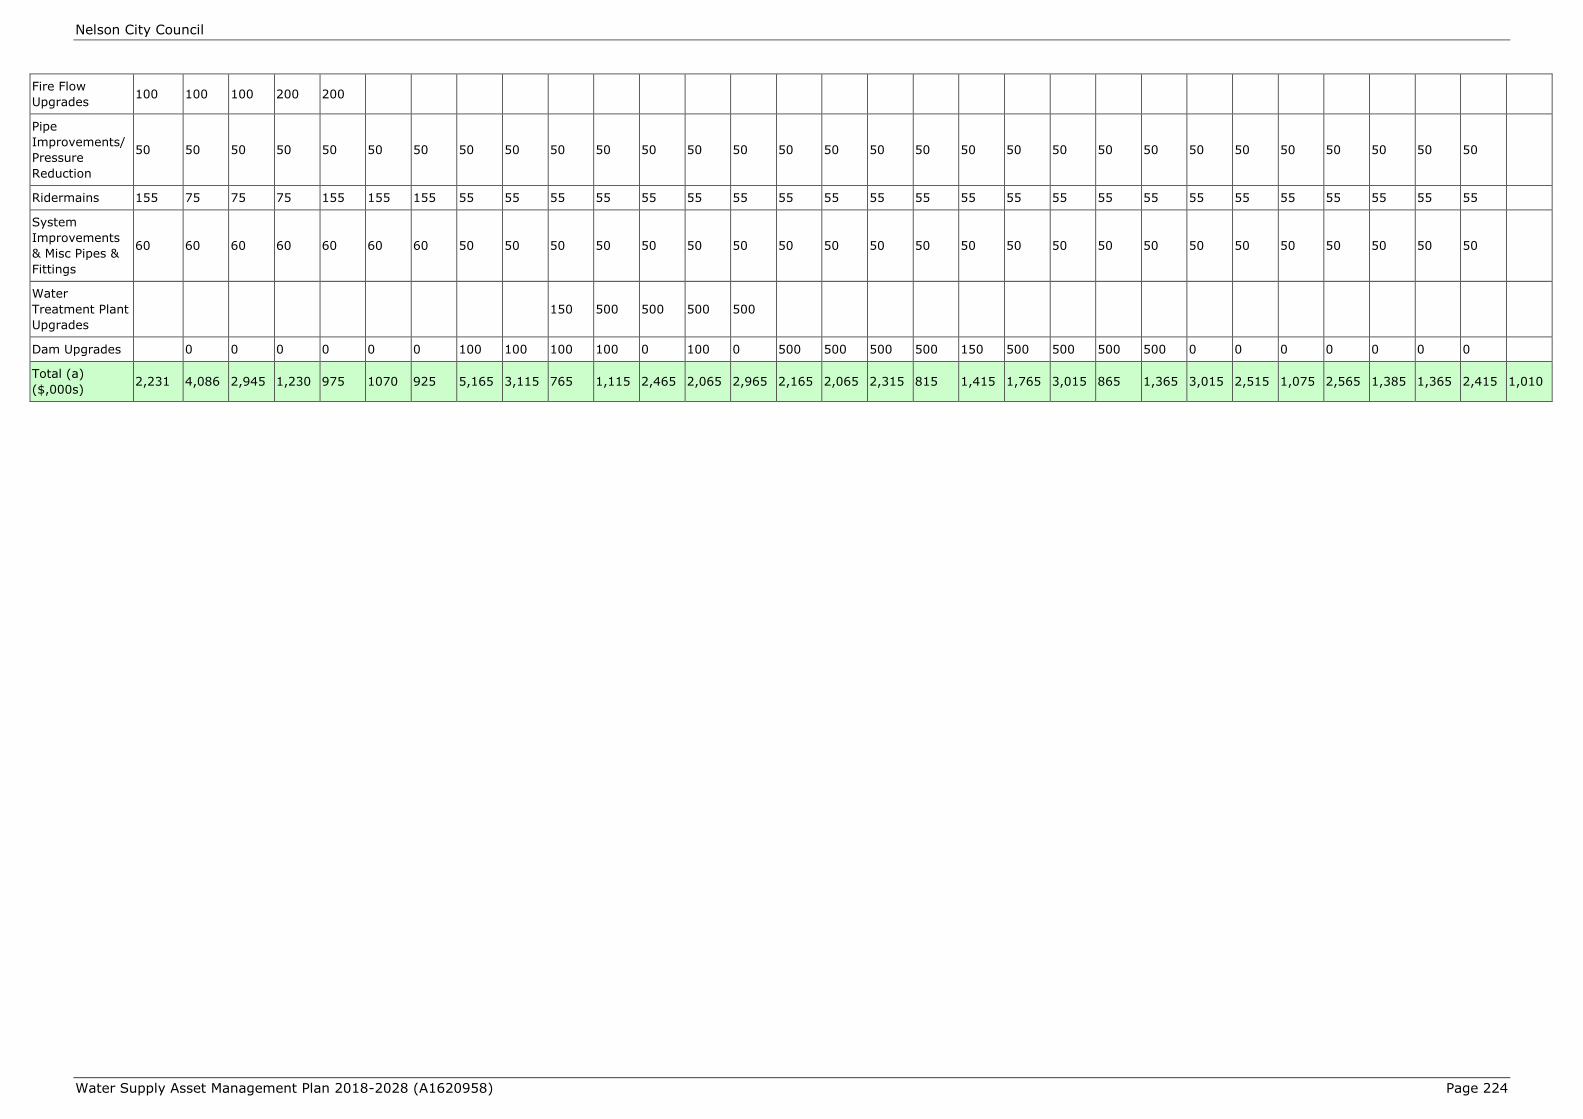
Nelson City Council
Water Supply Asset Management Plan 2018-2028 (A1620958) Page 224
Fire Flow
Upgrades 100 100 100 200 200
Pipe
Improvements/
Pressure
Reduction
50 50 50 50 50 50 50 50 50 50 50 50 50 50 50 50 50 50 50 50 50 50 50 50 50 50 50 50 50 50
Ridermains 155 75 75 75 155 155 155 55 55 55 55 55 55 55 55 55 55 55 55 55 55 55 55 55 55 55 55 55 55 55
System
Improvements
& Misc Pipes &
Fittings
60 60 60 60 60 60 60 50 50 50 50 50 50 50 50 50 50 50 50 50 50 50 50 50 50 50 50 50 50 50
Water
Treatment Plant
Upgrades
150 500 500 500 500
Dam Upgrades 0 0 0 0 0 0 100 100 100 100 0 100 0 500 500 500 500 150 500 500 500 500 0 0 0 0 0 0 0
Total (a)
($,000s) 2,231 4,086 2,945 1,230 975 1070 925 5,165 3,115 765 1,115 2,465 2,065 2,965 2,165 2,065 2,315 815 1,415 1,765 3,015 865 1,365 3,015 2,515 1,075 2,565 1,385 1,365 2,415 1,010
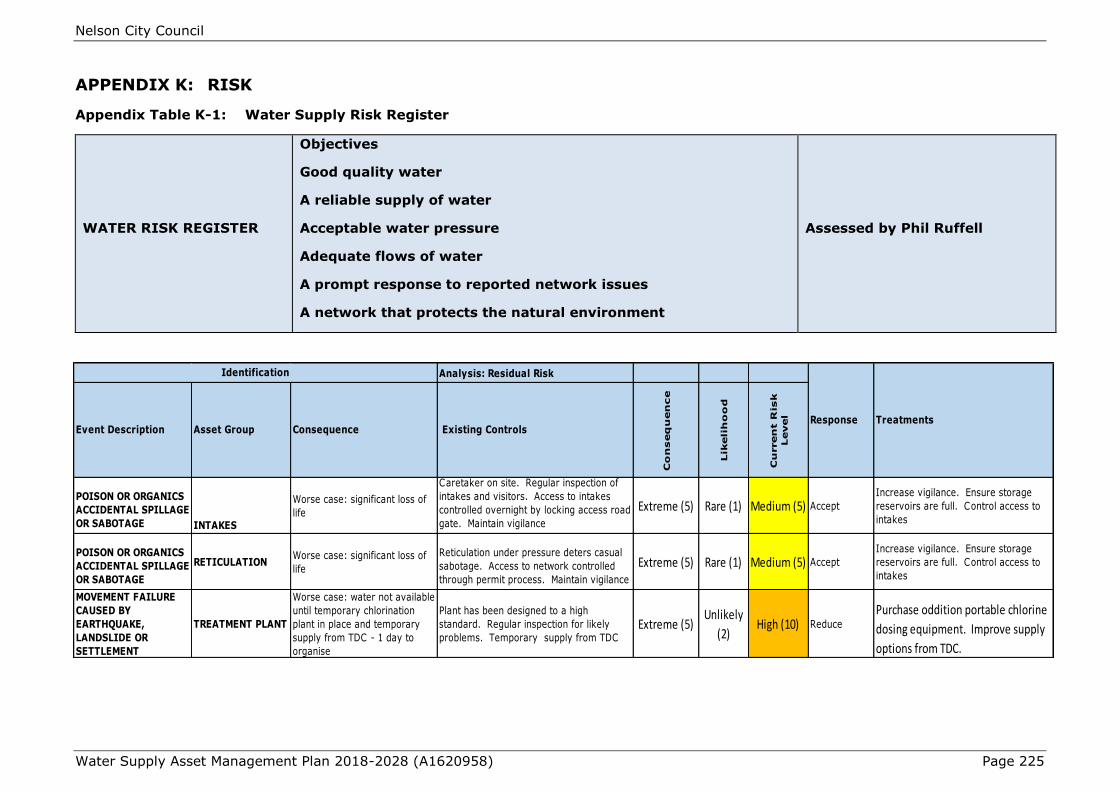
Nelson City Council
Water Supply Asset Management Plan 2018-2028 (A1620958) Page 225
APPENDIX K: RISK
Appendix Table K-1: Water Supply Risk Register
WATER RISK REGISTER
Objectives
Good quality water
A reliable supply of water
Acceptable water pressure
Adequate flows of water
A prompt response to reported network issues
A network that protects the natural environment
Assessed by Phil Ruffell
Analysis: Residual Risk
POISON OR ORGANICS
ACCIDENTAL SPILLAGE
OR SABOTAGE INTAKES
Worse case: significant loss of
life
Caretaker on site. Regular inspection of
intakes and visitors. Access to intakes
controlled overnight by locking access road
gate. Maintain vigilance
Extreme (5) Rare (1) Medium (5) Accept
Increase vigilance. Ensure storage
reservoirs are full. Control access to
intakes
POISON OR ORGANICS
ACCIDENTAL SPILLAGE
OR SABOTAGE
RETICULATIONWorse case: significant loss of
life
Reticulation under pressure deters casual
sabotage. Access to network controlled
through permit process. Maintain vigilance
Extreme (5) Rare (1) Medium (5) Accept
Increase vigilance. Ensure storage
reservoirs are full. Control access to
intakes
MOVEMENT FAILURE
CAUSED BY
EARTHQUAKE,
LANDSLIDE OR
SETTLEMENT
TREATMENT PLANT
Worse case: water not available
until temporary chlorination
plant in place and temporary
supply from TDC - 1 day to
organise
Plant has been designed to a high
standard. Regular inspection for likely
problems. Temporary supply from TDCExtreme (5)
Unlikely
(2)High (10) Reduce
Purchase oddition portable chlorine
dosing equipment. Improve supply
options from TDC.
TreatmentsEvent Description Asset Group Consequence Existing Controls
Cu
rren
t R
isk
Level
Identification
Response
Co
nseq
uen
ce
Lik
eli
ho
od
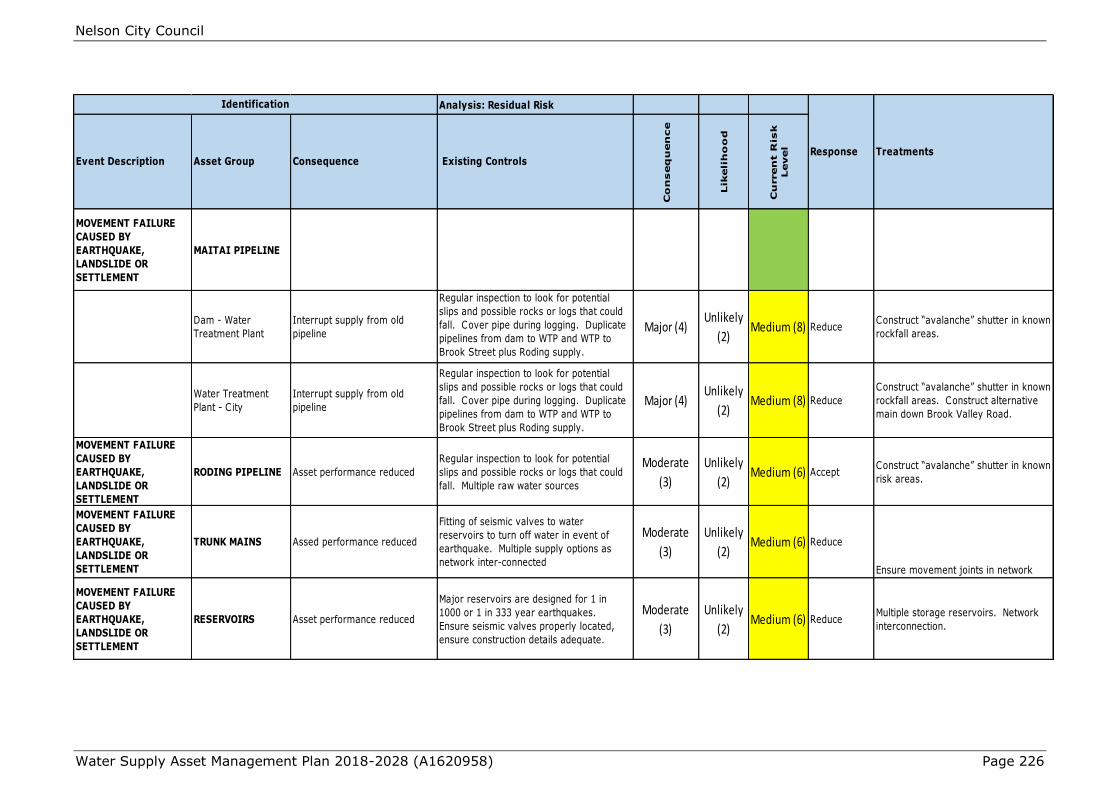
Nelson City Council
Water Supply Asset Management Plan 2018-2028 (A1620958) Page 226
Analysis: Residual Risk
MOVEMENT FAILURE
CAUSED BY
EARTHQUAKE,
LANDSLIDE OR
SETTLEMENT
MAITAI PIPELINE
Dam - Water
Treatment Plant
Interrupt supply from old
pipeline
Regular inspection to look for potential
slips and possible rocks or logs that could
fall. Cover pipe during logging. Duplicate
pipelines from dam to WTP and WTP to
Brook Street plus Roding supply.
Major (4)Unlikely
(2)Medium (8) Reduce
Construct “avalanche” shutter in known
rockfall areas.
Water Treatment
Plant - City
Interrupt supply from old
pipeline
Regular inspection to look for potential
slips and possible rocks or logs that could
fall. Cover pipe during logging. Duplicate
pipelines from dam to WTP and WTP to
Brook Street plus Roding supply.
Major (4)Unlikely
(2)Medium (8) Reduce
Construct “avalanche” shutter in known
rockfall areas. Construct alternative
main down Brook Valley Road.
MOVEMENT FAILURE
CAUSED BY
EARTHQUAKE,
LANDSLIDE OR
SETTLEMENT
RODING PIPELINE Asset performance reduced
Regular inspection to look for potential
slips and possible rocks or logs that could
fall. Multiple raw water sources
Moderate
(3)
Unlikely
(2)Medium (6) Accept
Construct “avalanche” shutter in known
risk areas.
MOVEMENT FAILURE
CAUSED BY
EARTHQUAKE,
LANDSLIDE OR
SETTLEMENT
TRUNK MAINS Assed performance reduced
Fitting of seismic valves to water
reservoirs to turn off water in event of
earthquake. Multiple supply options as
network inter-connected
Moderate
(3)
Unlikely
(2)Medium (6) Reduce
Ensure movement joints in network
MOVEMENT FAILURE
CAUSED BY
EARTHQUAKE,
LANDSLIDE OR
SETTLEMENT
RESERVOIRS Asset performance reduced
Major reservoirs are designed for 1 in
1000 or 1 in 333 year earthquakes.
Ensure seismic valves properly located,
ensure construction details adequate.
Moderate
(3)
Unlikely
(2)Medium (6) Reduce
Multiple storage reservoirs. Network
interconnection.
TreatmentsEvent Description Asset Group Consequence Existing Controls
Cu
rren
t R
isk
Level
Identification
Response
Co
nseq
uen
ce
Lik
eli
ho
od
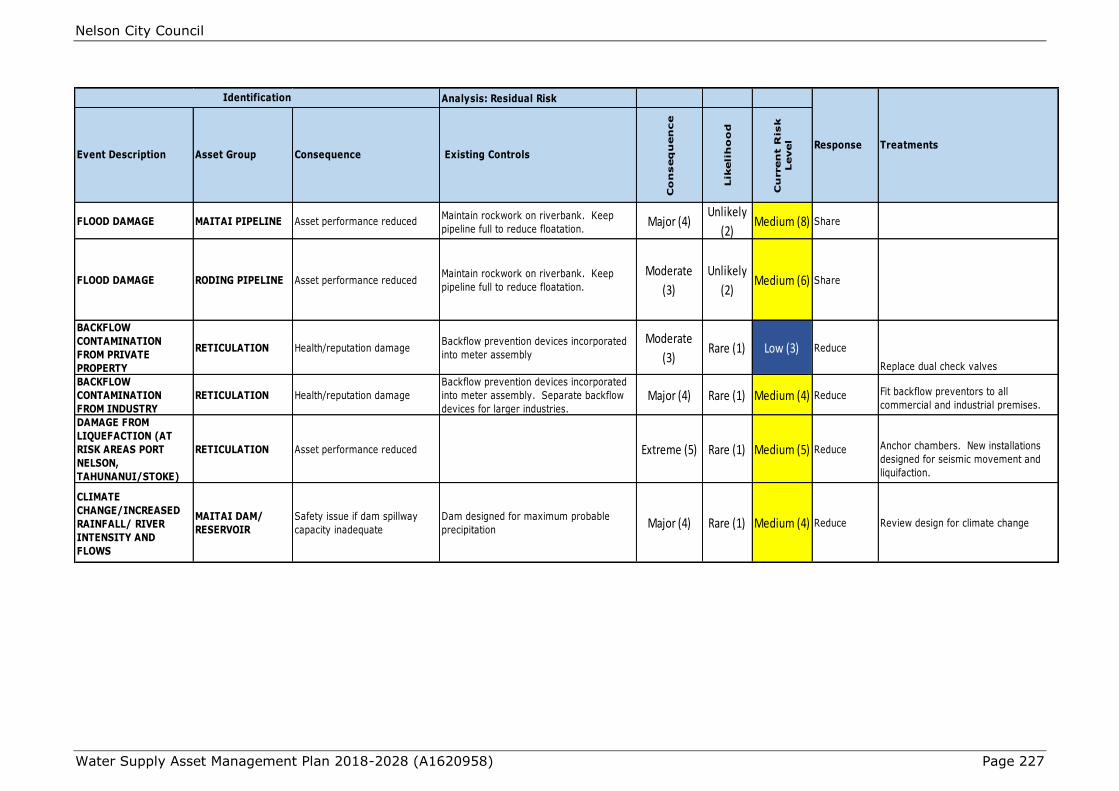
Nelson City Council
Water Supply Asset Management Plan 2018-2028 (A1620958) Page 227
Analysis: Residual Risk
FLOOD DAMAGE MAITAI PIPELINE Asset performance reducedMaintain rockwork on riverbank. Keep
pipeline full to reduce floatation.Major (4)
Unlikely
(2)Medium (8) Share
FLOOD DAMAGE RODING PIPELINE Asset performance reducedMaintain rockwork on riverbank. Keep
pipeline full to reduce floatation.
Moderate
(3)
Unlikely
(2)Medium (6) Share
BACKFLOW
CONTAMINATION
FROM PRIVATE
PROPERTY
RETICULATION Health/reputation damageBackflow prevention devices incorporated
into meter assembly
Moderate
(3)Rare (1) Low (3) Reduce
Replace dual check valves
BACKFLOW
CONTAMINATION
FROM INDUSTRY
RETICULATION Health/reputation damage
Backflow prevention devices incorporated
into meter assembly. Separate backflow
devices for larger industries.Major (4) Rare (1) Medium (4) Reduce Fit backflow preventors to all
commercial and industrial premises.
DAMAGE FROM
LIQUEFACTION (AT
RISK AREAS PORT
NELSON,
TAHUNANUI/STOKE)
RETICULATION Asset performance reduced Extreme (5) Rare (1) Medium (5) Reduce Anchor chambers. New installations
designed for seismic movement and
liquifaction.
CLIMATE
CHANGE/INCREASED
RAINFALL/ RIVER
INTENSITY AND
FLOWS
MAITAI DAM/
RESERVOIR
Safety issue if dam spillway
capacity inadequate
Dam designed for maximum probable
precipitationMajor (4) Rare (1) Medium (4) Reduce Review design for climate change
TreatmentsEvent Description Asset Group Consequence Existing Controls
Cu
rren
t R
isk
Level
Identification
Response
Co
nseq
uen
ce
Lik
eli
ho
od

Nelson City Council
Water Supply Asset Management Plan 2018-2028 (A1620958) Page 228
Appendix Table K-2: Consequence Rating (Impact)
Political / Community/
Reputational
Exterme (5)Multiple fatalities of
workers or public (MF)
Significant loss of life
expectancy for
multiple persons or
incapacity for more
than 1000 person
days
Service not provided
for more than 5000
person days
Permanent
environmental
damage on a
nationally significant
scale and/or
permanent loss of
nationally significant
building, artwork, or
other valued entity
Overspend, loss
(i.e. spend without
result) or income
loss of > $5m OR
>100% of business
unit budget
Major loss of public confidence
in Council (>2000 opponents
via social media or other
mediums)
Negative international
mainstream media coverage;
shareholder or key stakeholder
outage; or loss of a key
customer
Major breakdown of
relationship affecting
multiple areas. Refusal
to resolve without one
or more major
concessions from
council
Litigation/ prosecution or
civil action successful
resulting in major
(>50% of maximum
available) fine/costs
awarded and/or
imprisonment of council
officer.
Multiple errors in
information and
analysis and
presentation
misleading
(intentionallly or
not) or not
understandable by
non- specialists
Major (4)Single fatality of
workers or public (SF)
Single loss of life
expectancy or
incapacity for
between 100 and
1000 person days
Service not provided
for less than 5000
person days but
more than 500
person days
Major environmental
damage with long-
term recovery
requiring significant
investment and/or
loss or permanent
damage to a
registered historical,
cultural or
archaeological site or
object
Overspend, loss
(i.e. spend without
result) or income
loss of > $1m and
<$5m OR between
70% and 100% of
business unit
budget
Significant negative public
reaction likely
(200-2000 opponents via social
media or other mediums)
Negative national mainstream
media coverage; significant
negative perception by
shareholder or key
stakeholder; or a customer
disruption
Significant breakdown
of relationship largely
in in one area. Some
concessions from
council sought before
substantive issue
considered by iwi
grouping affected
Litigation/ prosecution or
civil action successful
resulting in minor
fine(<50% of max
available)/ costs
awarded.
One major error in
information, analysis
incomplete and
presentation
ambiguous
Moderate (3)Notifiable injury of
workers or public.
Incapacity for
between 20 and 100
person days
Service not provided
for less than 500
person days but
more than 50 person
days
Measurable
environmental harm
on a nationally
significant scale.
Some costs in terms
of money and/or loss
of public access or
conservation value of
the site and/or
restorable damage to
historical, cultural or
archaeological site or
object
Overspend, loss
(i.e. spend without
result) or income
loss of > $0.5m
and <$1m OR
between 30% and
70% of business
unit budget
Some negative public reaction
likely (30-200 opponents via
social media or other
mediums)
Repeated complaints;
Regulatory notification; or
negative stakeholder, local
media attention
Major relationship
damaged in a single
area but amenable to
negotiation
Documented Breach of
legislation, no legal
action or prosecution or
civil action not
successful.
Information correct
but presentation/
analysis insufficient
to support decision
on the day
Minor (2)
Serious injury on one
person requiring
medical treatment (MA)
Incapacity for
between 1 and 20
person days
Service not provided
for less than 50
person days but
more than 5 person
days
Medium term
environmental impact
at a local level and/or
development
compromising the
integrity of a
registered historical,
cultural or
archaeological site
Overspend, loss
(i.e. spend without
result) or income
loss of > $100k
and <$500k OR
between 10% and
30% of business
unit budget
Minor public reaction likely
(<30 active opponents via
social media or other
mediums)
Workforce attention; limited
external attention;
Relationship damage
resolvable through
normal
communication/
consultation
mechanisms
Formal warning of
breach from legislative
authority.
Information correct,
analysis complete
but presented in a
way which could be
misinterpreted
Insignificant (1)
Minor injury requiring
only first aid or less
(FA)
Incapacity for less
than 1 person day
Service not provided
for between 1 & 5
person days
Short term and
temporary impact
requiring no remedial
action and/or
restorable loss
damage to historical/
cultural record
Overspend, loss
(i.e. spend without
result) or income
loss of > $10k and
<$100k OR
between 5% and
10% of business
unit budget
Very limited negative reaction
(1 or 2 active opponents via
social media or other
mediums) Internal attention
only from staff directly working
on the matter.
Iwi/ tribe/ hapu public
dissatisfaction
resolvable through
routine communication
Breach of minor
legislation/ no legal
action
Small errors in
information or
presentation - no
effect on decision
FinancialRelationship with
IwiRating Safety Health
Asset
Performance/
Service Delivery
Environmental/
Historical/cultural
Information/
decision supportLegal compliance

Nelson City Council
Water Supply Asset Management Plan 2018-2028 (A1620958) Page 229
Appendix Table K-3: Risk Matrix – Consequences x Likelihood
The consequence can be
expected in most
circumstances OR
A very low level of
confidence/information
The consequence will
quite commonly occur
OR
A low level of
confidence/information
The consequence may
occur occasionally
A moderate level of
confidence/information
The consequence may
occur only infrequently
A high level of
confidence/information
The consequence may
occur only in
exceptional
circumstances
A very high level of
confidence/information
Almost certain
(5)
CONSEQUENCES
Insignificant(1) Minor (2) Moderate (3) Major (4) Extreme (5)
Medium (5) Medium (10) High (15) Very High (20) Very High (25)
High (12) High (15)Low (3) Medium (6) Medium (9) Possible (3)
Medium (4) Medium (8) High (12) High (16) Very High (20) Likely (4)
Rare (1)
Very Low (2) Low (4) Medium (6) Medium (8) High (10) Unlikely (2)
Very Low (1) Very Low (2) Low (3) Medium (4) Medium (5)
Descriptor Qualitative guidance
statement
Indicative
Probability range
%
Indicative frequency
range (years)
LIKELIHOOD of the given consequence occurring
Once per 10 - 50 years2% - 10%
<2%Less than once per 50
years
>90% >1 occurrence per year
Once per 1-5 years
Once per 5-10 years
20% - 90%
10% - 20%

Nelson City Council
Water Supply Asset Management Plan 2018-2028 (A1620958) Page 230
Appendix Table K-4: Residual Risk Tolerance
Risk Level Description and
Action
Authority for
continued
tolerance
Timing for
implementing
action
Obligation to
promptly advise
including
advising
treatments
Very High
Not normally
tolerable, immediate
intervention to
reduce risk
Full Council on
advice from CE
Immediate if
possible but no
more than one
month
Full Council using
best practicable
means
High
Not normally
tolerable, initiate
action as soon as
practicable to
reduce risk below
High
SLT or Group
Manager
(Council at CE
discretion)
As soon as
practicable but no
more than 2
months
SLT or accountable
Group Manager
(Council at CE
discretion)
Medium
Normally tolerable,
frequently review to
look for opportunities
to further reduce risk
where practicable
Business Unit
Manager
At least within
one quarter
Accountable Group
Manager
Low
Acceptable risk,
routine review for
low cost actions to
reduce risk further
No specific
authority required
Routine review
period (e.g. 3- 6
monthly)
None
Very Low
Acceptable risk, no
specific actions to
reduce further
No specific
authority required
Only if incidental
to another action None
Nelson City Council
Water Supply Asset Management Plan 2018-2028 (A1620958) Page 231
APPENDIX L: NELSON WATER TREATMENT PLANT ASSET
MANAGEMENT PLAN (A1111654) (A717945)
Nelson City Council
Water Supply Asset Management Plan 2018-2028 (A1620958) Page 232

Nelson City Council
Water Supply Asset Management Plan 2018-2028 (A1620958) Page 233

Nelson City Council
Water Supply Asset Management Plan 2018-2028 (A1620958) Page 234

Nelson City Council
Water Supply Asset Management Plan 2018-2028 (A1620958) Page 235
Nelson City Council
Water Supply Asset Management Plan 2018-2028 (A1620958) Page 236
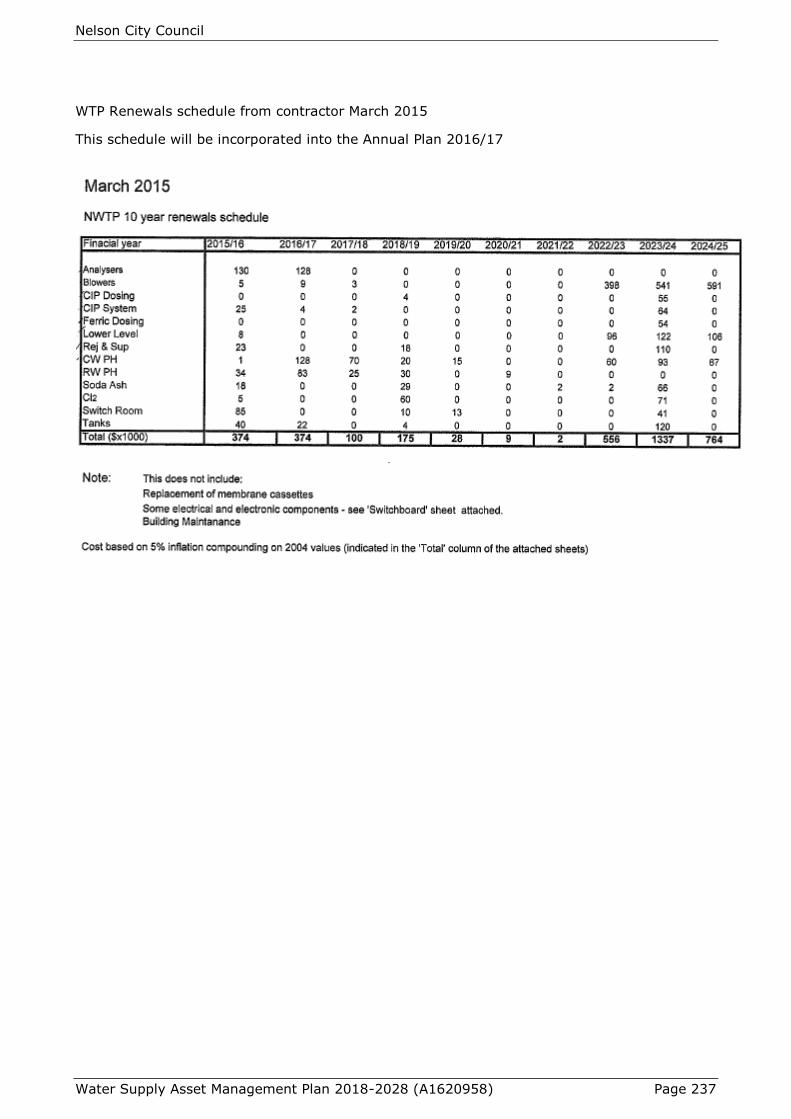
Nelson City Council
Water Supply Asset Management Plan 2018-2028 (A1620958) Page 237
WTP Renewals schedule from contractor March 2015
This schedule will be incorporated into the Annual Plan 2016/17
Nelson City Council
Water Supply Asset Management Plan 2018-2028 (A1620958) Page 238
APPENDIX M: SOLUTIONS TO FIRE FLOW LEVEL OF SERVICE
(A706990)
Solutions to Breaches of Fire Flow Level of Service
Champion Tce: 22 properties affected
Create a connection between the 350 main and the 100 main either at 66 or 49 Bisley Ave.
This fixes the issue for 21 properties. 8 Bisley Ave is 145m from the nearest hydrant (should
be 135m). This can be fixed by shifting the hydrant to the corner by 10 Bisley (but probably
not worth it). Bisley Avenue solution likely to require upgrading 40mm rider main to 150dia
main to support hydrant flows. Programme in for future AMPlan 2018/19. PR 15/12/2014.
Moncrieff Ave: 10 properties affected
Renew 262m of 100 cast iron main with 100 PVC from the start of Moncrieff Ave to 25
Moncrieff Ave.
Montcalm St: 8 properties affected
Renew 100m of 100 cast iron main from 47 Wolfe St north to the walkway between 31 and 37
Wolfe St. Lay 50m of 100 main up the walkway with a hydrant at the end. This fixes fire
flows for 5 properties: 30, 32, 34, 37 and 39 Montcalm St.
Remaining 3 properties: 68Arrow St has no house on it (owned by same owners as 70 Arrow
St). 70 Arrow St is 186m from the hydrant at the end of Arrow St. 50 Arrow St also fails. To
fix these, renew 620m of 100 CI from Washington Rd, up arrow St, down walkway to Quebec
Rd and to end of Arrow St. Extend another 40m to the very end of Arrow St and put on a
hydrant and then it will get to within 146m of 70 Arrow St house and fix 50 Arrow St.
Brooklands Rd: 47 properties affected
Renew 480m of 100 AC with 150 main from Atawhai Dr to 54 Brooklands Rd.
Strathaven Pl: 20 properties affected
Note that 27, 31, 35, 39, 40 and 43 Strahaven Pl have C0689 (Non Compliance Fire Service)
condition so are not included. Replace 123m of 50 HDPE with 100 main from Strathaven tanks
down to where it meets the 150 main. Also put a new hydrant on the high side of the NRV
outside 17 Strathaven Pl. Now only 1 property – 34 Strathaven Pl fails.
Tui Glen / Matuku Pl: 31 properties affected
Either put a new 135m 100 dia link down Kereru Way or replace 194m of 100 AC in Tui Glen
Rd from Atawhai Dr to Matuku Pl with 150 main (excluding the 42 length which is already 100
PVC).
Hazells Way: 5 properties affected
Replace the first 50m of 40 dia main in Manchester Way with 50 dia main and put a hydrant in
at the corner.
Norwest Way / Seawatch Way: 4 properties affected
Note there are 2 fire hydrants on tanks in Seawatch Way to cover the top 6 houses in
Seawatch Way. However 10 and 15 Seawatch Way are not adequately covered by these (not
within 135m). These are not included in this evaluation as we cannot fix them with
reticulation.
Would have to have a pump to fix these as the top hydrant (which still 142m from the furthest
house) is not 10m below the tanks.

Nelson City Council
Water Supply Asset Management Plan 2018-2028 (A1620958) Page 239
Chamboard Pl: 3 properties affected
A new hydrant outside the property boundary of 5 and 7 Chamboard Pl at the 89.5m contour
will deliver 25l/s and is within 135m of the 3 properties. Note this is only 15m from the
existing hydrant so not sure if it’s worth it. Install new hydrant outside No7, halfway between
existing hydrants.
Princes Dr: 4 properties affected
These are within 10m elevation of Observatory reservoir so pumping would be required.
Point Rd: 4 properties affected
These properties are located near the portion of Point Rd which is subject to high tide so no
easy solution.
Orakei St: 4 properties affected
Replace 258m of 100 AC with 100 PVC.
20a Matipo Tce: 1 property affected
The driveway to this house is 200m on its own – would need a dedicated fire main.
Atmore Tce: 6 properties affected
Putting a new hydrant at the 129m contour and 66m of 150 main leading down to it from the
tank (new and replace existing 100 dia) gets 25 l/s which fixes 4 properties. 46 Atmore is too
far away so would require a pump.
City Heights: 2 properties affected
Need a new hydrant 20m on from the last hydrant (connected by 100 dia main) so that 7 City
Heights is within 135m. Also need to replace 100m of 100 dia with 150 dia main from
Cleveland Tce to City Heights.
Cherry Ave: 4 properties affected
The Stoke pressure reduction scenario had Baigent Rd from The Ridgeway to Cherry Ave being
upgraded to 150 and Cherry Ave being renewed in 100 PVC to fix this.
Willow Ave: 2 properties affected
Upgrade 128m of 100 main to 150 in Ranui Rd from Main Rd to Willow Ave. Upgrade 80m of
100 main to 100 PVC in WilloW Ave from Ranui Rd to the first hydrant.
17B Titoki St
Nearest hydrant is 20m too far away. Need new hydrant outside 17 Titoki.
Mount Street /Konini Street Link
Currently Konini St water is served by a single dead-end main from Gloucester St, at higher
pressure. As part of the wider pressure reduction programme it is proposed to reduce the
pressure in Konini Street. This will adversely impact on fire flows. This can be resolved by the
connection of the Konini St main to the Mount Street water main. This allows for flow to be
provided from a ring main.
Properties Needing Further Investigation
10 and 15 Seawatch Way
5 and 5A Te Ata Pl
6 Ngapua Pl
Nelson City Council
Water Supply Asset Management Plan 2018-2028 (A1620958) Page 240
12 Naumai St
9 and 13 Werneth Ridge
49, 51, 53, 55, 56, 58, 60 St Lawrence St
1998 Residents’ Survey
In November 1998 AC Nielsen carried out a residents' survey on behalf of the Nelson City
Council.
Of the Council’s 14 significant activity areas, residents:
Were least satisfied with the water supply;
Rated water supply the most important activity area in contributing to quality of life of
Nelson residents.
2001 Residents’ Survey
In September 2001 AC Nielsen carried out a residents’ survey on behalf of the Nelson City
Council. Of the Council’s 14 significant activity areas, residents again:
Were least satisfied with the water supply;
Rated water supply the most important activity area in contributing to quality of life of
Nelson residents.
2004 Residents’ Survey
In November 2004 AC Nielsen carried out a residents’ survey on behalf of the Nelson City
Council. This survey was carried out some three months after the opening of the Tantragee
Water Treatment Plant.
Of the Council’s 14 significant activity areas, residents:
Rated water supply as the most important activity area contributing to the quality of life
for Nelson Residents;
Were most satisfied with the water supply and gave it a similar satisfaction to parks and
open spaces.
Issues identified within Water Supply were:
Having a permanent, continuous and reliable supply;
Quality of water, both from taste and health perspective;
A fair and affordable cost.
2007 Residents’ Survey
In August 2007 the Neilson Company carried out a residents’ survey on behalf of the Nelson
City Council.
Of the Council’s 14 significant areas, residents:
Again rated water supply as the most important activity area contributing to quality of
life for Nelson Residents;
Rated water supply second only to Parks and Open Spaces for satisfaction.
Issues identified within water supply were:
Cost of the Water Treatment Plant/Cost of water too high;

Nelson City Council
Water Supply Asset Management Plan 2018-2028 (A1620958) Page 241
Adequate and continuous supply necessary;
Water quality is a necessity of life and health.
2010 Residents’ Survey
In June and July 2010 the Key Research carried out a residents’ survey on behalf of the Nelson
City Council.
Of the Council’s 14 significant areas, residents:
Perceived water supply as the most important area for Council to focus on;
Satisfaction is high with regard to water supply with respondents rating this second
highest after parks and open space with 73% responding as satisfied or very satisfied.
Issues identified within water supply were:
Cost of water;
Quality of water – in terms of taste and smell;
Security of supply and water pressure.
2011 Residents’ Survey
In May 2011 the Key Research carried out a residents’ survey on behalf of the Nelson City
Council.
Of the Council’s 14 significant areas, residents:
Perceived water supply as the most important area for Council to focus on;
Satisfaction remained high with regard to water supply with respondents rating this
fourth highest with 70% responding as satisfied or very satisfied.
Issues identified within water supply were:
Cost of water
Quality of water – in terms of taste
Appendix Table M-1: Maitai Pipeline (over next five years)
Location Work Done Work to be Done
Support
Blocks
Painting Repairs Support
Blocks
Painting Repairs
Fiddlers Elbow Syphon 2012/15
River arch span
West abutment (true
right)
East abutment (true
left)
1991
2000
2012/15
Motor Camp Syphon
River arch span
West abutment (true
left)
East abutment (true
right)
Investigate
2011
1995
2012/15
1980
1996
TBA
Andrews Farm Syphon

Nelson City Council
Water Supply Asset Management Plan 2018-2028 (A1620958) Page 242
Location Work Done Work to be Done
Support
Blocks
Painting Repairs Support
Blocks
Painting Repairs
East abutment
West abutment
1993
1993
To be abandoned when repairs not
viable
To be abandoned when repairs not
viable
Brook Street Falling
Main
To be abandoned when repairs not
viable
Surge Towers and
Valve Specials
2001/02
Tunnel Repairs 1994
Concrete Pipe Crack
Repairs
1996 ongoing
Rockfall Protection
Appendix Table M-2: Damwatch Engineering Maitai Dam 2013 Comprehensive
Safety Review recommendations:

Nelson City Council
Water Supply Asset Management Plan 2018-2028 (A1620958) Page 243

Nelson City Council
Water Supply Asset Management Plan 2018-2028 (A1620958) Page 244

Nelson City Council
Water Supply Asset Management Plan 2018-2028 (A1620958) Page 245
Appendix Table M-3: Total Monthly Demand
Month 2008 - 2009 2009 - 2010 2010 - 2011 2011 - 2012 2012 - 2013 2013 - 2014 2014 - 2015 2015 - 2016 2016 - 2017 2017 - 2018
Maitai
(000m3)
Roding
(000m3)
Maitai
(000m3)
Roding
(000m3)
Maitai
(000m3)
Roding
(000m3)
Maitai
(000m3)
Roding
(000m3)
Maitai
(000m3)
Roding
(000m3)
Maitai
(000m3)
Roding
(000m3)
Maitai
(000m3)
Roding
(000m3)
Maitai
(000m3)
Roding
(000m3)
Maitai
(000m3)
Roding
(000m3)
Maitai
(000m3)
Roding
(000m3)
July 420 204 315 280 NA NA 268 313 309 277 336 239 330 199 328 202 292 243 479 66
Aug 319 298 381 220 NA NA 286 315 444 140 367 212 299 237 291 228 309 237 496 63
Sept 361 238 485 69 359 208 291 316 353 200 330 226 324 201 331 197 297 238 477 62
Oct 323 299 364 256 348 252 318 258 394 196 403 172 300 288 344 237 391 151 513 74
Nov 423 182 382 322 356 344 346 278 398 288 355 286 434 260 358 275 346 217 557 108
Dec 447 179 435 306 413 252 441 194 429 300 421 273 480 170 426 252 385 233 579 202
Jan 444 322 458 281 410 278 425 278 487 238 443 241 405 346 536 100 384 281 534 109
Feb 345 330 403 307 348 330 325 331 376 271 361 309 451 171 455 201 341 278 387 80
Mar 439 246 456 313 385 267 409 214 393 281 458 225 490 130 359 296 416 230 531 93
Apr 381 247 483 208 398 178 319 268 365 195 418 173 356 201 569 11 492 72
May 465 108 421 218 467 82 328 267 389 195 298 248 278 260 528 40 492 74
June 329 255 412 197 349 209 363 189 385 153 318 211 301 212 374 151 482 68
Sub-Total 4,696 2,908 4,995 2,977 NA NA 4,119 3,221 4,722 2,734 4,508 2,815 4,448 2,675 4,899 2,190 4,627 2,322 4,533 857
Total
(000m3) 7,604 7,972 7,188 7,340 7,456 7,323 7,123 7,089 6,949 5,410

Nelson City Council
Water Supply Asset Management Plan 2018-2028 (A1620958) Page 246
Appendix Table M-4: Historical Asset Valuations
Asset Category
June 2012 June 2010
Quantity RV DRV Depr Quantity RV DRV Depr
km/units/
Ha ($) ($) ($)
km/units
/Ha ($) ($) ($)
Reticulation High
Pressure 107.5 26,732,483 13,502,374 362,648 110.6 25,674,272 12,773,447 347,925
Reticulation Low
Pressure 212.6 46,678,091 26,284,959 562,149 211.7 43,133,775 24,479,987 521,883
Trunk Mains 36.8 16,898,455 9,539,672 218,788 37.2 16,125,114 9,400,533 209,401
Maitai Pipeline 9.2 16,392,075 3,717,038 258,490 9.2 17,091,425 4,391,315 272,745
Roding Pipeline 5.7 2,995,194 345,842 37,313 5.7 2,826,891 237,321 37,481
Maitai Water
Supply Scheme 19,114,600 14,328,400 208,000 19,114,600 14,328,400 208,000
Roding Dam 2,586,200 1,000,400 43,100 2,586,200 1,000,400 43,100
Treatment Plant 24,779,752 14,215,696 1,198,337 21,888,693 15,672,048 1,130,507
Tunnels 3 10,595,700 9,515,000 50,700 3 10,595,700 9,515,000 50,700
Reservoirs and Tanks 37 11,550,683 9,438,174 145,972 36 9,766,108 7,759,414 128,348
Pump Stations 9 2,262,029 1,315,266 100,538 9 2,097,315 1,384,325 96,140
Pressure
Reducing Valves 33 400,870 229,124 11,041 28 315,763 172,995 8,684
Air & Non Return Valves 123 293,225 169,544 8,060 117 263,157 159,341 7,249
Gate Valves 3,249 7,463,915 4,575,426 94,590 3,174 5,472,591 3,283,611 69,304
Manholes 94 343,359 198,440 4,548 93 320,519 191,683 4,215
Hydrants 2,459 5,630,557 2,846,438 71,635 2,450 4,523,400 2,298,685 57,584
Meters 20,122 2,931,042 746,134 173,540 19,851 2,729,116 931,395 166,786
Customer
Connections 20,122 25,725,659 15,528,564 321,571 19,851 21,948,103 13,919,568 274,351
TOTAL 223,373,890 127,496,493 3,871,021 206,472,741 121,899,468 3,634,402