water supplies – general
TRANSCRIPT

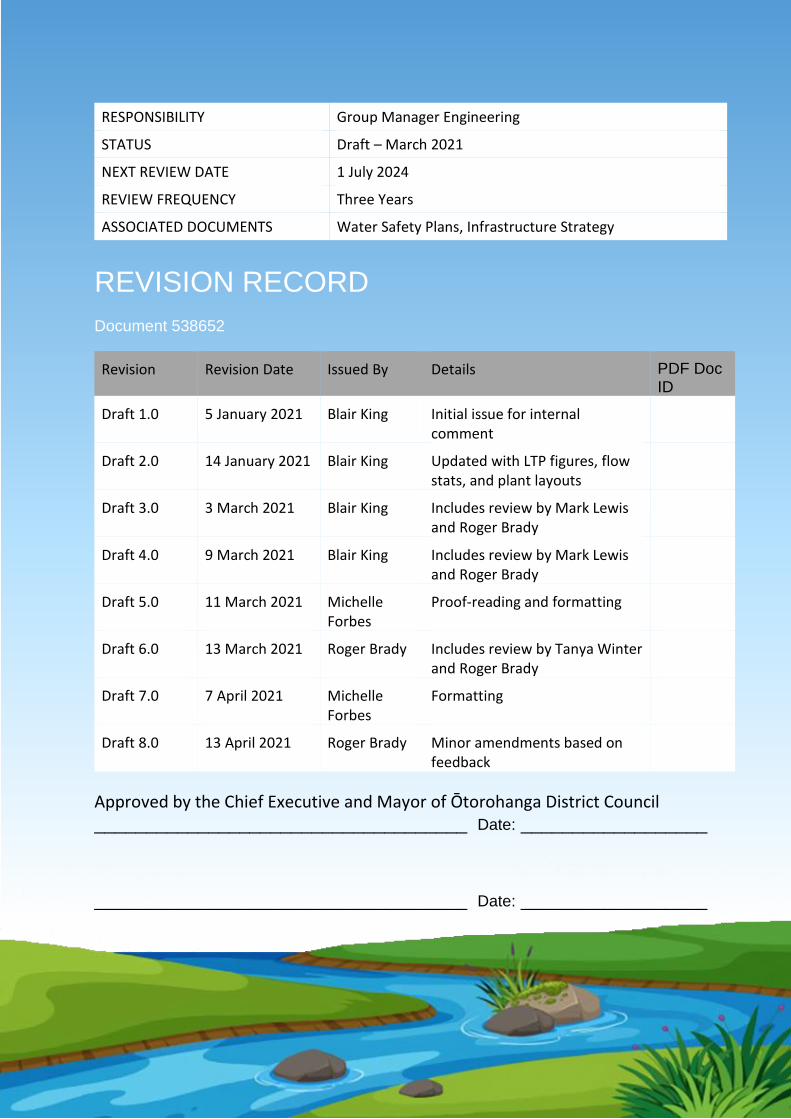
REVISION RECORD Document 538652
Approved by the Chief Executive and Mayor of Ōtorohanga District Council ____________________________________ Date: __________________
____________________________________ Date: __________________
RESPONSIBILITY Group Manager Engineering
STATUS Draft – March 2021
NEXT REVIEW DATE 1 July 2024
REVIEW FREQUENCY Three Years
ASSOCIATED DOCUMENTS Water Safety Plans, Infrastructure Strategy
Revision Revision Date Issued By Details PDF Doc ID
Draft 1.0 5 January 2021 Blair King Initial issue for internal comment
Draft 2.0 14 January 2021 Blair King Updated with LTP figures, flow stats, and plant layouts
Draft 3.0 3 March 2021 Blair King Includes review by Mark Lewis and Roger Brady
Draft 4.0 9 March 2021 Blair King Includes review by Mark Lewis and Roger Brady
Draft 5.0 11 March 2021 Michelle Forbes
Proof-reading and formatting
Draft 6.0 13 March 2021 Roger Brady Includes review by Tanya Winter and Roger Brady
Draft 7.0 7 April 2021 Michelle Forbes
Formatting
Draft 8.0 13 April 2021 Roger Brady Minor amendments based on feedback
Ōtorohanga District Water Supply Asset Management Plan 2021-31 i
CONTENTS
1.0 Executive Summary .................................................................................................................. 1 2.0 Introduction ............................................................................................................................. 3 2.1 Key Directions of Council ....................................................................................................... 3 2.2 Plan Purpose .......................................................................................................................... 4 2.3 Relationship with other Plans ................................................................................................ 4 2.4 Agreed Problem and Benefit Statements .............................................................................. 5 2.5 Underlying Planning Assumptions ......................................................................................... 7 2.5.1 District Overview and Growth Projections .............................................................. 7 2.5.2 Water Allocation Framework ................................................................................ 10 2.5.3 Drinking Water Standards Mandatory .................................................................. 10 2.5.4 Climate Change ...................................................................................................... 11 3.0 Asset Management Practices .................................................................................................. 12 3.1 Asset Management Criteria ................................................................................................. 12 3.2 Data Provision Process and Systems ................................................................................... 12 3.3 Definition and Management of Critical Risks ...................................................................... 15 3.3.1 Critical Risks ........................................................................................................... 15 3.4 Programme / Project Prioritisation of Renewals ................................................................ 21 3.5 Valuation Practices and Process .......................................................................................... 23 3.6 Financial Forecasts .............................................................................................................. 24 3.7 Performance Measures ........................................................................................................ 24 3.8 Collaboration with other Councils and Taumata Arowai ..................................................... 24 4.0 Levels of Service .................................................................................................................... 26 4.1 Customer Expectations ........................................................................................................ 26 4.2 Technical Levels of Service .................................................................................................. 27 5.0 Council Administered Water Supplies – General Information ................................................... 29 5.1 Nature of Activity ................................................................................................................. 29 5.2 Rationale for Delivery of Activity ......................................................................................... 29 5.3 What is the Extent of Council’s Responsibility? ................................................................... 29 5.4 Potentially Associated Negative Effects............................................................................... 30 5.5 Water Source Chemistry ...................................................................................................... 30 5.6 Asset Information ................................................................................................................ 30 5.7 Asset Condition .................................................................................................................... 30 5.8. Rural Water Schemes (RWS) and Conditions of Supply ....................................................... 30 5.9 Water Services Delivery ...................................................................................................... 31 5.10 Demand Trends .................................................................................................................... 31 5.11 Drinking Water Standards NZ (DWSNZ) Compliance ........................................................... 32 5.12 Maintenance and Renewal Strategies ................................................................................. 34 5.13 Health Risk Assessments ...................................................................................................... 35 5.14 Adopted Processes and Standards for Work on Water Assets ............................................ 35 5.15 Water Fluoridation ............................................................................................................... 36 5.16 Raw Water Allocation .......................................................................................................... 37 5.17 Unaccounted for Water ...................................................................................................... 37 5.18 Water Metering & Other Demand Control Measures ......................................................... 38 5.19 Water Take Reporting ......................................................................................................... 38
Ōtorohanga District Water Supply Asset Management Plan 2021-31 ii
CONTENTS
6.0 Ōtorohanga Rural Water Supply Scheme (including Wāipa RWS) ............................................. 39
6.1 Description ........................................................................................................................... 39 6.2 Condition .............................................................................................................................. 42 6.3 Performance ........................................................................................................................ 42 6.4 Risk Assessment ................................................................................................................... 43 6.5 Future Demand .................................................................................................................... 43 6.6 Ability to Accommodate Demand Changes ......................................................................... 44 6.7 Alternative Supply Options .................................................................................................. 45 6.8 Significant Programmed Works ........................................................................................... 45
7.0 Kāwhia Rural Water Supply Scheme ........................................................................................ 46
7.1 Description ........................................................................................................................... 46 7.2 Condition .............................................................................................................................. 49 7.3 Performance ........................................................................................................................ 49 7.4 Risk Assessment ................................................................................................................... 50 7.5 Future Demand .................................................................................................................... 50 7.6 Ability to Accommodate Demand Changes ......................................................................... 52 7.7 Ability to Comply with DWSNZ 2005 (Revised 2008) ........................................................... 52 7.8 Potential Demand Control Measures .................................................................................. 52 7.9 Significant Programmed Works ........................................................................................... 52
8.0 Tihiroa Rural Water Supply Scheme ........................................................................................ 53
8.1 Description ........................................................................................................................... 53 8.2 Condition .............................................................................................................................. 55 8.3 Performance ........................................................................................................................ 56 8.4 Risk Assessment ................................................................................................................... 56 8.5 Future Demand .................................................................................................................... 57 8.6 Ability to Accommodate Demand Changes ......................................................................... 57 8.7 Ability to Comply with DWSNZ 2005 (Revised 2008) ........................................................... 58 8.8 Alternative Supply Options .................................................................................................. 58 8.9 Significant Programmed Works ........................................................................................... 59
9.0 Arohena Rural Water Supply Scheme ...................................................................................... 60
9.1 Description ........................................................................................................................... 60 9.2 Condition .............................................................................................................................. 64 9.3 Performance ........................................................................................................................ 64 9.4 Risk Assessment ................................................................................................................... 65 9.5 Future Demand .................................................................................................................... 65 9.6 Ability to Accommodate Demand Changes ......................................................................... 67 9.7 Ability to Comply with DWSNZ 2005 (Revised 2008) ........................................................... 68 9.8 Alternative Supply Options .................................................................................................. 68 9.9 Significant Programmed Works ........................................................................................... 68

Ōtorohanga District Water Supply Asset Management Plan 2021-31 iii
CONTENTS
10.0 Ranginui Rural Water Supply Scheme ...................................................................................... 69
10.1 Description ........................................................................................................................... 69 10.2 Condition .............................................................................................................................. 69 10.3 Performance ........................................................................................................................ 71 10.4 Risk Assessment ................................................................................................................... 71 10.5 Future Demand .................................................................................................................... 71 10.6 Ability to Accommodate Demand Changes ......................................................................... 72
11.0 Asset Management Improvement Plan ................................................................................... 73
11.1 Definition of Actions Required for DWSNZ 2005 (revised 2018) Compliance ..................... 73 11.2 Continuing Emphasis on Collection of Work History Data .................................................. 73 11.3 Build Flow Model using Spatial Data on Pipes and Proposed Reservoirs ............................ 74
Appendix 1 ........................................................................................... Capital Works Programme
Ōtorohanga District Water Supply Asset Management Plan 2021-31 iv
TABLES AND FIGURES
TABLES Table 2.1: Three Key Problem Statements ............................................................................................. 5 Table 2.2: What Are We Doing and How? .............................................................................................. 6 Table 3.1: Criteria for Asset Management Planning ............................................................................. 12 Table.3.3.1: Management of Critical Risks ............................................................................................... 15 Table 3.3.2: Improvements to Barriers to Contamination Ōtorohanga Supply ....................................... 16 Table 3.3.3: Improvements to Barriers to Contamination Kāwhia Supply .............................................. 19 Table 4.1: Water Supply Technical Levels of Service ............................................................................ 27 Table 5.1: Estimated Usage of Water (as % volume) ............................................................................ 29 Table 5.2: DWSNZ Compliance Report 2019-20 ................................................................................... 32 Table 6.1: Technical Description of Ōtorohanga/Wāipa Rural Water Scheme .................................... 39 Table 7.1: Technical Description of Kāwhia Rural Water Scheme ........................................................ 47 Table 8.1: Technical Description of Tihiroa Rural Water Scheme ......................................................... 53 Table 9.1: Technical Description of Arohena Rural Water Scheme ...................................................... 60 Table 10.1 Technical Description of Ranginui Rural Water Scheme ...................................................... 69
FIGURES Figure 2.1 – Ōtorohanga District Water Supplies .......................................................................................... 3 Figure 2.2 – Three Yearly AMP Flowchart ..................................................................................................... 4 Figure 2.3 – Ōtorohanga District Location Map ............................................................................................ 7 Figure 2.4 – Population in Ōtorohanga District, 2006-18 Censuses.............................................................. 7 Figure 2.5 – Ōtorohanga Township – Dwelling Numbers ............................................................................. 8 Figure 2.6 – Kāwhia Township – Dwelling Numbers ..................................................................................... 9 Figure 2.7 – Slowest Growing Territorial Authority Areas (2013-2018) ........................................................ 9 Figure 2.8 – Map of Territorial Authority GDP Per Capita Five-year Growth .............................................. 10 Figure 3.1 – Service Request Processing for Water Services ...................................................................... 13 Figure 3.2 – Process Flow for Programming and Prioritising of Renewal ................................................... 21 Figure 3.3 – Process Flow for Valuations .................................................................................................... 23 Figure 5.1 – Various Ways Houses in these Rural Water Supply Areas Obtain their Water ....................... 34 Figure 6.1 – Ōtorohanga Water Treatment Plant ....................................................................................... 40 Figure 6.2 – Wāipa Water Supply Area ....................................................................................................... 41 Figure 6.3 – Ōtorohanga Water Annual Renewal Cost Trend ..................................................................... 42 Figure 6.4 – Mean Daily Water Usage (Plant Outflow) ............................................................................... 43 Figure 6.5 – Distribution between Ōtorohanga and Wāipa ........................................................................ 44 Figure 7.1 – Kāwhia Community Water Supply ........................................................................................... 46 Figure 7.2 – Kāwhia Water Treatment Plant ............................................................................................... 48 Figure 7.3 – Kāwhia Water Annual Renewal Cost Trend ............................................................................. 49 Figure 7.4 – Kāwhia Average Water Consumption Per Month ................................................................... 50 Figure 7.5 – Kāwhia Daily Water Use Christmas Peak ................................................................................. 51 Figure 7.6 – Kāwhia Reservoir Level ............................................................................................................ 51 Figure 8.1 – Tihiroa Water Treatment Plant ............................................................................................... 54 Figure 8.2 – Tihiroa Water Supply Area ...................................................................................................... 55 Figure 8.3 – Tihiroa Water Annual Renewal Cost Trend ............................................................................. 56 Figure 8.4 – Tihiroa Rural Water Supply ...................................................................................................... 57 Figure 9.1 – Arohena (Kahorekau) Water Supply Area ............................................................................... 61 Figure 9.2 – Arohena (Huirimu) Water Supply Area ................................................................................... 62 Figure 9.3 – Arohena (Taupaki) Water Supply Area .................................................................................... 63 Figure 9.4 – Arohena Water Annual Renewal Cost Trend........................................................................... 64

Ōtorohanga District Water Supply Asset Management Plan 2021-31 v
TABLES AND FIGURES
Figure 9.5 – Arohena Scheme Annual Consumption – All Supplies ............................................................ 65 Figure 9.6 – Kahorekau Supply Annual Consumption ................................................................................. 66 Figure 9.7 – Huirimu Supply Annual Consumption ..................................................................................... 66 Figure 9.8 – Taupaki Supply Annual Consumption ...................................................................................... 67 Figure 10.1 – Ranginui Water Supply Area .................................................................................................. 70 Figure 10.2 – Ranginui Water Annual Renewal Cost Trend ........................................................................ 71 Figure 10.3 – Ranginui Rural Water Scheme Annual Consumption ............................................................ 72

Ōtorohanga District Water Supply Asset Management Plan 2021-31 1
EXECUTIVE SUMMARY
1.0 Executive Summary
Ōtorohanga District Council’s water supply networks, currently serve the Ōtorohanga and Kāwhia urban communities and the defined rural supply areas of Wāipa, Tihiroa and Arohena. Council also administer a stock-water only rural scheme in the Ranginui area. This Water Supply Asset Management Plan (AMP) aligns with the 30-year Infrastructure Strategy, and is one of the supporting documents for the LTP, showing how Council proposes to:
Provide affordable, well-designed and maintained water infrastructure to enable economic growth for households, commerce and industry across Ōtorohanga.
Implement appropriate barriers as detailed in the approved Water Safety Plans against waterborne risks such as protozoa or E. coli to meet public health compliance requirements, through proactive upgrading of the rural and urban schemes.
Increase resilience against risks such as loss of supply, enable fire-fighting demand to be met with adding new hydrants where required for growth, and managing longer term climate change impacts on surface water takes, through building additional storage to provide at least 72 hours average daily demand, along with replacing asbestos cement water mains that have a high failure rate.
Significance of Water to Iwi/Māori
Council recognises the importance of wai (water) to iwi/Māori:
That water carries a mauri (life force).
That water has a wairua (spiritual significance).
That water supports mahinga kai (traditional food gathering).
That water tells the stories of tupuna (ancestors).
Council’s relationship with iwi in our rohe (district) is developing, and Council expects to engage far more with iwi over the course of this Long Term Plan, particularly in relation to anything involving water. Proactive upgrading of treatment plants, impact of Three Waters Reform and Regional Collaboration
Under the proposed Drinking Water reform, Council as a water supplier must demonstrate that:
The quality of the source water used is understood.
The treatment plants have appropriate barriers to bacterial and protozoal contamination installed, operated and continuously monitored.
Water for drinking must avoid breaching specified levels of chemical or cyanotoxin determinands known as (MAVs).
Measures are in place to prevent recontamination of water within a distribution system, such as backflow prevention and controls on accessing pipes and plants.
Council resolved to accelerate the upgrading of all water treatment plants to meet new performance standards being set by Parliament, and one of these plants, (Kahorekau scheme), will be completed as a pilot for rural schemes in partnership with the new national Water Regulator - Taumata Arowai. This is consistent with Council’s goals of optimising performance and reducing costs for residents, ratepayers and businesses. The potential for vesting the three waters assets into new proposed external multi-region delivery organisations, once these are established is expected to be 2-3 years away and will be considered as part of the 2024-24 LTP.
Ōtorohanga District Water Supply Asset Management Plan 2021-31 2
EXECUTIVE SUMMARY
Within the treatment plants, getting the water to a suitable clarity to enable effective protozoa and microbiological risk barriers is essential to drinking water safety. In the case of the two urban water supplies Ōtorohanga and Kāwhia, achieving compliance with the 2018 Drinking Water Standards is well underway and has been consistently achieved over the last six months through a combination of relatively modest treatment process upgrading and improved monitoring processes. Increased Chlorine contact times have been recommended by the Drinking Water assessor to enhance barriers against microbiological risks. However, none of the rural water supplies meet the requirements of the NZ Drinking Water Standards in respect of protozoa, and especially the 24-hour continuous monitoring. Staff are involved in a Rural and Small Supplies reference group focussed on issues facing such supplies in New Zealand following the review into the Havelock North crisis. Council has also linked up with the Waikato Local Authority Shared Services (WLASS), Regional Asset Technical Accord (RATA) and the Taumata Arowai Establishment Unit to align its approach to compliance. Collaboration also includes input into establishing a nationally consistent description of water assets. All the rural water treatment systems have fundamental deficiencies, and for these very extensive and expensive upgrading, (potentially complete replacement of existing water treatment plants), may be necessary to achieve compliance with the standards. Council is proposing to work in partnership with the new water regulator to agree on upgrades and funding of these plants.
Without central Government funding support, upgrading will incur significant debt and increasing operational costs that have to be met by relatively small numbers of customers connected to these rural supplies. The Big Five Issues for Water Supply Council has identified five issues that will have a significant impact on the way water supply is managed into the future. These are addressed in more detail throughout this document:
1. Climate Change – weather patterns, natural hazards and resilience.
2. Growth – the impact of a growing community.
3. Asset Data Capture – understanding what we have so we can make informed decisions.
4. Resourcing - to advance an ambitious capital works programme.
5. Water Reforms – government’s proposals to change the way water supplies are managed.
Ōtorohanga District Water Supply Asset Management Plan 2021-31 3
INTRODUCTION
2.0 Introduction
2.1 Key Directions of Council
Early engagement as part of the Long Term Plan (LTP), project (Ōtorohanga 2050), resulted in community feedback indicating that it was time for the Council to invest for the future, and move from an austerity focus to one of vibrancy. This will involve investing in community places and spaces, as well as lifting the performance of Council’s assets including three waters infrastructure. The district vision for the 2021–2031 LTP is:
Ōtorohanga - ‘where Kiwi can fly’; A Dynamic, Inclusive and Unique District
Council identified the following outcomes that will guide activities to promote the well-being of our community, and the function and performance of our assets and infrastructure:
Aspirational Connected Diverse Empowered Enduring Engaged Innovative Knowledgeable Liveable Passionate Progressive Prosperous Proud Resilient Responsible Supportive Sustainable Thriving United Vibrant Welcoming
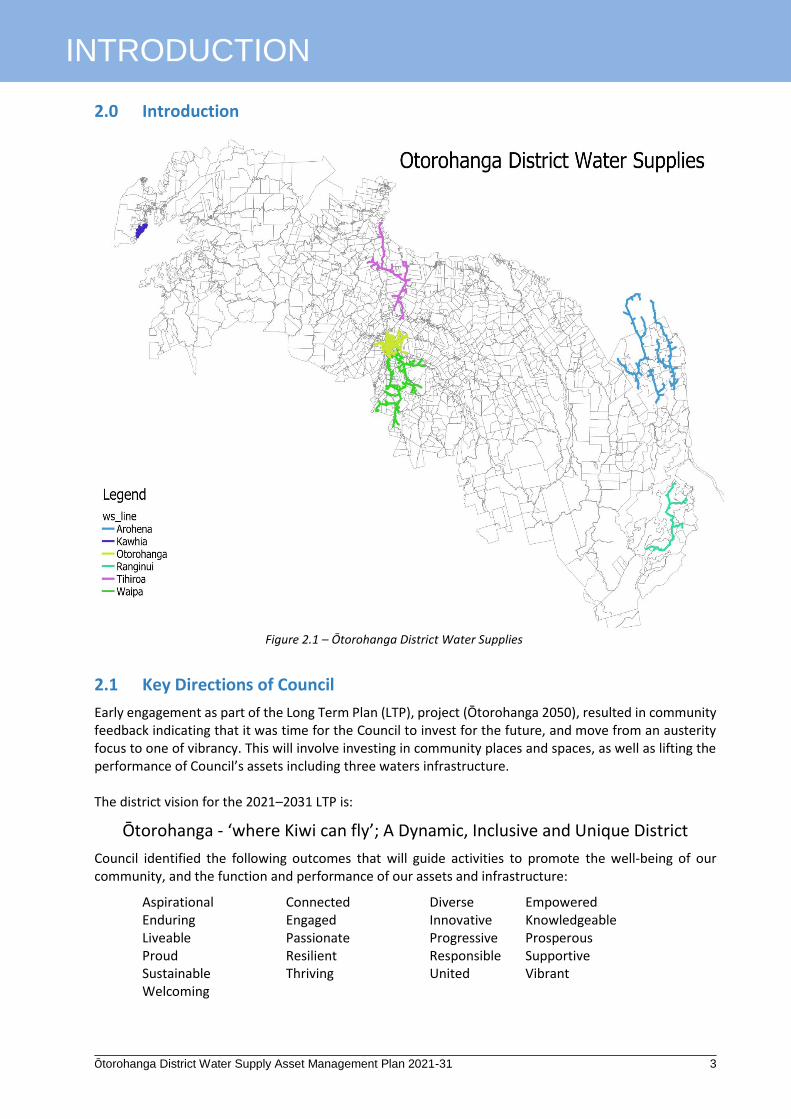
Figure 2.1 – Ōtorohanga District Water Supplies

Ōtorohanga District Water Supply Asset Management Plan 2021-31 4
INTRODUCTION
2.2 Plan Purpose
The purpose of this Asset Management Plan is to ensure that all of the assets (in this case drinking water supply) are operated and maintained so that they provide the required level of service for present and future customers in a sustainable and cost effective manner through:
Demonstrating sustainable operation of key strategic assets of the Ōtorohanga District, including funding requirements.
Ensuring compliance with legislation including the Local Government Act 2002, Health and Safety at Work Act, Health Act, Resource Management Act 1991 and Building Act 2004. Drinking Water Standards for New Zealand 2005 (Revised 2018)
Being consistent with key directions of Council and agreed levels of service. Using robust risk-assessment approach to identify and prioritise operational, maintenance,
renewal and capital development needs.
This plan substantiates budget forecasts put forward in the Ōtorohanga District Council LTP (2021-2031) and associated long term (30) year capital replacement forecasts for water supply. Ōtorohanga District Council will:
Use the Water Safety Plans on a day-to-day basis as a ‘working document’, and note amendments to this Asset Management Plan arising from these Water Safety Plans on an annual basis.
Conduct three-yearly rewrites of the Asset Management Plan in advance of the LTP annual amendments or updates will be undertaken if significant asset management changes occur.
2.3 Relationship with other Plans
In the diagram below are the linkages between Council’s high level planning documents as they relate to the Asset Management Plan:
LONG TERM PLAN
ASSET MANAGEMENT PLAN Includes a reconciliation of budgets for
planned activities
THREE-YEARLY AMP REVIEW
INPUTS Council Strategic
Plans Community
Outcomes Levels of Service Regional Plans Growth
Projections Legislative
Documents Asset Condition
Rating Asset Criticality Water Reform
Lead by Central Government
Customer Feedback and Complaints
ANNUAL PLAN
DISTRICT PLAN
Figure 2.2 – Three-Yearly AMP Flowchart
Ōtorohanga District Water Supply Asset Management Plan 2021-31 5
INTRODUCTION
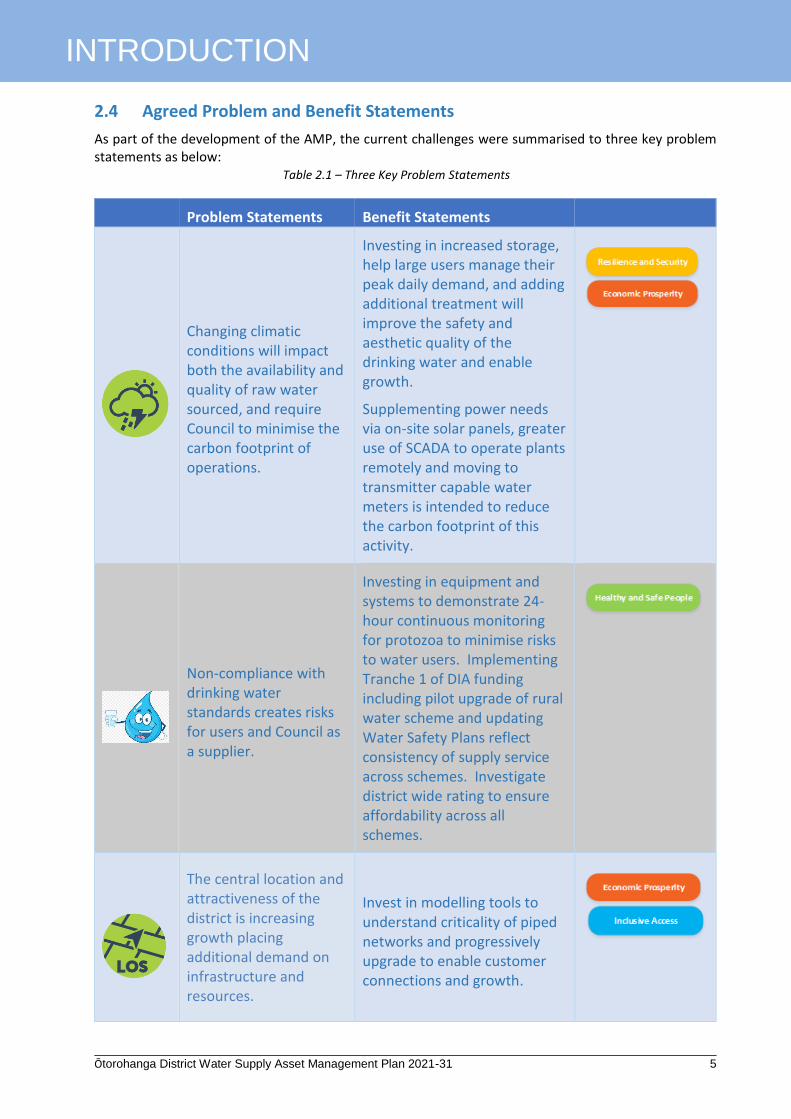
2.4 Agreed Problem and Benefit Statements
As part of the development of the AMP, the current challenges were summarised to three key problem statements as below:
Problem Statements Benefit Statements
Changing climatic conditions will impact both the availability and quality of raw water sourced, and require Council to minimise the carbon footprint of operations.
Investing in increased storage, help large users manage their peak daily demand, and adding additional treatment will improve the safety and aesthetic quality of the drinking water and enable growth.
Supplementing power needs via on-site solar panels, greater use of SCADA to operate plants remotely and moving to transmitter capable water meters is intended to reduce the carbon footprint of this activity.
Non-compliance with drinking water standards creates risks for users and Council as a supplier.
Investing in equipment and systems to demonstrate 24-hour continuous monitoring for protozoa to minimise risks to water users. Implementing Tranche 1 of DIA funding including pilot upgrade of rural water scheme and updating Water Safety Plans reflect consistency of supply service across schemes. Investigate district wide rating to ensure affordability across all schemes.
The central location and attractiveness of the district is increasing growth placing additional demand on infrastructure and resources.
Invest in modelling tools to understand criticality of piped networks and progressively upgrade to enable customer connections and growth.
Table 2.1 – Three Key Problem Statements

Ōtorohanga District Water Supply Asset Management Plan 2021-31 6
INTRODUCTION
What are we doing and how? Effects on $ Outcome
Improved storage and increased resilience to climate change
Te Raumauku Water Dam design and costing $75,000.
Tihiroa rural water scheme 120m3 storage $125,000.
Ōtorohanga 400m3 storage at Mountain View $250,000.
Investigation into bulk raw water storage for Ōtorohanga.
Compliance with Drinking Water Standards
Ōtorohanga/Wāipa Plant:
- Improving dosing / mixing of the coagulants prior to clarifier.
- Improving filtration through better sand filters and efficient underdrain / nozzles.
- Progressively add instruments that analyse raw and semi-treated water properties to improve our ability to stay in compliance during storm events, and investigate harvesting raw water.
- Further automation and upgraded Programmable Logic Controller (PLC) to minimize human intervention and secure a stable process.
Kahorekau Plant:
- Rural Water Scheme pilot to DWSNZ $750,000.
Tihiroa and Arohena Plant:
- Treatment plant upgrade design for DWSNZ $75,000.
Funded via Capital as combination of renewals and LOS.
Modelling of network
Regional Collaboration on Three Waters Reform $100,000 and specific modelling.
100% funded through Water Reform.
100% funded through Water Reform.
100% funded through Water Reform.
Table 2.2 – What we are doing and how?

Ōtorohanga District Water Supply Asset Management Plan 2021-31 7
INTRODUCTION
2.5 Underlying Planning Assumptions
2.5.1 – District Overview and Growth Projections
DISTRICT OVERVIEW
Ōtorohanga District Council is a territorial local authority in the Waikato region of New Zealand. It covers an area of 1976 square kilometres that extends from the shores of the Tasman Sea in the West to the Waikato River in the East. It has diverse topography, productive farmland, extensive native vegetation, ocean beaches and protected harbours. The principal township is Ōtorohanga, located centrally in the District, with a smaller urban settlement of Kāwhia located at the coast, which is a popular holiday destination.
POPULATION AND GROWTH
Based on the 2018 census, 10,104 live in the District, of which 3027 (30%) are in Ōtorohanga town. The 2018 Census tells us there are more than 4,300 homes in the District, which is around 230 more than in 2013. Home ownership rates in the District are 63.4%, which is only slightly lower than the New Zealand level of 64.6%. The cost of renting a house continues to be significantly lower in our District than the average for New Zealand. The average house value (2019) in the district was $280,850 (NZ $687,099). However, the growth rate in local house values has exceeded that of New Zealand since 2016/17. Data from the 2018 census for the Ōtorohanga District shows a healthy population increase between 2013 and 2018 of 963 people (+10.53%). During this period the national population has shown an overall population increase of 457 707 (+10.79%) which shows that Ōtorohanga is reflecting the national average. On-going private subdivision activity is expected to yield up to 160 new housing lots within the community by 2022, which would represent an increase in housing stock of over 10%. How quickly buyers convert the land into housing and then to occupancy could be 3 years under current house price growth, and if the borders are re-opened due to the covid-19 Pandemic. It is, also, anticipated that other subdivision activity may yield an additional 40 or so lots within the community by 2025 giving an additional 200 lots in total.
9.075 9.14110.104
0
2.5
5
7.5
10
12.5
2006 (count) 2013 (count) 2018 (count)
Tho
usa
nd
s (N
um
ber
)
Population in Ōtorohanga District, 2006-18 Censuses
Figure 2.4 – Population in Ōtorohanga District, 2006-18 Censuses
Figure 2.3 – Ōtorohanga District Location Map
Ōtorohanga District Water Supply Asset Management Plan 2021-31 8
INTRODUCTION
Three externally funded developments are expected to add to residential growth including:
1. Construction of the Waikeria Prison expansion to provide a new 500-bed unit, on track for completion in 2022. This facility is to the north of Ōtorohanga and the Districts comparably low land values, (against neighbouring Wāipa District), would have appeal to the new permanent workforce.
2. Happy Valley Nutrition Dairy Factory located just outside Ōtorohanga urban boundary with a
proposed opening in July 2022.
3. Nova Energy proposed Power Plant on Kāwhia Road with the required Resource Consents issued by Commissioners for both District and Regional Council. There is a possibility that the power station may be supplied from an upgraded Tihiroa Rural Water Treatment Plant, however, discussions are at the early stages and have not been directly factored into this plan.
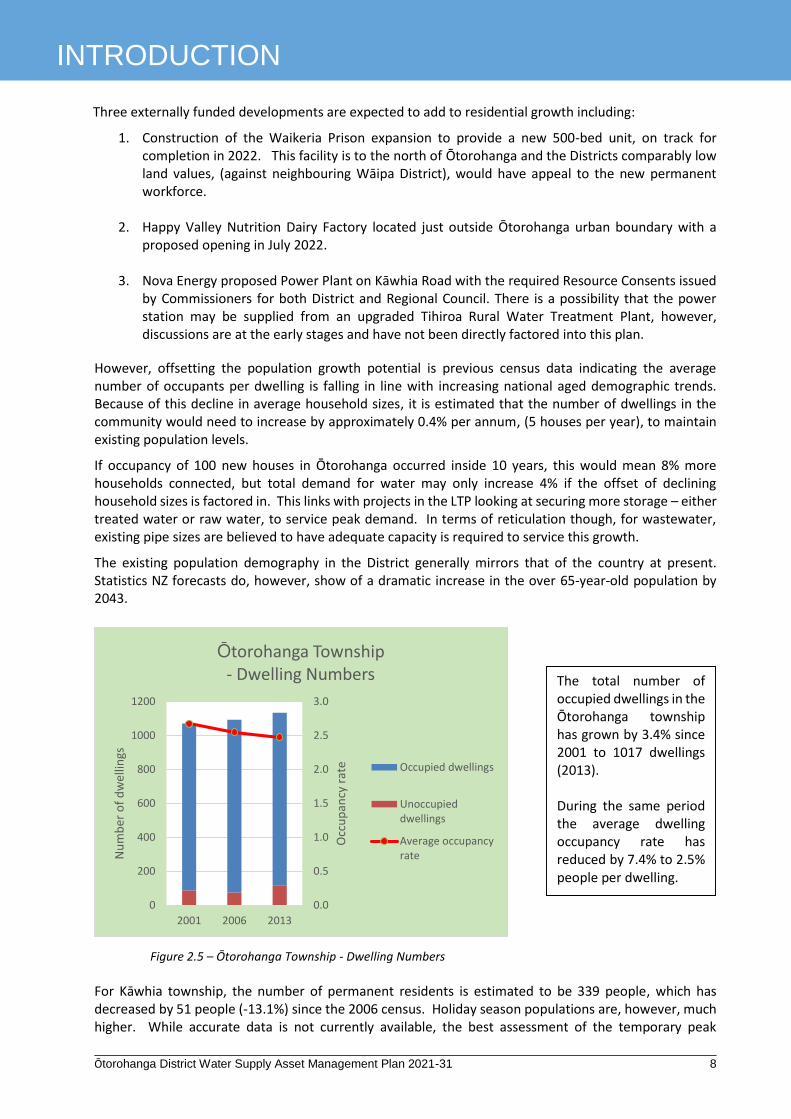
However, offsetting the population growth potential is previous census data indicating the average number of occupants per dwelling is falling in line with increasing national aged demographic trends. Because of this decline in average household sizes, it is estimated that the number of dwellings in the community would need to increase by approximately 0.4% per annum, (5 houses per year), to maintain existing population levels.
If occupancy of 100 new houses in Ōtorohanga occurred inside 10 years, this would mean 8% more households connected, but total demand for water may only increase 4% if the offset of declining household sizes is factored in. This links with projects in the LTP looking at securing more storage – either treated water or raw water, to service peak demand. In terms of reticulation though, for wastewater, existing pipe sizes are believed to have adequate capacity is required to service this growth.
The existing population demography in the District generally mirrors that of the country at present. Statistics NZ forecasts do, however, show of a dramatic increase in the over 65-year-old population by 2043.
Figure 2.5 – Ōtorohanga Township - Dwelling Numbers
For Kāwhia township, the number of permanent residents is estimated to be 339 people, which has decreased by 51 people (-13.1%) since the 2006 census. Holiday season populations are, however, much higher. While accurate data is not currently available, the best assessment of the temporary peak
The total number of occupied dwellings in the Ōtorohanga township has grown by 3.4% since 2001 to 1017 dwellings (2013). During the same period the average dwelling occupancy rate has reduced by 7.4% to 2.5% people per dwelling.
0.0
0.5
1.0
1.5
2.0
2.5
3.0
0
200
400
600
800
1000
1200
2001 2006 2013
Occ
up
ancy
rat
e
Nu
mb
er o
f d
wel
lings
Ōtorohanga Township - Dwelling Numbers
Occupied dwellings
Unoccupieddwellings
Average occupancyrate
Ōtorohanga District Water Supply Asset Management Plan 2021-31 9
INTRODUCTION
population is in the order of 3,000 residents for the two to three weeks of Christmas, and often 2,000 on other holiday periods. It is these peak figures, (which are themselves limited by the accommodation capacity of the town), that effectively determine the services capacity requirements of the community.
ECONOMY
Agriculture is the economic backbone of the District, with 34.5% of the District’s employed population listing their occupation as relating to Agriculture, Forestry and Fishing. It is still believed that upwards of 75% of all economic activity in the District is closely associated with the agricultural sector. The prevailing economic climate has been difficult for some of the smaller Ōtorohanga businesses, and there have been some changes to businesses in the retail and service sectors, though it is suspected that these changes have occurred without any substantial net loss or gain in total employee numbers.
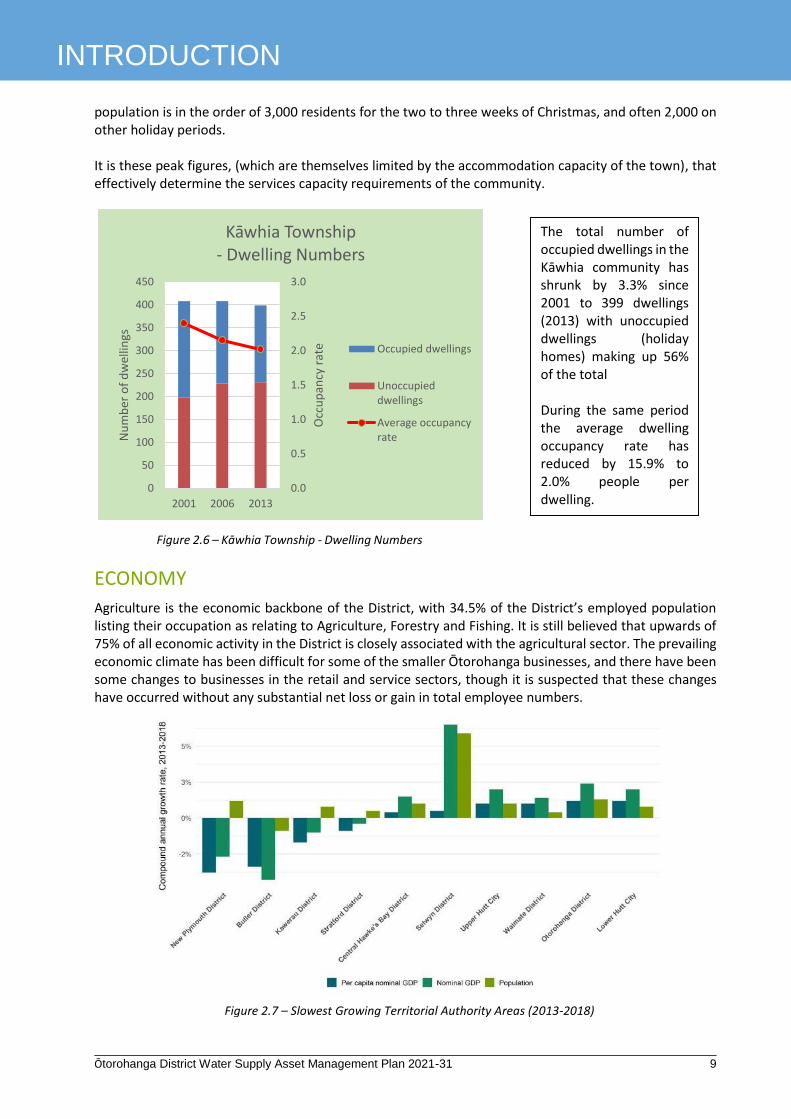
The total number of occupied dwellings in the Kāwhia community has shrunk by 3.3% since 2001 to 399 dwellings (2013) with unoccupied dwellings (holiday homes) making up 56% of the total During the same period the average dwelling occupancy rate has reduced by 15.9% to 2.0% people per dwelling.
Figure 2.6 – Kāwhia Township - Dwelling Numbers
Figure 2.7 – Slowest Growing Territorial Authority Areas (2013-2018)
0.0
0.5
1.0
1.5
2.0
2.5
3.0
0
50
100
150
200
250
300
350
400
450
2001 2006 2013
Occ
up
ancy
rat
e
Nu
mb
er o
f d
wel
lings
Kāwhia Township- Dwelling Numbers
Occupied dwellings
Unoccupieddwellings
Average occupancyrate
Ōtorohanga District Water Supply Asset Management Plan 2021-31 10
INTRODUCTION
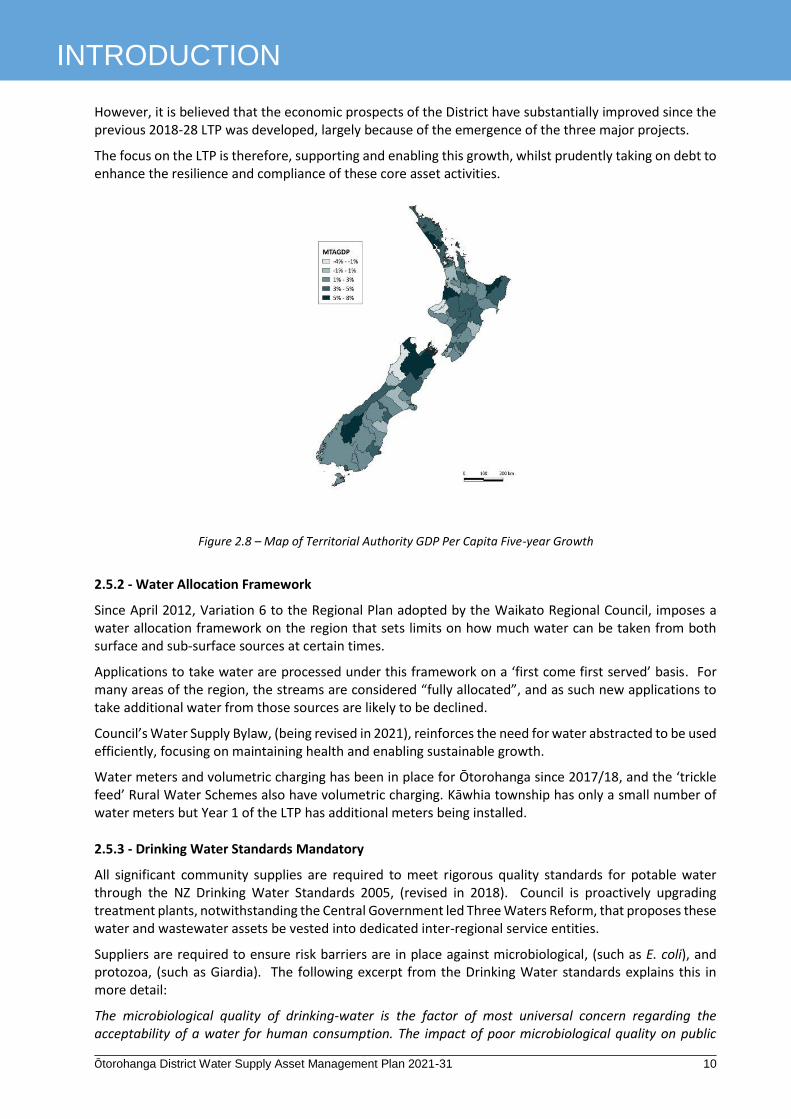
However, it is believed that the economic prospects of the District have substantially improved since the previous 2018-28 LTP was developed, largely because of the emergence of the three major projects.
The focus on the LTP is therefore, supporting and enabling this growth, whilst prudently taking on debt to enhance the resilience and compliance of these core asset activities.
2.5.2 - Water Allocation Framework
Since April 2012, Variation 6 to the Regional Plan adopted by the Waikato Regional Council, imposes a water allocation framework on the region that sets limits on how much water can be taken from both surface and sub-surface sources at certain times.
Applications to take water are processed under this framework on a ‘first come first served’ basis. For many areas of the region, the streams are considered “fully allocated”, and as such new applications to take additional water from those sources are likely to be declined.
Council’s Water Supply Bylaw, (being revised in 2021), reinforces the need for water abstracted to be used efficiently, focusing on maintaining health and enabling sustainable growth.
Water meters and volumetric charging has been in place for Ōtorohanga since 2017/18, and the ‘trickle feed’ Rural Water Schemes also have volumetric charging. Kāwhia township has only a small number of water meters but Year 1 of the LTP has additional meters being installed.
2.5.3 - Drinking Water Standards Mandatory
All significant community supplies are required to meet rigorous quality standards for potable water through the NZ Drinking Water Standards 2005, (revised in 2018). Council is proactively upgrading treatment plants, notwithstanding the Central Government led Three Waters Reform, that proposes these water and wastewater assets be vested into dedicated inter-regional service entities.
Suppliers are required to ensure risk barriers are in place against microbiological, (such as E. coli), and protozoa, (such as Giardia). The following excerpt from the Drinking Water standards explains this in more detail:
The microbiological quality of drinking-water is the factor of most universal concern regarding the acceptability of a water for human consumption. The impact of poor microbiological quality on public
Figure 2.8 – Map of Territorial Authority GDP Per Capita Five-year Growth
Ōtorohanga District Water Supply Asset Management Plan 2021-31 11
INTRODUCTION
health usually becomes evident to consumers much more rapidly than do the consequences of elevated levels of chemical contaminants of health significance. Consuming a glass of drinking-water containing disease-causing micro-organisms may affect one’s health within a short time, whereas the chemical MAVs are based on the possible effects of an individual drinking two litres a day for 70 years. Good microbiological quality of water at the consumer’s tap is most reliably achieved by ensuring that the water entering the distribution system is microbiologically safe, and that there is a residual disinfectant in the distribution system to minimise the impact of any regrowth or contamination that enters the distribution system.
Council has received advice as part of its annual Drinking Water review that increased contact time for the Chlorine used as a residual disinfectant is recommended. Although testing of water from network shows compliance with the required levels of ‘Free Available Chlorine’ known as FAC, the current variability in turbidity of the raw water means there is a risk of the FAC being consumed rapidly past the treatment plant. Council is improving clarifiers and filters to reduce this variability. 2.5.4 - Climate Change
Of New Zealand’s 10 most significant climate change risks, based on the National Climate Change Risk Assessment, potable water supplies (availability and quality), due to changes in rainfall, temperature, drought, extreme weather events and ongoing sea-level rise, scored as extreme. A similar score of extreme was given to risks to buildings due to extreme weather events, drought, increased fire weather and ongoing sea-level rise.
Strategies for mitigation will include:
Greater use of Business Intelligence using data captured from 24-hour plant monitoring to optimise pump run-times so they are only using energy when they need to, or mainly off-peak reducing energy consumption.
Shifting some water meters to ‘internet of things’ devices that provide large users with instantaneous usage information to help them proactively manage their demand wastage.
More use of renewable energy sources such as solar panels on treatment plant roofs to power non-critical assets and reduce total carbon footprint of operations.
Increasing storage to a minimum of 72 hours, (mean daily average demand), across the urban supplies. This may include adding high quality raw water storage beside the treatment plant/s that can be used to supplement the main supply when the rivers are turbid or peak demand exceeds what we can legally abstract and treated water reservoirs are falling below 50% full.
Creation of ‘source protection plans’ in line with proposed Water Services Bill.

Ōtorohanga District Water Supply Asset Management Plan 2021-31 12
ASSET MANAGEMENT PRACTICES
3.0 Asset Management Practices
3.1 Asset Management Criteria
The six most important criteria for asset management planning, as identified in an NZIER study, are listed below along with Ōtorohanga District Councils current self-assessment:
3.2 Data Provision Process and Systems
Asset information is captured and stored in the AssetFinda software programme. AssetFinda is an advanced Asset Management System that utilises three key interfaces: Web, GIS and mobile devices e.g. iPad’s and smart phones, to help you improve our asset management practices. AssetFinda is fully compliant with National Asset Management Standards (NAMS) and national asset accounting standards.
Objective Information Summary Self-Evaluation
1. Obtain financial information that accurately indicates the current investment in the potable water supply.
Financial information based on accurate records and independent review of valuations.
High degree of confidence. ‘Highly Reliable’.
2. Obtain data that indicates the age, condition and performance of the potable water infrastructure services.
Age and performance records are good; information on the condition of the infrastructure is based on historical data and scientific research rather than in situ condition assessments.
Fair degree of confidence. ‘Less Reliable’.
3. Obtain information on the setting, delivering and measuring levels of service and compliance for potable water infrastructure services.
Levels of service and compliance are stringently monitored by the Waikato District Health Board and Waikato Regional Council.
High degree of confidence. ‘Highly Reliable’.
4. Obtain information on processes that forecast future demand for potable water infrastructure services.
Population forecasts suggest limited population growth in the district hence future water demand is based on current usage figures with any growth offset against savings in water usage and reducing unaccounted for water.
High degree of confidence. ‘Highly Reliable’.
5. Identify the governance model adopted to oversee the delivery for potable water infrastructure services (including delegated authority).
Strong governance model is in place via Community Boards and Council.
High degree of confidence. ‘Highly Reliable’.
6. Identify the service delivery mechanisms being used in the potable water infrastructure services.
Established water schemes with delivery methods and infrastructure clearly defined.
High degree of confidence. ‘Highly Reliable’.
Table 3.1: Criteria for Asset Management Planning

Ōtorohanga District Water Supply Asset Management Plan 2021-31 13
ASSET MANAGEMENT PRACTICES
Ōtorohanga District Council has also invested in a dedicated staff member and provided the training required to fully utilise AssetFinda. The flow chart below shows the process used to check and capture information related to service requests for non-routine maintenance.
Urgent SR to be notified immediately to Water Services Engineer and Working Foreman by phone.
SR allocated to: - Water Services Engineer (service fault or task), or - Services Manager (development request,
compliance, high risk incident).
- Water Services Engineer agrees timeframe / resourcing with water team / foreman.
- Services Manager takes lead on any high risk complaints / incidents, liaise with external agencies, stakeholders, prepare any media release / public notifications and external reporting.
- Repairs and maintenance SR - Water team provide information on the completed SR, ensuring As-Builts provided.
- Minor development SR - Water Services Team provide information on the completed SR, to ensuring As-Builts provided and report to SM as complete in case any follow up needed.
- If work allocated to external approved contractor – they provide information to enable completion of the SR, ensure As-Builts provided, with report to SM as complete in case any follow up needed.
Service Manager (SM) to plan and programme any Development work, liaise with Building Control and developers on consents which will affect infrastructure. Make sure District Plan and WRC Resource Consents are complied with, determine if work can be done in-house or by contractor.
SM to monitor work and collect As-Builts and update i n t e r n a l / e x t e r n a l stakeholders of progress and complete any invoicing. C o m p l e t e d w o r k S R forwarded for AssetFinda, As -Bui l t s and GIS to be updated.
Provided complete
information
YES A
START
Service request (SR) created following notification of fault, proactive planning of routine task, level of service question, compliance or development request
Figure 3.1 - Service Request Processing for Water Services

Ōtorohanga District Water Supply Asset Management Plan 2021-31 14
ASSET MANAGEMENT PRACTICES
Figure 3.1 – Service Request Processing for Water Services (continued)
A
YES
NO
END
Technical Support Officer receives completed SR from Services Manager or Water Services Engineer to sign off in the system, update water
accounts if applicable, process documents, and
contact customer if requested.
Technical Support Officer to check As-Builts and
evaluate if all information needed is available.
As-Builts provided
need more information
Process As-Builts and update QGIS and AMS.
Contact Water Services Engineer and ask to redraw
and/or provide the necessary information

Ōtorohanga District Water Supply Asset Management Plan 2021-31 15
ASSET MANAGEMENT PRACTICES
3.3 Definition and Management of Critical Risks
3.3.1. - Critical Risks
Risks that would have a significant impact for the water supply, based on ability to meet published levels or service, and detrimental effect on users include:
Event Controls in place or proposed
Breach of Drinking Water Standards leading to contamination of either E. coli or Protozoa.
Continuous monitoring of water quality through plant, interventions in place for loss of protozoa controls or Chlorine effectiveness. External sampling carried out, results monitored by District Health Board.
Failure of raw water intake or supply line. Adding raw and treated water reservoirs to achieve a minimum 72 hours’ storage.
Failure of critical bulk water main from reservoir. Assess feasibility of installing automated ‘high flow’ earthquake valves along with flexible connection to reservoir. Consider pressure reducing valves in Kāwhia to address risk of water losses in mains and laterals.
Backflow failure into reticulation, or leak on high use property.
Move commercial and high users progressively to ‘Internet of Things’ electronic meters to enable continuous reporting and monitoring for user and Council, including any abnormal flows.
Poor quality raw water leading to inability to produce suitable quantities of compliant treated water.
Creation of ‘source protection plans’ under new Water Services Bill. Physical controls may include adding extra raw water storage, installing additional raw water quality analysers to reduce risk of contaminated water, (such as high E. coli count from upstream farm effluent system failure), entering treatment plant and add additional clarifier capacity to reduce variability in turbidity.
Loss of treatment plant operation due to natural hazard such as earthquake or significant power outage.
Increase treated water storage, ensure plants have 24 hour automated standby generator capacity especially for microbiological and protozoa risk barriers, that is tested annually.
Table 3.3.1.: Management of Critical Risks
Ōtorohanga District Water Supply Asset Management Plan 2021-31 16
ASSET MANAGEMENT PRACTICES
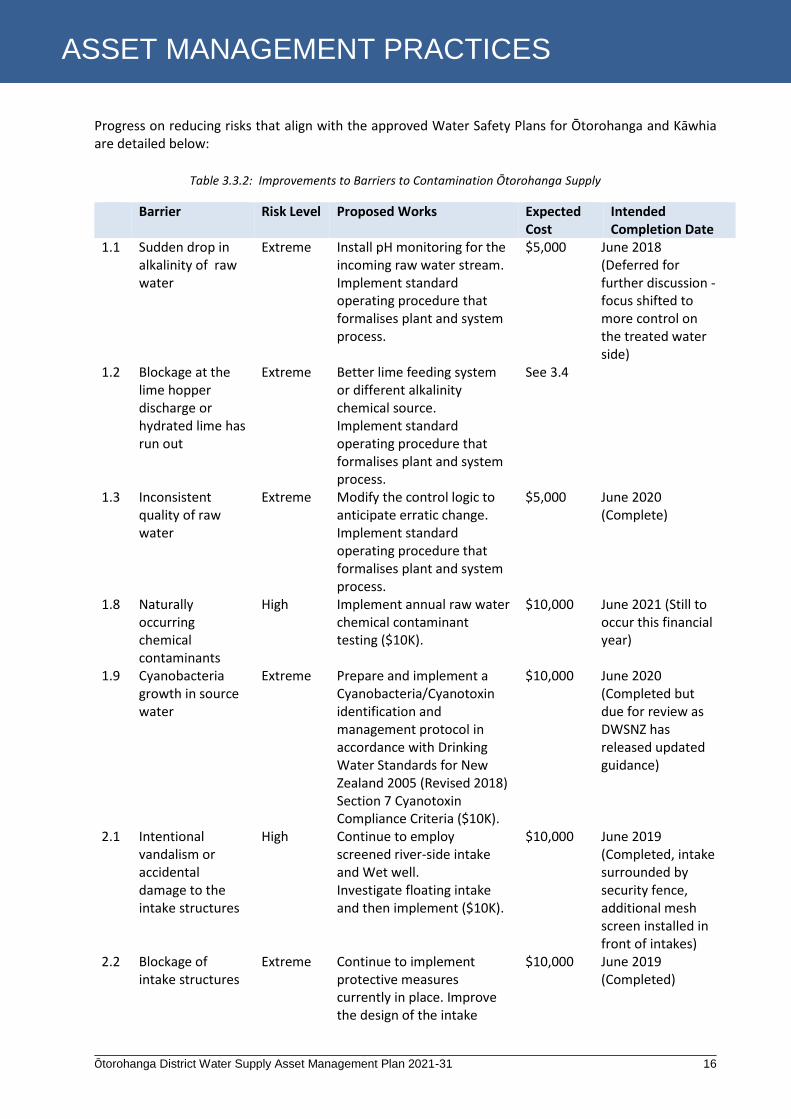
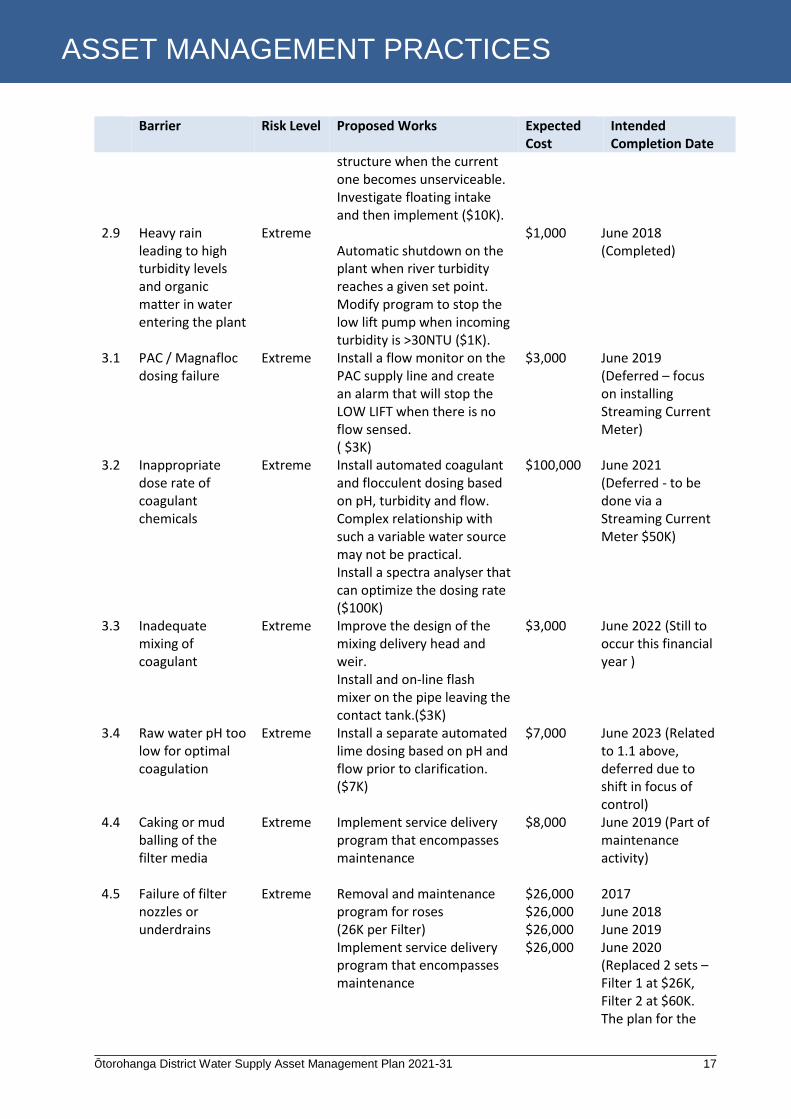
Progress on reducing risks that align with the approved Water Safety Plans for Ōtorohanga and Kāwhia are detailed below:
Barrier Risk Level Proposed Works Expected Cost
Intended Completion Date
1.1 Sudden drop in alkalinity of raw water
Extreme Install pH monitoring for the incoming raw water stream. Implement standard operating procedure that formalises plant and system process.
$5,000 June 2018 (Deferred for further discussion - focus shifted to more control on the treated water side)
1.2 Blockage at the lime hopper discharge or hydrated lime has run out
Extreme Better lime feeding system or different alkalinity chemical source. Implement standard operating procedure that formalises plant and system process.
See 3.4
1.3 Inconsistent quality of raw water
Extreme Modify the control logic to anticipate erratic change. Implement standard operating procedure that formalises plant and system process.
$5,000 June 2020 (Complete)
1.8 Naturally occurring chemical contaminants
High Implement annual raw water chemical contaminant testing ($10K).
$10,000 June 2021 (Still to occur this financial year)
1.9 Cyanobacteria growth in source water
Extreme Prepare and implement a Cyanobacteria/Cyanotoxin identification and management protocol in accordance with Drinking Water Standards for New Zealand 2005 (Revised 2018) Section 7 Cyanotoxin Compliance Criteria ($10K).
$10,000 June 2020 (Completed but due for review as DWSNZ has released updated guidance)
2.1 Intentional vandalism or accidental damage to the intake structures
High Continue to employ screened river-side intake and Wet well. Investigate floating intake and then implement ($10K).
$10,000 June 2019 (Completed, intake surrounded by security fence, additional mesh screen installed in front of intakes)
2.2 Blockage of intake structures
Extreme Continue to implement protective measures currently in place. Improve the design of the intake
$10,000 June 2019 (Completed)
Table 3.3.2: Improvements to Barriers to Contamination Ōtorohanga Supply
Ōtorohanga District Water Supply Asset Management Plan 2021-31 17
ASSET MANAGEMENT PRACTICES
Barrier Risk Level Proposed Works Expected Cost
Intended Completion Date
structure when the current one becomes unserviceable. Investigate floating intake and then implement ($10K).
2.9 Heavy rain leading to high turbidity levels and organic matter in water entering the plant
Extreme Automatic shutdown on the plant when river turbidity reaches a given set point. Modify program to stop the low lift pump when incoming turbidity is >30NTU ($1K).
$1,000 June 2018 (Completed)
3.1 PAC / Magnafloc dosing failure
Extreme Install a flow monitor on the PAC supply line and create an alarm that will stop the LOW LIFT when there is no flow sensed. ( $3K)
$3,000 June 2019 (Deferred – focus on installing Streaming Current Meter)
3.2 Inappropriate dose rate of coagulant chemicals
Extreme Install automated coagulant and flocculent dosing based on pH, turbidity and flow. Complex relationship with such a variable water source may not be practical. Install a spectra analyser that can optimize the dosing rate ($100K)
$100,000 June 2021 (Deferred - to be done via a Streaming Current Meter $50K)
3.3 Inadequate mixing of coagulant
Extreme Improve the design of the mixing delivery head and weir. Install and on-line flash mixer on the pipe leaving the contact tank.($3K)
$3,000 June 2022 (Still to occur this financial year )
3.4 Raw water pH too low for optimal coagulation
Extreme Install a separate automated lime dosing based on pH and flow prior to clarification. ($7K)
$7,000 June 2023 (Related to 1.1 above, deferred due to shift in focus of control)
4.4 Caking or mud balling of the filter media
Extreme Implement service delivery program that encompasses maintenance
$8,000 June 2019 (Part of maintenance activity)
4.5 Failure of filter nozzles or underdrains
Extreme Removal and maintenance program for roses (26K per Filter) Implement service delivery program that encompasses maintenance
$26,000 $26,000 $26,000 $26,000
2017 June 2018 June 2019 June 2020 (Replaced 2 sets – Filter 1 at $26K, Filter 2 at $60K. The plan for the

Ōtorohanga District Water Supply Asset Management Plan 2021-31 18
ASSET MANAGEMENT PRACTICES
Barrier Risk Level Proposed Works Expected Cost
Intended Completion Date
next two is to trial new technology which is estimated at $80K each)
4.6 High suspended solid loads or floc from clarifier carryover and sudden flow rate changes during peak demand periods
Extreme Investigate the refurbishment of the clarifier to help prevent floc carryover to the filters. (Refer recommendations made by MWH) Install a sludge level sensor to discharge sludge if needed (15K)
$15,000 June 2021 (Completed)
4.7 Failure of filter control valves
Extreme Install automated filter backwashing and replace manual valves with automated actuators. (50K per Filter)
$50,000 $50,000 $50,000 $50,000
June 2022 June 2023 June 2024 June 2025 (60% of the automation has been done at $90K and the rest will be completed this financial year at $45K estimated cost)
4.8 Leakage from the filter backwash outlet pipe which runs through the clear wells
Extreme Install new piping and valves from the filter outlet to the clear-well. ($22K per Filter)
$88,000 June 2026 (Completed)
5.3 Manual set point incorrect
Extreme Currently, the flow controller is under sized and need to be changed to allow higher flow rate ($6K)
$6,000 June 2018 (Completed)
5.4 Chlorine demand exceeds chlorine dose due to high raw water turbidity
Extreme Install flow proportional chlorine dosing Currently, the flow controller is under sized and need to be changed to allow higher flow rate ($6K)
$6,000 June 2018 (Completed)
8.4 Backflow from consumer connections
Extreme
Prepare and implement a council water supply backflow prevention policy which includes preparation of a register of all backflow protection devices and a register of annual testing of all devices
$10,000 June 2019 (Not completed - new requirements for backflow prevention and auditing within proposed Water Services Bill that
Ōtorohanga District Water Supply Asset Management Plan 2021-31 19
ASSET MANAGEMENT PRACTICES
Barrier Risk Level Proposed Works Expected Cost
Intended Completion Date
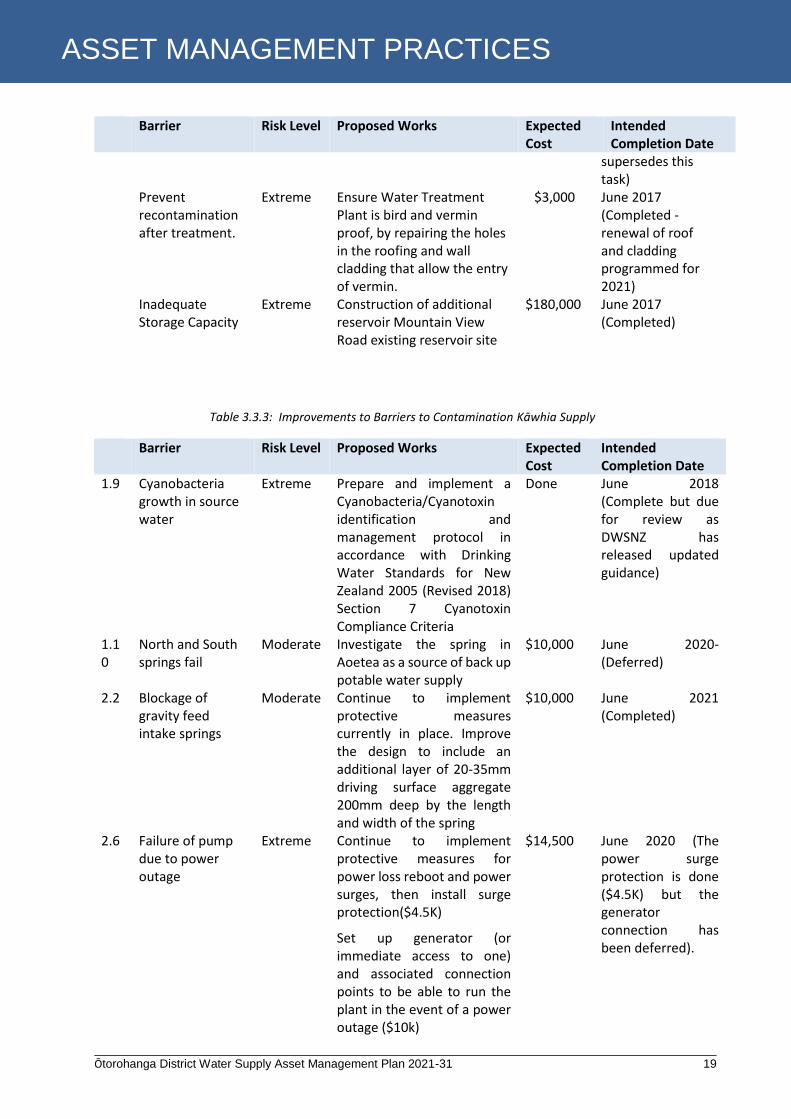
supersedes this task)
Prevent recontamination after treatment.
Extreme Ensure Water Treatment Plant is bird and vermin proof, by repairing the holes in the roofing and wall cladding that allow the entry of vermin.
$3,000 June 2017 (Completed - renewal of roof and cladding programmed for 2021)
Inadequate Storage Capacity
Extreme Construction of additional reservoir Mountain View Road existing reservoir site
$180,000 June 2017 (Completed)
Barrier Risk Level Proposed Works Expected Cost
Intended Completion Date
1.9 Cyanobacteria growth in source water
Extreme Prepare and implement a Cyanobacteria/Cyanotoxin identification and management protocol in accordance with Drinking Water Standards for New Zealand 2005 (Revised 2018) Section 7 Cyanotoxin Compliance Criteria
Done June 2018 (Complete but due for review as DWSNZ has released updated guidance)
1.10
North and South springs fail
Moderate Investigate the spring in Aoetea as a source of back up potable water supply
$10,000 June 2020- (Deferred)
2.2 Blockage of gravity feed intake springs
Moderate Continue to implement protective measures currently in place. Improve the design to include an additional layer of 20-35mm driving surface aggregate 200mm deep by the length and width of the spring
$10,000 June 2021 (Completed)
2.6 Failure of pump due to power outage
Extreme Continue to implement protective measures for power loss reboot and power surges, then install surge protection($4.5K)
Set up generator (or immediate access to one) and associated connection points to be able to run the plant in the event of a power outage ($10k)
$14,500 June 2020 (The power surge protection is done ($4.5K) but the generator connection has been deferred).
Table 3.3.3: Improvements to Barriers to Contamination Kāwhia Supply
Ōtorohanga District Water Supply Asset Management Plan 2021-31 20
ASSET MANAGEMENT PRACTICES
Barrier Risk Level Proposed Works Expected Cost
Intended Completion Date
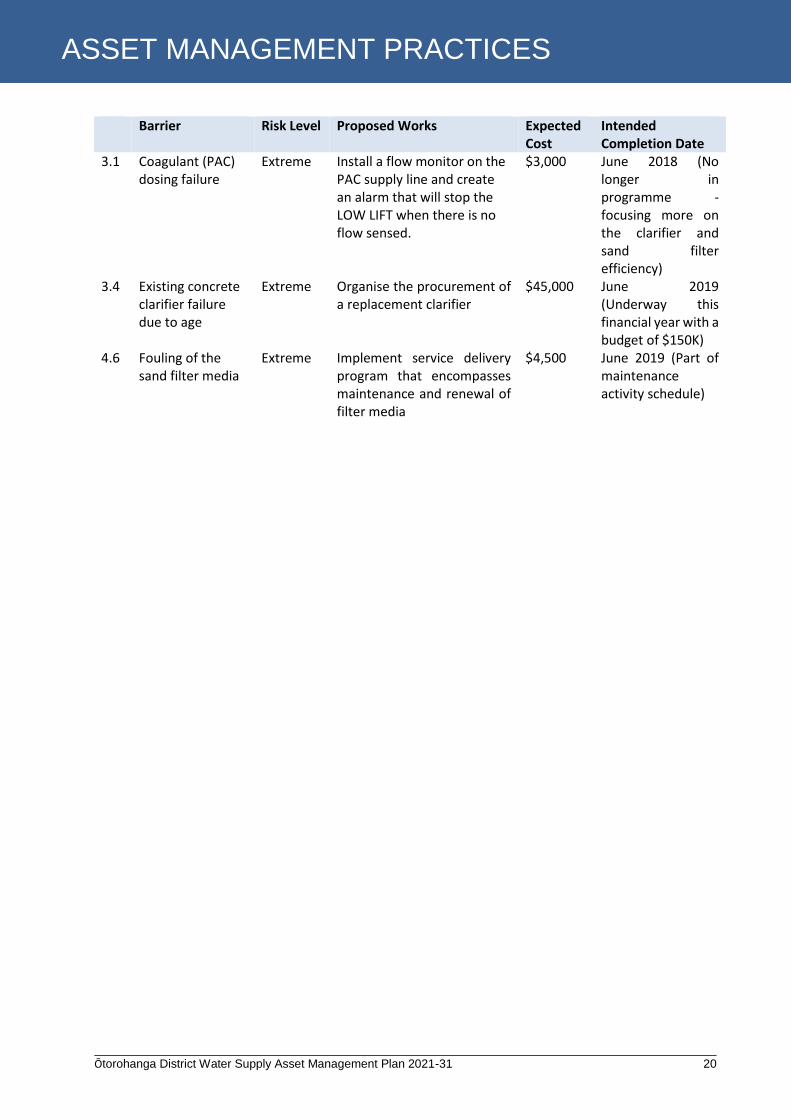
3.1 Coagulant (PAC) dosing failure
Extreme Install a flow monitor on the PAC supply line and create an alarm that will stop the LOW LIFT when there is no flow sensed.
$3,000 June 2018 (No longer in programme - focusing more on the clarifier and sand filter efficiency)
3.4 Existing concrete clarifier failure due to age
Extreme Organise the procurement of a replacement clarifier
$45,000 June 2019 (Underway this financial year with a budget of $150K)
4.6 Fouling of the sand filter media
Extreme Implement service delivery program that encompasses maintenance and renewal of filter media
$4,500 June 2019 (Part of maintenance activity schedule)

Ōtorohanga District Water Supply Asset Management Plan 2021-31 21
ASSET MANAGEMENT PRACTICES
3.4 Programme / Project Prioritisation of Renewals
Council’s process to programme and prioritise renewals is as set out below:
START
Information with AssetFinda checked and verified
Data sorted by scheme
Process then repeated for each scheme
Assets sorted based on remaining life
Site inspection and condition assessment completed
Remaining life re-assessed and updated
A
Renewals list printed for next 10 years
Condition assessment captured
Figure 3.2 - Process Flow for Programming and Prioritising of Renewals

Ōtorohanga District Water Supply Asset Management Plan 2021-31 22
ASSET MANAGEMENT PRACTICES
A
Risk and Criticality assessment completed
Renewal list programmed to incorporate risk and
criticality
Final renewal list completed
Renewal budgets completed using
replacement values in AssetFinda
END
Figure 3.2 - Process Flow for Programming and Prioritising of Renewals (continued)

Ōtorohanga District Water Supply Asset Management Plan 2021-31 23
ASSET MANAGEMENT PRACTICES
3.5 Valuation Practices and Process
Valuations have been completed in accordance with the following standards:
New Zealand International Accounting Standard No 16 (NZIAS 16).
New Zealand Infrastructure Valuation and Depreciation Guidelines, issued by the National Asset Management Steering Group (NAMS) of Ingenium.
Process used for the valuations is as follows:
Figure 3.3 - Process Flow for Valuations
START
Asset scheduled from AssetFinda printed and
reviewed
Each asset viewed and checked by Valuer and
Services Manager
Valuer then reviews current replacement value based on
data from other councils, contract rates and market
research
AssetFinda database updated
END
Replacement values revised/confirmed
Total asset values depreciation calculated
Ōtorohanga District Water Supply Asset Management Plan 2021-31 24
ASSET MANAGEMENT PRACTICES
The most recent asset valuations have made use of extensive information gathered by the Waikato Local Authority Share Services (WLASS) on the expected lives and unit costs being assumed by the particular local authorities for specific types of reticulation assets.
The parameters that Council has adopted in its valuations of these assets are very much in line with the values typically adopted by other Councils and this benchmarking has provided good reassurance that the valuations conducted of Council’s water supply assets are reliable.
3.6 Financial Forecasts
Financial forecasts of expenditures and revenues related to water supply activities are developed by Council staff within the NCS MagiQ financial management system.
Inputs to the forecasting process are provided by appropriately skilled Council staff or, where considered necessary, by appropriate external specialists.
The developed forecasts are scrutinised by both senior Council staff, Council’s elected members and Council’s auditors.
3.7 Performance Measures
Council uses the mandatory performance measures in the Local Government Act to report annually to the community on the performance of water supplies.
Key performance measures can be split into three categories:
Financial
Health
Environmental
Financial measures are initially assessed by the effect that expenditure have on rates and metered water charges to ensure budgeted expenditure is acceptable and then by measuring actual costs against budgeted costs. This is closely monitored internally on a monthly basis and by the Council’s elected members on a quarterly basis. Health impacts are annually audited by Waikato District Health Board Drinking Water Assessor. Their 2019-20 report commended staff for getting compliance on Ōtorohanga and Kāwhia supplies, but signalled ongoing non-compliance with protozoa monitoring across schemes needed more work. Environmental performance is assessed annually by Waikato Regional Council staff, relating to consented abstraction. Increasing levels of usage by the Rural Water Schemes are resulting in ‘letters of direction’ to ensure daily limits are complied with. Greater compliance would require the Rural Water Committee’s to ensure they actively monitor their demands and ensure users have adequate storage on-site to avoid ‘emergencies’ to cater for stock drinking needs. There are fully functional working relationships between Council staff and all of the above parties.
3.8 Collaboration with other Councils and Taumata Arowai
Ōtorohanga District Council (Council) has been proactive in preparing itself and the community for regulatory change and undertaken several studies on its supplies and potential options for the future. This includes being involved in a Rural and Small Supplies reference group focussed on issues facing such supplies in New Zealand.
Ōtorohanga District Water Supply Asset Management Plan 2021-31 25
ASSET MANAGEMENT PRACTICES
Council has also linked up with the WLASS, the Regional Asset Technical Accord (RATA) and the Taumata Arowai Establishment Unit to align its approach to compliance. This aligns with Council’s funding in the proposed LTP to accelerate the upgrading of water treatment plants to meet the new standards
Council engaged a specialist company, (AMBI), to undertake a research study focussing on one of its rural supplies, (Kahorekau), to understand options and risks around complying with current and potential future drinking water standards and supply requirements. This quickly morphed into a collaborative regional study for the Waikato, (funded through WLASS), and incorporating guidance and resources from Taumata Arowai. This ensured acceptable solutions were considered in the options selection process for Kahorekau, but also developed an approach and framework that could be applied region and potentially nationwide. Although Council has resolved to complete this work there is still consultation to take place with the Arohena Rural Water Scheme committee.
The project objectives outlined below show this collaboration in practical terms:
Establish the Kahorekau Scheme as a national pilot in partnership with the new national Water Regulator - Taumata Arowai, to proof the most cost-effective upgrade model and operational costs for typical rural water scheme of this nature.
RATA to lead the project on behalf of the Waikato region and leverage off Councils’ proactive approach and innovation.
Deliver a solution that is robust, compliant, manageable, cost effective and well positioned should some subsidies be available from Taumata Arowai, or Central Government.
Establish a systematic framework to deal with rural water supply upgrades and compliance recovery issues in the context of the DIA team being ‘The Regulator’ with reference to such schemes, (while adopting a blend of best-practice and affordability).

Ōtorohanga District Water Supply Asset Management Plan 2021-31 26
LEVELS OF SERVICE
4.0 Levels of Service
4.1 Customer Expectations
Improved storage and reticulation systems and reticulation maintenance, (including regular flushing programmes), has reduced recorded complaints of ‘dirty’ water that previously occurred on the Kāwhia, Tihiroa and Ōtorohanga schemes. Improved reticulation management issues have solved some of the complaints of poor supply pressure in the RWS schemes, although there is an on-going need for users to ensure they have adequate on-site storage to reflect the ‘trickle feed’ supply.
Overall, very few complaints are received in respect of water supply or quality, the only significant exception being in relation to the taste and smell of water from the Ōtorohanga supply during very dry periods in summer when the Wāipa River falls to low levels. During the LTP 2021-31 Roadshow, residents requested improvements to taste and odour. This links with the activated carbon and coagulation improvements included within budgets. Significant additional treatment to remove taste and odour is above the NZ Drinking Water Standards, however, the improvements programmed for treating this raw water will help reduce these concerns. Trials of a carbon plant and introduction of pre-chlorination has shown early reductions in organic compounds, (Geosmin and 2-Methyisoborneol), that testing showed was likely to cause the taste and odour issues.
In Kāwhia, peak demand in the Christmas / New Year’s holiday period can result in the reservoirs dropping to critical levels. As part of the first year of the LTP, staff are considering additional treated storage that will be on-line for a 30-day period, and also adding a pressure reducing valve on the supply main from the reservoir to reduce potential losses in the reticulation. The Community Board have agreed with the need for metering on all connections, which is also proposed in Year 1 of the LTP.

Ōtorohanga District Water Supply Asset Management Plan 2021-31 27
COUNCIL ADMINISTERED WATER SUPPLIES - GENERAL INFORMATION
4.2 Technical Levels of Service
Service Characteristic
Performance Indicator Target Level of Service
Performance results
1 Safety of drinking water
DIA Mandatory measure:
The extent to which the local authority’s drinking water supply complies with: (a) Part 4 of the drinking-water standards (bacteria compliance criteria); and (b) Part 5 of the drinking-water standards (protozoal compliance criteria).
No public health Incidents related to drinking water quality
Ōtorohanga and Kāwhia supplies currently comply with Part 4 and Part 5. None of the rural water schemes have the plant processes or capability to continuously meet either Part 4 or part 5 of the Drinking Water Standards.
2 Maintenance of the reticulation network
DIA Mandatory measure:
The percentage of real water loss from the local authority’s networked reticulation system (including a description of the methodology used to calculate this).
Of the annual volume of water produced through the treatment plants, the volume that remains unaccounted for (whether leaks, unauthorised takes, flushing or firefighting), reduces year to year and <30%
For 2018-19 possible unaccounted for water of 14% in Ōtorohanga, and 32% for Kāwhia. Further zone metering and proposed work on use of Business Intelligence tools on metered data will help Council target leak detection to the areas with the greatest variation.
3 Fault response times:
DIA Mandatory measure:
Where the local authority attends a call-out in response to a fault or unplanned interruption to its networked reticulation system, the following median response times are measured:
- Time between call and site attendance for urgent and non-urgent call-outs:
- Time between call and actual resolution of urgent and non-urgent call-outs
Median response time to:
Urgent call-outs (<3hr 55mins)
Non-urgent call-outs (<26hr 20mins) Median resolution times for:
Urgent call-outs (<18 hrs)
Non-urgent call-outs (<31 hrs)
2018/19 results
Response times:
Urgent call-outs (1 hr 5mins)
Non-urgent call-outs (65hr 4mins) Median resolution times:
Urgent call-outs (<18 hrs)
Non-urgent call-outs (<31 hrs)
Table 4.1: Water Supply Technical Levels of Service Supply

Ōtorohanga District Water Supply Asset Management Plan 2021-31 28
COUNCIL ADMINISTERED WATER SUPPLIES - GENERAL INFORMATION
Service Characteristic
Performance Indicator Target Level of Service
Performance results
4 Customer satisfaction
DIA Mandatory measure:
The total number of drinking water complaints per 1000 connections received by the local authority about any of water clarity; water taste; pressure or flow; continuity of supply; and the local authority’s response to any of these issues
≤5 complaints 32 complaints for 2018/19 year
5 Demand Management
Average consumption of drinking water per day per resident within the Ōtorohanga District
390L per person per day
Ōtorohanga: 290L person/day
Kāwhia: 193L person/day
Table 4.1: Water Supply Technical Levels of Service (continued) Supply
Ōtorohanga District Water Supply Asset Management Plan 2021-31 29
COUNCIL ADMINISTERED WATER SUPPLIES - GENERAL INFORMATION
5.0 Council Administered Water Supplies – General Information
5.1 Nature of Activity
Ōtorohanga District Council owns and administers two urban water supply schemes for Ōtorohanga and Kāwhia, and four Rural Water Supply (RWS) schemes (Arohena, Tihiroa, Ranginui and Wāipa), mainly for agricultural purposes. Estimated usages of water produced by the various supplies are listed in the table below:
Estimated Usage of Water (as % volume)
Water Supply
Domestic
Industrial / Commercial
Farm Stock
Irrigation (sports fields)
Ōtorohanga Community 70 23 5 2
Kāwhia Community 90 10 nil nil
Wāipa RWS 15 nil 85 nil
Tihiroa RWS 8 nil 92 nil
Arohena RWS (overall) 8 nil 92 nil
Ranginui RWS nil nil 100 nil
Issues discussed in this section are generally relevant to all of these supplies, though Ranginui is a non-potable supply, as reflected in the table above.
The urban and rural schemes differ in that the urban schemes are ‘on-demand’ pressure supplies, capable of providing adequate fire-fighting water flows direct from reticulation, whilst the rural schemes are designed to work on the flow restricted ‘trickle feed’ principle, whereby smaller continuous flows of water are provided, requiring use of on-site storage to meet instantaneous demand.
5.2 Rationale for Delivery of Activity
Having established reticulated water services to the urban communities of Ōtorohanga and Kāwhia and to some rural areas, to enable growth and prosperity, the Local Government Act 2002 imposes significant obligations on Council to continue this activity.
Council’s water supplies are relevant to the following broad desired community outcomes:
Liveable
Resilient
Connected
Prosperous
Sustainable
5.3 What is the Extent of Council's Responsibility?
With the establishment of Taumata Arowai and the draft Water Services Bill, there is a clear directive that everything council does in the water space, we must give effect to Te Mana o te Wai. Te Mana o te Wai is best described as the Korowai that sits above all things water, and Council services will need to have this message as part of our planning going into the future.
Overall, Council is responsible for ensuring reliable and compliant supply of potable water to the urban communities of Ōtorohanga and Kāwhia, and being clear on the quality of the water to those rural areas where water supply schemes have been established. To do this, Council:
Table 5.1: Estimated Usage of Water (as % volume) Supply
Ōtorohanga District Water Supply Asset Management Plan 2021-31 30
COUNCIL ADMINISTERED WATER SUPPLIES - GENERAL INFORMATION
Undertakes strategic planning, asset management, operations and associated supervision and administrative activity, including charging for water.
Co-operates with the Waikato District Health Board as the mandated Drinking Water Assessors to ensure that treated water meets relevant standards.
Ensures compliance with the operative Regional Plan for consents for this activity issued under the Resource Management Act 1991.
5.4 Potentially Associated Negative Effects
Potential significant adverse effects of water supply activities are health (if the supply of potable water to the consumers’ point of supply does not meet the Drinking Water Standards), environmental (water abstraction, discharge of backwashed water), and economic (costs imposed annually on ratepayers to provide the required budgets for meeting legislative standards and resilient infrastructure).
Except for Ōtorohanga, the volume of water extracted from the surface water sources is high relative to the amount needed as a sustainable continuation flow. To enable Council to give effect to Te Mana o te Wai, we must continuously seek efficiency in the usage of water.
As costs to deliver compliant water services increase, (as more obligations and reporting requirements are imposed on Council), some RWS customers may seek to withdraw from the schemes, which may make the existing supply schemes unaffordable in favour of other private supply arrangements.
5.5 Water Source Chemistry
The water sources providing raw water to Council’s supplies are variable, but testing has shown no significant chemical or radiological components that require monitoring or control. The new Water Services Bill will add to the level of monitoring, testing and reporting that Council must do, including developing ‘source protection plans’ to ensure the plants have the technical capacity to successfully ‘treat’ and supply water in compliance with standards.
5.6 Asset Information
Information on Council water supply assets is reliant on two main sources - these being a GIS based ‘AssetFinda’ Asset Management System and a NCS MagiQ electronic document handling system. The quality of spatial information on water pipes is now considered to be good, with more than 95% of pipes accurately recorded.
5.7 Asset Condition
The earliest reticulated community water supply infrastructure in the Ōtorohanga District was established in Ōtorohanga in the 1930s, but all elements of this first infrastructure have now been replaced.
The majority of current water treatment and supply infrastructure in Council’s water schemes was established between 1959 and 1986, with the oldest remaining assets generally being asbestos cement (‘AC’) water mains in Ōtorohanga.
Most significant water supply assets are generally believed to be in good condition, but during the past two or three years a number of AC mains have been found to display significant softening of the pipe material even though in some cases the expected lives of these pipes have not yet been approached.
5.8 Rural Water Schemes (RWS) and Conditions of Supply
The rural supplies were established through intensive development in the 1980’s by farmers taking advantage of central government subsidies that were available at that time. The areas supplied by the

Ōtorohanga District Water Supply Asset Management Plan 2021-31 31
COUNCIL ADMINISTERED WATER SUPPLIES - GENERAL INFORMATION
RWS schemes are limited to those properties for which an appropriate capital contribution has been paid, and these areas are formally defined through Gazetting.
Whilst the assets of the RWS schemes are vested in Council, farms connected paid significant capital contributions when the schemes were established. This creates a challenge where some supplied properties believe their contribution should equate to decision making powers rather than recommendations to Council in regards to desired operating and administrative practice. Council acknowledges as part of the Water Bylaw review and nationally led Three Waters Reform, support is needed for the RWS Committee’s to understand their role and legislative requirements including the proposed Water Services Bill.
Some key terms and conditions of supply that apply to those connected for these schemes include:
Available flows to all connections to be limited by orifice flow restrictors. Size of the orifice being based upon demand projections for individual properties at the time of scheme commissioning.
All private reticulation is to be isolated from public reticulation by an air gap or other approved backflow prevention device.
All customers required to have on-site water storage capacity adequate for 24 hours’ consumption at peak demand rates.
No assurance of continuity of supply is given; if a property requires continuous supply they are responsible for providing the necessary back-up arrangements.
Customers required to notify Council of any substantial changes in demand for water; large increases in demand, combined with adjustment or removal of restrictors may result in localised water shortages.
Defined range of measures in response to non-compliance with terms and conditions.
5.9 Water Services Delivery
From July 2010, Council initiated an in-house team of three water services operators rather using contracted external suppliers. Whilst predominantly operators of the treatment plants, this team can deal with minor but urgent matters such as locating tobies, fixing small leaks and responding to service requests. Costs for the in-house service are lower than previously invoiced annually by contractors, and more importantly ratepayers value the ‘ownership of the network’ these staff provide.
In addition, there is greater supervision and management control over the daily tasks, responses to emergencies, flexibility and a decrease in administration in the absence of contract preparation and management. The latter allows engineering staff to apply time to the growing demands of the Drinking Water Standards NZ 2005 (Revised 2018) and the Resource Management (Measurement and Reporting of Water Takes) Regulations 2010.
Council’s water services team has been recently increased to four operators to further reduce the extent to which external contractor assistance is required for certain tasks.
Considerable work is still contracted out to local firms, such as the larger or more complex repairs, development and renewals.
5.10 Demand Trends
The 5% increase in housing numbers in Ōtorohanga recorded between 2013 and 2018 does not coincide with an increase in water consumption, mainly due to the installation of water meters and imposing volumetric charging in the same period. Unless a significant new ‘wet industry’ such as a meat processing company established inside the urban boundary, the supplies are considered to have sufficient capacity to meet demand for the next 10 years.

Ōtorohanga District Water Supply Asset Management Plan 2021-31 32
COUNCIL ADMINISTERED WATER SUPPLIES - GENERAL INFORMATION
5.11 Drinking Water Standards NZ (DWSNZ) Compliance
The externally provided 2019-20 DWSNZ Compliance Report notes:
An official assessment of the performance of Ōtorohanga District Council as a ‘water supplier’, against the Health Act 1956, Part 2A, Drinking Water (the Act), and the Drinking Water Standards for New Zealand 2005 (Revised 2018) (DWSNZ) has been completed for the period 1st July 2019 – 30th June 2020.
Table 5.2: DWSNZ Compliance Report 2019-20 Supply
Ōtorohanga District Water Supply Asset Management Plan 2021-31 33
COUNCIL ADMINISTERED WATER SUPPLIES - GENERAL INFORMATION
Overall, the ODC performance over the compliance period is slightly worse than previous years, with the exception of the Ōtorohanga Water Treatment Plant, which through the hard work of ODC staff was able to achieve full compliance for six months of the compliance year. For the Arohena water supply, bacterial compliance was able to be demonstrated for the whole compliance year. Unfortunately, Kāwhia and Tihiroa Treatment Plants, could not achieve bacterial compliance with Criterion 2B, DWSNZ. This was due to turbidity events throughout the compliance year. Protozoa compliance also was not able to be demonstrated for these two treatment plants.
It was pleasing to see that all the distribution zones were able to achieve full compliance with Section 4.3.1, DWSNZ. Full compliance was also achieved for all of the duties that were assessed under Part 2A of the Health Act.
The area of most concern to the DWA is that no treatment plant complied with the protozoa requirements of the DWSNZ, (apart from Ōtorohanga Treatment Plant). Most of ODC’s treatment plants are capable of meeting the drinking water standards it’s just a matter of sorting out the peak weather events and compliance monitoring.
ODC has undertaken some significant work in past few years to provide potable water to the residents of the district. The treatment in place is more than capable of producing high quality treated water, (apart from the Arohena treatment plants), and once the minor technical issues have been resolved, including the Wāipa Distribution Zone chlorine contact time (C.t) values, then the ODC water supplies can be fully compliant. Waikato Drinking Water Assessors (WaDWAS) applauds the dedication and hard work that has been undertaken by ODC staff throughout the 2019-2020 compliance period.
Council believes that it can further enhance Ōtorohanga and Kāwhia risk barriers through work planned on managing the quality of raw water for both peak periods and high turbidity events.
The situation regarding the rural water supplies is very different, as the treatment systems are effectively unable to meet compliance with the DWS, particularly in respect of protozoa. As of the 24th of February following a positive E. coli result in Arohena, the Arohena Rural Water Scheme are now under a permanent Boil Water Notice.
For each of the schemes the options available to meet the Drinking Water Standards are:
1. Significantly upgrading existing treatment plant(s), or constructing entirely new treatment plant(s) recognising the equipment and staffing resource to reliably achieve DWS compliance would require central government funding to be achievable; or
2. Restricting the use of the existing RWS supply(s) to the provision of non-potable water for agricultural purposes only.
3. Cease operation of the supply entirely.
Pragmatically, Options 1 and 2 are most likely under the proposed reform of Drinking Water supplies in NZ.
In terms of decisions in the LTP, each RWS committee needs to discuss the Governments proposals and requirements with their consumers. If the RWS committees are unable to agree how they will ensure the supplies consistently comply with new rules for provision of drinking water, Council will be required to undertake work regardless as Council is deemed the network supplier.
Achieving compliance with the DWS will undoubtedly place increased financial burdens on all Council administered water schemes, and unless Council moves to district wide scheme funding, the impact will be greatest on the smaller rural schemes, regardless that they consume water primarily for farm stock. It is also unfortunate that for the rural treatment plants achieving compliance with the DWS will not eliminate all of the most significant health related risks associated with these supplies, since the issues of potential on-site contamination will not be addressed. The diagram below highlights the various ways houses in these rural water supply areas obtain their water:

Ōtorohanga District Water Supply Asset Management Plan 2021-31 34
COUNCIL ADMINISTERED WATER SUPPLIES - GENERAL INFORMATION
It has been Council’s experience that significant health related issues are more likely to arise within private reticulation on farms than in the ‘public’ water treatment and reticulation components that will be affected by imposition of the DWS. Observed on-site contamination issues have included introduction of chemical stock dosing into household water supplies, insecure storage tanks (occasionally containing dead animals or birds), and cross-connection of cattle troughs to household supplies.
5.12 Maintenance and Renewal Strategies
Council’s strategy towards water supply asset maintenance and renewal can be summarised as follows:
Water treatment plant and pump station assets: These assets are being proactively upgraded to meet the Drinking Water Standards using predominately central Government funding from Tranche 1 of the Three Waters Reform. All assets receive routine planned maintenance, and except for critical water safety assessment tools such as Chlorine Analysers or UV bulbs that are replaced as per manufacturers recommendations, components are replaced typically based upon evidence of impending failure, or other observed performance deficiencies.
The annual Drinking Water Compliance report notes enhancements to Protozoa compliance and Chlorine Contact time will be required, which aligns with projects proposed in the draft LTP.
Water reticulation assets: Water mains and associated valves and hydrants receive programmed maintenance such as periodic flushing (pipes) and open-close operation (valves). Renewals of these items are based upon observed performance deficiencies (i.e. pattern of mains or lateral failures, valve leaks), or other evidence of advanced deterioration. An example of this latter criteria has been Council’s on-going programme to replace all existing known old (circa 1930) concrete water mains in the Ōtorohanga community, which is now completed.
Since 2014, the water services team have used a Technical Support Officer whose principal role is to make use of asset management software to manage asset management and replacement is a more effective manner. This improvement has been driven by a desire to meet level of service requirements and more effectively manage operating and maintenance costs.
Figure 5.1: Various Ways Houses in these Rural Water Supply Areas Obtain their Water
Ōtorohanga District Water Supply Asset Management Plan 2021-31 35
COUNCIL ADMINISTERED WATER SUPPLIES - GENERAL INFORMATION
Increasing the use of this formal asset management system to reduce the risk associated with relying heavily upon the knowledge and experience of relevant staff and contractors to identify maintenance and renewal requirements is of strategic importance.
Verifying, correcting and improving the data contained in the AssetFinda programme has enabled staff to align renewal budgets with long-run averages in a scientific manner this improving budgeting accuracy and confidence levels.
5.13 Health Risk Assessments
The Ministry of Health requires a more proactive approach that requires significant water supplies to be fully characterised, risks identified, and a comprehensive strategy for managing those risks presented via Water Safety Plans (WSPs).
Council currently has two approved WSPs, for the Ōtorohanga and Kāwhia supplies and are integral to this AMP.
For the rural water supplies, significant health risks have been previously identified, and many of these have been progressively resolved through improvements to infrastructure and operating practices. These include the introduction of chlorine disinfection to the Taupaki supply of the Arohena RWS, and the conversion of the Ranginui RWS to a non-potable supply.
Despite these improvements, none of Council’s rural water supplies have the barriers against protozoa that are required by the DWSNZ, and it has been assessed as being impractical to modify the existing water treatment plants to provide protozoa barriers to the required standard without external funding support. (As possibly provided via the national water reform.) As a result of these lack of barriers, the Waikato DHB imposed a permanent boil water notice on the Arohena Rural Water Schemes from 24 February 2021.
5.14 Adopted Processes and Standards for Work on Water Assets
The following general policies, processes and standards are routinely adopted to minimise health risks in relation to Council administered water supplies:
Regional Infrastructure Technical Specification (RITS)
Council requires developers to apply the Regional Infrastructure Technical Specification (RITS) developed jointly by Councils in the Waikato region. This works well for greenfields development, and recognising that some development is of in-fill or intensification type, we also adopt the following processes:
Authorisation to Work on Council Mains
Work on Council water mains may only be conducted by contractors who have been approved by Council following agreement on Health and Safety processes along with having the equipment and competency to ensure the work is in accordance with standards specified by Council.
Shut Down Procedures
Any work or situation that very significantly interrupts Council’s water services is managed in accordance with Council's water shut-down procedures. These specify requirements in respect of planning, application, approval, public notification and management of the shutdown event. Any major shut downs must be authorised by the Council’s Chief Executive Officer. The Council holds a confidential list of properties requiring specific water needs, for example constant supply for kidney dialysis equipment.
Ōtorohanga District Water Supply Asset Management Plan 2021-31 36
COUNCIL ADMINISTERED WATER SUPPLIES - GENERAL INFORMATION
Testing and Disinfection – New Mains
Inspection and testing of new water mains or completed major repairs to existing mains is undertaken by experienced Council services staff. Water mains are not connected or put into service until all tests and approvals are given by Council and supervised flushing of the service is undertaken.
Backflow Prevention
Council is updating its Water Bylaw to ensure the requirements on Backflow Devices will align with the proposed Water Services Bill. Currently new or modified water connections requiring backflow prevention are addressed at the time of application/installation or through the Building Consent process.
All rural water supply connections are required to have an air gap separation into a tank or another approved form of backflow prevention device, usually to RPZ standard. These are inspected for compliance.
Health and Safety, Signage and Security
As required by the Health and Safety at Work Act 2015 and Council’s Health and Safety Policy, health and safety inspections are integral to day to day operations. Staff receive training and support to enable identification and timely resolution of significant issues. Council has a Health, Safety and Wellbeing Advisor who works with Water Services staff to identify and manage risks.
Plants and premises have a security lock system along with clearly visible warning signage. Only approved persons are permitted into treatment areas and must follow clear and well-documented procedures. Where possible valves and other accessible controls are installed in a manner that restricts potential for malicious tampering.
Water Take Agreements
A limited number of contractors currently have approval to take ‘bulk’ quantities of water from Council mains on a commercial basis. All applications for Permits to Take Water from Fire Hydrants are received and approved by the Services Manager. Such approval is reviewed annually and is governed by a strict set of conditions intended to reduce potential for associated hazards such as backflow or other contamination of the potable supply.
Infectious Diseases
Council requires that persons working with sewerage are tested and inoculated for Hepatitis and other infectious diseases and that any contractor or staff member infected with such disease is excluded from contact with water services.
Cross Contamination – Water and Wastewater
Council requires all contractors working on water and wastewater services to follow normal good practice to ensure contamination is not carried from sewage to the water system. This includes appropriate delays between working on the two services and use of separate sets of water and wastewater tools.
5.15 Water Fluoridation
Fluoride is not currently added to any of the Council administered water supplies. Addition of fluoride is simple and inexpensive and appears to have significant benefits in respect of dental health, but is also the subject of strong public contention, on the basis of other perceived possible adverse physical effects.
Council has received a few requests from individual residents for fluoridation of water, but it is also known that there would also be widespread opposition to such measures, and that surveys undertaken by other local authorities have shown a strong majority against the addition of fluoride. As such, Council does not at this time intend to pursue the issue further, unless directed to do so under central government direction.
Ōtorohanga District Water Supply Asset Management Plan 2021-31 37
COUNCIL ADMINISTERED WATER SUPPLIES - GENERAL INFORMATION
5.16 Raw Water Allocation
All of Council’s water supplies are required to hold Resource Consents from the Waikato Regional Council in respect of taking water from surface sources. Increasing development throughout the region has resulted in more demand to access raw water, and in response to this Waikato Regional Council has put in place a ‘water allocation’ framework that will ensure that available water resources are fairly and effectively allocated to the various parties requiring water.
The allocation model adopted by WRC considers that the quantity of water currently taken, (or proposed to be taken in the near future), from the upper Wāipa River or its tributaries by existing users during the period between October and April is at the limit of what is sustainable without significant adverse environmental effects. As such it is not currently possible to obtain resource consents to take additional water from these sources during these months.
Whilst the quantities of water that Council is consented to take from the Wāipa River for the Ōtorohanga and Tihiroa water supplies are sufficient for current and probable near-future needs, it is of concern that if there was substantial increased demand for water from either of these sources, the inability to take more water from the river during the October to April period would pose a significant constraint on the ability to meet this demand.
Council is considering two options to mitigate this. The first option is building a reservoir close to the water treatment plant to store low turbidity raw water for supplementing the river take when the river flows are abnormal. The second option is building a water storage lake on elevated land west of Ōtorohanga, where over 100,000 cubic metres of rain water might be accumulated during the winter period, and then released as a continuation flow into the river during the October to April period.
Both options are at feasibility stage, and depending on likely costs to construct and operate, Council may consider bore options for a similar purpose.
5.17 Unaccounted for Water
It is considered inevitable that some water will be unaccounted for from reticulated water supplies, either through leakage from mains or private lateral pipelines, unknown connections, meter faults or premature failure of connections such as tapping bands.
The magnitude is dependent on the extent and condition of public and private reticulation, the average working pressures in the reticulation, the standard of reticulation maintenance (potentially including leak detection surveys), and public attitudes towards water conservation, for example willingness to fix leaky taps etc. These losses or wastages in total typically account for between ten and forty percent of water produced by a treatment plant. It is generally accepted that leakage proportions below 10% are extremely difficult to achieve in anything but very small or very new public reticulation systems.
For 2018-19 possible unaccounted for water has been assessed at 14% in Ōtorohanga, and 32% for Kāwhia. Further zone metering and proposed work on use of Business Intelligence tools on metered data will help Council target leak detection to the areas with the greatest variation. These estimates are based on a combination of comparing the water volume supplied by the water plant versus the total volume recorded by all of the water meters at the receiving properties, and measuring minimum night flows.
Council’s rural water supplies are more difficult to assess as meters tend to under-read in the very low flows at points of supply in 'trickle feed' connections. Current estimates are between 20% and 30% of the water produced by a given treatment plant, is unaccounted for. These levels of losses are fairly typical of those found for ‘trickle feed’ supplies.
Ōtorohanga District Water Supply Asset Management Plan 2021-31 38
COUNCIL ADMINISTERED WATER SUPPLIES - GENERAL INFORMATION
5.18 Water Metering & Other Demand Control Measures
Council's rural water supplies have a significant element of demand control, with allocated quota of water delivered to particular properties on a metered trickle feed basis, with charges for water based wholly or in part on metered consumption, which is assessed at six-monthly intervals.
Escalating demand for water and other development issues on the rural supplies has however resulted in some circumvention of these controls, the most notable of which has been exceeding quotas and widespread removal of flow restrictors.
There has at times been elevated localised demand for water within some of the RWS schemes that has made effective supply management challenging, but it generally been possible to resolve these issues informally without the need for stronger actions such as forcefully imposing the designed supply quotas and re-installation of flow restrictors as they were originally specified.
Installation of water meters in Ōtorohanga has been completed and volumetric charging is in place.
Demand issues in the Kāwhia community are very different, and centre on managing the peak demand over a brief period around Christmas and the New Year, when the population of the town increases dramatically. Council intends to complete metering for Kāwhia in the 2021-22 year.
5.19 Water Take Reporting
Since 2010 Council has been required to provide enhanced reporting of the quantities of raw water taken by its water supplies. The requirements are in essence to keep auditable daily records of the cubic metres taken using an accurate water measuring device or system that provides, or provides for, electronic storage of the data.
The measurement devices require calibration every five years.
Council supplies are now fully compliant with these requirements.
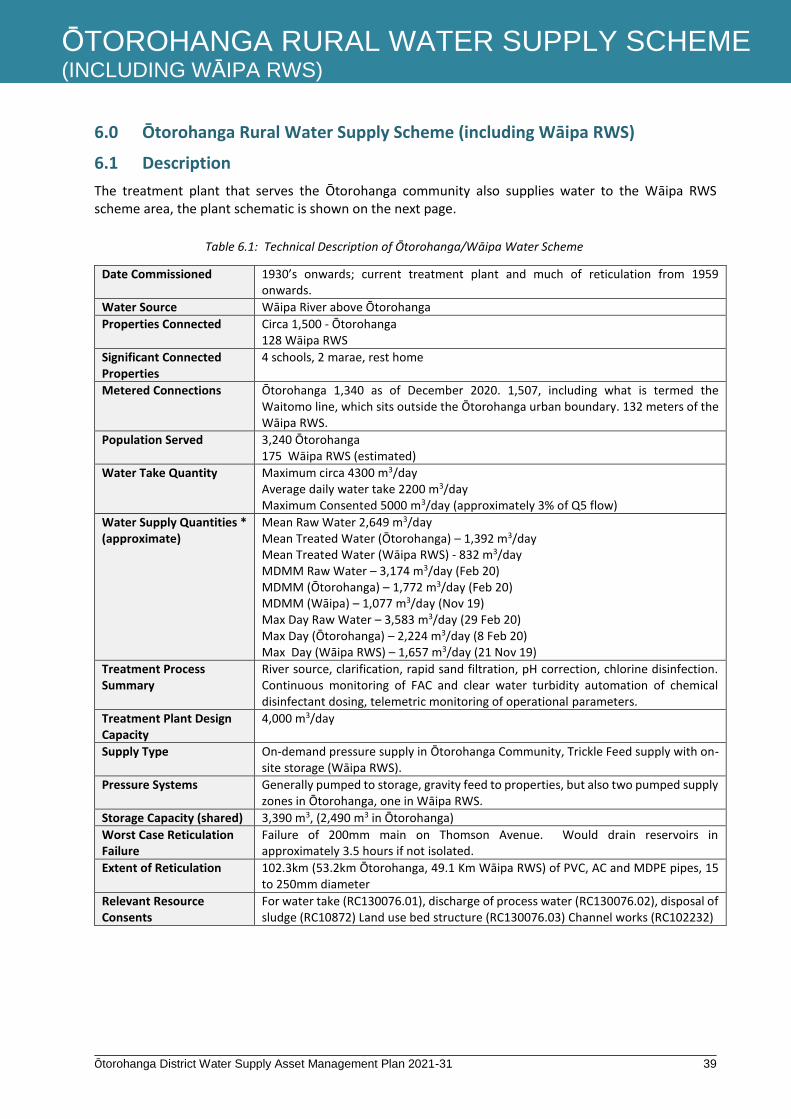
Ōtorohanga District Water Supply Asset Management Plan 2021-31 39
ŌTOROHANGA RURAL WATER SUPPLY SCHEME (INCLUDING WĀIPA RWS)
6.0 Ōtorohanga Rural Water Supply Scheme (including Wāipa RWS)
6.1 Description
The treatment plant that serves the Ōtorohanga community also supplies water to the Wāipa RWS scheme area, the plant schematic is shown on the next page.
Date Commissioned 1930’s onwards; current treatment plant and much of reticulation from 1959 onwards.
Water Source Wāipa River above Ōtorohanga
Properties Connected Circa 1,500 - Ōtorohanga 128 Wāipa RWS
Significant Connected Properties
4 schools, 2 marae, rest home
Metered Connections Ōtorohanga 1,340 as of December 2020. 1,507, including what is termed the Waitomo line, which sits outside the Ōtorohanga urban boundary. 132 meters of the Wāipa RWS.
Population Served 3,240 Ōtorohanga 175 Wāipa RWS (estimated)
Water Take Quantity Maximum circa 4300 m3/day Average daily water take 2200 m3/day Maximum Consented 5000 m3/day (approximately 3% of Q5 flow)
Water Supply Quantities * (approximate)
Mean Raw Water 2,649 m3/day Mean Treated Water (Ōtorohanga) – 1,392 m3/day Mean Treated Water (Wāipa RWS) - 832 m3/day MDMM Raw Water – 3,174 m3/day (Feb 20) MDMM (Ōtorohanga) – 1,772 m3/day (Feb 20) MDMM (Wāipa) – 1,077 m3/day (Nov 19) Max Day Raw Water – 3,583 m3/day (29 Feb 20) Max Day (Ōtorohanga) – 2,224 m3/day (8 Feb 20) Max Day (Wāipa RWS) – 1,657 m3/day (21 Nov 19)
Treatment Process Summary
River source, clarification, rapid sand filtration, pH correction, chlorine disinfection. Continuous monitoring of FAC and clear water turbidity automation of chemical disinfectant dosing, telemetric monitoring of operational parameters.
Treatment Plant Design Capacity
4,000 m3/day
Supply Type On-demand pressure supply in Ōtorohanga Community, Trickle Feed supply with on-site storage (Wāipa RWS).
Pressure Systems Generally pumped to storage, gravity feed to properties, but also two pumped supply zones in Ōtorohanga, one in Wāipa RWS.
Storage Capacity (shared) 3,390 m3, (2,490 m3 in Ōtorohanga)
Worst Case Reticulation Failure
Failure of 200mm main on Thomson Avenue. Would drain reservoirs in approximately 3.5 hours if not isolated.
Extent of Reticulation 102.3km (53.2km Ōtorohanga, 49.1 Km Wāipa RWS) of PVC, AC and MDPE pipes, 15 to 250mm diameter
Relevant Resource Consents
For water take (RC130076.01), discharge of process water (RC130076.02), disposal of sludge (RC10872) Land use bed structure (RC130076.03) Channel works (RC102232)
Table 6.1: Technical Description of Ōtorohanga/Wāipa Water Scheme
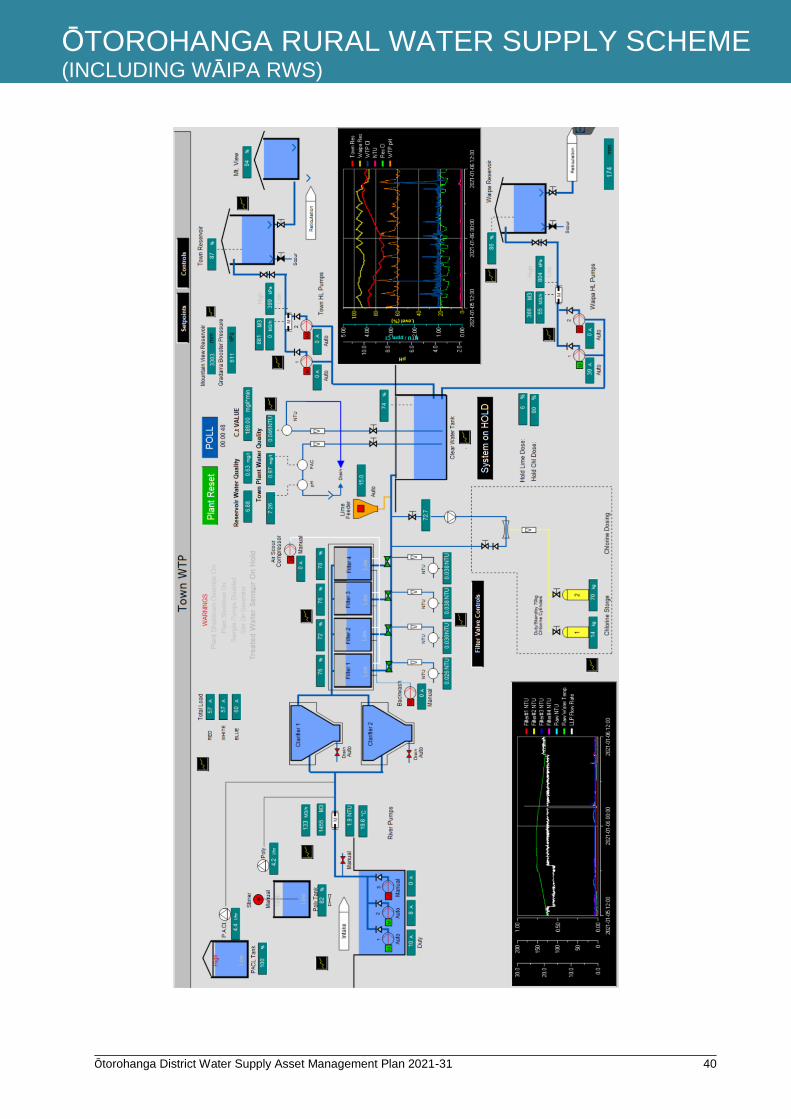
Ōtorohanga District Water Supply Asset Management Plan 2021-31 40
ŌTOROHANGA RURAL WATER SUPPLY SCHEME (INCLUDING WĀIPA RWS)
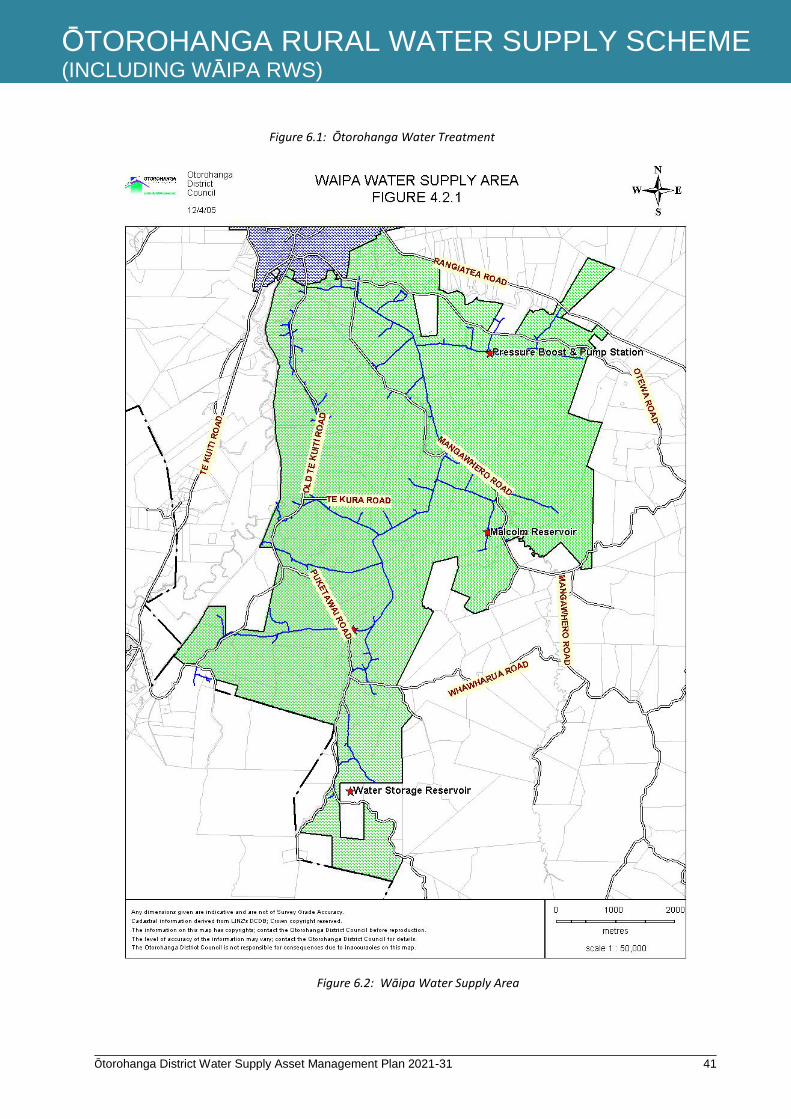
Ōtorohanga District Water Supply Asset Management Plan 2021-31 41
ŌTOROHANGA RURAL WATER SUPPLY SCHEME (INCLUDING WĀIPA RWS)
Figure 6.2: Wāipa Water Supply Area
Figure 6.1: Ōtorohanga Water Treatment Plant

Ōtorohanga District Water Supply Asset Management Plan 2021-31 42
ŌTOROHANGA RURAL WATER SUPPLY SCHEME (INCLUDING WĀIPA RWS)
6.2 Condition
While the water treatment plant is almost 60 years old, it was substantially constructed, has been well maintained, and has in more recent years received significant data and control technology upgrading the basic structure and configuration remains the same. As such it is in a sound condition, though some major components are beginning to display signs of deterioration.
As stated previously, all of the town’s earliest water infrastructure dating back to the 1930s, has now been replaced and the majority of remaining reticulation was installed between the late 1950’s and early 1970s. Some of this reticulation, in particular asbestos cement pipes, is now approaching the end of their expected lives and hence some extensive renewal requirements are ahead, as indicated in the projection below for the next 30 years:
The Wāipa RWS comprises only reticulation and storage facilities, as shown on the map on the previous page above. These were constructed in 1989 and are therefore relatively new and generally in excellent condition, with a remaining life of at least 50 years expected for the pipes. As such no substantial renewals are expected within the next 30 years.
6.3 Performance
The Ōtorohanga Water Safety Plan (WSP) was assessed and approved in December 2017. An assessment against this WSP determined the Ōtorohanga Plant was not meeting the Drinking Water Standards for the first part of the year, and then complied for the remaining six months. Key issues were seven instances in July 2019 and two instances in October 2019 where turbidity exceeded two Nephelometric Turbidy Units (NTU) for three minutes or more. It was also noted that the chlorine contact time (C.t) value must be at least six for at least 98% of the compliance monitoring period.
0
200,000
400,000
600,000
800,000
1,000,000
1,200,000
1,400,000
1,600,000
20
22
20
23
20
24
20
25
20
26
20
27
20
28
20
29
20
30
20
31
20
32
20
33
20
34
20
35
20
36
20
37
20
38
20
39
20
40
20
41
20
42
20
43
20
44
20
45
20
46
20
47
20
48
20
49
20
50
ŌTOROHANGA ANNUAL RENEWAL COST COMPARISON
2021 2018
Figure 6.3 – Ōtorohanga Water Annual Renewal Cost Trend
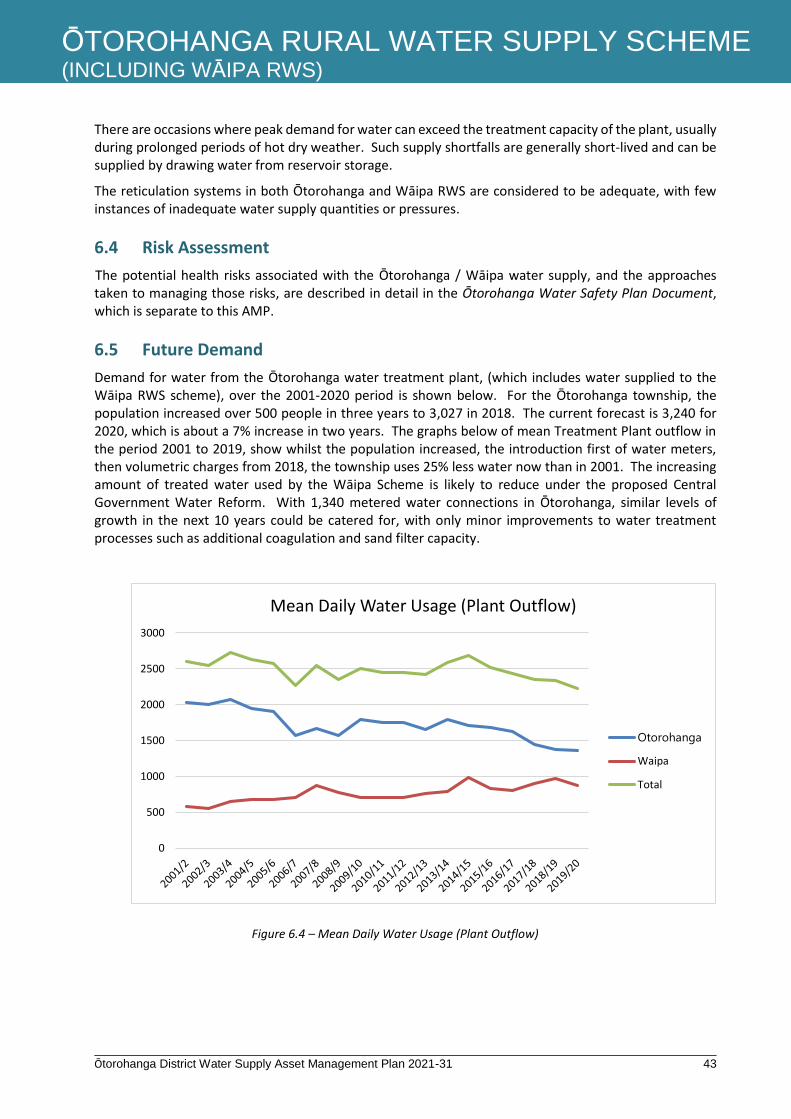
Ōtorohanga District Water Supply Asset Management Plan 2021-31 43
ŌTOROHANGA RURAL WATER SUPPLY SCHEME (INCLUDING WĀIPA RWS)
There are occasions where peak demand for water can exceed the treatment capacity of the plant, usually during prolonged periods of hot dry weather. Such supply shortfalls are generally short-lived and can be supplied by drawing water from reservoir storage.
The reticulation systems in both Ōtorohanga and Wāipa RWS are considered to be adequate, with few instances of inadequate water supply quantities or pressures.
6.4 Risk Assessment
The potential health risks associated with the Ōtorohanga / Wāipa water supply, and the approaches taken to managing those risks, are described in detail in the Ōtorohanga Water Safety Plan Document, which is separate to this AMP.
6.5 Future Demand
Demand for water from the Ōtorohanga water treatment plant, (which includes water supplied to the Wāipa RWS scheme), over the 2001-2020 period is shown below. For the Ōtorohanga township, the population increased over 500 people in three years to 3,027 in 2018. The current forecast is 3,240 for 2020, which is about a 7% increase in two years. The graphs below of mean Treatment Plant outflow in the period 2001 to 2019, show whilst the population increased, the introduction first of water meters, then volumetric charges from 2018, the township uses 25% less water now than in 2001. The increasing amount of treated water used by the Wāipa Scheme is likely to reduce under the proposed Central Government Water Reform. With 1,340 metered water connections in Ōtorohanga, similar levels of growth in the next 10 years could be catered for, with only minor improvements to water treatment processes such as additional coagulation and sand filter capacity.
0
500
1000
1500
2000
2500
3000
Mean Daily Water Usage (Plant Outflow)
Otorohanga
Waipa
Total
Figure 6.4 – Mean Daily Water Usage (Plant Outflow)
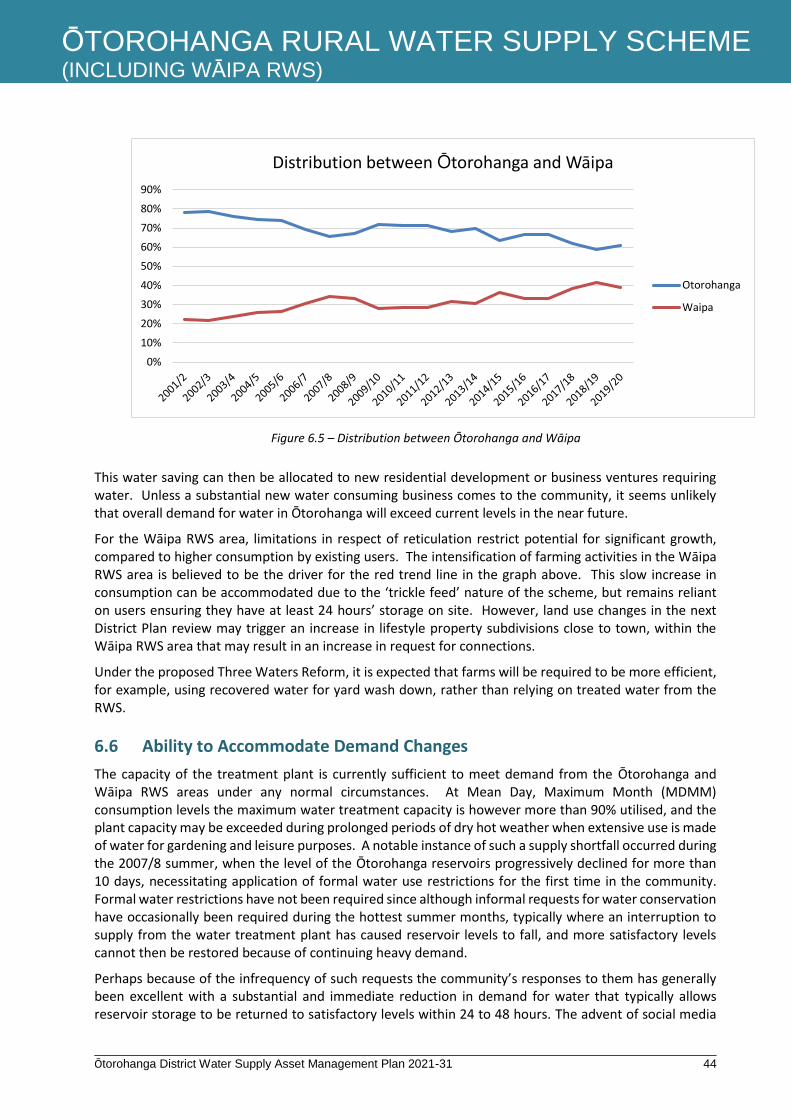
Ōtorohanga District Water Supply Asset Management Plan 2021-31 44
ŌTOROHANGA RURAL WATER SUPPLY SCHEME (INCLUDING WĀIPA RWS)
This water saving can then be allocated to new residential development or business ventures requiring water. Unless a substantial new water consuming business comes to the community, it seems unlikely that overall demand for water in Ōtorohanga will exceed current levels in the near future.
For the Wāipa RWS area, limitations in respect of reticulation restrict potential for significant growth, compared to higher consumption by existing users. The intensification of farming activities in the Wāipa RWS area is believed to be the driver for the red trend line in the graph above. This slow increase in consumption can be accommodated due to the ‘trickle feed’ nature of the scheme, but remains reliant on users ensuring they have at least 24 hours’ storage on site. However, land use changes in the next District Plan review may trigger an increase in lifestyle property subdivisions close to town, within the Wāipa RWS area that may result in an increase in request for connections.
Under the proposed Three Waters Reform, it is expected that farms will be required to be more efficient, for example, using recovered water for yard wash down, rather than relying on treated water from the RWS.
6.6 Ability to Accommodate Demand Changes
The capacity of the treatment plant is currently sufficient to meet demand from the Ōtorohanga and Wāipa RWS areas under any normal circumstances. At Mean Day, Maximum Month (MDMM) consumption levels the maximum water treatment capacity is however more than 90% utilised, and the plant capacity may be exceeded during prolonged periods of dry hot weather when extensive use is made of water for gardening and leisure purposes. A notable instance of such a supply shortfall occurred during the 2007/8 summer, when the level of the Ōtorohanga reservoirs progressively declined for more than 10 days, necessitating application of formal water use restrictions for the first time in the community. Formal water restrictions have not been required since although informal requests for water conservation have occasionally been required during the hottest summer months, typically where an interruption to supply from the water treatment plant has caused reservoir levels to fall, and more satisfactory levels cannot then be restored because of continuing heavy demand.
Perhaps because of the infrequency of such requests the community’s responses to them has generally been excellent with a substantial and immediate reduction in demand for water that typically allows reservoir storage to be returned to satisfactory levels within 24 to 48 hours. The advent of social media
0%
10%
20%
30%
40%
50%
60%
70%
80%
90%
Distribution between Ōtorohanga and Wāipa
Otorohanga
Waipa
Figure 6.5 – Distribution between Ōtorohanga and Wāipa
Ōtorohanga District Water Supply Asset Management Plan 2021-31 45
ŌTOROHANGA RURAL WATER SUPPLY SCHEME (INCLUDING WĀIPA RWS)
has also proved to be beneficial in this respect since it has enabled water conservation messages to be quickly communicated to the community.
The 2007/8 event showed that the Ōtorohanga/Wāipa scheme showed that additional treated water storage capacity in Ōtorohanga would be merited, being approximately 24 hours supply at MDMM demand levels. Water storage capacity has since been increased to around 28 hours supply at MDMM demand by the construction of an additional reservoir at Mountain View Road. The assumption of the need for increased storage capacity is further justified, as between 1 March 2020 to 28 March 2021 Ōtorohanga Reservoirs dropped to was 30% which is well below the desired limit of 50%.
This is also considered to slightly reduce the risk that has existed of a possible failure of the water main from the large Thomson Avenue reservoir resulting in an immediate loss of almost all the stored water in the community.
The capacity of existing distribution reticulation in both the Ōtorohanga community and the Wāipa RWS is currently considered to be adequate to meet likely demands within at least the next 10 years. If further significant residential development occurs in Ōtorohanga it is currently considered likely to occur in the vicinity of the main storage reservoirs at Thomson Avenue, and such additional demand could be easily supplied and may in fact benefit the operation of the existing pumped pressure zone that serves part of this area.
The introduction of a water allocation framework by Waikato Regional Council that limits the amount of water that can be taken from the Wāipa River has also caused a need for consideration to be given to what priorities should exist in respect of water supply to new developments in either the Ōtorohanga community or the Wāipa RWS area, and an agreement has been reached between the two parties that places decisions regarding this in the hands of the Ōtorohanga Community Board.
6.7 Alternative Supply Options
No consideration is being given at this point to replacing the Wāipa River as the primary water source for the Ōtorohanga/Wāipa RWS supply. Whilst it is sometimes subject to significant turbidity variations these can be managed, (including by temporarily shutting down the plant at times of extreme discoloration), and the river is otherwise a reliable source with adequate capacity.
As noted in section 5, Council is considering two options to address poor quality raw water over the summer period. There is a potential site on Council owned land off Te Raumauku Road that is being assessed as a large dam to retain winter time stream flows for use in the summer. Another is building a reservoir close to the water treatment plant to store low turbidity raw water, that will be piped to the plant to be blended with water from the river take.
Another possible alternative source for an augmenting source of water is from groundwater bores, but previous investigation suggests that the available groundwater in the vicinity of Ōtorohanga is often constrained in respect of both quantity and quality.
In considering the rationale for continuing this activity, Council believes the provisions of Section 131 of the Local Government Act 2002 would in any case preclude discontinuing supply of a treated water system to communities such as Ōtorohanga and Kāwhia. However, if the Government legislates that Councils shall vest their Three Waters assets into new inter-regional supply companies, then Council would abide with that new direction once decisions on how capital debt applying to those assets will be dealt with.
6.8 Significant Programmed Works
Appendix 1 lists the significant capital projects proposed to be undertaken on the Ōtorohanga / Wāipa Water Supply within the next 10 years.

Ōtorohanga District Water Supply Asset Management Plan 2021-31 46
KĀWHIA RURAL WATER SUPPLY SCHEME
7.0 Kāwhia Rural Water Supply Scheme
7.1 Description
The treatment plant that serves the Kāwhia community and the scheme detail and plant schematic is shown below.
Figure 7.1 – Kāwhia Community Water Supply
Ōtorohanga District Water Supply Asset Management Plan 2021-31 47
KĀWHIA RURAL WATER SUPPLY SCHEME
Date Commissioned 1970’s onwards; current treatment plant and much of reticulation from 1970 onwards
Water Source Kāwhia springs
Properties Connected Circa 417 - Kāwhia
Significant Connected Properties 1 school, 1 marae.
Metered Connections Kāwhia has 37 as of March 2021
Population Served 400 year round and summer holiday 3000
Water Take Quantity Maximum circa - 400m3/day (2019/20) Average daily water take - 330m3/day (2019/20) Maximum Consented - 600m3/day effective from 20 December to 10 January & 450m³/day for the balance of the calendar year
Treatment Process Summary Spring source, clarification, rapid sand filtration, chlorine & UV disinfection. Continuous monitoring of FAC and clear water turbidity automation of chemical disinfectant dosing, telemetric monitoring of operational parameters.
Treatment Plant Design Capacity 800m3/day, the limiting factor here is the source which is spring feed.
Supply Type Spring feed
Pressure Systems Generally pumped to storage, gravity feed to properties.
Storage Capacity (shared) Circa 1,180m3, (comprising of 2 x 400m³ and 1 x 380m³ reservoir tanks)
Worst Case Reticulation Failure Failure of 150mm main from the 3 reservoirs, Would drain reservoirs in 5 hours if not isolated
Extent of Reticulation 13.3km of PVC, AC and MDPE pipes, 15 to 150mm diameter
Relevant Resource Consents For water take (RC120401) and water use (RC120393)
Table 7.1: Technical Description of Kāwhia Rural Water Scheme
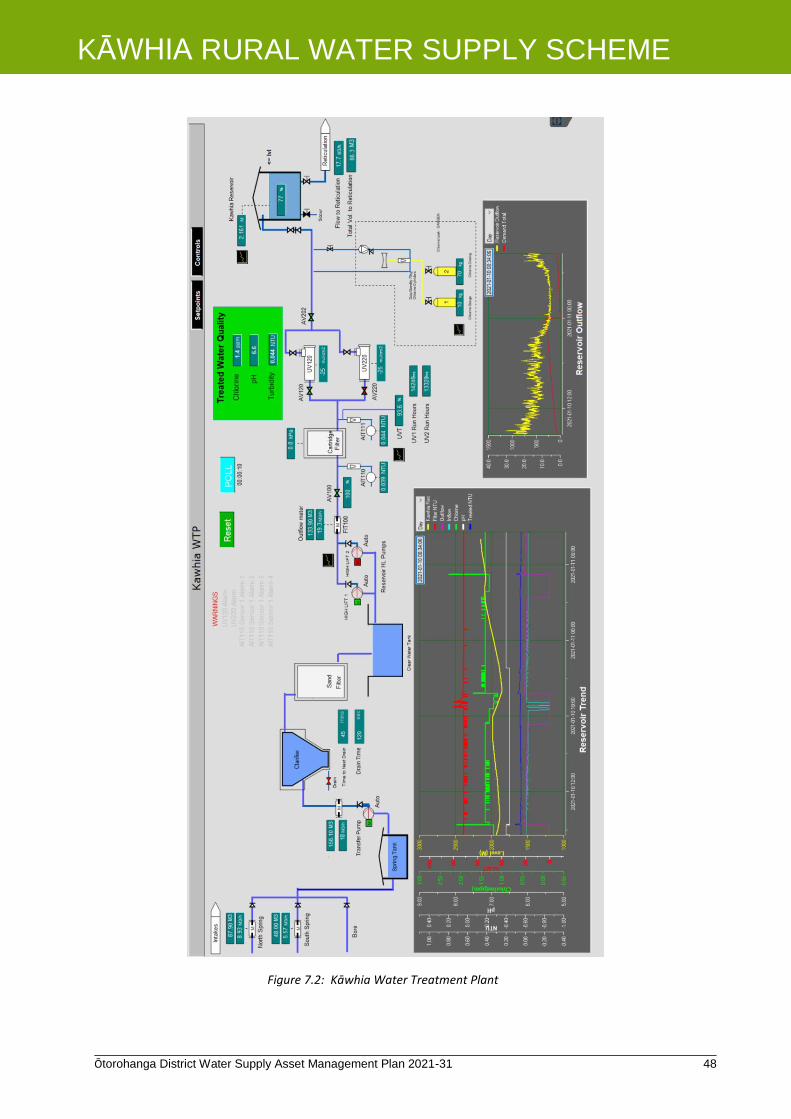
Ōtorohanga District Water Supply Asset Management Plan 2021-31 48
KĀWHIA RURAL WATER SUPPLY SCHEME
Figure 7.2: Kāwhia Water Treatment Plant
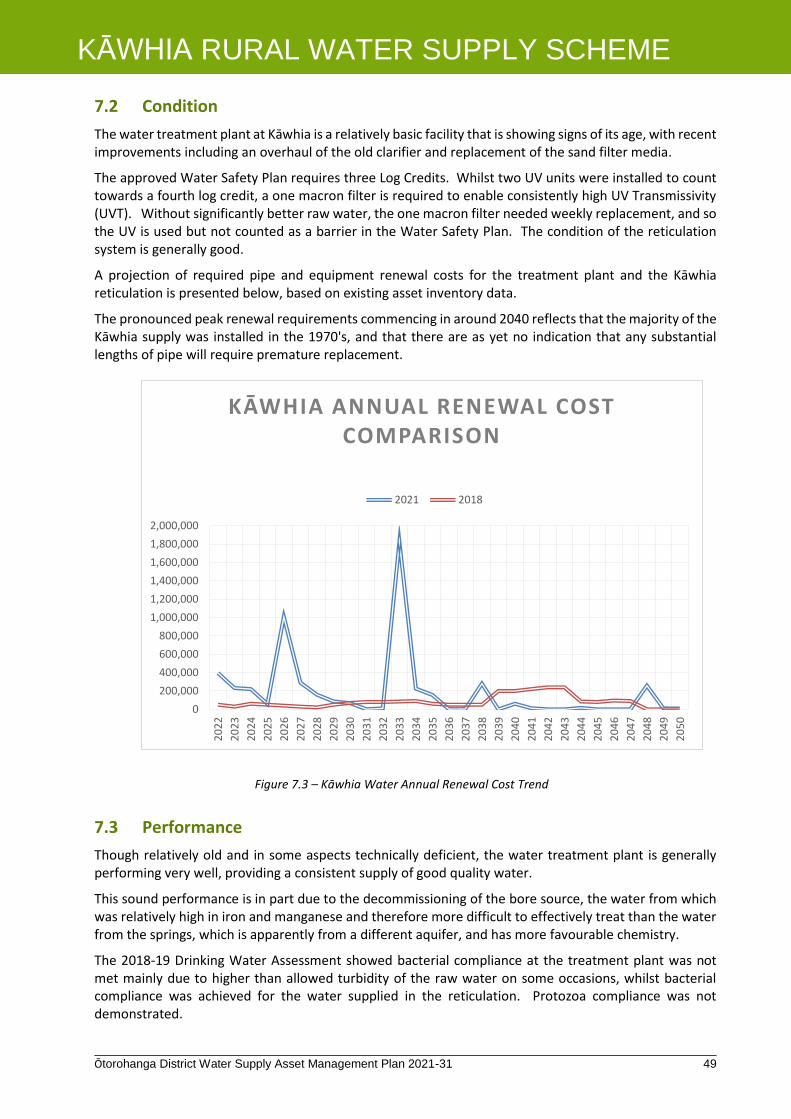
Ōtorohanga District Water Supply Asset Management Plan 2021-31 49
KĀWHIA RURAL WATER SUPPLY SCHEME
7.2 Condition
The water treatment plant at Kāwhia is a relatively basic facility that is showing signs of its age, with recent improvements including an overhaul of the old clarifier and replacement of the sand filter media.
The approved Water Safety Plan requires three Log Credits. Whilst two UV units were installed to count towards a fourth log credit, a one macron filter is required to enable consistently high UV Transmissivity (UVT). Without significantly better raw water, the one macron filter needed weekly replacement, and so the UV is used but not counted as a barrier in the Water Safety Plan. The condition of the reticulation system is generally good.
A projection of required pipe and equipment renewal costs for the treatment plant and the Kāwhia reticulation is presented below, based on existing asset inventory data.
The pronounced peak renewal requirements commencing in around 2040 reflects that the majority of the Kāwhia supply was installed in the 1970's, and that there are as yet no indication that any substantial lengths of pipe will require premature replacement.
7.3 Performance
Though relatively old and in some aspects technically deficient, the water treatment plant is generally performing very well, providing a consistent supply of good quality water.
This sound performance is in part due to the decommissioning of the bore source, the water from which was relatively high in iron and manganese and therefore more difficult to effectively treat than the water from the springs, which is apparently from a different aquifer, and has more favourable chemistry.
The 2018-19 Drinking Water Assessment showed bacterial compliance at the treatment plant was not met mainly due to higher than allowed turbidity of the raw water on some occasions, whilst bacterial compliance was achieved for the water supplied in the reticulation. Protozoa compliance was not demonstrated.
0
200,000
400,000
600,000
800,000
1,000,000
1,200,000
1,400,000
1,600,000
1,800,000
2,000,000
20
22
20
23
20
24
20
25
20
26
20
27
20
28
20
29
20
30
20
31
20
32
20
33
20
34
20
35
20
36
20
37
20
38
20
39
20
40
20
41
20
42
20
43
20
44
20
45
20
46
20
47
20
48
20
49
20
50
KĀWHIA ANNUAL RENEWAL COST COMPARISON
2021 2018
Figure 7.3 – Kāwhia Water Annual Renewal Cost Trend

Ōtorohanga District Water Supply Asset Management Plan 2021-31 50
KĀWHIA RURAL WATER SUPPLY SCHEME
The Kāwhia Water Safety Plan was assessed and approved in June 2018.
7.4 Risk Assessment
The potential health risks associated with the Kāwhia water supply and the approaches taken to managing those risks are described in detail in the Kāwhia Water Safety Plan Document, which is separate to this AMP.
7.5 Future Demand
As a coastal community with a steadily increasing proportion of temporarily occupied dwellings, (now making up the majority in the community), Kāwhia has large seasonal variations in water consumption associated with tourism and holiday home occupation, with the extent of these variations being very dependent on weather conditions, particularly over the peak holiday periods.
An extended period of good or poor weather over the summer period can significantly affect both the peak and average annual water consumption for any year. This high level of variability is illustrated in the graph below, with annual MDMM water consumption exhibiting variations of more than 40% over the period considered, and as such it is extremely difficult to define any long term trends.
Whilst the most recent development is of a new hotel facing the waterfront, the trend graph of Figure 7.2 shows there is adequate capacity for growth. The largest challenge is catering for the peak demand over the Christmas-New Year’s holiday period as shown in Figures 7.3 and 7.4 below:
0
50
100
150
200
250
300
350
400
450
500
Ave
erag
e m
3 p
er m
on
th
Kāwhia Average Water Consumption per Month Average m3 per month
Figure 7.4 – Kāwhia Average Water Consumption Per Month
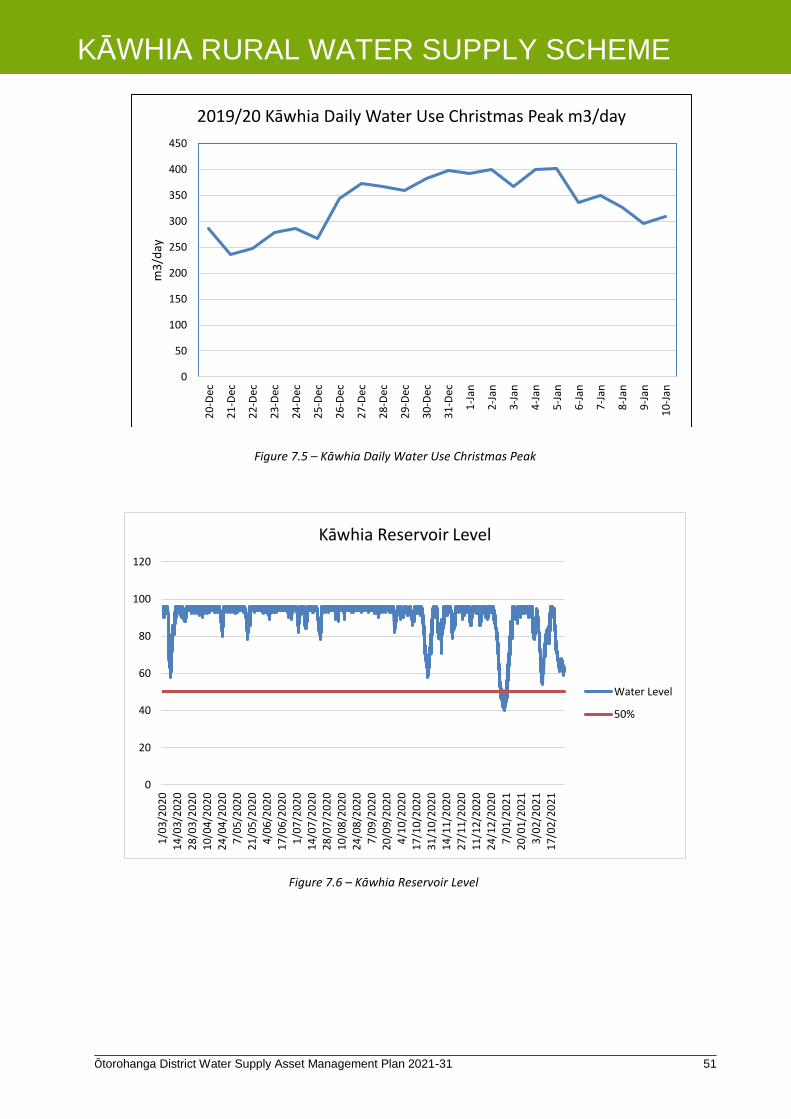
Ōtorohanga District Water Supply Asset Management Plan 2021-31 51
KĀWHIA RURAL WATER SUPPLY SCHEME
0
50
100
150
200
250
300
350
400
450
20
-Dec
21
-Dec
22
-Dec
23
-Dec
24
-Dec
25
-Dec
26
-Dec
27
-Dec
28
-Dec
29
-Dec
30
-Dec
31
-Dec
1-J
an
2-J
an
3-J
an
4-J
an
5-J
an
6-J
an
7-J
an
8-J
an
9-J
an
10
-Jan
m3
/day
2019/20 Kāwhia Daily Water Use Christmas Peak m3/day
0
20
40
60
80
100
120
1/0
3/2
02
01
4/0
3/2
02
02
8/0
3/2
02
01
0/0
4/2
02
02
4/0
4/2
02
07
/05
/20
20
21
/05
/20
20
4/0
6/2
02
0
17
/06
/20
20
1/0
7/2
02
0
14
/07
/20
20
28
/07
/20
20
10
/08
/20
20
24
/08
/20
20
7/0
9/2
02
02
0/0
9/2
02
04
/10
/20
20
17
/10
/20
20
31
/10
/20
20
14
/11
/20
20
27
/11
/20
20
11
/12
/20
20
24
/12
/20
20
7/0
1/2
02
12
0/0
1/2
02
13
/02
/20
21
17
/02
/20
21Kāwhia Reservoir Level
Water Level
50%
Figure 7.5 – Kāwhia Daily Water Use Christmas Peak
Figure 7.6 – Kāwhia Reservoir Level
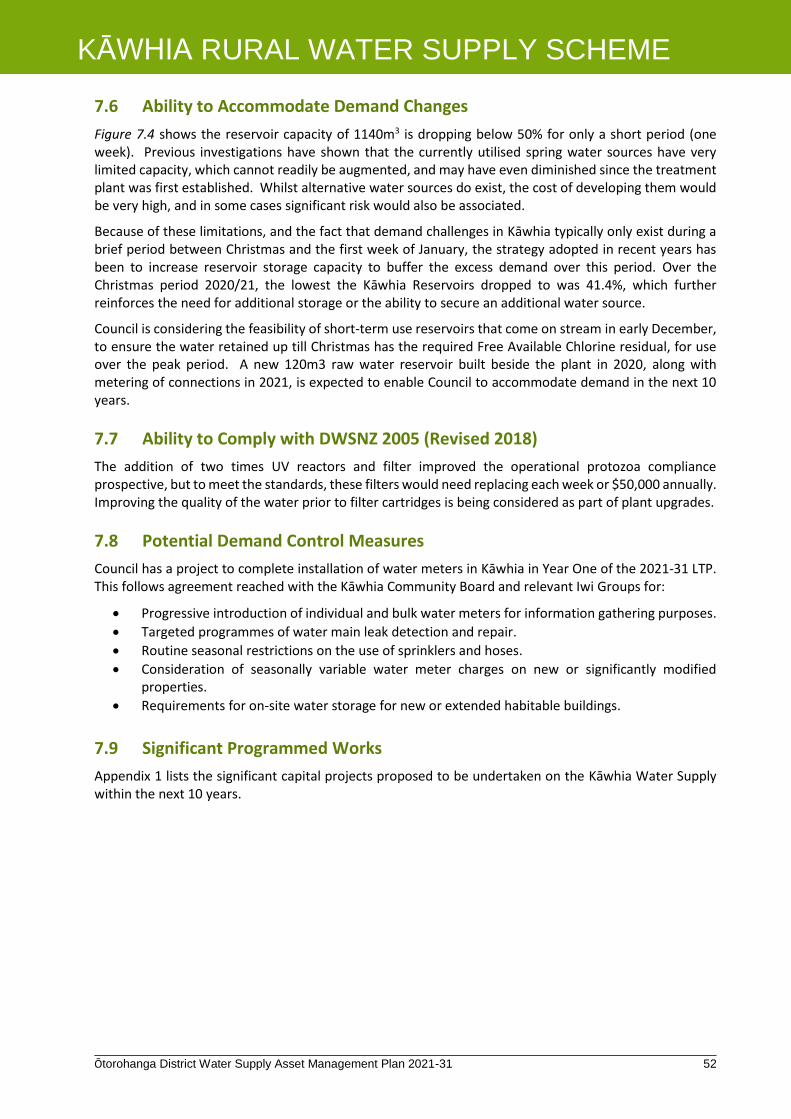
Ōtorohanga District Water Supply Asset Management Plan 2021-31 52
KĀWHIA RURAL WATER SUPPLY SCHEME
7.6 Ability to Accommodate Demand Changes
Figure 7.4 shows the reservoir capacity of 1140m3 is dropping below 50% for only a short period (one week). Previous investigations have shown that the currently utilised spring water sources have very limited capacity, which cannot readily be augmented, and may have even diminished since the treatment plant was first established. Whilst alternative water sources do exist, the cost of developing them would be very high, and in some cases significant risk would also be associated.
Because of these limitations, and the fact that demand challenges in Kāwhia typically only exist during a brief period between Christmas and the first week of January, the strategy adopted in recent years has been to increase reservoir storage capacity to buffer the excess demand over this period. Over the Christmas period 2020/21, the lowest the Kāwhia Reservoirs dropped to was 41.4%, which further reinforces the need for additional storage or the ability to secure an additional water source.
Council is considering the feasibility of short-term use reservoirs that come on stream in early December, to ensure the water retained up till Christmas has the required Free Available Chlorine residual, for use over the peak period. A new 120m3 raw water reservoir built beside the plant in 2020, along with metering of connections in 2021, is expected to enable Council to accommodate demand in the next 10 years.
7.7 Ability to Comply with DWSNZ 2005 (Revised 2018)
The addition of two times UV reactors and filter improved the operational protozoa compliance prospective, but to meet the standards, these filters would need replacing each week or $50,000 annually. Improving the quality of the water prior to filter cartridges is being considered as part of plant upgrades.
7.8 Potential Demand Control Measures
Council has a project to complete installation of water meters in Kāwhia in Year One of the 2021-31 LTP. This follows agreement reached with the Kāwhia Community Board and relevant Iwi Groups for:
Progressive introduction of individual and bulk water meters for information gathering purposes.
Targeted programmes of water main leak detection and repair.
Routine seasonal restrictions on the use of sprinklers and hoses.
Consideration of seasonally variable water meter charges on new or significantly modified properties.
Requirements for on-site water storage for new or extended habitable buildings.
7.9 Significant Programmed Works
Appendix 1 lists the significant capital projects proposed to be undertaken on the Kāwhia Water Supply within the next 10 years.
Ōtorohanga District Water Supply Asset Management Plan 2021-31 53
TIHIROA RURAL WATER SUPPLY SCHEME
8.0 Tihiroa Rural Water Supply Scheme
8.1 Description
The Tihiroa Rural Water Scheme and treatment plant serves the Tihiroa community and the scheme details and plant schematic is shown below:
Table 8.1: Technical Description of Tihiroa Rural Water Scheme
Date Commissioned 1986
Water Source Wāipa River
Properties Connected 35
Significant Connected Properties
None
Metered Connections 55 (serving all connected properties)
Population Served Circa 400 (majority of water used for farm stock)
Maximum Consent Water Take Quantity
1,500m³ May to October and 1,778m³ for the remainder of the year
Water Use Quantities (approximate) (based on data from year 2019/20)
Mean - 819m3/day Mean day, max month – 1,174m3(Feb) Max day - 1,402m3 (Feb)
Treatment Process Summary
River source, clarification, rapid sand filtration, chlorine disinfection. Minor automation, with telemetric monitoring of operational parameters.
Treatment Plant Design Capacity
1,800m3/day
Supply Type Trickle Feed supply with 24 hours on-site storage, air-gap or other approved backflow protect at each property
Pressure Systems Combined rising/falling main to storage, gravity/pumped pressure supply
Storage Capacity (shared)
400m3, = 8 hours at MDMM demand
Extent of Reticulation 34.6km of AC, MDPE and PVC pipes, 15 to 125mm diameter
Relevant Resource Consents
RC114845 (Surface water take – expiry date 1 July 2026); RC121172 – expiry date 1 July 2026); RC114846 (Backwash water discharge – expiry date 1 July 2026)
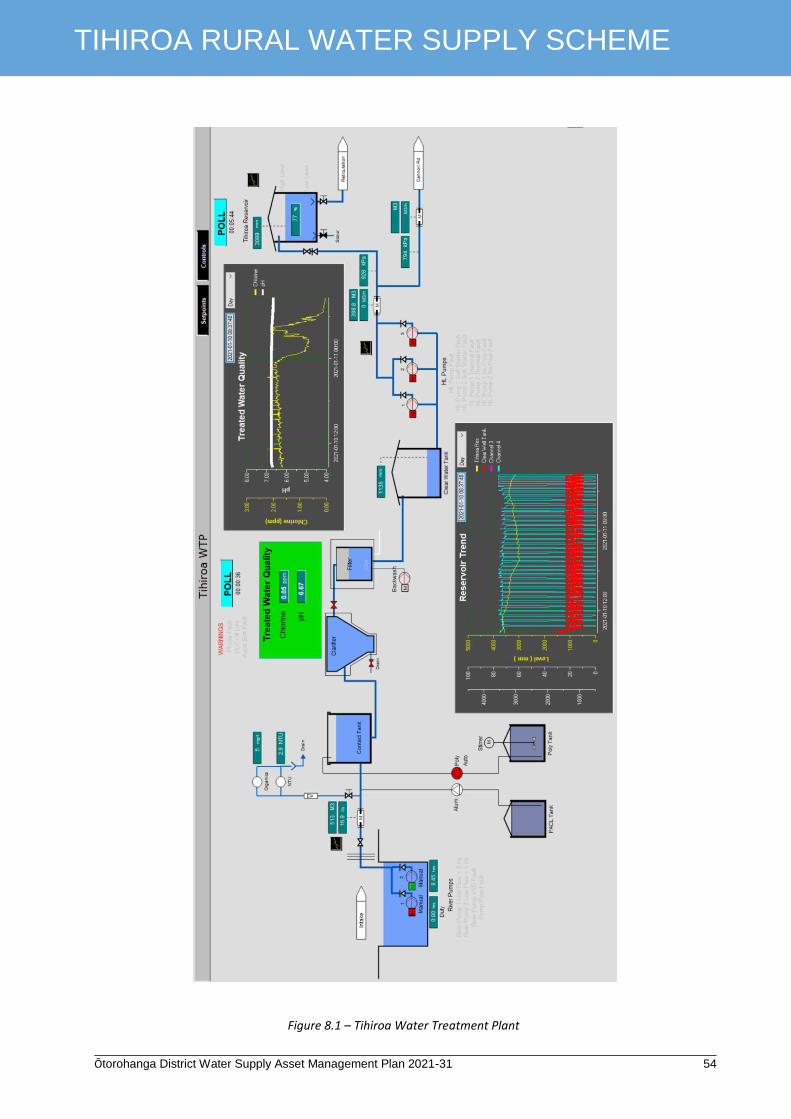
Ōtorohanga District Water Supply Asset Management Plan 2021-31 54
TIHIROA RURAL WATER SUPPLY SCHEME
Figure 8.1 – Tihiroa Water Treatment Plant

Ōtorohanga District Water Supply Asset Management Plan 2021-31 55
TIHIROA RURAL WATER SUPPLY SCHEME
8.2 Condition
The condition of water treatment equipment is variable, whilst reticulation assets are generally in good condition.
Reticulation failures are rare, though there is a 2km section of piping that has been under-specified for its potential working pressure, and may fail if pressures are not appropriately managed. In recent times however such effective pressure management has been achieved, (pressure reducing valve has been recently overhauled), and replacement of this section of pipe is therefore not planned.
Figure 8.2 – Tihiroa Water Supply Area

Ōtorohanga District Water Supply Asset Management Plan 2021-31 56
TIHIROA RURAL WATER SUPPLY SCHEME
A projection of required equipment renewal costs for the Tihiroa Scheme for the next 30 years is presented below, based on existing asset inventory data:
Figure 8.3 – Tihiroa Water Annual Renewal Cost Trend
Almost all of this renewal expenditure is for components of the treatment plant since no substantial reticulation renewals are expected to be required until after 2060.
Because of issues described in the following sections, the presented renewal profile may not reflect actual costs since there is a possibility that the treatment plant will have to be very substantially upgraded or even completely replaced, for full DWSNZ compliance to be achieved.
8.3 Performance
Whilst there is no Water Safety Plan for the Tihiroa RWS, 2019 performance in relation to public health is summarised below:
Manual monitoring results for E. coli, Free Available Chlorine Equivalent (FACE) and turbidity showed bacterial compliance for the treatment plant was not met.
Protozoa compliance was not demonstrated, due to lack of monitoring data.
For the reticulation, monitoring results for E. coli showed bacterial compliance was achieved.
There were precautionary boil water notices on the Tihiroa supply due to elevated turbidity events between 30th July 2019 until 6th August 2020, 27th November 2019 until 23rd December 2019 and 30th July 2020 until 6th August 2020. The DWA was consulted and kept informed at all times.
Development of a WSP for this supply is encouraged.
8.4 Risk Assessment
The variability in turbidity and lack of monitoring data for protozoa mean this supply is considered a high risk if used as a drinking water supply. Substantial changes to the treatment process or the function of the scheme would be required to solve this.
0
100,000
200,000
300,000
400,000
500,000
600,000
20
22
20
23
20
24
20
25
20
26
20
27
20
28
20
29
20
30
20
31
20
32
20
33
20
34
20
35
20
36
20
37
20
38
20
39
20
40
20
41
20
42
20
43
20
44
20
45
20
46
20
47
20
48
20
49
20
50
TIHIROA ANNUAL RENEWAL COST COMPARISON
2021 2018
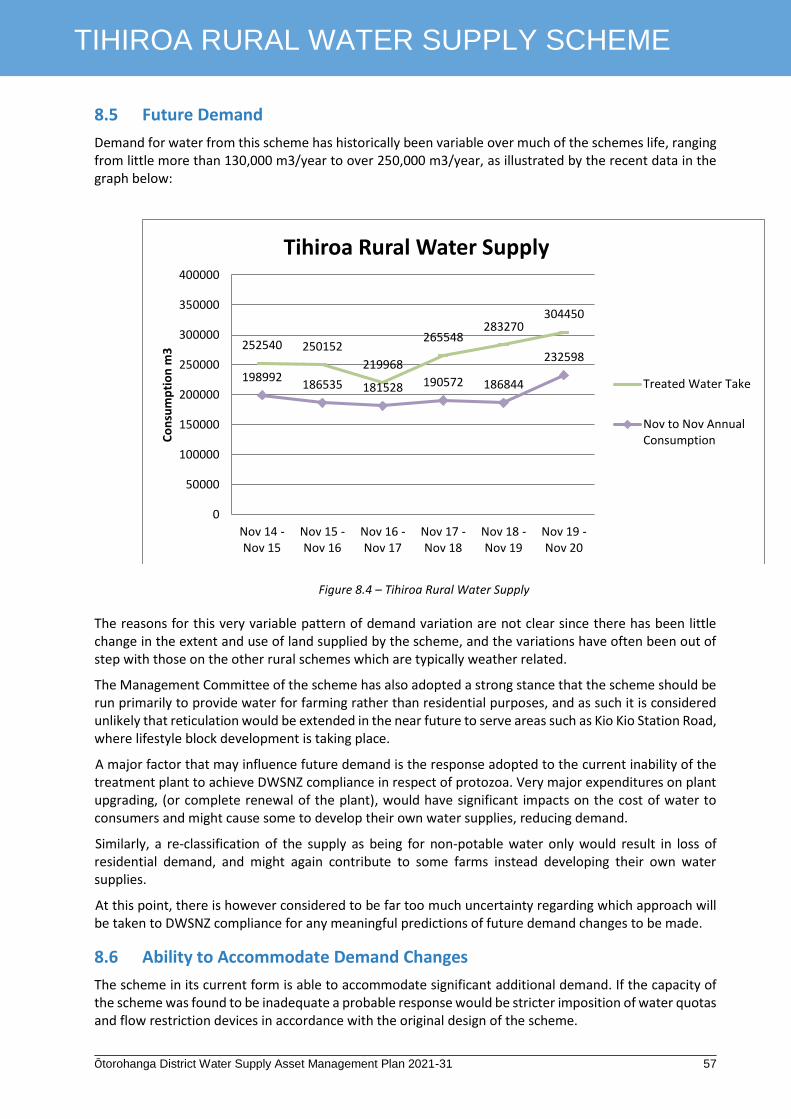
Ōtorohanga District Water Supply Asset Management Plan 2021-31 57
TIHIROA RURAL WATER SUPPLY SCHEME
8.5 Future Demand
Demand for water from this scheme has historically been variable over much of the schemes life, ranging from little more than 130,000 m3/year to over 250,000 m3/year, as illustrated by the recent data in the graph below:
Figure 8.4 – Tihiroa Rural Water Supply
The reasons for this very variable pattern of demand variation are not clear since there has been little change in the extent and use of land supplied by the scheme, and the variations have often been out of step with those on the other rural schemes which are typically weather related.
The Management Committee of the scheme has also adopted a strong stance that the scheme should be run primarily to provide water for farming rather than residential purposes, and as such it is considered unlikely that reticulation would be extended in the near future to serve areas such as Kio Kio Station Road, where lifestyle block development is taking place.
A major factor that may influence future demand is the response adopted to the current inability of the treatment plant to achieve DWSNZ compliance in respect of protozoa. Very major expenditures on plant upgrading, (or complete renewal of the plant), would have significant impacts on the cost of water to consumers and might cause some to develop their own water supplies, reducing demand.
Similarly, a re-classification of the supply as being for non-potable water only would result in loss of residential demand, and might again contribute to some farms instead developing their own water supplies.
At this point, there is however considered to be far too much uncertainty regarding which approach will be taken to DWSNZ compliance for any meaningful predictions of future demand changes to be made.
8.6 Ability to Accommodate Demand Changes
The scheme in its current form is able to accommodate significant additional demand. If the capacity of the scheme was found to be inadequate a probable response would be stricter imposition of water quotas and flow restriction devices in accordance with the original design of the scheme.
252540 250152
219968
265548283270
304450
198992186535 181528 190572 186844
232598
0
50000
100000
150000
200000
250000
300000
350000
400000
Nov 14 -Nov 15
Nov 15 -Nov 16
Nov 16 -Nov 17
Nov 17 -Nov 18
Nov 18 -Nov 19
Nov 19 -Nov 20
Co
nsu
mp
tio
n m
3
Tihiroa Rural Water Supply
Treated Water Take
Nov to Nov AnnualConsumption

Ōtorohanga District Water Supply Asset Management Plan 2021-31 58
TIHIROA RURAL WATER SUPPLY SCHEME
A more significant concern for this scheme would be the potential for a significant decrease in demand to the levels previously seen in 2001/2 and 2008/9. If this was to occur a significant increase in water charges could be required, particularly if the decline in demand shortly followed a significant investment in plant upgrading.
There is surplus supply available for around nine months every year; however, during the summer season peak demand is limited by low flow water take parameters and as such there is no surplus capacity at this time.
8.7 Ability to Comply with DWSNZ 2005 (Revised 2018)
The Wāipa River at Tihiroa is considered to be a higher risk source and as such substantial additional treatment processes might be required to accumulate the necessary treatment log credits.
The plant in its current form has proved unable to treat water to the very low levels of turbidity required for effective control of protozoa, investigations undertaken by CH2M Beca Consultants three years ago indicated that major upgrading is required at a cost of approximately $800,000, and that a possible better approach with a high level of confidence of a positive outcome might be to construct and entirely new treatment plant at a cost of between $2.2 and $2.4 million if the entire supply was to meet DWSNZ. A more pragmatic plant design that dealt with drinking water for houses is expected to be $1.2m
An alternative option that had been previously considered was to achieve compliance through small 'point of use' treatment units, comprising cartridge filters and UV treatment units at every place where water is potentially consumed by humans.
However, there are challenges with maintaining such units to ensure their consistent effective operation would be extremely difficult, and would be reliant in the water supplied having low turbidity, which it does not.
Another option that remains is to limit the supply of water from the scheme to non-potable agricultural purposes only, as has been done for the Ranginui scheme. This would require property owners to provide alternative potable supplies for houses and other places where water might be consumed by people.
8.8 Alternative Supply Options
A number of potential alternatives to supply of water from the existing scheme have been considered as follows:
Individual Supplies
Development of individual water supply systems generally based upon groundwater and/or roof water for household supply is possible, and adequate groundwater supplies are known to be available in this area.
Development of individual water supplies is however not favoured from an environmental health perspective, since it is unlikely that the water from such supplies would be subject to high standards of quality assurance.
Use of Groundwater Source
Substitution of a groundwater source for the existing river intake has previously been considered because of the potential benefits associated with reducing the high levels of turbidity variation that is found in the river. It is believed that a suitable relatively shallow source could be found in relatively close proximity to the existing treatment plant.
Supply of Water from Ōtorohanga
Supplying the existing reticulated Tihiroa RWS area using water from an upgraded Ōtorohanga/Wāipa treatment station is an option that would appear to have potential benefits in terms of simplifying management and reducing risks.

Ōtorohanga District Water Supply Asset Management Plan 2021-31 59
TIHIROA RURAL WATER SUPPLY SCHEME
Such supply would however require commissioning of at least 9km of new 150mm diameter main to link the Ōtorohanga and Tihiroa schemes in addition to the cost of increasing the capacity of the Ōtorohanga treatment plant, and it is likely that the high associated cost will preclude this option at this time.
This approach might, however, be worthy of consideration in the future when very major renewal is required of the Ōtorohanga plant, but that is currently believed to be many years in the future.
8.9 Significant Programmed Works
Appendix 1 lists the significant capital projects proposed to be undertaken on the Kāwhia Water Supply within the next 10 years:

Ōtorohanga District Water Supply Asset Management Plan 2021-31 60
AROHENA RURAL WATER SUPPLY SCHEME
9.0 Arohena Rural Water Supply Scheme
9.1 Description
The Arohena RWS scheme consists of three separate water supplies, (Kahorekau, Huirimu and Taupaki), serving rural areas in the east of the District. Because these supplies are considered together for administrative and financial purposes, relevant information will be presented within a single section in this Asset Management Plan.
The areas served by the individual supplies are shown in the following maps. All of the Arohena water supplies were commissioned in 1982 and source water from small rocky streams flowing from predominantly native bush catchments. All supplies employ rapid sand filtration and chlorine disinfection.
All of the scheme supplies water on a trickle feed basis into tanks with 24 hours’ on-site storage capacity, which are separated from the supply reticulation by an air-gap or other approved backflow protection device.
An outline technical description of the supplies within the Arohena scheme is presented in the table below:
Table 9.1: Technical Description of Arohena Rural Water Scheme
Kahorekau Huirimu Taupaki
Water Source (Stream) Manga Kouma Makomako Mangare
Properties Connected 13 14 7
Metered Connections 33 30 9
Population Served (approx) 130 120 20
Water Take Quantity: Maximum Actual (m3/day) Consent (m3/day) Consent as % of Q5
950 985
Circa 50
900 925 15
117 150 >50
Water Supply Quantities: Mean (m3/day) Mean Day, Max Month (m3/day) Max Day (based on year 2019/20)
753
1,074 (Mar) 1,397 (Feb)
591
698 (Feb) 909 (Feb)
65
111 (Mar) 141 (Feb)
Treatment Plant Design Capacity (m3/day)
1,037 1,037 216
Storage Capacity (m3) 350 860 40
Extent of Reticulation (km) 27.7 24.6 9.8
Reticulation Diameter (mm) 25 to 150 25 to 125 25 to 100
Ministry of Health Grading – Water Source & Treatment Plant
Ungraded Ungraded Ungraded
Relevant Resource Consents Water Take RC136074.02
Water Use RC136074.01
Expires 31/08/51
Water Use RC136074.01 Water Take
RC136074.02 Expires
31/08/51
Water Take RC136074.02
Water Use RC136074.01
Expires 31/08/51
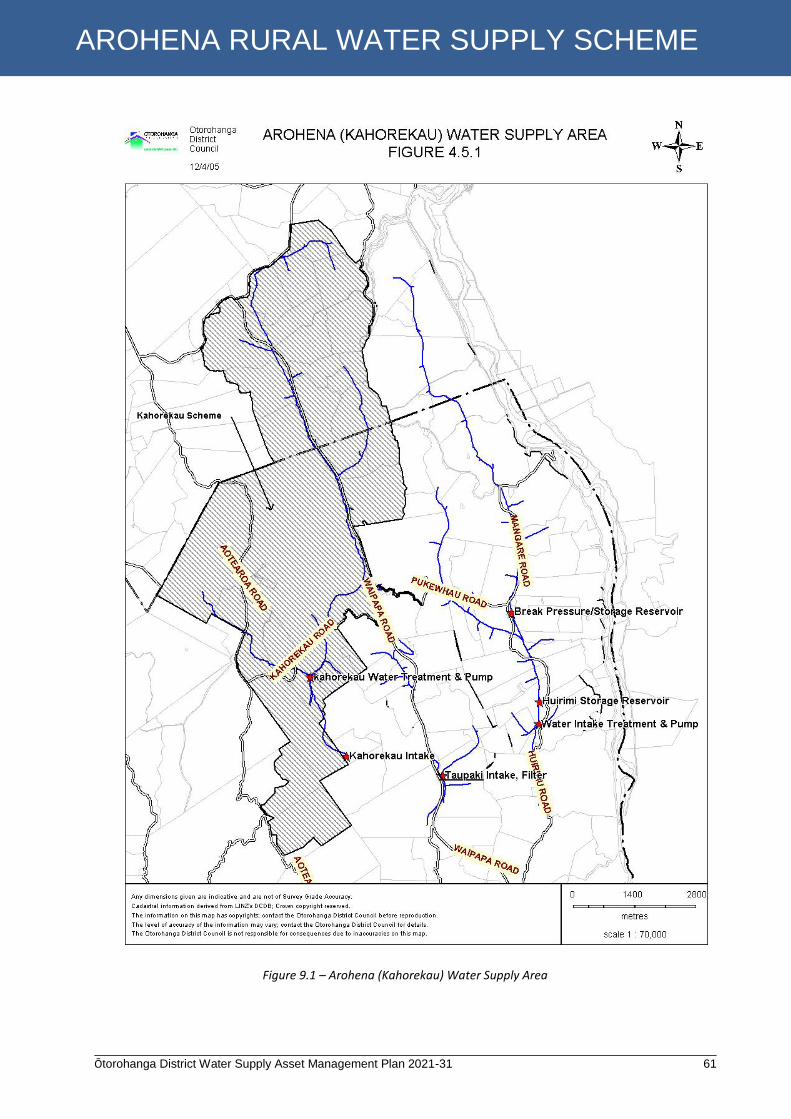
Ōtorohanga District Water Supply Asset Management Plan 2021-31 61
AROHENA RURAL WATER SUPPLY SCHEME
Figure 9.1 – Arohena (Kahorekau) Water Supply Area
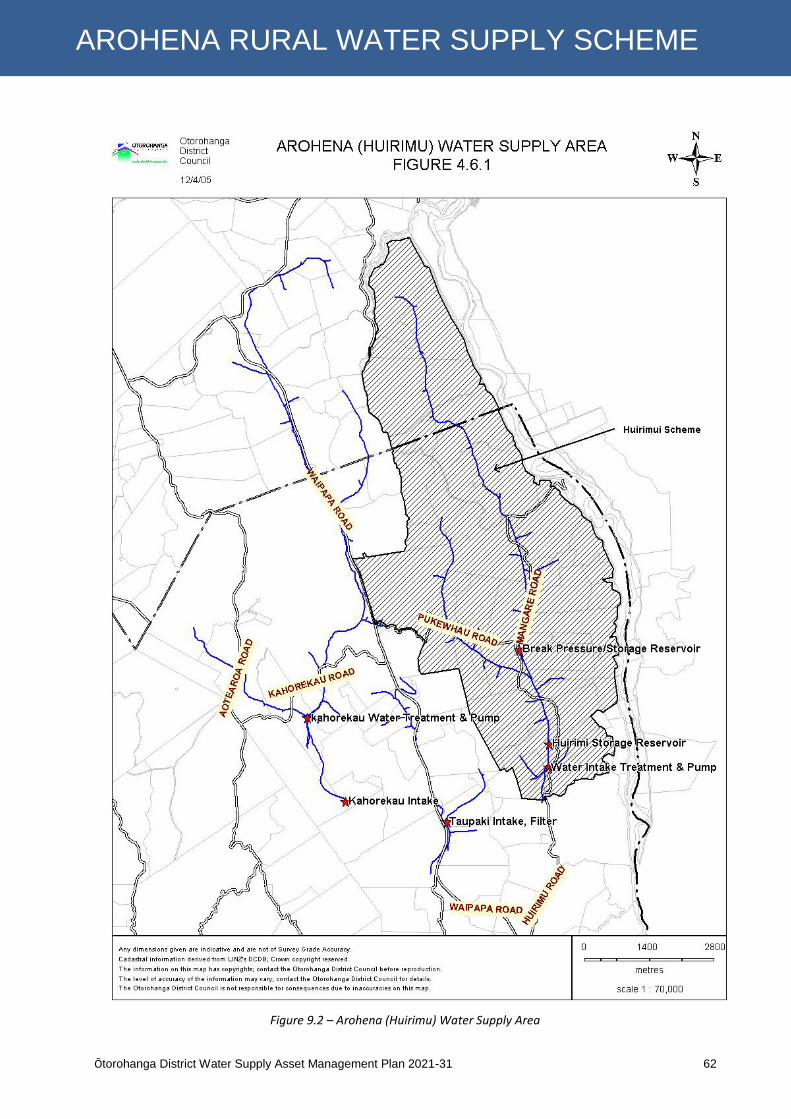
Ōtorohanga District Water Supply Asset Management Plan 2021-31 62
AROHENA RURAL WATER SUPPLY SCHEME
Figure 9.2 – Arohena (Huirimu) Water Supply Area
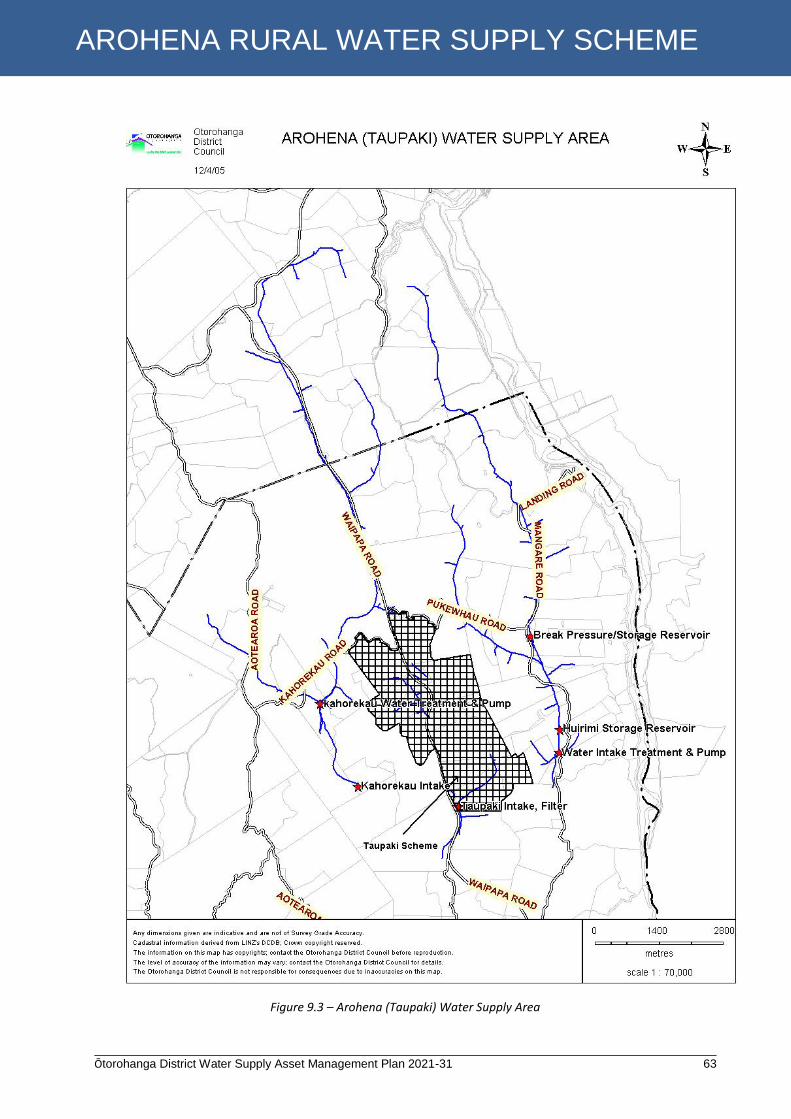
Ōtorohanga District Water Supply Asset Management Plan 2021-31 63
AROHENA RURAL WATER SUPPLY SCHEME
Figure 9.3 – Arohena (Taupaki) Water Supply Area

Ōtorohanga District Water Supply Asset Management Plan 2021-31 64
AROHENA RURAL WATER SUPPLY SCHEME
9.2 Condition
The scheme is not particularly old and its assets are generally in very good condition. Reticulation failures, (including those resulting from accidental damage), are very rare, and little need to reticulation renewal is expected before 2060.
As such, the required renewals in the shorter term are mainly limited to water treatment and storage equipment and water meters. A projection of such required equipment renewal costs for the Arohena schemes over the next 30 years is presented below:
Figure 9.4 – Arohena Water Annual Renewal Cost Trend
As was the case for the other rural water supplies, virtually all of the renewal costs over the next 30 years are for plant items, as the reticulation is little more than half way through its expected life.
As was the case for the Tihiroa RWS, the presented renewal profile may not reflect actual costs since there is a possibility that the treatment plants will have to be very substantially upgraded or even completely replaced for full DWSNZ compliance to be achieved.
9.3 Performance
There are three separate water supplies which make up the Arohena water supply. They are referred to by their treatment plant names - Huirimu, Kahorekau and Taupaki/Arohena.
Manual monitoring results at the treatment plants for E. coli, Free Available Chlorine Equivalent (FACE) and turbidity showed bacterial compliance with the DWSNZ. However, protozoa compliance was not met as there is no effective treatment to inactivate or remove protozoa and no monitoring data was provided.
Development of a WSP for this supply is encouraged.
The systems within the scheme are largely reliant on gravity for flow, resulting in low power costs and efficient operation. The only regular operational performance issues are blockages of the water intake structures, associated reticulation and/or the sand filter by silt and other water borne debris arising from very heavy rainfall in the steep, bush clad catchments. This has in the past resulted in both regular brief
0
100,000
200,000
300,000
400,000
500,000
600,000
700,000
800,000
20
22
20
23
20
24
20
25
20
26
20
27
20
28
20
29
20
30
20
31
20
32
20
33
20
34
20
35
20
36
20
37
20
38
20
39
20
40
20
41
20
42
20
43
20
44
20
45
20
46
20
47
20
48
20
49
20
50
AROHENA ANNUAL RENEWAL COST COMPARISON
2021 2018

Ōtorohanga District Water Supply Asset Management Plan 2021-31 65
AROHENA RURAL WATER SUPPLY SCHEME
interruptions of supply, (typically due to the sand filter requiring additional backwashing), and also some more extended loss of service when the intake structure and pipes have required substantial cleaning. These problems have been most pronounced on the Kahorekau supply.
9.4 Risk Assessment
Where RWS users do not have adequate on site storage for their peak demands, the cumulative demand can either cause a breach of the relevant resource consents covering abstraction limits, or create backflow issues if their connections are not in compliance with Councils requirements. Compliance with consents is generally satisfactory after the consent to take water for the Kahorekau scheme was revised to increase the permitted take.
9.5 Future Demand
Whilst the three individual water supplies within the Arohena scheme have displayed quite variable annual consumption, when considered as a whole, the scheme has a much better defined and more consistent recent trend in respect of water use, as can be seen from the graphs below.
Since the scheme was commissioned there has been progressive conversion of dry stock farms to dairy units, with resultant increases in water consumption.
Figure 9.5 – Arohena Scheme Annual Consumption – All Supplies
0
50000
100000
150000
200000
250000
300000
350000
400000
450000
500000
Co
nsu
mp
tio
n m
3
Arohena Rural Water Scheme
Nov Total
May Total
Annual Total
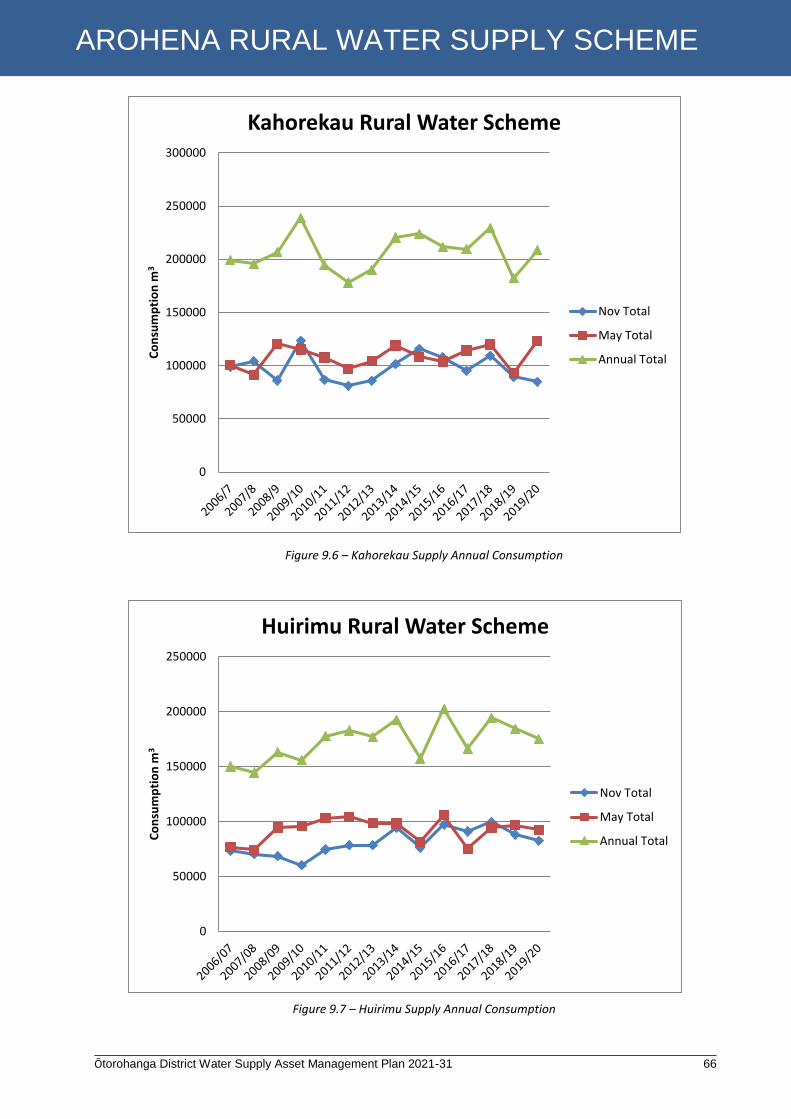
Ōtorohanga District Water Supply Asset Management Plan 2021-31 66
AROHENA RURAL WATER SUPPLY SCHEME
Figure 9.6 – Kahorekau Supply Annual Consumption
Figure 9.7 – Huirimu Supply Annual Consumption
0
50000
100000
150000
200000
250000
300000C
on
sum
pti
on
m3
Kahorekau Rural Water Scheme
Nov Total
May Total
Annual Total
0
50000
100000
150000
200000
250000
Co
nsu
mp
tio
n m
3
Huirimu Rural Water Scheme
Nov Total
May Total
Annual Total
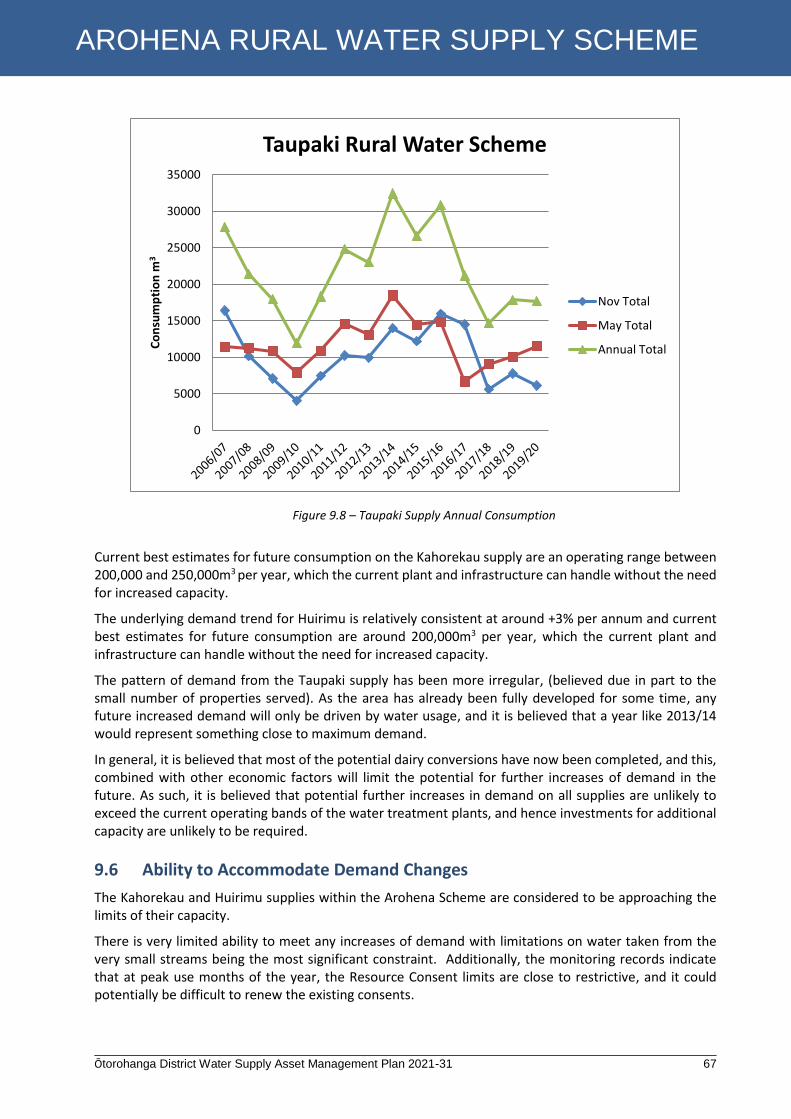
Ōtorohanga District Water Supply Asset Management Plan 2021-31 67
AROHENA RURAL WATER SUPPLY SCHEME
Figure 9.8 – Taupaki Supply Annual Consumption
Current best estimates for future consumption on the Kahorekau supply are an operating range between 200,000 and 250,000m3 per year, which the current plant and infrastructure can handle without the need for increased capacity.
The underlying demand trend for Huirimu is relatively consistent at around +3% per annum and current best estimates for future consumption are around 200,000m3 per year, which the current plant and infrastructure can handle without the need for increased capacity.
The pattern of demand from the Taupaki supply has been more irregular, (believed due in part to the small number of properties served). As the area has already been fully developed for some time, any future increased demand will only be driven by water usage, and it is believed that a year like 2013/14 would represent something close to maximum demand.
In general, it is believed that most of the potential dairy conversions have now been completed, and this, combined with other economic factors will limit the potential for further increases of demand in the future. As such, it is believed that potential further increases in demand on all supplies are unlikely to exceed the current operating bands of the water treatment plants, and hence investments for additional capacity are unlikely to be required.
9.6 Ability to Accommodate Demand Changes
The Kahorekau and Huirimu supplies within the Arohena Scheme are considered to be approaching the limits of their capacity.
There is very limited ability to meet any increases of demand with limitations on water taken from the very small streams being the most significant constraint. Additionally, the monitoring records indicate that at peak use months of the year, the Resource Consent limits are close to restrictive, and it could potentially be difficult to renew the existing consents.
0
5000
10000
15000
20000
25000
30000
35000
Co
nsu
mp
tio
n m
3Taupaki Rural Water Scheme
Nov Total
May Total
Annual Total
Ōtorohanga District Water Supply Asset Management Plan 2021-31 68
AROHENA RURAL WATER SUPPLY SCHEME
There are no other readily available surface water sources to provide a ‘top up’ supply, and whilst it might be possible to develop groundwater source(s) for this purpose, the feasibility of doing so has not yet been investigated.
Council has taken steps to control further increases in water consumption through re-installation of flow restrictors on individual properties to ensure that properties do not take substantially more water from the scheme than was allocated to them when the supplies were commissioned.
9.7 Ability to Comply with DWSNZ 2005 (Revised 2018)
None of the existing water treatment systems within the Arohena scheme can be easily modified to enable all of the water supplied to meet the requirements of the DWSNZ. The primary reason for this is the lack of flocculation / clarification processes that would enable sufficiently low turbidity to be achieved for implementation of effective protozoa controls.
As such, the Arohena supplies are in an even poorer position that the Tihiroa scheme with respect to achieving DWSNZ compliance. A study by CH2M Beca consultants, presented in their report ‘Arohena and Tihiroa Schemes Water Treatment Plants Protozoa Assessment’ dated 29 June 2017, (a copy of which is attached as Appendix 5), indicated that the existing treatment plants did not provide an adequate base for upgrading, and as such the other apparent means of achieving compliance would be construction of entirely new treatment plants.
As discussed in the section on the Tihiroa supply, the initially envisaged approach of utilising ‘point of use’ treatment units are not now considered viable due to the difficulty of maintaining the many units in an effective operating condition.
Costs of new treatment plants for the Huirimu and Kahorekau supplies have been estimated to be in the order of $2 million each, with a cost of around $1.5 million for the smaller Taupaki supply.
These are very significant figures for supplies where the large majority of water is used for non-potable purposes and the number of people within the supply area is relatively small.
As such, it appears probable that a more realistic approach may be to re-classify the scheme as a non-potable supply and limit the use of water to agricultural purposes, as has occurred on the Ranginui Scheme. Such a decision is however for the RWS committee to make.
9.8 Alternative Supply Options
The only practical alternative to the existing water supply arrangements, (or variations of them), is for currently connected properties to develop their own water supply systems, generally relying on bore water sources, since there are very limited surface water resources in the area. Some properties have already developed productive bores as back-up supplies.
Such individual supplies could either be used to reticulate entire properties or to augment the existing RWS supply.
9.9 Significant Programmed Works
Appendix 1 lists the significant capital projects proposed to be undertaken on the Kāwhia Water Supply within the next 10 years:

Ōtorohanga District Water Supply Asset Management Plan 2021-31 69
RANGINUI RURAL WATER SUPPLY SCHEME
10.0 Ranginui Rural Water Supply Scheme
10.1 Description
The Ranginui RWS scheme has been for stock water only since 2018, and serves the area shown overleaf. An outline technical description of the scheme is presented in the table below:
Table 10.1: Technical Description of Ranganui Rural Water Scheme
10.2 Condition
The scheme is not particularly old and its assets are generally in sound condition. A projection of required equipment renewal costs for the Ranginui scheme over the next 10 years follows, based on existing asset inventory data. Pipe replacement costs have not been included since no substantial reticulation renewals are expected to be required until after 2060.
Renewal costs are projected to be modest, with the only significant item being the renewal of the timber tank reservoir in 2022.
Date Commissioned 1982
Water Source Upper Wāipapa River
Properties Connected 16 meters, 6 properties
Population Served Nil - water used for farm stock only
Water Take Quantity Maximum Consented 864m3/day
Water Supply Quantities (approximate) - data based on year 2019/20
Mean - 469m3/day Mean day, max month - 511m3/day (Nov) Max day - 932m3 (27/28 Nov)
Treatment Process Summary Stream source, rapid sand filtration, and Chlorine disinfection. No significant automation or remote monitoring / control.
Treatment Plant Design Capacity 1,000m3/day
Supply Type Trickle Feed supply with 24 hours on-site storage, air-gap or other approved backflow protect at each property
Pressure Systems Generally pumped to storage, gravity feed to properties, but also pumped pressure supply to largest customer.
Storage Capacity (shared) 25m3 at Plant = 8 hours at MDMM demand
Worst Case Reticulation Failure Any significant failure of large trunk main has potential to drain reservoir before being detected
Extent of Reticulation 17.3km of PVC pipes, 20 to 100mm diameter
MoH Water Grading U (ungraded)
Relevant Resource Consents RC105489 (Water Take) – expiry date 31 July 2021 and new consent application submitted
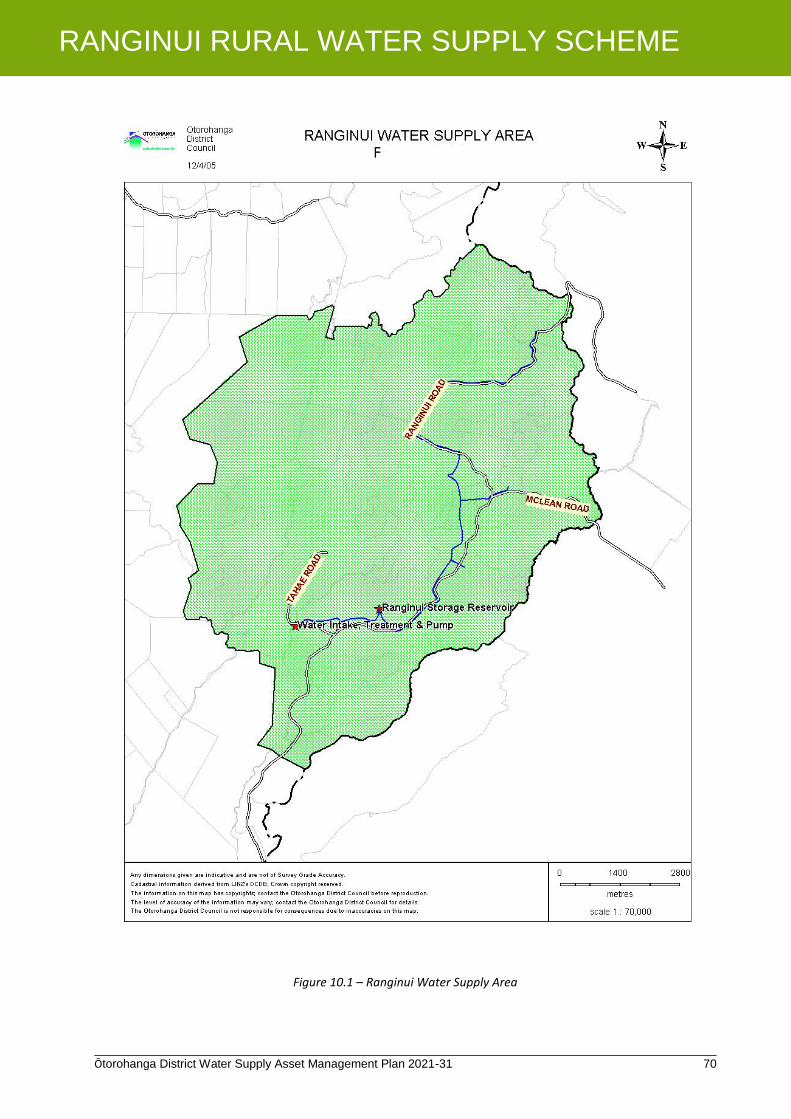
Ōtorohanga District Water Supply Asset Management Plan 2021-31 70
RANGINUI RURAL WATER SUPPLY SCHEME
Figure 10.1 – Ranginui Water Supply Area
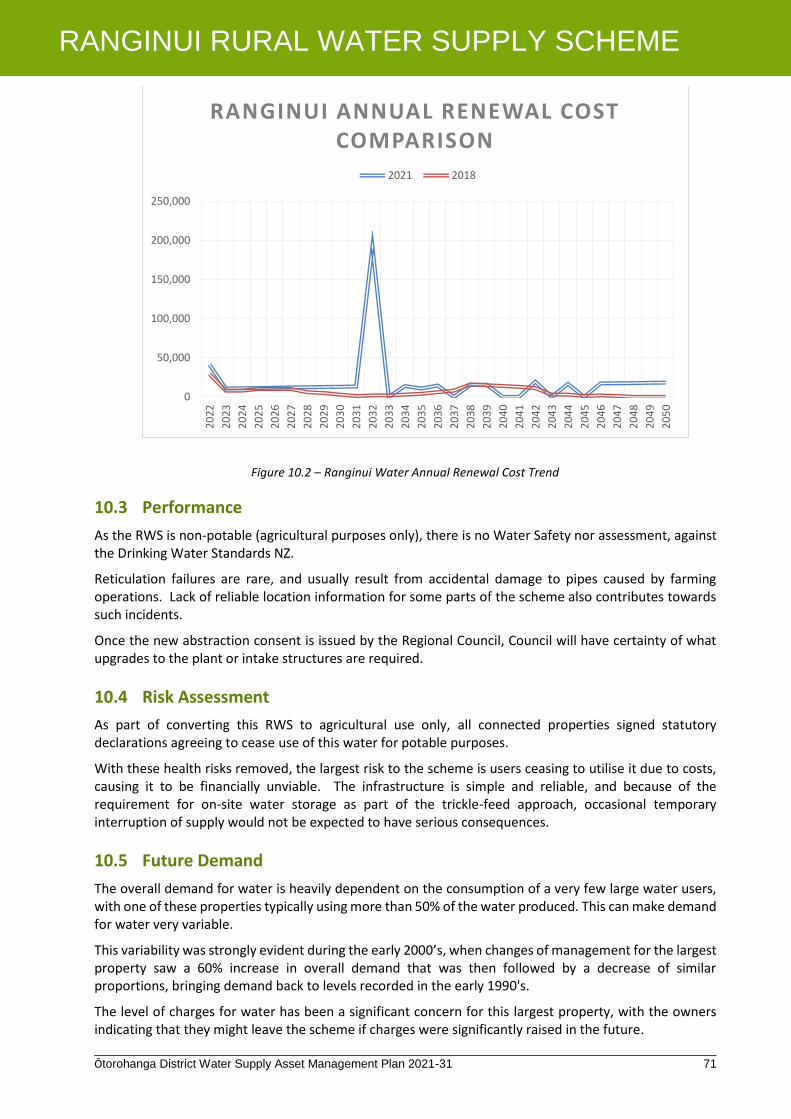
Ōtorohanga District Water Supply Asset Management Plan 2021-31 71
RANGINUI RURAL WATER SUPPLY SCHEME
Figure 10.2 – Ranginui Water Annual Renewal Cost Trend
10.3 Performance
As the RWS is non-potable (agricultural purposes only), there is no Water Safety nor assessment, against the Drinking Water Standards NZ.
Reticulation failures are rare, and usually result from accidental damage to pipes caused by farming operations. Lack of reliable location information for some parts of the scheme also contributes towards such incidents.
Once the new abstraction consent is issued by the Regional Council, Council will have certainty of what upgrades to the plant or intake structures are required.
10.4 Risk Assessment
As part of converting this RWS to agricultural use only, all connected properties signed statutory declarations agreeing to cease use of this water for potable purposes.
With these health risks removed, the largest risk to the scheme is users ceasing to utilise it due to costs, causing it to be financially unviable. The infrastructure is simple and reliable, and because of the requirement for on-site water storage as part of the trickle-feed approach, occasional temporary interruption of supply would not be expected to have serious consequences.
10.5 Future Demand
The overall demand for water is heavily dependent on the consumption of a very few large water users, with one of these properties typically using more than 50% of the water produced. This can make demand for water very variable.
This variability was strongly evident during the early 2000’s, when changes of management for the largest property saw a 60% increase in overall demand that was then followed by a decrease of similar proportions, bringing demand back to levels recorded in the early 1990's.
The level of charges for water has been a significant concern for this largest property, with the owners indicating that they might leave the scheme if charges were significantly raised in the future.
0
50,000
100,000
150,000
200,000
250,0002
02
2
20
23
20
24
20
25
20
26
20
27
20
28
20
29
20
30
20
31
20
32
20
33
20
34
20
35
20
36
20
37
20
38
20
39
20
40
20
41
20
42
20
43
20
44
20
45
20
46
20
47
20
48
20
49
20
50
RANGINUI ANNUAL RENEWAL COST COMPARISON
2021 2018

Ōtorohanga District Water Supply Asset Management Plan 2021-31 72
RANGINUI RURAL WATER SUPPLY SCHEME
There has, at various time, been discussion amongst scheme members of closing the scheme as the majority of the members appear to have alternative bore supplies which might potentially be more cost effective.
Because of this dependence on a few large properties, future demand behaviour is relatively difficult to predict, and it is believed that little can be inferred from historical demand data. There is potential for increasing demand to arise from more intensive farming, but there is also potential for substantial decreases in demand if one or more major customers should choose to leave the scheme and utilise other means of water supply.
Figure 10.3 – Ranginui Rural Water Scheme Annual Consumption
10.6 Ability to Accommodate Demand Changes
Increasing demand for water is not a concern for this scheme since the source, treatment plant and reticulation all have significant excess capacity at current levels of demand. Increasing demand would be beneficial for consumers since unit charges for water could be lowered.
Any significant decrease in demand could potentially be critical to the viability of the scheme, since it could trigger a ‘vicious circle’ of increasing water charges to meet relatively fixed costs and further reduced demand if properties chose to leave the scheme. Such a process could quickly lead to a situation where the scheme was no longer financially viable.
There is considered to be little scope for restructuring water charges to offer further incentives for large water users to continue taking water from the scheme. Appendix 1 lists the significant capital projects proposed to be undertaken on the Kāwhia Water Supply within the next 10 years.
0
20,000
40,000
60,000
80,000
100,000
120,000
140,000
160,000
180,000
200,000
Nov 14 -Nov 15
Nov 15 -Nov 16
Nov 16 -Nov 17
Nov 17 -Nov 18
Nov 18 -Nov 19
Nov 19 -Nov 20
Co
nsu
mp
tio
n m
3
Ranginui Rural Water Supply
Treated Water
Nov to NovAnnualConsumption

Ōtorohanga District Water Supply Asset Management Plan 2021-31 73
ASSET MANAGEMENT IMPROVEMENT PLAN
11.0 Asset Management Improvement Plan
Several items were identified in the past three water asset management plans related to improvements to be pursued in the following years, and these items are listed below as they are still relevant to ongoing progress in asset management. Where these previous objectives have been achieved is also noted.
11.1 Definition of Actions Required for DWSNZ 2005 (revised 2018) Compliance
In response to the Drinking-water assessor’s email of 13 October 2020, the following tasks from the Waikato District Health Board are considered a priority in 2020-22 (actions proposed are in red):
1. Addressing the lack of Protozoa treatment at Arohena water supply This continues to be a challenge for ODC, however with the Central Government Stimulus Package, ODC have planned to spend $750,000 on upgrading the Kahorekau Water Scheme. This will still leave Taupaki and Huirimu in the same state, but we are looking at combining Taupaki into Kahorekau / Huirimu, which is ultimately going to leave Arohena RWS in a complaint status. This illustrates ODC’s commitment to addressing the protozoa treatment in Arohena. Such upgrades have been proposed in the 2021/30 long term plan.
2. Providing Protozoa monitoring data for the Tihiroa Water Treatment Plant Included in the 20/21 Annual Plan, is the replacing the sand filter in Tihiroa. ODC have engaged NZ Commissioning to design the specs for the sand filter in preparation and this work is currently out for tender. Part of this specification is to include continuous turbidity monitoring on the outlet of the sand filter. This is designed to give compliant protozoa monitoring and provides the opportunity to obtain a further 1.0 log credits, (Section 5.8.1 DWNZ 2005), this may then bring Tihiroa up to Log 4. Further plant renewals and upgrades, including UV treatment are proposed in the 2021/30 long term plan which will ensure log 4 compliance.
3. Addressing the lack of compliance with the full year protozoa requirements for the Ōtorohanga Water Treatment Plant It is fair to say that the beginning of 2019/20 period the plant was still experiencing the flow on issues discovered in the 18/19 period, which were primarily rapid sand filter nozzles and under drain failures, plus a lack of a ripening systems (period of discharge to waste) on the filters after backwash. As shown in the last six months of the 19/20 period, these issues were addressed and reached full compliance. ODC have also made some changes to the critical set points so the plant automatically shuts down sending any water in the system to waste immediately any compliance levels are breached.
4. Addressing the turbidity exceedances at the Kāwhia Water Treatment Plant ODC have adjusted the critical set points in Kāwhia, which will address the turbidity issues by shutting the plant down should compliance levels be breached. Further automation is proposed including automating the process by installing additional process instrumentations and actuated valves.
5. Improving chlorine contact time (C.t) for the Wāipa Rural Water Scheme. The Provision of calculations and the associated monitoring data to confirm that the C.t value for chlorine contact is being met for the bacterial continuous monitoring for the Wāipa Distribution Zone has been implemented.
11.2 Continuing Emphasis on Collection of Work History Data
Recording of work history, (in particular pipe failures), within the asset management system is considered to have significant benefits and has recently been implemented in the day to day work flow systems. The goal over the forthcoming years is to build an accurate historical record of the maintenance, and feed this data into the condition assessment of the item in question and hence ensure that the renewals which take place are accurately prioritised. The desired outcome from this is continuity of services at the least possible cost. (Avoid costly emergency work due to unforeseen failure of equipment and infrastructure).

Ōtorohanga District Water Supply Asset Management Plan 2021-31 74
ASSET MANAGEMENT IMPROVEMENT PLAN
While on the flip side, this would also reduce the number of early renewals where assets still have significant useful life remaining.
11.3 Build Flow Model using Spatial Data on Pipes and Proposed Reservoirs
To help with ensuring the network pressure and levels of service are maintained as peak demand increases, a flow model is required. This will also help understand whether the replenishment rate in remote reservoirs is adequate to ensure the Free Available Chlorine (FAC) levels remain compliant. The nature and extent of this model is still under consideration and will be included in future planning and budgets but has not currently being included in the 2021/30 long term plan.