water services and the cape town urban water...
TRANSCRIPT
Page 1 of 40
WATER SERVICES AND THE CAPE TOWN URBAN WATER CYCLE March 2018
Page 2 of 40
TABLE OF CONTENTS
WATER SERVICES AND THE CAPE TOWN URBAN WATER CYCLE .......................... 3
1. EVAPORATION ...................................................................................................... 5
2. CONDENSATION ................................................................................................... 5
3. PRECIPITATION .................................................................................................... 6
4. OUR CATCHMENT AREAS ................................................................................... 7
5. CAPE TOWN’S DAMS ........................................................................................... 9
6. WHAT IS GROUNDWATER? ............................................................................... 17
7. SURFACE RUNOFFS .......................................................................................... 17
8. CAPE TOWN’S WATER TREATMENT WORKS ................................................. 18
9. CAPE TOWN’S RESERVOIRS ............................................................................ 23
10. OUR RETICULATION SYSTEMS ........................................................................ 27
11. CONSUMERS ....................................................................................................... 29
12. HOW WE TREAT WASTEWATER ....................................................................... 33
13. RE-USING TREATED WASTEWATER ................................................................ 38
14. MARINE OUTFALLS ............................................................................................ 39

Page 3 of 40
WATER SERVICES AND THE CAPE TOWN URBAN WATER CYCLE Learn more about water and sanitation services, and components of the Cape Town water cycle with our water cycle graphic. Simply match up the numbers on our graphic to the different stages of the water cycle. You can find a summary of these on the next page of this handbook.

Page 4 of 40
1. Evaporation Liquid water changes to gas, called water vapour, and rises in the air. Most of Cape Town’s water comes from water evaporating off the Atlantic Ocean. To find out more see EVAPORATION 2. Condensation As water vapour rises, it cools and condenses into clouds; clouds are made up of tiny droplets of liquid water or ice crystals. To find out more see CONDENSATION 3. Precipitation Rain, hail, snow and dew are all types of precipitation. In Cape Town, most precipitation falls as rain in the winter months. To find out more see PRECIPITATION 4. Catchment areas Rainfall is highest in the mountainous area around Cape Town. These pristine fynbos areas contribute to Cape Town’s excellent water quality. To find out more see OUR CATCHMENT AREAS 5. Dams Cape Town is supplied by 14 dams with a collection capacity of nearly 900 000 Ml. To find out more see CAPE TOWN’S DAMS 6. Groundwater Some rainwater seeps into the ground and becomes groundwater. The Atlantis, Cape Flats and Table Mountain Group aquifers are important underground water bodies in Cape Town, flowing between sand grains or other porous soil or rock. To find out more see WHAT IS GROUNDWATER? 7. Surface runoff Rainwater collects in the city’s stormwater system and streams, which feed into larger rivers and canals that flow to the seas. To find out more see SURFACE RUNOFFS 8. Water treatment works Water is purified and treated at 12 water treatment works to ensure that it is safe to drink. To find out more see CAPE TOWN’S WATER TREATMENT WORKS 9. Reservoirs 26 large reservoirs store treated drinking water before it is piped our homes and businesses. Faure Reservoir, the largest of these, can hold the equivalent of 250 Olympic swimming pools. To find out more see CAPE TOWN’S RESERVOIRS 10. Reticulation systems A network of reservoirs, pump stations and 20 0000 km of pipelines take drinking water (potable water) and wastewater to and from properties. To find out more see OUR RETICULATION SYSTEMS 11. Consumers Over 650 000 metered connections provide water to all houses, schools, hospitals, businesses, industries and other properties. To find out more see CONSUMERS 12. Wastewater treatment works Wastewater is treated at 17 treatment works and six smaller facilities before it is discharged into rivers and canals. To find out more see HOW WE TREAT WASTEWATER 13. Treated effluent re-use Recycled water is used for irrigation and industry. About 8% of Cape Town’s water is re-used by facilities such as schools, sports facilities and parks. The City also uses this water to irrigate the flower beds along Cape Town’s Integrated Rapid Transport (IRT) routes. To find out more see RE-USING TREATED WASTEWATER 14. Marine outfalls Three underwater pipelines discharge wastewater far into the sea where ocean currents safely dilute and carry effluent away from the shore. To find out more see MARINE OUTFALLS

Page 5 of 40
1. EVAPORATION Evaporation is the process where liquid water changes to water vapour, which is an invisible gas. It is water vapour that gives air its humidity, and air with a high humidity has lots of water vapour in it which can make it feel sticky and uncomfortable. Dry air, or air with a low humidity, can also be uncomfortable as it makes your skin feel dry. Evaporation is very important for weather systems. Without evaporation, clouds can’t form and without clouds, it cannot rain. Almost all the rain that falls in and around Cape Town comes from water vapour that has evaporated off the Atlantic Ocean far out to sea. It rises from the surface of the sea to form clouds and eventually falls as rain. Evaporation also occurs on land. When a small puddle of water dries or when clothes on a washing line dry – that is evaporation at work. Water evaporates from plants, the ground, rivers, dams and even from our skin. Most water evaporating from the land comes from plant leaves – this is called transpiration. Evaporation is faster when it is hot and slower when it is cold, which is why plants need more water in the summer.
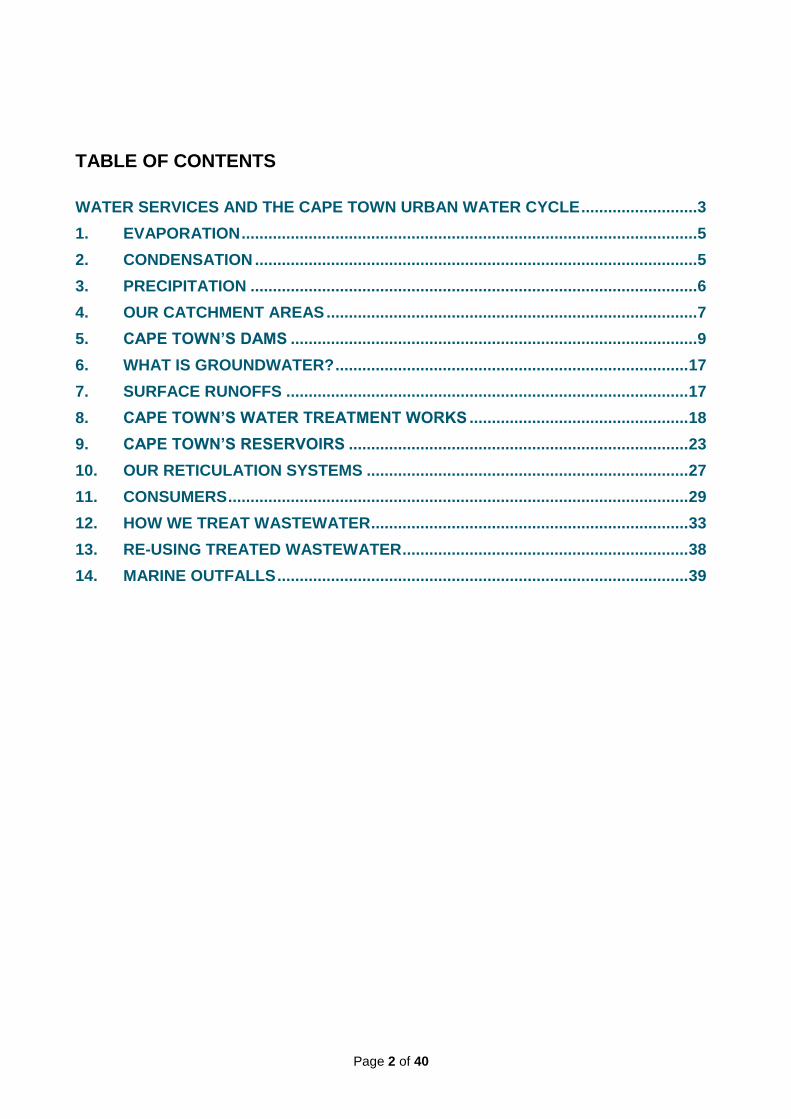
2. CONDENSATION Condensation is the process where water vapour (water in a gas form) changes to liquid water. Clouds, mist, fog, steam from a kettle or even the “steam” you see coming off an ice cream are all examples of condensation. Clouds or steam don’t look like liquid water, but they are made up of thousands of tiny water droplets. If you look carefully, you can actually see the water droplets. Condensation can also form on a solid surface like the inside of a window or on glasses. Water vapour condenses into liquid water when it is cooled. For example, hot water vapour coming out of a boiling kettle soon cools and condenses into steam. It is initially invisible when it is water vapour, but it
Page 6 of 40
becomes visible as soon as it condenses into steam. Another example of condensation is water vapour inside a warm room that suddenly cools when it comes into contact with the cold glass of a window. Condensation is the process that allows clouds to form. Moist air close to the ground or the surface of the sea is warmed by the sun, which causes it to expand and start to rise. Over the oceans, the warmth of the sea also helps to warm the layer of air closest to the sea surface. As warm air is lighter than cold air, it starts to rise in the same way as a hot air balloon rises. The air cools as it rises and the water vapour in the air condenses to form clouds. The condensation process releases energy, which helps to keep the rising pocket of air warmer than the surrounding air – sending it still higher.
3. PRECIPITATION Rain, hail, snow and dew are all types of precipitation. In Cape Town nearly all precipitation consists of rain and only very small amounts fall as hail or snow. Clouds contain thousands of tiny water droplets that are so small that they float in the air. However, as they bump into each other they join to form bigger droplets. Eventually, the droplets become too big and heavy to stay suspended in the air and fall as rain. Unlike most of South Africa, Cape Town receives its rain in winter during storms caused by cold fronts. June and July are the wettest months of the year. Close to 100 mm of rain falls in these months. December and January are the driest months and receive less than 20 mm per month. It is more difficult to save water in a winter rainfall area as people with gardens use lots of water for irrigation during our hot, dry and windy summers. On average, Cape Town receives approximately 500 mm of rain annually. However, this does not fall evenly over the greater Cape Town area because of the presence of the mountains. Rainfall is highest on or close to mountainous areas – often exceeding 2 000 mm per year. In contrast, other parts of the city such as the West Coast or Camps Bay only receive 300 mm per year. Clouds that form over the mountains when the south-east wind blows also contribute to precipitation. Table Mountain’s famous tablecloth

Page 7 of 40
dampens the top of the mountain and this precipitation helps to keep streams and springs flowing from the mountain throughout the year.
4. OUR CATCHMENT AREAS Cape Town’s main catchment areas are the mountain fynbos areas located to the east and north-east of the city, including the Hottentots Holland, Riviersonderend, Wemmershoek, Wellington, and Porterville mountain ranges. Table Mountain is also a catchment area although these days it contributes less than 1% of Cape Town’s total water supply. Wemmershoek catchment area

Page 8 of 40
Mountain fynbos catchment areas Rainfall is highest in these mountainous areas, often exceeding 2 000 mm per year. This is a significant amount considering that some parts of the city receive as little as 300 mm per year. Most rain falls during winter storms are caused by cold fronts. Moist air and clouds blown inland from the Atlantic are forced to rise over the mountains. This causes the air to cool and moisture to precipitate as rain and sometimes as hail or snow. The water drains into streams and rivers, and flows downhill towards the sea in rivers such as the Berg, Riviersonderend, Palmiet and Steenbras. Some of this water is captured and stored in dams that supply the Cape Town water system and the rest is returned to the rivers to sustain the river systems.
The pristine undeveloped nature of our catchment areas contributes to the excellent quality of the water we drink. However, Cape Town’s raw (untreated) water is tea-coloured from plant matter that is dissolved in the water, and is soft and acidic. This is corrected during the water treatment process. Traditionally approximately 98% of our water comes from dams. For this reason, our catchment areas need to be protected. Poor agricultural practices or urban development within catchment areas can have a negative effect on the quality of our water sources. Invasive alien plants consume more water than the indigenous fynbos and are a threat to our water resources. The Working for Water project helps to clear alien vegetation in our catchment areas and creates employment opportunities for local communities.

Page 9 of 40
Groundwater Most of our water is surface water (water collected from rivers and dams). However, usually approximately 2% of our drinking water comes from groundwater sources. Examples of these:
The area of Atlantis, which is supplied with water pumped from the Atlantis Aquifer. This is an underground water body that is formed between the sand grains of the sandy soil that occurs in the area. This water is pumped from boreholes at two well fields: one at Witzand near Atlantis and a smaller one near Silverstroom Strand.
Water that is pumped from boreholes along the Lourens River in Somerset West
Water that is sourced from the Albion Spring in Newlands The growing demand for water Until 1921, Cape Town was supplied exclusively with water from Table Mountain. However, as the city grew, this proved to be insufficient and water from further afield was sought. This led to the construction of the Steenbras dam above Gordon's Bay and a 63 km pipeline was needed to transfer the water to the city. Today, water is transferred from several other catchment areas, including those from the Berg, Riviersonderend and Palmiet rivers via an integrated supply system known as the Western Cape Water Supply System. This network consists of an intricate system of dams and pipelines managed either by the City of Cape Town or the National Department of Water and Sanitation. Additional water sources will be required as the city continues to grow. The Berg River-Voëlvlei Augmentation Scheme scheme has been earmarked as the most suitable next augmentation scheme. The scheme involves the diversion of surplus winter water from the Berg River for storage in the Voëlvlei Dam and has an estimated yield of 23 million m
3 per annum. Additional future water sources being considered
include:
sea water desalination;
water reclamation;
groundwater from the Table Mountain Group Aquifer – a large aquifer running under the Cape Fold Mountains;
diversion of the Lourens River; and
diversion of water from the Upper Wit and Molenaars rivers.
5. CAPE TOWN’S DAMS Cape Town is supplied by 14 dams with a collective capacity of approximately 900 000 Ml (900 000 000 000 litres). Most of this capacity is provided by six large dams: the Theewaterskloof, Voëlvlei, Berg River, Wemmershoek, and the Steenbras Upper and Lower dams. The remaining dams are much smaller and only contribute 0.4% to total capacity. The three largest dams are owned or managed by the National Department of Water and Sanitation. Until 1897, Cape Town relied on spring river water which usually reduced to a trickle in the summer months. This supply challenge changed with the construction of Cape Town’s first dam, the 954 Ml Woodhead Dam on Table Mountain. These days, the city has access to water storage of nearly 1 000 times greater capacity, provided by 14 dams, and is integrated into the wider Western Cape Supply System. Table Mountain dams: Woodhead Dam The Woodhead Dam was completed in 1897. It was one of the first dams to be built in the country. It is still in service and provides water to Camps Bay and the high-lying areas of the City Bowl.

Page 10 of 40
Woodhead Dam
Hely-Hutchinson Dam The water supply was augmented by the Hely-Hutchinson Dam which was completed seven years after Woodhead Dam opened. It was built upstream from Woodhead Dam and is also situated on Table Mountain’s Disa River. Both have masonry dam walls constructed of sandstone blocks which were carved out of the mountain by stonemasons. A small railway line and a cable car connecting the top of Kasteelspoort to Camps Bay were constructed to assist with the dams’ construction. A small waterworks museum, which includes the original locomotive, is located next to the dams.
Hely-Hutchinson Dam museum

Page 11 of 40
Water from these two dams is treated at the Kloofnek Water Treatment Plant. The water takes an interesting route to get there. First, it is released into the Disa River Gorge where it flows as a small river towards Hout Bay. Closer to Hout Bay, the water is fed through the 700 metre Woodhead Tunnel that runs through the Twelve Apostles mountains to the Camps Bay side. From there it is piped into cast iron pipes that run along the popular Pipe Track hiking trail to the Kloofnek Treatment Works. Hely-Hutchinson Dam Victoria, Alexandra and De Villiers dams The three other dams on Table Mountain are Victoria, Alexandra and De Villiers dams. Victoria Dam, completed in 1896, is Cape Town's oldest dam, although the original dam wall was subsequently raised. De Villiers Dam, completed in 1910, is the last to be built on Table Mountain. The dams are closer to the Constantia Nek side of the mountain and were the only water suppliers to the former Wynberg Municipality for many years. Water from these three dams is treated at the Constantia Nek Water Treatment Plant. De Villiers Dams

Page 12 of 40
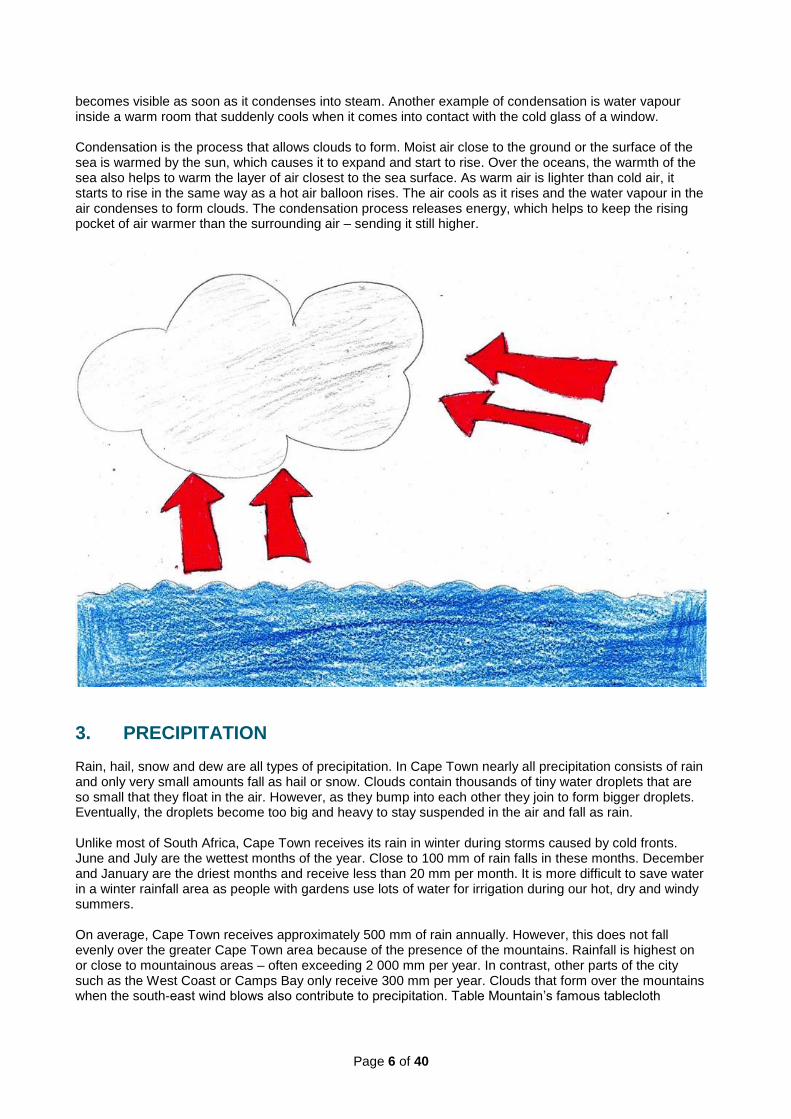
Steenbras dams: Steenbras Lower Dam Steenbras Lower Dam is located in the mountains above Gordon’s Bay and was completed in 1921. It was the first dam in Cape Town to be built at a remove from Table Mountain. The original Steenbras Water Scheme included an 820 m tunnel through the mountain to Gordon’s Bay and a 64 km cast iron pipe (750 mm in diameter) which linked the dam to the Molteno Reservoir in Oranjezicht. This project proved to be so expensive that the independent municipalities of Cape Town, Claremont, Green Point, Sea Point, Kalk Bay, Maitland, Mowbray,Rondebosch, Woodstock and, at a later stage, Wynberg, combined to form the Greater Cape Town Municipality in order to afford it. Further work included the building of a new, higher dam wall in 1926 and then raising it still higher in 1954. A second (1926) and third (1949) pipeline to Newlands Reservoir were also constructed. Steenbras Upper Dam The Steenbras Upper Dam was completed in 1977 and almost doubled the storage capacity on the Steenbras River. It is located just upstream of the Steenbras Lower Dam and can be seen from the N2 highway. In addition to storing water, the Steenbras Upper Dam also plays an important role in generating electricity as it forms the upper reservoir for the City of Cape Town’s Steenbras pumped storage scheme, the first such scheme to be built in Africa. Pump storage schemes are used to generate additional electricity in peak demand periods. During the night they use surplus electricity available on the national grid to pump water back up to the upper reservoir. Steenbras Upper Dam is also linked by an open canal and pipeline to the Rockview Dam that forms the upper reservoir of the Palmiet Pumped Storage Scheme, which is a separate pump storage scheme operated by Eskom and the Department of Water and Sanitation. The link allows water from the Palmiet River to be transferred to the dam.
Page 13 of 40
Steenbras Upper Dam Wemmershoek Dam Wemmershoek Dam was completed in 1957 and was the second of Cape Town’s dams to be constructed at a remove from Table Mountain. It is nearly double the capacity of Steenbras Lower Dam and is the largest dam owned by the City of Cape Town. In an engineering first in South Africa, it was constructed using a clay wall and rockfill embankment rather than a traditional masonry and cement dam wall, which significantly reduced the cost. The dam is in a beautiful setting in the Wemmershoek Mountains and contains very high quality water that requires relatively little treatment. Wemmershoek Dam

Page 14 of 40
Simon’s Town dams Simon’s Town is supplied by two small dams: the Kleinplaats and Lewis Gay dams. Following local government restructuring of 1997, Simon’s Town's water system has been connected to the wider City of Cape Town water system. Voëlvlei Dam Voëlvlei Dam is Cape Town’s second largest supply dam, even though it is not built on any major river. Instead, it is supplied with water from two canals that divert water from the Klein Berg, Leeu, and Twenty-Four rivers, which have catchment areas in the Porterville and Tulbagh mountains. Voëlvlei Dam Voëlvlei Dam was built by the Department of Water and Sanitation and was completed in 1971. However, the infrastructure required for the city to use this water, including the water treatment works, pumping stations and the 80 km of 1 500 mm pipeline connecting the dam to the city were constructed by the City of Cape Town. Theewaterskloof Dam Theewaterskloof Dam is located near Villiersdorp and is the largest dam supplying Cape Town. It is the seventh-largest dam in South Africa. It is larger in capacity than the other 13 dams combined. Theewaterskloof is connected to an extensive system of pipelines and tunnels that, in turn, connects it to the broader Western Cape Water Supply System. Particularly impressive is the 30 km of tunnels that pass through the Franschhoek, Groot Drakenstein, and Stellenbosch mountains. To put this in perspective, this tunnel system is nearly eight times longer than the Huguenot Tunnel that one travels through on the N1 highway near Paarl. The tunnels link the Theewaterskloof Dam with the Cape Town water system near Somerset West via the Kleinplaas Balancing Dam (not to be confused with the Kleinplaats Dam near Simon’s Town) in the Jonkershoek Valley near Stellenbosch. The tunnels also connect to pipelines in the Franschhoek Valley linking it to the Wemmershoek and Berg River dams. Berg River Dam The Berg River Dam (originally called the Skuifraam Dam) is located in the mountains near Franschhoek and is the newest supply dam. It was completed in 2009, or 112 years after Cape Town’s first supply dam was constructed on Table Mountain in 1897. In future, the City will need to find other means of meeting its increasing water requirements. As there is no more suitable land on which to build dams in the Cape Town area, no further dams will be built.

Page 15 of 40
Berg River Dam Western Cape Water Supply System The dams in and around Cape Town form part of the Western Cape Water Supply System, which is an integrated and collectively managed system of dams, pump stations, pipelines, and tunnels. In addition to servicing Cape Town, the system supplies water to towns in the Overberg, Boland, West Coast and Swartland areas as well as providing irrigation water for agriculture. The integrated system helps optimise the use of water resources in the region as it allows water to be transferred between dams and catchment systems. Dams that are running low can be topped up from another source, and excess water flows in the Berg River in winter can be transferred to Theewaterskloof Dam for storage. During the dry months the water is transferred back and released into the Berg River as required.
Drinking water consumption by user within Western Cape Water Supply System

Page 16 of 40
The pie graph shows water consumed by different types of users within the Western Cape Water Supply System during a non-drought year. Most water from the WCWSS is consumed by Cape Town, whilst the second highest consumer is the Agriculture sector which mainly uses water for irrigation purposes. The system also supplies a smaller percentage of water to other municipalities which includes Overberg, Boland, West Coast and Swartland.
Our dam specifications
Name Location Water source Ownership Completed Capacity
(Ml)
Theewaterskloof Villiersdorp Riviersonderend
River DWS 1978 480 250
Voëlvlei Gouda
Klein Berg, Leeu
and Twenty-Four
rivers
DWS 1971 164 122
Berg River Franschhoek Berg River DWS 2009 130 000
Wemmershoek Franschhoek Wemmers River CCT 1957 58 644
Steenbras Lower Gordon’s Bay Steenbras River CCT 1921 33 517
Steenbras Upper Gordon’s Bay Steenbras River CCT 1977 31 767
Kleinplaats Simon’s Town Bokram Spruit River CCT
1 368
Woodhead Table Mountain Disa River CCT 1897 954
Hely-Hutchinson Table Mountain Disa River CCT 1904 925
Land-en-Zeezicht Somerset West Lourens River and
boreholes CCT 1973 451
De Villiers Table Mountain Disa Stream CCT 1910 243
Lewis Gay Simons Town Bokram Spruit River CCT
182
Victoria Table Mountain Original Disa Stream CCT 1896 128
Alexandra Table Mountain Original Disa Stream CCT 1903 126
Kleinplaas
Balancing Dam
Jonkershoek
Valley near
Stellenbosch
Balancing Dam for
Theewaterskloof
water /Jonkershoek
Tributary
DWS

Page 17 of 40
6. WHAT IS GROUNDWATER? Groundwater is an important water resource. Some rain water seeps into the ground and becomes groundwater. The process is particularly important in areas with sandy soils such as the Cape Flats and the West Coast areas. Rivers do not form in these areas; rain instead infiltrates the porous soil to form underground water bodies called aquifers. Drinking water is sourced from the Silverstroom springs at the Silverstroom weir. Atlantis, on the West Coast, is supplied with drinking water extracted from the Atlantis Aquifer. This is pumped from boreholes at the Witsand and Silverstroom wellfields. The Cape Flats aquifer is an important source of irrigation water for vegetable farming in Philippi. The Table Mountain Group Aquifer is being investigated as a potential future source of drinking water. It is a large aquifer, part of which extends under the mountain ranges to the east of the city, although not under Table Mountain itself. Many sports fields and other properties in Cape Town have private boreholes for irrigation. The practice is supported by the City of Cape Town as it helps to reduce the demand placed on our municipal drinking water supplies. Many springs exist in Cape Town, especially in areas close to Table Mountain and in the Gordon’s Bay and Atlantis areas. Many of these springs played an important historical role in providing drinking water. Albion Spring in Newlands is still in use today and water from this spring is pumped into the city’s drinking water network. However, today most springs are used for irrigation purposes.
7. SURFACE RUNOFFS Rainwater falling on the land collects in streams and small rivers, which join to form larger rivers that flow to the sea. Many rivers in Cape Town, such as the Zand River near Muizenberg or the Diep River at Woodbridge Island, form vleis or small estuaries before entering the sea. Some rivers such as the Black River and the Lotus River have been partially canalised.

Page 18 of 40
Black River Important rivers in the Cape Town area include:
Little and Big Lotus rivers that feed Zeekoeivlei;
Diep, Zand, Keysers and Westlake rivers that feed Zandvlei in Muizenberg;
Silvermine river that reaches the sea at Fish Hoek;
Lourens and Sir Lowry’s Pass rivers near Somerset West;
Steenbras River, which feeds the Steenbras dams;
Eerste and Kuils rivers that flow into False Bay near Macassar;
Salt River and its tributaries including the Liesbeek, Black and Elsiekraal rivers;
Disa River in Hout Bay, which provides water to the Kloof Nek Water Treatment Works; and
Diep River that drains the Malmesbury area and feeds Rietvlei near Table View before reaching the sea at Woodbridge Island, Milnerton.
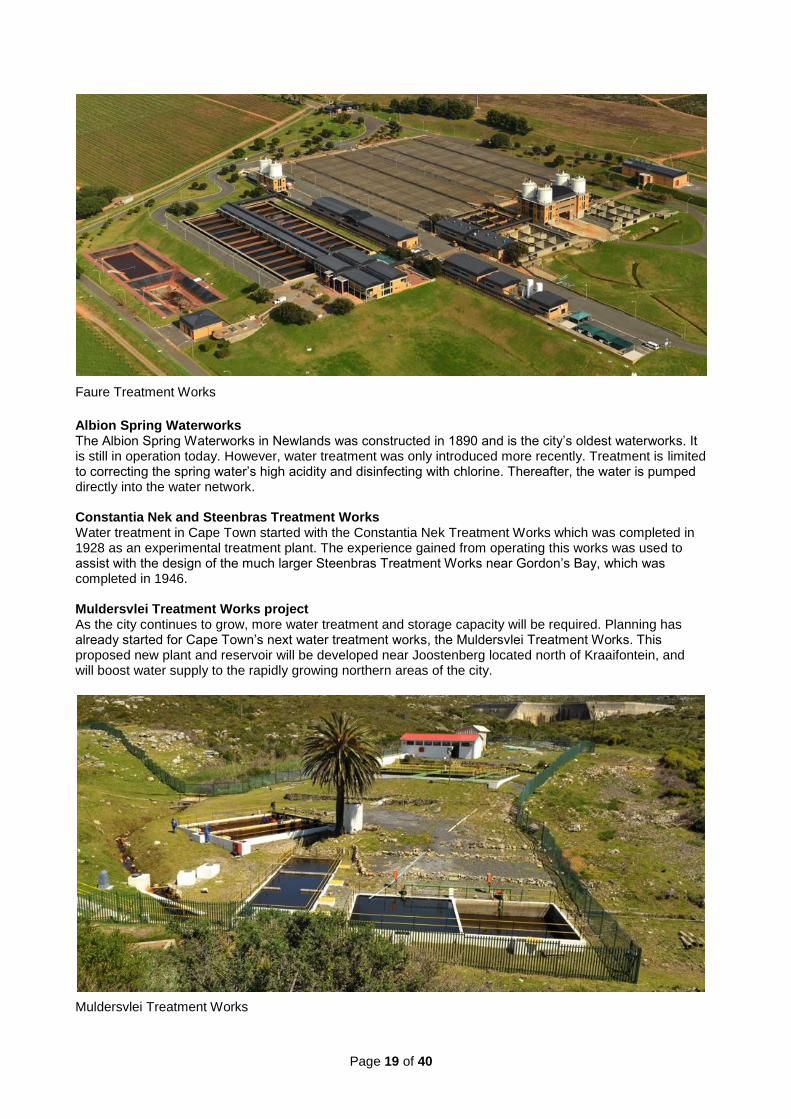
8. CAPE TOWN’S WATER TREATMENT WORKS The quality of drinking water in Cape Town is of an extremely high standard. This is due to the quality of the treatment processes, and from the fact that most of the water consumed in Cape Town is abstracted from unpolluted mountain catchments and aquifers. Cape Town water complies with the stringent guidelines as stipulated in the South African National Standards (SANS 241:2015) for drinking water and has received multiple Blue Drop awards from the Department of Water and Sanitation for its water quality. Our water treatment works Cape Town has 12 treatment works, ranging in treatment capacity from 3 Ml per day, at Constantia Nek to 500 Ml per day at the state-of-the-art Faure Treatment Works. Collectively, these plants provide a treatment capacity of approximately 1 600 Ml per day. Prior to the introduction of water treatment, all water supplied was tea-coloured due to plant matter suspended in the water. However, more serious problems included the build-up of sediment in the pipelines, which caused blockages, and the water’s high acidity levels, which corroded pipelines and valves.
Page 19 of 40
Faure Treatment Works
Albion Spring Waterworks The Albion Spring Waterworks in Newlands was constructed in 1890 and is the city’s oldest waterworks. It is still in operation today. However, water treatment was only introduced more recently. Treatment is limited to correcting the spring water’s high acidity and disinfecting with chlorine. Thereafter, the water is pumped directly into the water network. Constantia Nek and Steenbras Treatment Works Water treatment in Cape Town started with the Constantia Nek Treatment Works which was completed in 1928 as an experimental treatment plant. The experience gained from operating this works was used to assist with the design of the much larger Steenbras Treatment Works near Gordon’s Bay, which was completed in 1946. Muldersvlei Treatment Works project As the city continues to grow, more water treatment and storage capacity will be required. Planning has already started for Cape Town’s next water treatment works, the Muldersvlei Treatment Works. This proposed new plant and reservoir will be developed near Joostenberg located north of Kraaifontein, and will boost water supply to the rapidly growing northern areas of the city. Muldersvlei Treatment Works
Page 20 of 40
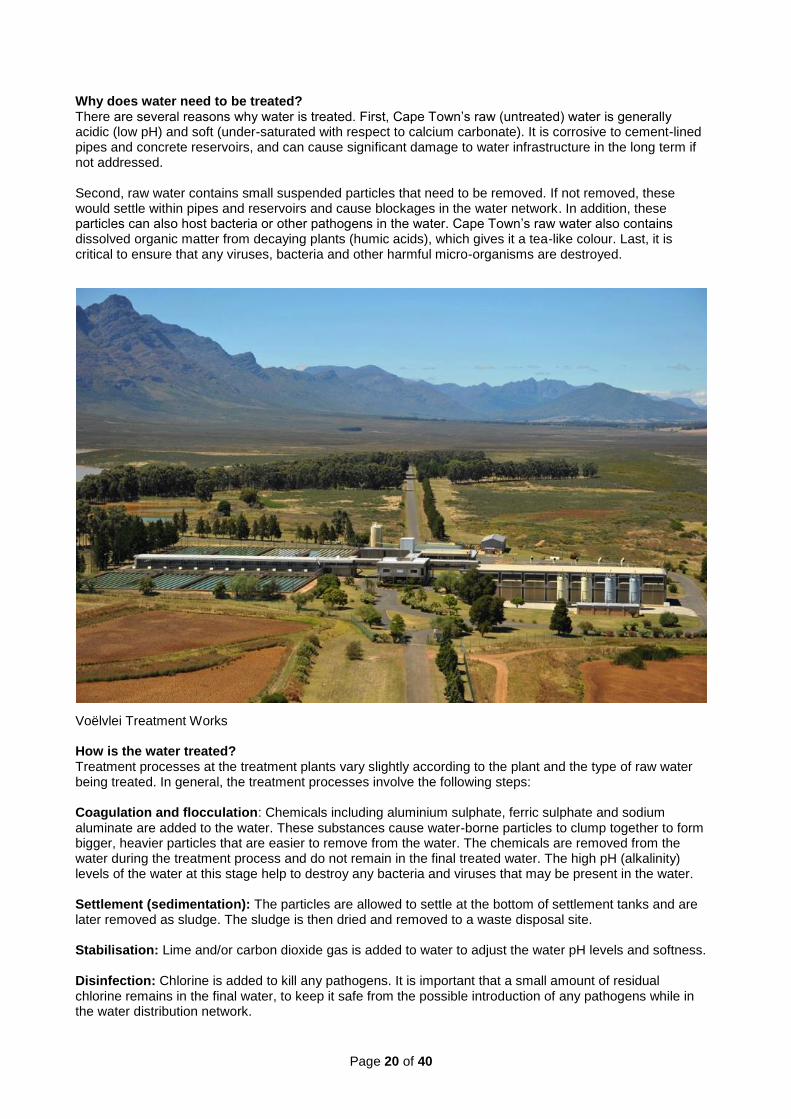
Why does water need to be treated? There are several reasons why water is treated. First, Cape Town’s raw (untreated) water is generally acidic (low pH) and soft (under-saturated with respect to calcium carbonate). It is corrosive to cement-lined pipes and concrete reservoirs, and can cause significant damage to water infrastructure in the long term if not addressed. Second, raw water contains small suspended particles that need to be removed. If not removed, these would settle within pipes and reservoirs and cause blockages in the water network. In addition, these particles can also host bacteria or other pathogens in the water. Cape Town’s raw water also contains dissolved organic matter from decaying plants (humic acids), which gives it a tea-like colour. Last, it is critical to ensure that any viruses, bacteria and other harmful micro-organisms are destroyed.
Voëlvlei Treatment Works How is the water treated? Treatment processes at the treatment plants vary slightly according to the plant and the type of raw water being treated. In general, the treatment processes involve the following steps: Coagulation and flocculation: Chemicals including aluminium sulphate, ferric sulphate and sodium aluminate are added to the water. These substances cause water-borne particles to clump together to form bigger, heavier particles that are easier to remove from the water. The chemicals are removed from the water during the treatment process and do not remain in the final treated water. The high pH (alkalinity) levels of the water at this stage help to destroy any bacteria and viruses that may be present in the water. Settlement (sedimentation): The particles are allowed to settle at the bottom of settlement tanks and are later removed as sludge. The sludge is then dried and removed to a waste disposal site. Stabilisation: Lime and/or carbon dioxide gas is added to water to adjust the water pH levels and softness. Disinfection: Chlorine is added to kill any pathogens. It is important that a small amount of residual chlorine remains in the final water, to keep it safe from the possible introduction of any pathogens while in the water distribution network.

Page 21 of 40
Our water treatment plants
Water treatment plant
Capacity (Ml/day)
Treatment process and chemicals used
Water source Constructed
Faure (hillside to the north of Faure)
500 Coagulation and pH level adjustment (hydrated lime), odour control (powder activated carbon), flocculation (ferric sulphate), settlement, filtration, stabilisation (hydrated lime and carbon dioxide), and chlorine disinfection
Theewaterskloof and Steenbras Upper dams
1994
Blackheath 420 Coagulation and pH level adjustment (hydrated lime), odour control (powder activated carbon), flocculation (aluminium sulphate), settlement, filtration, stabilisation (hydrated lime and carbon dioxide), and chlorine disinfection
Theewaterskloof Dam
1982
Wemmershoek (Wemmershoek Dam near Franschhoek)
250 Coagulation and pH level adjustment (hydrated lime), flocculation (aluminium sulphate), settlement, filtration, stabilisation (hydrated lime and carbon dioxide), and chlorine disinfection
Wemmershoek Dam (augmented from Theewaterskloof)
1958
Voëlvlei (Voëlvlei Dam near Gouda)
230 Coagulation and pH level adjustment (hydrated lime), odour control (powder activated carbon), flocculation (aluminium sulphate/polyelectrolyte), settlement, filtration, stabilisation (hydrated lime and carbon dioxide), and chlorine disinfection
Voelvlei Dam (Klein Berg and Twenty-four rivers)
1971
Steenbras (Gordon’s Bay)
150 Coagulation and pH level adjustment (hydrated lime), flocculation (aluminium sulphate/sodium aluminate), settlement, filtration, stabilisation (hydrated lime and carbon dioxide), and chlorine disinfection
Steenbras Lower Dam
1946
Kloof Nek (above Camps Bay)
18 Coagulation and pH level adjustment (hydrated lime), flocculation (aluminium sulphate/sodium aluminate), settlement, filtration, stabilisation (hydrated lime and carbon dioxide), and chlorine disinfection
Hely-Hutchinson and Woodhead dams
1938
Helderberg (Somerset West)
15 pH level adjustment (hydrated lime), slow sand filtration and chlorination and chlorine disinfection
Land-en-Zeezicht Dam (Lourens River and boreholes)
Witzand (Atlantis)
14 pH level adjustment (sodium hydroxide), ion-exchange softening and chlorine disinfection
Witzand Wellfield (30 boreholes) Atlantis Aquifer
1986

Page 22 of 40
Brooklands (Red Hill above Simon’s Town)
5 Coagulation and pH level adjustment (hydrated lime), flocculation (aluminium sulphate/sodium aluminate), settlement, filtration, stabilisation (hydrated lime and carbon dioxide), and chlorine disinfection
Kleinplaats and Lewis Gay dams (augmented from the South African Navy’s Rawson dam)
1974
Albion Spring (Newlands)
4 pH level adjustment (carbon dioxide scrubbing) and chlorine disinfection
Albion Spring 1890
Silwerstroom (near Atlantis)
3 Pressure sand filtration, pH level adjustment and chlorine disinfection
Silwerstroom wellfield (14 boreholes)
1975
Constantia Nek 3 Coagulation and pH level adjustment (hydrated lime), flocculation (aluminium sulphate/ sodium aluminate/ sodium silicate), settlement, filtration, stabilisation (hydrated lime and carbon dioxide), and chlorine disinfection
Alexandra, De Villiers and Victoria dams
1934

Page 23 of 40
9. CAPE TOWN’S RESERVOIRS Cape Town is serviced by 25 bulk reservoirs and more than 100 smaller distribution reservoirs store treated drinking water before it is piped to homes and businesses. Why are reservoirs important? Reservoirs are an important part of any water reticulation system. Water is supplied to reservoirs at a fairly constant rate from the City’s water treatment plants. However, the amount of water needed to supply homes and businesses fluctuates throughout the day. Demand peaks in the morning and the evening, but dips in the middle of the night when most people are asleep. This is a bit like rush hour for water. Reservoirs help the water reticulation system to cope with periods of peak demand. All reservoirs are built on hills in and around the city. Many are built approximately 110 meters above sea level to help create the right amount of pressure in our water pipes. Cities in flat areas require water towers to help create water pressure. However, this is not necessary in Cape Town because of our conveniently located hills. Most reservoirs are enclosed. However, the historic Molteno and Newlands reservoirs are open.
The enclosed 583 Ml Plattekloof Reservoir

Page 24 of 40
Newlands Upper Reservoir was completed in 1905. Molteno Reservoir Molteno Reservoir was completed in 1881 and is the city’s oldest reservoir that is still in use. It is also the city’s fifth largest reservoir.
Page 25 of 40
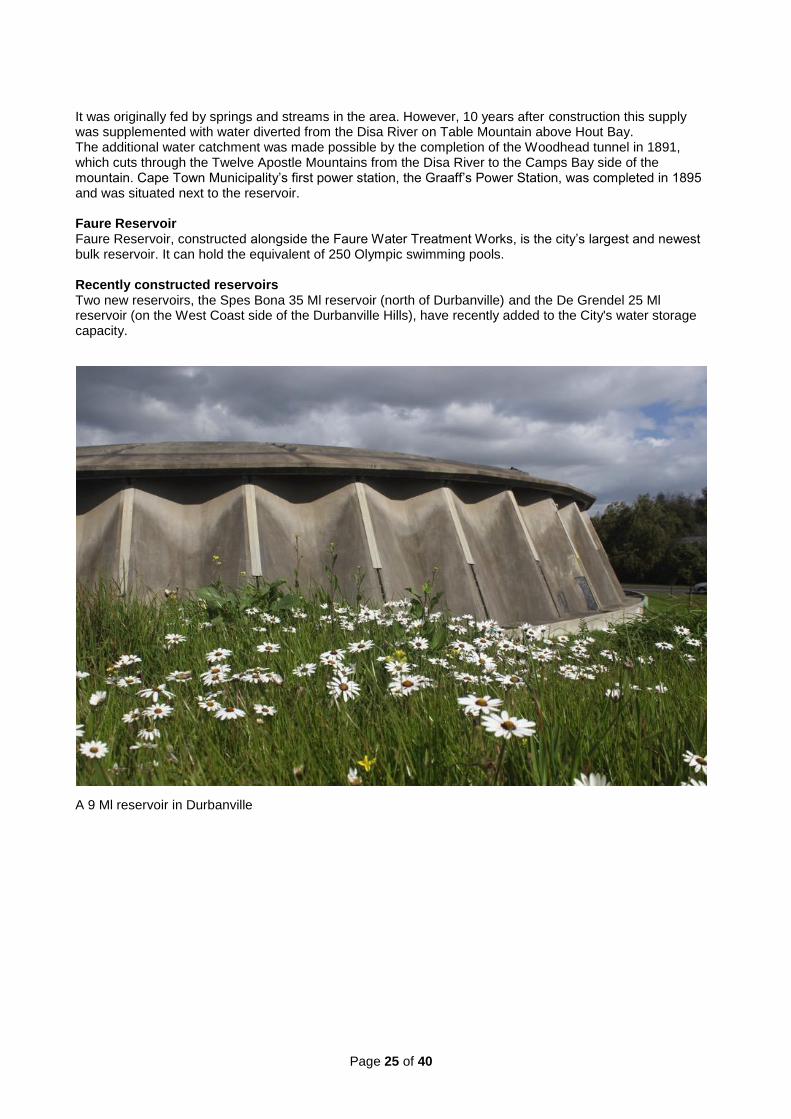
It was originally fed by springs and streams in the area. However, 10 years after construction this supply was supplemented with water diverted from the Disa River on Table Mountain above Hout Bay. The additional water catchment was made possible by the completion of the Woodhead tunnel in 1891, which cuts through the Twelve Apostle Mountains from the Disa River to the Camps Bay side of the mountain. Cape Town Municipality’s first power station, the Graaff’s Power Station, was completed in 1895 and was situated next to the reservoir. Faure Reservoir Faure Reservoir, constructed alongside the Faure Water Treatment Works, is the city’s largest and newest bulk reservoir. It can hold the equivalent of 250 Olympic swimming pools. Recently constructed reservoirs Two new reservoirs, the Spes Bona 35 Ml reservoir (north of Durbanville) and the De Grendel 25 Ml reservoir (on the West Coast side of the Durbanville Hills), have recently added to the City's water storage capacity. A 9 Ml reservoir in Durbanville

Page 26 of 40
List of our bulk reservoirs
Bulk reservoirs Capacity at top water level (Ml) Constructed
Faure 614.2 1996
Plattekloof 583.6 1974
Blackheath Lower 537.6 1983
Tygerberg No. 2 264.3 1962
Molteno 188.1 1886
Glen Garry 149.6 1991
Newlands Upper 132.6 1905
Blackheath Upper 48.2 1980
Newlands Lower 46.0 1950
Pella 40 40.0 1981
Tygerberg No. 1 33.4 1952
Monterey 29.0 1972
Wynberg No. 2 22.2 1949
Hospital 20 20.0 1990
Melkbos A 20.0 1976
Melkbos B 20.0 1987
Hout Bay 20.0 2000
Oranjezicht 16.3 1988
Kloof Nek 13.6 1908
Pella 10 10.0 1975
Hospital 10 10.0 1970
Midlands 10.0 1995
Wynberg No. 1 8.4 1897
Eastern High Level 4.3 1932
Constantia Nek 3.7 1953

Page 27 of 40
10. OUR RETICULATION SYSTEMS Every day (during non-drought times), approximately 880 000 Ml of treated, drinking water is distributed to nearly 650 000 consumers through a network of 85 pump stations, 26 large reservoirs, 103 smaller reservoirs and about 10 700 km of pipeline ranging from those big enough for two people to walk abreast to the standard domestic 15 mm or 20 mm connections. Laid end-to-end, the pipes would reach Melbourne, Australia. Every year, around 16 000 drinking water samples are drawn from approximately 300 designated sampling points and are laboratory tested to ensure compliance with stringent water quality standards. Our wastewater network Wastewater is piped to treatment facilities via a network of 9 300 km of pipeline and 385 pump stations. The city’s largest sewer pipeline is 1.8 m in diameter at its largest point. Sewer pipes are generally larger than water pipes. Unlike water pipes, they are usually not pressurised and instead flow by gravity. The exception is “rising sewer mains”, which allow wastewater to be pumped uphill. Non-drinking water network A third type of pipeline is Cape Town’s non-drinking water network. This smaller network conveys treated wastewater or spring water to customers for irrigation or industrial use. Managing the City’s reticulation system

Page 28 of 40
Maintaining and expanding this system to accommodate our rapidly growing city is an enormous task that is performed by more than 4 000 staff members. During 2016/17 an annual operating budget of about R7.8 billion was required to keep the City's reticulation system in good working order. Pipe replacement programme The City of Cape Town is actively pursuing a pipe replacement programme to replace ageing pipelines in order to limit pipe bursts, water leaks and sewerage spills. Through this programme, about 30 km of sewer and 40 km of water mains are replaced each year. Sewer blockages A major challenge is the excessively high number of sewer blockages currently being experienced. On average, the City attends to nearly 300 sewer blockages every day.
Blocked or overflowing sewers are unpleasant, can cause health hazards, and are bad for the environment. The additional burden of clearing these blockages results in increased operational costs, which ultimately leads to higher service charges. Most sewer blockages are completely avoidable and caused by foreign matter in the sewer system. Please help prevent sewer blockages by following these few steps:
Do not flush foreign matter such as rags, newspaper, nappies, nappy wipes, tampon or sanitary pads down the toilet.
Do not pour oils or fats down the drains. These substances congeal in the sewer and cause blockages.
Do not dispose of sand or building rubble in the sewer system. Please report missing manhole covers as these are an easy point of ingress for illegal dumping.
Check your property for any illegal stormwater connections to the sewerage system (e.g. any gutters that drain into the sewerage system). The extra rainwater that enters can overload the sewerage network during times of wet weather causing sewer overflows.

Page 29 of 40
It is extremely important that all restaurants, or any premises where food is prepared, install and maintain adequately sized grease traps as required by the Wastewater and Industrial Effluent By-law.
A newly constructed water pump station at Clovelly
11. CONSUMERS The City of Cape Town provides water and sanitation services to more than 4.1 million people (2017 Statistics South Africa, Mid-Year Estimates) via water and sewer connections that supply nearly 650 000 properties. However, Cape Town is growing rapidly and this figure increases every year due to population growth and migration to the city. Each year, on average, the Water and Sanitation Department provides connections to 8 500 new customers. Our customers include:
approximately 160 000 informal households in 204 informal settlements throughout the city, which are serviced by approximately 6 500 communal taps and 49 000 toilets;
approximately 600 000 domestic consumers;
approximately 13 000 commercial consumers;
approximately 6 500 housing complexes and blocks of flats;
close to 4 500 industrial consumers; and
two other municipalities: the City provides treated drinking water to Drakenstein (Paarl) and Winelands (Stellenbosch) municipalities.
All water consumption from formal properties in Cape Town is metered and consumers are billed according to how much water is used. All properties are connected to the water network via a water meter, which is
Page 30 of 40
usually installed in a small chamber beneath the pavement directly outside the property. The meter is read monthly by a team of water meter readers.
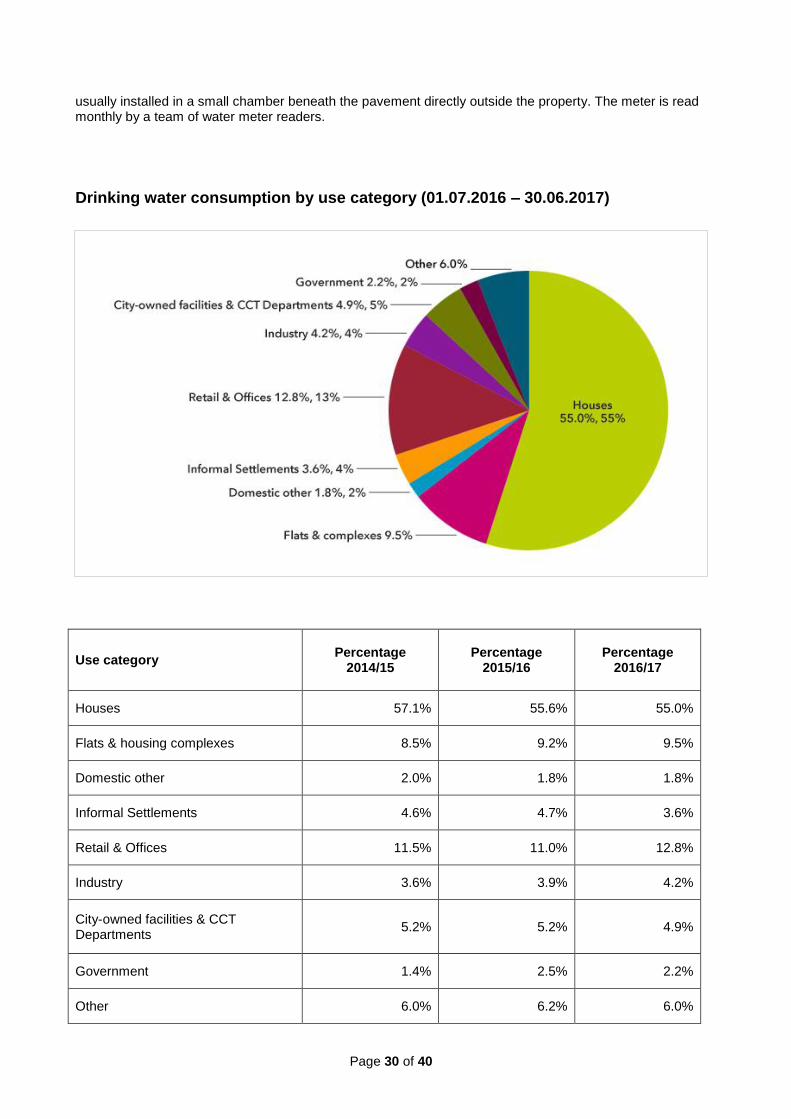
Drinking water consumption by use category (01.07.2016 – 30.06.2017)
Use category Percentage
2014/15 Percentage
2015/16 Percentage
2016/17
Houses 57.1% 55.6% 55.0%
Flats & housing complexes 8.5% 9.2% 9.5%
Domestic other 2.0% 1.8% 1.8%
Informal Settlements 4.6% 4.7% 3.6%
Retail & Offices 11.5% 11.0% 12.8%
Industry 3.6% 3.9% 4.2%
City-owned facilities & CCT Departments
5.2% 5.2% 4.9%
Government 1.4% 2.5% 2.2%
Other 6.0% 6.2% 6.0%

Page 31 of 40
Total 100.0% 100.0% 100.0%
The pie graph shows water consumed by different types of consumers in Cape Town. Most water is consumed by formal households (houses, flats and group housing). The amount of water used by households depends on the size and type of the property, as well as the number of occupants and the care they take in conserving water. Consumption varies greatly across suburbs. As shown in the histogram below, most houses (properties on the Domestic full tariff) consume between 200 and 600 litres per day (6 and 18 kl per month) during a non-drought year. Above 1 000 litres per day (30 kl per month) can be considered as high consumption. Houses with large gardens and swimming pools usually consume more water, while flats and houses with smaller gardens generally consume less. Low-income households consume much less water, unless there are plumbing leaks on the property. Average domestic consumption calculated over a 12-month period is 660 litres per day (20 kl per month) for houses (Domestic full tariff) and 460 litres per day (14 kl per month) for flats and complexes (Domestic cluster tariff). Please help by saving water. Water consumption histogram for houses This graph shows daily water consumption calculated over a 12-month period for all houses (properties on the Domestic full tariff) in Cape Town in kl (1 kl = 1 000 litres).
Water consumption histogram for houses (based on 2014 consumption in 2014 - a year that did not have water restriction

Page 32 of 40
Average daily consumption per capita (L/Capita/Day) 2016 2017 The maps show an average daily consumption per capita comparison between July 2016 to September 2016 and July 2017 to September 2017. The per capita consumption is dependent on the number of people per household.

Page 33 of 40
12. HOW WE TREAT WASTEWATER
The City of Cape Town operates 17 wastewater treatment works (sewerage works) and six smaller facilities. Wastewater undergoes a closely monitored treatment process before being safely discharged into rivers, canals, vleis, underground water bodies called aquifers, or the sea. Wastewater is water from baths, showers, sinks, toilets, and other drains. It can also include industrial liquid waste especially if draining from the city’s industrial areas. Wastewater treatment works have the important job of cleaning the dirty water and making it safe before discharging it into the environment. The treatment process Cape Town’s wastewater treatment works use different processes to clean the water (see the table below). However, most treatment works include the following treatment steps:
Pre-treatment and screening to remove large foreign matter such as rags, paper, plastic, leaves, etc.
Filtration of grit, sand, small stones and broken glass. It is important to remove these at an early stage so that they don’t cause damage to pumps and other equipment later on in the treatment process.
Primary sedimentation in order to remove solids, which are treated separately as sludge. Fats, greases and oils are also removed in this stage.
Secondary treatment processes used in Cape Town works include activated sludge, bio-filtration and rotating biological contactors. Oxidation ponds are also used in some small rural works. In this treatment phase, microscopic organisms are used to process the wastewater to remove organic matter and various chemicals such as ammonia, nitrogen and phosphorous.
Disinfection using chlorine, ozone or ultraviolet light to kill bacteria, viruses and other pathogens. In some works, the final treated effluent is allowed to remain in maturation ponds, which improves the quality further before it is discharged.
The quality of treated wastewater is monitored on a weekly basis to ensure compliance with licensing conditions and national standards. Treated wastewater is re-used for irrigation or industrial use in the city.
Cape Town, 64% (243 Mm³/a)
Other Municipalities, 7% (37 Mm³)
Agriculture, 29% (158 Mm³)
Drinking water consumption by user within Western Cape Water Supply System
Cape Town
Other Municipalities
Agriculture

Page 34 of 40
Wastewater treatment works at Cape Flats
Aerial view of the clarifiers at the Athlone Water Treatment Works

Page 35 of 40
Protect our wastewater system Our wastewater system is part of our urban environmental system. What goes down your drain is ultimately discharged into our rivers, vleis and the sea. Sewer blockages can result in untreated sewerage overflowing into our streets, rivers and vleis. In addition, our treatment works rely on biological process, which are sensitive to toxins, to clean the water. Please help look after our environment and our treatment works by following these guidelines:
Do not flush foreign matter, chemicals, toxins, oils or fats down our drains and toilets. This causes sewer blockages and can prevent treatment plants from working optimally or may even kill the microscopic organisms that are needed to clean our water.
Report illegal discharges or other by-law contraventions including restaurants that have insufficiently maintained grease traps.
Wipe leftover food off plates and place the food scrapings in the bin – not down the drain. Do not install a kitchen sink drain grinder. This places an extra load on our wastewater treatment works.
Check your property for any illegal stormwater connections to the sewerage system (e.g. any gutters or downpipes that drain into the sewerage system). The extra rainwater that enters the sewerage systems can overload our treatment plants during times of wet weather.
Infrastructure investment The City is continually investing in its wastewater treatment works to improve the quality of our treated effluent and keep pace with our rapidly growing city. Key investments include a R150 million, six-year upgrade to the Athlone works which will increase its capacity and improve the quality of treated effluent discharged into the Black River. An extensive plant upgrade is also in progress at the Bellville treatment plant. Athlone Treatment Works

Page 36 of 40
The city’s newest treatment works opened in Fisantekraal in 2012. It uses state-of-the-art ultraviolet disinfection and is geared as a ‘zero discharge’ plant, as the treated water is piped to customers for irrigation purposes. Fisantekraal Treatment Works

Page 37 of 40
Our wastewater treatment plants
WWTW Date
commissioned
Capacity
(Ml/d)
DWS licence
(Ml/d) Plant type
Cape Flats 1960 200.0 161.0 Activated sludge
Athlone 1923 105.0 110.0 Activated sludge
Zandvliet 1989 72.0 73.6 Activated sludge
Bellville 1950 54.6 56.0 Activated sludge
Potsdam 1957 47.0 43.9 Activated sludge
Mitchells Plain 1976 45.0 35.3 Activated sludge
Green Point 1993 40.0 27.3 Sea outfall
Macassar 1978 38.0 30.7 Activated sludge
Borcheds Quarry 1973 35.0 35.3 Activated sludge
Fisantekraal 2012 24.0 58.0 Activated sludge
Kraaifontein 1971 17.5 28.0 Activated sludge
Wildevoelvlei 1976 14.0 5.8 Activated sludge
Scottsdene 1976 12.5 10.0 Activated sludge
Hout Bay 1993 9.8 5.2 Sea outfall
Wesfleur Domestic 1978 8.0 6.9 Activated sludge
Wesfleur industrial 1978 6.0 3.2 Activated sludge
Camps Bay 1977 5.5 2.3 Sea outfall
Melkbosstrand 1977 5.4 3.6 Activated sludge
Gordon’s Bay 1994 3.1 3.4 Activated sludge
Simon’s Town 1970 2.5 1.8 Bio filters
Parow 1976 1.2 0.8 Decommissioned
Llandudno 1973 0.28 0.2 Rotating bio disc
Philadelphia 1996 0.086 0.08 Oxidation pond
Klipheuwel 2000 0.07 0.07 Rotating bio disc
Millers Point 1996 0.06 to be determined Rotating bio disc
Oudekraal 1996 0.03 to be determined Rotating bio disc
Groot Springfontein 1984 0.01 0.01 Oxidation pond

Page 38 of 40
13. RE-USING TREATED WASTEWATER Treated effluent, or recycled water, is wastewater that has been treated at wastewater treatment (or sewerage) works and then piped via a separate network of pipes to various consumers. In Cape Town, this water is not used as drinking water but for irrigation and industrial purposes. Recycling our water On average, approximately 50 000 m³ of this water is consumed every day. In this way, Cape Town recycles 8% of all water used. This water is much cheaper than drinking water and the City of Cape Town actively promotes its use in order to conserve Cape Town’s limited drinking water supply. There are more than 160 treated effluent consumers in the city including schools, sports clubs, golf courses, farms, industry and commercial developments with large water features. The City also uses this water for irrigating parks and the flower beds along Cape Town’s Integrated Rapid Transport (IRT) routes. Treated effluent systems Thirteen of the City’s wastewater treatment works are equipped to produce treated effluent suitable for re-use, and a 230 km treated effluent pipe network conveys this water to customers.

Page 39 of 40
Wastewater treatment plant
Treated effluent capacity (Ml/d)
Km of pipe network
Number of customer meters
Potsdam 46.6 110.0 44
Fisantekraal 20.0 0.2 1
Bellville 19.5 12.1 22
Cape Flats 16.1 10.9 3
Athlone 15.3 44.6 58
Macassar 11.1 32.3 17
Kraaifontein 9.0 16.8 24
Scottsdene 8.3 3.1 3
Atlantis 6.4 1.1 2
Mitchells Plain 6.1 0 1
Melkbosstrand 2.2 3.8 2
Gordon’s Bay 2.0 0 0
Parow 1.9 6.3 5
Total 164.5 241.2 182
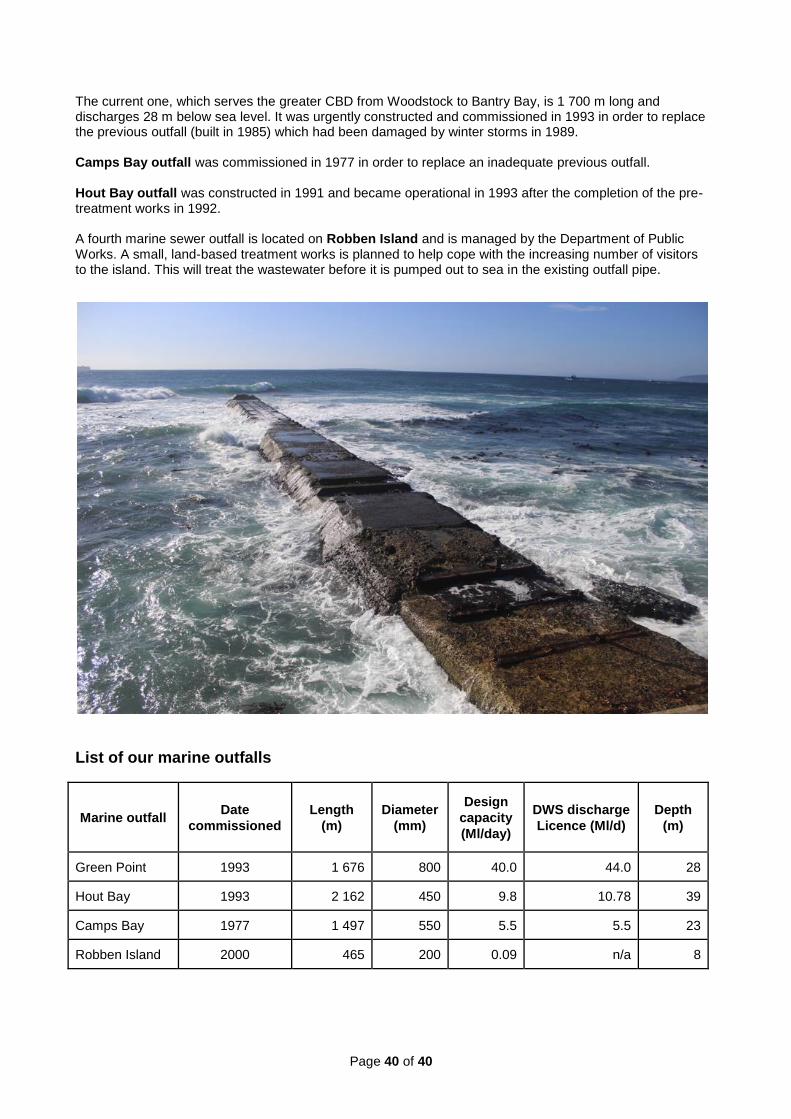
14. MARINE OUTFALLS The City of Cape Town operates three marine outfalls that discharge wastewater deep underwater far into the sea where the effluent is safely dispersed. All three consist of the following components:
A pre-treatment works where sand and grit is removed and the effluent is screened to remove plastic, paper, rags and any other foreign material
A pump station
An underwater pipeline designed to withstand wave actions and possible damage from ship anchors
A diffuser at the end of the pipeline that helps to disperse the waste Why do we need marine outfalls? While many people may feel uncomfortable about discharging largely untreated wastewater into the sea, it is important to consider that marine outfalls are carefully designed to safely disperse wastewater deep underwater far from the shore. They are located in areas where ocean currents help to disperse and carry the effluent away from the coast. The enormous volume of the sea helps to dilute the waste to nearly undetectable concentrations, and bacteria and pathogens die off while mixing with the sea water. Our marine outfalls generally serve densely urbanised areas where the establishment of a land-based treatment works would be difficult due to limited availability of suitable land. Marine outfalls in Cape Town Cape Town’s first marine outfall was constructed at Mouille Point as far back as 1895, and four outfalls have since been built in the area. The original outfall was replaced by a 180 metre pipeline in 1927.
Page 40 of 40
The current one, which serves the greater CBD from Woodstock to Bantry Bay, is 1 700 m long and discharges 28 m below sea level. It was urgently constructed and commissioned in 1993 in order to replace the previous outfall (built in 1985) which had been damaged by winter storms in 1989. Camps Bay outfall was commissioned in 1977 in order to replace an inadequate previous outfall. Hout Bay outfall was constructed in 1991 and became operational in 1993 after the completion of the pre-treatment works in 1992. A fourth marine sewer outfall is located on Robben Island and is managed by the Department of Public Works. A small, land-based treatment works is planned to help cope with the increasing number of visitors to the island. This will treat the wastewater before it is pumped out to sea in the existing outfall pipe.
List of our marine outfalls
Marine outfall Date
commissioned
Length
(m)
Diameter
(mm)
Design
capacity
(Ml/day)
DWS discharge
Licence (Ml/d)
Depth
(m)
Green Point 1993 1 676 800 40.0 44.0 28
Hout Bay 1993 2 162 450 9.8 10.78 39
Camps Bay 1977 1 497 550 5.5 5.5 23
Robben Island 2000 465 200 0.09 n/a 8