water, sanitation and hygiene - world health...
TRANSCRIPT
i
Environmental Burden of Disease Series, No. 15
Water, sanitation and hygiene
Quantifying the health impact at national and local levels in countries with incomplete water supply and sanitation coverage
Lorna Fewtrell
Annette Prüss-Üstün
Robert Bos
Fiona Gore
Jamie Bartram
A Microsoft Excel spreadsheet for calculating the estimates described in this document can be obtained from WHO/PHE. E-mail contact: [email protected]
Public Health and the Environment Geneva 2007
Quantifying health impacts
ii
WHO Library Cataloguing-in-Publication Data Water, sanitation and hygiene : quantifying the health impact at national and local
levels in countries with incomplete water supply and sanitation coverage / Lorna Fewtrell … [et al.]. (Environmental burden of disease series ; no. 15) 1.Gastrointestinal diseases - prevention and control. 2.Diarrhea - prevention and control 3.Malnutrition - complications. 4.Water supply - statistics. 5. Parasitic diseases - prevention and control. 6.Cost of illness. I.Fewtrell, Lorna. II.Series.
ISBN 978 92 4 159575 9 (NLM classification: WA 675) ISSN 1728-1652
Suggested Citation Fewtrell L, Prüss-Üstün A, Bos R, Gore F, Bartram. Water, sanitation and hygiene: quantifying the health impact at national and local levels in countries with incomplete water supply and sanitation coverage. World Health Organization, Geneva, 2007. (WHO Environmental Burden of Disease Series No. 15)
© World Health Organization 2007
All rights reserved. Publications of the World Health Organization can be obtained from WHO Press, World Health Organization, 20 Avenue Appia, 1211 Geneva 27, Switzerland (tel.: +41 22 791 3264; fax: +41 22 791 4857; e-mail: [email protected]). Requests for permission to reproduce or translate WHO publications – whether for sale or for noncommercial distribution – should be addressed to WHO Press, at the above address (fax: +41 22 791 4806; e-mail: [email protected]).
The designations employed and the presentation of the material in this publication do not imply the expression of any opinion whatsoever on the part of the World Health Organization concerning the legal status of any country, territory, city or area or of its authorities, or concerning the delimitation of its frontiers or boundaries. Dotted lines on maps represent approximate border lines for which there may not yet be full agreement. The mention of specific companies or of certain manufacturers’ products does not imply that they are endorsed or recommended by the World Health Organization in preference to others of a similar nature that are not mentioned. Errors and omissions excepted, the names of proprietary products are distinguished by initial capital letters. All reasonable precautions have been taken by the World Health Organization to verify the information contained in this publication. However, the published material is being distributed without warranty of any kind, either expressed or implied. The responsibility for the interpretation and use of the material lies with the reader. In no event shall the World Health Organization be liable for damages arising from its use. The named authors alone are responsible for the views expressed in this publication. Printed by the WHO Document Production Services, Geneva, Switzerland.
Water, sanitation and hygiene
iii
Table of contents
Preface ............................................................................................................................................................. v
Affiliations and acknowledgements ........................................................................................................................... vi
Abbreviations.................................................................................................................................................................................. vi
Summary ............................................................................................................................................................vii
1. Introduction....................................................................................................................................................1
1.1 Basis for quantification of disease ...................................................................................................1 1.2 Choosing the study population ........................................................................................................4
2. Summary of the method ................................................................................................................................5
3. Diarrhoeal diseases.......................................................................................................................................8
3.1 Introduction ......................................................................................................................................8 3.2 Assessing exposure.........................................................................................................................8 3.3 Relative risks .................................................................................................................................13 3.4 Calculation of the fraction of diarrhoea attributable to WSH..........................................................18 3.4 Estimation of disease burden of diarrhoeal disease ......................................................................19
4. Intestinal nematode infections .....................................................................................................................20
5. Childhood malnutrition .................................................................................................................................20
5.1 What is malnutrition ? ....................................................................................................................21 5.2 Consequences of malnutrition on disease.....................................................................................21 5.3 Environmental factors influencing malnutrition ..............................................................................22 5.4 Estimating the disease from WSH related malnutrition .................................................................23
6. Schistosomiasis ...........................................................................................................................................23
7. Trachoma ....................................................................................................................................................24
8. Vector-borne diseases.................................................................................................................................24
8.1 Malaria ...........................................................................................................................................26 8.2 Lymphatic filariasis ........................................................................................................................29 8.3 Onchocerciasis ..............................................................................................................................30 8.4 Dengue ..........................................................................................................................................31 8.5 Japanese encephalitis ...................................................................................................................32
9. Drowning .....................................................................................................................................................32
10. Other diseases ............................................................................................................................................33
11. Availability of disease statistics ...................................................................................................................34
11.1 National statistics...........................................................................................................................34 11.2 Poor availability or alternative sources of statistics .......................................................................34
12. Estimating the total disease burden related to WSH ...................................................................................35
13. Uncertainty ..................................................................................................................................................35
13.1 Uncertainty in estimating attributable diarrhoea ............................................................................35 13.2 Uncertainty in other disease estimates..........................................................................................36
14. Practical example ........................................................................................................................................37
14.1 Diarrhoea .......................................................................................................................................37 14.2 Diseases almost fully attributable to WSH.....................................................................................39 14.3 Other diseases...............................................................................................................................39
15. Policy actions...............................................................................................................................................39
16. Global estimates of WSH-related burden of disease...................................................................................42
References ...........................................................................................................................................................44
Quantifying health impacts
iv
List of tables
Table 1 Diseases related to unsafe water, sanitation and hygiene.................................................................... 2
Table 2 Groups of WSH risks and related diseases .......................................................................................... 3
Table 2 Exposure scenarios ............................................................................................................................ 10
Table 3 Definitions of ‘improved’ and ‘unimproved’ drinking water sources and sanitation facilities ............... 11
Table 4 Exposure data needs .......................................................................................................................... 11
Table 5 Distribution of the population of selected countries, in exposure scenariosa ...................................... 12
Table 6 Key studies and reviews ..................................................................................................................... 15
Table 7 Relative risks associated with scenarios............................................................................................. 18
Table 8 Regional means for fraction of malaria attributable to the environment.............................................. 29
Table 9 Regional means for fraction of lymphatic filariasis attributable to the environment ............................ 30
Table 10 Disease statistics for the Lao People's Democratic Republic ............................................................ 39
Table 11 Deaths attributable to water, sanitation and hygiene, by WHO subregion in 2002............................. 43
Table 12 Burden of disease (in DALYs) attributable to environmental factors, by WHO subregions in 2002 ... 45
List of Figures
Figure 1 Transmission pathways of faecal-oral diseases ................................................................................ 9
Figure 2 Scenarios determining risk of diarrhoeal disease from unsafe WSH................................................. 9
Figure 3 Main pathways linking WSH to malnutrition.................................................................................... 21
Figure 4 Proportional mortality in children younger than five years olda ....................................................... 22
Figure 5 Causal web for malaria transmission related to water resources development.............................. 28
List of Annexes
Annex 1 WHO Member States, by WHO subregion and mortality stratum ....................................................51
Annex 2 Coverage estimates of countries, areas and territories, 2004..........................................................52
Annex 3 Prior estimates of selected country health statistics, 2004..............................................................57
Water, sanitation and hygiene
v
Preface
In the formulation of rational risk management policies, policy-makers increasingly rely on estimates of the disease burden attributable to certain risk factors. Decision-makers consider such estimates and the distribution of the burden within populations to create frameworks for effective interventions. Obtaining objective, reliable and accurate measurements of such attributable fractions of disease burdens is therefore of growing importance. Yet, the complexities of the links between environmental risk factors and their health effects continue to hamper the quantification of attributable fractions. This quantification itself and the opportunities it creates for potential health gains from implementing targeted interventions will not only support rational policy making. It will also facilitate, through raising awareness of the environmental risk dimensions of the disease burden, intersectoral collaboration needed to carry out environmental health interventions to the maximum of their potential impact. In the context of the present publication, the environmental focus is on water (access to safe water and integrated water resources management), sanitation and hygiene The World Health Organization (WHO) carried out an assessment of the global disease burden from unsafe water, sanitation and hygiene, as part of a larger initiative to assess the impact of 25 risk factors in a standardized manner (WHO, 2002; Prüss et al., 2002; Murray and Lopez, 1996a). It also commissioned systematic literature reviews of the fraction of the estimated burden of four water-associated vector-borne diseases that can be attributed to water resources development (irrigation schemes and dams) (Keiser et al., 2005a; Erlanger et al., 2005; Keiser et al., 2005b; Steinmann et al., 2006). This guide builds on these, by providing a tool for public health professionals to carry out more-detailed estimates of the disease burden associated with water, sanitation and hygiene at both national and sub-national levels. It is complemented by an introductory volume on methods for assessing the environmental burden of disease (Prüss-Üstün et al., 2003). It is part of a series providing guidance on quantifying disease from various environmental risks. Work on estimating the health impacts of interventions to tackle water sanitation and hygiene related disease is one component of the activities of WHO in the subject area. It complements and builds on other activities including:
• monitoring status and trends on use of basic water supply and sanitation and building national capacities for national and local monitoring (with UNICEF through the WHO/UNICEF 'Joint Monitoring Programme';
• normative 'Guidelines' analogous to international standards on drinking water quality, safe use of wastewater and excreta in agriculture, aquaculture and urban areas; safe recreational water environments;
• guidance on 'good practice' based on lessons learned in effectively managing water sanitation and hygiene hazards;
• supporting networks for practitioners in areas such as safe household water, small community water supply and safety, sanitation, and drinking-water regulators;
Quantifying health impacts
vi
• information and publications in these and other areas are downloadable from the WHO website at www.who.int/water_sanitation_health/.
Affiliations and acknowledgements
Lorna Fewtrell is with the Centre for Research into Environment and Health, University of Wales, Aberystwyth, UK. Annette Prüss-Üstün, Robert Bos, Fiona Gore and Jamie Bartram are with the World Health Organization in Geneva, Switzerland. In preparing this document, we drew on methods developed for estimating the global burden of disease caused by exposure to unsafe water, sanitation and hygiene and the systematic literature review of the association between water resources development and vector-borne diseases. We therefore thank David Kay of the University of Wales, Aberystwyth, contributor to the global analysis, and Jürg Utzinger, Jennifer Keiser and their team at the Swiss Tropical Institute, Basel for the adaptation and application of the systematic review approach.
Abbreviations
DALY Disability-adjusted life years WSH Water, sanitation and hygiene
Water, sanitation and hygiene
vii
Summary
This guide aims to assist in the development of a quantitative estimate of health impacts attributable to water, sanitation and hygiene (WSH) related risks at country or local level. Most of data available for the methods used cover developing countries, and this guide is therefore mainly relevant to developing countries. Eleven diseases or injuries are reviewed. For diarrhoea, a calculation method based on access levels to safe water and adequate sanitation service levels is used. The disease burden from malnutrition is linked to WSH risks because of repeated diarrhoea and intestinal nematode infections especially affecting children. Several infectious diseases such as intestinal nematode infections, schistosomiasis, trachoma or dengue in certain regions are almost entirely attributable to WSH-related risks. The fraction of the other diseases, including malaria, lymphatic filariasis, onchocerciasis, Japanese encephalitis and drowning that is attributable to WSH should be estimated based on the basis of expert judgement and, where possible, a systematic review of the literature. Methods for pooling of expert judgement and for systematic literature reviews are outlined in this guide. The fractions of disease attributable to WSH obtained by the methods outlined in this guide should be combined with national disease statistics for those diseases (deaths, prevalence/incidence or DALYs). Where such national disease statistics are unavailable or of poor quality, approximate estimates may also be obtained from WHO1. The quantification of health impacts and development of understanding of the potential benefits of interventions provide an opportunity to highlight the disease burden that could be prevented through actions in water, sanitation and hygiene. This can assist in directing interventions, and more generally motivate policy action to prevent this disease burden that disproportionately affects children in the lower socio-economic segments of the population.
1 http://www.who.int/whosis/en/, under "Burden of disease estimates", "GBD 2002 estimates" and "Revised GBD 2002 estimates for countries".
Quantifying health impacts
viii
Water, sanitation and hygiene
1
1. Introduction
1.1 Basis for quantification of disease
Health hazards and risk factors related to water, sanitation and hygiene (WSH) are of a composite nature. Various determining aspects may need to be taken into consideration, including:
• drinking-water is a medium that can serve to transmit pathogens and toxic chemicals;
• the lack of services to provide access to safe drinking-water and adequate sanitation, and the lack of solid waste management services increase the risk of several diseases;
• the failure to apply integrated water resources management principles in the planning, design and operation of dams, irrigation schemes and other hydraulic projects may result in changes in water ecologies that lead to the proliferation of vectors of certain diseases (e.g. malaria, schistosomiasis, lymphatic filariasis, arbovirus infections);
• water-associated behaviours including for example personal and domestic hygiene, water contact patterns and unsafe use of built environments; and
• the management of aquatic ecosystems, which may increase or decrease disease risks.
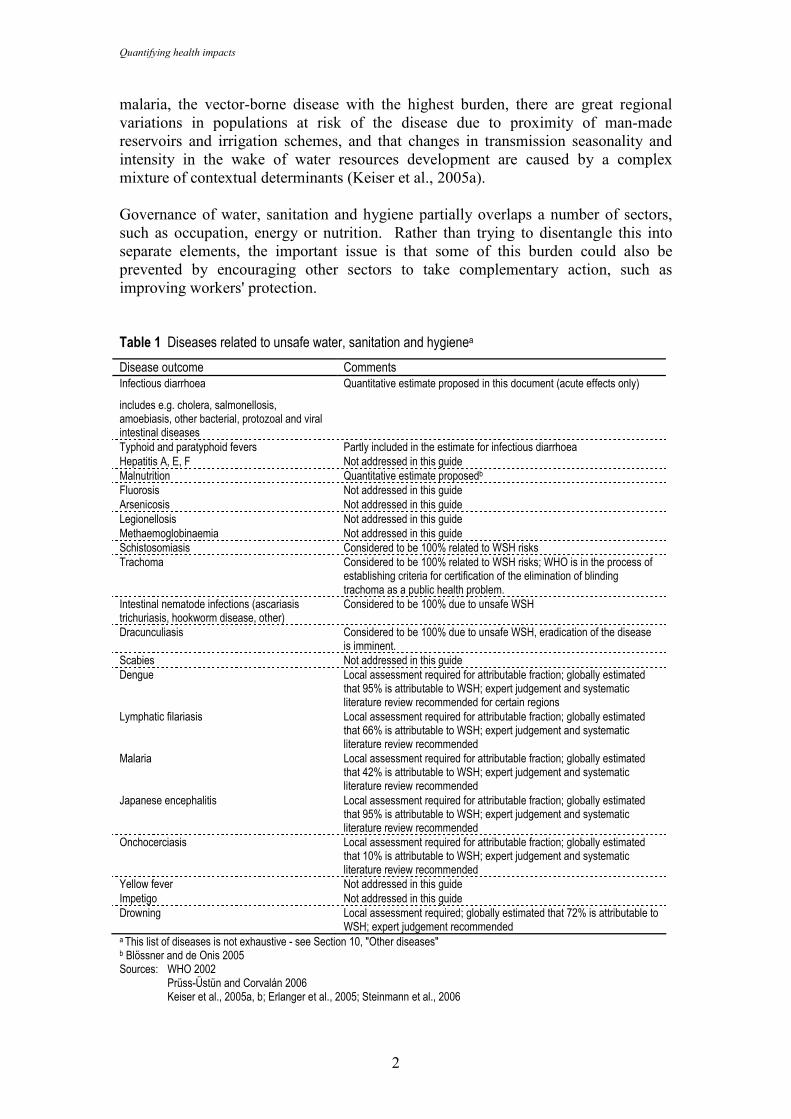
While the impact of some of these risks has been quantified at global level and can be quantified at national and sub-national level, the impact of others is still difficult to quantify with systematic methods. Table 1 provides an overview of the diseases concerned and the possibilities of quantification as proposed by this guide. For diarrhoea, this guide provides detailed methods for quantification. The linkage to malnutrition is outlined in this guide and quantification of the burden of malnutrition attributable to WSH is covered in detail in a separate guide (Malnutrition - EBD series No. 12). Several infectious diseases such as intestinal nematode infections, schistosomiasis, trachoma or dengue in certain regions are almost entirely attributable to WSH-related risks. Quantification of the WSH-attributable fraction of the burden of other diseases, including malaria, lymphatic filariasis, onchocerciasis, dengue, Japanese encephalitis and drownings is proposed to be achieved based on the basis of expert judgment and supported by systematic literature reviews. The overall disease burden related to unsafe water, sanitation and hygiene was first examined at a global level in 1990 (Murray & Lopez, 1996), and was limited to diarrhoeal diseases. This estimate was revised in 2002 (WHO 2002; Prüss et al, 2002; Prüss-Üstün et al. 2004) based on a systematic and transparent method. Other estimates have since been performed, based on the same method (Cairncross and Valdmanis 2006). More recently, the impact of WSH on disease has been reassessed in a more comprehensive way (WHO 2007), which estimated that almost one tenth of the global burden of disease can be attributed to water, sanitation and hygiene (see section 19 for global results). Systematic literature reviews of the association between vector-borne disease burdens and water resources development were commissioned by WHO in 2004 from the Swiss Tropical Institute and showed that, for example for
Quantifying health impacts
2
malaria, the vector-borne disease with the highest burden, there are great regional variations in populations at risk of the disease due to proximity of man-made reservoirs and irrigation schemes, and that changes in transmission seasonality and intensity in the wake of water resources development are caused by a complex mixture of contextual determinants (Keiser et al., 2005a). Governance of water, sanitation and hygiene partially overlaps a number of sectors, such as occupation, energy or nutrition. Rather than trying to disentangle this into separate elements, the important issue is that some of this burden could also be prevented by encouraging other sectors to take complementary action, such as improving workers' protection. Table 1 Diseases related to unsafe water, sanitation and hygienea
Disease outcome Comments Infectious diarrhoea
includes e.g. cholera, salmonellosis, amoebiasis, other bacterial, protozoal and viral intestinal diseases
Quantitative estimate proposed in this document (acute effects only)
Typhoid and paratyphoid fevers Partly included in the estimate for infectious diarrhoea Hepatitis A, E, F Not addressed in this guide Malnutrition Quantitative estimate proposedb Fluorosis Not addressed in this guide Arsenicosis Not addressed in this guide Legionellosis Not addressed in this guide Methaemoglobinaemia Not addressed in this guide Schistosomiasis Considered to be 100% related to WSH risks Trachoma Considered to be 100% related to WSH risks; WHO is in the process of
establishing criteria for certification of the elimination of blinding trachoma as a public health problem.
Intestinal nematode infections (ascariasis trichuriasis, hookworm disease, other)
Considered to be 100% due to unsafe WSH
Dracunculiasis Considered to be 100% due to unsafe WSH, eradication of the disease is imminent.
Scabies Not addressed in this guide Dengue Local assessment required for attributable fraction; globally estimated
that 95% is attributable to WSH; expert judgement and systematic literature review recommended for certain regions
Lymphatic filariasis Local assessment required for attributable fraction; globally estimated that 66% is attributable to WSH; expert judgement and systematic literature review recommended
Malaria Local assessment required for attributable fraction; globally estimated that 42% is attributable to WSH; expert judgement and systematic literature review recommended
Japanese encephalitis Local assessment required for attributable fraction; globally estimated that 95% is attributable to WSH; expert judgement and systematic literature review recommended
Onchocerciasis Local assessment required for attributable fraction; globally estimated that 10% is attributable to WSH; expert judgement and systematic literature review recommended
Yellow fever Not addressed in this guide Impetigo Not addressed in this guide Drowning Local assessment required; globally estimated that 72% is attributable to
WSH; expert judgement recommended a This list of diseases is not exhaustive - see Section 10, "Other diseases" b Blössner and de Onis 2005 Sources: WHO 2002 Prüss-Üstün and Corvalán 2006
Keiser et al., 2005a, b; Erlanger et al., 2005; Steinmann et al., 2006
Water, sanitation and hygiene
3
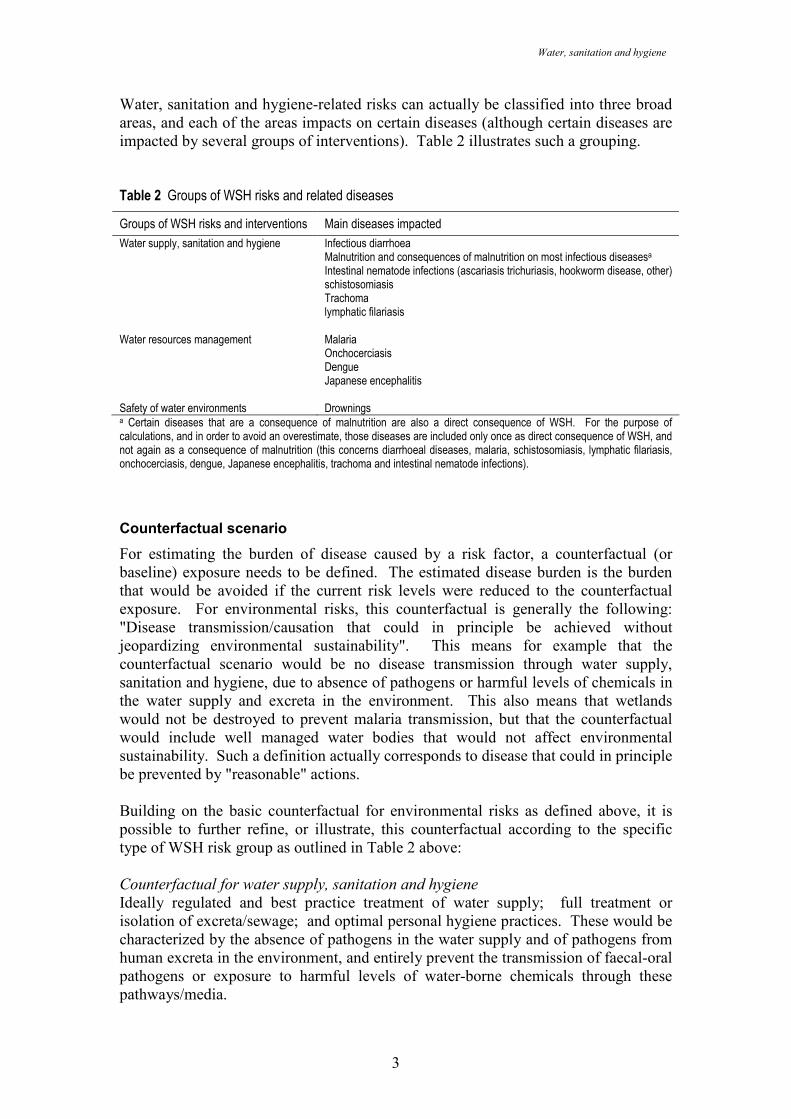
Water, sanitation and hygiene-related risks can actually be classified into three broad areas, and each of the areas impacts on certain diseases (although certain diseases are impacted by several groups of interventions). Table 2 illustrates such a grouping. Table 2 Groups of WSH risks and related diseases
Groups of WSH risks and interventions Main diseases impacted
Water supply, sanitation and hygiene Infectious diarrhoea Malnutrition and consequences of malnutrition on most infectious diseasesa Intestinal nematode infections (ascariasis trichuriasis, hookworm disease, other) schistosomiasis Trachoma lymphatic filariasis
Water resources management Malaria Onchocerciasis Dengue Japanese encephalitis
Safety of water environments Drownings a Certain diseases that are a consequence of malnutrition are also a direct consequence of WSH. For the purpose of calculations, and in order to avoid an overestimate, those diseases are included only once as direct consequence of WSH, and not again as a consequence of malnutrition (this concerns diarrhoeal diseases, malaria, schistosomiasis, lymphatic filariasis, onchocerciasis, dengue, Japanese encephalitis, trachoma and intestinal nematode infections).
Counterfactual scenario
For estimating the burden of disease caused by a risk factor, a counterfactual (or baseline) exposure needs to be defined. The estimated disease burden is the burden that would be avoided if the current risk levels were reduced to the counterfactual exposure. For environmental risks, this counterfactual is generally the following: "Disease transmission/causation that could in principle be achieved without jeopardizing environmental sustainability". This means for example that the counterfactual scenario would be no disease transmission through water supply, sanitation and hygiene, due to absence of pathogens or harmful levels of chemicals in the water supply and excreta in the environment. This also means that wetlands would not be destroyed to prevent malaria transmission, but that the counterfactual would include well managed water bodies that would not affect environmental sustainability. Such a definition actually corresponds to disease that could in principle be prevented by "reasonable" actions. Building on the basic counterfactual for environmental risks as defined above, it is possible to further refine, or illustrate, this counterfactual according to the specific type of WSH risk group as outlined in Table 2 above: Counterfactual for water supply, sanitation and hygiene
Ideally regulated and best practice treatment of water supply; full treatment or isolation of excreta/sewage; and optimal personal hygiene practices. These would be characterized by the absence of pathogens in the water supply and of pathogens from human excreta in the environment, and entirely prevent the transmission of faecal-oral pathogens or exposure to harmful levels of water-borne chemicals through these pathways/media.
Quantifying health impacts
4
Counterfactual for water resources management
Best design in implementation and management practices of water resource management projects (e.g. dams, irrigation, drainage) that minimize the transmission of vector-borne diseases, without jeopardizing environmental sustainability. This includes implementation of health safeguards, health risk mitigating measures and health promotion, contained in a public health management plan based on adequate assessment and evaluation of health risks of dams, irrigation schemes and other water resources developments. This should include contextual measures related to hydraulic structures, water management practices and human water contact patterns. Reduction of the most important risks through environmental engineering in existing projects using water resources for agricultural production, energy generation and other purposes must maintain ecological integrity (excluding, for example, the complete drainage of wetlands) and measures that contribute to environmental sustainability should be prioritized, as should those with dual benefits for example for the agricultural production system and for human health. Counterfactual for safety of water environments
Optimal safety of natural and man-made water environments without compromising the environments, within reasonable limits (physical barriers, information, prevention and rescue service, other safety measures and regulations). Such measures should not jeopardize environmental sustainability (e.g. in terms of circulation/reproduction of animals) 1.2 Choosing the study population
The study population is the population for which the disease burden is calculated. This guide mainly addresses populations at the level of entire countries or at the level of states or regions within countries. To meet the objectives, the study population should be selected according to the following criteria:
• Data availability and reliability. Information about risks, exposures and/or outcomes should be available for the study population. The required exposure data (e.g. access to safe water and adequate sanitation in absolute and relative terms, entomological inoculation rate in relation with vector-borne diseases) and health data (e.g. diarrhoeal disease incidence/mortality, incidence and mortality of other water-associated diseases, nutritional status) are generally available at country level, and sometimes also at district level or city level.
• Relative vulnerability. If certain vulnerable populations within a study perimeter have been identified and the water associated disease burden needs to be quantified, the first essential condition is that segregated health data should be available. Such vulnerable groups may include women, children, certain occupational groups or groups residing in very specific ecosystems such as wetlands. Socioeconomic status will be an important modulating factor in identifying specific vulnerable groups.
• Chance of success for specific interventions targeted at the population. In the selection of a study population, the potential success or failure of targeted
Water, sanitation and hygiene
5
WSH interventions and the level of certainty linked to different interventions should contribute to the final choice.
• Representativeness. The selection of the study population should favour those populations that make up a representative sample for larger population groups or other population groups in similar settings, with a view to possibly scaling up successful interventions.
2. Summary of the method
The quantitative assessment of health impacts due to unsafe WSH is based on five methodologies: (a) exposure-based method for infectious diarrhoea; (b) malnutrition described in detail in EBD series No. 12, of which, globally, 50% are estimated to be due to WSH-related risks; (c) full attribution to WSH for schistosomiasis, trachoma, ascariasis, trichuriasis, hookworm disease and, in certain regions, dengue; (d) expert judgement recommended for malaria, lymphatic filariasis, Japanese encephalitis, onchocerciasis, drownings and, in certain regions, dengue; (e) systematic literature reviews of the nature and magnitude of the association between water resources development and vector-borne diseases.
A) Set the framework
• define the objectives of the quantification: policy formulation, programme development or intervention testing;
• choose the study population of interest;
• select diseases of interest, among the following:
− diarrhoea
− malnutrition
− intestinal nematode infections (ascariasis trichuriasis, hookworm disease, other)
− schistosomiasis
− trachoma
− malaria
− lymphatic filariasis
− onchocerciasis
− dengue
− Japanese encephalitis
− drownings
• collect health statistics (mortality, incidence or DALYs, for children under five and adults or alternative age groups), for the selected diseases.

Quantifying health impacts
6
B) Diarrhoeal diseases
• assess exposure to drinking water, sanitation and related hygiene, according to six defined typical scenarios, including the following (in brief):
− Improved drinking water and sanitation in countries where more than 98% of the population has access to those services
− Improved drinking water and improved sanitation
− Improved sanitation, but no improved drinking water
− Improved drinking water, but no improved sanitation
− Neither improved drinking water nor improved sanitation;
• match the exposure scenarios with relative risk information;
• use the formula for estimating the attributable fraction: AF = Σ pi RRi - 1Σ pi RRi
(including the proportion of uneposed in the formula, ∑pi=1)
• multiply the attributable fraction with the disease statistics (deaths, incidence or DALYs);
• estimate or describe uncertainty, analyse the sensitivity of the assumptions made.
C) Malnutrition
• Assess health consequences of childhood malnutrition (based on EBD series No. 12); required data include
− mortality (and possible incidence or DALYs) from infectious diseases in children under the age of five years;
− percentage of children with weight-for-age below two standard deviations below the mean;
• Apply 50% of the disease burden estimated for malnutrition (or estimate the locally applicable fraction on the basis of expert opinion), except of the diseases which are already directly caused by water, sanitation and hygiene.
D) Diseases almost entirely attributable to WSH
• collect health statistics (mortality, incidence or DALYs, for children under five and adults or alternative age groups), for the selected diseases;
• for schistosomiasis, distinguish between environmental determinants of transmission, and water-associated behavioural determinants as a further basis for policy formulation and intervention design.
Water, sanitation and hygiene
7
E) Other diseases
• decide whether experts are going to be consulted on estimation of attributable fractions;
• if so, collect local data on the subject and design a procedure to consult experts;
• collect and consolidate expert opinion on attributable fractions;
• multiply the attributable fraction with the disease statistics (deaths, incidence or DALYs).
F) Systematic literature reviews
(optional, according to available resources/required accuracy, and in particular for vector-borne diseases)
• within the boundaries set for the study group, prepare an inventory of sources of articles and reports, including the international peer-reviewed literature, national scientific journals and grey literature;
• prepare a locally relevant transmission pathway framework;
• set criteria for a systematic literature review in accordance with the study objectives and the transmission pathway framework;
• carry out the review in an iterative way;
• test assumptions made in the process for their sensitivity;
• publish outcome of the review in a report.
G) Synthesis
• summarize and present results.
Quantifying health impacts
8
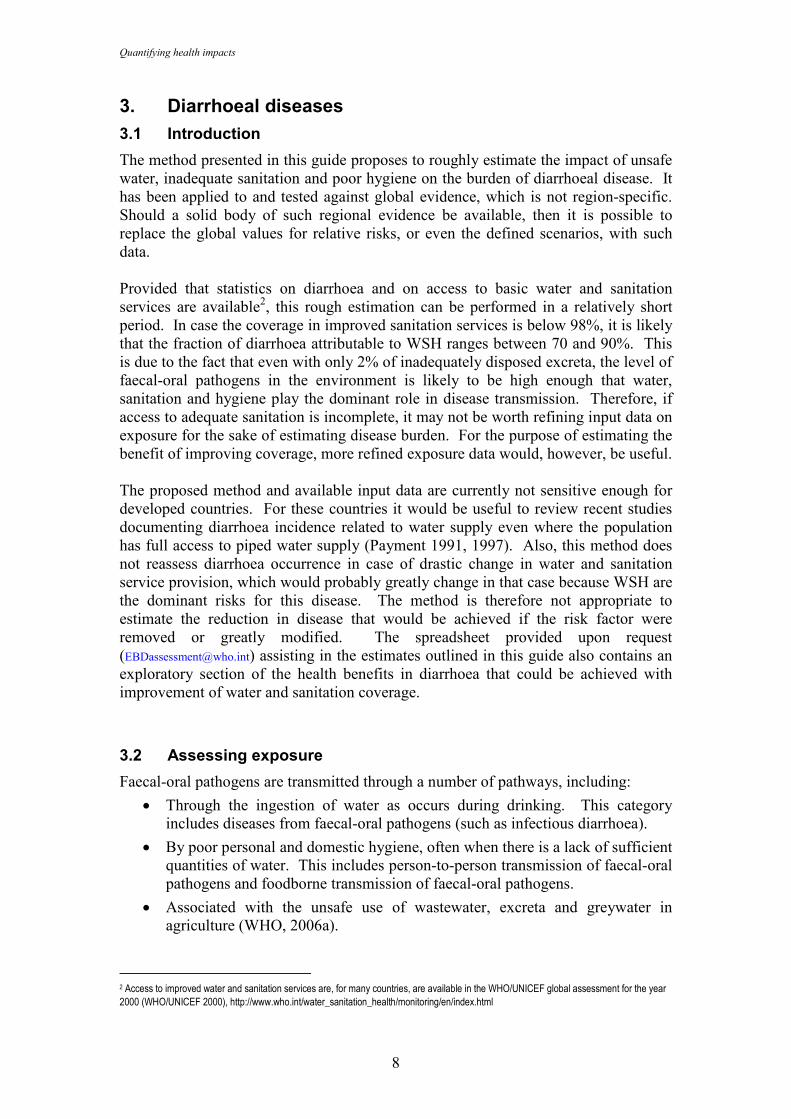
3. Diarrhoeal diseases
3.1 Introduction
The method presented in this guide proposes to roughly estimate the impact of unsafe water, inadequate sanitation and poor hygiene on the burden of diarrhoeal disease. It has been applied to and tested against global evidence, which is not region-specific. Should a solid body of such regional evidence be available, then it is possible to replace the global values for relative risks, or even the defined scenarios, with such data. Provided that statistics on diarrhoea and on access to basic water and sanitation services are available2, this rough estimation can be performed in a relatively short period. In case the coverage in improved sanitation services is below 98%, it is likely that the fraction of diarrhoea attributable to WSH ranges between 70 and 90%. This is due to the fact that even with only 2% of inadequately disposed excreta, the level of faecal-oral pathogens in the environment is likely to be high enough that water, sanitation and hygiene play the dominant role in disease transmission. Therefore, if access to adequate sanitation is incomplete, it may not be worth refining input data on exposure for the sake of estimating disease burden. For the purpose of estimating the benefit of improving coverage, more refined exposure data would, however, be useful. The proposed method and available input data are currently not sensitive enough for developed countries. For these countries it would be useful to review recent studies documenting diarrhoea incidence related to water supply even where the population has full access to piped water supply (Payment 1991, 1997). Also, this method does not reassess diarrhoea occurrence in case of drastic change in water and sanitation service provision, which would probably greatly change in that case because WSH are the dominant risks for this disease. The method is therefore not appropriate to estimate the reduction in disease that would be achieved if the risk factor were removed or greatly modified. The spreadsheet provided upon request ([email protected]) assisting in the estimates outlined in this guide also contains an exploratory section of the health benefits in diarrhoea that could be achieved with improvement of water and sanitation coverage.
3.2 Assessing exposure
Faecal-oral pathogens are transmitted through a number of pathways, including:
• Through the ingestion of water as occurs during drinking. This category includes diseases from faecal-oral pathogens (such as infectious diarrhoea).
• By poor personal and domestic hygiene, often when there is a lack of sufficient quantities of water. This includes person-to-person transmission of faecal-oral pathogens and foodborne transmission of faecal-oral pathogens.
• Associated with the unsafe use of wastewater, excreta and greywater in agriculture (WHO, 2006a).
2 Access to improved water and sanitation services are, for many countries, are available in the WHO/UNICEF global assessment for the year 2000 (WHO/UNICEF 2000), http://www.who.int/water_sanitation_health/monitoring/en/index.html
Water, sanitation and hygiene
9
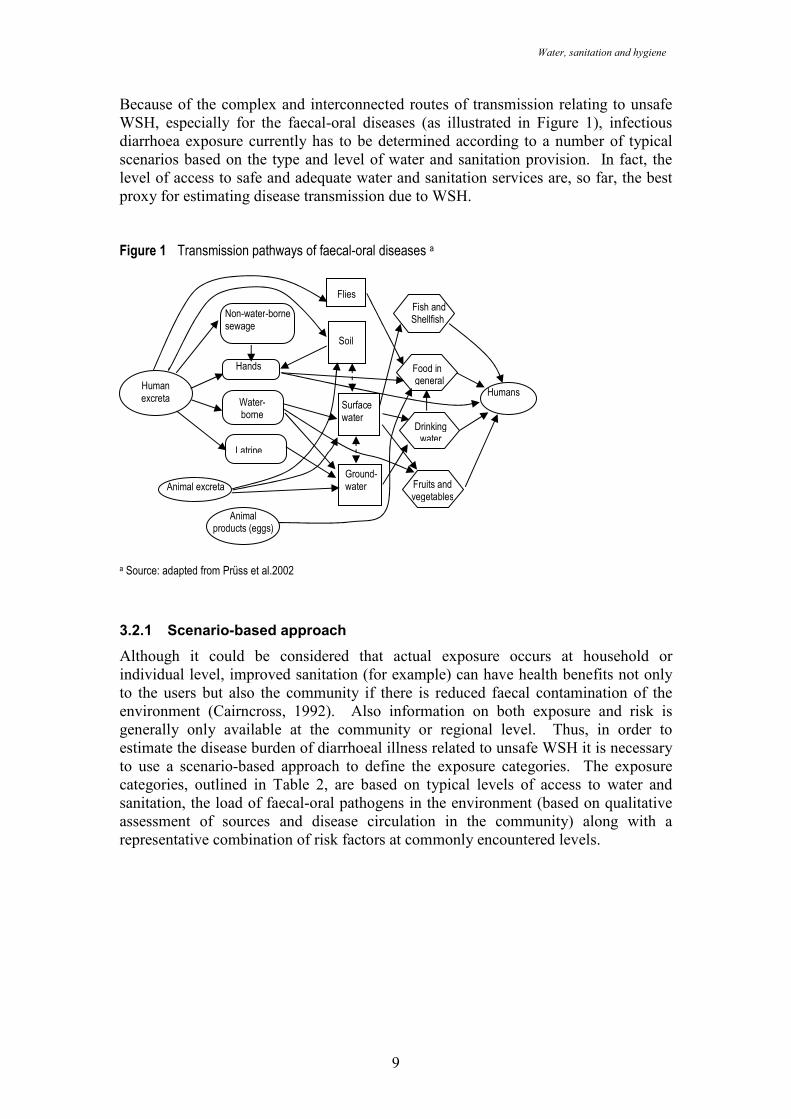
Because of the complex and interconnected routes of transmission relating to unsafe WSH, especially for the faecal-oral diseases (as illustrated in Figure 1), infectious diarrhoea exposure currently has to be determined according to a number of typical scenarios based on the type and level of water and sanitation provision. In fact, the level of access to safe and adequate water and sanitation services are, so far, the best proxy for estimating disease transmission due to WSH.
Figure 1 Transmission pathways of faecal-oral diseases a
a Source: adapted from Prüss et al.2002
3.2.1 Scenario-based approach
Although it could be considered that actual exposure occurs at household or individual level, improved sanitation (for example) can have health benefits not only to the users but also the community if there is reduced faecal contamination of the environment (Cairncross, 1992). Also information on both exposure and risk is generally only available at the community or regional level. Thus, in order to estimate the disease burden of diarrhoeal illness related to unsafe WSH it is necessary to use a scenario-based approach to define the exposure categories. The exposure categories, outlined in Table 2, are based on typical levels of access to water and sanitation, the load of faecal-oral pathogens in the environment (based on qualitative assessment of sources and disease circulation in the community) along with a representative combination of risk factors at commonly encountered levels.
Human excreta
Latrine
Water-borne
Non-water-borne sewage
Hands
Soil
Animal excreta
Surface water
Ground- water
Drinking water
Food in general
Humans
Fish and Shellfish
Flies
Animal products (eggs)
Fruits and vegetables
Quantifying health impacts
10
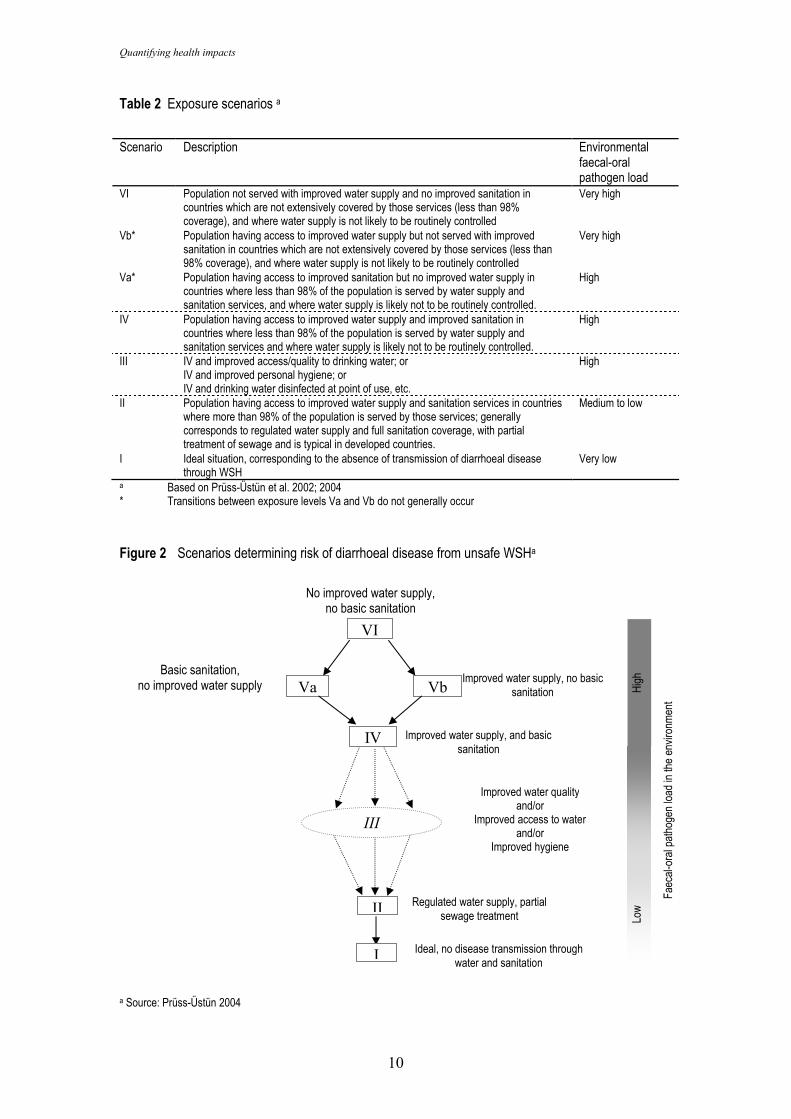
Table 2 Exposure scenarios a
Scenario Description Environmental
faecal-oral pathogen load
VI Population not served with improved water supply and no improved sanitation in countries which are not extensively covered by those services (less than 98% coverage), and where water supply is not likely to be routinely controlled
Very high
Vb* Population having access to improved water supply but not served with improved sanitation in countries which are not extensively covered by those services (less than 98% coverage), and where water supply is not likely to be routinely controlled
Very high
Va* Population having access to improved sanitation but no improved water supply in countries where less than 98% of the population is served by water supply and sanitation services, and where water supply is likely not to be routinely controlled.
High
IV Population having access to improved water supply and improved sanitation in countries where less than 98% of the population is served by water supply and sanitation services and where water supply is likely not to be routinely controlled.
High
III IV and improved access/quality to drinking water; or IV and improved personal hygiene; or IV and drinking water disinfected at point of use, etc.
High
II Population having access to improved water supply and sanitation services in countries where more than 98% of the population is served by those services; generally corresponds to regulated water supply and full sanitation coverage, with partial treatment of sewage and is typical in developed countries.
Medium to low
I Ideal situation, corresponding to the absence of transmission of diarrhoeal disease through WSH
Very low
a Based on Prüss-Üstün et al. 2002; 2004 * Transitions between exposure levels Va and Vb do not generally occur
Figure 2 Scenarios determining risk of diarrhoeal disease from unsafe WSHa
a Source: Prüss-Üstün 2004
Improved water supply, no basic sanitation
No improved water supply, no basic sanitation
VI
Va Basic sanitation,
no improved water supply Vb
IV Improved water supply, and basic sanitation
II
III
Regulated water supply, partial sewage treatment
I Ideal, no disease transmission through water and sanitation
Faec
al-oral p
atho
gen load
in th
e en
vironm
ent
High
Low
Improved water quality and/or
Improved access to water and/or
Improved hygiene
Water, sanitation and hygiene
11
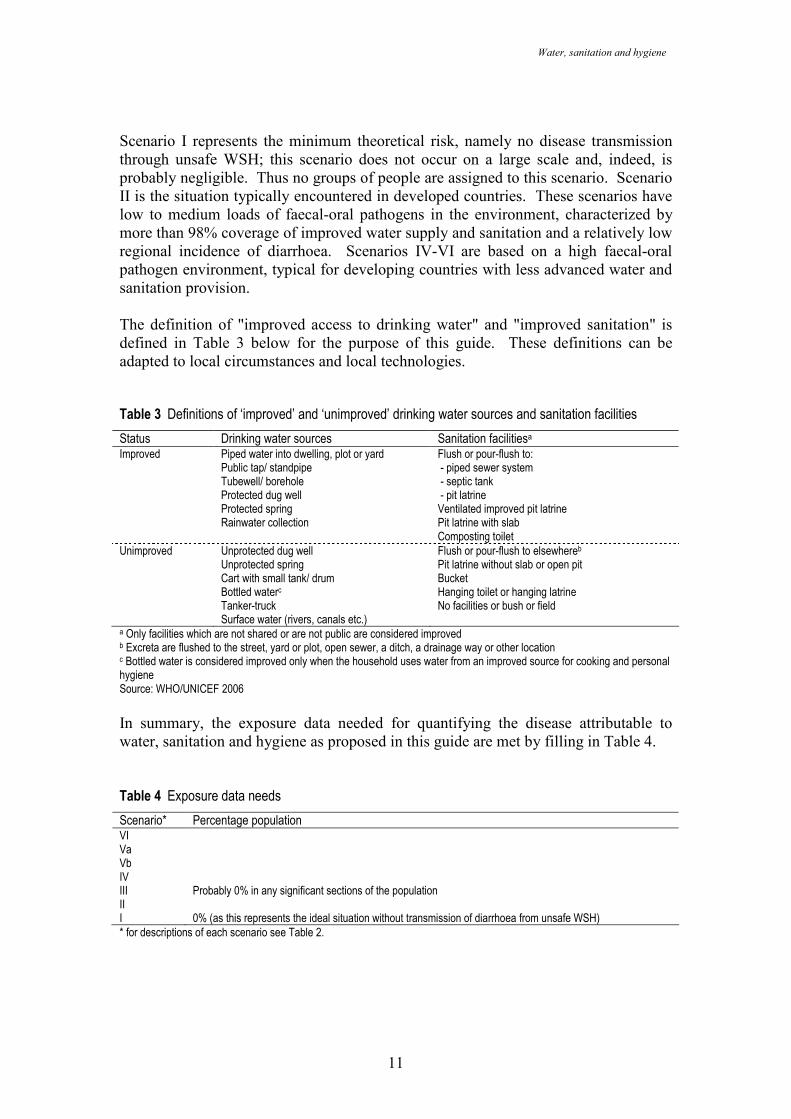
Scenario I represents the minimum theoretical risk, namely no disease transmission through unsafe WSH; this scenario does not occur on a large scale and, indeed, is probably negligible. Thus no groups of people are assigned to this scenario. Scenario II is the situation typically encountered in developed countries. These scenarios have low to medium loads of faecal-oral pathogens in the environment, characterized by more than 98% coverage of improved water supply and sanitation and a relatively low regional incidence of diarrhoea. Scenarios IV-VI are based on a high faecal-oral pathogen environment, typical for developing countries with less advanced water and sanitation provision. The definition of "improved access to drinking water" and "improved sanitation" is defined in Table 3 below for the purpose of this guide. These definitions can be adapted to local circumstances and local technologies. Table 3 Definitions of ‘improved’ and ‘unimproved’ drinking water sources and sanitation facilities
Status Drinking water sources Sanitation facilitiesa Improved Piped water into dwelling, plot or yard Flush or pour-flush to: Public tap/ standpipe - piped sewer system Tubewell/ borehole - septic tank Protected dug well - pit latrine Protected spring Ventilated improved pit latrine Rainwater collection Pit latrine with slab Composting toilet Unimproved Unprotected dug well Flush or pour-flush to elsewhereb Unprotected spring Pit latrine without slab or open pit Cart with small tank/ drum Bucket Bottled waterc Hanging toilet or hanging latrine Tanker-truck No facilities or bush or field Surface water (rivers, canals etc.) a Only facilities which are not shared or are not public are considered improved b Excreta are flushed to the street, yard or plot, open sewer, a ditch, a drainage way or other location c Bottled water is considered improved only when the household uses water from an improved source for cooking and personal hygiene Source: WHO/UNICEF 2006
In summary, the exposure data needed for quantifying the disease attributable to water, sanitation and hygiene as proposed in this guide are met by filling in Table 4. Table 4 Exposure data needs
Scenario* Percentage population VI Va Vb IV III Probably 0% in any significant sections of the population II I 0% (as this represents the ideal situation without transmission of diarrhoea from unsafe WSH) * for descriptions of each scenario see Table 2.
Quantifying health impacts
12
3.2.2 Sources of exposure data
The exposure scenarios were selected according to available information on exposure-risk relationships (see Section 3.3) and the type of exposure information that is generally available at country level. Data on access to safe drinking-water and adequate sanitation may be available from the following sources:
• national or sub-national census reports
• national or sub-national household surveys
• project reports of local NGOs (though they may use alternative definitions).
Alternatively, information on exposure distribution to the various exposure scenarios is also contained within the Joint Monitoring Programme (JMP) on global water supply and sanitation assessment 2000 (WHO/UNICEF 2006). JMP is a compilation of Demographic Health Surveys (DHS)3, Multiple Indicator Cluster Surveys (MICS)4, the World Health Survey5, other international surveys, and national census and surveys.
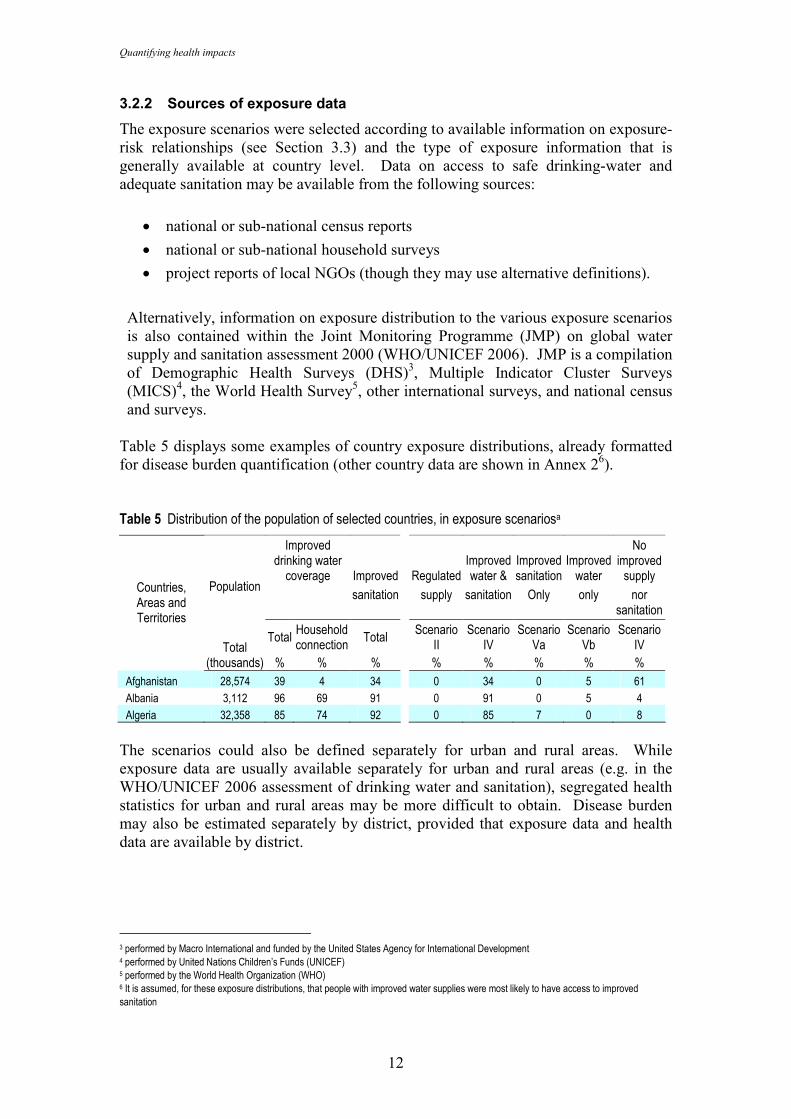
Table 5 displays some examples of country exposure distributions, already formatted for disease burden quantification (other country data are shown in Annex 26). Table 5 Distribution of the population of selected countries, in exposure scenariosa
Improved drinking water
coverage Improved Regulated Improved water &
Improved sanitation
Improved water
No improved supply
sanitation supply sanitation Only only nor sanitation
Population
Total Total
Household connection
Total Scenario
II Scenario
IV
Scenario Va
Scenario Vb
Scenario IV
Countries, Areas and Territories
(thousands) % % % % % % % %
Afghanistan 28,574 39 4 34 0 34 0 5 61
Albania 3,112 96 69 91 0 91 0 5 4
Algeria 32,358 85 74 92 0 85 7 0 8
The scenarios could also be defined separately for urban and rural areas. While exposure data are usually available separately for urban and rural areas (e.g. in the WHO/UNICEF 2006 assessment of drinking water and sanitation), segregated health statistics for urban and rural areas may be more difficult to obtain. Disease burden may also be estimated separately by district, provided that exposure data and health data are available by district.
3 performed by Macro International and funded by the United States Agency for International Development 4 performed by United Nations Children’s Funds (UNICEF) 5 performed by the World Health Organization (WHO) 6 It is assumed, for these exposure distributions, that people with improved water supplies were most likely to have access to improved sanitation
Water, sanitation and hygiene
13
3.3 Relative risks
The fact that for faecal-oral pathogens the water route is a major transmission pathway is well established (Andersson & Bohan 2001; Hunter 1997; Esrey et al. 1991). The following subsections briefly outline the evidence, derived from the peer-reviewed literature, for the causal links between infectious diarrhoea and water, sanitation and hygiene before going on to examine the relative risks associated with the scenarios outlined in the previous section.
3.3.1 Background on infectious diarrhoea causality
A large part of the studies that have examined WSH and diarrhoea are intervention studies, which have looked at changes in water supply, excreta disposal or hygiene practices, and have assessed the effects on diarrhoea morbidity (Fewtrell & Colford, 2004; Fewtrell et al., 2005). Case-control studies, particularly following outbreaks suspected to be caused by potable water contamination in the developed nations make up another significant group of investigations (Hunter et al. 2003).
Sanitation
Ideally, sanitation (here restricted to human excreta management) should result in the isolation and/or destruction of pathogenic material and, hence, a break in the transmission pathway. In a comprehensive literature review, Esrey et al. (1991) identified 30 studies, from a variety of different countries (including Bangladesh, Brazil, Chile, Guatemala, Kenya, Malaysia and Panama), that examined the impact of sanitation on disease transmission. Twenty-one of those studies reported health improvements (median 22% reduction in diarrhoea morbidity), with a greater median reduction seen in the rigorous studies (36% reduction). In a later meta-analysis only two sanitation intervention studies were identified that could be used in the analysis (Azurin & Alvero, 1974; Daniels et al. 1990), which estimated a significant reduction in diarrhoea levels of approximately 32% (Fewtrell & Colford 2004). Meddings et al. (2004) in a case-control study found that patients with diarrhoea were less likely than controls to live in houses with improved latrines (OR=0.57; 95% CI 0.42-0.77 for children aged less than five). In addition, several studies have isolated various faecal-oral pathogens from the faeces of sick people and the transmission of such pathogens isolated from infected faeces to human host has also been demonstrated (e.g. for Shigella spp., Dupont et al. 1989).
Water
The continuing occurrence and number of outbreaks of infectious disease caused by faecal-oral pathogens in developed countries attests to the efficiency of this mode of transmission. In the United States of America, for example, 19 outbreaks of gastroenteritis with an infectious etiology associated with drinking water were reported in the two year period 2001-2002 (Blackburn et al. 2004). In developing countries, it is not only water contaminated at source or during distribution that is an issue, but water stored within the home where it may become contaminated (Gundry et al. 2004), although arguably this is a matter of water quality management and domestic hygiene. Numerous epidemiological studies and outbreak investigations have also found an association between poor water quality and infectious diarrhoea (Hunter et al. 2003).
Quantifying health impacts
14
Hygiene
A number of studies have attempted to examine the role of personal and domestic hygiene, although in many cases some of the ‘hygiene’ measures or interventions could also impact on sanitation, and hygiene interventions may also interact with water quality. Six studies examined by Esrey et al. 1991 identified reductions in diarrhoea morbidity associated with hygiene interventions; these ranged from 14% to 48%, with a median reduction of 33%. Curtis and Cairncross (2003) conducted a systematic review and meta-analysis of the impact of handwashing with soap on diarrhoea morbidity. They found studies from diverse locations including the USA, Bangladesh, India, Myanmar, Guinea, Indonesia and Brazil and the results of the meta-analysis suggested that handwashing with soap could reduce diarrhoea morbidity by 47%. Similar results for all hygiene interventions were reported by Fewtrell & Colford (2004) in their meta-analysis. The temporal adoption of hygiene measures can be illustrated by the study by Ahmed et al. (1993). This group compared cleanliness and diarrhoea levels in villages with and without hygiene education interventions. Higher adoption rates of the intervention were associated with a better cleanliness state, which was paralleled by a decrease in diarrhoea and malnutrition rates. The differences were found to increase over time as more villagers adopted the intervention. A review by Feachem (1984) documented the presence of pathogens on the hands following toilet activities, as did Hoque (2003), who also found that different handwashing practices affected the residual bacterial contamination of the hands.
3.3.2 Relative risks associated with exposure scenarios
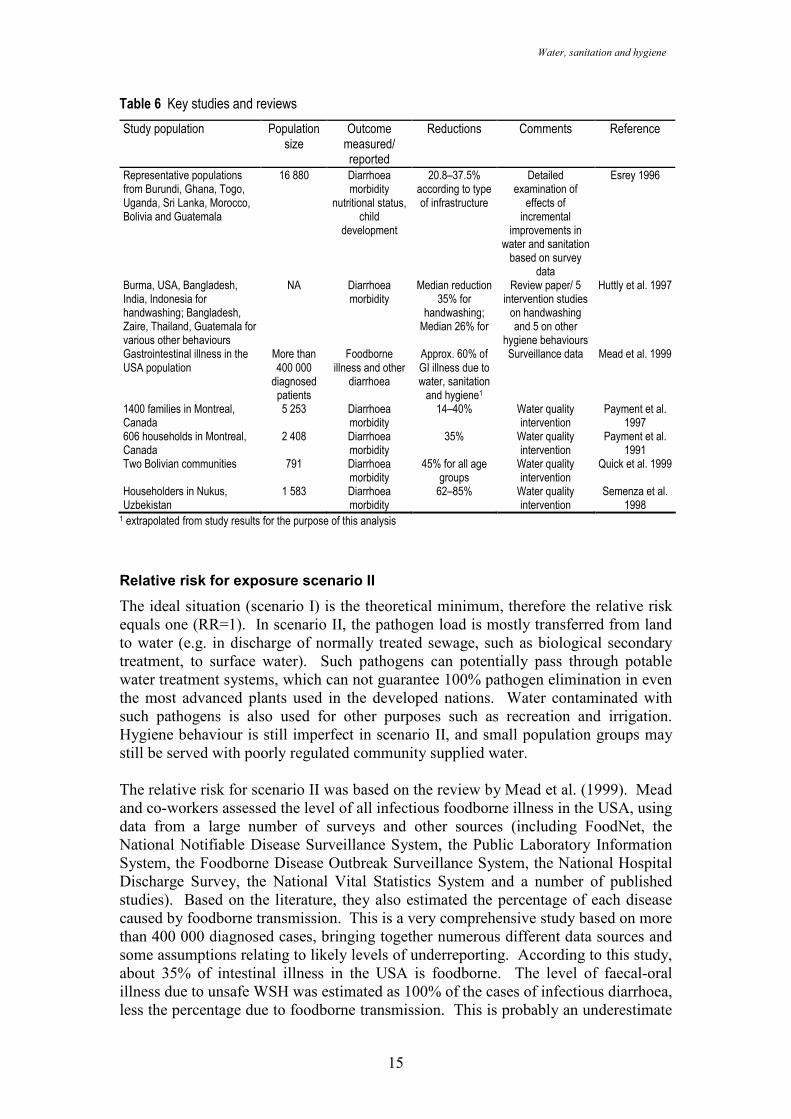
The relative risk values for each of the exposure scenarios have been derived from the literature. They could be replaced by more locally applicable values if such were available. In that case, it should be ensured that the data are representative for the country and that they are, for example, not subject to seasonal effects. For the global relative risks proposed here, selected major reviews, multi-country studies or studies of superior design to quantify the transition between two or more chosen exposure scenarios were selected. This literature includes the review and multi-country study by Esrey (Esrey et al. 1991; Esrey 1996), the reviews by Huttly (1997) and Mead (1999), in conjunction with key literature and high quality studies published since the review papers (Quick et al. 1999; Semenza et al. 1998; Payment et al. 1991; 1997). The major part of this literature is based on intervention studies and surveillance information. The final selection of used studies depended largely on the degree to which the study exposure data could be matched with the chosen exposure scenarios and also the sample size and quality of studies. Further details on the chosen studies are outlined in Table 6.
Water, sanitation and hygiene
15
Table 6 Key studies and reviews
Study population Population size
Outcome measured/ reported
Reductions Comments Reference
Representative populations from Burundi, Ghana, Togo, Uganda, Sri Lanka, Morocco, Bolivia and Guatemala
16 880 Diarrhoea morbidity
nutritional status, child
development
20.8–37.5% according to type of infrastructure
Detailed examination of
effects of incremental
improvements in water and sanitation based on survey
data
Esrey 1996
Burma, USA, Bangladesh, India, Indonesia for handwashing; Bangladesh, Zaire, Thailand, Guatemala for various other behaviours
NA Diarrhoea morbidity
Median reduction 35% for
handwashing; Median 26% for
Review paper/ 5 intervention studies on handwashing and 5 on other
hygiene behaviours
Huttly et al. 1997
Gastrointestinal illness in the USA population
More than 400 000
diagnosed patients
Foodborne illness and other
diarrhoea
Approx. 60% of GI illness due to water, sanitation and hygiene1
Surveillance data Mead et al. 1999
1400 families in Montreal, Canada
5 253 Diarrhoea morbidity
14–40% Water quality intervention
Payment et al. 1997
606 households in Montreal, Canada
2 408 Diarrhoea morbidity
35% Water quality intervention
Payment et al. 1991
Two Bolivian communities 791 Diarrhoea morbidity
45% for all age groups
Water quality intervention
Quick et al. 1999
Householders in Nukus, Uzbekistan
1 583 Diarrhoea morbidity
62–85% Water quality intervention
Semenza et al. 1998
1 extrapolated from study results for the purpose of this analysis
Relative risk for exposure scenario II
The ideal situation (scenario I) is the theoretical minimum, therefore the relative risk equals one (RR=1). In scenario II, the pathogen load is mostly transferred from land to water (e.g. in discharge of normally treated sewage, such as biological secondary treatment, to surface water). Such pathogens can potentially pass through potable water treatment systems, which can not guarantee 100% pathogen elimination in even the most advanced plants used in the developed nations. Water contaminated with such pathogens is also used for other purposes such as recreation and irrigation. Hygiene behaviour is still imperfect in scenario II, and small population groups may still be served with poorly regulated community supplied water. The relative risk for scenario II was based on the review by Mead et al. (1999). Mead and co-workers assessed the level of all infectious foodborne illness in the USA, using data from a large number of surveys and other sources (including FoodNet, the National Notifiable Disease Surveillance System, the Public Laboratory Information System, the Foodborne Disease Outbreak Surveillance System, the National Hospital Discharge Survey, the National Vital Statistics System and a number of published studies). Based on the literature, they also estimated the percentage of each disease caused by foodborne transmission. This is a very comprehensive study based on more than 400 000 diagnosed cases, bringing together numerous different data sources and some assumptions relating to likely levels of underreporting. According to this study, about 35% of intestinal illness in the USA is foodborne. The level of faecal-oral illness due to unsafe WSH was estimated as 100% of the cases of infectious diarrhoea, less the percentage due to foodborne transmission. This is probably an underestimate
Quantifying health impacts
16
as unsafe WSH is known to play a role in some foodborne transmission (e.g. through irrigation of food products with pathogen-contaminated water or via an infected food handler). After deduction of the portion of foodborne transmission through aerosols of certain viruses (estimated as up to 25% for rotavirus and astrovirus), the remaining fraction attributable to unsafe WSH is about 60%. This order of magnitude is supported by intervention studies acting on point-of-use treatment of drinking water in Canada (Payment et al. 1991, 1997) and a meta-analysis of hand-washing interventions in the United States, Canada and Australia (Fewtrell & Colford 2004), reporting reductions of 40%, 35% and 42% respectively. A preliminary assessment by Hunter et al. (2005) suggests that up to about 15% of gastrointestinal illness in the UK, may be associated with consumption of drinking water that has been contaminated as a result of a burst water main or other loss of pressure in the distribution system. A 60% reduction in disease corresponds to a relative risk of 2.5 (RR=1/(1-0.6)) for exposure scenario II.
Risk transition between scenarios II and IV
The shift between scenarios II and IV represents the transition between high and relatively low pathogen loads in the community environment, or more generally between developed and developing regions. Intervention studies are not available as it is not possible to transform environments “high” in pathogen load into environments “low” in pathogen load, which would imply completing the coverage in improved sanitation in a reasonable time frame and without simultaneous change in other major determinants of health. Some studies do, however, describe elements of this risk transition between scenario II and IV by acting on selected characteristics of the differences of these scenarios, and their results were used to estimate the transmission between scenarios II and IV. These studies include the following:
• The transition between scenarios IV and II is associated with improved drinking-water quality: Introduction of point-of-use disinfection. Quick et al. (1999) examined the level of diarrhoea prevention that could be achieved through point-of-use water treatment along with safe water storage. The reason for selecting this study is that the intervention strongly reduces the pathway of transmission through drinking water, and “simulates” the reduction that could be achieved by improved drinking water quality and its handling inside the house. The study randomized 791 participants into two groups; the intervention group received a special storage container (preventing hand contact with the stored water) and a supply of disinfectant. The control group not receiving the intervention was similar in terms of demographic characteristics, sanitary conditions and baseline water quality. During the baseline investigations only 5% of household samples were free of E. coli. During the study period this varied between 0 and 13% of the control group (with the median level being between 5 000 and 85 000/100ml), while the intervention group exceeded 50% of households at all times, rising to almost 80% on one occasion (median E. coli counts were zero, throughout). Overall diarrhoea reductions of 44.7% in the total population and 54.5% in children were reported by Quick et al. (RR=1.81 and 2.20). The reduction of 44.7% was selected as a component in the transition between II and IV in this analysis.
Water, sanitation and hygiene
17
• One additional study is worthy of note. This randomized intervention study was conducted in 240 households (120 with and 120 without access to municipal piped water), with a total population of 1 583, in Uzbekistan (Semenza et al. 1998). Residents from approximately half of the households without piped water were trained to chlorinate their drinking water within the home and store it in a safe manner. Diarrhoea morbidity was markedly lower in the home chlorination group 28.8/1 000 subjects/month, compared to 75.5/1 000 in the piped water group and 179.2/1 000 in the no piped water group (i.e. a 62% reduction in diarrhoea rates for an intervention with home-chlorination of drinking water, as compared to those living in areas with access to piped water (RR=2.6), in households without a piped supply, the same intervention achieved a 85% reduction in disease (RR=6.7)). The authors consider that home chlorination of water is unlikely to affect disease transmission via other routes, suggesting that a large fraction of the diarrhoeal pathogens in this area were spread through water.
• Scenario IV and improved personal hygiene: Reductions in diarrhoea morbidity have been reviewed by Huttly et al. (1997), and handwashing resulted in a median 35% reduction in diarrhoea incidence (RR=1.5). The results of this review outline possible achievements due to a reduction in the transmission pathway of hygiene, which in itself is conditioned by the pathogen load in the environment and ready access to water for hygiene purposes.
The literature currently does not provide solid evidence on the achievements from piped water.
Risk transition between scenarios IV and VI
The multicountry study conducted by Esrey (1996) provides data to allow calculation of relative risks between scenarios IV, Va, Vb and VI. This study examined whether incremental health effects relating to diarrhoea and nutritional status resulted from incremental improvements in water and sanitation conditions and was based on Demographic and Health Surveys (DHS) from eight countries from different regions (Ghana, Togo, Burundi, Uganda, Bolivia, Guatemala, Morocco and Sri Lanka). The Demographic and Health Surveys included information on diarrhoea prevalence, child weight, child height, child age, source of drinking water and type of sanitation facility. In addition, the survey data-sets were supplemented by field studies that determined current levels of diarrhoea prevalence in children aged 3–36 months. According to this study, a reduction of 20.8% in diarrhoeal disease rates (RR=1.26) can be observed when progressing from scenario VI to Vb (i.e. when providing an improved water supply), and 37.5% (RR=1.6) when progressing from VI to Va (i.e. when providing basic sanitation facilities). When progressing from VI to IV (i.e. when providing both an improved water supply and basic sanitation facilities), a reduction of 37.5% is also achieved. This implies that no further reduction in diarrhoeal disease is achieved when implementing an “improved water supply” in terms of protected sources for water collection (rather than piped supplies), when basic sanitation is already available. These data are supported by the results of Esrey’s review (Esrey et al. 1991), which provides similar results for the same types of interventions. The recent meta-analysis (Fewtrell et al. 2005) of risk reduction from water supply and sanitation interventions could not be used to provide relative risk values, as the
Quantifying health impacts
18
analysis did not differentiate for the introduction of an improved water supply by sanitation status (i.e. whether or not improved sanitation was already in place). The results are nevertheless very similar to the risk reductions used in this guide.
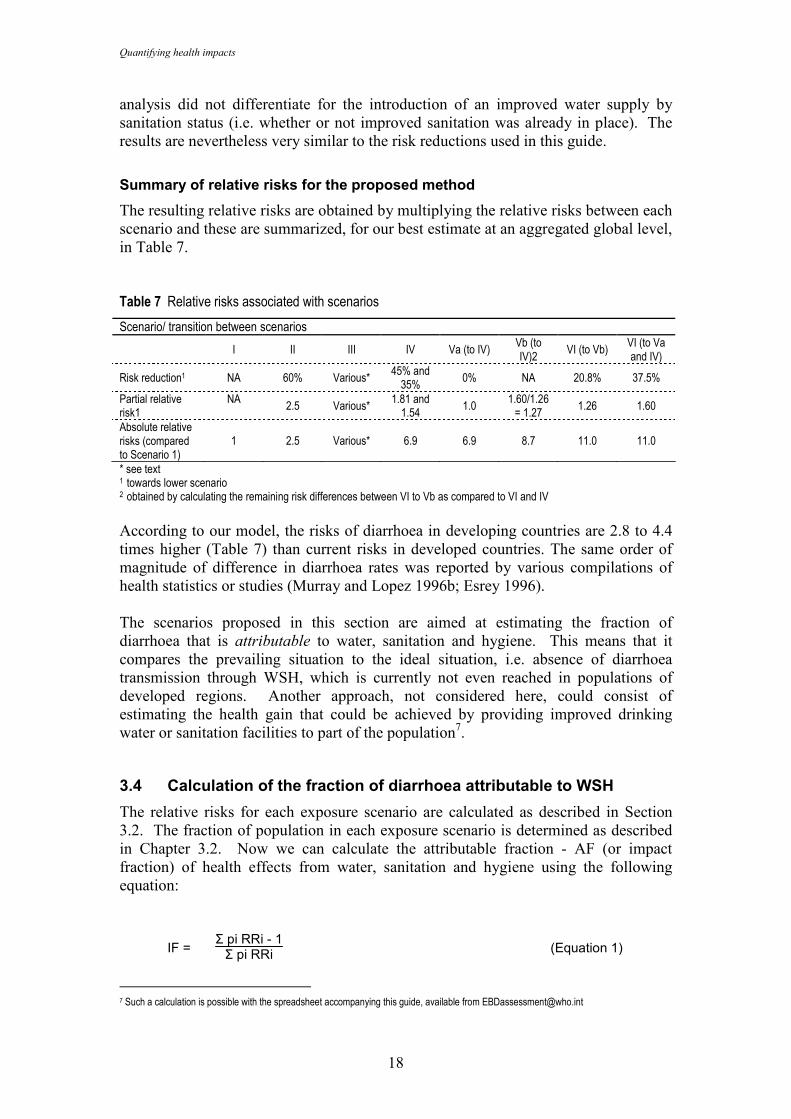
Summary of relative risks for the proposed method
The resulting relative risks are obtained by multiplying the relative risks between each scenario and these are summarized, for our best estimate at an aggregated global level, in Table 7. Table 7 Relative risks associated with scenarios
Scenario/ transition between scenarios
I II III IV Va (to IV) Vb (to IV)2
VI (to Vb) VI (to Va and IV)
Risk reduction1 NA 60% Various* 45% and 35%
0% NA 20.8% 37.5%
Partial relative risk1
NA 2.5 Various*
1.81 and 1.54
1.0 1.60/1.26 = 1.27
1.26 1.60
Absolute relative risks (compared to Scenario 1)
1 2.5 Various* 6.9 6.9 8.7 11.0 11.0
* see text 1 towards lower scenario 2 obtained by calculating the remaining risk differences between VI to Vb as compared to VI and IV
According to our model, the risks of diarrhoea in developing countries are 2.8 to 4.4 times higher (Table 7) than current risks in developed countries. The same order of magnitude of difference in diarrhoea rates was reported by various compilations of health statistics or studies (Murray and Lopez 1996b; Esrey 1996). The scenarios proposed in this section are aimed at estimating the fraction of diarrhoea that is attributable to water, sanitation and hygiene. This means that it compares the prevailing situation to the ideal situation, i.e. absence of diarrhoea transmission through WSH, which is currently not even reached in populations of developed regions. Another approach, not considered here, could consist of estimating the health gain that could be achieved by providing improved drinking water or sanitation facilities to part of the population7. 3.4 Calculation of the fraction of diarrhoea attributable to WSH
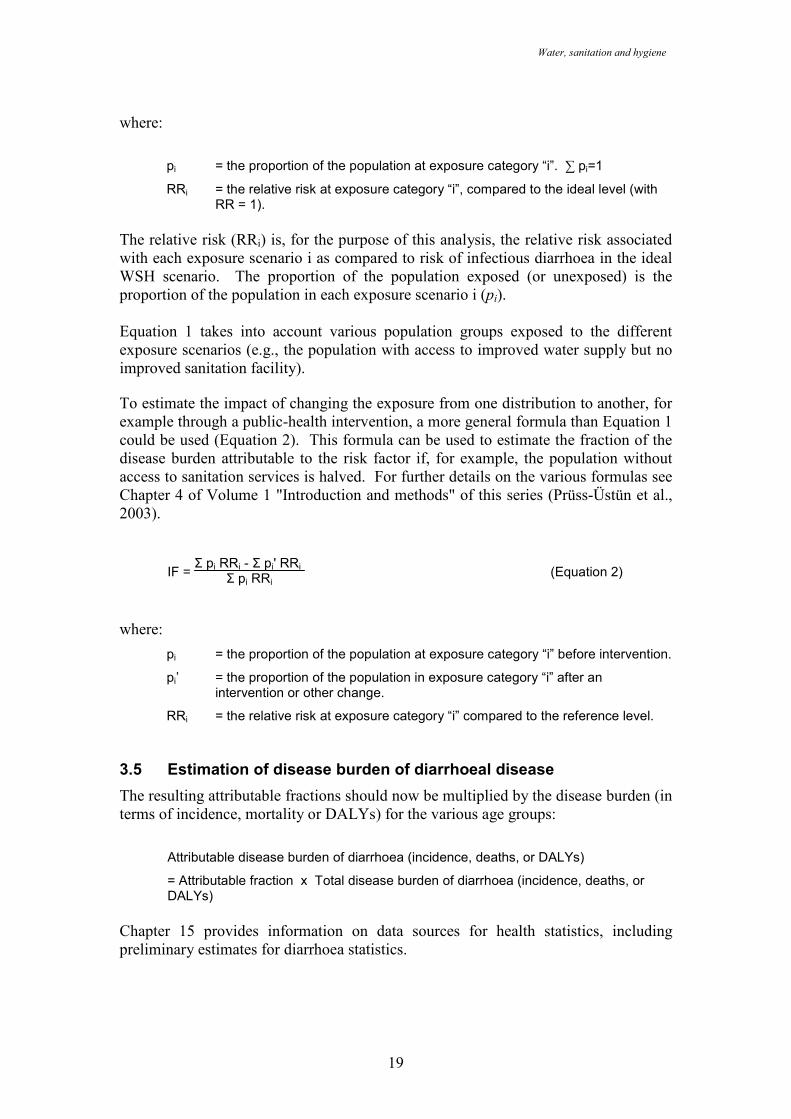
The relative risks for each exposure scenario are calculated as described in Section 3.2. The fraction of population in each exposure scenario is determined as described in Chapter 3.2. Now we can calculate the attributable fraction - AF (or impact fraction) of health effects from water, sanitation and hygiene using the following equation:
IF = Σ pi RRi - 1Σ pi RRi (Equation 1)
7 Such a calculation is possible with the spreadsheet accompanying this guide, available from [email protected]
Water, sanitation and hygiene
19
where:
pi = the proportion of the population at exposure category “i”. ∑ pi=1
RRi = the relative risk at exposure category “i”, compared to the ideal level (with RR = 1).
The relative risk (RRi) is, for the purpose of this analysis, the relative risk associated with each exposure scenario i as compared to risk of infectious diarrhoea in the ideal WSH scenario. The proportion of the population exposed (or unexposed) is the proportion of the population in each exposure scenario i (pi). Equation 1 takes into account various population groups exposed to the different exposure scenarios (e.g., the population with access to improved water supply but no improved sanitation facility). To estimate the impact of changing the exposure from one distribution to another, for example through a public-health intervention, a more general formula than Equation 1 could be used (Equation 2). This formula can be used to estimate the fraction of the disease burden attributable to the risk factor if, for example, the population without access to sanitation services is halved. For further details on the various formulas see Chapter 4 of Volume 1 "Introduction and methods" of this series (Prüss-Üstün et al., 2003).
IF = Σ pi RRi - Σ pi' RRi
Σ pi RRi (Equation 2)
where:
pi = the proportion of the population at exposure category “i” before intervention.
pi’ = the proportion of the population in exposure category “i” after an intervention or other change.
RRi = the relative risk at exposure category “i” compared to the reference level. 3.5 Estimation of disease burden of diarrhoeal disease
The resulting attributable fractions should now be multiplied by the disease burden (in terms of incidence, mortality or DALYs) for the various age groups:
Attributable disease burden of diarrhoea (incidence, deaths, or DALYs)
= Attributable fraction x Total disease burden of diarrhoea (incidence, deaths, or DALYs)
Chapter 15 provides information on data sources for health statistics, including preliminary estimates for diarrhoea statistics.
Quantifying health impacts
20
4. Intestinal nematode infections
Ascariasis is caused by the large roundworm Ascaris lumbricoides. Eggs are passed in the faeces of an infected person and in poor sanitation conditions may contaminate water and soil. Ingestion of infective eggs, from contaminated soil or from uncooked products contaminated with soil or wastewater containing infective eggs, results the infection. Transmission does not occur from person to person. The eggs can survive for months or years in favourable conditions and can, thus, pose an infective hazard for a considerable period of time. Numerous studies have investigated the link of access to safe water and adequate sanitation with the disease (Esrey et al., 1991). In particular, increased risk was associated with being exposed to untreated wastewater (Cifuentes 1998, Habbari et al. 2000), no use of latrines (Toma et al., 1999, Arfaa et al., 1977), and households without soap (Olsen et al. 2001). Trichuriasis is caused by ingestion of the human infectious eggs of the whipworm Trichuris trichuria. The infection is not directly transmittable from person to person. The modes of transmission are similar to ascariasis (Smith et al., 2001; Saldiva et al., 1999; Anderson et al., 1993). Also for trichuriasis, water supply and use of latrines were shown to reduce infections (e.g. Rajeswari et al., 1994, Narain et al., 2000). Hookworm infection is caused by Ancylostoma duodenale or Necator americanus, and results from the ingestion or skin penetration of the hookworm larvae in soil. Larvae develop in soil through the deposit of faeces containing eggs from infected persons. Poor sanitation and hygiene practices are, therefore, at the root of this infection. The disease is not transmitted from person to person. Intervention studies showing prevention of the disease by water, sanitation and hygiene are also numerous (Esrey et al., 1991, Sorensen et al., 1994, Olsen et al., 2001). Knowledge on disease transmission suggests that 100% of intestinal nematode infections can be prevented by adequate water, sanitation and hygiene. Several studies on the reinfection by intestinal nematodes (Norhayati et al., 1995) show that reinfection rates are relatively high after treatment. For example, in a study of over 1800 children in Brazil, Moraes and Cairncross (2004) found that sewerage and drainage infrastructure could significantly reduce transmission (and reinfection). This suggests that long-term strategies incorporating education on personal hygiene, provision of toilets and of access to safe water are important elements in strategies to sustainably reduce the disease. Estimated disease burden should be fully attributed to water, sanitation and hygiene. If such statistics are not available at the national level, prior estimates formulated by WHO could be used (Annex 3).
5. Childhood malnutrition
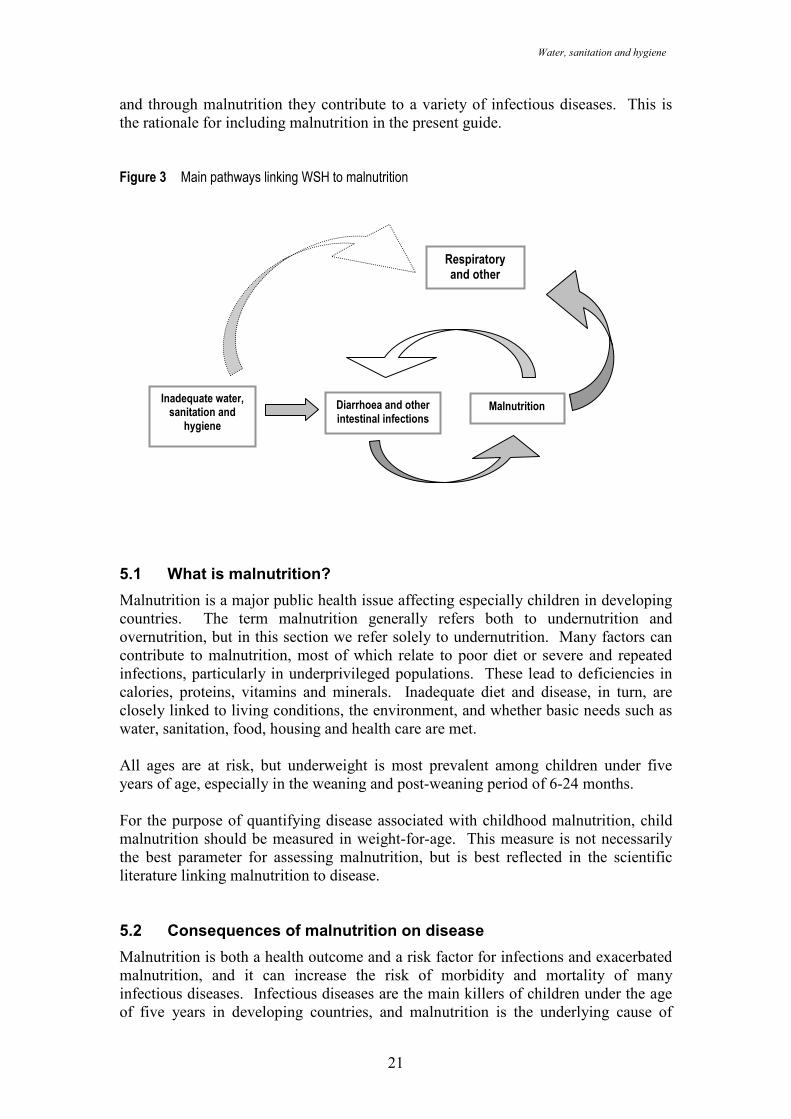
Water, sanitation and hygiene are closely linked to childhood malnutrition. WSH risks are a major cause of repeated gastro-intestinal infections, which may lead to reduced absorption of nutrients. This, in turn, causes malnutrition. The following sections outline this link, as well as the link to diseases caused as a consequence of childhood malnutrition (Figure 3). In simple terms, WSH risks cause malnutrition,
Water, sanitation and hygiene
21
and through malnutrition they contribute to a variety of infectious diseases. This is the rationale for including malnutrition in the present guide. Figure 3 Main pathways linking WSH to malnutrition
5.1 What is malnutrition?
Malnutrition is a major public health issue affecting especially children in developing countries. The term malnutrition generally refers both to undernutrition and overnutrition, but in this section we refer solely to undernutrition. Many factors can contribute to malnutrition, most of which relate to poor diet or severe and repeated infections, particularly in underprivileged populations. These lead to deficiencies in calories, proteins, vitamins and minerals. Inadequate diet and disease, in turn, are closely linked to living conditions, the environment, and whether basic needs such as water, sanitation, food, housing and health care are met. All ages are at risk, but underweight is most prevalent among children under five years of age, especially in the weaning and post-weaning period of 6-24 months. For the purpose of quantifying disease associated with childhood malnutrition, child malnutrition should be measured in weight-for-age. This measure is not necessarily the best parameter for assessing malnutrition, but is best reflected in the scientific literature linking malnutrition to disease. 5.2 Consequences of malnutrition on disease
Malnutrition is both a health outcome and a risk factor for infections and exacerbated malnutrition, and it can increase the risk of morbidity and mortality of many infectious diseases. Infectious diseases are the main killers of children under the age of five years in developing countries, and malnutrition is the underlying cause of
Malnutrition Diarrhoea and other intestinal infections
Inadequate water, sanitation and hygiene
Respiratory and other diseases
Quantifying health impacts
22
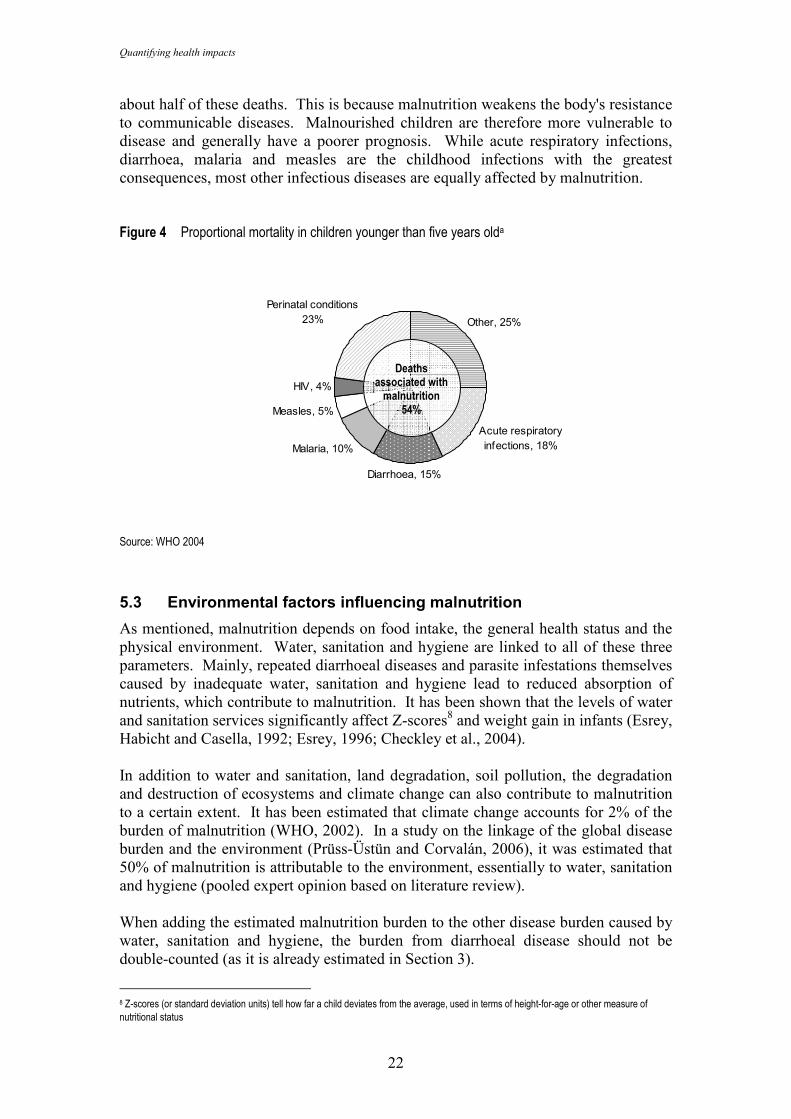
about half of these deaths. This is because malnutrition weakens the body's resistance to communicable diseases. Malnourished children are therefore more vulnerable to disease and generally have a poorer prognosis. While acute respiratory infections, diarrhoea, malaria and measles are the childhood infections with the greatest consequences, most other infectious diseases are equally affected by malnutrition. Figure 4 Proportional mortality in children younger than five years olda
Other, 25%
Acute respiratory infections, 18%
Diarrhoea, 15%
Malaria, 10%
Measles, 5%
HIV, 4%
Perinatal conditions 23%
Source: WHO 2004
5.3 Environmental factors influencing malnutrition
As mentioned, malnutrition depends on food intake, the general health status and the physical environment. Water, sanitation and hygiene are linked to all of these three parameters. Mainly, repeated diarrhoeal diseases and parasite infestations themselves caused by inadequate water, sanitation and hygiene lead to reduced absorption of nutrients, which contribute to malnutrition. It has been shown that the levels of water and sanitation services significantly affect Z-scores8 and weight gain in infants (Esrey, Habicht and Casella, 1992; Esrey, 1996; Checkley et al., 2004). In addition to water and sanitation, land degradation, soil pollution, the degradation and destruction of ecosystems and climate change can also contribute to malnutrition to a certain extent. It has been estimated that climate change accounts for 2% of the burden of malnutrition (WHO, 2002). In a study on the linkage of the global disease burden and the environment (Prüss-Üstün and Corvalán, 2006), it was estimated that 50% of malnutrition is attributable to the environment, essentially to water, sanitation and hygiene (pooled expert opinion based on literature review). When adding the estimated malnutrition burden to the other disease burden caused by water, sanitation and hygiene, the burden from diarrhoeal disease should not be double-counted (as it is already estimated in Section 3).
8 Z-scores (or standard deviation units) tell how far a child deviates from the average, used in terms of height-for-age or other measure of nutritional status
Deaths associated with malnutrition
54%
Water, sanitation and hygiene
23
5.4 Estimating the disease from WSH related malnutrition
A separate guide of the Environmental Burden of Disease series covers the quantification of disease burden caused by malnutrition (No. 12): "Malnutrition - Quantifying the health impact at national and local levels" (Blössner and de Onis 2005). This guide is accompanied by an excel spreadsheet to facilitate calculations. This guide assists in estimating the burden caused by childhood (and maternal) malnutrition, based on population data of weight-for-age in children and disease burden (deaths, incidence or DALYs) of infectious diseases and protein-energy malnutrition. The basic method applied to estimate the consequences of malnutrition in terms of health impact from infectious diseases in children under the age of 5 years consists of the following steps (Blössner and de Onis 2005; Fishman et al. 2004):
• estimation of the number of children with a weight-for-age below -2 standard deviations (SD) of the mean;
• estimation of fractions of mortality due to diarrhoeal disease, malaria, measles, lower respiratory infections, other infectious diseases (besides HIV) and protein-energy malnutrition that are attributable to malnutrition, based on relative risks from the literature;
• calculation of disease burden attributable to malnutrition by multiplying mortality statistics with attributable fractions.
As about 50% of malnutrition is caused by unsafe environmental conditions, essentially water, sanitation and hygiene, roughly half of the burden from childhood malnutrition estimated by the method outlined in the document "Malnutrition - Quantifying the health impact at national and local levels" can be attributed to water, sanitation and hygiene. Only the infectious diseases (besides HIV) which are not already directly caused by WSH should be taken into account here to avoid double-counting. This fraction of 50% of malnutrition may be re-estimated locally to take into account the local circumstances, in particular if they are likely to differ significantly from the proposed average. This may be the case in situations where children are disproportionately vulnerable to the determinants of malnutrition. For such an estimation, a suitable question to experts would be the following: "How much (as a percentage) of malnutrition (in deaths and DALYs) could, in principle, be avoided by environmental improvements (essentially water, sanitation and hygiene), without jeopardizing environmental sustainability".
6. Schistosomiasis
Schistosomiasis is caused by infection with trematodes of species belonging to the genus Schistosoma. Transmission of the disease occurs when people come into contact with water containing cercariae (the mobile, infective larval stage of the life cycle), which penetrate the skin. Water is contaminated by infected humans who excrete the schistosome eggs in their faeces or urine (depending on the Schistosoma species). The final link in the chain of infection is provided by an intermediate snail host, which the parasite needs in order to complete its life cycle. The water, sanitation and hygiene risk factors determining schistosomiasis transmission can be categorized
Quantifying health impacts
24
as infrastructural (access to adequate sanitation) and behavioural (hygiene habits, habits of urinating and defecation and contact patterns with contaminated water). Esrey et al. (1991) identified 12 studies that related water and sanitation facilities to the prevalence rates of schistosomiasis. Reported decreases in infection rates related to improved access to water and sanitation varied between 59 and 87%, with the median value of the rigorous studies being a 77% reduction. A number of studies have examined reinfection with schistosomiasis following a drug-based intervention programme (such as mass treatment or case detection and targeted treatment), suggesting that (1) treatment alone will not sustainably eliminate the disease and (2) that the plateau prevalence rates achieved by such interventions reflect the context specific risk factors. Current knowledge on disease transmission indicates that the disease is fully attributable to risks associated with unsafe WSH. Generally, lack of access to adequate sanitation will determine the contamination level of water bodies, lack of access to safe domestic water and to adequate sanitation will influence community exposure levels, and recreational and occupational water contact patterns will increase the risks for specific vulnerable groups. Estimated morbidity or mortality of schistosomiasis should therefore entirely be attributed to the risk factor. In the case such estimates are not available on the national level, prior estimates are provided by WHO (see Annex 3).
7. Trachoma
Trachoma is a chronic contagious eye disease, which can result in blindness, caused by Chlamydia trachomatis. Transmission occurs by several routes (Dolin et al. 1997), all of which are hygiene-related (e.g. direct infection by flies, person-to-person from clothing used to wipe children’s faces and by hand-to-face contact). Risk factors for the disease include lack of facial cleanliness, poor access to water supplies, lack of latrines and a high number of flies. Several environmental control measures are effective (Sutter & Ballard, 1983; Esrey et al., 1991; Emerson et al., 1999, 2000; Prüss and Mariotti, 2000), and trachoma can be considered to be almost 100% attributable to the environment. Estimated morbidity or mortality of trachoma should therefore be attributed to the water, sanitation and hygiene. In the case such estimates are not available on the national level, prior estimates are provided by WHO (see Annex 3).
8. Vector-borne diseases
Water-associated vector-borne diseases are distributed according to the ecologies that will support their propagation. Latitude and altitude boundaries limit this distribution and rainfall patterns influence the level of seasonality of disease transmission. In a number of natural settings where one or more vector-borne diseases are endemic, environmental interventions to reduce transmission risks are feasible. Where vector
Water, sanitation and hygiene
25
species occur that are ecologically highly versatile, however, such interventions are less effective and appropriate. The impact of human activities is superimposed over this natural distribution and is determined by a number of environmental and social factors, which provide an entry point for environmental interventions:
• Hydrological changes resulting from water resources development (introduction or extension of irrigation; construction of small of large dams) may
− lead to the introduction of new vector breeding sites in areas where they were not present before (particularly arid and semi-arid zones, introducing vectors;
− further extend the surface of existing vector breeding places, resulting in higher vector population densities;
− prolong the breeding period into the dry season, thereby shifting the transmission pattern from seasonal to perennial;
− increase the relative humidity, contributing to a longer average mosquito vector lifespan and enhancing the vectorial capacity of the vector population.
• Changes in patterns of human circulation, such as
− permanent resettlement into a new development project, of non-immunes into disease endemic areas or of disease carriers into a non-endemic area;
− seasonal migration associated with the agricultural cropping cycle.
• Infrastructural changes
− improved housing with greater protection to insect vectors;
− improved environmental sanitation, with less standing water and better drainage;
− improved and reliable access to drinking water, eliminating the need for unsafe water storage at home;
− better roads for improved access to health services and to health protective measures.
At the global level, systematic literature review has proved to be a valuable approach as a first step to the estimation of the vector-borne disease burden that can be attributed to water resources development projects. If possible, such a literature review should also be undertaken for publications concerning the study population. The following steps are proposed for a comprehensive review (adapted from: Keiser et al. 2005a):
• Prepare a causal web of vector-borne disease transmission pathways relevant to the study area (i.e. taking into account endemicity of diseases and the ecology of local vectors).
Quantifying health impacts
26
• Prepare an inventory of possible sources of relevant literature, i.e. web-based search engines, national council for science and technology, health sector institutions, universities, WHO and UNICEF offices and local NGOs. Some sources may be less obvious: in Sri Lanka, for example, a considerable amount of research reports on malaria have been published by the International Water Management Institute (e.g. Konradsen et al. 2000; Amerasinghe et al. 2001).
• Determine the distribution of human populations in relation to irrigation schemes and man-made reservoirs, based on a reasonable assumption of the flight range of local vectors, through national censuses and surveys and possibly local population databases, and considering possible informal settlements.
• Set the criteria for the systematic literature review and carry it out in an iterative way, until you are reasonably sure that all relevant information has been covered. For development projects, in principle, only studies and surveys should be included that provide reliable information from the pre-development baseline to the disease outcome when the project has become operational.
• Analyse, correlate and extrapolate the health information to the population at risk and prepare estimates of attributable fractions of the disease burden.
• If feasible, test the assumptions made in the analysis of the population at risk and the burden of disease extrapolation for their sensitivity.
• Prepare a final report on your findings.
8.1 Malaria
In humans, malaria is caused by a parasite belonging to the genus Plasmodium. The parasite is transmitted by the bite of an infected female mosquito of the genus Anopheles. The larval stages of Anopheles mosquitoes occur in a wide range of habitats, but most species share a preference for clear, unpolluted, stagnant or slowly moving fresh water (Muir, 1988). Some species of public health importance breed in brackish water. The fraction of malaria that can be prevented by environmental management depends on the local conditions and opportunities to influence vector habitats, their propagation and disease transmission. The main management opportunities include the following:
• Modify the environment. Permanently change land, water or vegetation conditions to reduce vector habitats, often through infrastructural works.
• Manipulate the environment. Recurrent activities, often with community involvement, to create temporary unfavourable conditions for vector propagation.
• Modify or manipulate human habitation or behaviour. Reduce contact between humans and vectors.
Examples of environmental modification options to control malaria include:
• draining;
• levelling land;
Water, sanitation and hygiene
27
• filling depressions, borrow pits, pools and ponds;
• contouring reservoirs;
• modifying river boundaries;
• lining canals to prevent seepage, and ensuring a proper gradient;
• constructing self-draining hydraulic structures, such as weirs, to avoid stagnant water;
• tree planting in areas with high water tables;
• designing small dams as cascading systems;
• designing overhead tanks and other water storage structures with practical covers.
Examples of environmental manipulation activities to control malaria include:
• removal of aquatic plants from water bodies where mosquito larvae may find shelter (de-weeding);
• alternate wetting and drying of irrigated paddy fields (formerly known as intermittent irrigation; van der Hoek et al., 2001);
• periodic flushing of natural and man-made waterways, where mosquito breeding may occur in standing pools;
• introduction of predators such as larvivorous fish;
• implementation of rule-curves for the management of reservoirs, to strand mosquito larvae on the shore through rapid draw down of water levels;
• synchronization of irrigation schedules in irrigated rice production systems;
• application of non-toxic surface tension reducing monolayers (particularly in small water collections in urban environments).
Changes in human habitation to modify contact with vectors can also lead to reduced burden. This may include screening of doors and windows, covering eaves with netting and peri-domestic environmental management to remove standing water. While the use of mosquito nets is, in principle, an environmental intervention, the use of insecticide treated mosquito nets is considered a chemical intervention because of its impact on vector lifespan. In certain ecosystems environmental management is not a feasible option at all, for example in the forested areas of S.E. Asia where Anopheles dirus is the main vector. In situations of instability (humanitarian disasters, civil strive) environmental modification measures add a considerable element of resilience to disease prevention, as they remain functional while regular health services may break down. A general example of a causal web for malaria transmission related to water resources development projects is presented in Figure 5.
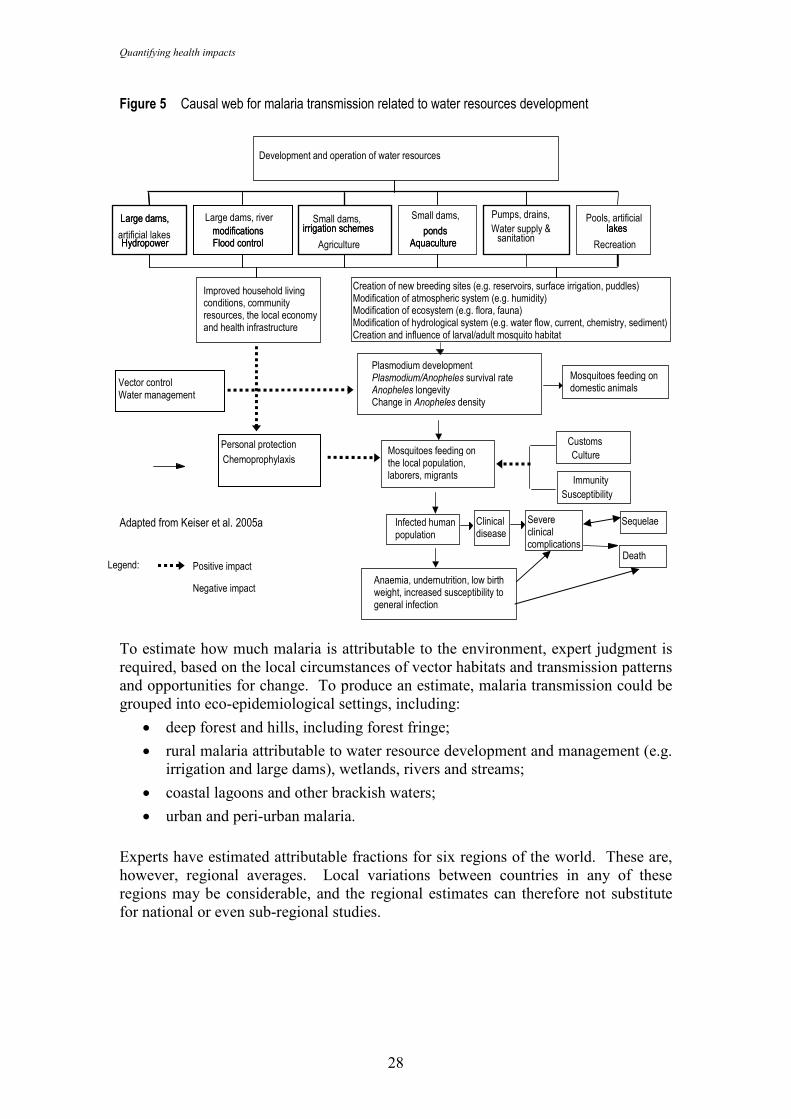
Quantifying health impacts
28
Figure 5 Causal web for malaria transmission related to water resources development Adapted from Keiser et al. 2005a
To estimate how much malaria is attributable to the environment, expert judgment is required, based on the local circumstances of vector habitats and transmission patterns and opportunities for change. To produce an estimate, malaria transmission could be grouped into eco-epidemiological settings, including:
• deep forest and hills, including forest fringe;
• rural malaria attributable to water resource development and management (e.g. irrigation and large dams), wetlands, rivers and streams;
• coastal lagoons and other brackish waters;
• urban and peri-urban malaria.
Experts have estimated attributable fractions for six regions of the world. These are, however, regional averages. Local variations between countries in any of these regions may be considerable, and the regional estimates can therefore not substitute for national or even sub-regional studies.
Infected human population
Large dams,
artificial lakes Hydropower
Small dams, irrigation schemes
Pumps, drains, Pools, artificial lakes
Mosquitoes feeding on domestic animals
Clinical disease
Small dams,
ponds Aquaculture
Chemoprophylaxis
Susceptibility
Large dams, river modifications Flood control
Plasmodium development Plasmodium/Anopheles survival rate Anopheles longevity Change in Anopheles density
Mosquitoes feeding on the local population, laborers, migrants
Vector control Water management
Development and operation of water resources
Large dams,
Hydropower irrigation schemes
Agriculture
Water supply & sanitation
lakes
Recreation ponds
Aquaculture
Personal protection Customs Culture
Immunity
Improved household living conditions, community resources, the local economy and health infrastructure
modifications Flood control
Legend: Positive impact
Negative impact
Creation of new breeding sites (e.g. reservoirs, surface irrigation, puddles) Modification of atmospheric system (e.g. humidity) Modification of ecosystem (e.g. flora, fauna) Modification of hydrological system (e.g. water flow, current, chemistry, sediment) Creation and influence of larval/adult mosquito habitat
Severe clinical complications
Death
Anaemia, undernutrition, low birth weight, increased susceptibility to general infection
Sequelae
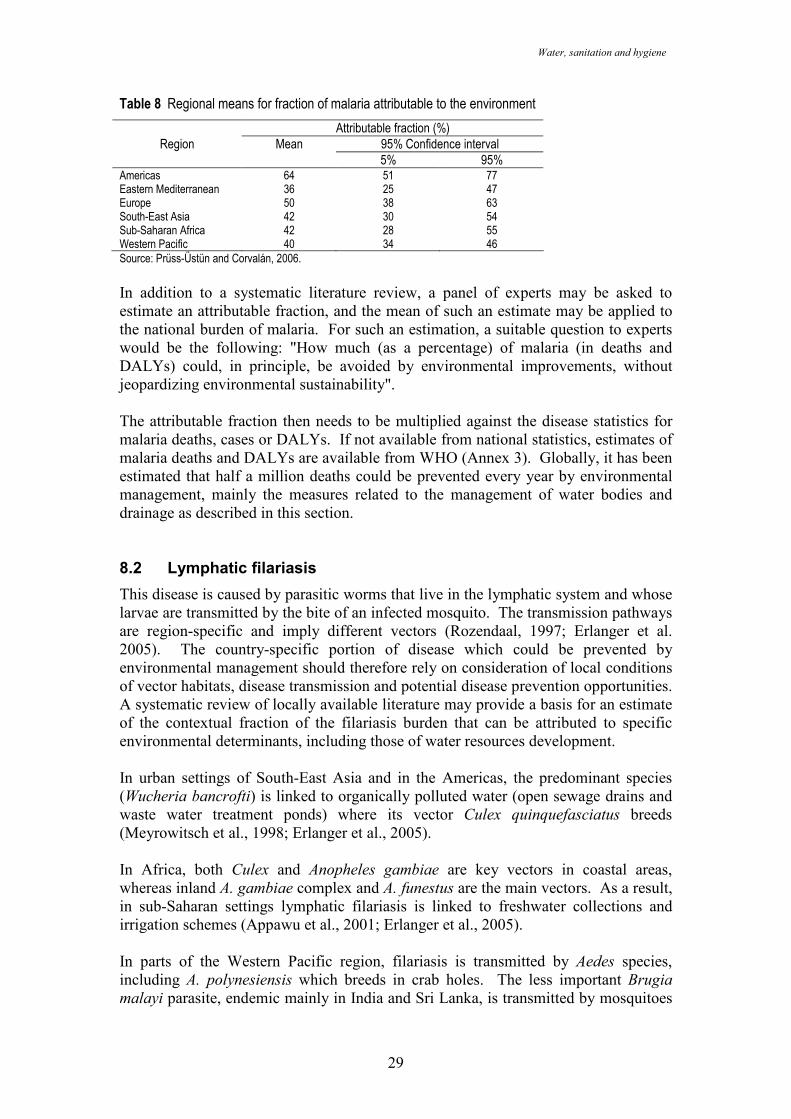
Water, sanitation and hygiene
29
Table 8 Regional means for fraction of malaria attributable to the environment
Attributable fraction (%) Region Mean 95% Confidence interval
5% 95% Americas 64 51 77 Eastern Mediterranean 36 25 47 Europe 50 38 63 South-East Asia 42 30 54 Sub-Saharan Africa 42 28 55 Western Pacific 40 34 46 Source: Prüss-Üstün and Corvalán, 2006.
In addition to a systematic literature review, a panel of experts may be asked to estimate an attributable fraction, and the mean of such an estimate may be applied to the national burden of malaria. For such an estimation, a suitable question to experts would be the following: "How much (as a percentage) of malaria (in deaths and DALYs) could, in principle, be avoided by environmental improvements, without jeopardizing environmental sustainability". The attributable fraction then needs to be multiplied against the disease statistics for malaria deaths, cases or DALYs. If not available from national statistics, estimates of malaria deaths and DALYs are available from WHO (Annex 3). Globally, it has been estimated that half a million deaths could be prevented every year by environmental management, mainly the measures related to the management of water bodies and drainage as described in this section. 8.2 Lymphatic filariasis
This disease is caused by parasitic worms that live in the lymphatic system and whose larvae are transmitted by the bite of an infected mosquito. The transmission pathways are region-specific and imply different vectors (Rozendaal, 1997; Erlanger et al. 2005). The country-specific portion of disease which could be prevented by environmental management should therefore rely on consideration of local conditions of vector habitats, disease transmission and potential disease prevention opportunities. A systematic review of locally available literature may provide a basis for an estimate of the contextual fraction of the filariasis burden that can be attributed to specific environmental determinants, including those of water resources development. In urban settings of South-East Asia and in the Americas, the predominant species (Wucheria bancrofti) is linked to organically polluted water (open sewage drains and waste water treatment ponds) where its vector Culex quinquefasciatus breeds (Meyrowitsch et al., 1998; Erlanger et al., 2005). In Africa, both Culex and Anopheles gambiae are key vectors in coastal areas, whereas inland A. gambiae complex and A. funestus are the main vectors. As a result, in sub-Saharan settings lymphatic filariasis is linked to freshwater collections and irrigation schemes (Appawu et al., 2001; Erlanger et al., 2005). In parts of the Western Pacific region, filariasis is transmitted by Aedes species, including A. polynesiensis which breeds in crab holes. The less important Brugia malayi parasite, endemic mainly in India and Sri Lanka, is transmitted by mosquitoes
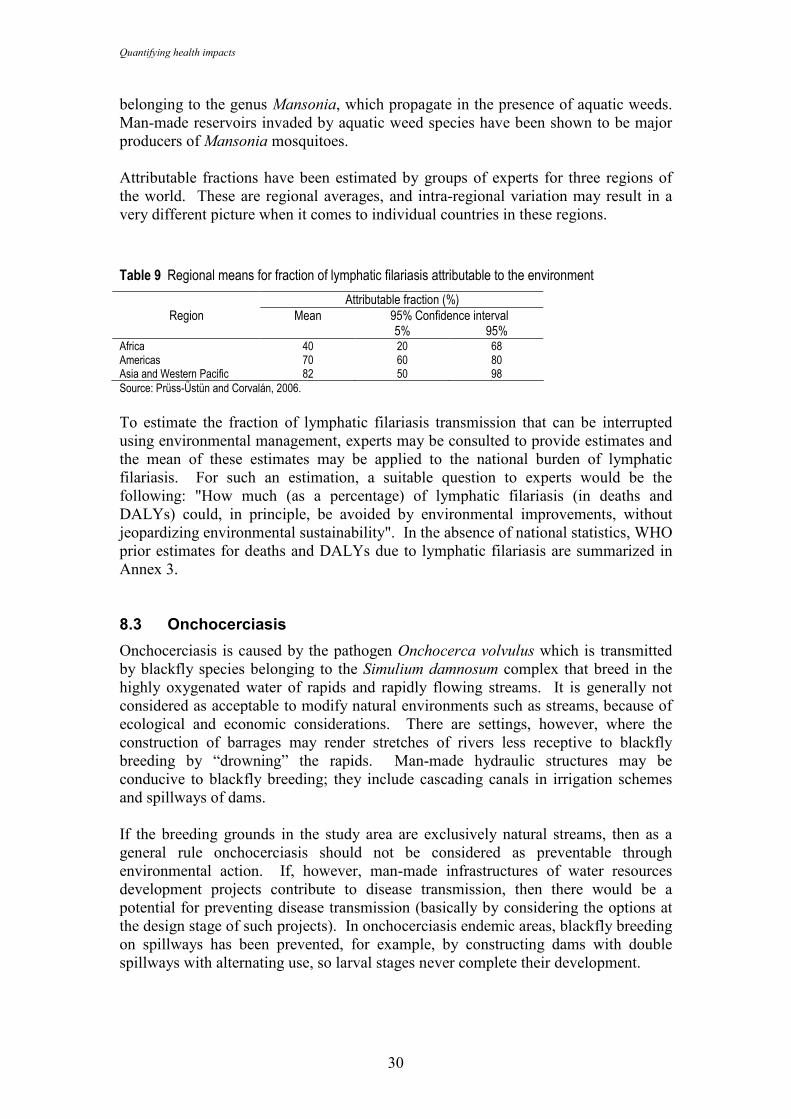
Quantifying health impacts
30
belonging to the genus Mansonia, which propagate in the presence of aquatic weeds. Man-made reservoirs invaded by aquatic weed species have been shown to be major producers of Mansonia mosquitoes. Attributable fractions have been estimated by groups of experts for three regions of the world. These are regional averages, and intra-regional variation may result in a very different picture when it comes to individual countries in these regions.
Table 9 Regional means for fraction of lymphatic filariasis attributable to the environment
Attributable fraction (%) Region Mean 95% Confidence interval
5% 95% Africa 40 20 68 Americas 70 60 80 Asia and Western Pacific 82 50 98 Source: Prüss-Üstün and Corvalán, 2006.
To estimate the fraction of lymphatic filariasis transmission that can be interrupted using environmental management, experts may be consulted to provide estimates and the mean of these estimates may be applied to the national burden of lymphatic filariasis. For such an estimation, a suitable question to experts would be the following: "How much (as a percentage) of lymphatic filariasis (in deaths and DALYs) could, in principle, be avoided by environmental improvements, without jeopardizing environmental sustainability". In the absence of national statistics, WHO prior estimates for deaths and DALYs due to lymphatic filariasis are summarized in Annex 3. 8.3 Onchocerciasis
Onchocerciasis is caused by the pathogen Onchocerca volvulus which is transmitted by blackfly species belonging to the Simulium damnosum complex that breed in the highly oxygenated water of rapids and rapidly flowing streams. It is generally not considered as acceptable to modify natural environments such as streams, because of ecological and economic considerations. There are settings, however, where the construction of barrages may render stretches of rivers less receptive to blackfly breeding by “drowning” the rapids. Man-made hydraulic structures may be conducive to blackfly breeding; they include cascading canals in irrigation schemes and spillways of dams. If the breeding grounds in the study area are exclusively natural streams, then as a general rule onchocerciasis should not be considered as preventable through environmental action. If, however, man-made infrastructures of water resources development projects contribute to disease transmission, then there would be a potential for preventing disease transmission (basically by considering the options at the design stage of such projects). In onchocerciasis endemic areas, blackfly breeding on spillways has been prevented, for example, by constructing dams with double spillways with alternating use, so larval stages never complete their development.
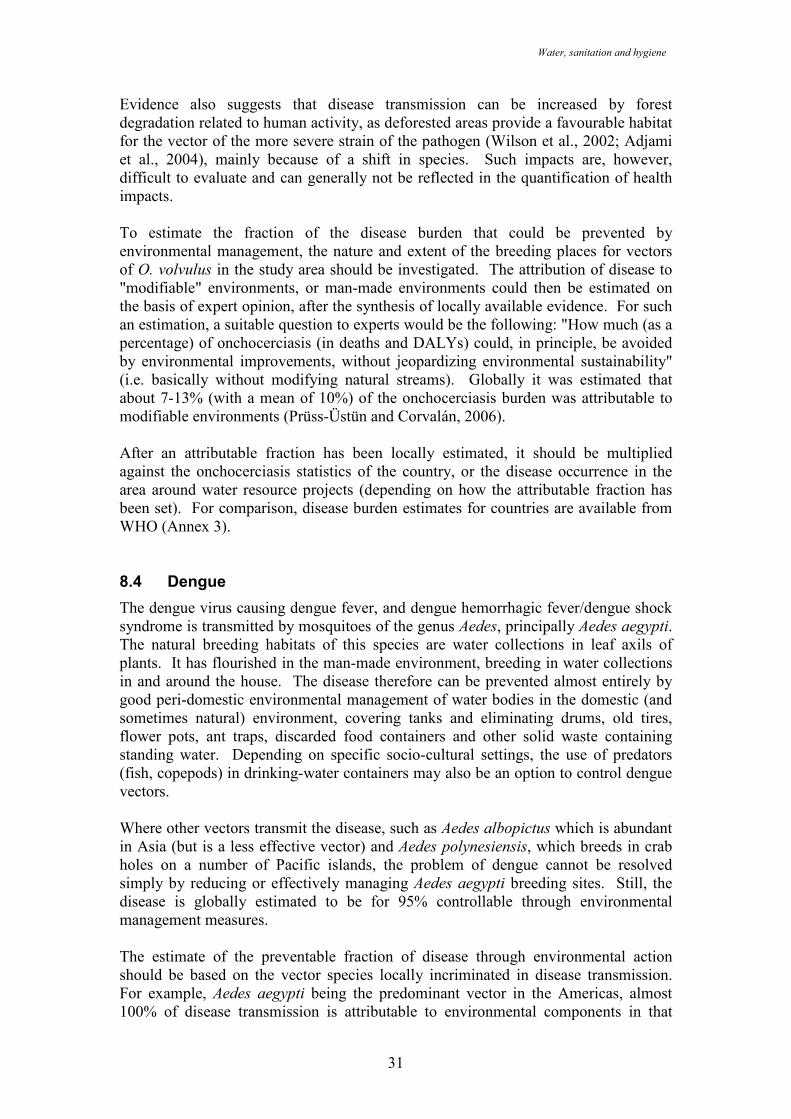
Water, sanitation and hygiene
31
Evidence also suggests that disease transmission can be increased by forest degradation related to human activity, as deforested areas provide a favourable habitat for the vector of the more severe strain of the pathogen (Wilson et al., 2002; Adjami et al., 2004), mainly because of a shift in species. Such impacts are, however, difficult to evaluate and can generally not be reflected in the quantification of health impacts. To estimate the fraction of the disease burden that could be prevented by environmental management, the nature and extent of the breeding places for vectors of O. volvulus in the study area should be investigated. The attribution of disease to "modifiable" environments, or man-made environments could then be estimated on the basis of expert opinion, after the synthesis of locally available evidence. For such an estimation, a suitable question to experts would be the following: "How much (as a percentage) of onchocerciasis (in deaths and DALYs) could, in principle, be avoided by environmental improvements, without jeopardizing environmental sustainability" (i.e. basically without modifying natural streams). Globally it was estimated that about 7-13% (with a mean of 10%) of the onchocerciasis burden was attributable to modifiable environments (Prüss-Üstün and Corvalán, 2006). After an attributable fraction has been locally estimated, it should be multiplied against the onchocerciasis statistics of the country, or the disease occurrence in the area around water resource projects (depending on how the attributable fraction has been set). For comparison, disease burden estimates for countries are available from WHO (Annex 3). 8.4 Dengue
The dengue virus causing dengue fever, and dengue hemorrhagic fever/dengue shock syndrome is transmitted by mosquitoes of the genus Aedes, principally Aedes aegypti. The natural breeding habitats of this species are water collections in leaf axils of plants. It has flourished in the man-made environment, breeding in water collections in and around the house. The disease therefore can be prevented almost entirely by good peri-domestic environmental management of water bodies in the domestic (and sometimes natural) environment, covering tanks and eliminating drums, old tires, flower pots, ant traps, discarded food containers and other solid waste containing standing water. Depending on specific socio-cultural settings, the use of predators (fish, copepods) in drinking-water containers may also be an option to control dengue vectors. Where other vectors transmit the disease, such as Aedes albopictus which is abundant in Asia (but is a less effective vector) and Aedes polynesiensis, which breeds in crab holes on a number of Pacific islands, the problem of dengue cannot be resolved simply by reducing or effectively managing Aedes aegypti breeding sites. Still, the disease is globally estimated to be for 95% controllable through environmental management measures. The estimate of the preventable fraction of disease through environmental action should be based on the vector species locally incriminated in disease transmission. For example, Aedes aegypti being the predominant vector in the Americas, almost 100% of disease transmission is attributable to environmental components in that
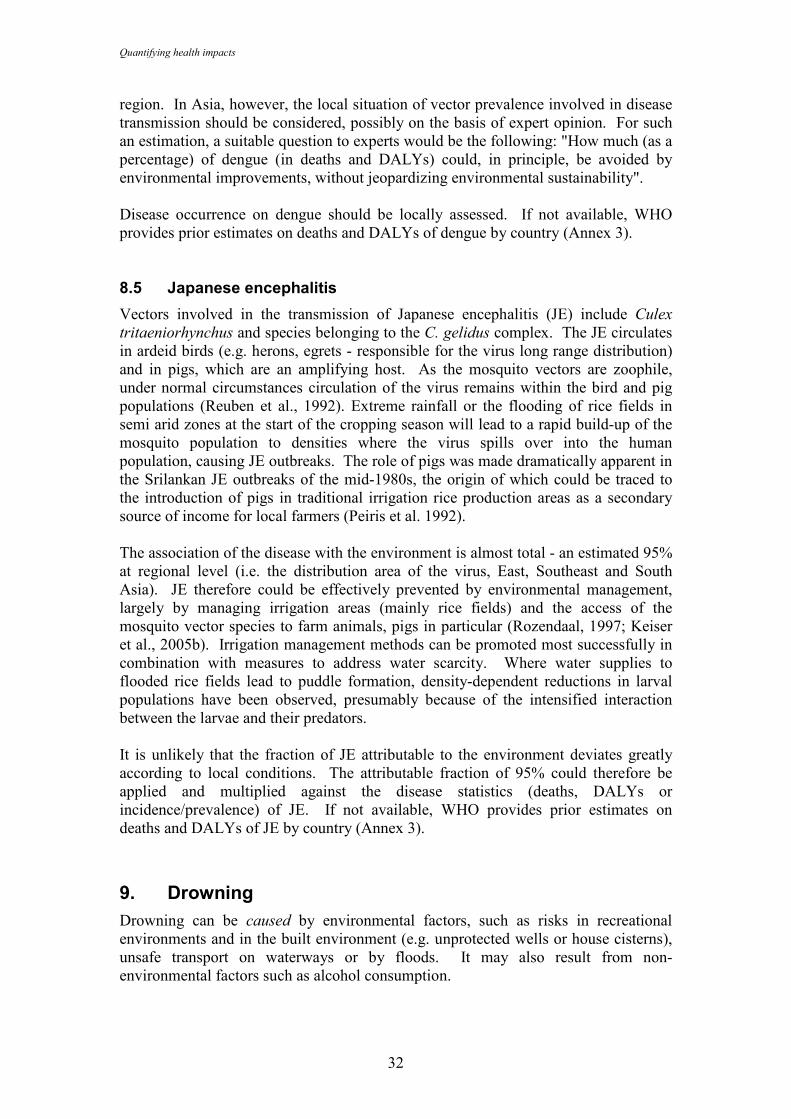
Quantifying health impacts
32
region. In Asia, however, the local situation of vector prevalence involved in disease transmission should be considered, possibly on the basis of expert opinion. For such an estimation, a suitable question to experts would be the following: "How much (as a percentage) of dengue (in deaths and DALYs) could, in principle, be avoided by environmental improvements, without jeopardizing environmental sustainability". Disease occurrence on dengue should be locally assessed. If not available, WHO provides prior estimates on deaths and DALYs of dengue by country (Annex 3). 8.5 Japanese encephalitis
Vectors involved in the transmission of Japanese encephalitis (JE) include Culex tritaeniorhynchus and species belonging to the C. gelidus complex. The JE circulates in ardeid birds (e.g. herons, egrets - responsible for the virus long range distribution) and in pigs, which are an amplifying host. As the mosquito vectors are zoophile, under normal circumstances circulation of the virus remains within the bird and pig populations (Reuben et al., 1992). Extreme rainfall or the flooding of rice fields in semi arid zones at the start of the cropping season will lead to a rapid build-up of the mosquito population to densities where the virus spills over into the human population, causing JE outbreaks. The role of pigs was made dramatically apparent in the Srilankan JE outbreaks of the mid-1980s, the origin of which could be traced to the introduction of pigs in traditional irrigation rice production areas as a secondary source of income for local farmers (Peiris et al. 1992). The association of the disease with the environment is almost total - an estimated 95% at regional level (i.e. the distribution area of the virus, East, Southeast and South Asia). JE therefore could be effectively prevented by environmental management, largely by managing irrigation areas (mainly rice fields) and the access of the mosquito vector species to farm animals, pigs in particular (Rozendaal, 1997; Keiser et al., 2005b). Irrigation management methods can be promoted most successfully in combination with measures to address water scarcity. Where water supplies to flooded rice fields lead to puddle formation, density-dependent reductions in larval populations have been observed, presumably because of the intensified interaction between the larvae and their predators. It is unlikely that the fraction of JE attributable to the environment deviates greatly according to local conditions. The attributable fraction of 95% could therefore be applied and multiplied against the disease statistics (deaths, DALYs or incidence/prevalence) of JE. If not available, WHO provides prior estimates on deaths and DALYs of JE by country (Annex 3).
9. Drowning
Drowning can be caused by environmental factors, such as risks in recreational environments and in the built environment (e.g. unprotected wells or house cisterns), unsafe transport on waterways or by floods. It may also result from non-environmental factors such as alcohol consumption.
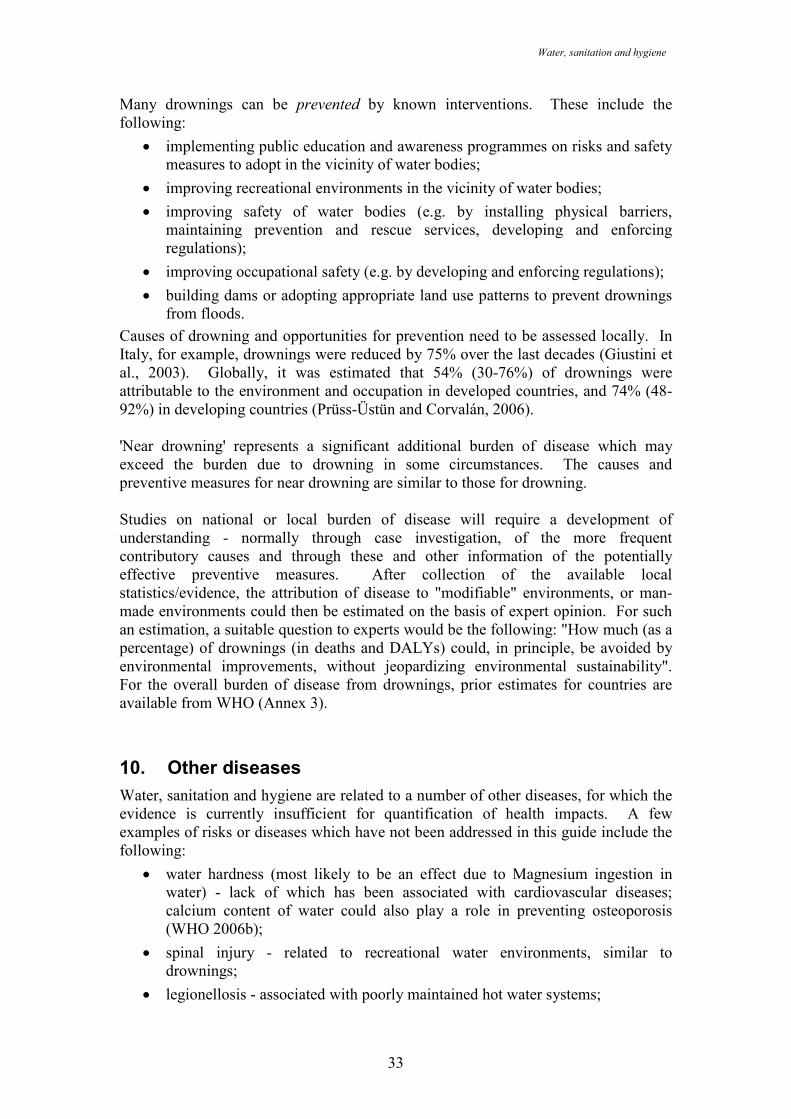
Water, sanitation and hygiene
33
Many drownings can be prevented by known interventions. These include the following:
• implementing public education and awareness programmes on risks and safety measures to adopt in the vicinity of water bodies;
• improving recreational environments in the vicinity of water bodies;
• improving safety of water bodies (e.g. by installing physical barriers, maintaining prevention and rescue services, developing and enforcing regulations);
• improving occupational safety (e.g. by developing and enforcing regulations);
• building dams or adopting appropriate land use patterns to prevent drownings from floods.
Causes of drowning and opportunities for prevention need to be assessed locally. In Italy, for example, drownings were reduced by 75% over the last decades (Giustini et al., 2003). Globally, it was estimated that 54% (30-76%) of drownings were attributable to the environment and occupation in developed countries, and 74% (48-92%) in developing countries (Prüss-Üstün and Corvalán, 2006). 'Near drowning' represents a significant additional burden of disease which may exceed the burden due to drowning in some circumstances. The causes and preventive measures for near drowning are similar to those for drowning. Studies on national or local burden of disease will require a development of understanding - normally through case investigation, of the more frequent contributory causes and through these and other information of the potentially effective preventive measures. After collection of the available local statistics/evidence, the attribution of disease to "modifiable" environments, or man-made environments could then be estimated on the basis of expert opinion. For such an estimation, a suitable question to experts would be the following: "How much (as a percentage) of drownings (in deaths and DALYs) could, in principle, be avoided by environmental improvements, without jeopardizing environmental sustainability". For the overall burden of disease from drownings, prior estimates for countries are available from WHO (Annex 3).
10. Other diseases
Water, sanitation and hygiene are related to a number of other diseases, for which the evidence is currently insufficient for quantification of health impacts. A few examples of risks or diseases which have not been addressed in this guide include the following:
• water hardness (most likely to be an effect due to Magnesium ingestion in water) - lack of which has been associated with cardiovascular diseases; calcium content of water could also play a role in preventing osteoporosis (WHO 2006b);
• spinal injury - related to recreational water environments, similar to drownings;
• legionellosis - associated with poorly maintained hot water systems;
Quantifying health impacts
34
• upper respiratory infections - related to poor recreational water quality;
• hepatitis B, C and HIV - related to injections performed with contaminated needles, that could be prevented by hygienic management of health-care wastes;
• natural contamination of drinking-water with arsenic and fluoride - associated with various cancers, crippling fluorosis and other health impacts, of particular concern in certain countries and areas;
• lead in drinking water - increased lead levels leading to permanent impacts on cognitive function in children due to leaded drinking water pipes;
• inadequate hydration - associated with urinary stone formation, urinary tract cancer, poor oral health and other outcomes.
Further research is needed to build the evidence that would allow the quantification of these health impacts at national and local levels.
11. Availability of disease statistics
11.1 National statistics
National statistics, or data detailed by sub-national units, on the incidence, mortality or DALYs (if a National Burden of Disease study has been conducted) of diseases linked to water, sanitation and hygiene are the data of choice for quantifying the disease burden using the proposed method. Where vulnerable groups are of interest, such as certain age groups, the disease statistics should also present segregated illness rates specific to these groups. The diseases of interest are all those that the users of this guide would like to quantify in terms of attributable fraction to water, sanitation and hygiene. Where multiple studies or data sets on disease frequency exist, these should be checked for consistency and possible variations explained (e.g. difference in definition of diarrhoeal disease). 11.2 Poor availability or alternative sources of statistics
Where the required disease data are not available or are not detailed enough for the required study population, it may be possible to develop an approximate or preliminary estimate based on the disease statistics extrapolated from a larger region, based on the assumption that disease rates vary little. However, such approximation should be carried out with caution. For example, if access to water and sanitation services shows important differences, it is likely that diarrhoeal disease rates may also vary substantially and, therefore, such an extrapolation would be inappropriate. Disease statistics on diarrhoeal incidence or prevalence and other major diseases of interest may also be available from alternative sources, such as the DHS (Demographic Health Surveys, www.measuredhs.com/), which provide survey results for numerous developing countries on-line or upon request. For comparison, disease statistics and rates are available also from WHO on a regional basis and for all WHO Member States (www.who.int/evidence, by selecting
Water, sanitation and hygiene
35
"Burden of disease statistics", "Burden of disease project", "Global burden of disease estimates", "GBD 2002 estimates", then "Revised GBD 2002 estimates for countries", then "Deaths and DALY estimates by Member States"). This comprehensive database contains estimates for deaths and DALYs for about 200 countries and about 100 major diseases and injury categories. Summaries of these statistics per country are reproduced in Annex 3 of this document for the year 2004. It is, however, advisable to check the WHO web site for updates. It is also possible to improve national health information and statistics through, for example, purpose-designed surveys. An initiative coordinated by WHO, the Health Metrics Network, supports the development of better health information systems in view of generation of reliable health information at country level (http://www.who.int/healthmetrics/en/).
12. Estimating the total disease burden related to WSH
The total disease burden related to water, sanitation and hygiene is the sum of the individual disease burdens attributable to WSH, estimated as described in this guide. The reader may wish to select the diseases to be included in this estimate, according to the relevance in their study population, or consider only portions of the WSH risk factor (for example drinking water and sanitation services and hygiene). The disease burden (expressed as mortality, incidence or in DALYs) should be estimated, for each considered disease, by multiplying the attributable fraction with the measure of disease (see section 3.4 for diarrhoea):
Attributable burden = attributable fraction x number of deaths, cases or DALYs Deaths and DALYs attributable to WSH can then be added up, while incident cases of different diseases are not comparable. The results of the global analysis for example are presented in section 16.
13. Uncertainty
13.1 Uncertainty in estimating attributable diarrhoea
Relative risks
Although some of the relative risks used in this guide rely on multi-country studies, they all represent risks associated with the specific conditions of the populations and risks covered in those studies. As locally available water and sanitation services may differ, and practices may be specific to socio-economic and cultural settings, those relative risks may not entirely cover the prevailing local situation. It is of course possible to perform local assessments of relative risks. However, given the difficulties in designing representative studies, in particular due to the seasonal variation of risks, it may still be preferable to rely on multi-country studies. In view of the above, relative risks may present a significant source of uncertainty.
Quantifying health impacts
36
Exposure levels
Estimates of exposure to WSH-related risk factors need to match the definitions used in the studies assessing the relative risks. As technologies and practices of water, sanitation and hygiene practices are numerous, they are generally grouped into broad categories for the purpose of estimating health impacts. The uncertainty in exposure assessments will often depend on the data sources or surveys used for such assessments, and should be discussed on that basis.
Addressing uncertainty
Although the approach described in this guide is commensurate with much of the available data, it does have important limitations with respect to chosen measures of relative risk and exposure scenarios. There is inherent uncertainty in both the methodology and data sources, including often-neglected uncertainty in estimates of the total disease burden in the population. At present, however, there is no straightforward mechanism for capturing different sources of uncertainty and for calculating lower and upper bounds for estimates generated by local assessments. If reliable uncertainty information were available on both relative risks and exposure information, it would be possible to perform a Monte Carlo simulation9. However, the effort required to execute such an approach seems unsuitable for most local assessments, particularly as the additional information gained may not be substantial. Given these limitations, we recommend that the final results are derived from the central estimates of relative risk and exposure distribution. Furthermore, uncertainties around relative risks and exposure levels should be described and discussed. A survey of water and sanitation services, based on a random population-based sample, will also enable calculation of a confidence interval for the exposure distribution. Presentation of uncertainty considerations are generally recommended in the final results. To explore likely ranges of results, calculations for attributable fractions can be repeated with the lower and upper relative risk confidence intervals, along with the central exposure level. Although, the ranges that result for attributable fractions and burdens cannot be interpreted in a statistical fashion, they serve simply as “low” and “high” scenarios, not lower and upper bounds around a central estimate, and only point to other possibilities for the actual impact. Alternatively, a series of scenarios can help explore the impact of uncertainties on final results. 13.2 Uncertainty in other disease estimates
Diseases almost fully attributable to water, sanitation and hygiene
As outlined in the above sections, certain diseases are practically entirely transmitted through water, sanitation and hygiene pathways, such as schistosomiasis or intestinal nematode infections. This does not mean that such diseases could only be prevented by action in the WSH sector. For example, prevention of schistosomiasis could also be carried out by worker's protection, but still by addressing WSH measures.
9 A Monte Carlo simulation calculates multiple scenarios of a model by repeatedly sampling values from the probability distributions for the uncertain input variables. It provides a probability distribution around the resulting values.
Water, sanitation and hygiene
37
For these diseases that are almost entirely attributable to WSH, the main source of uncertainty will lie in the disease statistics, i.e. in the number of deaths, incidence (and possibly DALYs) of the disease for the study population.
Expert-based attributable fractions
Estimated attributable fractions based on expert opinion are usually relatively large. It is therefore recommended that experts provide a best estimate, and a possible range of their estimate (possibly in terms of a 95% "confidence" interval). It is also recommended to consult a number of experts, or convene a panel of experts. It is likely that the accuracy of expert-based estimates is lower than estimates of disease burden based on evidence, such as measures of population exposure combined with risk estimates (as for diarrhoea) or on other statistics. Nevertheless, for some diseases, the use of expert opinions may currently be the only way to estimate the contribution of the environment to their burden, and hence highlight the opportunities for preventing disease through environmental change. If several experts have been consulted for their estimates, the following options are possible to obtain one consolidated estimate:
• Ask experts to justify and discuss their estimates and agree on one final estimate (if possible with likely range).
• Add probabilities of expert opinions, with the resulting mean being the best estimate, and use the new resulting 95% confidence intervals. This can be done for example by assuming a triangular distribution with 95% confidence intervals for each reply (see Prüss-Üstün and Corvalán, 2006, for further details).
14. Practical example
14.1 Diarrhoea
The amount of diarrhoeal disease caused by water, sanitation and hygiene is estimated for the example of the Lao People's Democratic Republic, based on the Global Water Supply and Sanitation Assessment (WHO/UNICEF 2006) and health statistics estimated by WHO. Such an estimate is approximate only and could be revised with more accurate national information. The estimate is performed as follows: 1) Determine the population distribution for the exposure scenarios Coverage data are based on the Global Assessment (WHO/UNICEF 2006). The report states the following for Lao People's Democratic Republic:
Coverage by improved drinking water: 51%
Coverage by improved sanitation: 30% Based on these data, it is not possible to assess whether those served with improved water corresponded to those with improved sanitation. However, reports suggest that
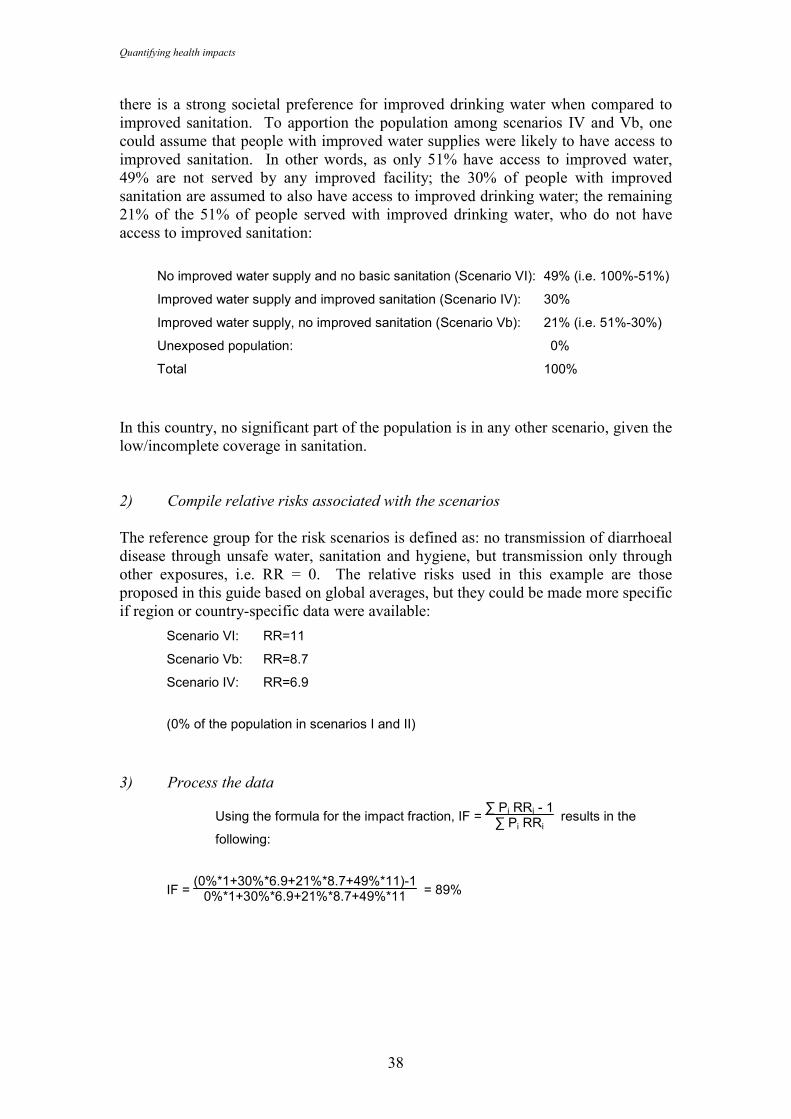
Quantifying health impacts
38
there is a strong societal preference for improved drinking water when compared to improved sanitation. To apportion the population among scenarios IV and Vb, one could assume that people with improved water supplies were likely to have access to improved sanitation. In other words, as only 51% have access to improved water, 49% are not served by any improved facility; the 30% of people with improved sanitation are assumed to also have access to improved drinking water; the remaining 21% of the 51% of people served with improved drinking water, who do not have access to improved sanitation:
No improved water supply and no basic sanitation (Scenario VI): 49% (i.e. 100%-51%)
Improved water supply and improved sanitation (Scenario IV): 30%
Improved water supply, no improved sanitation (Scenario Vb): 21% (i.e. 51%-30%)
Unexposed population: 0%
Total 100%
In this country, no significant part of the population is in any other scenario, given the low/incomplete coverage in sanitation.
2) Compile relative risks associated with the scenarios The reference group for the risk scenarios is defined as: no transmission of diarrhoeal disease through unsafe water, sanitation and hygiene, but transmission only through other exposures, i.e. RR = 0. The relative risks used in this example are those proposed in this guide based on global averages, but they could be made more specific if region or country-specific data were available:
Scenario VI: RR=11
Scenario Vb: RR=8.7
Scenario IV: RR=6.9
(0% of the population in scenarios I and II)
3) Process the data
Using the formula for the impact fraction, IF = ∑ Pi RRi - 1∑ Pi RRi
results in the
following:
IF = (0%*1+30%*6.9+21%*8.7+49%*11)-10%*1+30%*6.9+21%*8.7+49%*11 = 89%
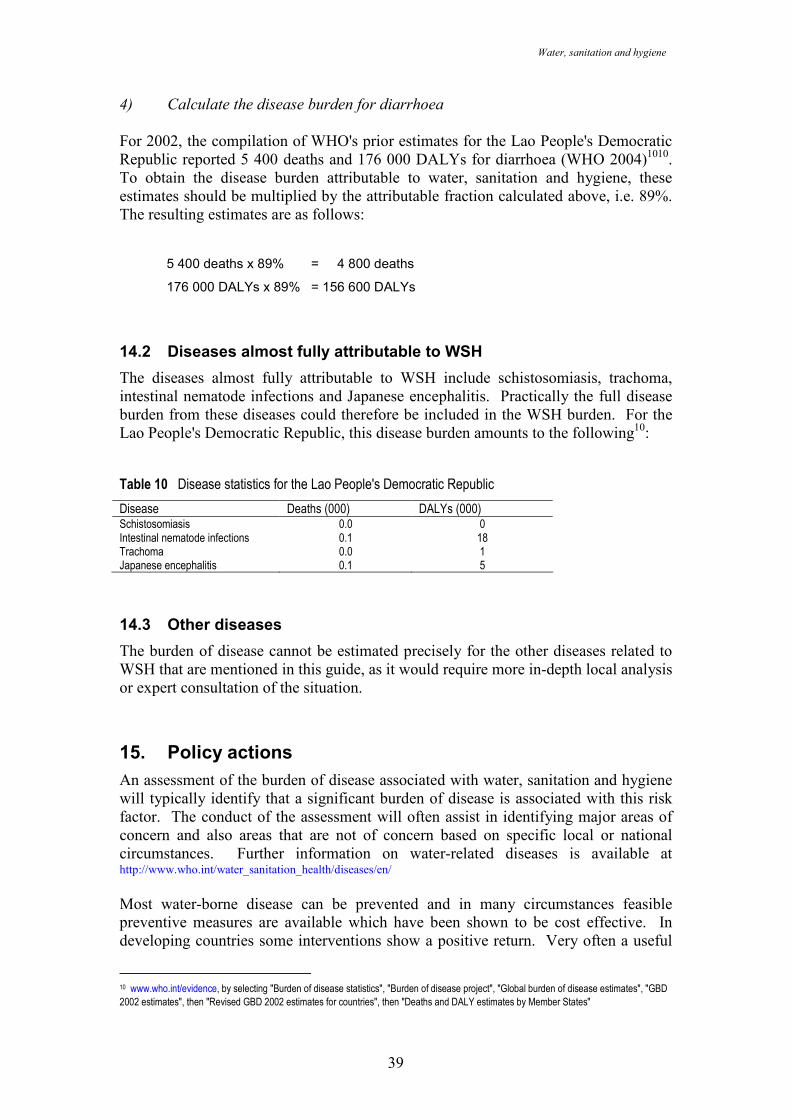
Water, sanitation and hygiene
39
4) Calculate the disease burden for diarrhoea For 2002, the compilation of WHO's prior estimates for the Lao People's Democratic Republic reported 5 400 deaths and 176 000 DALYs for diarrhoea (WHO 2004)1010. To obtain the disease burden attributable to water, sanitation and hygiene, these estimates should be multiplied by the attributable fraction calculated above, i.e. 89%. The resulting estimates are as follows:
5 400 deaths x 89% = 4 800 deaths
176 000 DALYs x 89% = 156 600 DALYs
14.2 Diseases almost fully attributable to WSH
The diseases almost fully attributable to WSH include schistosomiasis, trachoma, intestinal nematode infections and Japanese encephalitis. Practically the full disease burden from these diseases could therefore be included in the WSH burden. For the Lao People's Democratic Republic, this disease burden amounts to the following10: Table 10 Disease statistics for the Lao People's Democratic Republic
Disease Deaths (000) DALYs (000) Schistosomiasis 0.0 0 Intestinal nematode infections 0.1 18 Trachoma 0.0 1 Japanese encephalitis 0.1 5
14.3 Other diseases
The burden of disease cannot be estimated precisely for the other diseases related to WSH that are mentioned in this guide, as it would require more in-depth local analysis or expert consultation of the situation.
15. Policy actions
An assessment of the burden of disease associated with water, sanitation and hygiene will typically identify that a significant burden of disease is associated with this risk factor. The conduct of the assessment will often assist in identifying major areas of concern and also areas that are not of concern based on specific local or national circumstances. Further information on water-related diseases is available at http://www.who.int/water_sanitation_health/diseases/en/ Most water-borne disease can be prevented and in many circumstances feasible preventive measures are available which have been shown to be cost effective. In developing countries some interventions show a positive return. Very often a useful
10 www.who.int/evidence, by selecting "Burden of disease statistics", "Burden of disease project", "Global burden of disease estimates", "GBD 2002 estimates", then "Revised GBD 2002 estimates for countries", then "Deaths and DALY estimates by Member States"
Quantifying health impacts
40
'next step' will therefore be to look at the scale of likely costs and impacts of technical and policy options to address this burden of disease. Guidance on conducting such analyses is under development by WHO and information on it is available through the WHO internet site at http://www.who.int/water_sanitation_health/economic/en/ In identifying potential remedial actions it is useful to categorize water-related disease into a number of major groups:
• True water borne disease in which the agent that causes disease is ingested directly through water. The 'agent' may be a microbe or a chemical.
• Water hygiene related diseases where hygiene and especially personal hygiene is important in prevention. Many of these diseases can also be water borne (e.g. infectious diarrhoea, bacillary dysentery, infectious hepatitis). Water hygiene related diseases also include skin and eye infections and infestations such as trachoma scabies, ringworm and conjunctivitis.
• Water based diseases - where the association is through the agent of disease requiring water to complete its life cycle. Schistosomiasis is the most globally prevalent example.
• Water related insect vectors where the disease is transmitted by a vector which requires water to complete its life cycle. Globally malaria is the most important example.
• There are also some other water related diseases that do not fit readily into this well-established categorization. These include legionellosis caused by a bacterium that multiplies especially in artificial water environments; and diseases associated with deficiencies of certain minerals in the diet to which water makes a significant contribution (for which the most important potential example is magnesium and cardiovascular disease).
In the following sections we explore briefly the types of interventions appropriate to each of these groups and the availability of guidance towards their prevention: Water borne infectious disease It is not possible with present information to precisely quantify the contributions of true water borne disease from that of food related disease and from water hygiene related disease. Nevertheless the fact that they contribute significantly is confirmed by studies on drinking-water quality and human health (see section 3.3) and by the ongoing occurrence of water borne disease outbreaks in developing and developed countries. Outbreaks may be very large and have wide social and economic impacts. There is considerable information and experience available on effective measures to prevent water borne disease. Broadly two complementary approaches focus on controlling the source of the disease-causing microbes (pathogens from human and to a lesser extent animal excreta) through sanitation; and on the immediate safety of water being consumed.
• Further information on sanitation interventions is available at www.sanicon.net, http://www.who.int/water_sanitation_health/hygiene/en/; and http://www.who.int/water_sanitation_health/wastewater/en/;
Water, sanitation and hygiene
41
• Further information on managing drinking-water quality is available at http://www.who.int/water_sanitation_health/dwq/en/; http://www.who.int/wsportal/en/; and http://www.who.int/household_water/en/
Water-borne disease caused by toxic chemicals While there is a large number of chemicals of potential concern in drinking-water, a very small number are believed to be responsible for a significant burden of disease. These include fluoride11 and arsenic12, both of which are natural components of groundwater but occur in excessive concentrations in some regions. WHO has developed guidance on identifying those chemicals that are most likely to be of health significance in drinking water13. Extensive guidance on chemicals in drinking water and health is available in the WHO Guidelines for Drinking-water Quality14. Water hygiene related disease and diseases with water-related insect vectors The principal activities involved in controlling water hygiene related disease are increasing access to water for hygiene15 and encouraging use of water for hygiene. For trachoma, which is also a vector-borne disease, a major global effort is under way to reduce the disease and to eliminate blinding trachoma through the 'SAFE' strategy16. Water-based diseases WHO defines Environmental Management for Vector Control as the planning, organization, carrying out and monitoring of activities for the modification and/or manipulation of environmental factors or their interaction with man with a view to preventing or minimizing vector propagation and reducing man-vector-pathogen contact. It may entail one or both of two approaches: environmental modification (permanent infrastructural changes of a capital-intensive nature) and environmental manipulation (recurrent actions aimed at achieving temporary unfavourable conditions for vector breeding). The occurrence and prevalence of water based diseases such as schistosomiasis is influenced by the way that water is managed in rural and urban areas. Information on environmental management for control of insect vectors of disease is available at http://www.who.int/water_sanitation_health/resources/envmanagement/en/index.html. In addition to the quantitative estimation of disease burden, health impact assessment provides a useful tool in assessing potential future disease burdens and approaches to their management. WHO defines Health Impact Assessment (HIA) as a combination of procedures, methods and tools by which a policy, programme or project may be judged as to its potential effects on the health of a population, and the distribution of those effects within the population. Further information on HIA for water resources management is available at http://www.who.int/water_sanitation_health/resources/hia/en/index.html.
11 1See http://www.who.int/water_sanitation_health/dwq/chemicals/fluoride/en/index.html 12 1See http://www.who.int/water_sanitation_health/dwq/arsenic/en/index.html 13 See http://www.who.int/water_sanitation_health/gdwqrevision/chempriorities/en/index.html 14 See http://www.who.int/water_sanitation_health/dwq/guidelines/en/index.html 15 See http://www.who.int/water_sanitation_health/diseases/wsh0302/en/index.html 16 See http://www.who.int/water_sanitation_health/
Quantifying health impacts
42
Other water-related diseases Other diseases of global significance and the cause and/or prevention of which is linked to water sanitation and hygiene management include:
• Legionellosis caused by a bacterium that multiplies especially in artificial water environments. While the reported incidence of legionellosis in the developing world is low, this may in part be due to under-reporting. Legionellosis can be prevented by controlling excess growth of Legionella pneumophila in artificial water systems. Further information on legionellosis and its prevention is available at
http://www.who.int/water_sanitation_health/emerging/legionella/en/index.html
• There is increasing interest in the possibility that water may make a significant protective contribution to some diseases which are associated with deficiencies of certain minerals in the diet or inadequate hydration. Most recent interest has focused on magnesium and cardiovascular disease (see
http://www.who.int/water_sanitation_health/gdwqrevision/hardness/en/index.html
• Management of health care waste is a component of sanitation which is of particular concern to health because of its association with a significant burden of diseases such as HIV/AIDS and hepatitis B and C. Further information on healthcare waste management is available through http://www.healthcarewaste.org/en/115_overview.html
16. Global estimates of WSH-related burden of disease
WHO recently estimated the global burden of disease caused by the environment, based on a combination of results from the Comparative Risk Assessment (WHO 2002), a review of the literature and an expert survey (Prüss-Üstün and Corvalán 2006). The results of these estimates are summarized in Tables 11 and 12. This estimate addresses the attributable burden of disease, i.e. the reduction of disease burden of disease that could be achieved if the three main groups of risks within the area of water, sanitation and hygiene were reduced to the specified baseline (or counterfactual) scenario (see Section 1.1). It should be noted that in principle, the preventable disease burden from various intervention areas cannot necessarily be summed up, as there may be interactions between exposures/outcomes or joint effects. For the purpose of these calculations, however, in order to avoid an overestimate, the outcomes with a direct WSH component are excluded from the estimation of the burden from malnutrition and its consequences. The diseases included only once as direct consequence of WSH, and not again as a consequence of malnutrition therefore include diarrhoeal diseases, malaria, schistosomiasis, lymphatic filariasis, onchocerciasis, dengue, Japanese encephalitis, trachoma, intestinal nematode infections and "other infectious diseases"17.
17 "other" infectious diseases as referred to in the WHO disease statistics (http://www.who.int/healthinfo/bodestimates/en/index.html)
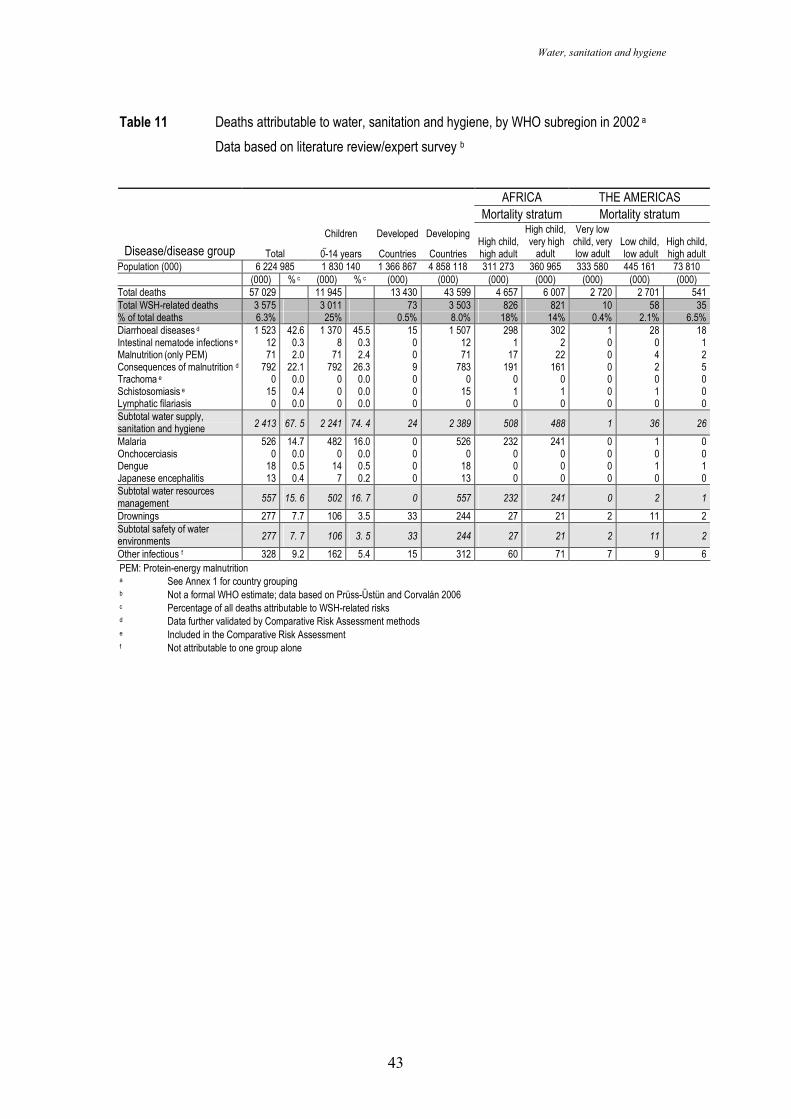
Water, sanitation and hygiene
43
Table 11 Deaths attributable to water, sanitation and hygiene, by WHO subregion in 2002 a
Data based on literature review/expert survey b
AFRICA THE AMERICAS
Mortality stratum Mortality stratum
Disease/disease group Total
Children
0-14 years
Developed
Countries
Developing
Countries High child, high adult
High child, very high
adult
Very low child, very low adult
Low child, low adult
High child, high adult
Population (000) 6 224 985 1 830 140 1 366 867 4 858 118 311 273 360 965 333 580 445 161 73 810 (000) % c (000) % c (000) (000) (000) (000) (000) (000) (000)
Total deaths 57 029 11 945 13 430 43 599 4 657 6 007 2 720 2 701 541 Total WSH-related deaths 3 575 3 011 73 3 503 826 821 10 58 35 % of total deaths 6.3% 25% 0.5% 8.0% 18% 14% 0.4% 2.1% 6.5% Diarrhoeal diseases d 1 523 42.6 1 370 45.5 15 1 507 298 302 1 28 18 Intestinal nematode infections e 12 0.3 8 0.3 0 12 1 2 0 0 1 Malnutrition (only PEM) 71 2.0 71 2.4 0 71 17 22 0 4 2 Consequences of malnutrition d 792 22.1 792 26.3 9 783 191 161 0 2 5 Trachoma e 0 0.0 0 0.0 0 0 0 0 0 0 0 Schistosomiasis e 15 0.4 0 0.0 0 15 1 1 0 1 0 Lymphatic filariasis 0 0.0 0 0.0 0 0 0 0 0 0 0 Subtotal water supply, sanitation and hygiene 2 413 67. 5 2 241 74. 4 24 2 389 508 488 1 36 26
Malaria 526 14.7 482 16.0 0 526 232 241 0 1 0 Onchocerciasis 0 0.0 0 0.0 0 0 0 0 0 0 0 Dengue 18 0.5 14 0.5 0 18 0 0 0 1 1 Japanese encephalitis 13 0.4 7 0.2 0 13 0 0 0 0 0 Subtotal water resources management 557 15. 6 502 16. 7 0 557 232 241 0 2 1
Drownings 277 7.7 106 3.5 33 244 27 21 2 11 2 Subtotal safety of water environments 277 7. 7 106 3. 5 33 244 27 21 2 11 2
Other infectious f 328 9.2 162 5.4 15 312 60 71 7 9 6 PEM: Protein-energy malnutrition a See Annex 1 for country grouping b Not a formal WHO estimate; data based on Prüss-Üstün and Corvalán 2006 c Percentage of all deaths attributable to WSH-related risks d Data further validated by Comparative Risk Assessment methods e Included in the Comparative Risk Assessment f Not attributable to one group alone
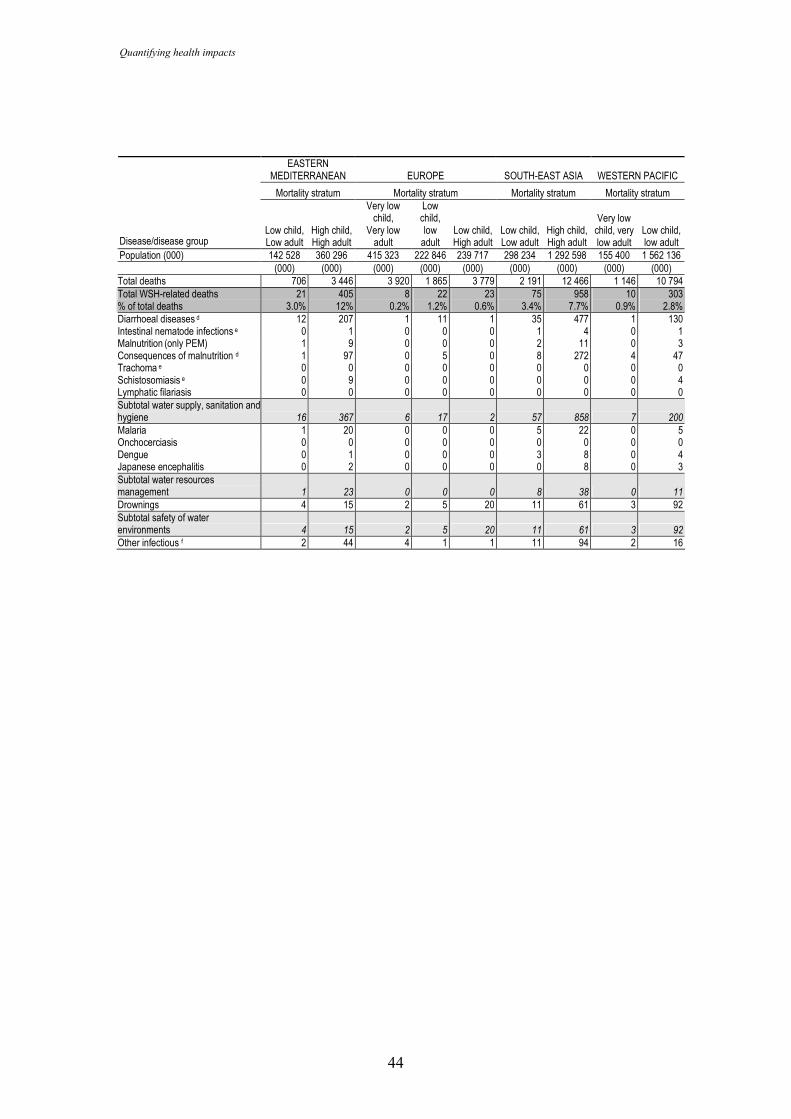
Quantifying health impacts
44
EASTERN MEDITERRANEAN EUROPE SOUTH-EAST ASIA WESTERN PACIFIC
Mortality stratum Mortality stratum Mortality stratum Mortality stratum
Disease/disease group
Low child, Low adult
High child, High adult
Very low child,
Very low adult
Low child, low adult
Low child, High adult
Low child, Low adult
High child, High adult
Very low child, very low adult
Low child, low adult
Population (000) 142 528 360 296 415 323 222 846 239 717 298 234 1 292 598 155 400 1 562 136 (000) (000) (000) (000) (000) (000) (000) (000) (000) Total deaths 706 3 446 3 920 1 865 3 779 2 191 12 466 1 146 10 794 Total WSH-related deaths 21 405 8 22 23 75 958 10 303 % of total deaths 3.0% 12% 0.2% 1.2% 0.6% 3.4% 7.7% 0.9% 2.8% Diarrhoeal diseases d 12 207 1 11 1 35 477 1 130 Intestinal nematode infections e 0 1 0 0 0 1 4 0 1 Malnutrition (only PEM) 1 9 0 0 0 2 11 0 3 Consequences of malnutrition d 1 97 0 5 0 8 272 4 47 Trachoma e 0 0 0 0 0 0 0 0 0 Schistosomiasis e 0 9 0 0 0 0 0 0 4 Lymphatic filariasis 0 0 0 0 0 0 0 0 0 Subtotal water supply, sanitation and hygiene 16 367 6 17 2 57 858 7 200
Malaria 1 20 0 0 0 5 22 0 5 Onchocerciasis 0 0 0 0 0 0 0 0 0 Dengue 0 1 0 0 0 3 8 0 4 Japanese encephalitis 0 2 0 0 0 0 8 0 3 Subtotal water resources management 1 23 0 0 0 8 38 0 11
Drownings 4 15 2 5 20 11 61 3 92 Subtotal safety of water environments 4 15 2 5 20 11 61 3 92
Other infectious f 2 44 4 1 1 11 94 2 16
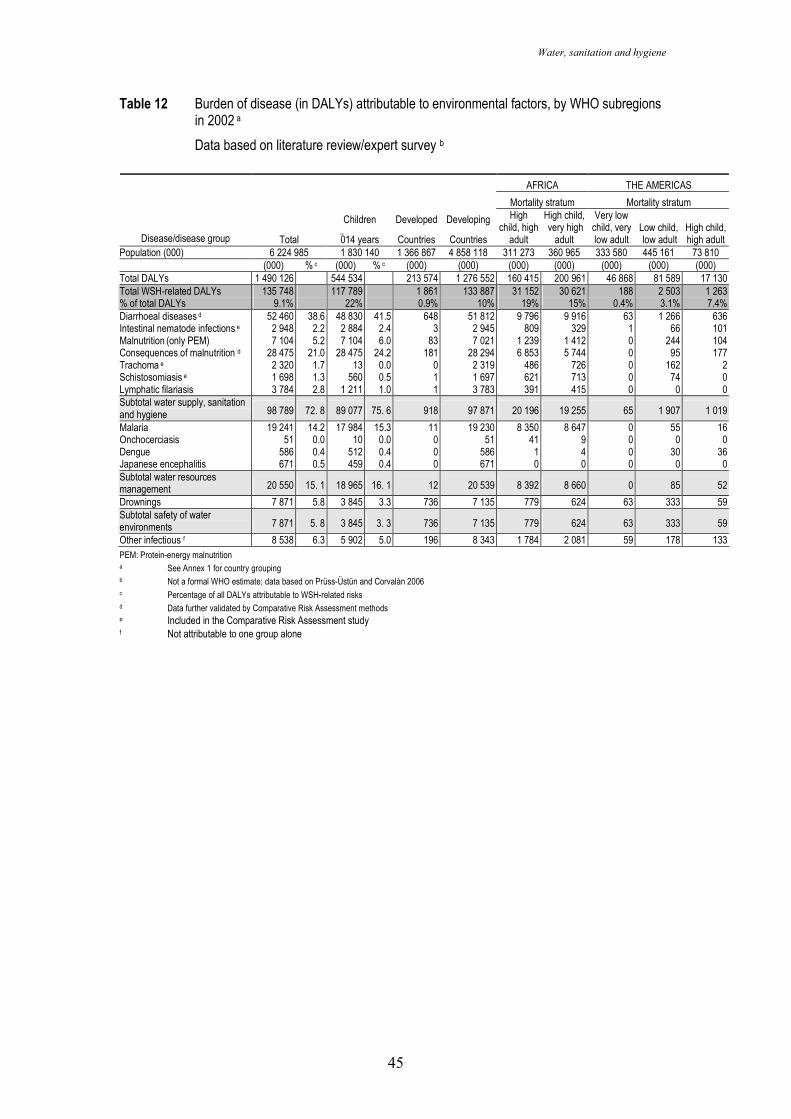
Water, sanitation and hygiene
45
Table 12 Burden of disease (in DALYs) attributable to environmental factors, by WHO subregions in 2002 a
Data based on literature review/expert survey b
AFRICA THE AMERICAS Mortality stratum Mortality stratum
Disease/disease group Total
Children
014 years
Developed
Countries
Developing
Countries
High child, high
adult
High child, very high
adult
Very low child, very low adult
Low child, low adult
High child, high adult
Population (000) 6 224 985 1 830 140 1 366 867 4 858 118 311 273 360 965 333 580 445 161 73 810 (000) % c (000) % c (000) (000) (000) (000) (000) (000) (000) Total DALYs 1 490 126 544 534 213 574 1 276 552 160 415 200 961 46 868 81 589 17 130 Total WSH-related DALYs 135 748 117 789 1 861 133 887 31 152 30 621 188 2 503 1 263 % of total DALYs 9.1% 22% 0.9% 10% 19% 15% 0.4% 3.1% 7.4% Diarrhoeal diseases d 52 460 38.6 48 830 41.5 648 51 812 9 796 9 916 63 1 266 636 Intestinal nematode infections e 2 948 2.2 2 884 2.4 3 2 945 809 329 1 66 101 Malnutrition (only PEM) 7 104 5.2 7 104 6.0 83 7 021 1 239 1 412 0 244 104 Consequences of malnutrition d 28 475 21.0 28 475 24.2 181 28 294 6 853 5 744 0 95 177 Trachoma e 2 320 1.7 13 0.0 0 2 319 486 726 0 162 2 Schistosomiasis e 1 698 1.3 560 0.5 1 1 697 621 713 0 74 0 Lymphatic filariasis 3 784 2.8 1 211 1.0 1 3 783 391 415 0 0 0 Subtotal water supply, sanitation and hygiene 98 789 72. 8 89 077 75. 6 918 97 871 20 196 19 255 65 1 907 1 019
Malaria 19 241 14.2 17 984 15.3 11 19 230 8 350 8 647 0 55 16 Onchocerciasis 51 0.0 10 0.0 0 51 41 9 0 0 0 Dengue 586 0.4 512 0.4 0 586 1 4 0 30 36 Japanese encephalitis 671 0.5 459 0.4 0 671 0 0 0 0 0 Subtotal water resources management 20 550 15. 1 18 965 16. 1 12 20 539 8 392 8 660 0 85 52
Drownings 7 871 5.8 3 845 3.3 736 7 135 779 624 63 333 59 Subtotal safety of water environments 7 871 5. 8 3 845 3. 3 736 7 135 779 624 63 333 59
Other infectious f 8 538 6.3 5 902 5.0 196 8 343 1 784 2 081 59 178 133 PEM: Protein-energy malnutrition a See Annex 1 for country grouping b Not a formal WHO estimate; data based on Prüss-Üstün and Corvalán 2006 c Percentage of all DALYs attributable to WSH-related risks d Data further validated by Comparative Risk Assessment methods e Included in the Comparative Risk Assessment study f Not attributable to one group alone
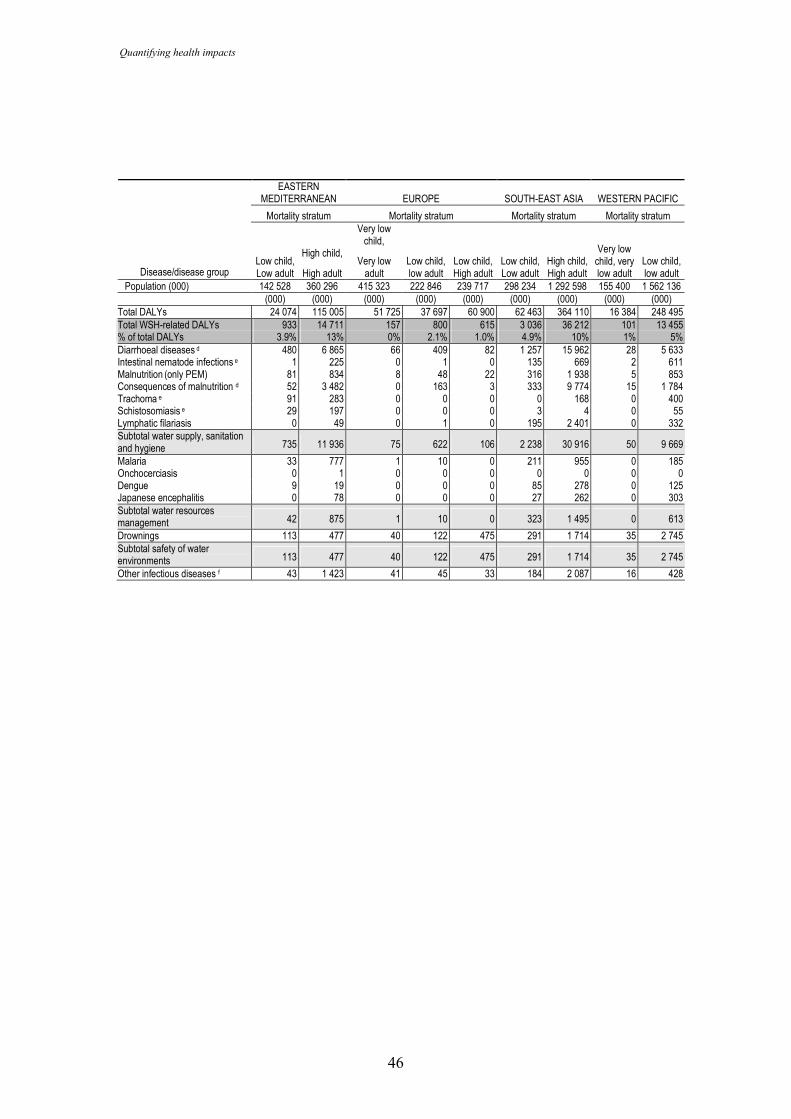
Quantifying health impacts
46
EASTERN MEDITERRANEAN EUROPE SOUTH-EAST ASIA WESTERN PACIFIC
Mortality stratum Mortality stratum Mortality stratum Mortality stratum
Disease/disease group Low child, Low adult
High child,
High adult
Very low child,
Very low adult
Low child, low adult
Low child, High adult
Low child, Low adult
High child, High adult
Very low child, very low adult
Low child, low adult
Population (000) 142 528 360 296 415 323 222 846 239 717 298 234 1 292 598 155 400 1 562 136 (000) (000) (000) (000) (000) (000) (000) (000) (000)
Total DALYs 24 074 115 005 51 725 37 697 60 900 62 463 364 110 16 384 248 495 Total WSH-related DALYs 933 14 711 157 800 615 3 036 36 212 101 13 455 % of total DALYs 3.9% 13% 0% 2.1% 1.0% 4.9% 10% 1% 5% Diarrhoeal diseases d 480 6 865 66 409 82 1 257 15 962 28 5 633 Intestinal nematode infections e 1 225 0 1 0 135 669 2 611 Malnutrition (only PEM) 81 834 8 48 22 316 1 938 5 853 Consequences of malnutrition d 52 3 482 0 163 3 333 9 774 15 1 784 Trachoma e 91 283 0 0 0 0 168 0 400 Schistosomiasis e 29 197 0 0 0 3 4 0 55 Lymphatic filariasis 0 49 0 1 0 195 2 401 0 332 Subtotal water supply, sanitation and hygiene 735 11 936 75 622 106 2 238 30 916 50 9 669
Malaria 33 777 1 10 0 211 955 0 185 Onchocerciasis 0 1 0 0 0 0 0 0 0 Dengue 9 19 0 0 0 85 278 0 125 Japanese encephalitis 0 78 0 0 0 27 262 0 303 Subtotal water resources management 42 875 1 10 0 323 1 495 0 613
Drownings 113 477 40 122 475 291 1 714 35 2 745 Subtotal safety of water environments 113 477 40 122 475 291 1 714 35 2 745
Other infectious diseases f 43 1 423 41 45 33 184 2 087 16 428
Water, sanitation and hygiene
47
References
Adjami AG, Toe L, Bissan Y, Bugri S, Yameogo L, Kone M, et al (2004) The current status of onchocerciasis in the forest/savannah transition zone of Cote d'Ivoire. Parasitology 128:407-14. Medline
Ahmed NU, Zeitlin MF, Beiser AS, Super CM, Gershoff SN (1993) A longitudinal study of the impact of behavioural change intervention on cleanliness, diarrhoeal morbidity and growth of children in rural Bangladesh. Soc Sci Med 37:159-71. Medline
Amerasinghe FP, Konradsen F, van der Hoek W, Amerasinghe PH, Gunawardena JPW, Fonseka KT, et al. (2001) Small irrigation tanks as a source of malaria mosquito vectors: a study in North-Central Sri Lanka. IWMI Research Report 57, Colombo, Sri Lanka, International Water Management Institute.
Anderson TJ, Zizza CA, Leche GM, Scott ME, Solomons NW (1993) The distribution of intestinal helminth infections in a rural village in Guatemala. Mem Inst Oswaldo Cruz 88:53-65. Medline
Andersson Y, Bohan P. (2001) Disease surveillance and waterborne outbreaks. In: Water quality: guidelines, standards and health. Assessment of risk and risk
management for water-related infectious disease. Fewtrell L, Bartram J, eds. IWA Publishing, London.
Appawu MA, Dadzie SK, Baffoe-Wilmot A, Wilson MD (2001) Lymphatic filariasis in Ghana: entomological investigation of transmission dynamics and intensity in communities served by irrigation systems in the upper east region of Ghana. Trop Med Int Health 6:511-6. Medline
Arfaa F, Sahba GH, Farahmandian I, Jalali H (1977) Evaluation of the effect of different methods on control of soil-transmitted helminths in Khuzestan, south-west Iran. Am J Trop Med Hyg 26:230-3.
Azurin JC, Alvero M (1974) Field evaluation of environmental sanitation measures against cholera. Bull World Health Organ 51:19-26. Medline
Barbosa FS, Pinto R, Souza OA (1971) Control of schistosomiasis mansoni in a small north east Brazilain community. Trans R Soc Trop Med Hyg 65:206-13. Medline
Blössner M, de Onis M. (2005) Malnutrition - Quantifying the health impact at national and local levels. World Health Organization, Geneva. Environmental Burden of Disease Series No. 12.
Blackburn BG, Craun GF, Yoder JS, Hill V, Claderon RL, Chen N, et al (2004) Surveillance for waterborne-disease outbreaks associated with drinking water – United States, 2001-2002. MMWR Surveillance Summary 53:23-45.
Cairncross S, Valdmanis V. Water supply, sanitation and hygiene promotion (2006) In: Disease control priorities in developing countries, eds: Jamison D et al. 2nd ed. Oxford University Press and World Bank, Washington.
Cairncross S. (1992) Sanitation and water supply: practical lessons from the decade. Water and Sanitation Discussion Paper Series No. 9, UNDP-World Bank Water and Sanitation Program, The World Bank, Washington, DC.
Quantifying health impacts
48
Checkley W, Gilman RH, Black RE, Epstein LD, Cabrera L, Sterling CR, et al (2004) Effect of water and sanitation on childhood health in a poor Peruvian periurban community. Lancet 363:112-8. Medline
Cifuentes E (1998) The epidemiology of enteric infections in agricultural communities exposed to wastewater irrigation: perspectives for risk control. Int J Environ Health Res 8:203-13.
Coura JR, Amaral RS (2004) Epidemiological and control aspects of schistosomiasis in Brazilian endemic areas. Mem Inst Oswaldo Cruz 99:13-9. Medline
Coura-Filho P, Rocha RS, Farah MW, da Silva GC, Katz N (1994) Identification of factors and groups at risk of infection with Schistosoma mansoni: a strategy for the implementation of control measures? Rev Inst Med Trop Sao Paulo 36:245-53. Medline
Curtis V, Cairncross S (2003) Effect of washing hands with soap on diarrhoea risk in the community: a systematic review. Lancet Infect Dis 3:275-81. Medline
Daniels DL, Cousens SN, Makoae LN, Feachem RG (1990) A case-control study of the impact of improved sanitation on diarrhoea morbidity in Lesotho. Bull World Health Organ 68:455-63. Medline
Dolin PJ, Faal H, Johnson GJ, Minassian D, Sowa S, Day S, et al (1997) Reduction of trachoma in a sub-Saharan village in absence of a disease control programme. Lancet 349:1511-2. Medline
Dupont HL, Levine MM, Hornick RB, Formal SB (1989) Inoculum size in shigellosis and implications for expected mode of transmission. J Infect Dis 159:1126-8. Medline
Emerson PM, Cairncross S, Bailey RL, Mabey DC (2000) Review of the evidence base for the 'F' and 'E' components of the SAFE strategy for trachoma control. Trop Med Int Health 5:515-27. Medline
Emerson PM, Lindsay SW, Walraven GE, Faal H, Bøgh C, Lowe K, et al (1999) Effect of fly control on trachoma and diarrhoea. Lancet 353:1401-3. Medline
Erlanger TE, Keiser J, Caldas de Castro M, Bos R, Singer BH, Tanner M, et al. (2005) Effect of water resource development and management on lymphatic filariasis, and estimates of populations at risk. Am J Trop Med Hyg 73:523-33. Medline
Esrey SA (1996) Water, waste, and well-being: a multicountry study. Am J Epidemiol 143:608-23. Medline
Esrey SA, Habicht JP, Casella G (1992) The complementary effect of latrines and increased water usage on the growth of infants in rural Lesotho. Am J Epidemiol 135:659-66. Medline
Esrey SA, Potash JB, Roberts L, Schiff C (1991) Effects of improved water supply and sanitation on ascariasis, diarrhoea, dracunculiasis, hookworm infection, schistosomiasis, and trachoma. Bull World Health Organ 69:609-21. Medline
Ezzati M, Lopez AD, Rodgers A, Murray CJL eds. (2004) Comparative quantification of health risks. Global and regional burden of disease attributable to selected
major risk factors. World Health Organization, Geneva.
Water, sanitation and hygiene
49
Feachem RG (1984) Interventions for the control of diarrhoeal diseases among young children: promotion of personal and domestic hygiene. Bull World Health Organ 62:467-76. Medline
Fewtrell L, Kaufmann RB, Kay D, Enanoria W, Haller L, Colford JM Jr (2005) Water, sanitation, and hygiene interventions to reduce diarrhoea in less developed countries: a systematic review and meta-analysis. Lancet Infect Dis 5:42-52. Medline
Fewtrell L (2004) Drinking-water nitrate, methaemoglobinemia, and global burden of disease: a discussion. Environ Health Perspect 112:1371-4. Medline
Fewtrell L, Colford J Jr. (2004) Water, sanitation and hygiene: interventions and diarrhoea. A systematic review and meta-analysis. Health, Nutrition and Population (HNP) Discussion Paper, World Bank, Washington, DC.
Fishman S, Caulfield LE, de Onis M, Blossner M, Mullany L, Black RE. (2004). Childhood and maternal underweight. In: Ezzati M, Lopez AD, Rodgers A, Murray CJL, eds. Comparative quantification of health risks: global and regional burden of disease attributable to selected major risk factors. Geneva, World Health Organization.
Giustini M, Ade P, Taggi F, Funari E (2003). Incidenti nelle aree di balneazione. [Accidents in recreational waters.] Annali dell'Istituto Superiore di Sanita, [Annals of the Superior Sanitary Institute,] 39(1):6976.
Gundry S, Wright J, Conroy R (2004) A systematic review of the health outcomes related to household water quality in developing countries. J Water Health 2:1-13. Medline
Habbari K, Tifnouti A, Bitton G, Mandil A (2000) Geohelminthic infections associated with raw wastewater reuse for agricultural purposes in Beni-Mellal, Morocco. Parasitol Int 48:249-54. Medline
Henry FJ (1981) Environmental sanitation infection and nutritional status in infants in rural St. Lucia, West Indies. Trans R Soc Trop Med Hyg 75:507-13. Medline
Hoque BA. Handwashing practices and challenges in Bangladesh (2003) Int J Environ Health Res 13:S81-7. Medline
Humphries DL, Stephenson LS, Pearce EJ, The PH, Dan HT, Khanh LT (1997) The use of human faeces for fertilizer is associated with increased intensity of hookworm infection in Vietnamese women. Trans R Soc Trop Med Hyg 91:518-20. Medline
Hunter PR, Chalmers RM, Hughes S, Syed Q (2005) Self reported diarrhoea in a control group: a strong association with reporting of low pressure events in tap water. Clin Infect Dis 40:e32-4. Medline
Hunter PR. (1997) Waterborne disease: epidemiology and ecology. John Wiley & Sons Ltd., Chichester, England.
Hunter PR, Waite M, Ronchi E, editors. (2003) Drinking water and infectious disease. Establishing the links. CRC Press and IWA Publishing, London.
Huttly SRA, Morris SS, Pisani V (1997) Prevention of diarrhoea in young children in developing countries. Bull World Health Organ 75:163-74. Medline
Quantifying health impacts
50
Jamison DT, Breman JG, Anthony R, Measham AR, Alleyne G, Claeson M, et al. (2006) Disease control priorities in developing countries. The World Bank, Washington.
Jordan P (1972) Epidemiology and control of schistosomiasis. Br Med Bull 28:55-9. Medline
Keiser J, Caldas de Castro M, Maltese MF, Bos R, Tanner M, Singer BH, et al. (2005a) Effect of irrigation and large dams on the burden of malaria on a global and regional scale. Am J Trop Med Hyg 72:392-406.
Keiser J, Maltese MF, Erlanger TE, Bos R, Tanner M, Singer BH, et al. (2005b) Effect of irrigated rice agriculture on Japanese encephalitis, including challenges and opportunities for integrated vector management. Acta Trop 95:40-57. Medline
Konradsen F, Amerasinghe FP, van der Hoek W, Amerasinghe PH. (2000). Malaria in Sri Lanka: Current knowledge on transmission and control. Colombo, Sri Lanka. International Water Management Institute
Lima e Costa MFF, Rocha RS, Leite MLC, et al. (1991) A multivariate analysis of socio-demographic factors, water contact patterns and Schistosoma mansoni infection in an endemic area in Brazil. Rev Inst Med Trop Sao Paulo 33:58-63. Medline
Massara CL, Peixoto SV, Barros Hda S, Enk MJ, Carvalho Odos S, Schall V (2004) Factors associated with schistosomiasis mansoni in a population from the municipality of Jaboticatubas, State of Minas Gerais, Brazil. Mem Inst Oswaldo Cruz 99:127-34. Medline
Mead PS, Slutsker L, Dietz V, McCaig LF, Bresee JS, Shapiro C, Griffin PM, Tauxe RV (1999) Food-related illness and death in the United States. Emerg Infect Dis 5:607-25.
Meddings DR, Ronald LA, Marion S, Pinera JF, Oppliger A (2004) Cost effectiveness of a latrine revision programme in Kabul, Afghanistan. Bull World Health Organ 82:281-9. Medline
Meyrowitsch DW, Nguyen DT, Hoang TH, Nguyen TD, Michael E (1998) A review of the present status of lymphatic filariasis in Vietnam. Acta Trop 70:335-47. Medline
Moraes LR, Cairncross S (2004) Environmental interventions and the pattern of geohelminth infections in Salvador, Brazil. Parasitology 129:223-32. Medline
Muir DA. (1988) Anopheline mosquitoes: vector reproduction, life cycle and biotope. In: Wernsdorfer WH, McGregor I., eds. Malaria. Principles and practices of malariology. New York, Churchill Livingstone.
Murray CJL, Lopez AD, editors. (1996a) The global burden of disease: a comprehensive assessment of mortality and disability from diseases, injuries
and risk factors in 1990 and projected to 2020. Global Burden of Disease and Injury, Vol 1. Harvard School of Public Health on behalf of WHO, Cambridge, MA.
Murray CJL, Lopez AD, editors. (1996b) Global health statistics: a compendium of incidence, prevalence and mortality estimates for over 200 conditions. Global
Water, sanitation and hygiene
51
Burden of Disease and Injury, Vol 2. Harvard School of Public Health on behalf of WHO, Cambridge, MA.
Narain K, Rajguru SK, Mahanta J (2000) Prevalence of Trichuris trichuria in relation to socio-economic and behavioural determinants of exposure to infection in rural Assam. Indian J Med Res 112:140-6. Medline
Norhayati M, Oothuman P, Fatmah MS, Muzain Minudin Y, Zainuddin B (1995) Hookworm infection and reinfection following treatment among Orang Asli children. Med J Malaysia 50:314-9. Medline
Olsen A, Samuelsen H, Onyango-Ouma W (2001) A study of risk factors for intestinal helminth infections using epidemiological and anthropological approaches. J Biosoc Sci 33:569-84. Medline
Payment P, Richardson L, Siemiatycki J, Dewar R, Edwardes M, Franco E (1991) A randomized trial to evaluate the risk of gastrointestinal disease due to consumption of drinking water meeting current microbiological standards. Am J Public Health 81:703-8. Medline
Payment P, Siemiatycki J, Richardson L, Renaud G, Franco E, Prévost M (1997) A prospective epidemiological study of gastrointestinal health effects due to the consumption of drinking water. Int J Environ Health Res 7:5-31.
Peiris JS, Amerasinghe FP, Ameasinghe PH, Ratnayake CB, Karunaratne SH, Tsai TF (1992) Japanese encephalitis in Sri Lanka-the study of an epidemic: vector incrimination, porcine infection and human disease. Trans R Soc Trop Med Hyg 86:307-13. Medline
Prüss A, Kay D, Fewtrell L, Bartram J (2002) Estimating the burden of disease from water, sanitation and hygiene at global level. Environ Health Perspect 110:537-42. Medline
Prüss-Üstün A, Bartram J. (2007) Preventing disease through healthy environments - The contribution of water, sanitation and hygiene. World Health Organization, Geneva.
Prüss-Üstün A, Corvalán C. (2006) Preventing disease through healthy environments: the contribution of water, sanitation and hygiene. World Health Organization, Geneva.
Prüss-Üstün A, Kay D, Fewtrell L, Bartram J (2004) Unsafe water, sanitation and hygiene. In: Comparative quantification of health risks. Global and regional burden of disease attributable to selected major risk factors. Volume 1. Ezzati M, Lopez AD, Rodgers A, Murray CJL, eds. World Health Organization, Geneva.
Prüss-Üstün A, Mathers C, Corvalán C, Woodward A (2003) Introduction and methods. Assessing the environmental burden of disease at national and local levels. Environmental Burden of Disease Series, 1. World Health Organization, Geneva.
Prüss A, Mariotti SP (2000) Preventing trachoma through environmental sanitation: a review of the evidence base. Bull World Health Organ 78:258-66. Medline
Quantifying health impacts
52
Quick RE, Venczel LV, Mintz ED, et al. (1999) Diarrhoea prevention in Bolivia through point-of-use water treatment and safe storage: a promising new strategy. Epidemiol Infect 122:83-90. Medline
Rajeswari B, Sinniah B, Hussein H (1994) Socio-economic factors associated with intestinal parasites among children living in Gombak, Malaysia. Asia Pac J Public Health 7:21-5. Medline
Reuben R, Thenmozhi V, Samuel PP, Gajanana A, Mani TR (1992) Mosquito feeding patterns as a factor in the epidemiology of Japanese encephalitis in southern India. Am J Trop Med Hyg 46:654-63. Medline
Rozendaal JA. (1997). Vector control. Methods for use by individuals and communities. Geneva, World Health Organization.
Saldiva SR, Silveira AS, Philippi ST, Torres DM, Mangini AC, Dias AC, et al. (1999) Ascaris-Trichuris association and malnutrition in Brazilian children. Paediatr Perinat Epidemiol 13:89-98. Medline
Semenza JC, Roberts L, Henderson A, Bogan J, Rubin CH (1998) Water distribution system and diarrheal disease transmission: a case study in Uzbekistan. Am J Trop Med Hyg 59:941-6. Medline
Smith H, Dekaminsky R, Niwas S, Soto R, Jolly P (2001) Prevalence and intensity of infections of Ascaris lumbricoides and Trichuris trichuria and associated socio-demographic variables in rural rural Honduran communities. Mem Inst Oswaldo Cruz 96:303-14. Medline
Sorensen E, Ismail M, Amarasinghe DK, Hettiarachchi I, Dassenaieke TS (1994) The effect of the availability of latrines on soil-transmitted nematode infections in the plantation sector of Sri-Lanka. Am J Trop Med Hyg 51:36-9. Medline
Steinmann P, Keiser J, Bos R, Tanner M, Utzinger J (2006) Schistosomiasis and water resources development: systematic review, meta-analysis, and estimates of people at risk. Lancet Infect Dis 6:411-25. Medline
Sutter EE, Ballard RC (1983) Community participation in the control of trachoma in Gazankulu. Soc Sci Med 17:1813-7. Medline
Toma A, Miyagi I, Kamimura K, Tokuyama Y, Hasegawa H, Selomo M, et al. (1999) Questionnaire survey and prevalence of intestinal helminthic infections in Barru, Sulawesi, Indonesia. Southeast Asian J Trop Med Public Health 30:68-77. Medline
Van der Hoek W, Sakthivadivel R, Renshaw M, Silver JB, Birley MH, Konradsen F. (2001). Alternate wet/dry irrigation in rice cultivation: a practical way to save water and control malaria and Japanese encephalitis? IWMI Research Report 47, Colombo, Sri Lanka, International Water Management Institute
WHO/UNICEF. (2006) Meeting the MDG Drinking Water and Sanitation. The urban and rural challenge of the decade. World Health Organization and United Nations Children’s Fund, Geneva.
WHO. (2007). Preventing disease through healthy environments. The contribution of water, sanitation and hygiene. World Health Organization, Geneva.
WHO. (2007) Nutrients in drinking water: Potential health consequences of long-term consumption of demineralized, remineralized and altered mineral content
Water, sanitation and hygiene
53
drinking water. Report of an expert meeting. Geneva, World Health Organization. In press.
WHO. (2006a). Guidelines for the safe use of wastewater, excreta and greywater in agriculture and aquacukture Vols 1-4, Geneva, World Health Organization.
WHO (2004) World Health Report 2004 Changing history. Geneva, World Health Organization.
WHO (2002) World Health Report 2002 Reducing risks, promoting healthy life. World Health Organization, Geneva.
Wilson MD, Cheke RA, Flasse SP, Grist S, Osei-Ateweneboana MY, Tetteh-Kumah A et al. (2002) Deforestation and the spatio-temporal distribution of savannah and forest members of the Simulium damnosum complex in southern Ghana and south-western Togo. Trans R Soc Trop Med Hyg 96:632-9. Medline
Zhaowu W, Kaiming B, Liping Y, Guifeng Y, Jinhua Z, Qili L (1993) Factors contributing to reinfection with Schistosomiasis japonica after treatment in the lake region of China. Acta Trop 54:83-8. Medline
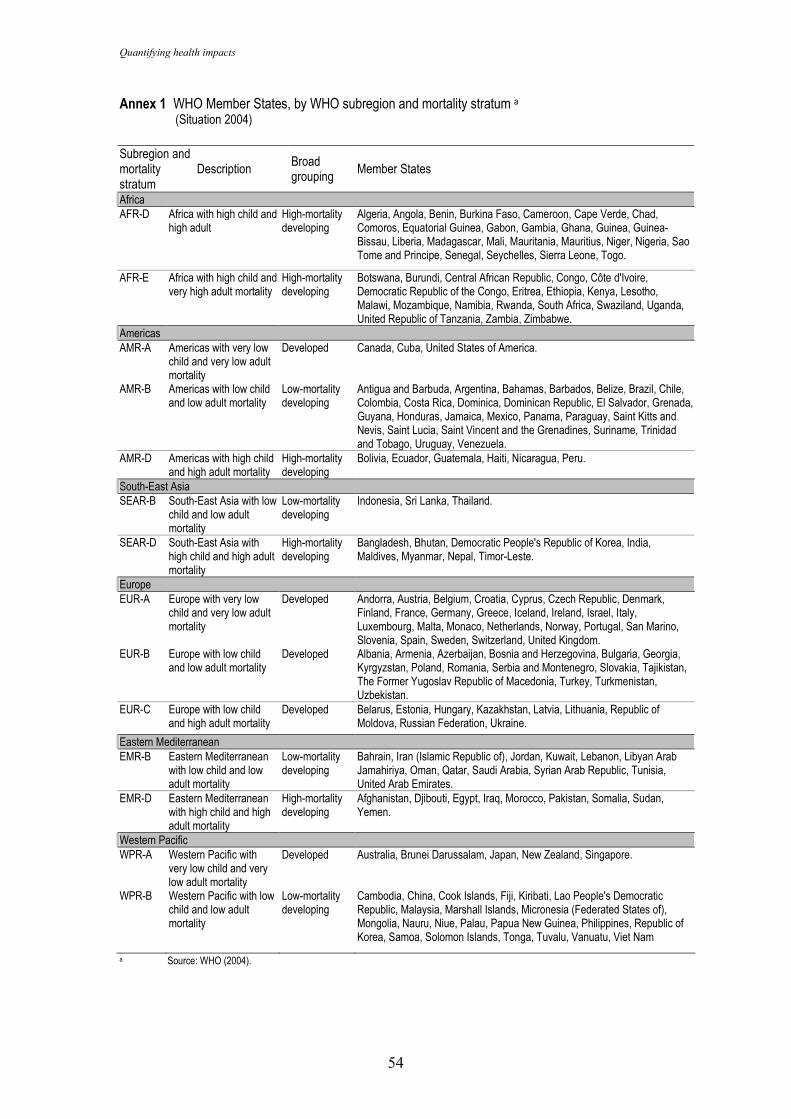
Quantifying health impacts
54
Annex 1 WHO Member States, by WHO subregion and mortality stratum a (Situation 2004) Subregion and mortality stratum
Description Broad grouping
Member States
Africa AFR-D Africa with high child and
high adult High-mortality developing
Algeria, Angola, Benin, Burkina Faso, Cameroon, Cape Verde, Chad, Comoros, Equatorial Guinea, Gabon, Gambia, Ghana, Guinea, Guinea-Bissau, Liberia, Madagascar, Mali, Mauritania, Mauritius, Niger, Nigeria, Sao Tome and Principe, Senegal, Seychelles, Sierra Leone, Togo.
AFR-E Africa with high child and very high adult mortality
High-mortality developing
Botswana, Burundi, Central African Republic, Congo, Côte d'Ivoire, Democratic Republic of the Congo, Eritrea, Ethiopia, Kenya, Lesotho, Malawi, Mozambique, Namibia, Rwanda, South Africa, Swaziland, Uganda, United Republic of Tanzania, Zambia, Zimbabwe.
Americas AMR-A Americas with very low
child and very low adult mortality
Developed Canada, Cuba, United States of America.
AMR-B Americas with low child and low adult mortality
Low-mortality developing
Antigua and Barbuda, Argentina, Bahamas, Barbados, Belize, Brazil, Chile, Colombia, Costa Rica, Dominica, Dominican Republic, El Salvador, Grenada, Guyana, Honduras, Jamaica, Mexico, Panama, Paraguay, Saint Kitts and Nevis, Saint Lucia, Saint Vincent and the Grenadines, Suriname, Trinidad and Tobago, Uruguay, Venezuela.
AMR-D Americas with high child and high adult mortality
High-mortality developing
Bolivia, Ecuador, Guatemala, Haiti, Nicaragua, Peru.
South-East Asia SEAR-B South-East Asia with low
child and low adult mortality
Low-mortality developing
Indonesia, Sri Lanka, Thailand.
SEAR-D South-East Asia with high child and high adult mortality
High-mortality developing
Bangladesh, Bhutan, Democratic People's Republic of Korea, India, Maldives, Myanmar, Nepal, Timor-Leste.
Europe EUR-A Europe with very low
child and very low adult mortality
Developed Andorra, Austria, Belgium, Croatia, Cyprus, Czech Republic, Denmark, Finland, France, Germany, Greece, Iceland, Ireland, Israel, Italy, Luxembourg, Malta, Monaco, Netherlands, Norway, Portugal, San Marino, Slovenia, Spain, Sweden, Switzerland, United Kingdom.
EUR-B Europe with low child and low adult mortality
Developed Albania, Armenia, Azerbaijan, Bosnia and Herzegovina, Bulgaria, Georgia, Kyrgyzstan, Poland, Romania, Serbia and Montenegro, Slovakia, Tajikistan, The Former Yugoslav Republic of Macedonia, Turkey, Turkmenistan, Uzbekistan.
EUR-C Europe with low child and high adult mortality
Developed Belarus, Estonia, Hungary, Kazakhstan, Latvia, Lithuania, Republic of Moldova, Russian Federation, Ukraine.
Eastern Mediterranean EMR-B Eastern Mediterranean
with low child and low adult mortality
Low-mortality developing
Bahrain, Iran (Islamic Republic of), Jordan, Kuwait, Lebanon, Libyan Arab Jamahiriya, Oman, Qatar, Saudi Arabia, Syrian Arab Republic, Tunisia, United Arab Emirates.
EMR-D Eastern Mediterranean with high child and high adult mortality
High-mortality developing
Afghanistan, Djibouti, Egypt, Iraq, Morocco, Pakistan, Somalia, Sudan, Yemen.
Western Pacific WPR-A Western Pacific with
very low child and very low adult mortality
Developed Australia, Brunei Darussalam, Japan, New Zealand, Singapore.
WPR-B Western Pacific with low child and low adult mortality
Low-mortality developing
Cambodia, China, Cook Islands, Fiji, Kiribati, Lao People's Democratic Republic, Malaysia, Marshall Islands, Micronesia (Federated States of), Mongolia, Nauru, Niue, Palau, Papua New Guinea, Philippines, Republic of Korea, Samoa, Solomon Islands, Tonga, Tuvalu, Vanuatu, Viet Nam
a Source: WHO (2004).
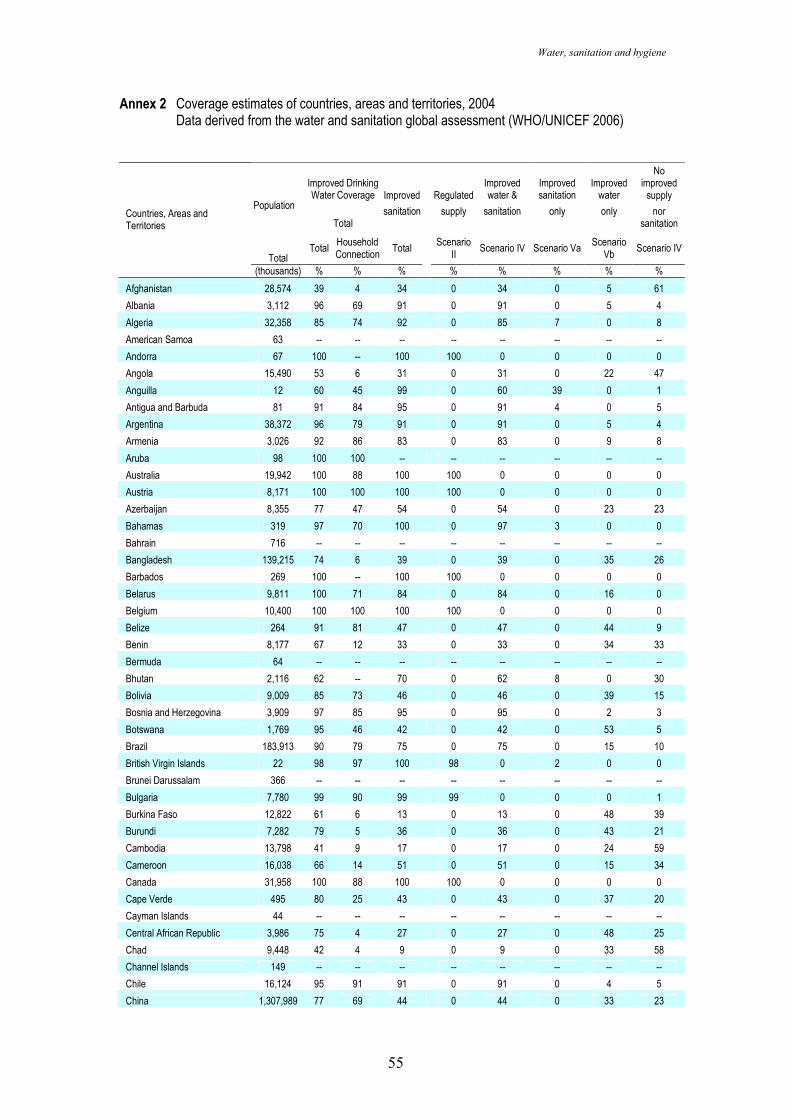
Water, sanitation and hygiene
55
Annex 2 Coverage estimates of countries, areas and territories, 2004 Data derived from the water and sanitation global assessment (WHO/UNICEF 2006)
Improved Drinking Water Coverage Improved Regulated
Improved water &
Improved sanitation
Improved water
No improved supply
Total sanitation supply sanitation only only nor
sanitation
Population
Total Total
Household Connection
Total Scenario
II Scenario IV Scenario Va
Scenario Vb
Scenario IV
Countries, Areas and Territories
(thousands) % % % % % % % %
Afghanistan 28,574 39 4 34 0 34 0 5 61
Albania 3,112 96 69 91 0 91 0 5 4
Algeria 32,358 85 74 92 0 85 7 0 8
American Samoa 63 -- -- -- -- -- -- -- --
Andorra 67 100 -- 100 100 0 0 0 0
Angola 15,490 53 6 31 0 31 0 22 47
Anguilla 12 60 45 99 0 60 39 0 1
Antigua and Barbuda 81 91 84 95 0 91 4 0 5
Argentina 38,372 96 79 91 0 91 0 5 4
Armenia 3,026 92 86 83 0 83 0 9 8
Aruba 98 100 100 -- -- -- -- -- --
Australia 19,942 100 88 100 100 0 0 0 0
Austria 8,171 100 100 100 100 0 0 0 0
Azerbaijan 8,355 77 47 54 0 54 0 23 23
Bahamas 319 97 70 100 0 97 3 0 0
Bahrain 716 -- -- -- -- -- -- -- --
Bangladesh 139,215 74 6 39 0 39 0 35 26
Barbados 269 100 -- 100 100 0 0 0 0
Belarus 9,811 100 71 84 0 84 0 16 0
Belgium 10,400 100 100 100 100 0 0 0 0
Belize 264 91 81 47 0 47 0 44 9
Benin 8,177 67 12 33 0 33 0 34 33
Bermuda 64 -- -- -- -- -- -- -- --
Bhutan 2,116 62 -- 70 0 62 8 0 30
Bolivia 9,009 85 73 46 0 46 0 39 15
Bosnia and Herzegovina 3,909 97 85 95 0 95 0 2 3
Botswana 1,769 95 46 42 0 42 0 53 5
Brazil 183,913 90 79 75 0 75 0 15 10
British Virgin Islands 22 98 97 100 98 0 2 0 0
Brunei Darussalam 366 -- -- -- -- -- -- -- --
Bulgaria 7,780 99 90 99 99 0 0 0 1
Burkina Faso 12,822 61 6 13 0 13 0 48 39
Burundi 7,282 79 5 36 0 36 0 43 21
Cambodia 13,798 41 9 17 0 17 0 24 59
Cameroon 16,038 66 14 51 0 51 0 15 34
Canada 31,958 100 88 100 100 0 0 0 0
Cape Verde 495 80 25 43 0 43 0 37 20
Cayman Islands 44 -- -- -- -- -- -- -- --
Central African Republic 3,986 75 4 27 0 27 0 48 25
Chad 9,448 42 4 9 0 9 0 33 58
Channel Islands 149 -- -- -- -- -- -- -- --
Chile 16,124 95 91 91 0 91 0 4 5
China 1,307,989 77 69 44 0 44 0 33 23
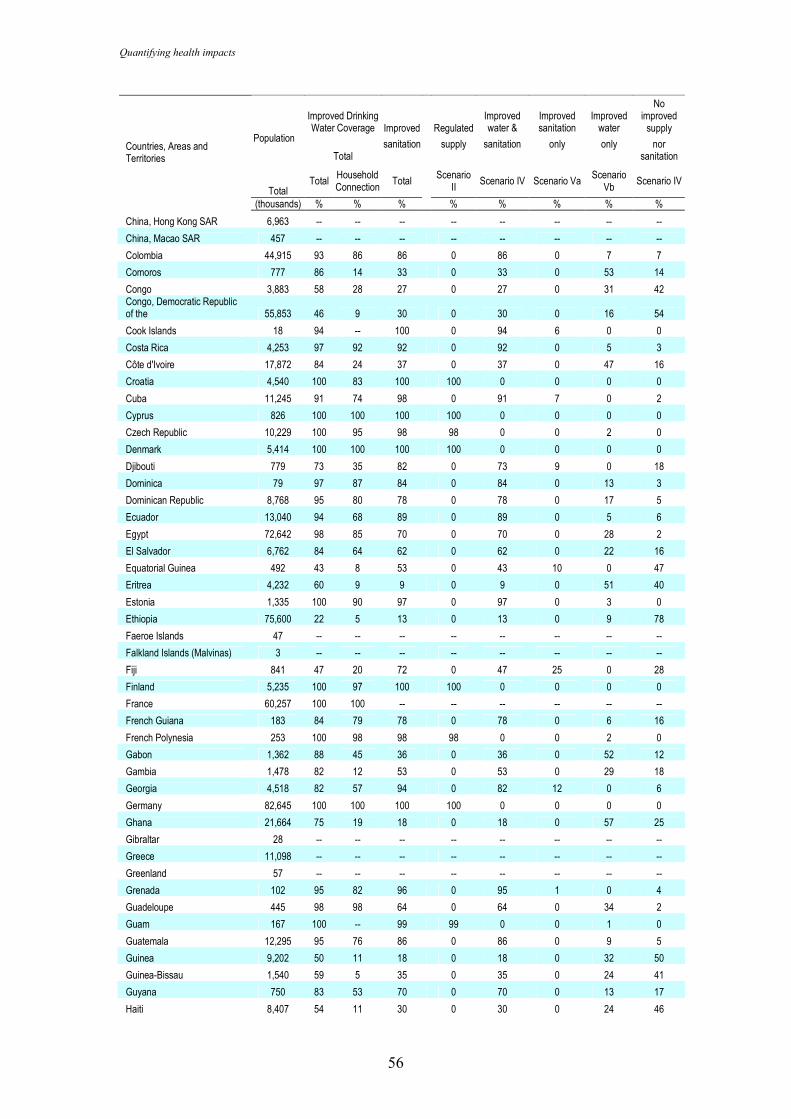
Quantifying health impacts
56
Improved Drinking Water Coverage Improved Regulated
Improved water &
Improved sanitation
Improved water
No improved supply
Total sanitation supply sanitation only only nor
sanitation
Population
Total Total
Household Connection
Total Scenario
II Scenario IV Scenario Va
Scenario Vb
Scenario IV
Countries, Areas and Territories
(thousands) % % % % % % % %
China, Hong Kong SAR 6,963 -- -- -- -- -- -- -- --
China, Macao SAR 457 -- -- -- -- -- -- -- --
Colombia 44,915 93 86 86 0 86 0 7 7
Comoros 777 86 14 33 0 33 0 53 14
Congo 3,883 58 28 27 0 27 0 31 42 Congo, Democratic Republic of the 55,853 46 9 30 0 30 0 16 54
Cook Islands 18 94 -- 100 0 94 6 0 0
Costa Rica 4,253 97 92 92 0 92 0 5 3
Côte d'Ivoire 17,872 84 24 37 0 37 0 47 16
Croatia 4,540 100 83 100 100 0 0 0 0
Cuba 11,245 91 74 98 0 91 7 0 2
Cyprus 826 100 100 100 100 0 0 0 0
Czech Republic 10,229 100 95 98 98 0 0 2 0
Denmark 5,414 100 100 100 100 0 0 0 0
Djibouti 779 73 35 82 0 73 9 0 18
Dominica 79 97 87 84 0 84 0 13 3
Dominican Republic 8,768 95 80 78 0 78 0 17 5
Ecuador 13,040 94 68 89 0 89 0 5 6
Egypt 72,642 98 85 70 0 70 0 28 2
El Salvador 6,762 84 64 62 0 62 0 22 16
Equatorial Guinea 492 43 8 53 0 43 10 0 47
Eritrea 4,232 60 9 9 0 9 0 51 40
Estonia 1,335 100 90 97 0 97 0 3 0
Ethiopia 75,600 22 5 13 0 13 0 9 78
Faeroe Islands 47 -- -- -- -- -- -- -- --
Falkland Islands (Malvinas) 3 -- -- -- -- -- -- -- --
Fiji 841 47 20 72 0 47 25 0 28
Finland 5,235 100 97 100 100 0 0 0 0
France 60,257 100 100 -- -- -- -- -- --
French Guiana 183 84 79 78 0 78 0 6 16
French Polynesia 253 100 98 98 98 0 0 2 0
Gabon 1,362 88 45 36 0 36 0 52 12
Gambia 1,478 82 12 53 0 53 0 29 18
Georgia 4,518 82 57 94 0 82 12 0 6
Germany 82,645 100 100 100 100 0 0 0 0
Ghana 21,664 75 19 18 0 18 0 57 25
Gibraltar 28 -- -- -- -- -- -- -- --
Greece 11,098 -- -- -- -- -- -- -- --
Greenland 57 -- -- -- -- -- -- -- --
Grenada 102 95 82 96 0 95 1 0 4
Guadeloupe 445 98 98 64 0 64 0 34 2
Guam 167 100 -- 99 99 0 0 1 0
Guatemala 12,295 95 76 86 0 86 0 9 5
Guinea 9,202 50 11 18 0 18 0 32 50
Guinea-Bissau 1,540 59 5 35 0 35 0 24 41
Guyana 750 83 53 70 0 70 0 13 17
Haiti 8,407 54 11 30 0 30 0 24 46
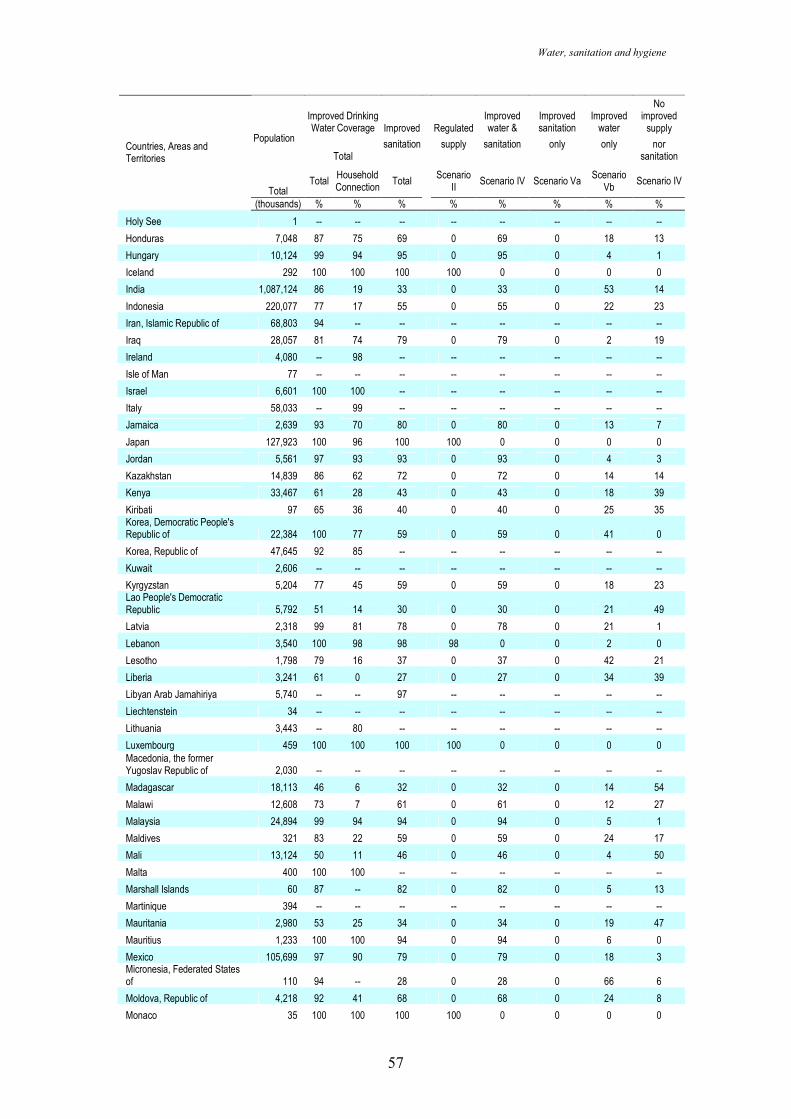
Water, sanitation and hygiene
57
Improved Drinking Water Coverage Improved Regulated
Improved water &
Improved sanitation
Improved water
No improved supply
Total sanitation supply sanitation only only nor
sanitation
Population
Total Total
Household Connection
Total Scenario
II Scenario IV Scenario Va
Scenario Vb
Scenario IV
Countries, Areas and Territories
(thousands) % % % % % % % %
Holy See 1 -- -- -- -- -- -- -- --
Honduras 7,048 87 75 69 0 69 0 18 13
Hungary 10,124 99 94 95 0 95 0 4 1
Iceland 292 100 100 100 100 0 0 0 0
India 1,087,124 86 19 33 0 33 0 53 14
Indonesia 220,077 77 17 55 0 55 0 22 23
Iran, Islamic Republic of 68,803 94 -- -- -- -- -- -- --
Iraq 28,057 81 74 79 0 79 0 2 19
Ireland 4,080 -- 98 -- -- -- -- -- --
Isle of Man 77 -- -- -- -- -- -- -- --
Israel 6,601 100 100 -- -- -- -- -- --
Italy 58,033 -- 99 -- -- -- -- -- --
Jamaica 2,639 93 70 80 0 80 0 13 7
Japan 127,923 100 96 100 100 0 0 0 0
Jordan 5,561 97 93 93 0 93 0 4 3
Kazakhstan 14,839 86 62 72 0 72 0 14 14
Kenya 33,467 61 28 43 0 43 0 18 39
Kiribati 97 65 36 40 0 40 0 25 35 Korea, Democratic People's Republic of 22,384 100 77 59 0 59 0 41 0
Korea, Republic of 47,645 92 85 -- -- -- -- -- --
Kuwait 2,606 -- -- -- -- -- -- -- --
Kyrgyzstan 5,204 77 45 59 0 59 0 18 23 Lao People's Democratic Republic 5,792 51 14 30 0 30 0 21 49
Latvia 2,318 99 81 78 0 78 0 21 1
Lebanon 3,540 100 98 98 98 0 0 2 0
Lesotho 1,798 79 16 37 0 37 0 42 21
Liberia 3,241 61 0 27 0 27 0 34 39
Libyan Arab Jamahiriya 5,740 -- -- 97 -- -- -- -- --
Liechtenstein 34 -- -- -- -- -- -- -- --
Lithuania 3,443 -- 80 -- -- -- -- -- --
Luxembourg 459 100 100 100 100 0 0 0 0 Macedonia, the former Yugoslav Republic of 2,030 -- -- -- -- -- -- -- --
Madagascar 18,113 46 6 32 0 32 0 14 54
Malawi 12,608 73 7 61 0 61 0 12 27
Malaysia 24,894 99 94 94 0 94 0 5 1
Maldives 321 83 22 59 0 59 0 24 17
Mali 13,124 50 11 46 0 46 0 4 50
Malta 400 100 100 -- -- -- -- -- --
Marshall Islands 60 87 -- 82 0 82 0 5 13
Martinique 394 -- -- -- -- -- -- -- --
Mauritania 2,980 53 25 34 0 34 0 19 47
Mauritius 1,233 100 100 94 0 94 0 6 0
Mexico 105,699 97 90 79 0 79 0 18 3 Micronesia, Federated States of 110 94 -- 28 0 28 0 66 6
Moldova, Republic of 4,218 92 41 68 0 68 0 24 8
Monaco 35 100 100 100 100 0 0 0 0
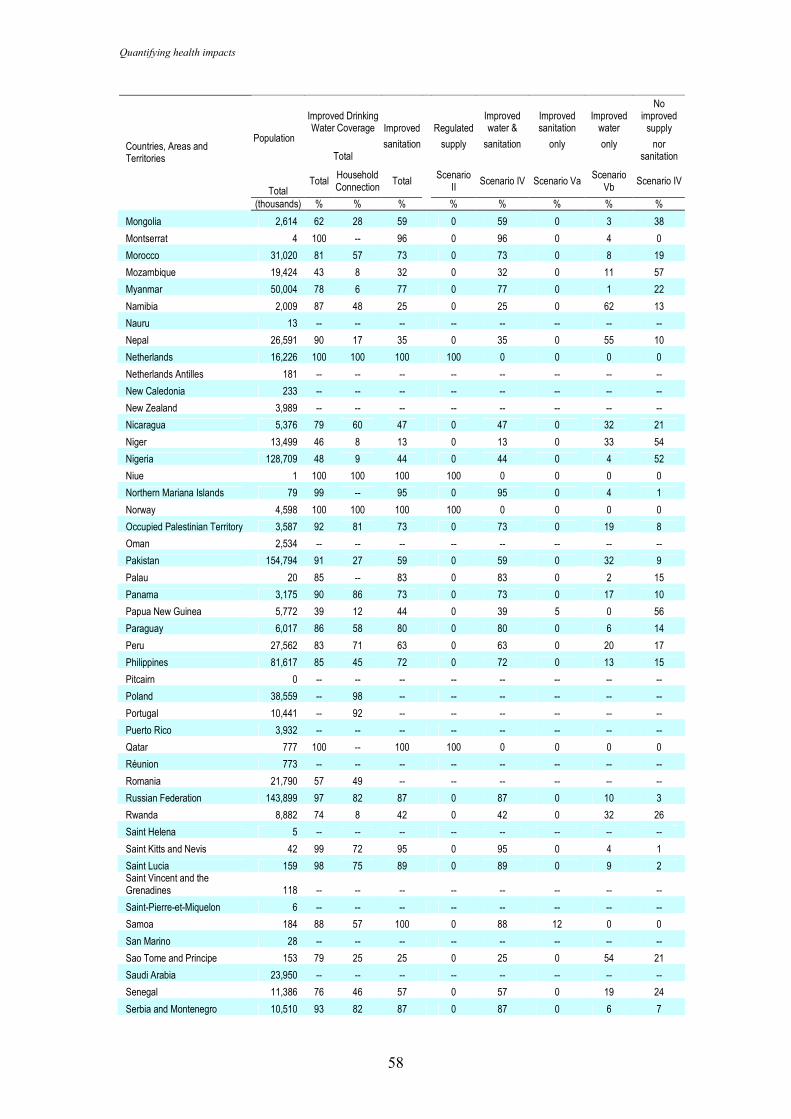
Quantifying health impacts
58
Improved Drinking Water Coverage Improved Regulated
Improved water &
Improved sanitation
Improved water
No improved supply
Total sanitation supply sanitation only only nor
sanitation
Population
Total Total
Household Connection
Total Scenario
II Scenario IV Scenario Va
Scenario Vb
Scenario IV
Countries, Areas and Territories
(thousands) % % % % % % % %
Mongolia 2,614 62 28 59 0 59 0 3 38
Montserrat 4 100 -- 96 0 96 0 4 0
Morocco 31,020 81 57 73 0 73 0 8 19
Mozambique 19,424 43 8 32 0 32 0 11 57
Myanmar 50,004 78 6 77 0 77 0 1 22
Namibia 2,009 87 48 25 0 25 0 62 13
Nauru 13 -- -- -- -- -- -- -- --
Nepal 26,591 90 17 35 0 35 0 55 10
Netherlands 16,226 100 100 100 100 0 0 0 0
Netherlands Antilles 181 -- -- -- -- -- -- -- --
New Caledonia 233 -- -- -- -- -- -- -- --
New Zealand 3,989 -- -- -- -- -- -- -- --
Nicaragua 5,376 79 60 47 0 47 0 32 21
Niger 13,499 46 8 13 0 13 0 33 54
Nigeria 128,709 48 9 44 0 44 0 4 52
Niue 1 100 100 100 100 0 0 0 0
Northern Mariana Islands 79 99 -- 95 0 95 0 4 1
Norway 4,598 100 100 100 100 0 0 0 0
Occupied Palestinian Territory 3,587 92 81 73 0 73 0 19 8
Oman 2,534 -- -- -- -- -- -- -- --
Pakistan 154,794 91 27 59 0 59 0 32 9
Palau 20 85 -- 83 0 83 0 2 15
Panama 3,175 90 86 73 0 73 0 17 10
Papua New Guinea 5,772 39 12 44 0 39 5 0 56
Paraguay 6,017 86 58 80 0 80 0 6 14
Peru 27,562 83 71 63 0 63 0 20 17
Philippines 81,617 85 45 72 0 72 0 13 15
Pitcairn 0 -- -- -- -- -- -- -- --
Poland 38,559 -- 98 -- -- -- -- -- --
Portugal 10,441 -- 92 -- -- -- -- -- --
Puerto Rico 3,932 -- -- -- -- -- -- -- --
Qatar 777 100 -- 100 100 0 0 0 0
Réunion 773 -- -- -- -- -- -- -- --
Romania 21,790 57 49 -- -- -- -- -- --
Russian Federation 143,899 97 82 87 0 87 0 10 3
Rwanda 8,882 74 8 42 0 42 0 32 26
Saint Helena 5 -- -- -- -- -- -- -- --
Saint Kitts and Nevis 42 99 72 95 0 95 0 4 1
Saint Lucia 159 98 75 89 0 89 0 9 2 Saint Vincent and the Grenadines 118 -- -- -- -- -- -- -- --
Saint-Pierre-et-Miquelon 6 -- -- -- -- -- -- -- --
Samoa 184 88 57 100 0 88 12 0 0
San Marino 28 -- -- -- -- -- -- -- --
Sao Tome and Principe 153 79 25 25 0 25 0 54 21
Saudi Arabia 23,950 -- -- -- -- -- -- -- --
Senegal 11,386 76 46 57 0 57 0 19 24
Serbia and Montenegro 10,510 93 82 87 0 87 0 6 7
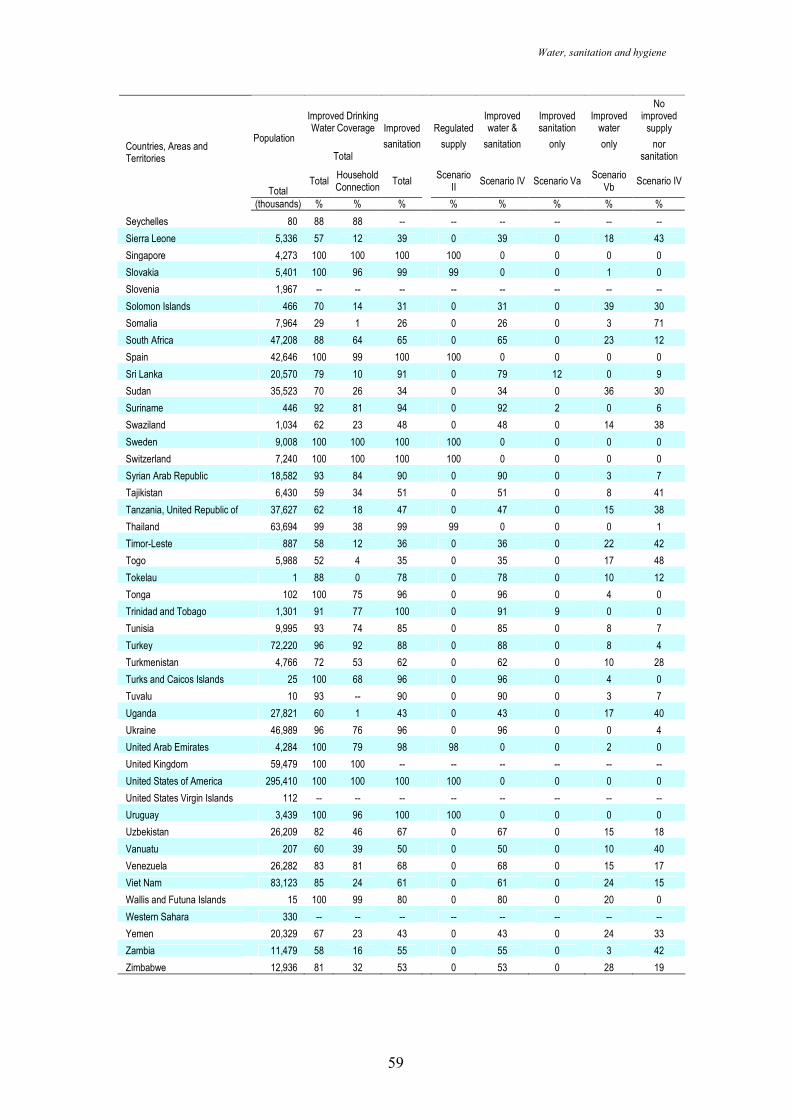
Water, sanitation and hygiene
59
Improved Drinking Water Coverage Improved Regulated
Improved water &
Improved sanitation
Improved water
No improved supply
Total sanitation supply sanitation only only nor
sanitation
Population
Total Total
Household Connection
Total Scenario
II Scenario IV Scenario Va
Scenario Vb
Scenario IV
Countries, Areas and Territories
(thousands) % % % % % % % %
Seychelles 80 88 88 -- -- -- -- -- --
Sierra Leone 5,336 57 12 39 0 39 0 18 43
Singapore 4,273 100 100 100 100 0 0 0 0
Slovakia 5,401 100 96 99 99 0 0 1 0
Slovenia 1,967 -- -- -- -- -- -- -- --
Solomon Islands 466 70 14 31 0 31 0 39 30
Somalia 7,964 29 1 26 0 26 0 3 71
South Africa 47,208 88 64 65 0 65 0 23 12
Spain 42,646 100 99 100 100 0 0 0 0
Sri Lanka 20,570 79 10 91 0 79 12 0 9
Sudan 35,523 70 26 34 0 34 0 36 30
Suriname 446 92 81 94 0 92 2 0 6
Swaziland 1,034 62 23 48 0 48 0 14 38
Sweden 9,008 100 100 100 100 0 0 0 0
Switzerland 7,240 100 100 100 100 0 0 0 0
Syrian Arab Republic 18,582 93 84 90 0 90 0 3 7
Tajikistan 6,430 59 34 51 0 51 0 8 41
Tanzania, United Republic of 37,627 62 18 47 0 47 0 15 38
Thailand 63,694 99 38 99 99 0 0 0 1
Timor-Leste 887 58 12 36 0 36 0 22 42
Togo 5,988 52 4 35 0 35 0 17 48
Tokelau 1 88 0 78 0 78 0 10 12
Tonga 102 100 75 96 0 96 0 4 0
Trinidad and Tobago 1,301 91 77 100 0 91 9 0 0
Tunisia 9,995 93 74 85 0 85 0 8 7
Turkey 72,220 96 92 88 0 88 0 8 4
Turkmenistan 4,766 72 53 62 0 62 0 10 28
Turks and Caicos Islands 25 100 68 96 0 96 0 4 0
Tuvalu 10 93 -- 90 0 90 0 3 7
Uganda 27,821 60 1 43 0 43 0 17 40
Ukraine 46,989 96 76 96 0 96 0 0 4
United Arab Emirates 4,284 100 79 98 98 0 0 2 0
United Kingdom 59,479 100 100 -- -- -- -- -- --
United States of America 295,410 100 100 100 100 0 0 0 0
United States Virgin Islands 112 -- -- -- -- -- -- -- --
Uruguay 3,439 100 96 100 100 0 0 0 0
Uzbekistan 26,209 82 46 67 0 67 0 15 18
Vanuatu 207 60 39 50 0 50 0 10 40
Venezuela 26,282 83 81 68 0 68 0 15 17
Viet Nam 83,123 85 24 61 0 61 0 24 15
Wallis and Futuna Islands 15 100 99 80 0 80 0 20 0
Western Sahara 330 -- -- -- -- -- -- -- --
Yemen 20,329 67 23 43 0 43 0 24 33
Zambia 11,479 58 16 55 0 55 0 3 42
Zimbabwe 12,936 81 32 53 0 53 0 28 19
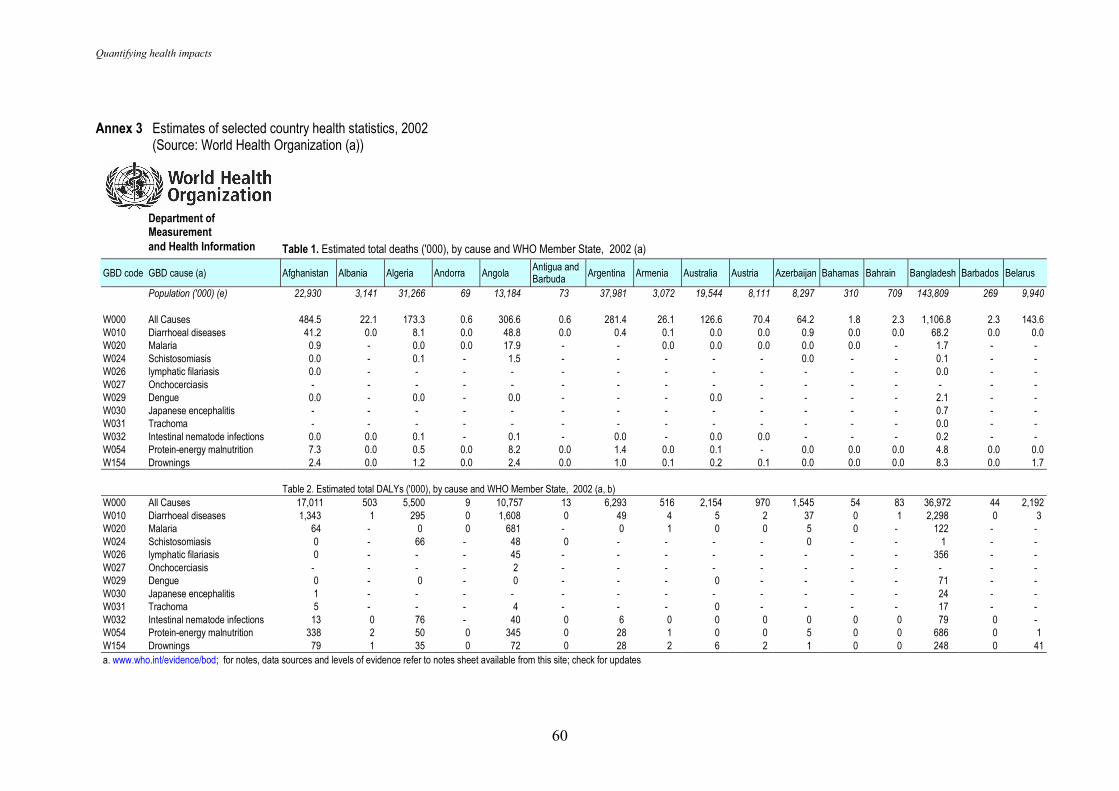
Quantifying health impacts
60
Annex 3 Estimates of selected country health statistics, 2002 (Source: World Health Organization (a))
Department of Measurement
and Health Information Table 1. Estimated total deaths ('000), by cause and WHO Member State, 2002 (a)
GBD code GBD cause (a) Afghanistan Albania Algeria Andorra Angola Antigua and Barbuda Argentina Armenia Australia Austria Azerbaijan Bahamas Bahrain Bangladesh Barbados Belarus
Population ('000) (e) 22,930 3,141 31,266 69 13,184 73 37,981 3,072 19,544 8,111 8,297 310 709 143,809 269 9,940
W000 All Causes 484.5 22.1 173.3 0.6 306.6 0.6 281.4 26.1 126.6 70.4 64.2 1.8 2.3 1,106.8 2.3 143.6 W010 Diarrhoeal diseases 41.2 0.0 8.1 0.0 48.8 0.0 0.4 0.1 0.0 0.0 0.9 0.0 0.0 68.2 0.0 0.0 W020 Malaria 0.9 - 0.0 0.0 17.9 - - 0.0 0.0 0.0 0.0 0.0 - 1.7 - - W024 Schistosomiasis 0.0 - 0.1 - 1.5 - - - - - 0.0 - - 0.1 - - W026 lymphatic filariasis 0.0 - - - - - - - - - - - - 0.0 - - W027 Onchocerciasis - - - - - - - - - - - - - - - - W029 Dengue 0.0 - 0.0 - 0.0 - - - 0.0 - - - - 2.1 - - W030 Japanese encephalitis - - - - - - - - - - - - - 0.7 - - W031 Trachoma - - - - - - - - - - - - - 0.0 - - W032 Intestinal nematode infections 0.0 0.0 0.1 - 0.1 - 0.0 - 0.0 0.0 - - - 0.2 - - W054 Protein-energy malnutrition 7.3 0.0 0.5 0.0 8.2 0.0 1.4 0.0 0.1 - 0.0 0.0 0.0 4.8 0.0 0.0 W154 Drownings 2.4 0.0 1.2 0.0 2.4 0.0 1.0 0.1 0.2 0.1 0.0 0.0 0.0 8.3 0.0 1.7 Table 2. Estimated total DALYs ('000), by cause and WHO Member State, 2002 (a, b)
W000 All Causes 17,011 503 5,500 9 10,757 13 6,293 516 2,154 970 1,545 54 83 36,972 44 2,192 W010 Diarrhoeal diseases 1,343 1 295 0 1,608 0 49 4 5 2 37 0 1 2,298 0 3 W020 Malaria 64 - 0 0 681 - 0 1 0 0 5 0 - 122 - - W024 Schistosomiasis 0 - 66 - 48 0 - - - - 0 - - 1 - - W026 lymphatic filariasis 0 - - - 45 - - - - - - - - 356 - - W027 Onchocerciasis - - - - 2 - - - - - - - - - - - W029 Dengue 0 - 0 - 0 - - - 0 - - - - 71 - - W030 Japanese encephalitis 1 - - - - - - - - - - - - 24 - - W031 Trachoma 5 - - - 4 - - - 0 - - - - 17 - - W032 Intestinal nematode infections 13 0 76 - 40 0 6 0 0 0 0 0 0 79 0 - W054 Protein-energy malnutrition 338 2 50 0 345 0 28 1 0 0 5 0 0 686 0 1 W154 Drownings 79 1 35 0 72 0 28 2 6 2 1 0 0 248 0 41 a. www.who.int/evidence/bod; for notes, data sources and levels of evidence refer to notes sheet available from this site; check for updates
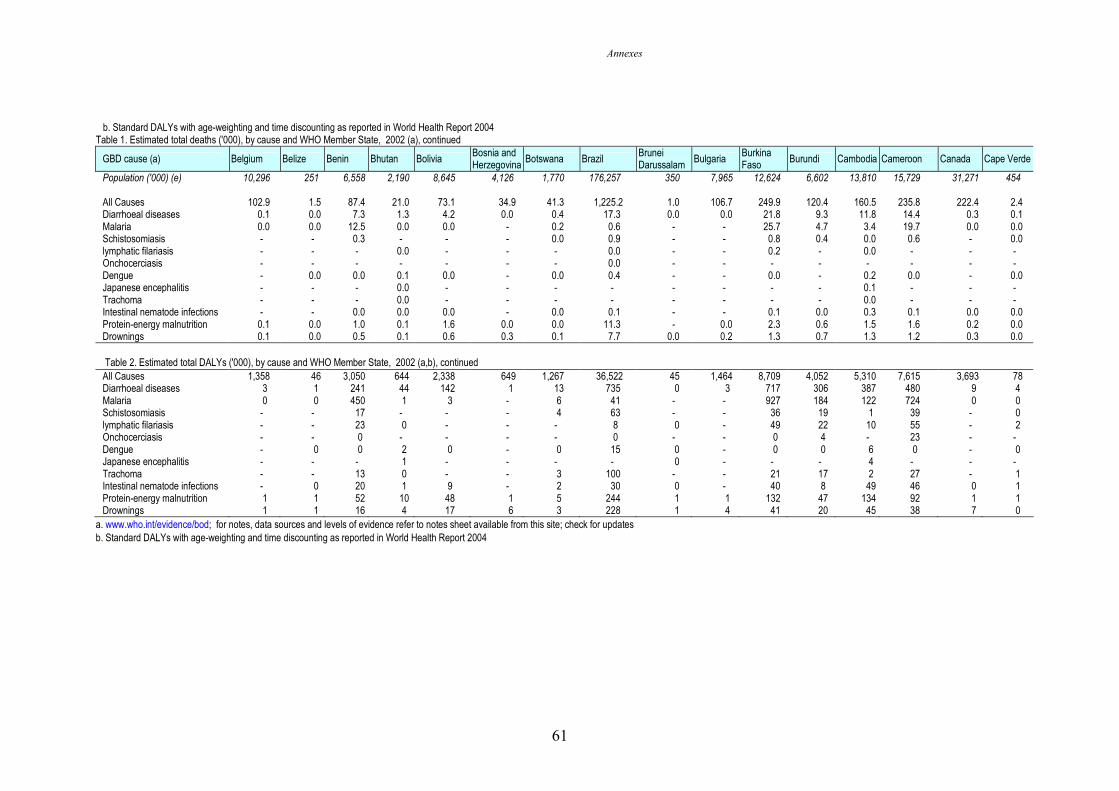
Annexes
61
b. Standard DALYs with age-weighting and time discounting as reported in World Health Report 2004 Table 1. Estimated total deaths ('000), by cause and WHO Member State, 2002 (a), continued
GBD cause (a) Belgium Belize Benin Bhutan Bolivia Bosnia and Herzegovina
Botswana Brazil Brunei Darussalam
Bulgaria Burkina Faso
Burundi Cambodia Cameroon Canada Cape Verde
Population ('000) (e) 10,296 251 6,558 2,190 8,645 4,126 1,770 176,257 350 7,965 12,624 6,602 13,810 15,729 31,271 454 All Causes 102.9 1.5 87.4 21.0 73.1 34.9 41.3 1,225.2 1.0 106.7 249.9 120.4 160.5 235.8 222.4 2.4 Diarrhoeal diseases 0.1 0.0 7.3 1.3 4.2 0.0 0.4 17.3 0.0 0.0 21.8 9.3 11.8 14.4 0.3 0.1 Malaria 0.0 0.0 12.5 0.0 0.0 - 0.2 0.6 - - 25.7 4.7 3.4 19.7 0.0 0.0 Schistosomiasis - - 0.3 - - - 0.0 0.9 - - 0.8 0.4 0.0 0.6 - 0.0 lymphatic filariasis - - - 0.0 - - - 0.0 - - 0.2 - 0.0 - - - Onchocerciasis - - - - - - - 0.0 - - - - - - - - Dengue - 0.0 0.0 0.1 0.0 - 0.0 0.4 - - 0.0 - 0.2 0.0 - 0.0 Japanese encephalitis - - - 0.0 - - - - - - - - 0.1 - - - Trachoma - - - 0.0 - - - - - - - - 0.0 - - - Intestinal nematode infections - - 0.0 0.0 0.0 - 0.0 0.1 - - 0.1 0.0 0.3 0.1 0.0 0.0 Protein-energy malnutrition 0.1 0.0 1.0 0.1 1.6 0.0 0.0 11.3 - 0.0 2.3 0.6 1.5 1.6 0.2 0.0 Drownings 0.1 0.0 0.5 0.1 0.6 0.3 0.1 7.7 0.0 0.2 1.3 0.7 1.3 1.2 0.3 0.0 Table 2. Estimated total DALYs ('000), by cause and WHO Member State, 2002 (a,b), continued
All Causes 1,358 46 3,050 644 2,338 649 1,267 36,522 45 1,464 8,709 4,052 5,310 7,615 3,693 78 Diarrhoeal diseases 3 1 241 44 142 1 13 735 0 3 717 306 387 480 9 4 Malaria 0 0 450 1 3 - 6 41 - - 927 184 122 724 0 0 Schistosomiasis - - 17 - - - 4 63 - - 36 19 1 39 - 0 lymphatic filariasis - - 23 0 - - - 8 0 - 49 22 10 55 - 2 Onchocerciasis - - 0 - - - - 0 - - 0 4 - 23 - - Dengue - 0 0 2 0 - 0 15 0 - 0 0 6 0 - 0 Japanese encephalitis - - - 1 - - - - 0 - - - 4 - - - Trachoma - - 13 0 - - 3 100 - - 21 17 2 27 - 1 Intestinal nematode infections - 0 20 1 9 - 2 30 0 - 40 8 49 46 0 1 Protein-energy malnutrition 1 1 52 10 48 1 5 244 1 1 132 47 134 92 1 1 Drownings 1 1 16 4 17 6 3 228 1 4 41 20 45 38 7 0
a. www.who.int/evidence/bod; for notes, data sources and levels of evidence refer to notes sheet available from this site; check for updates b. Standard DALYs with age-weighting and time discounting as reported in World Health Report 2004
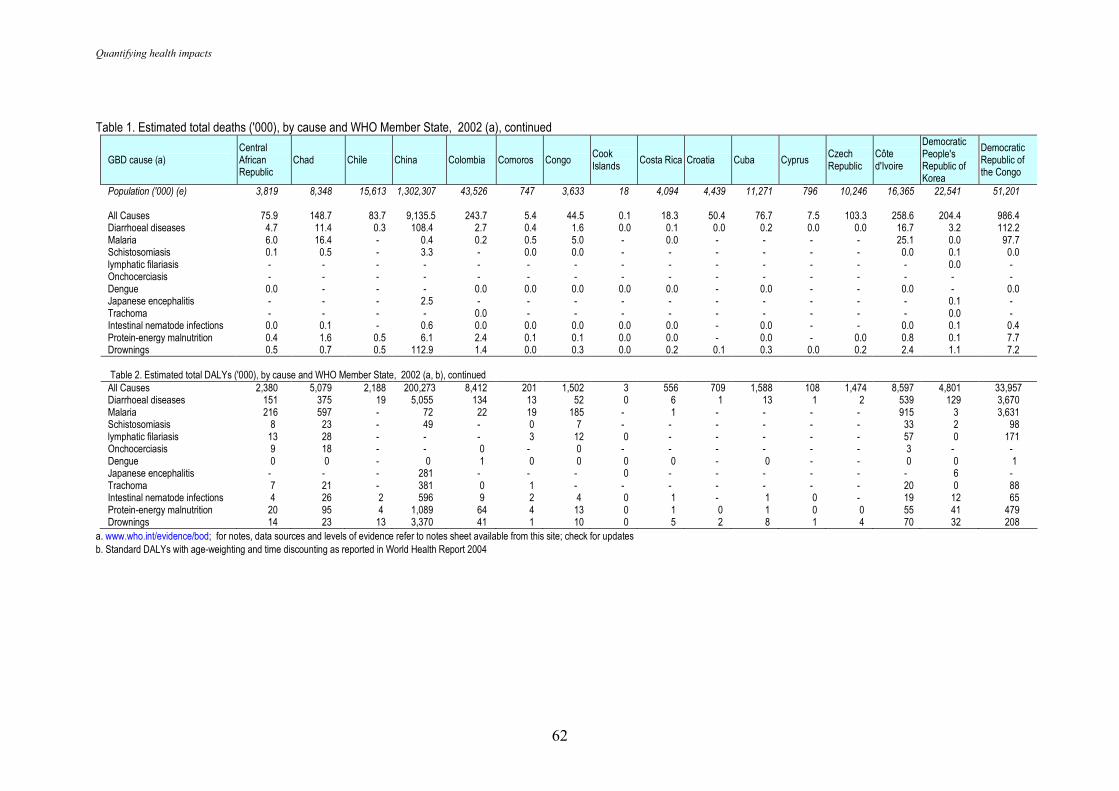
Quantifying health impacts
62
Table 1. Estimated total deaths ('000), by cause and WHO Member State, 2002 (a), continued
GBD cause (a) Central African Republic
Chad Chile China Colombia Comoros Congo Cook Islands
Costa Rica Croatia Cuba Cyprus Czech Republic
Côte d'Ivoire
Democratic People's Republic of Korea
Democratic Republic of the Congo
Population ('000) (e) 3,819 8,348 15,613 1,302,307 43,526 747 3,633 18 4,094 4,439 11,271 796 10,246 16,365 22,541 51,201 All Causes 75.9 148.7 83.7 9,135.5 243.7 5.4 44.5 0.1 18.3 50.4 76.7 7.5 103.3 258.6 204.4 986.4 Diarrhoeal diseases 4.7 11.4 0.3 108.4 2.7 0.4 1.6 0.0 0.1 0.0 0.2 0.0 0.0 16.7 3.2 112.2 Malaria 6.0 16.4 - 0.4 0.2 0.5 5.0 - 0.0 - - - - 25.1 0.0 97.7 Schistosomiasis 0.1 0.5 - 3.3 - 0.0 0.0 - - - - - - 0.0 0.1 0.0 lymphatic filariasis - - - - - - - - - - - - - - 0.0 - Onchocerciasis - - - - - - - - - - - - - - - - Dengue 0.0 - - - 0.0 0.0 0.0 0.0 0.0 - 0.0 - - 0.0 - 0.0 Japanese encephalitis - - - 2.5 - - - - - - - - - - 0.1 - Trachoma - - - - 0.0 - - - - - - - - - 0.0 - Intestinal nematode infections 0.0 0.1 - 0.6 0.0 0.0 0.0 0.0 0.0 - 0.0 - - 0.0 0.1 0.4 Protein-energy malnutrition 0.4 1.6 0.5 6.1 2.4 0.1 0.1 0.0 0.0 - 0.0 - 0.0 0.8 0.1 7.7 Drownings 0.5 0.7 0.5 112.9 1.4 0.0 0.3 0.0 0.2 0.1 0.3 0.0 0.2 2.4 1.1 7.2 Table 2. Estimated total DALYs ('000), by cause and WHO Member State, 2002 (a, b), continued
All Causes 2,380 5,079 2,188 200,273 8,412 201 1,502 3 556 709 1,588 108 1,474 8,597 4,801 33,957 Diarrhoeal diseases 151 375 19 5,055 134 13 52 0 6 1 13 1 2 539 129 3,670 Malaria 216 597 - 72 22 19 185 - 1 - - - - 915 3 3,631 Schistosomiasis 8 23 - 49 - 0 7 - - - - - - 33 2 98 lymphatic filariasis 13 28 - - - 3 12 0 - - - - - 57 0 171 Onchocerciasis 9 18 - - 0 - 0 - - - - - - 3 - - Dengue 0 0 - 0 1 0 0 0 0 - 0 - - 0 0 1 Japanese encephalitis - - - 281 - - - 0 - - - - - - 6 - Trachoma 7 21 - 381 0 1 - - - - - - - 20 0 88 Intestinal nematode infections 4 26 2 596 9 2 4 0 1 - 1 0 - 19 12 65 Protein-energy malnutrition 20 95 4 1,089 64 4 13 0 1 0 1 0 0 55 41 479 Drownings 14 23 13 3,370 41 1 10 0 5 2 8 1 4 70 32 208
a. www.who.int/evidence/bod; for notes, data sources and levels of evidence refer to notes sheet available from this site; check for updates b. Standard DALYs with age-weighting and time discounting as reported in World Health Report 2004
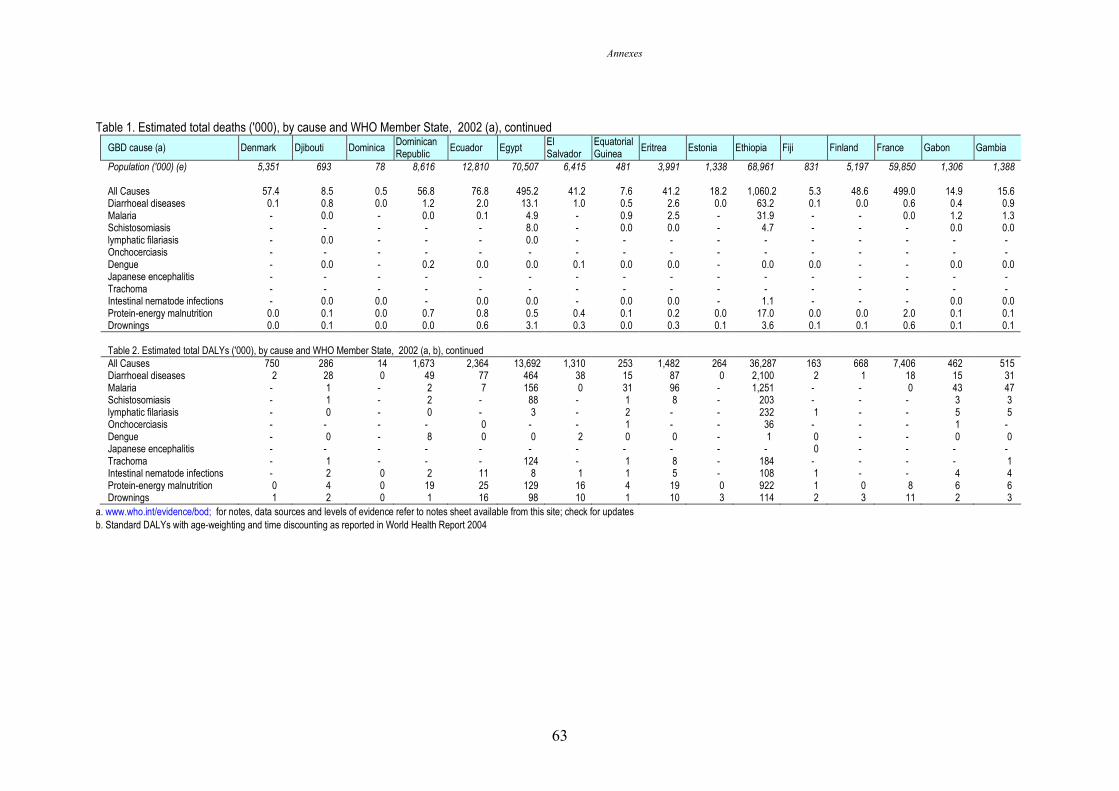
Annexes
63
Table 1. Estimated total deaths ('000), by cause and WHO Member State, 2002 (a), continued
GBD cause (a) Denmark Djibouti Dominica Dominican Republic
Ecuador Egypt El Salvador
Equatorial Guinea
Eritrea Estonia Ethiopia Fiji Finland France Gabon Gambia
Population ('000) (e) 5,351 693 78 8,616 12,810 70,507 6,415 481 3,991 1,338 68,961 831 5,197 59,850 1,306 1,388 All Causes 57.4 8.5 0.5 56.8 76.8 495.2 41.2 7.6 41.2 18.2 1,060.2 5.3 48.6 499.0 14.9 15.6 Diarrhoeal diseases 0.1 0.8 0.0 1.2 2.0 13.1 1.0 0.5 2.6 0.0 63.2 0.1 0.0 0.6 0.4 0.9 Malaria - 0.0 - 0.0 0.1 4.9 - 0.9 2.5 - 31.9 - - 0.0 1.2 1.3 Schistosomiasis - - - - - 8.0 - 0.0 0.0 - 4.7 - - - 0.0 0.0 lymphatic filariasis - 0.0 - - - 0.0 - - - - - - - - - - Onchocerciasis - - - - - - - - - - - - - - - - Dengue - 0.0 - 0.2 0.0 0.0 0.1 0.0 0.0 - 0.0 0.0 - - 0.0 0.0 Japanese encephalitis - - - - - - - - - - - - - - - - Trachoma - - - - - - - - - - - - - - - - Intestinal nematode infections - 0.0 0.0 - 0.0 0.0 - 0.0 0.0 - 1.1 - - - 0.0 0.0 Protein-energy malnutrition 0.0 0.1 0.0 0.7 0.8 0.5 0.4 0.1 0.2 0.0 17.0 0.0 0.0 2.0 0.1 0.1 Drownings 0.0 0.1 0.0 0.0 0.6 3.1 0.3 0.0 0.3 0.1 3.6 0.1 0.1 0.6 0.1 0.1 Table 2. Estimated total DALYs ('000), by cause and WHO Member State, 2002 (a, b), continued
All Causes 750 286 14 1,673 2,364 13,692 1,310 253 1,482 264 36,287 163 668 7,406 462 515 Diarrhoeal diseases 2 28 0 49 77 464 38 15 87 0 2,100 2 1 18 15 31 Malaria - 1 - 2 7 156 0 31 96 - 1,251 - - 0 43 47 Schistosomiasis - 1 - 2 - 88 - 1 8 - 203 - - - 3 3 lymphatic filariasis - 0 - 0 - 3 - 2 - - 232 1 - - 5 5 Onchocerciasis - - - - 0 - - 1 - - 36 - - - 1 - Dengue - 0 - 8 0 0 2 0 0 - 1 0 - - 0 0 Japanese encephalitis - - - - - - - - - - - 0 - - - - Trachoma - 1 - - - 124 - 1 8 - 184 - - - - 1 Intestinal nematode infections - 2 0 2 11 8 1 1 5 - 108 1 - - 4 4 Protein-energy malnutrition 0 4 0 19 25 129 16 4 19 0 922 1 0 8 6 6 Drownings 1 2 0 1 16 98 10 1 10 3 114 2 3 11 2 3
a. www.who.int/evidence/bod; for notes, data sources and levels of evidence refer to notes sheet available from this site; check for updates b. Standard DALYs with age-weighting and time discounting as reported in World Health Report 2004
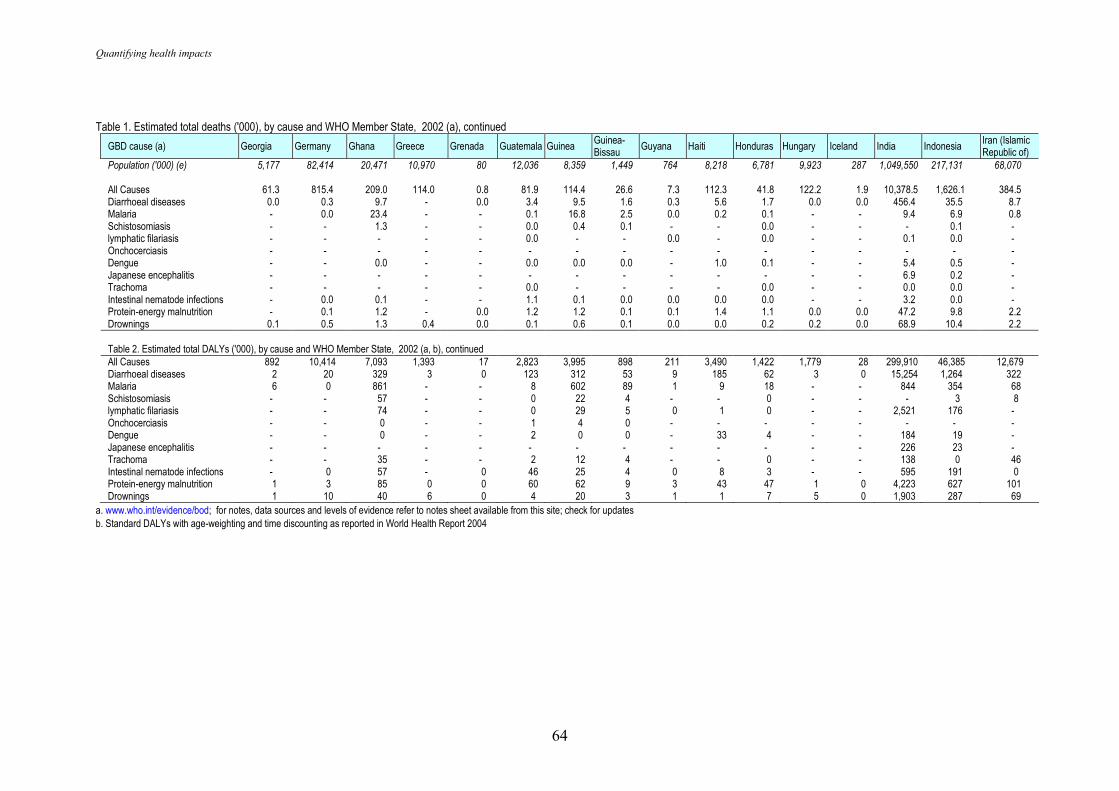
Quantifying health impacts
64
Table 1. Estimated total deaths ('000), by cause and WHO Member State, 2002 (a), continued
GBD cause (a) Georgia Germany Ghana Greece Grenada Guatemala Guinea Guinea-Bissau
Guyana Haiti Honduras Hungary Iceland India Indonesia Iran (Islamic Republic of)
Population ('000) (e) 5,177 82,414 20,471 10,970 80 12,036 8,359 1,449 764 8,218 6,781 9,923 287 1,049,550 217,131 68,070 All Causes 61.3 815.4 209.0 114.0 0.8 81.9 114.4 26.6 7.3 112.3 41.8 122.2 1.9 10,378.5 1,626.1 384.5 Diarrhoeal diseases 0.0 0.3 9.7 - 0.0 3.4 9.5 1.6 0.3 5.6 1.7 0.0 0.0 456.4 35.5 8.7 Malaria - 0.0 23.4 - - 0.1 16.8 2.5 0.0 0.2 0.1 - - 9.4 6.9 0.8 Schistosomiasis - - 1.3 - - 0.0 0.4 0.1 - - 0.0 - - - 0.1 - lymphatic filariasis - - - - - 0.0 - - 0.0 - 0.0 - - 0.1 0.0 - Onchocerciasis - - - - - - - - - - - - - - - - Dengue - - 0.0 - - 0.0 0.0 0.0 - 1.0 0.1 - - 5.4 0.5 - Japanese encephalitis - - - - - - - - - - - - - 6.9 0.2 - Trachoma - - - - - 0.0 - - - - 0.0 - - 0.0 0.0 - Intestinal nematode infections - 0.0 0.1 - - 1.1 0.1 0.0 0.0 0.0 0.0 - - 3.2 0.0 - Protein-energy malnutrition - 0.1 1.2 - 0.0 1.2 1.2 0.1 0.1 1.4 1.1 0.0 0.0 47.2 9.8 2.2 Drownings 0.1 0.5 1.3 0.4 0.0 0.1 0.6 0.1 0.0 0.0 0.2 0.2 0.0 68.9 10.4 2.2 Table 2. Estimated total DALYs ('000), by cause and WHO Member State, 2002 (a, b), continued
All Causes 892 10,414 7,093 1,393 17 2,823 3,995 898 211 3,490 1,422 1,779 28 299,910 46,385 12,679 Diarrhoeal diseases 2 20 329 3 0 123 312 53 9 185 62 3 0 15,254 1,264 322 Malaria 6 0 861 - - 8 602 89 1 9 18 - - 844 354 68 Schistosomiasis - - 57 - - 0 22 4 - - 0 - - - 3 8 lymphatic filariasis - - 74 - - 0 29 5 0 1 0 - - 2,521 176 - Onchocerciasis - - 0 - - 1 4 0 - - - - - - - - Dengue - - 0 - - 2 0 0 - 33 4 - - 184 19 - Japanese encephalitis - - - - - - - - - - - - - 226 23 - Trachoma - - 35 - - 2 12 4 - - 0 - - 138 0 46 Intestinal nematode infections - 0 57 - 0 46 25 4 0 8 3 - - 595 191 0 Protein-energy malnutrition 1 3 85 0 0 60 62 9 3 43 47 1 0 4,223 627 101 Drownings 1 10 40 6 0 4 20 3 1 1 7 5 0 1,903 287 69
a. www.who.int/evidence/bod; for notes, data sources and levels of evidence refer to notes sheet available from this site; check for updates b. Standard DALYs with age-weighting and time discounting as reported in World Health Report 2004
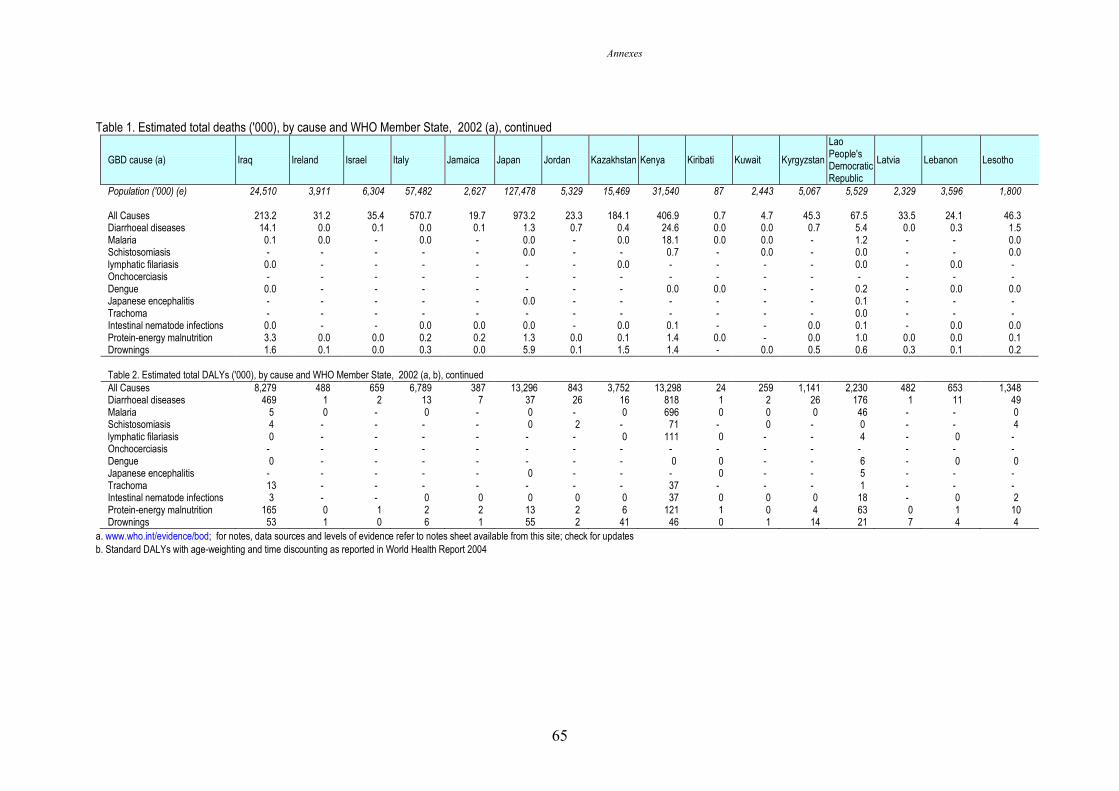
Annexes
65
Table 1. Estimated total deaths ('000), by cause and WHO Member State, 2002 (a), continued
GBD cause (a) Iraq Ireland Israel Italy Jamaica Japan Jordan Kazakhstan Kenya Kiribati Kuwait Kyrgyzstan
Lao People's Democratic Republic
Latvia Lebanon Lesotho
Population ('000) (e) 24,510 3,911 6,304 57,482 2,627 127,478 5,329 15,469 31,540 87 2,443 5,067 5,529 2,329 3,596 1,800 All Causes 213.2 31.2 35.4 570.7 19.7 973.2 23.3 184.1 406.9 0.7 4.7 45.3 67.5 33.5 24.1 46.3 Diarrhoeal diseases 14.1 0.0 0.1 0.0 0.1 1.3 0.7 0.4 24.6 0.0 0.0 0.7 5.4 0.0 0.3 1.5 Malaria 0.1 0.0 - 0.0 - 0.0 - 0.0 18.1 0.0 0.0 - 1.2 - - 0.0 Schistosomiasis - - - - - 0.0 - - 0.7 - 0.0 - 0.0 - - 0.0 lymphatic filariasis 0.0 - - - - - - 0.0 - - - - 0.0 - 0.0 - Onchocerciasis - - - - - - - - - - - - - - - - Dengue 0.0 - - - - - - - 0.0 0.0 - - 0.2 - 0.0 0.0 Japanese encephalitis - - - - - 0.0 - - - - - - 0.1 - - - Trachoma - - - - - - - - - - - - 0.0 - - - Intestinal nematode infections 0.0 - - 0.0 0.0 0.0 - 0.0 0.1 - - 0.0 0.1 - 0.0 0.0 Protein-energy malnutrition 3.3 0.0 0.0 0.2 0.2 1.3 0.0 0.1 1.4 0.0 - 0.0 1.0 0.0 0.0 0.1 Drownings 1.6 0.1 0.0 0.3 0.0 5.9 0.1 1.5 1.4 - 0.0 0.5 0.6 0.3 0.1 0.2 Table 2. Estimated total DALYs ('000), by cause and WHO Member State, 2002 (a, b), continued
All Causes 8,279 488 659 6,789 387 13,296 843 3,752 13,298 24 259 1,141 2,230 482 653 1,348 Diarrhoeal diseases 469 1 2 13 7 37 26 16 818 1 2 26 176 1 11 49 Malaria 5 0 - 0 - 0 - 0 696 0 0 0 46 - - 0 Schistosomiasis 4 - - - - 0 2 - 71 - 0 - 0 - - 4 lymphatic filariasis 0 - - - - - - 0 111 0 - - 4 - 0 - Onchocerciasis - - - - - - - - - - - - - - - - Dengue 0 - - - - - - - 0 0 - - 6 - 0 0 Japanese encephalitis - - - - - 0 - - - 0 - - 5 - - - Trachoma 13 - - - - - - - 37 - - - 1 - - - Intestinal nematode infections 3 - - 0 0 0 0 0 37 0 0 0 18 - 0 2 Protein-energy malnutrition 165 0 1 2 2 13 2 6 121 1 0 4 63 0 1 10 Drownings 53 1 0 6 1 55 2 41 46 0 1 14 21 7 4 4
a. www.who.int/evidence/bod; for notes, data sources and levels of evidence refer to notes sheet available from this site; check for updates b. Standard DALYs with age-weighting and time discounting as reported in World Health Report 2004
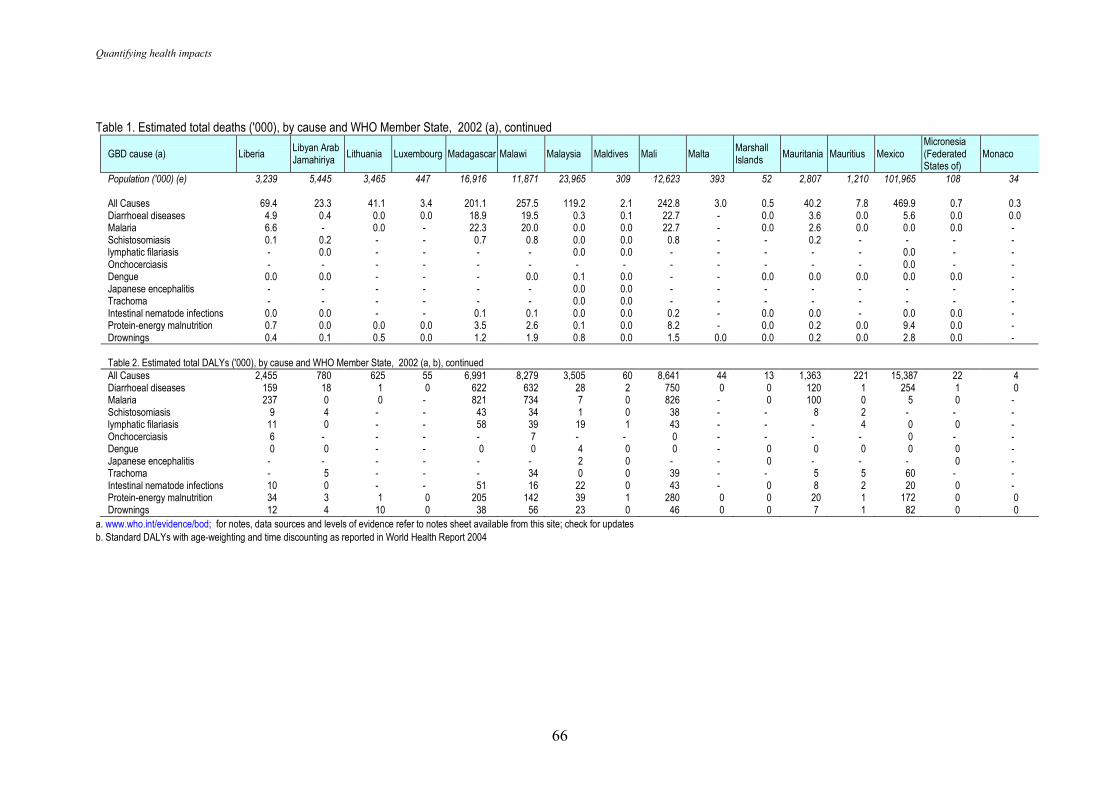
Quantifying health impacts
66
Table 1. Estimated total deaths ('000), by cause and WHO Member State, 2002 (a), continued
GBD cause (a) Liberia Libyan Arab Jamahiriya
Lithuania Luxembourg Madagascar Malawi Malaysia Maldives Mali Malta Marshall Islands
Mauritania Mauritius Mexico Micronesia (Federated States of)
Monaco
Population ('000) (e) 3,239 5,445 3,465 447 16,916 11,871 23,965 309 12,623 393 52 2,807 1,210 101,965 108 34 All Causes 69.4 23.3 41.1 3.4 201.1 257.5 119.2 2.1 242.8 3.0 0.5 40.2 7.8 469.9 0.7 0.3 Diarrhoeal diseases 4.9 0.4 0.0 0.0 18.9 19.5 0.3 0.1 22.7 - 0.0 3.6 0.0 5.6 0.0 0.0 Malaria 6.6 - 0.0 - 22.3 20.0 0.0 0.0 22.7 - 0.0 2.6 0.0 0.0 0.0 - Schistosomiasis 0.1 0.2 - - 0.7 0.8 0.0 0.0 0.8 - - 0.2 - - - - lymphatic filariasis - 0.0 - - - - 0.0 0.0 - - - - - 0.0 - - Onchocerciasis - - - - - - - - - - - - - 0.0 - - Dengue 0.0 0.0 - - - 0.0 0.1 0.0 - - 0.0 0.0 0.0 0.0 0.0 - Japanese encephalitis - - - - - - 0.0 0.0 - - - - - - - - Trachoma - - - - - - 0.0 0.0 - - - - - - - - Intestinal nematode infections 0.0 0.0 - - 0.1 0.1 0.0 0.0 0.2 - 0.0 0.0 - 0.0 0.0 - Protein-energy malnutrition 0.7 0.0 0.0 0.0 3.5 2.6 0.1 0.0 8.2 - 0.0 0.2 0.0 9.4 0.0 - Drownings 0.4 0.1 0.5 0.0 1.2 1.9 0.8 0.0 1.5 0.0 0.0 0.2 0.0 2.8 0.0 - Table 2. Estimated total DALYs ('000), by cause and WHO Member State, 2002 (a, b), continued
All Causes 2,455 780 625 55 6,991 8,279 3,505 60 8,641 44 13 1,363 221 15,387 22 4 Diarrhoeal diseases 159 18 1 0 622 632 28 2 750 0 0 120 1 254 1 0 Malaria 237 0 0 - 821 734 7 0 826 - 0 100 0 5 0 - Schistosomiasis 9 4 - - 43 34 1 0 38 - - 8 2 - - - lymphatic filariasis 11 0 - - 58 39 19 1 43 - - - 4 0 0 - Onchocerciasis 6 - - - - 7 - - 0 - - - - 0 - - Dengue 0 0 - - 0 0 4 0 0 - 0 0 0 0 0 - Japanese encephalitis - - - - - - 2 0 - - 0 - - - 0 - Trachoma - 5 - - - 34 0 0 39 - - 5 5 60 - - Intestinal nematode infections 10 0 - - 51 16 22 0 43 - 0 8 2 20 0 - Protein-energy malnutrition 34 3 1 0 205 142 39 1 280 0 0 20 1 172 0 0 Drownings 12 4 10 0 38 56 23 0 46 0 0 7 1 82 0 0
a. www.who.int/evidence/bod; for notes, data sources and levels of evidence refer to notes sheet available from this site; check for updates b. Standard DALYs with age-weighting and time discounting as reported in World Health Report 2004
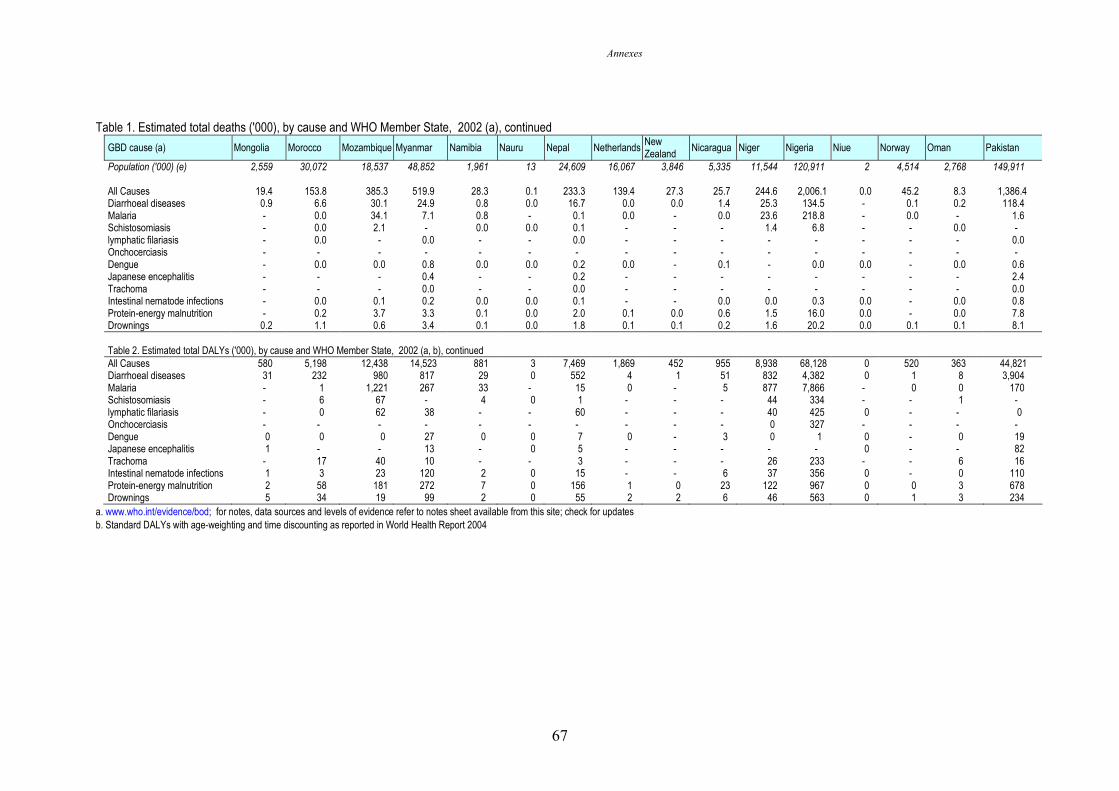
Annexes
67
Table 1. Estimated total deaths ('000), by cause and WHO Member State, 2002 (a), continued
GBD cause (a) Mongolia Morocco Mozambique Myanmar Namibia Nauru Nepal Netherlands New Zealand
Nicaragua Niger Nigeria Niue Norway Oman Pakistan
Population ('000) (e) 2,559 30,072 18,537 48,852 1,961 13 24,609 16,067 3,846 5,335 11,544 120,911 2 4,514 2,768 149,911 All Causes 19.4 153.8 385.3 519.9 28.3 0.1 233.3 139.4 27.3 25.7 244.6 2,006.1 0.0 45.2 8.3 1,386.4 Diarrhoeal diseases 0.9 6.6 30.1 24.9 0.8 0.0 16.7 0.0 0.0 1.4 25.3 134.5 - 0.1 0.2 118.4 Malaria - 0.0 34.1 7.1 0.8 - 0.1 0.0 - 0.0 23.6 218.8 - 0.0 - 1.6 Schistosomiasis - 0.0 2.1 - 0.0 0.0 0.1 - - - 1.4 6.8 - - 0.0 - lymphatic filariasis - 0.0 - 0.0 - - 0.0 - - - - - - - - 0.0 Onchocerciasis - - - - - - - - - - - - - - - - Dengue - 0.0 0.0 0.8 0.0 0.0 0.2 0.0 - 0.1 - 0.0 0.0 - 0.0 0.6 Japanese encephalitis - - - 0.4 - - 0.2 - - - - - - - - 2.4 Trachoma - - - 0.0 - - 0.0 - - - - - - - - 0.0 Intestinal nematode infections - 0.0 0.1 0.2 0.0 0.0 0.1 - - 0.0 0.0 0.3 0.0 - 0.0 0.8 Protein-energy malnutrition - 0.2 3.7 3.3 0.1 0.0 2.0 0.1 0.0 0.6 1.5 16.0 0.0 - 0.0 7.8 Drownings 0.2 1.1 0.6 3.4 0.1 0.0 1.8 0.1 0.1 0.2 1.6 20.2 0.0 0.1 0.1 8.1 Table 2. Estimated total DALYs ('000), by cause and WHO Member State, 2002 (a, b), continued
All Causes 580 5,198 12,438 14,523 881 3 7,469 1,869 452 955 8,938 68,128 0 520 363 44,821 Diarrhoeal diseases 31 232 980 817 29 0 552 4 1 51 832 4,382 0 1 8 3,904 Malaria - 1 1,221 267 33 - 15 0 - 5 877 7,866 - 0 0 170 Schistosomiasis - 6 67 - 4 0 1 - - - 44 334 - - 1 - lymphatic filariasis - 0 62 38 - - 60 - - - 40 425 0 - - 0 Onchocerciasis - - - - - - - - - - 0 327 - - - - Dengue 0 0 0 27 0 0 7 0 - 3 0 1 0 - 0 19 Japanese encephalitis 1 - - 13 - 0 5 - - - - - 0 - - 82 Trachoma - 17 40 10 - - 3 - - - 26 233 - - 6 16 Intestinal nematode infections 1 3 23 120 2 0 15 - - 6 37 356 0 - 0 110 Protein-energy malnutrition 2 58 181 272 7 0 156 1 0 23 122 967 0 0 3 678 Drownings 5 34 19 99 2 0 55 2 2 6 46 563 0 1 3 234
a. www.who.int/evidence/bod; for notes, data sources and levels of evidence refer to notes sheet available from this site; check for updates b. Standard DALYs with age-weighting and time discounting as reported in World Health Report 2004
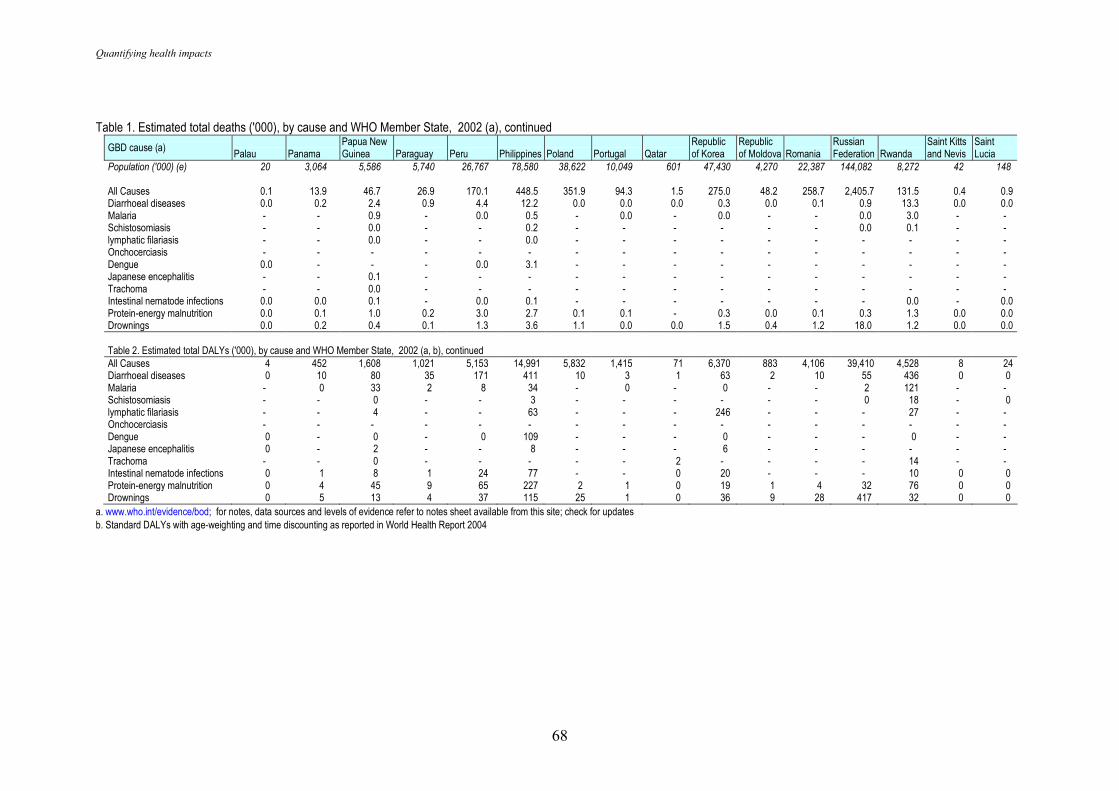
Quantifying health impacts
68
Table 1. Estimated total deaths ('000), by cause and WHO Member State, 2002 (a), continued
GBD cause (a) Palau Panama
Papua New Guinea Paraguay Peru Philippines Poland Portugal Qatar
Republic of Korea
Republic of Moldova Romania
Russian Federation Rwanda
Saint Kitts and Nevis
Saint Lucia
Population ('000) (e) 20 3,064 5,586 5,740 26,767 78,580 38,622 10,049 601 47,430 4,270 22,387 144,082 8,272 42 148 All Causes 0.1 13.9 46.7 26.9 170.1 448.5 351.9 94.3 1.5 275.0 48.2 258.7 2,405.7 131.5 0.4 0.9 Diarrhoeal diseases 0.0 0.2 2.4 0.9 4.4 12.2 0.0 0.0 0.0 0.3 0.0 0.1 0.9 13.3 0.0 0.0 Malaria - - 0.9 - 0.0 0.5 - 0.0 - 0.0 - - 0.0 3.0 - - Schistosomiasis - - 0.0 - - 0.2 - - - - - - 0.0 0.1 - - lymphatic filariasis - - 0.0 - - 0.0 - - - - - - - - - - Onchocerciasis - - - - - - - - - - - - - - - - Dengue 0.0 - - - 0.0 3.1 - - - - - - - - - - Japanese encephalitis - - 0.1 - - - - - - - - - - - - - Trachoma - - 0.0 - - - - - - - - - - - - - Intestinal nematode infections 0.0 0.0 0.1 - 0.0 0.1 - - - - - - - 0.0 - 0.0 Protein-energy malnutrition 0.0 0.1 1.0 0.2 3.0 2.7 0.1 0.1 - 0.3 0.0 0.1 0.3 1.3 0.0 0.0 Drownings 0.0 0.2 0.4 0.1 1.3 3.6 1.1 0.0 0.0 1.5 0.4 1.2 18.0 1.2 0.0 0.0 Table 2. Estimated total DALYs ('000), by cause and WHO Member State, 2002 (a, b), continued
All Causes 4 452 1,608 1,021 5,153 14,991 5,832 1,415 71 6,370 883 4,106 39,410 4,528 8 24 Diarrhoeal diseases 0 10 80 35 171 411 10 3 1 63 2 10 55 436 0 0 Malaria - 0 33 2 8 34 - 0 - 0 - - 2 121 - - Schistosomiasis - - 0 - - 3 - - - - - - 0 18 - 0 lymphatic filariasis - - 4 - - 63 - - - 246 - - - 27 - - Onchocerciasis - - - - - - - - - - - - - - - - Dengue 0 - 0 - 0 109 - - - 0 - - - 0 - - Japanese encephalitis 0 - 2 - - 8 - - - 6 - - - - - - Trachoma - - 0 - - - - - 2 - - - - 14 - - Intestinal nematode infections 0 1 8 1 24 77 - - 0 20 - - - 10 0 0 Protein-energy malnutrition 0 4 45 9 65 227 2 1 0 19 1 4 32 76 0 0 Drownings 0 5 13 4 37 115 25 1 0 36 9 28 417 32 0 0
a. www.who.int/evidence/bod; for notes, data sources and levels of evidence refer to notes sheet available from this site; check for updates b. Standard DALYs with age-weighting and time discounting as reported in World Health Report 2004
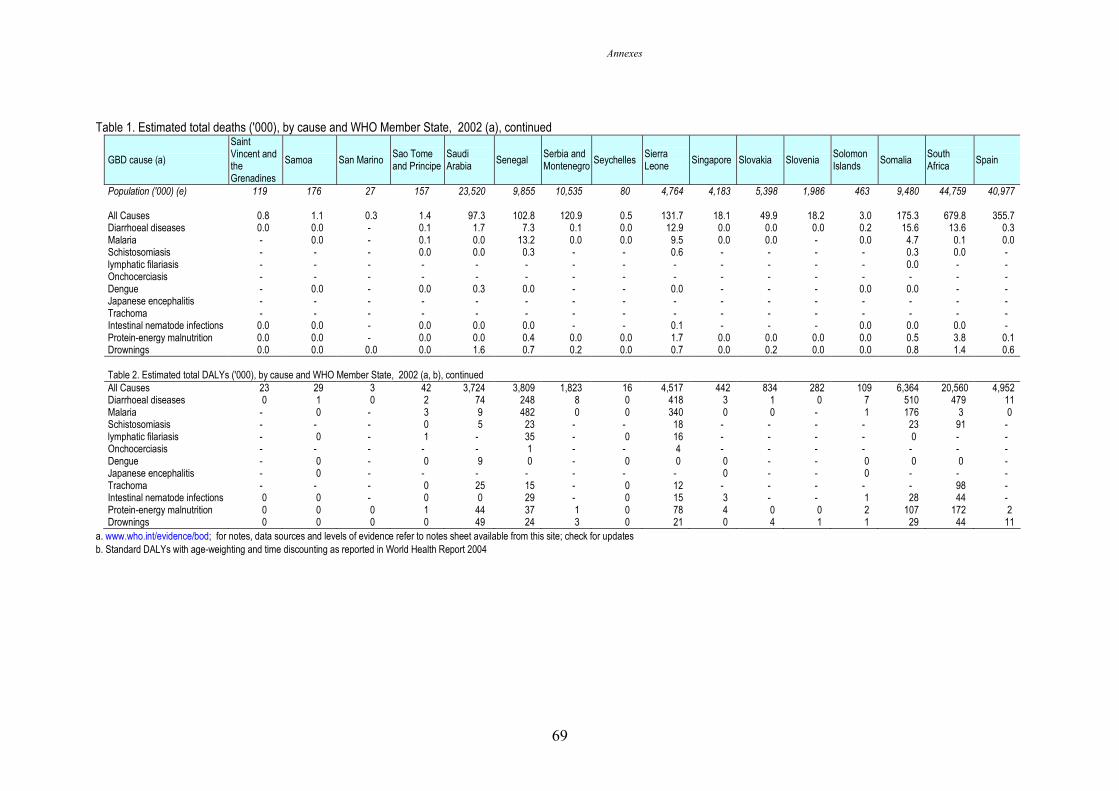
Annexes
69
Table 1. Estimated total deaths ('000), by cause and WHO Member State, 2002 (a), continued
GBD cause (a)
Saint Vincent and the Grenadines
Samoa San Marino Sao Tome and Principe
Saudi Arabia
Senegal Serbia and Montenegro
Seychelles Sierra Leone
Singapore Slovakia Slovenia Solomon Islands
Somalia South Africa
Spain
Population ('000) (e) 119 176 27 157 23,520 9,855 10,535 80 4,764 4,183 5,398 1,986 463 9,480 44,759 40,977 All Causes 0.8 1.1 0.3 1.4 97.3 102.8 120.9 0.5 131.7 18.1 49.9 18.2 3.0 175.3 679.8 355.7 Diarrhoeal diseases 0.0 0.0 - 0.1 1.7 7.3 0.1 0.0 12.9 0.0 0.0 0.0 0.2 15.6 13.6 0.3 Malaria - 0.0 - 0.1 0.0 13.2 0.0 0.0 9.5 0.0 0.0 - 0.0 4.7 0.1 0.0 Schistosomiasis - - - 0.0 0.0 0.3 - - 0.6 - - - - 0.3 0.0 - lymphatic filariasis - - - - - - - - - - - - - 0.0 - - Onchocerciasis - - - - - - - - - - - - - - - - Dengue - 0.0 - 0.0 0.3 0.0 - - 0.0 - - - 0.0 0.0 - - Japanese encephalitis - - - - - - - - - - - - - - - - Trachoma - - - - - - - - - - - - - - - - Intestinal nematode infections 0.0 0.0 - 0.0 0.0 0.0 - - 0.1 - - - 0.0 0.0 0.0 - Protein-energy malnutrition 0.0 0.0 - 0.0 0.0 0.4 0.0 0.0 1.7 0.0 0.0 0.0 0.0 0.5 3.8 0.1 Drownings 0.0 0.0 0.0 0.0 1.6 0.7 0.2 0.0 0.7 0.0 0.2 0.0 0.0 0.8 1.4 0.6 Table 2. Estimated total DALYs ('000), by cause and WHO Member State, 2002 (a, b), continued
All Causes 23 29 3 42 3,724 3,809 1,823 16 4,517 442 834 282 109 6,364 20,560 4,952 Diarrhoeal diseases 0 1 0 2 74 248 8 0 418 3 1 0 7 510 479 11 Malaria - 0 - 3 9 482 0 0 340 0 0 - 1 176 3 0 Schistosomiasis - - - 0 5 23 - - 18 - - - - 23 91 - lymphatic filariasis - 0 - 1 - 35 - 0 16 - - - - 0 - - Onchocerciasis - - - - - 1 - - 4 - - - - - - - Dengue - 0 - 0 9 0 - 0 0 0 - - 0 0 0 - Japanese encephalitis - 0 - - - - - - - 0 - - 0 - - - Trachoma - - - 0 25 15 - 0 12 - - - - - 98 - Intestinal nematode infections 0 0 - 0 0 29 - 0 15 3 - - 1 28 44 - Protein-energy malnutrition 0 0 0 1 44 37 1 0 78 4 0 0 2 107 172 2 Drownings 0 0 0 0 49 24 3 0 21 0 4 1 1 29 44 11
a. www.who.int/evidence/bod; for notes, data sources and levels of evidence refer to notes sheet available from this site; check for updates b. Standard DALYs with age-weighting and time discounting as reported in World Health Report 2004
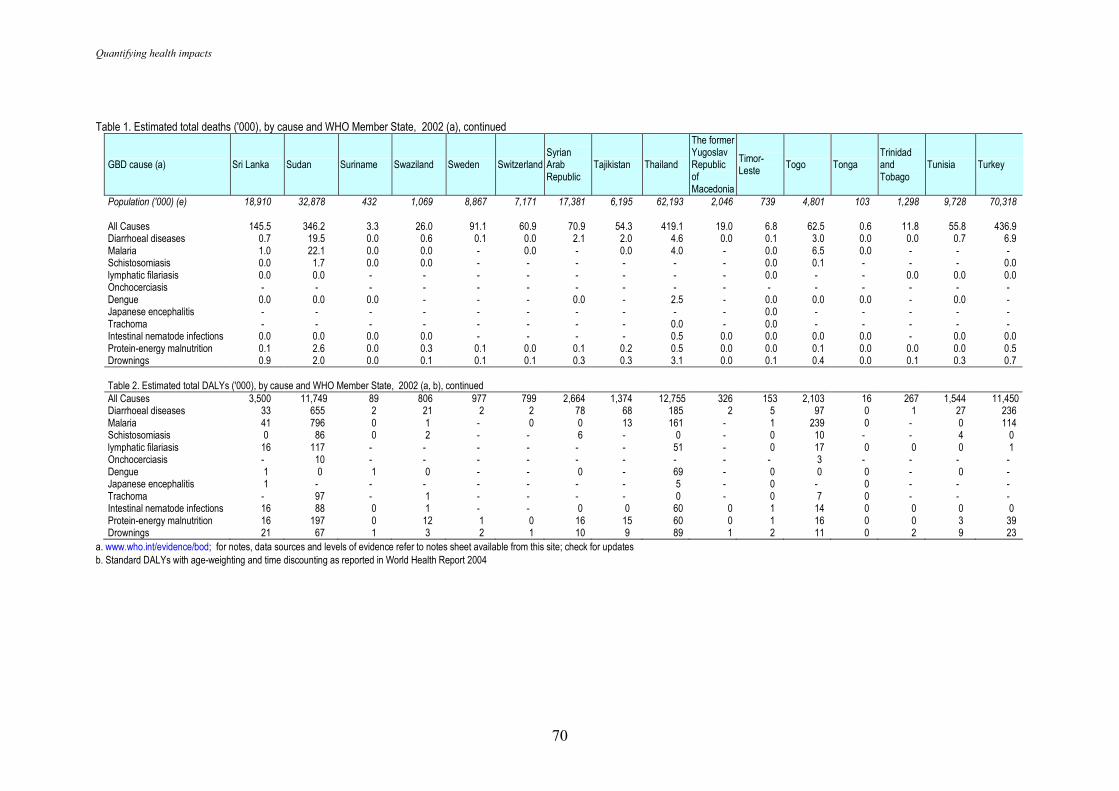
Quantifying health impacts
70
Table 1. Estimated total deaths ('000), by cause and WHO Member State, 2002 (a), continued
GBD cause (a) Sri Lanka Sudan Suriname Swaziland Sweden Switzerland Syrian Arab Republic
Tajikistan Thailand
The former Yugoslav Republic of Macedonia
Timor-Leste
Togo Tonga Trinidad and Tobago
Tunisia Turkey
Population ('000) (e) 18,910 32,878 432 1,069 8,867 7,171 17,381 6,195 62,193 2,046 739 4,801 103 1,298 9,728 70,318 All Causes 145.5 346.2 3.3 26.0 91.1 60.9 70.9 54.3 419.1 19.0 6.8 62.5 0.6 11.8 55.8 436.9 Diarrhoeal diseases 0.7 19.5 0.0 0.6 0.1 0.0 2.1 2.0 4.6 0.0 0.1 3.0 0.0 0.0 0.7 6.9 Malaria 1.0 22.1 0.0 0.0 - 0.0 - 0.0 4.0 - 0.0 6.5 0.0 - - - Schistosomiasis 0.0 1.7 0.0 0.0 - - - - - - 0.0 0.1 - - - 0.0 lymphatic filariasis 0.0 0.0 - - - - - - - - 0.0 - - 0.0 0.0 0.0 Onchocerciasis - - - - - - - - - - - - - - - - Dengue 0.0 0.0 0.0 - - - 0.0 - 2.5 - 0.0 0.0 0.0 - 0.0 - Japanese encephalitis - - - - - - - - - - 0.0 - - - - - Trachoma - - - - - - - - 0.0 - 0.0 - - - - - Intestinal nematode infections 0.0 0.0 0.0 0.0 - - - - 0.5 0.0 0.0 0.0 0.0 - 0.0 0.0 Protein-energy malnutrition 0.1 2.6 0.0 0.3 0.1 0.0 0.1 0.2 0.5 0.0 0.0 0.1 0.0 0.0 0.0 0.5 Drownings 0.9 2.0 0.0 0.1 0.1 0.1 0.3 0.3 3.1 0.0 0.1 0.4 0.0 0.1 0.3 0.7 Table 2. Estimated total DALYs ('000), by cause and WHO Member State, 2002 (a, b), continued
All Causes 3,500 11,749 89 806 977 799 2,664 1,374 12,755 326 153 2,103 16 267 1,544 11,450 Diarrhoeal diseases 33 655 2 21 2 2 78 68 185 2 5 97 0 1 27 236 Malaria 41 796 0 1 - 0 0 13 161 - 1 239 0 - 0 114 Schistosomiasis 0 86 0 2 - - 6 - 0 - 0 10 - - 4 0 lymphatic filariasis 16 117 - - - - - - 51 - 0 17 0 0 0 1 Onchocerciasis - 10 - - - - - - - - - 3 - - - - Dengue 1 0 1 0 - - 0 - 69 - 0 0 0 - 0 - Japanese encephalitis 1 - - - - - - - 5 - 0 - 0 - - - Trachoma - 97 - 1 - - - - 0 - 0 7 0 - - - Intestinal nematode infections 16 88 0 1 - - 0 0 60 0 1 14 0 0 0 0 Protein-energy malnutrition 16 197 0 12 1 0 16 15 60 0 1 16 0 0 3 39 Drownings 21 67 1 3 2 1 10 9 89 1 2 11 0 2 9 23
a. www.who.int/evidence/bod; for notes, data sources and levels of evidence refer to notes sheet available from this site; check for updates b. Standard DALYs with age-weighting and time discounting as reported in World Health Report 2004
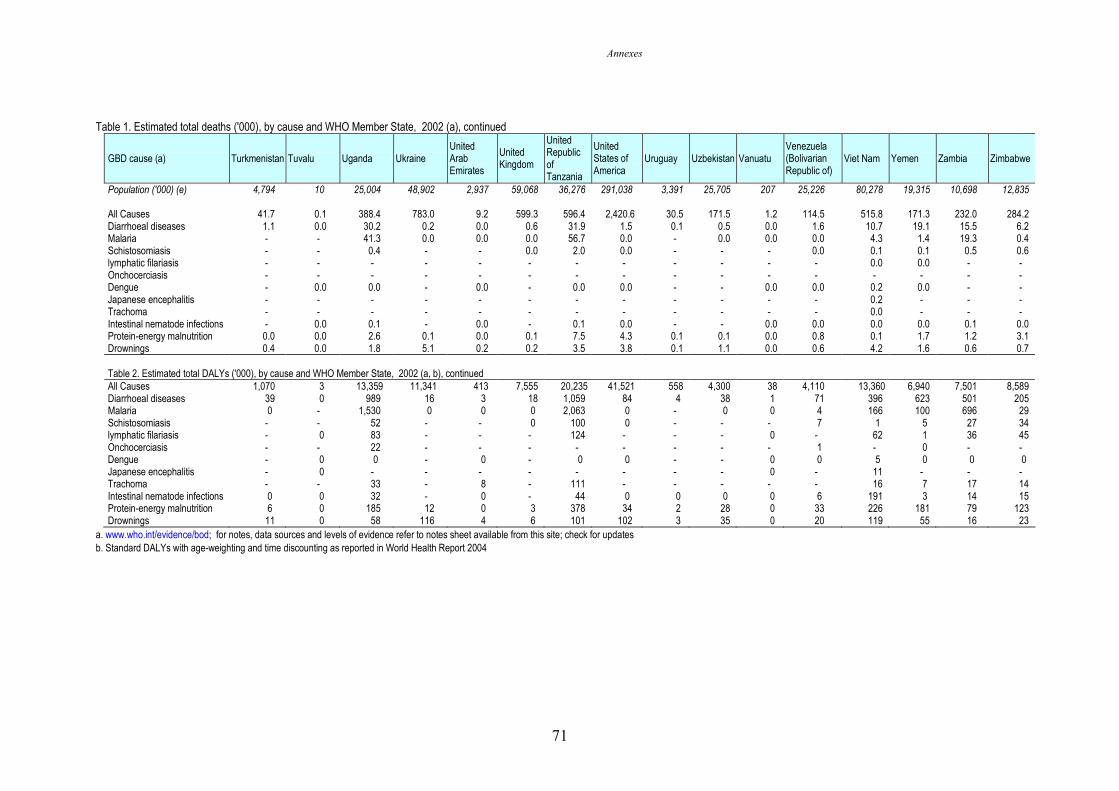
Annexes
71
Table 1. Estimated total deaths ('000), by cause and WHO Member State, 2002 (a), continued
GBD cause (a) Turkmenistan Tuvalu Uganda Ukraine United Arab Emirates
United Kingdom
United Republic of Tanzania
United States of America
Uruguay Uzbekistan Vanuatu Venezuela (Bolivarian Republic of)
Viet Nam Yemen Zambia Zimbabwe
Population ('000) (e) 4,794 10 25,004 48,902 2,937 59,068 36,276 291,038 3,391 25,705 207 25,226 80,278 19,315 10,698 12,835 All Causes 41.7 0.1 388.4 783.0 9.2 599.3 596.4 2,420.6 30.5 171.5 1.2 114.5 515.8 171.3 232.0 284.2 Diarrhoeal diseases 1.1 0.0 30.2 0.2 0.0 0.6 31.9 1.5 0.1 0.5 0.0 1.6 10.7 19.1 15.5 6.2 Malaria - - 41.3 0.0 0.0 0.0 56.7 0.0 - 0.0 0.0 0.0 4.3 1.4 19.3 0.4 Schistosomiasis - - 0.4 - - 0.0 2.0 0.0 - - - 0.0 0.1 0.1 0.5 0.6 lymphatic filariasis - - - - - - - - - - - - 0.0 0.0 - - Onchocerciasis - - - - - - - - - - - - - - - - Dengue - 0.0 0.0 - 0.0 - 0.0 0.0 - - 0.0 0.0 0.2 0.0 - - Japanese encephalitis - - - - - - - - - - - - 0.2 - - - Trachoma - - - - - - - - - - - - 0.0 - - - Intestinal nematode infections - 0.0 0.1 - 0.0 - 0.1 0.0 - - 0.0 0.0 0.0 0.0 0.1 0.0 Protein-energy malnutrition 0.0 0.0 2.6 0.1 0.0 0.1 7.5 4.3 0.1 0.1 0.0 0.8 0.1 1.7 1.2 3.1 Drownings 0.4 0.0 1.8 5.1 0.2 0.2 3.5 3.8 0.1 1.1 0.0 0.6 4.2 1.6 0.6 0.7 Table 2. Estimated total DALYs ('000), by cause and WHO Member State, 2002 (a, b), continued
All Causes 1,070 3 13,359 11,341 413 7,555 20,235 41,521 558 4,300 38 4,110 13,360 6,940 7,501 8,589 Diarrhoeal diseases 39 0 989 16 3 18 1,059 84 4 38 1 71 396 623 501 205 Malaria 0 - 1,530 0 0 0 2,063 0 - 0 0 4 166 100 696 29 Schistosomiasis - - 52 - - 0 100 0 - - - 7 1 5 27 34 lymphatic filariasis - 0 83 - - - 124 - - - 0 - 62 1 36 45 Onchocerciasis - - 22 - - - - - - - - 1 - 0 - - Dengue - 0 0 - 0 - 0 0 - - 0 0 5 0 0 0 Japanese encephalitis - 0 - - - - - - - - 0 - 11 - - - Trachoma - - 33 - 8 - 111 - - - - - 16 7 17 14 Intestinal nematode infections 0 0 32 - 0 - 44 0 0 0 0 6 191 3 14 15 Protein-energy malnutrition 6 0 185 12 0 3 378 34 2 28 0 33 226 181 79 123 Drownings 11 0 58 116 4 6 101 102 3 35 0 20 119 55 16 23
a. www.who.int/evidence/bod; for notes, data sources and levels of evidence refer to notes sheet available from this site; check for updates b. Standard DALYs with age-weighting and time discounting as reported in World Health Report 2004