water, sanitation and hygiene promotion programme -...
TRANSCRIPT
Report of the Baseline Survey in Magway and Mandaly Divisions
Water, Sanitation and Hygiene
Promotion Programme
Report of the Water, Sanitation and Hygiene
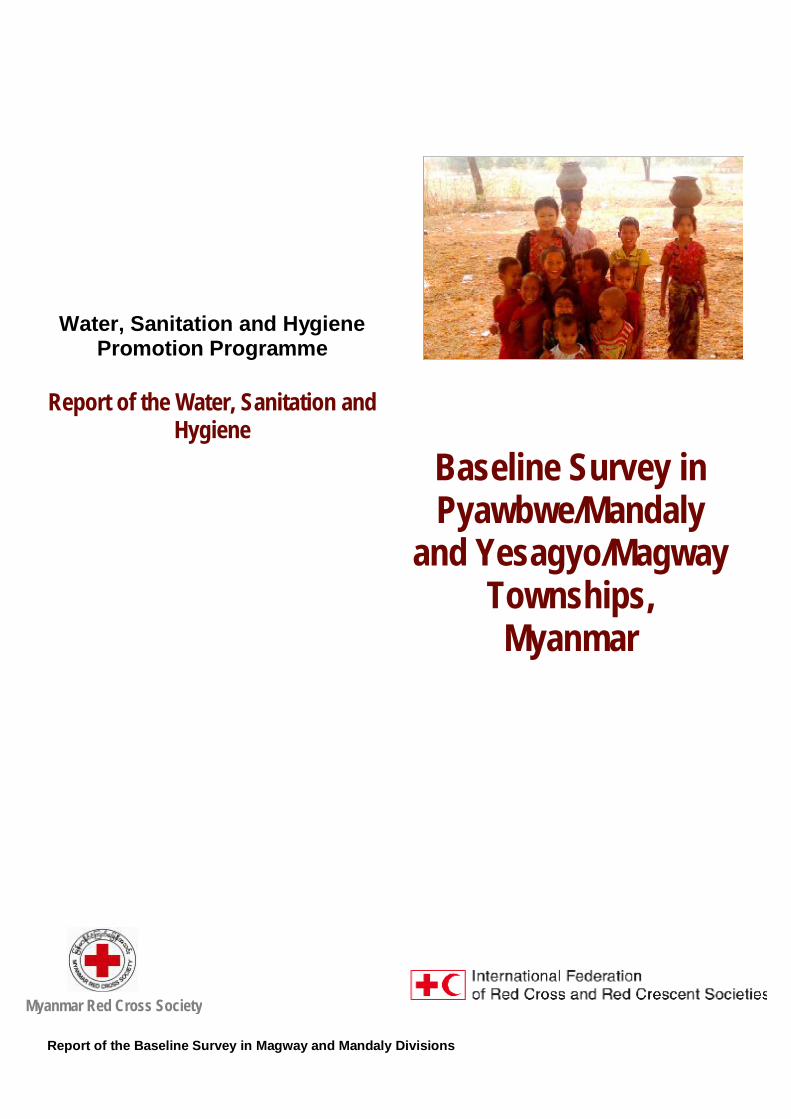
Baseline Survey in Pyawbwe/Mandaly
and Yesagyo/Magway Townships, Myanmar
Myanmar Red Cross Society
Report of the Baseline Survey in Magway and Mandaly Divisions
TABLE OF CONTENTS
9.0 Information on Hygiene Awareness 15 9.1 About diseases:-Diarrhoea & stomach upset 15 9.2 Diarrhoea cases in Family in past weeks 15 9.3 About diseases:- MALARIA 15 9.4 About diseases:- How Malaria Spreads 16 9.5 About diseases:- How Disease prevented 16 9.6 About diseases:-Mosquito related
Disese Control 16 9.7 Self Reported Disease incidence and
Health Care Options 16 9.7.1 AWARENESS OF DISEASE AETIOLOGY 16 9.7.2 HEALTH CARE OPTIONS 17 9.7.3 AWARENESS AND PRACTICE OF HYGINE17 9.8 HANDWASHING AT CRITICAL TIMES 17 9.9 Hand washing cleaning Agent 18 9.10 Reason for washing Hands 18 9.11 Cleaning Agents for washing utensils 18 10.0 AWARESS ABOUT HYGIENE 18 10.1 Impediments for health and Hygiene Tasks 18 10.2 Observation About Hand Washing: 19 11.0 Health Information - related to Water and
Sanitation 19 11.1 Health Matter concern in Community: 20 12.0 VECTOR CONTROL 20 12.1 Mosquito nets in Households: 20 12.2 Vector Control in community/ villages. 20 13.0 Knowledge, attitude and practice (KAP)
ANALYSIS 21 14.0 FINDINGS 21 15.0 Conclusions 24 16.0 MONITORING AND EVALUATION
CONSIDERATION 24 17.0 DESIGN CONSIDERATIONS 24 18.0 RECOMMENDATIONS 24 Annexure-1 Summarise Tables 26 Annexure-2 TSP Maps 27 Annexure-3YSG& PWE TSp Maps 28 Annexure-4 BSL Questionnaire 29 List of Tables II List of Chart II
TABLE OF CONTENTS List of Abbreviations I
1.0 BACKGROUND 1 2.0 BASELINE SURVEY 1 3. 0 METHODOLOGY 1 3.1 POSSIBLE BIAS AND
METHODOLOGICALLIMITATIONS 1 3.2 Design of the Survey 2 3.3 SAMPLING METHOD 2 4.0 VULNERABILITY OF THE PYAWBWE
AND YESAGYO 2 4.1 SANITATION 2 4.2 Solid and liquid waste 2 4.3 Diseases 3 5.0 RESULTS OF THE STUDY:
QUANTITATIVE DATA DEMOGRAPHIC CHARACTERISTICS 3
5.1 Total Surveyed Households and officials 3 5.2 Characteristics of Surveyed Households 3 5.2.1 Percentage of males and females 3 5.2.2 Sample of respondent- Age class wise 4 5.2.3 Children population in surveyed villages 4 5.3 HOUSEHOLD SIZE DISTRIBUTION
(Head of Household) 5 5.4 EDUCATION LEVEL OF HEAD 5
OF HOUSEHOLD 5.5 HOUSEHOLD LIVING SPAN IN
PRESENT HOUSE 5 6.0 Water Supply situation in Villages 6 6.1 Season wise changes in water Source 7 6.2 Time used for Collection/ Fetching of Water7 6.3 Water usage per Household 8 6.4 Attitude towards present water supply
(only for drinking purpose) 9 6.5 Benefits for Drinking water Supply 9 6.6 Water Treatment before drinking. 9 6.7 Water storage container cleaning agent 10 7.0 SANITATION AT VILLAGES 11 7.1 Defication Places at Villages 11 7.2 Benefits of Laterine 11 7.3 Satisfaction with present Laterine 12 7.4 Reason for not Having Laterine 12 7.5 Age of Children’s to start using Laterine 12 7.6 Place for Children’s Stool disposal 12 7.7 Obervations for Sanitations 13 8.0 HOUSEHOLD WASTE 13 8.1 DISPOSAL OF HOUSEHOLD WASTE 13 8.2 Disposal of Animal/ cattle Waste and issue 14 8.3 Issue related to Animal waste 14 8.4 Observation For Household Waste 14
I
Report of the Baseline Survey in Magway and Mandaly Divisions
1 Households and Officials Surveyed in Two
Townships 2 Gender wise Households Surveyed in Two
Townships 3 Age Class and gender wise respondent 4 Age Class wise children Population 5 Water Quality problems in villages 6 Attitude towards water supply (season wise) 7 Water treatment methods 8 Defication Places in Villages. 9 Gender wise Defication Places in Villages. 10 Benefits of laterine 11 Location for disposing animal/cattle waste. 12 Hand washing at critical times. 13 Reason for Washing hands 14 Impediments for health and Hygiene Tasks 15 Health related Information 16 Health Matters 17 No of Mosquito Nets per HHs in PBE and YSG 18 Vector Control Method
LIST OF TABLES LIST OF CHARTS
1 Total Gender wise respondent 2 Age Class and gender wise respondent 3 Age Class wise children Population 4 Gendewise head of Households 5 Education level of Household 6 HHs time length for living in the present house&
Observation for Houses 7 Type of Water Sources used by Villagers 8 %wise water sources changes in season 9 Time used by villagers to fetch the water 10 Household wise water usage 11 Drinking water supply benefits 12 Water treatment methods at YSG Tsp 13 Water treatment methods at PBE Tsp 14 Water container cleaning 15 HHs wise Defication Places in Villages. 16 Satisfaction level with present Laterine. 17 Resons for not having Laterine 18 Age group of Children’s to start using Laterine 19 Place for children’s stool disposal 20 Disposal of HHs waste 21 Cause of Diarrhoea and Stomach upset 22 How malaria Spreads 23 How malaria prevented 24 How malaria Spreads 25 When Wash Hands 26 Hand washing Cleaning Agent 27 Cleaning Agents for utensils 28 Sources of Health Information 29 Mosquito nets in PBE Tsp. 30 Mosquito nets in YSG Tsp.
TABLES CHARTS
II
Report of the Baseline Survey in Magway and Mandaly Divisions
LIST OF ABBREVIATIONS AND ACRONYMS
BPL Below Poverty Line BSL Base Line Survey CBHFA Community-Based Health CHAST Children Sanitation and First
Aid DW Dug –Well FT Feet Gal Gallon HH Household HHW Household Waste HP Hand Pump HQ Headquarters HW Health worker IFRC International Federation of
Red Cross and Red Crescent Societies
IEC Information, Education and Communication
MRCS Myanmar Red Cross Society MTS Meters MOH Ministry of Health MMK Myanmar Kyat PHAST Participatory Hygiene and
Sanitation Transformation Hygiene training.
PBE Pyawbwe Township RCRC Red Cross and Red
Crescent RCV Red Cross Volunteer SW Shallow well TW Tube-well VL Village leader WHO World Health Organisation YSG Yasagyo Township 2IC Second IN charge
III
Report of the Baseline Survey in Magway and Mandaly Divisions
The water, sanitation and hygiene promotion programme implemented by Myanmar Red Cross Society, supported by the International Federation of Red Cross and Red Crescent Societies and funded by Austrian Red Cross is the first of its kind in size of community based watsan project and nature of implementation process with main focus on enhance capacity of MRCS branch for long term programme implementation. The objective of the project is to improve the health of the targeted population in 10 villages in Pyawbwe and Yesagyo Townships at Mandalay and Magway division by improving community based sustainable water supply systems, sanitations and hygiene practices. The project is entirely designed and carried out by MRCS HQs staff, Township Branch and Red cross volunteers. The community-based watsan project spans 2 years (2011 -2012) and aims at, among other specific objectives, a) Establish and Developing the WatSan Unit at HQs and
build and enhance capacity of staff and volunteers in Watsan assessment, project design and implementation, monitoring and evalution.
b) To reduce the incidence of water borne diseases by providing sound , sustainable environmental services in water supply, Sanitation and hygiene promotion.
c) To enhance the capacity of Watsan Unit to response to emergency and disaster preparedness and risk reduction.
This report is based on a descriptive community survey and highlights important water sanitation and hygiene issues. The data was generated by the use of questionnaires and observation forms, both being carried out by men and women separately. The survey basically deals with four main areas: The survey findings is one of the means which will be used for village selection, monitoring and evaluation benchmark. Based on its findings, several recommendations on fine-tuning the project are made.
The baseline survey findings are deduced from data of households, villages’ leader, health workers, and schools’ headmaster collected by trained MRCS volunteers from within the target townships’ area. Household data were gathered from 443 households, 8 health workers and 8 schools using structured questionnaire; respondent households were selected through simple random sampling. Indicators assessed from the survey indicate lack of safe water and sanitation coupled with poor hygiene. A quantitative Household Survey of water, sanitation and hygiene knowledge, attitudes and practices in 15 villages in two townships Pyawbwe and Yesagyo Townships in Mandaly Magway Divisions repectively. Over 432 Household and 30 officials interviews were performed by trained MRCS volunteers. The volunteers attended two intensive training in Meitklia and Yangon, whilst 2ICs and selected active volunteers were given additional training as they are nominated as team leaders.2 Each household interview was conduced by a group of two volunteers (male & female) considering gender balance, while official’s interview was performed by two volunteers and a team leader. To supplement the Household survey data, both transect walks and Focus Group Discussions with target beneficiaries were performed to provide qualitative insight to the data set for analysis and comparison with the quantitative findings. Data entry were rendered by MRCS volunteers at the HQs; statistical analysis were then performed independently by the WatSan delegate, IFRC to ensure reliability through quality control of the data. 1. “No response bias.” The fact that interviews were conducted from 9 a.m. to 4 p.m. meant that some heads of household were not at home during the survey and thus were not included in the study. 2. Despite the high number of surveys that have taken place in the targeted areas, "refusal to participate bias" was not observed in all visited communities and the surveyors were generally well received. This demonstrated the will of the population to work closely with the team during future programs. 3. "Translation bias.” Interpretation of questions may be different in Myanmar compared to the original question written in English. Accordingly, during the training session the survey team took sufficient time to translate the questionnaire into Myanmar and the surveyors had the translated text in Myanmar next to the questions in English.
• Water • Sanitary situation and defecation habits • Solid and liquid waste • Diseases
BACKGROUND 1.
BASELINE SURVEY 2.
METHODOLOGY 3.
POSSIBLE BIAS AND METHODOLOGICAL LIMITATIONS
3.1
1
Report of the Baseline Survey in Magway and Mandaly Divisions
4. "Investigator bias." The opinions of the surveyors and their supervisors can skew the results. For example, when surveyors show verbal or non-verbal responses to what is “correct” during the interview. The team tried to minimize this bias during training through role playing. 5. “Respondent bias.” Respondents may have an interest in providing incorrect answers because they think that they may benefit later, especially in the event that their responses lead to support from donors. In each household, the surveyors explained the objectives of the study to avoid this bias. 6."Privacy bias." In order to ensure the respondents’ confidentiality, the investigator makes certain that crowds are not present during the interview. To reduce the risks of bias, the survey coordinator: • Dedicated time and effort to select experienced surveyors. • Started with a pre-survey (pilot test) and supervised surveyors during the study. • Verified the completed questionnaires each day and provided feedback to the surveyors before conducting fieldwork the next day. The baseline survey forms, household and official, were derived from the RCRC PHAST Household baseline survey form, yet adaptations were made to suit programme local context. The survey form translated into Burmese, then back to English for cross checking technical terminologies (Annexes 4). Additionally, both forms were introduced to, and filling was rehearsed and practiced thoroughly by volunteers and team leaders. The survey was planned into two phases; the first phase from March to April and second from May to June 2011. Data collected during the phase-1 had been examined by the WatSan Team; consequently, remedies, additional trainings and close supervision of WatSan team, HQs were established as appropriate for robust high level of trustworthiness. Simultaneously, a software programme(MS- Access based) was developed by Database Officer and tested by WatSan team for analysing collected data. The survey sample was calculated to cover 28-30 % of the target populations as indicated in table 1. The sampling plan was developed on advice obtained, with some modifications, from the CBHFA PILOT VERSION Draft. Concerned villages’ houses were numbered, then the first HHs was selected randomly and an interval of 4 houses.
These two townships falling in the Dry zone of of Central Inner Burman( Myanmar) basin located between 19 degree to 23 degree N. The Dry Zone comprise 54 townships in 13 districts spread 3 divisions namely Sagaing(Lower), Mandlay and Magway as per the Dry Zone Greening department. IN Mandlay (23 township), sagaing(19 townships) and Magway(18 Townships) falling in Dry Zone of Myanmar In overall 60% of areas in these township represent Dry Zone. Pyawbwe and yasago have been facing spells of draughts and floods in the recent decades in which tens of villages suffered the consequences. The immediate effects of these onset adversities manifest in shortage of clean water and irregularity of replenish traditional water sources (ponds, dug and tube wells, rain harvesting systems). The aforementioned phenomena have influenced not only drinking water quality and quantity, but daily hygiene of people through insufficiency of water for domestic usage. Sanitary situation and defecation habits The enquiry about defecation habits shows, that villagers has habits of open defecation while men go to the open field, women go in the opposite direction to shrubs and bushes. Open defecation is practised by most, while the use of private toilets is an exception. Around 51% of households do have private toilets but only one third of the men of such households use them. Children under five defecate in the shrubs or else their faeces are be taken away by elders. The most challenging issue for the informants as regards open defecation appears to be the loss of time and necessity of walking long distances. Two thirds of the existing toilets are in comparatively bad condition. Interestingly, only a very small percentage of the villagers recognise use of latrines and regular hand washing practices as a way to prevent diarrhea. It is obvious, that no sort of segregation of solid waste material is being made at present in the villages under scrutiny: kitchen or bio-degradable waste is not kept, nor disposed of separately from other plastic or solid waste. Most waste material is disposed of in open public dumping places where it is regularly burned. For the informants themselves, the biggest problems with this form of waste disposal are the resulting bad smell and the mosquito menace. The same is true for the existence of waste water, which can usually be found stagnating around the villages, in canals and roads,
VULNERABILITY OF THE PYAWBWE AND YESAGYO
SANITATION:
Solid and liquid waste
SAMPLING METHOD
DESIGN OF THE SURVEY 3.2
3.3
4
4.1
4.2
2
Report of the Baseline Survey in Magway and Mandaly Divisions
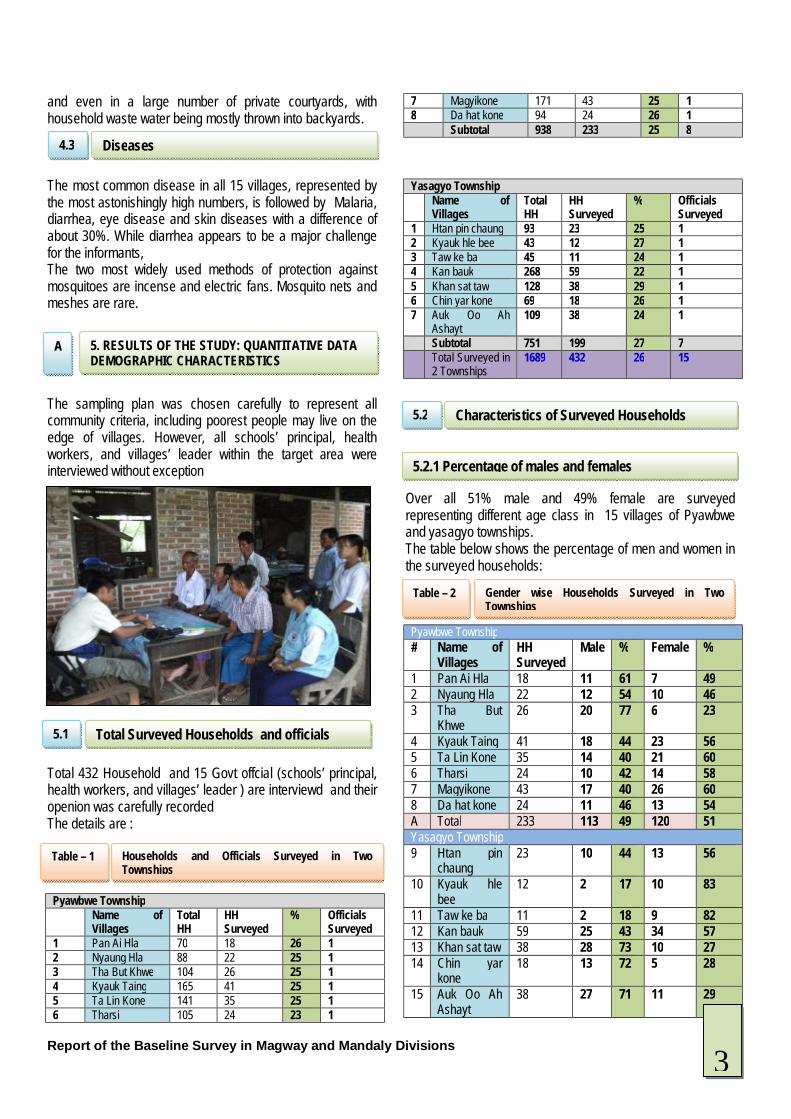
and even in a large number of private courtyards, with household waste water being mostly thrown into backyards. The most common disease in all 15 villages, represented by the most astonishingly high numbers, is followed by Malaria, diarrhea, eye disease and skin diseases with a difference of about 30%. While diarrhea appears to be a major challenge for the informants, The two most widely used methods of protection against mosquitoes are incense and electric fans. Mosquito nets and meshes are rare. The sampling plan was chosen carefully to represent all community criteria, including poorest people may live on the edge of villages. However, all schools’ principal, health workers, and villages’ leader within the target area were interviewed without exception Total 432 Household and 15 Govt offcial (schools’ principal, health workers, and villages’ leader ) are interviewd and their openion was carefully recorded The details are : Pyawbwe Township Name of
Villages Total HH
HH Surveyed
% Officials Surveyed
1 Pan Ai Hla 70 18 26 1 2 Nyaung Hla 88 22 25 1 3 Tha But Khwe 104 26 25 1 4 Kyauk Taing 165 41 25 1 5 Ta Lin Kone 141 35 25 1 6 Tharsi 105 24 23 1
7 Magyikone 171 43 25 1 8 Da hat kone 94 24 26 1 Subtotal 938 233 25 8
Yasagyo Township Name of
Villages Total HH
HH Surveyed
% Officials Surveyed
1 Htan pin chaung 93 23 25 1 2 Kyauk hle bee 43 12 27 1 3 Taw ke ba 45 11 24 1 4 Kan bauk 268 59 22 1 5 Khan sat taw 128 38 29 1 6 Chin yar kone 69 18 26 1 7 Auk Oo Ah
Ashayt 109 38 24 1
Subtotal 751 199 27 7 Total Surveyed in
2 Townships 1689 432 26 15
Over all 51% male and 49% female are surveyed representing different age class in 15 villages of Pyawbwe and yasagyo townships. The table below shows the percentage of men and women in the surveyed households: Pyawbwe Township # Name of
Villages HH Surveyed
Male % Female %
1 Pan Ai Hla 18 11 61 7 49 2 Nyaung Hla 22 12 54 10 46 3 Tha But
Khwe 26 20 77 6 23
4 Kyauk Taing 41 18 44 23 56 5 Ta Lin Kone 35 14 40 21 60 6 Tharsi 24 10 42 14 58 7 Magyikone 43 17 40 26 60 8 Da hat kone 24 11 46 13 54 A Total 233 113 49 120 51 Yasagyo Township 9 Htan pin
chaung 23 10 44 13 56
10 Kyauk hle bee
12 2 17 10 83
11 Taw ke ba 11 2 18 9 82 12 Kan bauk 59 25 43 34 57 13 Khan sat taw 38 28 73 10 27 14 Chin yar
kone 18 13 72 5 28
15 Auk Oo Ah Ashayt
38 27 71 11 29
Diseases
5. RESULTS OF THE STUDY: QUANTITATIVE DATA DEMOGRAPHIC CHARACTERISTICS
Characteristics of Surveyed Households
5.2.1 Percentage of males and females
A
4.3
5.2
Total Surveyed Households and officials 5.1
Households and Officials Surveyed in Two Townships
Table – 1
Gender wise Households Surveyed in Two Townships
Table – 2
3
Report of the Baseline Survey in Magway and Mandaly Divisions
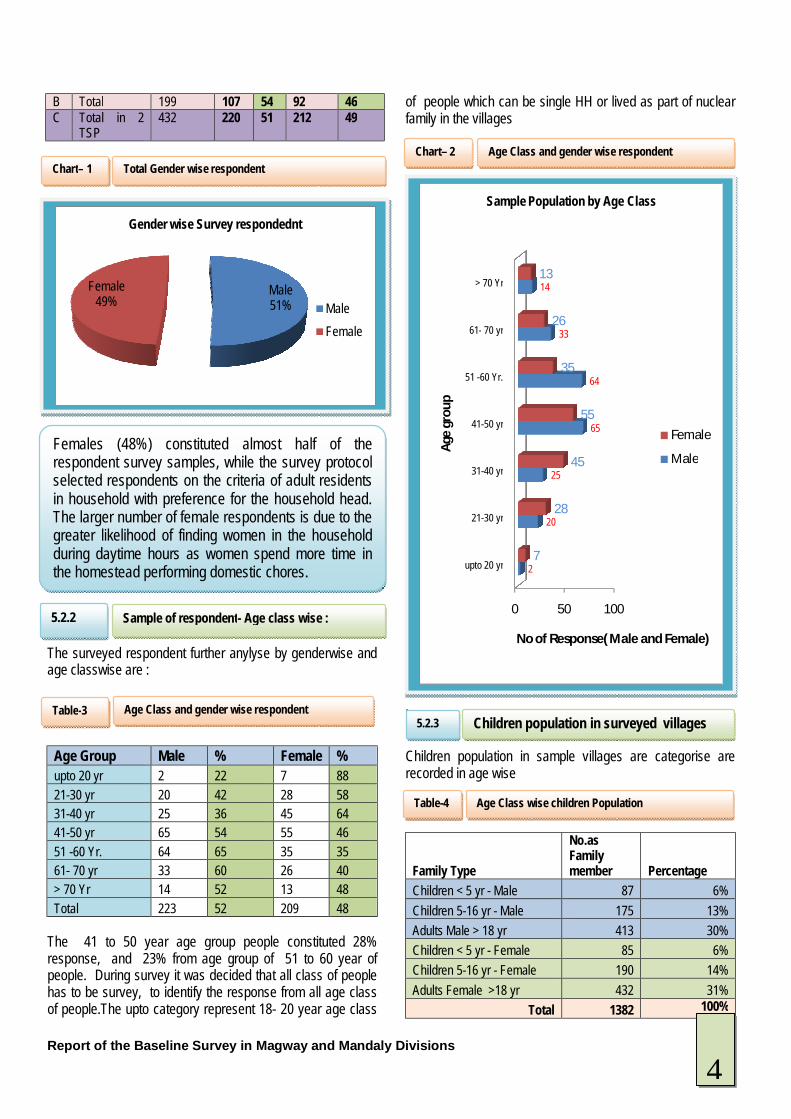
B Total 199 107 54 92 46 C Total in 2
TSP 432 220 51 212 49
The surveyed respondent further anylyse by genderwise and age classwise are :
Age Group Male % Female % upto 20 yr 2 22 7 88 21-30 yr 20 42 28 58 31-40 yr 25 36 45 64 41-50 yr 65 54 55 46 51 -60 Yr. 64 65 35 35 61- 70 yr 33 60 26 40 > 70 Yr 14 52 13 48 Total 223 52 209 48
The 41 to 50 year age group people constituted 28% response, and 23% from age group of 51 to 60 year of people. During survey it was decided that all class of people has to be survey, to identify the response from all age class of people.The upto category represent 18- 20 year age class
of people which can be single HH or lived as part of nuclear family in the villages . Children population in sample villages are categorise are recorded in age wise
Family Type
No.as Family member Percentage
Children < 5 yr - Male 87 6% Children 5-16 yr - Male 175 13% Adults Male > 18 yr 413 30% Children < 5 yr - Female 85 6% Children 5-16 yr - Female 190 14% Adults Female >18 yr 432 31%
Total 1382 100%
Male 51%
Female49%
Gender wise Survey respondednt
Male Female
0 50 100
upto 20 yr
21-30 yr
31-40 yr
41-50 yr
51 -60 Yr.
61- 70 yr
> 70 Yr
2
20
25
65
64
33
14
7
28
45
55
35
26
13
No of Response( Male and Female)
Age
gro
up
Sample Population by Age Class
Female
MaleFemales (48%) constituted almost half of the respondent survey samples, while the survey protocol selected respondents on the criteria of adult residents in household with preference for the household head. The larger number of female respondents is due to the greater likelihood of finding women in the household during daytime hours as women spend more time in the homestead performing domestic chores.
Total Gender wise respondent Chart– 1
Age Class and gender wise respondent Table-3
Sample of respondent- Age class wise :
5.2.2
Age Class and gender wise respondent Chart– 2
Children population in surveyed villages 5.2.3
Age Class wise children Population Table-4
4

Report of the Baseline Survey in Magway and Mandaly Divisions
The sample illustrates 12 percent of households have children aged below five years, this figure is of interest because children of this age are not only very vulnerable to water and sanitation related diseases, but are themselves vital carriers of infection 79% male represented to head of Household and involved in decision making for the family in the survey villages.19% female are head of household which is either seprated/ divorced or single mother are involved for decision making of family.2% of People didnt responded for this question. It is observed that more than 90% of household heads are able to read and write, despite the fact of being living in rural areas
47% of survey respondent mentioned they spent 20-50 year in the present house.Some people responded that they lived in sameplace and constructed or expanded the area of their house as family grow.
Children < 5 y -Male6%
Children 5-16 y - Male
13%
Adults Male > 18 y30%
Children < 5 y - Female
6%
Children 5-16 y -
Female14%
Adults Female >18
y31%
% wise Household Member's children Profile
Female19%
Male79%
Not Given2%
Gender wise Household Head
Illiterate, 7%
Able to read/write,
3%
Monastery education,
41%
Primary school, 33%
Middle school, 12%High
school, 3%Graduate,
1%NA, 0%
Family Head Education Level
60 63 8059 61 63 46
14% 15%19%
14% 14% 15%11%
020406080
100
0 to 10 y
10 to 20 y
20 to 30 y
30 to 40 y
40 to 50 y
Over 50 y
No Answer
Fam
ilies
Years
Length of Time Lived in This House
55%
1%12%
32%
0%10%20%30%40%50%60%
Detached house with private yard
House without private yard
Multi-story unit Is there an animal pen in vicinity of the
house
Observation of house
Age Class wise children Population Chart -3
Gendewise head of Households Chart -4
EDUCATION LEVEL OF HEAD OF HOUSEHOLD 5.4
Education level of Household Chart -5
HOUSEHOLD LIVING SPAN IN PRESENT HOUSE 5.5
HHs time length for living in the present house& Observation for Houses
Chart -6
HOUSEHOLD SIZE DISTRIBUTION (Head of Household)
5.3
5
Report of the Baseline Survey in Magway and Mandaly Divisions
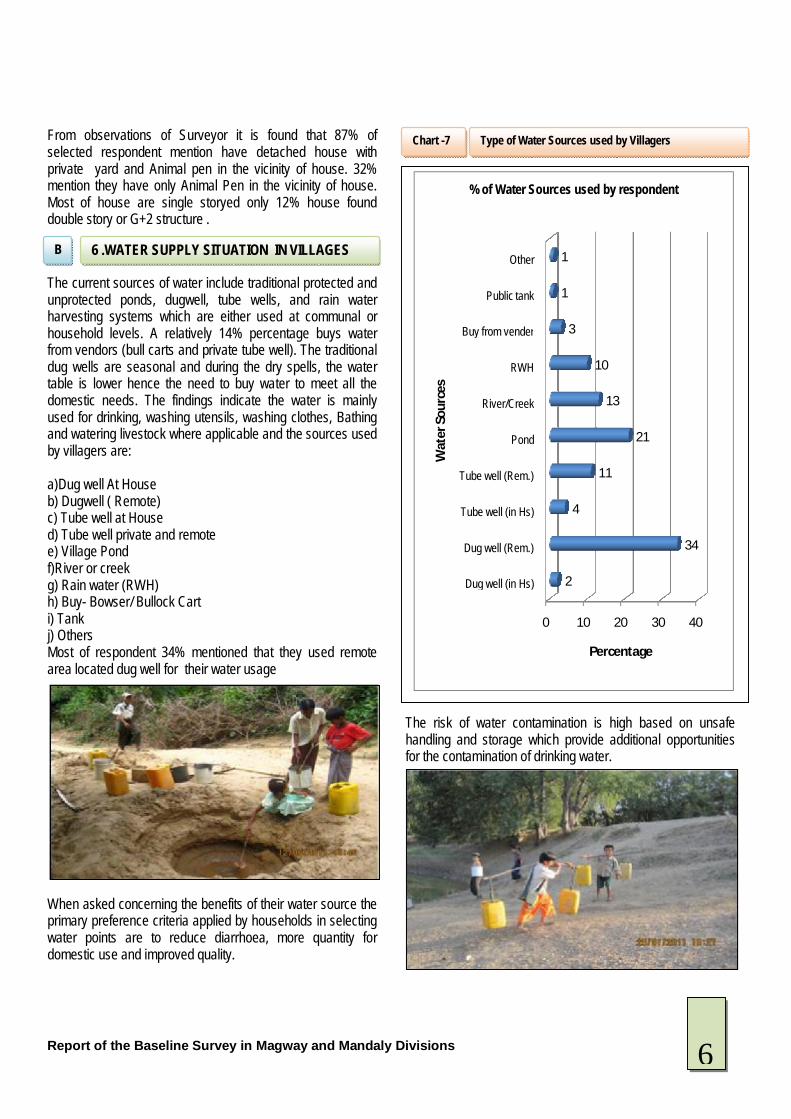
From observations of Surveyor it is found that 87% of selected respondent mention have detached house with private yard and Animal pen in the vicinity of house. 32% mention they have only Animal Pen in the vicinity of house. Most of house are single storyed only 12% house found double story or G+2 structure .
The current sources of water include traditional protected and unprotected ponds, dugwell, tube wells, and rain water harvesting systems which are either used at communal or household levels. A relatively 14% percentage buys water from vendors (bull carts and private tube well). The traditional dug wells are seasonal and during the dry spells, the water table is lower hence the need to buy water to meet all the domestic needs. The findings indicate the water is mainly used for drinking, washing utensils, washing clothes, Bathing and watering livestock where applicable and the sources used by villagers are: a)Dug well At House b) Dugwell ( Remote) c) Tube well at House d) Tube well private and remote e) Village Pond f)River or creek g) Rain water (RWH) h) Buy- Bowser/ Bullock Cart i) Tank j) Others Most of respondent 34% mentioned that they used remote area located dug well for their water usage When asked concerning the benefits of their water source the primary preference criteria applied by households in selecting water points are to reduce diarrhoea, more quantity for domestic use and improved quality.
The risk of water contamination is high based on unsafe handling and storage which provide additional opportunities for the contamination of drinking water.
0 10 20 30 40
Dug well (in Hs)
Dug well (Rem.)
Tube well (in Hs)
Tube well (Rem.)
Pond
River/Creek
RWH
Buy from vender
Public tank
Other
2
34
4
11
21
13
10
3
1
1
Percentage
Wat
er S
ourc
es
% of Water Sources used by respondent
6 .WATER SUPPLY SITUATION IN VILLAGES B
Type of Water Sources used by Villagers Chart -7
6
Report of the Baseline Survey in Magway and Mandaly Divisions
Mainly, childrens aged less than 15 years ( Daughters 37% and sons 31%) collecting or fetching water thus could be targeted for HP, In some of Household women(11%) are responsible for collecting the water for daily usage. Only 2-5 percent of households consistently treat their drinking water, the main impediments to this safe guard being cost and ignorance on which method to apply and with the assumption the water is already safe. The cost barrier emanates from the time used to search for wood fuel for boiling or money to buy water filters. Chlorine is not commen to be use find out during observation and discussion. It is find out through obervation during survey that People and aminals share the same water source. Changes in water sources are frequest in the surveyed villages and community changes water depends upon the season. 54% of people changes their water sources in summer season and reason is the present sources may become dry or the recharge time for Dug well are increase 4 -5 hr and recharge level of water will be less and insufficient. 27% of people mention they change water source in Rainy and 19% in winter and due to less travel time to fethcing the water.
53% of respondednt mentioned that the average time for collection of water during normal ( winter and Rainy) season is range from 15 min to 30 min. 43% of respondednt mentioned that the average time for collection of water during normal ( winter and Rainy) season is range from 1-2 hrs. 4% of respondednt mentioned that the average time for collection of water during normal ( winter and Rainy) season is range from more than 2 hrs During Dry season most of water source become dry or the water table level go down in most of the surveyed villages. Women’s mentioned some time in rainy season water quality become worse of some sources and during dry season most of time they go for fetching of water 2-3 times, as some of them are lacking of transportation and they have to carry water on their shoulders.Some of respondent mentioned that during dry season most of villagers faced following issues are:
Summer54%
Winter19%
Rainy27%
Source of water change depending on the season?
<15 Min5% till 15 Min.
14%
till 30 Min24%
till 1 hr.22%
till 2 Hr21%
till 3 Hr 9%
>3 Hr.5%
Time take for fetching of water
Season wise changes in current water Source
6 .1
%wise water sources changes in season Chart 8
Time used for Collection/ Fetching of Water:
6 .2
Time used by villagers to fetch the water Chart 9
7
Report of the Baseline Survey in Magway and Mandaly Divisions
At least 47 percent of the household use 30-90 gallon and 46% percent of the household use over 90 gallon of water per day for their domestic and personal hygiene which indicate an average of 12-20 gallon per person per day. Only 7 percentage use less than 30 litres of water per family for their daily usage Problem in Current Drinking water The current problem for current drinking water reported by responded during survey are categorised and summarised.
Water quality % Reason Dirty/ Brackish 8 Some of village tube well
installed by Govt/ private
owners providing brackish water with mild salinity level. During water quality check we find the randge are 1000ppm to 1200 ppm in some of villages. And if the boil, there is not sufficient firewood available.
Taste is Bad 13 Some village beneficiary mention the taste of water is not good due iron presence in water. And some time if they drink they become sick etc. Some of respondednt mentioned that during cooking with rice the water turn in yellowish color.
Disrupted supply / not enough for fullfilling present needs
43 This is normal problem of respondent , they mention that during dry season the water sources become dry and water scarcity arises .
Diffcult to collect 27 Most of responded from Pyawbwe mentioned that they have to travel 3-4 hrs to collect the water during dry season and during normal time its 1-2 hrs.
Water cost is high 3 During dry season the cost of water become high due to unavailability of drinking water ,in normal time 10-15 kyat per gallan become 20-25 kyat, due to vender also has to collect water from far sources and travel time increases.
Others 6 Some people mentioned that maintenance cost of tube well running is high, and some time owner cant offord to repair.
8 20
73
130
200
1
1.85%4.63%
16.90%
30.09%
46.30%
0.23%0
50
100
150
200
250
b)4 – 13 gallons
c)13 –30
gallons
d)30 –60
gallons
e)60 –90
gallons
f)Over 90
gallons
(blank)
Water used by people within your household per day?
a) Sharp Depletion in water table level. b) Water Recharge take longtime and quantity is not
sufficient c) New source is not sufficient for villagers. d)Travel time to fetch water increase (3-4 times) as
compare to normal time. e) water quality is worse and muddy and yellowish in
nature. f) lack of fuel wood for treating/ boiling of water.
Water Quality problems in villages Table-5
Water usage per Household
6.3
Household wise water usage Chart 10
8
Report of the Baseline Survey in Magway and Mandaly Divisions
The Attitude of respondednt is presented in following ways as per seasonality. The combined response for both townships are:
Attitude Season Summer Rainy Winter
Water Quality and Quantity are Good
9% agreed that water is available during this season and quality is good and 91% mentioned that quantity is not enough due to some of sources become dry. Most of respondent mention that their collected water become dry and less in this season
11% agreed that water is available in this season and 45% mentioned quality is not good as the current sources become muddy some times. 32% respondednt mention that they collected water in this season, but they dont have enough pots to collect RWH. 12% not responded for this seasond
24% mention that water is available in this season and some of water source quality is good and sufficient only for villagers.
Water Delivery/ Collection is good and enough are available with 10-30 min walk
In Pyawbwe TSP.60-70% of respondednt mention that nearest collection point for water become dry i.e. well etc. So they have to travel 2-3 hrs to collect water
60% mention that during this season water is available at nearest point.
65% mention that during this season water is available at nominal cost and at their nearest sources.
Enough water but quality is concerned.
80-90% responded that water quality is brackish where water is fatched through tubewell, but
40-60% mention that enough water if good rain, but annual precipitation is found decreasing in recent years.
65% respondent mentioned that water is available and quality is good related to wells. But in tube well
again where tubewell is not major source for drinking, respondent mention the scarecity of water during summer season.
30-35% mention that quality is main concern during rainy days also as water become muddy in shallow well in their areas. 5% not reponded for this.
throughout quality is concerned in yasagyo township. 30-32% agreed for quality and quantity in their areas.
The benefits for water supply view assessed keeping in way that water points available at nearest to their house and quality of water is safe for drinking purpose and has awareness of water borne disease in community. 33% of respondent mention that if water supply system in their area will reduce down the water born diarrhoea diseases, stomach ache problem etc. 21% responded said the quality of water will improve and safe water will be available as a benefit. 20% mention that its will be reduce down the time for collection of water. Household level water treatment most of villagers use in keep as economical and as per their affordability . Some of villagers has lack of awareness for water treatment before drinking if quality is not as per standard. The surveyed results are:
saved collection
time14%
reduced walking
distance to collect
6%
improved quality of
water21%
decreased diarrhoea
33%
more water for domestic
use26%
Benefits for water Supply
6.4 Attitude towards present water supply (only for drinking purpose):
Benefits for Drinking water Supply
6.5
Water Treatment before drinking.
6.6
Attitude towards water supply (season wise) Table-6
Drinking water supply benefits Chart 11
9
Report of the Baseline Survey in Magway and Mandaly Divisions
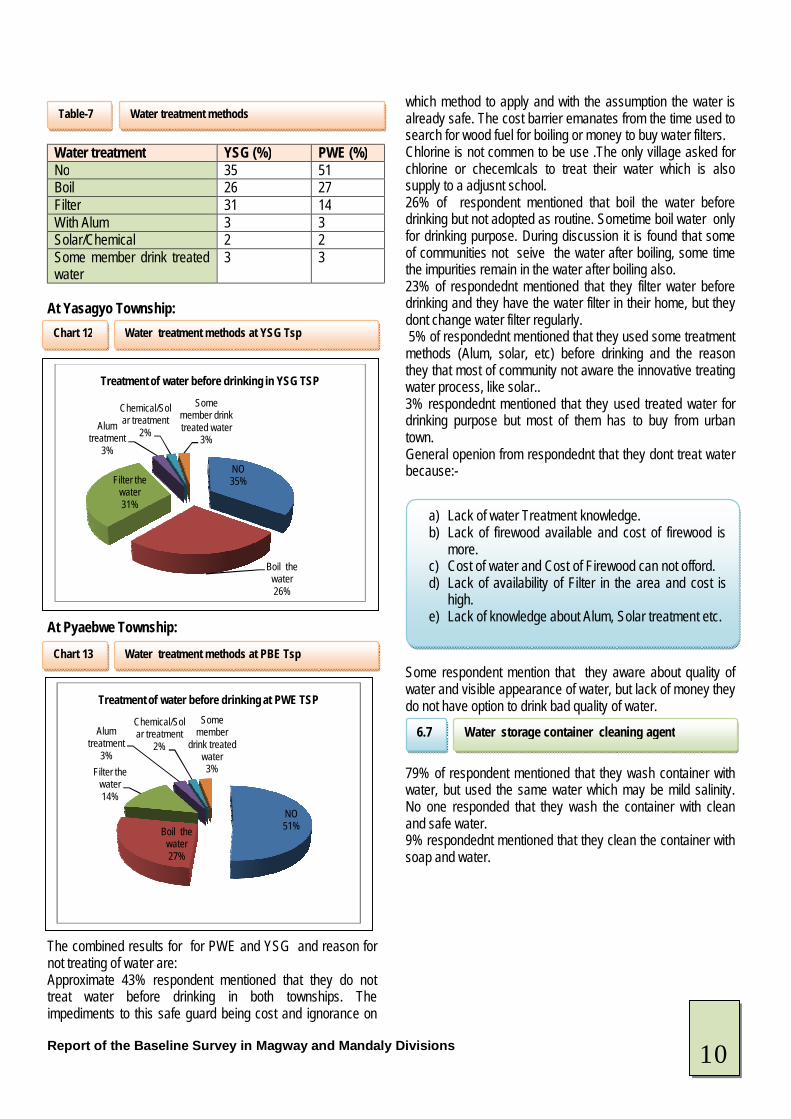
Water treatment YSG (%) PWE (%) No 35 51 Boil 26 27 Filter 31 14 With Alum 3 3 Solar/Chemical 2 2 Some member drink treated water
3 3
At Yasagyo Township: At Pyaebwe Township: The combined results for for PWE and YSG and reason for not treating of water are: Approximate 43% respondent mentioned that they do not treat water before drinking in both townships. The impediments to this safe guard being cost and ignorance on
which method to apply and with the assumption the water is already safe. The cost barrier emanates from the time used to search for wood fuel for boiling or money to buy water filters. Chlorine is not commen to be use .The only village asked for chlorine or checemlcals to treat their water which is also supply to a adjusnt school. 26% of respondent mentioned that boil the water before drinking but not adopted as routine. Sometime boil water only for drinking purpose. During discussion it is found that some of communities not seive the water after boiling, some time the impurities remain in the water after boiling also. 23% of respondednt mentioned that they filter water before drinking and they have the water filter in their home, but they dont change water filter regularly. 5% of respondednt mentioned that they used some treatment methods (Alum, solar, etc) before drinking and the reason they that most of community not aware the innovative treating water process, like solar.. 3% respondednt mentioned that they used treated water for drinking purpose but most of them has to buy from urban town. General openion from respondednt that they dont treat water because:- Some respondent mention that they aware about quality of water and visible appearance of water, but lack of money they do not have option to drink bad quality of water. 79% of respondent mentioned that they wash container with water, but used the same water which may be mild salinity. No one responded that they wash the container with clean and safe water. 9% respondednt mentioned that they clean the container with soap and water.
NO35%
Boil the water26%
Filter the water31%
Alum treatment
3%
Chemical/Solar treatment
2%
Some member drink treated water
3%
Treatment of water before drinking in YSG TSP
NO51%Boil the
water27%
Filter the water14%
Alum treatment
3%
Chemical/Solar treatment
2%
Some member
drink treated water3%
Treatment of water before drinking at PWE TSP
Water treatment methods Table-7
Water treatment methods at YSG Tsp Chart 12
Water treatment methods at PBE Tsp Chart 13
a) Lack of water Treatment knowledge. b) Lack of firewood available and cost of firewood is
more. c) Cost of water and Cost of Firewood can not offord. d) Lack of availability of Filter in the area and cost is
high. e) Lack of knowledge about Alum, Solar treatment etc.
Water storage container cleaning agent
6.7
10
Report of the Baseline Survey in Magway and Mandaly Divisions
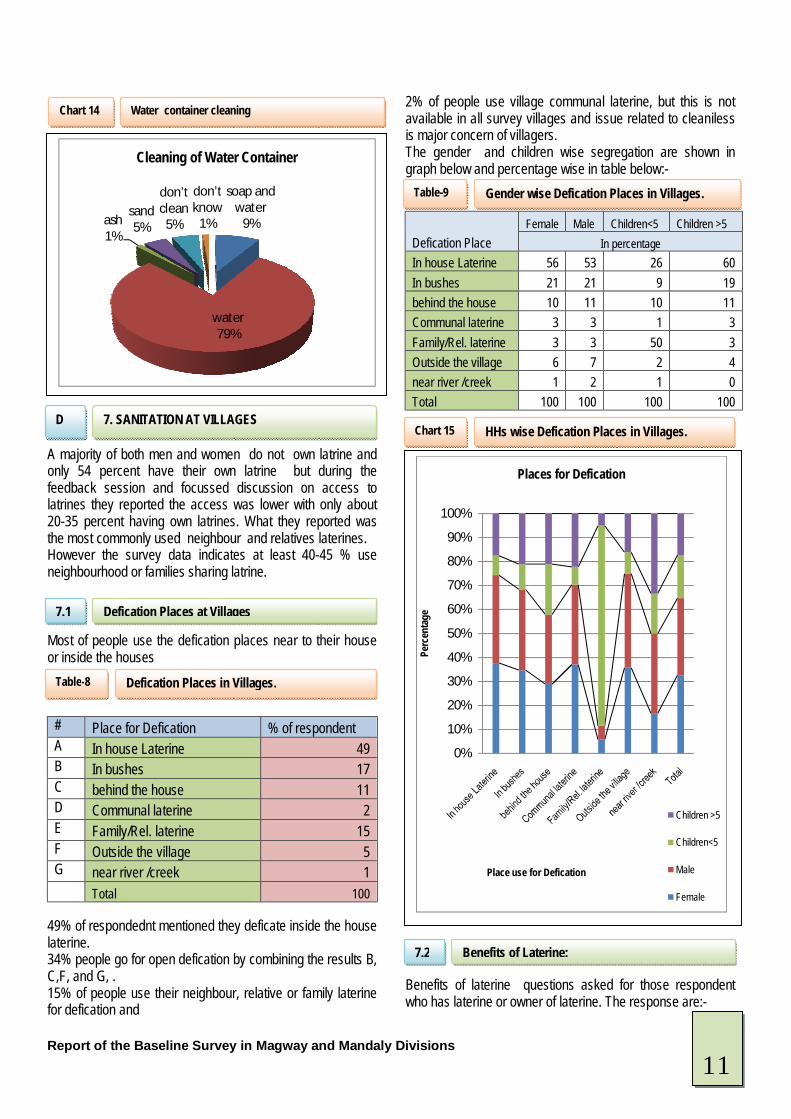
A majority of both men and women do not own latrine and only 54 percent have their own latrine but during the feedback session and focussed discussion on access to latrines they reported the access was lower with only about 20-35 percent having own latrines. What they reported was the most commonly used neighbour and relatives laterines. However the survey data indicates at least 40-45 % use neighbourhood or families sharing latrine. Most of people use the defication places near to their house or inside the houses
# Place for Defication % of respondent A In house Laterine 49 B In bushes 17 C behind the house 11 D Communal laterine 2 E Family/Rel. laterine 15 F Outside the village 5 G near river /creek 1 Total 100
49% of respondednt mentioned they deficate inside the house laterine. 34% people go for open defication by combining the results B, C,F, and G, . 15% of people use their neighbour, relative or family laterine for defication and
2% of people use village communal laterine, but this is not available in all survey villages and issue related to cleaniless is major concern of villagers. The gender and children wise segregation are shown in graph below and percentage wise in table below:-
Defication Place Female Male Children<5 Children >5
In percentage In house Laterine 56 53 26 60 In bushes 21 21 9 19 behind the house 10 11 10 11 Communal laterine 3 3 1 3 Family/Rel. laterine 3 3 50 3 Outside the village 6 7 2 4 near river /creek 1 2 1 0 Total 100 100 100 100
Benefits of laterine questions asked for those respondent who has laterine or owner of laterine. The response are:-
soap and water
9%
water79%
ash1%
sand5%
don’t clean
5%
don’t know
1%
Cleaning of Water Container
0%
10%
20%
30%
40%
50%
60%
70%
80%
90%
100%
Perc
enta
ge
Place use for Defication
Places for Defication
Children >5
Children<5
Male
Female
Water container cleaning Chart 14
7. SANITATION AT VILLAGES
D
Defication Places at Villages 7.1
Defication Places in Villages. Table-8
Gender wise Defication Places in Villages. Table-9
HHs wise Defication Places in Villages. Chart 15
Benefits of Laterine: 7.2
11
Report of the Baseline Survey in Magway and Mandaly Divisions
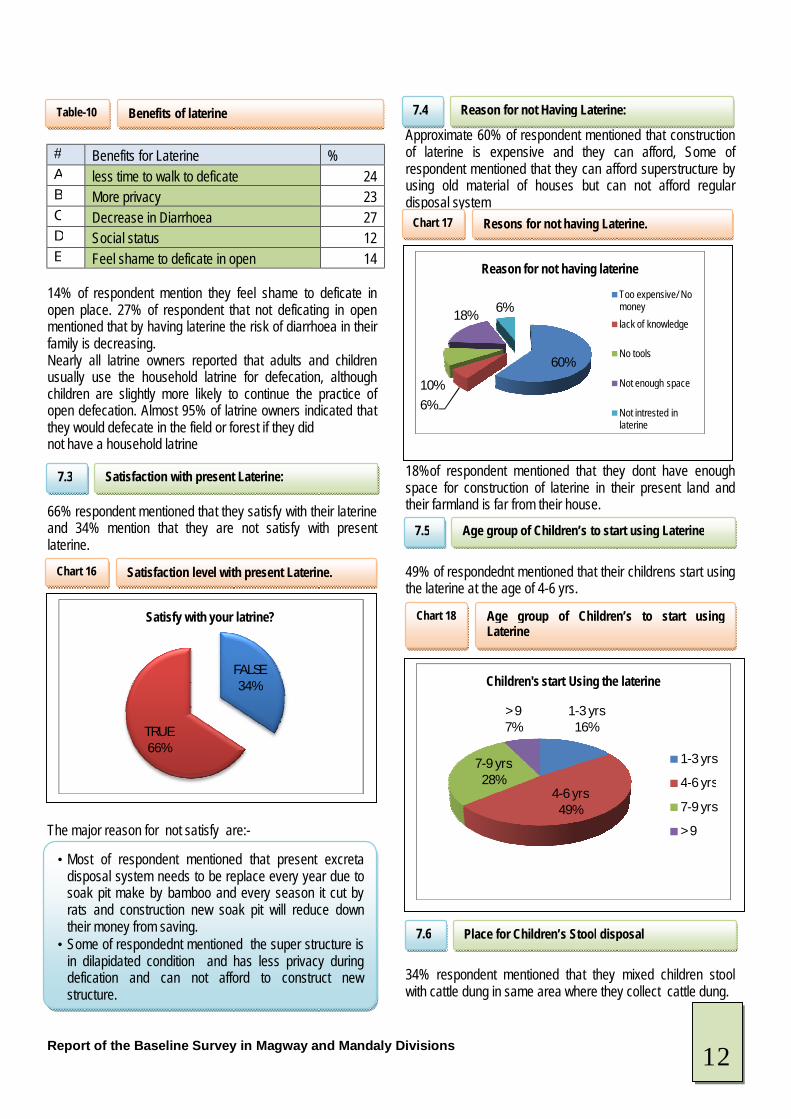
# Benefits for Laterine % A less time to walk to deficate 24 B More privacy 23 C Decrease in Diarrhoea 27 D Social status 12 E Feel shame to deficate in open 14
14% of respondent mention they feel shame to deficate in open place. 27% of respondent that not deficating in open mentioned that by having laterine the risk of diarrhoea in their family is decreasing. Nearly all latrine owners reported that adults and children usually use the household latrine for defecation, although children are slightly more likely to continue the practice of open defecation. Almost 95% of latrine owners indicated that they would defecate in the field or forest if they did not have a household latrine 66% respondent mentioned that they satisfy with their laterine and 34% mention that they are not satisfy with present laterine. The major reason for not satisfy are:-
Approximate 60% of respondent mentioned that construction of laterine is expensive and they can afford, Some of respondent mentioned that they can afford superstructure by using old material of houses but can not afford regular disposal system 18%of respondent mentioned that they dont have enough space for construction of laterine in their present land and their farmland is far from their house. 49% of respondednt mentioned that their childrens start using the laterine at the age of 4-6 yrs. 34% respondent mentioned that they mixed children stool with cattle dung in same area where they collect cattle dung.
FALSE34%
TRUE66%
Satisfy with your latrine?
60%
6%
10%
18%6%
Reason for not having laterine
Too expensive/ No moneylack of knowledge
No tools
Not enough space
Not intrested in laterine
1-3 yrs16%
4-6 yrs49%
7-9 yrs28%
> 97%
Children's start Using the laterine
1-3 yrs
4-6 yrs
7-9 yrs
> 9
Benefits of laterine Table-10
Satisfaction with present Laterine:
7.3
Satisfaction level with present Laterine. Chart 16
• Most of respondent mentioned that present excreta disposal system needs to be replace every year due to soak pit make by bamboo and every season it cut by rats and construction new soak pit will reduce down their money from saving.
• Some of respondednt mentioned the super structure is in dilapidated condition and has less privacy during defication and can not afford to construct new structure.
Reason for not Having Laterine:
7.4
Resons for not having Laterine. Chart 17
Age group of Children’s to start using Laterine
7.5
Age group of Children’s to start using Laterine
Chart 18
Place for Children’s Stool disposal 7.6
12
Report of the Baseline Survey in Magway and Mandaly Divisions
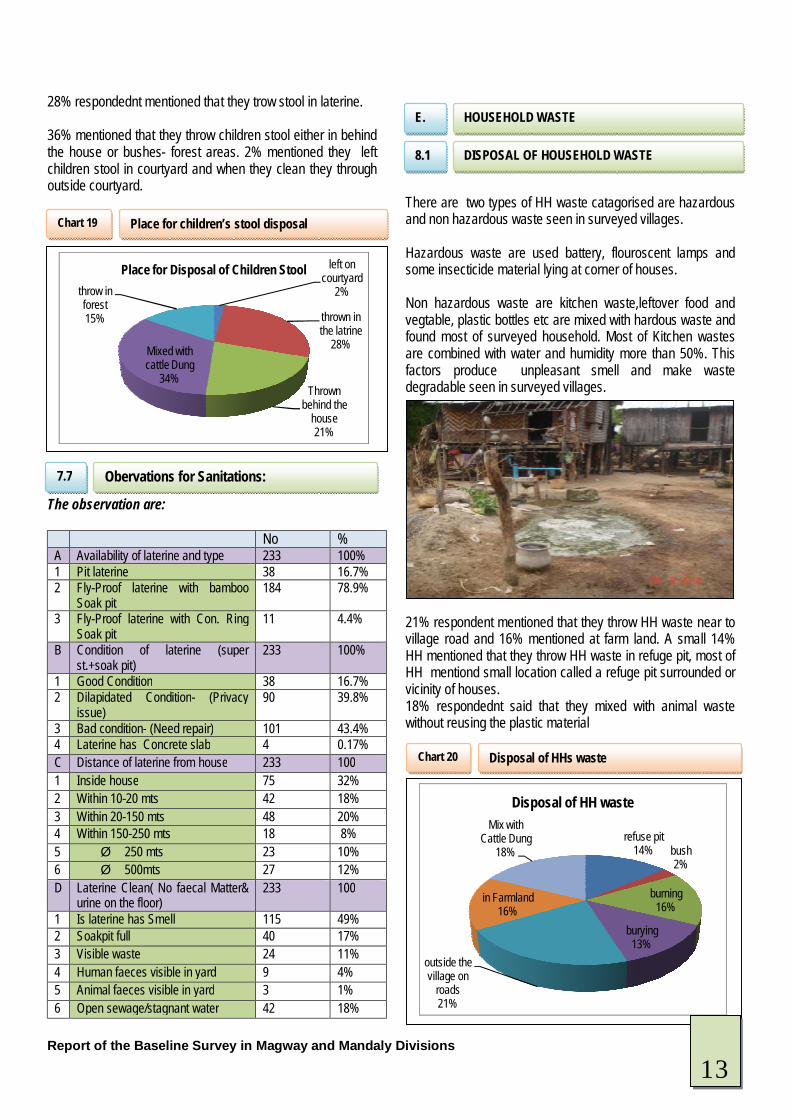
28% respondednt mentioned that they trow stool in laterine. 36% mentioned that they throw children stool either in behind the house or bushes- forest areas. 2% mentioned they left children stool in courtyard and when they clean they through outside courtyard. The observation are:
No % A Availability of laterine and type 233 100% 1 Pit laterine 38 16.7% 2 Fly-Proof laterine with bamboo
Soak pit 184 78.9%
3 Fly-Proof laterine with Con. Ring Soak pit
11 4.4%
B Condition of laterine (super st.+soak pit)
233 100%
1 Good Condition 38 16.7% 2 Dilapidated Condition- (Privacy
issue) 90 39.8%
3 Bad condition- (Need repair) 101 43.4% 4 Laterine has Concrete slab 4 0.17% C Distance of laterine from house 233 100 1 Inside house 75 32% 2 Within 10-20 mts 42 18% 3 Within 20-150 mts 48 20% 4 Within 150-250 mts 18 8% 5 Ø 250 mts 23 10% 6 Ø 500mts 27 12% D Laterine Clean( No faecal Matter&
urine on the floor) 233 100
1 Is laterine has Smell 115 49% 2 Soakpit full 40 17% 3 Visible waste 24 11% 4 Human faeces visible in yard 9 4% 5 Animal faeces visible in yard 3 1% 6 Open sewage/stagnant water 42 18%
There are two types of HH waste catagorised are hazardous and non hazardous waste seen in surveyed villages. Hazardous waste are used battery, flouroscent lamps and some insecticide material lying at corner of houses. Non hazardous waste are kitchen waste,leftover food and vegtable, plastic bottles etc are mixed with hardous waste and found most of surveyed household. Most of Kitchen wastes are combined with water and humidity more than 50%. This factors produce unpleasant smell and make waste degradable seen in surveyed villages. 21% respondent mentioned that they throw HH waste near to village road and 16% mentioned at farm land. A small 14% HH mentioned that they throw HH waste in refuge pit, most of HH mentiond small location called a refuge pit surrounded or vicinity of houses. 18% respondednt said that they mixed with animal waste without reusing the plastic material
left on courtyard
2%
thrown in the latrine
28%
Thrown behind the
house21%
Mixed with cattle Dung
34%
throw in forest15%
Place for Disposal of Children Stool
refuse pit14% bush
2%
burning16%
burying13%
outside the village on
roads21%
in Farmland16%
Mix with Cattle Dung
18%
Disposal of HH waste
Place for children’s stool disposal Chart 19
Obervations for Sanitations:
7.7
HOUSEHOLD WASTE
E.
DISPOSAL OF HOUSEHOLD WASTE
8.1
Disposal of HHs waste Chart 20
13
Report of the Baseline Survey in Magway and Mandaly Divisions
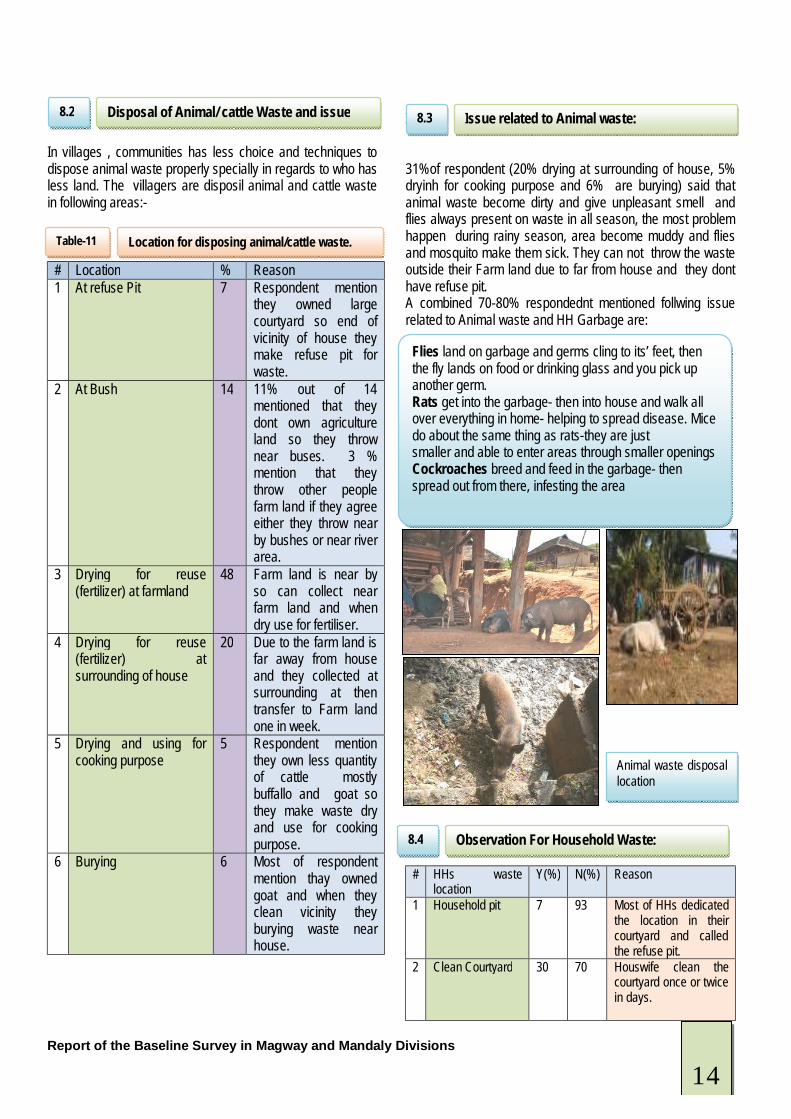
In villages , communities has less choice and techniques to dispose animal waste properly specially in regards to who has less land. The villagers are disposil animal and cattle waste in following areas:-
# Location % Reason 1 At refuse Pit 7 Respondent mention
they owned large courtyard so end of vicinity of house they make refuse pit for waste.
2 At Bush 14 11% out of 14 mentioned that they dont own agriculture land so they throw near buses. 3 % mention that they throw other people farm land if they agree either they throw near by bushes or near river area.
3 Drying for reuse (fertilizer) at farmland
48 Farm land is near by so can collect near farm land and when dry use for fertiliser.
4 Drying for reuse (fertilizer) at surrounding of house
20 Due to the farm land is far away from house and they collected at surrounding at then transfer to Farm land one in week.
5 Drying and using for cooking purpose
5 Respondent mention they own less quantity of cattle mostly buffallo and goat so they make waste dry and use for cooking purpose.
6 Burying 6 Most of respondent mention thay owned goat and when they clean vicinity they burying waste near house.
I 31%of respondent (20% drying at surrounding of house, 5% dryinh for cooking purpose and 6% are burying) said that animal waste become dirty and give unpleasant smell and flies always present on waste in all season, the most problem happen during rainy season, area become muddy and flies and mosquito make them sick. They can not throw the waste outside their Farm land due to far from house and they dont have refuse pit. A combined 70-80% respondednt mentioned follwing issue related to Animal waste and HH Garbage are:
# HHs waste location
Y(%) N(%) Reason
1 Household pit 7 93 Most of HHs dedicated the location in their courtyard and called the refuse pit.
2 Clean Courtyard 30 70 Houswife clean the courtyard once or twice in days.
Disposal of Animal/ cattle Waste and issue 8.2
Location for disposing animal/cattle waste. Table-11
Issue related to Animal waste:
8.3
Flies land on garbage and germs cling to its’ feet, then the fly lands on food or drinking glass and you pick up another germ. Rats get into the garbage- then into house and walk all over everything in home- helping to spread disease. Mice do about the same thing as rats-they are just smaller and able to enter areas through smaller openings Cockroaches breed and feed in the garbage- then spread out from there, infesting the area
Observation For Household Waste:
8.4
Animal waste disposal location
14
Report of the Baseline Survey in Magway and Mandaly Divisions
3 Unpleasant Smell 82 18 As cattle dung lying on courtyard since morning start giving bad smell in enironment.
4 Flies on Animal waste
92 8 Uncleaned courtyard and no proper disposal of Animal waste invite flies, ants and cockroaches.
44% mentioned that cause of diarrhoea and stomach upset are eating unhygenic dirty foods. 18% out of 44% said primarily they unable to recognise the importance of clean food and sometime they eat uncovered food which may be contaminated and then they suffer from Stomach ache. Many people do not make the link between poor water quality and diseases such as diarrhoea, intestinal worms and skin diseases. Dirty hands and unsanitary waste disposal perpetuate the cycle of disease and poverty
19% of respondednt dont know the cause of diarrhoea, which shows lack of knowledge of other vector borne diseases. Risk factors that were associated with persistent diarrhoea and malnutrition included low family income, low education of mothers, unhygienic latrines, flies in the house and on the child, dirty appearance of child and mother, mother not using soap and water when washing child's stools, defaecation of child on floor, breastfeeding on demand, child eating food from floor, not feeding recommended weaning foods, and lack of knowledge by mother about causes of diarrhoea and about foods that prevent malnutrition. These results indicated that persistent diarrhoea and malnutrition in surveyed areas are caused by a complex of several interrelated socioeconomic factors, unsanitary behaviour pertaining to personal hygiene, the practice of demand breastfeeding and lack of certain weaning foods, and low education of mothers who showed less knowledge about causes of diarrhoea and prevention of malnutrition. 10% house hold mentioned that they commonly have problems of stomach upset and loose motion, which may be diarrhoea, as they dont know symptoms of diarrhoea. 20-30% reported that they not aware about diarrhoea cases in family. 10-12% reported that their children face some loose motion problem in current and past weeks also.
Understanding of the aetiology of Dengue, Malaria and Chikengunya is better than that for diarrheal diseases. This statement is made in light of the comparison of those who correctly identified what causes vector borne diseases 79 percent (mosquito bites) with those who listed germs 12 percent and 9 percent who don’t know and those who listed the correct answer in respect to malaria.
by Dirty Foods44%
by Dirty Water23%
Through Flies
touches foods14%
Don’t know19%
Cause of Diarrhoea and Stomach upset
9. Information on Hygiene Awareness F
About diseases:- Diarrhoea and stomach upset
9.1
According to the latest WHO data published in April 2011 Diarrhoeal diseases Deaths in Myanmar reached 13,919 or 2.62% of total deaths. The age adjusted Death Rate is 28.97 per 100,000 of population ranks Myanmar 56 in the world.1
Cause of Diarrhoea and Stomach upset
Chart 21
Diarrhoea cases in Family in past weeks
9.2
About diseases:- MALARIA
9.3
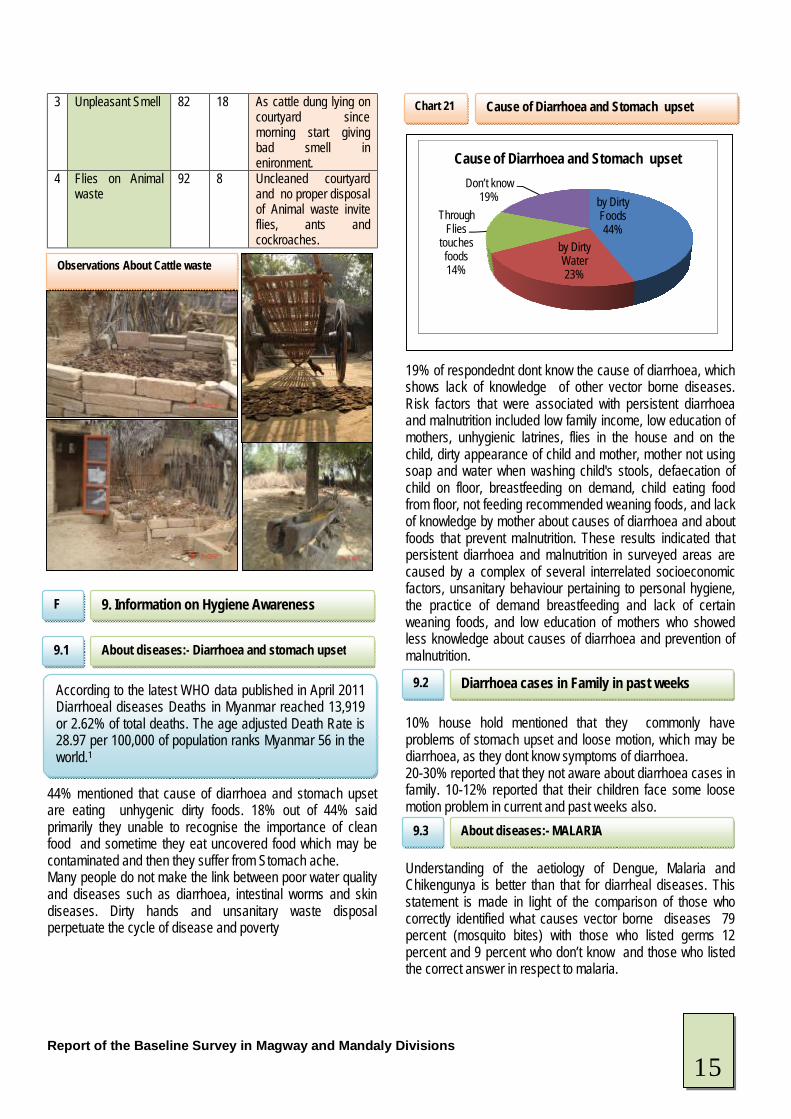
Observations About Cattle waste
15
Report of the Baseline Survey in Magway and Mandaly Divisions
However, the understanding of how these diseases can be prevented is majored on environmental actions such as clearing stagnant water and bushes . Notable is the 7 percent who don’t know what to do. However, the understanding of how these diseases can be prevented is majored on environmental actions such as clearing stagnant water and bushes .Notable is the 7 percent who don’t know what to do. Some of Beneficiary has knowledge for prevention of malaria related control methods by hearing the health department information through radio but applicability fr using of the information they lacking the skill and resources.
The most prevalent diseases are water related, the highest reported household incidence being for diarrhoea at 13percent, vector borne (12 percent) and skin diseases at 12 percent. Three of the top four diseases affecting households are therefore water and vector related. Skin diseases, being largely water washed are a reflection of water scarcity while diarrhoea reflects in part the effects of poor water quality, hygiene and sanitation.
Poor understanding of disease aetiology contributes to poor understanding and practice in hygiene and sanitation thereby perpetuating a disease friendly living environment. Only 68 percent of respondents made the association between dirty food, dirty water and diarrheal diseases, added to the poor association between hygiene and these class of diseases, it is clear that poor awareness on hygiene and disease aetiology make individuals and communities susceptible to disease outbreaks.
There is access to free medical care with an average of 150 patients attended to by MOH1 clinic which is mainly for prenatal and ante natal care. While the District general hospital provides medical care for an average of 350 patients daily. From the Ministry of Health the Public health inspectors conduct community and school health education program reaching approximately 59 percent of the population with 44 percent information on water and sanitation. 1 Medical Officer of Health
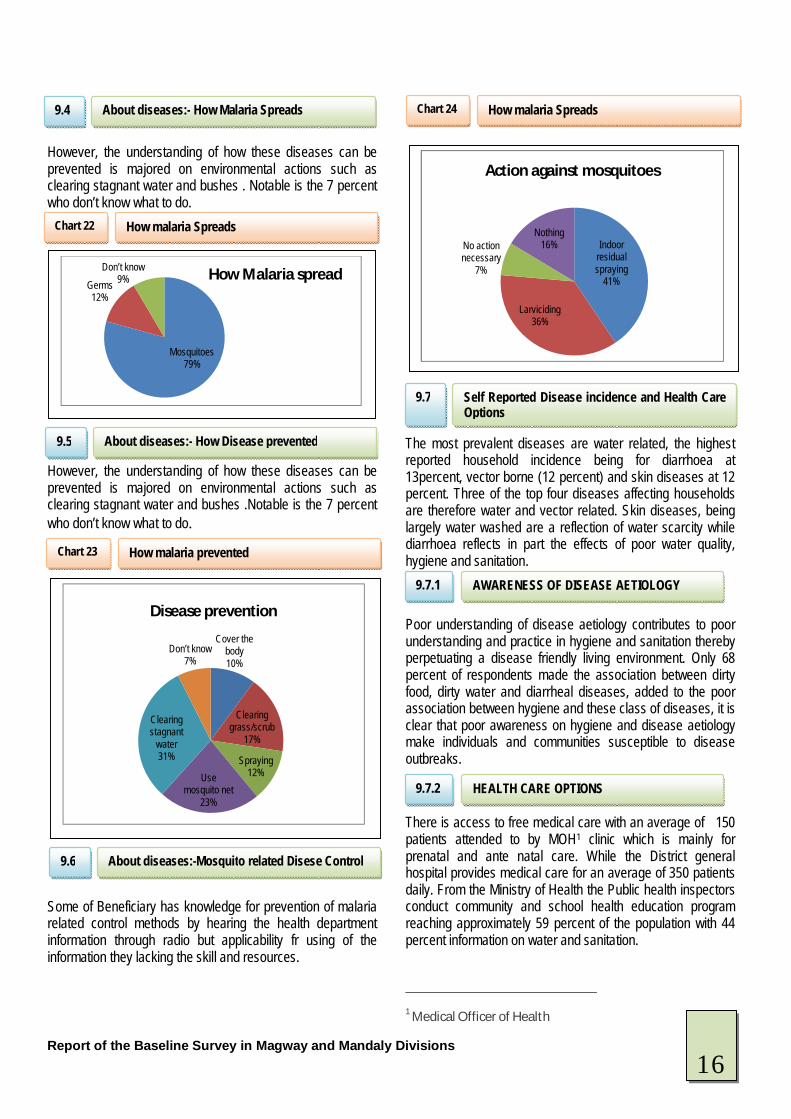
Mosquitoes79%
Germs 12%
Don’t know 9% How Malaria spread
Cover the body10%
Clearing grass/scrub
17%
Spraying 12%Use
mosquito net 23%
Clearing stagnant
water 31%
Don’t know 7%
Disease prevention
Indoor residual spraying
41%
Larviciding 36%
No action necessary
7%
Nothing 16%
Action against mosquitoes
About diseases:- How Malaria Spreads
9.4
How malaria Spreads Chart 22
About diseases:- How Disease prevented
9.5
How malaria prevented Chart 23
How malaria Spreads Chart 24
About diseases:-Mosquito related Disese Control
9.6
Self Reported Disease incidence and Health Care Options
9.7
AWARENESS OF DISEASE AETIOLOGY 9.7.1
HEALTH CARE OPTIONS 9.7.2
16
Report of the Baseline Survey in Magway and Mandaly Divisions
Before reading this section, it is important to keep in mind that the practice of hygiene is motivated by various reasons. Some of these motivations have nothing to do with the desire to prevent disease. The desire for order and respect for social acceptance are external to health but are important motivations for the observance of hygiene. Hygiene is central to social norm so much that the need to be seen in a positive light can lead to respondents in surveys answering in the affirmative for habits they do not practice. Further, it has been suggested that the desire to avoid dirt is intuitive to humans (and other animals) as an evolutionary adaptation. As such, hand washing can be intuitive when dirt is visible and if this initiation is the only impetus to keep clean, individuals can neglect hygiene at critical times when contamination is invisible. Hand washing before eating and preparing food constitute secondary barriers to the spread of diarrhoeal diseases by preventing microbes in the environment from being ingested. However, once microbes enter the environment either through unsafe sanitation of poor hygiene (primary barriers), there are large number of ways they can spread to new hosts, including but not limited to ingestion. Hand washing before handling food is much more widely practiced, than before preparing / handling food, 18 percent does it consistently and only 93 percent wash their hands before eating. The higher incidence of hand washing before eating could be because of the direct and immediate association the need to avoid ingesting dirt (and microbes). While hand washing has definite hygiene value, even when water of intermediate quality is used, the hygiene benefits are much greater when soap is used, and the use of an abrasive (such as ash) yields better results than using water alone. by asking systematic questions about hand washing time (when they wash hands), the response are:
# Washing of hands- After
Always (%)
Sometime (%)
Never (%)
No resp. (%)
1 Wake up in morning 71 15 1 13 2 Take a pee 18 37 37 8 3 Deficate 73 15 12 4 Handled Animals 28 37 34 1 5 Before Eat 93 7 0 0 6 Before food
preparation 97 3 0 0
7 After coming from Outside
6 26 46 23
8 After Cleaning (Houses or yard
30 43 23 4
9 After Wiping children Bottom
24 45 17 14
10 Before go to Bed 16 31 47 6
Further, it was established that consistent hand washing is highest before eating and when hands are dirty , both percent followed by before handling food or cooking and after handling infant faeces 24 percent . It is therefore clear there is little regard for the primary barriers to the spread of faecal borne pathogens but most people make observance of secondary barriers to the spread of faecal borne pathogens .
71
18
73
28
93
97
6
30
24
16
15
37
15
37
7
3
26
43
45
31
1
37
12
34
0
0
46
23
17
47
13
8
1
0
0
23
4
14
6
Wake up in morning
Take a pee
Deficate
Handled Animals
Before Eat
Before food preparation
After coming from Outside
After Cleaning (Houses or yard
After Wiping children Bottom
Before go to Bed
Response for (When wash hands)
No resp. never Sometime Always
AWARENESS AND PRACTICE OF HYGINE 9.7.3
HANDWASHING AT CRITICAL TIMES 9.8
Hand washing at critical times. Table-12
When Wash Hands Chart 25
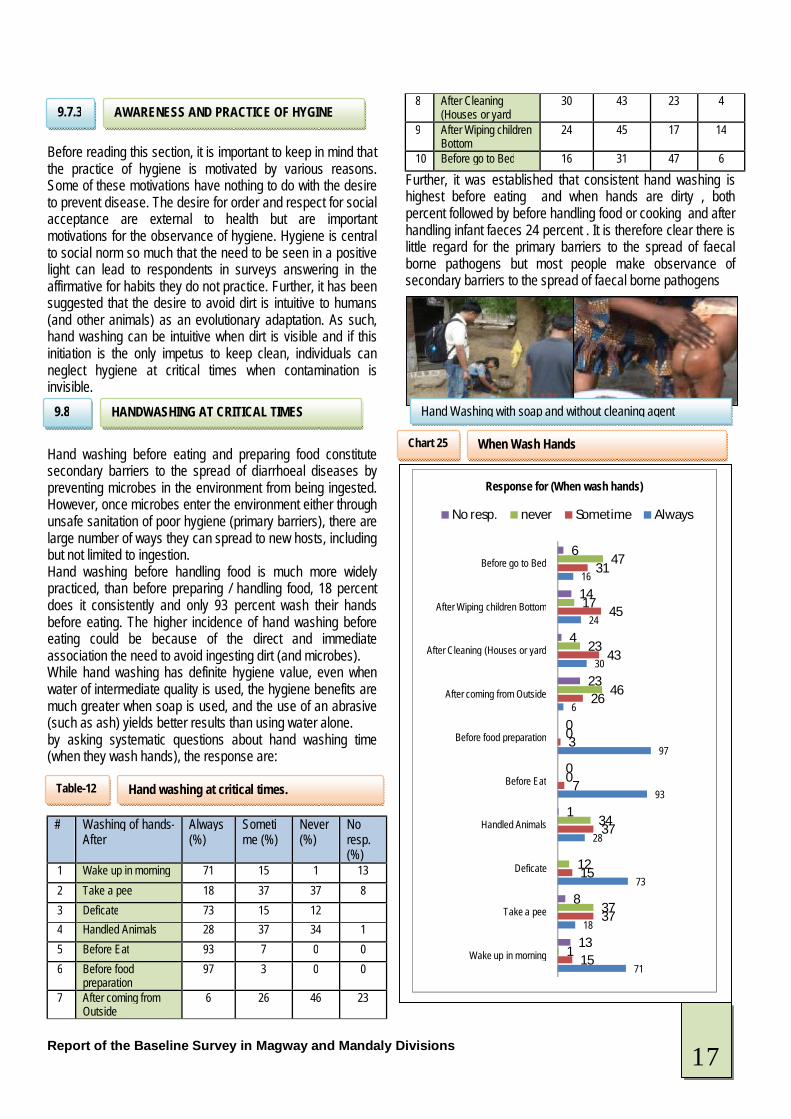
Hand Washing with soap and without cleaning agent
17
Report of the Baseline Survey in Magway and Mandaly Divisions
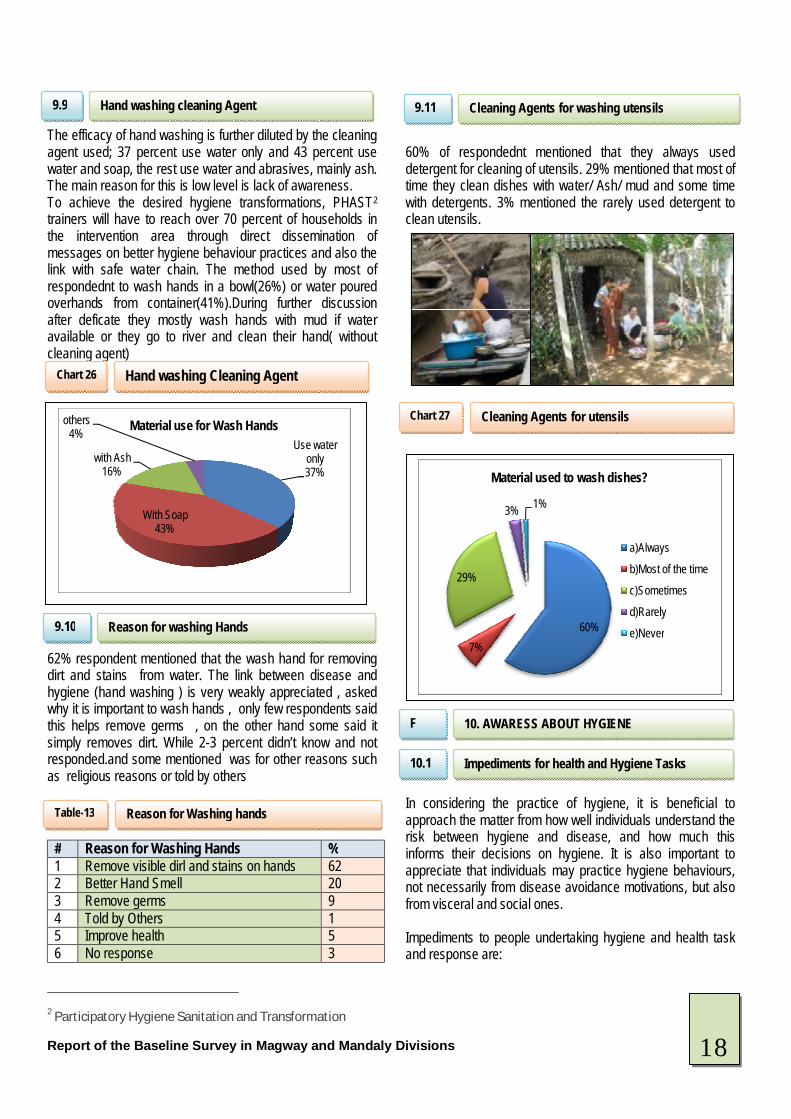
The efficacy of hand washing is further diluted by the cleaning agent used; 37 percent use water only and 43 percent use water and soap, the rest use water and abrasives, mainly ash. The main reason for this is low level is lack of awareness. To achieve the desired hygiene transformations, PHAST2 trainers will have to reach over 70 percent of households in the intervention area through direct dissemination of messages on better hygiene behaviour practices and also the link with safe water chain. The method used by most of respondednt to wash hands in a bowl(26%) or water poured overhands from container(41%).During further discussion after deficate they mostly wash hands with mud if water available or they go to river and clean their hand( without cleaning agent)
62% respondent mentioned that the wash hand for removing dirt and stains from water. The link between disease and hygiene (hand washing ) is very weakly appreciated , asked why it is important to wash hands , only few respondents said this helps remove germs , on the other hand some said it simply removes dirt. While 2-3 percent didn’t know and not responded.and some mentioned was for other reasons such as religious reasons or told by others
# Reason for Washing Hands % 1 Remove visible dirl and stains on hands 62 2 Better Hand Smell 20 3 Remove germs 9 4 Told by Others 1 5 Improve health 5 6 No response 3
2 Participatory Hygiene Sanitation and Transformation
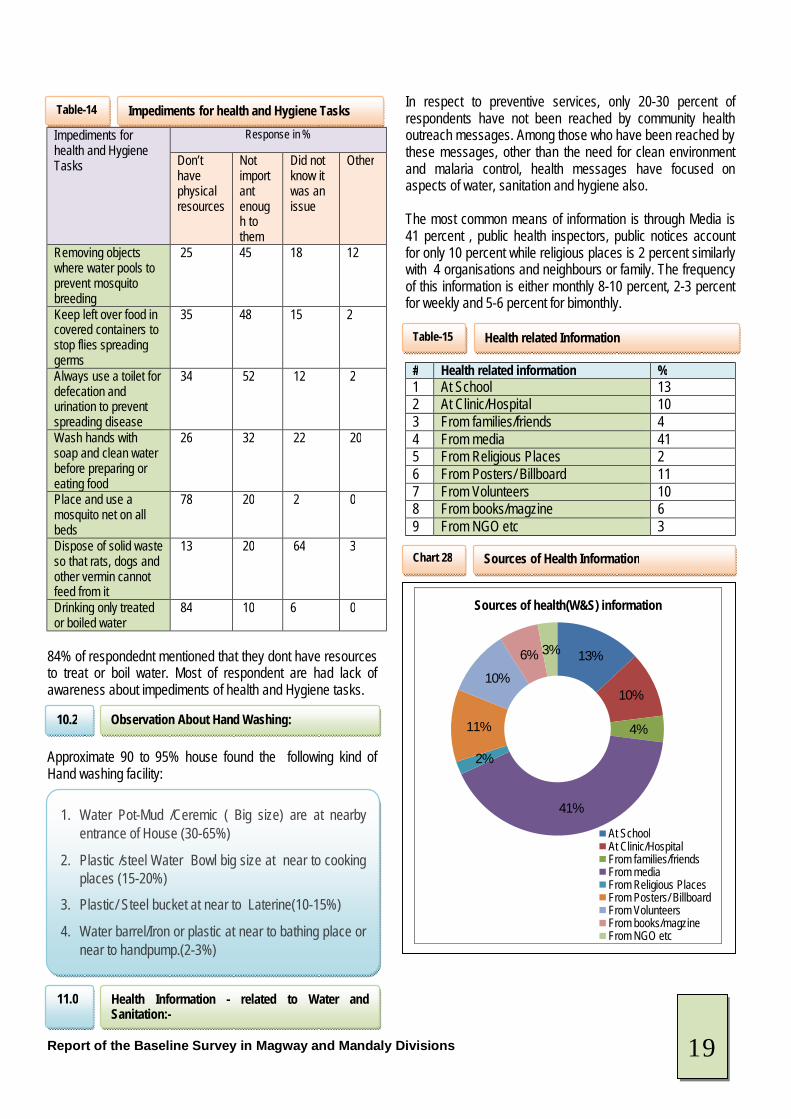
60% of respondednt mentioned that they always used detergent for cleaning of utensils. 29% mentioned that most of time they clean dishes with water/ Ash/ mud and some time with detergents. 3% mentioned the rarely used detergent to clean utensils.
In considering the practice of hygiene, it is beneficial to approach the matter from how well individuals understand the risk between hygiene and disease, and how much this informs their decisions on hygiene. It is also important to appreciate that individuals may practice hygiene behaviours, not necessarily from disease avoidance motivations, but also from visceral and social ones. Impediments to people undertaking hygiene and health task and response are:
Use water only37%
With Soap43%
with Ash16%
others4% Material use for Wash Hands
60%7%
29%
3% 1%
Material used to wash dishes?
a)Always
b)Most of the time
c)Sometimes
d)Rarely
e)Never
Cleaning Agents for utensils Chart 27
Hand washing cleaning Agent 9.9
Hand washing Cleaning Agent Chart 26
Reason for washing Hands 9.10
Reason for Washing hands Table-13
Cleaning Agents for washing utensils 9.11
10. AWARESS ABOUT HYGIENE F
Impediments for health and Hygiene Tasks 10.1
18
Report of the Baseline Survey in Magway and Mandaly Divisions
Impediments for health and Hygiene Tasks
Response in %
Don’t have physical resources
Not important enough to them
Did not know it was an issue
Other
Removing objects where water pools to prevent mosquito breeding
25 45 18 12
Keep left over food in covered containers to stop flies spreading germs
35 48 15 2
Always use a toilet for defecation and urination to prevent spreading disease
34 52 12 2
Wash hands with soap and clean water before preparing or eating food
26 32 22 20
Place and use a mosquito net on all beds
78 20 2 0
Dispose of solid waste so that rats, dogs and other vermin cannot feed from it
13 20 64 3
Drinking only treated or boiled water
84 10 6 0
84% of respondednt mentioned that they dont have resources to treat or boil water. Most of respondent are had lack of awareness about impediments of health and Hygiene tasks. Approximate 90 to 95% house found the following kind of Hand washing facility:
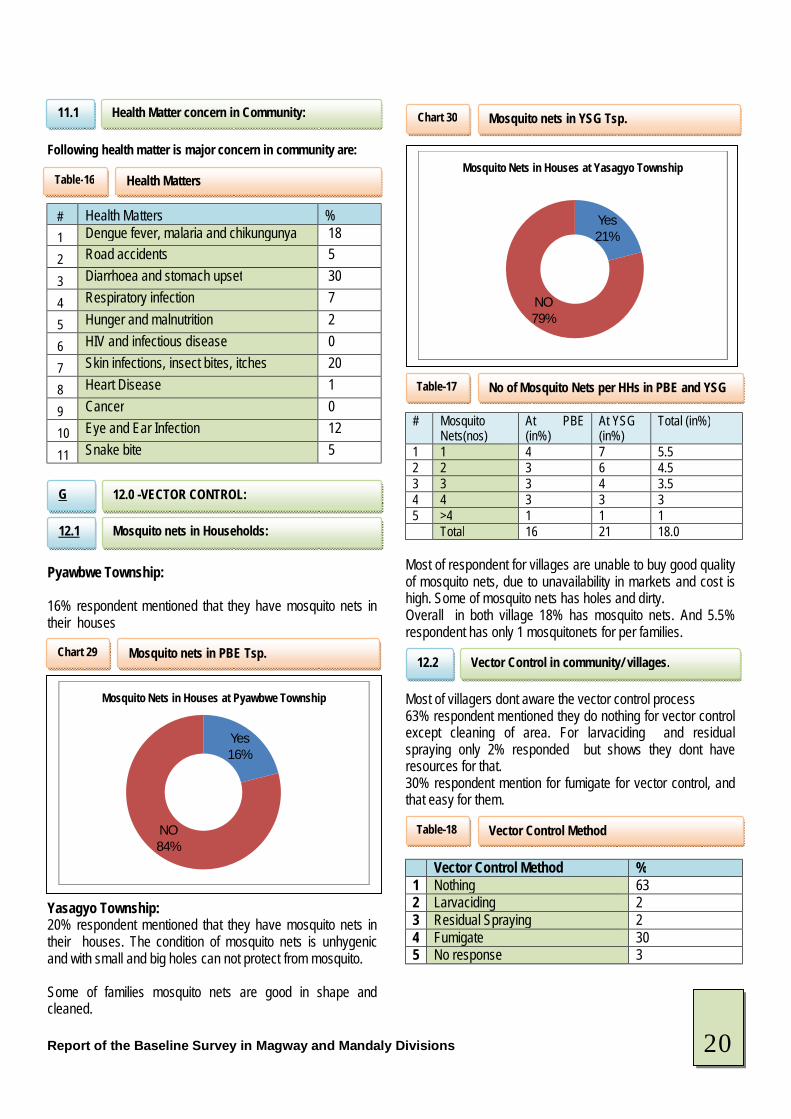
In respect to preventive services, only 20-30 percent of respondents have not been reached by community health outreach messages. Among those who have been reached by these messages, other than the need for clean environment and malaria control, health messages have focused on aspects of water, sanitation and hygiene also. The most common means of information is through Media is 41 percent , public health inspectors, public notices account for only 10 percent while religious places is 2 percent similarly with 4 organisations and neighbours or family. The frequency of this information is either monthly 8-10 percent, 2-3 percent for weekly and 5-6 percent for bimonthly.
# Health related information % 1 At School 13 2 At Clinic/Hospital 10 3 From families/friends 4 4 From media 41 5 From Religious Places 2 6 From Posters/ Billboard 11 7 From Volunteers 10 8 From books/magzine 6 9 From NGO etc 3
13%
10%
4%
41%
2%
11%
10%
6% 3%
Sources of health(W&S) information
At SchoolAt Clinic/HospitalFrom families/friendsFrom mediaFrom Religious PlacesFrom Posters/ BillboardFrom VolunteersFrom books/magzineFrom NGO etc
Impediments for health and Hygiene Tasks Table-14
Observation About Hand Washing:
10.2
1. Water Pot-Mud /Ceremic ( Big size) are at nearby entrance of House (30-65%)
2. Plastic /steel Water Bowl big size at near to cooking places (15-20%)
3. Plastic/ Steel bucket at near to Laterine(10-15%)
4. Water barrel/Iron or plastic at near to bathing place or near to handpump.(2-3%)
Health Information - related to Water and Sanitation:-
11.0
Health related Information Table-15
Sources of Health Information Chart 28
19
Report of the Baseline Survey in Magway and Mandaly Divisions
Following health matter is major concern in community are:
# Health Matters % 1 Dengue fever, malaria and chikungunya 18
2 Road accidents 5
3 Diarrhoea and stomach upset 30
4 Respiratory infection 7
5 Hunger and malnutrition 2
6 HIV and infectious disease 0
7 Skin infections, insect bites, itches 20
8 Heart Disease 1
9 Cancer 0
10 Eye and Ear Infection 12
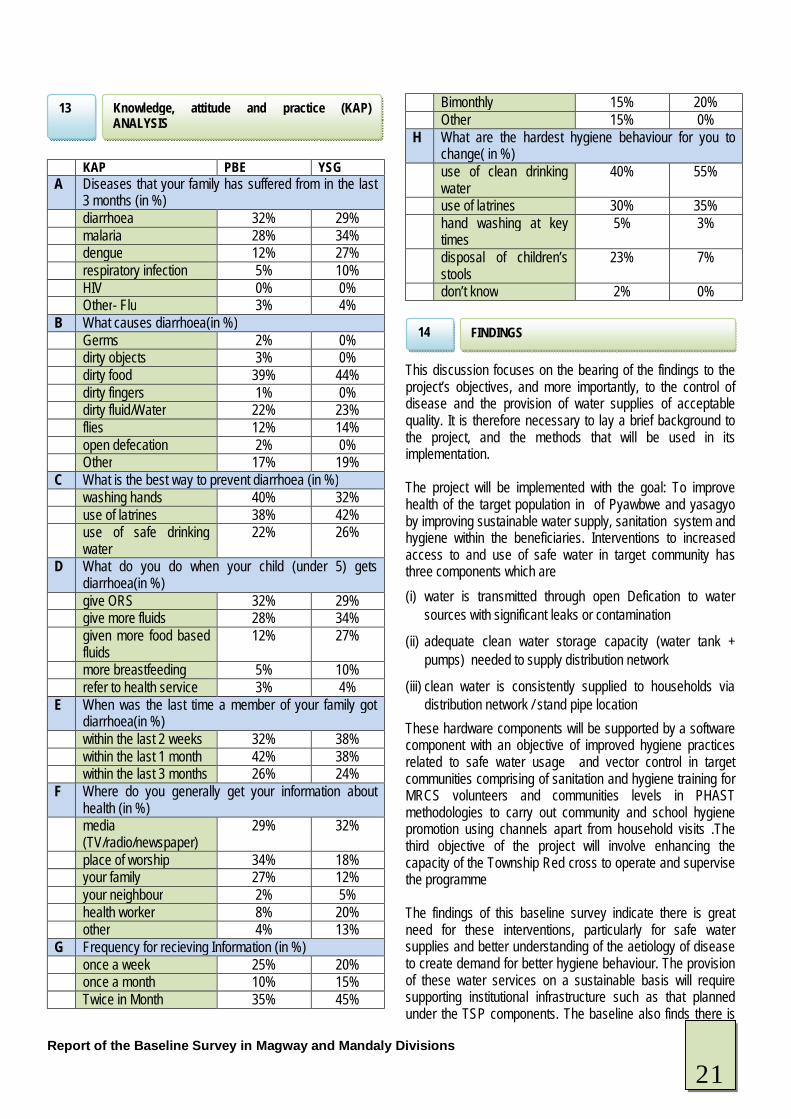
11 Snake bite 5 Pyawbwe Township: 16% respondent mentioned that they have mosquito nets in their houses Yasagyo Township: 20% respondent mentioned that they have mosquito nets in their houses. The condition of mosquito nets is unhygenic and with small and big holes can not protect from mosquito. Some of families mosquito nets are good in shape and cleaned.
# Mosquito Nets(nos)
At PBE (in%)
At YSG (in%)
Total (in%)
1 1 4 7 5.5 2 2 3 6 4.5 3 3 3 4 3.5 4 4 3 3 3 5 >4 1 1 1 Total 16 21 18.0
Most of respondent for villages are unable to buy good quality of mosquito nets, due to unavailability in markets and cost is high. Some of mosquito nets has holes and dirty. Overall in both village 18% has mosquito nets. And 5.5% respondent has only 1 mosquitonets for per families. Most of villagers dont aware the vector control process 63% respondent mentioned they do nothing for vector control except cleaning of area. For larvaciding and residual spraying only 2% responded but shows they dont have resources for that. 30% respondent mention for fumigate for vector control, and that easy for them.
Vector Control Method % 1 Nothing 63 2 Larvaciding 2 3 Residual Spraying 2 4 Fumigate 30 5 No response 3
Yes16%
NO84%
Mosquito Nets in Houses at Pyawbwe Township
Health Matter concern in Community:
11.1
Health Matters Table-16
12.0 -VECTOR CONTROL: G
Mosquito nets in Households: :
12.1
Mosquito nets in PBE Tsp. Chart 29
No of Mosquito Nets per HHs in PBE and YSG Table-17
Yes21%
NO79%
Mosquito Nets in Houses at Yasagyo Township
Vector Control in community/ villages.
12.2
Vector Control Method Table-18
Mosquito nets in YSG Tsp. Chart 30
20
Report of the Baseline Survey in Magway and Mandaly Divisions
KAP PBE YSG A Diseases that your family has suffered from in the last
3 months (in %) diarrhoea 32% 29% malaria 28% 34% dengue 12% 27% respiratory infection 5% 10% HIV 0% 0% Other- Flu 3% 4% B What causes diarrhoea(in %) Germs 2% 0% dirty objects 3% 0% dirty food 39% 44% dirty fingers 1% 0% dirty fluid/Water 22% 23% flies 12% 14% open defecation 2% 0% Other 17% 19% C What is the best way to prevent diarrhoea (in %) washing hands 40% 32% use of latrines 38% 42% use of safe drinking
water 22% 26%
D What do you do when your child (under 5) gets diarrhoea(in %)
give ORS 32% 29% give more fluids 28% 34% given more food based
fluids 12% 27%
more breastfeeding 5% 10% refer to health service 3% 4% E When was the last time a member of your family got
diarrhoea(in %) within the last 2 weeks 32% 38% within the last 1 month 42% 38% within the last 3 months 26% 24% F Where do you generally get your information about
health (in %) media
(TV/radio/newspaper) 29% 32%
place of worship 34% 18% your family 27% 12% your neighbour 2% 5% health worker 8% 20% other 4% 13% G Frequency for recieving Information (in %) once a week 25% 20% once a month 10% 15% Twice in Month 35% 45%
Bimonthly 15% 20% Other 15% 0% H What are the hardest hygiene behaviour for you to
change( in %) use of clean drinking
water 40% 55%
use of latrines 30% 35% hand washing at key
times 5% 3%
disposal of children’s stools
23% 7%
don’t know 2% 0% This discussion focuses on the bearing of the findings to the project’s objectives, and more importantly, to the control of disease and the provision of water supplies of acceptable quality. It is therefore necessary to lay a brief background to the project, and the methods that will be used in its implementation. The project will be implemented with the goal: To improve health of the target population in of Pyawbwe and yasagyo by improving sustainable water supply, sanitation system and hygiene within the beneficiaries. Interventions to increased access to and use of safe water in target community has three components which are (i) water is transmitted through open Defication to water
sources with significant leaks or contamination
(ii) adequate clean water storage capacity (water tank + pumps) needed to supply distribution network
(iii) clean water is consistently supplied to households via distribution network / stand pipe location
These hardware components will be supported by a software component with an objective of improved hygiene practices related to safe water usage and vector control in target communities comprising of sanitation and hygiene training for MRCS volunteers and communities levels in PHAST methodologies to carry out community and school hygiene promotion using channels apart from household visits .The third objective of the project will involve enhancing the capacity of the Township Red cross to operate and supervise the programme The findings of this baseline survey indicate there is great need for these interventions, particularly for safe water supplies and better understanding of the aetiology of disease to create demand for better hygiene behaviour. The provision of these water services on a sustainable basis will require supporting institutional infrastructure such as that planned under the TSP components. The baseline also finds there is
Knowledge, attitude and practice (KAP) ANALYSIS
13
FINDINGS 14
21
Report of the Baseline Survey in Magway and Mandaly Divisions
demand for these components, particularly capacity building in maintenance and operations. The need for O&M capacity will become even more critical with the construction of distribution network and the storage tank with community contribution will be required. The findings of the survey in respect to the three core components i.e. water,sanitation, hygiene and management capacity.; The water supplies is characterised by a high degree of use of unsafe water sources which are also seasonal, with pronounced water shortages in the dry season. These shortages are exacerbated by the increased cost of water in the dry season. The seasonal patterns consist of high usage of generally cost free surface water in the wet season. Protected and unprotected shallow wells are therefore the main water supplies in the dry season, used by 30 and 29 percent of households respectively. The number of households purchasing water from vendors (trucks and vendors) 6-9 percent increases during the dry season. This creates incentive to reduce consumption especially during the dry season. The 27 percent of households using boreholes also increases. Reducing seasonal shocks as well as ensuring safety in water supplies is therefore a priority transformation. These seasonal changes are not only damaging to health and welfare, but they also threaten the benefits of any hygiene and sanitation training carried out among the communities; The practice of hygiene will definitely be impacted by dry season water shortages and the recovery with increased availability of water in the next water season will definitely be to a lesser degree. Further water supply needs to be stabilised to reduce the risk of water washed diseases, which comprise a substantial part of the morbidity burden. Another parameter of importance to the implementation of the project is user preference in water supplies. The unprotected shallow wells, protected wells and communal boreholes are the most preferred water supplies in that order. The strongest preference criteria parameters are time, safety, distance and improved health. While cleanness is the strongest preference criteria, the second and third criteria proximity and time imply that households will use whatever water is available simply because there are no choices. This means that for water supply improvements to have the desired impact, they must be available within reasonable distance and cost, and be available all year round. The proportion of households that have to pay for water all year round rises dramatically by at least 50%.It will be important to examine the willingness to pay for water as the need for user fees through billing will become more critical to ensure sustainable operation. The current cost of water ranges between10-20 Kyat; Further, it is important to take note that households try avoiding paying for water when it can
be accessed for no cost, therefore, the number of households using water from vendors and water bullock cart is very low in the wet season. Considering the price sensitivity of water consumers, they must also offer other tangible benefits such as safety, consistency, proximity and cost. The sustainable management of water points sought by the intervention will very much depend on good financial management as much as technical measures. The charging of water by monthly must balance the need for cost recovery and the need to ensure that cost does become a barrier to access. In terms of water consumption, quality and quantity are the primary factors in terms of health outcomes. It established that quality of most water is poor. In terms of quantity, there is need to maintain the mean daily per capita consumption of over 20 litres per person per day benchmark of consumption levels which are needed to meet basic hygiene and consumption needs . Water availability has implications on the ability of individuals to practice proper hygiene, creating especially conducive conditions for the spread of water washed diseases such as skin diseases, which are quite prevalent. However, at the current low levels of awareness on certain aspects of hygiene, lack of water is not the only reason hygiene standards are poor. The quantity of water supply must be increased in tandem with hygiene promotion to ensure there is enough water for individuals to practice what they learn. While there are strong indications, there other reasons for poor hygiene, the lack of sufficient water compounds the problem by constraining hygiene when and if demand for it is present.
Domestic water handling and storage is critical in the safety of drinking water supplies, if done unhygienic ally, it can contaminate water that was previously safe, negating the benefits of developing safer water sources. Efforts to improve water therefore need to be simultaneously undertaken both at the point of use and supply. Only 3 percent of households consistently treat their drinking water, and the main reasons cited by those who don’t were that it’s too expensive 43 percent and don’t know how to 6percent. 51 percent said it is not important, illustrating an opportunity for substantial changes through awareness creation which would also address those who don’t know how to treat. The cost impediment has to do with the need to purchase fuel for boiling, or treatment tablets ,even where wood fuels is used , there is an expense in the time used to collect it and boil the water . A water filter option would address these issues, but for a filter to effectively substitute boiling or chemical disinfection, it must meet the relevant safety standards. For a sterile water filter the standard is an effective pore size between of .01 micron and .45 microns. Filters with effective pore sizes between .45 micron and 1.0 micron are considered to be bacteriologic ally safe. This can be an option to be explored by the project for those families
Water Supply 14.1
Domestic Water handling 14.2
22
Report of the Baseline Survey in Magway and Mandaly Divisions
that will not be able to afford to connect up to the water supply system despite subsidization. Further, as ceramic filters can leave residual levels of bacteria it is imperative that filtered water be stored very safely to reduce multiplication of these residual pathogens to infectious levels. Interventions that manage to improve water quality at source will have their impact diluted by contamination in transit and storage, with a concomitant reduction on their impact in reducing diarrhoeal diseases. Regarding these, the survey found that water storage and handling in the house are poor. While 67 percent of households store their drinking water in a metallic pot or jerry can which being narrow necked container reduces the possibility of in house contamination, with 17 percent of these containers were observed to be uncovered and not clean. There are numerous opportunities for contamination of water in storage or handling, a risk amplified by the poor hand washing behaviour enumerated in this survey. In any case, only 31 percent of households consistently treat their drinking water, the main some of these methods such as filtration and sedimentation have negligible impact in reducing micro organic pathogens, but can remove some larger pathogens. The main impediments cited in this regard were the expense and lack of knowledge on how to do it. Therefore, considering the water sources used by households, supplies are very likely to have been contaminated at source let alone within the household. The survey indicates that no water management structures in villages and or weak and poorly supported by the community. The main complaint was being delays in repairing water points (there are very many broken wells), and failure to keep the water point clean. Operational and maintenance weaknesses are of specific concern, considering the water supply proposed to be implemented by the project. Failure to keep water points clean may well negate the benefits of increased water supplies. The management structures in place are predominantly community elders and water committees, and they may very well lack the technical capacity to implement their mandate. Community support for these structures and O&M at water points is also weak.
Food Hygiene There is relative good practice with food being prepared just before eating or the morning before eating this reduces the risk of food poisoning. However as indicated previously, the practice of hand washing with water and soap and more so before handling food is low. While on food storage only 12 percent do not cover the food and this is stored outside.
On environmental hygiene, indicators in this theme are average of 46 percent households had either human or animal defecation in the compound at the time of the survey, increasing the risk of disease transmission within the household. Garbage disposal is predominantly by crude dumping or burning with 34 and 35 percent of households respectively applying these methods thereby creating a favourable environment for vermin and insect vectors. 89 Percent said rats were a problem and the figure was confirmed to be higher. With 20 percent indicating lack of knowledge on what disease rats spread .But even the 80 percent could not mention the specific disease. Other aspects of sanitation, namely the disposal of infant’s faeces are equally poor; only 28 percent of households, put infant are faeces in the latrine .The main disposal method is dumping in the open or drains thus a health hazard.
A majority of both men and women do not own latrine and only 38 percent have their own latrine but during the feedback session on access to latrines they reported the access was lower with only about 15percent having own latrines. What they reported was the most commonly used method was cat method and bushes. However the survey data indicates at least 72 percent use neighbourhood concept with families sharing one latrine. There is every little gender differentiation on the method or place of defecation. But what is obvious is that there over 180 households indicated they use cat method for the children under five which is a health risk. On latrine usage 38 percent of the latrines were not clean and there were signs of urine or faeces and the main reason cited were low level of awareness. While only 72 percent of the latrine were cleaned daily. Access to sanitation is included in the project objective hence budget allocation made for this. On school water, sanitation and hygiene situation all the eight schools within the target area were surveyed. On access to safe water, three school use shallow communal wells and the quality of the water is not guaranteed. The water is saline. On latrine coverage all school has zero access or dilapidated in nature. Where latrines are available they were not cleaned and it was not clear who was responsible. In addition there was no soap available for hand washing except in one school and even there the soap was not used. While on waste disposal all schools have no dustbins.
Water Management Structure at Village Levels 14.3
Hygiene and sanitation indicators 14.3
Sanitation 14.4
On School Water,Sanitation and Hygine Situation
14.5
23
Report of the Baseline Survey in Magway and Mandaly Divisions
The survey concludes that residents in the target area are exposed to multiple paths of infection, some of which are opened by poor infrastructure and others by poor knowledge and hygiene practice. The following are the main findings of the survey; Contamination of water at source and within the household is exposing residents to water borne transmission and measures to prevent both are required .To prevent contamination at source , it is necessary to improve sanitation and conservation measures , while at the household level , improvements in storage and handling are required , coupled with the household treatment to ensure safe drinking water. In promoting household treatment, provision of low cost options will be critical to sustained uptake of the safeguard. Although water usage per capita is fair, the sources are polluted thus placing individuals and communities at risk of water washed diseases. Increasing safe water supplies will reduce this risk coupled with better personal hygiene, which nevertheless has to be actively promoted. Poor sanitation is posing a threat to water supplies and its presence in the domestic arena especially that of infants is presenting additional risk, including encouraging insect vectors. Low levels of overall sanitation are also putting households that have invested in proper sanitation at risk because vectors move freely between compounds as cited with the rats, mosquito and flies problem. Improved sanitation for individual households will have to be matched by much wider coverage for full benefits to accrue. Poor hygiene is as much a product of poor awareness as it is a result of lack of necessary facilities. Hygiene promotion will have to be matched by provision of better sanitation and water services. On a balance of probabilities, primary barriers, namely proper sanitation and hand washing after defecation or handling infant’s faeces are more critical to the control of diarrheal disease.
To track the effect of improved water and sanitation and enable the use of disease patterns in fine tuning the
intervention, it is necessary to collect disease incidence data at health centres, and also using PHAST trainers record sheets. Much greater impact will be achieved if available resources are allocated for subsides for water connections since the majority of the expected beneficiaries are poor estimated to be over 65 percent by Pradeshiya Sabah existing data and may not afford to connect up to the water supply system within the lifespan of the project. However for those households which cannot still connect up, alternatives may be sought such as introduction of ceramic water filters to maximise on their efficacy. On sanitation the project has no component to fully address access to sanitary latrines yet hygiene promotion benefits can only be realised if access to sanitary latrines is addressed. Efforts will be made through hygiene promotion to encourage the households without access to look for alternative donors since this is a glaring gap which by all means needs to be addressed to add value to the existing project and the beneficiaries’ lives Based on the findings, the following recommendations are made to target actions at areas which have the comparative impact in reducing water related diseases, improve access to safe water and key hygiene practices. Development of water supply system focusing on improving per capita water consumption, and ensuring water supply is acceptable quality. This will require; § The construction of the water supply system is intended to
reach at least 70 per cent of the population of in yasagyo and pyabwe selected 10 villages.This will stabilise, and increase the capacity and quality of the water.
§ For the households who will not have access or will prefer to use the existing traditional water sources actions will include installation of conservation measures to stop water contamination at source thus sustain safe water chain. Communities shall also be encouraged to use protected water supplies in preference to other sources
Conclusions 15
RISKS EMANATING FROM THE WATER
15.1
RISKS EMANATING FROM POOR SANITATION 15.2
RISKS EMANATING FROM POOR HYGIENE 15.3
MONITORING AND EVALUATION CONSIDERATION
16
DESIGN CONSIDERATIONS 17
RECOMMENDATIONS 18
FACILITATING HEALTH THROUGH IMPROVED WATER SUPPLY
18.1
24
Report of the Baseline Survey in Magway and Mandaly Divisions
§ For sustainability in improvements to water supply, the MRCS will be trained on community on management issues, and provided with technical capacity through training of local technicians to carry out maintenance and repair work..
§ To prevent water contamination in the household, safe water handling, treatment and storage shall be promoted among the target communities.
Although the project has no component on provision of sanitary latrines, safe sanitation shall be promoted so that in conjunction with good hygiene, pathogens shall be prevented from entering the living environment and spreading to new hosts. The project will partner with the Pradeshiya Sabah, the MOH and DHO and other stakeholders together with the local communities in conducting periodic clean up campaigns and community health awareness promotions using various multi media channels and also the conventional ones such as use of religious places. § Hygiene promotion shall be carried out through the PHAST
methodology and shall place particular emphasis on primary barriers to disease spread i.e. safe sanitation and hand washing after contact with faeces. Emphasis will also be placed on domestic hygiene, food and water handling through encouraging cleanups, safe water storage, construction of dish racks and food cupboards etc.
§ Hygiene and Sanitation Awareness/Training shall be carried out at schools to address risk factors manifest there.Further , the intervention shall take measures to ensure all schools in the intervention area are provided with safe and sanitary facilities
To demonstrate the impact on improved hygiene health outcomes, PHAST trainers/ RCV volunteers shall maintain records on disease incidence among beneficiary households and schools, including the extent to which households are adopting various counter disease measures. The intervention shall also work with midwifes/ nurses/ teachers to maintain aggregated community level disease incidence data. This data shall be used to gauge the efficacy of various measures and adjust intervention as appropriate. In totality, these recommendations, if implemented with other project components will provide protection from most routes
of infection and therefore reduce the incidence of water elated disease.
FACILITATING HEALTH THROUGH IMPROVED SANITATION
18.2
IMPROVING HEALTH THROUGH HYGIENE 18.3
MONITORING AND EVALUATION 18.4
25
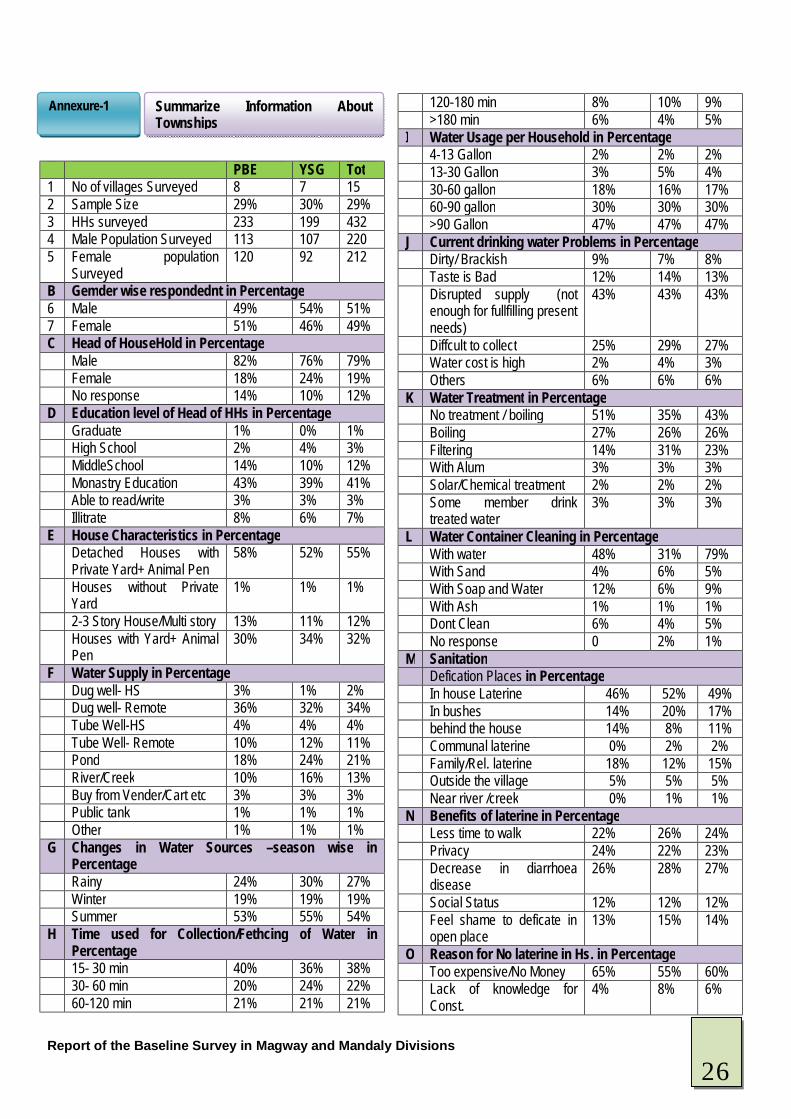
Report of the Baseline Survey in Magway and Mandaly Divisions
PBE YSG Tot 1 No of villages Surveyed 8 7 15 2 Sample Size 29% 30% 29% 3 HHs surveyed 233 199 432 4 Male Population Surveyed 113 107 220 5 Female population
Surveyed 120 92 212
B Gemder wise respondednt in Percentage 6 Male 49% 54% 51% 7 Female 51% 46% 49% C Head of HouseHold in Percentage Male 82% 76% 79% Female 18% 24% 19% No response 14% 10% 12% D Education level of Head of HHs in Percentage Graduate 1% 0% 1% High School 2% 4% 3% MiddleSchool 14% 10% 12% Monastry Education 43% 39% 41% Able to read/write 3% 3% 3% Illitrate 8% 6% 7% E House Characteristics in Percentage Detached Houses with
Private Yard+ Animal Pen 58% 52% 55%
Houses without Private Yard
1% 1% 1%
2-3 Story House/Multi story 13% 11% 12% Houses with Yard+ Animal
Pen 30% 34% 32%
F Water Supply in Percentage Dug well- HS 3% 1% 2% Dug well- Remote 36% 32% 34% Tube Well-HS 4% 4% 4% Tube Well- Remote 10% 12% 11% Pond 18% 24% 21% River/Creek 10% 16% 13% Buy from Vender/Cart etc 3% 3% 3% Public tank 1% 1% 1% Other 1% 1% 1% G Changes in Water Sources –season wise in
Percentage Rainy 24% 30% 27% Winter 19% 19% 19% Summer 53% 55% 54% H Time used for Collection/Fethcing of Water in
Percentage 15- 30 min 40% 36% 38% 30- 60 min 20% 24% 22% 60-120 min 21% 21% 21%
120-180 min 8% 10% 9% >180 min 6% 4% 5% I Water Usage per Household in Percentage 4-13 Gallon 2% 2% 2% 13-30 Gallon 3% 5% 4% 30-60 gallon 18% 16% 17% 60-90 gallon 30% 30% 30% >90 Gallon 47% 47% 47% J Current drinking water Problems in Percentage Dirty/ Brackish 9% 7% 8% Taste is Bad 12% 14% 13% Disrupted supply (not
enough for fullfilling present needs)
43% 43% 43%
Diffcult to collect 25% 29% 27% Water cost is high 2% 4% 3% Others 6% 6% 6% K Water Treatment in Percentage No treatment / boiling 51% 35% 43% Boiling 27% 26% 26% Filtering 14% 31% 23% With Alum 3% 3% 3% Solar/Chemical treatment 2% 2% 2% Some member drink
treated water 3% 3% 3%
L Water Container Cleaning in Percentage With water 48% 31% 79% With Sand 4% 6% 5% With Soap and Water 12% 6% 9% With Ash 1% 1% 1% Dont Clean 6% 4% 5% No response 0 2% 1% M Sanitation Defication Places in Percentage In house Laterine 46% 52% 49% In bushes 14% 20% 17% behind the house 14% 8% 11% Communal laterine 0% 2% 2% Family/Rel. laterine 18% 12% 15% Outside the village 5% 5% 5% Near river /creek 0% 1% 1% N Benefits of laterine in Percentage Less time to walk 22% 26% 24% Privacy 24% 22% 23% Decrease in diarrhoea
disease 26% 28% 27%
Social Status 12% 12% 12% Feel shame to deficate in
open place 13% 15% 14%
O Reason for No laterine in Hs. in Percentage Too expensive/No Money 65% 55% 60% Lack of knowledge for
Const. 4% 8% 6%
Summarize Information About Townships
Annexure-1
26
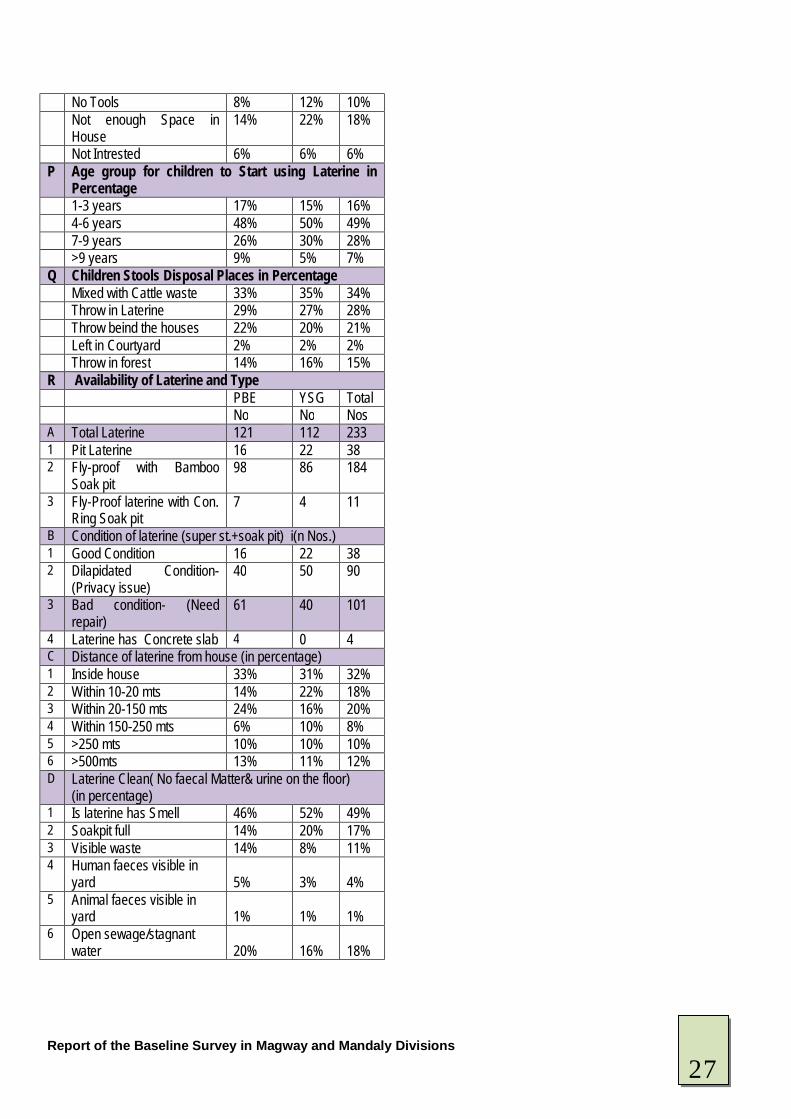
Report of the Baseline Survey in Magway and Mandaly Divisions
No Tools 8% 12% 10% Not enough Space in
House 14% 22% 18%
Not Intrested 6% 6% 6% P Age group for children to Start using Laterine in
Percentage 1-3 years 17% 15% 16% 4-6 years 48% 50% 49% 7-9 years 26% 30% 28% >9 years 9% 5% 7% Q Children Stools Disposal Places in Percentage Mixed with Cattle waste 33% 35% 34% Throw in Laterine 29% 27% 28% Throw beind the houses 22% 20% 21% Left in Courtyard 2% 2% 2% Throw in forest 14% 16% 15% R Availability of Laterine and Type PBE YSG Total No No Nos A Total Laterine 121 112 233 1 Pit Laterine 16 22 38 2 Fly-proof with Bamboo
Soak pit 98 86 184
3 Fly-Proof laterine with Con. Ring Soak pit
7 4 11
B Condition of laterine (super st.+soak pit) i(n Nos.) 1 Good Condition 16 22 38 2 Dilapidated Condition-
(Privacy issue) 40 50 90
3 Bad condition- (Need repair)
61 40 101
4 Laterine has Concrete slab 4 0 4 C Distance of laterine from house (in percentage) 1 Inside house 33% 31% 32% 2 Within 10-20 mts 14% 22% 18% 3 Within 20-150 mts 24% 16% 20% 4 Within 150-250 mts 6% 10% 8% 5 >250 mts 10% 10% 10% 6 >500mts 13% 11% 12% D Laterine Clean( No faecal Matter& urine on the floor)
(in percentage) 1 Is laterine has Smell 46% 52% 49% 2 Soakpit full 14% 20% 17% 3 Visible waste 14% 8% 11% 4 Human faeces visible in
yard 5%
3% 4%
5 Animal faeces visible in yard 1%
1% 1%
6 Open sewage/stagnant water 20%
16% 18%
27
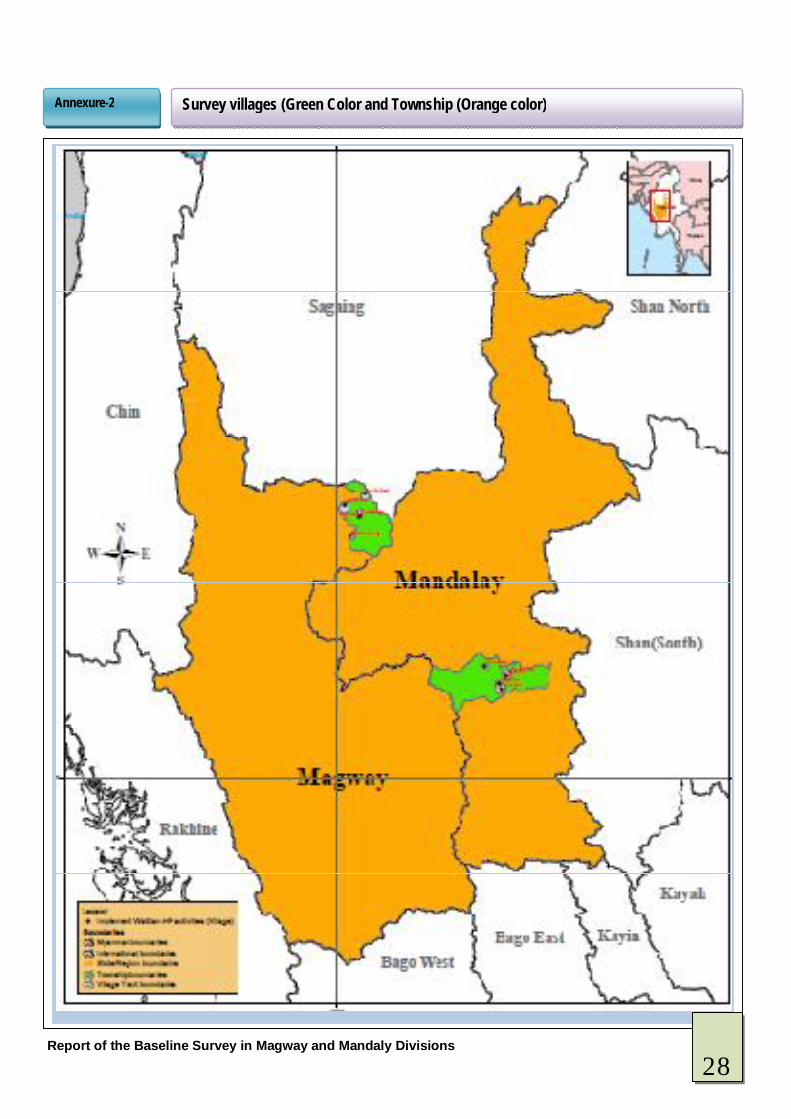
Report of the Baseline Survey in Magway and Mandaly Divisions
Survey villages (Green Color and Township (Orange color) Annexure-2
28
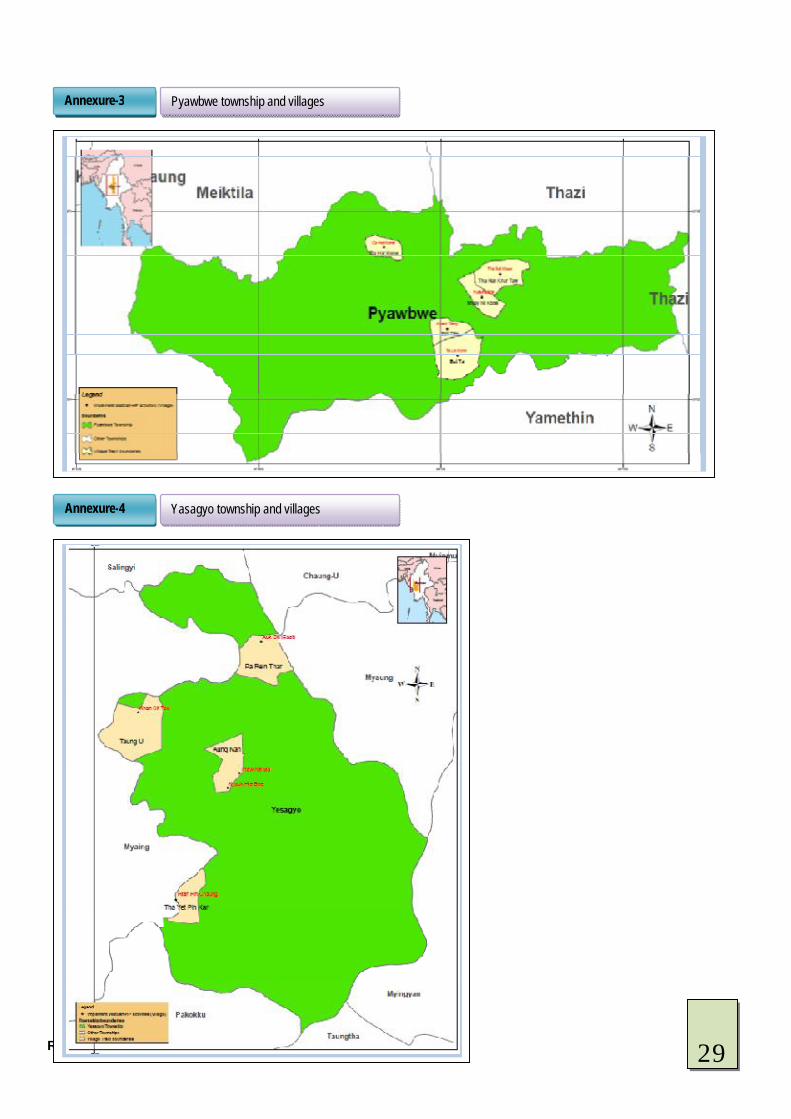
Report of the Baseline Survey in Magway and Mandaly Divisions
Pyawbwe township and villages Annexure-3
Yasagyo township and villages Annexure-4
29
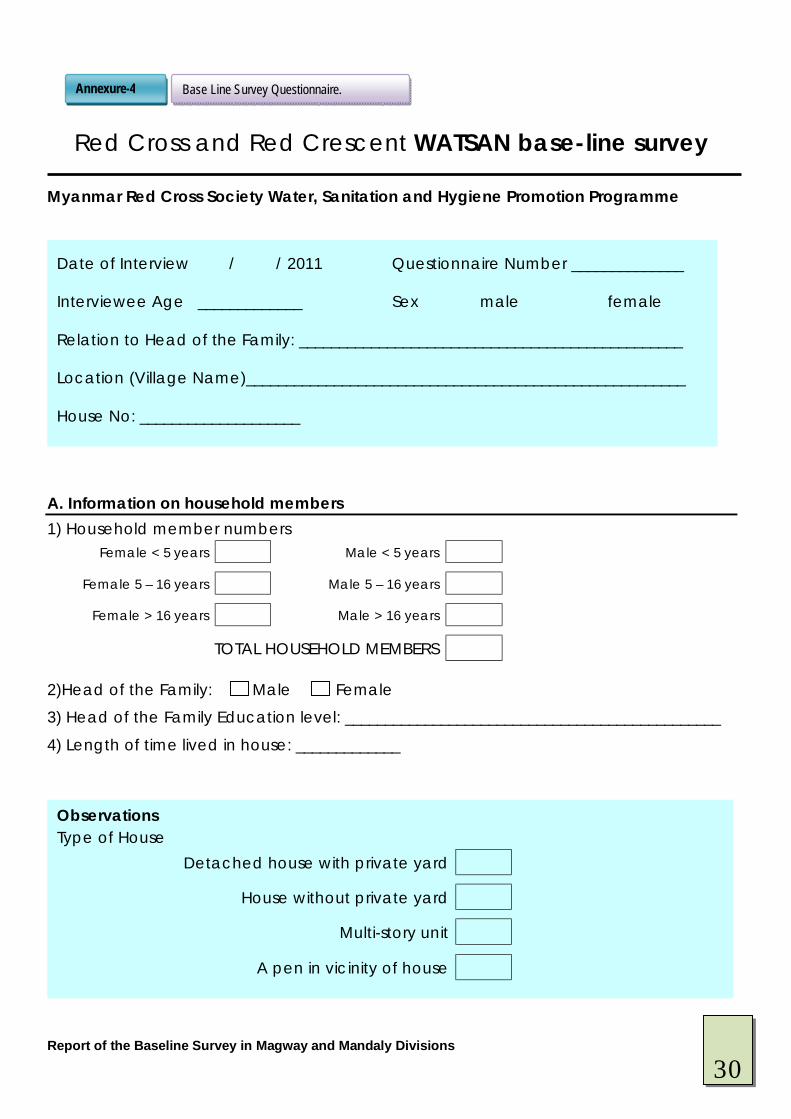
Report of the Baseline Survey in Magway and Mandaly Divisions
Red Cross and Red Crescent WATSAN base-line survey
Myanmar Red Cross Society Water, Sanitation and Hygiene Promotion Programme
A. Information on household members 1) Household member numbers
Female < 5 years Male < 5 years
Female 5 – 16 years Male 5 – 16 years
Female > 16 years Male > 16 years
TOTAL HOUSEHOLD MEMBERS 2)Head of the Family: Male Female
3) Head of the Family Education level: _______________________________________________
4) Length of time lived in house: _____________
Base Line Survey Questionnaire. Annexure-4
Observations Type of House
Detached house with private yard
House without private yard
Multi-story unit
A pen in vicinity of house
v v
Date of Interview / / 2011 Questionnaire Number ______________
Interviewee Age _____________ Sex male female
Relation to Head of the Family: ________________________________________________
Location (Village Name)_______________________________________________________
House No: ____________________
30
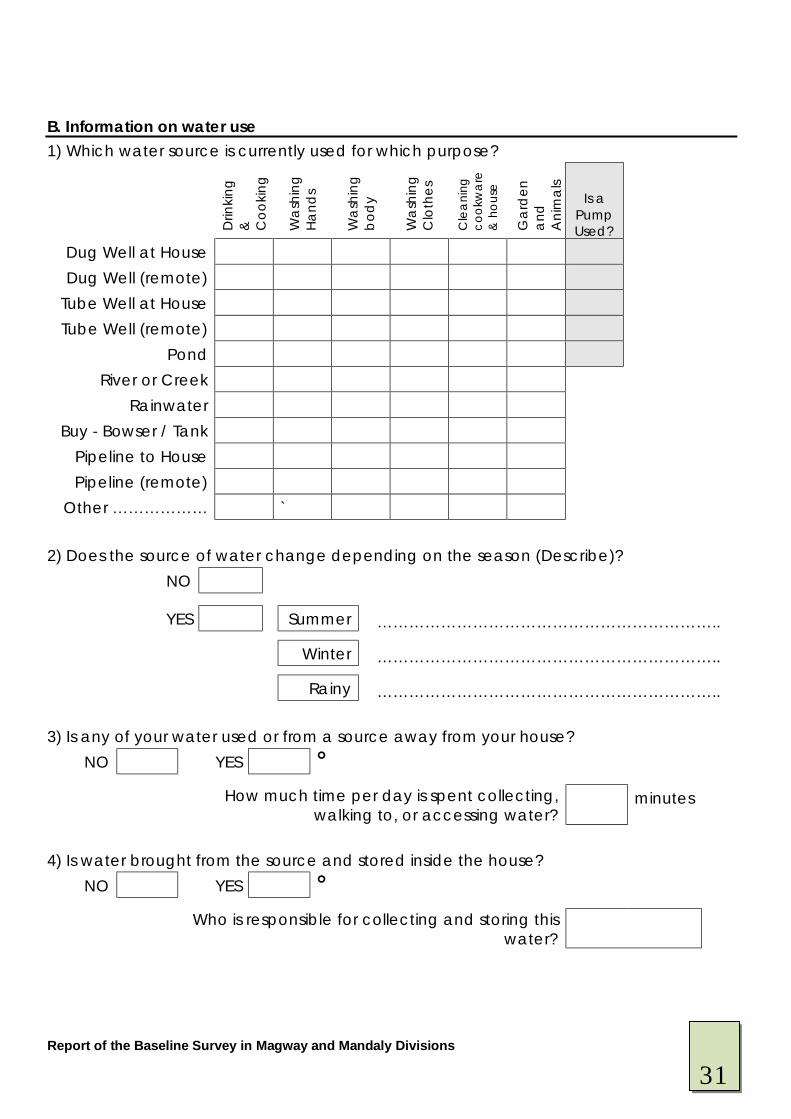
Report of the Baseline Survey in Magway and Mandaly Divisions
B. Information on water use 1) Which water source is currently used for which purpose?
D
rinki
ng
&
Coo
king
Wa
shin
g H
and
s
Wa
shin
g b
ody
Wa
shin
g C
loth
es
Cle
ani
ng
cook
wa
re
& h
ouse
Gar
den
a
nd
Ani
ma
ls
Is a Pump Used?
Dug Well at House Dug Well (remote)
Tube Well at House Tube Well (remote)
Pond River or Creek
Rainwater Buy - Bowser / Tank
Pipeline to House Pipeline (remote)
Other ……………… ` 2) Does the source of water change depending on the season (Describe)?
NO
YES Summer ………………………………………………………..
Winter ………………………………………………………..
Rainy ……………………………………………………….. 3) Is any of your water used or from a source away from your house?
NO YES Ê
How much time per day is spent collecting, walking to, or accessing water?
minutes
4) Is water brought from the source and stored inside the house?
NO YES Ê
Who is responsible for collecting and storing this water?
31
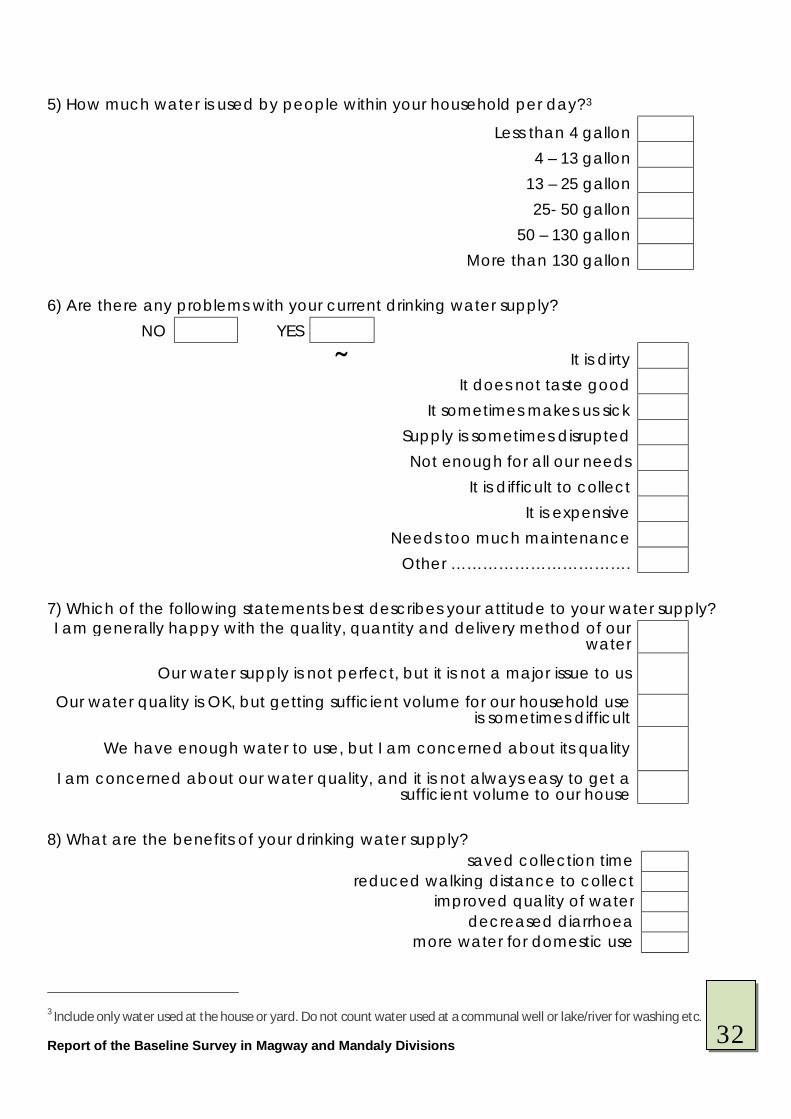
Report of the Baseline Survey in Magway and Mandaly Divisions
5) How much water is used by people within your household per day?3
Less than 4 gallon
4 – 13 gallon
13 – 25 gallon
25- 50 gallon
50 – 130 gallon
More than 130 gallon 6) Are there any problems with your current drinking water supply?
NO YES Ä It is dirty
It does not taste good
It sometimes makes us sick
Supply is sometimes disrupted
Not enough for all our needs
It is difficult to collect
It is expensive
Needs too much maintenance
Other …………………………….
7) Which of the following statements best describes your attitude to your water supply? I am generally happy with the quality, quantity and delivery method of our
water
Our water supply is not perfect, but it is not a major issue to us
Our water quality is OK, but getting sufficient volume for our household use is sometimes difficult
We have enough water to use, but I am concerned about its quality
I am concerned about our water quality, and it is not always easy to get a sufficient volume to our house
8) What are the benefits of your drinking water supply?
saved collection time reduced walking distance to collect
improved quality of water decreased diarrhoea
more water for domestic use 3 Include only water used at the house or yard. Do not count water used at a communal well or lake/river for washing etc.
32

Report of the Baseline Survey in Magway and Mandaly Divisions
9) Do you treat your water supply before drinking it?
No Yes, boil it Yes, filter it
Yes, other treatment (chemical, solar) ONLY SOME MEMBERS OF THE HOUSEHOLD DRINK TREATED WATER
10) If you don’t treat your water what is the reason it is expensive
No need It is safe
Other ………………..
11) What do you clean your drinking water container with? soap and water
water ash
sand don’t clean don’t know other ……..
C. Financing water supplies 1) How much did/do you contribute towards the initial costs, installation, repairs of the water point?
…………………………… Kayt □ per month □ per year D. Information on Sanitation 1) Does your household have a latrine?
Yes No 2) Where do different people defecate?3
Women Men Children over 5
Children under 5
Latrine in House In the bush
Near River/Creek Communal Latrine
33
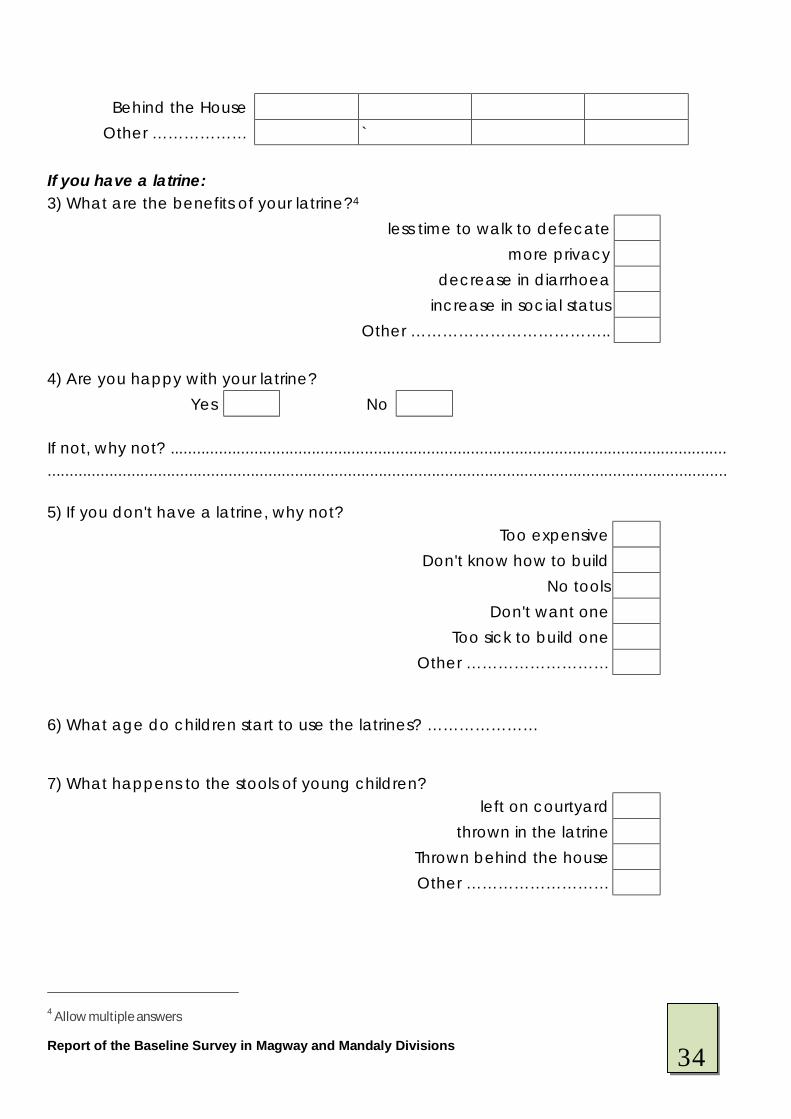
Report of the Baseline Survey in Magway and Mandaly Divisions
Behind the House Other ……………… `
If you have a latrine: 3) What are the benefits of your latrine?4
less time to walk to defecate more privacy
decrease in diarrhoea increase in social status
Other ……………………………….. 4) Are you happy with your latrine?
Yes No If not, why not? .............................................................................................................................. .......................................................................................................................................................... 5) If you don't have a latrine, why not?
Too expensive
Don't know how to build
No tools
Don't want one
Too sick to build one
Other ……………………… 6) What age do children start to use the latrines? ………………… 7) What happens to the stools of young children?
left on courtyard
thrown in the latrine
Thrown behind the house Other ………………………
4 Allow multiple answers
34
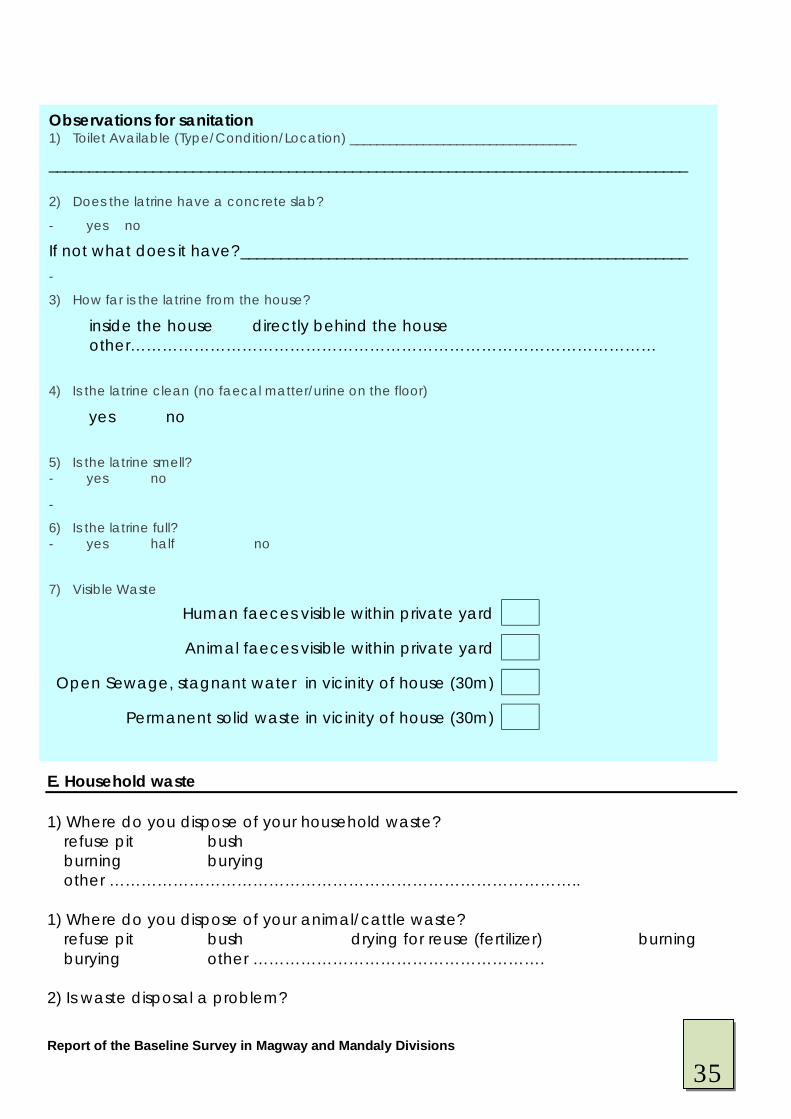
Report of the Baseline Survey in Magway and Mandaly Divisions
E. Household waste 1) Where do you dispose of your household waste? refuse pit bush burning burying other …………………………………………………………………………….. 1) Where do you dispose of your animal/cattle waste? refuse pit bush drying for reuse (fertilizer) burning burying other ………………………………………………. 2) Is waste disposal a problem?
Observations for sanitation 1) Toilet Available (Type/Condition/Location) __________________________________
________________________________________________________________________________ 2) Does the latrine have a concrete slab?
- yes no
If not what does it have?________________________________________________________ -
3) How far is the latrine from the house?
inside the house directly behind the house other………………………………………………………………………………………
4) Is the latrine clean (no faecal matter/urine on the floor)
yes no
5) Is the latrine smell? - yes no
-
6) Is the latrine full? - yes half no
7) Visible Waste
Human faeces visible within private yard
Animal faeces visible within private yard
Open Sewage, stagnant water in vicinity of house (30m)
Permanent solid waste in vicinity of house (30m)
35
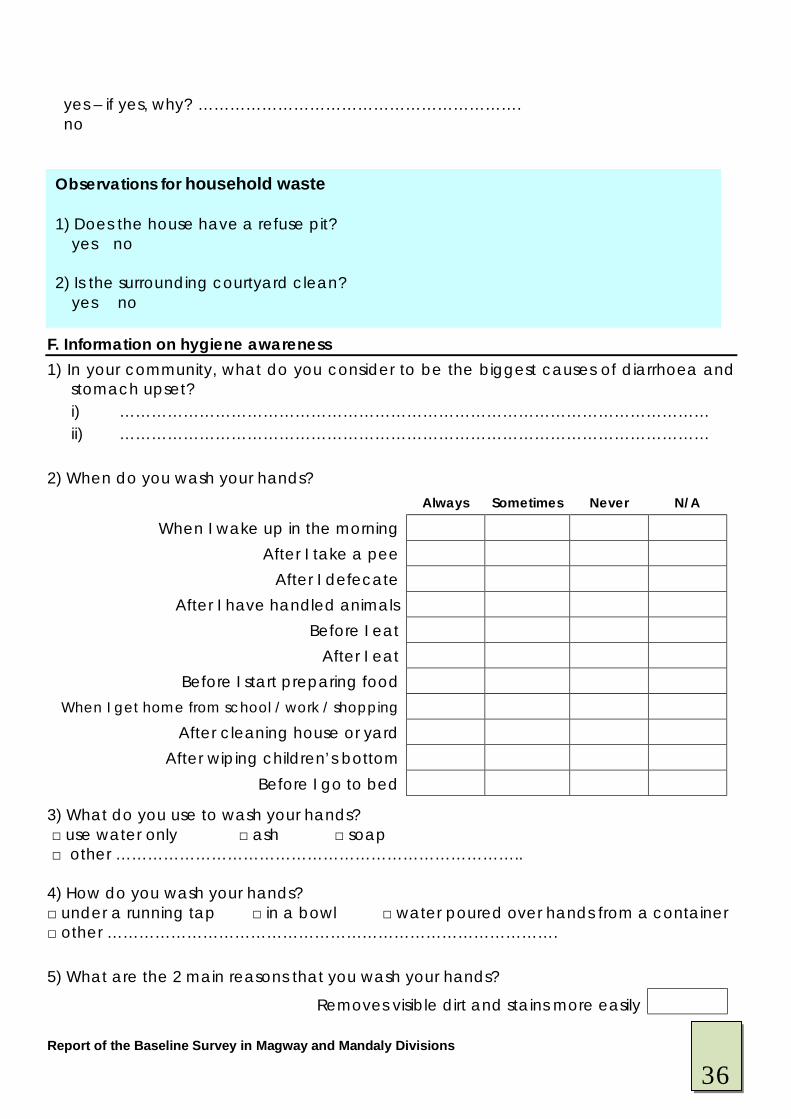
Report of the Baseline Survey in Magway and Mandaly Divisions
yes – if yes, why? ……………………………………………………. no F. Information on hygiene awareness 1) In your community, what do you consider to be the biggest causes of diarrhoea and
stomach upset? i) ………………………………………………………………………………………………… ii) …………………………………………………………………………………………………
2) When do you wash your hands?
Always Sometimes Never N/A
When I wake up in the morning After I take a pee
After I defecate After I have handled animals
Before I eat After I eat
Before I start preparing food When I get home from school / work / shopping
After cleaning house or yard After wiping children’s bottom
Before I go to bed
3) What do you use to wash your hands? □ use water only □ ash □ soap □ other ………………………………………………………………….. 4) How do you wash your hands? □ under a running tap □ in a bowl □ water poured over hands from a container □ other …………………………………………………………………………. 5) What are the 2 main reasons that you wash your hands?
Removes visible dirt and stains more easily
Observations for household waste 1) Does the house have a refuse pit? yes no 2) Is the surrounding courtyard clean? yes no
36
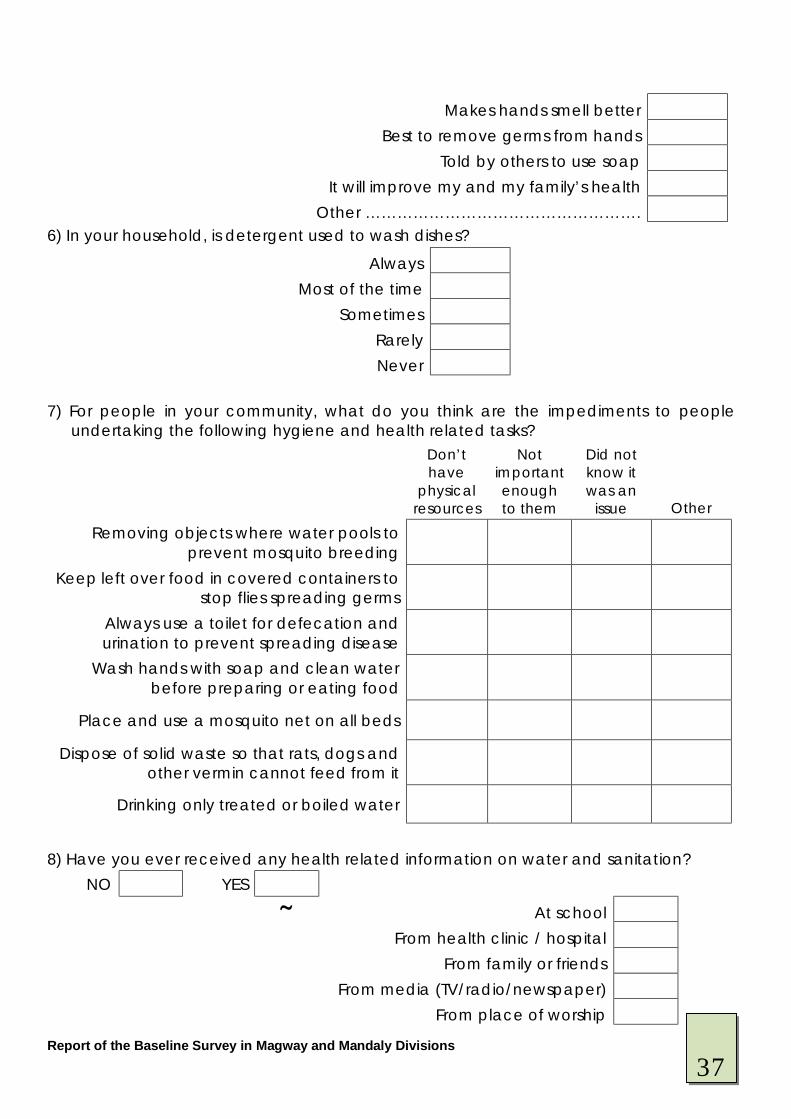
Report of the Baseline Survey in Magway and Mandaly Divisions
Makes hands smell better
Best to remove germs from hands
Told by others to use soap
It will improve my and my family’s health
Other ……………………………………………. 6) In your household, is detergent used to wash dishes?
Always
Most of the time
Sometimes
Rarely
Never 7) For people in your community, what do you think are the impediments to people
undertaking the following hygiene and health related tasks? Don’t
have physical
resources
Not important enough to them
Did not know it was an
issue Other
Removing objects where water pools to prevent mosquito breeding
Keep left over food in covered containers to stop flies spreading germs
Always use a toilet for defecation and urination to prevent spreading disease
Wash hands with soap and clean water before preparing or eating food
Place and use a mosquito net on all beds
Dispose of solid waste so that rats, dogs and other vermin cannot feed from it
Drinking only treated or boiled water
8) Have you ever received any health related information on water and sanitation?
NO YES Ä At school From health clinic / hospital From family or friends From media (TV/radio/newspaper) From place of worship
37
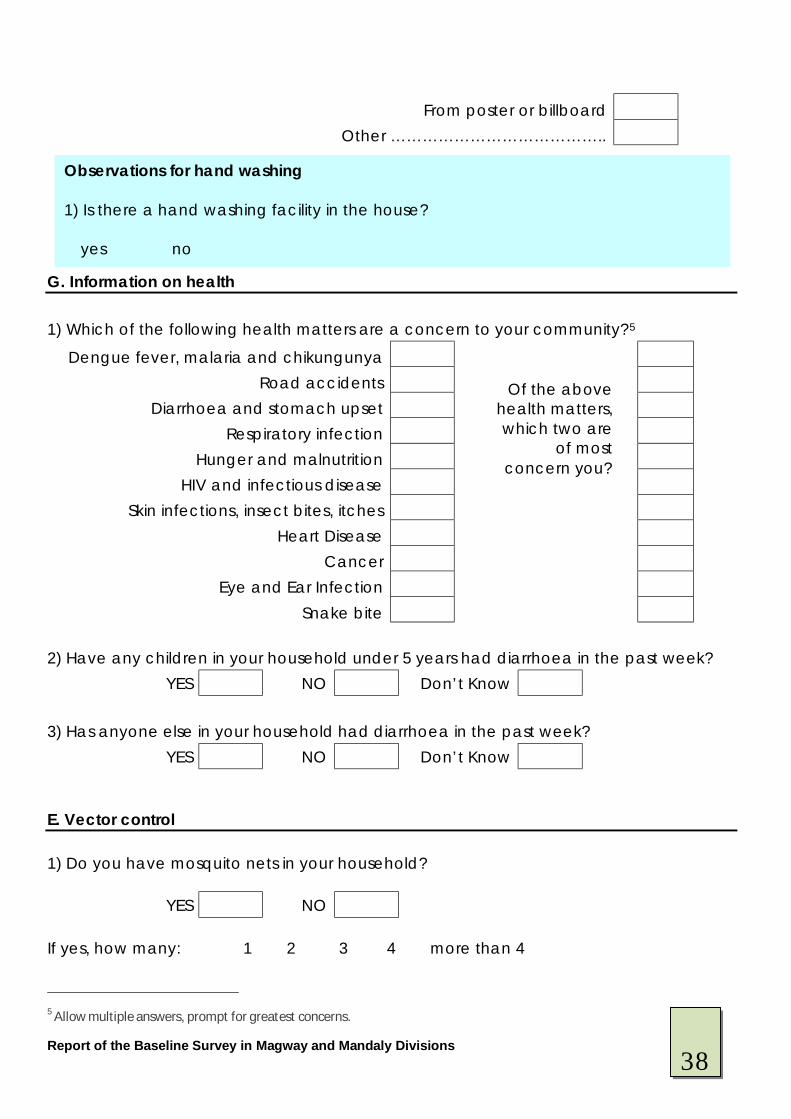
Report of the Baseline Survey in Magway and Mandaly Divisions
From poster or billboard Other …………………………………..
G. Information on health 1) Which of the following health matters are a concern to your community?5
Dengue fever, malaria and chikungunya
Road accidents
Diarrhoea and stomach upset
Respiratory infection
Hunger and malnutrition
HIV and infectious disease
Skin infections, insect bites, itches
Heart Disease
Cancer
Eye and Ear Infection
Snake bite 2) Have any children in your household under 5 years had diarrhoea in the past week?
YES NO Don’t Know 3) Has anyone else in your household had diarrhoea in the past week?
YES NO Don’t Know E. Vector control 1) Do you have mosquito nets in your household?
YES NO If yes, how many: 1 2 3 4 more than 4 5 Allow multiple answers, prompt for greatest concerns.
Of the above health matters, which two are
of most concern you?
Observations for hand washing 1) Is there a hand washing facility in the house? yes no
38
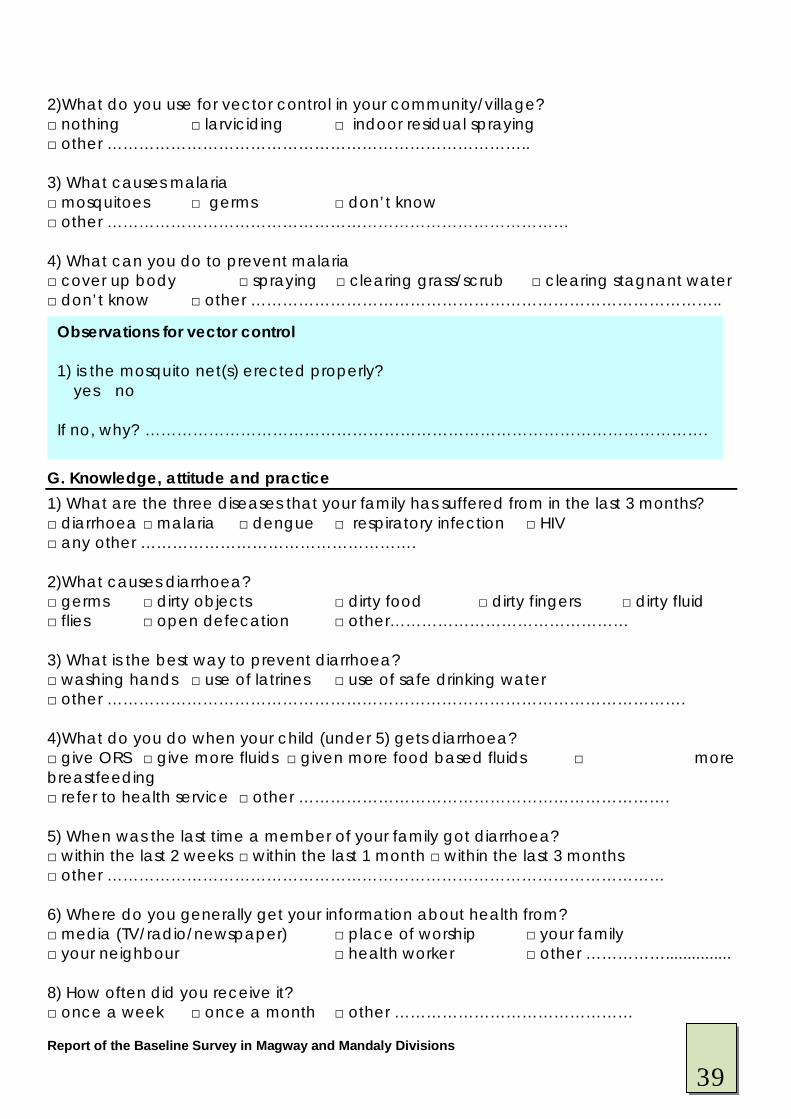
Report of the Baseline Survey in Magway and Mandaly Divisions
2)What do you use for vector control in your community/village? □ nothing □ larviciding □ indoor residual spraying □ other …………………………………………………………………….. 3) What causes malaria □ mosquitoes □ germs □ don’t know □ other …………………………………………………………………………… 4) What can you do to prevent malaria □ cover up body □ spraying □ clearing grass/scrub □ clearing stagnant water □ don’t know □ other …………………………………………………………………………….. G. Knowledge, attitude and practice 1) What are the three diseases that your family has suffered from in the last 3 months? □ diarrhoea □ malaria □ dengue □ respiratory infection □ HIV □ any other ……………………………………………. 2)What causes diarrhoea? □ germs □ dirty objects □ dirty food □ dirty fingers □ dirty fluid □ flies □ open defecation □ other……………………………………… 3) What is the best way to prevent diarrhoea? □ washing hands □ use of latrines □ use of safe drinking water □ other ………………………………………………………………………………………………. 4)What do you do when your child (under 5) gets diarrhoea? □ give ORS □ give more fluids □ given more food based fluids □ more breastfeeding □ refer to health service □ other ……………………………………………………………. 5) When was the last time a member of your family got diarrhoea? □ within the last 2 weeks □ within the last 1 month □ within the last 3 months □ other …………………………………………………………………………………………… 6) Where do you generally get your information about health from? □ media (TV/radio/newspaper) □ place of worship □ your family □ your neighbour □ health worker □ other ……………............... 8) How often did you receive it? □ once a week □ once a month □ other ………………………………………
Observations for vector control 1) is the mosquito net(s) erected properly? yes no If no, why? …………………………………………………………………………………………….
39
Report of the Baseline Survey in Magway and Mandaly Divisions
9) What is the hardest hygiene behaviour for you to change? □ use of clean drinking water □ use of latrines □ hand washing at key times □ disposal of children’s stools □ don’t know □ other …………………………………………………………… 13) And why? …………………………………………………………………………………………………………………………………………………………………………………………………………………………………… Name Signature Date Volunteer (1) Volunteer (2) Team Leader
40

Report of the Baseline Survey in Magway and Mandaly Divisions