water resources of the neuse river basin north carolina · neuse river basin ... summary of...
TRANSCRIPT

Water Resources of the Neuse River Basin North Carolina
GEOLOGICAL SURVEY WATER-SUPPLY PAPER 1414
Prepared in cooperation with Division of tf^ater Resources, Inlets and Coastal fFaterways, North Carolina Depart ment of Conservation and Development

Water Resources of the Neuse River Basin North CarolinaBy G. A. BILLINGSLEY, R. E. FISH, and R. G. SCHIPF
GEOLOGICAL SURVEY WATER-SUPPLY PAPER 1414
Prepared in cooperation with Division of fFater Resources, Inlets and Coastal Waterways, North Carolina Depart ment of Conservation and Development
UNITED STATES GOVERNMENT PRINTING OFFICE, WASHINGTON : 1957

UNITED STATES DEPARTMENT OF THE INTERIOR
FRED A. S EATON, Secretary
GEOLOGICAL SURVEY
Thomas B. Nolan, Director
For sale by the Superintendent of Documents, U. 8. Oovernment Printing Office Washington 26, D. C. - Price 35 cents (Paper cover)

PREFACE
The report on the resources of the Neuse River basin is one of a series of reports describing the water resources of North Car olina. .When the contemplated series of reports is completed, information for the entire State will be available to assist in the orderly planning and development of the water facilities required for municipal and industrial expansion, and for the expansion of the uses of water in agriculture.
This report was prepared by the U. S. Geological Survey, in cooperation with the Division of Water Resources, Inlets, and Coastal Waterways of the North Carolina Department of Conser vation and Development. Many individuals in the Water Resources Division contributed to the preparation of this report.
Most of the data summarized in this report have been collected over a period of many years by the U. S. Geological Survey in cooperation with the North Carolina Department of Conservation and Development, the State Board of Health, and the Corps of en gineers, U. S. Army, Wilmington, N. C.
Other data and information presented in this report are based on data collected by, in cooperation with, or are from technical reports, or publications, of the U. S. Weather Bureau, North Car olina State Stream Sanitation Committee, and the North Carolina State Highway and Public Works Commission.
Ill


CONTENTS
PageAbstract...................................................................................................................................... 1Introduction................................................................................................................................ 2
Purpose................................................................................................................................. 2Geography.............................................................................................................................. 2
Topography and drainage................................................................................................ 3Climate .............................................................................................................................. 4Natural resources.............................................................................................................. 6Agricultural and industrial development........................................................................ 8
Definition of terms. ............................................................................................................. 9Occurrence and quality of water............................................................................................ 10
The hydrologic cycle........................................................................................................... 10Sources of water.................................................................................................................. 11Significance of quality of water......................................................................................... 12
Surface water............................................................................................................................. 15Flow characteristics........................................................................................................... 19
Duration of flow................................................................................................................ 20Low-flow frequency.......................................................................................................... 25Maximum period of deficient discharge ..................'........................................................ 32Storage requirements....................................................................................................... 36Flood frequencies............................................................................................................. 43
Quality of surface water...................................................................................................... 46Ground water............................................................................................................................ 52
Occurrence of ground water................................................................................................. 52Geology.................................................................................................................................. 54
Rocks of the Piedmont..................................................................................................... 55Rocks of the Coastal Plain ............................................................................................ 56
Ground-water provinces....................................................................................................... 57Crystalline-rock province............................................................................................... 57Slate province.................................................................................................................. 62Cretaceous sand province.............................................................................................. 63Tertiary limestone province........................................................................................... 64Composite limestone-sand province............................................................................... 64
Water levels........................................................................................................................... 65Public water-supply systems .................................................................................................. 67Present water use..................................................................................................................... 79
Private industrial supplies................................................................................................. 79Public supplies..................................................................................................................... 80Rural domestic supplies ...................................................................................................... 80Agricultural use.................................................................................................................... 80Other uses ............................................................................................................................. 81
Potential supply....................................................................................................................... 81Surface water......................................................................................................................... 81Ground water......................................................................................................................... 82
Water laws................................................................................................................................. 83Selected bibliography.............................................................................................................. 84Index.......................................................................................................................................... 87
VI CONTENTS
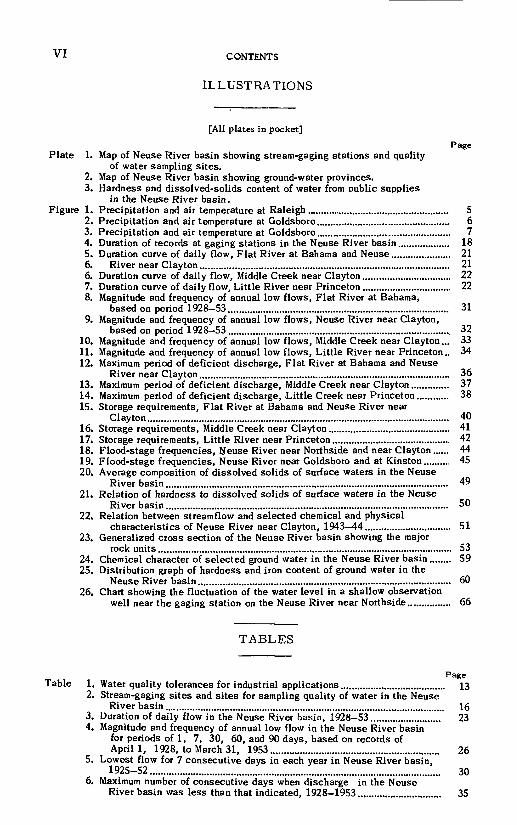
ILLUSTRATIONS
[All plates in pocket]
PagePlate 1. Map of Neuse River basin showing stream-gaging stations and quality
of water sampling sites.2. Map of Neuse River basin showing ground-water provinces.3. Hardness and dissolved-solids content of water from public supplies
in the Neuse River basin. Figure 1. Precipitation and air temperature at Raleigh ..................................................... 5
2. Precipitation and air temperature at Goldsboro................................................. 63. Precipitation and air temperature at Goldsboro................................................. 74. Duration of records at gaging stations in the Neuse River basin................... 185. Duration curve of daily flow, Flat River at Bahama and Neuse...................... 216. River near Clayton............................................................................................. 216. Duration curve of daily flow, Middle Creek near Clayton................................. 227. Duration curve of daily flow, Little River near Princeton................................. 228. Magnitude and frequency of annual low flows, Flat River at Bahama,
based on period 1928-53.................................................................................. 319. Magnitude and frequency of annual low flows, Neuse River near Clayton,
based on period 1928 53................................................................................... 3210. Magnitude and frequency of annual low flows, Middle Creek near Clayton... 3311. Magnitude and frequency of annual low flows, Little River near Princeton., 3412. Maximum period of deficient discharge, Flat River at Bahama and Neuse
River near Clayton............................................................................................. 3613. Maximum period of deficient discharge, Middle Creek near Clayton.............. 3714. Maximum period of deficient discharge, -Little Creek near Princeton............ 3815. Storage requirements, Flat River at Bahama and Neuse River near
Clayton................................................................................................................ 4016. Storage requirements, Middle Creek near Clayton............................................. 4117i Storage requirements, Little River near Princeton............................................ 4218. Flood-stage frequencies, Neuse River near Northside and near Clayton...... 4419. Flood-stage frequencies, Neuse River near Goldsboro and at Kinston.......... 4520. Average composition of dissolved solids of surface waters in the Neuse
River basin......................................................................................................... 4921. Relation of hardness to dissolved solids of surface waters in the Neuse
River basin......................................................................................................... 5022. Relation between streamflow and selected chemical and physical
characteristics of Neuse River near Clayton, 1943-44................................ 5123. Generalized cross section of the Neuse River basin showing the major
rock units............................................................................................................. 5324. Chemical character of selected ground water in the Neuse River basin........ 5925. Distribution graph of hardness and iron content of ground water in the
Neuse River basin.............................................................................................. 6026. Chart showing the fluctuation of the water level in a shallow observation
well near the gaging station on the Neuse River near Northside................ 66
TABLES
Page Table 1. Water quality tolerances for industrial applications....................................... 13
2. Stream-gaging sites and sites for sampling quality of water in the NeuseRiver basin........................................................................................................ 16
3. Duration of daily flow in the Neuse River basin, 1928-53.......................... 234. Magnitude and frequency of annual low flow in the Neuse River basin
for periods of 1, 7, 30, 60, and 90 days, based on records of April 1, 1928, to March 31, 1953............................................................... 26
5. Lowest flow for 7 consecutive days in each year in Neuse River basin.1925-52............................................................................................................ 30
6. Maximum number of consecutive days when discharge in the NeuseRiver basin was less than that indicated, 1928-1953............................... 35

CONTENTS VII
Page Table 7. Storage requirements in Neuse River basin, 1928 53 ...................................... 39
8. Summary of chemical analyses of water from streams of the NeuseRiver basin.......................................................................................................... 47
9. Summary of chemical analyses of ground waters in the Neuse Riverbasin.................................................................................................................... 58
10. Chemical analyses of water from public water supplies in the NeuseRiver basin.......................................................................................................... 68


WATER RESOURCES OF THE NEUSE RIVER BASIN
NORTH CAROLINA
By G. A. Billingsley, R. E. Fish, and R. G. Schipf
ABSTRACT
Sufficient water is available in the Neuse River basin to meet present requirements and those for many years to come if water use continues to increase at about the present rate- Data presented in this report show that the average annual streamflow from approximately 70 percent of the basin area during the 26-year period, 1928-53, was about 2,500 mgd. Comparison of this flow, with the estimated total withdrawal use of both surface and ground water of 280 mgd indicates the relative utilization of the potential water resources of the basin. If proper pollution controls are observed and practiced so that water in the various streams may be reused a number of times, the potential for water-resources de velopments and use is even greater than indicated by the above comparison. Preliminary studies indicate that the quantity of water now being withdrawn from ground-water reser voirs in the basin is but a fraction of the total that may be obtained from this source.
Only 10 of the 43 municipalities having public water-supply systems use surface water; however, since 5 of the 10 are the largest cities in the area, about 60 percent of the water used for public supplies is from surface sources.
Of the 14 complete-record stream-gaging stations in the Neuse River basin, for which records are available, 11 have been in operation for 25 years or longer. Periodic meas urements of the rate of flow have been made at 15 additional sites on streams scattered widely over the basin. All available streamflow data to 1953 have been summarized in either graphic or tabular form, or both. Analyses of streamflow records indicate that there is no significant long-term trend, either an increase or a decrease, in the volume of water flowing in the streams of the Neuse River basin.
Domestic supplies and supplies for small municipalities and industries in the Piedmont region are available almost everywhere from wells; the yields of individual wells vary greatly, ranging from about 1 to 200 gpm, and averaging about 30 gpm. In the Coastal Plain, yields of wells from poorly consolidated beds of sand and limestone are commonly more than 200 gpm. Both the water table and the artesian water level are generally con trolled by natural conditions and, consequently, have shown no perennial decline. In certain areas near the coast, a body of salt water lies beneath the fresh water in the underground reservoir, and it is important in those areas that wells be properly spaced and pumping regulated so that well supplies are not contaminated with salt water.
Generally the surface waters in the Neuse River basin are of better chemical quality than ground water. Except for those streams affected by encroachment of sea water, the surface waters are low in dissolved mineral matter and are soft. Some surface waters contain excessive quantities of iron. Many of the streams in the basin receive polluting waste from surface sources making those waters unsuitable for many uses. Streams in the lower part of the basin are highly colored because of the drainage from swamp streams. The observed hardness of ground waters ranged from 2 to 750 ppm as compared with 11 to 112 ppm for surface waters in the basin.
Ground water from the crystalline-rock province of the Piedmont and from the slate province of the fall line is more variable in quality than water from other provinces in the area. The dissolved solids ranged from 43 to 1,460 ppm with a median of 108 ppm in the crystalline-rock and slate provinces. The Tertiary limestone province yields a calcium bicarbonate water ranging in hardness from 110 to 391 ppm.
1

2 WATER RESOURCES, NEUSE RIVER BASIN, NORTH CAROLINA
INTRODUCTION
PURPOSE
Water is one of the most important natural resources in the Neuse River basin. In the past, little thought was given to the availability of water resources, but a series of severe droughts in recent years has focused attention on the fact that our usable water supplies are not limitless even in the humid southeastern states. The great natural increase in population, the expansion of industrial facilities, and the great demands on agricultural production, have generally impressed the public with the need for accurate and continuing appraisals of water resources and their development so as to meet the accelerating demands for water.
In 1953, the General Assembly of North Carolina established the Neuse River Watershed Authority (NRWA) to aid in planning the development of the varied resources of the basin. Many fac tors influence the economic growth of any r*egion but the basic factor is adequate water supplies for public, industrial, rural domestic, agricultural, and other uses. These supplies must furnish not only a sufficient quantity of water but also water of satisfactory chemical and physical quality.
This report has been prepared to summarize and evaluate the data now available on the quantity and quality of both surface and ground water in the Neuse River basin. It is hoped that the report will assist in the location, development, or expansion of munic ipal, industrial, agricultural, and other water supplies and, per haps, be a guide for the future study of water resources in the area.
GEOGRAPHY
The Neuse River basin is in east-central North Carolina. Its area, approximately 6, 000 square miles, lies entirely within the boundaries of the State and is considered in this report to extend to Core Sound and to include the Newport River basin in Carteret County. The Neuse River basin is almost 200 miles long, extend ing from Orange and Person Counties in the northwest to the Atlantic Ocean bordering Carteret County in the southeast. The basin ranges in width from 35 to 45 miles through most of its length and includes about 11 percent of the area of North Carolina.
There has been a sharp upward trend in population in the Neuse River basin since 1940 and the present population is about 625,000, or about 15 percent of the population of North Carolina. There

INTRODUCTION
are several cities in the basin, including Raleigh, Durham, Golds- boro, Wilson, Kinston, and New Bern, but the region is chiefly one of small towns and a large (42 percent) rural population.
TOPOGRAPHY AND DRAINAGE
The Neuse River basin lies in two physiographic regions that differ considerably in topography, geology, and hydrology. Almost 40 percent of the basin is in the Piedmont region; the remainder is in the Coastal Plain. At some places, falls and rapids are found where streams leave the hard rocks of the Piedmont to cut into the softer rocks of the Coastal Plain. The area where these falls or rapids occur is known as the fall line. The approximate bound ary between the Piedmont and Coastal Plain may be considered a line drawn between Penson and Wilson.
The entire basin has a general surface slope toward the south east and most of the streams, therefore, flow in that direction. Near the northwestern end of the basin, several hills reach ele vations of 800 feet above sea level but the surface becomes lower as the fall line is approached and at elevations of 100 to 200 feet the Coastal Plain is entered. Farther to the southeast, sea level is reached in the estuary of the Neuse River.
The Piedmont section was formerly a gently sloping plain. The area was raised to its present elevation, and streams cut down into the rock to form the present hilly terrain. The northwestern quarter of the region is underlain by slate and schist, the next quarter by shale and sandstone of the Newark group. The third quarter is underlain by granite and gneiss, whereas the rocks in the southeastern quarter are slate and schist similar to those in the northwestern part of the basin. The slate is covered, toward the southeast by the clay and sand of the Coastal Plain strata.
The rocks of the Piedmont have been altered by various physi cal and chemical processes so that a moderately deep zone of reddish soil and soft, decayed rock is characteristic of the region. The surface is rolling to hilly in many places, especially near the streams, but broad upland areas and long ridges are also common where the rocks are more resistant to erosion.
The streams are generally swift flowing but many of them are bordered by swampy bottom land. The stream pattern when viewed from above in the upper part of the Piedmont resembles a branching oak tree, but in some places, where the harder rocks have frac tures, streams tend to cut their channels in the fractured zones and make right angle turns where the fractures meet. In the lower

4 WATER RESOURCES, NEUSE RIVER BASIN, NORTH CAROLINA
Piedmont, near the fall line, the streams generally flow parallel to each other, as the Coastal Plain streams do, because they were developed on rocks that have been almost completely eroded away.
The Coastal Plain region is underlain by sedimentary rocks, chiefly sand, clay, and limestone (Cretaceous and Post-Creta ceous) but the surface is generally covered by light-colored, loose sandy soil. From the fall line to the vicinity of New Bern, the Coastal Plain surface is gently to moderately undulating but slopes are very steep at many places near the larger streams. The land is generally well drained but swamps are found in the bottom lands along the creeks.
During past geologic ages the sea reached far inland several times, and the latest flooding occurred during the comparatively recent Pleistocene epoch. A.S the sea retreated, the streams had to extend themselves farther and farther to reach the coast and tended to flow parallel to each other for some distance before joining a larger stream. Many of the tributaries to the Neuse, such as Contentnea Creek, flow parallel to the main stream for many miles before entering it. For about a third of its length, from Smithfield to Kinston, the Neuse River flows verv close to the southern boundary of its basin and most of its larger tributar ies enter the main stream from the north.
Southeast of New Bern, the stream gradients are so low that nat ural drainage is inadequate, and extensive swamps exist in this area. Although the area was uplifted from the sea in recent geo logic time, it has again been drowned to some extent since the drainage was established, creating many salt marshes and estu aries, or drowned rivers.
beveral long barrier islands, offshore bars, and other coastal landforms have been built by wave action and by ocean currents some distance from the mainland. The barrier islands, known as the "outer banks", have typical sand-dune topography. The action of wind and waves during violent storms effects great changes in the physiography of this coastal region.
CLIMATE
The Neuse River basin has a humid climate and because of the length of the basin and its extension from the inland Piedmont re gion to the Atlantic Ocean, there are minor variations in climate through the area.
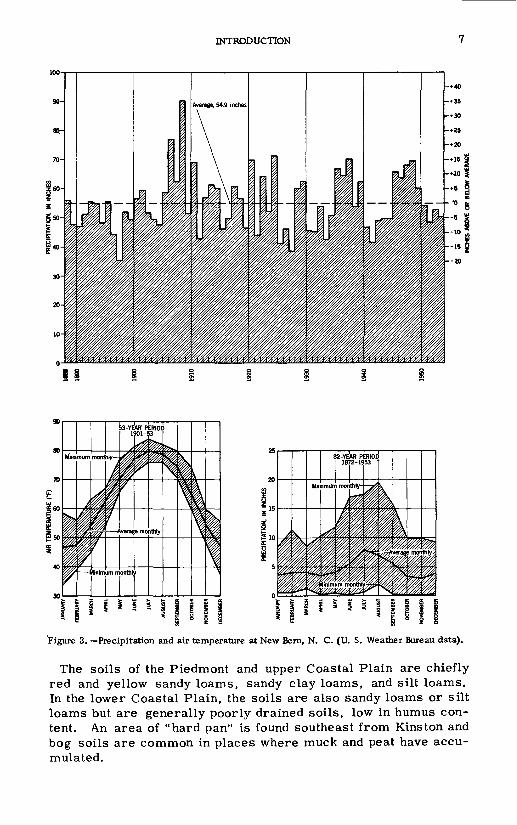
Precipitation occurs chiefly as rainfall and varies with the sea sons and with elevation. The mean annual precipitation ranges from 42 inches at the northwestern end of the basin to 55 inches near the coast at New Bern. This rainfall is generally well distributed through the year but is greatest during the summer and early fall. The heaviest monthly rainfall recorded in the basin is 17.60 inches

INTRODUCTION °
(New Bern, July 1908) but the average is only a quarter of that amount.
Mean annual temperatures also vary from northwest to south east, being about 59°F in the upper Piedmont section of the basin and about 63°F near the coast. Temperatures vary seasonally and are highest, of course, during the summer months, generally reaching a peak in July. The highest temperature recorded in the basin is 108°F (Goldsboro, July 1932).
The growing season ranges from 210 days in Person County to 269 days in Carteret County. Seasonal variations in precipitation and temperature at three weather stations in the Neuse River basin are shown in figures 1, 2, and 3.
Figure 1 Precipitation and air temperature at Raleigh, N. C. (U. S. Weather Bureau data).

WATER RESOURCES, NEUSE RIVER BASIN, NORTH CAROLINA
Figure 2. Precipitation and air temperature at Goldsboro, N. C. (U. S. Weather Bureau data).
NATURAL RESOURCES
The most widely used natural resources of the Neuse River basin in addition to water are its soils and forests, but mineral production and fisheries are important at some places.
INTRODUCTION
Average, 54.9 inches
ii
'Figure 3. Precipitation and air temperature at New Bern, N. C. (U. S. Weather Bureau data).
The soils of the Piedmont and upper Coastal Plain are chiefly red and yellow sandy loams, sandy clay loams, and silt loams. In the lower Coastal Plain, the soils are also sandy loams or silt loams but are generally poorly drained soils, low in humus con tent. An area of "hard pan" is found southeast from Kinston and bog soils are common in places where muck and peat have accu mulated.

8 WATER RESOURCES, NEUSE RIVER BASIN, NORTH CAROLINA
The Neuse River basin is rich in forest resources, the climate and topography being suitable for the growth of a great variety of trees which may be used for lumber and furniture making and the production of pulpwood and cellulose. The loblolly pine is the most important tree for both lumber and pulpwood, but several other pines and many hardwoods are abundant.
In the Piedmont the chief mineral product is crushed and dimen sion stone, mainly granite, "but lesser quantities of heavy clay materials and pyrophyllite are extracted. In the Coastal Plain the mining of sand, gravel, and marl are important.
In the lower counties of the basin, salt-water fisheries are an important resource. The principal fish caught here is the men haden which is processed into oil, fishmeal, and other products. Foodfish, principally alewives, shrimps, and crabs are supplied to inland markets.
AGRICULTURAL AND INDUSTRIAL DEVELOPMENT
The Neuse River basin is primarily an agricultural region, to bacco being the chief dollar crop in all counties. In the Piedmont, other important crops are corn, hay, wheat, and potatoes, with cotton becoming more important nearer the Coastal Plain. Other crops in the Coastal Plain are corn, cotton, and potatoes, with potatoes assuming greater importance near the coast. Dairying and beef cattle production are important in both areas. The crops occupying the greatest acreage are corn, cotton, and tobacco, in that order.
There is some industrial diversification in the basin but the chief industries are textiles and lumbering. The manufacture of ciga rettes and other tobacco products is concentrated at Durham,. Other important industries include the processing of food and other agricultural products, the making of furniture and other wood products, the production of synthetic fiber, and the manufacture of various agricultural and consumer products.
The many small towns and the few cities are important commer cial centers. The usual commercial enterprises are well repre sented in the basin but the most colorful, and one of the most important,is that of buying and selling tobacco at the many ware houses and markets throughout the basin.
Several railroads serve the area but the extensive network of all-weather roads has made trucking an important means of trans port. The cities of Raleigh, Durham, Kinston, New Bern, and

INTRODUCTION
Morehead City have airline service and water transportation is important near the coast through the Intracoastal Waterway and the deep-water port at Morehead City.
DEFINITION OF TERMS
The records for quantities of water are expressed in various terms in the presentation ofhydrologic data. Some of these terms have become associated with certain types of works and maybe di vided into two general groups: those that represent a rate of flow such as million gallons per day (mgd), gallons per minute (gpm), cubic feet per second (cfs), million gallons per day per square mile, and cubic feet per second per square mile (cfsm); and those that represent volume of water, as million gallons, million gallons per square mile, and as runoff depth in inches on the drainage basin.
The gallon is the volumetric unit commonly used in North Caro lina in connection with pumping rates, storage for water supplies and sprinkler-type irrigation systems, whereas the cubic foot is the volumetric unit generally used in connection with power gen eration and with flood flows.
The units in which hydrologic data are given in this report may be defined as follows:
A cubic foot per second is the rate of discharge equivalent to that of a stream whose channel is 1 square foot in cross-sectional area and whose average velocity is 1 foot per second.
A million gallons per day per square mile is defined as 1 million gallons of water per day flowing from each square mile of area drained, on the assumption that runoff is distributed uniformly as regards time and area.
Cubic feet per second per square mile is the average number of cubic feet of water per second flowing from each square mile of area drain ed, on the assumption that the runoff is distributed uniformly as regards time and area.
1 cfs = 448. 8 gpm = 0. 646 mgd 1 mgd = 1. 55 cfs = 694. 4 gpm
A water-year begins October 1 and ends September 30 and is the year for which most streamflow data are reported. The water-year is used in analysis and presentation of data on low flow in this report except that magnitude and frequency of low flows are based on a climatic-year beginning April 1 and ending March 31.

10 WATER RESOURCES, NEUSE RIVER BASIN, NORTH CAROLINA
One part per million (ppm) is a unit weight of a constituent in a million unit weights of water. In the chemical analysis of water samples, it is necessary to determine the presence of various substances usually found in minute amounts; therefore, the results are usually expressed in parts per million rather than in percent ages. One part per million equals one ten- thousandth of one percent (0. 0001 percent).
The hydrogen-ion concentration in an aqueous solution or water is represented on the pH scale by a number which is the negative logarithm of the hydrogen-ion concentration in moles per liter. A solution having a pH value of 7. 0 is neutral, that is, it is nei ther acid or alkaline. Progressive pH values below 7. 0 denote increasing acidity and progressive pH values above 7. 0 denote increasing alkalinity.
Specific conductance is a measure of the ability of a water to conduct an electrical current and is expressed in micromhos at a temper ature of 25°C. It varies with the concentration and degree of ionization of the different minerals in solution and with the tem perature. The conductance, however, does not indicate the rela tive quantities of different salts in solution.
OCCURRENCE AND QUALITY OF WATER
THE HYDROLOGIC CYCLE
The water we use, whether it is from surface or ground water sources, has its origin in precipitation. In the natural sequence of events, the water that is evaporated from the oceans by the energy of the sun is carried inland as water vapor and falls on the land from clouds as rain, snow, sleet, or hail. Some of the pre cipitation is returned to the atmosphere by evaporation and tran spiration but the remainder percolates into the ground or flows overland in surface streams. That water which moves beneath or upon the land surface eventually reaches the sea where it may again be evaporated. This recurring succession of events is known as the hydrologic cycle.
It is evident that, although the quantity of water involved in the hydrologic cycle remains rather constant for the earth as a whole, the amount of water available from any specific source varies with precipitation from time to time or from place to place. Because of this natural circulation, water maybe regarded as a renewable resource.
Rainfall that reaches the ground and does not evaporate or run off seeps downward, moving through the minute spaces between

OCCURRENCE AND QUALITY OF WATER 11
soil particles. Much of this water is held in the soil to be used by trees, crops, and other vegetation. Soil moisture requirements have a priority on precipitation and a large percentage of rainfall, especially during the growing season, is used by vegetation.
When the rate of precipitation exceeds the rate of absorption in the ground, surplus water infiltrates further downward to a zone which it saturates. The water in this zone of saturation is called ground water; as it slowly percolates to lower elevations, it dis charges into surface channels from seeps and springs to maintain streamflow in dry weather or discharges into the sea.
When precipitation exceeds the rate at which it can be absorbed in the ground, water must flow on the surface, where it develops channels or gullies in the land in its search for drainage ways. Surface runoff may be stored in ponds or other reservoirs to min imize flood damage and to provide water during periods of defi ciency that may follow. If water levels are higher in streams than in the surrounding rock formations, some water may enter into and recharge the ground-water reservoir.
Water can be utilized best by man when in lakes and streams or underground reservoirs. Water constantly passes from one part of the hydrologic cycle to another, appearing as a gas in the at mosphere, as a liquid in surface or ground-water bodies, or as a solid when frozen. If man is to evaluate his water resources and rationally plan their use, continuing investigations must be made not only by geologists and hydrologists but also by meteorolo gists, agronomists, and other technical personnel.
SOURCES OF WATER
Both surface and ground water sources are utilized in the Neuse River basin.
In the Piedmont section of the basin, the yield of wells is not very great, being rarely as much as 100 gpm and usually much less. Water supplies for large cities such as Durham and Raleigh must necessarily come from surface streams. Large mills or other industrial plants must also obtain most of their water from lakes or streams, either by constructing their own facilities or by purchasing treated water from a public supply. Several small towns in the Piedmont section have wells to furnish their public supplies but no large city in that area has ever used ground water.
In the Coastal Plain, ground-water sources are more important than in the Piedmont. Wells yielding more than 200 to 300 gpm

12 WATER RESOURCES, NEUSE RIVER BASIN, NORTH CAROLINA
are common. Because of the low relief over much of the coastal plain, the construction of large dams for water supplies or other purposes is not generally possible and only one public supply, that forGoldsboro, is obtained from surface water. Large public, industrial, and irrigation supplies may be obtained from ground- water sources. It may be said that, generally, large water sup plies are obtained from surface sources in the Piedmont section but from wells in the Coastal Plain.
Of the cities and towns in theNeuse River basin that have public water supplies, 77 percent, serving 120,000 persons, use ground water, and 23 percent, serving 240,000 persons, have surface- water sources (see pi. 3). Ground water is used for domestic sup plies by 62 percent of the basin's population.
SIGNIFICANCE OF QUALITY OF WATER
An adequate water supply is a deter mining factor in the selection of an industrial site. Sharing importance with quantity is a knowl edge of the chemical quality, degree of pollution, and a seasonal estimate of suspended sediment carried by the stream.
Chemical analyses of water for municipal or industrial uses are necessary to determine whether the water is suitable for specific purposes, and, if not, to determine the type and cost of the treat ment needed to make it satisfactory. The analyses aid in deter mining the suitability of the water for drinking, steam production and heating, manufacturing, laundering, or other uses. Compre hensive analyses can also be used to determine the cost of sof tening water, its scale-forming properties and its tendency to corrode plumbing.
The chemical requirements for water used by different indus tries are so variable that it is impossible to establish specifica tions to fit all uses. In general, however, most industries require clear water low in total mineral content and hardness. Water temperature is also an important factor in determining the value of water for industrial use. The requirements of chemical quality of water for various industrial processes are given in table 1.
Generally accepted chemical specifications have been establish ed for waters used domestically; they are independent of any sanitary specifications established for protection of the public

OCCURENCE AND QUALITY OF WATER 13
Table 1. Water quality tolerances tot industrial applications
[American Water Works Association, 1950, Water quality and treatment, p. 67, table 3-4. Re marks: A, no corrosiveness; B, no slime formation; C, conformance to Federal drinking-water standards; D, AljOj less than 8 ppm, SiO2 less than 25 ppm, Cu less than 5 ppm. Chemical constituents in parts per million]
Industrial use
Air conditioning*.........
Boiler feed: 0-150 psi................150-250 psi...... .......
Canning:
uncolored. Paper and pulp:'
grade. Rayon (viscose) pulp:
Manufacture ...........
Textiles:
Tur bidity
"10"
2010
5
1010
2
501-5
2
502515
5
50.3
9f\
55
5
Color
"76"'
8040
5
10
5
2
201510
5
5
10-100
205-20
705
Fe
0.5
0
0
.5
.29
.02
1-.0
.11
.05
.0
OC
1.0.9,
Mn
0.5 9
99
.2
.5
.2
.02
.5
.1
.05
.05
.0
OC
1.0
Fe+Mn
0.5 9
99
9.5
.02
1.0.2.1.1
.05
.0
9c
1.0
Hard ness
/9\
7540
8
oc 7c
250
50
50
180100100
50
55 50-135
9ft9ft
209ft
Alka linity
........
50
30-50
50
1 "5C.
pH
..........
8.0+8.5+9 0+
(4)
7.8-8.38 f\
Total solids
..............
3000-10002500-5001500-100
850100
300
200
300200200
100
Gen eral
A.B C
CC
A.B
B
D
1 Waters with algae and hydrogen sulfide odors are most unsuitable for air conditioning. Z Some hardness desirable.'Clear, odorless, sterile water for syrup and carbonation. Water consistent in character.
Most high-quality filtered municipal water not satisfactory for beverages.* Hard candy requires pH of 7.0 or greater, as low value favors inversion of sucrose, causing
sticky product.5 Control of corrosion is necessary as is also control of organisms, such as sulfur and iron
bacteria, which tend to form slimes.«Ca(HCOs)2 particularly troublesome. Mg(HCOs)g tends to greenish color. CC«2 assists topre-
vent cracking. Sulfates and chlorides ofCa, Mg.Na should each be less than 300 ppm(white butts).1 Uniformity of composition and temperature desirable. Iron objectionable since cellulose
adsorbs iron from dilute solutions. Manganese very objectionable, clogs pipelines and is oxi dized to permanganates by chlorine, causing reddish color.
* Excessive iron, manganese, or turbidity creates spots and discoloration in tanning of hides and leather goods.
9Constant composition; residual alumina1 < 0.5 ppm.10Calcium, magnesium, iron, manganese, suspended matter and soluble organic matter may
be objectionable.

14 WATER RESOURCES, NEUSE RIVER BASIN, NORTH CAROLINA
health. In 1946 the United States Public Health Service established chemical and physical specifications for drinking water used on interstate carriers as follows:
Iron and manganese together.....................................................................ppm.... ^ 0.3Magnesium................................................................................................... PPm » -^ 125Chloride..............................._..................................................................... PPm....^ 250Sulfate ........................................................................................................ ppm....^ 250Fluoride ................................................................................... .. PPm - 1.5Lead ........................................ ............-..........................................»... PPm - -^ .1Color......................................................................... ................... - units.. ..^ 20Total solids.................................................................-.... .. ....» PP m- -^ 1500
11, 000 ppm permitted if no other water is available.
The above specifications have since been adopted by the American Water Works Association and most municipalities as standard for public water supplies. Water containing less than 500 ppm of dissolved solids generally is satisfactory for most domestic and industrial uses. However, an excessive iron content or hardness may cause difficulty in some uses. Waters containing more than 1, OOOpprri of dissolved solids are likely to include certain constit uents that make them unsuitable for domestic or industrial uses.
Information on hardness of water is of great importance. In domestic use hardness is recognized by the difficulty in obtaining a lather without an excessive consumption of soap; the insoluble, sticky curd that results in washing processes using soap, and the scale formed in vessels in which the water is boiled. Industry gives much attention to hardness in water supplies because it af fects manufacturing processes and the finished product. Further more the scale deposited in hot-water pipes, hot-water heaters, and steam boilers, results in economic loss through loss of heat transfer, increased fuel consumption, and breakdown of equip ment. Calcium and magnesium are the principal causes of hard ness. Other constituents, such as iron, manganese, aluminum, barium, strontium, and free acid also cause hardness but generally they are not present in sufficient quantities to have an appreciable effect on the hardness. Water having a hardness of less than 60 ppm is usually rated as soft and suitable for most purposes. Hard ness ranging between 60 and 120 ppm maybe considered moderate, but it does not seriously interfere with the use of the water except in high pressure steam boilers and in some industrial processes. Water having a hardness ranging from 121 to 200 ppm is hard, and, in the upper ranges, laundries and industries may profitably sof ten the supply. Waters having a hardness greater than 200 ppm is usually softened before being used.
Iron and manganese in excess of 0. 3 ppm are objectionable for several reason. Excessive amounts of iron and manganese cause

SURFACE WATER 15
reddish-brown stains on white porcelain or enamelware, on fix tures, and on clothing or other fabrics. These two constituents in excessive amounts, interfere with dyeing, tanning, paper man ufacturing, and the manufacture of photographic film and many other products.
Color, in water analysis, refers to the appearance of water that is free of suspended material. Generally waters are colored by organic matter leached from plants, tree roots, and organic com ponents of soils. Highly colored waters may foam in boilers and can stain processed products. It is more difficult to remove iron and to soften the water with hot phosphate solutions in highly col ored waters than in clear water. Also, color is objectionable in public water supplies for esthetic reasons.
SURFACE WATER
During North Carolina's history, the Neuse River has played an important part in the development of the region. From the time of the early settlements when New Bern was the colonial capital, the river was the artery upon which ships traveled inland. As shipping diminished, the River and its tributaries supplied power in the operation of grist and saw mills, and water for municipal and industrial use, generation of electric power, recreation, and other uses. At New Bern the Neuse River drains an area of 5, 040 square miles including the Trent River area.
The rivers and creeks are valuable assets, but at times they can become liabilities. There have been occasions when stream- flow was inadequate to meet the established requirements of many users in the basin. At still other times floods have menaced ex tensive areas, particularly in the lower reaches.
Streamflow information consists of continuous records of flow at gaging stations on the rivers and smaller streams and of peri odic and occasional measurements of flow at other sites. At present, 14 gaging stations are operated within the basin, some having been maintained since 1925 (see fig. 4). On many small streams where no continuous records of flow are available, meas urements of streamflow have been made during periods of low flow to supply a more complete coverage of the area. Records of daily flow and results of miscellaneous measurements are published in annual water-supply papers of the U. S. Geological Survey. Gaging sites at which continuous records of flow are not collected are known as partial-record stations. Locations of complete-record gaging stations and partial-record stations are shown on plate 1 and pertinent descriptive data are given in table 2.

Tab
le 2
. St
ream
-gag
ing
site
s an
d si
tes
for
sam
plin
g qu
alit
y of
wat
er in
the
Neu
se R
iver
bas
in
No.
(p
l.
1)
1 2 3 4 5 6 7 8 9 10 11
12 13
Gag
ing
stat
ion
Sw
ift
Cre
ek n
ear
McC
ulle
rs
Mid
dle
Cre
ek n
ear
Cla
yto
n.....................
Dra
inag
e ar
ea
(sq.
m
iles
)
66.5
150 4.9
171
526 13.2
21.0
97.8
8.75
3.90
1.1
40
53.9
80.7
Typ
e an
d le
ngth
of
reco
rd
Dis
char
ge
Typ
e
Dai
ly
Dai
ly
Dai
ly
Dai
ly
Dai
ly
Par
tial
Par
tial
Par
tial
Par
tial
Par
tial
Dai
ly
Par
tial
Dai
ly
Num
ber
of
year
s 26
28 28
26 26 3 5 5 3 3 26 5 14
Chem
ical
qua
lity
Typ
e
Dai
ly
Wat
er
yea
r
1944
Loc
atio
n
|O
rang
e C
ount
y,
lat
36"0
4tN
, lo
ng.
79°0
6'W
, 1.
000
ft
^
belo
w
brid
ge o
n S
tate
Hig
hway
86
at H
ills
boro
. gj
D
urha
m C
ount
y, la
t 36
°11'
00",
lo
ng.
78°5
2'45
*1.
{ O
m
ile
abov
e L
ake
Mic
hie,
1}
mil
es n
orth
of
Bah
ama,
£g
an
d ij
r m
iles
abo
ve D
ial
Cre
ek.
fj
Dur
ham
Cou
nty,
la
t S
e'lO
'SS
", l
ong.
78
°51'
20J",
f
$
mil
e ab
ove
mou
th a
nd L
ake
Mic
hie,
an
d l£
mil
es
nort
heas
t of
Bah
ama.
Z
D
urha
m C
ount
y,
lat
36"0
8'55
",
long
. 78
"49'
43",
90
0 ft
cj
be
low
Dur
ham
mun
icip
al d
am,
3 m
iles
sou
thea
st o
f ^
Bah
ama,
an
d 5
mil
es a
bove
Eno
Riv
er.
^
Gra
nvil
le C
ount
y,
lat
36"0
2'07
",
long
. 78
°44
159
1',
g
at F
ish
Dam
bri
dge,
2i
mil
es s
outh
of
Nor
thsi
de.
w
Wak
e C
ount
y,
lat
3V
58'0
1",
lo
ng.
78e3
8'08
tl,
at
&
high
way
bri
dge
3 m
ile
abov
e m
outh
, If
mil
es
eo
nort
h of
Bay
leaf
, an
d 3?
mil
es n
orth
wes
t of
Fal
ls.
^
Wak
e C
ount
y,
lat
SS
'SS
'IO
",
long
. 78
e35
'30
",
at
g
brid
ge o
n U
. S.
H
ighw
ay 2
64,
1 m
ile
abov
e m
outh
, an
d 4i
mil
es w
est
of W
ake
For
est.
2
Wak
e C
ount
y,
lat
35'5
0'1
5",
lo
ng.
78e4
0'4
5",
at
O
U
. S.
H
ighw
ay 1
5A,
4j
mil
es n
orth
wes
t of
Ral
eigh
. H
W
ake
Cou
nty,
la
t S
S'S
l'ig
",
long
. 78
°39'
43",
li
S
m
iles
abo
ve m
outh
, an
d 3
\ m
iles
wes
t o
f M
illb
rook
. O
W
ake
Cou
nty,
la
t 35
°49'
18",
lo
ng.
78e3
7'4
7",
at
>
cu
lver
t on
Six
For
ks R
oad,
5
mil
e ab
ove
mou
th
§
2|
mil
es
sout
hwes
t of
Mil
lbro
ok.
E
John
ston
Cou
nty,
la
t 35
039
f, lo
ng.
78s
25',
at S
tate
g
Hig
hway
42,
3
mil
es e
ast
of C
layt
on.
Wak
e C
ount
y,
lat
35
"4r,
lo
ng.
78"3
91,
at h
ighw
ay
brid
ge ?
mil
e be
low
unn
amed
cre
ek,
and
2j
mil
es
nort
heas
t of
McC
ulle
rs.
John
ston
Cou
nty,
la
t 35
"34
I10t
l,
long
. 78
"35'
30",
at
S
tate
Hig
hway
50,
9?
mil
es s
outh
wes
t of
Cla
yton
.

SURFACE WATER 17
fl rta«
>
13'ia,
CQ1-1
S
j5 rf
le Creek near Smithfie
T3
§
n.
115CO J3 rt
i i
Partial
oOSc-
Creek near Four Oaks.
y
3
10
ill
IO
731eu
0
t>iH
I13 %
rt
WJ ^
s
co
°AW ^'° 8 | 1'
rH OJ U3 * OS OS
j !CO CO U3 (N (N
* * 1 g 1 S
0
OS O rHCQ OS C4)W CO
(M
j
River near Princeton. River near Goldsboro. Creek near Goldsboro.
S3 ff H (U gJ 2 M
C- 00 Oi
Lenoir C
"3
Partial
IO
|
j a
tg Creek at Falling Cre
3UH
a
Lenoir C
0
OS
3 Q
CO <N
1
OSeo<N
£
River at Kinston.......
3
^
*<T
10
Partial
i-i co
I
: !
rf
§
(U
(M (M
6 f
2
73
eu
(M
00
!!
u t>a aa.s 3u£
a
e *
§21.3
CO (M
icoN
!
rf
ntnea Creek near Wils«
Q
6
rfieb
is!o,aj ^(5
10
Partial
t>OS
|
-T
1
i23
£
«
i]loU3 OJ rH
3 Q
10
I-I
00
rfi
ntnea Creek at Hooker
Q
<3
co(M
J a S bb Sjj Xrt.0
10
Partial
(M
IO
i..a
Creek near Fort Barnwe
JJa
^
^w ^
U3 U3 OJOi rH rH
IICO
1(M00"-I
:
Creek near Vanceboro
1V)
00
1 1
CO IO
CO
i
1
Jfr
00co
River near Trenton....
18 WATER RESOURCES, NEUSE RIVER BASIN, NORTH CAROLINA
1 Index No. | (PL 1)
1
2
3
4
5
11
13
17
18
24
26
28
29
Water years ending September 30
to o tn o m of pa co n ^i ^i tn "3 09 09 ro 09 o> on*-« I-H l-t ,-t ,_, ,-4 1 I
mWWWIfi^w"fimmo^ ^^^^
e
%&m
Gaging station.
Eno River at Hillsboro
Flat River at Bahama
Dial Creek near Bahama
Flat River at dam, near Bahama
Neuse River near Northside
Neuse River near Clayton
Middle Creek near Clayton
Little River near Princeton
Neuse River near Goldsboro
Neuse River at Kinston
Contentnea Creek near Wilson
Contentnea Creek at Hookerton
Swift Creek near Vanceboro
Trent River near Trenton
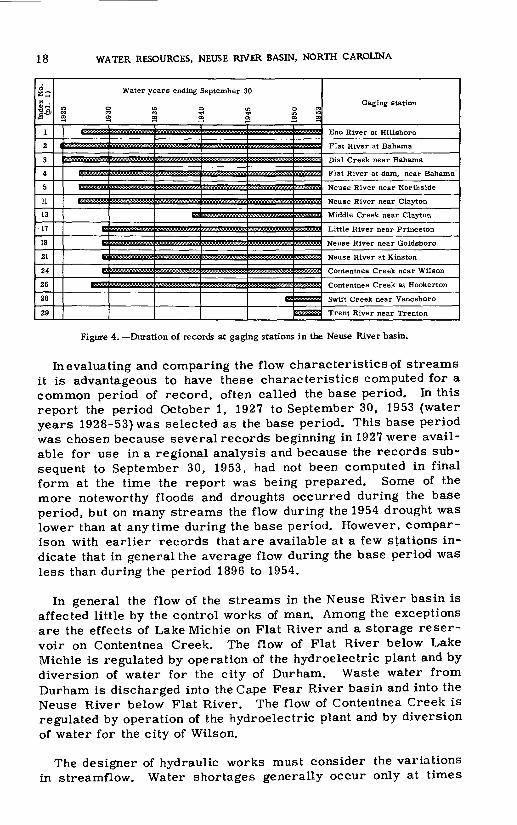
Figure 4. Duration of records at gaging stations in the Neuse River basin.
In evaluating and comparing the flow characteristics of streams it is advantageous to have these characteristics computed for a common period of record, often called the base period. In this report the period October 1, 1927 to September 30, 1953 (water years 1928-53) was selected as the base period. This base period was chosen because several records beginning in 1927 were avail able for use in a regional analysis and because the records sub sequent to September 30, 1953, had not been computed in final form at the time the report was being prepared. Some of the more noteworthy floods and droughts occurred during the base period, but on many streams the flow during the 1954 drought was lower than at anytime during the base period. However, compar ison with earlier records that are available at a few stations in dicate that in general the average flow during the base period was less than during the period 1896 to 1954.
In general the flow of the streams in the Neuse River basin is affected little by the control works of man. Among the exceptions are the effects of Lake Michie on Flat River and a storage reser voir on Contentnea Creek. The flow of Flat River below Lake Michie is regulated by operation of the hydroelectric plant and by diversion of water for the city of Durham. Waste water from Durham is discharged into the Cape Fear River basin and into the Neuse River below Flat River. The flow of Contentnea Creek is regulated by operation of the hydroelectric plant and by diversion of water for the city of Wilson.
The designer of hydraulic works must consider the variations in streamflow. Water shortages generally occur only at times

SURFACE WATER 19
when stream runoff is considerably below normal and they are of ten mistakenly referred to as drought shortages when they really should be described as resulting from inadequate planning or from increased demands outrunning the expansion of facilities.
The data presented within this report generally will be adequate for preliminary planning. In order to conserve space much of the data is given in tabular form. However, a few sample graphs have been given to illustrate differences in characteristics of streams. The reader will be able to plot additional curves as needed, per haps by adding them to the graphs that have been given. The data presented for partial-record stations and at short-term gaging stations are obtained from relationships with other stations and therefore cannot be considered as reliable as information from the long-term gaging stations. The data presented for partial- record stations will not take the place of detailed studies neces sary for hydraulic works. Care should be exercised in using the "per square mile" data even on the same streams because all parts of most drainage areas do not have similar runoff charac teristics or equal yields per unit of area. In general, the possible error increases with an increase in distance between the gaging station and the place where information on flow is desired.
In appraising the adequacy of a specific source for water supply, the requirements will be known for water consumption or for waste disposal. To meet these requirements the percent of time the flow is sufficient to meet the needs must be determined. Informa tion is also required on how frequently the flow will be insufficient, how long the deficiency will persist, and what storage will be required to meet the deficiency. This report has been designed to provide data that will serve as a guide in preliminary planning to meet these requirements.
FLOW CHARACTERISTICS
Streamflow varies greatly from day to day, season to season, and from year to year. (See fig. 22). The long-term average streamflow per unit of area, however, is relatively uniform over the entire Neuse River basin. No significant long-term trend to ward either an increase or decrease in the annual flow has been discovered during the period of record. In the Neuse River basin the average streamflow is approximately uniform per unit area (0. 65 mgd per square mile) for streams in the rocky Piedmont as well as for those in the sandy'Coastal Plain. The high and low flow of streams in these two areas, however, reflect differences in rainfall, topography, geology, vegetation, size of drainage area, and other factors.
20 WATER RESOURCES, NEUSE RIVER BASIN, NORTH CAROLINA
Curves showing streamflow characteristics are usually pre pared for the period of record at the gaging site under study; how ever, these curves can be adjusted to longer periods by statistical methods using records on nearby streams. It is also possible to make a regional analysis of the data by statistical methods. A regional analysis is a study to make the best possible evaluation of the flow characteristics of a stream by taking into consideration records from nearby streams. Streamflow data in this report are generally for the base period, October 1, 1927 to September 30, 1953 and a regional analysis has been made of the low-flow fre quency data. Where the period of record is significantly different from the base period, curves for both periods may be shown, as in figure 7. Data for stations with only short periods of record were extended to the base period, where practicable. For sites where only partial records of discharge were obtained (see table 2), data were computed for the base period by correlation with data from nearby gaging sites.
The precipitation during the base period was about normal (figs. 1 to 3, and therefore, the streamflow was probably about normal. Assuming that future flow will follow the pattern of flow measured in the past, curves showing the flow characteristics during the base period may be used to estimate the probable occurrence of a spec ified discharge.
DURATION OF FLOW
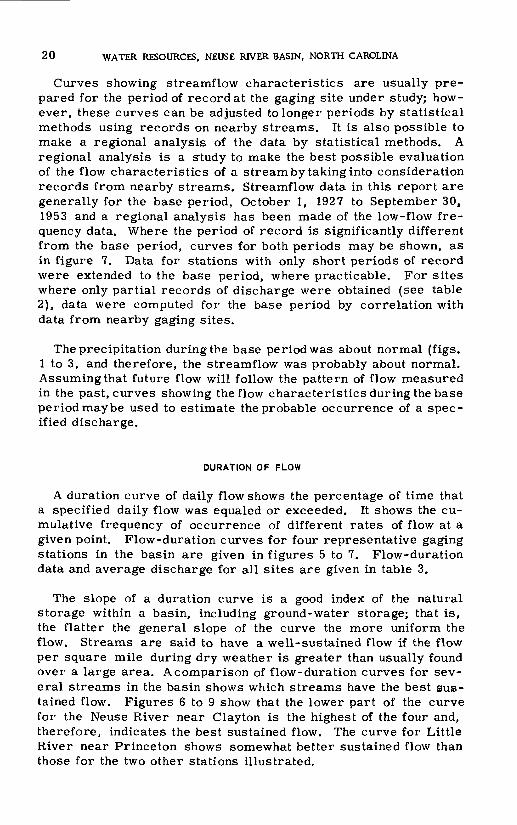
A duration curve of daily flow shows the percentage of time that a specified daily flow was equaled or exceeded. It shows the cu mulative frequency of occurrence of different rates of flow at a given point. Flow-duration curves for four representative gaging stations in the basin are given in figures 5 to 7. Flow-duration data and average discharge for all sites are given in table 3.
The slope of a duration curve is a good index of the natural storage within a basin, including ground-water storage; that is, the flatter the general slope of the curve the more uniform the flow. Streams are said to have a well-sustained flow if the flow per square mile during dry weather is greater than usually found over a large area. A comparison of flow-duration curves for sev eral streams in the basin shows which streams have the best sus tained flow. Figures 6 to 9 show that the lower part of the curve for the Neuse River near Clay ton is the highest of the four and, therefore, indicates the best sustained flow. The curve for Little River near Princeton shows somewhat better sustained flow than those for the two other stations illustrated.

SURFACE WATER 21
100 BO-
80
40
20
10 8
6 5
*=
3
2
1 .8
JE j_.2
.1 .08
.05
.04
02
.01
006 005 004
003
002
100
60 SO 40
30
20
10 8
6 5
Y PER SQUARE MILE
S *
X .6 £ .5 S .4
E,IN MILLION GALLO g U » o,
| .06 5 05 I .04
.03
.02
.01 .008
.006
.005
.004
.003
.002
.001
^
k-^
F UA' nr
VS
VER,
\
BAS SPE
^v~JfvV
tlOD, 1
k\
\N\
127-53IN
^s S\
^ S NEUSE RIVER, BASE PERIOD, 1927-53 ^DRAINAGE AREA: 1140 SQUARE MILES
>
\\^
X\
S->EXAMPLE:
- THE DAILY FLOW Or . FLAT RIVEH AT BAHAMA
i- PROBABLY WILL BE EQUAL - - TO OH BE GHEATEH THAN -
0ILE FOB 95 PERCENT
IF THE TIME
^^
\
'V
-^ ^*
"
0.01 0.05 01 0.2 0.5 1 98 99 39.1 99.8 99.9 99.95 9959
Figure 5. Duration curve of daily flow, Flat River atBahama andNeuse River near Clayton.N. C.
As an example of the further use of flow-duration, curves, as sume that it is desired to locate an industrial plant on a site adjacent to Middle Creek at which the drainage area is 100 square miles and that construction of a storage dam is not planned. Fur ther assume that a flow of 2. 5 mgd (0. 025 mgd per square mile from 100 square miles) is required for plant operation. Inasmuch as the observed minimum flows are less than the required flow, it is necessary to know the probable number of days per year that there will be a shortage of water. From the curve for the base period 1928-53 (fig. 6), a flow of 0.025 mgd per square mile will be available 98 percent of the time assuming that the flow in'the future will be similar to that during the base period. Thus over a long period of time there will be sufficient water 98 percent of the

DIS
CH
AR
GE
, IN
CU
BIC
FEE
T PE
R S
ECO
ND
PER
SQ
UA
RE
MIL
E
DIS
CH
AR
GE
,IN.C
UB
IC
FEET
PER
SEC
ON
D
PER
SQ
UA
RE
MIL
E
S
£ u
i §i
So
>~
hj
(o
^cjiaic
o*-
ro
288 888 8
b
=>
b p
oo
b
......
*. s
ui&
csS
oiX
ttM
S3
in
£
ui5
oo
i-*
N>
w
.fc
01 m
qo
i-.
ro
u
i^cn
oic
oo
°
Tim
iiiT
ini
i i
i 11
uTi
mi
i i
i i ii
iTT
iTn
i T
i i itii
i in?
i
DIS
CH
AR
GE
,IN M
ILLI
ON
GA
LLO
NS
PER
D
AY
PER
SQ
UA
RE
MIL
E
yton, N.
C
DIS
CH
AR
GE
, IN
MIL
LIO
N G
ALL
ON
S P
ER D
AY
PER
SQ
UA
RE
MIL
E
_U
f_l2
8
8
2 S!
S S
- io
o. i.
0,0,
co
>-
b
d
5
SM
s °
s 1s Sa 1
^ £ s 18 IO $ 8 %
_^--
^'' '
x""
.''
g > O *
--S i s s 2 i 1 s H
/f
'^'
SO
f
»S n^
^ Sg
ss
^ = 8 1$ B? Sa / '
i X § i i-; o n X i g \ ^
g |-- ^
<
g S p s s \^^ f t
, 'A
J
V//
/* i o o n g S z
//>
'//
*_
. '
I'/
y /j ?
. ., i / i_ / /'

SURFACE WATER 23
Table 3. Duration of daily flow in the Neuse River basin, 1928-53
Drainage area sq miles.
Percent of time: 0.1..............5.............
2...............5...............
10 .... ...........20...............30...............50...............70...............80...............90...............95...............98...............99...............99.5.............99.8.............99.95 ...........
Drainage area sq miles..
Average.........<Perc ent of ti m e:
0.1..............5.............
2...............5...............
10...............20...............30...............50...............70...............80...............90...............95...............98...............99 .............. .99.5.............99.8.............99.95...........
Flow, in million gallons per day per square mile, which was exceeded or equaled for indicated percent of time
1. Eno River at Hillsboro
66.5
0.638
23.3 9.82 4.42 2.13 1.21
.690
.486
.282
.167
.188
.063
.040
.022
.0082
.0052
.0039
.0027
2. Flat River at Bahama
150
0.629
22.4 12.7
5.30 2.26 1.21
.646
.444
.241
.125
.081
.038
.019
.0069
.0042
.0031
.0023
.0018
3. Dial Creek near Bahamaa
4.9
0.579
19.0 10.3 4.09 1.91 1.11
.646
.462
.264
.138
.086
.030
.0032
4. Flat River at dam, near Bahama
171
0.60
19.3 9.41 3.17 1.63 1.22
.865
.548
.265
.147
.061
.017
.0074
.0026
5. Neuse River near Northside
526
0.66
17.1 9.09 4.40 2.36 1.45
.811
.547
.289
.150
.100
.046
.023
.013
.0098
.0079
.0060
.0046
6. Lower Barton Creek near Bayleaf
13.2
0.72
.695
.397
.264
.215
.176
.145
.118
.100
.085
Flow, in million gallons per day per square mile, which was exceeded or equaled for indicated percent of time
T, B?rse Creek near Wake Forest
21.0
0.70
.560
.409
.317
.274
.215
.182
.138
.122
8. Crabtree Creek near Raleigh
97.8
0.63
.628
.317
.159
.106
.056
.033
.017
.010
9. Mine Creek near Millbrook
8.7
0.67
.676
.389
.264
.220
.173
.145
.120
.105
10. Big Branch near Millbrook
3.9
0.68
.680
.381
.245
.204
.162
.138
.113
.096
11. Neuse River near Clayton
1,140
0.696
8.336.074.202 170
1.67884
.612
.380
.230
.164
.105
.074
.053
.044
.037 n*}9
12. Swift Creek near McCullers
53.9
0.72
.695
.372
.192
.128
.074
.046
.025
.016
.0096
aPeriod of record (1927-53) unadjusted for regulation by Lake Michie and power plant or for diverson to city of Durham for municipal water supply.

24 WATER RESOURCES. NEUSE RIVER BASIN, NORTH CAROLINA
Table 3. Duration of daily flow in the Neuse River basin, 1928-53 Continued
Drainage area sq miles..
AveraeePercent of time:
0.1..............5.............
5...............10................20................Of)
50...............70 .............. .80...............on
95 ...............98...............qq99.5.............99.8.............. 99.95 ............
Drainage area sq miles..
Percent of time: 0.1..............5.............
2...............5.. ............ .
10...............20...............^n50................70................80................90................95 ............... ,98................99................99.5..............99.8..............99.95 ............
How, in million gallons per day per square mile, which was exceeded or equaled for indicated percent of time
13. Middle Creek near Clayton
80.7
0.729
8.17 6.09 4.04 2.72 1.76 1.04
.705
.376
.192
.128
.074
.046
.025
.016
.0096
.0043
.00080
14. Middle Creek near Smithfield
124
0.72
.688
.375
.190
.128
.074
.047
.027
.018
.012
15. Black Creek near Four Oaks
79.0
0.73
.687
.273
.069
.027
.0078
.0025
16. Buck Swamp near Dudley
17 .-0
0.68
.684
.365
.186
.122
.063
.036
.017
17. Little River near Princeton
229
0.677
6.74 3.87 2.43 1.64
.988
.677
.373
.206
.144
.083
.053
.030
.019
.011
.0048
.0032
18. Neuse River near Goldsboro
2,390
0.659
2.73 1.65
.865
.595
.373
.227
.162
.103
.070
.051
.042
.035
.030
.024
How, in million gallons per day per square mile, which was exceeded or equaled for indicated percent of time
19. Stony Creek at Goldsboro
21.0
0.68
.677
.375
.206
.145
.083
.054
.029
.019
20. Falling Creek
Iks845.4
0.67
.669
.384
.216
.155
.093
.061
.036
21. Neuse River at Kinston
2,690
0.674
2.811.68
.889
.625
.408
.259
.190
.125
.089
.065
.054 (\A.n041
.034
22. Deep Run at Deep Run
6.1
0.74
.678
.477
.350
.275
.199
.152
.121
.103
23. Moccasin Creek near Middlesex
28.2
0.73
.688
.378
.190
.128
.074
.045
.025
.016
.0096
24. Contentnea Creek near Wilsonb
236
0.646
9.53 6.44 3.78 2.36 1.56
.945
.652
.334
.137
.071
.024
.0074
.0025
.0014
Period of record (1930-53) unadjusted for regulation by municipal reservoir and power plant or for diversion to city of Wilson for municipal water supply.

SURFACE WATER 25
Table 3. Duration of daily (low in the Neuse River basin, 1928-53 Continued
Drainage area sq miles..
Percent of time: 0.1...................5..................
5... ................ .10 ................... .20....................^n50....................70....................anon
95 ....................98 ....................qq99.5..... .............99.8..................99.95................
Flow, in million gallons per day per square mile, which was exceeded or equaled for indicated percent of time
25. Nahunta Swamp near Snow Mil
97.1
0.67
.679
.366
.202
.142
.082
.053
.029
.019
26. Contentnea Creek at Hooker ton
789
0.613
4.26 2.78 1.68
.876
.557
.311
.179
.121
.070
.046
.032
.025
.021
.017
.014
27. Core Creek near Fort Barn we 11
59.2
0.65
.644
.301
.140
.087
.043
.024
.011
28. Swift Creek near Vanceboro
182
0.59
.522
.266
.138
.089
.043
.020
.0064
.0023
.00082
29. Trent River near Trenton
168
0.61
.550
.308
.169
.108
.058
.034
.022
.016
.013
.010
days and a shortage on 2 percent of the days. The advantages of the proposed site where a water shortage will occur 2 percent of the time could be weighed with alternate sites farther downstream (larger drainage areas) or sites on other streams where the re quired flow will be available a greater portion of the time.
The flow-duration curve does not show whether the days of in sufficient flow will be consecutive or how frequently shortages will occur. It may be possible to operate the plant for short peri ods on less than 2. 5 mgd or if not, possibly the plant can be shut down occasionally if the shortage does not occur too frequently. Therefore we need to know more about the low-flow characteris tics of the stream. How frequently will the flow be insufficient? How long will deficiencies last? How much storage will be re quired to provide the necessary flow? These questions may be answered by use of the low-flow frequency curve, curve for the maximum period of deficient discharge, and the storage-require ment curve.
LOW-FLOW FREQUENCY
The low-flow frequency curve gives the average interval at which a specific discharge may be expected to recur as the lowest flow

Tab
le 4
. M
agni
tude
and
freq
uenc
y of
ann
ual
tow
flo
w in
the
Neu
se R
iver
baa
in f
or t
he p
erio
ds o
f 1,
7,
30,
60,
and
90 d
ays,
baa
ed o
n re
cord
s of
Apr
il 1,
192
8, t
o M
arch
31,
195
3
to en
No.
(P
l.l)
1 2 3 .5 6 7 8
Gag
ing
site
sD
rain
age
area
(s
quar
e m
iles
)
66.5
150 4.9
526 13
.2
21.0
97
.8
Min
imum
da
ily
disc
harg
e of
rec
ord
(mgd
)
0.2
.24
0 2.0
Per
iods
(c
onse
cu
tive
da
ys)
1 7 30
60
90
1 7 30
60
90
1 7 30
60
90 1 7
30
60
90 1 7
30
60
90 1 7
30
60
90 1 7
Low
est
flow
, in
mil
lion g
allo
ns p
er d
ay p
er s
quar
e m
ile,
an
d re
curr
ence
'int
erva
ls,
in y
ears
2 0.04
0 .0
52
.08
3
.140
.209
.020
.028
.05
2
.099
.160
. 6*2
*2
.054
.100
.16
2
.032
.04
2
.06
6
.111
.160
.15
5
.172
.202
.242
.284
.184
.202
.238
.29
2
.348
.037
.050
3 0.0
25
.0
33
.051
.078
.117
.011
.0
16
.02
8
.052
.086
.02
1
.053
.08
7
.019
.026
.0
41
.068
.09
6
.131
.146
.170
.201
.2
27
.157
.171
.198
.243
.27
7
.203
.031
5 0.0
15
.0
19
.02
7
.037
.048
.005
3.0
07;
.012
.01
8
.025
.01
7,
.011
.0
15
.021
.0
29
.039
.104
.11
7
.134
.153
.16
8
,130
.141
.1
59
.178
.195
.011
.0
17
10
. .~
.
0.01
4 .0
21
.027
.002
5 .0
030
.004
9 .0
086
.012
.006
3 .0
07
2
.011
.016
.021
.100
.1
22
.135
.12
7
.14
8
.160
15 0.01
1 .0
17
.023
.001
9 .0
02
3
.0038
.00
65
.0
091
.005
U
.00
59
.0
08
7
.01
3
.01
7
.089
.112
.12
5
.11
8
.13
7
.149
25
"oTo
iT.0
19
.001
4 .0
01
7
.002
9 .0
049
.006
9
.00
42
.0
048
.007
1 .0
11
.014
....
....
..

10 11 12 13 14 15 16
8.75
3.90
1,140 53.9
80.7
124 79.0
17.0
29
.4
30
60
90 1 7 30
60
90 1 7 30
60
90 1 7 30
60
90 1 7 30
60
90 1 7 30
60
90 1 7 30
60
90 1 7 30
60
90 1 7 30
60
90
.075
.116
.159
.150
.164
.191
.230
.265
.143
.156
.179
.212
.245
.084
.098
.132
.184
.232
.055
.073
.110
.164
.222
.054
.072
.108
.1
64
.220
.056
.073
.108
.164
.219
.003
.006
.018
.04T
.094
.038
.057
.085
.137
.187
.048
.073
. Q99
.131
.142,
.162
.191
.215
.123
.134
.154
.178
.199
.064
.075
.097
.134
.170
.035
.047
.071
.106
.1
44
.034
.046
.070
.104
.143
.036
.048
.0
71
.104
.143
.001
.002
.006
.016
.034
.024
.033
.053
.084
.114
.02
5
.03
5
.046
.108
.120
.13
3.1
47
.161
.099
.113
.126
.141
.152
.04
6
.053
.066
.081
.09
6
.018
.025
.03
7
.053
.06
8.0
18
.0
25
.037
.053
.067
.020
.027
.039
.054
.06
8
.001
.00
3.0
05
.01
7.0
27
.039
.051
.010
.01
9
.025
.10
4
.12
3.1
33
.096
.116
.12
6
.03
2
.036
.04
4
.05
7
.067
.01
6
.028
.038
.00
42
.0
071
.01
6
.028
.03
8
.005
.00
8.0
18
.0
30
.040
.001
.019
.02
7
.007
1 .0
14
.0
20
.09
5
.115
.126
.088
.108
.119
.029
.03
2
.040
.05
1
.06
0
.011
.022
.03
1.0
019
.003
6 .0
11
.022
.030
.003
.00
5.0
13
.024
.033
.014
.021
...........
*
***
*
"""'
626*
.028
.035
,04
5
.05
2
...........
.00
07
.0
01
5
.00
72
.0
16
.0
24
...........

Tab
le 4
. M
agni
tude
and
freq
uenc
y of
ann
ual
low
flo
w i
n th
e N
euse
Riv
er b
asin
for
the
per
iods
of
1, 7
, 30
, 60
, an
d 90
day
s, b
ased
on
reco
rds
ofA
pril
1, 1
928,
to
Mar
ch 3
1, 1
95
3 C
ontin
ued
No.
(p
i. 1
)
17
18
19
20
21
22
23
Gag
ing
site
s
Neu
se R
iver
nea
r G
olds
boro
Fal
ling
Cre
ek a
t F
alli
ng C
reek................................
Dra
inag
e ar
ea
(squ
are
mil
es)
229
2,39
0 21.0
45.4
2,69
0 6.1
28.2
Min
imum
da
ily
disc
harg
e of
rec
ord
(mgd
) .65
58 81
Per
iods
(c
onse
cu
tiv
e da
ys)
1 7 30
60
90 1 7
30
60
90 1 7 30
60
90 1 7 30
60
90 1 7 30
60
90 1 7 30
60
90 1 7 30
60
90
Low
est
flow
, in
mil
lion g
allo
ns p
er d
ay p
er s
quar
e m
ile,
an
d re
curr
ence
int
erva
ls,
in y
ears
2 0.0
59
.0
76
.10
7
.15
8
.206
.08
2
.097
.130
.178
.22
7
.059
.076
.108
.15
8
.206
.067
.085
.118
.169
.218
.099
.11
6
.151
.207
.254
.1
66
.1
89
.230
.2
91
.346
.05
4
.072
.108
.163
.21
8
3
0.03
9 .0
51
.07
3
.106
.137
.06
2
.08
3
.096
.128
.162
.039
.050
.073
.106
.137
.046
.05
8
.082
.117
.147
.077
.089
.1
15
.15
1
.182
.135
.154
.183
.228
.27
3
.03
4
.04
6
.070
.1
03
.1
42
5 0.02
1 .0
29
.0
42
.05
6
.071
.04
5
.051
.064
.078
.094
.02
1
.030
.0
42
.05
6
.071
.03
5
.04
8
.06
4
.080
.057
.065
.080
.097
.113
.109
.12
0
.14
0
.16
4
.185
.01
8
.02
5
.037
.05
3
.06
7
10
0.00
71
.010
.0
19
.03
2
.04
2
.030
.034
.042
.054
.064
.019
.0
32
.04
2
.038
.048
.041
.045
.055
.070
.08
2
. 105
.1
25
.142
.016
.028
.037
15
0. 0
045
.00
68
.0
14
.02
6
.035
.02
7
.030
.03
8
.049
.05
7
.01
4
.02
6
.035
.041
.037
.040
.050
.06
2
.07
2
.114
.129
.011
.02
2
.030
25
0. 0
003
.004
1 .0
09
7
.019
.0
27
.0
24
.0
26
.034
.04
3
.050 ..
..
*
*
*
* **
.033
.036
.044
.05
5
.06
4
........... *
....
....
..
CO
00

25 26 97 28 29
97
.1
789 59.2
182
168
8.4
1.0
1.9
1 730
60 90
1 7 30
60
90 1 7
30 60
90 1 7 30
60
90 1 7 30
60
90
.059
.07
5.1
06
.1
56
.203
.054
.066
.092
.135
.179
.027
.037
.05
9.0
98
.13
9
.02
8.0
39
.06
2
.093
.139
.042
.053
.079
.12
3
.169
.039
.050
.07
2
.104
.134
.039
.048
.065
.091
.12
2
.016
.022
.035
.05
8
.081
.013
.021
.038
.061
.08
9
.028
.036
.052
.077
.110
.021
.029
.04
1
.05
6.0
70
.02
7.0
32
.041
.052
.064
.011
.017
.025
.03
4
.0032
.0065
.01
4
.025
.03
7
.018
.022
.03
0
.04
0
.05
1
.01
9
.032
.041
.01
8.0
20
.026
.034
.04
2
.01
2
.017
. 000
28.0
0060
.0
02
5
.00
80
.0
15
.0
11
.01
2
.017
.02
3
.031
.01
4
.026
.03
5.0
15
.017
.02
3
.03
0
.03
6
.00
91
.0
12
. 000
23
.00
12
.0
04
7
.0096
.01
0
.014
.02
0
.026
»
**
.013
.01
5
.01
9
.026
.03
1
....
....
...
...........
"*
****
****
****
w
....
....
...
^I~
!~"~
* C
O
CO

30 WATER RESOURCES, NEUSE RIVER BASIN, NORTH CAROLINA
Table S< Lowest flow for 7 consecutive days in each year in NettseRiverhasin, 1925*-52
[Million gallons per day]
Year (beginning
April 1)
1QO 1?IQOfi
1927IQOfi
1929............... 1930...............1931...............1932..... .......... 1933...............1934...............1935...............1936...............J-*7<3 '»* * *
1938...............1939............... 1940...........M.d1941............... 194 2............... lt/4o, »*** iy4 4. 1945...............1946...............1947...............1948...............1949... ... ......... 1950............... 1951...............1952...............
Gaging station and No. (pi. 1)
3(4
Q> O
4ofl££
4.2 8.6 2.1 2.5 .9
1.0 7.0 2.7 5.5
11.0 7.0 8.8 3.0 .2
3.8 1.7 2.9 5.4 4.2 2.9 2.6 6.3 4.2 1.4 5.6
rt
> £*J 3^ s(N
0..431.3 6.1 4.6
15 1.1 2.3 .27 .36
10 4.2 6.4
11 11 9.7 5.9 .59
8.6 .83
2.1 14 3.8 5.8 4.5 9.9 6.8 1.7
11
% *« si§inCO
0.230 .03 .16 .63
0 .01
0 0 .26 .13 .28 .44 .46 .70 .18
0 .19
0 0 .34 .14 .25 .28 .43 .32
0 .13
1TJ rtsi il2a 38 £ *
0.54 .30
29 .45 /78 .59 .27
21 2.3 2.4
15 0
16 2.8 1.4 2.3 .19
1.8 5.0 5.2 5.4 6.5 5.8 4.1 1.9 6.3
%01aH 0)
?:§ <2|!£01ZIO
28 22 70
!.(. 12
2.4 4.1
60 16 34 55 21 51 22 4.£
28 4.S
15 46 24 18 23 41 36 10 22
rt %
*Ss&" r~!3 U
£r-51-1
138 91
277 69
101 34 34
165 96
169 239 131 190 97 39
128 54 68
128 153 106
85 184 120
50 74
% <aa A
SS aK OU §. <u j*!3u-a §COr-(
.......
*
» *
***
»«
1.7 2.3 6.5 6.7 4.6 4.9 7.4 5.3 1.1
13 4.6 .6
2.1
% %(4 _, A) A
|fl(2 gHi 0 S'S1-
c-^r-l
5 13
.8 9
23 16 18 30 24 26 12
2 9 7
11 14 20 15 13 34 17
5 13
3 % " 8
P241 "Bgo £COr-l
116 186
64 92
283 180 310 478 353 333 163
69 200 127 123 274 313 259 167 458 253
83 162
rt(4 01
*1
£3is2T-5
(N
200 244 92
123 426 348 487 512 488 443 236 114 311 202 200 372 468 353 205
. 571 347 141 141
X01
2!U aS3I s 1^§3 u
a
1.0 7.2 .1.1
18 6.1 8.7
14 16 15 8.0 .6 .9
1.3 2.4
20 12 8.6 1.0
19 13
2i!i
30)s ! rtg|l1*3*CD <N
210 43 49 9.3
12 81 71 79 66 70 88 43 23 34 30 29 06 76 59 30
106 68 17 32
in the climatic year (April 1 to March 31). Low-flow frequency curves for the average flow during periods of 1, 7, 30, 60, and 90 consecutive days are shown in figure 8 to 11. These curves do not imply a regularity of occurrence but rather the probable average interval between specified low flows. Assuming that the flow during the period April 1928 to March 1953 was normal and that future flow will follow the pattern of flow measured in the past, these curves may be used to predict future streamflow. For example, on Neuse River near Clayton the lowest daily flow in a year may be expected to be equal to or less than 0. 046 mgd per square mile at an average interval of 5 years, or a total of 20 times in 100 years (fig. 9). The magnitude and frequency of low flows for the various periods for all gaging sites are shown in table 4.
The pattern of low flow in many streams becomes irregular in the lower reaches of the stream owing to regulation of the

SURFACE WATER 31
discharge upstream. The regulation frequently causes a period of very low flow of short duration within a longer period of relatively uniform flow. The minimum daily flow of these streams is often considered too limiting as a measure of the flow characteristics for many uses of the water. Where the regulation is minor and when it occurs in uniform weekly patterns, the average 7-day flow is a better indication of the flow characteristics of the stream. The lowest average 7-day flow for each year of record at gaging stations in the Neuse River basin is shown in table 5.
1.5
1.0
.8
.5
.4
.3-
2-
3iu1 .1-» .08
\ ~\ -06
5 .05-
a .04-*_ .03-
5 .02-J
i l-=5 .008-
.006-
.005-
.003-
.002-
.001
.0006
.8
.6
.5
.4
.3
.2
2 - 1U -08(C.
g, .06
cc .05
I"
g.03
§.02
5
1
^ .01zui.008 gi'0065.005
.004
.003
.002
.001
1.
\N
V
\
\
\
k,S
Am.MINI ).001
V
\\s
\
\s\\
IGEJ WUM S MG
\
\
\
kS
S
RE; DAn3PE
\
V
\
ss
L: ^Y R
\
S
^
.
k
Si DC 3Q1
\
\
\
\
\\
\
s\\\
SQUAR] 3CHARGP JARE MI
\y\\
\
\
\
\
: MIL:I, 192E LE
\\
>
\\
\|
\|
\
IS. -53,
s\\\ '\
s\\
N\\\
\\\\
\\\\s\^\
S
\\s\\
>
\V
\
\\
\.
V
s
\
\,
\
^
\ s
\ s
s s
\ s^
s^\
s, "s.'v
\^
S,
s\X^
X
»s^^-
\
^xX^
xx
^
^
-6C
31
'
DAY
DAT
DAY
DA'S
DAY
;
s
s
91 1.1 1.2 1.31.415 2 3 4 5 6 8 10 20 30 40 5 RECURRENCE INTERVAL, IN YEARS
Figure 8. Magnitude and frequency of annual low flows, Flat River at Bahama, N. C., basedon period 1928-53.
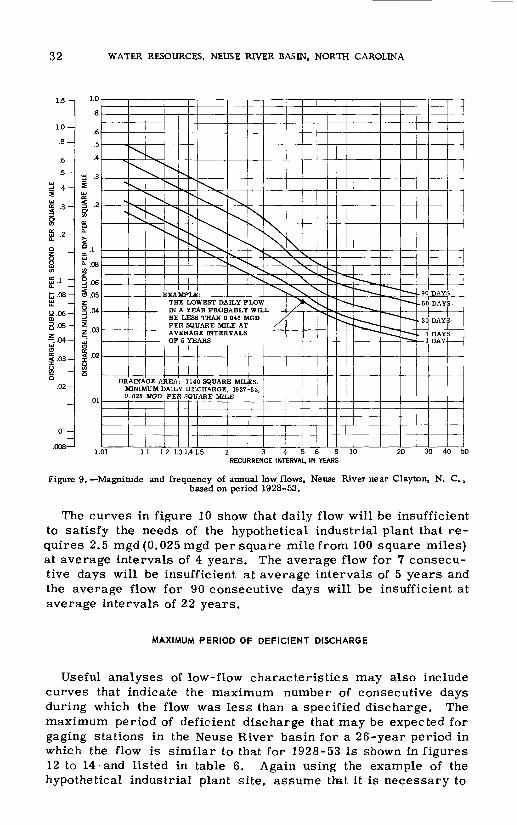
32 WATER RESOURCES, NEUSE RIVER BASIN, NORTH CAROLINA
.-
tf -
.05-
DISCHARGE, IN MILLION GALLONS PER DAY PER SQUARE MILE
2 § 8 2 W o> So "^ to io 4* ui o> ipo c
"
>X
[\\X
^
^^v
V,
\\
\\^
X
V
X,
V
X
V
\
SXAMPLI THE LO IN A YE BE LESS PER SQ1 AVERAC OF 5 YE
^ ^"^v^
^v
\,
\
x^J^s.
^
kX
X
WEST DAILY FLOW AR PROBABLY WIL
THAN 0.046 MGD JARE MILE AT E INTERVALS ARS
DRAINAGE AREA: 1140 SQUARE MILES. MINIMUM DAILY DISCHARGE, 1927-53, 0. 026 MGD PER SQUARE MILE
V
s^
X
r^
/
\ *\N 1
s]
vS
XS:^X,
^N^
^
s
-J^
v
N,
*J
"^
^
<
*»
^
--,
^.
"s
^^^^--^^-
^^J^~
-~~, - -.~-^
~^_-^
~~^
~-^. ~^,
.90
.60
30
. 7
DAY
DAY
DAY
DAYDAY
' 5-
!
g
11 1 2 1.3 1.4 1.5 2 34568 RECURRENCE INTERVAL, IN YEARS
Figure 9. Magnitude and frequency of annual low flows, Neuse River near Clayton, N. C., based on period 1928-53.
The curves in figure 10 show that daily flow will be insufficient to satisfy the needs of the hypothetical industrial plant that re quires 2.5 mgd (0.025 mgd per square mile from 100 square miles) at average intervals of 4 years. The average flow for 7 consecu tive days will be insufficient at average intervals of 5 years and the average flow for 90 consecutive days will be insufficient at average intervals of 22 years.
MAXIMUM PERIOD OF DEFICIENT DISCHARGE
Useful analyses of low-flow characteristics may also include curves that indicate the maximum number of consecutive days during which the flow was less than a specified discharge. The maximum period of deficient discharge that may be expected for gaging stations in the Neuse River basin for a 26-year period in which the flow is similar to that for 1928-53 is shown in figures 12 to 14 and listed in table 6. Again using the example of the hypothetical industrial plant site, assume that it is necessary to

SURFACE WATER 33
i.o
1.0
.8
.5-
.4-
.2-
I
1.1-
§ .08-cc. ^ .06-0I'05 "
ft .04- cc ^ .03-
t
|.02-0 Oz
)ISCHARGE,
.006-
.005-
.003-
.002-
.001
.8
.6
.5
.4
.3
.2
ni .1
. . . DISCHARGE, IN MILLION GALLONS PER DAY PER SQUARE Ml
o o g . .....
£ § §? 60 2 S co £ ui o> GO S S w S 01 o> Co
^
N
\
\
X
XX
X
X
XV\
X
\
\
X
X^
\
X,
\
H
EXAMPLE: THE LOW A YEAR I LESSTH# SQUARE DJTERVA THE LOW IN A YEA BE LESS PER SQU/ AVERAGI 5 YEARS. 90-DAY F PROBABI THAN 0.0 MILE ATOF 22 YE
"X
N
s
.^
X\\\ v X-^
^5
X\
X.N
xx
_
\\ \
S
N
X
K<=
.
\\\\
^s
N->_-
EST DAILY FLOW IN ROBABLY WILL BE iN 0.025 MGDPER MILE AT AVERAGE LS OF 4 YEARS. EST 7 -DAY FLOW R PROBABLY WILL THAN 0.025 MOD \RE MILE AT I INTERVALS OF
THE LOWEST LOW IN A YEAR -Y WILL BE LESS 25 MGD PER SQUARE AVERAGE INTERVALSARs
DRAINAGE AREA: 80. 7 SQUARE MILES. MINIMUM DAILY DISCHARGE, 1940-53. 0 0048 MGD PER SQUARE MILE
^s. ss\ks
-*$
k\
\
K
\
ss
\t
\\
ss
X
\\
X
s
\
\\
\\
s
\
\
\
\x^ X
\
\ __\
\\ N
\\
"\,
^^ s
v\
\\\
\\
^
X
X
\\^
> 9C
^7
DAY
IDAY
DAY
DAYS
3AY r
S
)1 1.1 12 1.3 IA 1.5 2 3 4 5 6 8 10 20 30 40 5RECURRENCE INTERVAL, IN YEARS
Figure 10. Magnitude and frequency of annual low flows, Middle Creek near Clayton, N. C.,based on period 1928-53.

0-9
% o
re «»
CLi o
o B
B i
a
S ft
^ Ir
DIS
CH
AR
GE
, IN
M
ILLI
ON
GA
LLO
NS
P
ER
DA
Y P
ER
SQ
UA
RE
MIL
E
8ilS ??
fcSS
-SS
K°O
g]
i"S
gda
tn
x1 s// -0 gX /
/ /
X X
f /
X
/X
g I/
X^X
" .
/>x
/
/
/ /
x" ^-
^
y
/
1 o> gX X' r y /
x xj x ' / /C
O I/ /'
i/ 1 '+y / / / t 1 i
/ / .7* /
/ / / X /
t , x
/t f t- /
/ x
/)/ // /
i' / ' /
'/
/ -t- /
A i I /(
i / /t / / f
/ /
o
O £
ft
"!^
ft
Cf
M X
*
d
M
mP
rt
- CO
1
rt-
ft
ET
rt
-
n> y
?S
.Mo
"" w
Es3
: ft O
Q
3g
CTQ
^<
a o
I
H?
*
*
I wO
5
3
Sw
5O
en
&
1<
?
s- 1
M,
ro
°
X *
3
"tJ
*O
ft
03
c-h
O
....
._.
rt-
CO
3
o> ^
o
o. o
ft
S"
to
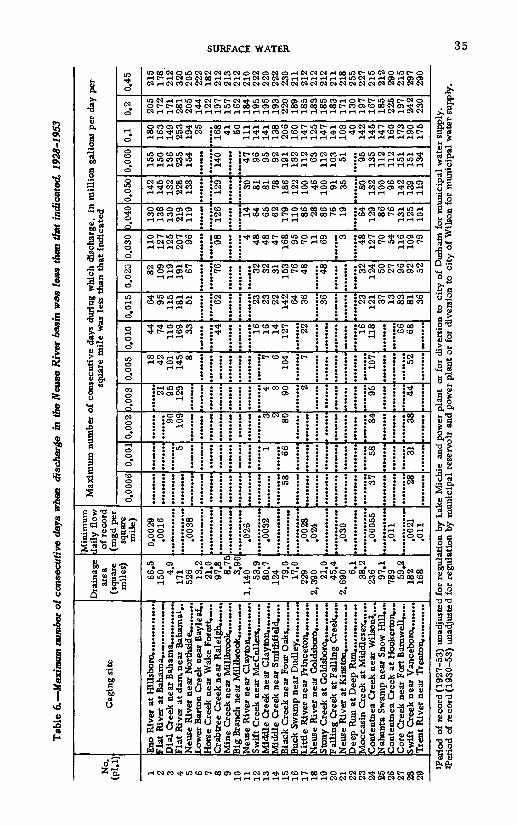
Tab
le 6
. M
axim
um n
umbe
r of
cons
ecut
ive
days
whe
n di
scha
rge
in t
he N
euse
Riv
er b
asin
was
les
s th
an t
hat
indi
cate
d, 1
928-
1953
No.
(P
U)
1 2 3 4 5 6 7 8 9 10
11
12
13
14
15
16
17
18
19
20
21
22
23
24
325
26
27
28
29
Gag
ing
sit
e
Eno
Riv
er a
t H
ills
boro
......
......
....
Dia
l C
reek
nea
r B
aham
a....
......
...
Fla
t R
iver
at d
am, n
ear
Bah
amai
,. N
euse
Riv
er n
ear
Nor
thsi
de...
......
Lo
wer
Bar
ton
Cre
ek n
ear
Bay
leaf
,, H
orse
Cre
ek n
ear
Wak
e F
ores
t.....
C
rabt
ree
Cre
ek n
ear
Ral
eigh
......
. M
ine
Cre
ek n
ear
Mil
lbro
ok...
......
Ji
g B
ranc
h ne
ar M
illb
rook
.. ........
Neu
se R
iver
nea
r C
layt
on, .
.........
Swif
t C
reek
nea
r M
cCul
lers
......
.. M
iddl
e C
reek
nea
r C
layt
on...
......
M
iddl
e C
reek
nea
r S
mit
hfie
ld...
.. Sl
ack
Cre
ek n
ear
Four
Oak
s....
.....
Suck
Sw
amp
near
Dud
ley.
......
.....
Litt
le R
iver
nea
r P
rinc
eton
. ...
....
..
Neu
se R
iver
nea
r G
olds
boro
......
.. St
ony
Cre
ek a
t G
olds
boro
......
......
Fa
lling
Cre
ek a
t F
alli
ng C
reek
....,
Moc
casi
n C
reek
at
Mid
dles
ex...
...
Zon
tent
nea
Cre
ek n
ear
Wil
son^
...
Mah
unta
Sw
amp
near
Sno
w H
ill..
., C
onte
ntne
a C
reek
at
Hoo
kert
on...
, C
ore
Cre
ek n
ear
Fort
Bar
nwel
l....,
Sw
ift
Cre
ek n
ear
Van
cebo
ro...
.....
Dra
inag
e ar
ea
(squ
are
mil
es)
66.5
15
0 4.9
171
526 13
.2
21.0
97
.8
8.75
3,
90
1,14
0 53.9
80
.7
124 79
.0
17.0
22
9 2,
390 21
.0
45.4
2,
690 6.
1 38
.2
236 97
.1
789 59
.2
182
168
Min
imum
da
ily
flow
of
rec
ord
(mgd
per
sq
uare
m
ile)
0.00
29
.001
6
.00*
38
.026
.003
2
....
....
....
.
.002
8 .0
24
.030
.000
55
.011
.002
1 .0
11
Max
imum
num
ber
of c
onse
cuti
ve d
ays
duri
ng w
hich
dis
char
ge,
in m
illi
on g
allo
ns p
er d
ay p
er
squa
re m
ile
was
les
s th
an t
hat
indi
cate
d
0.00
06
........
.
58 37 28
0.00
1 5 1 66 58 31
0.00
2 90
109 3 2 80 84 38
0.00
3 21
95
129 4 3 90 2
95 44
0.00
5 18
42
101
145 8 7 6
104 7
107 52
0.01
0 44
74
110
169 33 44 16
16
14
12
7 22 16
118 66
68
0.01
5 64
95
115
181 51 62 23
23
22
14
2 64
36 36 23
121 37
13
83
81
36
0.02
0 82
109
119
191 67 76 32
32
31
15
3 76
48 48 32
124 50
27
96
92
52
0.03
0
110
127
125
207 96 98 4 48
48
47
168 95
70
11
69 3 48
127 70
54
116
109 79
0.04
0
130
138
130
219
119
126 14
64
65
62
17
9 11
0 86
28
86
76
19 64
129 86
76
13
1 12
5 10
1
0.05
0
142
145
132
228
138
129 30
81
81
78
186
122
100 46
100 91
35 80
13
2 10
0 96
142
139
119
0.06
0
155
150
136
235
154
140 47
96
95
92
19
1 13
2 11
2 63
112
103 51 95
13
5 11
2 11
2 15
1 15
1 13
4
0.1 180
163
149
253
194 25 168 41
50
111
141
141
138
206
160
147
125
147
141
103 40
142
145
147
160
173
190
175
0.2
205
172
171
281
205
144
122
197
157
162
184
195
195
193
220
189
185
183
185
183
171
130
197
167
185
225
197
242
230
0.45 21
5 17
8 21
2 32
0 20
5 22
2 18
2 21
2 21
3 21
2 21
0 22
2 22
0 22
2 23
0 21
1 21
2 21
2 21
2 21
1 21
8 25
5 22
7 21
5 21
2 29
0 21
5 29
7 29
0
iPer
iod
of r
ecor
d (1
927-
53)
unad
just
ed f
or r
egul
atio
n by
Lak
e M
ichi
e an
d po
wer
pla
nt o
r fo
r di
vers
ion
to c
ity
of D
urha
m f
or m
unic
ipal
wat
er s
uppl
y.
zPer
iod
of r
ecor
d (1
930-
53)
unad
just
ed f
or r
egul
atio
n by
mun
icip
al r
eser
voir
and
pow
er p
lant
or
for
dive
rsio
n to
cit
y O
f Wils
on f
or m
unic
ipal
wat
er s
uppl
y.0
0
en

36 WATER RESOURCES, NEUSE RIVER BASIN, NORTH CAROLINA
g" .OS-
Si .06-
§ -°5I
I -04-
S .03-
fc ffia .02-
.01-
! .008-
.006-
.005-
.004-
.003-
.4
.3
2
.1
I .08
1 .06
X ,
N MILLION GALLONS PER JO Si
DISCHARGE, 3 '8 8 \ £ <5 01 i
.003
.002
.001
,__ J
__ -^
^~-
.-
-
.*-
~~ ""*
2 3 45678
_,-~^~
,,-"
_^^^
/
^^"
ss
^^
//
^
//
,/
}/
f
±
//
/
///
*-
/
-f-+
11
1jf-
'LAT H APRIL DEAD)
ABL
EUSE HIVEH NEAR CLAYTON: BASE PEHIOD.APRIL 1, 1923 TO MARCH 31, 1953. DHADJAGE AREA, 1140 SQUARE MILES
IVER: BAS 1, 1928 TO
AGE AREA
S PE MAJ
,150
RIOD, RCH 31, SQUAB
PLE: tNG A 25 -YEAR PERIOLAH TO 1928-53 THE -Y PLOW OF PLAT :R AT BAHAMA PROB Y WILL BE LESS THA MGD PER SQUARE
E FOR NOT MORE THA ONSECUTIVE MONTH ONSECUTIVE DAYS)
195 E Ml
D
*
N3
. LES -
10 20 1 2 3 4 5 6 7 8 910 12 18 24 36 48 7
CONSECUTIVE MONTHSCONSECUTIVE DAYS
LONGEST PERIOD OF TIME THAT FLOW WAS LESS THAN THAT SHOWN
Figure 12. Maximum period of deficient discharge, Flat River at Bahama, N. C., and Neuse River near Clayton, N. C.
STORAGE REQUIREMENTS
Frequently during dry periods streamflow is inadequate to meet the minimum requirements for many uses. Additional flow may be provided during such periods by the use of a storage reser voir. Storage of streamflow is often provided for municipal and industrial water supplies, power generation, supplements to low flows for waste dilution and navigation, flood control, and other uses.
The draft-storage curve is another means of studying the flow characteristics of streams. This curve shows the additional net storage required, disregarding evaporation, leakage, and dead storage, to maintain specific outflow rates. Storage curves for

SURFACE WATER 37
'.008-
.006-
.006-
.004-
.003-
.002-
.0015.
.2
a .13 u .08
ONS PER DAY PE3 0 P i5 B £ i
HARGE.IN MILLION GALL
loos.004
.003
.002
.001
PERIOD OP RECORD, APRIL 1, 1940- TO MARCH 31, 1953
^^ ^'
/
^'
A
/
^,
//
^
/
^
/
//
X//
/
-V
/
/''/
<,
///
V
DJUST
/
V
ED'
/r /
Of
r
/
AS
RA
/
/
/
//
1-T 4-
is
4f-i
/
tt-
~~ EXAMPLE:
5 PE
NAC
DURING A 25-YEAR PERIOD SIMILAR TO WATER YEARS 1928-53 THE DAILY FLOW PROBABLY WILL BE LESS THAN 0.025 MGD PER SQUAB MILE FOR NOT MORE THAN 40 CONSECUTIVE DAYS
HK>D, APRIL 1, 1928 TO MARC
E A RE A: 8t . ' ! C I ARE IV ILEE
:H si. is
CONSECUTIVE DAYS CONSECUTIVE MONTHS
LONGEST PERIOD OF TIME THAT FLOW WAS LESS THAN THAT SHOWN
Figure 13. Maximum period of deficient discharge, Middle Creek near Clayton, N. C.
four representative gaging stations in the Neuse River basin are given in figures 15 to 17. Net storage for selected outflow rates and the average flow for all sites in the basin are listed in table 7. In general, the storage curves were computed to 70 percent of average flow.
As an example of the use of the storage curve, assume that the hypothetical industrial plant at a site adjacent to Middle Creek is to be expanded and that the total water requirement is to be 5 mgd. With this new water-supply criterion, the stream will be unable to meet the demand 6 percent of the time, and stoppages or cutbacks in production will be more frequent and of greater proportions than before the expansion. If such a restricted sched ule of operation will be uneconomical, it will be necessary to build a storage reservoir to maintain the flow required for continuous operation of the plant. Figure 20 shows that to meet the sustained
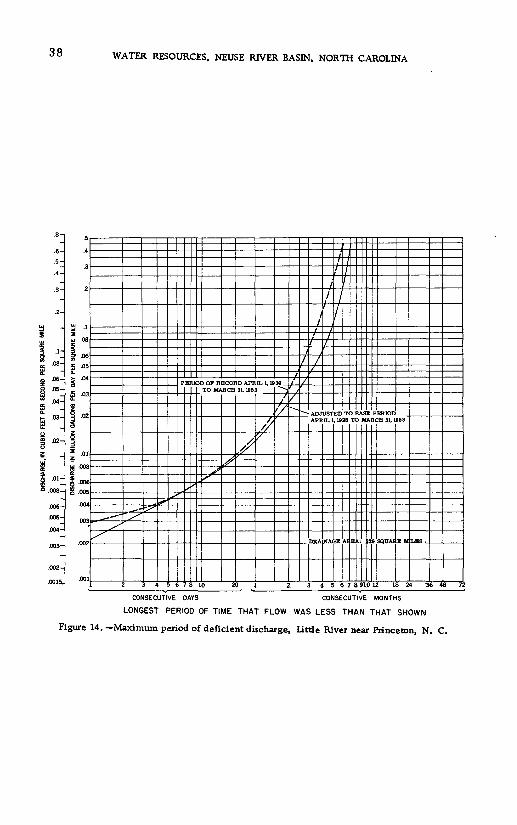
DIS
CH
AR
OE.
IN C
UB
IC F
EET
PER
SEC
ON
D
PER
SQU
AR
E M
ILE
CONSECUTIVE
DAYS
CONSECUTIVE
MONTHS
LONGEST
PERIOD
OF
TIME
THAT
FLOW
WAS
LESS
THAN
THAT
SHOWN
Figure 14.
Maximum
period of
deficient
discharge, Little
River
near Princeton, N.
C.
p
i i
i i
i i
i i
i ii
i i
i i
i iii
ii
i i
i i
i i
i i
i
^ ->i 00 o 8 N *. CO K g * ft H
8 1
J
:!
\ P B n & £ s 1 ti
P i
\\ \
i ^ \
DISC
HARG
E N
MIL
LIO
N G
ALLO
NS P
ER D
AY P
ER S
QUA
RE M
ILE
\1
\ 15
S ^ V
X^
s ^ / / ?! £ M
^ ° 5
* N
_ -
0
TO
MARCH
31.
1953 y§ 9) O » P > S s *«
,.
s"
-V vx"*" Ss
-^^
- ~
^ ^^--
. -.,
-^^
, -
CO
C
O

Tab
le 7
. S
tora
ge r
equi
rem
ents
in
Neu
se R
iver
bas
in,
1928
53
No.
(P
i. 1
)
1 2 3 4 5 6 7 8 9 10
11
12
13
14
15
16
17
18
19
20
21
22
23
24
25
26
27
28
29
Gag
ing
site
s
Dra
inag
e ar
ea
(squ
are
mil
es)
66.5
15
0 4.9
171
526 13
.2
21.0
97
.8
8.75
3.
90
1,14
0 53.9
80
.7
124 79
.0
17.0
22
9 2,
390 21
.0
45.4
2,
690 6.
1 28
.2
236 97
.1
789 59
.2
182
168
Ave
rage
di
scha
rge3
- (m
gd p
er
squa
re
mil
e) 0.63
8 .6
29
.579
.6
01.
.665
.7
2 .7
0 .6
3 .6
7 .6
8 .6
96
.72
.729
.7
2 .7
3 .6
8 .6
77
.659
.6
8 .6
7 .6
74
.74
.73
.646
.6
7 .6
13
.65
.59
.61
Sto
rage
req
uire
d,
in m
illi
on g
allo
ns p
er s
quar
e m
ile,
to
mai
nta
in r
egul
ated
flo
w i
nd
icat
ed i
n m
illi
on
gall
ons
per
day
per
squ
are
mil
e
0.01 0.17
.4
5 .8
8 1.
1 .07
*
.07
.02
.07
1.5 .13
..........
""".
*69
..........
.49
0.02
0.87
1.
9 1.
9 2.
4 .75
.67
.33
.15
.30
3.7 .14
.47
.17
.35
1.8 .20
.11
.77
1.3 .24
0.03
1.8
3.5
2.9
4.0
2.1
1.6 .01
.82
.44
.72
6.2
1.1 .99
.04
.78
.86
3.2 .78
.42
2.1
2.4 .86
0.05
4.3
7.0
5.4
7.5
5.5
3.9 .55
2,4
1.5
2.2
12 3.6
2.5 .62
2.5 .33
2.5
6.5
2.4
1.8
5.2
5.2
3.0
0.1
12
16
13
18
15 .3
3
13 .1
7 .4
5 5.
8 9.
6 7.
1 9.
4 25
12
9.0
5.5
9.4
8.4
3.6 .20
9.6
17 9.2
9.9
16
16
12
0.15
22
28
22
30
15 3.1
2.3
25 3.6
3.6
14
20
15
20
38
22
15
11
20
18
10 2.6
20
30
19
21
29
30
24
0.2
34
40
36
44
40 9.7
8.4
38
11
12
24
34
26
34
53
35
32
26
33
29
20 8.7
32
45
30
36
46
48
36
0.45
120
120
240
140 30
82
59
170 94
11
0 10
0 12
0 12
0 16
0 17
0 14
0 14
0 10
0 13
0 12
0 88
65
120
140
130
180
180
220
170
tab
le 1
for
per
iod
of r
ecor
d."P
erio
d of
rec
ord(
1927
-53)
una
djus
ted
for
regu
lati
on b
y L
ake
Mic
hie
and
pow
er P
lant
or
for
dive
rsio
n to
cit
y o
f D
urha
m f
or m
unic
ipal
wat
er s
uppl
y.
cPer
iod
of r
ecor
d (1
930-
53)
unad
just
ed f
or r
egul
atio
n by
mun
icip
al r
eser
voir
and
pow
er p
lan
t or
for
div
ersi
on t
o ci
ty o
f W
ilson
for
mun
icip
al w
ater
sup
ply.
CO
C
O

40 WATER RESOURCES, NEUSE RIVER BASIN, NORTH CAROLINA
\N \s\
s\S s\\
\^
\ \
\\\\
\\n
\\
\
\\\
\/\
/_.« ^SJI
lii -
ill Bsi »,
\
\
\
-8
3
-8
i
sajS
Ji
I\\^
u>"3K
nIs
ll
^ 'v
\
Wr»si'?^?s|l5|
iN«8 s fSgii?«|«sgill
\\
\\\
\\\'
"I s "
i||
IS 9X**
-Sai--^"£8
/
\
\\
\
\
\\\\\
\
C4
S1
s
R?
^
§
s8.
4
r8
_0
.-0
-in
-
i
-«>
H i
-!i
;E
« °J
-§
~°'
"'
-9
-S
§8.
i1
§i
-: 8 S 8 3 sum 3nvnos a3d AVO a3d SNOIIVS NOmiH NI 'Moid (mvinosa
I I-u
niw 3yvnos a3d anoois a3d i33j 31903 NI 'Moid

SURFACE WATER 41
\\\\^'\
^\
\\\\-\V\\
\
\\\\\ v,\
\»
g-s
5"o
I
$S0.
s\>
>
si8 s
8
2 8a
P
^?
\
V\\
\
\N\\ \
g
0
ra
n.
S
S
ii&B
^\\\
\\
1B28-53. A STORAGE CAPACITY OF 2.6 MILLION GALLONS PER SQUARE MILE
PROBABLY WILL BE REQUIRED TO
\
\
\
\
\ v
g
i*<ii"H
5*
s\
\ \-\
sps0'
5
2,
\\
-V-\
V\ \
\ V
«1
uoS
i
r\ \\\\ \
\\\
\\
\\ \
\ \\ i\\\*! *. m- " " g g g s 3 g 3 § i i i i
aim 3«vnos uad x*a a3d SNOIIVO Nornm MI 'MOIJ aiivinsati " '
1 ' T01 .02 .03 .04 '-05 .06 .08 .1 .2 .3 .4 .5 .6 .8 1 2 34568 10 20' 30 40 -50 60 80 100
1 STORAGE, IN MILLION GALLONS PER SQUARE MILE
~
_o
00
-.
u2
rt-«» o
a
.3 R SQUARE MILECreek net
' 1 1 1 L 1 1 '4 .05 .06 .08 .1
STORAGE, IN MILLION CUBIC FEET PE ge requirements, Middle
i- i-s ^
to.g *o <a
- I
O
Z§
-8 :8
-§
1
aim wvnos tod dNooas Had jau Diano NI 'MOU aaivinoati

42 WATER RESOURCES, NEUSE RIVER BASIN. NORTH CAROLINA
\V-\
\\^J
y\\
\\
n ^ 03 N -t
3iiw 3Hvn&s
/\ /\
/
\\
SzIt!
S%
«
0ugigI
/
\\
\
\\
\
\\\
i!jS
g«
SS
1g
\\\\
\
\'
\\\\
\88833 8 3 1 § | g
H3d AVO U3d SN011V9 NOITIIW Nl 'MO-U Q3i»inB3a
§
8
S
S 8
9
8
8
o
<D
3
"!
"5
«
«!
§8. 8
?
§
S
'
-S
-8
_o
"" y
-« S5
- I <u^
r £_»< H
»1 .002 .003 .004 .OOE.OOE .008 .01 .81 33 .04 .06 .06 .08 .1 .2 3 .4 .5 .6 .1
STORAGE, IN MILLION CUBK FEET PER SQUARE MILE Figure 17. Storage requirements. Little River nea
< < -! 8 % 8 S S. 831IW 3BW10S aid ON033S aid 133J 0181)0 Nl 'MOU 031*1(1338

SURFACE WATER 43
demand of 5 mgd (or 0.05 mgd per square mile) a storage capacity of 2. 6 million gallons per square mile of drainage area, or a total of 260 million gallons, will be required. This represents storage for approximately 110 days at critically low flows. To this volume must be added the amount of dead storage below the plant intake and an allowance for evaporation and leakage from the reservoir.
FLOOD FREQUENCIES
A state-wide study of flood frequency has recently been com pleted by the Geological Survey (Riggs 1955). Results of this study allow reliable flood-frequency relations to be established for Neuse River basin. These relations are shown for four gaging stations in the basin in figures 18 and 19.
Each frequency curve shows the average interval, in years, be tween floods that equal or exceed a given elevation. This does not mean that floods occur with any regularity; the recurrence intervals are average values only. It would be possible to have two floods of 50-year recurrence interval in successive years or in the same year.
Although frequency curves give average recurrence intervals only, they have much practical utility. For example, the frequen cy curve might be used to determine the elevation of a building in the flood plain of a river so that flood waters would reach it, on the average, only once in 50 years. Similarly, the average fre quency of flooding of a road fill could be determined from the curve.
However, there are problems in which data on flood frequencies at certain times of the year are needed. To meet this need, sum mer and winter flood-frequency curves are presented. The sum mer period extends from May 1 to October 31, and the winter period is the remaining 6 months of the year. These curves may be used to determine the probability of occurrence of a given flood in the selected season.
For example, suppose that a construction project is proposed for a location near the Neuse River near Clayton at an elevation of 145 feet above mean sea level. By use of figure 18 the recur rence interval of winter floods reaching that height may be deter mined as 10.8 years. This means that there is about a 1 to 11 chance that the work will be interrupted by flooding if it is done in a winter season. Similarly, from the curve for summer floods that the chances are about 1 in 5 that the work will be interrupted if it is done in a summer season. In the example cited the probability of flooding is greater in summer than in

44 WATER RESOURCES, NEUSE RIVER BASIN, NORTH CAROLINA
ELEVATION, IN FEET, ABOVE MEAN SEA LEVEL
SS^ifellgSBSSSS
y/
/
/
/
f
X
'
/
/
X
/
/
^x'
x x /
-^^/'
NOR
^
s/ '/
THS:
A
X^x'
DE
LL
x--
f X^*
FI
x'
-
oorx-'x'^ ^
s-~^X
X
^X^SUMMER FTXIODS x^ (MAY 1 TO OCT. 31)
\ i^WINTER FLOODS (NO VI TO APR. 30)
Ib4
152
150
148
146
144
142
140
138
136
134
132
J3O
X
/
,- >
X
'
X
X
x
X
XX
x
XX'./'/'./
CLA
Xx//
YTO
AL
/<
/ x
N
LF
//
\ /
LC
X
{s*
ODS
/X/
X"
/
f?
x7/
X
/^SUMM
{MAY
x
^/r
ER FLOODS TO OCT. 31)
% WINTER FLOODS (NOV. 1 TO APR. 30)
EXAMPLE: A FLOOD REACHING AN ELEVATION OP 145 FEET PROBABLY WILL OCCUR IN THE WINTER AT AVERAGE INTERVALS OP 10.8 YEARS AND IN THE SUMMER AT AVERAGE INTERVALS OF 5.5 YEARS. A FLOOD REACHING THIS SAME ELEVATKM PROBABLY WILL OCCUR EITHER DURING THE SUMMER OR WINTER AT AVERAGE INTERVALS OF 3 B YEARS
f
.3 .4 .5 .6 .8 1 2 3456 8 10 RECURRENCE INTERVAL, IN YEARS
20 30 40 50 60 80 100
Figure 18. Flood-stage frequencies, Neuse River near Northside and near Clayton, N. C.

SURFACE WATER 45
ELEVATION. IN FEET, ABOVE MEAN SEA LEVEL ELEVATION. IN FEET, ABOVE MEAN SEA LEVEL
£SKSSSg£&$g fiSSSS.&SBSSffiS;:
/
/
/
'
/
/
/
>
/
/
/
/
ALL FI
/
/I
/'
. ^^Sl
GOLI
OODS
/
/
MMEI
SBO
X
/'''
FL
RO
/
~X>
-^
,-
)S
^'
^ v
MA
,/,
Iff
r i
X^
^--
'ER FLOO
ro OCT. 31
'
3S (N(
)
)Y1 ro AI R.3( )
/
'
/
< X
./
/
/
/
/
^
'
''
^^.^ /
/^m
KIN
^
X
MMEI
STO
AI
^
'
FL
s
^L 1
^x
^'
"*-
3O
'L
X
X
>s
X)D
-^
,^-
VIN'
MA
;-^.
X
- -
:EE
r i
S
>S
*
*^
FLOODS
ro OCT. 31
;NOV
)
TO AP s.: 0)
.2 .3 4 .5 .6 & 1 2 3 4 5 6 8 10 RECURRENCE INTERVAL, IN YEARS
20 30 40 50 60 80 100
Figure 19. Flood-stage frequencies, Neuse River near Goldsboro and at Kinston, N. C.

46 WATER RESOURCES, NEUSE RIVER BASIN, NORTH CAROLINA
winter. Conversely, if the elevation at the proposed project site is lower than 141 feet above mean sea level the curves in figure 22 indicate that the probability of flooding in summer is less than in winter but of course much greater than at the higher elevations. The curve for summer floods could also be used to evaluate the risk of farming on a flood plain or of putting the flood plain to other seasonal use.
In general, the curve for frequency of all floods should be used in design of structures that are made to last for several years and the seasonal curves to evaluate the risk of flooding in a single season. The design of dam spillways or other structures whose failure will result in considerable damage or loss of life down stream is usually based on analyses involving maximum known floods rather than a flood of a specified frequency.
QUALITY OF SURFACE WATER
A. program to determine the chemical character of the waters of the Neuse River was begun in 1906. Daily samples for chemical analyses were collected from the Neuse River near Raleigh for a period of 1 year. Additional data were obtained from November 1932 to June 1933. A continuing cooperative program to deter mine the chemical quality of surface waters.in North Carolina was established between the U. S. Geological Survey and the North Car olina Department of Conservation and Development in 1943. Six daily and one monthly sampling stations for chemical quality stud ies have been in operation on streams in the Neuse River basin for at least 1 year each since 1943 (table 2). In addition to the daily and monthly sampling stations, samples for chemical analyses have been collected intermittently at all complete- and partial- record gaging stations within the basin. The mineral constituents and physical properties that have a practical bearing on most uses of surface water are summarized for each daily sampling loca tion in table 8. Figure 20 shows the average chemical character of the surface water at each of the daily sampling stations in the basin during the period 1943-54. The relation of hardness to dis solved solids of surface waters in the Neuse River basin is shown in figure 21.
The relation between streamflow and the chemical and physical characteristics of Neuse River water near Clayton during the 1944 water year is shown in figure 22. The highest color occurred during November. The hardness varied only slightly with stream- flow; whereas, the dissolved solids fluctuated with the flow, being greatest during October through most of December and during the latter part of summer when the streamflow was the lowest. The

SURFACE WATER 47
[Chemical constituents in parts per million. See plate 1 for location of gaging sites]
21, Ne'use River at Kinston October 1949-September 1950
18, Neuse River near Goldsboro October 1948-September 1949
11, Neuse River near Clayton October 1943-September 1944
Average
Minimum
Maximum
Average
Minimum
Maximum
S1
1Minimum
Maximum
CM CM0 rH OCM*
CO
10rH
ON IO CO 10
CM CD
sCD
UO O CO
CD i-H
CN
CO
IO
CD
CO
1 00
c-
rH
^< IO U3
OO^JCD,-
O CD rH
rH
d 00 ^ N COrH IO rH rH
C- O t- IO 00 O *J<
""j CO rH IO 00 >O IO *"* rH
CM CO O 00 O 00 t- CM
rH
So,*00 * «** 0 O CM OCO*
i-H
CDC
<* 10 'rH rH rH
rH
CM IO O
CM 00*
O
O COgg 0*00
Ju
1fVs
I
( 11A
oUJ
00
rH
(M
^< CD
O t> IO t> i-H CM
CO CO *J< 00 IO
CO rH ^< rH CO CO
c- ** ** co of oo ** oo ^
rH rh rH
<[tf
'a
o
-5.2 ««.
^
j
g
Sodium (Na) and potas Bicarbonate (HCOj).... Sulfate (SOA........... Chloride (CH...........
rH N
r-l ^1 O c2> CM
O COCM *j<IO r-l
O CD
00
_
CD
CM
OCD IO
rH CM
OrH
COCO CO*of *j< o CD c-^o
00 CO CO IOrH
rH C- 10 «*
CM IO O CO 00 IO rH CD (?)
O rH "CO rH
Tj< rH
*r-?lO rH CO (N
rH ***CO*0 0
C- N
O **
«rH
00 O> rHU3 C-
i^OO C-^CD IO C- ^<
r-l IO
*00*rH CO
rH
: :ft00rH
poration
>fi o <u
0
28dii
It
i
Nitrate (NO 3)........... Dissolved solids (residi Hardness as CaCOj.a.. Specific conductance. nrL .._ _. . .
O (N
00
5?
........ units..
o
3

Tab
le 8
. S
umm
ary
of
chem
ical
an
aly
ses
of
wat
er f
rom
str
eam
s of
th
e N
euse
Riv
er b
asin
C
onti
nued
Sil
ica
(Si0
2> ...
....
....
....
....
....
.............
Su
lfat
e (S
O4)
....
....
.. .............
.............
Chlo
ride
(Cl)
.. ..
....
....
....
.. .....
....
....
....
.
Nit
rate
(N
Oa)
.. ..................................
Dis
solv
ed s
olid
s (r
esid
ue
on e
vap
ora
tion
at 1
80°C
).
26,
Conte
ntn
ea C
reek
at
Ho
ok
er-
28,
Sw
ift
Cre
ek n
ear
Van
e eb
oro
ton
Oct
ober
1949-S
epte
mb
er
1950
O
cto
ber
1951-S
epte
mber
19
52
Max
imum
1,5
00
14 .6
0 4.4
1.
6 9.
1 19
8.3
9.2 .4
2.3
63 17 77.5
6.
6 45
Min
imum
97 6.0 .0
1 3.
0 1.
0 4.
0 9 4.
4 4.
6 .0
.1
45 12 53.1
5.
8 15
Aver
age
461 10
.13
3.7
1.3
6.3
13 6.0
6.7 .2
1.
1 53 15 62
.3
6.3
25
Max
imu
m
1,3
30
14
.69
23 4.2
31
77
19
43
.2
2.6
16
9 70 291 7.
2 55
Min
imu
m
1.6
7.
1 .05
6.9
1.2
4.5
9
10 7.6 .0
.2
66 24 81
.9
6.1
23
Aver
age
132 10
.16
12 1.9
12
31
14
17 .1
1.
2 99 38
149 6.
7 36
29,
Tre
nt
Riv
er n
ear
Tre
nto
n O
ctober
1951-
Sep
tem
ber
19
53
Max
imu
m
51-5
2
1,0
50 9.4 .3
8 36
2.4
12
10
6 18 8.8
.1
1
.6
128 99
223 7
.6
110
52
-53
1,60
0 9.4 .3
0 41
2.5
11
12
2 33 9.5
.1
2.0
14
3
112
245 7
.4
120
Min
imum
51-5
2
3.1
3.4 .0
3 7.
4 1.
0 2.
0 18
3.8
5.5 .0
.2
59 23 60.7
6.
3 16
52
-53
4.6
4
.4
.02
8.8 3
1.2
18 5.6
4.2
.0
.1
69 23 49
.1
6.4
14
Aver
age
^
51
-52
117 6.
7 .17
20 1.6
4.2
55
8.9
6.8 .0
.6
95 56
135 6.
9 65
52-5
3
H m R
RESOURCES. NEUSE
RIVER
BASIN, h
01/3
O
. 1
LO
CO
O3OC-
OS
C C
**r-HTj<i ICOe>
"*OO
1/3
LO
CD
O
OS
(N
CDi-H
O
CD
1/3
CD
r-\
.H

SURFACE WATER 49
PERCENT DISSOLVED SOLIDS (SUM)
NEUSE RIVER NEAR CLAYTON 1943-44 (62 ppm)
NEUSE RIVJiR NEAR GOLDSBORO 1948-49 (42 ppm)
NEUSE RIVER AT KINSTON 1949-50 (55 ppm)
CONTENTNEA CREEK NEAR HOOKERTON 1949-50 (42 ppm)
SWIFT CREEK NEAR VANCEBORO 1951-52 (83 ppm)
TRENT RIVER NEAR TRENTON 1951-52 (76 ppm)
TRENT RIVER NEAR TRENTON 1952-53 (88 ppm)
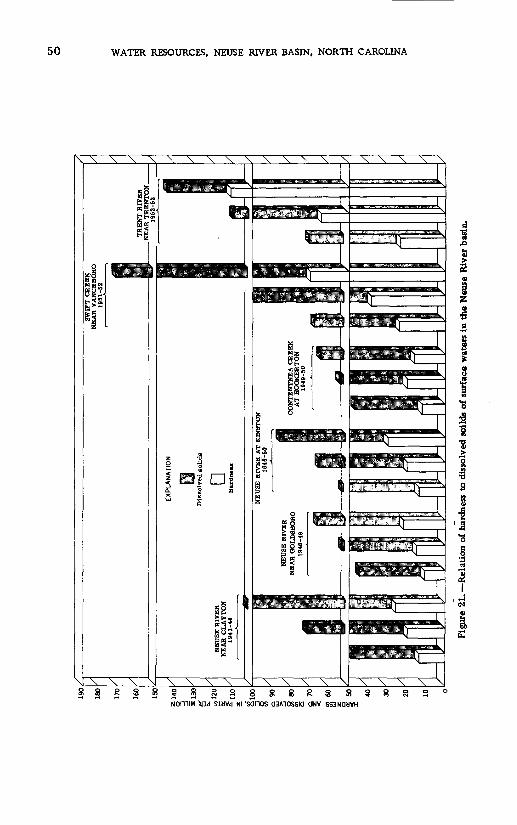
50 WATER RESOURCES, NEUSE RIVER BASIN, NORTH CAROLINA
\\ \\X\\X\\\XX\\\\\\X
\\\\\\\\ \ \ \ \ \ \ \ \ \ \ ^^ \
I£

SURFACE WATER 51
§5000-
£ </>54000-
-2000-
1000-
9000
8000
6000
3000
2000
1000
SEPT
Figure 22. Relation between streamflow and selected chemical and physical characteristics of Neuse River near Clayton, N. C., 1943-44.
highest temperature occurred during June, July, and a few days in August and September. Smithfield, about 10 miles below the Clayton station, uses Neuse River for its public water supply. Inasmuch as there is no appreciable amount of inflow between Clayton and Smithfield, the chemical and physical characteristics of the Neuse River at Smithfield are similar to those near Clayton.
Little River is the source of the public water supply for Golds- boro. Except for excessive quantities of iron and color, the chemical quality of the water from Little River is excellent. The dissolved solids ranged from 44 to 56 ppm and hardness from 9 to 22 ppm.
The water from Contentnea Creek generally is suitable for an industrial or public water supply on the basis of the mineral con tent. The uniformity of the dissolved solids and low hardness

5 2 WATER RESOURCES, NEUSE RIVER BASIN, NORTH CAROLINA
makes it very desirable for most uses (see p. ). Color ranged from 15 to 45 units during the 1950 water year. Contentnea Creek drains several swamp areas that contribute colored waters to the main stream.
Several swamp streams flowing into Swift Creek contribute to the color of the water (23-55). There were objectionable amounts of iron in the water during the period of record, October 1951 to September 1952. Contamination from salt water is likely in the lower part of the stream.
The hardness of waters from Trent River near Trenton is great er than from the other streams in the basin. The dissolved solids ranged from 59 to 128 ppm. The waters are colored (23 to 110 units) because of inflow from many swamp streams.
Salt-water encroachment in the lower region of theNeuse River basin has adversely affected the chemical quality of the surface waters in the area. The chemical quality of surface waters varies with the tide and the extent of salt-water encroachment. At the mouth of the Neuse River the salinity is very high, at times as much as 10, 000 ppm of dissolved solids. The salinity decreases upstream until the limit of salt-water encroachment is reached. Adequate data are not available to indicate the upstream limit of encroachment.
GROUND WATER
OCCURRENCE OF GROUND WATER
In the hydrologic cycle some of the precipitation that falls on the earth's surface percolates downward until it saturates the rock with water. Water in the zone of saturation is known as ground water; it comes to the surface again through springs and seeps, is withdrawn from wells, or is evaporated or transpired by vegetation.
Rocks are composed of mineral grains of many shapes and sizes and contain openings that may hold water. In sedimentary rocks, such as sand and clay, there usually are great numbers of inter stices; but in igneous and metamorphic rocks, such as granite and slate, the spaces that are large enough to yield water are gener ally due to fracturing or solution of the rock. The porosity of a rock is the ratio of the volume of the pore spaces to the total vol ume of the rock.

GROUND WATER 53
If the interstices are large enough and are interconnected, water will move readily through them and the rock is said to be perme able. If the spaces are too small or are poorly connected, the rock is relatively impermeable and water will move through it very slowly. If a rock has sufficient permeability to allow usable amounts of water to be withdrawn from it, it is called an aquifer.
In rocks that contain interconnected openings extending to the land surface, the "water that saturates the rock below a certain level forms a body whose upper surface is the water table. In valleys the water table generally is at or near the ground surface, whereas on hills the water table may be 60 feet or more below the surface. The water table fluctuates throughout the year as water is withdrawn by wells, by evapotranspiration, and by seepage to streams or as water is added after a storm. Where the water lev el in wells is free to fall and rise in response to these influences, the aquifer is said to be under water-table conditions.
In the Coastal Plain formations of the Neuse River basin, there are many alternating layers of permeable sand and impermeable clay sloping southeastward beneath the surface. (See fig. 23.) Water moves through the sand easily but its movement through the clay is retarded. Water entering the sand at higher elevations exerts a considerable pressure on the water already confined in the sand, and this pressure forces water upward against the clay beds overlying the sand beds. Water under pressure of this kind is said to be under artesian conditions, and a well in which the water level rises above the base of the overlying confining bed is known as an artesian well. At many places in the basin, there is sufficient artesian pressure to cause wells to flow at the sur face.
As water is removed from an aquifer it must be replaced or the water stored in the aquifer ultimately will be exhausted. Precip itation is the source of this recharge water, replenishing the un derground water supply throughout the basin, either by direct
V ... 9 60 Miles
Figure 23. Generalized cross section of the Neuse River basin showing the major rock units.

54 WATER RESOURCES. NEUSE RIVER BASIN, NORTH CAROLINA
downward seepage under water-table conditions or by percolation into the artesian aquifers in areas where they crop out at the sur face or can otherwise receive water. If yields are to be sustained indefinitely, withdrawal of water must not exceed average re charge; in addition, withdrawal must not be so great as to induce the encroachment of water of poor quality.
Generally, water first entering the ground tends to move toward nearby streams and discharge into them. If water levels are low ered sufficiently in wells that penetrate permeable strata near these streams, a reverse flow may occur and the ground-water reservoir will receive recharge from the streams. Recharge of this type, known as induced infiltration, is important at many places in the United States but does not now take place on any sig nificant scale in the Neuse River basin.
Pumping lowers the water pressure at a well and establishes a hydraulic gradient that allows water to flow toward the well. As pumping continues to lower the water level in the well, the influ ence of the gradient extends farther away and water maybe inter cepted that ordinarily would discharge elsewhere. If the discharge thus salvaged is sufficient, water levels will eventually stabilize, and large yields may be sustained. Conditions of this type seem to exist near Kinston as a result of heavy pumping at a large tex tile plant there.
In the Neuse River basin, most ground-water supplies are ob tained from wells. Most springs have poor yields and are inac cessible, so that it is difficult and expensive to develop water supplies from them. A properly located and properly constructed well, however, is a dependable and economical source of water. Wells are the common source of water for rural domestic use, and many towns also have wells for their supplies.
GEOLOGY
The movement and availability of ground water depend upon a number of geologic factors, such as the type of rock, the way the the grains are held together, and the way the rocks are fractured. In general, the rocks of the Piedmont are dense slate, granite, and similar rocks, but there are also some compact shale and sand stone. The rocks are exposed in about half the basin and slope beneath the rocks of the Coastal Plain to the southeast. The rocks of the Coastal Plain are composed chiefly of beds containing var iable amounts of sand and clay, some being relatively pure in sand and others relatively pure in clay; limestone, some of which is consolidated into a hard rock, is interlayered at many places with

GROUND WATER 55
the sand and clay. These strata slope eastward at a slightly greater rate than does the land surface and so are buried pro gressively deeper toward the coast. These formations increase in thickness from a featheredge near the fall line to a probable maximum of 4, 000 feet along the coast. The general relations among these Piedmont and Coastal Plain rocks are shown in fig ure 23.
ROCKS OF THE PIEDMONT
Slate rocks. A series of interbedded tuff, breccia, lava flows, shale, slate, and schist, all called slate rocks for convenience, underlie the northwesternmost part of the basin (Aand 0 in pi.2). These rocks, which are predominantly gray to greenish blue, in clude also quartz veins and diabase dikes. Generally, these rocks are tipped on end and trend northeastward. They are predomin antly acidic in composition, but the iron minerals have stained the weathered soil zone brown or dark red. Jointing and shearing are common features within several hundred feet of the surface. The total thickness of the slate rocks is unknown but is many thousands of feet. These rocks, probably of early Paleozoic age, are found chiefly in the northwestern end of the Neuse River basin in the vicinity of Hillsboro (A in pi. 2) and in the fall line area around Middlesex and Smithfield (D in pi. 2).
Granite. The granite (c-in pi. 2), especially well exposed in the vicinity of Wendell, is gray or pink medium- to coarse-grained massive to well-fractured rock. An extensive body of fine-grained generally massive gneiss, composed chiefly of quartz, mica, and feldspar, is found in the vicinity of Raleigh and Wake Forest and is included with the granites in this report. Banding trends north westward in the gneiss. Because of a thick soil zone, the areal relations between the metamorphic rocks and the granite are obscure, but all extend downward to an unknown but great depth.
Shale rocks. The consolidated shale, claystone, sandstone, con glomerate, and arkose beds of the Upper Triassic Newark group (B in pi. 2), all called shale rocks for convenience, occupy a northeastward-trending fault trough, or graben to a depth of 8,000 to 10,000 feet. Beneath a thin reddish-brown soil zone the rocks, chiefly shale, are compact and well cemented, but many faults and diabase dikes cut the gently to moderately sloping strata. These rocks, exposed north and east of Durham, contain some thin beds of coal, which are not mined.

56 WATER RESOURCES, NEUSE RIVER BASIN, NORTH CAROLINA
ROCKS OF THE COASTAL PLAIN
Tuscaloosa formation . The basal formation of the Coastal Plain ex posed near the fall line is the Tuscaloosa formation of Late Cre taceous age. It consists of gray, yellow, red, and tan clay and sandy clay and some gravel. The beds increase in thickness from a featheredge in the middle part of the fall line area to about 100 feet at Goldsboro and to about 560 feet at Morehead City. They dip southeastward at about 15 feet per mile in much of the basin, but this slope increases near the coast. Somewhere down the dip, similar sediments of Early Cretaceous age may intervene between the Tuscaloosa formation and bedrock, but these, if present, would be hydrologically similar to the Tuscaloosa.
3 lack <jreek formation. Dark-gray to black laminated lignitic clay alternates with fine-grained gray sand beds in the Upper Creta ceous strata that overlie the Tuscaloosa formation. The Snow Hill marl member, at the top of the Black Creek formation, is a fos- siliferous glauconitic sandy marl. The formation dips southeast ward, beginning at Goldsboro, and increases in thickness to about 600 feet at the coast.
Peedee formation. The Peedee formation of Late Cretaceous age consists of interbedded clay, sand, marl, and limestone that dip southeastward at 10 to 25 feet per mile, increasing in thickness from a thin edge near LaGrange to a maximum of 600 feet. The formation is fossiliferous and contains much glauconite.
Castle Hayne limestone . The Castle Hayne limestone is light- to dark- gray poorly to well consolidated limestone and sandy limestone or marl containing abundant shells. The formation has a slight southeastward dip and increases in thickness from a featheredge near Kinston to more than 250 feet along the coast.
Yorktown formation . The Yorktown formation is an extensive fossil iferous formation, of Late Miocene age, covering much of the northern half of the basin, increasing in thickness from a few feet near Wilson to more than 150 feet near Cherry Point. In lithology, the formation varies from a sticky bine clay to a loose shell marl.
Surficial sands . Surficial sands mantle much of the Coastal Plain. They consist of series of thin beds of sand and clayey sand, which in part are, derived from underlying formations but which include some sand., clay, and shell beds of Pleistocene age. The surficial beds probably do not exceed 30 feet in thickness except along the coast, where well-developed sand dunes are found.

GROUND WATER 57
GROUND-WATER PROVINCES
Ground-water conditions are not uniform throughout the Neuse River basin. Several ground-water provinces have been differen tiated because of significant differences in character and structure of the rocks, yield of wells, and quality of water. The aquifers in each province consist of one or more bodies of rock having similar hydrologic properties. Although these aquifers are dis tinctive in most places, it is evident that they lose some of their identity where they adjoin other aquifers. The quantity and quality of water that can be obtained from each of the water-bearing units varies with the type of well and its location and depth. The areal extent of each of the ground-water provinces is delineated in plate 2.
The chemical quality of the ground water in the Neuse River basin is summarized in table 9. Selected analyses of water from each ground-water province are presented graphically in figure 24. The occurrence of iron and hardness in ground water in the Neuse River basin is given in figure 25.
CRYSTALLINE-ROCK PROVINCE
The crystalline-rock ground-water province consists of the areas underlain by rocks described as the slate rocks, granite, and shale rocks. Together, these rocks form the poorest aquifer in the Neuse River basin.
In general, the slate rocks and granite (A and c in pi. 2) are massive crystalline rocks whose grains are intergrown or held together by molecular attraction. Pore space is negligible and usable water is found only along bedding planes, along planes of cleavage and schistosity, and in zones where fracturing and solu tion have occurred.
Many of the openings in the slate rocks and granite are the re sult of weathering processes that operate close to the earth's surface. A well will generally find fewer openings as it is deep ened, so that it is usually not worth while to drill wells to great depths. Coarse-textured rocks generally are relatively good pro ducers because weathering or fracturing will tend to open larger spaces in them than in fine-textured rocks.
Much water is stored in the weathered, or decayed, rock that lies immediately below the surface. This water will recharge underlying fractures as wells are pumped, and good yields may result if the weathered zone is thick and permeable.

Tab
le 9
. Sum
mar
y of
che
mic
al a
na
lyse
s of
gro
und
wat
ers
in
the
Neu
se R
iver
bas
in
[Che
mic
al c
onst
ituen
ts i
n pa
rts
per
mil
lion
]
Cry
stal
line
-roc
k an
d sl
ate
prov
ince
s C
reta
ceou
s sa
nd p
rovi
nce
Num
ber
of
sam
ples
an
alyz
edM
edia
nL
owH
igh
Num
ber
of
sam
ples
an
alyz
edM
edia
nL
owH
igh
Ter
tiar
y li
mes
tone
pro
vinc
e
Num
ber
of
sam
ples
an
alyz
edM
edia
nL
owH
igh
Sil
ica
(SiO
z).
............................................,
Iron
(F
e).
..................................................
Cal
cium
(C
a).
.........................................M
Mag
nesi
um (
Mg).
.......................................
Sod
ium
and
pot
assi
um (
Na
+ K
)...
....
....
....
....
..B
icar
bona
te (
HC
C^).
....
....
............................
Sulf
ate(
SO
.4).
....
....
....
....
....
....
....
....
....
....
....
Chl
orid
e (C
l)..
....
....
..»
....
....
....
....
....
....
....
..F
luo
rid
e(F
)...
....
....
....
....
...........................,
Nit
rate
(N
Qj)
....
....
....
....
....
........................,
Dis
solv
ed s
oli
ds.
....
..H..
....
....
....
....
....
....
....
...
Har
dnes
s as
CaC
C^..
....
....
......
....
....
....
....
....
.,C
olo
r..
....
....
....
I...
....
....
....
....
....
....
....
uni
ts,
Spe
cifi
c co
nduc
tanc
e
mi c
rom
hos
at 2
5°C
.p
H........
....
....
....
....
....
....
..........................
68 70 68 68 68 72 72 72 70 70 68 71 67 41 68
32.3
29.
83.
811 59 4
.7 4.5 .1 .4
108 463
180 6.
7
4.9 .00
2.0 .7 3.6
1 .6 2.5 .0 .0
43 10 0 52.7 5.4
56 17 182 72 261
472
179
815 1.
727
1,46
075
0 282,
850 8.
7
61 72 62 62 62 89 39 89 73 66 62 89 56 45 67
18.3
88.
32.
715 143 4.
75.
9 .2 .314
8 42 426
1 7.3
4.0 .03
.3
.3 3.6
0 .4 2.8 .0
.0
41 2 0 41.9 4.6
34 7.6
103 9.
630
138
812
919
0 1.1
30 826
283 37 550 8.
4
16 16 16 16 16 33 32 37 24 18 16 35 14 22 24
22 2.0
792.
76.
435
0 3.0
9.0 .2 .1
253
219 5
435 7.
2
13.0
750 1.
71.
517
2 .2 3.8 .0 .0
190
110 2
316 6.
9
53 5.2
104 30 113
458 60 760 1.
0 .648
439
1 183.
210 7.
6

GROUND WATER 59
CRYSTALLINE- ROCK AND SLATE PROVINCE
IONTLAWH HEMMIAL MUM,
IS.- - II IS!.. _.8
if 55 Is 58 _8I s!
i s fj!jf|if ypffj: yjSiiifpCRETACEOUS SAND PROVINCE
2^-_ i s
i itiiinlfTERTIARY LIMESTONE PROVINCE
HEW KM WELL 4,
n1C 88 _\l ,
f!i ? iifl ?!r
Figure 24. Chemical character of selected ground water in Neuse River basin.

60 WATER RESOURCES, NEUSE RIVER BASIN, NORTH CAROLINA
30
25IRON DJ WATER FROM CRYSTALLINE ROCK AND SLATE PROVINCES {70 SAMPLES)
ALSO 1 AT 8.8
1 AT 17 -
25
5 15
mON IN WATER FROM CRETACEOUS SAND PROVINCE (72 SAMPLES)
IRON IN WATER FROM TERTIARY LIMESTONE PROVINCE (16 SAMPLES)
I I345
PARTS PER MILLION
HARDNESS OF WATER FROM CRYSTALLINE ROCK AND SLATE PROVINCES (71 SAMPLES)
K 255
9 15
10
HARDNESS OF WATER FROM CRETACEOUS SAND PROVINCE (69 SAMPLES)
HARDNESS OF > rATER FROM TERTIARY LI] lESTONR PPflVlttrR tas SAMPLKsl
100 200 300 400 500PARTS PER MILLION
600 700
Figure 25. Distribution graph of hardness and iron content of ground water inNeuse River basin.

GROUND WATER 61
The intrusion of dikes and the growth of mineral veins may have caused fracturing in the surrounding rocks. Quartz veins are common in the slate and granite, and, because quartz is a brittle mineral, many large openings have developed in the veins as a result of earth movements. A well drilled into a quartz vein or into the fractured zone near a dike may yield a large amount of water.
Fractured zones usually are less resistant to erosion than is the relatively unfractured rock, allowing valleys and other low places to develop. Thus a well drilled in a low place has a great er chance of intersecting openings than a well on high ground; too, the natural drainage of ground water is toward valleys. Records of wells in the slate and granite indicate that most wells drilled in valleys are much more productive than wells drilled on hills.
The so-called shale rocks (,B in pi. 2) are chiefly shale or clay- stone that has been so compacted and cemented that permeability is low. Ground water cannot move rapidly through the minute pores, most of the movement being through fractures and along bedding planes. The shale commonly yields less water than the granite and slate. The sandstone is a somewhat better producer.
Many wells in the shale have fairly good yields at first but be come much less productive after a short time. Probably water in the pores near such wells is withdrawn quickly but the movement of recharge water from farther away is too slow to sustain the initial rate of production.
Depth and yield of wells. Throughout the crystalline-rock province, most domestic supplies are obtained from dug or bored wells, which are generally extended down to hard rock. Such wells av erage about 40 feet in depth and furnish enough water for house hold use, except in very dry summers. A drilled well, located at a. favorable place, generally will yield more water, inasmuch as it can be made deeper than the dug or bored wells. Because most of the usable ground water occurs in fractures formed near the surface, it is generally uneconomical to drill wells to depths greater than 300 feet. Because no sand or other loose material is ordinarily found in these rocks to fill up the well, an open-end well is usually satisfactory.
In the slate rocks and granite, the best wells may yield as much as 50 gpm, but wells yielding more than 25 gpm are not common. The average yield of wells drilled in the shale rocks is only 10 or 15 gpm, but as much as 30 gpm may be obtained from the more permeable sandstone or from fractured zones near dikes.

62 WATER RESOURCES. NEUSE RIVER BASIN, NORTH CAROLINA
Quality of water. The rocks in the crystalline-rock provinces gen erally yield water of similar chemical character, and the analyses of water are summarized in table 9. The dissolved-solids content in 68 water samples ranged from 43 to 1,460 ppm, the median being 108 ppm. The hardness ranged from 10 to 750 ppm and the median was 46 ppm. The iron content ranged from essentially zero to 17 ppm. Of 70 samples analyzed for iron content, 48 con tained less than 1. 0 ppm (37 of them less than 0. 30 ppm) and 22 contained more than 1. 0 ppm. The approximate range in concen tration of iron in the ground-water provinces is shown in figure 25. In the 68 samples the chloride content ranged from 2.5 to 815 ppm and the sulfate from 0. 6 to 179 ppm, but few exceeded 20 and 17 ppm, respectively. Analyses showing very hard water and much dissolved mineral matter are generally of water from the shale rocks. Temperatures range from 60°F to 63°F for water from the slate rocks and granite, and from 58°F to 66°F for water from the shale rocks.
SLATE PROVINCE
Slate rocks (D in pi. 2) and parts of the Tuscaloosa, Black Creek, and Yorktown formations ( E in pi. 2) are included in the slate province. The rocks of this province are generally better water producers than those of the Piedmont but are not as good as the Coastal Plain aquifers farther to the southeast.
The slate rocks of zone D are similar to those in zone A of the Piedmont but the yield in wells are generally larger, the rocks apparently being more schistose and more highly fractured. The Coastal Plain beds are mostly unconsolidated clay or sandy clay but they include some sand beds of low permeability. Few are more than 100 feet thick.
Depth and yield of wells. Small supplies for rural domestic use are generally obtained from dug or bored wells, but in the Coastal Plain driven wells, or well points, also are common. Such wells are rarely deeper than 50 feet. Larger supplies for municipal or industrial use may be obtained if wells are properly located and constructed. Where slate rocks are exposed, wells should be located in the manner already described for the Piedmont. Open- end wells are satisfactory and generally need be no deeper than 300 feet.
In the Coastal Plain section of this area, good yields are ob tained if sand strata are reached in drilling. Maximum yields are generally obtained if wells are drilled through the Coastal Plain strata and into the underlying slate rocks. If sand strata or other
GROUND WATER 63
loose sediments are penetrated, a screen will prevent the en trance of such material into the well but will allow the water to enter and be added to the total supply. Open-end wells are satis factory if they end in firm material. Most of the available water will be obtained within 300 feet of the surface.
Wells drilled in favorable places may yield 50 to 200 gpm. The best wells in this area have produced as much as 200 gpm but such large yields generally decline slowly over a period of several years, the permeability of the rocks not being high enough to pro vide sufficient recharge to sustain heavy pumping.
Quality of water . The chemical quality of the ground water in the crystalline rock and slate provinces has been discussed with that of the water of the Piedmont.
CRETACEOUS SAND PROVINCE
The Black Creek and Peedee formations of Late Cretaceous age are the chief aquifers in the Cretaceous sand province. Fine-to medium-grained sand layers alternate with beds of clay through out the entire thickness of the Coastal Plain strata. Clay pf the Yorktown formation is found near the surface in the northeast half of the province, and loose sand covers the surface in most of the province, but only small domestic water supplies can be ob tained from these sources.
The sand layers that lie at greater depth are recharged from precipitation on their outcrops to the northwest and constitute excellent artesian aquifers. The sand layers are generally clean and very permeable.
Depth and yield of wells. Because water is withdrawn from layers of sand which alternate with beds of clay, a well is drilled through one or more sand layers depending on the amount of water re quired. Wells range in depth, therefore, from 100 to more than 600 feet, the aggregate yield generally increasing with depth.
It is necessary to install a screen or slotted pipe in each sand zone to allow water to enter the well. If only one sand layer is utilized, a maximum yield of 200 gpm may be expected, but prop erly developed wells getting water from several sand beds are capable of much larger yields. Yields in excess of 500 gpm have been obtained from gravel-walled wells in this province, but properly screened and developed wells without gravel walls may give comparable results.

64 WATER RESOURCES, NEUSE RIVER BASIN, NORTH CAROLINA
Quality of water. Generally the water from the Cretaceous sand province is of excellent chemical quality, suitable for most pur poses with little or no treatment. Water from shallow wells in the southeastern half of the province may be hard, but deeper water is soft and resembles that from the northwestern half of the prov ince. The hardness of water from the Cretaceous sand province generally ranges from 15 to 125 ppm and dissolved solids from 73 to 189 ppm. Sodium and bicarbonate ions predominate. The hard ness of water in this province is shown in figure 25. Iron in 72 water samples from wells in this province ranged from 0. 03 to 7. 6 ppm, the median being 0.38 ppm.
TERTIARY LIMESTONE PROVINCE
The Tertiary limestone province consists of the shell limestone and interbedded sand layers of the Castle Hayne and Yorktown formations. There are some clay beds or other zones of low permeability in these strata that allow artesian conditions to de velop. The limestone owes its exceptional permeability to the removal, by percolating waters, of much soluble material, there by enlarging the openings and facilitating the movement of water.
Depth and yield of wells . In most places the limestone is consoli dated enough to allow the use of open-end wells. There are many places, however, where the aquifer is unconsolidated and gravel- walled wells or other screened wells are profitable. Wells are generally drilled to obtain water from several permeable layers, so that depths range from 100 to more than 300 feet, depending on the quantity of water desired and the thickness of the fresh water body. Yields of more than 500 gpm are generally obtained from properly constructed wells in the Tertiary limestone prov ince.
Quality of water . The Tertiary limestone province yields water in which calcium bicarbonate predominates and which has a hard ness ranging from 110 to 391 ppm. Ground water sampled in the province contained 0. 07 to 5. 2 ppm of iron. In 37 water samples the chloride content ranged from 3. 8 to 760 ppm, the median being 9. 0 ppm.
COMPOSITE LIMESTONE-SAND PROVINCES
The composite limestone-sand province is an intermediate zone in which adequate ground-water supplies maybe obtained from the limestones of Tertiary age near the surface or from the sands of Cretaceous age beneath.

GROUND WATER 65
Depth and yield of wells . Generally the shell limestone of Tertiary age is less than 100 feet thick and only shallow wells obtain water from this source. Deeper wells may obtain water solely from the sands of Cretaceous age or may utilize the limestone aquifer also. Wells may, therefore, range in depth from less than 100 feet to more than 600feet, the maximum depth being limited by the pres ence of salt water (fig. 23).
Yields and types of wells are comparable to those in the adjoin ing ground-water provinces. Some wells yielding more than 500 gpm obtain water from both aquifers.
Quality of water. Ground water in the composite limestone-sand province resembles that from the Cretaceous sand and the Terti ary limestone provinces, depending on the source.
WATER LEVELS
Water levels in wells reflect the fluctuations of the water table. Although precipitation is the source of ground water, water levels in the Neuse River basin are not highest during the summer when rainfall is greatest. Generally, the water table is at its highest level in the spring. As crops and other vegetation begin to remove water from the soil, a deficiency in soil moisture develops. Rain fall reaching the ground must make up this deficiency before any can reach the water table. Because high summer temperatures cause high rates of evaporation, the ground-water reservoir is recharged during the summer only when rainfall is heavy or pro longed. Summer storms sometimes produce very heavy rains that cannot be quickly absorbed by the soil, and surface runoff is often great. During the summer, withdrawal of water for human use is also greater, whether for recreation, irrigation, or other uses.
It seems obvious that some few factors, such as high rate of evaporation and transpiration, large withdrawals, and the brevity of summer storms, either remove much ground water from stor age or prevent effective ground-water recharge, so that water levels reach their lowest points at the end of the growing season.
During fall, winter, and early spring, fewer demands are made upon the ground-water reservoirs. Withdrawal is much less dur ing these seasons, vegetation is not removing much-moisture from the soil, evaporation is at its lowest rate, and the winter rains are comparatively prolonged. Large amounts of precipitation per colate into the zone of saturation and ground-water levels rise to their highest stages of the year.

66 WATER RESOURCES, NEUSE RIVER BASIN, NORTH CAROLINA
H W H U ««
to
35
< H «
10
15
10
1953
Figure 26. Chart showing the fluctuation of the water level in a shallow observation well on the Fish dam property in northern Wake County near the gaging station on the Neuse River near Northside, N. C.
A hydrograph of one observation well in the Neuse River basin is compared with climatic data in figure 26. This illustration shows that water levels usually rise soon after a rainfall and then decline slowly thereafter.
Sometimes, drainage works are constructed to lower the water table permanently in swamps and meadow lands so that more val uable crops may be grown. In the Neuse River basin, such drain age projects have been effective locally but have not been exten sive enough, as yet, to lower water levels over wide areas.
There is often some concern about falling water levels toward the end of the growing season when water levels are at their low est stage of the year. There is seldom any occasion for comment when the water table is at the highest point of its cycle in the spring. Thus it may not be generally realized that the water table at any given time of year differs little from its stage at the same time in previous years. Periods of several years of persistently dry or persistently wet weather cause temporary downward or

PUBLIC WATER-SUPPLY SYSTEMS 67
upward trends from year to year. However, where the ground water is not pumped heavily or otherwise di-scharged artifically (as through drainage ditches), these trends are not permanent, and over a long period of years the average ground-water levels change little.
PUBLIC WATER-SUPPLY SYSTEMS
There are 43 public water systems in the Neuse River basin; 9 use surface water and 34 use ground water. Location of the systems, the source of supply, the dissolved solids content, and hardness of the waters is shown in plate 3. A summary of chem ical analyses of raw and treated waters for the water-supply systems in the basin is given in table 10. Additional pertinent data related to the systems in the basin are given in the following sections. The data on yields of wells are not strictly indicative of the productivity of the aquifers. Some reported yields were meas ured during short intensive pumping tests after the drilling of the wells and probably are larger than could be sustained over a long period; some yields represent pump capacity rather than maxi mum well yield, and so do not show the amount that could be pumped.
APEX, WAKE COUNTY
Ownership: Municipal. Population served: 1,084. Source: Reservoir on two unnamed streams forming a35-acre lake. Treat ment: Coagulation with alum, chlorination, rapid sand filtration, final adjustment of pH with lime. Rated capacity of filtration plant: 324,000 gpd. Raw-water storage: None. Finished-water storage: 100, 000-gallon elevated tank. Location of filtration plant: 3 miles northeast of Apex. It was necessary to supplement the normal water source with water from nearby lakes in 1954.
AYDEN, PITT COUNTY
Ownership: Municipal. Population served: 2,282. Source: 4 wells (Nos. 1-4; 155, 155, 450, and 505 feet deep. The yield is reported to be 150, 250, 350, and 500 gpm. Well 1 pumped into 100, 000-gallon reservoir and then into elevated tank for distri bution. Wells 2-4 are pumped directly into mains for distribution. Treatment: None. Ground storage: 100,000-gallon reservoir. Elevated storage: 60, 000-gallon elevated tank.

68 WATER RESOURCES, NEUSE RIVER BASIN, NORTH CAROLINA
Table 10. Chemical analyses of water from public
[Chemical constituents, in parts per million.
Location
Do. .....Ayden. ...........
Do..............Bailey.............
Do..............Beaufort......... Beiison... .........
Do.............
Do..............Do.............. Do..............
Cherry Point.... Do..............
Do.............. Do..............
Cove City....... Creed moor......
Do..............Durham..........
Do..............Farmville.......;
Do..............Fountain......... Fremont..........
Do..............
Do.............. Do..............
Goldsboro........ Do..............
Grifton...........Hillsboro.. .......
Do..............Hooker ton....... Kenly.............
Do..............Do.............
Do.............Do.............
Knightdale...... Do..............
LaGrange. ....... Do..............
Middlesex....... Morehead City.
Do............. Mount Olive....
Do.............New Bern........
Do.............Do.............
Pikeville........Pink Hill........ Princeton........
Do.............
Date of
collection
Apr. 3 1952 ......do...........Feb. 9, 1948 Sept. 21, 1951 July 22, 1948 Mar. 4, 1954 Jan. 4, 1955 May 16, 1947 Apr. 23, 1954 Apr. 3. 1952 June 2, 1953 Sept. 18, 1954 Nov. 18, 1954 Jan. 5. 1953 ......do............May 20, 1948 Apr. 23, 1954 ......do........... July 6. 1949 Jan. 21, 1954 ......do............Jan. 31, 1955 ......do............Nov. 11, 1947
Jan. 12, 1948 Apr. 26, 1948 Jan. 3, 1955 Jan. 21, 1954 ......do....... .
Aug! l2*"lT5*0 ......do...........June 14, 1954 Jan. 31, 1955 ......do............Jan. 4. 1955 Nov. 4, 1947 ......do...........May 27, 1954 Feb. 19, 1951 ......do............Jan; 3, 1955 May 9, 1951 June 12, 1951 May 15, 1947 Jan, 3, 1955 May 15, 1947 Mar. 4, 1954 Jan. 4. 1955 ......do............ Dec. 2, 1946 Aug. 21, 1953 Nov. 19, 1952 June 10, 1954 Nov. 19, 1952 Oct. 19, 1953 Feb. 1, 1955 Jan. 5. 1948 fune 7, 1954
Type
R FR R R F F R R R R R R R FR R R R R FR FR R R R R R R R R FR R FRR R R R R R R R R R F F F F R R R R F R R R R
Depth of
well (feet)
........
155 450 250 155 348 550 800 200 400 250 500 250
250 125
""2*8*0*
500 500 194 596 280
175 150
135
380 96
110 200 375 550 435
92 195 238 321 190
86 230
"l7*o"
282
126
87 220 141 236
Silica (Si02)
5.5 3.7
19 11 4.9
24 36 12 11 43 37 41 47 31 24 27 30 29 9.7 7.0 4.3 8.7 6.8
20 16 20 17 15 33 33 35 13 14 20 15 14 13 12 15 22 13 9.8
11 48 35 24 26 42 35 40 41 32 32 15 22 15 13 12 32 33
Iron (Fe)
0.06 .03 .68
3.3 6.6 4.0 .09 .09 .00 .33
1.1 1.9 1.8 2.6 .12 .02
1.1 .18 .15 .11 .08 .08 .02 .14 .22 .19 .26 .07 .13 .09 .04 .06 .06 .31 .07 .12 .12 .49 .19 .66 .17 .73 .22 .35 .13
1.7 .31 .88 .10 .17 .10
1.4 .74
1.4 3.9 .14
1.4 .26 .21 .55
Man ga
nese (Mn)
0.00 .08 .07 .00 .28 .00 .00 .00 .00 .14 .04 .00 .00 .00 .00 .00 .00 .00 .00 .00 .00 .00 .00 .00 .00 .00 .00 .00 .00 .00 .00 .00 .00 .00 .00 .00 .00 .12 .00 .00 .00 .00 .00 .00 .00 .00 .00 .00 .00 .00 .00 .08 .00 .00 .00 .00 .00 .00 .08 .00
Cal cium (Ca)
3.2 17 42 12
5.6 4.1
69 17 13 12 74 14 22 85 15 20 12 13 4.7 3.7
29 5.0
18 1.0 8.8
36 72 49 9.7 6.2 4.8 2.8
14 35 4.8 12-
.2 8.7 4.6 9.8 7.6 6.4 9.6 9.0 2.8 4.6 2,4
27 7.6
96 84
7.9 7.0
79 76 23
3.4 48 24 23
Mag ne sium (Mg)
3^3 1.4 2.9 1.7 3.8 4.2
26 6.9 5.6 3.1
11 5.6 5.1 2.3 2.6 2.0 4.5 3.4 4.3 .9
5.7 1.2 1.7 1.6 5.1 6.8
23 17
5.4 2.9 2,0 1.2 1.3 4.9 1.5 1.5 .2
13 6.0 2.8 2.7 2.9 6.6 3.0 .8
2.7 1.2 3.7 2.9 5.4
11 1.0 1.6 1.8 2.4 .5
1.5 .7
4.5 4.7
Sodium (Na)
Potassium (K)
5.0. 5.2 9.2
11 4.3
14 24 9.3
54 49 9.9
26 9.7 1.7
15 1.6 8.1
18 23 12 13
140 5.2 6.6
5.6 1.9 3.5 1.6
136 79 57
189 17 18
9.8 6.0 5.5 5.1 5.8
24 6,5 4.7 .7 4.2 .4
84 7.0 33
6.8 13 40 47
30 17 7.3 8.8
40 32 6.4
6.5 6.8
8.8 4.8 9.9 7.0
9.5 5.1
14 2.9
74 3.6
2.9 1.0 20 8.6

PUBLIC WATER-SUPPLY SYSTEMS 69
water supplies in the Neuse River basin
Type: R, raw water; t', finished water]
Bicar bonate (HCOj)
913
155443939
383129130
68117
8712427542726366
3657
182522
226220137191199
7240311625
1892219
181201858
1271451564829
11189
10045
320321
3932
214239216
1215012397
Car- ^*«ibonate (C03)
000000000000008000
1304040000000000007000000000000000000000000
Sulfate (SO,)
6.5324.5
112.4
112.65.94.43.6
1798.66.71.0
17117.78.31.4
12767.3
27258.87.1
140284.22.41.53.5
213.55.8
14156.43.24.63.11.43.51.11.13.35.64.91.51.61.45.92.9
15.2
136.71.5
1311
Chlo ride (Cl)
6.5103.49.42.98.8
1354363.23.43.52.58.5
14209.08.07.03.86.23.89.0
651686
27141
2.53.23.24.27.25.53.54.2
307214
6.56.06.02.23.92.6
117.86.04.8
109.53.84.0
316.5
213.83.24.62.5
Fluo- ride (F)
0.1.2.1.1.1
.3
.2
.1
.1
.1
.0
.1
.3
.4
.0
.1
.21.0.0.0.0.1.7.5.2.3.0.2.1.1.0.0.3.0.0.0.1.1.1.2.3.1.1.1.2.1.4.1.0.0.4.1.0.1.0.1.1.1.2
Ni trate (NQO
0.81.1.0.5.0
1.41.3.2.0.1.0.2.1.0.0
122.61.3.2.8
1.2.5
1.0.5.6.4.9
1.5.4.5.6.5.4.1.3.0.8
27162.4.3.1
1.05.5.4.2
1.2.1.4
1.31.3.0.1.0.3.0.2.0.0.4
Dissolved solids
(residue on evap oration
at 180*C)
4084
1578143
11436921418610841712716028312615811311436955
1465392
3692442858532809881765086
1935275
2471948291
13815115310568
14612714881
3373368373
279237253
41151159139
Hardne CaC<
Cal cium, Mag nesium
1348
117373028
278715643
2305777
222485848462913961751
943
1182741914627201240
1081835
2753636302851351023118331
262256
2424
204199
5915
1237877
ss as 3s
Non- car - bon ate
638
01000000
134000000007
740
27006
11828
0000
200080
5921
00000000100000
29405000
Specific conduct
ance fmicro- mhos at 25'C)
52.4140
» «....... 142
> «........ .134588
»
334128570172221447180
.............15715760265.1
23360.6
141....,.»....»,
.............
49014979.276.951.2
120315
69.7102408
.............134*""
22725225411058.0
.............173
............96.3
508513
.............76.3
44238842344.5
256 « « »
189
PH
6.76.77.66.36.96.57.27.87.96.77.36.67.27.18.66.66.66.68.36.09.26.89.07.88.07.67.67.76.76.66.36.66.98.17.09.27.95.96.26.97.77.78.06.66.07.47.37.76.47.27.26.06.27.17.37.55.67.57.87.6
Color (units)
252
1236A
123323
101518
72229
365
227
153035441
1733
101012
6343
12823
371018
3171312
435660
133
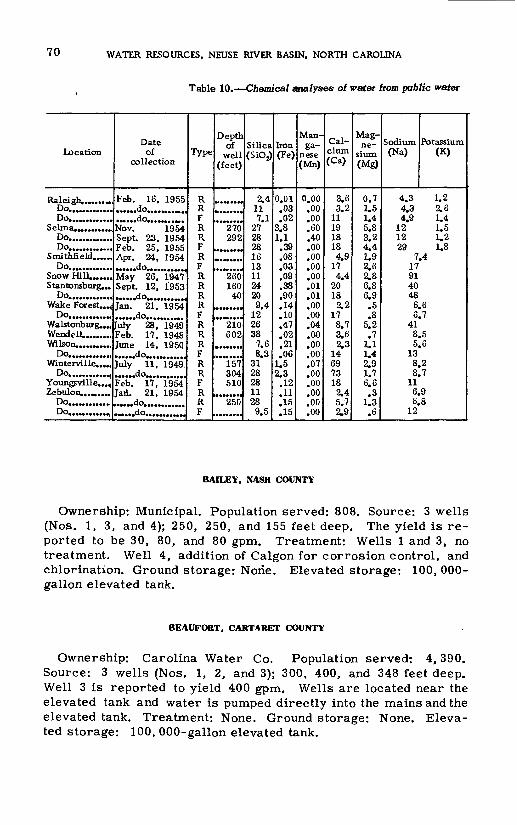
70 WATER RESOURCES, NEUSE RIVER BASIN, NORTH CAROLINA
Table 10. Chemical analyses of water from public water
Location
Raleigh......... Do.............Do.............
Do.............Do.............
Smithfield...... Do.............
Snow Hill....... Stantonsburg...
Do............. Wake Forest...^
Do.............Walstonburg..., Wendell. ........ Wilson...........
Do.............Winterville....,
Do.............Youngs vi 11 e...^ Zebulon.........
Do.............Do.............
Date of
collection
Feb. 16, 1955 ......do...........
Nov. 1954Sept. 23, 1954Feb. 25, 1955Apr. 24, 1954 ......do............May 26, 1947 Sept. 12, 1953 ......do............ Jan. 21, 1954 ......do...........July 28, 1949 Feb. 17, 1948 June 14, 195Q ......do......July 11, 1949.
Feb. 17, 1954 Jan. 21, 1954
Type
R RFRRFR FR R R R FR R R FRRF R RF
Depth of
well (feet)
.........
270OQO
........
260 160'
40
210 602
157304510
"**250
Silica (SiO^
2.4 117.1
27282816 1311 24 20 9.4
1226 38
7.6 8.3
31 2828 11 289.5
Iron (Fe)
0.01 ,030?,
3.81.1.39.08 ,03.09 .38 .90 .14in
.47
.02
.21
.061.5 ?,,3.12 .11 .15.15
Man ga
nese (Mn)
0.00 .00.00.60.40.00.00 .00.00 .01 .01 .00 .00.04 .00 .00 .00.07 .00.00 .00 .00.00
Cal cium (Ca)
3.6 3.2
111918184.9
174.4
20 18 2.2
178.7 3.6 2.3
1469 73182.4 5.72.9
Mag ne
sium (Mg)
0.7 1.51.45.83.24 41.92.62.8 6.8 6.9 .5 .8
5.2 .7
1.1 1.42.9 1.76.6 .3
1.3.6
Sodium (Na)
4.3 4.34.9
121229
7 179140 48
66
41 8 5
138 8.
116,6,
12
Potassium (K)
1.2 2.61.41.51.21.8
.4
.6
.7
.5
.6
,2 7
9 8
BAILEY, NASH COUNTY
Ownership: Municipal. Population served: 808. Source: 3 wells (Nos. 1, 3, and 4); 250, 250, and 155 feet deep. The yield is re ported to be 30, 80, and 80 gpm. Treatment: Wells 1 and 3, no treatment. Well 4, addition of Calgon for corrosion control, and chlorination. Ground storage: None. Elevated storage: 100, 000- gallon elevated tank.
BEAUFORT, CARTARET COUNTY
Ownership: Carolina Water Co. Population served: 4,390. Source: 3 wells (Nos. 1, 2, and 3); 300, 400, and 348 feet deep. Well 3 is reported to yield 400 gpm. Wells are located near the elevated tank and water is pumped directly into the mains and the elevated tank. Treatment: None. Ground storage: None. Eleva ted storage: 100, 000-gallon elevated tank.

PUBLIC WATER-SUPPLY SYSTEMS 71
supplies in the Neuse River basin Continued
Bicar bonate (HCQj)
1717208765
1122446
204171178
1010
142291534
227213
951131
0
Car bonate
(COa)
00000000000000000000000
Sulfate(S04)
5.65.8
231727225.1
40119.0
116.8
445.5.7
2.9302.48.9
127.32.9
29
Chlo ride (Cl)
3.23.25.58.83.07.56.57.0
2811134.24.06.42.84.96.59.2
173.23.53.54.2
Flua- ride (F)
0.0.1.2.1.1.0.1.1.4.2.2.0.0.3.1.0.1.1.1.1.1.1.1
Ni trate
(N03)
0.0.0.1.3.9.1
2.31.5.3.2.5.8.8.4
2.0.3.8.1.2.1.6.8.6
Dissolvedsolids
(residue on evap oration
at 180'C)
405069
142130169
591252552042114892
164754092
237249131457762
Hardness asCaC03
Cal cium Mag
nesium
12143371596420532278738
4643121041
18418972
72010
Non- car- bon-ate
00
170500
150000
38000
130
15000
10
Specificconduct
ance (micro- mhos at 25°C)
48.150.8
100209178243
75.6194
32535649.0
136248
****
48.115537138718745.579.398.1
PH
6.96.77.56.86.88.16.67.87.97.27.46.36.37.06.26.77.97.27.37.06.16.04.5
Color (units)
2333
3257
193343
25535
284224
2647
BENSON, JOHNSTON COUNTY
Ownership: Municipal. Population served: 2,220. Source: 3 wells (Nos. 1, 2, and 3); 550, 717, and 800 feet deep. The yield is reported to be 200, 140, and 15 gpm. Treatment: None. Ground storage: 100,000-gallon reservoir. Elevated storage: 100,000- gallon elevated tank.
GARY, WAKE COUNTY
Ownership: Municipal. Population served: 1,768. Source: 11 wells (Nos. 1-3 and 5-12); 320, 220, 320, 250, 200, 405, 300, 400, 300, 402, and 500 feet deep. The total yield of all wells is reported to be 532 gpm. All wells are pumped into distribution system at point of well location. Treatment: None. Ground stor age: None. Elevated storage: 100, 000-gallon elevated tank.

72 WATER RESOURCES, NEUSE RIVER BASIN, NORTH CAROLINA
CHERRY POINT, CRAVEN COUNTY
Ownership^ U. S. Government. No information available as to population served. Source: Wells.
CLAYTON, JOHNSTON COUNTY
Ownership: Municipal. Population served: 2, 500. Source: 9 wells (Nos. 1-9), 185, 225, 225, 250, 210, 485, 225, 185, and 250 feet deep. The total yield of all wells is reported to be 341 gpm. Wells 1, 2, and 6 are pumped into ground reservoir and and then into system. All other wells are pumped into distribu tion system. Treatment: None. Ground storage: 100, 000-gal- lon reservoir. Elevated storage: 100, 000-gallon elevated tank.
COVE CITY. CRAVEN COUNTY
Ownership: Wells-Oates Lumber Co. Population served: 465. Source: 1 well, 280 feet deep. Treatment: None. Ground storage: None. Elevated storage: None.
CREEDMOOR, QRANVILLE COUNTY
Ownership: Municipal. Population served: 2,075. Source: Ledge Creek impounded in lake with capacity of 120 million gal lons. Treatment: Coagulation with alum, carbon, and lime; rapid sand filtration; adjustment of pH with lime. Rated capacity of fil tration plant: 140, 000 gpd. Ground storage: 52, 000-gallon clear well. Elevated storage: 68, 000-gallon elevated tank. Location of filtration plant: 1 mile west of Creedmoor on Camp Butner Road.
DURHAM, DURHAM COUNTY
Ownership: Municipal. Population served: about 79,000, Source: Flat River impounded in Lake Michie, about 15.miles northwest of the city. Treatment: Partial aeration, breakpoint chlorination, coagulation with alum and lime, sedimentation, rapid sand filtration, and final adjustment of pH with lime. Activated carbon used occasionally for taste and odor control. Rated ca pacity of treatment plant: 15. 56 mgd. Raw-water storage: Im pounding reservoir, 4, 500 million gallons. Finished-water storage 5 clear wells, 4. 5 million gallons; 1 elevated tank, 1. 5 million gallons; 1 elevated reservoir, 3 million gallons. Quantity of water used during. 1954:' 3, 176. 6 million gallons. Maximum daily rate: 5. 87 mgd.
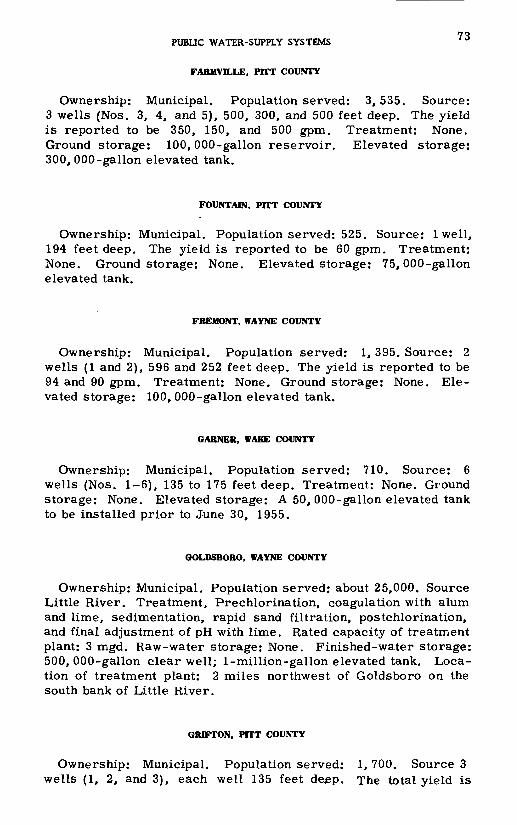
PUBLIC WATER-SUPPLY SYSTEMS ' °
FARMVELLE, PITT COUNTY
Ownership: Municipal. Population served: 3,535. Source: 3 wells (Nos. 3, 4, and 5), 500, 300, and 500 feet deep. The yield is reported to be 350, 150, and 500 gpm. Treatment: None. Ground storage: 100,000-gallon reservoir. Elevated storage: 300, 000-gallon elevated tank.
FOUNTAIN, PITT COUNTY
Ownership: Municipal. Population served: 525. Source: 1 well, 194 feet deep. The yield is reported to be 60 gpm. Treatment: None. Ground storage: None. Elevated storage: 75,000-gallon elevated tank.
FREMONT, WAYNE COUNTY
Ownership: Municipal. Population served: 1,395. Source: 2 wells (1 and 2), 596 and 252 feet deep. The yield is reported to be 94 and 90 gpm. Treatment: None. Ground storage: None. Ele vated storage: 100, 000-gallon elevated tank.
GARNER, WAKE COUNTY
Ownership: Municipal. Population served: 710. Source: 6 wells (Nos. 1-6), 135 to 175 feet deep. Treatment: None. Ground storage: None. Elevated storage: A 50, 000-gallon elevated tank to be installed prior to J-une 30, 1955.
GOLDSBORO, WAYNE COUNTY
Ownership: Municipal. Population served: about 25,000. Source Little River. Treatment, Prechlorination, coagulation with alum and lime, sedimentation, rapid sand filtration, postchlorination, and final adjustment of pH with lime. Rated capacity of treatment plant: 3 mgd. Raw-water storage: None. Finished-water storage: 500, 000-gallon clear well; 1-million-gallon elevated tank. Loca tion of treatment plant: 2 miles northwest of Goldsboro on the south bank of Little River.
GRIFTON. POT COUNTY
Ownership: Municipal. Population served: 1,700. Source 3 wells (1, 2, and 3), each well 135 feet dejep. The total yield is

74 WATER TUSfcURCES, NEUSE RIVER BASIN, NORTH CAROLINA
reported to be 541 gpm. Treatment: None. Ground storage:None. Elevated storage: 60, 000-gallon elevated tank.
HILLSBORO, ORANGE COUNTY
Ownership: Municipal. Population served: 2, 360. Source: Eno River. Treatment: Coagulation with alum, rapid sand filtration, postchlorination, and final adjustment of pH with lime. Rated ca pacity of filtration plant: 500,000 gpd. Raw-water storage: None. Finished-water storage: 50, 000-gallon clear water well;2DO, 000- gallon standpipe; and 20,000-gallon elevated tank. Location of fil tration plant: 2 miles west of Hillsboro. Plans have been made to build a 24-million-gallon impounding reservoir on Eno River.
HOOKERTON, GREENE COUNTY
Ownership: Municipal. Population served: 350. Source: 1 well, 380 feet deep. The yield is reported to be 120 gpm. Treatment: None. Ground storage: None. Elevated storage: 75,000-gallon elevated tank.
KENLY, JOHNSTON COUNTY
Ownership: Municipal. Population served: 1, 520. Source: 3 wells (Nos. 1, 2, and 3), 96, 110, and 200 feet deep. The yield is reported to be 90, 70, and 200 gpm. Treatment: None. Ground storage: None. Elevated storage: 100, 000-gallon elevated tank.
KINSTON, LENDER COUNTY
Ownership: Municipal. Population served: 27,500. Source: 5 wells (Nos. 1-5), 361, 369, 365, 552, and 435 feet deep; 3 ar tesian flowing wells (Hillcrest group); 350 to 390 feet deep. The yield of the 5 wells is reported to be: 900, 690, 460, 900, and 980 gpm. The flow of the artesian group is 150 gpm. Treatment; The water from the 5 wells is chlorinated before entering the distribu tion system. Water from the Hillcrest wells flows into a reser voir and is then pumped into the distribution system. Ground storage: 2 reservoirs, 1, 000, 000 and 250, 000 gallons. Elevated storage: 50, 000-gallon elevated tank.

PUBLIC WATER-SUPPLY SYSTEMS 75
KNIGHTDALE, WAKE COUNTY
Ownership: Municipal. Population served: 620. Source: 2 wells (1 and 2), 195 and 95 feet deep. The yield of the 2 wells is reported to be 82 and 22 gpm. Treatment: Chlorination. Ground storage: None. Elevated storage: 75, 000 gallon elevated tank.
LA ORANGE, LENOffi COUNTY
Ownership: Municipal. Population served: 1,800. Source 2 wells (1 and 2), 238 and 321 t&et deep* Well 1 used for stand-by. The yield of the 2 wells is reported to be 300 and 250 gpm. Treat ment: None. Ground storage: None. Elevated storage: 90,000- gallon elevated tank.
LUCAMA WILSON COUNTY
Ownership: Municipal. Population served:400. Source::! well, 190 feet deep. The yield of the well is reported to be 50 gpm. Treatment: Aeration (over coke trays), coagulation with lime, chlorination, and rapid sand filtration. Ground storage: 3, 000- gallon concrete reservoir. Elevated storage: 100, 000-gallonel evated tank.
MIDDLESEX, NASH COUNTY
Ownership: Municipal. Population served: 525. Sourcer2 wells (1 and 2), 86 and 74 feet deep. The yield of the 2 wells is report ed to be 30 gpm each. Treatment: Addition of Calgon for corro sion control. Ground storage: None. Elevated storage: 30,000- gallon elevated tank.
MOREHEAD CITY, CARTERET COUNTY
Ownership: Carolina Water Company. Population served: 5,444. Source: 6 wells (Nos. 1-6), 250, 525, 129, 247, 250, and 230 feet deep. Well number 6 is reported to yield 365 gpm. Treatment: Chlorination. Ground storage: None. Elevated storage: 65,000- gallon elevated tank.
MOUNT OLIVE, WAYNE COUNTY
Ownership: Municipal. Population served: 4,000. Source: 4 wells (Nos. 1-4), 135, 170, 175, and 282 feet deep. The yield

76 WATER RESOURCES, NEUSE RIVER BASIN, NORTH CAROLINA
of the wells is reported to be 90, 160, 150, and 800 gpm. Treat ment: Chlorination. Ground storage: 2 concrete reservoirs, 100, 000 gallon and 15, 000 gallon. Elevated storage: 75, 000-gallon elevated tank.
NEW BERN, CRAVEN COUNTY
Ownership: Municipal. Population served: 17,380. Source: 12 wells (Nos. 1-12), 90 to 115 feet deep. The total yield of the wells is reported to be 3, 100 gpm. Treatment: Softening with zeolite, ammoniation, and chlorination. Rated capacity of treat ment plant: 2 mgd. Raw-water storage: None. Ground storage: 300, 000-gallon reservoir. Elevated storage: 100, 000-gallon el evated tank.
PINK HILL, LENOIR COUNTY
Ownership: Municipal. Population served: 450. Source: 1 well, 220 feet deep. The yield of the well is reported to be 250 gpm. Treatment: None. Ground storage: None. Elevated storage: 100, 000-gallon elevated tank.
PIKEVflLLE, WAYNE COUNTY
Ownership: Municipal. Population served: 500. Source: 5 wells (Nos. 1-5), 257, 22, 20, 87, and 90 feet deep. The yield is reported to be 10, 15, 15, 100, and 100 gpm. Treatment: Addi tion of Calgon for corrosion control and chlorination. Ground storage: 3 clear water wells. Elevated storage: 75, 000-gallon elevated tank.
PRINCETON, JOHNSTON COUNTY
Ownership: Municipal. Population served: 655. Source:-2 wells (1 and 2), 141 and 236 feet deep. The yield is reported to be 60 and 80 gpm. Treatment: None. Ground storage: 1 clear water well. Elevated storage: 75, 000-gallon elevated
RALEIGH, WAKE COUNTY
Ownership: Municipal. Population served: about 73,500. Source: Walnut Creek impounded in Lakes Raleigh and Johnson. Swift Creek impounded in Rands Mill reservoir. Treatment: Coagulation

PUBLIC WATER-SUPPLY SYSTEMS 77
with alum, ammoniation (ammonium sulfate), prechlorination, sedimentation, addition of activated carbon for control of taste and odor, rapid sand filtration, adjustment of pH with lime, and postchlorination. Rated capacity of treatment plant: 13, 000,000 gpd. Ground storage: 2 clear wells, 2 million and 2 million gal lons. Elevated storage: 3 elevated tanks; 100,000, 600, 000, and 750,000 gallons. Location of treatment plant: 1 mile south of Raleigh on the old Fayetteville Road.
SELMA, JOHNSTON COUNTY
Ownership: Municipal. Population served: 2,600. Source: 5 wells (Nos. 3-7), 181, 305, 300, 291, and 275 feet deep. The yield is reported to be 180, 350, 300, 100, 200 gpm. Treatment: Fil tration by pressure, adjustment to pH 9.2 with caustic soda, and chlorination. Ground storage: 8,000-gallon reservoir. Eleva ted storage: 75, 000-gallon elevated tank.
SMITHFIELD, JOHNSTON COUNTY
Ownership: Municipal. Population served: 5, 700. Source: Neuse River. Treatment: Coagulation with alum and soda ash, prechlorination, addition of activated carbon for control of taste and odor, rapid sand filtration, adjustment of pH with lime, and postchlorination. Rated capacity of treatment plant: 1 mgd. Ground storage: 200, 000 gallon clear water well. Elevated stor age: 2 elevated tanks; 100,000 and 300, 000 gallons. Location of treatment plant: Northwest Smithfield on Neuse River.
SNOW HILL, GREENE COUNTY
Ownership: Carolina Water Company. Population served: 1, 000. Source: 1 well 260 feet deep. The yield is reported to be 340 gpm. Treatment: None. Ground storage: None. Elevated storage: 75, 000-gallon elevated tank.
STANTONSBURG, WILSON COUNTY
Ownership: Municipal. Population served: 750. Source: 2 wells (1 and 3), 165 and 150 feet deep. The yield is reported to be 300 and 80 gpm. Treatment: None. Ground storage: None. Elevated storage: 30, 000-gallon elevated tank.

78 WATER RESOURCES, NEUSE RIVER BASIN. NORTH CAROLINA
WAKE FOREST, WAKE COUNTY
Ownership: Municipal. Population served: 4,400. Source: Smith Creek and Alston Branch impounded. Treatment: Coagu lation with alum and lime, rapid sand filtration, and chlorination. Rated capacity of filtration plant: 450, 000 gpd.
WALSTONBURG, GREENE COUNTY
Ownership: Municipal. Population served: 250. Source: 1 well 210 feet deep. Treatment: None. Ground storage: None. Elevated storage: 75, 000-gallon elevated tank.
WENQELL, WAKE COUNTY
Ownership: Municipal. Population served: 1,690. Source: 4 wells (Nos. 1-4), 301, 602, 301, and 100 feet deep. The yield is reported to be 40, 30, 20, and 60 gpm. Treatment: None. Ground storage: None. Elevated storage: 100, 000-gallon elevated tank.
WILSON, WILSON COUNTY
Ownership: Municipal. Population served: 25,000. Source: Contentnea Creek and Toisnot Swamp. Treatment: Prechlorina- tion, coagulation with alum and (if necessary) lime, sedimentation, rapid sand filtration, ammoniation, addition of Calgon for corro sion control, postchlorination, and adjustment of pH with lime. Rated capacity of treatment plant: 4 mgd. Raw-water storage: None. Finished-water storage: 1 reservoir, 2 million gallons; 1 elevated tank, 1 million gallons. During dry periods supply is supplemented from Tar River. One well has been drilled to be used as emergency supply.
WINTERVDLLE, PITT COUNTY
Ownership: Municipal. Population served: 1,000. Source: 2 wells; 157 and 304 feet deep. The yield is reported to be 80 and 300 gpm. Treatment: Well 1, softening with zeolite and filtra tion; well 2, no treatment. Ground storage: None. Elevated stor age: 75, 000-gallon elevated tank.

*
PRESENT WATER USE 79
YOUNGSVILLE, FRANKLIN COUNTY
Ownership: Municipal. Population served: 660. Source: 1 well, 300 feet deep. The yield is reported to be 75 gpm. Treatment: Addition of Calgon for corrosion control. Ground storage: None. Elevated storage: 75, 000-gallon elevated tank.
ZEBULON, WAKE COUNTY
Ownership: Municipal. Population served: 1,486. Source: 4 wells (Nos. 1-4), 312, 250, 190, and 150 feet deep. The yield is reported to be 100, 45, 90, and 50 gpm. Supplemental supply: Little River. Treatment: Wells, none. All wells pumped directly into distribution system. Little River. Coagulation with lime and alum, rapid sand filtration, and chlorination. Rated capacity of treatment plant: 200,000 gpd. Ground storage: 100,000-gallon clear well. Elevated storage: 100, 000-gallon elevated tank.
PRESENT WATER USE
Water uses are classified in many ways; in this report they are considered to be of either the withdrawal or the nonwithdrawal type. Withdrawal uses are those that remove, or divert, water from its natural medium and transport it elsewhere. . Surface water that is withdrawn for most uses is usually returned in es sentially undiminished quantity to the stream from which it was withdrawn. Thus the same water may be used many times if its quality has not been too greatly impaired. On the other hand, water withdrawn for irrigation, and distributed by sprinkler irri gation systems, as in North Carolina, is almost if not completely consumed. Irrigation,waterpower, and domestic, municipal, and industrial uses' are withdrawal uses. The uses of ground water are all of the withdrawal type. The total withdrawal of surface water for all uses, except water power, probably is in the order of 200 mgd. Total withdrawals of ground water aggregate about 80 mgd.
Nonwithdrawal uses do not require diversion. Navigation, waste disposal, and most uses for recreation and for conservation of wildlife are examples of nonwithdrawal uses.
PRIVATE INDUSTRIAL SUPPLIES
Most industries in the Neuse River basin use some water from public water-supply systems, but estimates of the quantities of

80 WATER RESOURCES, NEUSE RIVER BASIN, NORTH CAROLINA
water used were not available. Streamflow is used at various points in the basin for water power to operate grist mills and electric power plants, for cooling water in steam-electric plants and other plants using steam power, and for processing textile products. Of the water withdrawn from streams for these uses, the greater part is returned to the stream from which it is with drawal Reliable estimates of the volumes of streamflow with drawn for industrial use are not available, but the total volume is probably in the order of 150 mgd.
Textile plants are the greatest users of ground water in the Neuse River basin. Most of these plants use ground water for drinking and some other uses, but many use ground water for all or most of their operations. Many food processing plants and several smaller industries use wells as a source of water supply. Industrial use of ground water in the basin is estimated to be about 30 mgd.
PUBLIC SUPPLIES
The 33 public water-supply systems using ground water in the Neuse River basin use an estimated 16 mgd. The 10 public water- supply systems taking water from streams use a combined aver age of about 24 mgd, but during periods of heavy demand use as much as 38 mgd.
RURAL DOMESTIC SUPPLIES
All farm homes and all urban homes not using water from public water systems are assumed to use ground water exclusively. Jlu- ral water use is probably about 26 mgd.
AGRICULTURAL USE
There are many farm ponds in the Neuse River basin created by damming small streams or by devising hillside catchment ba sins to trap rainfall and surface runoff. These ponds are used for fishing, stock watering, and for irrigating farm crops. Prior to 1954, only a little surface water was used for irrigation. During the drought period in the summer and fall of 1954, however, the practice of irrigating farm crops and pastures greatly increased. No estimate of the total volume of surface water used for agricul ture is available but the amount is probably very insignificant in relation to the total supply in the basin. The number of farms equipped to irrigate during dry seasons may be expected to in crease greatly in coming years.

POTENTIAL SUPPLY 81
Although there has been a significant increase in the use of ground water for irrigation, about 5mgd was used during the 1954 irrigation season of about 3 weeks and the use of ground water for supplemental irrigation is likely to increase greatly in the future. Larger volumes of ground water are used for watering stock. Many flowing wells on farms in the Coastal Plain section continu ously withdraw ground water. All agricultural uses of ground water aggregated an estimated 3 mgd in 1954.
OTHER USES
Waste disposal by industries and municipalities is one of the more important nonwithdrawal uses of streamflow in the Neuse River basin. Navigation and recreational activities in certain areas constitute a significant use of the surface waters of the basin.
Ground water is also used as the source of supply for motels, laundries, and air conditioning, and these miscellaneous uses of ground water account for an estimated 5 mgd.
POTENTIAL SUPPLY
SURFACE WATEB
At the present time the demand for surface water of suitable quantity and quality is increasing rapidly. The industrial expan sion in the State, gains in population, greater use of automatic home appliances, and widespread installation of irrigation equip ment have caused an upsurge in the use of water. The withdrawal of surface water for these uses maybe expected to increase in the future.
The present sources of surface water generally appear to be adequate to provide the quantities required in the near future for the continued development of the area. Although it is probable that in most places the present quantity of water withdrawal can be in creased several times without danger of a shortage of supply, the demand for water in many localities will grossly exceed the min imum stream flow and additional storage facilities will be neces sary. The adequacy of the surface-water supplies in several localities will depend in large measure upon pollution abatement. In the lower reaches of the Neuse and Trent Rivers and Swift Creek, water supplies must be located carefully to avoid serious contamination by salt water.

82 WATER RESOURCES. NEUSE RIVER BASIN, NORTH CAROLINA
Rainfall deficiencies during recent growing seasons have led to an increase in the volumes of water used for irrigation, and it may be expected that similar rainfall deficiencies in the future will necessitate additional increases in irrigation. Because of the State's humid climate, irrigation will not be practiced on the same scale in North Carolina as is done in the western states, but sup plementary irrigation will undoubtedly be continued on an increas ing scale.
GROUND WATER
Preliminary studies indicate that the quantity of water now with drawn from ground-water reservoirs in the Neuse River basin is only a fraction of the total available supply. A great expansion of present ground-water development is feasible throughout the basin.
An exact determination of the potential ground-water supply that maybe utilized in any given area can be made only by interpreting hydrologic data of many kinds, collected over a period of years. The ground-water program in North Carolina has been limited so far to general studies, so that detailed knowledge of the properties of the aquifers has not been obtained. Sufficient information is available, however, to suggest areas of possible expansion and to point out certain limitations on development.
Domestic ground-water supplies may be obtained generally throughout the Neuse River basin and present no great problem. Moderate supplies for municipal, industrial, or agricultural use are available at many places in the Piedmont and upper Coastal Plain, and large supplies may be obtained throughout the area underlain by the sand of Cretaceous age and limestone of Tertiary age. There are, however, two important restrictions on ground- water use in the basin which must be mentioned spacing of wells and salt-water contamination.
When a well is pumped, the water level is lowered at the well so that water flows toward it from all directions (see p. 54). The distance from the well to which a measurable effect of pumping extends depends on the rate of pumping. Wells must, therefore, be properly spaced to prevent mutual interference. Because so many factors are involved in the proper spacing of wells, they cannot be discussed in this report. This problem is not imperative in the Piedmont or fall line areas where the permeability is rela tively low and yields are small. In the area underlain by the very permeable sand of Cretaceous age and limestone of Tertiary age, however, where large yields are expected, the problem is more acute, especially as it relates to salt-water contamination.

WATER LAWS 83
There are certain physical relationships between these bodies of water that may be briefly stated as follows: Under ideal condi tions and at any given well site, for every foot of drawdown of the fresh-water level, the salt-water level will ultimately rise 40 feet. A body of salt water is known to lie beneath the fresh water in the underground reservoir from the vicinity of Dover, in Craven County, to the coast. It is very important, therefore, that wells be properly spaced, not only to prevent their interfering with pro duction from other wells, but also to prevent their combined pro duction lowering water levels enough to allow salt water to rise into the wells and render them unfit for use.
In that part of the Neuse River basin where salt-water contam ination is possible, most wells have excellent yields, some fur nishing as much as 1 mgd. Under present conditions, heavy pumping may be safely continued or, at some places, increased without danger of contamination. Generally, it may be said that an industry requiring 0. 25 to 1 mgd may rely upon a private ground- water supply. Because of the necessity of spacing wells some distance apart, it may not be possible for an industry to have sev eral heavily pumped wells on its property, whereas a municipality, being abbe to space its wells over several square miles, may fur nish several additional millions of gallons daily for public uses, including industrial.
It must be emphasized, however, that geologic and hydrologic conditions differ enough from place to place to prevent the appli cation of a "formula" that may govern all cases. Before installing a large ground-water system, a municipality or an industry should obtain as much information as possible about the geology of the aquifer and its hydrologic properties. It maybe necessary to drill several test holes to determine the depth to the salt-water body and the possibility of contamination. Although the potential supply of ground water is large and its withdrawal may be safely in creased, to the greatest extent in the southeastern half of the Neuse River basin, each large installation should be given indi vidual study and should be planned in consideration of other instal lations in the same general area.
WATER LAWS
In North Carolina water rights, with only a few important excep tions, are based on the principal of riparian rights established under the old English law and as interpreted from time to time by various courts.
In matters affecting public health, the statutes of North Carolina provide that the State Board of Health shall have control over
84 WATER RESOURCES, NEUSE RIVER BASIN, NORTH CAROLINA
domestic waste discharges where such discharges are into waters used as sources of public water supplies.
The North Carolina State Stream Sanitation Committee, by action of the General Assembly of 1951, was vested with the authority to establish standards applicable to the streams and watercourses of the State and with the responsibliity of classifying such waters. Within the limits of the enabling act, control as to the manner and extent of disposal of sewage and waste and the maintenance of established stream standards rest with this Committee. Industries contemplating locating in North Carolina should clear with the State Stream Sanitation Committee plans and proposals for the disposal of waste into the streams of the State.
The General Statutes of 1943, as amended, provide that any person, firm, or corporation utilizing waters for irrigation that are taken from any stream, river, creek or lake in North Carolina, in an amount sufficient to substantially reduce the volume of flow, shall obtain a permit for such use from the Director of the Depart ment of Conservation and Development.
Navigable streams are under the jurisdiction of Congress through its constitutional powers to "regulate commerce among the several States. " This power extends to the nonnavigable trib utaries of navigable streams if the navigable capacity of the navi gable waterway or if interstate commerce is affected. Flood control is also recognized as a Federal responsiblity.
Control of navigable waters has been generally exercised by the Corps of Engineers, U. S. Army. Concurrent jurisdiction, how ever, is vested in the Federal Power Commission in the matter of permits and licenses where the construction and operation of hydroelectric installations are involved on navigable streams or tributaries thereto. The district office of the Corps of Engineers having jurisdiction over the navigable stream affected should be consulted where encroachment on a navigable stream is contem plated, or regarding any proposed impoundment of or diversion from such navigable stream or tributary thereto related to hydro electric installations. The entire Neuse River basin lies within the present jurisdiction of the Wilmington, N. C., district of the Corps of Engineers.
SELECTED BIBLIOGRAPHY
American Water Works Association, 1950, Water quality and treatment, 2d ed. Billingsley, G. A., and Joyner, B. F., 1953, Chemical and physical character of surface
waters of North Carolina, 1951-52: N. C. Dept. of Conserv. and Devel., Bull. 52, v.8. Collins, W. D., 1925, Temperature of water available for industrial use in the United
States, ,1925: U. S. Geol. Survey Water-Supply Paper 520-F, p. 97-104.

SELECTED BIBLIOGRAPHY 85
Dole, R. B., 1909, The quality of simace waters in the United States, pt. 1, Analysis ofwaters east of the one hundredth meridian: U. S. Geol. Survey Water-Supply Paper 236.
Harris, K. F., and Pauszek, F. H., 1951, Chemical Character of surface waters of NorthCarolina, 1^49-50: N. C. Dept. of Consery. and DeveL Bull. 52, v. 6.
Johnson, T. S., and Mann, C. L., Jr., 1938, Discharge records of North Carolina streams,1889-1936: N. C. Dept. Conserv. and Devel., Bull. 39, 220 p.
Joyner, B. F., and Lamar, W. L., 1949, Chemical character of surface waters of NorthCarolina, 1946-47: N. C. Dept. of Conserv. and Devel. Bull. 52, v. 3.
Joyner, B. F., and Pauszek, F. H., 1949, Chemical character of surface waters of NorthCarolina, 1947-48: N_ C. Dept. of Conserv. and Devel. Bull. 52, v. 4.
Lamar, W. L., 1947, Chemical character of surface waters of North Carolina, 1944-45:N. C. Dept. of Conserv. and Devel Bull. 52, v. 1.
1948: Chemical character of surface waters of North Carolina, 1945-46: N. C.Dept. of Conserv. and Devel. Bull. 52, v. 2.
Lohr, E. W., and Love, S. K., 1955, The industrial utility of public water supplies in theUnited States, 1952, pt. 1: U. S. Geol. Survey Water-Supply Paper 1299.
Mundorff, M. J., 1945, Progress report on ground water in North Carolina: N. C. Dept.Conserv. and Devel., Bull. 47, 78 p.
1946, Ground water in the Halifax area,. North Carolina: N. C. Dept. Conserv. andDeveL, BulL 51, 76 p.
North Carolina Division of Commerce and Industry, 1936, North Carolina: Today and to morrow: N. C. Dept. of Conserv. and Devel.
North Carolina Division of Water Resources and Engineering, 1947, Hydrologic data onthe Neuse River basin 1866-1945: N. C. Dept. of Conserv. and Devel.
North Carolina Division of Water Resources, Inlets and Coastal Waterways, 1955, Waterresources of North Carolina: N. C. Dept. of Conserv. and Devel.
North Carolina State Planning Board, 1937, A planning report on water resources ofNorth Carolina.
Parsons, Brinkerhoff, Hall, and MacDonald, June 1954, Report on survey of North Car*olina inland ports and waterways, prepared for N. C. Dept. of Conserv. and Devel.
Pauszek, F. H., 1950, Chemical character of surface waters of North Carolina, 1948-49:N. C. Dept. of Conserv. and Devel. Bull. 52, v. 5.
Pauszek, F. H., 1952, Chemical character of surface waters of North Carolina, 1950-51:N. C. Dept. of Conserv. and Devel. BulL 52, v. 7.
Ray, C. E., Jr., and Randolph, E. E., 1928, Preliminary report on the chemical qualityof surface waters of North Carolina with relation to industrial use: N. C. Dept. ofConserv. and Devel. Econ. Paper 61.
Saville, T., and Smith, G. W., 1925, Discharge records of North Carolina streams,1889-1923: N. C. Dept. Conserv. and Devel., BulL 34, 405 p.
Stiemke, R. E., February 1947, The extent of stream pollution in North Carolina: N. C.State Coll., Dept. of Eng. Research, Bull. 34.
United States Corps of Engineers, 1932, Report for the improvement and development ofthe Neuse River, N. C.: U. S. Cong. Doc., 72d Cong., 2d sess., H. Doc. 500.
United States Geological Survey, issued annually, Surface-water supply of the UnitedStates, pt. 2, South Atlantic slope and eastern Gulf of Mexico basins: U. S. GeoLSurvey Water-Supply Papers.
____issued annually, Surface-water supply of the United States, pt. 2A. South Atlanticslope basins, James River to Savannah River U. S. Geol. Survey Water-Supply Papers.
United States Public Health Service, 1946, Drinking water standards: reprint 2697, 14 p.,from Public Health Service Repts., v. 61, no. 11, p. 371-384.
United States Weather Bureau, issued annually, Daily river stages at river-gage stationson the principal rivers of the United States.
.___issued monthly and annually, Climatological data, North Carolina.

INDEX
Page
Abstract....................................Agriculture..............................Agricultural use of water ...........Analyses of water.....................Apex, public water-supply system.. Aquifer, artesian....................Ayden, public water system......
B
............ 1
............ 8
. . 80-81 47, 48, 58
,..67, 68-69 ...... 53-54
, 67, 68-69
Bailey, public water-supply system M 68-69, 70 Barton Creek, near Bayleaf....M..u..MM 16, 23,
26. 35. 39 Beaufort, public water-supply
system................................. 68-69, 70Benson, public water-supply systemM68-69, 71 Bibliography..................................... 84-85Big Branch, near Millbrook................l6, 23,
27. 35, 39 Black Creek formation..........^.^.«56, 62, 63Buck Swamp, near Dudley................. 17, 24,
27, 35, 39
Gary, public water-supply system....68-69, 71Castle Hayne formation........................... 56Chemical analyses of water, need for......... 12Chemical quality of water, relation
to streamflow........................ 46, 49-51Chemical requirements of water....M...M..M< 12Chemical specifications for water.......... 12-14Cherry Point, public water-supply
system............................... 68-69. 72Clayton, public water-supply
system................................. 68-69, 72Climate................................... ......... 4-6Coastal landfonns...................Coastal Plain, altitude.............
description.........................PQglgS........ .........................
sources of water..................Color in water, obj ections to........Contentnea Creek, at Hookerton...
29, 30chemical quality of water.....
......4» * * * O
............ 4
.M.....M. 56
,11-12 >.......... 15,~..17, 25, 35, 39, 48 .......51-52
near Wilson^......................... 17, 24, 30,39. 51-52
regulation of flow.M..M..u..M.....n...M.M. 18Core Creek, near Fort Barnwell.......... 17, 25,
29, 35, 39 Cove City, public water-supply
system................................. 68-69, 72Crabtree Creek, near Raleigh............ 16. 23,
26, 35. 39 Creedmore, public water-supply
system................................. 68-69, 72
Page
Cretaceous sand province, aquifers in....... 63chemical analyses of water................. 58depth and yield of wells..................... 63quality of water................................ 64
Crystalline-rock province, chemicalanalyses of water.MM..M....MM..M..M.M58
depth and yield of wells>M..MMM..M..MM.61 permeability ofM.....M..M..M.......... 57, 61quality of water................................ 62
Deep Run at Deep Run... »...17, 24.28, 35, 39
.........9-10
..16, 23,2630, 35, 39
Definition of terms..MMM..M......<Dial Creek, near Bahama...........
Discharge, deficient, maximumperiod of..^..................»........«32-36
Dissolved solids in water....M...14, 46, 49-51Draft-storage curves............................. 36Drainage...........................................3 4Duration of flow..........».........«....... 20-25Durham, public water-supply
system ...............................68-69, 72
Eno River, at Hillsboro.... ......16, 23,26, 30, 35, 39
Falling Creek, at Falling Creek ........1 7, 24,28, 35, 39
Fall lineM.M.......M..M..M.n...M.....M...M..M 3Farmville, public water-supply
system M..M.M..M...M......M..M.t>8-69, 73_
Flat River, at dam near Bahama....... 16, 23,30, 35, 39
near Bahama.................. 16, 21, 23, 26,30, 31, 35, 36, 39, 40
regulation of flow.u.M...M.M..n...M.M... 18Flood-frequency curves, seasonal^..... 43, 46
use of............................................ 46value of......................................... 43
Flood frequencies, studies......^......,...... 43Flood-stage frequencies, Neuse River ...44, 45 Flow-duration curve...................20. 21, 25Fluctuation of water levels................ .65-67Forest resources...... .................~. ........... 8Fountain, public water-supply
system ............................. .68-69, 73Fremont, public water-supply
system. .................... 68 69, 73
87

88 INDEX
G Page
Gaging stations, duration of records for....... 18See a/so Stream gaging sites and Quality
of water, gating sites.Garner, public water-supply
system................................. 68-69, 73Geography ...... .....................................2 3Geology....................................... ....54-56Goldsboro, precipitation and
temperature at^................................. 6public water supply.............. 51, 68-69, 73
Granite.................................55, 57, 61-62Grifton, public water-supply
system,.............................. 68-69, 73-74Ground water, chemical analyses of........... 58
chemical character of.......................... 59definition^...................................!!. 52hardness of........................................ 60movement.....................................53 54occurrence..........M........................ 52 54potential supply.......................... 82-83
Ground-water provinces.........,...............^ 57Growing season....................................... 5
H
Hardness of water, chemicals causing.........14graph of, for ground water.....................60importance of..................................... 14relation to dissolved solids.....................50
Hillsboro, public water-supplysystem «..»..«..~..........«.«....68-69, 74
Hookerton, public water-supplysystenv«......«..«..^..^.....«..M68-69, 74
Horse Creek, near Wake Forest...........l6, 23,26, 35, 39
Hydrogen-ion concentration......................10Hydrologic cycle................................!0-11
I
Industrial development............................. 8Introduction....................................... 2-10Iron in water, objection to.MM........MMM 14-15
K
Kenly, public water-supplysystems................................ 68-69, 74
Kinston, public water supply..... 54, 68-69, 74Knightdale, public water-supply
system.................................68-69, 75
La Grange, public water-supplysystem................................. 68-69, 75
Limestone-sand province..................... 64-65Little River, near Princeton...M..«JL7, 22, 24,
28, 30, 34. 35, 38. 39, 42, 51Low-flow frequency.......................... 25, 3£Lucama, public water-supply
system................................. 68-69, 75
M Page
Manganese in water, objection to.,......14-15Middle Creek, near Clayton......J.6, 22, 24,
27, 30, 33, 35, 37, 39, 41 near Smithfield^.........!?, 24, 27, 35, 39
Middlesex, public water-supplysystem.....................M........^8-69, 75
Mine Creek, near Millbrook...M..MMMl6> 23.27. 35, 39
Mineral products................................... 8Moccasin Creek, near Middlesex...... 17, 24,
28. 35, 39 Morehead City, public water-supply
system............................... 68-69, 75Mount Olive, public water-supply
system............................... 68-69, 75
N
Nahunta Swamp, near Snow Hill....... 17, 25,29, 39
Neuse River, at Kinston«.«........17, 24, 28,30, 35, 39. 45, 47
near Clayton..«^M«...16 t 23, 27, 30. 35,36, 39, 40, 44, 46, 47, 51
near Goldsboro..................... 17, 24, 28,30, 35, 39, 45, 47
near Northside..........M....MM..16, 23, 26,30, 35, 39, 44
New Bern, precipitation andtemperature at............................... 7
Peedee formation.M......MM....M..M..M.56, 63Piedmont region, description................... 3
rocks............M.............................. 55sources of water............................... 11
Pikeville, public water supply«..M.68-69, 76 Pink Hill, public water supply«M«.68-69, 76 Population........................................ 2-3Porosity of the rocks.M..M......M..M...........52Precipitation............................ 4-6, 7, 20Princeton, public water supply...... 68-69, 76Public water supply, sources................... 12Public water-supply systems......... 67-79, 80Pumping, effect of, on water level
in wells....................................... 54Purpose of the report.............................. 2
Quality of water, for industrial uses......... 13sampling sites for.......................... 16-17ground water..M....n......M..62, 63, 64, 65significance of................................. 12surface...................................... 46 5 2
Raleigh, precipitation and temperature at...........
public water supply Resources, natural............
70-71. 76-77

INDEX 89
S Page
Salinity of water of the area.MW..M.....M.MM 52Salt-water encroachment......................... 52Selma, public water supply............ 70-71, 77Shale rocks................. 55, 57. 61-62Size of area^.................................... ...... 2Slate province, depth and yield
of wells...........................^........ 62-63permeability of...................M.............. 62
Slate rocks.-..*,..................... 55, 37, 61-62S mithfieH, public water supply.....51,70-71, 77Snow Hill, public water supply........70-71, 77Soil moisture..................................^ 10 11
Specific conductance.............................. 10Stantonsburg, public water supply ......70-71, 77Stony Creek, at Goldsboro..M...17,24,28,35,39 Storage curves, use of........................37, 43Storage requirements.....................36, 39-43Streamflow. records of............................ 15
relation to chemical qualityof water......................... 46, 49-51
Streamflow characteristics................... 19-20Stream gradients...................................... 4Stream-gaging sites........................... 16-17Stream pattern.................................... 3 4Streams, importance in colonial times ....... 15Surface water, potential supply............ 81-82
quality of..................................... 46-52Surficial sands....................................... 56Swift Creek, chemical quality of water^.^.. 52
near McCullers.«..^..»MJ.6, 23, 27, 35, 39near Vanceboro....... 17, 25, 29, 35, 39, 48
Temperature.................................. 5, 6,, 7Terms, definitions...M.M>MM..M..M..M.M.M9-10 Tertiary limestone province, chemical
analyses of water...MMM..M.M...MMMMM 58 depth and yield of wells.M..M.M.
quality of water.............................
Page
Topography......................................... 3Transportation................................... 8-9Trent River, near Trenton.........17, 25, 29,
35, 39, 48, 52 Tuscaloosa formation.......................56, 62
W
Wake Forest, public water supply.,.70-71, 78 Walstonburg, public water supply... 70-71, 78 Water, agricultural use..................... 80-81
chemical specifications for............. 12-14miscellaneous uses........................... 81origin............................................. 10potential supply............................ 81-8 3private industrial supplies............... 79-80public supplies ..................12, 67-79, 80rural domestic supplies....................... 80sources of.................................... 11-12uses of............................................ 79
Water laws..................................... 83-84Water levels in wells, fluctu-
SltiODS O'*«»»>« »««»>«»» OO*"O 7
Wells, depth of..............61, 62, 63, 64, 65water levels in............................. 65 67yield of.....«..............61, 62, 63, 64, 65
Wendell, public water supply..^.... 70-71, 78Wilson, public water supply..........70-71, 78Winteryille, public water
.....^.w.M..^...^w...70-71, 78
Yorktown formation ..............Youngsville, public water
supply.M..M.M.......M.......
......... 56 , 62
.H.. 70-71, 79
Zebulon, public water supply....«-.70-71, 79
* U. S. GOVERNMENT PRINTING OFFICE : 1957 O - 428578