water resources delineation report - ohio · 2012-10-19 · differential correction technology...
TRANSCRIPT
Water Resources Delineation Report
Sparrow Fen Site, 11.7 Acres, Heckman
Street N.W., Lake Township, Stark County,
Ohio August, 2012

Water Resources Delineation Report
Sparrow Fen Site, 11.7 Acres, Heckman
Street N.W., Lake Township, Stark County,
Ohio
August, 2012
Prepared for: Union Square Investment,
LTD./Diebold, Incorporated
821 South Main Street
North Canton, Ohio 44720
Prepared by: Davey Resource Group
A Division of The Davey Tree Expert Company
1500 North Mantua Street
P.O. Box 5193
Kent, Ohio 44240
800-828-8312

Davey Resource Group i August, 2012
Table of Contents
Executive Summary ...................................................................................................................................... ii
Introduction.................................................................................................................................................... 1
Study Area Description and Location ........................................................................................................ 1
Secondary Source Information .................................................................................................................. 1
Methodology .................................................................................................................................................. 2
Results .......................................................................................................................................................... 4
Vegetation ................................................................................................................................................. 4
Soils ........................................................................................................................................................... 4
Hydrology................................................................................................................................................... 4
Conclusions ................................................................................................................................................... 5
Tables
1. Jurisdictional Wetlands Delineated on the Site ...................................................................................... ii
2. Jurisdictional Drainageways Delineated on the Site .............................................................................. ii
3. Soil Types Mapped for the Site .............................................................................................................. 1
4. ORAM Scoring Breakpoints for Wetland Regulatory Categories ........................................................... 3
Appendices
A. Water Resources Map
B. Plant Communities Map
C. Location of Stark County on Ohio County Map
D. Location of Study Area on Highway Map
E. Location of Study Area on Aerial Photograph
F. Location of Study Area on USGS 7.5-Minute Topographic Map (North Canton Quadrangle)
G. Location of Study Area on National Wetlands Inventory Map (North Canton Quadrangle)
H. Location of Study Area on Stark County Soil Survery Map
I. Definition of Wetlands Vegetation Indicator Status (from Reed, 1988)
J. Photographs of Site
K. Vegetation, Hydrology, and Soils Data Sheets
L. Ohio Rapid Assessment Method (ORAM) Forms
M. References
N. Resumes
Davey Resource Group ii August, 2012
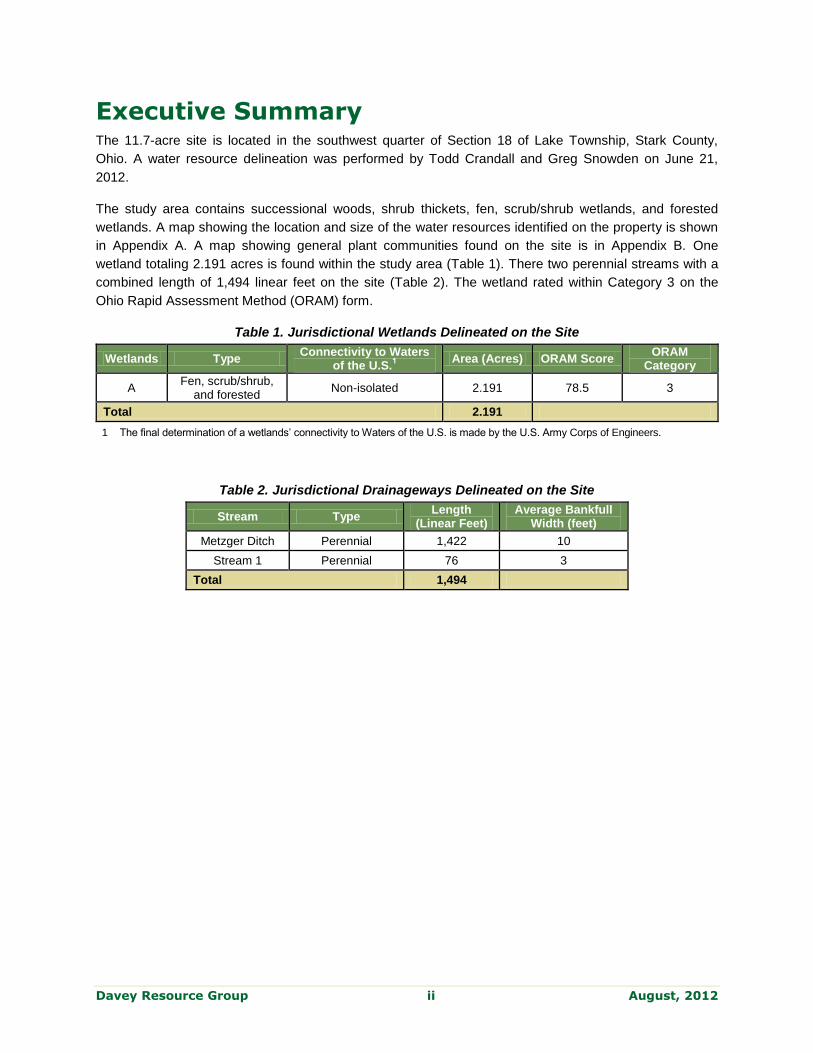
Executive Summary The 11.7-acre site is located in the southwest quarter of Section 18 of Lake Township, Stark County,
Ohio. A water resource delineation was performed by Todd Crandall and Greg Snowden on June 21,
2012.
The study area contains successional woods, shrub thickets, fen, scrub/shrub wetlands, and forested
wetlands. A map showing the location and size of the water resources identified on the property is shown
in Appendix A. A map showing general plant communities found on the site is in Appendix B. One
wetland totaling 2.191 acres is found within the study area (Table 1). There two perennial streams with a
combined length of 1,494 linear feet on the site (Table 2). The wetland rated within Category 3 on the
Ohio Rapid Assessment Method (ORAM) form.
Table 1. Jurisdictional Wetlands Delineated on the Site
Wetlands Type Connectivity to Waters
of the U.S.1
Area (Acres) ORAM Score ORAM
Category
A Fen, scrub/shrub,
and forested Non-isolated 2.191 78.5 3
Total 2.191
1 The final determination of a wetlands’ connectivity to Waters of the U.S. is made by the U.S. Army Corps of Engineers.
Table 2. Jurisdictional Drainageways Delineated on the Site
Stream Type Length
(Linear Feet) Average Bankfull
Width (feet)
Metzger Ditch Perennial 1,422 10
Stream 1 Perennial 76 3
Total 1,494

Davey Resource Group 1 August, 2012
Introduction
Study Area Description and Location The 11.7-acre site is located in the southwest quarter of Section 18, Lake Township, Stark County, Ohio
(Appendix C). The property is bounded on the south by Heckman Street N.W. (Appendix D).
The property contains successional woods, shrub thickets, fen, scrub/shrub wetlands, and forested
wetlands. The wetland is fed by numerous springs and hillside seeps along the east side of the wetland,
which has created the fen portion of the wetland. A small storm water detention basin is located in the
northern portion of the site which collects storm water from a residential subdivision to the east of the site.
Metzger Ditch, a small, perennial stream, flows south along the western property line. This stream has
been channelized. Water from Wetland A drains into Stream 1, which flows into Metzger Ditch. The
Metzger Ditch flows south off the property, eventually entering the headwaters of the Tuscarawas River.
The Tuscarawas River is a part of the 8,051-square-mile Muskingum River drainage basin.
Secondary Source Information The property is shown on the North Canton Quadrangle of the United States Geological Survey (USGS)
maps (Appendix F). Elevations range from approximately 1,130 to 1,150 feet across the site.
The National Wetlands Inventory (NWI) map (North Canton Quadrangle) is in Appendix G. The western
portion of the site is mapped as a palustrine, scrub/shrub, broad-leaved deciduous, emergent, seasonal
wetlands system (code P SS1/EM C).
A map from the United States Department of Agriculture Natural Resources Conservation Service Web
Soil Survey showing the soil types located on and adjacent to the site is found in Appendix H.
Table 3 provides a list of soil types mapped for the site.
Table 3. Soil Types Mapped for the Site
Map Unit Soil Description
BoB Bogart silt loam, 2 to 6 percent slopes
CoE2 Chili gravelly loam, 18 to 25 percent slopes, moderately
eroded
Lz Luray silt loam, gravelly subsoil variant1
WhA Weinbach silt loam, 0 to 2 percent slopes
1Hydric soil

Davey Resource Group 2 August, 2012
Methodology The Corps of Engineers Wetlands Delineation Manual (Environmental Laboratory, 1987) and Interim
Regional Supplement to the Corps of Engineers Wetland Delineation Manual: North central and
Northeast Region (U.S. Army Corps of Engineers, 2009) was used in delineating wetlands within the
study area. The water resources were delineated and surveyed on June 21, 2012. The water resources
delineation fieldwork, boundary mapping, and data analysis were performed by Todd Crandall. Ken
Christensen prepared the vegetation, soils, and wetlands maps using AutoCAD® Map 2012 software.
Shawn Bruzda prepared the maps included in Appendices C—H using ArcGIS® v.9.3. Judith Mitchell and
Greg Snowden provided technical oversight and quality control.
Streams are identified as linear, flowing water features with a defined bed and bank. Streams are
classified as ephemeral, intermittent, or perennial based upon flow regime. Ephemeral streams have
flowing water only during, and for a short duration after, precipitation events. Intermittent streams have
flowing water during certain times of the year, when groundwater and rainfall provide water for stream
flow. During dry periods, intermittent streams may not have flowing water. Perennial streams have flowing
water year-round, receiving water from groundwater and rainfall runoff.
Wetlands are identified based on three criteria: vegetation, soils, and hydrology. An area must meet all
three criteria to be considered a jurisdictional wetland. Four sampling points were established in the field
to determine wetlands boundaries. Data sheets reporting the results of soils, vegetation, and hydrology
analyses were completed for each sample station and are located in Appendix K.
Soil samples were obtained to determine the extent of hydric soils on the site. A standard Munsell soil
color chart was used to determine the hue, value, and chroma of each soil sample. Soil samples were
taken to a depth to adequately make a hydric soil determination. Criteria established by the National
Technical Committee for Hydric Soils (1991) were used to determine hydric soils.
Wetland hydrology was characterized during this water resources delineation. Inundation and/or soil
saturation were noted for each sample point. Secondary hydrological indicators, including watermarks,
drift lines, sediment deposits, wetlands drainage patterns, blackened leaves, and morphological
indicators, were also noted. Other hydrological indicators observed included iron/manganese concretions
and oxidized root zones within the upper soil layers.
Quantitative vegetation data were collected at each sampling point. Dominance was estimated by percent
areal cover. Four strata were considered for each sample point—trees, saplings/shrubs, herbs, and
woody vines. Trees were defined as any woody plant having a diameter at breast height (DBH) greater
than 3.0 inches. Saplings and shrubs were those woody plants with a DBH of less than 3.0 inches and
greater than 3.2 feet in height. For each stratum, plant species within a plot were identified and percent
areal cover was estimated for each species. Thirty-foot-radius plots were used for trees and vines; 15-
foot-radius plots were used for saplings and shrubs; and 5-foot-radius plots were used for herbs.
Any species within a stratum comprising 20 percent or more of the total plot areal cover was considered
to be dominant. Dominant species within all strata were then added to determine the percentage of
wetlands vegetation for each sample point. The wetlands vegetation criterion was met if greater than 50
percent of the dominant vegetation was indicative of wetlands conditions.

Davey Resource Group 3 August, 2012
Species identifications were based on Braun (1989) and Newcomb (1977). Reed (1988) was used to
assign indicator statuses to each identified species. Plants with an indicator status of obligate (OBL),
facultative wetland (FACW), or facultative (FAC) were considered to be indicative of wetlands conditions.
Plants with an indicator status of facultative upland (FACU), or upland (UPL) were considered to be
indicative of upland conditions. Plants that could only be identified to genus were sometimes assigned an
indicator status based on the professional judgment of Davey Resource Group. These plants were
classified as wetlands indicator species (WIS) or upland indicator species (UIS). See Appendix I for a
more detailed explanation of wetlands vegetation indicator statuses.
Survey flags were placed at necessary points around each wetland to accurately depict the wetland
upland boundary. The location of each flag was surveyed using a GeoXH™
Trimble® GeoExplorer
® 6000
series Dual-frequency Global Navigation Satellite System or GNSS (GPS, GLONASS, SBAS [WAAS])
receiver and antenna with Everest™
multipath rejection technology and Floodlight technology with 220
channels, running professional TerraSync™
software capable of decimeter (10–75cm) accuracy after
differential correction.
Trimble® GPS Pathfinder
® Office software was used for post-processing the GNSS field collected data
incorporating Trimble® DeltaPhase
™ differential correction technology using GPS data collected from an
appropriate base station. The corrected GPS latitude-longitude positions were exported into a compatible
coordinate system as an AutoCAD® drawing interchange file (DXF). The vegetation, soils, and wetlands
maps included in this report were prepared using AutoCAD Map® 2012 software.
Wetlands that are hydrologically connected to other traditional navigable waters of the United States are
considered non-isolated and fall under the federal jurisdiction of the U.S. Army Corps of Engineers
(USACE). All hydrologically isolated wetlands that lack connectivity to other surface waters are regulated
by Ohio Environmental Protection Agency (EPA).
Ohio Rapid Assessment Method (ORAM) forms (version 5.0) were completed for each wetland
(Appendix L). The 10-page ORAM long form is included for each wetland. The ORAM evaluates the
ecological quality of wetlands using a scoring form containing multiple questions. Wetlands are classified
into categories as shown in Table 4. As part of the ORAM process, a review of the Ohio Biodiversity
database was initiated to determine if any rare, threatened, or endangered species are located within or
near the project area. Results of the database search are presented along with the ORAM forms in
Appendix L. There is a record for the fen as well as two plants, one threatened and one potentially
threatened, within the fen.
Table 4. ORAM Scoring Breakpoints for Wetland Regulatory Categories
ORAM Score Wetland Category
0-29.9 1
30-34.9 1 or 2 gray zone
35-44.9 Modified 2
45-59.9 2
60-64.9 2 or 3
65-100 3

Davey Resource Group 4 August, 2012
Results
Vegetation A map showing the locations of vegetative communities present on the property is in Appendix B. The site
contains successional woods, shrub thicket, fen, scrub/shrub wetlands, and forested wetlands.
Photographs showing water resources identified on the site are included in Appendix J.
Successional Woods. Most of the site is a successional woods. Common species include Acer rubrum
(red maple, FAC), Alliaria petiolata (garlic mustard, FACU), Fraxinus pennsylvanica (green ash, FACW),
Ligustrum vulgare (privet, FACU), Lonicera tatarica (Tartarian honeysuckle, FACU), Prunus serotina
(black cherry, FACU), Quercus rubra (red oak, FACU), and Rosa multiflora (multiflora rose, FACU).
Shrub Thickets. Areas of dense shrub thicket are associated with the storm water detention basin.
These areas contain Rosa multiflora (multiflora rose, FACU), Eleagnus umbellata (Autumn olive, FACU),
and Rubus allegheniensis (Allegheny blackberry, FACU).
Fen. Much of the wetland is a fen that is fed by hillside seeps and springs. The fen contains areas of
emergent vegetation along with a few barren areas with calcareous mineral deposits. Common species
found in the fen include Carex spp. (sedges), Myosotis laxa (fen forget-me-not), Parnassia glauca (grass-
of-parnassus, OBL), Solidago patula (rough goldenrod, OBL), and Typha latifolia (broad-leaved cattail,
OBL).
Scrub/shrub Wetlands. A small portion of the wetland is a scrub/shrub wetland. This area is dominated
by Cornus amomum (silky dogwood, FACW).
Lowland Woods. The northern portion of the wetland is a lowland woods. This area contains Fraxinus
pennsylvanica (green ash, FACW), Glyceria striata (fowl manna grass, OBL).Quercus palustris (pin oak,
FACW), and Symplocarpus foetidus (skunk cabbage, OBL).
Soils The soils generally match what is mapped on the soil survey. Very small areas of hydric soils correspond
to the small areas of wetlands on the site. The soils within the wetlands meet the depleted matrix (F3)
hydric soil indicator.
Hydrology The wetland is fed by numerous springs and hillside seeps. This mineral-rich ground water has created
the fen. Drainage from the wetland is to the perennial stream along the western property line. The
wetland is adjacent to the stream and is non-isolated. Non-isolated wetlands would fall under the
jurisdiction of USACE, while isolated wetlands are regulated by the Ohio EPA.

Davey Resource Group 5 August, 2012
Conclusions A map showing the location and size of the water resources identified on the property, along with the
locations of sample points, is shown in Appendix B. The wetland has an area of 2.191 acres. Metzger
Ditch is a perennial stream with a length of 1,422 linear feet. Stream 1 is a small perennial stream with a
length of 76 feet. The wetland rated within Category 3 using the ORAM form (Appendix L).
Davey Resource Group is confident that all jurisdictional wetlands and drainageways were identified on
this site. No unusual or problem areas were found. All water resource studies conducted by Davey
Resource Group are objective and based strictly on professional judgment. Davey Resource Group and
its employees have no vested interest in this property or the proposed project. Appendix M contains
references used in the creation of this report, and Appendix N provides profiles of all Davey Resource
Group personnel who contributed to this report.
All wetlands delineations must be verified by the U.S. Army Corps of Engineers to be considered official.
This wetlands delineation is reflective of environmental conditions at the time the fieldwork was
performed. Wetlands are dynamic natural systems; therefore, boundaries may change slightly over time.
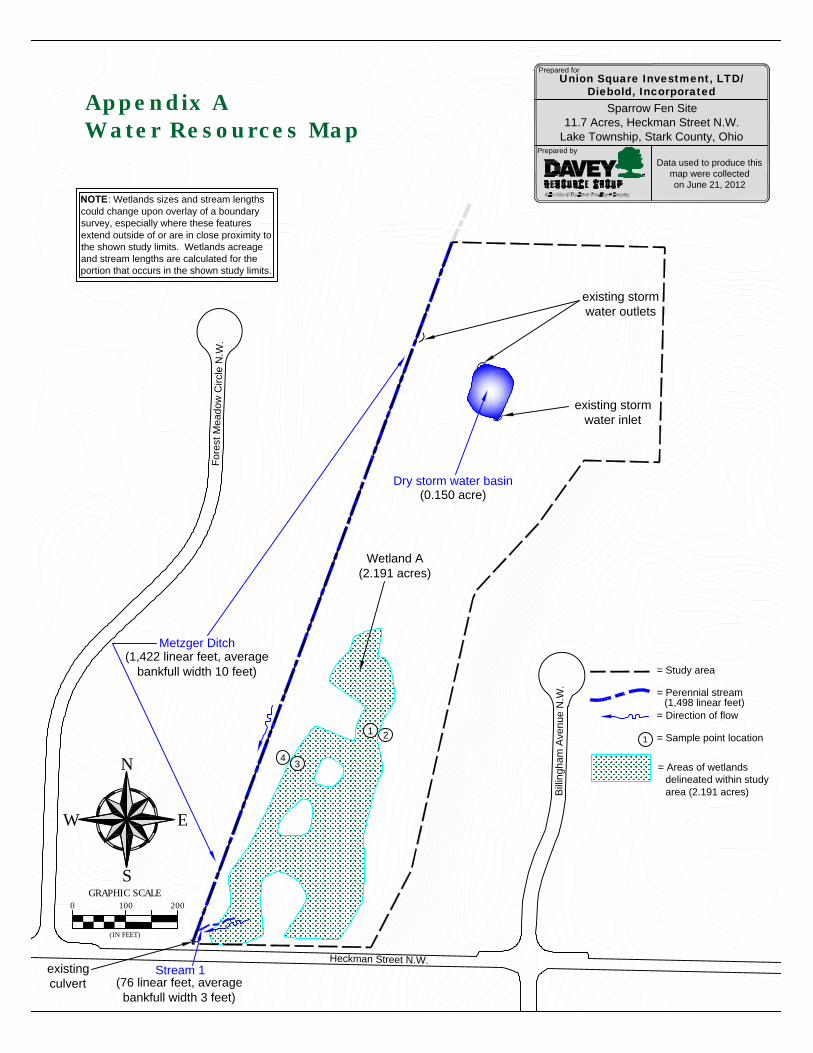
Wetland A
(2.191 acres)
Dry storm water basin
(0.150 acre)
S
EW
NN
S
EW
2
Sparrow Fen Site
11.7 Acres, Heckman Street N.W.
Lake Township, Stark County, Ohio
Data used to produce this
map were collected
on June 21, 2012
Union Square Investment, LTD/Diebold, Incorporated
Prepared for
Prepared by
Stream 1
(76 linear feet, average
bankfull width 3 feet)
Metzger Ditch
(1,422 linear feet, average
bankfull width 10 feet)
200
GRAPHIC SCALE
0 100
(IN FEET)
200
GRAPHIC SCALE
0 100
(IN FEET)
= Study area
Heckman Street N.W.
Forest M
eadow
C
ircle N
.W
.
Billin
gh
am
A
ve
nu
e N
.W
.
= Perennial stream
= Direction of flow
= Areas of wetlands
delineated within study
area (2.191 acres)
(1,498 linear feet)
existing
culvert
existing storm
water outlets
existing storm
water inlet
NOTE: Wetlands sizes and stream lengths
could change upon overlay of a boundary
survey, especially where these features
extend outside of or are in close proximity to
the shown study limits. Wetlands acreage
and stream lengths are calculated for the
portion that occurs in the shown study limits.
= Sample point location
1
1
4
3
Appendix A
Water Resources Map

Dry storm water basin
S
EW
NN
S
EW
Wetland A
Sparrow Fen Site
11.7 Acres, Heckman Street N.W.
Lake Township, Stark County, Ohio
Data used to produce this
map were collected
on June 21, 2012
Union Square Investment, LTD/Diebold, Incorporated
Prepared for
Prepared by
Appendix B
Plant Communities Map
Stream 1
Metzger Ditch
200
GRAPHIC SCALE
0 100
(IN FEET)
200
GRAPHIC SCALE
0 100
(IN FEET)
= Study area
Heckman Street N.W.
Forest M
eadow
C
ircle N
.W
.
Billin
gh
am
A
ve
nu
e N
.W
.
= Perennial stream
= Direction of flow
1
= Photograph location and
direction of view
= Scrub / shrub wetlands
= Forested wetlands
Wetland Plant Communities
= Fen wetlands
existing
culvert
= Areas of wetlands
delineated within
study area
existing storm
water outlets
existing storm
water inlet
2
3
4
5
6
7
1
Successional
Woods
Successional
Woods
Successional
Woods
Shrub
Thicket
Shrub
Thicket

Davey Resource Group August, 2012
Appendix CLocation of Stark County
Lake Erie
Ross
Stark
Wood
Knox
LickingDarke
Scioto
Pike
Adams
Wayne
Huron
Gallia
Lorain
Butler
Brown
Ashtabula
Allen
Trumbull
Logan
Seneca
Athens
Perry
Clark Franklin
Henry
Union
HardinMercer
Meigs
Noble
Belmont
Fairfield
Miami
Preble
Vinton
Fulton
Highland
Portage
HancockPutnam
Muskingum
Clinton
Carroll
Monroe
Shelby
Richland
Medina
Marion Holmes
Warren
Madison
Washington
Coshocton
Guernsey
Summit
Erie
Morrow
MorganPickaway
Lucas
FayetteGreene
Hocking
ClermontJackson
Ashland
Delaware
Williams
Tuscarawas
Harrison
Lawrence
Geauga
Paulding
Cuyahoga
Hamilton
Defiance
Auglaize
ColumbianaWyandotVan Wert
Lake
Jefferson
Crawford
Sandusky
Mahoning
Montgomery
Champaign
Ottawa
25 0 25 5012.5Miles
!.
!. = Study Area Location
on Ohio County Map
11.7 Acres, Heckman Street NWSource: Esri
Redlands, California
Site Location: Sparrow Fen SiteLake Township, Stark County, Ohio

Davey Resource Group August, 2012
Appendix DLocation of Study Area on Highway Map
GreenGreen
UniontownUniontown
GreentownGreentown
UV91
Cleveland
Cleveland Ave
Moga
dore
Ave
Wrigh
t Rd
Cain St
Wise Rd
Kreig
hbau
m Av
e
Lake Center St
Mayfair Rd
Raber RdNewbury Ave
Brouse St
Heckman Rd
Graybill Rd
Midway St
Heckman St
Bass
wood
Ave
Peac
h Glen
Ave
Dotwood St
Myers
ville
Rd
Billin
gham
Ave
Apache StBo
ston A
ve
Spade Rd
Rams
ey D
r
Twin Hills St
To wnsend St
Shosh
one A
ve
Eaver St
Dogwood St
Bucklers S t
Byron Dr
Hampton St
Islan
dview
Ave
Crosby St
Shawnee St
Scotn
ey Av
eMulberry St
Raymond St
Wagn
er Av
e
Banc
roft A
ve
Bear Hol low Rd
Case
rn Av
e
Cro ws Nest Cir
Cottin
gham
Cir
Heartwood St
Tully Ave
Apollo St
Leaflan d St
Rockingham St
Abbey St
Polly StAmb er C
ir
Chickasaw Trail St
Spruce Haven St
Hilltop St
Beec
hdale
Ave
Dottie
Dr
Fenw
ay Ct
Gr Creek 3Gr Creek 3
Gr Cree
k 5
Gr Cree
k 5
0.25 0 0.25 0.50.125Miles
Legend= Study Area
Source: EsriRedlands, California
11.7 Acres, Heckman Street NWSite Location: Sparrow Fen Site
Lake Township, Stark County, Ohio

Davey Resource Group August, 2012
150 0 150 30075Feet
Appendix ELocation of Study Area on Aerial Photograph
Legend= Study Area
11.7 Acres, Heckman Street NWSite Location: Sparrow Fen Site
Lake Township, Stark County, OhioSource: Stark County GIS Department
Canton, OhioAerial photograph dated 2009

Davey Resource Group August, 2012
Appendix FLocation of Study Area on
500 0 500 1,000250Feet
USGS 7.5-Minute Topographic Map(North Canton Quadrangle)
Legend= Study Area
11.7 Acres, Heckman Street NWSite Location: Sparrow Fen Site
Lake Township, Stark County, OhioSource: U.S. Department of the Interior
Reston, VirginiaPhotorevised 1984U.S. Geological Survey

Davey Resource Group August, 2012
Appendix GLocation of Study Area on
PSS1/EMC
PSS1/EMC
PSS1/EMC
PFO/SS1C
PFO1/EMC
PUBG
500 0 500 1,000250Feet
National Wetlands Inventory Map(North Canton Quadrangle)
Legend= Study Area
11.7 Acres, Heckman Street NWSite Location: Sparrow Fen Site
Lake Township, Stark County, OhioSource: U.S. Department of the Interior
U.S. Fish and Wildlife ServiceApril, 2012

Davey Resource Group August, 2012
CpB
BoB
Lz
CpB
CpB
CoE2
CpC2
WrB
WhA
PgUa
Kk
Kk
Ch
CyB
150 0 150 30075Feet
Location of Study Area onStark County Soil Survey MapAppendix H
Legend= Study Area
11.7 Acres, Heckman Street NWSite Location: Sparrow Fen Site
Lake Township, Stark County, Ohio
Aerial photograph dated 2009
Source: U.S. Department of AgricultureNatural Resources Conservation ServiceWeb Soil SurveyStark County GIS Department

Davey Resource Group August, 2012
Appendix I Definition of Wetlands Vegetation Indicator
Status (from Reed, 1988)
Obligate Wetlands (OBL). Occur almost always (estimated probability is greater than 99%) under natural
conditions in wetlands.
Facultative Wetlands (FACW). Usually occur in wetlands (estimated probability 67–99%) but
occasionally found in non-wetlands.
Facultative (FAC). Equally likely to occur in wetlands or non-wetlands (estimated probability 34–66%).
Facultative Upland (FACU). Usually occur in non-wetlands (estimated probability
67–99%) but occasionally found in wetlands (estimated probability 1–33%).
Obligate Upland (UPL). Occur in wetlands in another region, but occur almost always (estimated
probability > 99%) under natural conditions in non-wetlands in the region specified. If a species does not
occur in wetlands in any region, it is not on the National List.
Species for which little or no information was available to base an indicator status were assigned a no
indicator (NI) status. An asterisk (*) after the indicator status indicates that the indicator status was based
on limited ecological information.
The wetlands indicator categories should not be equated to degrees of wetness. Many obligate wetlands
species occur in permanently or semi-permanently flooded wetlands, but a number of obligates also
occur, and some are restricted to wetlands that are only temporarily or seasonally flooded. The facultative
upland species include a diverse collection of plants that range from weedy species adapted to exist in a
number of environmentally stressful or disturbed sites (including wetlands), to species in which a portion
of the gene pool (an ecotype) always occurs in wetlands. Both the weedy and ecotype representatives of
the facultative upland category occur in seasonally and semi-permanently flooded wetlands.
Davey Resource Group has added two additional indicators for situations when plants can only be
identified to genus. A Wetlands Indicator Species (WIS) is a plant that is most likely obligate wetlands,
facultative wetlands, or facultative. An Upland Indicator Species (UIS) is a plant that is most likely
indicative of upland or facultative upland conditions. These additional indicators are used when species
identification is not possible. A variety of factors are part of the UIS and WIS assignments. Indicator
statuses of all locally occurring members of the genus in question are considered, as are the health and
size of the population and the indicator status of nearby plants.

Davey Resource Group August, 2012
Appendix J Photographs of Site
Photograph 1 (6-21-12) Much of the wetland is a fen with diverse herbaceous vegetation.
Photograph 2 (6-21-12) This is another view of the fen showing hillside seeps and calcareous mineral deposits.

Davey Resource Group August, 2012
Photograph 3 (6-21-12) A portion of the wetland is a lowland woods with Symplocarpus foetidus (skunk cabbage).
Photograph 4 (6-21-12) A portion of the wetland has scrub/shrub vegetation.

Davey Resource Group August, 2012
Photograph 5 (6-21-12) A small, channelized, perennial stream is located along the western property line.
Photograph 6 (6-21-12) Much of the site contains successional woods.

Davey Resource Group August, 2012
Photograph 7 (6-21-12). A detention basin surrounded by shrub thicket is found in the northern portion of the site.

Davey Resource Group August, 2012
Appendix K Vegetation, Hydrology, and Soils Data Sheets

01
21-Jun-12
0.0
YesYesYesYes NoNoNoNo
YesYesYesYes NoNoNoNo
YesYesYesYes NoNoNoNo
YesYesYesYes NoNoNoNo
YesYesYesYes NoNoNoNo
YesYesYesYes NoNoNoNo
Lat.:
Hydric Soil Present?
Sampling Point:
Summary of Findings - Attach site map showing sampling point locations, transects, important features, etc
State:
°Landform (hillslope, terrace, etc.):
T.
(If no, explain in Remarks.)
Are Vegetation
Are "Normal Circumstances" present?
Datum:
naturally problematic?
Are climatic/hydrologic conditions on the site typical for this time of year?
Hydrophytic Vegetation Present?
Remarks: (Explain alternative procedures here or in a separate report.)
R.
Are Vegetation
Long.:
significantly disturbed?
Local relief (concave, convex, none): Slope:
Investigator(s):
(If needed, explain any answers in Remarks.)
City/County:
, Soil
% /
Soil Map Unit Name:
, or Hydrology
, Soil , or Hydrology
NWI classification:
Subregion (LRR or MLRA):
Project/Site:
Wetland Hydrology Present?
Section, Township, Range: S.
Is the Sampled Areawithin a Wetland?
Applicant/Owner:
Sampling Date:
WETLAND DETERMINATION DATA FORM - Northcentral and Northeast Region
Successional woods
Sparrow Fen Site
Union Square Investment, LTD/Diebold Inccorporated
Todd Crandall, Greg Snowden
Footslope
LRR R
Bogart silt loam
Lake Township, Stark County
Ohio
convex
0.0
YesYesYesYes NoNoNoNo
YesYesYesYes NoNoNoNo
YesYesYesYes NoNoNoNoYesYesYesYes NoNoNoNo
Hydrology
Surface Water (A1)
High Water Table (A2)
Saturation (A3)
Water Marks (B1)
Sediment Deposits (B2)
Drift deposits (B3)
Algal Mat or Crust (B4)
Dry Season Water Table (C2)
Hydrogen Sulfide Odor (C1)
Oxidized Rhizospheres along Living Roots (C3)
Presence of Reduced Iron (C4)
Recent Iron Reduction in Tilled Soils (C6)
Other (Explain in Remarks)
Drainage Patterns (B10)Water-Stained Leaves (B9)
Saturation Visible on Aerial Imagery (C9)
Crayfish Burrows (C8)
Moss Trim Lines (B16)
Primary Indicators (minimum of one required; check all that apply)
Wetland Hydrology Indicators:
Field Observations:
Surface Water Present?
Water Table Present?
Saturation Present?(includes capillary fringe)
Depth (inches):
Depth (inches):
Depth (inches):Wetland Hydrology Present?
Describe Recorded Data (stream gauge, monitoring well, aerial photos, previous inspections), if available:
Remarks:
Secondary Indicators (minimum of 2 required)
Iron Deposits (B5)
Surface Soil Cracks (B6)
Stunted or Stressed Plants (D1)
Inundation Visible on Aerial Imagery (B7)
Sparsely Vegetated Concave Surface (B8)
Thin Muck Surface (C7) Shallow Aquitard (D3)
FAC-neutral Test (D5)
Northcentral and Northeast Region - Version 2.0US Army Corps of Engineers
Geomorphic Position (D2)
Microtopographic Relief (D4)
Marl Deposits (B15)
Aquatic Fauna (B13)
No hydrological indicators

30
20
30
0
0
10
20
0
0
0
0
0
0
0
0
0
0
0
0
YesYesYesYes NoNoNoNo
137.5% FAC
25.0% FACU
737.5% FACU
0.0%
14.3%
80
0.0%
33.3% FACU
66.7% FACU
0 0
0.0%
0 0
0.0%
30 90
140 560
0 0
0.0%
170 650
0.0%
3.824
0.0%
0.0%
0.0%
0.0%
0.0%
0.0%
0.0%
0.0%
30
0
Northcentral and Northeast Region - Version 2.0
Woody Vine Stratum
(B)(B)(B)(B)
= Total Cover
IndicatorStatus
= Total Cover
Prevalence Index is ≤3.0
HydrophyticVegetationPresent?
US Army Corps of Engineers
VEGETATION - Use scientific names of plants
Dominance Test worksheet:
Total Number of DominantSpecies Across All Strata:
Prevalence Index worksheet:
Prevalence Index = B/A =
(A/B)
1 Indicators of hydric soil and wetland hydrology mustbe present, unless disturbed or problematic.
Problematic Hydrophytic Vegetation 1 (Explain)
Herb Stratum
= Total Cover
Number of Dominant SpeciesThat are OBL, FACW, or FAC:
Hydrophytic Vegetation Indicators:
Remarks: (Include photo numbers here or on a separate sheet.)
OBL speciesOBL speciesOBL speciesOBL species
FACW speciesFACW speciesFACW speciesFACW species
FAC speciesFAC speciesFAC speciesFAC species
FACU speciesFACU speciesFACU speciesFACU species
UPL speciesUPL speciesUPL speciesUPL species
Column Totals:Column Totals:Column Totals:Column Totals:
x 1 = x 1 = x 1 = x 1 =
x 2 =x 2 =x 2 =x 2 =
x 3 =x 3 =x 3 =x 3 =
x 4 = x 4 = x 4 = x 4 =
x 5 = x 5 = x 5 = x 5 =
(A)(A)(A)(A)
(A)
Percent of dominant Species
That Are OBL, FACW, or FAC:
Total % Cover of: Multiply by:
(B)
1.2.3.4.5.6.7.8.9.
10.11.12.
Tree Stratum
*Indicator suffix = National status or professional decision assigned because Regional status not defined by FWS.
Absolute% Cover
Dominance Test is > 50%
DominantSpecies?Rel.Strat.Cover
1
1
1
1.2.3.4.
40
20
0
0
0
66.7% FACU
33.3% FACU
0.0%
0.0%
60
0.0%
= Total Cover
Sapling/Shrub Stratum
1.
0
0
0.0%
0.0%
0
0
0.0%
0.0%
0
0
0.0%
0.0%
Definitions of Vegetation Strata:
Tree - Woody plants, 3 in. (7.6 cm) or more in diameter at breast height (DBH), regardless of height.
Sapling/shrub - Woody plants less than 3 in. DBH and greater than 3.28 ft (1m) tall..
Herb - All herbaceous (non-woody) plants, regardless of size, and woody plants less than 3.28 ft tall.
Woody vine - All woody vines greater than 3.28 ft in height.
01Sampling Point:
)
)
)
)
Morphological Adaptations 1 (Provide supporting data in Remarks or on a separate sheet)
Rapid Test for Hydrophytic Vegetation
(Plot size: 30 feet
Acer rubrumAcer rubrumAcer rubrumAcer rubrum
Quercus rubraQuercus rubraQuercus rubraQuercus rubra
Prunus serotinaPrunus serotinaPrunus serotinaPrunus serotina
(Plot size: 15 feet
(Plot size: 5 feet
(Plot size:
Lonicera tataricaLonicera tataricaLonicera tataricaLonicera tatarica
Ligustrum vulgareLigustrum vulgareLigustrum vulgareLigustrum vulgare
Potentilla simplexPotentilla simplexPotentilla simplexPotentilla simplex
Alliaria petiolataAlliaria petiolataAlliaria petiolataAlliaria petiolata
1
2.3.4.5.6.7.
1.2.3.4.5.6.7.

01Soil Sampling Point:
Profile Description: (Describe to the depth needed to document the indicator or confirm the absence of indicators.)
Matrix Redox Features
Type
YesYesYesYes NoNoNoNo
Hydric Soil Indicators: Indicators for Problematic Hydric Soils :
Restrictive Layer (if observed):
Hydric Soil Present?
Indicators of hydrophytic vegetation and wetland hydrology must be present, unless disturbed or problematic.
Histosol (A1)
Histic Epipedon (A2)
Black Histic (A3)
Hydrogen Sulfide (A4)
Depleted Below Dark Surface (A11)
Thick Dark Surface (A12)
Sandy Muck Mineral (S1)
Sandy Gleyed Matrix (S4)
Sandy Redox (S5)
Stripped Matrix (S6)
Loamy Gleyed Matrix (F2)
Depleted Matrix (F3)
Redox Dark Surface (F6)
Depleted Dark Surface (F7)
Other (Explain in Remarks)
Type:
Depth (inches):
Remarks:
US Army Corps of Engineers Northcentral and Northeast Region - Version 2.0
Dark Surface (S7) (LRR R, MLRA 149B)
Stratified Layers (A5)
Polyvalue Below Surface (S8) (LRR R, MLRA 149B)
Redox Depressions (F8)
1
1
3
3
Thin Dark Surface (S9) (LRR R, MLRA 149B)
Iron-Manganese Masses (F12) (LRR K, L, R)
Mesic Spodic (TA6) (MLRA 144A, 145, 149B)
2 cm Muck (A10) (LRR K, L, MLRA 149B)
Piedmont Floodplain Soils (F19) (MLRA 149B)
Red Parent Material (F21)
Very Shallow Dark Surface (TF12)
Type: C=Concentration. D=Depletion. RM=Reduced Matrix, CS=Covered or Coated Sand Grains ²Location: PL=Pore Lining. M=Matrix
Polyvalue Below Surface (S8) (LRR K, L)
Dark Surface (S7) (LRR K, L, M) Loamy Mucky Mineral (F1) LRR K, L)
Coast Prairie Redox (A16) (LRR K, L, R)
5 cm Mucky Peat or Peat (S3) (LRR K, L, R)
Thin Dark Surface (S9) (LRR K, L)
0-3
3-14 10YR
10YR 4/2
4/3 95% 10YR 5/8 5% C M Silt Loam
Loam
% RemarksTextureLoc²% Color (moist) Color (moist)
Depth(inches)

01
21-Jun-12
0.0
YesYesYesYes NoNoNoNo
YesYesYesYes NoNoNoNo
YesYesYesYes NoNoNoNo
YesYesYesYes NoNoNoNo
YesYesYesYes NoNoNoNo
YesYesYesYes NoNoNoNo
Lat.:
Hydric Soil Present?
Sampling Point:
Summary of Findings - Attach site map showing sampling point locations, transects, important features, etc
State:
°Landform (hillslope, terrace, etc.):
T.
(If no, explain in Remarks.)
Are Vegetation
Are "Normal Circumstances" present?
Datum:
naturally problematic?
Are climatic/hydrologic conditions on the site typical for this time of year?
Hydrophytic Vegetation Present?
Remarks: (Explain alternative procedures here or in a separate report.)
R.
Are Vegetation
Long.:
significantly disturbed?
Local relief (concave, convex, none): Slope:
Investigator(s):
(If needed, explain any answers in Remarks.)
City/County:
, Soil
% /
Soil Map Unit Name:
, or Hydrology
, Soil , or Hydrology
NWI classification:
Subregion (LRR or MLRA):
Project/Site:
Wetland Hydrology Present?
Section, Township, Range: S.
Is the Sampled Areawithin a Wetland?
Applicant/Owner:
Sampling Date:
WETLAND DETERMINATION DATA FORM - Northcentral and Northeast Region
Forested wetland
Sparrow Fen Site
Union Square Investment, LTD/Diebold Inccorporated
Todd Crandall, Greg Snowden
Valley bottom
LRR R
Luray silt loam
Lake Township, Stark County
Ohio
concave 0.0
3
0
YesYesYesYes NoNoNoNo
YesYesYesYes NoNoNoNo
YesYesYesYes NoNoNoNoYesYesYesYes NoNoNoNo
Hydrology
Surface Water (A1)
High Water Table (A2)
Saturation (A3)
Water Marks (B1)
Sediment Deposits (B2)
Drift deposits (B3)
Algal Mat or Crust (B4)
Dry Season Water Table (C2)
Hydrogen Sulfide Odor (C1)
Oxidized Rhizospheres along Living Roots (C3)
Presence of Reduced Iron (C4)
Recent Iron Reduction in Tilled Soils (C6)
Other (Explain in Remarks)
Drainage Patterns (B10)Water-Stained Leaves (B9)
Saturation Visible on Aerial Imagery (C9)
Crayfish Burrows (C8)
Moss Trim Lines (B16)
Primary Indicators (minimum of one required; check all that apply)
Wetland Hydrology Indicators:
Field Observations:
Surface Water Present?
Water Table Present?
Saturation Present?(includes capillary fringe)
Depth (inches):
Depth (inches):
Depth (inches):Wetland Hydrology Present?
Describe Recorded Data (stream gauge, monitoring well, aerial photos, previous inspections), if available:
Remarks:
Secondary Indicators (minimum of 2 required)
Iron Deposits (B5)
Surface Soil Cracks (B6)
Stunted or Stressed Plants (D1)
Inundation Visible on Aerial Imagery (B7)
Sparsely Vegetated Concave Surface (B8)
Thin Muck Surface (C7) Shallow Aquitard (D3)
FAC-neutral Test (D5)
Northcentral and Northeast Region - Version 2.0US Army Corps of Engineers
Geomorphic Position (D2)
Microtopographic Relief (D4)
Marl Deposits (B15)
Aquatic Fauna (B13)

70
0
0
0
0
70
10
0
0
0
0
0
0
0
0
0
0
0
0
YesYesYesYes NoNoNoNo
4100.0% FACW
0.0%
40.0%
0.0%
100.0%
70
0.0%
87.5% OBL
12.5% OBL
80 80
0.0%
100 200
0.0%
0 0
0 0
0 0
0.0%
180 280
0.0%
1.556
0.0%
0.0%
0.0%
0.0%
0.0%
0.0%
0.0%
0.0%
80
0
Northcentral and Northeast Region - Version 2.0
Woody Vine Stratum
(B)(B)(B)(B)
= Total Cover
IndicatorStatus
= Total Cover
Prevalence Index is ≤3.0
HydrophyticVegetationPresent?
US Army Corps of Engineers
VEGETATION - Use scientific names of plants
Dominance Test worksheet:
Total Number of DominantSpecies Across All Strata:
Prevalence Index worksheet:
Prevalence Index = B/A =
(A/B)
1 Indicators of hydric soil and wetland hydrology mustbe present, unless disturbed or problematic.
Problematic Hydrophytic Vegetation 1 (Explain)
Herb Stratum
= Total Cover
Number of Dominant SpeciesThat are OBL, FACW, or FAC:
Hydrophytic Vegetation Indicators:
Remarks: (Include photo numbers here or on a separate sheet.)
OBL speciesOBL speciesOBL speciesOBL species
FACW speciesFACW speciesFACW speciesFACW species
FAC speciesFAC speciesFAC speciesFAC species
FACU speciesFACU speciesFACU speciesFACU species
UPL speciesUPL speciesUPL speciesUPL species
Column Totals:Column Totals:Column Totals:Column Totals:
x 1 = x 1 = x 1 = x 1 =
x 2 =x 2 =x 2 =x 2 =
x 3 =x 3 =x 3 =x 3 =
x 4 = x 4 = x 4 = x 4 =
x 5 = x 5 = x 5 = x 5 =
(A)(A)(A)(A)
(A)
Percent of dominant Species
That Are OBL, FACW, or FAC:
Total % Cover of: Multiply by:
(B)
1.2.3.4.5.6.7.8.9.
10.11.12.
Tree Stratum
*Indicator suffix = National status or professional decision assigned because Regional status not defined by FWS.
Absolute% Cover
Dominance Test is > 50%
DominantSpecies?Rel.Strat.Cover
1
1
1
1.2.3.4.
10
20
0
0
0
33.3% FACW
66.7% FACW-
0.0%
0.0%
30
0.0%
= Total Cover
Sapling/Shrub Stratum
1.
0
0
0.0%
0.0%
0
0
0.0%
0.0%
0
0
0.0%
0.0%
Definitions of Vegetation Strata:
Tree - Woody plants, 3 in. (7.6 cm) or more in diameter at breast height (DBH), regardless of height.
Sapling/shrub - Woody plants less than 3 in. DBH and greater than 3.28 ft (1m) tall..
Herb - All herbaceous (non-woody) plants, regardless of size, and woody plants less than 3.28 ft tall.
Woody vine - All woody vines greater than 3.28 ft in height.
01Sampling Point:
)
)
)
)
Morphological Adaptations 1 (Provide supporting data in Remarks or on a separate sheet)
Rapid Test for Hydrophytic Vegetation
(Plot size: 30 feet
Fraxinus pennsylvanicaFraxinus pennsylvanicaFraxinus pennsylvanicaFraxinus pennsylvanica
(Plot size: 15 feet
(Plot size: 5 feet
(Plot size:
Cornus amomumCornus amomumCornus amomumCornus amomum
Viburnum dentatum var. lucidumViburnum dentatum var. lucidumViburnum dentatum var. lucidumViburnum dentatum var. lucidum
Symplocarpus foetidusSymplocarpus foetidusSymplocarpus foetidusSymplocarpus foetidus
Glyceria striataGlyceria striataGlyceria striataGlyceria striata
1
2.3.4.5.6.7.
1.2.3.4.5.6.7.

01Soil Sampling Point:
Profile Description: (Describe to the depth needed to document the indicator or confirm the absence of indicators.)
Matrix Redox Features
Type
YesYesYesYes NoNoNoNo
Hydric Soil Indicators: Indicators for Problematic Hydric Soils :
Restrictive Layer (if observed):
Hydric Soil Present?
Indicators of hydrophytic vegetation and wetland hydrology must be present, unless disturbed or problematic.
Histosol (A1)
Histic Epipedon (A2)
Black Histic (A3)
Hydrogen Sulfide (A4)
Depleted Below Dark Surface (A11)
Thick Dark Surface (A12)
Sandy Muck Mineral (S1)
Sandy Gleyed Matrix (S4)
Sandy Redox (S5)
Stripped Matrix (S6)
Loamy Gleyed Matrix (F2)
Depleted Matrix (F3)
Redox Dark Surface (F6)
Depleted Dark Surface (F7)
Other (Explain in Remarks)
Type:
Depth (inches):
Remarks:
US Army Corps of Engineers Northcentral and Northeast Region - Version 2.0
Dark Surface (S7) (LRR R, MLRA 149B)
Stratified Layers (A5)
Polyvalue Below Surface (S8) (LRR R, MLRA 149B)
Redox Depressions (F8)
1
1
3
3
Thin Dark Surface (S9) (LRR R, MLRA 149B)
Iron-Manganese Masses (F12) (LRR K, L, R)
Mesic Spodic (TA6) (MLRA 144A, 145, 149B)
2 cm Muck (A10) (LRR K, L, MLRA 149B)
Piedmont Floodplain Soils (F19) (MLRA 149B)
Red Parent Material (F21)
Very Shallow Dark Surface (TF12)
Type: C=Concentration. D=Depletion. RM=Reduced Matrix, CS=Covered or Coated Sand Grains ²Location: PL=Pore Lining. M=Matrix
Polyvalue Below Surface (S8) (LRR K, L)
Dark Surface (S7) (LRR K, L, M) Loamy Mucky Mineral (F1) LRR K, L)
Coast Prairie Redox (A16) (LRR K, L, R)
5 cm Mucky Peat or Peat (S3) (LRR K, L, R)
Thin Dark Surface (S9) (LRR K, L)
0-3
3-14 10YR
10YR 4/2
3/1 Loam
Loam
% RemarksTextureLoc²% Color (moist) Color (moist)
Depth(inches)

03
21-Jun-12
0.0
YesYesYesYes NoNoNoNo
YesYesYesYes NoNoNoNo
YesYesYesYes NoNoNoNo
YesYesYesYes NoNoNoNo
YesYesYesYes NoNoNoNo
YesYesYesYes NoNoNoNo
Lat.:
Hydric Soil Present?
Sampling Point:
Summary of Findings - Attach site map showing sampling point locations, transects, important features, etc
State:
°Landform (hillslope, terrace, etc.):
T.
(If no, explain in Remarks.)
Are Vegetation
Are "Normal Circumstances" present?
Datum:
naturally problematic?
Are climatic/hydrologic conditions on the site typical for this time of year?
Hydrophytic Vegetation Present?
Remarks: (Explain alternative procedures here or in a separate report.)
R.
Are Vegetation
Long.:
significantly disturbed?
Local relief (concave, convex, none): Slope:
Investigator(s):
(If needed, explain any answers in Remarks.)
City/County:
, Soil
% /
Soil Map Unit Name:
, or Hydrology
, Soil , or Hydrology
NWI classification:
Subregion (LRR or MLRA):
Project/Site:
Wetland Hydrology Present?
Section, Township, Range: S.
Is the Sampled Areawithin a Wetland?
Applicant/Owner:
Sampling Date:
WETLAND DETERMINATION DATA FORM - Northcentral and Northeast Region
fen
Sparrow Fen Site
Union Square Investment, LTD/Diebold Inccorporated
Todd Crandall, Greg Snowden
Valley bottom
LRR R
Luray silt loam
Lake Township, Stark County
Ohio
concave
0.0
0
YesYesYesYes NoNoNoNo
YesYesYesYes NoNoNoNo
YesYesYesYes NoNoNoNoYesYesYesYes NoNoNoNo
Hydrology
Surface Water (A1)
High Water Table (A2)
Saturation (A3)
Water Marks (B1)
Sediment Deposits (B2)
Drift deposits (B3)
Algal Mat or Crust (B4)
Dry Season Water Table (C2)
Hydrogen Sulfide Odor (C1)
Oxidized Rhizospheres along Living Roots (C3)
Presence of Reduced Iron (C4)
Recent Iron Reduction in Tilled Soils (C6)
Other (Explain in Remarks)
Drainage Patterns (B10)Water-Stained Leaves (B9)
Saturation Visible on Aerial Imagery (C9)
Crayfish Burrows (C8)
Moss Trim Lines (B16)
Primary Indicators (minimum of one required; check all that apply)
Wetland Hydrology Indicators:
Field Observations:
Surface Water Present?
Water Table Present?
Saturation Present?(includes capillary fringe)
Depth (inches):
Depth (inches):
Depth (inches):Wetland Hydrology Present?
Describe Recorded Data (stream gauge, monitoring well, aerial photos, previous inspections), if available:
Remarks:
Secondary Indicators (minimum of 2 required)
Iron Deposits (B5)
Surface Soil Cracks (B6)
Stunted or Stressed Plants (D1)
Inundation Visible on Aerial Imagery (B7)
Sparsely Vegetated Concave Surface (B8)
Thin Muck Surface (C7) Shallow Aquitard (D3)
FAC-neutral Test (D5)
Northcentral and Northeast Region - Version 2.0US Army Corps of Engineers
Geomorphic Position (D2)
Microtopographic Relief (D4)
Marl Deposits (B15)
Aquatic Fauna (B13)

0
0
0
0
0
40
50
10
0
0
0
0
0
0
0
0
0
0
0
YesYesYesYes NoNoNoNo
20.0%
0.0%
20.0%
0.0%
100.0%
0
0.0%
40.0% OBL
50.0% OBL
100 100
10.0% OBL
0 0
0.0%
0 0
0 0
0 0
0.0%
100 100
0.0%
1.000
0.0%
0.0%
0.0%
0.0%
0.0%
0.0%
0.0%
0.0%
100
0
Northcentral and Northeast Region - Version 2.0
Woody Vine Stratum
(B)(B)(B)(B)
= Total Cover
IndicatorStatus
= Total Cover
Prevalence Index is ≤3.0
HydrophyticVegetationPresent?
US Army Corps of Engineers
VEGETATION - Use scientific names of plants
Dominance Test worksheet:
Total Number of DominantSpecies Across All Strata:
Prevalence Index worksheet:
Prevalence Index = B/A =
(A/B)
1 Indicators of hydric soil and wetland hydrology mustbe present, unless disturbed or problematic.
Problematic Hydrophytic Vegetation 1 (Explain)
Herb Stratum
= Total Cover
Number of Dominant SpeciesThat are OBL, FACW, or FAC:
Hydrophytic Vegetation Indicators:
Remarks: (Include photo numbers here or on a separate sheet.)
OBL speciesOBL speciesOBL speciesOBL species
FACW speciesFACW speciesFACW speciesFACW species
FAC speciesFAC speciesFAC speciesFAC species
FACU speciesFACU speciesFACU speciesFACU species
UPL speciesUPL speciesUPL speciesUPL species
Column Totals:Column Totals:Column Totals:Column Totals:
x 1 = x 1 = x 1 = x 1 =
x 2 =x 2 =x 2 =x 2 =
x 3 =x 3 =x 3 =x 3 =
x 4 = x 4 = x 4 = x 4 =
x 5 = x 5 = x 5 = x 5 =
(A)(A)(A)(A)
(A)
Percent of dominant Species
That Are OBL, FACW, or FAC:
Total % Cover of: Multiply by:
(B)
1.2.3.4.5.6.7.8.9.
10.11.12.
Tree Stratum
*Indicator suffix = National status or professional decision assigned because Regional status not defined by FWS.
Absolute% Cover
Dominance Test is > 50%
DominantSpecies?Rel.Strat.Cover
1
1
1
1.2.3.4.
0
0
0
0
0
0.0%
0.0%
0.0%
0.0%
0
0.0%
= Total Cover
Sapling/Shrub Stratum
1.
0
0
0.0%
0.0%
0
0
0.0%
0.0%
0
0
0.0%
0.0%
Definitions of Vegetation Strata:
Tree - Woody plants, 3 in. (7.6 cm) or more in diameter at breast height (DBH), regardless of height.
Sapling/shrub - Woody plants less than 3 in. DBH and greater than 3.28 ft (1m) tall..
Herb - All herbaceous (non-woody) plants, regardless of size, and woody plants less than 3.28 ft tall.
Woody vine - All woody vines greater than 3.28 ft in height.
03Sampling Point:
)
)
)
)
Morphological Adaptations 1 (Provide supporting data in Remarks or on a separate sheet)
Rapid Test for Hydrophytic Vegetation
(Plot size:
(Plot size:
(Plot size: 5 feet
(Plot size:
Myosotis laxaMyosotis laxaMyosotis laxaMyosotis laxa
Nasturtium officinaleNasturtium officinaleNasturtium officinaleNasturtium officinale
Leersia oryzoidesLeersia oryzoidesLeersia oryzoidesLeersia oryzoides1
2.3.4.5.6.7.
1.2.3.4.5.6.7.

03Soil Sampling Point:
Profile Description: (Describe to the depth needed to document the indicator or confirm the absence of indicators.)
Matrix Redox Features
Type
YesYesYesYes NoNoNoNo
Hydric Soil Indicators: Indicators for Problematic Hydric Soils :
Restrictive Layer (if observed):
Hydric Soil Present?
Indicators of hydrophytic vegetation and wetland hydrology must be present, unless disturbed or problematic.
Histosol (A1)
Histic Epipedon (A2)
Black Histic (A3)
Hydrogen Sulfide (A4)
Depleted Below Dark Surface (A11)
Thick Dark Surface (A12)
Sandy Muck Mineral (S1)
Sandy Gleyed Matrix (S4)
Sandy Redox (S5)
Stripped Matrix (S6)
Loamy Gleyed Matrix (F2)
Depleted Matrix (F3)
Redox Dark Surface (F6)
Depleted Dark Surface (F7)
Other (Explain in Remarks)
Type:
Depth (inches):
Remarks:
US Army Corps of Engineers Northcentral and Northeast Region - Version 2.0
Dark Surface (S7) (LRR R, MLRA 149B)
Stratified Layers (A5)
Polyvalue Below Surface (S8) (LRR R, MLRA 149B)
Redox Depressions (F8)
1
1
3
3
Thin Dark Surface (S9) (LRR R, MLRA 149B)
Iron-Manganese Masses (F12) (LRR K, L, R)
Mesic Spodic (TA6) (MLRA 144A, 145, 149B)
2 cm Muck (A10) (LRR K, L, MLRA 149B)
Piedmont Floodplain Soils (F19) (MLRA 149B)
Red Parent Material (F21)
Very Shallow Dark Surface (TF12)
Type: C=Concentration. D=Depletion. RM=Reduced Matrix, CS=Covered or Coated Sand Grains ²Location: PL=Pore Lining. M=Matrix
Polyvalue Below Surface (S8) (LRR K, L)
Dark Surface (S7) (LRR K, L, M) Loamy Mucky Mineral (F1) LRR K, L)
Coast Prairie Redox (A16) (LRR K, L, R)
5 cm Mucky Peat or Peat (S3) (LRR K, L, R)
Thin Dark Surface (S9) (LRR K, L)
0-14 10YR 3/1 Loam
% RemarksTextureLoc²% Color (moist) Color (moist)
Depth(inches)

04
21-Jun-12
0.0
YesYesYesYes NoNoNoNo
YesYesYesYes NoNoNoNo
YesYesYesYes NoNoNoNo
YesYesYesYes NoNoNoNo
YesYesYesYes NoNoNoNo
YesYesYesYes NoNoNoNo
Lat.:
Hydric Soil Present?
Sampling Point:
Summary of Findings - Attach site map showing sampling point locations, transects, important features, etc
State:
°Landform (hillslope, terrace, etc.):
T.
(If no, explain in Remarks.)
Are Vegetation
Are "Normal Circumstances" present?
Datum:
naturally problematic?
Are climatic/hydrologic conditions on the site typical for this time of year?
Hydrophytic Vegetation Present?
Remarks: (Explain alternative procedures here or in a separate report.)
R.
Are Vegetation
Long.:
significantly disturbed?
Local relief (concave, convex, none): Slope:
Investigator(s):
(If needed, explain any answers in Remarks.)
City/County:
, Soil
% /
Soil Map Unit Name:
, or Hydrology
, Soil , or Hydrology
NWI classification:
Subregion (LRR or MLRA):
Project/Site:
Wetland Hydrology Present?
Section, Township, Range: S.
Is the Sampled Areawithin a Wetland?
Applicant/Owner:
Sampling Date:
WETLAND DETERMINATION DATA FORM - Northcentral and Northeast Region
Successional woods
Sparrow Fen Site
Union Square Investment, LTD/Diebold Inccorporated
Todd Crandall, Greg Snowden
Flat
LRR R
Luray silt loam
Lake Township, Stark County
Ohio
convex
0.0
YesYesYesYes NoNoNoNo
YesYesYesYes NoNoNoNo
YesYesYesYes NoNoNoNoYesYesYesYes NoNoNoNo
Hydrology
Surface Water (A1)
High Water Table (A2)
Saturation (A3)
Water Marks (B1)
Sediment Deposits (B2)
Drift deposits (B3)
Algal Mat or Crust (B4)
Dry Season Water Table (C2)
Hydrogen Sulfide Odor (C1)
Oxidized Rhizospheres along Living Roots (C3)
Presence of Reduced Iron (C4)
Recent Iron Reduction in Tilled Soils (C6)
Other (Explain in Remarks)
Drainage Patterns (B10)Water-Stained Leaves (B9)
Saturation Visible on Aerial Imagery (C9)
Crayfish Burrows (C8)
Moss Trim Lines (B16)
Primary Indicators (minimum of one required; check all that apply)
Wetland Hydrology Indicators:
Field Observations:
Surface Water Present?
Water Table Present?
Saturation Present?(includes capillary fringe)
Depth (inches):
Depth (inches):
Depth (inches):Wetland Hydrology Present?
Describe Recorded Data (stream gauge, monitoring well, aerial photos, previous inspections), if available:
Remarks:
Secondary Indicators (minimum of 2 required)
Iron Deposits (B5)
Surface Soil Cracks (B6)
Stunted or Stressed Plants (D1)
Inundation Visible on Aerial Imagery (B7)
Sparsely Vegetated Concave Surface (B8)
Thin Muck Surface (C7) Shallow Aquitard (D3)
FAC-neutral Test (D5)
Northcentral and Northeast Region - Version 2.0US Army Corps of Engineers
Geomorphic Position (D2)
Microtopographic Relief (D4)
Marl Deposits (B15)
Aquatic Fauna (B13)
No hydrological indicators

50
30
20
0
0
30
20
0
0
0
0
0
0
0
0
0
0
0
0
YesYesYesYes NoNoNoNo
150.0% FACU
30.0% FACU
720.0% FACW
0.0%
14.3%
100
0.0%
60.0% FACU
40.0% UPL
0 0
0.0%
20 40
0.0%
0 0
180 720
20 100
0.0%
220 860
0.0%
3.909
0.0%
0.0%
0.0%
0.0%
0.0%
0.0%
0.0%
0.0%
50
0
Northcentral and Northeast Region - Version 2.0
Woody Vine Stratum
(B)(B)(B)(B)
= Total Cover
IndicatorStatus
= Total Cover
Prevalence Index is ≤3.0
HydrophyticVegetationPresent?
US Army Corps of Engineers
VEGETATION - Use scientific names of plants
Dominance Test worksheet:
Total Number of DominantSpecies Across All Strata:
Prevalence Index worksheet:
Prevalence Index = B/A =
(A/B)
1 Indicators of hydric soil and wetland hydrology mustbe present, unless disturbed or problematic.
Problematic Hydrophytic Vegetation 1 (Explain)
Herb Stratum
= Total Cover
Number of Dominant SpeciesThat are OBL, FACW, or FAC:
Hydrophytic Vegetation Indicators:
Remarks: (Include photo numbers here or on a separate sheet.)
OBL speciesOBL speciesOBL speciesOBL species
FACW speciesFACW speciesFACW speciesFACW species
FAC speciesFAC speciesFAC speciesFAC species
FACU speciesFACU speciesFACU speciesFACU species
UPL speciesUPL speciesUPL speciesUPL species
Column Totals:Column Totals:Column Totals:Column Totals:
x 1 = x 1 = x 1 = x 1 =
x 2 =x 2 =x 2 =x 2 =
x 3 =x 3 =x 3 =x 3 =
x 4 = x 4 = x 4 = x 4 =
x 5 = x 5 = x 5 = x 5 =
(A)(A)(A)(A)
(A)
Percent of dominant Species
That Are OBL, FACW, or FAC:
Total % Cover of: Multiply by:
(B)
1.2.3.4.5.6.7.8.9.
10.11.12.
Tree Stratum
*Indicator suffix = National status or professional decision assigned because Regional status not defined by FWS.
Absolute% Cover
Dominance Test is > 50%
DominantSpecies?Rel.Strat.Cover
1
1
1
1.2.3.4.
50
20
0
0
0
71.4% FACU
28.6% FACU
0.0%
0.0%
70
0.0%
= Total Cover
Sapling/Shrub Stratum
1.
0
0
0.0%
0.0%
0
0
0.0%
0.0%
0
0
0.0%
0.0%
Definitions of Vegetation Strata:
Tree - Woody plants, 3 in. (7.6 cm) or more in diameter at breast height (DBH), regardless of height.
Sapling/shrub - Woody plants less than 3 in. DBH and greater than 3.28 ft (1m) tall..
Herb - All herbaceous (non-woody) plants, regardless of size, and woody plants less than 3.28 ft tall.
Woody vine - All woody vines greater than 3.28 ft in height.
04Sampling Point:
)
)
)
)
Morphological Adaptations 1 (Provide supporting data in Remarks or on a separate sheet)
Rapid Test for Hydrophytic Vegetation
(Plot size: 30 feet
Prunus serotinaPrunus serotinaPrunus serotinaPrunus serotina
Acer saccharumAcer saccharumAcer saccharumAcer saccharum
Fraxinus pennsylvanicaFraxinus pennsylvanicaFraxinus pennsylvanicaFraxinus pennsylvanica
(Plot size: 15 feet
(Plot size: 5 feet
(Plot size:
Lonicera tataricaLonicera tataricaLonicera tataricaLonicera tatarica
Rosa multifloraRosa multifloraRosa multifloraRosa multiflora
Alliaria petiolataAlliaria petiolataAlliaria petiolataAlliaria petiolata
Rubus occidentalisRubus occidentalisRubus occidentalisRubus occidentalis
1
2.3.4.5.6.7.
1.2.3.4.5.6.7.

04Soil Sampling Point:
Profile Description: (Describe to the depth needed to document the indicator or confirm the absence of indicators.)
Matrix Redox Features
Type
YesYesYesYes NoNoNoNo
Hydric Soil Indicators: Indicators for Problematic Hydric Soils :
Restrictive Layer (if observed):
Hydric Soil Present?
Indicators of hydrophytic vegetation and wetland hydrology must be present, unless disturbed or problematic.
Histosol (A1)
Histic Epipedon (A2)
Black Histic (A3)
Hydrogen Sulfide (A4)
Depleted Below Dark Surface (A11)
Thick Dark Surface (A12)
Sandy Muck Mineral (S1)
Sandy Gleyed Matrix (S4)
Sandy Redox (S5)
Stripped Matrix (S6)
Loamy Gleyed Matrix (F2)
Depleted Matrix (F3)
Redox Dark Surface (F6)
Depleted Dark Surface (F7)
Other (Explain in Remarks)
Type:
Depth (inches):
Remarks:
US Army Corps of Engineers Northcentral and Northeast Region - Version 2.0
Dark Surface (S7) (LRR R, MLRA 149B)
Stratified Layers (A5)
Polyvalue Below Surface (S8) (LRR R, MLRA 149B)
Redox Depressions (F8)
1
1
3
3
Thin Dark Surface (S9) (LRR R, MLRA 149B)
Iron-Manganese Masses (F12) (LRR K, L, R)
Mesic Spodic (TA6) (MLRA 144A, 145, 149B)
2 cm Muck (A10) (LRR K, L, MLRA 149B)
Piedmont Floodplain Soils (F19) (MLRA 149B)
Red Parent Material (F21)
Very Shallow Dark Surface (TF12)
Type: C=Concentration. D=Depletion. RM=Reduced Matrix, CS=Covered or Coated Sand Grains ²Location: PL=Pore Lining. M=Matrix
Polyvalue Below Surface (S8) (LRR K, L)
Dark Surface (S7) (LRR K, L, M) Loamy Mucky Mineral (F1) LRR K, L)
Coast Prairie Redox (A16) (LRR K, L, R)
5 cm Mucky Peat or Peat (S3) (LRR K, L, R)
Thin Dark Surface (S9) (LRR K, L)
0-2
2-14 10YR
10YR 4/2
5/3 95% 10YR 5/6 5% C M Silt Loam
Loam
% RemarksTextureLoc²% Color (moist) Color (moist)
Depth(inches)

Davey Resource Group August, 2012
Appendix L Ohio Rapid Assessment Method (ORAM) Form

Davey Resource Group August, 2012
Appendix M References
Braun, E. Lucy. 1989 (2nd edition). The Woody Plants of Ohio: Trees, Shrubs, and Woody Climbers
Native, Naturalized, and Escaped. The Ohio State University Press, Columbus. 362 pp.
Environmental Laboratory. 1987. Corps of Engineers Wetlands Delineation Manual. Technical Report
Y-87-1. United States Army Engineer Waterways Experiment Station, Vicksburg, Mississippi.
National Technical Committee for Hydric Soils. 1991. Hydric Soils of the United States. United States
Department of Agriculture Soil Conservation Service, Washington.
Newcomb, Lawrence. 1977. Newcomb’s Wildflower Guide. Little, Brown, and Company, Boston.
U.S. Army Corps of Engineers. 2012. National Wetland Plant List Final Draft Ratings: Northcentral and
Northeast Region.
Cold Regions Research and Engineering Labatory.
Soil Survey Staff, Natural Resources Conservation Service, United States Department of Agriculture.
Web Soil Survey. Available online at http://websoilsurvey.nrcs.usda.gov/. Accessed July, 2012.
Stark County GIS Department. OHSTAR005019.sid[air photo]. Resolution: 0.5-foot. Projection:
NAD_1983_StatePlane_Ohio_North_FIPS_3401_Feet; linear unit: Foot_US. Canton, Ohio. 2009.
U.S. Army Corps of Engineers. 2012. Regional Supplement to the Corps of Engineers Wetland
Delineation Manual: Northcentral and Northeast Region. TR-09-19, U.S. Army Engineer
Research and Development Center, Vicksburg, Mississippi.
United States Fish and Wildlife Service. 2011. National Wetlands Inventory Map: North Canton
Quadrangle. United States Department of the Interior, Fish and Wildlife Service, Washington,
D.C.
U.S. Geological Survey. North Canton quadrangle, Ohio [map]. Photorevised 1984. 1:24,000. 7.5 Minute
Series. Reston, Virginia: United States Department of the Interior, USGS, 1984.

Davey Resource Group August, 2012
Appendix N Davey Resource Group Personnel Profiles Shawn W. Bruzda is a senior urban forester, biologist, and technical specialist with Davey Resource Group,
having served in this capacity for over 10 years. As a biologist with Davey Resource Group, Mr. Bruzda
focuses on ecological surveys involving fish and macro-invertebrate identification and data analysis. He is
proficient with the Index of Biotic Integrity (IBI), the Modified Index of Well-Being (MIWB), and the Invertebrate
Community Index (ICI), all used by Ohio Environmental Protection Agency to set minimum criteria index
scores for use designations in water quality standards. He works on large- and small-scale bat survey projects,
assisting with mist-net surveys, habitat evaluations, and radio tracking studies to determine foraging patterns;
endangered species and habitat studies; invasive species management; secondary source reviews; technical
report writing; and water quality studies. Mr. Bruzda has completed training through Ohio Environmental
Protection Agency for conducting the following: Headwater Habitat Evaluation Index (HHEI); Qualitative
Habitat Evaluation Index (QHEI); Ohio Rapid Assessment Method (ORAM) v.5; and Vegetation Index of Biotic
Integrity (VIBI). Proficient with AutoCAD® and ArcGIS
™ software, Mr. Bruzda creates maps for a wide variety of
natural resource and tree-related projects. Mr. Bruzda is also responsible for safety and fleet vehicle
management. He is an International Society of Arboriculture (ISA) Certified Arborist (OH-1342A). Mr. Bruzda is
a graduate of Kent State University, having received a Bachelor of Science degree in biological sciences with
an emphasis in aquatic ecology.
Ana Burns, M.S.E.S., is a biologist and Coordinator of Ecological Services for Davey’s Natural Resource
Consulting group. Ms. Burns has 11 years of experience in the natural resources and environmental planning
fields and at Davey is responsible for overseeing all ecological surveys and environmental planning studies, as
well as the specialized management of ecological and wetlands permitting projects, mitigation bank planning
and monitoring projects, and natural resource restoration projects. She is knowledgeable of state and federal
stream and wetlands regulations, all aspects of Section 401 and 404 permitting, isolated wetlands regulations,
and the federal mitigation rule for compensatory mitigation and its application to mitigation banking. Ms. Burns
has managed multiple Section 401 and 404 permitting projects along with numerous natural resource
inventories and planning projects. In addition, Ms. Burns has provided assistance with grant writing and
managing grant-funded projects. Ms. Burns has coordinated and facilitated public meetings and hearings and
has assisted in the development of various planning documents including greenways planning, watershed
planning, and urban forestry management plans. In addition to public meetings, Ms. Burns has developed
many informational public outreach publications and prepared electronic sources of information for distribution.
With a background in urban and rural planning, she is well versed in working with planning commissions,
steering committees, and local political groups and has given many presentations at a variety of venues. Ms.
Burns is a board member of the Tinkers Creek Watershed Partnership and active in the Ohio Lake
Management Society. Ms. Burns graduated from Indiana University with a Bachelor of Science degree in
biology and holds a Master of Science degree in environmental science from IU's School of Public and
Environmental Affairs.
Ken Christensen is a senior biologist with more than 25 years of experience in the natural resource field. Mr.
Christensen is involved in all aspects of wetlands and stream restoration projects, including design, planting,
and implementation. He is also involved with the subsequent monitoring of mitigation and restoration projects
to ensure that such endeavors reach an expected successful conclusion. Mr. Christensen assists in plant
surveys and wetlands delineations and in the field identification of vertebrate populations, especially
amphibians, reptiles, and mammals. Proficient with AutoCAD® software, Mr. Christensen is responsible for
managing the Global Positioning System (GPS) data collection and AutoCAD® mapping operations for all
natural resource studies.

Davey Resource Group August, 2012
As an International Society of Arboriculture Certified Arborist (OH-0690A), he performs tree appraisals and
inventories and also develops tree preservation plans. Mr. Christensen is a LEED® Accredited Professional
and has received the following training: Certificate of Completion for LEED® for New Construction Technical
Review Workshop from U.S. Green Building Council; Certificate of Completion for American Ecological
Engineering Society Wetland Mitigation Design from Virginia Polytechnic Institute and State University;
Certificate of Completion for AutoCAD®
for Stream Restoration and Monitoring from North Carolina
Cooperative Extension; Certificate of Completion from North Carolina Stream Restoration Institute’s Stream
Classification and Assessment Program; and Certificate of Completion from North Carolina Stream
Restoration Institute’s Stream Restoration Design Principles. Mr. Christensen is prequalified by the Ohio
Department of Transportation for wetland mitigation. He has also completed training through Ohio
Environmental Protection Agency for conducting the following: Headwater Habitat Evaluation Index (HHEI);
Qualitative Habitat Evaluation Index (QHEI); Ohio Rapid Assessment Method (ORAM) v.5; and Vegetation
Index of Biotic Integrity (VIBI). Clients for these mitigation, stream restoration, and tree preservation projects
have included the Holden Arboretum, Ohio Wetlands Foundation, Medina County Park District, Metro Parks
Serving Summit County, Portage Park District, and Western Reserve Land Conservancy. He is a member of
the American Ecological Engineering Society, Breakneck Creek Watershed Coalition, the Ecological
Landscaping Association, the Northeast Ohio Association of Herpetologists, American Ecological Engineering
Society, and Association of State Wetlands Managers. Mr. Christensen holds a Bachelor of Science degree in
conservation from Kent State University.
Todd A. Crandall, M.En., is a senior wetlands scientist with 19 years of experience performing wetlands
delineations in Ohio and adjacent states. Mr. Crandall also performs ecological surveys, vegetation cover
mapping, plant identification, and Section 401 and 404 and isolated wetlands permitting. He also contributes to
the planning and design of restoration wetlands and prepares wetland mitigation reports. Mr. Crandall is
responsible for vegetation monitoring at numerous wetlands mitigation sites throughout Ohio. He has
completed large-scale wetlands and natural resource inventories for the Cuyahoga Valley National Park, as
well as Cuyahoga, Medina, Portage, and Summit Counties in Northeast Ohio. He is certified to perform
wetlands studies by the U.S. Army Wetlands Delineator Certification Program, and is a certified Professional
Wetland Scientist through the Society of Wetland Scientists. He has completed the 40-hour OSHA health and
safety training (OSHA Standard 29 CFR 1910.120). Mr. Crandall has successfully completed the Ohio
Department of Transportation’s (ODOT) Ecological Training hosted by the Office of Environmental Services.
He is ODOT prequalified for ecological surveys and wetland mitigation. Mr. Crandall has also completed
training through the Ohio Environmental Protection Agency for the following: Headwater Habitat Evaluation
Index (HHEI); Qualitative Habitat Evaluation Index (QHEI); Ohio Rapid Assessment Method (ORAM) v.5; and
Vegetation Index of Biotic Integrity (VIBI). He holds a Bachelor of Science degree from Hiram College in
biology and a Master’s degree in environmental science from Miami University.
Judith Mitchell is a biologist and project manager with 14 years of experience in wetland delineation and
mitigation, Section 401 and 404 and isolated wetlands permitting, stream and wetland restoration and
monitoring, and water quality testing. She also performs ecological surveys, including bat habitat and
emergence studies, macro-invertebrate and amphibian studies, and vegetation surveys. Ms. Mitchell has
provided planting and construction oversight for wetland and stream restoration projects. She has managed
multiple Section 401 and 404 permitting projects and a wide variety of ecological survey and compensatory
mitigation projects. Ms. Mitchell has completed training through Ohio Environmental Protection Agency for the
following: Headwater Habitat Evaluation Index (HHEI); Qualitative Habitat Evaluation Index (QHEI); Ohio
Rapid Assessment Method (ORAM) v.5; and Vegetation Index of Biotic Integrity (VIBI). Ms. Mitchell graduated
from Kent State University with a Bachelor of Science degree in conservation with an emphasis in water
resources.

Davey Resource Group August, 2012
Greg Snowden, M.S., is a biologist with Davey Resource Group. He assists with Section 401 and 404
permitting, wetland and stream monitoring, Ohio Department of Transportation (ODOT) ecological surveys,
ecological restoration services, and helps prepare ODOT ecological survey reports, and wetland mitigation
reports. He has experience utilizing the Headwater Habitat Evaluation Index (HHEI) and Qualitative Habitat
Evaluation Index (QHEI). Prior to joining Davey, Mr. Snowden participated in numerous academic research
projects involving plant physiology and ecology. These included the study of the sedge Schoenoplectus
americanus (chairmaker’s bulrush) and its effects on soil accumulation in tidal salt marshes, and the study and
management of the invasive plant species Ailanthus altissima (tree-of-heaven) and Lonicera maackii (Amur
honeysuckle). During the summer of 2005, Greg was a research intern at the Royal Botanic Gardens Kew in
London, England where he worked to create a virtual online herbarium of type specimens from the plant family
Violaceae, and performed morphological research for a taxonomic study of the plant families Salicaceae and
Flacourtiaceae. Mr. Snowden graduated from Ohio University’s Honors Tutorial College with a Bachelor of
Science degree in environmental and plant biology and received a Master of Science degree in biological
sciences (ecology, evolution, and the environment) from the University of Notre Dame.