water quality trends along new castle county streams (1999 ... · of 14 streams. media bacteria...
TRANSCRIPT

1
Stream Water Quality Trends in New Castle County, Delaware (1999-2014) Gerald J. Kauffman
University of Delaware
Abstract: The University of Delaware defined water quality trends from 1999 to 2014 along 14 streams in New Castle County, Delaware. Water quality improved or was constant at 94% of stations since 1999. Dissolved oxygen, enterococcus bacteria, total nitrogen, total phosphorus, and total suspended sediment improved or were constant at 100%, 93%, 93%, 100%, and 86% of the water quality monitoring stations, respectively, since 1999. During 2005–2010, median levels were good or fair at 100% of the stations for dissolved oxygen, 50% for bacteria, 71% for nitrogen, 86% for phosphorus, and 79% for sediment. Since 1999, improving New Castle County water quality stations (43) outnumbered degrading stations (4) by a 10:1 margin. Over the last decade and a half, watershed strategies such as the New Castle County National Pollution Discharge Elimination System (NPDES) Municipal Separate Stormwater System (MS4) Permit Program required by the Federal Clean Water Act have improved or preserved water quality along these streams, however, greater emphasis is needed to curb recent increases in nitrogen levels. Keywords Water Quality, Water Pollution, Watershed, Clean Water Act Gerald J. Kauffman University of Delaware Water Resources Agency DGS Annex Building, Academy St. Newark, DE 19716 [email protected]
1. Introduction The Federal Clean Water Act administered by the Environmental Protection Agency (EPA) and Delaware Department of Natural Resources and Environmental Control (DNREC) require New Castle County, Delaware to administer a National Pollution Discharge Elimination System (NPDES) Municipal Separate Stormwater System (MS4) Permit Program. The NPDES MS4 program requires the county to examine water quality trends as part of watershed-based water quality improvement programs (WQIPs). 2. Objective The objective of this analysis is to evaluate water quality trends along 14 streams in New Castle County, Delaware and determine whether watershed management programs have improved or preserved water quality. We examined stream monitoring data to determine whether water quality trends have improved, remained constant, or degraded during a 15 year period between 1999 and 2014. 3. Study Area
New Castle County, Delaware lies midway between New York City and Washington, D. C. along the Atlantic Seaboard of the United States. Approximately 90% of the watershed area in the county drains east to the Delaware River and Bay and 10% drains west to the Chesapeake Bay. Approximately 20% of the county is covered by the hilly, rocky Piedmont Plateau province in populous northern Delaware and 80% is situated in the flat, sandy Coastal Plain province in the rural yet suburbanizing south below the Chesapeake and Delaware Canal. New Castle County is drained by three whole basins as defined by the Delaware DNREC - the Piedmont, Delaware Estuary, and Chesapeake basins.
4. Methods
The Delaware DNREC Watershed Assessment Branch collects STORET water quality monitoring data during the first week of each month along 14 streams in New Castle County (Figure 1). Favorable monitoring stations included data that span the period of analysis (1999-2014), with no more than a year of missing data at the beginning/end of the time period, and at least one half of the data present in the first and last thirds of the record (Lanfear and Alexander 1990). Stream monitoring stations are situated at or upstream from the head of tide yet far enough downstream to characterize water quality from most of the watershed. Six monitored streams flow through the Piedmont Basin, seven streams flow east to the Delaware Estuary, and one stream flows west to the Chesapeake Bay. Six streams drain watersheds in the hilly, rocky Piedmont physiographic province and eight are in the flat, sandy Coastal Plain province.

2
Watershed land uses for each station were compiled using the Delaware 2007 GIS orthophoto quarter quadrangle coverage and then grouped into four categories: developed (urban/suburban), cultivated (farms/agriculture), forests, and water/wetlands (Table 1). Watershed impervious cover was estimated using GIS by multiplying the area of each land use by an impervious cover factor, summing the products, and dividing by total watershed area. Impervious cover factors were obtained by directly measuring the area of roof and pavement for each land use category including developed urban/suburban (30%-70%), cultivated farms and agriculture (5%), forests (0%), and water/wetlands (0%). Favorable water quality monitoring stations contain at least four sampling points per year from 1999 to 2014 for dissolved oxygen (DO), enterococcus bacteria (EB), total nitrogen (TN), total phosphorus (TP), and total suspended sediment (TSS). The EPA and DNREC have identified these as priority parameters to establish TMDLs along Delaware streams. DO levels higher than 4 mg/l are necessary to sustain aquatic life as the basis for fishable water quality standards. High bacteria levels originate from sewage or animal waste and cause health problems if ingested during swimming or contact with polluted waters. Elevated nitrogen causes eutrophication and algae blooms and depleted oxygen levels and high turbidity. Phosphorus is needed for plant metabolism, however, in high amounts it is a limiting factor in algae blooms, eutrophication, and fish kills. High TSS concentrations smother fish habitat, block sunlight causing water plants to die, decrease DO levels, and increase water temperature. Water quality data were plotted on time series scatterplots with concentration on the vertical axis and time on the horizontal axis (Appendices A through E). Scatterplots portray basic statistical parameters such as the sample, maximum/ minimum, range, and variance. Two-dimensional scatterplots of the sample illustrate the relationship between water quality concentration and time period and show the original characteristics of the data (Helsel and Hirsch 2002). The median, instead of the mean, is preferable when evaluating the central tendency of water quality data because the median is usually resistant to and minimally affected by outliers.
Table 1. Land use and impervious cover in New Castle County, Delaware watersheds
Watershed (DNREC Station No.)
Drainage Area (mi2)
Impervious(%)
Developed(%)
Cultivated (%)
Forest(%)
Wetland(%)
Piedmont Basin Naamans Cr. at Naamans Road (101021) 10 39 86 1 12 1 Shellpot Cr. at Route 13 (102011) 14 44 85 1 11 3 Brandywine Cr. at Footbridge (104011) 321 14 30 35 33 1 White Clay Cr. at Delaware Park (105151) 105 18 38 32 28 2 Red Clay Cr. at Stanton (103011) 53 17 40 31 28 1 Christina R. at Rt. 141 Newport (106011) 77 40 61 13 19 6 Delaware Estuary Basin 0 Army Cr. at Route 13 (114021) 10 38 62 15 10 12 Red Lion Cr. at Route 7 (107011) 11 24 44 33 13 13 Dragon Run at Route 9 (111011) 10 23 43 33 13 11 C & D Canal at St. Georges Br. (108021) 43 11 19 42 13 25 Appoquinimink R. at Odessa (109051) 45 12 20 53 9 18 Blackbird Cr. at Route 13 (110021) 30 7 13 37 20 29 Smyrna R. at Route 9 (201041) 63 10 15 55 10 20 Chesapeake Bay Basin 0 Chester R. at Sewell Bridge Rd. (112021) 39 5 9 44 12 34

3
Figure 1. Stream water quality monitoring stations in Delaware

4
The analysis includes visual examination of time series scatterplots and medians at five year intervals. Visual analyses using scatterplots can detect trends where water quality change is not monotonic, for instance, where water quality may degrade over the first years of record, reverses, and improves over the latter years (the banana curve effect). We compared median water quality data for 1999 to 2014 to Delaware criteria to categorize stream health as good, fair, or poor. The Delaware dissolved oxygen standard is 4 mg/l for warm water streams and 5 mg/l for cold water put and take trout streams (Table 2). The Delaware enterococcus bacteria standard is 100 colonies per 100 ml. The Delaware total nitrogen target level for setting TMDLs ranges from 2.0 to 3.0 mg/l. DNREC defines total phosphorus target levels of 0.1 to 0.2 mg/l (DNREC 2008). Delaware does not have a total suspended sediment standard, therefore, a neighboring New Jersey TSS standard of 25 mg/l is used for comparison (NJDEP 2006).
Table 2. Surface water quality criteria and target levels in Delaware Parameter Criteria (mg/l)
Dissolved Oxygen 4.0 warm water, 5.0 cold water
Enterococcus Bacteria 100 colonies/100 ml
Total Nitrogen 2.0-3.0 (TMDL target)
Total Phosphorus 0.1-0.2 (TMDL target)
Total Suspended Sediment 25 (NJ default) Water quality along New Castle County, Delaware streams are defined as good, fair, or poor by comparing the 2006-2010 median to criteria summarized in Table 3. Good water quality indicates the 5-year median comfortably exceeds water quality criteria by 50% or more. Fair water quality indicates the median just exceeds the criteria. Poor water quality indicates the median is below criteria and does not meet water quality standards or target levels.
Table 3. Water quality ladder for Delaware streams Water
Quality Comparison to Water
Quality Criteria DO
(mg/l) E. Bacteria (#/100 ml)
TN (mg/l)
TP (mg/l)
TSS (mg/l)
Good Comfortably exceeds > 6.0 < 90 < 1.0 < 0.051 < 25 Fair Just exceeds 4.0-6.0 90-100 1.0-2.0 0.05-0.15 25-40 Poor Below standards < 4.0 > 100 > 2.0 > 0.15 > 40
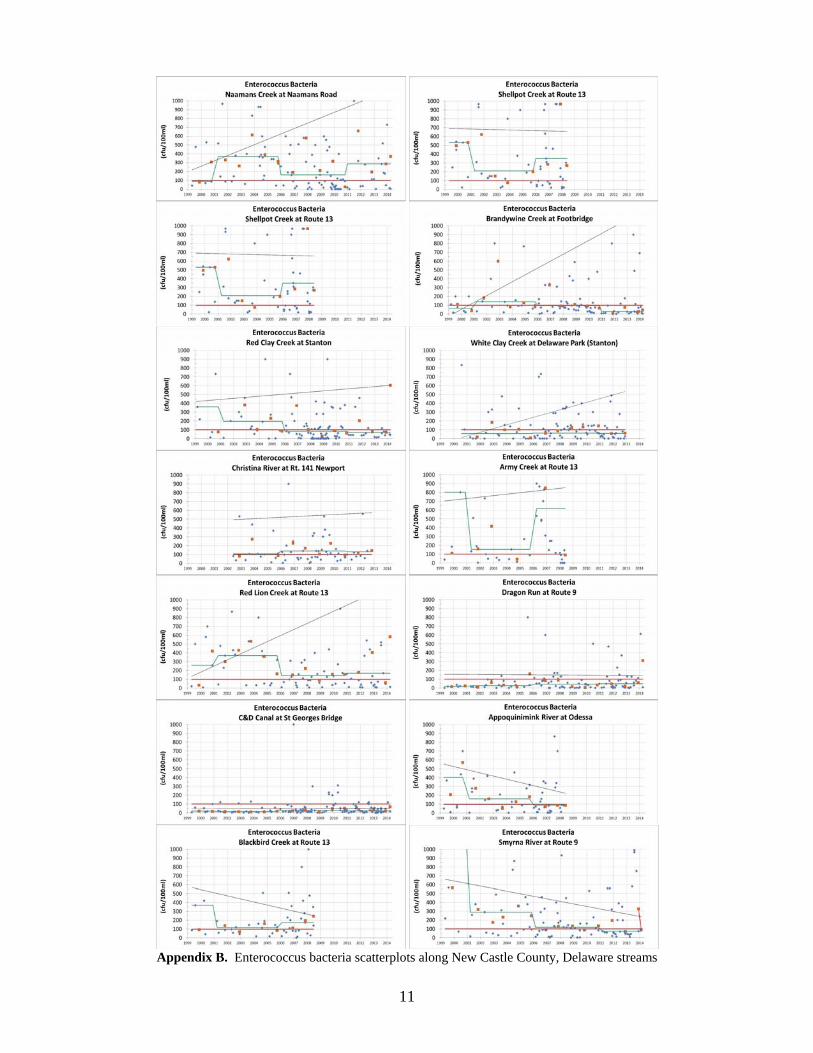
5. Results Water quality along New Castle County, Delaware streams improved or was constant at 94% of the stations from 1999 to 2014 (Table 4 and Figure 2). Since 1999, water quality improved at 61%, remained constant at 33%, and degraded at 6% of the stations as improving stations outweighed degrading stations by a 10:1 margin. Dissolved oxygen improved at 93%, was constant at 7%, and degraded at 0% of the streams. Enterococcus bacteria improved at 43%, was constant at 50%, and degraded at 7% of the streams. Total nitrogen improved at 43%, was constant at 50%, and degraded at 7% of the streams. Total phosphorus improved at 64%, was constant at 36%, and degraded at 0% of the streams. Total suspended sediment improved at 64% of streams, was constant at 21%, and degraded at 15% of the streams. The White Clay, Red Clay, C&D Canal, Appoquinimink, Blackbird, Smyrna, and Chester River stations recorded the most improvement where at least three of the five parameters had improving trends. From 2006-2010, median levels were good or fair at 100% of the stations for dissolved oxygen, 50% for bacteria, 71% for nitrogen, 86% for phosphorus, and 79% for sediment. DO as recorded by the 5-year median from 2006-2010 are levels good and exceed 6 mg/l in all 14 streams and comfortably exceed the Delaware fresh water standard of 4 mg/l (Figure 3). Median bacteria levels from 2006–2010 are poor and exceed the Delaware standard of 100 colonies per 100 ml in 50% or 7 of 14 streams. Media bacteria levels are good and meet the standard in the Brandywine, Red Clay, and White Clay Creeks in the Piedmont and in the C&D Canal, Dragon Run, Chester River, and Appoquinimink River in the Coastal Plain. Median total nitrogen levels are good in the Red Lion Creek and Dragon Run and fair in 8 of 14 streams (57%). Watersheds with poor nitrogen levels include the Army Creek and three Piedmont streams with high amounts of agricultural land in Pennsylvania (Brandywine, Red Clay, and White Clay creeks). Median total phosphorus levels are poor and exceed 0.20 mg/l in the Appoquinimink and Smyrna river watersheds and good (less than 0.05 mgl) in the Christina, Naamans, White Clay, Shellpot, and Red Lion watersheds. Median total suspended sediment levels from 2006-2010 are good (25 mg/l) in all but three streams. The Appoquinimink, C&D Canal, and Smryna watersheds have high sediment loads from the primarily rural watersheds.

5
Table 4. Water quality trends along New Castle County, Delaware streams (1999-2014) Stream
DO
(mg/L) Bacteria
(#/100ml) TN
(mg/L) Total P (mg/L)
TSS (mg/L)
Naamans Creek 10.0 163 1.7 0.04 1
Shellpot Creek 9.5 350 1.5 0.05 4
Brandywine Creek 10.5 97 3.3 0.15 4 White Clay Creek 10.2 63 2.9 0.04 3
Red Clay Creek 10.5 83 3.4 0.13 3 Christina River 8.5 140 1.5 0.02 20 Army Creek 9.0 616 2.1 0.07 6
Red Lion Creek 9.0 145 1.0 0.05 4
Dragon Run Creek 7.9 43 1.0 0.11 7
C&D Canal 8.8 27 1.9 0.15 73
Appoquinimink River 9.1 87 1.9 0.20 46 Blackbird Creek 8.4 173 1.6 0.08 4 Smyrna River 7.8 117 1.6 0.26 84 Chester River 7.5 57 1.7 0.13 3
Improving 13/14 (93%) 6/14(43%) 6/14 (43%) 9/14 (64%) 9/14 (64%) Constant 1/14 (7%) 7/14 (50%) 7/14 (50%) 5/14 (36) 3/14 (21%)
Degrading 0/14 (0%) 1/14 (7%) 1/14 (7%) 0/14 (0%) 2/14 (15%)
Figure 2. Water quality trends along New Castle County, Delaware streams (1999-2014)

6
Figure 3. Median water quality levels along New Castle County, Delaware streams (2006-2010)
6. Discussion Stream water quality in New Castle County varies by physiographic province and drainage basin. Median dissolved oxygen levels are higher in streams such as the Brandywine, Red Clay, and White Clay creeks in the hilly, rocky Piedmont basin compared to lower DO levels in the agricultural, flat sandy coastal plain basins draining to the Delaware Estuary and Chesapeake Bay. Urbanized Coastal Plain streams draining to the Delaware Estuary such as the Army Creek and Shellpot Creek recorded the highest bacteria levels most likely due to runoff from development. The Brandywine, Red Clay, and White Clay creeks recorded the highest nitrogen levels mostly originating from agricultural runoff in the headwaters in Chester County, Pennsylvania. Total phosphorus and total suspended sediment levels were highest in the Coastal Plain streams of southern New Castle County (C&D Canal, Appoquinimink, and Smyrna River) where high percentages of agricultural land occupy the watersheds.
Stream water quality varies by watershed land use (Figures 4 and 5). Land use varies from over 40% developed (urban/suburban) in seven watersheds near Wilmington and City of New Castle to less than 20% developed along rural coastal streams south of the C&D Canal. The Brandywine, White Clay, C&D Canal, Blackbird, Smyrna, and Chester watersheds retain over 30% natural cover as forest plus wetlands. Impervious cover ranges from near 40% in three Piedmont watersheds in urban northern Delaware (Naamans, Shellpot, and Christina) to less than 10% in the lightly developed Blackbird, Smyrna River, and Chester River watersheds in the Coastal Plain.

7
Figure 4. Land use in Delaware watersheds

8
Figure 5. Land use proportions in New Castle County, Delaware watersheds
Linear regression analysis indicates that water quality is moderated correlated with watershed land use in New Castle County (Figure 6). The coefficient of determination (r2 > 0.30) from linear regression analyses indicates good water quality is moderately correlated with large areas of forest and is negatively correlated with agriculture and impervious cover. Dissolved oxygen improves with increasing areas of forest in these watersheds. Total phosphorus and sediment levels increase with rising agricultural area. Bacteria increases with increased impervious cover in the watersheds. Linear regression plots of cultivated land use or wetland area versus median water quality levels for DO, bacteria, and TN indicate little or no correlation as r2 values are all less than 0.1.
Figure 6. Linear regression plots of water quality versus land use in New Castle County, Delaware watersheds
Since 1990, Delaware DNREC has addressed point source pollutants in New Castle County, Delaware watersheds by issuing NPDES permits to four wastewater treatment plants (Table 5). The Delaware DNREC established a policy that

9
prohibits water treatment plant surface water discharges and is systematically eliminating surface water discharges through the TMDL process. The ban on phosphate detergent during the 1980s and phosphorus removal at wastewater plants has resulted in significant TP reductions in Delaware streams. In 1998, Delaware began implementing Total Maximum Daily Loads per Section 303(d) of the Clean Water Act and by the end of 2006 set TMDL standards for 13 watersheds in New Castle County. Delaware Tributary Action Teams and New Castle County, Delaware Department of Transportation, and City of Newark MS4 NPDES permits are implementing TMDLs through voluntary and regulatory Pollution Control Strategies such as agricultural nutrient management, soil erosion and sediment control, reforestation, septic system relief, and stream restoration programs. These watershed restoration strategies have resulted in improved or preserved (no change) water quality along 94% of the stations over the last decade and a half.
Table 5. Wastewater Treatment Plants in New Castle County, Delaware watersheds. Watershed NPDES Sewage Treatment Plant TMDL
Brandywine Creek Greenville Country Club, Winterthur 2006 C & D Canal Lums Pond State Park Appoquinimink River Middletown-Odessa 2003 Smyrna River Hanover Foods 2006
7. Conclusions The University of Delaware defined water quality trends from 1999 to 2014 along 14 streams in New Castle County, Delaware. Water quality improved or was constant at 94% of stations since 1999. Dissolved oxygen, enterococcus bacteria, total nitrogen, total phosphorus, and total suspended sediment improved or were constant at 100%, 93%, 93%, 100%, and 86% of streams since 1999. During 2005–2010, median levels were good or fair at 100% of the stations for dissolved oxygen, 50% for bacteria, 71% for nitrogen, 86% for phosphorus, and 79% for sediment. Since 1999, improving New Castle County water quality stations (43) outnumbered degrading stations (4) by a 10:1 margin. Good water quality correlates with high mounts of forested land in these watersheds. Over the last decade and a half, watershed strategies such as the New Castle County and City of Newark National Pollution Discharge Elimination System (NPDES), Municipal Separate Stormwater System (MS4) Permit Program required by the Federal Clean Water Act have improved or preserved water quality along these streams. However, greater emphasis is needed to curb recently resurging nitrogen increases along Delaware streams through denitrification techniques such as agricultural nutrient management, planting forests, and urban stormwater retrofitting and efforts. References Delaware Department of Natural Resources and Environmental Control, 2008. State of Delaware 2008 combined watershed assessment report (305(b)) and determination for Clean Water Act Section 303(d) list of TMDLs. Delaware Department of Natural Resources and Environmental Control, 2006. Delaware’s regulations governing the control of water pollution, adopted March 15, 1974. Helsel, D. R. and R. M. Hirsch, 2002. Statistical methods in water resources, Chapter A3, Techniques of Water-Resources Investigations of the U.S. Geological Survey. Book 4, Hydrologic analysis and interpretation. 510 pp. Lanfear, K. J. and R. B Alexander, 1990. Methodology to derive water-quality trends for use by the national water summary program of the U.S. Geological Survey. U.S. Geological Survey Open-File Report 90-359. 10 pp. New Jersey Department of Environmental Protection, 2006. Surface water quality standards, effective April 17, 1998, amended October 16, 2006. United State Environmental Protection Agency, 2007. Clean Water Act History. www.epa.gov. accessed December 14, 2007.

10
Appendix A. Dissolved oxygen scatterplots along New Castle County, Delaware streams
11
Appendix B. Enterococcus bacteria scatterplots along New Castle County, Delaware streams

12
Appendix C. Total nitrogen scatterplots along New Castle County, Delaware streams

13
Appendix D. Total phosphorus scatterplots along New Castle County, Delaware streams

14
Appendix E. Total suspended sediment scatterplots along Delaware streams