water quality report - pinellas park, florida
TRANSCRIPT

PWS ID#:6521406
Water testing performed in 2020
WATER QUALITY REPORT ANNUAL
Presented by
Meeting the Challenge
The City of Pinellas Park is pleased to provide our annual Water Quality Report. This edition covers all testing completed from January 1, 2020 through December 31, 2020. The City’sPublic Utilities Division is committed to delivering drinking water that meets or exceeds all state and federal drinking water standards. Rest assured, we remain vigilant in meeting
the challenge of source water protection, water conservation, and community education while continuing to serve the needs of all our water users. Should you ever have any questions, we are always available to assist you.
ONCE AGAIN THE CITY OF PINELLAS PARK DRINKING WATER MEETS OR EXCEEDS ALL FEDERAL AND STATE REQUIREMENTS
Contaminants That May Be Present In Source Water
The sources of drinking water (both tap water and bottledwater) includes rivers, lakes, streams, ponds, reservoirs,
springs, and wells. As water travels over the surface ofthe land or through the ground, it dissolves naturallyoccurring minerals and in some cases, radioactivematerial and can pick up substances resulting fromthe presence of animals or from human activity.
Contamination that may be present in source water include:
Microbial Contaminants, such as viruses and bacteria, which may come from sewage treatment plants, septic systems, agricultural livestock operations, and wildlife. Inorganic Contaminants, such as salts and metals, which can be naturally occurring or result from urban stormwater runoff, industrial or domestic wastewater discharges, oil and gas production, mining, or farming. Pesticides and Herbicides, which may come from a variety of sources, such as agriculture, urban stormwater runoff, and residential uses.
Organic Chemical Contaminants, including synthetic andvolatile organic chemicals, which are by-products of industrial processes and petroleum production and can also come from gas stations, urban stormwater runoff, and septic systems.Radioactive Contaminants, which can be naturally occurring or be the result of oil and gas production and mining activities.
In order to ensure that tap water is safe to drink, the U.S. EPA prescribes regulations, which limit the amount of certain contaminants in water provided by public water systems. Food and Drug Administration (FDA) regulations establish limits for contaminants in bottled water, which must provide the same protection for public health.
Drinking water, including bottled water, may reasonably be expected to contain at least small amounts of some contaminants. The presence of contaminants does not necessarily indicate that water poses a health risk. More information about contaminants and potential health effects can be obtained by calling the U.S. Environmental Protection Agency Drinking Water Hotline at (800) 426-4791.
Source Water Assessment
I n 2020, the Department of Environmental Protection performed Source Water Assessments
for Tampa Bay Water facilities. The assessment results are available on the FDEP Source Water Assessment and Protection Program website atwww.dep.state.fl.us/swapp or they can be obtained from Tampa Bay water, 2575 Enterprise Road, Clearwater, FL 33763, phone (727) 796-2355.
Turbidity is a measure of the cloudiness of thewater. It is monitored for because it is a good indicator of the effectiveness of the filtration system. High turbidity can hinder the effectiveness of disinfectants.
Your Participation is Welcome!For more information about your drinking water and opportunities to get more involved, please contact Marty Reich (727) 369-5622 email [email protected] or mail at 6250 82nd Avenue North, Pinellas Park, FL 33781. City Council meets the 2nd & 4th Thursday of each month.
1
Microbiological Contaminants
Turbidity
What’s In My Water?
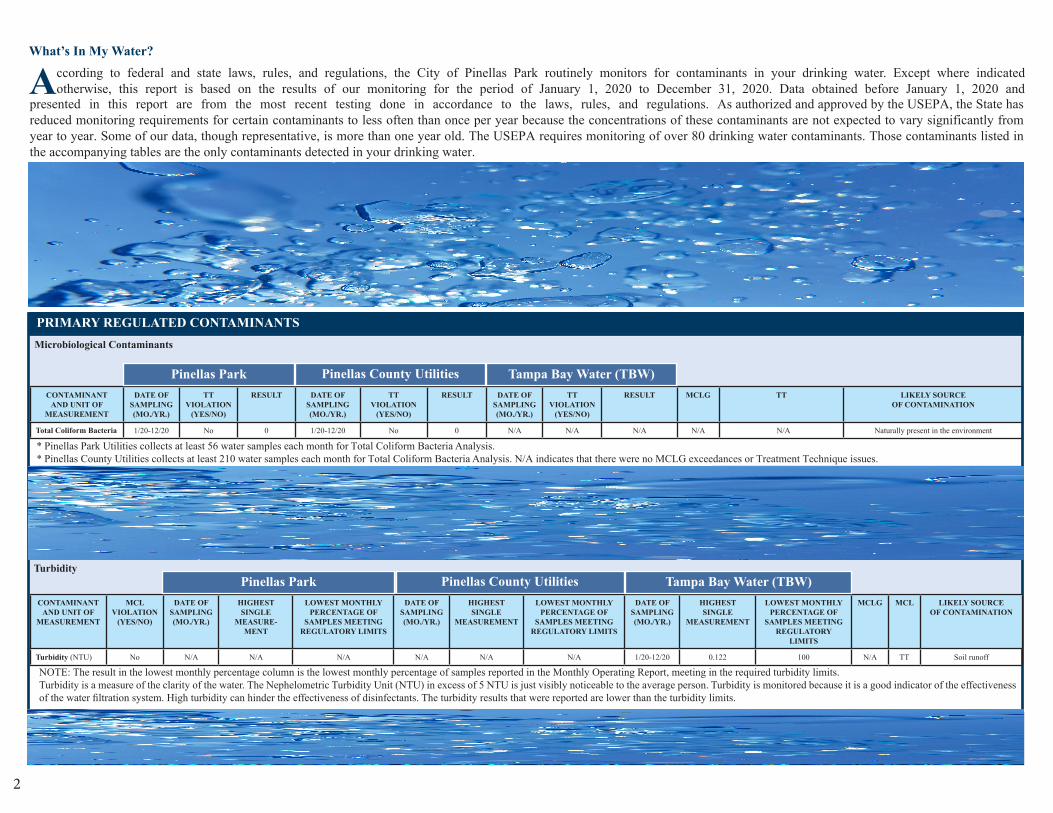
According to federal and state laws, rules, and regulations, the City of Pinellas Park routinely monitors for contaminants in your drinking water. Except where indicatedotherwise, this report is based on the results of our monitoring for the period of January 1, 2020 to December 31, 2020. Data obtained before January 1, 2020 and
presented in this report are from the most recent testing done in accordance to the laws, rules, and regulations. As authorized and approved by the USEPA, the State has reduced monitoring requirements for certain contaminants to less often than once per year because the concentrations of these contaminants are not expected to vary significantly from year to year. Some of our data, though representative, is more than one year old. The USEPA requires monitoring of over 80 drinking water contaminants. Those contaminants listed in the accompanying tables are the only contaminants detected in your drinking water.
CONTAMINANT AND UNIT OF
MEASUREMENT
DATE OF SAMPLING (MO./YR.)
TT VIOLATION
(YES/NO)
RESULT DATE OF SAMPLING (MO./YR.)
TT VIOLATION
(YES/NO)
RESULT DATE OF SAMPLING (MO./YR.)
TT VIOLATION
(YES/NO)
RESULT MCLG TT LIKELY SOURCE OF CONTAMINATION
Total Coliform Bacteria 1/20-12/20 No 0 1/20-12/20 No 0 N/A N/A N/A N/A N/A Naturally present in the environment
PRIMARY REGULATED CONTAMINANTS
Pinellas County Utilities Tampa Bay Water (TBW) Pinellas Park
* Pinellas Park Utilities collects at least 56 water samples each month for Total Coliform Bacteria Analysis. * Pinellas County Utilities collects at least 210 water samples each month for Total Coliform Bacteria Analysis. N/A indicates that there were no MCLG exceedances or Treatment Technique issues.
CONTAMINANT AND UNIT OF
MEASUREMENT
DATE OF SAMPLING(MO./YR.)
MCL
VIOLATION(YES/NO)
TOTAL NUMBER OFPOSITIVE SAMPLES
FOR THE YEAR
DATE OF SAMPLING (MO./YR.)
MCL VIOLATION
(YES/NO)
TOTAL NUMBER OF POSITIVE SAMPLES
FOR THE YEAR
DATE OF SAMPLING (MO./YR.)
MCL VIOLATION
(YES/NO)
TOTAL NUMBER OF POSITIVE SAMPLES
FOR THE YEAR
MCLG MCL LIKELY SOURCE OF CONTAMINATION
E.coli 1/19-12/19 No 0 1/19-12/19 No 0 N/A N/A N/A 0 N/A Human and animal fecal waste
CONTAMINANTAND UNIT OF
MEASUREMENT
MCL VIOLATION
(YES/NO)
DATE OF SAMPLING (MO./YR.)
HIGHEST SINGLE
MEASURE-MENT
LOWEST MONTHLY PERCENTAGE OF
SAMPLES MEETING REGULATORY LIMITS
DATE OF SAMPLING(MO./YR.)
HIGHEST SINGLE
MEASUREMENT
LOWEST MONTHLY PERCENTAGE OF
SAMPLES MEETING REGULATORY LIMITS
DATE OF SAMPLING (MO./YR.)
HIGHEST SINGLE
MEASUREMENT
LOWEST MONTHLY PERCENTAGE OF
SAMPLES MEETING REGULATORY
LIMITS
MCLG MCL LIKELY SOURCE OF CONTAMINATION
Turbidity (NTU) No N/A N/A N/A N/A N/A N/A 1/20-12/20 0.122 100 N/A TT Soil runoff
Pinellas County Utilities Tampa Bay Water (TBW) Pinellas Park
NOTE: The result in the lowest monthly percentage column is the lowest monthly percentage of samples reported in the Monthly Operating Report, meeting in the required turbidity limits. Turbidity is a measure of the clarity of the water. The Nephelometric Turbidity Unit (NTU) in excess of 5 NTU is just visibly noticeable to the average person. Turbidity is monitored because it is a good indicator of the effectiveness of the water filtration system. High turbidity can hinder the effectiveness of disinfectants. The turbidity results that were reported are lower than the turbidity limits.
Pinellas County Utilities Tampa Bay Water (TBW) Pinellas Park
**All repeat sample results were negative for E. coli and total coliform, confr ming there was not a total coliform positive or E. coli-positive compliance MCLG or MCL issue.
2
CONTAMINANT AND UNIT OF
MEASUREMENT
MCL VIOLATION
(YES/NO)
DATE OF SAMPLING(MO./YR.)
LEVEL
DETECTED RANGE OF RESULTS
DATE OF SAMPLING (MO./YR.)
LEVEL DETECTED
RANGE OF RESULTS
DATE OF SAMPLING (MO./YR.)
LEVEL DETECTED
RANGE OF RESULTS
MCLG MCL LIKELY SOURCE OF CONTAMINATION
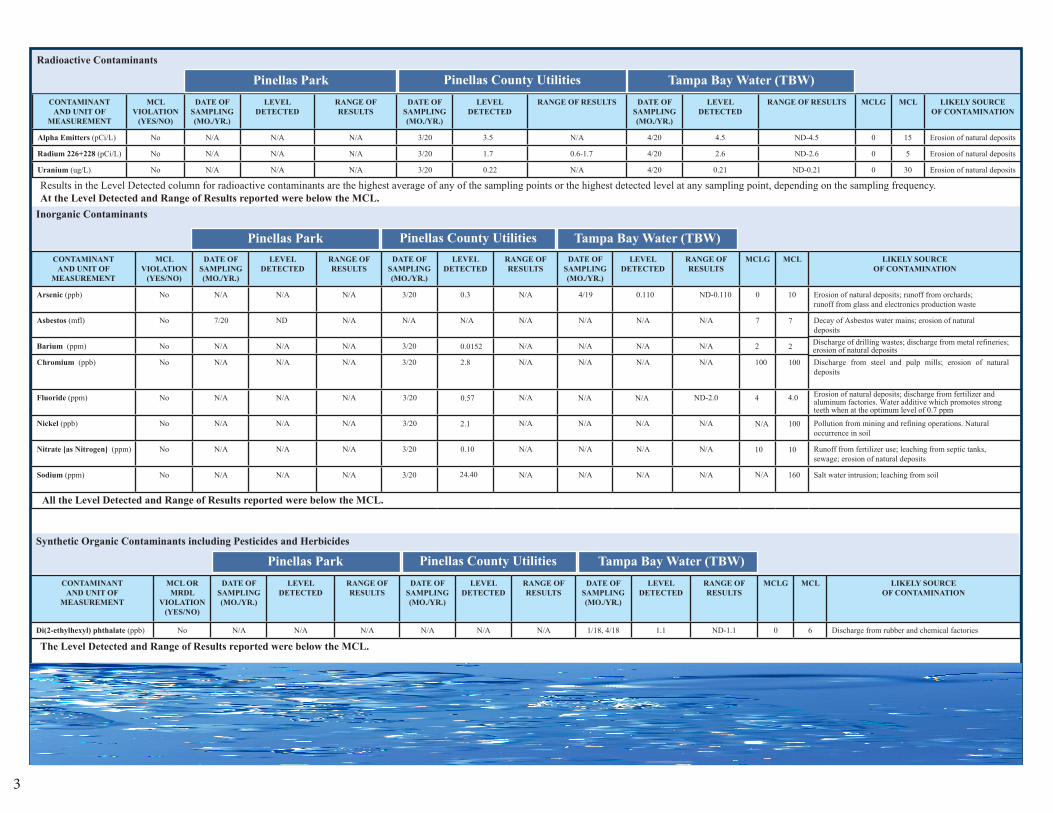
Arsenic (ppb) No N/A N/A N/A 3/20 0.3 N/A 4/19 0.110 ND-0.110 0 10 Erosion of natural deposits; runoff from orchards; runoff from glass and electronics production waste
Asbestos (mfl) No 7/20 ND N/A N/A N/A N/A N/A N/A N/A 7 7 Decay of Asbestos water mains; erosion of natural deposits
Barium (ppm) No N/A N/A N/A 3/20 0.0152 N/A N/A N/A N/A 2 2 Discharge of drilling wastes; discharge from metal refineries; erosion of natural deposits
Chromium (ppb) No N/A N/A N/A 3/20 2.8 N/A N/A N/A N/A 100 100 Discharge from steel and pulp mills; erosion of natural deposits
Fluoride (ppm) No N/A N/A N/A 3/20 0.57 N/A N/A N/A ND-2.0 4 4.0 Erosion of natural deposits; discharge from fertilizer and aluminum factories. Water additive which promotes strong teeth when at the optimum level of 0.7 ppm
Nickel (ppb) No N/A N/A N/A 3/20 2.1 N/A N/A N/A N/A N/A 100 Pollution from mining and refining operations. Natural occurrence in soil
Nitrate [as Nitrogen] (ppm) No N/A N/A N/A 3/20 0.10 N/A N/A N/A N/A 10 10 Runoff from fertilizer use; leaching from septic tanks, sewage; erosion of natural deposits
Sodium (ppm) No N/A N/A N/A 3/20 24.40 N/A N/A N/A N/A N/A 160 Salt water intrusion; leaching from soil
Inorganic Contaminants
Pinellas County Utilities Tampa Bay Water (TBW) Pinellas Park
CONTAMINANT AND UNIT OF
MEASUREMENT
MCL OR MRDL
VIOLATION (YES/NO)
DATE OF SAMPLING(MO./YR.)
LEVEL
DETECTED RANGE OF RESULTS
DATE OF SAMPLING (MO./YR.)
LEVEL DETECTED
RANGE OF RESULTS
DATE OF SAMPLING (MO./YR.)
LEVEL DETECTED
RANGE OF RESULTS
MCLG MCL LIKELY SOURCE OF CONTAMINATION
Di(2-ethylhexyl) phthalate (ppb) No N/A N/A N/A N/A N/A N/A 1/18, 4/18 1.1 ND-1.1 0 6 Discharge from rubber and chemical factories
Synthetic Organic Contaminants including Pesticides and Herbicides
Pinellas County Utilities Tampa Bay Water (TBW) Pinellas Park
CONTAMINANT AND UNIT OF
MEASUREMENT
MCL VIOLATION
(YES/NO)
DATE OF SAMPLING (MO./YR.)
LEVEL DETECTED
RANGE OF RESULTS
DATE OF SAMPLING (MO./YR.)
LEVEL DETECTED
RANGE OF RESULTS DATE OF SAMPLING (MO./YR.)
LEVEL DETECTED
RANGE OF RESULTS MCLG MCL LIKELY SOURCE OF CONTAMINATION
Alpha Emitters (pCi/L) No N/A N/A N/A 3/20 3.5 N/A 4/20 4.5 ND-4.5 0 15 Erosion of natural deposits
Radium 226+228 (pCi/L) No N/A N/A N/A 3/20 1.7 0.6-1.7 4/20 2.6 ND-2.6 0 5 Erosion of natural deposits
Uranium (ug/L) No N/A N/A N/A 3/20 0.22 N/A 4/20 0.21 ND-0.21 0 30 Erosion of natural deposits
Radioactive Contaminants
Pinellas County Utilities Tampa Bay Water (TBW) Pinellas Park
Results in the Level Detected column for radioactive contaminants are the highest average of any of the sampling points or the highest detected level at any sampling point, depending on the sampling frequency. At the Level Detected and Range of Results reported were below the MCL.
All the Level Detected and Range of Results reported were below the MCL.
The Level Detected and Range of Results reported were below the MCL.
3

CONTAMINANT AND UNIT OF
MEASUREMENT
ACUTE VIOLATIONS
(YES/NO)
NON-ACUTE VIOLATIONS
(YES/NO)
LEVEL DETECTED
DATE OF SAMPLING (MO./YR.)
DATE OF SAMPLING (MO./YR.)
LEVEL DETECTED
DATE OF SAMPLING (MO./YR.)
LEVEL DETECTED
MRDLG MRDL LIKELY SOURCE OF CONTAMINATION
Chlorine Dioxide (ppb) No N/A No N/A 4/20 N/A 0.50 N/A 800 Water additive used to control microbes 800
Pinellas County Utilities Tampa Bay Water (TBW) Pinellas Park
MCL VIOLATION
(YES/NO)
DATE OF SAMPLING (MO./YR.)
CONTAMINANT AND UNIT OF
MEASUREMENT
HIGHEST AVERAGE
DATE OF SAMPLING (MO./YR.)
HIGHEST AVERAGE
DATE OF SAMPLING (MO./YR.)
HIGHEST MONTHLY AVERAGE*
HIGHEST AVERAGE
MCLG MCL LIKELY SOURCE OF CONTAMINATION
Chlorite (ppm) No N/A N/A N/A N/A 1/20-12/20 0.00559 N/A 0.8 1.0 By-product of drinking water disinfection
Tampa Bay Water (TBW) Pinellas County Utilities Pinellas Park
The Highest Monthly Average was below the MCLG and the MCL.
For chlorine dioxide, the level detected is the highest single daily sample collected at the entrance to the distribution system. The Level Detected was below the MRDLG and MRDL.
CONTAMINANT AND UNIT OF
MEASUREMENT
TT VIOLATION
(YES/NO)
DATE OF SAMPLING (MO./YR.)
LOWEST RUNNING ANNUAL
AVERAGE*
RANGE OF MONTHLY REMOVAL
RATIOS
DATE OF SAMPLING (MO./YR.)
LOWESTRUNNINGANNUAL
AVERAGE
Naturally present in the environment TT 1.82-3.89 N/A 3.37 1/20-12/20 N/A N/A N/A N/A N/A N/A No Total Organic Carbon (ppm)
LIKELY SOURCE OF CONTAMINATION
MCL MCLG RANGE OF MONTHLY REMOVAL
RATIOS *
LOWEST RUNNING ANNUAL
AVERAGE
DATE OF SAMPLING(MO./YR.)
RANGE OFMONTHLYREMOVAL
RATIOS *
Tampa Bay Water (TBW) Pinellas County Utilities Pinellas Park
*Lowest Running Annual Average computed quarterly
DISINFECTANT AND UNIT OF
MEASUREMENT
MCL OR MRDL
VIOLATION(YES/NO)
RANGE OFRESULTS
LEVEL DETECTED
DATE OF SAMPLING(MO./YR.)
LEVEL DETECTED
DATE OF SAMPLING (MO./YR.)
RANGE OFRESULTS
LEVEL DETECTED
DATE OF SAMPLING (MO./YR.)
MRDLG RANGE OF
RESULTS MRDL LIKELY SOURCE
OF CONTAMINATION
Bromate (ppb) No N/A N/A N/A N/A N/A N/A 1/20-12/20 3.04 ND-5.66 0 10 By-product of drinking water disinfection
Chlorine and Chloramines (ppm)
No 1/20-12/20 2.18 0.7-4.0 1/20-12/20 3.8 0.85-4.96 N/A N/A N/A 4 4.0 Water additive used to control microbes
Stage 1 Disinfectants and Disinfection By-Products-For Chloramines, or Chlorine, the level detected is the highest running annual average (RAA), computed quarterly, of monthly averages of all samples collected. The range of results is the highest and lowest result of all the individual samples collected during the past year.
Pinellas County Utilities Tampa Bay Water (TBW) Pinellas Park
For bromate the level detected is the highest running annual average (RAA), computed quarterly, of monthly averages of all samples collected. The Level Detected and Range of Results reported were below the MCL.
4
CONTAMINANT AND UNIT OF
MEASUREMENT
MCL OR MRDL
VIOLATION (YES/NO)
DATE OF SAMPLING (MO./YR.)
LEVEL DETECTED
RANGE OF RESULTS
DATE OF SAMPLING (MO./YR.)
LEVEL DETECTED
RANGE OF RESULTS
DATE OF SAMPLING (MO./YR.)
LEVEL DETECTED
RANGE OF RESULTS
MCLG MCL LIKELY SOURCE OF CONTAMINATION
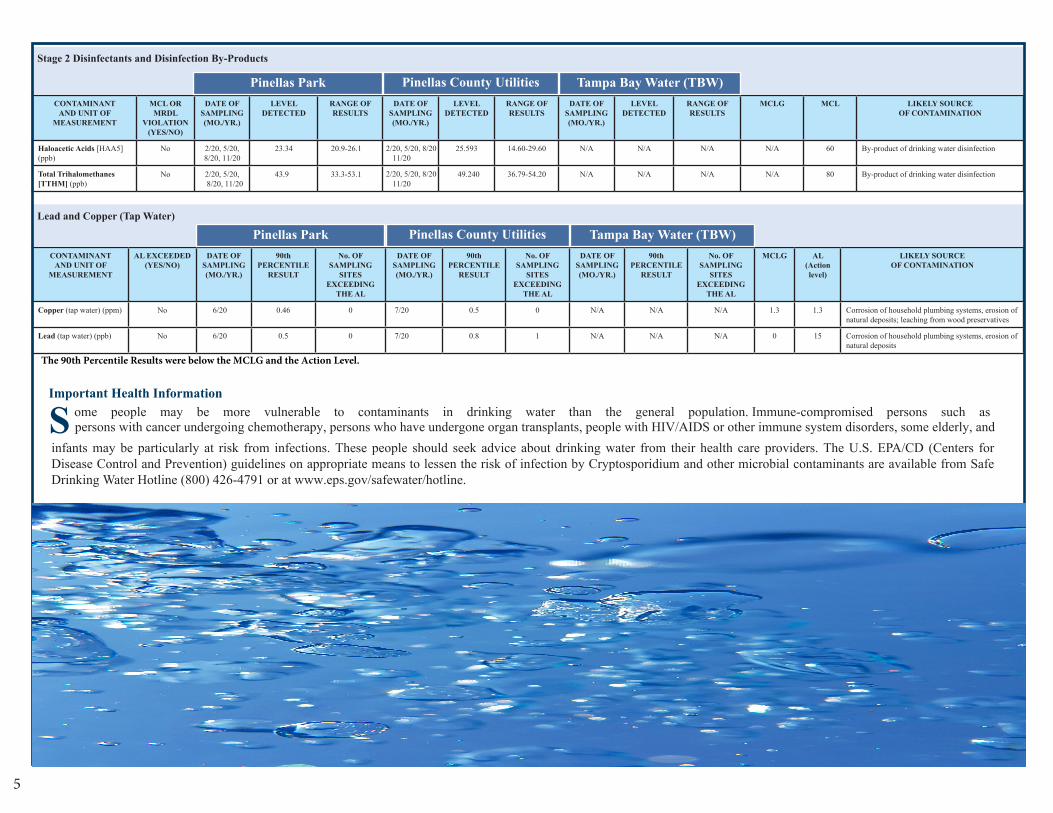
Haloacetic Acids [HAA5] (ppb)
No 2/20, 5/20, 8/20, 11/20
23.34 20.9-26.1 2/20, 5/20, 8/20 11/20
25.593 14.60-29.60 N/A N/A N/A N/A 60 By-product of drinking water disinfection
Total Trihalomethanes [TTHM] (ppb)
No 2/20, 5/20, 8/20, 11/20
43.9 33.3-53.1 2/20, 5/20, 8/20 11/20
49.240 36.79-54.20 N/A N/A N/A N/A 80 By-product of drinking water disinfection
Stage 2 Disinfectants and Disinfection By-Products
Pinellas County Utilities Tampa Bay Water (TBW) Pinellas Park
CONTAMINANT AND UNIT OF
MEASUREMENT
AL EXCEEDED (YES/NO)
DATE OF SAMPLING(MO./YR.)
90th PERCENTILE
RESULT
No. OF SAMPLING
SITES EXCEEDING
THE AL
DATE OF SAMPLING (MO./YR.)
90th PERCENTILE
RESULT
No. OF SAMPLING
SITES EXCEEDING
THE AL
DATE OF SAMPLING (MO./YR.)
90th PERCENTILE
RESULT
No. OF SAMPLING
SITES EXCEEDING
THE AL
MCLG AL (Actionlevel)
LIKELY SOURCE OF CONTAMINATION
Copper (tap water) (ppm)
No 6/20 0.46 0 7/20 0.5 0 N/A N/A N/A 1.3 1.3 Corrosion of household plumbing systems, erosion of natural deposits; leaching from wood preservatives
Lead (tap water) (ppb) No 6/20 0.5 0 7/20 0.8 1 N/A N/A N/A 0 15 Corrosion of household plumbing systems, erosion of natural deposits
Lead and Copper (Tap Water)
Pinellas County Utilities Tampa Bay Water (TBW) Pinellas Park
The 90th Percentile Results were below the MCLG and the Action Level.
Important Health Information
S ome people may be more vulnerable to contaminants in drinking water than the general population. Immune-compromised persons such aspersons with cancer undergoing chemotherapy, persons who have undergone organ transplants, people with HIV/AIDS or other immune system disorders, some elderly, and
infants may be particularly at risk from infections. These people should seek advice about drinking water from their health care providers. The U.S. EPA/CD (Centers for Disease Control and Prevention) guidelines on appropriate means to lessen the risk of infection by Cryptosporidium and other microbial contaminants are available from Safe Drinking Water Hotline (800) 426-4791 or at www.eps.gov/safewater/hotline.
5
CONTAMINANT
AND UNIT OF MEASUREMENT DATE OF SAMPLING (MONTH/YEAR) LEVEL DETECTED RANGE OF RESULTS LIKELY SOURCE OF CONTAMINATION
Bromochloroacetic Acid (ppb) 1/19 3.75 3.5-4.2 Not available
Bromodichloroacetic Acid (ppb) 1/19 1.8 1.5-1.9 Not available
Chlorodibromoacetic Acid (ppb) 1/19 0.755 .75-.80 Not available
Haloacetic Acids (Total) (ppb)
Monobromoacetic Acid (ppb) 1/19 ND ND Not available
Monochloroacetic Acid (ppb) 1/19 ND ND Not available
Tribromoacetic Acid (ppb) 1/19 ND ND Not available
Trichloroacetic Acid (ppb) 1/19 8.575 8.2-9.2 Not available
Butylated hydroxyanisole (BHA) (ppb) 1/19 ND ND Not available
o-Toluidine (ppb) 1/19 ND ND Not available
1/19 ND ND Not available
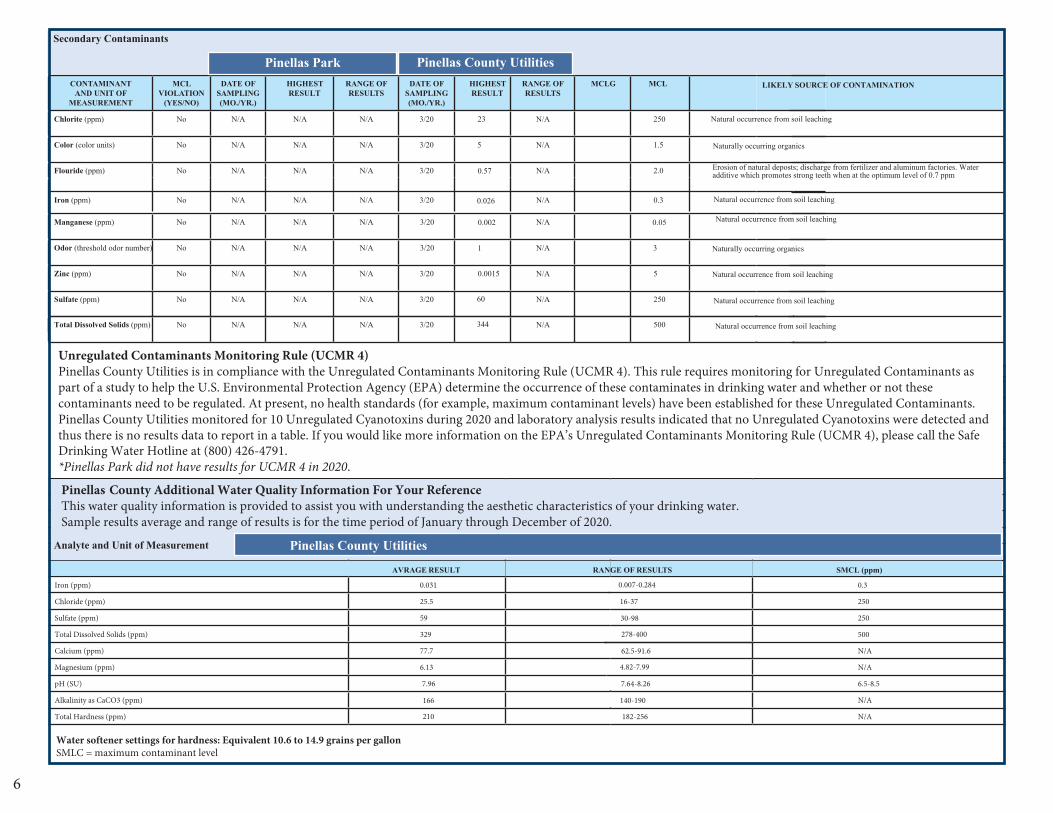
Iron (ppm) 0.031 0.007-0.284 0.3
Chloride (ppm) 25.5 16-37 250
Sulfate (ppm) 59 30-98 250
Total Dissolved Solids (ppm) 329 278-400 500
Calcium (ppm) 77.7 62.5-91.6 N/A
Magnesium (ppm) 6.13 4.82-7.99 N/A
pH (SU) 7.96 7.64-8.26 6.5-8.5
Alkalinity as CaCO3 (ppm) 166 140-190 N/A
Total Hardness (ppm)
210 182-256 N/A
Unregulated Contaminants Pinellas Park
6
Pinellas County Utilities Analyte and Unit of Measurement
RANGE OF RESULTS SMCL (ppm) AVRAGE RESULT
Pinellas County Additional Water Quality Information For Your ReferenceThis water quality information is provided to assist you with understanding the aesthetic characteristics of your drinking water.Sample results average and range of results is for the time period of January through December of 2020.
Water softener settings for hardness: Equivalent 10.6 to 14.9 grains per gallon SMLC = maximum contaminant level
Unregulated Contaminants Monitoring Rule (UCMR 4)Pinellas County Utilities is in compliance with the Unregulated Contaminants Monitoring Rule (UCMR 4). This rule requires monitoring for Unregulated Contaminants as part of a study to help the U.S. Environmental Protection Agency (EPA) determine the occurrence of these contaminates in drinking water and whether or not these contaminants need to be regulated. At present, no health standards (for example, maximum contaminant levels) have been established for these Unregulated Contaminants.Pinellas County Utilities monitored for 10 Unregulated Cyanotoxins during 2020 and laboratory analysis results indicated that no Unregulated Cyanotoxins were detected and thus there is no results data to report in a table. If you would like more information on the EPA’s Unregulated Contaminants Monitoring Rule (UCMR 4), please call the Safe Drinking Water Hotline at (800) 426-4791. *Pinellas Park did not have results for UCMR 4 in 2020.
CONTAMINANT AND UNIT OF
MEASUREMENT
MCL
(YES/NO) VIOLATION
DATE OF
(MO./YR.) SAMPLING
HIGHESTRESULT
RANGE OF RESULTS
DATE OF SAMPLING (MO./YR.)
HIGHESTRESULT RESULTS
RANGE OF MCLG MCL LIKELY SOURCE OF CONTAMINATION
Chlorite (ppm) No N/A N/A N/A 3/20 23 N/A 250 Natural occurrence from soil leaching
Color (color units) No N/A N/A N/A 3/20 5 N/A 1.5 Naturally occurring organics
Flouride (ppm) No N/A N/A N/A 3/20 0.57 N/A 2.0 Erosion of natural deposts; discharge from fertilizer and aluminum factories. Water additive which promotes strong teeth when at the optimum level of 0.7 ppm
Iron (ppm) No N/A N/A N/A 3/20 0.026 N/A 0.3 Natural occurrence from soil leaching
Manganese (ppm) No N/A N/A N/A 3/20 0.002 N/A 0.05 Natural occurrence from soil leaching
Odor (threshold odor number) No N/A N/A N/A 3/20 1 N/A 3 Naturally occurring organics
Zinc (ppm) No N/A N/A N/A 3/20 0.0015 N/A 5 Natural occurrence from soil leaching
Sulfate (ppm) No N/A N/A N/A 3/20 60 N/A 250 Natural occurrence from soil leaching
Secondary Contaminants
Pinellas County Utilities Pinellas Park
Total Dissolved Solids (ppm) No N/A N/A N/A 3/20 344 N/A 500 Natural occurrence from soil leaching
I f present, elevated levels of lead can cause serious health problems, especially for pregnant women and young children. Lead in drinking water is primarily from materials and components associated with service lines and home plumbing. The City of Pinellas Park is responsible for providing high quality drinking water but cannot control the variety
of materials used in plumbing components. When your water has been sitting for several hours, you can minimize the potential for lead exposure by flushing your tap for 30 seconds to 2 minutes before using water for drinking or cooking. If you are concerned about lead in your water, you may wish to have your water tested. Information on lead in drinking water, testing methods, and steps you can take to minimize exposure is available from the Safe Drinking Water Hotline (800) 426-4791 or at www.eps.gov/safewater/lead. The current Federal Environmental Protection Agency (EPA) regulatory potable water 90th percentile Lead Action Level is 15 ppb (parts per billion). During 2017 Pinellas Park Utilities completed tri-annual Residential Tap Water sampling resulting in a 1.9 ppb 90th percentile for Lead that is well below the 15 ppb Action Level. In addition the Florida Department of Environmental Protection (FDEP) requires lead levels in the source water be analyzed annually to confirm the quality of the source water supply. The 2017 source water lead sample analysis results reported no detection for lead. Pinellas Park Utilities shall be collecting Residential Tap Water samples again between June and September of 2020 with the results being reported in the 2020 CCR.
Lead and Drinking Water
To help you better understand the abbreviations and terms in the Water Quality Analysis table located on the center page we have provided the following definitions:
AL (Action Level): The concentration of a contaminant which, if exceeded, triggers treatment or other requirements which a water system must follow.
NH2Cl (Chloramine): A compound made by chemically combining chlorine and ammonia. Monochloramine, one of three possible combinations, is the desired chloramine from for disinfection of potable water.
Cl (Chlorine): An element used in gaseous form that readily combines with other elements in water to disinfect potable water.
HAAs (Haloacetic Acids): A group of disinfection by-products formed as a result of the chemical disinfection of water.
IDSE (Initial Distribution System Evaluation): An important part of the Stage 2 Disinfection By-Products Rule (DBPR). The IDSE is a one time study conducted by water systems to identify distribution system locations with high concentrations of trihalomethanes (THMs) and haloacetic acids (HAAs). Water systems will use results from the IDSE, Where Does My Water Come From?
The City of Pinellas Park is a consecutive water systemwhich relies on purchased processed water from the
Pinellas County Water System. Utilities customers receive potable (drinking) water from sources managed by the regional water supplier, Tampa Bay Water. This regional water supply is a blend of groundwater, treated surface water and desalinated seawater. Eleven regional well fields pumping water from the Floridan Aquifer are the primary sources for the regional groundwater supply. The Alafia River, Hillsborough River, C. W. Bill Young Regional Reservoir, and the Tampa Bypass Canal are the primary sources for the regional treated surface water supply. Hillsborough Bay is the primary
Abbreviations and Water Quality T erms in conjunction with their Stage 1 DBPR compliance monitoring data, to select compliance monitoring locations for the Stage 2 DBPR.
MCL (Maximum Contaminant Level): The highest level of a contaminant that is allowed in drinking water. MCLs are set as close to the MCLGs as feasible using the best available treatment technology.
MCLG (Maximum Contaminant Level Goal): The level of a contaminant in drinking water below which there is no known or expected risk to health. MCLGs allow for a margin of safety.
MFL (Million Fibers Per Liter): Measure of the presence of asbestos fibers that are larger than 10 micrometers.
MRDL (Maximum Residual Disinfectant Level): The highest level of a disinfectant allowed in drinking water. There is convincing evidence that addition of a disinfectant is necessary for control of microbial contaminants.
MRDLG (Maximum Residual Disinfectant Level Goal): The level of a drinking water disinfectant below which there is no known or expected health risk. MRDLGs do not reflect the benefits of the use of disinfectants to control microbial contaminants.
source of seawater for the regional desalinated supply. The groundwater acquired from the Eldridge-Wilde Well field undergoes water treatment processes that are comprised of three steps. First, the water goes through a hydrogen sulfide removal process. Hydrogen sulfide is a natural element that has a displeasing odor. Next, the groundwater is treated to a standard of 99.99% bacteriological inactivation by adding free chlorine as the primary disinfectant. Then chloramine disinfectant is formed by adding chlorine and ammonia for disinfectant residual maintenance in the distribution system. Lastly, the Eldridge-Wilde Well Field water is blended with the water blend provided by Tampa Bay Water. All the blended water is further treated by Utilities. The
N/A: Not applicable. ND (Not Detected): Indicated that the substance was not
found by laboratory analysis. NTU (Nephelometric Turbidity Units): Measurement
of the clarity or turbidity of water. Turbidity in excess of 5 NTU is just noticeable to the average person.
pCi/L (picocuries per liter): A measure of radioactivity. ppb (parts per billion): One part substance per billion
parts water (or micro-grams per liter). ppm (parts per million): One part substance per million
parts water (or milligrams per liter). TT (Treatment Technique): A required process intended
to reduce the level of contaminant in drinking water. TTHMs (Total Trihalomethanes): A group of
disinfection by-products formed as a result of the chemical disinfection of water.
Turbidity: Turbidity is a measure of the cloudiness of the water. We monitor it because it is a good indicator of the effectiveness of our filtration system. High turbidity can hinder the effectiveness of disinfectants.
chloramine residual is adjusted with sodium hypochlorite-to meet the required level residual set point. The pH (acid-alkali) is adjusted and stabilized using sodium hydroxide. The water is treated with a polyphosphate inhibitor to control corrosion, and then fluoridated for dental health purposes. This final blend of potable water is transferred to pumping stations where it undergoes additional chloramine residual adjustment, if needed, before being pumped to homes and businesses. If you would like a copy please contact Pinellas County Water (727) 464-4000 or visit www.pinellascounty.org/utilities and Tampa Bay Water (727) 796-2355 for their2018 Consumer Confidence Water Quality Report.
7

PWS ID#:6521406
Water testing performed in 2020
WATER QUALITY REPORT ANNUAL 2020
Presented by