water-quality monitoring for environmental management and source-water protection u.s. geological...
TRANSCRIPT

Water-Quality Monitoring for Environmental Management and Source-Water Protection
U.S. Geological SurveyNew England Water Science Center
in cooperation with
Rhode Island Department of Environmental Management
US Department of InteriorUS Geological SurveyU.S. Department of the InteriorU.S. Geological Survey

Monitoring goals:
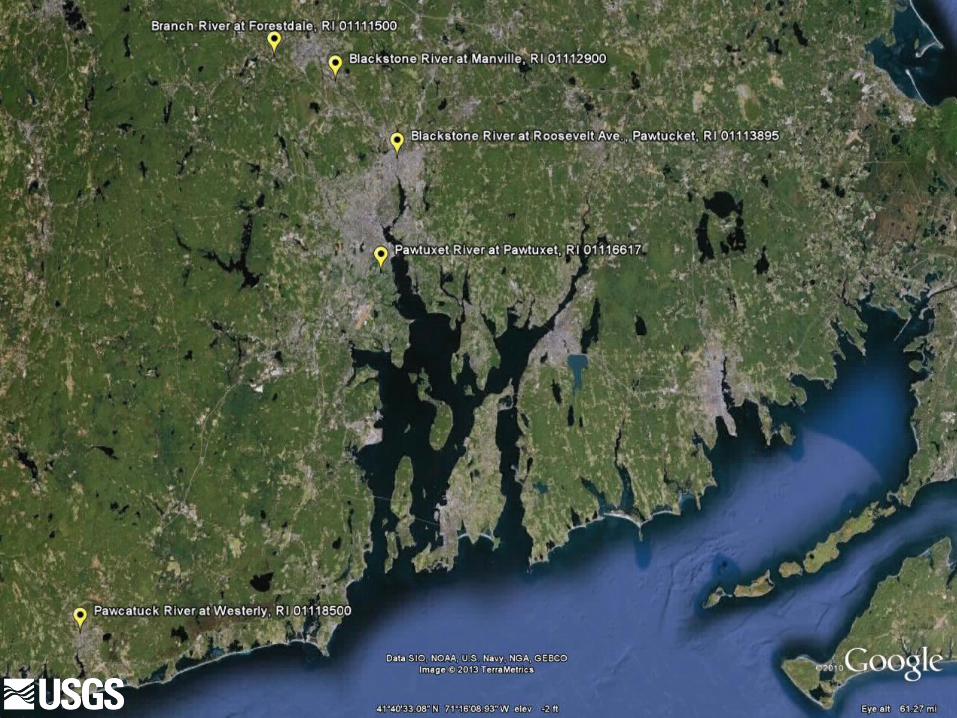
• Characterize water-quality conditions in 4 major RI streams
• Provide data in a format that is used in reporting water quality conditions (305B reports) and assisting in management decisions
• Collect data that may be used to:Identify long-term trendEstimate constituent loads
Slater Mill, Pawtucket, RI

Station Name Identifier Streamflow data Water-quality data
Blackstone River at Millville, MA 01111230 2008 1971, 1973, 1978-2002, 2007-present
Blackstone River at Manville 01112900 1970, 1979-present 1970, 1978-2002, 2007-present
Blackstone River at Roosevelt St, at Pawtucket
01113895 2003-present 2007-present
Branch River at Forestdale 01111500 1940-present1953, 1954, 1956-57, 1958, 1965-67, 1968, 1969, 1971-72, 1975-2002, 2007-present
Pawtuxet River at Pawtuxet 01116617Nearby gage (01116500)
1939-present 1978-2002, 2007-present
Pawcatuck River at Westerly 01118500 1940-present1952, 1953, 1963, 1967, 1971-73, 1975-2002, 2007-present
Rhode Island water-quality monitoring network:
DRAFT

Analyte
USGS NWQL
Parameter code
Minimum reporting
level
Monthly sampling
Quarterly sampling
Nutrients
Organic-N + ammonia-N, whole water
625 0.07 mg/L ü ü
Organic-N + ammonia-N, filtered 623 0.07 mg/L ü ü
Ammonia nitrogen 608 0.010 mg/L ü ü
Nitrate + nitrite nitrogen 631 0.04 mg/L ü ü
Nitrite nitrogen 613 0.0010 mg/L ü ü
Total phosphorus, whole water 665 0.004 mg/L ü ü
Total phosphorus, filtered 666 0.0030 mg/L ü ü
Orthophosphate phosphorus 671 0.004 mg/L ü ü
Trace metals
Cadmium, filtered 1025 0.016 ug/L ü Chromium, filtered 1030 0.07 ug/L ü Copper, filtered 1040 0.80 ug/L ü Lead, filtered 1049 0.025 ug/L ü Nickel, filtered 1065 0.09 ug/L ü Zinc, filtered 1090 1.4 ug/L ü
2014-15 Sampling Plan:

Analyte
USGS NWQL
Parameter code
Minimum reporting
level
Monthly sampling
Quarterly sampling
Major ions
Calcium, filtered 915 0.022 mg/L ü ü
Magnesium, filtered 925 0.011 mg/L ü ü
Sodium, filtered 930 0.06 mg/L ü ü
Chloride, filtered 940 0.06 mg/L ü ü
Suspended sediment
SSC 80154 1 mg/L ü ü
Field parameters
Water temperature 10 0.01 oC ü ü
Specific conductance 95 1.0 uS/cm ü ü
Dissolved oxygen 300 0.1 mg/L ü ü
pH 400 ü ü
2014-15 Sampling Plan:

• Monthly sampling strategy covers the full range of flow conditions at all stations.
0.0 0.1 0.2 0.3 0.4 0.5 0.6 0.7 0.8 0.9 1.010
100
1000
10000FLOW ON WATER-QUALITYSAMPLING DATE--Colors showmonth in which sample was taken
11 Nov
2 Feb 3 Mar 4 Apr 5 May 6 Jun 7 Jul 8 Aug 9 Sep 10 Oct
12 Dec
1 Jan
BLACKSTONE R. AT PAWTUCKET (01113895)March 2007-June 2013
ST
RE
AM
FLO
W, i
n cu
bic
feet
per
sec
ond
PERCENT OF TIME EXCEEDING
DRAFT

• Data show seasonal variations in water-quality conditions.
DRAFT

• Flow-weighted trend analysis shows long-term changes in some constituents.
DRAFT
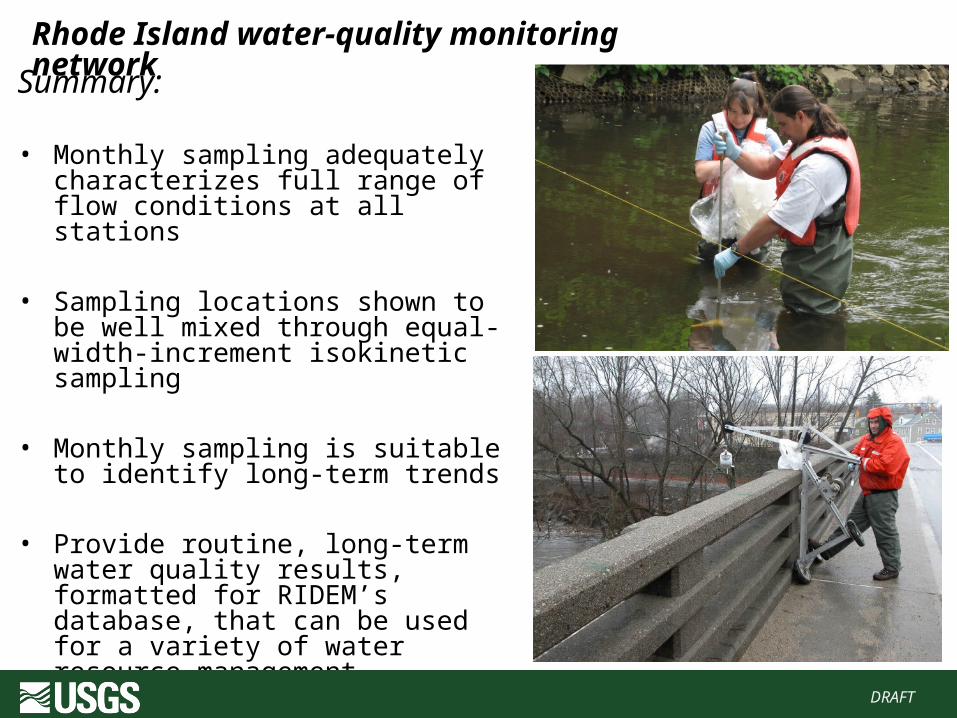
Summary:
• Monthly sampling adequately characterizes full range of flow conditions at all stations
• Sampling locations shown to be well mixed through equal-width-increment isokinetic sampling
• Monthly sampling is suitable to identify long-term trends
• Provide routine, long-term water quality results, formatted for RIDEM’s database, that can be used for a variety of water resource management activities through the USGS cooperative program.
Rhode Island water-quality monitoring network
DRAFT