water quality in the lake winnebago · pdf filewater quality in the lake winnebago pool ... it...
TRANSCRIPT
Water Quality in the Lake Winnebago Pool
A report prepared by the Wisconsin Department of Natural Resources in cooperation with the University of Wisconsin Extension and the Poygan Sportsmen's Club.
DNR Publication Number FH-229-04

TTaabbllee ooff CCoonntteennttss Introduction .......................................................................................................1 Water Quality ....................................................................................................3 Remote Sensing................................................................................................6 Shallow Lakes .................................................................................................10 Monitoring Results...........................................................................................13 Climate ............................................................................................................22 Fish .................................................................................................................24 Aquatic Plants .................................................................................................26 Invasive Species .............................................................................................29 Self-Help Lake Monitoring ...............................................................................33 Management Actions.......................................................................................36 Appendix—Wastewater Discharge..................................................................40 Appendix—Sensitive Areas.............................................................................42
AAcckknnoowwlleeddggmmeennttss This report would not have been possible without the support of many people. Technical review and report input were provided by Mark Sesing, Rob McLennan, Kendall Kamke, Kristy Rogers, Art Techlow, Bob Olynyk, Ellen Barth, Scott Provost, all with the Wisconsin DNR; Chad Cook and Bob Korth with the University of Wisconsin Extension; Dan Rudebeck with the Poygan Sportsmen's Club; and Jonathan Chipman with the University of Wisconsin Environmental Remote Sensing Center. The Poygan Sportsmen's Club provided funds for the printing of this report. Information requests or questions on this report should be directed to: Wisconsin DNR Oshkosh Service Center 625 E. County Road Y, Suite 700 Oshkosh, WI 54901-9731 (920) 424-3050 The Wisconsin Department of Natural Resources provided equal opportunity in its employment, programs, services, and functions under an Affirmative Action Plan. If you have any questions, please write to Equal Opportunity Office, Department of Interior, Washington, D.C. 20240. This publication is available in alternative format (large print, Braille, audio tape, etc.) upon request. Please call (608) 267-7498 for more information. PUBLICATION NUMBER: FH-229-04 2004

Water Quality in the Lake Winnebago Pool 1
WWaatteerr QQuuaalliittyy iinn tthhee LLaakkee WWiinnnneebbaaggoo PPooooll
WWaatteerr quality. What does it mean to you? Most of us know water quality will affect our swimming, boating, hunting and fishing. The Winnebago Pool is the collective name for Lakes Winnebago, Butte des Morts, Poygan, and Winneconne. People living, working and recreating on the Winnebago Pool all want good water quality. Most would probably agree our water quality vision should include lake water that is low in algae, tchemicals, and odors. These qualities usually translate into clear water.
oxic
he Wisconsin Department of Natural Resources (DNR) has a mission to
he water quality of the Winnebago Pool lakes has been examined, or
, and
he data also start to answer the question of how close we are to
tains ter
n action plan for further water quality monitoring and education is also
l.
Tprotect and enhance our natural resources. However, that mission is very much dependent on the people that live among and utilize those natural resources. It is only through the cooperation and coordination of many that we will find the path to our mutual destination of good water quality. T“monitored”, to various degrees by the DNR for nearly 25 years. This report summarizes those actions and examines the data for trends--increasing or decreasing. Interactions of water quality to fish, wildlifeaquatic plants are examined as well as the impact of exotic species on water quality. Treaching the goals identified in the Winnebago Comprehensive Management Plan (WCMP). Published in 1989, the WCMP conspecific water quality objectives for the Winnebago Pool. A panel of waquality experts and citizens developed these objectives with the extensive public input of over 2,000 citizens. Aincluded. While it is important to review the collected water quality data inlight of goals set by the WCMP, it is equally important to use the data to guide further monitoring and assessments of the health of the entire Poo
Water Quality in the Lake Winnebago Pool 1

TThhee lakes that collectively make up the Winnebago Pool encompass over 166,000 surface acres (67,178 ha). This total accounts for nearly 17% of the state’s surface water area. Lake Winnebago, at 137,708 acres (55,728 ha), is the largest lake in Wisconsin and one of the largest lakes in the United States. Despite its large size the average depth is only 15.5 feet (4.7 m) and the maximum depth 21 feet (6.4 m).
Winnebago Pool Watershed
The Winnebago Pool’s main tributary streams are the Fox and Wolf Rivers. The watershed drains about 5,700 square miles (14,763 km2), almost 12% of the entire area of Wisconsin. The Wolf River (203 mi. or 327 km long) drains almost 3,700 square miles (9,583 km2) of northeastern Wisconsin while the Fox River (117 mi. or 188 km long) drains slightly over 2,000 square miles (5,180 km2) of primarily rural land of central Wisconsin.
Major Population CentersThe Winnebago Pool lies in the Fox Valley. Over two million people are within 75 miles (120 km) of the lakes. The west side of Lake Winnebago is most heavily developed. From south to north the major population areas are Fond du Lac (pop. 42,000), Oshkosh (pop. 63,000), Neenah (pop. 24,000), Menasha (pop. 16,000), Grand Chute (pop. 19,000), and Appleton (pop. 70,000). The cities of Appleton, Neenah, Menasha and Oshkosh all draw their drinking water directly from Lake Winnebago. Several cities and sanitary districts also discharge their wastewater effluent directly into the Pool lakes or into the rivers adjacent to the lakes. An appendix at the end of this report has a complete list of wastewater discharges to the Fox and Wolf River basins.
Water Quality in the Lake Winnebago Pool 2

WWaa eerr QQuuaallii yy tt tt
WWaatteerr quality can be measured in a number of different ways. Chemical or biological characteristics of the water itself can be directly measured or more indirect indicators can be used. Plants, fish, or other aquatic organisms such as phytoplankton (words printed like this are defined at the end of the section) or zooplankton can be monitored and changes in their population or distribution used as an indicator of changing water quality. When monitoring occurs, the results give a snapshot of the conditions present at that particular time, in that particular location. On most Wisconsin lakes, monitoring usually occurs at one location, typically at the deepest portion. Due to their large size, the lakes in the Winnebago Pool need to be monitored at several locations to more accurately assess the conditions of the whole lake. Multiple sampling locations make data analysis and trend identification more challenging. To get an idea of whether conditions are improving or deteriorating, monitoring over a long period of time is needed. The frequency of sample collection will depend on what characteristics are sampled. Collection frequencies range from daily, weekly, monthly, seasonally, to even yearly. Many parameters fluctuate on a daily, seasonally, or yearly basis and it is important to take that natural variation into account when examining data collected. For example, the water temperature of a lake varies little on a day-to-day basis but does vary significantly on a seasonal scale. Dissolved oxygen, on the other hand, will often vary over the course of a day. During the day aquatic plants release oxygen to the water as they undergo photosynthesis. This means dissolved oxygen levels in the water are usually highest late in the afternoon. As the sun sets and aquatic plants begin the respiration process, oxygen is consumed and levels in the water drop to their lowest points in the morning before sunrise. The DNR often relies on monitoring of chemical and biological characteristics in order to assess the condition of lakes and to determine whether water quality is improving or not. This type of information is relatively easy and inexpensive to collect and standardized methods are followed to insure that the data is easy to compare even if different people collect the data. The information collected allows the department to evaluate water quality and ultimately helps guide management efforts. Routine chemical and biological monitoring has been done on Lake Winnebago and, to a smaller extent, on the other Pool lakes for about the last 15 years. This sampling has occurred, on average, several times per year and has been done for the purpose of monitoring the Pool for changes in water quality.
Water Quality in the Lake Winnebago Pool 3

Other, more sporadic monitoring has occurred, often times as a part of a larger, more specific project. For example, water quality monitoring data has been collected in association with the Terrell’s Island breakwall project on Lake Butte des Morts. The monitoring is done to provide details on how the project is affecting the area inside versus outside the breakwall. A typical water quality monitoring plan for a lake will sample many different characteristics. Individually, these characteristics may not reveal much information about a lake’s water quality but when examined together a much clearer picture of a lake’s health is seen. Continued monitoring over a long time period gives an indication of how a lake behaves throughout a year. Because weather is so variable in any given year and is so important to many lake processes, monitoring over the course of several years will minimize the affects the weather of any single year will have on the data collected. Monitoring is especially useful for examining the impact of conservation practices that may have been implemented in the watershed to reduce non-point sources of pollution. Collection of monitoring data in the Winnebago Pool occurs year-round but typically occurs more frequently during the summer months. In addition, most sampling events occur in the middle of the day in relatively calm weather. Sampling under these conditions can introduce bias in the sample results but it is difficult to avoid these issues given the resources available.
ZOOPLANKTON—Small, usually microscopic Consequently, animals belonging to this class d
PHYTOPLANKTON—Microscopic floating plandrift about because they cannot move by themsagainst a current.
PHOTOSYNTHESIS—The process in green plsynthesized from carbon dioxide and water usinoxygen as a byproduct. Chlorophyll typically ac RESPIRATION—The process occurring within substances containing carbon, hydrogen, and oconsumption of oxygen (O2) and the liberation Definitions courtesy of the North American Lake Man
Water Quality in the Lake Winnebago Pool
Definitions animals found in water, possessing little or no means of propulsion. rift along with the currents.
ts, mainly algae, that live suspended in bodies of water and that elves or because they are too small or too weak to swim effectively
ants and certain other organisms by which carbohydrates are g light as an energy source. Most forms of photosynthesis release
ts as the catalyst in this process.
living cells by which the chemical energy of organic molecules (i.e., xygen) is released in a series of metabolic steps involving the
of carbon dioxide (CO2) and water (H2O).
agement Society (NALMS). www.nalms.org/glossary/glossary.htm
4

Characteristic
Sampled Sampling Location Reason for Sampling
Water Temperature From surface to bottom at every ½ meter of depth
Many lake activities are temperature influenced (fish spawning, algae blooms, etc.). Monitoring helps predict these events.
Dissolved Oxygen From surface to bottom at every ½ meter of depth
Dissolved oxygen is crucial for supporting life in the lake. Low levels may indicate some sort of pollution
Water Clarity by a Secchi Disk
Measuring water clarity gives an indication as to how much particulate matter, such as algae or sediment, is suspended in the water.
Nitrogen Water sample collected from ½-1 meter from surface and ½-1 meter above the bottom
Nitrogen can be a nutrient that limits algae growth. Depending on the ratio of nitrogen and phosphorus present the type of algae likely to bloom can be predicted.
Phosphorus Water sample collected from ½-1 meter from surface and ½-1 meter above the bottom
Phosphorus is most often the nutrient that limits algae growth. The more phosphorus, the more likely there will be algae blooms.
Chlorophyll Water sample collected from ½-1 meter from surface and ½-1 meter above the bottom
The measurement of chlorophyll, which algae use in photosynthesis, gives an idea of how much algae is present in the water.
pH Water sample collected from ½-1 meter from surface and ½-1 meter above the bottom
The pH of the lake is a general indicator of any changes that may be occurring. Typically the pH changes little throughout the year.
For more information on water quality and its measurement, you can visit one of the following web pages. The U.S. EPA’s Office of Wetlands, Oceans, and Watersheds at http://www.epa.gov/owow/monitoring/ The National Water Quality Monitoring Council at http://water.usgs.gov/wicp/acwi/monitoring/ DNR’s Bureau of Watershed Management at http://www.dnr.state.wi.us/org/water/wm/
Water Quality in the Lake Winnebago Pool 5

RReemmoo ee SSeennssiinngg tt
TTrraaddiittiioonnaall lake monitoring usually involves someone actually going onto a lake to collect water samples and other information for analysis. Often this type of lake monitoring can be hindered by budget and/or personnel constraints. Mother Nature can also influence the timing and amount of monitoring. Typically fair weather is needed to allow for safe monitoring. Another monitoring method being explored is the use of remote sensing. The Upper Midwest Regional Earth Science Applications Center's (RESAC) Satellite Lake Observatory Initiative (SLOI), through a partnership with the Environmental Remote Sensing Center at the University of Wisconsin Madison, uses satellite images to measure water clarity and other water quality parameters in Wisconsin lakes. The radiation characteristics reflected back into space from a lake is dependent on the clarity of the lake. By comparing the radiation characteristics measured by satellite imagery to actual clarity data collected by volunteers, a statistical relationship can be defined. Once established, water clarity can then be accurately determined remotely by analysis of the satellite imagery. This remote sensing technique could reduce the need for actual lake visits to collect data, which would save time and money. On the following pages are examples of images collected by satellites for use in the SLOI. The images clearly demonstrate how dynamic and variable the Winnebago Pool can be at various times. Lake Winnebago varies greatly even from one side to the other and can often look quite different than the Upriver Lakes. These simple visual observations underscore the importance of having an adequate monitoring program in place. Regardless of how many monitoring locations there are in the Pool, identifying trends in water quality will still be a difficult task. For more information on the UW Madison Environmental Remote Sensing Center, you can visit one of the following web pages. The Environmental Remote Sensing Center http://www.ersc.wisc.edu/home/home.htm The Satellite Lakes Observatory Initiative http://tidris.ersc.wisc.edu/sloi/pub/
Water Quality in the Lake Winnebago Pool 6

Images and interpretation courtesy of UW Environmental Remote Sensing Center.
The images above are an example of the use of remote sensing. They were taken by the Landsat-5 and Landsat-7 satellites. The image on the left was acquired on July 9, 2001. Notice the green swath of algae that has accumulated off the north and east shores of Lake Winnebago. The images on the right were acquired by Landsat 7 and show Lakes Winneconne and Poygan on July 27, 1999. In the upper image you see the lakes in context with their surrounding landscape. Note the extensive wetlands on the southwest shore of Lake Poygan and to the North where the Wolf River enters. In the bottom image the surrounding landscape features have been masked out and the variability within the lakes highlighted. The results clearly show even the most subtle variations in lake color, with green colors representing the effects of chlorophyll-rich algae and red-brown colors representing suspended materials stirred up by wave action or carried into the lake from sources upstream. Notice the influence of the wetlands on the southwest shore of Lake Poygan. Wetlands act as natural filters for the water flowing through them by trapping sediment suspended in the water and taking up nutrients and other pollutants dissolved in the water. Therefore, the water flowing into the lakes from this wetland complex is poorer in nutrients and supports less algae growth due to the cleansing action of the wetlands.
Water Quality in the Lake Winnebago Pool 7

11 22
33
Image and interpretation courtesy of UW Environmental Remote Sensing Center.
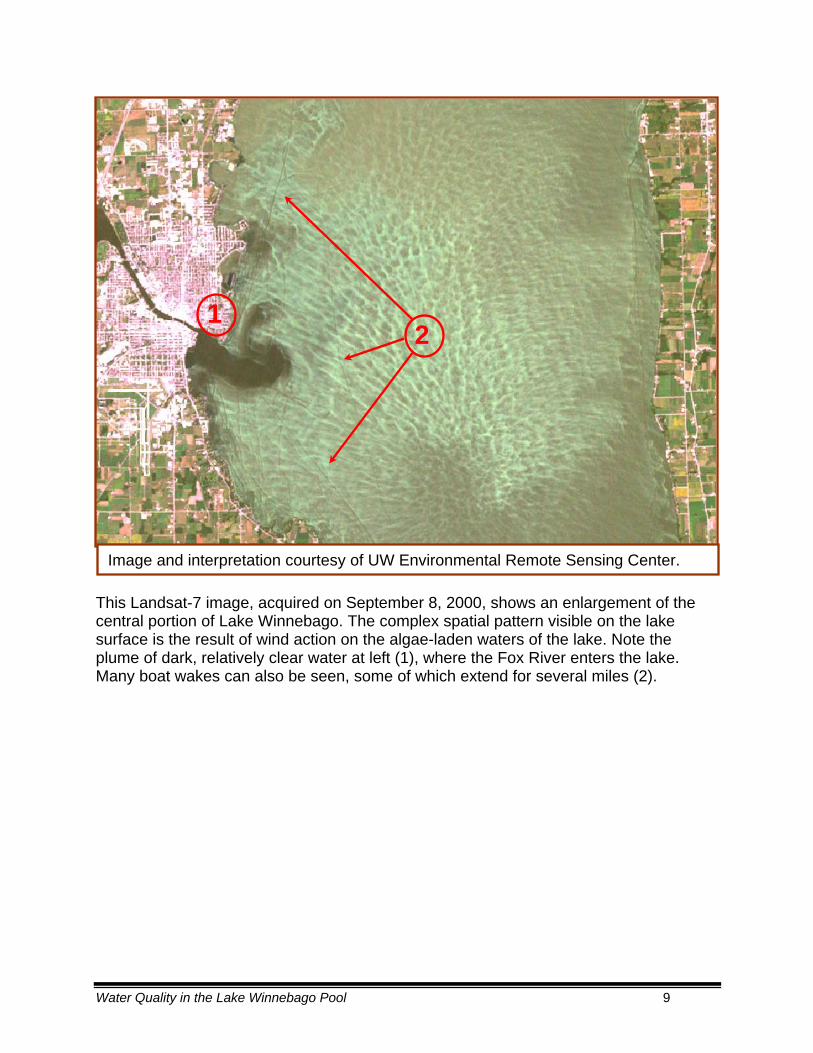
The image above was acquired from the Landsat-7 satellite on September 2, 2001. (1) A large algae bloom is occurring on Lake Winnebago and is most pronounced in the northeast portion of the lake due to the prevailing winds. Notice that the Upriver lakes do not show this intense bloom. (2) Water inside the Terrell’s Island breakwall shows a distinct difference in color from the water outside the breakwall. The water inside appears to be clearer. (3) Notice the algae bloom on Rush Lake. The color is slightly different than the color of Lake Winnebago indicating different algae species may be responsible for each bloom. Rush Lake is a good example of a shallow “prairie pothole” marsh. Water from Rush Lake drains through Waukau Creek and into the Fox River.
Water Quality in the Lake Winnebago Pool 8
22 11
Image and interpretation courtesy of UW Environmental Remote Sensing Center.
This Landsat-7 image, acquired on September 8, 2000, shows an enlargement of the central portion of Lake Winnebago. The complex spatial pattern visible on the lake surface is the result of wind action on the algae-laden waters of the lake. Note the plume of dark, relatively clear water at left (1), where the Fox River enters the lake. Many boat wakes can also be seen, some of which extend for several miles (2).
Water Quality in the Lake Winnebago Pool 9

TThhee lakes in the Winnebago Pool are all classified as shallow lakes. Typically, shallow lakes behave much differently than deeper water lakes that we may be accustomed to seeing in Wisconsin. Shallow lakes are generally characterized by depths less than 25 feet (7.6 m), large surface area to volume ratios, and frequent mixing. Our understanding of shallow lake dynamics is poor. Shallow lakes have typically been mismanaged in Wisconsin with the results being habitat and water quality degradation.
The diagram at the right shows a typical deep-water lake and the annual cycle of thermal stratification and overturn. Shallow lakes like Winnebago, Butte des Morts, Poygan, and Winneconne are consistently mixed and resemble, year-round, the spring or fall overturn phases that deep-water lakes progress through. Credit: Figure from G. Tyler Miller's Living in the Environment, 13th edition. Brooks/Cole Publishing, Thompson Learning.
SShhaallllooww LLaakkeess
Lakes left to fluctuate naturally, without influence of a dam or other artificial water control structure, will go through a predictable sequence of water level conditions. Spring snowmelt raises water levels up to typically their highest levels of the year. Levels slowly recede through the summer months due to increased evaporation and lower precipitation amounts. Levels again begin to increase in the later fall and early winter months. Of course, fluctuations will occur throughout the year as rainy periods and dry spells occur but the general pattern is followed. Many lakes have water levels managed for boating or some other cultural need like power generation, resulting in artificially high summer levels. Dams located in Neenah and Menasha control the Winnebago Pool water levels. Built in the 1850's, the dams
Water Quality in the Lake Winnebago Pool 10

raised the water levels by about 2.5 feet initially and another 0.5 feet with subsequent modifications. On the Pool lakes the natural ecological balance is upset and the result is a loss of aquatic plant habitat and poor water clarity. This artificial water level management on shallow lakes is just one example of a management practice that can have detrimental impacts to habitat and water quality. The hydrograph below illustrates the water level management cycle currently in place on the Winnebago Pool and compares it to a lake without a water level control structure.
Winnebago Pool Hydrograph
0
0.5
1
1.5
2
2.5
3
3.5
Jan Feb Mar Apr May Jun Jul Aug Sep Oct Nov Dec
Stag
e (ft
.)
Current Natural
Jan Feb Mar Apr May Jun Jul Aug Sep Oct Nov Dec
Winds, even light winds, can easily create rough conditions on the lakes. The long fetches typical of the Pool lakes lead to frequent mixing of the lake water, which reduces the amount of time the lake water column is stratified. This mixing also stirs up bottom sediments and releases stored nutrients which feed algae blooms, both of which add up to decreased water clarity. Suspended sediment decreases the penetration of light into the water, which minimizes the growth of aquatic plants. Healthy aquatic plant communities have adapted to natural water level fluctuations. Water levels, if maintained for cultural uses such as navigation, take many of these plants out of the natural timing condition, the result being the inability for the plants to grow and reproduce. Wild rice and bulrush are good examples of this need for natural lake level fluctuation. Both plants are very sensitive to water level fluctuation timing and live in shallow water areas. Rice requires a specific water level during a critical growth phase called the floating leaf stage. Water levels too high or too low prevent growth and the end result is loss of wild rice beds. Bulrush seeds are another example. As the primary means of bulrush bed expansion, the seeds need exposure to heat and drying in order to germinate. In this case stable high levels retard seed germination and reduce rush habitat.
Water Quality in the Lake Winnebago Pool 11
A major consequence of reduced rooted plants, like bulrush and wild rice, is the creation of favorable conditions for algae growth. Algae compete with rooted aquatic plants for available light and nutrients. At one time the Pool lakes were plant dominated, but unnaturally high water levels have changed all that. When rooted plants are “upset”, the algae will take advantage of the nutrients and space now made available to them. With lake levels controlled by dams, algae are winning the battle of the plants in the Winnebago Pool. All the lakes now favor algae growth, and are considered to be algae dominated. The artificial management of water levels, especially high summer levels, has dramatically decreased the ecological quality of the Pool lakes. Cane beds on the Pool lakes continue to decline, water clarity is low, and wetland loss has been extreme. Wildlife and fish species diversity and abundance decreases—fewer teal, fewer pike, fewer shorebirds, greater turbidity, less balance. That is the story on the Winnebago Pool. Can that change? Yes, but only with a public willing to accept change when it comes to water level management. The lakes are like aquatic "gardens" and they will grow plants regardless of whether or not we have a good understanding of them. Managing for a healthy balance, based on understanding, is the challenge.
Definitions THERMAL STRATIFICATION—The vertical temperature stratification of a lake which consists of: (a) the upper layer, or Epilimnion, in which the water temperature is virtually uniform; (b) the middle layer, or Thermocline, in which there is a marked drop in temperature per unit of depth; and (c) the lowest stratum, or Hypolimnion, in which the temperature is again nearly uniform. OVERTURN—(1) The sinking of surface water and rise of bottom water in a lake or sea that results from changes in temperature that commonly occur in spring and fall. (2) One complete cycle of top to bottom mixing of previously stratified water masses. This phenomenon may occur in the spring or fall, or after storms, and results in uniformity of chemical and physical properties of water at all depths. EPILIMNION—The warm upper layer of a body of water with thermal stratification, which extends down from the surface to the Thermocline, which forms the boundary between the warmer upper layers of the emilimnion and the colder waters of the lower depths, or Hypolimnion. The epilimnion is less dense than the lower waters and is wind-circulated and essentially homothermous. THERMOCLINE—(1) The region in a thermally stratified body of water which separates warmer oxygen-rich surface water from cold oxygen-poor deep water and in which temperature decreases rapidly with depth. (2) A layer in a large body of water, such as a lake, that sharply separates regions differing in temperature, so that the temperature gradient across the layer is abrupt. (3) The intermediate summer or transition zone in lakes between the overlying Epilimnion and the underlying Hypolimnion, defined as that middle region of a thermally stratified lake or reservoir in which there is a rapid decrease in temperature with water depth. Typically, the temperature decrease reaches 1°C or more for each meter of descent (or equivalent to 0.55°F per foot). HYPOLIMNION—The lowermost, non-circulating layer of cold water in a thermally stratified lake or reservoir that lies below the Thermocline, remains perpetually cold and is usually deficient of oxygen. FETCH—(1) The distance traveled by waves in open water, from their point of origin to the point where they break. (2) The distance the wind blows over water or another homogeneous surface without appreciable change in direction. Definitions courtesy of the North American Lake Management Society (NALMS). www.nalms.org/glossary/glossary.htm
Water Quality in the Lake Winnebago Pool 12

MMoonnii oorriinngg RReessuull ss tt tt
TThhee DNR has monitored water quality in the Lake Winnebago Pool since 1979. This initial monitoring was done as part of a statewide lake monitoring effort that sampled nearly 600 lakes. A more consistent, thorough monitoring strategy did not begin until the late 1980’s on Lake Winnebago and the mid-1990’s on the remainder of the Pool. Of the Upriver lakes, Butte des Morts has been monitored the most extensively. Three sites were monitored for 5 to 7 years beginning in 1986 as part of a canvasback duck habitat study on shallow lakes. Another 7 sites were monitored in 1995, after the completion of the Terrell’s Island breakwall. Two sites have been monitored continuously since 1998. On Lakes Winneconne and Poygan, monitoring data has been collected consistently since 1998. Several other monitoring efforts have been undertaken on the Lakes over the years. Studies originating at the University of Wisconsin-Oshkosh, Lawrence University, and Ripon College have all collected water quality data. Additional water quality monitoring has been done through the department’s Self-Help Lake Monitoring Program, which relies on volunteers to collect the data. A more detailed review of the Self-Help Lake Monitoring Program and the data collected through it is located elsewhere in this report.
Water quality monitoring sites on the Winnebago Pool
ð
ð
ð
Oshkosh
Neenah
ðð
ðð ð
Lake Butte des Morts
Lake Winneconne
Lake Poygan
Lake Monitoring Sites Years of Collection First Year Winnebago 3 12 1989 Butte des Morts 2 8 1995 Winneconne 1 4 1998 Poygan 2 4 1998
Water Quality in the Lake Winnebago Pool 13
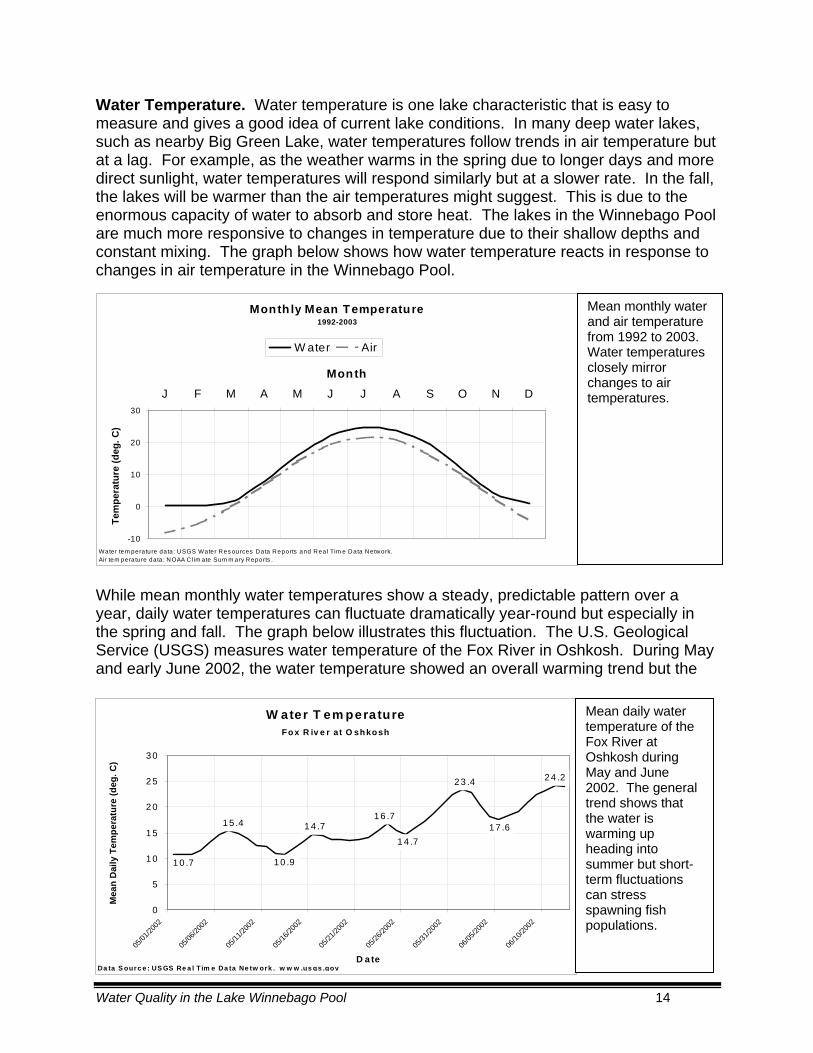
Water Temperature. Water temperature is one lake characteristic that is easy to measure and gives a good idea of current lake conditions. In many deep water lakes, such as nearby Big Green Lake, water temperatures follow trends in air temperature but at a lag. For example, as the weather warms in the spring due to longer days and more direct sunlight, water temperatures will respond similarly but at a slower rate. In the fall, the lakes will be warmer than the air temperatures might suggest. This is due to the enormous capacity of water to absorb and store heat. The lakes in the Winnebago Pool are much more responsive to changes in temperature due to their shallow depths and constant mixing. The graph below shows how water temperature reacts in response to changes in air temperature in the Winnebago Pool.
Month ly Mean Temperature1992-2003
-10
0
10
20
30
J F M A M J J A S O N D
Month
Tem
pera
ture
(deg
. C)
W ater Air
Water tem perature data: USGS Water Res ources Data Reports and Real Tim e Data Network.Air tem perature data: N OAA C lim ate Sum m ary Reports .
Mean monthly water and air temperature from 1992 to 2003. Water temperatures closely mirror changes to air temperatures.
While mean monthly water temperatures show a steady, predictable pattern over a year, daily water temperatures can fluctuate dramatically year-round but especially in the spring and fall. The graph below illustrates this fluctuation. The U.S. Geological Service (USGS) measures water temperature of the Fox River in Oshkosh. During May and early June 2002, the water temperature showed an overall warming trend but the
W ater T em peratureFox R iv e r at O shkosh
1 0 .7
1 5 .4
1 0 .9
1 4 .7 1 7 .6
2 4 .2
1 6 .7
1 4 .7
2 3 .4
0
5
1 0
1 5
2 0
2 5
3 0
05/01
/2002
05/06
/2002
05/11
/2002
05/16
/2002
05/21
/2002
05/26
/2002
05/31
/2002
06/05
/2002
06/10
/2002
D a te
Mea
n D
aily
Tem
pera
ture
(deg
. C)
Da ta S ourc e : US GS Re a l T im e Da ta Ne tw ork . w w w .us gs .gov
Mean daily water temperature of the Fox River at Oshkosh during May and June 2002. The general trend shows that the water is warming up heading into summer but short-term fluctuations can stress spawning fish populations.
Water Quality in the Lake Winnebago Pool 14

water underwent warm ups and cool downs that changed the mean water temperature by as much as 7 or 8 degrees Celsius (12-14 degrees Fahrenheit) in less than a week’s time. These fluctuations can stress fish that are attempting to or have just completed spawning. This period of 2002 saw a large die-off of post-spawn white bass, which can be partially attributed to these large fluctuations of water temperature. Over the course of an entire summer, the temperature varies by a few degrees but stays relatively stable. This can be seen in the graph below that charts water temperature from June through the middle of September 2002. By the end of June, the water temperature was above 25 degrees Celsius (77 degrees Fahrenheit) and stayed between there and 30 degrees Celsius (86 degrees Fahrenheit) until the middle of August.
W a te r T e m p e ra tu re F o x R iv e r a t O s h k o s h
0
5
1 0
1 5
2 0
2 5
3 0
3 5
06/15
/2002
06/25
/2002
07/05
/2002
07/15
/2002
07/25
/2002
08/04
/2002
08/14
/2002
08/24
/2002
09/03
/2002
09/13
/2002
D a te
Mea
n D
aily
Tem
pera
ture
(deg
. C)
D a ta S o u r c e : U S GS R e a l T im e D a ta N e tw o r k . w w w .u s g s .g o v
Mean daily water temperatures of the Fox River in Oshkosh between June and September 2002. Prolonged periods of warm or cool weather can affect water temperature by as much as several degrees Celsius.
While the USGS measures water temperature daily at its monitoring station on the Fox River in Oshkosh, the data collected by the DNR during water quality monitoring is much sparser. Water temperature readings are collected at every half-meter of depth from the surface to the bottom at each monitoring station. Since all of the lakes in the Pool are shallow, temperature does not change much from the surface to the bottom. This is due to the constant mixing of the water column due to wind and wave action. In deeper lakes, the temperature can be significantly cooler at the bottom as compared to the surface.
Sum m er T em perature ProfileLake Winne bago, O shkosh
0
1
2
3
4
5
0 10 20 30 40Te m pe rature (de g . C)
Dep
th (m
)
Lake
Lake Bottom
Typical summer temperature profile from the Oshkosh sampling location on Lake Winnebago. Data was compiled between 1989 and 2001. The top of the chart represents the surface of the lake while the bottom of the chart represents the lake bottom. The other lakes in the Pool show similar patterns.
Water Quality in the Lake Winnebago Pool 15

A statistical analysis of the summer temperature data collected by the DNR shows that a trend of increasing water temperatures is present on Lake Winnebago. The other lakes in the Pool lack an adequate amount of data for a statistical analysis. The data indicate that average summer water temperatures are increasing by slightly more than half a degree Celsius (1-degree Fahrenheit) each year. An analysis of the water temperature data collected by the USGS indicates an increase of approximately 0.3 degrees Celsius per year (0.5 degrees Fahrenheit). This discrepancy in the analysis between the two sets of data can be easily explained. The USGS data is collected everyday by an automated sampling device. The DNR data is collected only three or four times a month and in some years, only once a month and therefore is less likely to reflect the true monthly mean temperature. The USGS data, shown in the graph below, is a more reliable data source.
Mean Summer Water Temperature Fox River at Oshkosh
0 5
10 15 20 25 30
Mea
n Te
mpe
ratu
re
92 93 94 95 96 97 98 99 00 01
Calculated from daily mean water temperatures recorded on Fox River at Oshkosh with Acoustical Velocity Meter (AVM) system. Transducer is located at Latitude 44°00'49", Longitude 88°32'27".
Summer water temperatures of the Fox River at Oshkosh. Data collected from the USGS Acoustical Velocity Meter. Daily mean temperatures from June 15 through September 15 were used to calculate mean temperatures for each year. The dashed line signifies the statistically significant trend of increasing water temperatures.
The statistically significant warming trend should be viewed with caution. When dealing with a relatively short time frame, in this case 12 years, any abnormally high or low years could influence the statistical results. With summer water temperatures, 1992 was an unusually cool year while 2002 was fairly warm. If the data from these two years was removed from the analysis, the significant warming trend disappears. Many more years of data would be needed to accurately identify an actual warming trend. The observed increase of summer water temperatures may not seem to be that great, but even these small increase can have dramatic effects over time. The composition of fish communities may change, duration and severity of algal blooms could increase, aquatic plant communities could shift to more southern-type species, and invasive species could find it easier to invade the Pool. More discussion on potential changes to the Winnebago Pool ecosystem due to climate affects can be found in a later section of this report.
Water Quality in the Lake Winnebago Pool 16
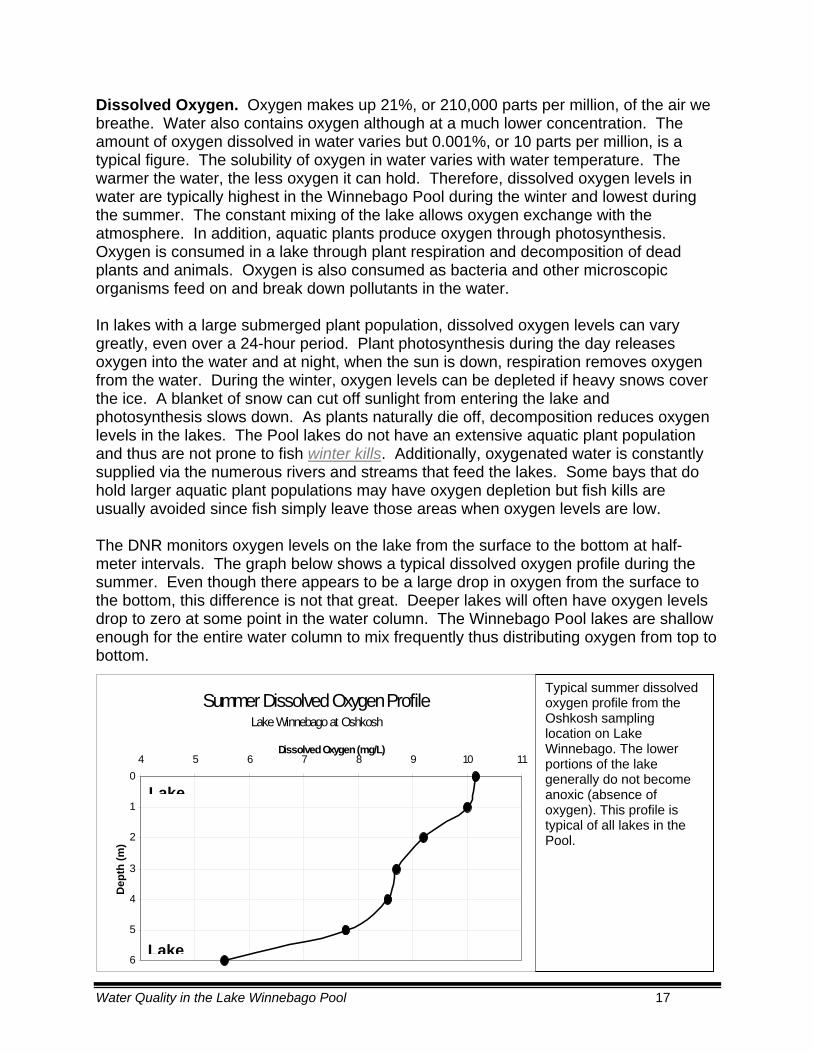
Dissolved Oxygen. Oxygen makes up 21%, or 210,000 parts per million, of the air we breathe. Water also contains oxygen although at a much lower concentration. The amount of oxygen dissolved in water varies but 0.001%, or 10 parts per million, is a typical figure. The solubility of oxygen in water varies with water temperature. The warmer the water, the less oxygen it can hold. Therefore, dissolved oxygen levels in water are typically highest in the Winnebago Pool during the winter and lowest during the summer. The constant mixing of the lake allows oxygen exchange with the atmosphere. In addition, aquatic plants produce oxygen through photosynthesis. Oxygen is consumed in a lake through plant respiration and decomposition of dead plants and animals. Oxygen is also consumed as bacteria and other microscopic organisms feed on and break down pollutants in the water. In lakes with a large submerged plant population, dissolved oxygen levels can vary greatly, even over a 24-hour period. Plant photosynthesis during the day releases oxygen into the water and at night, when the sun is down, respiration removes oxygen from the water. During the winter, oxygen levels can be depleted if heavy snows cover the ice. A blanket of snow can cut off sunlight from entering the lake and photosynthesis slows down. As plants naturally die off, decomposition reduces oxygen levels in the lakes. The Pool lakes do not have an extensive aquatic plant population and thus are not prone to fish winter kills. Additionally, oxygenated water is constantly supplied via the numerous rivers and streams that feed the lakes. Some bays that do hold larger aquatic plant populations may have oxygen depletion but fish kills are usually avoided since fish simply leave those areas when oxygen levels are low. The DNR monitors oxygen levels on the lake from the surface to the bottom at half-meter intervals. The graph below shows a typical dissolved oxygen profile during the summer. Even though there appears to be a large drop in oxygen from the surface to the bottom, this difference is not that great. Deeper lakes will often have oxygen levels drop to zero at some point in the water column. The Winnebago Pool lakes are shallow enough for the entire water column to mix frequently thus distributing oxygen from top to bottom.
Typical summer dissolved oxygen profile from the Oshkosh sampling location on Lake Winnebago. The lower
ns of the lake generally do not become anoxic (absence of oxygen). This profile is typical of all lakes in the Pool.
portio
Summer Dissolved Oxygen ProfileLake Winnebago at Oshkosh
0
1
2
3
4
5
6
4 5 6 7 8 9 10 11Dissolved Oxygen (mg/L)
Dep
th (m
)
Lake
Lake
Water Quality in the Lake Winnebago Pool 17

An analysis of the dissolved oxygen data collected by the DNR does not show any statistically significant trends with respect to long term changes in dissolved oxygen levels. Water clarity. A secchi (sek-ē) disk is used to monitor how clear the water is. A black and white disk is lowered into the water to the point where it can no longer be seen. The distance from the water surface to the disk at this point is recorded as the secchi reading. If the distance is small between the water surface and the point where the secchi disk disappears, it usually indicates that there is a lot of turbidity in the water. This turbidity may come from sediment suspended by wind or boat action or from algae suspended in the water. In general, water clarity is best during the winter because the cold water and ice prevent algal blooms and sediment resuspension. Clarity slowly decreases through spring and early summer and is usually worst in late summer when water temperatures are at their highest, algal blooms are occurring, and winds are light. Clarity can be quite variable in a lake from day-to-day or even at different locations on the same day, especially on lakes as dynamic as the Winnebago Pool.
Drawing of a secchi disk. The disk is typically 6 to 10 inches in diameter and is painted in a black and white alternating pattern. Suspended from a line, the disk is lowered into the water to measure water clarity.
On Lake Winnebago, secchi data indicates that summer water clarity has not changed significantly over the last 12 years at any of the three sampling sites. The north end of the lake does seem to be a bit clearer than the rest of the lake at many times of the year. Poorer clarity at the other sample locations is probably due to the influence of the Fond du Lac River near Fond du Lac and the Fox River near Oshkosh. These rivers tend to bring in loads of suspended sediments and possibly more organic matter which may act as food for algae. While water clarity is a good indicator of water quality, it is essential to have an adequate number of readings during all four seasons to get a true idea of the water quality. There simply has not been enough water clarity data collected by the DNR to get a clear picture of whether clarity is increasing in the Pool. Anecdotal evidence suggests that clarity is increasing. Lake users have reported excellent water clarity during several recent winters and clearer water later into the Spring. A more complete monitoring program is needed to document this phenomenon.
Water Quality in the Lake Winnebago Pool 18
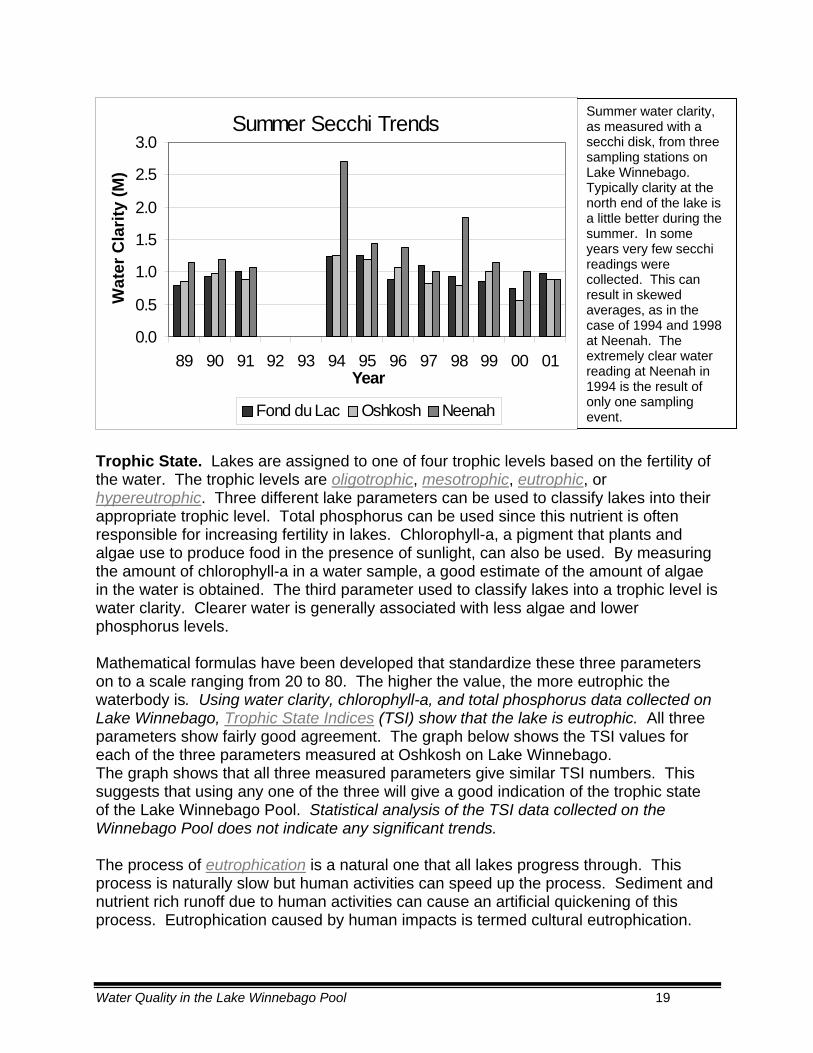
Summer Secchi Trends
0.0
0.5
1.0
1.5
2.0
2.5
3.0
89 90 91 92 93 94 95 96 97 98 99 00 01Year
Wat
er C
larit
y (M
)
Fond du Lac Oshkosh Neenah
Summer water clarity, as measured with a secchi disk, from three sampling stations on Lake Winnebago. Typically clarity at the north end of the lake is a little better during the summer. In some years very few secchi readings were collected. This can result in skewed averages, as in the case of 1994 and 1998 at Neenah. The extremely clear water reading at Neenah in 1994 is the result of only one sampling event.
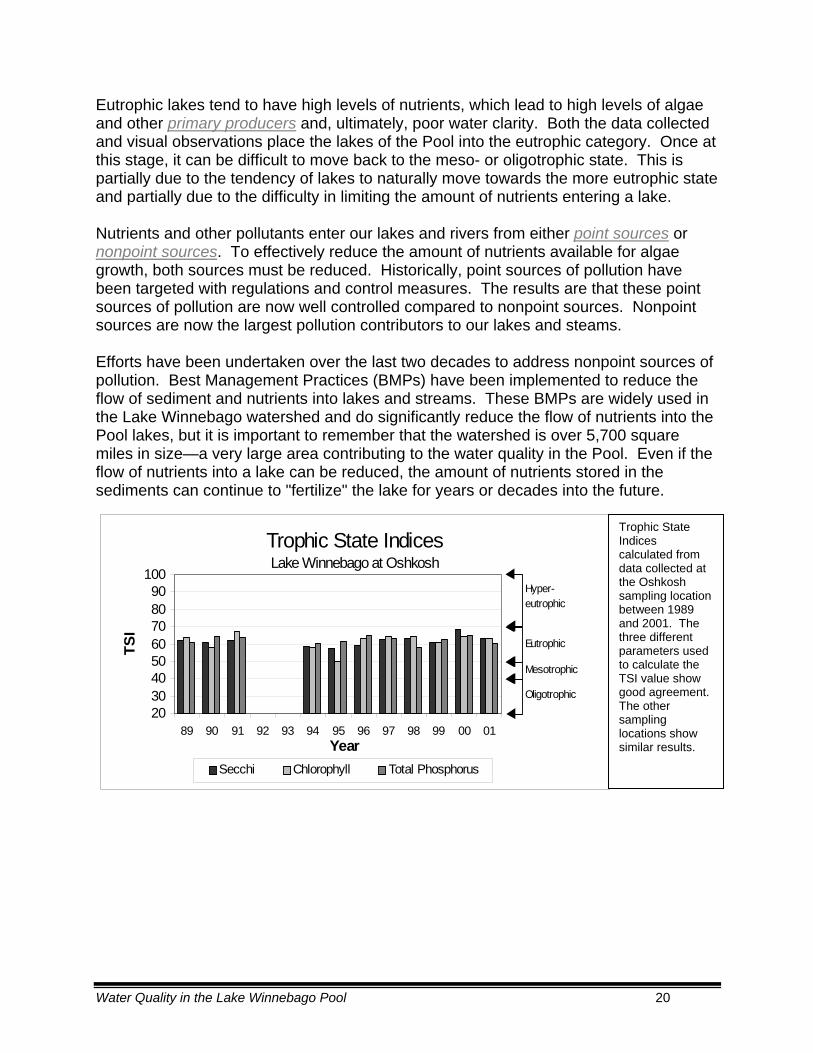
Trophic State. Lakes are assigned to one of four trophic levels based on the fertility of the water. The trophic levels are oligotrophic, mesotrophic, eutrophic, or hypereutrophic. Three different lake parameters can be used to classify lakes into their appropriate trophic level. Total phosphorus can be used since this nutrient is often responsible for increasing fertility in lakes. Chlorophyll-a, a pigment that plants and algae use to produce food in the presence of sunlight, can also be used. By measuring the amount of chlorophyll-a in a water sample, a good estimate of the amount of algae in the water is obtained. The third parameter used to classify lakes into a trophic level is water clarity. Clearer water is generally associated with less algae and lower phosphorus levels. Mathematical formulas have been developed that standardize these three parameters on to a scale ranging from 20 to 80. The higher the value, the more eutrophic the waterbody is. Using water clarity, chlorophyll-a, and total phosphorus data collected on Lake Winnebago, Trophic State Indices (TSI) show that the lake is eutrophic. All three parameters show fairly good agreement. The graph below shows the TSI values for each of the three parameters measured at Oshkosh on Lake Winnebago. The graph shows that all three measured parameters give similar TSI numbers. This suggests that using any one of the three will give a good indication of the trophic state of the Lake Winnebago Pool. Statistical analysis of the TSI data collected on the Winnebago Pool does not indicate any significant trends. The process of eutrophication is a natural one that all lakes progress through. This process is naturally slow but human activities can speed up the process. Sediment and nutrient rich runoff due to human activities can cause an artificial quickening of this process. Eutrophication caused by human impacts is termed cultural eutrophication.
Water Quality in the Lake Winnebago Pool 19
Eutrophic lakes tend to have high levels of nutrients, which lead to high levels of algae and other primary producers and, ultimately, poor water clarity. Both the data collected and visual observations place the lakes of the Pool into the eutrophic category. Once at this stage, it can be difficult to move back to the meso- or oligotrophic state. This is partially due to the tendency of lakes to naturally move towards the more eutrophic state and partially due to the difficulty in limiting the amount of nutrients entering a lake. Nutrients and other pollutants enter our lakes and rivers from either point sources or nonpoint sources. To effectively reduce the amount of nutrients available for algae growth, both sources must be reduced. Historically, point sources of pollution have been targeted with regulations and control measures. The results are that these point sources of pollution are now well controlled compared to nonpoint sources. Nonpoint sources are now the largest pollution contributors to our lakes and steams. Efforts have been undertaken over the last two decades to address nonpoint sources of pollution. Best Management Practices (BMPs) have been implemented to reduce the flow of sediment and nutrients into lakes and streams. These BMPs are widely used in the Lake Winnebago watershed and do significantly reduce the flow of nutrients into the Pool lakes, but it is important to remember that the watershed is over 5,700 square miles in size—a very large area contributing to the water quality in the Pool. Even if the flow of nutrients into a lake can be reduced, the amount of nutrients stored in the sediments can continue to "fertilize" the lake for years or decades into the future.
Trophic State IndicesLake Winnebago at Oshkosh
2030405060708090
100
89 90 91 92 93 94 95 96 97 98 99 00 01Year
TSI
Secchi Chlorophyll Total Phosphorus
Oligotrophic
Hyper-eutrophic
Eutrophic
Mesotrophic
Trophic State Indices calculated from data collected at the Oshkosh sampling location between 1989 and 2001. The three different parameters used to calculate the TSI value show good agreement. The other sampling locations show similar results.
Water Quality in the Lake Winnebago Pool 20

EUTROPHIC—Body of water characterized by laresulting in high productivity. Such waters are oftSlightly or moderately eutrophic water can be heHowever, such waters are generally undesirable EUTROPHICATION—The process of enrichmenrange from Oligotrophic water (maximum transpaMesotrophic, Eutrophic, to Hypereutrophic waterphosphorus). Eutrophication of a lake normally cto dry land. Eutrophication may be accelerated b HYPEREUTROPHIC—Body of water characterizproductivity. Such waters are often shallow, with moderately eutrophic water can be healthful andwaters are generally undesirable for drinking wat MESOTROPHIC—Body of water characterized bphosphorous and resulting in significant productiof oxygen deficiency. Slightly or moderately eutroand animal life. However, such waters are gener NON-POINT SOURCE (NPS) POLLUTION—Polocation. These are forms of diffuse pollution cauoriginating from land use activities, which are carsource pollution, means any water contaminationpollution, by contrast, is contamination that occurcity streets, or suburban backyards. As this runofpollutants such as nutrients and pesticides. Somrecharge) the groundwater below. The rest of theand coastal waters. Originating from numerous sand hard to pinpoint. Compared with point sourceestimated that non-point source pollution accountoday. OLIGOTROPHIC—Body of water characterized phosphorous and resulting in very moderate prodconsequently poor areas for the development of with sandy bottoms and very limited plant growthstages in the life cycle of a lake. POINT SOURCE (PS) POLLUTION—Pollutants channels, sewers, tunnels, and containers of var PRIMARY PRODUCERS—Plants at the base ofother organisms in the food chain. The food and TROPHIC STATE INDEX (TSI)—A measure of Eof water transparency or turbidity (using Secchi Dphosphorus levels. TSI measures range from a sminimum chlorophyll-a, minimum phosphorus) thtransparency, maximum chlorophyll-a, maximum WINTER KILL—The complete or partial kill of fisprolonged periods of ice and snow cover. The kildiminished dissolved oxygen due to a lack of phoorganic matter; the production of harmful chemicanaerobic decomposition; and the harmful influen Definitions courtesy of the North American Lake Ma
Water Quality in the Lake Winnebago Pool
Definitions rge nutrient concentrations such as nitrogen and phosphorous and en shallow, with algal blooms and periods of oxygen deficiency. althful and support a complex web of plant and animal life. for drinking water and other needs.
t of water bodies by nutrients. Degrees of Eutrophication typically rency, minimum chlorophyll-a, minimum phosphorus) through
(minimum transparency, maximum chlorophyll-a, maximum ontributes to its slow evolution into a Bog or Marsh and ultimately y human activities and thereby speed up the aging process.
ed by excessive nutrient concentrations and resulting in high algal blooms and periods of oxygen deficiency. Slightly or support a complex web of plant and animal life. However, such er and other needs.
y moderate nutrient concentrations such as nitrogen and vity. Such waters are often shallow, with algal blooms and periods phic water can be healthful and support a complex web of plant
ally undesirable for drinking water and other needs.
llution discharged over a wide land area, not from one specific sed by sediment, nutrients, organic and toxic substances ried to lakes and streams by surface runoff. Technically, non-point that does not originate from a "point source." Non-point source s when rainwater, snowmelt, or irrigation washes off plowed fields, f moves across the land surface, it picks up soil particles and e of the polluted runoff infiltrates into the soil to contaminate (and runoff deposits the soil and pollutants in rivers, lakes, wetlands, mall sources, non-point source pollution is widespread, dispersed, pollution, it is diffuse and difficult to control or prevent. It has been
ts for more than one-half of the water pollution in the United States
by extremely low nutrient concentrations such as nitrogen and uctivity. Oligotrophic lakes are those low in nutrient materials and
extensive aquatic floras and faunas. Such lakes are often deep, , but with high dissolved-oxygen levels. This represents the early
discharged from any identifiable point, including pipes, ditches, ious types.
a food chain. They produce food and energy that is used by all energy is produced through photosynthesis.
utrophication of a body of water using a combination of measures isk depth recordings), Chlorophyll-a concentrations, and total cale 20-80 and from Oligotrophic waters (maximum transparency, rough Mesotrophic, Eutrophic, to Hypereutrophic waters (minimum phosphorus).
h and other animals in a body of water, usually occurring during l can be attributed to a number of circumstances including tosynthesis; the depletion of dissolved oxygen by decomposing
als (e.g., ammonia, hydrogen sulfide, and ethanes) resulting from ce of insecticides and herbicides.
nagement Society (NALMS). www.nalms.org
21
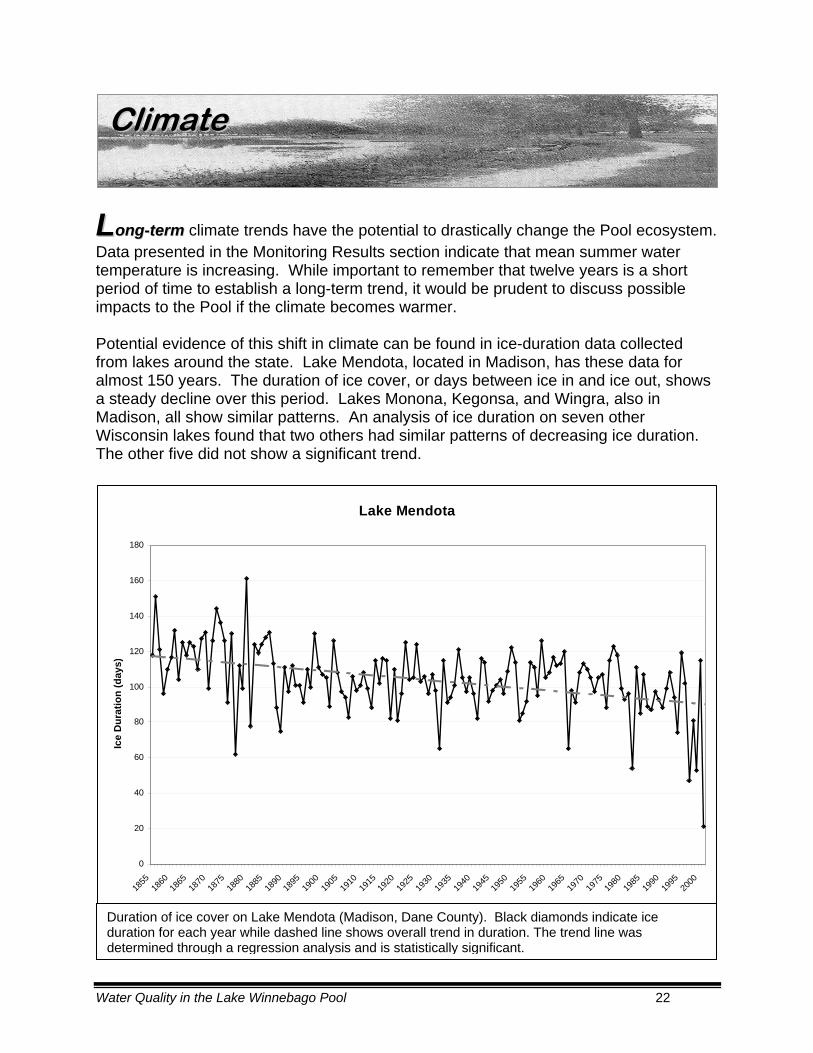
CClliimmaa ee tt
LLoonngg--tteerrmm climate trends have the potential to drastically change the Pool ecosystem. Data presented in the Monitoring Results section indicate that mean summer water temperature is increasing. While important to remember that twelve years is a short period of time to establish a long-term trend, it would be prudent to discuss possible impacts to the Pool if the climate becomes warmer. Potential evidence of this shift in climate can be found in ice-duration data collected from lakes around the state. Lake Mendota, located in Madison, has these data for almost 150 years. The duration of ice cover, or days between ice in and ice out, shows a steady decline over this period. Lakes Monona, Kegonsa, and Wingra, also in Madison, all show similar patterns. An analysis of ice duration on seven other Wisconsin lakes found that two others had similar patterns of decreasing ice duration. The other five did not show a significant trend.
Lake Mendota
0
20
40
60
80
100
120
140
160
180
1855
1860
1865
1870
1875
1880
1885
1890
1895
1900
1905
1910
1915
1920
1925
1930
1935
1940
1945
1950
1955
1960
1965
1970
1975
1980
1985
1990
1995
2000
Ice
Dur
atio
n (d
ays)
Duration of ice cover on Lake Mendota (Madison, Dane County). Black diamonds indicate ice duration for each year while dashed line shows overall trend in duration. The trend line was determined through a regression analysis and is statistically significant.
Water Quality in the Lake Winnebago Pool 22

These mixed results do not conclusively point to a shift in climate conditions but do provide examples of lakes in our state that may be affected by climate. It is important to realize that climate may not be the only factor influencing the shortened ice season on the lakes around Madison. Urbanization or other watershed impacts may also be playing a role. Lakes by themselves are complex ecosystems but the added impact of human-related activities makes them even more so. With a warmer climate, fish species that tolerate warmer water temperatures, like members of the bass and panfish family (centrarchids), may thrive and outcompete those species needing cooler water temperatures, like walleye (percids). Aquatic plant communities may also shift to include more warm-water species. As the ecosystem shifts in terms of species composition, invasive species may find an easier time finding a foothold in the Pool. A warmer climate may also result in reduced water levels as more moisture evaporates due to the warmer temperatures and reduced periods of ice cover. Experts predict that extreme weather events—droughts, floods, storms—will be more frequent and more intense. A host of other potential impacts are possible but will only be known for sure with more research and time. For more information on global warming and possible climate changes, you can visit one of the following web pages. Union of Concerned Scientists (UCS) http://www.ucsusa.org/global_environment/global_warming/index.cfm UCS, Wisconsin specific information http://www.ucsusa.org/greatlakes/pdf/wisconsin.pdf (Adobe Acrobat Reader needed to view this link) UCS, page of global warming related links http://www.ucsusa.org/global_environment/global_warming/page.cfm?pageID=546
Water Quality in the Lake Winnebago Pool 23

TThhee fish community that inhabits the Winnebago Pool is dependent on water quality conditions. The generally eutrophic (turbid, high-nutrient) conditions support a warm water sport fish community. Walleye (Stizostedion vitreum vitreum) are one of the most abundant game fish species and the Winnebago Pool is widely recognized as having one of the best walleye fisheries in the United States. Another unique feature of the Pool is the presence of the largest self-sustaining population of lake sturgeon (Acipenser fulvescens) in the world. With a population estimated at about 40,000 adults, lake sturgeon are harvested annually through a special spearing season each February. In terms of sheer numbers, freshwater drum, locally known as sheephead (Aplodinotus grunniens) dominate the Pool. The population is conservatively estimated at 30 million fish. The white bass (Morone chrysops), the most abundant game fish, is also highly prized by anglers.
Credits: Walleye—DNR image by Virgil Beck. Lake Sturgeon—DNR image by Virgil Beck. Freshwater Drum—U.S. Fish and Wildlife Service image by Duane Raver. White bass—U.S. Fish and Wildlife Service image by Duane Raver
Freshwater Drum (Aplodinotus grunniens) White Bass (Morone chrysops)
Lake Sturgeon (Acipenser fulvescens) Walleye (Stizostedion vitreum vitreum)
FFiisshh
The entire Winnebago Pool, including the Upper Fox and Wolf Rivers, is important for the fish community. Many of the fish species that reside in the lakes make their way up the Fox, Wolf, and other tributary rivers for spawning. Extensive spawning areas on or adjacent to the Wolf are extremely important for walleye, sturgeon, and white bass. Much money and effort is directed at protecting and enhancing the spawning grounds for walleye and sturgeon.
Water Quality in the Lake Winnebago Pool 24

The Pool hosts approximately 50 fishing tournaments each year and this number continues to grow. A majority of the tournaments target walleye although the number of bass tournaments is increasing. Since water quality changes in the Pool occur slowly over time, changes in the fish community will likewise occur slowly. Water quality changes will drive changes in the overall composition of the Pool’s fisheries. Species like freshwater drum, carp (Cyprinus carpio), and some sucker species prefer more turbid, nutrient-rich water and may decline if water quality improves. Increased water clarity would promote aquatic plant growth which would in turn favor those species, such as panfish, that prefer denser plant growth. Sauger (Stizostedion canadense) populations may continue to decline if water quality and clarity improve. The sauger competes with the walleye for food and does better under poorer water clarity conditions. Improved clarity would favor the walleye. It is important to remember that the Pool is very dynamic and year-to-year variations in conditions play a prominent role in fish populations. For example, Spring water levels in the Fox and Wolf basins are crucial to the spawning success of walleye, northern pike, and sturgeon. Several years of low water levels may do more to impact these populations in the short-term than would long-term water quality changes. Overall, the fish populations of the Winnebago Pool are healthy but it is important to recognize the impact that water quality and climate changes can and will have for the future. Proactively managing the Pool is crucial to maintaining the long-term health of the fish community. For more information on fish in Wisconsin, you can visit one of the following web pages. Wisconsin Sea Grant Fishes of Wisconsin Database at http://www.seagrant.wisc.edu/greatlakesfish/becker.html The Fish Identification Database at http://144.92.62.239/fish/ Wisconsin Sea Grant Fish page at http://www.seagrant.wisc.edu/fish.html The Wisconsin DNR Bureau of Fisheries Management and Habitat Protection page at http://www.dnr.state.wi.us/org/water/fhp/
Water Quality in the Lake Winnebago Pool 25

AAqquuaattiicc plants are an important part of a lake’s ecosystem. They play a major role in determining water quality and supporting the fish community. Think of them as the forest equivalent in the lake ecosystem. In the Winnebago Pool, aquatic plants are mostly confined to shoreline areas and bays. Most of the open water, middle portions of the lakes are without plant growth. The most prevalent in-lake plant species are water milfoil—both native (Myriophyllum spp.) and the invasive Eurasian (Myriophyllum spicatum), sago pondweed (Potamogeton pectinatus), common waterweed (Elodea elodea), water celery or eelgrass (Vallisneria americana), and the emergent canes or common reed (Phragmites australis). The wet fringe areas of the lakes are dominated by cattails (Typha spp.). Because diverse, dense stands of aquatic plants are relatively uncommon in the Pool as a whole, those areas that do support plants need to be preserved and protected from detrimental forces. One effort at protection, undertaken jointly by the DNR and the University of Wisconsin—Oshkosh, identified almost 40 areas in the Upriver Lakes that are ecologically important yet sensitive to disturbance. The multimedia report seeks to increase public knowledge of the benefits of aquatic plants. More information on this project can be found in an appendix at the end of this report.
Credits: Elodea—© USDA, NRCS, 1997—Northeastern Wetlands Flora @ PLANTS Eurasian Watermilfoil—© USDA, NRCS, 1997—Northeastern Wetlands Flora @ PLANTS Sago Pondweed—No photo author. Giant Reed Grass—© USDA, NRCS, 1995—Midwestern Wetland Flora @ PLANTS Cattail—© James L. Reveal @ PLANTS Purple Loosestrife—U.S. Fish and Wildlife Service
Top Row: Common Waterweed or Elodea, Eurasian Watermilfoil, Sago Pondweed Bottom Row: Giant Reed Grass, Cattail, Purple Loosestrife
AAqquuaa iicc PPllaann ss tt tt
Water Quality in the Lake Winnebago Pool 26

Aquatic plants are a fragile component of a lake's ecosystem. Besides changes that can occur due to human disturbances, water quality can dramatically impact plant populations. Many plant species have evolved to live in specific water conditions. Changes in water depth, clarity, pH, salinity, or temperature can cause a species to die out of a specific area. When an area loses it native plants the delicate natural balance is upset which can result in changes to the entire ecosystem. Loss of native plants opens the door for other, perhaps invasive species to move in. Eurasian watermilfoil, purple loosestrife, and curly leaf pondweed (potamogeton crispus) are all exotic species that have gained strong footholds in the Pool. Additionally, the loss of native plants means that the nutrients in the water normally used by those plants are available to algae. This can lead to an increase in algae populations perhaps more severe algae blooms. More algae also means decreased water clarity which can then lead to further loss of aquatic plants due to this lack of light penetration. Historically, the Pool had much more emergent vegetation than it does now. Many areas of the Upriver lakes that are now open water were once covered with dense stands of sedges (Carex spp.), cattails, reed grass, and a host of other emergents. A water level increase in the mid-1850’s raised the water about 2.5 feet and since then the emergent vegetation has slowly been receding. This recession has been caused by the inability of the emergents to adapt to deeper water levels and the increased erosional energy of the water caused by wind and boat activity. Many areas of the Upriver lakes remain ringed by large areas of cattails, however recession is still occurring. Riparian property owners often line their shorelines with rock riprap in order to stop the erosion. While this does protect the natural vegetation of the area, it creates an artificial barrier that may inhibit fish movement into spawning areas or restrict movement of amphibians such as frogs and turtles. Newer construction methods or different materials are being used to try and reduce the negative impacts of riprap.
Left: Blue-winged teal on marsh near Winneconne, circa 1900. Photo Credit: Winneconne Historical Society Right: A family outing on Lake Butte des Morts, circa 1910. Photo Credit: Only Oshkosh photo pamphlet
Water Quality in the Lake Winnebago Pool 27

Aquatic Plant Classification Examples Benefits
Emergent Plants—plants with leaves that extend above water surface
Giant reed grass, reed canary grass, cattail, bulrush, sedges
Free-Floating Plants—plants that float freely on the water surface
Duckweed
Floating-Leaf Plants—plants with leaves that float on the water surface
American lotus, pond lily, water lily
Submersed Plants—plants with most of their leaves growing below the water surface
Eurasian watermilfoil, sago pondweed, wild celery, common waterweed
Improve water quality by absorbing nutrients that could otherwise fuel algal growth. Filter and breakdown some pollutants. Blunt wave action and reduce shoreline erosion. Roots trap sediment and keep it from re-suspending due to wave turbulence. Important food source for waterfowl and other animals. Nesting cover for many animals. Protects nests from predators. Spawning cover for fish. Provide a refuge from predators for small fish and zooplankton. Contribute to an aesthetically pleasing shoreline.
Source: Through the Looking Glass…A Field Guide to Aquatic Plants. © 1997 Wisconsin Lakes Partnership
For more information on aquatic plants, you can visit one of the following web pages. The Wisconsin DNR Aquatic Plant Management Program at http://www.dnr.state.wi.us/org/water/fhp/lakes/aquaplan.htm The North American Lake Management Society at http://www.nalms.org/glossary/wordlink/aqplants.htm The Center for Aquatic and Invasive Plants at http://aquat1.ifas.ufl.edu/ The United States Geologic Survey Midwestern Wetland Plants page at http://www.npwrc.usgs.gov/resource/othrdata/plntguid/plntguid.htm
Water Quality in the Lake Winnebago Pool 28
IInnvvaassiivvee SSppeecciieess
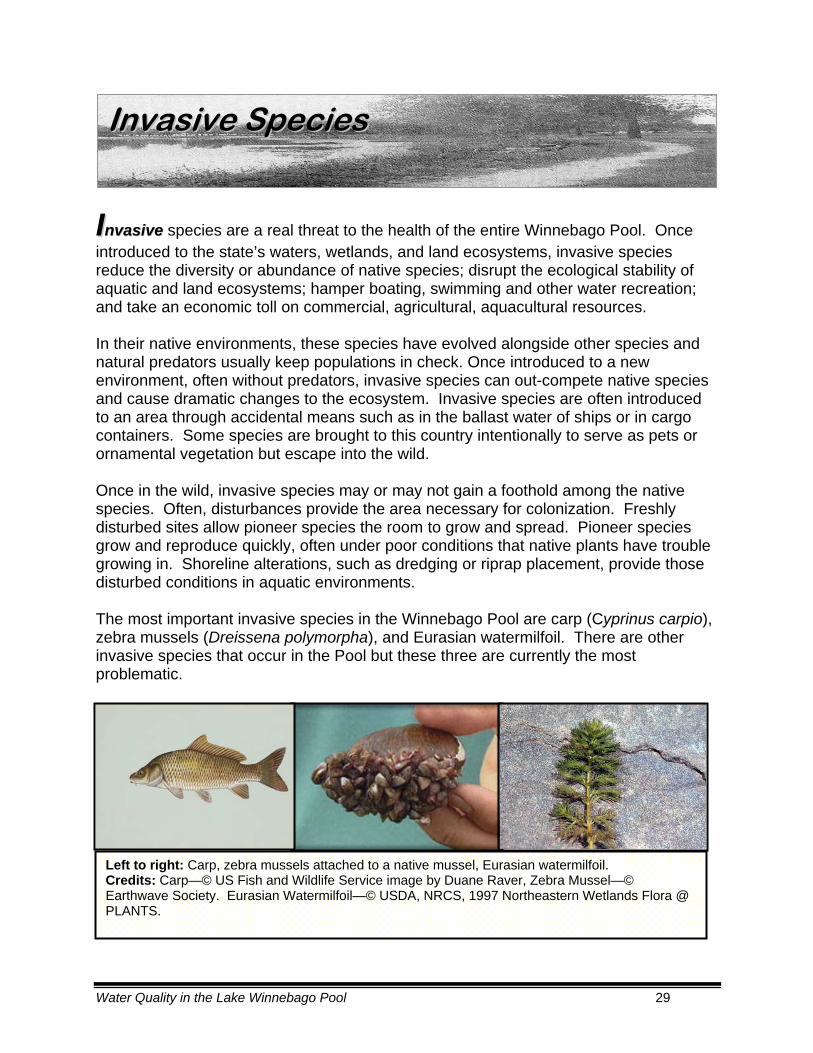
IInnvvaassiivvee species are a real threat to the health of the entire Winnebago Pool. Once introduced to the state’s waters, wetlands, and land ecosystems, invasive species reduce the diversity or abundance of native species; disrupt the ecological stability of aquatic and land ecosystems; hamper boating, swimming and other water recreation; and take an economic toll on commercial, agricultural, aquacultural resources. In their native environments, these species have evolved alongside other species and natural predators usually keep populations in check. Once introduced to a new environment, often without predators, invasive species can out-compete native species and cause dramatic changes to the ecosystem. Invasive species are often introduced to an area through accidental means such as in the ballast water of ships or in cargo containers. Some species are brought to this country intentionally to serve as pets or ornamental vegetation but escape into the wild. Once in the wild, invasive species may or may not gain a foothold among the native species. Often, disturbances provide the area necessary for colonization. Freshly disturbed sites allow pioneer species the room to grow and spread. Pioneer species grow and reproduce quickly, often under poor conditions that native plants have trouble growing in. Shoreline alterations, such as dredging or riprap placement, provide those disturbed conditions in aquatic environments. The most important invasive species in the Winnebago Pool are carp (Cyprinus carpio), zebra mussels (Dreissena polymorpha), and Eurasian watermilfoil. There are other invasive species that occur in the Pool but these three are currently the most problematic.
Left to right: Carp, zebra mussels attached to a native mussel, Eurasian watermilfoil. Credits: Carp—© US Fish and Wildlife Service image by Duane Raver, Zebra Mussel—© Earthwave Society. Eurasian Watermilfoil—© USDA, NRCS, 1997 Northeastern Wetlands Flora @ PLANTS.
Water Quality in the Lake Winnebago Pool 29

Carp, introduced to the U.S. from Asia to control aquatic plants, thrive in the Pool. As a bottom-feeding fish, carp uproot aquatic plants and stir up bottom sediment. Besides physically uprooting plants, the suspended sediment blocks sunlight and can, over time, result in the loss of other aquatic plants. These plants are used extensively by zooplankton and smaller fish as they seek refuge from larger predators. Plants also help stabilize the bottom and shoreline and reduce the impacts of wind or boat generated waves. With a loss of aquatic plants comes a change in the entire food web.
Reduce the Spread of Invasive Species
Thoroughly clean your fishing and diving gear, nets, and boats before you move from one lake to another. Remove plants and animals from boats and equipment. Drain water from motor, live well, bilge, and transom wells while on land before leaving the area. Empty your bait bucket on land upon leaving the water at the end of the day - do this before you leave the area. Do not release live bait into a body of water or release animals from one waterbody to another. Rinse the boat with a high-pressure sprayer or 104 degrees F water or allow the boat to dry for a period of at least 5 days before launching it into another waterbody. Remove suspicious material from fishing lines and downriggers, especially where the line meets the swivel, lure, and downrigger ball connection. Discard contaminated lines and nets that you can’t get clean.
Source: Great Lakes Sea Grant Extension Office at the Great Lakes Environmental Research Laboratory
Zebra mussels are a fairly recent invader of the Pool. First discovered in Lake Winnebago in 1998, they prefer to colonize hard substrates and filter large amounts of water. Zebra mussels are particularly troublesome when they attach to piers, water intake structures, boat hulls, or other artificial structures placed in the water. In addition, they pose a substantial health risk, as the shells are very sharp and can easily cut the feet of unsuspecting swimmers and waders. As filter feeders, zebra mussels are extremely efficient and remove vast amounts of algae from the water. This can create clearer water conditions but it also reduces the food source for zooplankton and young fish that depend on algae for early growth. Fortunately, the Pool lakes have a relatively small amount of the hard substrate preferred by zebra mussels, which would tend to limit their impact. However, recent surveys in Lake Erie have found that zebra mussels are colonizing sand and mud flats. Zebra mussels may also shift the typical nitrogen -phosphorus ratios of lakes, which could result in a reduction in the spring algal blooms but favors the growth of certain blue-green algae. These blue-green algae, some of which can cause skin rashes in humans and can be toxic to wildlife and pets, typically form blooms in late summer. Recent anecdotal evidence of increasing water clarity is sometimes attributed to the arrival of the zebra mussel. While zebra mussels may
Water Quality in the Lake Winnebago Pool 30

influence water clarity in very localized areas, it would be an injustice to give them all the credit for water clarity improvements in the Pool. Huge strides have been made throughout the entire watershed to reduce both point and nonpoint sources of pollution. Agricultural runoff, illegal oil and waste dumping, habitat degradation, and a host of other pollution sources have been identified and eliminated all across the watershed. Educational initiatives have raised citizen awareness and regulatory tools have been developed and implemented to address pollution concerns. Due to the very large and diverse nature of the watershed contributing to the Winnebago Pool, it is difficult to pinpoint exactly what is responsible for increased water clarity. No doubt, a combination of factors is responsible. Eurasian watermilfoil, a submerged aquatic plant, forms dense stands that grow to the water’s surface. Besides crowding out native plant species, Eurasian watermilfoil becomes a nuisance to lake users by entangling boat motor props and interfering with swimming and other water recreation. Mechanical harvesting is useful in controlling it throughout the growing season, but Eurasian watermilfoil spreads easily by fragments as small as a few inches long. In some cases, mechanical harvesting can do more harm than good by spreading the plants to new locations in a lake. Any control program should consider the potential inadvertent harm to native plants in the management of the exotic species. The potential is high for other invasive species to enter the Pool since the Fox River offers a direct conduit into the Great Lakes. Perhaps the species most likely to show up in the Winnebago Pool are the white perch (Morone americana) and the round goby (Neogobius melanostomus). These fish are small and could easily be transported into the Pool via bait buckets or live wells. A couple of zooplankton species, spiny waterflea (Bythotrephes cederstroemi.) and fishhook waterflea (Cercopagis pengoi) also have the potential to significantly affect the Pool. They are aggressive species that prey on native zooplankton. Additionally, they can cause nuisance accumulations on fishing line and poles. The sea lamprey (Petromyzon marinus), an invasive species found in the Great Lakes, may have a more difficult time entering the Pool from Lake Michigan. The series of locks and dams on the Fox River between Lake Winnebago and Green Bay offers a physical barrier to the movement of the lamprey since several of these locks have been closed for years and would need extensive repairs if they were to be opened again. Two native lamprey species, the silver lamprey (Ichthyomyzon unicuspis) and chestnut lamprey (Ichthyomyzon castaneus), are found in the Winnebago Pool and should not be confused with the larger sea lamprey. Like it or not, the invasive species already found in the Pool and those likely to appear in the future will undoubtedly influence the complex interactions of the Pool’s native species. Once established, eradication of invasive species is unlikely. Efforts are focused on controlling populations and preventing the spread through educational initiatives.
Water Quality in the Lake Winnebago Pool 31

Winnebago Pool Most Wanted If introduced, these invasive species that could provide the biggest future threat to the
Winnebago Pool
Clockwise from upper left: White perch, round goby, fishhook waterflea, spiny waterflea. Credits: White perch--Department of Fisheries and Oceans. Round goby—EPA. Spiny waterflea--J. Lindgren, Minnesota Department of Natural Resources. Fishhook waterflea—Dr. Igor A Grigorovich, University of Windsor
For more information on invasive species you can visit one of the following web pages. The Sea Grant Nonindigenous Species Site at http://www.sgnis.org/ The Wisconsin DNR Aquatic Invasive Species Program at http://www.dnr.state.wi.us/org/water/wm/glwsp/exotics/ The Invasive Plant Association of Wisconsin at http://www.uwex.edu/ces/ipaw/ The United States Geologic Survey Nonindigenous Aquatic Species page at http://nas.er.usgs.gov/ The NOAA Great Lakes Environmental Research Laboratory Nonindigenous Species Program at http://www.glerl.noaa.gov/res/Programs/nsmain.html
Water Quality in the Lake Winnebago Pool 32

SSeell HHeellpp LLaakkee MMoonnii oorriinngg ff-- tt
TThhee Self-Help Lake Monitoring program began in Wisconsin in 1986, relying on volunteers that to assist with collection of data on their lakes. These volunteers monitor water clarity, water chemistry, dissolved oxygen, and plants. The data is used by the DNR to supplement its own monitoring efforts. Since the Self-Help Monitoring program’s beginning, over 3,200 volunteers have collected data on over 1,000 lakes in Wisconsin. Self-help lake data has been collected on Lake Winnebago since 1996. Four sites on the lake have multiple years of data and another three sites have one year of data. The longest term of data collection is four years, collected on two different sites. Data collection on Lake Butte des Morts dates back to 1988. Two sites have been sampled, with one of the sites having seven years of data. Lake Poygan has two sample locations, one of them with five years of data dating back to 1991. Lake Winneconne only has data from two sites both of them sampled in 2000.
1986 1987 1988 1989 1990 1991 1992 1993 1994 1995 1996 1997 1998 1999 2000 2001 2002Winnebago Deep Hole-S. End
Sea BouyWendt's LandingMenashaSoutheastNorth EndBlack Wolf Point
Butte des Morts Site 1Site 2
Winneconne CentralSite B
Poygan Site 1Deep Hole
Table shows Self-Help Monitoring effort on the Winnebago Pool since 1986. Shaded in box indicates sampling occurred in that calendar year. Seven years (Site 1, Butte des Morts) is the longest stretch of monitoring. Five of the sites were only monitored for one year each.
A majority of the data collected on the Winnebago Pool is water clarity in the form of secchi depths, collected primarily during the spring, summer, and early fall months. While none of the sample sites have a long-term record of data collection, which would allow for an analysis of trends, the information is still useful for several reasons. First, the information is useful for comparative purposes. The DNR can compare the data it has collected with the data collected by the self-help volunteers to verify findings. The data comparisons also point out differences across different areas of the lakes, which highlight the variable nature of the system. A few of the self-help sampling sites have a large number of data points for a certain year. This is useful to give a clearer picture of
Water Quality in the Lake Winnebago Pool 33
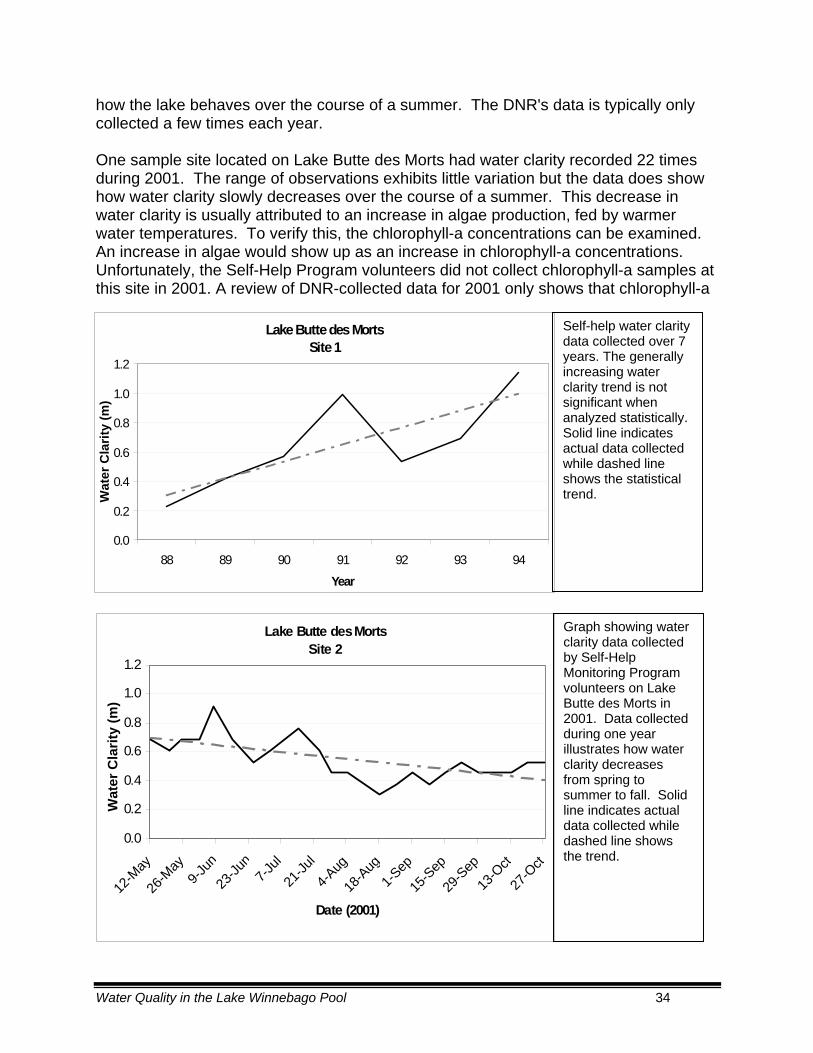
how the lake behaves over the course of a summer. The DNR's data is typically only collected a few times each year. One sample site located on Lake Butte des Morts had water clarity recorded 22 times during 2001. The range of observations exhibits little variation but the data does show how water clarity slowly decreases over the course of a summer. This decrease in water clarity is usually attributed to an increase in algae production, fed by warmer water temperatures. To verify this, the chlorophyll-a concentrations can be examined. An increase in algae would show up as an increase in chlorophyll-a concentrations. Unfortunately, the Self-Help Program volunteers did not collect chlorophyll-a samples at this site in 2001. A review of DNR-collected data for 2001 only shows that chlorophyll-a
Lake Butte des Morts Site 1
0.0
0.2
0.4
0.6
0.8
1.0
1.2
88 89 90 91 92 93 94
Year
Wat
er C
larit
y (m
)
Self-help water clarity data collected over 7 years. The generally increasing water clarity trend is not significant when analyzed statistically. Solid line indicates actual data collected while dashed line shows the statistical trend.
Lake Butte des MortsSite 2
0.0
0.2
0.4
0.6
0.8
1.0
1.2
12-M
ay
26-M
ay9-J
un
23-Ju
n7-J
ul
21-Ju
l
4-Aug
18-A
ug1-S
ep
15-S
ep
29-S
ep
13-O
ct
27-O
ct
Date (2001)
Wat
er C
larit
y (m
)
Graph showing water clarity data collected by Self-Help Monitoring Program volunteers on Lake Butte des Morts in 2001. Data collected during one year illustrates how water clarity decreases from spring to summer to fall. Solid line indicates actual data collected while dashed line shows the trend.
Water Quality in the Lake Winnebago Pool 34

was sampled three times on Lake Poygan. This information is not enough to correlate the decreasing water clarity to algae concentrations. As a new water quality monitoring strategy is developed for the Winnebago Pool, the Self-Help Monitoring Program volunteers will undoubtedly play a key role. It is imperative that the volunteers continue to collect their data throughout the Pool so that the data can be used to adequately supplement the DNR’s data collection efforts. It will only be through this combined monitoring effort that the true state of the Pool’s water quality will be determined. For more information on invasive species you can visit one of the following web pages. The DNR Self-Help Monitoring Program Site at http://dnr.wi.gov/org/water/fhp/lakes/selfhelp/index.htm The Secchi Dip-In Program, another volunteer water quality monitoring project, at http://dipin.kent.edu
Water Quality in the Lake Winnebago Pool 35

MMaannaaggeemmeenn AAcc iioonnss tt tt
NNooowww that the water quality status of the Lake Winnebago Pool has been discussed, attention should be turned to the future. Based on the monitoring results presented, it appears that the water quality appraisal effort undertaken by the DNR is not sufficient to adequately measure the true status of the lakes or identify trends. The actions suggested below are designed to enhance the knowledge of the Lake Winnebago Pool and provide a framework for identifying water quality goals for the future.
N
Action—Future Direction
Re-examine water quality objectives for the Pool as set by the WCMP. A concerted effort should be undertaken to review the WCMP water quality objectives, determine whether or not they have been met, compare them to the current data, and adjust attainment levels and target dates if necessary.
Much work went into the development of the WCMP and the objectives and recommendations should be continually evaluated for progress. Instead of "reinventing the wheel" and developing new objectives and goals, the WCMP should be used as a guideline for future actions.
Develop a long-range appraisal protocol. A concerted effort should be undertaken to
review the current water quality appraisal efforts and methods to determine whether or not the data collected can be used in evaluating the status of the WCMP water quality objectives.
If the current data collection efforts cannot adequately assess progress towards the water quality objectives, a targeted effort should be undertaken to design an appraisal protocol that will measure water quality in the Pool and integrate into the WCMP objectives.
Additional appraisal opportunities should also be examined in order to provide a complete picture of the ecosystem health. Use of fish community assessments, aquatic plant surveys, phytoplankton and zooplankton community assessments, and habitat surveys should be explored as potential appraisal tools. Any additional appraisal efforts should integrate with WCMP objectives and be designed to answer whether those objectives are being met.
The current appraisal protocol should be examined to minimize overlap with information gathered from other monitoring efforts—the Self Help program and the
Water Quality in the Lake Winnebago Pool 36

remote sensing initiative. Any changes should be designed to minimize collection effort while maximizing the quality of the data.
Review water level management strategies. Current water level management objectives should be examined carefully. Research on water level impacts on water quality should be reviewed to determine whether the current water level management regime is contributing to the goal of improved water quality. Keeping in mind other water level requirements, a new management strategy should be developed to integrate with the WCMP water quality objectives.
Action—Appraisal Strategy
Continue seasonal water quality appraisal of the Pool lakes. In the past two decades, data collection has included nutrients (phosphorus and nitrogen), suspended solids, temperature, dissolved oxygen, and pH. This data serves as a basic condition appraisal, a quality assurance reference for the remote sensing initiative, and contributes to the long-range evaluation of lake conditions.
Maintain continuous water quality monitoring station. The DNR currently deploys
one continuous monitoring station on Lake Winnebago that collects data on several different parameters at once. This multi-parameter sampler can be programmed to collect information at a variety of different time intervals and store the data in its internal memory. Every week or two someone needs to visit the station to download data and service the equipment as necessary. Efforts should be made to continue this practice and integrate the data collected into the overall appraisal effort on the Pool. Having a continuous series of data can be useful in examining how the Pool behaves on a day-to-day basis and can provide insight to changes that occur in response to storm or wind events.
Enhance the citizen volunteer monitoring network. The current Self-Help program is
sporadic in both the amount of data collected and the locations of data collection. Active recruitment and training of volunteers is essential in developing a long-term monitoring network that provides adequate coverage for all the lakes in the Pool. There are many dedicated citizens that would be interested in assisting with this monitoring effort. This source of help needs to be utilized.
Another potential source for monitoring could come from the numerous educational institutions around the lakes. Omro, Winneconne, Oshkosh, Fond du Lac, Neenah, Menasha, and Stockbridge all have high schools on or near the lakes. Educators from these schools should be invited to incorporate the lakes and their ecosystem into the curriculum. Higher educational institutions are also present in the Fox Valley area. UW Oshkosh, Marian College, Moraine Park Technical College, UW Fond du Lac, UW Fox Valley, Fox Valley Technical College, Lawrence University, and Ripon College are all in close proximity to the lakes. These institutions could be tapped for their expertise in studying any number of specific issues surrounding the lakes.
Water Quality in the Lake Winnebago Pool 37

Initiate algal appraisals. In coordination with area universities, create an algae
identification and enumeration program. The objective would be occasional algal surveys to provide resource managers, health professionals, and lake-users with up-to-date information on relative density and algae species composition, including blue-green algae.
Algae, especially during bloom conditions, can be more than a nuisance to lake users and shoreline property owners. Blue-green algae can contain toxins that affect wildlife and humans. Ducks or other wildlife species that ingest large quantities of blue-green algae have been known to die due to the buildup of the toxins. Swimmers and other lake users may occasionally develop skin rashes from blue-green algae exposure. Municipalities that draw drinking water from the lakes also have an interest in algal concentrations. Excessive amounts of algae can influence the taste and appearance of our drinking water and can put a strain on treatment.
Reconstruct the long-term trophic history of the lake. Paleolimnological sediment
coring has proven useful for many other lakes throughout the state in determining historical water quality conditions. Reconstructing the long-term trophic history of the Pool lakes would identify a target for water quality improvement. Unrealistic expectations of improvement can be eased and more realistic goals identified.
Action—Information and Education
Develop a Pool-wide web page. The site would promote education and awareness regarding the Pool's use and health. Information specific to the Pool lakes, including current water quality conditions, could be presented in a manner that would promote discussion and feedback from web users.
Linking the continuous monitoring station to the web page would enable viewers to see, in real-time, what conditions are like on the lakes. Developing multiple monitoring stations would give conditions across the Pool and allow the diverse nature of the Pool to be fully appreciated.
Explore the structure for an informal water quality forum. The purpose of a water
quality forum could be for interested parties to gather periodically to discuss the state of the Pool and get updates on any new information gathered.
Provide support for existing and future remote sensing initiatives. One objective of
the (Satellite Lakes Observatory Initiative—SLOI) Remote Sensing Monitoring Project is to develop a method to monitor water quality conditions without having to invest the time and money in actual on-lake effort. The frequency of the remote monitoring would add to the goal of providing current conditions to lake users. The information collected could be accessed through the Pool web page.
Water Quality in the Lake Winnebago Pool 38

The remote sensing initiative should not and cannot replace actual water quality monitoring but can be used to verify results and provide a more regional picture of water quality conditions.
Collect and disseminate information on invasive species. Literature and current
research should be reviewed to create a clearer picture on how invasive species affect water quality. Where applicable, Pool-specific research should be initiated. Routes of introduction should be identified and an information campaign developed to educate Pool users on the impacts of invasive species. Specific steps to reduce the potential for invasive species introduction could be posted at all Pool access points.
I thank the earth for feeding my body, I thank the sun for warming my bones, I thank the trees for the air I breathe,
And I thank the water for nourishing my soul. Leah Wolfsong
Water Quality in the Lake Winnebago Pool 39

A large number of communities dispose of treated wastewater effluent into the rivers and streams that feed the Pool lakes. The two major watersheds that drain into Lake Winnebago are the Upper Fox River Basin and the Wolf River Basin. Below is a list of municipal wastewater discharges with a Wisconsin Pollution Discharge Elimination System (WPDES) permit from the DNR. The numbers below are based on reported flows for the year 2000. Some of the discharges vary over the year so the number is an average value. There are a total of 62 permitted municipal wastewater discharges to the Lake Winnebago Pool averaging a total of 34.24 million gallons per day. An average of 2.87 billion gallons of water per day enters Lake Winnebago from the Fox River at Oshkosh. This amount includes the Upper Fox River, the Wolf River, and all of the smaller streams and rivers that enter the Upriver Lakes. The amount of wastewater discharged to the Pool equals slightly more than 1% of this total flow entering Lake Winnebago at Oshkosh.
Upper Fox River Basin WPDES Permitted Municipal Discharges Avg. Flow (million gallons per day)
1 Berlin Wastewater Treatment Facility 0.878 2 Butte des Morts Consolidated Sanitary District #1 0.080 3 Eden Wastewater Treatment Facility 0.181 4 Edison Estates Mobile Home Park Wastewater Treatment Facility 0.024 5 Fairwater Wastewater Treatment Facility 0.042 6 Fond du Lac Wastewater Treatment Facility 7.186 7 Friesland Wastewater Treatment Facility 0.008 8 Green Lake Sanitary District 0.080 9 Green Lake Wastewater Treatment Facility 0.193 10 Kingston Village 0.020 11 Markesan Wastewater Treatment Facility 0.307 12 Montello Wastewater Treatment Facility 0.154 13 Neshkoro Wastewater Treatment Facility 0.031 14 Oakfield Village Wastewater Treatment Facility 0.161 15 Omro Wastewater Treatment Facility 0.561 16 Oshkosh Wastewater Treatment Facility 12.032 17 Oxford Village Wastewater Treatment Facility 0.048 18 Pardeeville Wastewater Treatment Facility 0.276 19 Princeton Wastewater Treatment Facility 0.182 20 Ripon Wastewater Treatment Facility 1.676 21 Rosendale Wastewater Treatment Facility 0.111 22 Stockbridge Wastewater Treatment Facility 0.049 23 Westfield Wastewater Treatment Facility 0.220 24 Wisconsin Corp Seventh Day Adventist 0.014 Total per day discharge (million gallons) 24.511
AAppppeennddiixx:: WWaass eewwaa eerr DDiisscchhaarrggee tt tt
Water Quality in the Lake Winnebago Pool 40

Wolf River Basin WPDES Permitted Municipal Discharges Avg. Flow (million gallons per day)
1 Almond Wastewater Treatment Facility 0.027 2 Amherst Wastewater Treatment Facility 0.100 3 Bear Creek Wastewater Treatment Facility 0.048 4 Birnamwood Wastewater Treatment Facility 0.090 5 Black Creek Wastewater Treatment Facility 0.336 6 Bowler Wastewater Treatment Facility 0.022 7 Caroline Sanitary District #1 Wastewater Treatment Facility 0.020 8 Clintonville Wastewater Treatment Facility 0.611 9 Dale Sanitary District #1 Wastewater Treatment Facility 0.034 10 Embarrass/Cloverleaf Lake Wastewater Treatment Facility 0.102 11 Fremont Orihula Wolf River Joint Sanitary District 0.111 12 Gresham Wastewater Treatment Facility 0.077 13 Hortonville Wastewater Treatment Facility 0.251 14 Iola Wastewater Treatment Facility 0.135 15 Larsen Winchester Sanitary District Wastewater Treatment Facility 0.046 16 Manawa Wastewater Treatment Facility 0.166 17 Maple Lane Health Care Center Wastewater Treatment Facility 0.010 18 Marion Wastewater Treatment Facility 0.235 19 New London Wastewater Treatment Facility 1.211 20 Nichols Wastewater Treatment Facility 0.030 21 North Lake Poygan Sanitary District Wastewater Treatment Facility 0.033 22 Poy Sippi Sanitary District Wastewater Treatment Facility 0.037 23 Poygan Poy Sippi Sanitary District Wastewater Treatment Facility 0.037 24 Redgranite Wastewater Treatment Facility 0.167 25 Ridgeway Country Club Wastewater Treatment Facility 0.003 26 Scandinavia Wastewater Treatment Facility 0.060 27 Seymour Wastewater Treatment Facility 0.547 28 Shiocton Wastewater Treatment Facility 0.088 29 Silver Lake Sanitary District 0.507 30 Stephensville Sanitary District # 0.015 31 Tigerton Wastewater Treatment Facility 0.067 32 Waupaca Wastewater Treatment Facility 1.070 33 Weyauwega Wastewater Treatment Facility 0.423 34 White Lake, Village of 0.036 35 Wild Rose Wastewater Treatment Facility 0.080 36 Winneconne Wastewater Treatment Facility 0.451 37 Wittenberg Wastewater Treatment Facility 0.198 38 Wolf Treatment Plant 2.245 Total per day discharge (million gallons) 9.729
Water Quality in the Lake Winnebago Pool 41

AAppppeennddiixx:: SSeennssii iivvee AArreeaass tt
Sensitive areas, as defined in section NR107.05 (3)(i)(1.), Wisconsin Administrative Code, are areas of aquatic vegetation identified by the DNR as offering critical or unique fish and wildlife habitat, including seasonal or lifestage requirements, or offering water quality or erosion control benefits to the body of water. A study undertaken by the University of Wisconsin—Oshkosh and funded the Wisconsin DNR, examined the Upriver lakes and identified approximately 40 sensitive areas. These sensitive areas are critical in providing many of the functions listed above. The primary goal of the project was to develop a means to identify these sensitive areas and ecologically characterize them. One product of this project was the creation of a multimedia CD-ROM that provides much information about each site. For each site, the user can view aerial photos of the site, including historical photos that date back to the 1930’s; digital maps that identify land cover and use types; tables that list wetland plants; graphs and charts that detail fish populations, water quality, substrate type, and water depths. Photos and videos are also available for some sites.
Water Quality in the Lake Winnebago Pool 42