water quality conditions and restoration of submerged
TRANSCRIPT

W&M ScholarWorks W&M ScholarWorks
Reports
1-1-2005
Water Quality Conditions and Restoration of Submerged Aquatic Water Quality Conditions and Restoration of Submerged Aquatic
Vegetation (SAV) in the Tidal Freshwater James River: 2003-2004 Vegetation (SAV) in the Tidal Freshwater James River: 2003-2004
Ken Moore
Betty Neikirk Virginia Institute of Marine Science
Britt Anderson Virginia Institute of Marine Science
Jessie Campbell Virginia Institute of Marine Science
Follow this and additional works at: https://scholarworks.wm.edu/reports
Part of the Marine Biology Commons
Recommended Citation Recommended Citation Moore, K., Neikirk, B., Anderson, B., & Campbell, J. (2005) Water Quality Conditions and Restoration of Submerged Aquatic Vegetation (SAV) in the Tidal Freshwater James River: 2003-2004. Special Reports in Applied Marine Science and Ocean Engineering (SRAMSOE) No. 389. Virginia Institute of Marine Science, William & Mary. https://doi.org/10.21220/V51X7N
This Report is brought to you for free and open access by W&M ScholarWorks. It has been accepted for inclusion in Reports by an authorized administrator of W&M ScholarWorks. For more information, please contact [email protected].

WATER QUALITY CONDITIONS AND RESTORATION OF SUBMERGED AQUATIC VEGETATION (SAV) IN THE TIDAL
FRESHWATER JAMES RIVER: 2003-2004
Kenneth A. Moore, Betty Neikirk, Britt Anderson and Jessie Campbell
Special Report No. 389 in Applied Marine Science and Ocean Engineering
The Virginia Institute of Marine Science, College of William and Mary
Gloucester Point, Virginia 23062
Funded by:
HOPEWELL REGIONAL WASTEWATER TREATMENT FACILITY 231 Hummel Ross Road Hopewell, Virginia 23860
January 2005

i
TABLE OF CONTENTS LIST OF FIGURES ............................................................................................................. ii
LIST OF TABLES .............................................................................................................. iii
EXECUTIVE SUMMARY .................................................................................................v
1.0 INTRODUCTION .........................................................................................................1
1.1 Background and Objectives ...............................................................................1
2.0 METHODS ........................................................................................................2
2.1 Study Sites .........................................................................................................2
2.2 SAV Transplanting and Monitoring ..................................................................3
2.3 Water Quality Monitoring..................................................................................4
2.3.1 Fixed Station Monitoring ....................................................................4
2.3.2 Algal Condition and Water Color Assessments..................................4
2.3.3 Continuous Monitoring Using Dataflow Technology ........................7
3.0 RESULTS ......................................................................................................................8
3.1 Water Quality Monitoring..................................................................................8
3.1.1 Fixed Station Monitoring ....................................................................8
3.1.2 Algal Condition and Water Color Assessments................................12
3.1.3 Continuous Monitoring Using Dataflow Technology ......................15
3.2 Transplant Survival..............................................................................17 4.0 DISCUSSION AND CONCLUSIONS .......................................................................19
5.0 LITERATURE CITED ................................................................................................21
APPENDIX A TABLES ....................................................................................................22 APPENDIX B FIGURES ..................................................................................................26 * Cover Figure-Tar Bay Exclosure with SAV After Hurricane Isabell on 9/30/2003

ii
LIST OF FIGURES
(IN ORDER, APPENDIX A) Table 1. SAV Growing Season (April-October) Median Water Quality Table 2. Mean (March-May and July-September) Chlorophyll Concentrations at
SAV Transplant Sites for 2002, 2003, and 2004. Table 3. DATAFLOW Spatially Averaged 2004 Turbidity and Chlorophyll
Measurements for James River Tidal Freshwater Segments

iii
LIST OF FIGURES (IN ORDER, APPENDIX B)
Figure 1-1 Turkey Island Transplant Survivorship Figure 2-1 Location of SAV Transplant and Water Quality Monitoring Sites Figure 3-1 Water Temperature Figure 3-2 Conductivity Figure 3-3 Dissolved Oxygen Figure 3-4 pH Figure 3-5 Total Suspended Solids Figure 3-6 Phytoplankton as Chlorophyll a Figure 3-7 Secchi Depth Figure 3-8 Total Organic Carbon Figure 3-9 Total Kjeldahl Nitrogen Figure 3-10 Total Phosphorus Figure 3-11 Dissolved Nitrate + Nitrite Figure 3-12 Dissolved Ammonium Figure 3-13 Dissolved Inorganic Phosphate Figure 3-14 Munsell Color Category vs. Chlorophyll a Figure 3-15 High Angle Water Color Photography; May 4, 2004; Sunny Mid-Day;
Shade Side and Sun Side of Vessel Figure 3-16 High Angle Water Color Photography; April 6, 2004; Sunny Afternoon;
Shade Side and Sun Side of Vessel Figure 3-17 High Angle Water Color Photography; December 14, 2004; Sunny Mid-
Day, Shade Side and Sun Side of Vessel Figure 3-18 High Angle Water Color Photography; March 9, 2004; Cloudy Mid-Day;
Shade Side and Sun Side of Vessel

iv
Figure 3-19 James River Tidal Freshwater Dataflow Cruise Track, May 19, 2004 Figure 3-20 James River Tidal Freshwater Segments Dataflow Dissolved Oxygen,
May 19, 2004 Figure 3-21 James River Tidal Freshwater Segments Dataflow Chlorophyll, May 19,
2004 Figure 3-22 James River Tidal Freshwater Segments Dataflow Turbidity, May 19,
2004 Figure 3-23 James River Tidal Freshwater Dataflow Cruise Track, September 23, 2004 Figure 3-24 James River Tidal Freshwater Segments Dataflow Dissolved Oxygen,
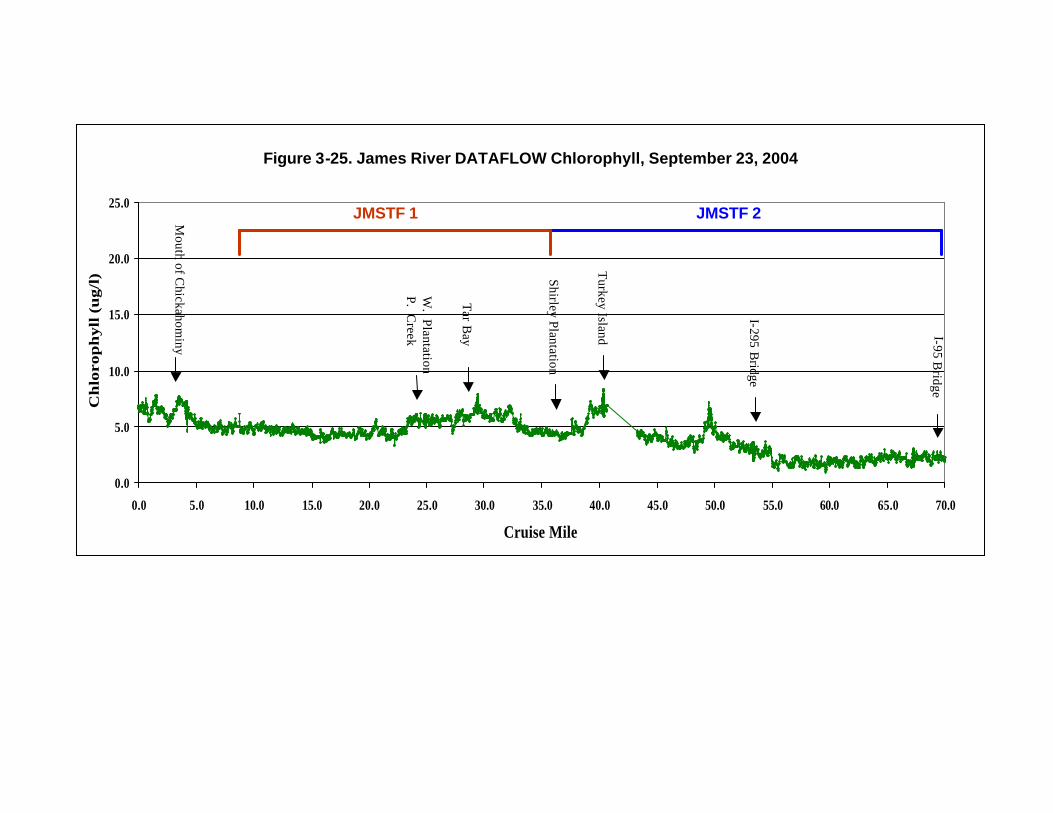
September 23, 2004 Figure 3-25 James River Tidal Freshwater Segments Dataflow Chlorophyll, September
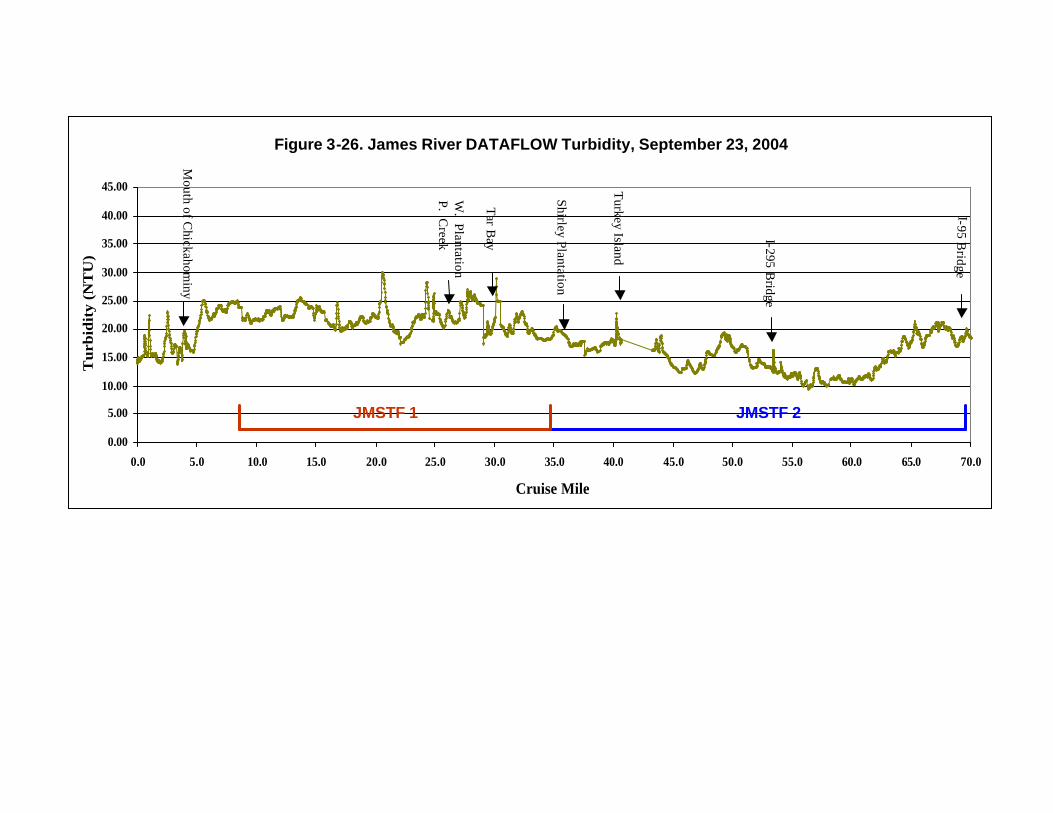
23, 2004 Figure 3-26 James River Tidal Freshwater Segments Dataflow Turbidity, September
23, 2004 Figure 3-27 James River Tidal Freshwater Dataflow Cruise Track, November 9, 2004 Figure 3-28 James River Tidal Freshwater Segments Dataflow Dissolved Oxygen,
November 9, 2004 Figure 3-29 James River Tidal Freshwater Segments Dataflow Chlorophyll, November
9, 2004 Figure 3-30 James River Tidal Freshwater Segments Dataflow Turbidity, November 9,
2004 Figure 3-31 James River 2003-2004 SAV Transplant Survivorship

v
EXECUTIVE SUMMARY
In 2003-2004 wild celery (Vallisneria americana) whole shoots and seeds were transplanted into four sites in the Hopewell region of the tidal James River. The SAV transplants were sampled by the Virginia Institute of Marine Science (VIMS) for survivorship and growth at bi-weekly to monthly intervals throughout the growing season. Concurrently, water quality sampling was conducted at bi-weekly intervals throughout the year for water column nutrients, chlorophyll a, suspended solids, water transparency and other chemical and physical constituents important for SAV growth. Objectives of the study were to: 1) expand the SAV transplanted plots within the study sites previously transplanted; 2) conduct water quality sampling using both fixed station and continuous underway Dataflow sampling; 3) evaluate techniques for assessing visual surface water algal conditions and water color characteristics; 4) evaluate the relationships between SAV transplant performance and water quality.
SAV growth and survival were evident at all sites when the plants were protected
from herbivory. Seeds obtained from wild stock and planted within the exclosures germinated and produced adult plants at each of the sites. The transplanted beds demonstrated limited impacts from hurricane Isabel with losses only evident at one transplant site.
Water quality conditions in 2003 and 2004 were characterized by relatively low
chlorophyll concentrations in comparison to 2002. River flow appeared to be inversely related to chlorophyll levels with a precipitous drop in chlorophyll evident for 2003 and 2004 (higher flow years) in comparison to 2002 (low flow year). Chlorophyll concentrations in 2003 and 2004 were well below the SAV habitat criteria (15µg/l) that have been associated with SAV growth to 1m. Proposed seasonal numeric chlorophyll limits under consideration by the Va. DEQ for the tidal freshwater James River (10 to 20 µg/l) would have been met in most areas in 2003 and 2004, but not in 2002. Turbidity levels were comparable among both high flow and low flow years. Water column nutrient concentrations did not vary greatly as river flow increased in 2003 and 2004 from lower flows in 2002. High ammonium concentrations found throughout this region in 2002 have not been evident since.
Algal condition assessments conducted in 2004 showed little visual algal
impairment. Several visual water color assessment techniques using the Flore-Ule color systems and Munsell color charts were also investigated. None were very suitable for quantifying algal and phytoplankton concentrations in this environment. This was partly due to the relative low phytoplankton concentrations present during most of this study period, the confounding effects of the varying ambient conditions, and partly due to the subjective nature of the assessment techniques themselves.

1
1.0 INTRODUCTION
1.1 Background and Objectives
This report summarizes the 2003-2004 results of a continuing shallow water quality
monitoring and submerged aquatic vegetation (SAV) restoration project that began in
1999, funded by the Hopewell Regional Wastewater Treatment Facility (HRWTF) in
partnership with the Chesapeake Bay Foundation (CBF.
Beginning in 1999, four test sites in shallow water areas of the tidal freshwater James
River (Powell’s Creek, Tar Bay, Shirley Plantation and Turkey Island) were selected for
test transplanting in the Hopewell region of the estuary. The sites chosen were based
upon historical photographs showing previous SAV presence and appropriate water
depths (<0.5m MLW; Moore et al. 2000). A fifth shallow water site (Westover) was
added in 2001 (Moore et al. 2002). Replicated SAV transplantings of a variety of native
SAV species were undertaken at the various sites during the spring and early summer of
each of the years (Moore et al. 2000, 2001, 2002, 2003). VIMS personnel monitored each
site for growth and survival as well as shoot epiphyte abundance throughout the growing
season. Results indicate that founder colonies of wild celery could be established within
three years (Fig. 1.1) if the transplant plots were enclosed with a fence to reduce
herbivory of the plantings. A preliminary SAV-herbivore study at the Shirley Cove site
(Meier 2002) suggests that the principal herbivore on the SAV may be the Chesapeake
Bay blue crab, Callinectes sapidus. Only wild celery (Vallisneria americana), among the
six native species of SAV tested, appeared to be able to survive and reproduce from one
year to the next. Water quality conditions at each of these shallow water (<1.0m)
transplant sites were monitoried at bi-weekly intervals. Typically, water quality did not

2
appear to be limiting SAV growth and survival. During unusually dry years, such as
2002, salinity intrusions during the growing season may have caused a dieback in
growing vegetation.
The 2003-2004 SAV restoration and water quality monitoring project was a
continuation of the previous SAV transplanting studies. In 2004 we also evaluated
several methodologies in an effort to quantify the aesthetic impacts of algae on water
surface condition and water color. The specific objectives of the 2003-2004 studies were:
1) Expand the SAV plots at the transplant sites to serve as habitat as well as a source
of propagules for enhanced recovery of SAV in these areas.
2) Work with the Alliance for the Chesapeake Bay (ACB), as well as the CBF to
expand other restoration activities in this region of the river.
3) Monitor the transplant sites for water quality and SAV growth and survival.
4) Relate the responses of the transplants to water quality conditions monitored at bi-
weekly intervals in the shallows during the growing season.
5) Evaluate techniques for quantify surface algae conditions and water color
characteristics and compare these to actual chlorophyll measurements.
6) Conduct continuous monitoring of surface water quality along the axis of the
James River during three quarterly cruises to quantify the spatial distribution of
water quality in the James River tidal freshwater segments.
2.0 METHODS
2.1 Study Sites
Five shallow water sites (Fig. 2-1) were used for SAV transplanting and/or water
quality monitoring in the Hopewell region of the James River estuary in 2003-2004.

3
Turkey Island Lat. 37.3826 N Long. 77.2527 W
Shirley Cove Lat. 37.3326 N Long. 77.2631 W
Tar Bay Lat. 37.3075 N Long. 77.1902 W
Powell’s Creek Lat. 37.2929 N Long. 77.1622 W
Westover Plantation Lat. 37.3105 N Long. 77.1558 W
Due to a dredge disposal operation at the Shirley Cove site, no transplants have been
placed there since 1999. However, water quality monitoring was continued in 2003-2004
to assess any long-term water changes at that location. As a result of the success of CBF
transplants at the Westover site and our review of previous water quality monitoring data
at this site, SAV were transplanted by VIMS to that site in the spring of 2003 and 2004
and the transplants were monitored for survival throughout 2004. In addition, technical
assistance was provided to the Alliance for the Chesapeake Bay and the U.S. Fish and
Wildlife Service for the development of a SAV restoration nursery area at the Harrison
Lake National Fish Hatchery.
2.2 SAV Transplanting and Monitoring
Transplanting activities at all of the James River sites were undertaken in spring and
summer 2003 and 2004 using bare-rooted wild celery donor plants. Transplants were
surveyed by diver at bi-weekly to monthly intervals throughout the growing season for
percent survival and growth of planting units. Observations were also made on the
relative condition of the transplants, including any evidence of herbivory.
Wild celery seeds were obtained from native beds in the Potomac River, Md. in
October 2003 by harvesting seed pods by hand. Seed pods were kept in river water and
were refrigerated in the dark at 4 °C until planting in April 2004. Just prior to planting

4
the seeds pods were gently broken apart by hand and 10-15 pods, with accompanying
seeds were lightly patted into the sediments within 1 m2 areas in the exclosures at each of
the transplant sites. Germinated seedlings were checked by diver for relative abundance
at monthly intervals.
Technical assistance was also provided to other restoration efforts in the region.
Herbivory exclosures had been constructed in June 2002 by VIMS, CBF and ACB at the
Harrison Lake National Fish Hatchery in Charles City, Virginia, in collaboration with the
U.S. Fish and Wildlife Service. Wild celery shoots were then transplanted into these by
ACB, CBF, VIMS and citizen volunteers. These ponds were checked for growth and
survivorship in 2003 and again in 2004. Hatchery grown plants will be used for
transplanting into the tidal James River in 2005.
2.3 Water Quality Monitoring
2.3.1 Fixed Station Monitoring
VIMS personnel conducted water quality sampling at bi-weekly intervals at each
of the five James River restoration sites from June 2003 to December 2004. This resulted
in a continuous record of water quality conditions from previous monitoring starting in
1999. Water quality measurements included: air and water temperatures, secchi depth,
light attenuation profiles (Kd), pH, conductivity, organic and inorganic nitrogen and
phosphorus, chlorophyll, suspended solids, dissolved oxygen, total organic carbon and
nitrogen. Samples were obtained at the shallow water transplant sites at water depths of
approximate one meter. Water samples were obtained a depth of one-half meter below
the surface.
2.3.2 Algal Condition and Water Color Assessments

5
In conjunction with water quality monitoring conducted by VIMS and HRWTF for
nutrients, chlorophyll a, suspended solids, water transparency and other chemical and
physical constituents, several procedures suggested by HRWTF and Malcom Pirnie and
Associates for visual assessment of algal condition were investigated at each of the James
River SAV transplant sites.
Algal Condition: Field personnel recorded the presences/absence of:
Ø Surface films/scums
Ø Partially dispersed clouds
Ø Flecks
Ø Balls
Ø Filaments
Ø Mats
In some cases, these effects above may have been of non-algal origin. Field personnel
took additional descriptive notes about form and color to help determine if such effects
are of algal origin. Field personnel rated the overall algal condition index on an ordinal
scale as follows:
Algal Index Value
Category Description
0 Clear Conditions vary from no algae to small populations visible to the naked eye.
1 Present Some algae visible to the naked eye but present at low to medium levels.
2 Visible Algae sufficiently concentrated that filaments and/or balls of algae are visible to the naked eye. May be scattered streaks of algae on water surface.
3 Scattered Surface Blooms
Surface mats of algae scattered. May be more abundant in localized areas if winds are calm. Some odor problems.
4 Extensive Surface Blooms
Large portions of the water surface covered by mats of algae. Windy conditions may temporarily eliminate mats, but they will quickly redevelop as winds become calm. Odor problems in localized areas.
Source: Coastnet, 1996, Sampling Procedures: A Manual for Estuary Monitoring, prepared for the Coastnet Water Quality Monitoring Project administered by the Oregon State University Extension Sea Grant Program, http://secchi.hmsc.orst.edu/coastnet/manual/index.html

6
Color: Water color was assessed using two separate standards.
Ø Forel-Ule Color System
Ø Munsell Soil Color Charts
The Forel-Ule color was determined by using a Lamotte Forel-Ule comparator. On
the shady side of the vessel, field personnel lowered the Secchi disk to a depth of one-
half meter and then compared the Forel-Ule color scale to the color of water as seen
against the white portion of the Secchi disk. The Forel-Ule color number that was the
closest match was then recorded.
The Munsell color number was determined by comparison of the surface water
color on the shady side of the vessel to the Munsell Soil color chart. A second assessment
was made by filling a clean test tube with sample water. Under natural light, in the shade,
and against a white background, the sample test tube was held next to the appropriate
Munsell color chart and assigned the appropriate Munsell number. The Munsell color
chart was also used to assess the color of algal blooms (filaments, films, flecks) that
might be different than the color of the surrounding water.
Photography: Photographs were taken at every sampling station during every sampling
event, regardless of whether algal effects were visible. Photographs were taken with an
Olympus Stylus 400 digital camera with 4.0 effective megapixels. High-angle
photographs of the water surface were taken both on the shady and non-shady sides of the
vessel; these photographs included a floatable color wheel for scale. Near shore and far
shore photographs were taken at each site as well as other photographs if necessary to
document visible algal effects or the lack thereof. Upon return from the field, pictures
7
were downloaded onto the computer and labeled with appropriate date and site
identification.
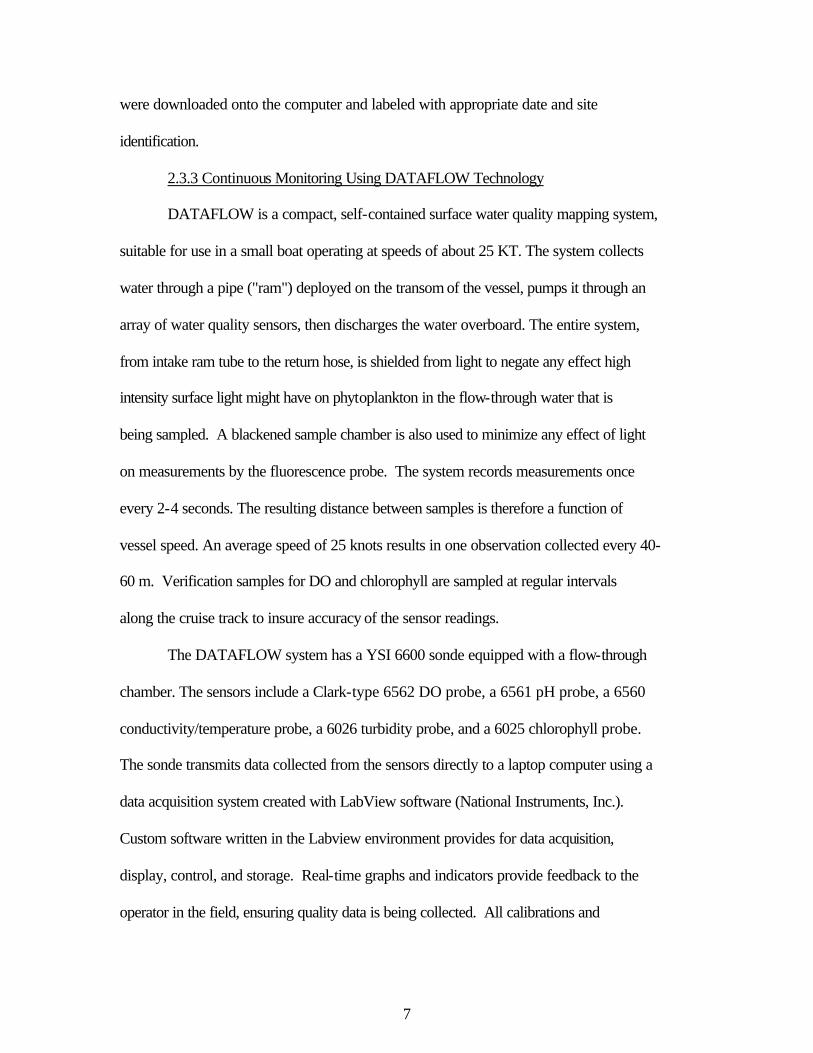
2.3.3 Continuous Monitoring Using DATAFLOW Technology
DATAFLOW is a compact, self-contained surface water quality mapping system,
suitable for use in a small boat operating at speeds of about 25 KT. The system collects
water through a pipe ("ram") deployed on the transom of the vessel, pumps it through an
array of water quality sensors, then discharges the water overboard. The entire system,
from intake ram tube to the return hose, is shielded from light to negate any effect high
intensity surface light might have on phytoplankton in the flow-through water that is
being sampled. A blackened sample chamber is also used to minimize any effect of light
on measurements by the fluorescence probe. The system records measurements once
every 2-4 seconds. The resulting distance between samples is therefore a function of
vessel speed. An average speed of 25 knots results in one observation collected every 40-
60 m. Verification samples for DO and chlorophyll are sampled at regular intervals
along the cruise track to insure accuracy of the sensor readings.
The DATAFLOW system has a YSI 6600 sonde equipped with a flow-through
chamber. The sensors include a Clark-type 6562 DO probe, a 6561 pH probe, a 6560
conductivity/temperature probe, a 6026 turbidity probe, and a 6025 chlorophyll probe.
The sonde transmits data collected from the sensors directly to a laptop computer using a
data acquisition system created with LabView software (National Instruments, Inc.).
Custom software written in the Labview environment provides for data acquisition,
display, control, and storage. Real-time graphs and indicators provide feedback to the
operator in the field, ensuring quality data is being collected. All calibrations and

8
maintenance on the YSI 6600 sondes are completed in accordance with the YSI, Inc.
operating manual methods (YSI 6-series Environmental Monitoring Systems Manual;
YSI, Inc. Yellow Springs, OH).
The system is also equipped with a Garmin GPSMAP 168 Sounder. This unit
serves several functions including chart plotting, position information, and depth. The
unit is WAAS (Wide Area Augmentation System) enabled providing a position accuracy
of better than three meters 95 percent of the time.
Three continuous DATAFLOW sampling cruises were conducted in May,
September and November 2004. The cruise tracks were run along the center axis of the
James River estuary from the mouth of the Chickahominy River to the upper limit of tidal
water in Richmond. Cruises occurred from approximately 10:00 am to 3:00 pm. During
each cruise five calibration stations were sampled for chlorophyll, dissolved oxygen,
suspended solids and light attenuation.
3.0 RESULTS
3.1 Water Quality Monitoring
3.1.1 Fixed Station Monitoring
Results of water quality measurements are presented for all years of shallow water
SAV habitat monitoring. Sampling was initiated at Westover Plantation on April 10,
2001. Water temperatures (Fig. 3-1) demonstrated similar annual patterns over the
1999-2004 sampling period at all the stations with daytime minimums ranging from
approximately 5 °C to maximums of 30-32 °C. During the winter of 2002-2003 however,
water temperatures were near zero on one occasion. Conductivity (Fig. 3-2)
demonstrated marked differences among the years reflecting variations in river discharge

9
rates and low freshwater inputs in 1999, 2001 and 2002. In this region of the James
conductivities were generally in the range of 100-300 µmhos (0 psu salinity). During low
flow years shallow water salinities began to increase in July to nearly 1000 µmhos (0.5
psu salinity) in the fall of 1999, 2000 µmhos (1.0 psu salinity) in the fall of 2001 and
3500 µmhos during the late summer and fall of 2002 (>6.0 psu salinity), and did not
return to freshwater conditions until the late fall. When salinity levels increased in the
fall of 1999, 2001 and 2002, highest levels were reached at the most downstream stations
of Westover Plantation, Powell’s and Tar Bay. At other times there were no differences
among the stations. Generally, the very high salinity levels did not reach the upriver
Turkey Island site where transplant survival was highest. Conductivities have remained
low throughout 2003 and 2004.
Daytime dissolved oxygen (DO) concentrations (Fig. 3-3) at the transplant sites
are typically above 6 mg/l even during the summer with no differences among the
stations. Seasonal maximums exceeding 13 mg/l are regularly measured during the
winter. Water column pH levels (Fig. 3-4) paralleled changing DO levels. However pH
is affected by many factors including the buffering capacity of the water, which is related
to salinity. The highest salinities observed here typically buffer pH between 7.5 and 8.0.
pH dropped markedly in the fall of 2002 as river flow increased and levels were
unusually low at Westover during the winter of 2002. This was not repeated during the
winters of 2002 and 2003
Suspended particle loads (TSS) have been remarkably consistent among years
regardless of river flow and salinity. Concentrations were consistently lowest at the
Shirley Cove station (Fig. 3-5) where the protected conditions allow for particle

10
settlement. The Westover and Tar Bay sites had the greatest proportion of short-term
increases in TSS likely reflecting wind or wave re-suspensions of bottom sediments.
Table 1 presents median annual TSS concentrations throughout the SAV growing season
(April 1- October 31) for each of the transplant sites. Levels were consistently lower by
5-10 mg/l in 2003, a high flow year, compared to 2002 a low flow year. Much of the
summertime suspended material may therefore be composed of material already within
the system that is being reworked and resuspended.
A pattern of generally increasing chlorophyll levels from initiation of the
monitoring in 1999 through mid 2002 is followed by a decrease through 2004 (Fig. 3-6).
SAV growing season median chlorophyll concentrations are presented in Table 1. Flow
appears inversely related to chlorophyll with a precipitous drop in chlorophyll evident
from 2002 (low flow year) to 2003 (high flow year). These lower levels continued in
2004. Concentrations in 2003 and 2004 were well below the diagnostic habitat criteria
(15 µg/l) that have been associated with SAV growth to 1m (EPA 2002).
Table 2 presents the mean chlorophyll concentrations for the March-May (spring)
and July-September (summer) periods for the SAV transplant stations within each of the
two James River Tidal Freshwater segments (JMSTF1 and JMSTF2). In 2002 the mean
concentrations exceeded the proposed numeric chlorophyll limits in 2002 but were near
or met the limits in 2003 and 2004 at most of the sites. Again, during the low flow
summer of 2002 chlorophyll concentrations were considerably higher than 2003 and
2004. Proposed numeric chlorophyll limits would have been met at most stations during
most seasons in 2003 and 2004 but not in 2002. The Turkey Island and Shirley Cove
transplant sites are located near the downstream end of JMSTF2 where conditions are

11
typically very similar to JMSTF1. Upstream areas in JMSTF2 closer to Richmond will
typically be lower. This spatial variability is reflected in the continuous DATAFLOW
monitoring presented later in this report.
Water transparencies measured as secchi depth (Fig. 3-7) demonstrated little year-
to-year variability over the past several years, regardless of river flow. Generally, secchi
depths were always greatest (i.e. clearer water) at the Shirley Cove site. This site is
located off the main section of the river. It is more sheltered from wave and current
action than the other sites and TSS levels were usually lowest.
Total organic carbon (TOC) concentrations demonstrated some seasonality with
higher levels during the summer (Fig 3-8). Concentrations were also highest in 2002
followed by decreases in 2003 and 2004. Total kjeldahl nitrogen (TKN) and total
phosphorus (TP) levels (Figs. 3-9, 3-10) were relatively consistent among the years.
Elevated late summer TKN concentrations in 2002 paralleled increased salinity
suggesting a source unrelated to watershed inputs. Concentrations were usually, but not
always, highest during the summers. Generally TP followed TSS patterns as much of the
total phosphorus load is bound to suspended sediments although levels were quite
variable. Concentrations appeared to be below detection (0.05 mg/l) on many occasions
after the fall of 2002 compared to before suggesting a possible long-term decrease.
Throughout the study period nitrate + nitrite levels (Fig. 3-11) have been quite
variable, both over time and among stations. Nitrate and nitrite generally represent
“new” nitrogen entering the system. Concentrations were generally highest in the late
fall and winter. Winter concentrations have been similar among the years. Nitrate +
nitrite levels were very low in the summer of 2002 and higher in the summers of 2003

12
and 2004 and this likely reflected higher watershed inputs due to higher river flow. High
levels of ammonium (Fig. 3-12) that were observed for all stations during the fall of 2001
have not re-occurred. Concentrations during the high flow summer of 2003 were below
detection. These increased to 0.2 mg/l in 2004.
Dissolved inorganic phosphorus (DIP) concentrations (Fig. 3-13) met the SAV
growing season habitat criteria threshold of 0.02 mg/l for 1999 through 2002, and
exceeded it slightly in 2003 and 2004 (Table 1). The long-term trend is one of increasing
growing season median concentrations from 1999 to 2003-2004. These increases may be
related to the relatively higher river flows in 2003 and 2004.
3.1.2 Algal Condition and Water Color Assessments Algal Condition: The evaluation of this parameter was straightforward but not
very informative for this region of the James. Most often Algal Index Values were given
the value of “0” (clear) but on occasion received a value of “1” (data not presented in this
report). Values of “1” were generally indicative of surface films/scums and occasionally
small flecks of material. Partially dispersed clouds, balls, filaments, and mats have not
been observed as of yet. These observations suggest that in 2004 this region of the river
was largely free of negative aesthetic impacts of phytoplankton including nuisance
conditions such as floating algal mats and films. This lack of surface visual impairment
is consistent with the relatively low water column chlorophyll concentrations in 2004
(Fig. 3-6; Tables 1and 2).
Forel-Ule Color System: A Lamotte Forel-Ule Color Scale kit was used to access
water color. The Forel-Ule color scale, a system originally developed by European lake
scientists, classifies water color into 22 categories ranging from blue, green, yellow to

13
brown. This method was found to be unsuitable for the Hopewell sampling sites. The
James River water color was never able to be matched to any of the given choices of
colors provided by the Forel-Ule Color Scale. The closest possible match was “XV” and
was the most often recorded regardless of chlorophyll level.
Munsell Soil Color Charts: While this measurement was somewhat subjective
depending on the user, it proved to be more suitable at the Hopewell transplant sites than
the Forel-Ule system. The Munsell color system has three components: hue (a specific
color), value (lightness and darkness), and chroma (color intensity). The mean
chlorophyll concentrations for combined 2004 data for all sites corresponding to each of
the observed Munsell color categories are presented in Fig. 3-14. Highest chlorophyll
concentrations were associated with 5y 4/3 and 5y 5/4 designations and lowest with 2.5y
5/6 and 2.5y 6/6. All water samples in this region had a yellow hue that may have largely
reflected the mineral as well as the organic matter composition of the suspended
sediments in the water. Water with higher chlorophyll concentrations (>20 ug/l)
nevertheless had a distinctly different hue (5y) than waters with less than 10ug/l (2.5y).
However, no algae blooms were observed at any of the stations in 2004, therefore the
range of chlorophyll values observed was not large enough to adequately asses this
method. Given a broader range of chlorophyll and less suspended sediments such a scale
may have some utility for qualitatively assessing bloom events. A second assessment of
this color monitoring approach was attempted by first filling a clean test tube with sample
water, holding the filled test tube against a white background in the shade, and then
comparing it to the color chips provided in the Munsell charts. This assessment proved to
be unsuitable, as colors were too faint to be successfully compared to the colors offered
14
by the Munsell charts. Perhaps an optical device with a longer path length for viewing
might provide a more detectable color, however visible differences in water color were
difficult to quantify by eye.
Photography: Photography of the surface water of the sampling sites using a
Olympus Stylus 400 digital camera with 4.0 effective megapixels have been archived,
however no algal effects were observed throughout 2004. Close-up, high angle
photographs of the water surface including a floatable color wheel at each of the
Hopewell sampling sites were also inconclusive. Representative pictures taken on both
the shady side and the sunny side of the boat on each sampling cruise are presented here
(Figs. 3-15 to 3-18). The assessment of algal condition and water color using a
comparison to the color wheel was inconsistent as the water color appeared related to sun
angle, time of day, viewer angle and atmospheric conditions. On clear sunny days during
the spring and summer (higher sun angle), pictures of the water surface on the sunny side
of the boat gave the appearance of being very dark and color determination was
impossible (Figs. 3-15 and 3-16). In the winter (low sun angle) more color could be seen
(Fig. 3-17). Pictures taken of the water surface in the shade under sunny conditions
demonstrated the opposite effect: greater color in the summer and less in the winter (Figs.
3-15, 3-16, 3-17). On days with heavily overcast skies, color was indistinguishable on
either the sunny and shady sides of the boat. The water generally appeared to be black or
dark gray. The most accurate means of measuring water color using comparison to the
wheel appeared to be direct visual in-situ observation. However, temporal or spatial
variation in water color among the Hopewell sites was not apparent using even this

15
technique. Visual estimation of water color by observer always appeared to be the
darkest of the yellow band on the color wheel.
3.1.3 Continuous Monitoring Using DATAFLOW Technology
Continuous Dataflow mapping cruises of the tidal freshwater James River from
the mouth of the Chickahominy River to the fall line at Richmond were conducted on
May 19, September 23 and November 11, 2004. Levels of turbidity, chlorophyll and
dissolved oxygen along with the May 2004 cruise track are presented in Fig. 3-19.
Dissolved oxygen (Fig. 3-20) generally exceeded 6 mg/l throughout the James River
Tidal Freshwater (JMSTF) segments with several areas of high D.O. observed. These
generally corresponded with areas of high chlorophyll especially in the middle reaches of
the sampling area (Fig. 3-21). Spatially averaged chlorophyll and turbidity
concentrations for each of the JMSTF segments are presented in Table 3. During the
May cruise integrated mean chlorophyll measured by fluorescence was 10.2 and 7.6 µg/l
for segments JMSTF1 and JMSTF2, respectively. This compares to proposed numeric
chlorophyll limits of 15 and 10 µg/l for these two segments of the James River. These
results suggest that when integrated over the entire reach of the segments, proposed
numeric limits would be met. Highest chlorophyll levels were observed in the SAV
transplant region (Westover to Turkey Island) with several peaks or blooms of
phytoplankton extending for distances of two miles or more. Lower concentrations of
chlorophyll were observed in the Shirley plantation cove and highest levels in the bend of
the James River where the Turkey Island transplant site is located. The distribution of
turbidity demonstrated a similar pattern with highest turbidities in the upper JMSTF1 and
lower JMSFT2 regions (Fig. 3-22). Several of the highest regions of turbidity were also

16
associated with the highest regions of chlorophyll suggesting some contribution of
phytoplankton to overall turbidity in these areas. Integrated turbidities measured in
NTUs were 22.1 and 15 NTU for JMSTF1 and JMSTF2 segments respectively.
Conversion of NTU to water clarity goal for SAV growth to 0.5 m was made using the
following approach. First, growth of SAV to 0.5 m was assumed to require a water
clarity secchi depth of 0.4 m or light attenuation coefficient (Kd) of approximately 3.6
(EPA 2003). DATAFLOW NTU corresponding to this water clarity was estimated using
the following relationship that was developed from in vivo DATAFLOW calibrations of
NTU to Kd (Moore unpublished):
Dataflow NTU = (Kd – 1) / 0.072 This conversion suggests that for tidal freshwater SAV growth to 0.5 m (0.4 m
secchi), a turbidity of 36 NTU or less should be the goal. Overall, both segments would
meet this goal with some regions, especially near the I-295 bridge and above, where the
water was much clearer.
The September 23, 2004 cruise track along with turbidity, chlorophyll and D.O.
levels are presented in Fig. 3-23. Surface D.O. concentrations during this cruise exceeded
6 mg/l throughout and were above 8 mg/l for most of the JMSTF2 segment (Fig. 3-24).
Chlorophyll concentrations were quite low throughout, never exceeding 10 µg/l (Fig. 3-
25). Proposed seasonal chlorophyll limits of 20 and 15 µg/l for the JMSTF1 and JMSTF2
segments would have been met. Integrated chlorophyll concentrations were also quite
low at 5.3 and 3.4 µg/l for these same two segments (Table 3). Turbidity levels were also
lower than the May cruise and typically never exceeded 25 NTU (Fig 3-26; Table 3).

17
The November 9, 2004 cruise track along with turbidity, chlorophyll and D.O.
levels are presented in Fig. 3-27. Declining water temperatures resulted in D.O.
concentrations exceeding 8 mg/l for most of the JMSTF segments (Fig. 3-28).
Chlorophyll concentrations were consistently low throughout, generally staying below 5
µg/l (Fig. 3-29). Intergrated mean concentrations were 4.2 and 3.3 µg/l for the JMSTF1
and JMSTF2 segments, respectively. These low September and November chlorophyll
levels observed using the Dataflow system reflected the low seasonal chlorophyll but
expand these site specific measurements to highlight the wide spatial distribution of the
low phytoplankton abundance in the late summer and fall. Turbidity distribution (Fig. 3-
30) demonstrated decreasing turbidity with distance upriver in November. Levels were
generally below the approximate 36 NTU threshold for SAV growth to 0.5 m.
3.2 Transplant Survival
Transplant survival and growth in 2003 and 2004 was high (Fig. 3-31) in spite of
the relatively high flow conditions of these years and the occurrence of hurricane Isabel
in September 2003. Additional exclosures of wild celery transplants were added to the
Turkey Island site and exclosures were rebuilt and expanded at the Westover, Powell’s
Creek and Tar Bay sites. Wild celery seeds obtained from natural beds in the Potomac
River in the fall of 2003 were planted into exclosures at each of the sites in April 2004.
Their germination, growth, and survival paralleled that of the transplanted whole shoots.
Future work in 2005 will focus on the expanded use of seeds for SAV restoration.
Thousands of wild celery seeds were collect in October 2004 from existing beds in the
Potomac River and will be used for transplanting in 2005. Seedpods containing seeds

18
have been kept refrigerated at 4 °C in the dark since collection for planting in April-May
2005.
As in previous years SAV transplanted to the Turkey Island site continued to have
the greatest survival and growth of all the restoration areas. A fifth exclosure was added
to this site and survival of transplants by the end of 2004 was approximately 80%.
Typically three years with no herbivory is required for growth to 100% coverage. The
Westover site had the poorest transplant survival but losses here appeared not to be
related to water quality in 2003 and 2004. Shoot herbivory has been the greatest problem
at this site. Perhaps this is due to the relatively exposed location causing gaps in the
exclosures. A preliminary study by Meier (2002) implicates the blue crab as a significant
herbivore. It may be that this downriver site has greater blue crab abundance due to its
somewhat higher salinity or proximity to the river channel. The effects of hurricane
Isabel on the transplants were relatively minor compared to the adjacent shoreline
damage. There were some loss of plants and damage to the exclosures, however most of
the sites recovered in the spring of 2004. Only the Westover site demonstrated
significant losses in the spring of 2004 with loss of all plants by mid summer. This area
was again replanted in late summer of 2004. The Tar Bay site also experienced herbivory
and was replanted. Both the expanded Powell’s Creek and Turkey Island sites
demonstrated no significant losses post hurricane and expanded through 2004.
Although epiphytes were not quantitatively measured in 2004, expanded growth
of an unidentified, encrusting, invasive colonial tunicate was observed throughout 2004
on both the exclosure mesh and the leaves of wild celery shoots at all sites. This tunicate
has been observed in the past, but qualitatively it was more abundance in 2004. It did not

19
appear to be causing an extensive died back of the vegetation but its presence will be
followed in 2005.
Wild celery transplants at the Harrison Lake National Fish Hatchery in Charles
City, Virginia, which were initially planted in 2003 by VIMS, ACB and CBF personnel,
were continued in 2004. One of the shallow water ponds used for grow out of transplants
was subject to an extensive algal bloom in the summer of 2003. This continued for at
least several weeks until the water in the pond could be exchanged. All of the growing
transplants died as a result of the very high turbidity. SAV in the second pond planted by
ACB was not so affected and growth and expansion of the SAV continued throughout
2004. ACB will provide some of these plants for transplantation into the James in 2005.
4.0 DISCUSSION AND CONCLUSIONS
Algal condition and water color assessments of the Hopewell region of the
JMSTF segments in 2004 revealed little visual impairment. Surface algal conditions
were generally categorized with no or low algae evident. Attempts to adapt established
color systems including the Forel-Ule and Munsell color charts to the surface waters of
the James were generally not successful. Few color differences were observed among the
stations or throughout the year. Water with higher chlorophyll concentrations (>20 ug/l)
during the summer could be differentiated with a distinctly different hue than waters with
less than 10ug/l found earlier or later during the year on the Munsell color scale but,
overall, the value of this approach in 2004 was limited. This was due in part to the
relatively low chlorophyll observed in this region through most of the year. Photographs
taken of the water surface both on the shady and sunny sides of the vessel in order to
document water condition were not quantifiable due to the effects of atmospheric
20
variability and sun angle. Perhaps all these data will provide a useful background if
water quality conditions were to deteriorate in the James but continued monitoring using
these approaches is probably not warranted at this time.
Water quality conditions and SAV survival in 2003 and 2004 demonstrated that
during these relatively high runoff years both were better in this region that during the
low flow year of 2002. Chlorophyll concentrations measured using both fixed station
sampling and continuous underway sampling with Dataflow were quite low for most of
the growing season. Although mid-summer concentrations reached 30-40 µg/l, seasonal
levels were only 5-15 µg/l. Comparisons to SAV habitat requirements or proposed
chlorophyll numeric limits suggest most areas in the JMSTF segments would meet these
goals in 2003-2004. In contrast, chlorophyll levels in the low flow year of 2002 were
much higher. This highlights the probable importance of water residence time in the
development of phytoplankton blooms in this region of the James. Turbidity levels
during the SAV growing season, in contrast, were not affected greatly by river flow and
consequently SAV survival was not related to the slight differences in light availability
apparent among the years.
Exceptional storm events, such as hurricane Isabel, which stuck this region in
September 2003, appeared to have little effect on water quality conditions or SAV
survival. Acute effects, such a erosion, scouring or uprooting of the existing vegetation
were generally not evident. In addition, turbidity increases or other water quality effects
were only short-lived and did not appear to be related to SAV persistence.

21
5.0 LITERATURE CITED
EPA. 2003. Ambient Water Quality Criteria for Dissolved Oxygen, Water Clarity and Chlorophyll a for the Chesapeake Bay and Its Tidal Tributaries. U.S. EPA Region III, Chesapeake Bay Program Office. Annapolis, Maryland.
Meier, P. 2002 Determining the source of herbivory on wild celery (Vallisneria
americana) in the James River, Charles City County, Virginia. Unpublished Report. Environmental Studies Program, Randolph-Macon College, Ashland, Va. 23005. 8p.
Moore, K.A., R. Orth, J. Fishman. 2000. Restoration of submerged aquatic vegetation
(SAV) in the tidal freshwater James River: 1999 Pilot Study. Special Report No. 384 in Applied Marine Science and Ocean Engineering No. 365. VIMS, Gloucester Point, Va. 48p.
Moore, K.A., K. Segerblom, B. Neikirk and J. Fishman. 2001. Restoration of submerged
aquatic vegetation SAV) in the tidal freshwater James River: Year 2. Special Report No. 384 in Applied Marine Science and Ocean Engineering No. 373. VIMS, Gloucester Point, Va. 40p.
Moore, K.A., B.A. Anderson and B. Neikirk. 2002. Restoration of Submerged Aquatic
Vegetation (SAV) in the Tidal Freshwater James River. Special Report No. 377 in Applied Marine Science and Ocean Engineering. Virginia Institute of Marine Science, Gloucester Point, Va. 38p.
Moore, K.A. B.A. Anderson and B.B. Neikirk. 2003. Restoration of Submerged Aquatic
Vegetation (SAV) in the Tidal Freshwater James River 2002-2003. Special Report No. 384 in Applied Marine Science and Ocean Engineering. Virginia Institute of Marine Science, Gloucester Point, Va. 45p.

22
APPENDIX A
TABLES

Table 1. SAV Growing Season (April – October) median water quality. Shaded indicates SAV criteria met for SAV growth to 1 m.
Turkey Island Water Quality Parameter
SAV Habitat Criteria
1999 2000 2001 2002 2003 2004
Light Attenuation (Kd; m-1) < 3.6 - - - 3.28 3.28 3.9 Secchi Depth (m) > 0.40 0.30 0.45 0.38 0.40 0.40 0.35 TSS (mg/l) <15 33.5 26.0 32.0 30.0 26.0 35.0 Chl a (ug/l) <15 11.1 30.8 30.8 44.8 6.6 9.2 DIP (mg/l) <0.02 0.01 0.02 0.02 0.02 0.03 0.03
Shirley Cove
Water Quality Parameter SAV
Habitat Criteria
1999 2000 2001 2002 2003 2004
Light Attenuation (Kd; m-1) < 3.6 - - - 3.40 2.38 2.83 Secchi Depth (m) > 0.40 0.40 0.55 0.40 0.40 0.50 0.45 TSS (mg/l) <15 21.00 19.00 22.00 24.00 16.00 21.00 Chl a (ug/l) <15 13.70 27.55 37.90 56.00 8.80 5.65 DIP (mg/l) <0.02 0.01 0.01 0.01 0.02 0.03 0.03
Tar Bay
Water Quality Parameter SAV
Habitat Criteria
1999 2000 2001 2002 2003 2004
Light Attenuation (Kd; m-1) < 3.6 - - - 4.20 4.03 3.66 Secchi Depth (m) > 0.40 0.35 0.40 0.35 0.40 0.40 0.35 TSS (mg/l) <15 31.00 28.00 30.00 34.50 24.00 32.00 Chl a (ug/l) <15 12.00 26.75 39.35 41.90 4.90 5.30 DIP (mg/l) <0.02 0.02 0.02 0.02 0.02 0.03 0.03
Powell’s Creek
Water Quality Parameter SAV
Habitat Criteria
1999 2000 2001 2002 2003 2004
Light Attenuation (Kd; m-1) < 3.6 - - - 4.07 3.41 4.42 Secchi Depth (m) > 0.40 0.30 0.50 0.30 0.40 0.40 0.30 TSS (mg/l) <15 37.50 29.00 32.00 35.50 31.00 38.00 Chl a (ug/l) <15 12.60 43.25 35.80 42.55 6.40 5.90 DIP (mg/l) <0.02 0.01 0.02 0.02 0.02 0.03 0.03
Westover
Water Quality Parameter SAV
Habitat Criteria
1999 2000 2001 2002 2003 2004
Light Attenuation (Kd; m-1) < 3.6 - - - 4.03 3.07 4.26 Secchi Depth (m) > 0.40 - - 0.40 0.40 0.40 0.30 TSS (mg/l) <15 - - 30.00 30.00 26.00 32.00 Chl a (ug/l) <15 - - 32.40 40.85 5.60 7.20 DIP (mg/l) <0.02 - - 0.02 0.02 0.03 0.03
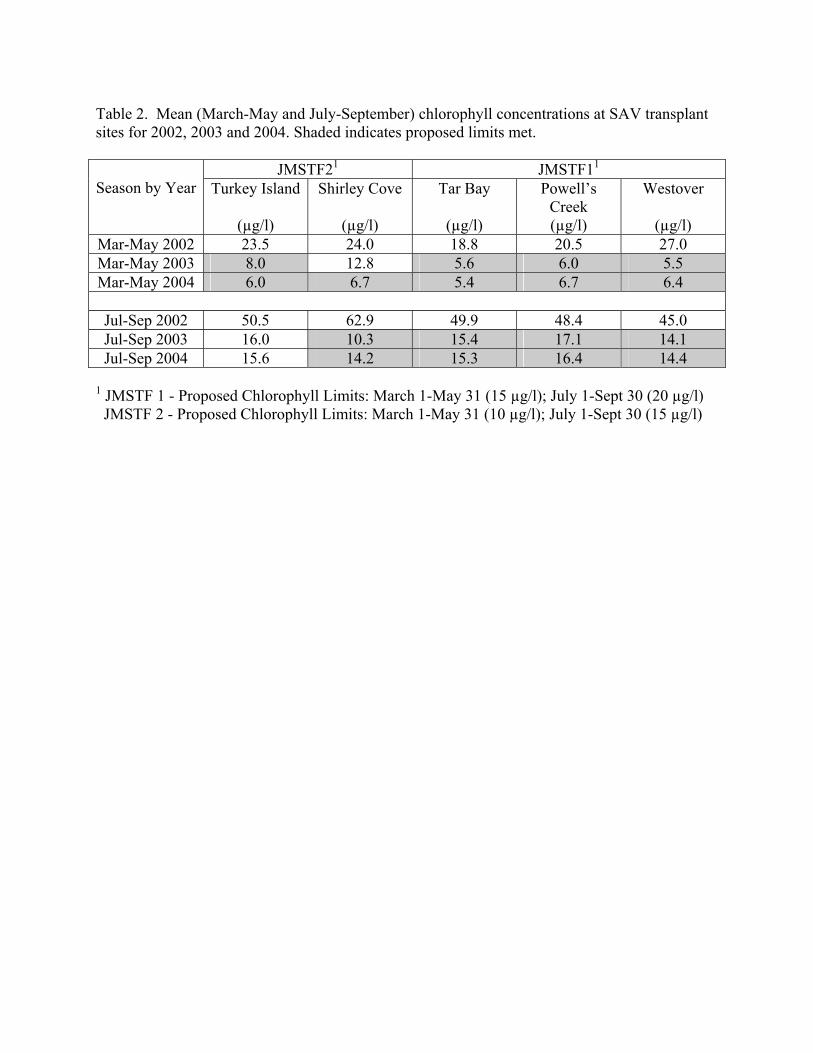
Table 2. Mean (March-May and July-September) chlorophyll concentrations at SAV transplant sites for 2002, 2003 and 2004. Shaded indicates proposed limits met.
JMSTF21 JMSTF11 Season by Year Turkey Island
(µg/l)
Shirley Cove
(µg/l)
Tar Bay
(µg/l)
Powell’s Creek (µg/l)
Westover
(µg/l) Mar-May 2002 23.5 24.0 18.8 20.5 27.0 Mar-May 2003 8.0 12.8 5.6 6.0 5.5 Mar-May 2004 6.0 6.7 5.4 6.7 6.4
Jul-Sep 2002 50.5 62.9 49.9 48.4 45.0 Jul-Sep 2003 16.0 10.3 15.4 17.1 14.1 Jul-Sep 2004 15.6 14.2 15.3 16.4 14.4
1 JMSTF 1 - Proposed Chlorophyll Limits: March 1-May 31 (15 µg/l); July 1-Sept 30 (20 µg/l) JMSTF 2 - Proposed Chlorophyll Limits: March 1-May 31 (10 µg/l); July 1-Sept 30 (15 µg/l)
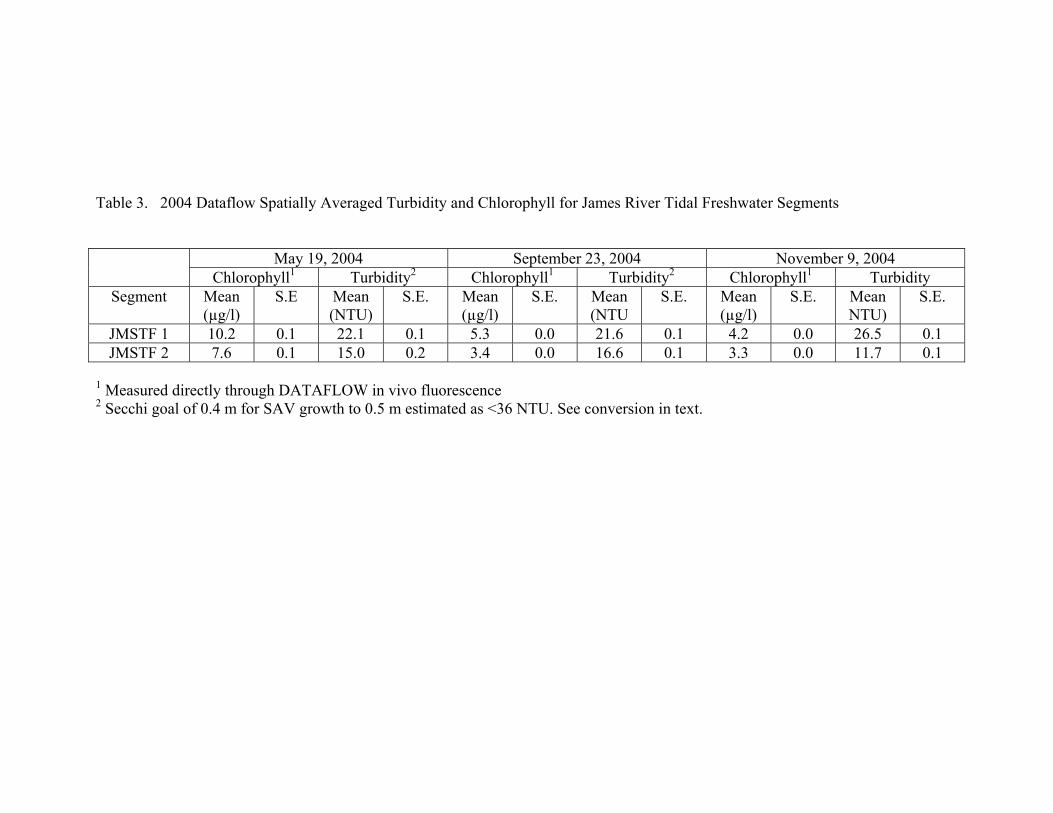
Table 3. 2004 Dataflow Spatially Averaged Turbidity and Chlorophyll for James River Tidal Freshwater Segments
May 19, 2004 September 23, 2004 November 9, 2004 Chlorophyll1 Turbidity2 Chlorophyll1 Turbidity2 Chlorophyll1 Turbidity
Segment Mean (µg/l)
S.E Mean (NTU)
S.E. Mean (µg/l)
S.E.
Mean (NTU
S.E. Mean (µg/l)
S.E. Mean NTU)
S.E.
JMSTF 1 10.2 0.1 22.1 0.1 5.3 0.0 21.6 0.1 4.2 0.0 26.5 0.1 JMSTF 2 7.6 0.1 15.0 0.2 3.4 0.0 16.6 0.1 3.3 0.0 11.7 0.1
1 Measured directly through DATAFLOW in vivo fluorescence 2 Secchi goal of 0.4 m for SAV growth to 0.5 m estimated as <36 NTU. See conversion in text.

26
APPENDIX B
FIGURES

Figure 1-1. Turkey Island Vallisneria Transplant Survivorship Showing 3-year Grow Out
DATE
7/01 7/02 7/03 7/04 1/01 1/02 1/03 1/04 1/05
% S
urvi
val
0
20
40
60
80
100

Figure 2-1. Location of SAV Transplant and Water Quality Monitoring Sites
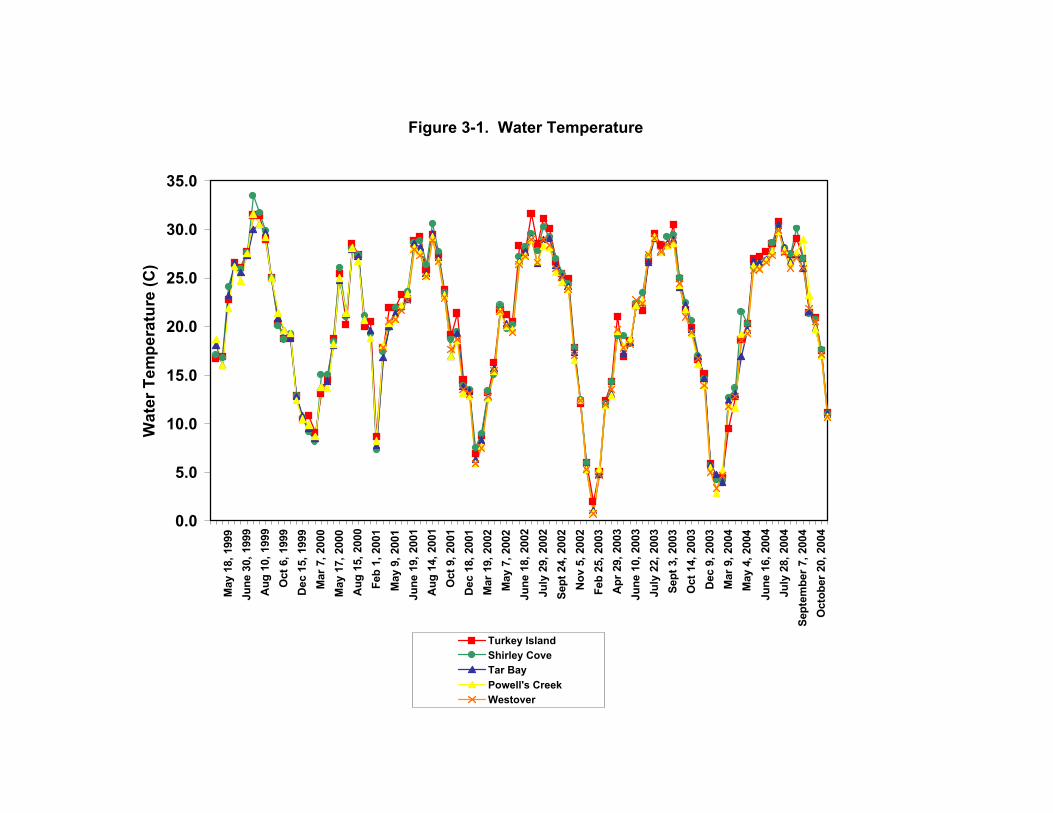
Figure 3-1. Water Temperature
0.0
5.0
10.0
15.0
20.0
25.0
30.0
35.0
May
18,
199
9Ju
ne 3
0, 1
999
Aug
10,
199
9O
ct 6
, 199
9D
ec 1
5, 1
999
Mar
7, 2
000
May
17,
200
0A
ug 1
5, 2
000
Feb
1, 2
001
May
9, 2
001
June
19,
200
1A
ug 1
4, 2
001
Oct
9, 2
001
Dec
18,
200
1M
ar 1
9, 2
002
May
7, 2
002
June
18,
200
2Ju
ly 2
9, 2
002
Sept
24,
200
2N
ov 5
, 200
2Fe
b 25
, 200
3A
pr 2
9, 2
003
June
10,
200
3Ju
ly 2
2, 2
003
Sept
3, 2
003
Oct
14,
200
3D
ec 9
, 200
3M
ar 9
, 200
4M
ay 4
, 200
4Ju
ne 1
6, 2
004
July
28,
200
4Se
ptem
ber 7
, 200
4O
ctob
er 2
0, 2
004
Wat
er T
empe
ratu
re (C
)
Turkey IslandShirley CoveTar BayPowell's CreekWestover

Figure 3-2. Conductivity
0.0
500.0
1000.0
1500.0
2000.0
2500.0
3000.0
3500.0
May
18,
199
9Ju
ne 3
0, 1
999
Aug
10,
199
9O
ct 6
, 199
9D
ec 1
5, 1
999
Mar
7, 2
000
May
17,
200
0A
ug 1
5, 2
000
Feb
1, 2
001
May
9, 2
001
June
19,
200
1A
ug 1
4, 2
001
Oct
9, 2
001
Dec
18,
200
1M
ar 1
9, 2
002
May
7, 2
002
June
18,
200
2Ju
ly 2
9, 2
002
Sept
24,
200
2N
ov 5
, 200
2Fe
b 25
, 200
3A
pr 2
9, 2
003
June
10,
200
3Ju
ly 2
2, 2
003
Sept
3, 2
003
Oct
14,
200
3D
ec 9
, 200
3M
ar 9
, 200
4M
ay 4
, 200
4Ju
ne 1
6, 2
004
July
28,
200
4Se
ptem
ber 7
, 200
4O
ctob
er 2
0, 2
004
Con
duct
ivity
(um
hos)
Turkey IslandShirley CoveTar BayPowell's CreekWestover

Figure 3-3. Dissolved Oxygen
5.0
7.0
9.0
11.0
13.0
15.0
17.0
19.0
May
18,
199
9Ju
ne 3
0, 1
999
Aug
10,
199
9O
ct 6
, 199
9D
ec 1
5, 1
999
Mar
7, 2
000
May
17,
200
0A
ug 1
5, 2
000
Feb
1, 2
001
May
9, 2
001
June
19,
200
1A
ug 1
4, 2
001
Oct
9, 2
001
Dec
18,
200
1M
ar 1
9, 2
002
May
7, 2
002
June
18,
200
2Ju
ly 2
9, 2
002
Sept
24,
200
2N
ov 5
, 200
2Fe
b 25
, 200
3A
pr 2
9, 2
003
June
10,
200
3Ju
ly 2
2, 2
003
Sept
3, 2
003
Oct
14,
200
3D
ec 9
, 200
3M
ar 9
, 200
4M
ay 4
, 200
4Ju
ne 1
6, 2
004
July
28,
200
4Se
ptem
ber 7
, 200
4O
ctob
er 2
0, 2
004
Dis
solv
ed O
xyge
n (m
g/l)
Turkey IslandShirley CoveTar BayPowell's CreekWestover
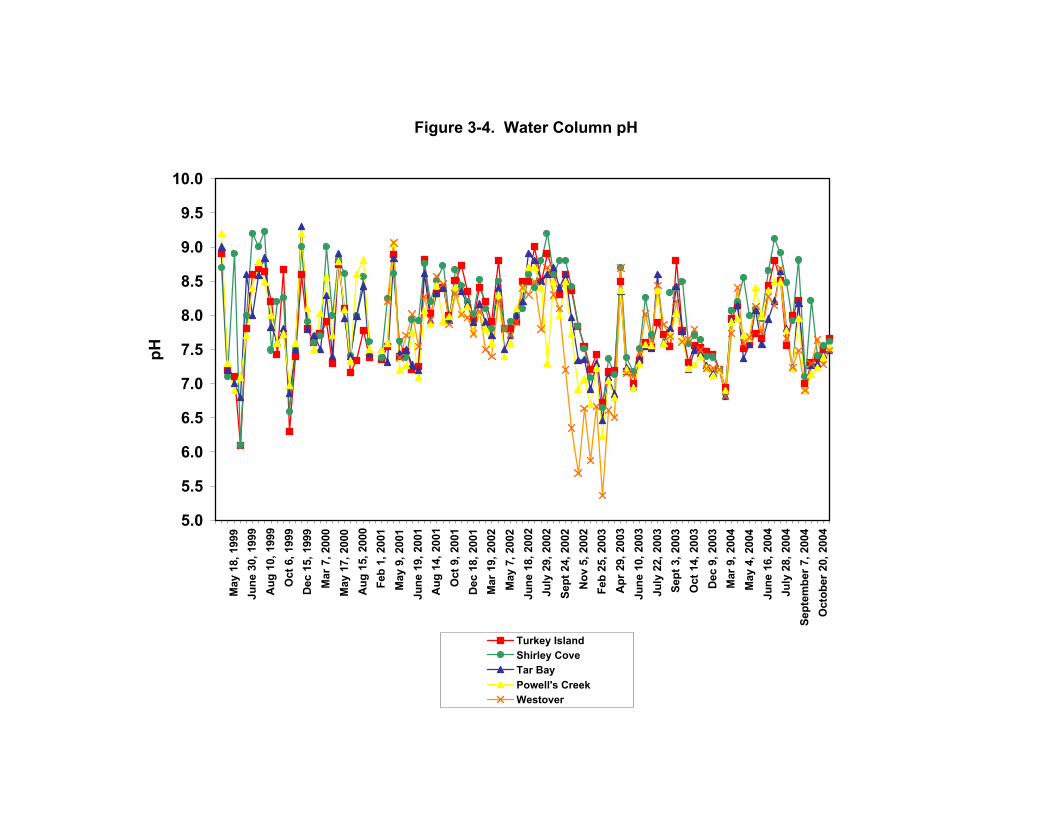
Figure 3-4. Water Column pH
5.0
5.5
6.0
6.5
7.0
7.5
8.0
8.5
9.0
9.5
10.0
May
18,
199
9Ju
ne 3
0, 1
999
Aug
10,
199
9O
ct 6
, 199
9D
ec 1
5, 1
999
Mar
7, 2
000
May
17,
200
0A
ug 1
5, 2
000
Feb
1, 2
001
May
9, 2
001
June
19,
200
1A
ug 1
4, 2
001
Oct
9, 2
001
Dec
18,
200
1M
ar 1
9, 2
002
May
7, 2
002
June
18,
200
2Ju
ly 2
9, 2
002
Sept
24,
200
2N
ov 5
, 200
2Fe
b 25
, 200
3A
pr 2
9, 2
003
June
10,
200
3Ju
ly 2
2, 2
003
Sept
3, 2
003
Oct
14,
200
3D
ec 9
, 200
3M
ar 9
, 200
4M
ay 4
, 200
4Ju
ne 1
6, 2
004
July
28,
200
4Se
ptem
ber 7
, 200
4O
ctob
er 2
0, 2
004
pH
Turkey IslandShirley CoveTar BayPowell's CreekWestover
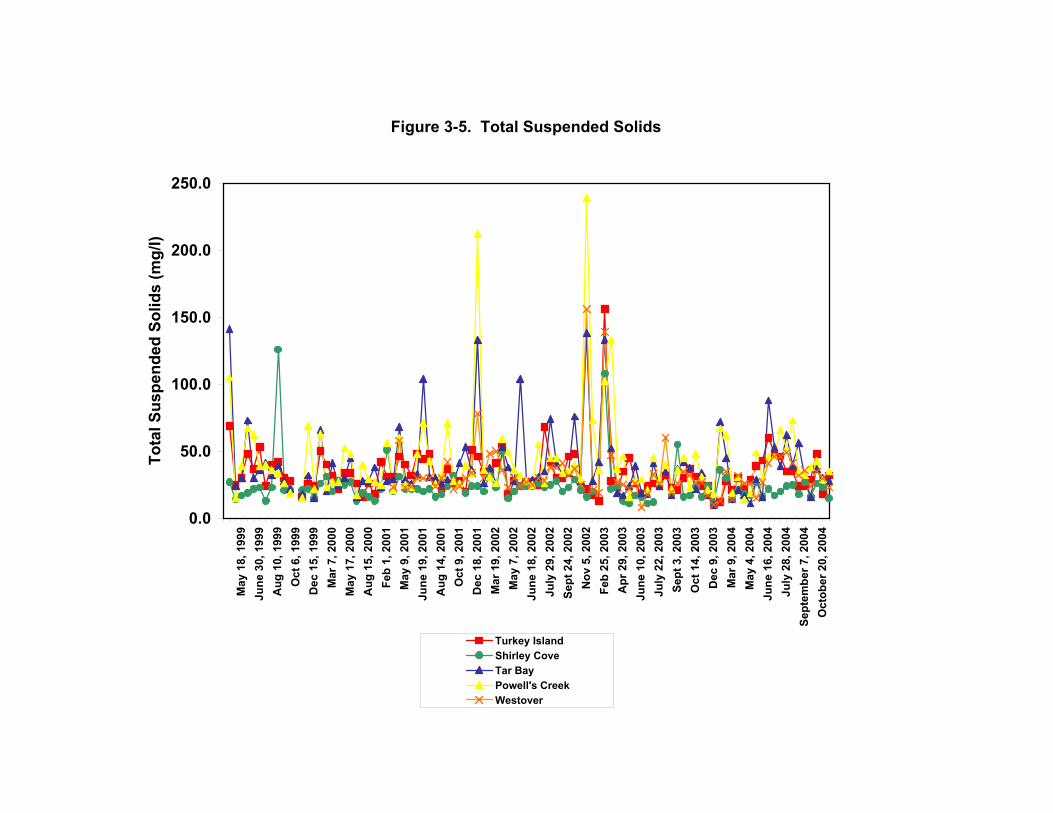
Figure 3-5. Total Suspended Solids
0.0
50.0
100.0
150.0
200.0
250.0
May
18,
199
9Ju
ne 3
0, 1
999
Aug
10,
199
9O
ct 6
, 199
9D
ec 1
5, 1
999
Mar
7, 2
000
May
17,
200
0A
ug 1
5, 2
000
Feb
1, 2
001
May
9, 2
001
June
19,
200
1A
ug 1
4, 2
001
Oct
9, 2
001
Dec
18,
200
1M
ar 1
9, 2
002
May
7, 2
002
June
18,
200
2Ju
ly 2
9, 2
002
Sept
24,
200
2N
ov 5
, 200
2Fe
b 25
, 200
3A
pr 2
9, 2
003
June
10,
200
3Ju
ly 2
2, 2
003
Sept
3, 2
003
Oct
14,
200
3D
ec 9
, 200
3M
ar 9
, 200
4M
ay 4
, 200
4Ju
ne 1
6, 2
004
July
28,
200
4Se
ptem
ber 7
, 200
4O
ctob
er 2
0, 2
004
Tota
l Sus
pend
ed S
olid
s (m
g/l)
Turkey IslandShirley CoveTar BayPowell's CreekWestover
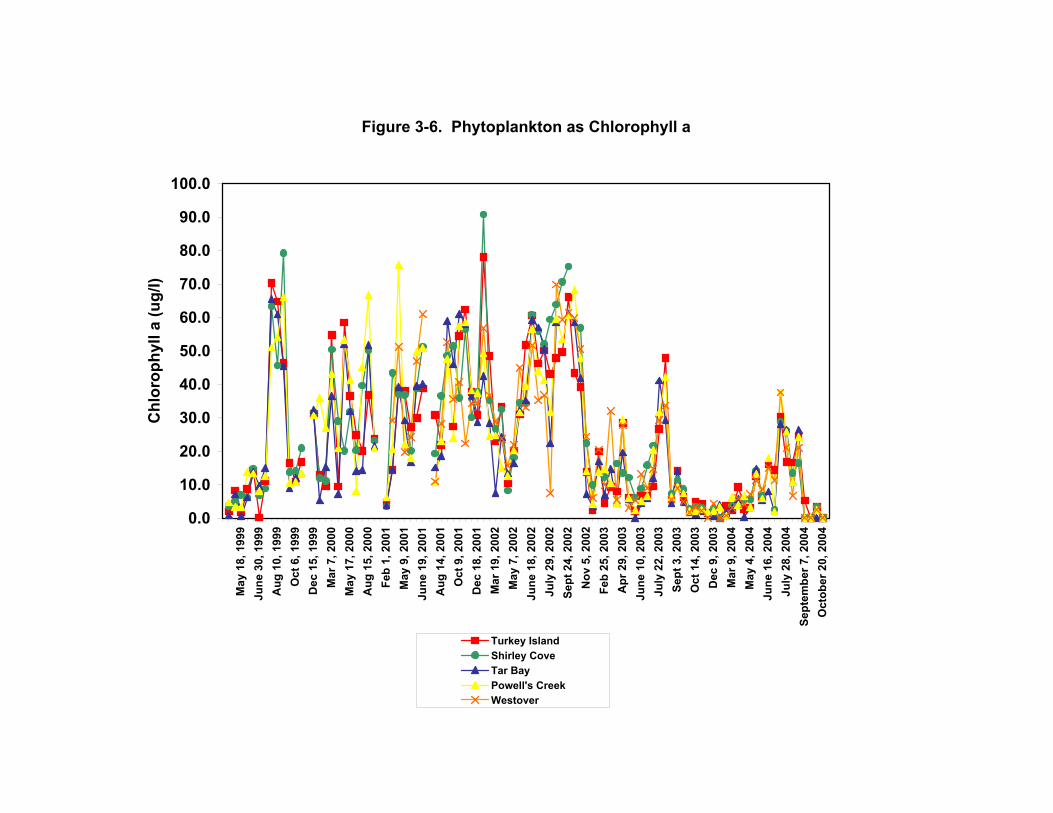
Figure 3-6. Phytoplankton as Chlorophyll a
0.0
10.0
20.0
30.0
40.0
50.0
60.0
70.0
80.0
90.0
100.0
May
18,
199
9Ju
ne 3
0, 1
999
Aug
10,
199
9O
ct 6
, 199
9D
ec 1
5, 1
999
Mar
7, 2
000
May
17,
200
0A
ug 1
5, 2
000
Feb
1, 2
001
May
9, 2
001
June
19,
200
1A
ug 1
4, 2
001
Oct
9, 2
001
Dec
18,
200
1M
ar 1
9, 2
002
May
7, 2
002
June
18,
200
2Ju
ly 2
9, 2
002
Sept
24,
200
2N
ov 5
, 200
2Fe
b 25
, 200
3A
pr 2
9, 2
003
June
10,
200
3Ju
ly 2
2, 2
003
Sept
3, 2
003
Oct
14,
200
3D
ec 9
, 200
3M
ar 9
, 200
4M
ay 4
, 200
4Ju
ne 1
6, 2
004
July
28,
200
4Se
ptem
ber 7
, 200
4O
ctob
er 2
0, 2
004
Chl
orop
hyll
a (u
g/l)
Turkey IslandShirley CoveTar BayPowell's CreekWestover

Figure 3-7. Secchi Depth
0.00
0.10
0.20
0.30
0.40
0.50
0.60
0.70
0.80
0.90
1.00
May
18,
199
9Ju
ne 3
0, 1
999
Aug
10,
199
9O
ct 6
, 199
9D
ec 1
5, 1
999
Mar
7, 2
000
May
17,
200
0A
ug 1
5, 2
000
Feb
1, 2
001
May
9, 2
001
June
19,
200
1A
ug 1
4, 2
001
Oct
9, 2
001
Dec
18,
200
1M
ar 1
9, 2
002
May
7, 2
002
June
18,
200
2Ju
ly 2
9, 2
002
Sept
24,
200
2N
ov 5
, 200
2Fe
b 25
, 200
3A
pr 2
9, 2
003
June
10,
200
3Ju
ly 2
2, 2
003
Sept
3, 2
003
Oct
14,
200
3D
ec 9
, 200
3M
ar 9
, 200
4M
ay 4
, 200
4Ju
ne 1
6, 2
004
July
28,
200
4Se
ptem
ber 7
, 200
4O
ctob
er 2
0, 2
004
Secc
hi D
epth
(C)
Turkey IslandShirley CoveTar BayPowell's CreekWestover

Figure 3-8. Total Organic Carbon
0.0
5.0
10.0
15.0
20.0
25.0
30.0
May
18,
199
9Ju
ne 3
0, 1
999
Aug
10,
199
9O
ct 6
, 199
9D
ec 1
5, 1
999
Mar
7, 2
000
May
17,
200
0A
ug 1
5, 2
000
Feb
1, 2
001
May
9, 2
001
June
19,
200
1A
ug 1
4, 2
001
Oct
9, 2
001
Dec
18,
200
1M
ar 1
9, 2
002
May
7, 2
002
June
18,
200
2Ju
ly 2
9, 2
002
Sept
24,
200
2N
ov 5
, 200
2Fe
b 25
, 200
3A
pr 2
9, 2
003
June
10,
200
3Ju
ly 2
2, 2
003
Sept
3, 2
003
Oct
14,
200
3D
ec 9
, 200
3M
ar 9
, 200
4M
ay 4
, 200
4Ju
ne 1
6, 2
004
July
28,
200
4Se
ptem
ber 7
, 200
4O
ctob
er 2
0, 2
004
TOC
(mg/
l)
Turkey IslandShirley CoveTar BayPowell's CreekWestover

Figure 3-9. Total Kjeldahl Nitrogen
0.0
1.0
2.0
3.0
4.0
5.0
6.0
7.0
8.0
May
18,
199
9Ju
ne 3
0, 1
999
Aug
10,
199
9O
ct 6
, 199
9D
ec 1
5, 1
999
Mar
7, 2
000
May
17,
200
0A
ug 1
5, 2
000
Feb
1, 2
001
May
9, 2
001
June
19,
200
1A
ug 1
4, 2
001
Oct
9, 2
001
Dec
18,
200
1M
ar 1
9, 2
002
May
7, 2
002
June
18,
200
2Ju
ly 2
9, 2
002
Sept
24,
200
2N
ov 5
, 200
2Fe
b 25
, 200
3A
pr 2
9, 2
003
June
10,
200
3Ju
ly 2
2, 2
003
Sept
3, 2
003
Oct
14,
200
3D
ec 9
, 200
3M
ar 9
, 200
4M
ay 4
, 200
4Ju
ne 1
6, 2
004
July
28,
200
4Se
ptem
ber 7
, 200
4O
ctob
er 2
0, 2
004
TKN
(mg/
l)
Turkey IslandShirley CoveTar BayPowell's CreekWestover
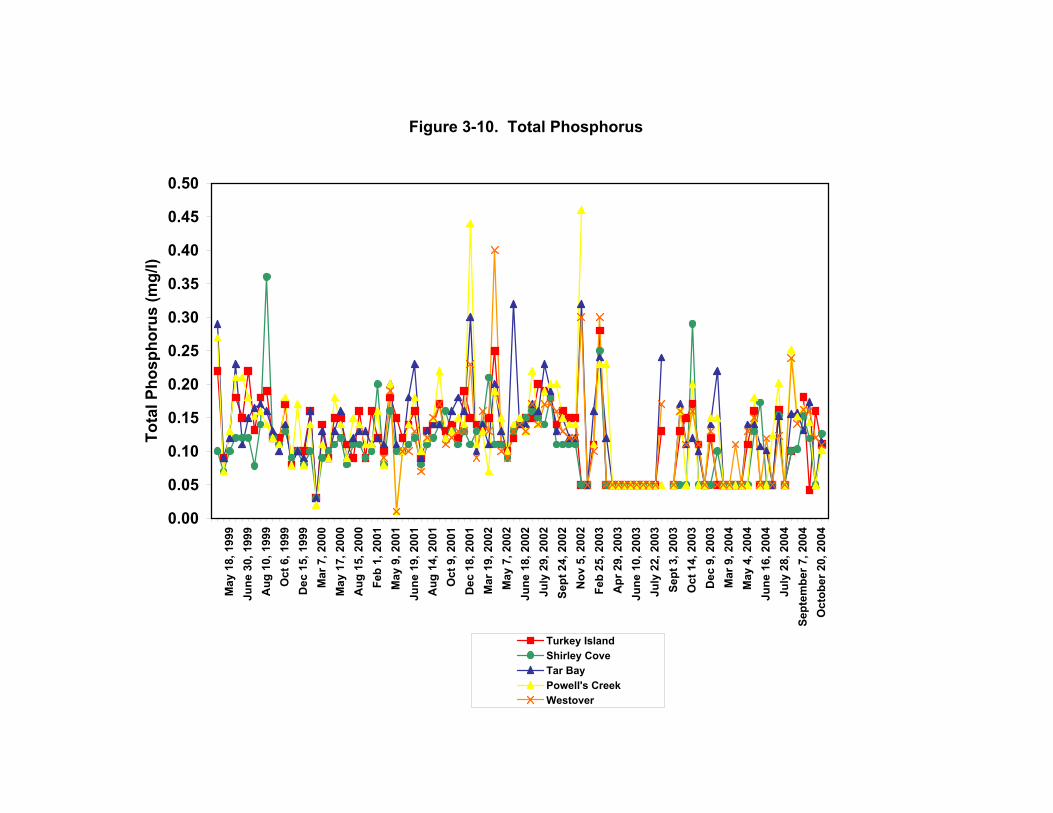
Figure 3-10. Total Phosphorus
0.00
0.05
0.10
0.15
0.20
0.25
0.30
0.35
0.40
0.45
0.50
May
18,
199
9Ju
ne 3
0, 1
999
Aug
10,
199
9O
ct 6
, 199
9D
ec 1
5, 1
999
Mar
7, 2
000
May
17,
200
0A
ug 1
5, 2
000
Feb
1, 2
001
May
9, 2
001
June
19,
200
1A
ug 1
4, 2
001
Oct
9, 2
001
Dec
18,
200
1M
ar 1
9, 2
002
May
7, 2
002
June
18,
200
2Ju
ly 2
9, 2
002
Sept
24,
200
2N
ov 5
, 200
2Fe
b 25
, 200
3A
pr 2
9, 2
003
June
10,
200
3Ju
ly 2
2, 2
003
Sept
3, 2
003
Oct
14,
200
3D
ec 9
, 200
3M
ar 9
, 200
4M
ay 4
, 200
4Ju
ne 1
6, 2
004
July
28,
200
4Se
ptem
ber 7
, 200
4O
ctob
er 2
0, 2
004
Tota
l Pho
spho
rus
(mg/
l)
Turkey IslandShirley CoveTar BayPowell's CreekWestover

Figure 3-11. Dissolved Nitrate + Nitrite
0.00
0.10
0.20
0.30
0.40
0.50
0.60
0.70
0.80
0.90
1.00
May
18,
199
9Ju
ne 3
0, 1
999
Aug
10,
199
9O
ct 6
, 199
9D
ec 1
5, 1
999
Mar
7, 2
000
May
17,
200
0A
ug 1
5, 2
000
Feb
1, 2
001
May
9, 2
001
June
19,
200
1A
ug 1
4, 2
001
Oct
9, 2
001
Dec
18,
200
1M
ar 1
9, 2
002
May
7, 2
002
June
18,
200
2Ju
ly 2
9, 2
002
Sept
24,
200
2N
ov 5
, 200
2Fe
b 25
, 200
3A
pr 2
9, 2
003
June
10,
200
3Ju
ly 2
2, 2
003
Sept
3, 2
003
Oct
14,
200
3D
ec 9
, 200
3M
ar 9
, 200
4M
ay 4
, 200
4Ju
ne 1
6, 2
004
July
28,
200
4Se
ptem
ber 7
, 200
4O
ctob
er 2
0, 2
004
Nitr
ate
+ N
itrite
(mg/
l)
Turkey IslandShirley CoveTar BayPowell's CreekWestover

Figure 3-12. Dissolved Ammonium
0.00
0.20
0.40
0.60
0.80
1.00
1.20
1.40
1.60
1.80
2.00
May
18,
199
9Ju
ne 3
0, 1
999
Aug
10,
199
9O
ct 6
, 199
9D
ec 1
5, 1
999
Mar
7, 2
000
May
17,
200
0A
ug 1
5, 2
000
Feb
1, 2
001
May
9, 2
001
June
19,
200
1A
ug 1
4, 2
001
Oct
9, 2
001
Dec
18,
200
1M
ar 1
9, 2
002
May
7, 2
002
June
18,
200
2Ju
ly 2
9, 2
002
Sept
24,
200
2N
ov 5
, 200
2Fe
b 25
, 200
3A
pr 2
9, 2
003
June
10,
200
3Ju
ly 2
2, 2
003
Sept
3, 2
003
Oct
14,
200
3D
ec 9
, 200
3M
ar 9
, 200
4M
ay 4
, 200
4Ju
ne 1
6, 2
004
July
28,
200
4Se
ptem
ber 7
, 200
4O
ctob
er 2
0, 2
004
Am
mon
ium
(mg/
l)
Turkey IslandShirley CoveTar BayPowell's CreekWestover

Figure 3-13. Dissolved Inorganic Phosphate
0.00
0.02
0.04
0.06
0.08
0.10
0.12
0.14
0.16
0.18
0.20
May
18,
199
9Ju
ne 3
0, 1
999
Aug
10,
199
9O
ct 6
, 199
9D
ec 1
5, 1
999
Mar
7, 2
000
May
17,
200
0A
ug 1
5, 2
000
Feb
1, 2
001
May
9, 2
001
June
19,
200
1A
ug 1
4, 2
001
Oct
9, 2
001
Dec
18,
200
1M
ar 1
9, 2
002
May
7, 2
002
June
18,
200
2Ju
ly 2
9, 2
002
Sept
24,
200
2N
ov 5
, 200
2Fe
b 25
, 200
3A
pr 2
9, 2
003
June
10,
200
3Ju
ly 2
2, 2
003
Sept
3, 2
003
Oct
14,
200
3D
ec 9
, 200
3M
ar 9
, 200
4M
ay 4
, 200
4Ju
ne 1
6, 2
004
July
28,
200
4Se
ptem
ber 7
, 200
4O
ctob
er 2
0, 2
004
Ort
hoph
osph
ate
(mg/
l)
Turkey IslandShirley CoveTar BayPowell's CreekWestover
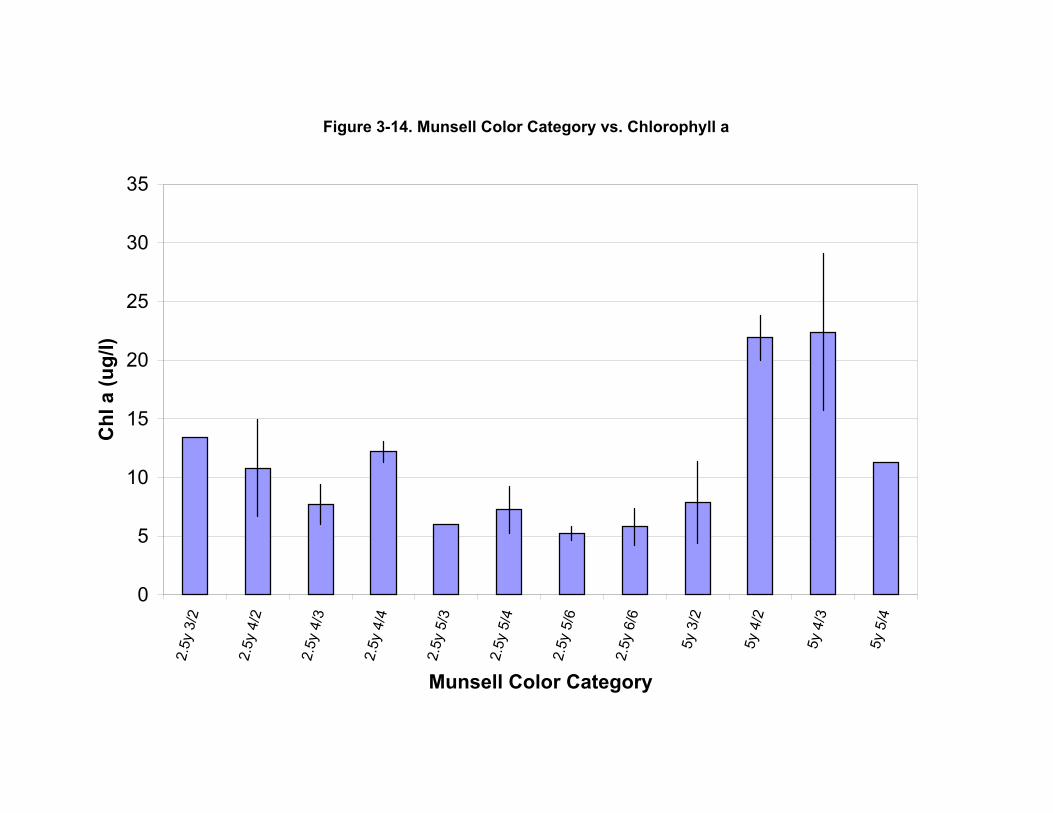
Figure 3-14. Munsell Color Category vs. Chlorophyll a
0
5
10
15
20
25
30
352.
5y 3
/2
2.5y
4/2
2.5y
4/3
2.5y
4/4
2.5y
5/3
2.5y
5/4
2.5y
5/6
2.5y
6/6
5y 3
/2
5y 4
/2
5y 4
/3
5y 5
/4
Munsell Color Category
Chl
a (u
g/l)

Figure 3-15. High Angle Water Color Photography; May 4, 2004; Sunny Mid-day; Shade Side (top); Sun Side (bottom)
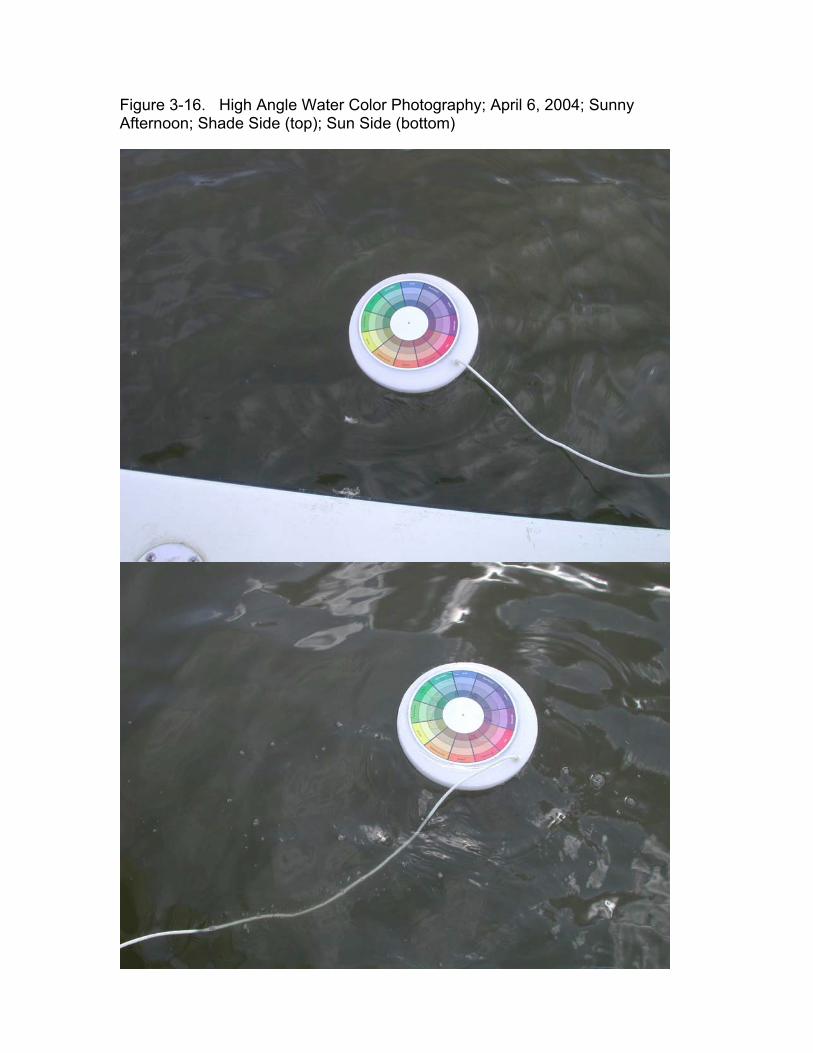
Figure 3-16. High Angle Water Color Photography; April 6, 2004; Sunny Afternoon; Shade Side (top); Sun Side (bottom)

Figure 3-17. High Angle Water Color Photography; December 14, 2004; Sunny Mid-day; Shade Side (top); Sunny Side (bottom)
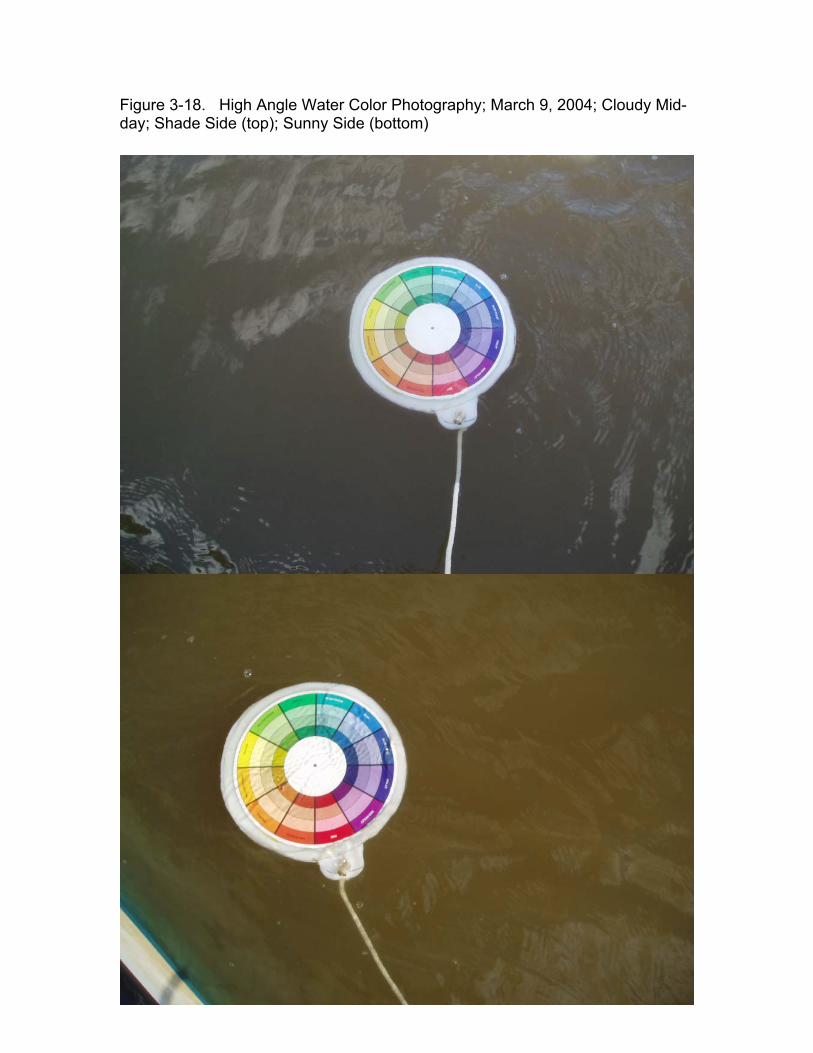
Figure 3-18. High Angle Water Color Photography; March 9, 2004; Cloudy Mid-day; Shade Side (top); Sunny Side (bottom)

Chlorophyll (ug/L)
0 - 10
10 - 20
20 - 30
30 - 40
40 - 50
50+
Dissolved Oxygen (mg/L)0 - 1
1 - 3
3 - 5
5 - 7
7 - 9
9 - 12
Turbidity (NTU)
0 - 10
10 - 20
20 - 30
30 - 40
40 - 50
50+
Upper James River Dataflow Cruise May 19, 2004Figure 3-19. James River DATAFLOW Cruise Track, May 19, 2004

Upper James River 05-19-04
0.00
2.00
4.00
6.00
8.00
10.00
12.00
0 5 10 15 20 25 30 35 40 45 50 55 60 65
Cruise Mile
Dis
solv
ed O
xyg
en (
mg
/l)
Mou
th o
f Chi
ckah
omin
y
Shirl
ey P
lant
atio
n
Turk
ey Is
land
I-29
5 B
ridge
I-95
Brid
ge
W.
Plan
tatio
nP.
Cre
ek
Tar B
ay
JMSTF 1 JMSTF 2
Figure 3-20. James River DATAFLOW Dissolved Oxygen, May 19, 2004

Upper James River 05-19-04
0.0
5.0
10.0
15.0
20.0
25.0
0 5 10 15 20 25 30 35 40 45 50 55 60 65
Cruise Mile
Ch
loro
ph
yll (
ug
/l)
Mouth of C
hickahominy
Shirl
ey P
lant
atio
n
Turk
ey Is
land
I-295 Bridge
I-95 Bridge
W.
Plan
tatio
nP.
Cre
ek
Tar B
ay
JMSTF 1 JMSTF 2
Figure 3-21. James River DATAFLOW Chlorophyll, May 19, 2004

Upper James River 05-19-04
0.00
5.00
10.00
15.00
20.00
25.00
30.00
35.00
40.00
45.00
0 5 10 15 20 25 30 35 40 45 50 55 60 65
Cruise Mile
Tu
rbid
ity (
NT
U)
Mouth of C
hickahominy
Shirl
ey P
lant
atio
n
Turk
ey Is
land
I-295 Bridge
I-95 Bridge
W.
Plan
tatio
nP.
Cre
ek
Tar B
ay
JMSTF 1 JMSTF 2
Figure 3-22. James River DATAFLOW Turbidity, May 19, 2004

Chlorophyll (ug/L)
0 - 10
10 - 20
20 - 30
30 - 40
40 - 50
50+
Dissolved Oxygen (mg/L)0 - 1
1 - 3
3 - 5
5 - 7
7 - 9
9 - 12
Turbidity (NTU)
0 - 10
10 - 20
20 - 30
30 - 40
40 - 50
50+
Upper James River Dataflow Cruise Sept 23, 2004Figure 3-23. James River DATAFLOW Cruise Track, September 23, 2004

Upper James River 09-23-04
0.00
2.00
4.00
6.00
8.00
10.00
12.00
0.0 5.0 10.0 15.0 20.0 25.0 30.0 35.0 40.0 45.0 50.0 55.0 60.0 65.0 70.0
Cruise Mile
Dis
solv
ed O
xyge
n (m
g/l)
Mou
th o
f Chi
ckah
omin
y
Shirl
ey P
lant
atio
n
Turk
ey Is
land
I-29
5 B
ridge
I-95
Brid
ge
W.
Plan
tatio
nP.
Cre
ek
Tar B
ay
JMSTF 1 JMSTF 2
Figure 3-24. James River DATAFLOW Dissolved Oxygen, September 23, 2004
Upper James River 09-23-04
0.0
5.0
10.0
15.0
20.0
25.0
0.0 5.0 10.0 15.0 20.0 25.0 30.0 35.0 40.0 45.0 50.0 55.0 60.0 65.0 70.0
Cruise Mile
Ch
loro
ph
yll (
ug/
l)
Mouth of C
hickahominy
Shirley Plantation
Turkey Island
I-295 Bridge
I-95 Bridge
W. Plantation
P. Creek
Tar Bay
JMSTF 1 JMSTF 2
Figure 3-25. James River DATAFLOW Chlorophyll, September 23, 2004
Upper James River 09-23-04
0.00
5.00
10.00
15.00
20.00
25.00
30.00
35.00
40.00
45.00
0.0 5.0 10.0 15.0 20.0 25.0 30.0 35.0 40.0 45.0 50.0 55.0 60.0 65.0 70.0
Cruise Mile
Tur
bidi
ty (N
TU
)
Mouth of C
hickahominy
Shirley Plantation
Turkey Island
I-295 Bridge
I-95 Bridge
W. Plantation
P. Creek
Tar Bay
JMSTF 1 JMSTF 2
Figure 3-26. James River DATAFLOW Turbidity, September 23, 2004

Chlorophyll (ug/L)
0 - 10
10 - 20
20 - 30
30 - 40
40 - 50
50+
Dissolved Oxygen (mg/L)0 - 1
1 - 3
3 - 5
5 - 7
7 - 9
9 - 12
Turbidity (NTU)
0 - 10
10 - 20
20 - 30
30 - 40
40 - 50
50+
Upper James River Dataflow Cruise Nov 9, 2004Figure 3-27. James River DATAFLOW Cruise Track, November 9, 2004

Upper James River 11-09-04
0.00
2.00
4.00
6.00
8.00
10.00
12.00
0.0 5.0 10.0 15.0 20.0 25.0 30.0 35.0 40.0 45.0 50.0 55.0 60.0 65.0
Cruise mile
Dis
solv
ed O
xyge
n (m
g/l)
Mou
th o
f Chi
ckah
omin
y
Shirl
ey P
lant
atio
n
Turk
ey Is
land
I-29
5 B
ridge
I-95
Brid
ge
W.
Plan
tatio
nP.
Cre
ek
Tar B
ay
JMSTF 1 JMSTF 2
Figure 3-28. James River DATAFLOW Dissolved Oxygen, November 9, 2004

Upper James River 11-09-04
0.0
5.0
10.0
15.0
20.0
25.0
0.0 5.0 10.0 15.0 20.0 25.0 30.0 35.0 40.0 45.0 50.0 55.0 60.0 65.0
Cruise mile
Chl
orop
hyll
(ug/
l)
Mouth of C
hickahominy
Shirley Plantation
Turkey Island
I-295 Bridge
I-95 Bridge
W. Plantation
P. Creek
Tar Bay
JMSTF 1 JMSTF 2
Figure 3-29. James River DATAFLOW Chlorophyll, November 9, 2004

Upper James River 11-09-04
0.00
5.00
10.00
15.00
20.00
25.00
30.00
35.00
40.00
45.00
0.0 5.0 10.0 15.0 20.0 25.0 30.0 35.0 40.0 45.0 50.0 55.0 60.0 65.0
Cruise mile
Turb
idity
(NTU
)
Mou
th o
f Chi
ckah
omin
y
Shirley Plantation
Turkey Island
I-295 Bridge
I-95 Bridge
W.
Plan
tatio
nP.
Cre
ek
Tar B
ay
JMSTF 1 JMSTF 2
Figure 3-30. James River DATAFLOW Turbidity, November 9, 2004

Wes
tove
r%
Sur
viva
l
0
20
40
60
80
100
DATE
1/03 5/03 9/03 1/04 5/04 9/04 1/05
Turk
ey Is
land
% S
urvi
val
0
20
40
60
80
100
Pow
ell's
Cre
ek%
Sur
viva
l
0
20
40
60
80
100
TarB
ay%
Sur
viva
l
0
20
40
60
80
100
Figure 3-31. James River 2003-2004 SAV Transplant Survivorship