water quality and health challenges law sch jrose
TRANSCRIPT

Water Quality and Health Challenges and Solutions
Dr. Joan B. Rose Homer Nowlin Chair in Water Research
Michigan State [email protected]
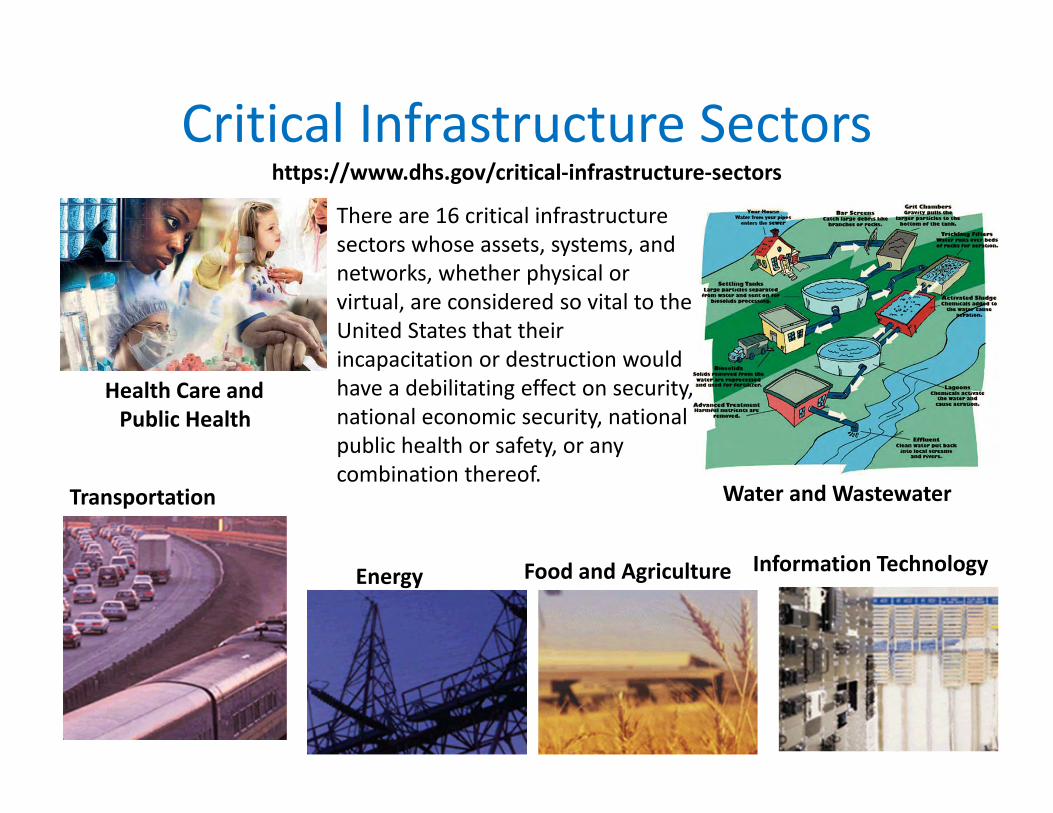
Critical Infrastructure Sectorshttps://www.dhs.gov/critical‐infrastructure‐sectors
There are 16 critical infrastructure sectors whose assets, systems, and networks, whether physical or virtual, are considered so vital to the United States that their incapacitation or destruction would have a debilitating effect on security, national economic security, national public health or safety, or any combination thereof.
Water and WastewaterTransportation
Information Technology Energy Food and Agriculture
Health Care and Public Health
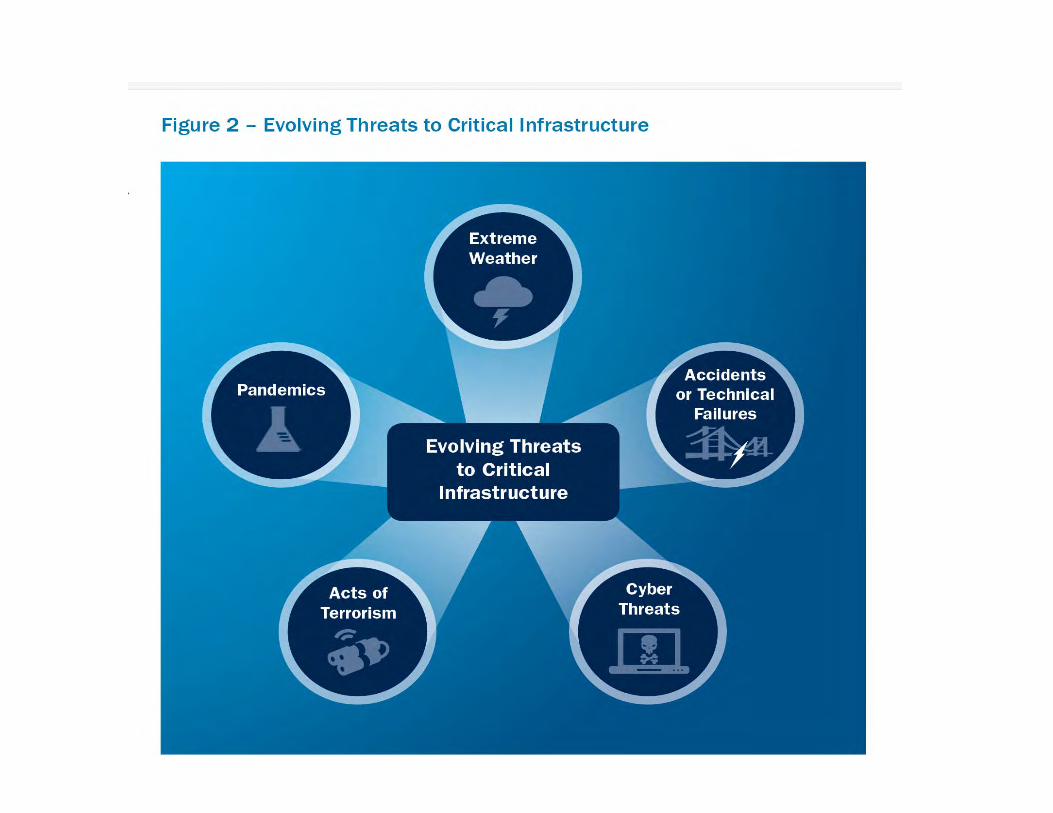

Lloyd’s City Risk Index of 301 cities showsNatural threats are estimated at$2.43 trillion dollars in risk.

Infrastructure By the NumbersWater
• 1.8 million miles of distribution lines
• 14.5% of Americans rely on their own water sources (wells)
• As of 2016, there are over 150,000 public drinking water systems in the United States―systems that have 15 or more connections or serve more than 25 people.
• 3% serve are large and serve 79% of the population.
• $1 trillion needed in the next 25 years for restoration
Sanitation
• 1.2 million miles of sewers• 17% of Americans are served by
on‐site sanitation (septic tanks)• Publicly owned wastewater
treatment plants serve 189.7 million people and treat 32.1 billion gallons per day.
• 15,848 wastewater treatment plants 9,388 facilities provide secondary treatment, 4,428 facilities provide advanced treatment, and 2,032 facilities do not discharge.
• $271 billion to meet current and future demands in the next decade.
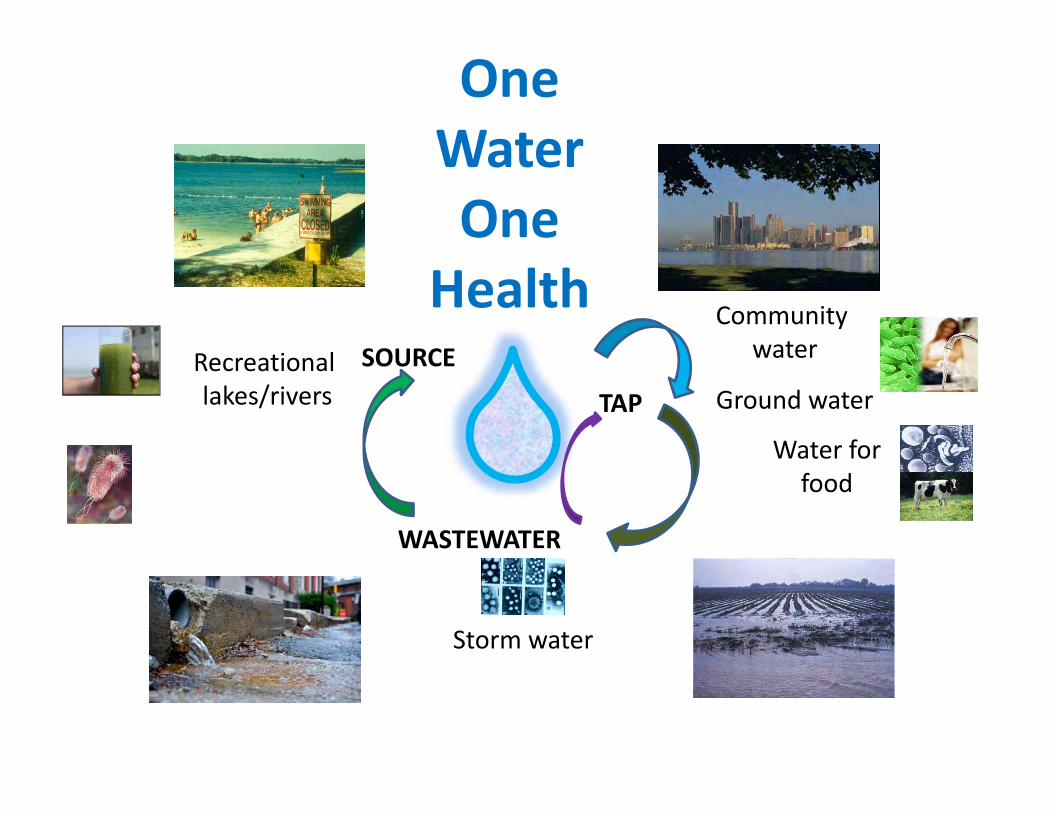
One Water One
Health SOURCE
TAP
WASTEWATER
Storm water
Recreationallakes/rivers
Communitywater
Water for food
Ground water


Recreational Irrigation Drinking
Water Quality No chemical or biological contaminants
At levels that cause harm
Seafood
SLIDE adapted from DR. JEANETTE THURSTON

Types of Microbial Hazards: Waterborne
Viruses Bacteria Parasites
THE DISEASES: diarrhea, respiratory illness, liver damage, kidney failure, heart disease, cancer, nervous system disorders;
birth defects, death.

Fecal contamination of water remains one of the largest threats to the biological safety of water today.

U.S. Drinking Water Outbreaks (1920‐to 2000)
Drinking water

U.S. Drinking Water Outbreaks by the Decade

Etiology of 885 drinking water–associated outbreaks, by year —United States, 1971–2012*MMWR: http://www.cdc.gov/mmwr/preview/mmwrhtml/mm6431a2.htm
DISEASE FROM 1971 to 2012
• 2011–2012, 32 drinking water–associated outbreaks were reported431 cases of illness, 102 hospitalizations, and 14 deaths
• Legionella was responsible for 66% of outbreaks and 26% of illnesses• Most commonly identified deficiencies leading to drinking water–associated outbreaks were
Legionella in building plumbing systems (66%) and untreated groundwater (13%)

Risk of Disease Rises With Water TemperaturesBy Kari Lydersen Washington Post Staff Writer
Monday, October 20, 2008
CLIMATE AND DISEASE


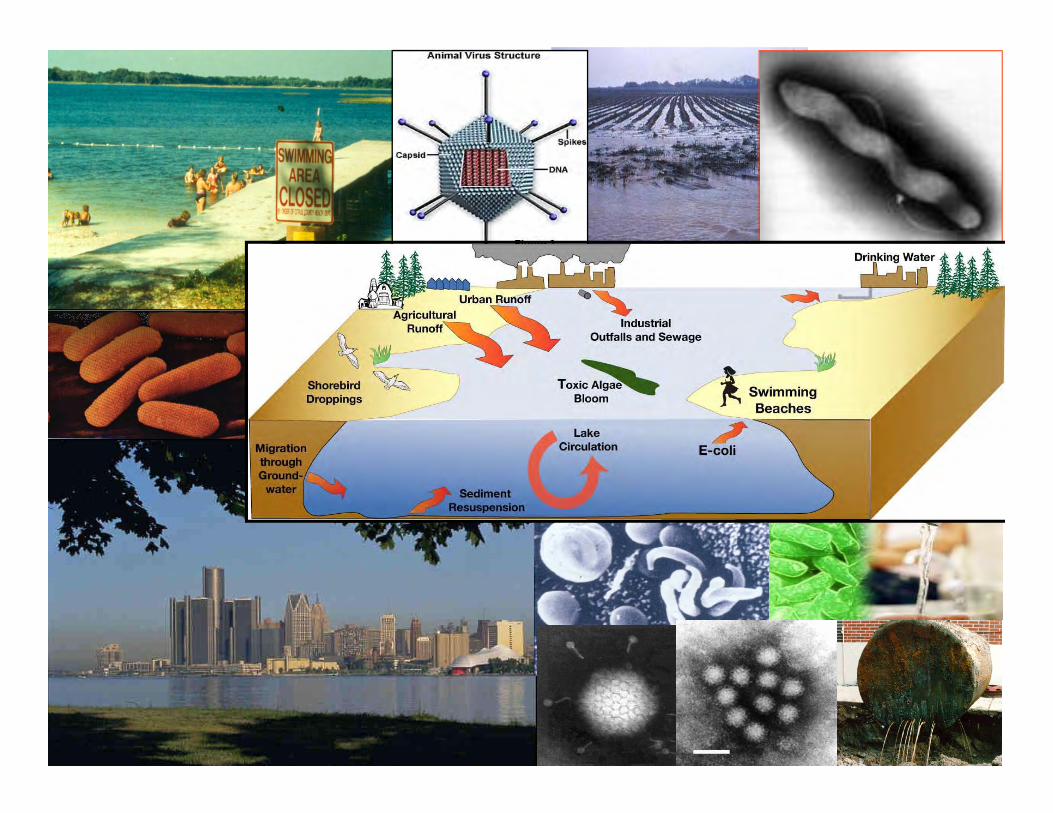
Waterborne pathogens threaten human health in the Great Lakes region
Campylobacter, Arcobacter, Giardia
Legionella
Cryptosporidium
Toxic Algal blooms
Norovirus
E.Coli 0157H7 and
Campylobacter
A sample glass of Lake Erie water is photographed near the Toledo water intake crib in Lake Erie.
(Haraz N. Ghanbari/Associated Press)
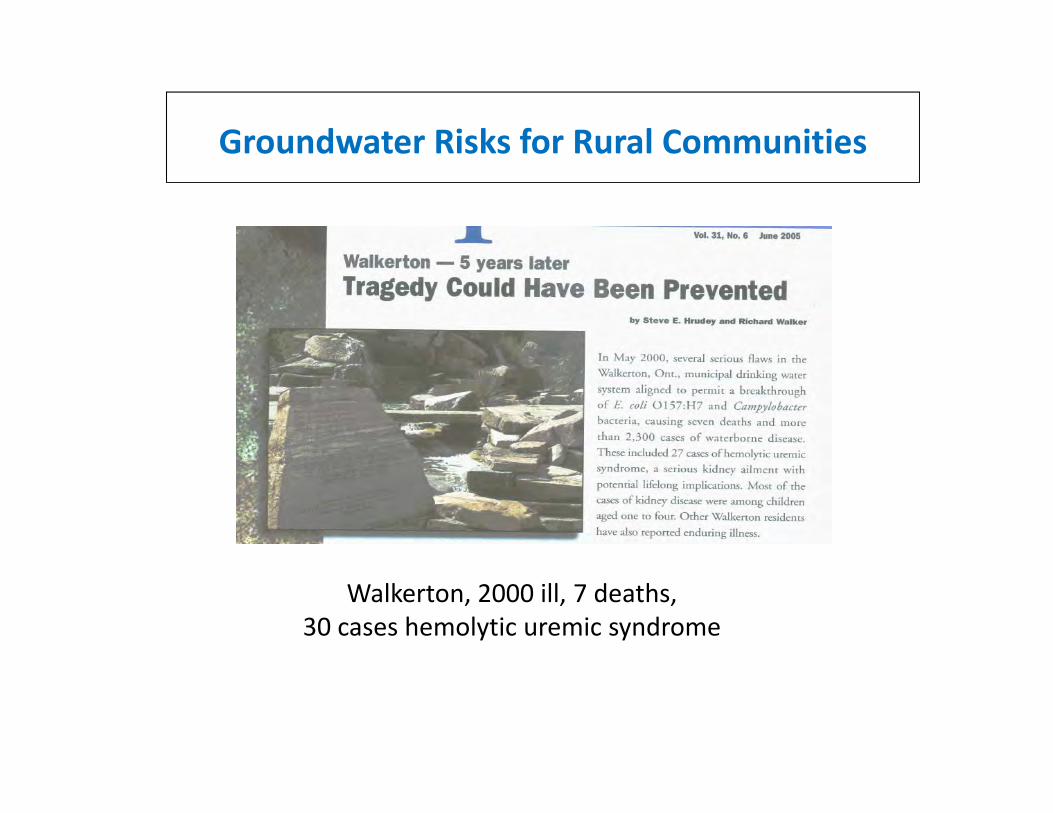
Groundwater Risks for Rural Communities
Walkerton, 2000 ill, 7 deaths, 30 cases hemolytic uremic syndrome

Ohio blames groundwater for Lake Erie island outbreak
Tuesday, February 22, 2005ASSOCIATED PRESS
TOLEDO, Ohio ‐‐Widespread groundwater contamination on a Lake Erie resort island was the likely source of illnesses that sickened hundreds last summer, the Ohio health department said Tuesday.
Several sources, including septic tanks, have tainted the South Bass Island's groundwater over a long period, and the contamination may have been worsened last summer because of a season of heavy rains, a health department report said.
The outbreak of gastrointestinal illness sickened about 1,400 tourists and residents, ending the tourist season early for many businesses.
01020
3040506070
8090
100
T. co
liform
T. co
liform
(Coli
lert)
E. coli
E. coli
(Coli
lert)
C. per
fringe
nsEnte
rococ
ciSom
atic
F-sp
ecific
Bacterial Indicators
Perc
enta
ge (%
)
MSU assisted with the investigationIdentified virus contamination and potentially a new and emerging bacteria


The Risk to Human Health: US estimates of
endemic waterborne disease
• ~19 Million waterborne illnesses /yr for community water systems in the US
5.4 M illnesses from groundwater13 Million illnesses from surface water systems.(Reynolds et al. 2008)• 12 Million cases/yr(Colford et al. 2006) • 16 Million cases/yr(Messner et al. 2006)

SAFE DRINKING WATER ACT • National Policy for safe drinking water. Health focus: MCL, treatment
regulations provides protection for sensitive populations• Total Coliform Rule• Lead and Copper Rule• Disinfection and Disinfectant By Products Rule
• Long‐Term Enhanced Surface Water Treatment Rule: Viruses, Cryptosporidium and Giardia (Legionella mentioned via chlorine control)
• Ground Water Rule
• Information Collection Rule• Unregulated Contaminate Monitoring Rule• Contaminant Candidate List
• Consumer Confidence Reports

Water Quality Standards1. Set a non‐enforceable maximum contaminant
level goal (MCLG) at a level at which no known or anticipated adverse health effects occur and that allows an adequate margin of safety.
2. Set permissible levels of contamination (MCL) Maximum Contaminant Level.
3. Established monitoring program, sample frequency, and sampling sites.
4. Standardized methodology, selectivity, sensitivity, accuracy and precision.

Performance Criteria
1. Specified the performance, treatment efficiency, and desirable end points.
2. Defined the types of treatment.
3. Included in some cases, compliance monitoring, verification and reliability.

Safe Water at the Tap• While the SDWA addresses national water quality, it will be the collective efforts of the water utilities, building/ housing and plumbing professionals that achieve safe water for consumers at the tap.
• Where ever there is water there are microbes and the distribution system and premise plumbing are no exceptions.
• There is a great need to manage the microbial biofilm for pathogens that cause disease via the plumbing system.

(http://www.huffingtonpost.com/entry/flint-water-legionnaires-lead-crisis_us_569d09d6e4b0ce4964252c33)
Water distribution systems & premise plumbing
LimeFeCl3

Source: CDC
Legionella pneumophila
Mycobacterium avium complex (MAC)
Pseudomonas aeruginosa
Naegleria fowleri
Acanthamoeba
Opportunistic pathogens are those naturally occurring microbes that opportunistically can cause disease in humans especially those who are immunocompromised
Opportunistic pathogens are now the primary source of waterborne disease in the U.S.

Amoeba in water systems
• Free‐living amoeba are ubiquitous organisms that have been isolated from domestic water systems, e.g. cooling towers, public drinking water;
• Naegleria fowleri infections occur when contaminated water enters the nose and the amoeba travels to the brain where it destroy brain tissue – a disease known as primary amebic meningoencephalitis (PAM);
• Has caused deaths associated with using disinfected public drinking water supplies in Australia and Pakistan, an untreated, geothermal well‐supplied drinking water system in Arizona and a disinfected public drinking water system in Louisiana (CDC).

Public health hospitalization costs associated with US drinking water*
• CDC estimates drinking water disease costs > $970 m/yr– Legionnaires’ disease, otitis externa, and non‐tuberculous mycobacterial (NTM) account for
>40 000 hospitalizations/year
Disease Annual costsCryptosporidiosis $46M
Giardiasis $34M
Legionnaires’ disease $434M
NTM infection/Pulmonary $426M/ $195M
*Collier et al. (2012) Epi Inf 140(11): 2003‐13
30

The CDC analyzed Legionella outbreaks it had investigated from 2000 to 2014 that involved 415 cases, including 65 deaths. Most of the outbreaks were in buildings with large or complex water systems, such as hotels, hospitals and long‐term‐care facilities.
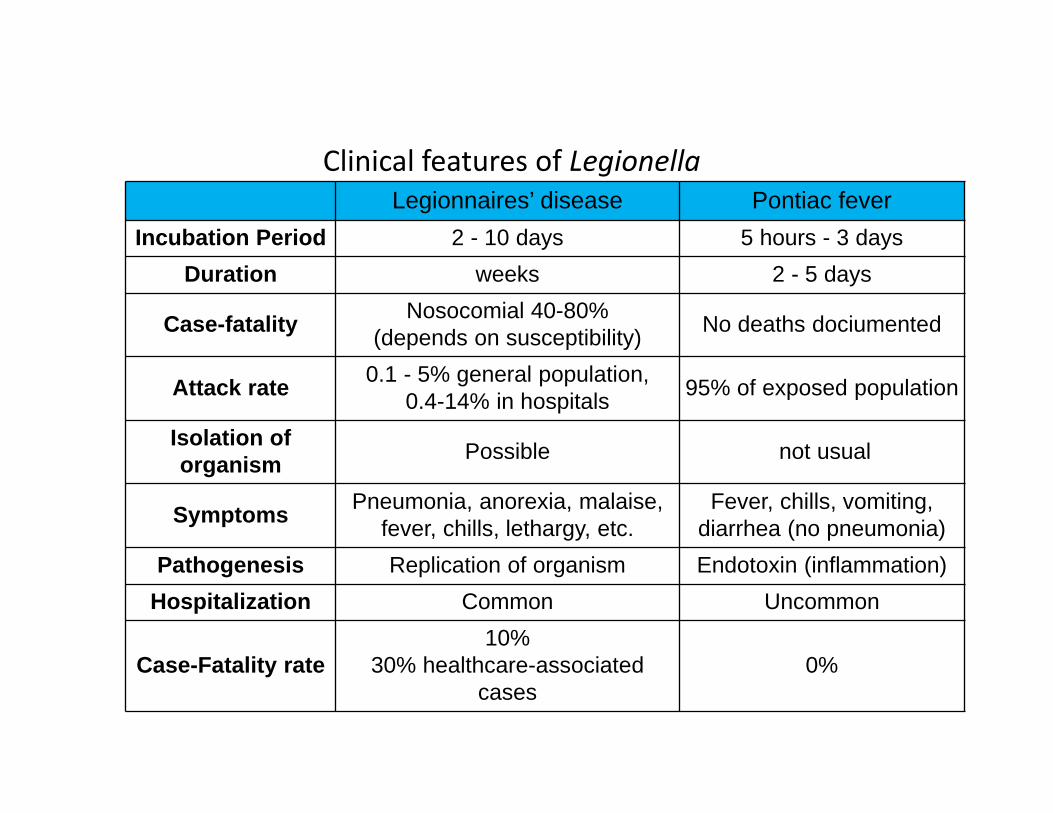
Legionnaires’ disease Pontiac feverIncubation Period 2 - 10 days 5 hours - 3 days
Duration weeks 2 - 5 days
Case-fatality Nosocomial 40-80% (depends on susceptibility) No deaths dociumented
Attack rate 0.1 - 5% general population, 0.4-14% in hospitals 95% of exposed population
Isolation of organism Possible not usual
Symptoms Pneumonia, anorexia, malaise, fever, chills, lethargy, etc.
Fever, chills, vomiting, diarrhea (no pneumonia)
Pathogenesis Replication of organism Endotoxin (inflammation)Hospitalization Common Uncommon
Case-Fatality rate10%
30% healthcare-associated cases
0%
Clinical features of Legionella

Legionnaire’ Disease:• New York Bronx July and Aug. 2015: 128 cases 12 deaths (cooling towers); Sept. 2015: 13 cases, 1 death.
• Every year, there are about 200 to 300 cases of Legionnaires’ disease in New York City
• Milwaukee, July 2013, 27 cases• Toronto, 2013: five times as many legionnaires' cases in a six‐week period this summer as it did last year (43 cases)
• Quebec, July 2012: 180 people were infected 13 people died. Office building suspected
• Chicago, 2012: 3 deaths, Hotel suspected

Flint MI: Change in source water, E.coli violation, Disinfection By Products violation, lead violation
http://www.pacificwater.org/userfiles/image/Water%20Demand%20Management/watersupplysystem.gif
provided by Dr. Susan MastenEnvironmental EngineeringMichigan State University

Flint Michigan
• Population in Flint peaked in 1960 at ~200,000• Population now <100,000. Water usage is down by 2/3, so water spends much more time in system than is conventional
• vulnerable, low‐income residents • Many older houses have lead services lines and/or plumbing (estimated at 15,000)
• Some distribution mains are thought to be lead
Slide provided by Dr. Susan MastenEnvironmental EngineeringMichigan State University

Background• The Flint plant was completed in 1954.
• Flint has purchased water from Detroit Water and Sewage Department (DWSD) since 1967.
• The source of the DWSD wateris Lake Huron and treated at the Fort Gratiot plant.
Slide provided by Dr. Susan MastenEnvironmental EngineeringMichigan State University

Timeline• September 2009 Preliminary Engineering Report, Lake
Huron Water Supply Karegnondi Water Authority issued• July 2011 Report on the evaluation of the Flint River as a
long‐term source of drinking water issued• December 2012 Michigan Treasury officials meet with Flint
city officials to discuss drinking water options, including using the Flint River
• April 16, 2013 City of Flint EM Ed Kurtz signs agreement with Karegnondi Water Authority (KWA) to supply water to Flint starting in 2016
• June 26, 2013 Ed Kurtz hires an engineering firm to determine how to equip the Flint Water Plant for the treatment of Flint River water.
Slide provided by Dr. Susan MastenEnvironmental EngineeringMichigan State University

Timeline
• March 31, 2014 Flint plant supervisor, Brent Wright, signs permit application for sludge lagoon upgrades. Application is submitted to DEQ for review and approval
• April 9, 2014 MDEQ approves permit• April 25, 2014 Flint River changeover ceremony
• April 30, 2014 DWSD Water line closedSlide provided by Dr. Susan MastenEnvironmental EngineeringMichigan State University

Timeline• June 2014 Complaints regarding water quality begin (smell, taste, discoloration)
• August 14, 2014 Flint water tests positive for E coli. Boil water advisories issued two days later. Problems continue with three boil water advisory notices issued in a 22‐day span in summer
• Summer 2014 29 cases of Legionellosis• October 13, 2014 GM engine plant announces that it will stop using Flint water
Steve Carmody/Michigan Radio
www.Flintwaterstudy.org
Slide provided by Dr. Susan MastenEnvironmental EngineeringMichigan State University

Timeline
• November 2, 2014 City increases hydrant flushing to address red water concerns
• December 16, 2014 City receives official violation notice from DEQ for violations of the Safe Drinking Water Act for total trihalomethanes
Photo courtesy of: Erin Brochovitch
Slide provided by Dr. Susan MastenEnvironmental EngineeringMichigan State University

Timeline• February 2015: City of Flint tests water of Lee Ann Walters and finds 104 ppb and 397 ppb. Iron level > 3.3 mg/L (> LOQ)– Water was filtered at the home – Sampling done after flushing– Internal plumbing found to be plastic, a portion external service line found to be galvanized iron pipe; the rest was lead
• February 25, 2015: Lee Ann Walters contacts Region 5 EPA regarding her concerns over lead levels in her water. Miguel del Toral calls the results alarming
Slide provided by Dr. Susan MastenEnvironmental EngineeringMichigan State University

Timeline
• June 2015 Second violation of D/DBP Rule
• Late July 2015 Flint installs a granular activated carbon filter to control THMs by removing organic matter
http://www.sereco.it/prodotti.php?vedi=20120167
http://cyber-nook.com
Slide provided by Dr. Susan MastenEnvironmental EngineeringMichigan State University

Timeline
• August 31, 2015 Prof. Marc Edwards, VA Tech says Flint drinking water is "very corrosive" and "causing lead contamination in homes"– 20% of the 120 samples exceeded the U.S. EPA lead action level of 15 ppb
– 42% of the 120 samples had lead levels that were >5 parts per billion, "which suggests a serious lead‐in‐water problem” according to Prof. Edwards
Slide provided by Dr. Susan MastenEnvironmental EngineeringMichigan State University

Timeline• September 24, 2015 Dr. Mona Hanna‐Attisha releases study showing that the number of Flint infants and children with elevated blood lead levels have increased since the switch to Flint River Water
www.abc12.comwww.pontiactribune.com
Slide provided by Dr. Susan MastenEnvironmental EngineeringMichigan State University
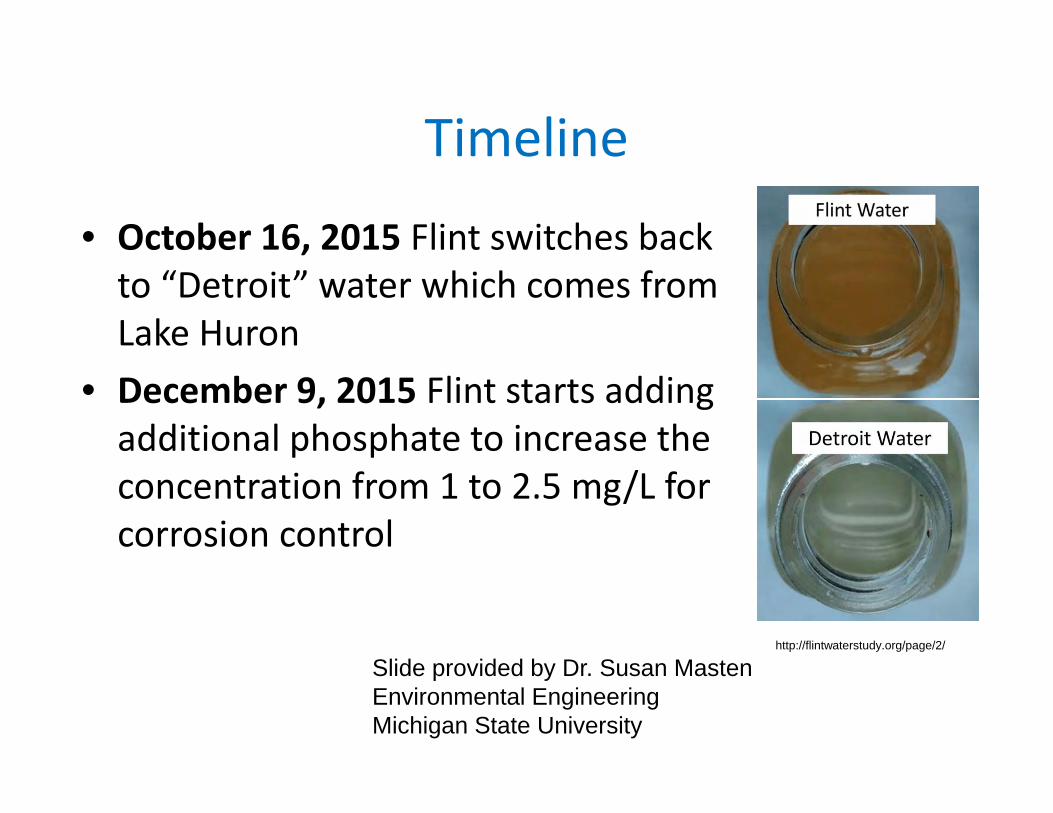
Timeline
• October 16, 2015 Flint switches back to “Detroit” water which comes from Lake Huron
• December 9, 2015 Flint starts adding additional phosphate to increase the concentration from 1 to 2.5 mg/L for corrosion control
http://flintwaterstudy.org/page/2/
Slide provided by Dr. Susan MastenEnvironmental EngineeringMichigan State University
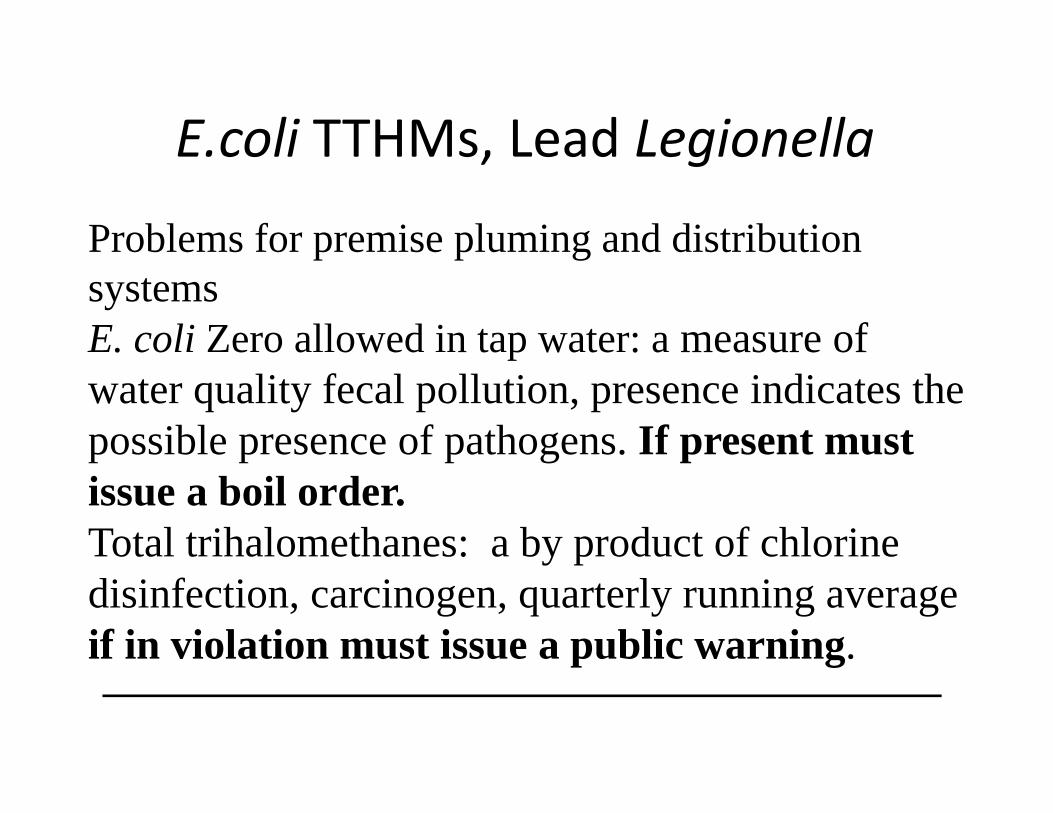
E.coli TTHMs, Lead Legionella
Problems for premise pluming and distribution systems E. coli Zero allowed in tap water: a measure of water quality fecal pollution, presence indicates the possible presence of pathogens. If present must issue a boil order.Total trihalomethanes: a by product of chlorine disinfection, carcinogen, quarterly running average if in violation must issue a public warning.

Disinfection‐By‐Products• Total Trihalomehthanes (TTHMs) are what are known as Disinfection‐
By‐ Products (DBPs) and are formed in water treatment with the use of chlorine.
• The TTHMS are an indicator of how disinfection of the drinking water is managed. This includes the time the water is in the pipes.
• Standards (MCL) have been set because studies have shown that long term exposure is associated with problems with liver, kidneys, or the central nervous system, and an increased risk of getting cancer. [However no links have been established when drinking water in excess of the standard for a few days.]
• A few studies have suggested that THMs in drinking water are associated with miscarriages and certain birth defects when consumed during the first three months of pregnancy.

LEADhttp://www.who.int/mediacentre/factsheets/fs379/en/
• Lead is a cumulative toxicant that affects multiple body systems and is particularly harmful to young children.
• Childhood lead exposure is estimated to contribute to about 600 000 new cases of children developing intellectual disabilities every year.
• Lead exposure is estimated to account for 143 000 deaths per year with the highest burden in developing regions.
• Lead in the body is distributed to the brain, liver, kidney and bones. It is stored in the teeth and bones, where it accumulates over time. Human exposure is usually assessed through the measurement of lead in blood.
• There is no known level of lead exposure that is considered safe.• Low level exposures have been shown to affect IQ, ability to pay attention, and
academic achievement. • cannot be corrected. • Exposure to high levels of leadmay cause anemia, weakness, and kidney and brain
damage. Very high lead exposure can cause death.
EPA only has an action level of 15 ppb, must use corrosion control and need to remove lead pipes and lead soldering

Legionnaire’ Disease: 87 cases, 10 deaths
(http://www.huffingtonpost.com/entry/flint-water-legionnaires-lead-crisis_us_569d09d6e4b0ce4964252c33)
Legionnaires’ DiseasePneumonia-Like SymptomsCough Muscle aches High fever Shortness of breath Headache
ELDERLY those with chronic lung problems, smokers more susceptible.
Pontiac Fever: an acute, nonfatal respiratory disease causes a mild upper respiratory infection that resembles acute influenza. Pontiac fever resolves spontaneously and often goes undiagnosed.

In 2009, California Project LEAN surveyed more than 200 school districts to determine the availability of drinking water in California schools. The survey revealed the following top three reasons students did not access free water at those schools where it was available: 1. The water in the fountains or dispensers is not cold.2. Schools do not have enough water fountains for the number of students. 3. Water fountains or dispensers are poorly maintained.
Thus Chapter 558 of the Statutes of 2010 (Senate Bill [SB] 1413, Leno) established California Education Code (EC) Section 38086, which required school districts to provide access to free, fresh drinking water during meal times in school food service areas. All schools participating in the National School Lunches program must also meet the requirement for having free access to water during food service.
All public places, government buildings are to provide citizens with access to
drinking water

• Sugary beverage consumption is an important component of dietary energy intake impacting body weight.
• Given the potential health benefits of increased water provision (particularly in schools), increased access to public water fountains may also promote healthy weights.
Schools and Access to Safe Water

DEGRADATION OF THE AMBIENT WATERS
High‐resolution spatial analyses of environmental stressors were analyzed and mapped for ecosystem services for all five Great Lakes
Costly restoration projects, such as the over one billion dollar Great Lakes Restoration Initiative are currently underway Allan et al. 2013 PNAS

By Todd C. Frankel August 11 2014Follow @tcfrankel The Washington Post
A sample glass of Lake Erie water is photographed near the Toledo water intake crib in Lake Erie. (Haraz N. Ghanbari/Associated Press)
The toxin that shut off Toledo’s water? The feds don’t make you test for it.
500 million people impacted from the water shut downl

National trends in drinking water quality violations.
• Utilities in the US deliver high‐quality water, however7 to 8 percent of community systems do not meet health‐related standards.
• Between 1982 and 2015, 9 million to 45 million people were affected by water quality issues ‐‐and that low‐income, rural regions were most vulnerable. Infractions were more numerous in "hot spots" in Texas, Oklahoma and Idaho.
• Maura Allaire, Haowei Wu, Upmanu Lall. National trends in drinking water quality violations. Proceedings of the National Academy of Sciences, 2018; 201719805 DOI: 10.1073/pnas.1719805115

Water Quality Impacts Health
The Issues:• Aging infrastructure: New materialsremoving lead, preventing leaking,reducing water retention times.• Source water change: New water source (desalination, reuse);
pollution of current source, climate impacts; overall water quality change (toxic algae)
• Emerging/ Re‐emerging hazards (chemical and biological) includes Legionella. Chronic outcomes!
• Disinfection: moving disinfection from an art to a science (inactivation studies, sensors, stability)
• Social Structures: Changes in vulnerable and sensitive populations, changes in community structure (access to wholesome food; access to education).

Pathway Forward toward Rehabilitation of our Water Systems and Reconnection to Health
• Water Diagnostics Program (Build the water microbiome and exposome; water system health diagnostics)
• Piloting Innovation (Sensors, diagnostics, treatment and rehabilitation technology)
• Information Collection Rule II (Mining and New Data Collection)
• National Waterborne Disease Registry (short and long term analysis of health impacts)
• National Water Quality Reporting Database (Integrate water quality with health)
• Technical Outreach and Support for Communities (modeled from Superfund [CERCLA])
Thank You!
Any Questions??