water monitoring data - water measurement ...data.water.vic.gov.au/wini/howtoguide.pdfhow to guide...
TRANSCRIPT

WATER MONITORING DATA
HOW TO GUIDE
V4.1
July 2014

How to Guide – Monitoring Data
V4.1 Page 2 of 33
About this Document
Document File Name Water Monitoring Data – How to guide
Date of Issue 23/07/2014
Current Version 4.1
Document Status Revised
Email [email protected]
Revision History
Version Date Status Version Notes
4.1 23/07/2014 Revised Information edits and updates to “How to” section
3.0 07/06/2013 Revised FAQs added
2.0 14/05/2013 Published Final version
1.0 30/04/2013 For review Initial version

How to Guide – Monitoring Data
V4.1 Page 3 of 33
Table of Contents
1. Purpose ............................................ ............................................................................................... 4
2. Introduction ...................................... ............................................................................................... 4
3. Accessibility, requirements and common browser issu es ......................................................... 4
4. Frequently Asked Questions ........................ ................................................................................. 5
4.1 Surface Water ............................................................................................................................... 5
4.2 Groundwater .................................................................................................................................. 5
5. Bore finder ....................................... ................................................................................................ 8
5.1 To access and use Bore finder ...................................................................................................... 8
6. How to – Surface Water ............................. ................................................................................... 10
6.1 Discover surface water information ............................................................................................. 10
6.2 View state-wide basin information and reports ............................................................................ 12
6.3 View site details and reports ........................................................................................................ 13
6.4 View and download site exports .................................................................................................. 14
6.5 Download and select groups of sites ........................................................................................... 17
6.6 Pre-prepared Surface water data extracts ................................................................................... 19
7. How to – Groundwater .............................. .................................................................................... 20
7.1 Discover groundwater information ............................................................................................... 20
7.2 View latest values ........................................................................................................................ 22
7.3 View bore details ......................................................................................................................... 23
7.4 View site documents.................................................................................................................... 24
7.5 View and/or download individual site data ................................................................................... 25
7.6 Upload groundwater data into WMIS ........................................................................................... 27
7.7 Download data for groups of sites ............................................................................................... 29
7.7.1 Pre-prepared Groundwater Data Extracts ................................................................................ 31
8. Disclaimer and Copyright .......................... .................................................................................. 33

How to Guide – Monitoring Data
V4.1 Page 4 of 33
1. Purpose
The purpose of this document is to provide detailed instructions on using the Department’s Water Monitoring Data Portal
If you have queries regarding the information contained in this document please contact the Department at [email protected]
2. Introduction
The Department’s Water Monitoring Data Portal provides access to a subset of data collected through Victoria surface water and groundwater monitoring networks. The portal is accessible at the following URL
http://data.water.vic.gov.au/monitoring.htm
The portal provides two ways of discovering data:
1. Either through our map by selecting monitoring sites; or
2. By searching by monitoring site
Some points to note:
• You have access to data as plots and tables, as well as other media (which may include photo images, text documents, sound files or movies).
• You can select and download groups of sites for both surface and groundwater by selecting the “download sites” hyperlink underneath the headings.
• Navigation is provided via the menu trees in the left pane and various links on the pages in the right pane.
3. Accessibility, requirements and common browser i ssues
Minimum browser requirements
• Internet Explorer 8+, or Firefox 3+ • Screen size not less than 1024 by 768 pixels • Javascript and cookies must be enabled • Internet Explorer security level Medium (Internet Options.. -> Security)
Recommended installed applications
• Microsoft Windows Media Player or RealNetworks Real Player • Adobe Reader
You may also require the following applications installed to view some provided sites documents:
• Microsoft Office, or Open Office
By selecting the “ ” link on the left hand navigation menu you can also alter the size of the text and images, along with adjusting the frame width.
How to Guide – Monitoring Data
V4.1 Page 5 of 33
4. Frequently Asked Questions 4.1 Surface Water
This section is currently under development.
If you do any questions relating monitoring data available through the Portal or information contained in this document please email the Department at [email protected]
4.2 Groundwater
Q: What is a site?
A: A site is a location where one of more measurements may be taken. Sites in groundwater refer to the bore ID as registered through the water register/bore construction process. Every site is identified by a unique site code and a site name. Site information is accessed in the Details tab.
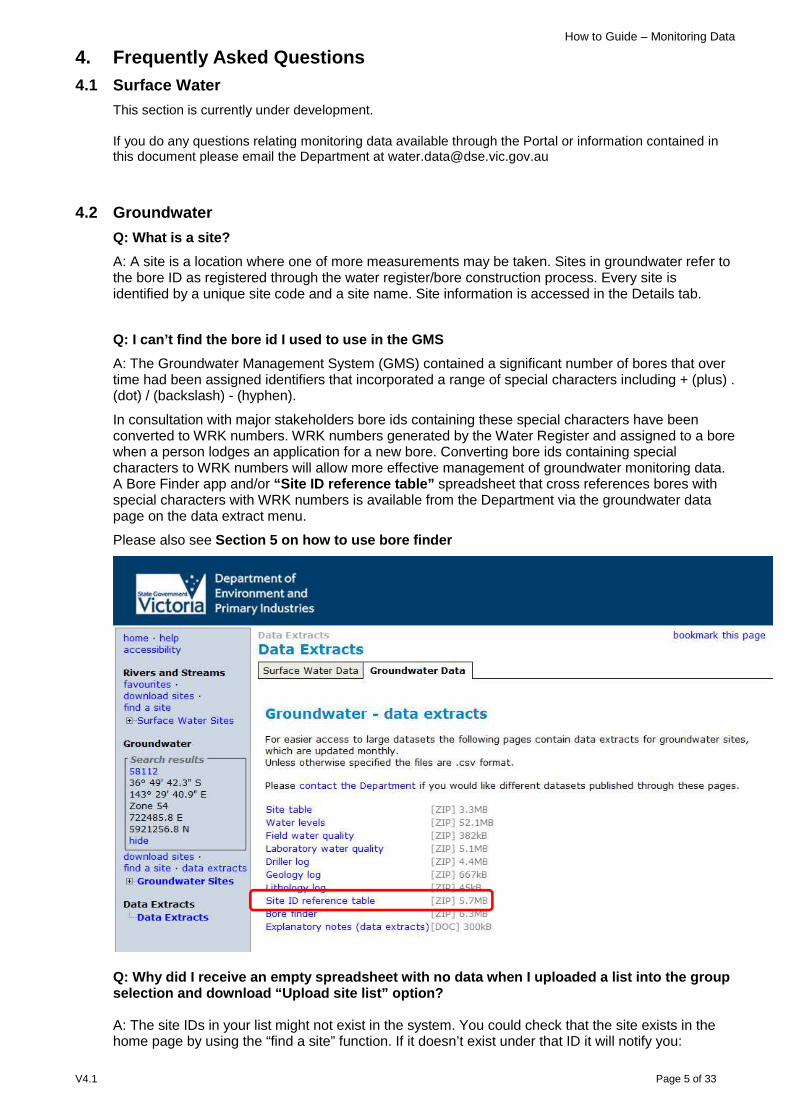
Q: I can’t find the bore id I used to use in the GM S
A: The Groundwater Management System (GMS) contained a significant number of bores that over time had been assigned identifiers that incorporated a range of special characters including + (plus) . (dot) / (backslash) - (hyphen).
In consultation with major stakeholders bore ids containing these special characters have been converted to WRK numbers. WRK numbers generated by the Water Register and assigned to a bore when a person lodges an application for a new bore. Converting bore ids containing special characters to WRK numbers will allow more effective management of groundwater monitoring data. A Bore Finder app and/or “Site ID reference table” spreadsheet that cross references bores with special characters with WRK numbers is available from the Department via the groundwater data page on the data extract menu.
Please also see Section 5 on how to use bore finder
Q: Why did I receive an empty spreadsheet with no d ata when I uploaded a list into the group selection and download “Upload site list” option?
A: The site IDs in your list might not exist in the system. You could check that the site exists in the home page by using the “find a site” function. If it doesn’t exist under that ID it will notify you:

How to Guide – Monitoring Data
V4.1 Page 6 of 33
Also please refer to the previous question as some GMS site IDs have had to be altered.
Q: What are the use groups?
A: In the Water Measurement Information System a bore may have more than one use type (or purpose) recorded against it. These uses have been grouped together into six separate groups: 1. Dewatering includes any sites registered with these uses:
a. Dewatering (DW),
b. Dewatering to evaporative basins (DE), and
c. Public dewatering (PD).
2. Domestic and Stock includes any sites registered with these uses:
a. Communal domestic (CD),
b. Domestic (DM),
c. Domestic - billable (DM-B),
d. Domestic and stock (DS),
e. Stock (ST), and
f. Stock - billable (ST-B).
3. Licensed includes any sites registered with these uses:
a. Agro industries (AI),
b. Aquaculture (AQ),
c. Commercial (CO),
d. Commercial aquaculture (CA),
e. Commercial residential (CR),
f. Dairy (DY),
g. Intensive animal husbandry (IA),
h. Industrial (IN)
i. Irrigation (IR),
j. Mineral water (MW), and
k. Urban (UR).
4. Monitoring and Observation includes any sites registered with these uses:
a. Dryland salinity network (DPI),
b. Engineering geology (EG),
c. Gen. geological inv. (GI),
d. Geothermal (GE),
e. Groundwater (GW),
f. Groundwater investigation (IV),
g. Mineral investigation (ME),
h. Observation (OB),
i. Petroleum exploration (PE), and
j. Stratigraphic (SG).
5. Other includes any sites registered with these uses:
a. Culture (CU),
b. Disposal (DI),
c. Drought relief (DR),
d. Environment(EN),
e. Extractive/quarrying(EX),

How to Guide – Monitoring Data
V4.1 Page 7 of 33
f. Groundwater recharge(RE),
g. Interception(INT),
h. Miscellaneous (MI),
i. Non-groundwater(NG),
j. Not known(NKN),
k. Not used - capped (NU),
l. Public pumps (PP),
m. Salinity irrigation(SI), and
n. SEC bores(use unidentified) (SEC).
6. State observation bore network (SOBN) includes any sites registered as "State Observation Network
(SON)".
a. Inactive – those registered as SOBN but not currently monitored
b. Active – those registered as SOBN and currently being monitored
Q: what do the arrows mean on the latest values tab for Groundwater sites?
A: The arrows indicate whether or not the latest value has increased, decreased or remained stable since the last record/reading.
higher than the previous record
lower than the previous record
unchanged (stable) from the previous record
Q: Why do I keep seeing this, or a similar, error:
“ http://203.12.195.133/wgen/cache/anon/gwlf_org58112 .xml could not be found or is empty”
A: This could be a web browser issue. If you see this error please delete your cookies, clear your cache (Tools > Internet options > General > Browsing History > Delete) and shut down and restart your browser again. If you still receive this error please contact DSE. Else, you can try using a different type of browser like Google Chrome or Mozilla Firefox. These two generally work better than Internet Explorer for this application.
Q: Will quarterly extracts of the GMS still be emai led out?
A: WMIS provides the same functionality so these bulk extracts are no longer necessary. If you require a copy of the full database please contact DSE.
Otherwise, you can access monthly groundwater extracts through the option in the navigation bar (see question above about the sites ids and the data extracts menu).

How to Guide – Monitoring Data
V4.1 Page 8 of 33
5. Bore finder The bore finder can also help you to locate a bore ID. Bore finder is a spreadsheet with a custom search box where you can search on a string of characters which then provides you with possible ids to use.
5.1 To access and use Bore finder 1. Go to the Data Extracts heading in the Navigation pane
2. Switch to the Groundwater Data tab
3. Click on the bore finder link to open in Excel
4. Check in Excel that your Macros have been Enabled = either
a. on the Message Bar, click Enable Content
OR
b. Go to File > Options > Trust Centre > "Trust Centre Setting..." button
> Macro Settings > Select the "Enable all macros..." radio button
2. Open the spreadsheet and double click anywhere to begin search

How to Guide – Monitoring Data
V4.1 Page 9 of 33
3. The ID to be used in WMIS can be found in Column A, Current bore ID (WMIS) and the first column in the search box labelled Current ID
Abbreviations in the bore finder spreadsheet (pleas e note, these can also be found on the information tab in the spreadsheet): • Current ID - use this in WMIS • GMS - Old Groundwater Management System • DITR - Manufacture & Industry Dev • VICWATER - Data Warehouse B numbers • RIG - Drilling Services Rig No. • DIV - RWC Diversions Bore Number • CNR - Conservation and Natural Resources

How to Guide – Monitoring Data
V4.1 Page 10 of 33
6. How to – Surface Water
6.1 Discover surface water information Overview
Individual sites containing surface water data can be found using
• the interactive map • navigation menus on the web portal to browse for a single site • ‘find a site’ tool to view a single site
Procedure – Navigation menus 1. From the WMIS web portal select the “Surface Water Sites” menu:
2. Hover over the points on the map until the label is revealed and select the site you want.

How to Guide – Monitoring Data
V4.1 Page 11 of 33
3. Under the “Surface Water Sites” menu select a basin to retrieve sites on streams in that basin. Here you can also select the site via the interactive map.
4. If you know the site ID you can select it from the WMIS web portal select the “find a site” link in the ““Rivers and Streams” heading:
5. Enter the Site ID and click on the “search” button.
6. Click on the Site ID to view the details.

How to Guide – Monitoring Data
V4.1 Page 12 of 33
6.2 View state-wide basin information and reports Overview – at the state-wide level there are two additional tabs available which provide general information on basins and statewide reports available for download.
Procedure – Navigation menus 1. From the WMIS web portal select the “Surface Water Sites” menu:
2. Switch to the Basin Info tab to view information on basins and where to source spatial layers.
3. Switch to the Reports tab to view and download various state-wide reports.

How to Guide – Monitoring Data
V4.1 Page 13 of 33
6.3 View site details and reports Overview The Details tab provides a user with site details such as location, number of gaugings, maximum gauged level and period of record.
Surface Water reports are available from the Reports tab for an individual Site.
The Reports tab provides a user with access to the following reports and plots:
• Site Details Summary,
• Continuous Height and Flow,
• Monthly Flow,
• Daily Flow Duration,
• Most Recent Rating Table (Plot), Most Recent Rating Table (Table),
• Gaugings vs. Rating
Procedure
Select a Site using the details in 6.1 above, and switch to either the Details Tab or the Reports Tab:

How to Guide – Monitoring Data
V4.1 Page 14 of 33
6.4 View and download site exports Overview
Surface Water data can be extracted through the Exports Tab for an individual Site. The Export tab provides a user with a list of field and laboratory variables available at a site. Multiple variables can be selected along with a period and exported as either a plot, spreadsheet or table
Procedure
Select a Site from the “Surface Water Sites” menu, and switch to the Exports Tab. Each Field Time Series and Laboratory Spot variable is listed with a checkbox to include/exclude it from the extract. Data can be extracted for various periods in plot, table or download formats.
Plot format: 1. The plotting period can be set using the Period dropdown:
2. Check the variables of interest, select your time “Period”, the “Plot” output type and click the “Get Output”
button.
How to Guide – Monitoring Data
V4.1 Page 15 of 33
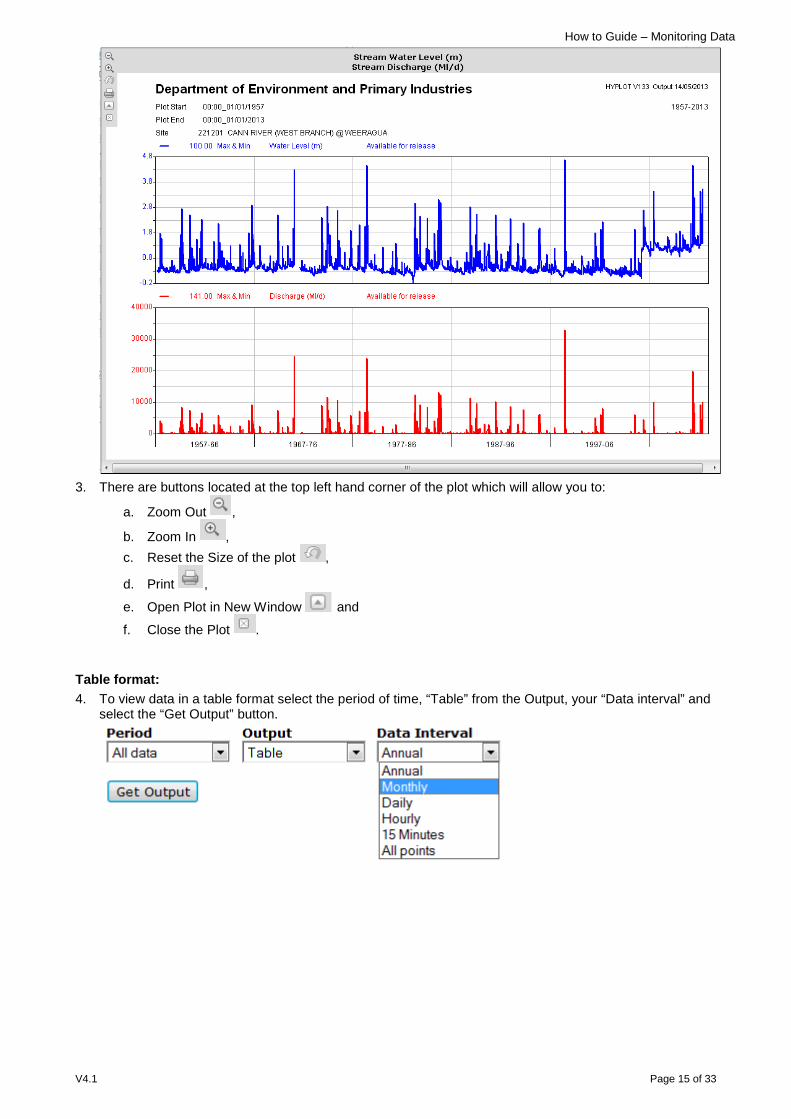
3. There are buttons located at the top left hand corner of the plot which will allow you to:
a. Zoom Out ,
b. Zoom In ,
c. Reset the Size of the plot ,
d. Print ,
e. Open Plot in New Window and
f. Close the Plot .
Table format: 4. To view data in a table format select the period of time, “Table” from the Output, your “Data interval” and
select the “Get Output” button.

How to Guide – Monitoring Data
V4.1 Page 16 of 33
5. Select the “go back” button to return to the Export tab.
6. When returning to the Export tab after viewing a plot or table you will have the option to download your output via a zip file.
Download format: 7. If you don’t want to view the data first you can go straight to the Download format in the “Output” drop down.

How to Guide – Monitoring Data
V4.1 Page 17 of 33
6.5 Download and select groups of sites Overview
Through the Download Sites user interface a user can select a group of sites and download data associated with the selected sites.
Procedure 1. In the left hand navigation menu select the “download sites” hyperlink underneath the Rivers and Streams
heading to navigate to the group download interface.
2. The user interface provides four methods for selecting a list of sites:
a. - allows uploading of a .csv or .txt file of sites. Select “Browse…” to navigate to your txt or csv file.
b. - enables selection of sites by defining a radius on the map.
c. - enables selection of sites by defining a rectangle on the map.
3. There are six different types of data to choose for download:
a.
b.
c.
d.
e.
f. 4. Users can then select the amount of data (“All data”) or a custom time period for the data (“Custom”)
5. If continuous data (time series) has been selected it can then be aggregated using these intervals:
a. Annual

How to Guide – Monitoring Data
V4.1 Page 18 of 33
b. Monthly
c. Daily
d. Hourly
6. Once the data has been selected the user must enter an email address into the space provided and select the “Prepare Download” button.
7. First the user will be presented with a disclaimer that they must accept to continue with their download.
8. The interface will then give you a rough estimate of the time it will take to download the data and provide statistics for you to consider
9. Once the disclaimer has been accepted you can then start your download by selecting the button and it will send the request off and give you a confirmation message.
10. Please note, if you change any of your options in the list creation, type of data to download or the email address the system will recalculate your download statistics.
11. If at any time you wish to return to the home page you can select the “close” hyperlink located next to the “Download Rivers and Streams sites” heading at the top of the interface.
How to Guide – Monitoring Data
V4.1 Page 19 of 33
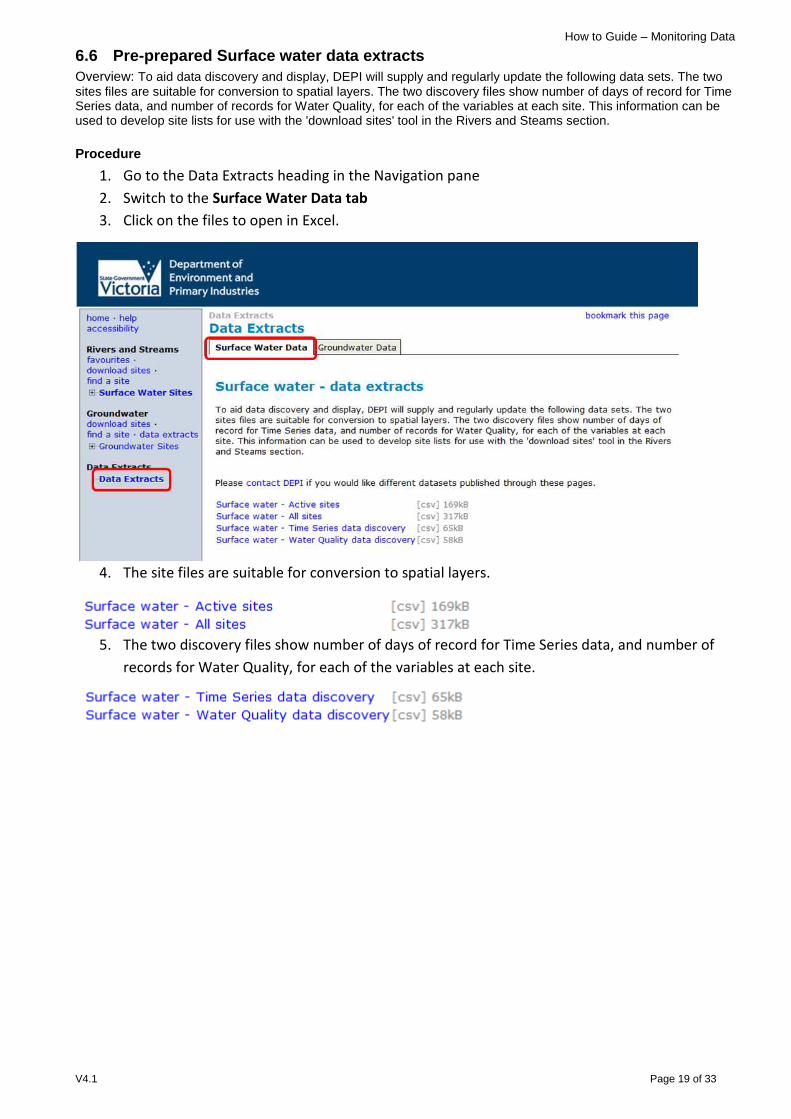
6.6 Pre-prepared Surface water data extracts Overview: To aid data discovery and display, DEPI will supply and regularly update the following data sets. The two sites files are suitable for conversion to spatial layers. The two discovery files show number of days of record for Time Series data, and number of records for Water Quality, for each of the variables at each site. This information can be used to develop site lists for use with the 'download sites' tool in the Rivers and Steams section.
Procedure
1. Go to the Data Extracts heading in the Navigation pane
2. Switch to the Surface Water Data tab
3. Click on the files to open in Excel.
4. The site files are suitable for conversion to spatial layers.
5. The two discovery files show number of days of record for Time Series data, and number of
records for Water Quality, for each of the variables at each site.
How to Guide – Monitoring Data
V4.1 Page 20 of 33
7. How to – Groundwater
7.1 Discover groundwater information Overview
Individual sites containing groundwater data can be found using
• the interactive map • navigation menus on the web portal to browse for a single site • ‘find a site’ tool to view a single site
Procedure – Navigation menus
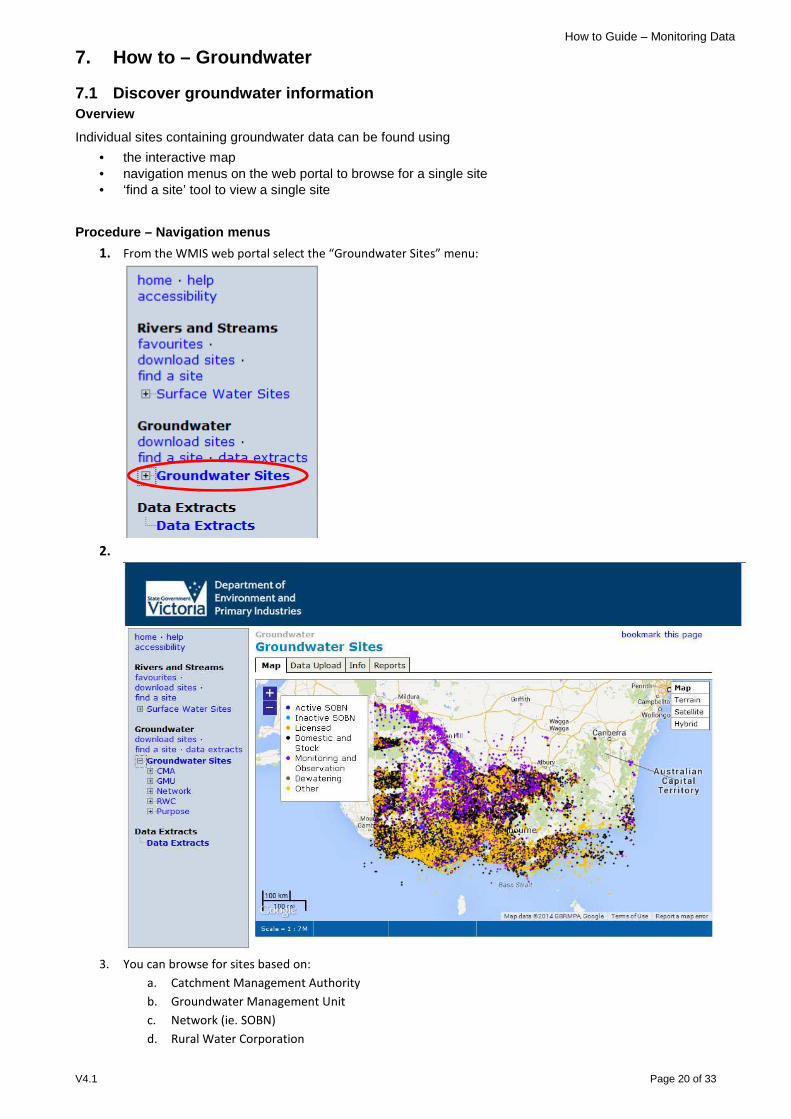
1. From the WMIS web portal select the “Groundwater Sites” menu:
2.
3. You can browse for sites based on:
a. Catchment Management Authority
b. Groundwater Management Unit
c. Network (ie. SOBN)
d. Rural Water Corporation

How to Guide – Monitoring Data
V4.1 Page 21 of 33
e. Purpose
Procedure – Find a single site
4. If you know the site id you can search for it from the WMIS web portal by selecting the “find a site” link from the
“Groundwater Sites” menu:
5. Enter the Site ID, e.g. ‘1’ and click on the “Search” button
6. Click on the Site ID to be directed to the site information.
How to Guide – Monitoring Data
V4.1 Page 22 of 33
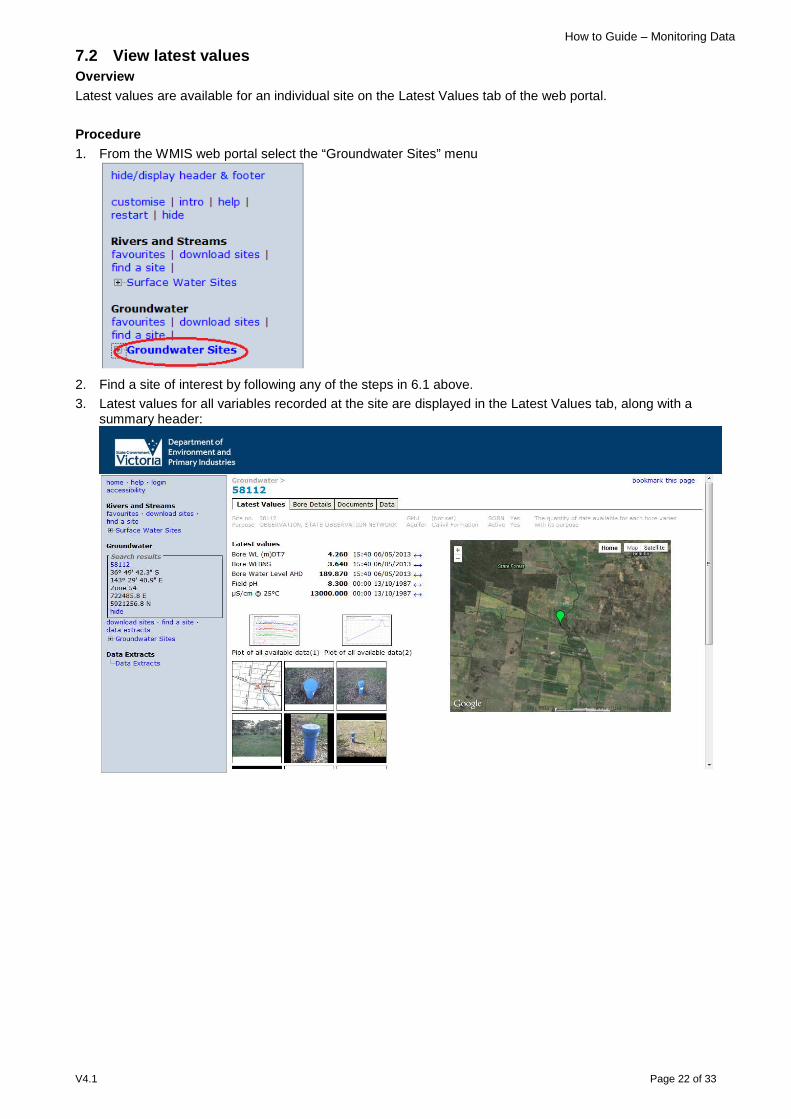
7.2 View latest values Overview Latest values are available for an individual site on the Latest Values tab of the web portal.
Procedure 1. From the WMIS web portal select the “Groundwater Sites” menu
2. Find a site of interest by following any of the steps in 6.1 above.
3. Latest values for all variables recorded at the site are displayed in the Latest Values tab, along with a summary header:

How to Guide – Monitoring Data
V4.1 Page 23 of 33
7.3 View bore details Overview Lithology, period of record and construction details for a bore are available in the Bore Details tab for an individual site.
Test Procedure
1. From the WMIS web portal select the “Groundwater Sites” menu:
2. Find a site of interest by following any of the steps in 6.1. Switch to the Bore Details tab to view the lithology,
period of record and construction details for the site.
How to Guide – Monitoring Data
V4.1 Page 24 of 33
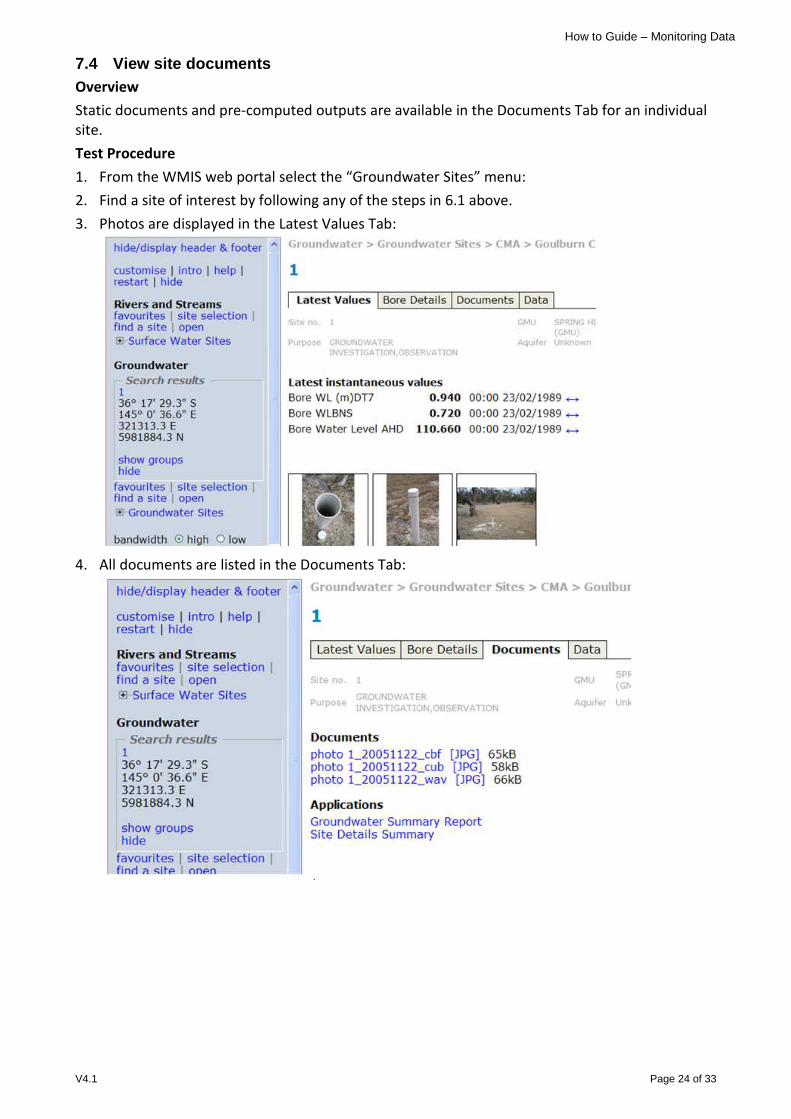
7.4 View site documents Overview
Static documents and pre-computed outputs are available in the Documents Tab for an individual
site.
Test Procedure
1. From the WMIS web portal select the “Groundwater Sites” menu:
2. Find a site of interest by following any of the steps in 6.1 above.
3. Photos are displayed in the Latest Values Tab:
4. All documents are listed in the Documents Tab:

How to Guide – Monitoring Data
V4.1 Page 25 of 33
7.5 View and/or download individual site data Overview
The Data Tab for an individual site provides options for displaying all variables in a table or
downloading the data.
Procedure
1. From the WMIS web portal select the “Groundwater Sites” menu:
2. Find a site of interest by following any of the steps in 6.1 above.
3. Water level data can be plotted or extracted in a table through the Data tab.
4. Select the data, the time Period, type of Output.
Please note – for all groundwater sites the Data interval will always be set to “All points” unless there
is Time Series data available for the site.
5. Selecting the “Get Output” button will display your data on screen.
6. Select the “go back” button to return to the Data tab.
7. You can then download a zip file of your data or view the output on screen again by clicking on
the “go back” button at the top of the table and selecting either of the hyperlinks.
How to Guide – Monitoring Data
V4.1 Page 26 of 33
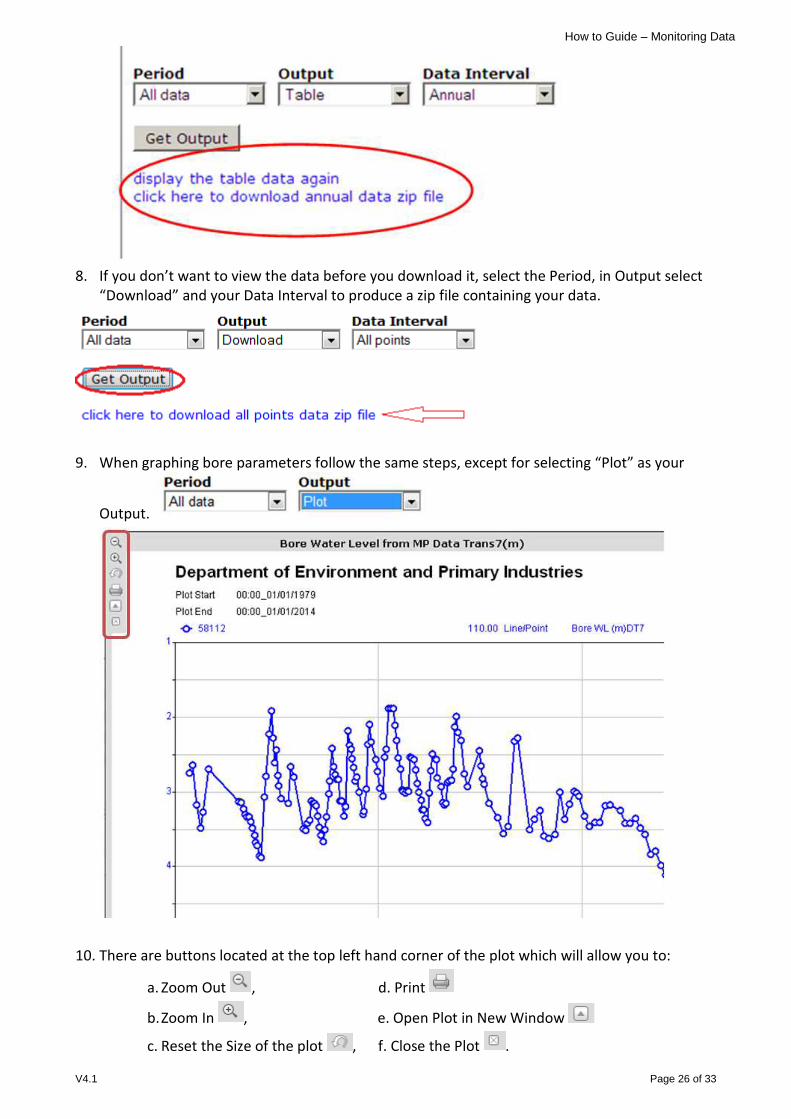
8. If you don’t want to view the data before you download it, select the Period, in Output select
“Download” and your Data Interval to produce a zip file containing your data.
9. When graphing bore parameters follow the same steps, except for selecting “Plot” as your
Output.
10. There are buttons located at the top left hand corner of the plot which will allow you to:
a. Zoom Out , d. Print
b. Zoom In , e. Open Plot in New Window
c. Reset the Size of the plot , f. Close the Plot .
How to Guide – Monitoring Data
V4.1 Page 27 of 33
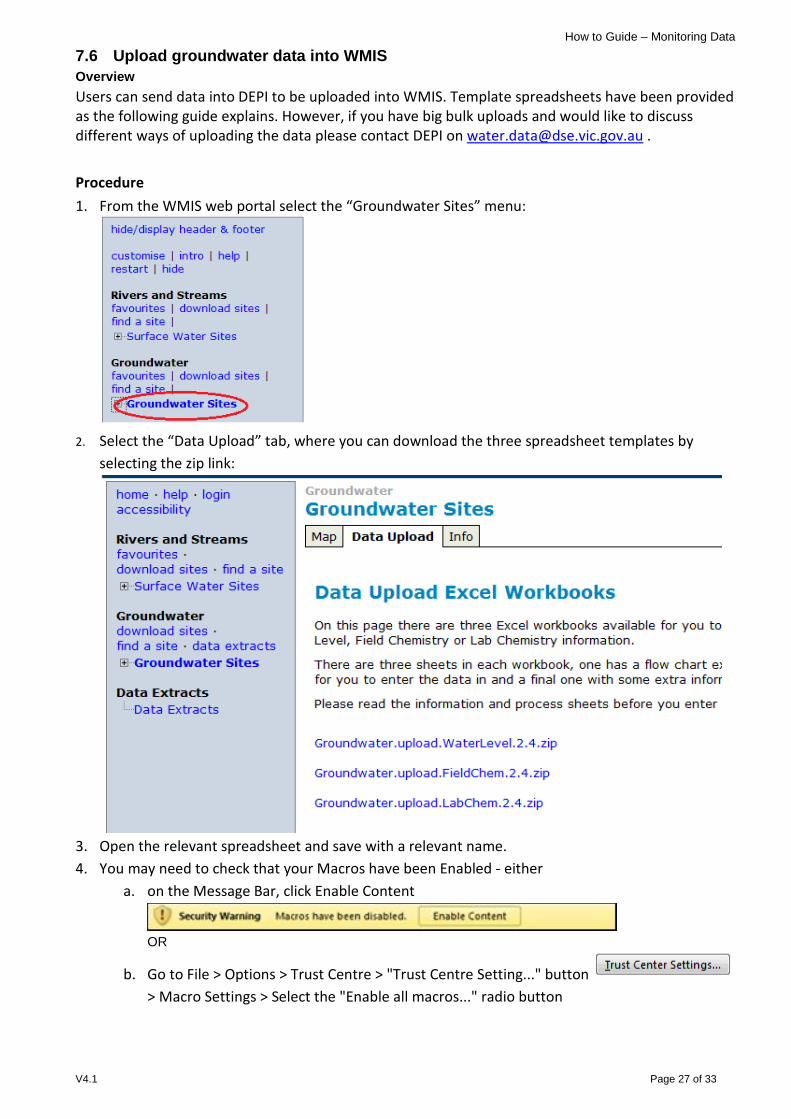
7.6 Upload groundwater data into WMIS Overview
Users can send data into DEPI to be uploaded into WMIS. Template spreadsheets have been provided
as the following guide explains. However, if you have big bulk uploads and would like to discuss
different ways of uploading the data please contact DEPI on [email protected] .
Procedure
1. From the WMIS web portal select the “Groundwater Sites” menu:
2. Select the “Data Upload” tab, where you can download the three spreadsheet templates by
selecting the zip link:
3. Open the relevant spreadsheet and save with a relevant name.
4. You may need to check that your Macros have been Enabled - either
a. on the Message Bar, click Enable Content
OR
b. Go to File > Options > Trust Centre > "Trust Centre Setting..." button
> Macro Settings > Select the "Enable all macros..." radio button

How to Guide – Monitoring Data
V4.1 Page 28 of 33
5. Enter your data into the Second tab, ending in _UL. EG.
a. WATER LEVEL_UL
b. FIELD CHEM_UL
c. LAB CHEM_UL
6. Fill in all mandatory fields for each record/row
a. Email
b. Organisation
c. Bore ID
d. Date
7. If you would like to search for a lab parameter you can find the relevant code and parameter
group in the last tab called “LOOK_UP_CODES”.
8. When you have finished entering your data press the “Validate Data” button.
9. Please note: your bore ID will not be validated until it is entered into the system. If it does not
exist in the system your data will not be imported.
10. Once finalised send your data to DEPI:

How to Guide – Monitoring Data
V4.1 Page 29 of 33
7.7 Download data for groups of sites
Overview
Through the Download Sites user interface a user can select a group of sites and download data associated with the selected sites.
Procedure 1. In the left hand navigation menu select the “download sites” hyperlink underneath the Groundwater
heading to access the group selection and download interface.
2. The user interface provides three methods for selecting a list of sites: a. uploading of a .csv or .txt file of sites. Select “Browse…” to navigate to your txt or csv file.

How to Guide – Monitoring Data
V4.1 Page 30 of 33
b. selection of sites by defining a radius on the map.
c. selection of sites by defining a rectangle on the map.
3. There are four different types of data to choose for download:
a.
b.
c.
d.
4. Users can then select the amount of data (“All data”) or a custom time period for the data (“Custom”)
5. Once the data has been selected the user must enter an email address into the space provided and
select the “Prepare Download” button.
6. The user will be presented with a disclaimer that they must accept to continue with their download.
7. When the disclaimer has been accepted the interface will then give you a rough estimate of the time it
will take to download the data and provide statistics for you to consider.
8. You can then start your download by selecting the “Start Download” button and it will send the request
off and give you a confirmation message. Once completed, the data will be sent to your email address.
9. Keep your request number (eg. [20140723122538] ) as a reference.

How to Guide – Monitoring Data
V4.1 Page 31 of 33
If you change any of your options in the list creation, type of data to download or the email address the system will recalculate your download statistics.
10. If at any time you wish to return to the home page you can select the “close” hyperlink located next to
the “Download Groundwater sites” heading at the top of the interface.
Please note: system constraints require there to be a limit to the number of sites that can be downloaded through this function. If you need to access more data you can either split your list up to usable sizes (< 200 sites) or access the Data Extracts menu from the main page.
7.7.1 Pre-prepared Groundwater Data Extracts 11. From the Data Extracts heading on the navigation pane, go to the Groundwater Data tab
12. These links contain large csv datasets:
13. All seven files – this contains all seven dataset files as mentioned above:

How to Guide – Monitoring Data
V4.1 Page 32 of 33
14. The Site ID reference table is a list of all the Current bore IDs in WMIS and associated alias IDs
15. The Bore finder is a spreadsheet with a customised search box to assist users in finding a bore ID. Having difficulty finding a bore ID? See Section 5.0 above on how to use Bore Finder .
16. The Explanatory notes provides greater detail on the prepared outputs.
17. Click on any of these files to Save or Open in Excel.

How to Guide – Monitoring Data
V4.1 Page 33 of 33
8. Disclaimer and Copyright
The following disclaimer and copyright statements apply to data accessed through the Water Monitoring Data Portal.
Disclaimer
The content of this Victorian Government web site is provided for information purposes only. No claim is made as to the accuracy or authenticity of the content of the website. In no event will the State of Victoria, its agents, instrumentalities and employees be liable for the accuracy of the information contained on this web site nor its use or reliance placed on it. The information on the web site is provided on the basis that all persons accessing the site undertake responsibility for assessing the relevance and accuracy of its content.
Information published by the Victorian Government is considered to be true and correct at the time of publication. Changes in circumstances after the time of publication may impact on the accuracy of this information and the Victorian Government gives no assurance of any information or advice contained.
The information contained in the web site is not to be displayed except in full screen format. No liability is accepted for any information that may appear in other format.
No responsibility is taken for any information that may appear on any linked web sites. This web site provides links to other web sites. These external information sources are outside our control. It is the responsibility of users to make their own decision about the accuracy, currency, reliability and correctness of information found. The Victorian Government does not necessarily endorse any company or organisation linked to from this site.
There is no warranty that the site will be free of infections by viruses or any other manifesting, contaminating or destructive properties
Copyright
Data, including all its components (images, audio, video, text) accessed through the Water Monitoring Data Portal is copyright.
Apart from fair dealing for the purposes of private study, research, criticism or review as permitted under the Copyright Act 1968, no part may be reproduced, copied, transmitted in any form or by any means (electronic, mechanical or graphic) without the prior written permission of the State of Victoria.
All requests and enquiries should be directed to the Customer Service Centre, phone 136 186 or email [email protected]