water management plan - us epa · pdf filethis water management plan has been developed to...
TRANSCRIPT

Water Management Plan Revision 2 United States Environmental Protection Agency Ecosystems Research Division 960 College Station Road Athens, GA 30605
August 18, 2014 Point of Contact: Rick Pittman, Facility Manager 706-355-8010

UNITED STATES ENVIRONMENTAL PROTECTION AGENCY ECOSYSTEMS RESEARCH DIVISION
ATHENS, GEORGIA
WATER MANAGEMENT PLAN, REVISION 2
Approved by:
______________________________________________________________________________ Gerald Brunson, Deputy Director Date
______________________________________________________________________________ Ri Date
i

TABLE OF CONTENTS
Page
1.0 IDENTIFIED WATER CONSERVATION OPPORTUNITIES .......................................................... 1
2.0 BACKGROUND AND PURPOSE ............................................................................................... 1
3.0 FACILITY INFORMATION ...................................................................................................... 2
4.0 WATER MANAGEMENT GOALS ............................................................................................ 2
5.0 WATER USE INFORMATION .................................................................................................. 3 5.1 Water Supply .......................................................................................................... 3 5.2 Meters and Submeters ............................................................................................. 3 5.3 Historical Water Use ............................................................................................... 4 5.4 End Uses of Water .................................................................................................. 6
6.0 DROUGHT CONTINGENCY PLAN ......................................................................................... 12
ii

1.0 IDENTIFIED WATER CONSERVATION OPPORTUNITIES
A water use and conservation assessment was conducted at the U.S. Environmental Protection Agency’s (EPA’s) Office of Research Development (ORD), National Exposure Research Laboratory, Ecosystems Research Division (ERD) laboratory in Athens, Georgia, in March 2014. ERD has achieved significant reduction in its water use intensity since fiscal year (FY) 2007, as documented in Section 5.3. Since no additional water conservation opportunities were identified during the March 2014 assessment, ERD will continue to implement the water use best management practices described in this Water Management Plan.
This plan describes ERD’s water reduction goals, water use trends, end uses of water, completed water efficiency projects, and drought management plans.
2.0 BACKGROUND AND PURPOSE
In 2007, Executive Order (EO) 13423, Strengthening Federal Environmental, Energy, and Transportation Management, called for federal agencies to reduce water use intensity by 2 percent per year between FY 2007 and FY 2015 for a total reduction of 16 percent, compared to a FY 2007 baseline. This goal was revised and extended by EO 13514, Federal Leadership in Environmental, Energy, and Economic Performance. EO 13514 calls for reducing potable water consumption intensity by 2 percent annually through FY 2020, relative to the FY 2007 baseline, for a 26 percent total reduction. Water use intensity is measured in gallons per gross square feet (gsf).
The implementation instructions for water efficiency and management provisions of EO 13514 direct that agencies replacing fixtures or other water-using products should purchase Federal Energy Management Program-designated or WaterSense® labeled products.
In addition to the potable water use reduction requirements, EO 13514 requires agencies to reduce industrial, landscaping, and agricultural (ILA) water consumption by 2 percent annually or 20 percent by the end of FY 2020, relative to an FY 2010 baseline (including non-potable sources). The EO also directs agencies to identify, promote, and implement water reuse strategies that reduce potable water consumption.
The Energy Independence and Security Act of 2007 directs agencies to complete comprehensive energy and water evaluations of 25 percent of covered facilities (i.e., those accounting for 75 percent of total energy use) each year; implement cost-effective measures identified through life cycle analyses; and measure and verify water savings.
In summary, existing EOs and federal law require substantial reductions in all forms of water use, as well as ongoing, regular assessments of facility water use to identify and implement saving opportunities.
This Water Management Plan has been developed to document and promote the efficient use of water at ERD, so that the facility can contribute to meeting these Agencywide objectives.
1

3.0 FACILITY INFORMATION
In FY 2013, ERD facilities occupied two sites in Athens, Georgia. The primary site is a compound of 12 buildings on 15 acres located on College Station Road. The secondary facility—the Field Research Annex, which is currently not occupied—is located on North Oconee Access Road and consists of one primary building and a number of small support structures on 6.5 acres. ERD facilities are owned and operated by EPA. In FY 2013, ERD facilities comprised a total of 78,146 square feet of conditioned space. ERD’s main laboratory building, built in 1966, is approximately 56,000 square feet and consists of a one-story administrative wing and a two-story lab wing. The building is organized in a “racetrack” arrangement with office and office support modules on the outer perimeter and labs and lab support modules in the inner core. The laboratories are served by a utility corridor that runs nearly the entire length of each floor. Between 2000 and 2006, ERD renovated most of the second-floor labs and some of first-floor labs and replaced heating, ventilation, and air conditioning (HVAC) and electrical systems. Three temporary structures are used for support office functions: the facility maintenance building (2,900 square feet, 1979 construction), the office annex (5,300 square feet, 1982 construction), and the environmental information annex (5,200 square feet, 1988 construction). ERD has several smaller buildings used for hazardous material and other storage. In addition to the main laboratory and support buildings, ERD has an additional stand-alone building, the Lifespan Center, which was previously used as a daycare facility. The Lifespan Center is currently not occupied, and ERD has not determined its future use. In October 2014, control of the Field Research Annex will be transferred to U.S. EPA Region 4 Science and Ecosystem Support Division (SESD) in Athens, Georgia. ERD employs 107 people—75 of which are present on any given day, accounting for field research—all of which are based in the main laboratory building. The main laboratory operates on a flex time schedule and is typically occupied Monday through Friday between the hours of 7 a.m. and 5:30 p.m. 4.0 WATER MANAGEMENT GOALS
ERD achieves its resource conservation goals by implementing the ORD Multi-Site Laboratory Environmental Management System (EMS) program. Within the EMS and otherwise, ORD’s collective water management goals include:
• Annually, achieve the Agency ConservW targets (set by EPA’s Sustainable Facilities Practices Branch) as a cumulative total of all seven ORD locations.
• By September 30, 2014, identify at least one water conservation project or
stormwater management project for ORD to complete in FY 2015 and obtain funding.
2

5.0 WATER USE INFORMATION
ERD uses city-supplied potable water primarily for cooling tower make-up, sanitary needs, and research. Discussed further in Section 5.3, ERD’s potable water use has decreased since the last water assessment in 2010 because ERD implemented suggested water-saving projects from the last Water Management Plan. ERD uses non-potable well water (ILA water) for irrigation when necessary to ensure landscape survival. ILA water use has also decreased since the last assessment. The following sections provide additional details on ERD’s water use. 5.1 Water Supply
ERD’s potable water and sewer service are provided by Athens-Clarke County. An onsite well provides non-potable, ILA water for landscape irrigation. ERD is not charged for any well water consumption.
5.2 Meters and Submeters
Incoming city water supply is metered. Flow totalizing meters are also installed on many of the major subsystem flows. Meters and submeters include:
• City water supply meter to main laboratory (Account #776-100462) • City water supply meter to Lifespan Center (Account #43908-127173) • EPA advanced meter on supply to main laboratory • EPA advanced meter on supply to Lifespan Center • Onsite well water meter • Cooling tower #1 make-up submeter • Cooling tower #2 make-up submeter • Recovered air handler condensate to cooling tower submeter • Distilled water system submeter
Previously, the irrigation system was connected to a city potable water line. However, since the last assessment, potable water service to the irrigation system was discontinued. ERD now only uses non-potable water from an onsite well for irrigation. ERD meters this well water use. City water supply meter readings are recorded monthly by the water utility and reported to the facilities management staff. The cooling tower make-up meters, recovered air handler condensate meter, and onsite well water meter are recorded daily by the facilities management staff. Water use trends are monitored on an ongoing basis, and unexpected changes in water use are investigated and resolved. EPA installed advanced meters on the city water supply lines to the main laboratory and Lifespan Center. ERD is in the process of integrating these meters into the facility Building Automation System (BAS).
3

A discrepancy exists between the city water supply meter to the main laboratory and the cooling tower make-up meters. Previous cooling tower make-up meters indicated that the cooling towers were consuming more water annually than was being metered and billed by Athens-Clarke County on the main laboratory city water supply line. The cooling tower make-up meters were replaced in March 2014. Under this Water Management Plan, ERD will monitor these new meters, along with the existing city water supply meter and the advanced meters, to determine appropriate next steps. 5.3 Historical Water Use
This section discusses ERD’s historical potable and ILA water use.
5.3.1 Historical Potable Water Use
In response to EO 13423, ERD set a FY 2007 potable water use intensity baseline of 44.32 gallons per gsf. In FY 2013, water use intensity had decreased to 11.67 gallons per gsf—a 73.7 percent reduction compared to the FY 2007 baseline. Figure 1 illustrates ERD’s potable water use intensity from FY 2007 to FY 2013.
ERD completed several water efficiency projects to contribute to its significant reduction in water use since FY 2007. These projects are described in Table 1.
Figure 1. Annual Potable Water Use Intensity, ERD, FY 2007–FY 2013
0.00
5.00
10.00
15.00
20.00
25.00
30.00
35.00
40.00
45.00
50.00
FY 2007 FY 2008 FY 2009 FY 2010 FY 2011 FY 2012 FY 2013
Wat
er U
se In
tens
ity (g
allo
ns/g
sf)
Fiscal Year
4

Table 1. Completed Water Efficiency Projects Since FY 2008, ERD
Project Implementation
Cost
Estimated Annual Water
Savings (gallons) Completion
Year Additional Notes Faucet aerators
$180 50,200 FY 2011 As of FY 2011, all faucets in ERD’s main laboratory building have been fitted with 0.5 gpm faucet aerators.
Urinals $40,500 104,000 FY 2011 As of FY 2011, all urinals at ERD are WaterSense labeled models flushing at either 0.125 or 0.5 gallons per flush (gpf) .
Toilets $85,500+ 202,000 FY 2011 As of FY 2011, all but one toilet at ERD are high-efficiency models flushing at either 1.28 or 1.4 gpf.
Meters Unknown Not quantifiable FY 2009 Flow meters are installed on cooling tower make-up water lines and the recovered air handler condensate line (which serves as cooling tower make-up).
Air handler condensate recovery
$10,000 430,000 FY 2008 ERD’s air handler condensate recovery system was installed in FY 2008. In FY 2013, the system provided 459,074 gallons of make-up water to the cooling tower system.
5.3.2 Historical ILA Water Use
ERD established an ILA water baseline in FY 2010 and has significantly reduced this water use since. Its FY 2010 ILA water use baseline was 797,938 gallons. By the end of FY 2013, its ILA water use had decreased by 65.8 percent to 273,185 gallons.
Prior to FY 2012, ERD added well water to an onsite stormwater detention pond to maintain water level. By design, it was not required that the pond remain wet. However, the water level was maintained for aesthetic reasons. In FY 2012, ERD stopped adding water to the pond due to a new research project allowing the pond water level to rise and fall without outside influences, resulting in a significant decrease in well water use the following year and years thereafter.
ERD also minimizes ILA water use by only irrigating in zones that require it to maintain landscape health. Turf areas are not irrigated. Irrigation is controlled based on the facility landscape contractor’s recommendation. Figure 2 illustrates ERD’s ILA water use from FY 2010 to FY 2013.
5

Figure 2. ILA Water Use, ERD, FY 2010–FY 2013
5.4 End Uses of Water
Table 2 and Figure 3 describe the end uses of water at ERD as of FY 2013.
Figure 4 identifies the facility’s water use based on the water source. ERD has been able to reduce its need for potable water by 28 percent by recovering and using air handler condensate as cooling tower make-up water.
Figure 5 provides a graph of ERD’s monthly potable and ILA water use in FY 2013. This graph illustrates ERD’s seasonal potable water use pattern that can be attributed to high cooling tower make-up water use in the summer months.
ERD’s end uses of water are described in more detail in this section.
0
200,000
400,000
600,000
800,000
1,000,000
1,200,000
1,400,000
1,600,000
FY 2010 FY 2011 FY 2012 FY 2013
Wat
er U
se (g
allo
ns)
Fiscal Year
6

Table 2. Major Water Uses, ERD, FY 2013
Major Process
FY 2013 Annual
Water Use (gallons)
Percent of Total
Potable Water Use
(%) Estimated
Utility Costsa Basis of Estimate Potable Water Use
Cooling tower make-up (potable water)
786,195b 86.2 $7,300 Calculated by difference from the FY 2013 total water use and the other estimated uses.
Main laboratory sanitary 100,000 11.0 $920 Engineering estimate based on 75 daily employees working at ERD. Water use estimated by considering the fixtures currently installed and associated water use factors.
Bailey Street Field Research Annex (primarily sanitary)c
12,268 1.3 $110 FY 2013 metered total.
Deionized water 9,568 1.0 $90 Estimated based on meter readings from March 2012 to February 2013.
Lifespan Center (primarily sanitary)
4,144 0.5 $40 FY 2013 metered total.
Total Potable Water Use
912,175 100 $8,500 FY 2013 metered total.
Onsite Alternative Water Use Cooling tower make-up (air handler condensate)
459,074 - - FY 2013 metered total.
Well Water Use Irrigation 273,185 - - FY 2013 metered total. Total Water Use 1,644,434 - - Sum of potable, onsite alternative and
well water uses. a Utility cost savings are calculated using the most current water and sewer rates available. Beginning in July 2013, the incremental water rate applicable to ERD is $4.61 per 1,000 gallons. The incremental sewer rate applicable to ERD is $4.60 per 1,000 gallons. b Separate make-up meters indicate cooling tower water use may be as much as 1,145,834 gallons per year. The differential method for determining cooling tower water use was used here to ensure the water balance is consistent with the main laboratory city water supply meter readings. Meters at all locations are routinely calibrated, and it is not clear why the cooling tower submeters and the main city water supply meter do not agree. c Note that the Field Research Annex will be reassigned to SESD in October 2014, so water use at this location is not discussed further in this plan.
7
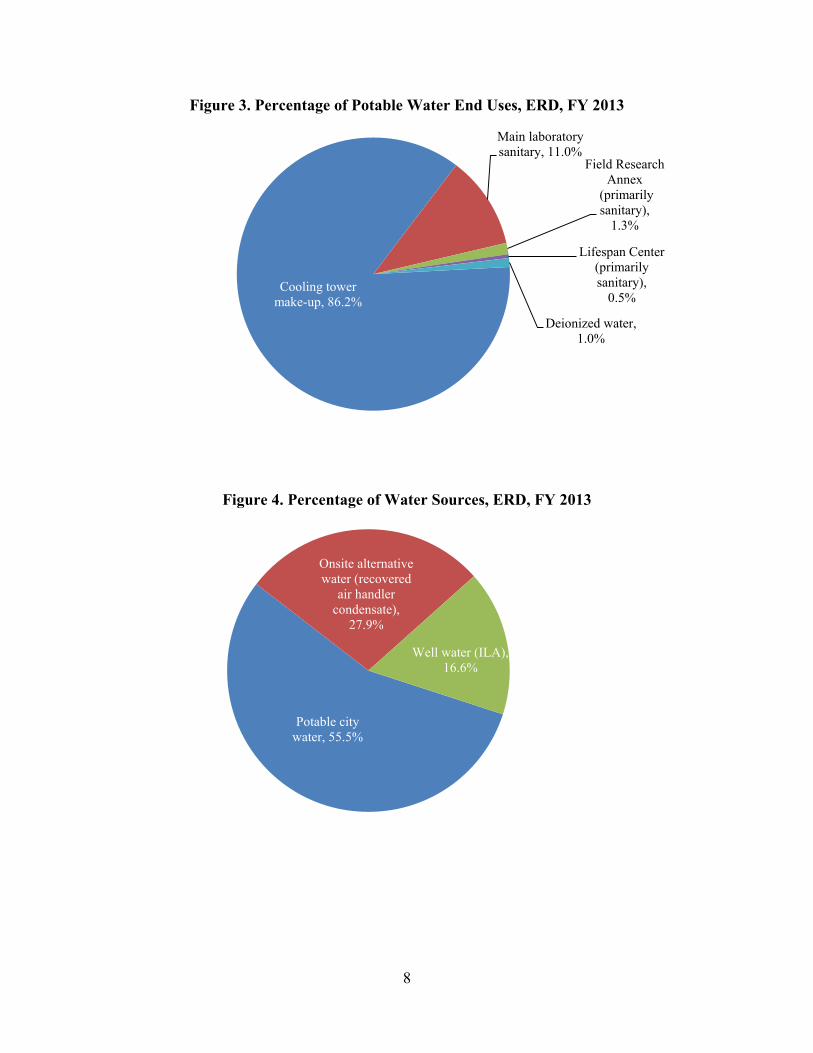
Figure 3. Percentage of Potable Water End Uses, ERD, FY 2013
Figure 4. Percentage of Water Sources, ERD, FY 2013
Cooling tower make-up, 86.2%
Main laboratory sanitary, 11.0%
Field Research Annex
(primarily sanitary),
1.3%
Lifespan Center (primarily sanitary),
0.5%
Deionized water, 1.0%
Potable city water, 55.5%
Onsite alternative water (recovered
air handler condensate),
27.9%
Well water (ILA), 16.6%
8

Figure 5. Monthly Water Use, ERD, FY 2013
Cooling Tower Make-Up The largest end use of water at ERD is its cooling tower system, which accounts for 86.2 percent of ERD’s total potable water use annually. The system is made up of two 150-ton cooling towers. If the cooling load requires it, both cooling towers can be run concurrently; however, typically only one cooling tower is operated at a time. The cooling towers are managed and maintained by a cooling tower maintenance contractor that performs monthly quality, performance, and water chemistry reviews of cooling tower operation. Dry chemical treatment is provided to control scale and corrosion. The cooling towers are operated at a conductivity between 500 and 1,000 microSiemens per centimeter (uS/cm). When the cooling towers are operating under a full cooling load, the conductivity is maintained at 1,000 uS/cm. Blowdown is adjusted by the maintenance contractor if the water conductivity falls out of this range. During warmer months when there is a load on the cooling tower, this control strategy provides for between 7.0 and 8.0 cycles of concentration and efficient cooling tower operation. ERD collects air handler condensate from the air handling unit on the roof and uses it for cooling tower make-up. The collected condensate is metered, and ERD records readings daily. Figure 6 is a graph of ERD’s monthly cooling tower water use in FY 2013, illustrating the two sources of cooling tower make-up.
0
50,000
100,000
150,000
200,000
250,000W
ater
Use
(gal
lons
)
Month-Year
Potable Water Use
Nonpotable Water Use
9

Figure 6. Source of Cooling Tower Make-Up Water, ERD, FY 2013
Sanitary Fixtures Sanitary fixtures are a major water end use at ERD. Aside from one private toilet located in the director’s office, all toilets in the main laboratory have been replaced with efficient models flushing at either 1.28 or 1.4 gallons per flush (gpf). All urinals in the main laboratory have been replaced with WaterSense labeled models flushing at either 0.125 or 0.5 gpf.
The main laboratory’s faucet fixtures are water-efficient, flowing at 0.5 gallons per minute (gpm). The 0.5 gpm flow rate is lower than the Energy Policy Act (EPAct) requirement for faucets and is compliant with the American Society of Mechanical Engineers/Canadian Standards Association (ASME/CSA) standard for lavatory faucets in public use settings. This flow rate is sufficient for hand washing and is considered a best practice for lavatory sinks in public settings.
The main laboratory’s showerheads are WaterSense labeled models flowing at 1.5 gpm. The Lifespan Center was not occupied in FY 2013; however, some facility maintenance and construction workers periodically perform renovation work within the facility. Water use at the Lifespan Center is related to sanitary use from these periodic visits. Toilets in the Lifespan Center flush at 1.28 gpf, while the faucet is a standard 2.2 gpm model. Water use at the Field Research Annex is entirely from sanitary use. All fixtures at the Field Research Annex are high-efficiency fixtures.
0
50,000
100,000
150,000
200,000
250,000
300,000
350,000W
ater
Use
(gal
lons
)
Month-Year
Potable Water Air Handler Condensate
10
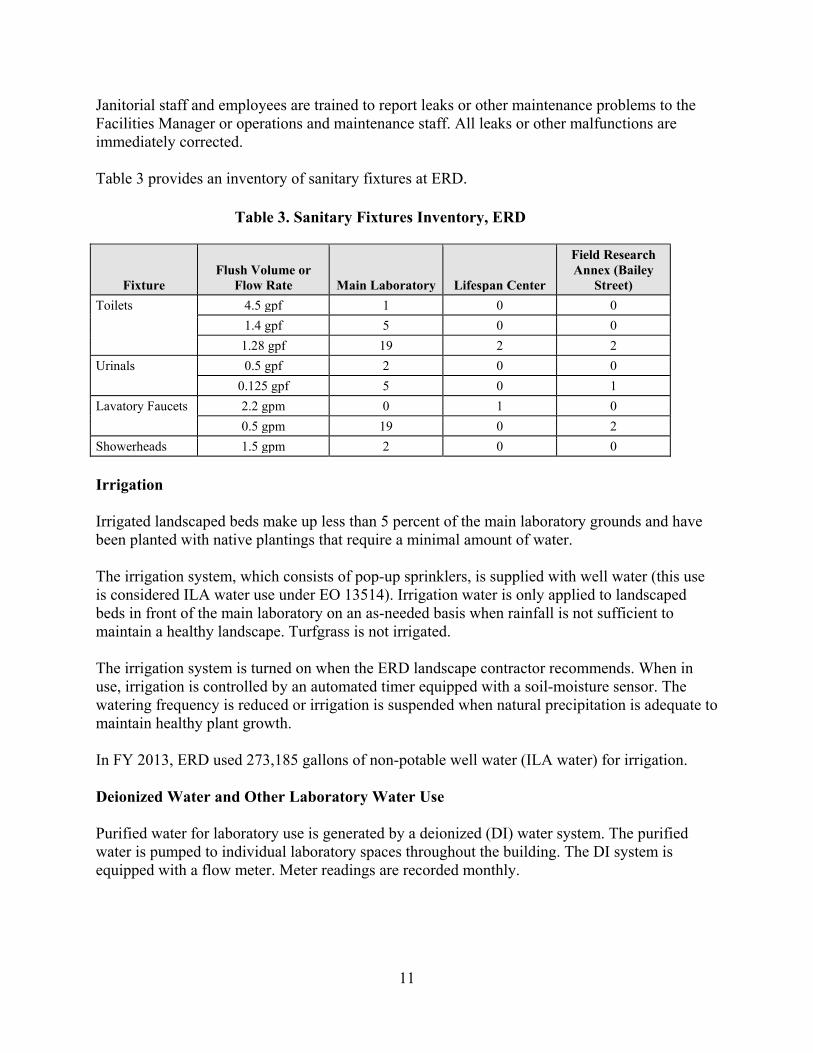
Janitorial staff and employees are trained to report leaks or other maintenance problems to the Facilities Manager or operations and maintenance staff. All leaks or other malfunctions are immediately corrected. Table 3 provides an inventory of sanitary fixtures at ERD.
Table 3. Sanitary Fixtures Inventory, ERD
Fixture Flush Volume or
Flow Rate Main Laboratory Lifespan Center
Field Research Annex (Bailey
Street) Toilets 4.5 gpf 1 0 0
1.4 gpf 5 0 0 1.28 gpf 19 2 2
Urinals 0.5 gpf 2 0 0 0.125 gpf 5 0 1
Lavatory Faucets 2.2 gpm 0 1 0 0.5 gpm 19 0 2
Showerheads 1.5 gpm 2 0 0 Irrigation Irrigated landscaped beds make up less than 5 percent of the main laboratory grounds and have been planted with native plantings that require a minimal amount of water. The irrigation system, which consists of pop-up sprinklers, is supplied with well water (this use is considered ILA water use under EO 13514). Irrigation water is only applied to landscaped beds in front of the main laboratory on an as-needed basis when rainfall is not sufficient to maintain a healthy landscape. Turfgrass is not irrigated. The irrigation system is turned on when the ERD landscape contractor recommends. When in use, irrigation is controlled by an automated timer equipped with a soil-moisture sensor. The watering frequency is reduced or irrigation is suspended when natural precipitation is adequate to maintain healthy plant growth. In FY 2013, ERD used 273,185 gallons of non-potable well water (ILA water) for irrigation. Deionized Water and Other Laboratory Water Use Purified water for laboratory use is generated by a deionized (DI) water system. The purified water is pumped to individual laboratory spaces throughout the building. The DI system is equipped with a flow meter. Meter readings are recorded monthly.
11

ERD is also equipped with a Getinge Model 533LS steam sterilizer. Condensate from the steam sterilizer flows to a drain where it is tempered with cooling water to prevent very hot water from entering the drain system. The tempering water only flows when the steam sterilizer is in use. 6.0 DROUGHT CONTINGENCY PLAN
Under non-drought conditions, ERD will comply with “pre-drought” water use restrictions mandated by the Georgia Department of Natural Resources (DNR) in Rules for Outdoor Water Use (Chapter 391-3-30-.03) (adopted May 26, 2004). For facilities with even-numbered addresses (e.g., 960 College Station Road and 130 North Oconee Access Road), outdoor water use is permitted on Mondays, Wednesdays, and Saturdays. For facilities with odd-numbered addresses, outdoor water use is permitted on Tuesdays, Thursdays, and Sundays. Landscape watering should not occur between 10 a.m. and 4 p.m. In the event of a drought, ERD will follow water use restrictions described in the Georgia Drought Management Plan (approved March 26, 2003) (Section 4) and Rules for Outdoor Water Use (Chapter 391-3-30-.03) according to the following levels, as declared by DNR’s Environmental Protection Division (EPD):
• Drought Response Level One • Outdoor water use follows “pre-drought” address scheduling. • Outdoor water use is allowed only between 4 p.m. and 10 a.m. • Use of fire hydrants for purposes other than firefighting, public health, safety, or
flushing is prohibited.
• Drought Response Level Two • Outdoor water use follows “pre-drought” address scheduling. • Outdoor water use is allowed only between 12 a.m. and 10 a.m. • Use of fire hydrants for purposes other than firefighting, public health, safety, or
flushing is prohibited. • Washing hard surfaces (such as streets, gutters, sidewalks, and driveways) is only
permitted when necessary for public health and safety.
• Drought Response Level Three • Even-numbered addresses: outdoor water use only permitted on Saturdays. • Odd-numbered addresses: outdoor water use only permitted on Sundays. • Outdoor water use is allowed only between 12 a.m. and 10 a.m. • The following uses are prohibited (except when necessary for public health and
safety): • Using fire hydrants. • Washing hard surfaces, such as gutters, sidewalks, and driveways. • Filling installed swimming pools. • Washing vehicles, such as cars, boats, trailers, and motorcycles. • Washing buildings or structures. • Using water for non-commercial fundraisers, such as car washes.
12

• Using water for ornamental purposes, such as fountains, reflecting pools, and waterfalls.
• Drought Response Level Four
• No outdoor water use is permitted except for activities exempted by EPD in 391-3-30-.05 or by the EPD Director.
Regional drought conditions and general information on water supply management can be found at the Drought in Georgia website provided by the University of Georgia College of Agricultural and Environmental Sciences at: http://www.georgiadrought.org/. ERD will also adhere to all applicable local water use restrictions mandated by Athens-Clarke County that extend beyond state-imposed water use restrictions. Information on Athens-Clarke County water use restrictions are found on the Athens-Clarke County Public Utilities website at: http://www.athensclarkecounty.com/publicutilities.
13