water management in peru - eijst.org.uk · at the tunnel graton, processing 17.5 m3/s in the...
TRANSCRIPT
European International Journal of Science and Technology Vol. 6 No. 9 December 2017
27
WATER MANAGEMENT IN PERU
Francisco Coronado
CENTRUM Católica Graduate Business School,
Pontificia Universidad Católica del Perú
JrAlomía Robles 125-129, Los Álamos de Monterrico-Santiago de Surco,
Lima, Perú.
Email: [email protected]
ABSTRACT
The paper presents the distribution and availability of water on the territory, the conditions
and characteristic of the different uses, the procedure of projects formulation, and of the water
authority in Peru.
Peru offers 4% of fresh water of the world; so on average there is abundance of water per
person. The precipitations reach a year average of 50 mm on the coast, 700 mm on the mountains and
3000 mm on the Amazonas, with direct correlation between altitude and precipitation on the coast
where rivers discharge about 70% of their total annual volume during four months of the year.
The matter bears social implications since all the population, about thirty million people, needs
to drink water and that the agricultural activity, the bigger user, occupies seven million people.
The paper highlights the necessity to build reservoirs, to increase the use of water of the
Amazonas basin and to improve the water projects formulation with care of the environment.
Keywords: Environmental Engineering, Water Resources, Water Management.
1.0 WATER AVAILABILITY
Peru is located on the central coast of South America; presents a narrow coast with 53 rivers some of
them dries every year, high mountains divides that occidental coast from the oriental basin of the
country, the Amazons jungle; the Titicaca lake basin completes the hydrography. (Coronado 2012).
The total available water including surface and groundwater is show in Table 1; The National
Authority of Water ANA, (2010) collects and processes the information of the water resources of
Peru.
European International Journal of Science and Technology ISSN: 2304-9693 www.eijst.org.uk
28
Table 1: Total available water
Basin Surface water
MMC/year
Groundwater
MMC/year
Total
MMC/year
Pacific 36,600 2,740 39,340
Amazonas 3’769,135 S/d 3’769,135
Titicaca 6,970 S/d 6,970
Total 3’812,705 2,740 3’815,445
Coronado (2012).
1.1 Surface water
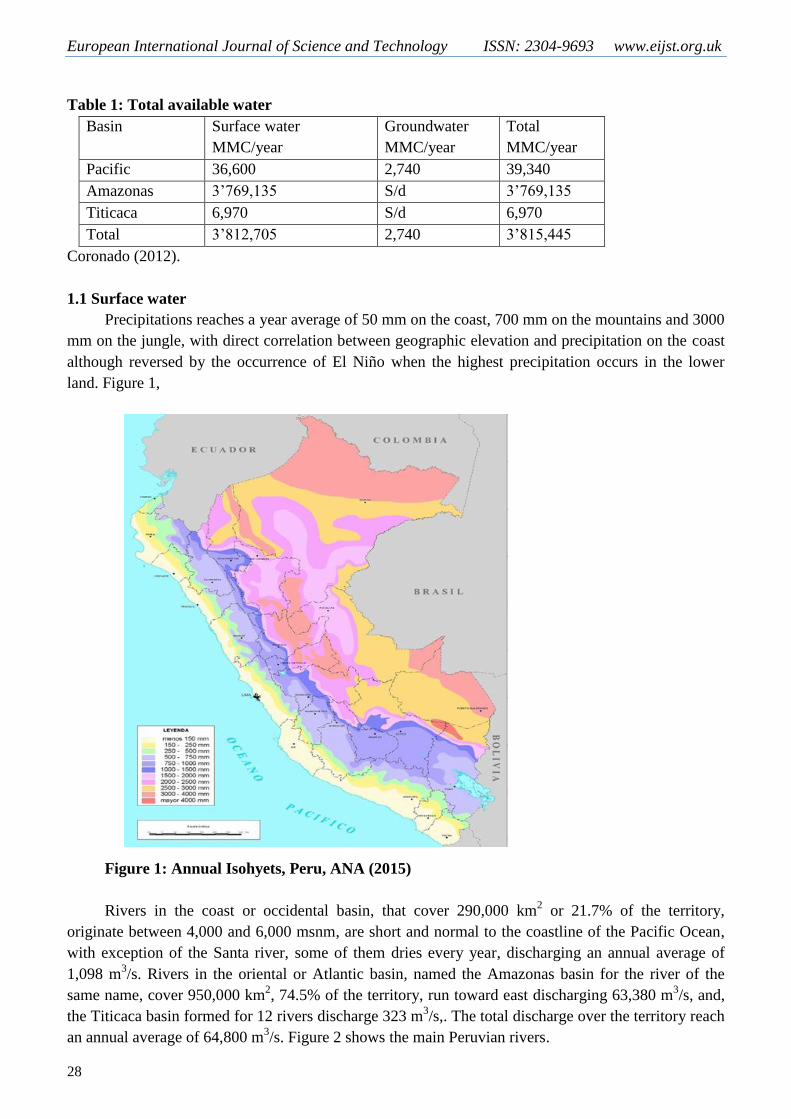
Precipitations reaches a year average of 50 mm on the coast, 700 mm on the mountains and 3000
mm on the jungle, with direct correlation between geographic elevation and precipitation on the coast
although reversed by the occurrence of El Niño when the highest precipitation occurs in the lower
land. Figure 1,
Figure 1: Annual Isohyets, Peru, ANA (2015)
Rivers in the coast or occidental basin, that cover 290,000 km2 or 21.7% of the territory,
originate between 4,000 and 6,000 msnm, are short and normal to the coastline of the Pacific Ocean,
with exception of the Santa river, some of them dries every year, discharging an annual average of
1,098 m3/s. Rivers in the oriental or Atlantic basin, named the Amazonas basin for the river of the
same name, cover 950,000 km2, 74.5% of the territory, run toward east discharging 63,380 m
3/s, and,
the Titicaca basin formed for 12 rivers discharge 323 m3/s,. The total discharge over the territory reach
an annual average of 64,800 m3/s. Figure 2 shows the main Peruvian rivers.

European International Journal of Science and Technology Vol. 6 No. 9 December 2017
29
Figure 2: Peruvian rivers, occidental, Amazonas and Titicaca basins.
At national level the available water of surface and the population is show in Table 2, observing
that the available water in the Amazonas basin elevates the annual average per person of Peru, as it’s
ranked at world level as a country with deficit of water.
Table 2: Surface water and population, 2007.
Basin Area 1000
Km2
Volume Population Volume /people
m3/año
MMC/año % Número %
Pacífic 290.0 37,383 1.8 18 315,276 65 2,040
Amazonas 950.0 1 998,752 97.7 8 579,112 30 232,979
Titicaca 45.2 10,172 0.5 1 326,376 5 7,669
TOTAL 1,285.2 2 046,268 100.0 28 220,764 100 72,509
Coronado (2012).

European International Journal of Science and Technology ISSN: 2304-9693 www.eijst.org.uk
30
In solid state surface water form glaciers and snow cover mountains representing 71% of
tropical glaciers of South America. MINAM-SENAMHI (2008), identified 18 glaciers covering about
2,041 km2 mainly in the mountains of the Santa’s river and on the mountains of the Urubamba,
Vilcanota and Vilcabamba rivers Figure 3.
Figure 3, Peruvians glaciers, MINAM-SENAMHI (2008)
The same publication reports a reduction of 21,8 % over the White Mountains between 1970 y
1997, and that between 1995 to 2008 the Pastoruri glacier reduced its area from 1.796 km² to 1,080
km².
Deficit of meteorological stations limits the possibility to control the decrease of - 0.5 °C over
the White Mountains between 1935 to 1998 (IRD 2007), in spite of being aware that the water of the
Santa river, that runs between those mountains, is the main source for two of the biggest irrigations of
Peru, Chavimochic of 141,356 ha, and Chinecas of 51,900 ha.
Peru counts with 12,201 lakes storing in liquid state 6981,1 Hm3,
Oficina Nacional de
Evaluación de Recursos Naturales, (ONERN 1980), and 743 dams storing about 5,500 Hm3,
Peruvian Forum for the Water (GWP-PERU 2015), including Poechos, 800 Hm
3 Gallito Ciego,
Tablachaca, El Frayle, Condoroma and San Lorenzo. (INADE 2007)
1.2 Groundwater
In the Peruvian coast are, Mendoza Z, Santayana T, Urrego G (2010), in operation about 5,000
tubular wells, 40 m to 100 m deep pumping between 12 to 100 lt/s or an annual volume of 1000 MMC
for irrigation purpose, other wells producing 350 MMC for drinking water, and about 400 MMC for
industrial and mining besides superficial artisanal wells for domestic use. Over pumping of the aquifer

European International Journal of Science and Technology Vol. 6 No. 9 December 2017
31
results in lowering the water table like in the Rímac and Ica’s valleys and the risk of contamination of
marine intrusion like in Callao and Barranca.
There is a need of more hydrogeological studies to define the sustainable volume of water to be
pumped, the geometry of the aquifer, the monitoring of the phreatic level and the measurement of the
input and output of the borders of the aquifers on the different valleys.
1.3 Sea water
Over 97% of water in the world is sea water, however its use is limited for the standards of
quality requirements for its different uses and the high cost of desalinization that makes more feasible
its use for limited volumes as for human consumption and some industrials processes.
It is of interest to point out the need of finding some agriculture species like pastures that could
resist some levels of salt, and the theme of Marine intrusion for example for measuring rivers
discharges as in the case of Tumbes river, and the contamination of groundwater for salty water as in
Callao and Barranca for over pumping.
2.0 Water quality and the environment
By law it’s an obligation to investigate the chemical, physical and biologic characteristic of
water being use for all purposes that obligates for instance to a treatment to reach standards for human
consumption and that defines the possibility its use for irrigation purpose. It is also important to study
the capacity to erode and transport solids that produces sedimentation of reservoirs like Poechos and
Gallito Ciego, and damages to urban areas, roads and bridges. The preservation of the balance of
nature and water, besides the effects of the climatic change, at least on running surface water is to
investigate the ecological discharges of the rivers to perfect the practical rules determinate for the
National Authority of Water, ANA (2016).
The location of about 48,000 mining concessions in operation in the high mountains, where near
60% of water are originated, expose the area soils, flora and fauna to pollution as well as to the
extension to the lower parts of the basins.
Drainage water of irrigations, cities wastewater and industrial and mining effluents modify and
affect natural environment extending their damages in the case of the rivers of the occidental basin to
the Pacific Ocean, as the water of the rivers like Moche and Rímac, and of the Titicaca lake for the
water of Rio Grande. (Agua y Agro 2010).
3.0. WATER USE
3.1. Human consumption.
The water service is provided by Public Sanitation Companies, EPS, at the regional level,
SEDAPAL in Lima, for Boards of Sanitation Service, JASS, for the rural population and, by
municipalities at the local level. It includes the concession to the private sector, as in the case of
Tumbes with the operation with a management contract, and the BOT, Build-Operate-Transfer of the
Chillón project. It should be noted the serious financial situation of 41 EPS with debts that to 2003
exceeded the $1.300 million (SEDAPAL 2010).
At national level, (Sedapal 2012), public services covered 76.8 % of the population, 89.2 % in
the urban area and 40.8 % in the rural area. In Lima, SEDAPAL delivers water 21 hours a day and the
EPS an average of 15 hours a day. In sewerage systems at the national level coverage reaches 65.3%
of the population, in the urban area the 83.8 % and in the rural areas 11.2 %. The population without

European International Journal of Science and Technology ISSN: 2304-9693 www.eijst.org.uk
32
water service at the national level was approximately seven million people and in Lima one million
receive water with cisterns paying 10 to 15 times the SEDAPAL tariffs.
To date SEDAPAL has the capacity to deliver 30.00 m3/s, provided by the Rimac and the
Chillón rivers with contributions from the Mantaro River and the Santa Eulalia basins, the lagoons of
Marcapomacocha, and Huascacocha, water from the reservoir of Yuracmayo as well as water filtering
at the tunnel Graton, processing 17.5 m3/s in the Atarjea treatment plant, 4.5 m3/s in PTAR Huachipa,
2.0 m3/s of the PTAR Chillón and up to 6.0 m3/s pumped from tubular wells, Sedapal Master Plan
(2014). The water distribution system comprises a network of 710 km of pipes and the sewerage
service of 782 km of pipes.
SEDAPAL plans include taking water from the Mala and Cañete rivers more than 130 km away
to the south, and from the Chancay and Huaral rivers about 100 km north of Lima, and proceed with
the sea water desalination for Ventanilla and urbanizations south of Lima.
If the production of water of SEDAPAL were 250 lt/capita per day (Reinhard 2009), the coast
with the current population of about 20 million people would need 1,825 million m3 per year, about
5% of the annual runoff of the Pacific rivers.
3.2 Agricultural consumption
Peruvian territory reaches 128 million hectares, with only 1.6 million under irrigation, of which
0.90 million hectares annually in production and a potential of 3.5 million in the coast; 0,50 million
hectares under irrigation and 1.30 million hectares producing with rain in the mountains with a
potential of 3.50 million hectares; other 0,20 million hectares are under irrigation and 0,60 million
producing with rain and a potential of 5,5 million hectares with agricultural aptitude in the jungle,
offering the most extensive area in Peru for that purpose, but in need of proper care for the
environment and the social conditions.
Some important irrigations in the coast use water from the Amazons basin such as the San
Lorenzo, from the Quiroz river, and Alto Piura y Olmos from the Huancabamba river, Tinajones
valley of Chancay in Lambayeque from the Chotano river, Ica, Majes, Apurímac river, Moquegua and
Tacna from the Titicaca basin, so it’s important to consider the rights of people living in territories
where water originates.
Available water in the coast will be just enough to satisfy the agricultural demand of the actual
1’000,000 hectare if gravity irrigation systems keep in use. Table 3 shows the water use in the country,
corresponding to the agricultural about 95% of all.
Table 3: Water use in Peru.
Use Volume
MMC
% Type of use
%
Annual discharge
MMC
CONSUNTIVE 64.5 2’059,799.3
Agriculture 23,059.0 94.4
Pecuary 87.7 0.4
Industrial 946.9 3.9
Mining 206.6 0.8
NO CONSUNTIVE 35.5
Energetic 13,352.7 100.0
TOTAL 37,652.9 100.0
Volume: use/discharge, 1.8%

European International Journal of Science and Technology Vol. 6 No. 9 December 2017
33
The net use of water will result of the balance between the water for the production in Peruvian
territory for human, agricultural, industrial, mining and commercial plus the imported water in diverse
products minus the water used for the products of export, following the so call Water Print, Hoekstra
et al (2011) with a balance that shows that we import more water that we export. Table 4.
Table 4, Water Print of Peruvian agriculture production,
Referencia, ANA (2015).
The National Authority of Water, ANA (2015), showed that rice, sugar cane and alfalfa, have
the highest water print and that water is exported in products as coffee, to the USA, Germany,
Belgium and Colombia, asparagus to USA, Nederland and Spain and avocado to Nederland and Spain.
The use of water for irrigations projects demanded investments of billions of dollars with
external financing, mostly designed and built by foreign companies as for the Puyango Tumbes and
the Chira-Piura by Americans consulting firms and Yugoslavian construction, Olmos with Russian
consulting and built by a Brazilian company, Tinajones and Jequetepeque Zaña design and built by
German companies, CHAVIMOCHIC with a Brazilian construction company, Majes Italian designer
and a consortium of Spanish and Swedish companies for the construction and Pasto Grande, for an
American consulting firm.
3.3. Mining use, pollution and conflicts.
Mining operations are located mostly in the upper parts of the mountains in the headwaters of
the water courses and lakes, extending at 2010, over 22'740.696 ha, with demand of water on the rise.
Yanacocha mine declared in 2010 the use of more than 500.000 m3 of surface water and more than
9'000.000 m3 of ground water a year. Cuajone demanded the use of 1.900 lt/s of surface water and
wells, Quellaveco 700 lt/s of the Tambo River and Cerro Verde of 1,000 lt/s from the waste water
plant of the city of Arequipa.
Office of the People Defender of Peru (2015) reported 140 conflicts in January 2015 as result of
denounces about environmental damages. Actual relevant cases are the mining Conga in Cajamarca
that contemplates to dry a lagoon to extract the ore and to dry another lagoon to deposit tailings, and
Tia Maria, in Cocachacra, Islay, Arequipa, close to the Tambo valley in full agricultural production.
The deterioration of water quality in the sierra of Peru as well as in the Titicaca basin result for
example, from the exploitation of gold among in Ananea, Puno in irregular ponds that alter in chaotic
way the banks with contamination that goes way to the Titicaca lake, (Agua y Agro 2010), situation
that repeats in Madre de Dios of the Amazon basin.
In both cases the contamination by the use of mercury, the formation of irregular ponds, the use
of dredges and trucks affect the environment and are in need to a new technology for example with
the disposal of pools of regular forms avoiding the spill directly to rivers.
To preserve the quality of water and to contribute to the solution of conflicts between mining
and the farmer’s interest it could be worth to consider conjunctive investments, mining and
agricultural and/or forestry, as in Porcon Farm in Cajamarca.
HH (Hm3/año) HH Green HH Blue HH Grey HH Total
HH for production 12,447 9,403 4,482 26,332
HH of exports 3,279 1,616 519 5,414
HH imported 9,542 572 1,145 11,259

European International Journal of Science and Technology ISSN: 2304-9693 www.eijst.org.uk
34
3.4. Power Generation
Peru has an estimated wind potential of 22.000 MW, solar energy of 5.24kWh/m2, and a
hydroelectric potential of generation of 58.937 MW; at the end of 2014, 66% of the installed power
was natural gas, 32% was of hydroelectric generation and 2% of solar and wind power (DGE, 2015).
In 2011, 88.8 % of the population at the national level counted with energy but at the rural areas only
61.2%. Among the main hydroelectric plants in production are the Antunez de Mayolo, 798 MW,
Restitution 210 MW, Cañon del Pato 264 MW, Yaupi, 108 MW and El Platanal.
It is reported, (MEM, 2014), that Peru has an installed capacity of more than 8.000 megawatts,
when the peak demand reaches the 6.000 megawatts, so that there is enough power to support the
development of the country.
4.0. FOOD SECURITY.
The welfare of the population, the sustainable development of cities and of the country depends
in large part on drinking water, energy and food. (FAO 2015) reported that the average daily calories
per capita in industrialized countries reaches 3.340, in Latin America and the Caribbean to 2.780 and
2.260 in Peru, where each inhabitant consumes an average of 365 kg of food per year.
Among the agricultural products that Peru produces are rice with an average consume per capita
year of 47.400 grams, the potato of 63.500 grams per year, the banana with 26.400 grams, followed by
apple and orange. The higher consumption of meat is chicken with 17.400 grams per capita per year,
although its production demands the import of hard yellow corn.
The relationship between the area under irrigation and the population has been decreasing with
population growth, the slow incorporation of irrigated land, the low agricultural yields and limitations
of the processes of post-harvest and marketing that resulted in the 2014 of the importation of more
than US $ 4,500 million for milk powder, fat anhydrous, wheat, maize, sorghum and soybeans,
although it is exported and imported coffee, cocoa, sugar, and fruits. Lately the exportation of
asparagus, avocado and blue berries are increasing.
As the basic diet of the Peruvian people is conform to mostly imported food there are not
enough reserves to be use in a time of crisis such as earthquakes, friaries, droughts and floods resulting
vital to have a Food Security Policy that Peru lacks.
5.0. CLIMATE CHANGE, EL NIÑO AND LA NIÑA.
The changing of weather conditions such as temperature and precipitation intensity on the coast
are manifestations of what is known as El Niño and La Niña, which according to the Technical
Committee of the National Study of the El Niño Phenomenon (ENFEN) between 1950 and 2014;
reached magnitudes between weak to extraordinary.
Between 1950 and 2015, (ENFEN 2015), there were 22 times the Niño, of which 2 years of
extraordinary level, 1 year strong, 8 moderate and 11 weak, while the Niña occur 22 times with
features of strong in 10 years, weak in 6 and moderate in other 6 years. The heavy rainfall and
discharges of 1982-83 and 1997-98, damage roads, bridges, schools and housing on the coast as the
lack of drinking water affecting the rural and urban areas. The Ministry of Agriculture (MINAN 2012)
reported losses from floods and droughts for the period 2006-2007 of S/. 250'876,226.
The 2017 heavy rainfall caused landslides and huaycos with more than 100 dead, serious
damage to more than 30.000 houses, to other family assets, more than 230 bridges collapsed, schools,
hospitals, roads, disrupting the transport between Lima and the north and center of the country, and
water pipes and sewage, 13.000 ha of crop losses, and flooding in particular Huarmey and Piura,

European International Journal of Science and Technology Vol. 6 No. 9 December 2017
35
Emergency Operations Center (COEN 2017). During the presence of the Niña as a period of drought
it’s necessary to have an appropriate knowledge of the aquifer and prepare the corresponding plan of
pumping.
Those situations constitute a challenge for a secure and economic design of rivers defenses and
the level of foundation of pillars and bridge stirrups, remembering that the river defenses of the Moche
valley practically collapsed with the Niño of 1998.
6.0 INTERNAL CONFLICTS
It is worth mention as some causes of internal conflicts the spatial distribution of water on the
territory, scarce in the coast and abundant in the Amazonas, and that in the coast discharges 70% of its
total volume in about four months.
Disputes between mining and agriculture activities that mostly result on differences of
appreciation of the contamination of water and soils generate a social pressure of the inhabitants of the
land on or downstream of the origins of the water courses to control the contamination and for
equitable public investment in their places for the use of water in other basins.
Some examples of disputes of the latter case is the use of water for irrigation purpose on the
coast of the Olmos and the Alto Piura projects that take water from the Huancabamba river of the
Amazonas basin, the Tinajones project that takes water of the oriental basin in Cajamarca; similar
cases are CHAVIMOCHIC and CHINECAS projects disputing water of the Santa’s river, Ica’s valley
and Huancavelica Region, the poorest of Perú, and the Majes Project and Espinar, Cusco, for the water
of the Apurímac´s river.
7.0 CHARACTERISTIC OF AMAZONS RIVER’S AND THE WATER USE
The Amazonian rivers are the contributor of 74.5%, of the water of the country, and show
variations of water levels that contribute to produce landslides of the banks while the currents erode
the bottom producing transversal sections variations, the formation and abandoning of meanders
reaches affect the navigation canals and port facilities. The Iquitos port, the most important fluvial
facility, was abandoned for the change of course of the main current of the Amazonas River some
years ago.
The high discharges of the Amazonas, Marañón, Ucayali and Huallaga rivers encourage plans to
derivate water to the coast from their higher tributaries crossing the Andean mountains, obligating to
be careful in the determination of the quantities to derivate, recalling that there is a proposal to pump
to the coast 500 m3/s from the Marañón and Huallaga rivers.
8.0 INTERNATIONAL SITUATION
The use of water of rivers that cross more than one country is ruled by the LXXII Resolution of
the Seventh American International Conference signed on December 24 of 1,933. The states have the
right to use those waters in accordance of the use of each limiting country. So, Peru and Ecuador
agreed in Washington on September 27 of 1971 to work together the binational projects, Catamayo-
Chira and the Puyango-Tumbes.
Peru and Bolivia work together the use of the Titicaca lake resources and Chile maintains the
Peruvian water right of pass by the Uchusuma canal that starts and ends in Perú. Peru, Ecuador and
Colombia work the use of rivers of the Amazonian basin for navigation purposes.

European International Journal of Science and Technology ISSN: 2304-9693 www.eijst.org.uk
36
9.0. FORMULATION AND EVALUATION OF PROJECTS.
Until February of 2017 the National System of Public Investment, SNIP, (Legislative Decree N°
1252, 2016) was the norm that all water projects should comply. However the table of contain was and
it was interpreted more as the application of formal aspects diminishing the due importance of the
hydraulic planning and the design part of the projects, and the elimination of the pre feasibility level
(MEF 2011) of necessity in particular for projects with dams and tunnels that require the selection of a
feasible alternative with field and of laboratory works..
The formulation of medium and big irrigations, shows the following sequence: Analysis of the
offer and demand of water, the chronogram of actions, the costs of the project at private prices, the
costs of the project at social prices, the contribution for entities, Income of the project, conditions for
sustainability, business plan, net value of the production without the project, net value of the
production with the project, change in the value of the project production. (MEF 2011). Sequence for
the formulation of small and medium size irrigations was applied during years in Peru, Figure 4,
(Coronado1976).
Figure 4: Formulation of small and medium size irrigations, Coronado1976.
The formulation of hydraulic projects has the difficulty of the limited precipitations and
discharges records. Because of the old cultures developed in the territory, to preserve what is left it is
required to obtain a Certificate of not affection of Archeological Rests, CIRA, and . for conservation
of the environment, it is obligatory to incorporate a study of the environmental impact of the project
that has to be approved by specialized offices of each Secretary and for projects of national impact for
the Secretary of Environment.
The emphasis on the presentation of cause and effects, means and ends and the logic framework
for a project, although at the beginning helped the projects formulation, resulted repetitive for the case
of irrigations for the common situation of the agricultural practice, of the limited availability of water,
the low level of technology and the lack or reservoirs among others.
In the other hand since professionals have to specialize in the SNIP, they follow very close the
formal aspects. In Peru, until 1982 it was applied successfully for medium and small irrigation the
sequence show in Figure 4,

European International Journal of Science and Technology Vol. 6 No. 9 December 2017
37
The Supreme Decree N~027/2017/EF, 2017 approves the regulation creating the National
System of Multiannual Program and Management, for minimum periods of three years following
criteria to be elaborate for a General Direction of the Secretary of Economy and Finances of the
government, requiring the participation of political authorities of the different regions of the country
and of the same users through their organizations as boards of irrigators.
To have an idea about the complexity of the management of the water resources is worth to
know that the whole treatment includes the National of Environment Police with four policies, the
National Agreement for Water Resources with five policies and eighteen strategies, the National Plan
of Water Resources with eleven strategies and thirty Programs, and finally at the lower level the
Management Plans of Water Resources for basins.
Projects formulation and construction for water use are responsibility of different Secretaries of
National level as Agriculture and irrigation, Minning, Energy, Fishing, and of regional government,
and local City Halls.
Projects formulation follows the procedures presented in the precedent title 9. Formulation and
Evaluation. Projects construction financed with public funds are regulated by the Secretary of
Economy and Finances and the Supervisor Organism of Public Contracts, OSCE that keeps records of
the contractors working in Perú.
10.0. WATER AUTHORITY.
The National Water Authority, ANA, is attached to the Secretary of Agriculture and Irrigation,
MINAGRI, in charge of water administration integrating the National System of Water Management
with the Secretary of Agriculture, Environment, Housing, Health, Production and Energy and Mines,
together with agrarian and not agrarian users, native communities between others, as the National
Superintendence of Services of Sanitation, the National Service of Meteorology and Hydrology, the
Supervisor Organism of the Investment in Energy and Mining, the Office of Evaluation and
Environmental Audit and the General Direction of Captaincies and Coast Guard
In seven years after the approval of the Water resources Law the MINAGRI has change eight
heads of the Authority, who in fact have limited authority since as an example cannot impose
sanctions for not authorized well perforations, and has not direct authority over the National Service of
Meteorology and Hydrology who is in charge of the water precipitations and discharges registers
because form part of the Secretary of Environment.
To illustrate the need of real authority of ANA it follow some cases that need decision as the
use of water for the Conga mine in Cajamarca, the agricultural use of water of the Apurimac river for
Majes project in Arequipa when people from neighbor Espinar in Cusco claims their priority to use
that water, the potential contamination of the Tambo river for the operation of Tia Maria mine, and the
distribution of water between two or more users as in the case of Alto Piura and Olmos, and between
Chavimochic and Chinecas. Through the country, Water Local Authorities, ALA, have the function to
authorize the use water for all users.
11.0. CONCLUSIONS
1. The different levels of policies, programs and plans approved in Peru, and the many entities
and users involved, difficult the water management.
2. The National Water Authority, ANA, does not exercises real authority.

European International Journal of Science and Technology ISSN: 2304-9693 www.eijst.org.uk
38
3. The deficit of the rainfall and water discharge gage stations makes it necessary to increase their
number to obtain more accurately the offer of water.
4. Water resources in Peru shown an unequal spatial and temporary distribution, scarce in the
coast, 70% discharges in the 4 first months of the year, and abundant in the jungle, resulting in
a need to study the use of the available water in the amazons.
5. The determination of water discharges, the fluvial processes and the preservation of the
environmental conditions in the Amazonas basin need to be confronted.
6. Monitoring of the phreatic level in the different valleys and a measurement of the input and
output of the borders of the aquifers need to be intensified.
7. The country needs to investigate the ecological discharge of the rivers.
8. Disputes between mining and agriculture for the use of water generate a social dilemma for
water rights and for an equitable public and private investment on the place of origin or on the
place of use.
9. There is a low coverture of drinking water and of sewerage services for the population of urban
and rural areas.
10. Peru does not have a policy of food security.
11. The organization and measures of prevention and action of the government under extreme
rainfalls and droughts requires of improvement and search of suitable solutions for example for
river training.
12. The norms for public projects with dams and tunnels needs to be changed, reinstalling the
prefeasibility level.
12.0 REFERENCES.
Agua y Agro Asesores Asociados SAC Elaboración del Perfil Técnico Económico siguiendo la norma
del SNIP de la cuenca del río Ananea, Lima, 2010
ANA National Authority of Water, Recursos Hídricos del Perú en Cifras, Boletín Técnico, Lima,
2010.
ANA, Huella Hídrica del Perú Producción Agropecuaria, Lima, Perú, 2015.
ANA, Metodología para Determinar Caudales Ecológicos, RJ N° 154-2016, Lima, Perú, 2016.
Comisión Mixta Peruano-Ecuatoriana para el Aprovechamiento de las Cuencas Hidrográficas
Binacionales Puyango-Tumbes y Catamayo Chira, september (1971), Bases Legales Reglamentos y
Normas Complementarias, Enero 1976, Lima.
Comité Técnico del Estudio Nacional del Fenómeno El Niño (ENFEN) 1950 y 2014, (2015)
Coronado, F. (1973) El recurso Agua, su Aprovechamiento y la Creación de un Sistema de
Planificación para el desarrollo de los recursos Hídricos, Segundo Seminario Nacional de
Hidrología, Lima.
European International Journal of Science and Technology Vol. 6 No. 9 December 2017
39
Coronado F, (2014) Las Irrigaciones en el Perú, Universidad Nacional de Ingeniería, Lima, Perú.
Decreto Legislativo N° 1252 (2016), nov 2016, Reglamento Decreto Supremo N° 027-2017-EF. Feb
2017
Defensoría del Pueblo Reporte de Conflictos sociales N-131, enero 2015, Lima
FAO, FIDA, PMA (2015), El estado de la seguridad alimentaria en el mundo, cumplimiento de los
objetivos internacionales para 2015 en relación con el hambre balance de las desigualdades, Roma,
FAO, 2015.
Foro Peruano para el Agua (GWP-PERU) (2015) diciembre
Hoekstra et al (2011). Water Footprint Assessment Manual,
Instituto Nacional de Desarrollo, INADE, (2007) Descripción de los Proyectos de Irrigación, Memoria
2001-2006, Lima.
Instituto Nacional de Recursos Naturales, INRENA, Ministerio de Agricultura, (1996).
Estudio de Reconocimiento del Uso del Recurso Hídrico por los diferentes sectores en el Perú INR-
42-DGAS, Lima.
Foro Peruano para el Agua (GWP-PERU) (2015) diciembre
Mendoza Z, Santayana T, Urrego G. Recursos Hídricos Subterráneos en Perú, PNUMA, La Habana,
Cuba, (2010).
Ministerio de Agricultura INRENA, (1996) Estudio de Reconocimiento del Uso del Recurso Hídrico
por los diferentes Sectores productivos en el Peru, INR-42-DGAS, Lima
Ministerio de Agricultura (2012), Report of Floods and Droughts loses, Lima
MINAM-SENAMHI (2008), Ubicación de nevados del Perú, Unidad de Glaciología,
Ministerio de Economía y Finanzas, MEF, (2011) Contenidos mínimos generales del estudio de pre
inversión de un proyecto de inversión pública Directoral Decrete N° 003-2011-EF/68.01, Lima.
MEF (2011) Directiva General del Sistema Nacional de Inversión Pública abril 2011, Lima.
Ministerio de Energía y Minas, Dirección General de Electricidad, (2015) Anuario Estadístico de
Electricidad, Lima.
National System of Public Investment, (2016) SNIP, Legislative Decree N° 1252,

European International Journal of Science and Technology ISSN: 2304-9693 www.eijst.org.uk
40
Oficina Nacional de Evaluación de Recursos Naturales, ONERN (1980), Aguas Superficiales del Perú,
Lima Peru.
Reinhard, S., (2009) Análisis de la Situación del Agua en Lima Metropolitana, Lima
Resolution of the Seventh American International Conference, LXXII, (1933), December
SEDAPAL, (2010) Plan Estratégico Institucional 2009-2013, Lima.
SEDAPAL, (2012) Plan Maestro para Lima y Callao, 2012-2040, Recursos Hídricos, Lima, Mayo
SEDAPAL, (2014), http://www.sedapal.com.pe/obras/proyobras.php
SEDAPAL (2014) Master Plan. Lima
Supreme Decree N° 027/2017/EF, 2017 National System of Multiannual Program and Management.