water management conservation, harvesting and artificial recharge
DESCRIPTION
Increasing water demands require more storage of water in times of water surplus for usein times of water need. Traditionally, this has been achieved by constructing dams. However,dams have finite lives because of eventual structural failure and sediment deposits in thereservoir. Also, good dam sites are becoming increasingly scarce, dams are not possible in flatareas, and they lose water by evaporation and can have adverse environmental and socioeconomiceffects. If water cannot be stored above ground by constructing dams, it must bestored below ground, via enhanced or artificial recharge of groundwater.TRANSCRIPT


This pageintentionally left
blank


Copyright © 2008, New Age International (P) Ltd., PublishersPublished by New Age International (P) Ltd., Publishers
All rights reserved.No part of this ebook may be reproduced in any form, by photostat, microfilm,xerography, or any other means, or incorporated into any information retrievalsystem, electronic or mechanical, without the written permission of the publisher.All inquiries should be emailed to [email protected]
PUBLISHING FOR ONE WORLD
NEW AGE INTERNATIONAL (P) LIMITED, PUBLISHERS4835/24, Ansari Road, Daryaganj, New Delhi - 110002Visit us at www.newagepublishers.com
ISBN (13) : 978-81-224-2632-8

PREFACE
Increase in population and change in lifestyle has created water scarcity in many parts of theworld. Microstructures for rain water harvesting, artificial recharge and reuse of water arebecoming more and more popular to solve the local water problems, to mitigate water shortageand improve water quality. In this book, it is attempted to fill the big gap between monitoringand performance of actual constructed structures and theoretical design in the literature. Thethree main structures for artificial recharge of groundwater viz. check dam, percolation tankand aquifer storage recovery well, are evaluated in this book. Topics related to reuse of waterand artificial rain are also discussed in length which will be necessary in the coming period.India has a very long coastal area, so sea water intrusion and preventive structures are veryimportant. This topic is also included in this book. Both the rationalized and empirical approachesfound valuable have been discussed. Many Case Studies will help the field workers to adoptoptimum design of micro-structures.
For the last several years, the authors have been associated actively with research andteaching of the subject at the undergraduate and postgraduate level. So this book will be verymuch useful for the students of water management subject at the undergraduate andpostgraduate level. It will be also very much useful to the practising engineers, farmers andpolicy makers.
The authors express their sincere thanks to V. P. Parekh and Manmohan Singh for theirkind help. Thanks are also due to Mrs. Prafulla Patel and Mrs. Chetna Shah who providedcontinuous encouragement for this project from its inception. Special thanks are due toMr. Saurabh Patel for his help in composing the manuscript.
Authors

This pageintentionally left
blank

On most of the river of the world, big dams are constructed. Very few sites are left forconstructing big water storage structures. Irregular rainfall, limited rainy days has createdflood and drought situation. Microstructure becomes more and more popular to solve the localproblems, to mitigate the flood and to fight against draught. Increase population and change inlife style have increase water demand. In this situation study, analysis and design of waterconservation, rainwater harvesting, reuse of water, and artificial recharge of ground waterwith the demand of time.
Groundwater being a handy resource exploited heavily and due to this reason day by daygroundwater table depleted and deterioration of groundwater quality is noticed in many partsof the world. Existing scarcity and water quality problems experienced practically all over theworld make water harvesting a critical issue for sustainable development. India has a richrepertoire of traditional techniques for water harvesting and it is appropriate that these practicesbe evaluated and can be adopted through out the world wherever required. Many case studiesgiven in this book will help readers and policy-makers to select specific optimum techniques.
Water Management - harvesting, conservation and artificial recharge by Dr. A.S. Patel andDr. D. L. Shah is indeed a worthy contribution to the field of water management, in generaland to the education of in this field in particular. Several features make this book remarkableamong others concerned with this topic.
This book consist of various chapters such as hydrological cycle groundwater occurrence,water losses and its prevention, water conservation, rainwater harvesting, artificial rechargemethods, their analysis and design. Many case studies of artificial recharge and rainwaterharvesting are included in this book. Some of the case studies are fully analyzed to adopt suchmethods in similar situation throughout the world. Sea water intrusion is a commonphenomenon on the coastal belt. So, a special chapter on this topic describes causes, concept,phenomenon, analysis, monitoring and structures needed for its prevention. Reuse of waterwill be required at the large extent in the coming days. So, concept of reuse of water, categoriesof waste water, technological innovations in the field, its reuse in different field, and case
FOREWORD
S e c re ta r y (K )

viii Energy ManagementWater Managementviii
studies. The world becomes very small. Most of the countries export and import somecommodities. To produce their commodity, water consumed in the virtual water net export orimport of water (in kinds of commodity) will create a water problem. From this point of viewa concept of virtual water is also included. This chapter will guide the policy makers andfarmers to prepare water footprint of the country and the change in agriculture croppingpattern depending upon the meteorological condition of the country. Artificial rain, reverseosmosis, moisture harvesting from the air in desert area and desalination is also included inthis book.
On the whole, the book is well written, self contained and several aspects a uniquecontribution to the field of Water Management in general and water harvesting, conservationand artificial recharge in particular. I fully intend to recommend it to students, researchers,and consultants.
(M.S. Patel)Secretary (K)

ix Energy Management Contents ix
CONTENTS
Foreword (v)Preface (vii)
1. INTRODUCTION 11.1 Overview 11.2 Increasing Resource Demand 21.3 Floods and Droughts 41.4 Water Quality Management 61.5 Fresh Water Management 71.6 Wastewater Management 81.7 Recycling and Reuse of Water 81.8 Need for Technology Development 91.9 Water Conservation 101.10 Need of Ensuring Quality & Cost-effectiveness of Water Harvesting 121.11 Development of International River Basins 12
2. HYDROLOGICAL CYCLE 152.1 Introduction 152.2 Atmospheric Water 182.3 Precipitation 192.4 Surface Water 192.5 Infiltration 202.6 Groundwater 202.7 Evapo-transpiration 222.8 Recharge 23
3. GROUNDWATER OCCURRENCE 253.1 Introduction 253.2 Groundwater Occurrence 253.3 Source of Groundwater 263.4 Factors Controlling Groundwater 273.5 Water Bearing Properties of Soils and Rocks 27

x Energy ManagementWater Managementx
3.6 Types of Aquifers 303.7 Aquifer’s Lithology 323.8 Groundwater Flow 343.9 Groundwater Appearing on Surface 353.10 Groundwater Exploration 373.11 Aquifer Performance Test 39
4. WATER LOSSES 414.1 Introduction 414.2 Evaporation 414.3 Transpiration 534.4 Interception 614.5 Depression Storage 634.6 Infiltration 63
5. WATER CONSERVATION 775.1 Introduction 775.2 Development of New Supplies 775.3 Reducing Demand of Water 785.4 Evaporation Control 795.5 Equipments 845.6 Studies on Evaporation Control 855.7 Conservation of Soil Moisture 885.8 Soil Mulches 895.9 Influence of Farmyard Manure on Soil Moisture 90
6. RAIN WATER HARVESTING 936.1 Introduction 936.2 Rain Water Harvesting 946.3 Roof Water Harvesting (RWH) 956.4 Water Harvesting by Ponds 1066.5 Water Quality Consideration 108
7. ARTIFICIAL RECHARGE METHODS 1117.1 Introduction 1117.2 Natural Recharge Measurements in India 1117.3 Concept of Artificial Recharge 1127.4 Methods of Artificial Recharge 1127.5 Theory of Artificial Recharge by Spreading 1167.6 Check Dam 1227.7 Percolation Tank 1227.8 Classification of Tanks 124

xi Energy Management Contents xi
7.9 Flooding Methods 1337.10 Indirect Methods 1397.11 Methods of Artificial Recharge Practiced by People in Drought
Prone Area 1447.12 Well Clogging Mechanism and their Prevention 1537.13 Cleaning of Injection Wells 162
8. CASE STUDIES 1678.1 In Situ Water Harvesting for Drinking Water Supply at Cherrapunji,
Meghalaya 1678.2 Case Studies of Artificial Recharge 1688.3 Artificial Recharge — Siphon Recharge Experiment
(National Geophysical Research Institute) 1758.4 Water Quality Improvement by Artificial Recharge —
Kanha Project, Vadodaraa 188
9. PERFORMANCE INDICATORS OF ARTIFICIAL RECHARGESTRUCTURES 1959.1 Introduction 1959.2 Methodology Adopted 1979.3 Percolation Tanks 1979.4 Check Dams 2059.5 Aquifer Storage Recovery (A.S.R.) Wells 212
10. SEA WATER INTRUSIONS 22110.1 Introduction 22110.2 Causes of Sea Water Intrusion 22310.3 Chemical Characteristics of Saline Water 22410.4 Concept of Fresh-saline Interface 22610.5 Phenomenon of Zone of Dispersion 22710.6 Analytical Formulae for the Fresh – Saline Interface 23010.7 Upconing of Saline Groundwater 23710.8 Effect of a Relative Sea Level Rise 23810.9 Control of Salt Water Intrusion 24010.10 Countermeasures to Control Salt Water Intrusion 24110.11 Monitoring of Salt Water Intrusion 24410.12 An Overview of Salt Water Intrusion Along Gujarat Coast, India 24510.13 Recharge Techniques 24810.14 Salinity Control Structures 24910.15 Coastal Land Reclamation 251
11. REUSE OF WATER 25311.1 Introduction 25311.2 Concept of Reuse of Water 25511.3 Categories of Wastewater Reuse 258

xii Energy ManagementWater Managementxii
11.4 Technological Innovations 26111.5 Types of Wastewater Reuse 263
12. VIRTUAL WATER 27712.1 Introduction 27712.2 The Concepts of Water Footprint and Virtual Water 27712.3 Definitions 27812.4 Underlying Assumptions 28012.5 Population - Food - Trade Nexus 28012.6 Strategic Issues 28212.7 The Economics of Water Use 28412.8 Virtual Water Trade 28512.9 Method for Calculating Amount of Virtual Water 28512.10 Calculation of a Nation’s ‘Water Footprint’ 28812.11 Data Sources 28912.12 Specific Water Demand Per Crop Type Per Country 29112.13 Global Trade in Virtual Water 291
13. CREATION OF SWEET WATER 29913.1 Artificial Rain 29913.2 Reverse Osmosis 30313.3 R.O. Plant at Thermal Power Station 30813.4 Low Temperature Thermal Desalination (LTTD) Plant 31513.5 Affordable Desalination 31713.6 Net is Used to Captive Water 318
REFERENCES 319
INDEX 329

INTRODUCTIONINTRODUCTIONINTRODUCTIONINTRODUCTIONINTRODUCTION
1.1 OVERVIEWThe earth’s population is projected to double from the present 5.6 billion to about 10 billionby the year 2050 (State of World Population Report, 1993, U.N. Population Fund). Most ofthis increase will occur in the Third World; where close to 90% of the world population willthen live. Also, people will continue to migrate from rural areas to cities and already by theend of this century, there will be 22 mega cities (population more than 10 million), 18 ofwhich will be in the Third World. Such cities have mega water needs, produce mega sewageflows, and will have mega problems. Already now, it is estimated that half the people in theThird World have no access to safe drinking water, that one billion get sick every year fromwaterborne diseases, and that 12 million die, 80% of which are children. Also, more waterwill be needed for irrigation of crops to provide enough food for the expanding population.Competition for water will become increasingly intense and can lead to unrest and war ifnot properly resolved.
Populations in industrialized countries will remain rather stable, except perhaps in theU.S. where the population may double in the next century, depending on immigration policies.However, increasing environmental concerns in First World countries will increase waterdemands for stream benefits, wetlands and other natural water areas, and recreation. This oftenleads to conflicts and polarization between interest groups, as for example, in the western U. S.where the issues are fish culture vs. farming, fish vs. hydropower, river beaches cultural vs.hydropower, and others.
Increasing water demands require more storage of water in times of water surplus for usein times of water need. Traditionally, this has been achieved by constructing dams. However,dams have finite lives because of eventual structural failure and sediment deposits in thereservoir. Also, good dam sites are becoming increasingly scarce, dams are not possible in flatareas, and they lose water by evaporation and can have adverse environmental and socio-economic effects. If water cannot be stored above ground by constructing dams, it must bestored below ground, via enhanced or artificial recharge of groundwater.
Integrated water management is most vital for poverty reduction, environmental sustenanceand sustainable economic development in world because water has the potential for bothdisease causation and prevention. Availability of water in any parts of the world is under
11111

2 Energy ManagementWater Management2
tremendous stress due to growing population, rapid urbanization, increase in per capitaconsumption, industrial growth and other demands for maintaining ecology. It is to be stressedthat nondevelopment of water storage projects is not a viable or available option in India, dueto the large temporal variations in the river flows in Indian monsoonic climate. Tremendousprogress has been made in the field of water resources development and management andconsequent boost in agricultural production leading to self-reliance, rapid industrializationand economic growth. In spite of that, a large portion of population still lives in sub-standardconditions, devoid of even minimum civic amenities. Vast area under agriculture still dependson the mercy of monsoon. The pressures on our water and land resources are continuouslyincreasing with rise in population and urbanization. All this demands sustainable developmentand efficient management of available water resources.
1.2 INCREASING RESOURCE DEMAND
Since independence, India has witnessed an unprecedented increase in population. From apopulation of about 343 million in 1947, the population has grown at a rate of 2.04% to cross the1,000 million mark in 2000 (Fig. 1.1). With an increasing number of mouths to feed, there has
1901 1911 1921 1931 1941 1951 1961 1971 1981 1991 2001 2011
1400
1200
1000
800
600
400
200
0
Pop
ulat
ion
of In
dia
(In
Mill
ions
)
Y ears
Fig. 1.1 Population of India 1901 – 2011(source: Census of India 1991).
been an additional pressure on agriculture resulting in an increase in net sown area from 119million hectares in 1951 to 142 million hectares in 1997; high cropping intensity has also resultedin an increased demand for water resources. Domestic water need in the urban areas has alsogrown notably with the current urban population at 4.5 times the population level in 1950s(UNEP 1998). The water requirement of the manufacturing sector has increased in proportionto the increase in the sector’s share in GDP from about 12% in 1950s to 20% in 1990s. By theyear 2050, the population is expected to reach around 160 crores, the per capita availability willdrastically reduced and our country shall be water stressed in many river basins. In planningcritical resources like water we need to plan on safer side. A close watch on an increase inpopulation is essential. The following Table 1.1 shows probable water availability against year.
Further, there is substantial variance in the different user sectors—agriculture, domesticand industry, vis-à-vis their share of water demand, resource pricing structure and usageefficiencies, which creates inter-sector competitions and conflicts. The agriculture sector, forinstance, accounts for about 95% of the total water demand with the subsidized and free
3 Energy Management Introduction 3
regime of supply of power and water resulting in the over-exploitation and inefficient usage ofwater. The high resource cost for industries, on the other hand, cross-subsidizes the waterconsumed by the other sectors.
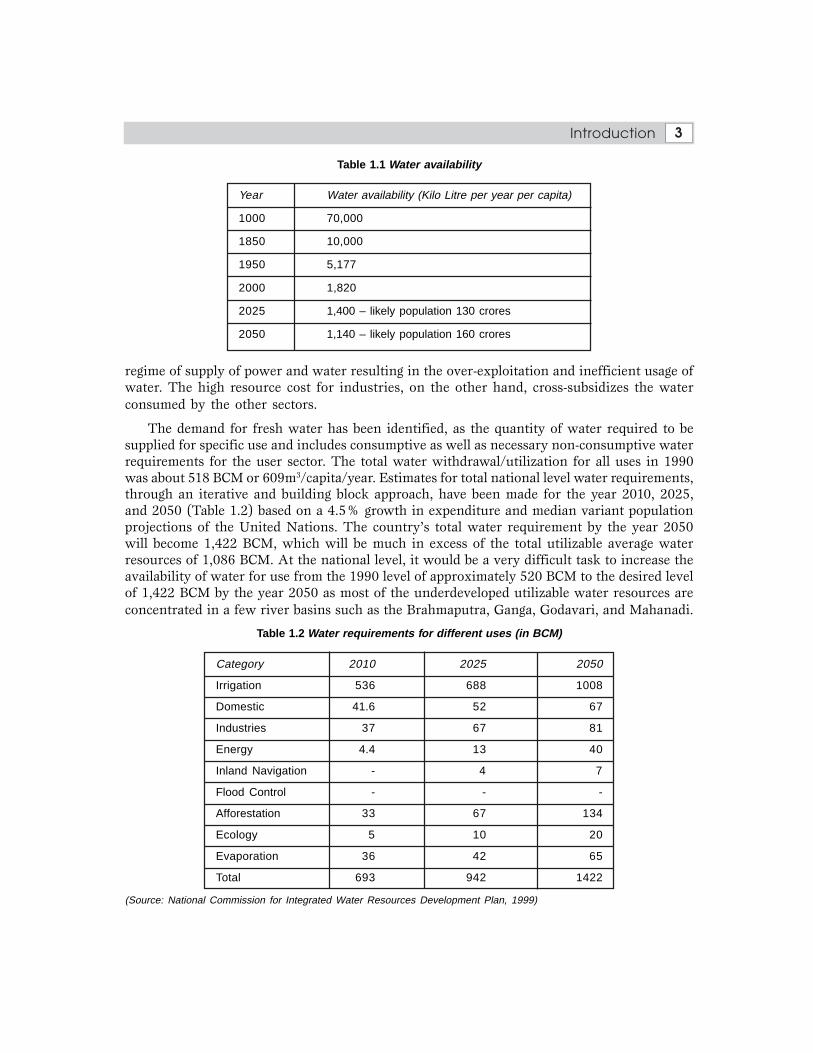
The demand for fresh water has been identified, as the quantity of water required to besupplied for specific use and includes consumptive as well as necessary non-consumptive waterrequirements for the user sector. The total water withdrawal/utilization for all uses in 1990was about 518 BCM or 609m3/capita/year. Estimates for total national level water requirements,through an iterative and building block approach, have been made for the year 2010, 2025,and 2050 (Table 1.2) based on a 4.5% growth in expenditure and median variant populationprojections of the United Nations. The country’s total water requirement by the year 2050will become 1,422 BCM, which will be much in excess of the total utilizable average waterresources of 1,086 BCM. At the national level, it would be a very difficult task to increase theavailability of water for use from the 1990 level of approximately 520 BCM to the desired levelof 1,422 BCM by the year 2050 as most of the underdeveloped utilizable water resources areconcentrated in a few river basins such as the Brahmaputra, Ganga, Godavari, and Mahanadi.
Table 1.2 Water requirements for different uses (in BCM)
Category 2010 2025 2050
Irrigation 536 688 1008
Domestic 41.6 52 67
Industries 37 67 81
Energy 4.4 13 40
Inland Navigation - 4 7
Flood Control - - -
Afforestation 33 67 134
Ecology 5 10 20
Evaporation 36 42 65
Total 693 942 1422
(Source: National Commission for Integrated Water Resources Development Plan, 1999)
Table 1.1 Water availability
Year Water availability (Kilo Litre per year per capita)
1000 70,000
1850 10,000
1950 5,177
2000 1,820
2025 1,400 – likely population 130 crores
2050 1,140 – likely population 160 crores

4 Energy ManagementWater Management4
1.3 FLOODS AND DROUGHTSCauses of Floods: Flooding caused due to several factors.
Natural
• Huge flows generated from rainfall occurring in a short span of time in the upstreamcatchments and consequent over bank spilling of the main rivers;
• Runoff generated by heavy local precipitation that can not drain out due to high stagein the out fall rivers;
• Landslide and glacial lake outbursts that result in high sediment deposition in the river course;• High tide in the Bay of Bengal coupled with wind setup caused by South Westerly
monsoon winds that obstruct drainage of the upland discharge, and• Synchronization of the peak flows of the major rivers.
Man Made
• Deforestation in the upper catchments;• Uncoordinated development activities in the upper riparian countries and in Bangladesh.
Floods in South Asia
Nepal: The major floods experienced in the Himalaya and the mountains are mainly due toglacier lake outburst or cloud burst and land slides. The three major rivers, the Sapt Kosi, theGandaki and the Karnali originate in the Himalaya are snow and glacier fed. A large part of thedrainage area is covered by snow and glacier throughout the year and play a significant role inthe hydrologic regime of the river system. These rivers receive monsoon floods form June toSeptember where about 85 percent of total precipitation falls.
India: All most all the rivers in India carry heavy runoff during monsoon due to intensive andheavy rainfall in their catchments. Flood problem in the Ganges basin in India are of threetypes inundation due to over bank spilling, erosion of riverbanks and changing river courses.In the Brahmaputra basin, a number of factors cause serious floods due to physiographiccondition, meteorological situations, earthquakes, landslides and encroachment of river areasMonsoon floods generally occur between June to September.
After the earthquake of 1950, the regime of the Brahmaputra river in the upper catchmentsin India changed considerably and the depth, duration and flooded area increased. Floods inIndia during 1954, 1962, 1966, 1972, 1973, 1974, 1983, 1984, 1987 and 1988 were very severe.The average area affected by flood in India is 7.9 million ha of which 3.69 million ha is cropped.On an average 1.25 million houses get damaged, over 1,00,000 cattle perish and about 1,500human lives are lost. The estimated average annual loss in India is about us $ 500 million.
Bangladesh: Flooding in Bangladesh is a recurrent phenomenon. About 60 percent of thecountry is flood prone, while about 25 percent of the land is inundated during monsoon in anormal year. Bangladesh experienced severe floods in 1954, 1955, 1961, 1962, 1964, 1970,1971, 1974, 1984, 1987, 1988 and 1993. Bangladesh through its intricate network of riversystem drains catchments of about 1.75 million sq. km. Owing to the geographical locationabout 90 percent of the streams flow with high sediment load from upstream catchmentswhich passes through Bangladesh.

5 Energy Management Introduction 5
Flood problem in the Ganges area in Bangladesh is mainly due to over bank spilling. Theflood situation deteriorates when Brahmaputra remains in spate forcing backwater into theGanges. The water in the Ganges begins to rise in May and period of maximum flood is in Julyand August. Occasionally September could be a month of severe flooding.
Flooding in the Brahmaputra is characterized by large-scale inundation of its banks, erosionat various places, and conveyance of heavy silt load from upstream. In Bangladesh, the areaprone to flooding is 6.14 million ha which 42 per cent of total area of the country. The losscaused by floods in a normal year is about US $ 175 million. In extreme situation, it mayexceed US $ 1 billion.
River basin development is a tool for social development. It supports economic growth andimproves living conditions and the quality of life. The Ganges, the Brahmaputra and the Meghnaare international rivers with its basin areas spread over China, Nepal, Bhutan, India andBangladesh. Its peculiar geographical location has given the rivers ample water resources; buttoday no coordinated attempt has been made to utilize these. Piecemeal attempts for developmentin individual countries have not been effective in solving the problems of flooding.
Presently each country has its own plans and programs for developments, including floodcontrol. But recent flood and other natural disasters have shown that such individual effortsare not enough within the country.
The need for holistic development and management of the river basins are needed toovercome the adverse effects of floods and maximize crop production with judicious use of water.
The construction of high dams in Nepal, Bhutan and India will generate not only cheaphydropower needed for overall development but also augment the dry season flows andmitigation of floods all the countries for the benefit of the people.
Management of Floods and Droughts
Floods and droughts though are natural calamities, these needs to be effectively managed, inorder to mitigate their adverse impact on humans and animals. It is estimated that around 263million people live in drought prone area of about 108 m. ha., which works out 1/3rd of thetotal Indian geographical area. Thus, more than 26% of total population of the country facesthe consequences of recurring droughts, on a wide spectrum of social concerns. During thedrought years, there is a marked tendency of intensive exploitation of groundwater, resultingin abnormal lowering of ground water table thus accentuating the distress. Grave adverseimpacts are borne by flora, fauna and domestic cattle and the very life itself fights againstnature for its survival. Droughts accentuate problems in cities in the form of mushrooming ofslums and pressure on the existing civil amenities thereby adversely affecting urban life.
Over 40 million hectares of the area of the country (about 1/8th of total geographical area)experiences periodic floods. The average area affected by floods annually in India is about 7.5m. ha. due to which crop area affected is 3.5 m. ha. Floods have claimed on an average 1529human lives and 94000 cattles every year. Apart from loss of life and domestic property, thedevastating effects of floods, sense of insecurity and fear in the minds of people living in the

6 Energy ManagementWater Management6
flood plains is enormous. The after effects of floods like the agony of survivors, spread ofepidemics, non-availability of essential commodities and medicines and loss of their dwellingsmake floods most feared natural disaster being faced by human kind. Large-scale damages toforests, crops & precious plants and deaths of aquatic and wildlife, migratory and native birdsin various National Parks, Delta region, low altitude hilly areas and alluvial flood plains havealways been the matter of serious concern. River Valley Projects moderate the magnitudes aswell as frequencies of floods.
Floods and drought management, therefore, form an important part of overall water resourcesdevelopment and management. Water of potable quality is essential for sustenance of life.
Besides, water is required for other domestic use and for livestock. This requirement ofwater though not very large, has to be met at a huge cost due to strict quality parameters and longconveyance. Norms of water supply in Indian cities are more than in some of the developedcountries of Europe. Users need to realize value of treated water and should inculcate habit ofconservation. The existing system should be maintained and leakage prevented to the extentpossible. Lavish consumers should be charged heavily and pricing of water should be used as atool for demand management. Low cost technique for recycling and reuse of grey water (Bathroom and kitchen wash) and black water (Sewerage) should be developed and encouraged.Water requirement for industries, at present is not significant. However, with continuousurbanization and industrialization, the demand for water for industries will increase significantly.Further practically all industries generate some waste. As of now, the performance of affluenttreatment system in the industries is far from satisfactory and this effluent is polluting our waterbodies. The industries have to stick to the norms to treat their waste accordingly. In the processpart of their demands can be met by the industries themselves with suitable treatment andrecycling. Industries generating hazardous waste may have to be located in area having suitablesites for waste disposal, as the present practice being adopted are very detrimental to the overallenvironment. Water requirements of the country would continue to grow partly due to the risein population and partly as a result of the improvement in the quality of life. As the developmentalefforts to meet the water requirements take shape, simultaneously the environmental issues gainimportance. Although, less evident than the more obvious quantity related problems, these arecritically important and need to be addressed to ensure sustainable development which is aformidable challenge, but one which can be accepted and negotiated successfully.
1.4 WATER QUALITY MANAGEMENTWater quality is a major environmental concern in developing countries. Pollution of waters ofrivers, streams and lakes is mainly the fallout of rapid urbanization, industrialization andinadequate storage of flood flows for meeting the needs of water supply and sanitation sectors.The main sources of water pollution are discharge of domestic sewage and industrial effluents,which contain organic pollutants, chemicals and heavy metals, and runoff from land basedactivities such as agriculture and mining. Further, bathing of animals, washing of clothes anddumping of garbage into the water bodies also contribute to water pollution. All these factorshave led to pollution of rivers, lakes, coastal areas and groundwaters seriously damaging the

7 Energy Management Introduction 7
eco-systems. Effective environmental laws to check water pollution need to be enforced withgreater vigour. The rivers and water bodies should no be used as a source for water supplies aswell as convenient sink for wastewater discharges. The rapid urbanization, industrializationand increasing use of chemical fertilizers and pesticides etc. have made our rivers and waterbodies highly polluted. Different organizations like Central Pollution Control Board, CentralWater Commission, and Central Groundwater Board are involved in water quality monitoring.Water quality Assessment Authority (WQAA) has been set up recently to effectively coordinateand improve the work of water quality monitoring by various organizations. As of now thereis no established method to assess requirements of minimum flow in the rivers. Perhaps, 50 percent of lean period flow before the structure is built over and above the committed use may bepassed on downstream of all existing and new structures.
1.5 FRESH WATER MANAGEMENTThe availability of fresh water is going to be the most pressing problem over the coming decades.The stress on water resources is a result of multiple factors namely urban growth, increasedindustrial activities, intensive farming, and the overuse of fertilizers and other chemicals inagricultural production. Untreated water from urban settlements and industrial activities, andrun-off from agricultural land carrying chemicals, are primarily responsible for deteriorationof water quality and contamination of lakes, rivers, and groundwater aquifers.
The Government of India formulated the National Water Policy in 1987 to provide toppriority to drinking water supply and undertook the National River Action Plan to clean uppolluted river stretches. Following measures needed to increase the availability of fresh water.
• Emphasis should be given to adopting a river basin approach or sub-basin-basedapproach, which integrates all aspects of water management namely water allocation,pollution control, protection of water resources, and mobilization of financial resources.
• Each state should prepare water policies. The National Water Policy of 1987 also needsto be revised urgently. Groundwater legislation needs to be promulgated in all states topromote sustainable water uses and development. Incentives under the Water CessAct have to be made more attractive.
• Emphasis should be given to rain water harvesting to increasing water resourceavailability. Watershed development must be adopted more rigorously. People’sparticipation is the essential prerequisite for water shed development and to this end,public education and training to local people is to be provided.
• An appropriate tariff structure for water services will have to be evolved to encouragewide usage. There is also a need to develop and implement cost effective waterappliances such as low flow cistern and faucets.
• Technological intervention is required to enhance effective treatment of wastewater.Adoption of cleaner technologies by the industry would help to safeguard surfacewaterbodies.
• Data on water supply and sanitation for both urban and rural areas need to be collectedto formulate strategies and priorities and action plan. Similarly, information on water

8 Energy ManagementWater Management8
consumption and effluent discharge patterns for industries would help to benchmarkresource consumption and increase the productivity levels per unit of water consumed.
• The availability of utilizable water resources, demand levels and consumption patternsneeds to be analyzed for different basins. Such an analysis would help in developing aWater Zoning Atlas to guide decisions related to the sitting of industries and othereconomic activities.
1.6 WASTEWATER MANAGEMENTRapid industrialization calls for wastewater treatment and its disposal to be so planned andsited so as to protect people, the quality of water (both surface and ground) and environmentfrom adverse impacts. The industrial units must set up effluent treatment plants for treatingthe wastewater to the desired standard before releasing to waterbodies. Effective checks andmonitoring should be placed in position and deterrent punitive measure be taken againstdefaulting units. These should be open for inspection by the State Pollution Control Board foraction. For small units located in various industrial estates common effluent treatment plantsbe set up and the industry should share the capital and O & M cost of the plants. Toxiceffluents, however, are not segregated in the industries and are often discharged mixed withother effluents. Generally, wastewater of industries such as sugar, distilleries, dairies, tanneriesetc. can be treated by biological methods such as stabilization ponds, activated sludge process,trickling filtration, aerated lagoons etc. Other industrial wastes such as pulp and paper syntheticfibre etc. have to undergo simple physico-chemical methods of treatment, but the industriesdischarging toxic wastes such as electro-plating, metallurgical, caustic chlorine etc. may requiremore elaborate techniques.
1.7 RECYCLING AND REUSE OF WATERAs the demand in industries is going to increase, the technological development in processingand methods of reusing water are expected to reduce the demand of fresh water. Recycling isdefined as the internal use of wastewater by the original user prior to discharge to a treatmentsystem or other point of disposal. Wastewater is recovered, treated or untreated and thenrecycled for repetitive use by the same user. The term reuse applies to wastewaters that aredischarged and then withdrawn by a user other than the discharger. Reclaimed waters fromwastewater after treatment are generally used for “agricultural” irrigation, cooling water, algalcultivation and pisciculture, apart from other industrial uses. India though predominantlyrural has still a large urban population. The urban centers are also the nuclei of industrialgrowth. The wastes (effluents), if reused within the industry with/without treatment aspermissible would help in minimizing fresh water requirements while achieving reduction inwastewater volume for final treatment before discharge, deriving economy at both ends.
In most cases industrial water uses are non-consumptive making reuse possible throughrecycling and conservation measures. Recycling of wastewater also helps in recovery of certaincommercially viable by-products. Process industries are major users of water and can recycleor reuse water wastes for lesser duty purpose. Cascade concept is adopted for reusing water
9 Energy Management Introduction 9
discarded from a process requiring higher purity to a process requiring lower purity. If required,a simple treatment process may be interposed between the processes. Water reuse is moreeconomical if included at the design stage by modification of the existing system. In most of theinland towns, in arid and semiarid areas, where suitable lands are generally available in thenearby areas for development of irrigation, treated effluent can economically be used forindustrial effluents are used for irrigation. The water recovered from effluents is mainly usedfor less important uses like gardening and cleaning. It is necessary to improve the productiontechnology, and low or no waste technology needs to be adopted. Though, such technologiesmay be costly at the initial stage, it would prove economical in the long run. The municipalwastewater and industrial effluent are being treated up to tertiary level and used for variouspurposes other than drinking by various industries and cities. For example, in Chennai theChennai Metro Board is providing 30 mld treated municipal wastewater to Ennore ThermalPower Plant for recycle and reuse for cooling and other purposes. Likewise in Bombay, manyof the industrial houses are using the recycled industrial effluent for purposes such asairconditioning, cooling etc. In Pondicherry Ashram, the wastewater from housing complexesand community’s toilets are recycled and reused for horticulture purposes and irrigation. StateGovernments may create Urban Development Fund for Urban Infrastructure developmentand the same can also be used for setting up of pilot projects for waste reuse, recycling andresource recovery.
1.8 NEED FOR TECHNOLOGY DEVELOPMENTWater requirement for Industries varies tremendously as industrial growth is also associatedwith technological changes. Also with number of Thermal and Nuclear Plants coming up,water use efficiency for cooling will have to go up to cater to the increased demand. The drycooling tower technique is one of the water saving method suggested for this purpose. Alsothe cost of industrial water recycling varies from site to site. Recycling depends on comparisonof cost of water treatment prior to disposal with that of treatment of wastewater for reusewithin the plants. The recycling cost may work out less in future as cost of wastewater treatmentis going up. It is suggested that our research efforts need to be oriented towards evolvingappropriate technology to ensure efficient use of cooling and process water, development ofpollution control mechanism, development of appropriate cost effective technologies fortreatment of waste water for reuse and development of cost effective technologies for recyclingof water.
Use of biotechnology is suggested for treatment of polluted water, when pollutants arebiodegradable. Domestic sewage, which contains mostly the biodegradable pollutants, has beentreated by microorganisms since the old times. Difficulty lies due to many modern vulnerableindustrial wastes, which are generally not degradable by conventional methods. New researchesin the field of biotechnology are opening the possibility of treatment of such types of industrialwastes in cost-effective manner. At the global level, use of biotechnology has already becomepopular. In India, biotechnology is now on the fast track and we should increase out share inglobal market, particularly for wastewater management. With the availability of water becomingscarce, technological upgradation is necessary in field of agronomy so as to maximize productivity

10 Energy ManagementWater Management10
per unit of water and land. Following measure may also be considered for adoption throughintensified efforts of academicians and field technologists.
Deficit Irrigation is the scheduling method applied under a restricted water supply, whenirrigation does not fully meet the evapo-transpiration requirements of the crop and wherecertain stress conditions are allowed. The specific objective is to optimize yields and incomesby allowing water to the most sensitive crop stages and for valuable crops. Strategies for deficitirrigation may include allocation of less water to the most drought tolerant crops, irrigationduring critical growth stages of crops, planting crops so as to stagger the critical demand periodsand planting for an average or wetter than average weather year. In drought prone areas,deficit irrigation, rather than full irrigation, can be planned as a norm, in order to distributethe benefit of drought proofing over a larger area.
Agriculture is at threshold of commercialization. There is need to shift focus from routinefood grains production systems to newer cropping system to meet the ever-increasing demandof pulses, oilseeds, fodder, fibre, fuel, spices, vegetables, medicinal and other commercial cropsand make agriculture an attractive and profitable business. This has become more importanttoday in the light of national policy of economic liberalization and export orientation ofagriculture. Crop diversification methods like crop rotation, mixed cropping and double croppinghave been found successful in many situations. Major advantages of these types of diversificationincludes reduced erosion, improved soil fertility, increased yield, reduction in need for nitrogenfertilizer in the case of legumes, and reduced risk of crop failure. Diversity of crop varieties canenhance the stability of yield and result in water saving. Thus, generic diversity and locationspecific varieties are essential for achieving sustainable production.
Raw wastewater has been in use for crops and fish production in several countries includingIndia without the approval of the competent authorities. Providing financial assistance andtechnical guidance in improving existing practices, not only to minimize health risks but alsoto increase productivity is preferable to outright prohibition. Generally, the upgrading of existingschemes may take precedence over the development of new projects. Treatment of wastewaterin stabilization ponds in an effective and low-cost method of pathogen removal, and is, therefore,suitable for schemes for wastewater reuse, particularly for irrigation of crops. Similarly, duckweedponds are quite effective in treating municipal wastewater and at the same time the harvestedduckweed is a good fish and chicken feed. As such, there is a need to develop appropriate andcost-effective technologies, for treatment and reuse of municipal wastewater, suitable to UrbanLocal Bodies for their adoption. Possible health risks to agricultural workers should, however,be assessed thoroughly and monitored regularly. The treated wastewater should conform tothe pollution control standards where such reuse practice is adopted.
1.9 WATER CONSERVATIONIn arid and semi-arid areas, the low and erratic rainfall normally occurs with high intensity ofshort duration resulting in high run-off and poor soil moisture storage. As a result, the loss isabout 50 to 60 per cent of rainwater. Runoff varies from 10 to 30 per cent of the rainfalldepending on the amount and intensity of rain, soil characteristics and vegetation cover. This

11Energy Management Introduction 11
surface runoff if harvested over a large area can yield considerable amount of water for storageand providing life saving irrigation to the crop during the dry spells in the monsoon season andalso for growing a second crop in rabi season. The major constraints that still limit the adoptionof this technology on a macro scale are, the high initial cost, and non-availability of cheap anddefective sealants for permeable Alfisols. Additionally, long breaks in the monsoon and lowintensity rains limit the runoff flow into the ponds during dry spells when water is neededmost. Despite these difficulties, small water storage ponds seem to be the most viable strategyto stabilize productivity of the ecologically disadvantaged dry land regions. The surface runofffrom an area can also be increased by reducing the infiltration capacity of the soil throughvegetation management, cleaning, sloping surface vegetation and reducing soil permeability byapplication of chemicals. To maximize profitability from the limited quantity of water stored insmall ponds, planning for its judicious use is most crucial. Research conducted at differentlocations in India established that a supplemental irrigation of 5 – 10 cm at the critical stage ofcrop growth substantially increases the yields of cotton, wheat, sorghum, tobacco, pearl, millet,etc vis-à-vis no irrigation.
Therefore one has to conserve the surface runoff by different techniques, for use in fair weather.
These techniques are:
(a) Conservation by surface storage — Storage of water by construction of various waterresources projects has been one of the oldest measures of water conservation. Thescope of storage depends on region to region depending on water availability andtopographic condition. The environmental impact of such storage also needs to beexamined for developing environment friendly strategies.
(b) Conservation of rainwater — Rainwater has been conserved and used for agriculture inseveral parts of our country since ancient time. The infrequent rain if harvested over alarge area can yield considerable amount of water. The example of such harvestingtechniques involves water and moisture control at a very simple level. It often consists ofrows of rocks placed along the contour of steps. Contour terraces have been found inuse in various parts of the world. Runoff captured by these barriers also allows forretention of soil, thereby serving as erosion control measures on gentle slopes. Thistechnique is especially suitable for areas having rainfall of considerable intensity, spreadover large part i.e., in Himalayan area, North – East states, and Andaman and NicobarIsland. In areas where rainfall is scanty and for a short duration, it is worth attemptingthis technique, which will induce surface runoff, which can be stored.
(c) Groundwater conservation — As highlighted earlier, out of total 400 mhamprecipitation occurs in India, about 45 mham percolates as a groundwater flow. It maynot be possible to tap the entire groundwater resources. The entire groundwater cannotbe harvested. As we have limited groundwater available, it is very important that weuse it economically and judiciously and conserve it to maximum possible. Some of thetechniques of groundwater management and conservation are as below:(i) Artificial recharge — In water scarce areas, where there is a low and erratic rainfall,
there is an increased dependence on groundwater. There are various techniques

12 Energy ManagementWater Management12
to develop and manage groundwater artificially. In one of the methods, water isspread over ground to increase area and length of time for water to remain incontact with soil, to allow maximum possible quantity of water to enter into theground. Digging recharge wells, which admit water from the surface to fresh wateraquifer, can also do the artificial recharging.
(ii) Percolation Tank Method¾Percolation tanks are constructed across thewatercourse for artificial recharge. The studies conducted indicates that on anaverage, area of influence of percolation of 1.2 km2, the average groundwater risewas of the order of 2.5 m and the annual artificial recharge to groundwater fromeach tanks was 1.5 hectare meter.
(iii) Catchment area protection (CAP) — Catchment area protection plans are usuallycalled Watershed Protection or Management Plans, these are adopted as animportant measure to conserve and protect the quality and quantity of water in awatershed. It helps in with holding runoff water albeit temporarily by a checkbund constructed across the streams on hilly terrain, which will delay the runoffso that greater time is available for water to seep underground. Such methods arein use in North East states, in hilly areas of tribal belts. This technique also helpsin soil conservation. Afforestation in the catchment area is also adopted for waterand soil conservation.
1.10 NEED OF ENSURING QUALITY & COST-EFFECTIVENESS OF WATER HARVESTINGIt is strongly suggested that detailed studies may be undertaken to compare the unit cost andquality indices for different alternates of groundwater recharge like large and mega dams,small and run of river diversion schemes, small tanks, bhandaras, check dams, watersheddevelopment, catchments area treatment, roof top harvesting, field water harvesting, contourterracing, bunding etc. The quantitative aspects, limitations, suitability and the quantum needof various alternates for groundwater recharging should also be studied and compared indifferent Indian regions to meet competing demands particularly the bulging concentrateddemands in mega urban cities. The benefits like hydropower, irrigation, tourism, recreation,flood moderation, drought proofing, pisciculture, horticulture, employment generation, checkon voluntary migration for want of employment particularly from dry/unirrigated areas toirrigated agricultural areas should also be accounted for while considering the technicalfeasibility, economic viability, cost effectiveness and environmental sustainability for variousalternates.
The need, procedure and budget for maintenance and repairs of above alternates shouldalso be considered before finalizing the proposed act/policy/guidelines for compulsory/accelerated rooftop harvesting in various municipal area.
1.11 DEVELOPMENT OF INTERNATIONAL RIVER BASINSWith increasing demand for water for various uses conflicts arise between nations sharing thesame river basin. The importance of shared water resources has not been realized so far. As aresult, the conflicts are going to intensify in future. National boundaries divide the catchments/

13Energy Management Introduction 13
drainage basins. The problems arise when the competing demands exceed the limited waterresources available in the dry months.
On a global basis, there are 214 river basins that are shared by two or more countries.
Country River Basins
Africa 57
Asia 40
Europe 48
North & Central Africa 33
South Africa 36
214
There are 44 countries where at least 80 percentage of total area falls within an InternationalRiver Basins of which 7 are in Asia. In the South Asian sub-continent, there are three asshown below:
Countries Total Area Area within an Percentagekm2 Int. Basin Country within
km2 the Int. Basin
Bangladesh 142,780 123,300 86
Bhutan 47,000 47,000 100
Nepal 140,800 140,800 100
During the past decades, conflicts have emerged over the development and management ofthe shared water of International Rivers in many parts of the World. The conflict betweenBangladesh and India on the Ganges is one of them.
With increasing population and need for further economic development, the pressure onscarce water resources will be more in the future. There is, therefore, an urgent need to identifythe existing and emerging conflicts in the basins and discuss, and resolve the issues in a spiritof cooperation for overall development and management of the river basins.
The Ganges, the Brahmaputra and the Meghna River Basin
Three internal rivers, the Ganges, the Brahmaputra and the Meghna pass through multiplecountries. These rivers system drain an area of 1.75 sq. km in China. Nepal, India, Bhutan andBangladesh of which only 7 per cent lies in Bangladesh, 63 per cent in India, 8 per cent inNepal and 2.58 per cent in Bhutan and the rest in Tibet. The region has a population of 535million of which 405 million in India, 120 million in Bangladesh, 18.5 million in Nepal and 1.5million in Bhutan. The region is very large and the climatic conditions differ widely from placeto place. The area is also prone to natural disasters like flood, drought, cyclone and earthquake.
The region is one of the poorest in the World but rich in natural resources like water andland. Cooperation among the nations is a prerequisite for development. Regional concept is

14 Energy ManagementWater Management14
essential for developing together for self-reliance and ecologically sustainable development fora better future.
With increasing population and demand for food and growing concern for environmentaldegradation demand for water will increase resulting in conflicts among nations sharinginternational river basins.
The Ganges: The Ganges covers an area of about 1,087,300 sq. km. spread over India (860,000sq. km.), Nepal (147,480 sq. km.), China (33,520 sq. km.) and Bangladesh (46,300 sq. km.).The length of the main river is about 2550 km. Three major tributaries of the Ganges, theKarnali, the Gandaki and the Kosi rise in China and flow through Nepal to join the Ganges inIndia, contributing 71 per cent of the dry season flows and about 41 per cent of the annualflows. The Ganges forms the common boundary between India and Bangladesh for about104 km. The river then flows southeastward inside Bangladesh for about 157 km. and joinsthe Brahmaputra at Goalundo. The recorded maximum and minimum flows in the Ganges atHardinge Bridge were 76,000 cumec and 263 cumec.
The Brahmaputra: The Brahmaputra has a total catchments area of 552,000 sq. km. spreadover China (270,900 sq. km.), Butan (47,000 sq. km.), India (195,000 sq. km.) and Bangladesh(39,100 sq. km.). The Brahmaputra originates in the Himalayan range and collects snowmeltand runoff form the catchments lying in China. Bhutan, India and Bangladesh. The river afterentering Bangladesh flows southward and continues to its confluence with the Ganges nearAricha. The total length of the Brahmaputra is about 2900 km. up to Aricha. The recordedmaximum flow in the Brahmaputra at Bahadurabad was 98,300 cumec while the minimumwas 2,860 cumec.
The Meghna: The Barak, headstream of the Meghna rises in the hills of Manipur in India.Near the Indo-Bangladesh border, the Barak bifurcates into two rivers: the Surma and theKushiyara which again join together at Ajmirigonj in Bangladesh. The combined flow takesthe name of Meghna and flows in a southwesterly direction to meet the Padma at Chandpur.Below Chandpur the combined flow is known as the lower Meghna. The total length of theriver is about 902 km. of which 403 km. is in Bangladesh. The total catchments area of Meghnais 82,000 sq. km. out of which 47,000 sq. km. and lie in India and Bangladesh respectively. Therecorded maximum discharge of the Meghna at Bhairab Bazar was 19,800 cumec.

22222 HYDROLOGICAL CYCLEHYDROLOGICAL CYCLEHYDROLOGICAL CYCLEHYDROLOGICAL CYCLEHYDROLOGICAL CYCLE
2.1 INTRODUCTION
Water is the most widespread substance to be found in the natural environment. Water existsin three states: liquid, solid, and invisible vapour. It forms the oceans, seas, lakes, rivers andthe underground waters found in the top layers of the Earth’s crust and soil cover. In a solidstate, it exists as ice and snow cover in polar and alpine regions. A certain amount of water iscontained in the air as water vapour, water droplets and ice crystals, as well as in the biosphere.Huge amounts of water are bound up in the composition of the different minerals of theEarth’s crust and core.
To assess the total water storage on the Earth reliably is a complicated problem becausewater is so very dynamic. It is constantly changing from liquid to solid or gaseous phase,and back again. It is usual to estimate the quantity of water found in the so-calledhydrosphere. This is all the free water existing in liquid, solid or gaseous state in theatmosphere, on the Earth’s surface and in the crust down to a depth of 2000 meters.Current estimates are that the Earth’s hydrosphere contains a huge amount of water —about 1386 million cubic kilometers. However, 97.5% of these amounts are saline watersand only 2.5% is fresh water. The greater portion of this fresh water (68.7%) is in theform of ice and permanent snow cover in the Antarctic, the Arctic, and in the mountainousregions. Next, 29.9% exists as fresh ground waters. Only 0.26% of the total amount offresh waters on the Earth is concentrated in lakes, reservoirs and river systems wherethey are most easily accessible for our economic needs and absolutely vital for waterecosystems.
These are the values for natural, static, water storage in the hydrosphere. It is theamount of water contained simultaneously, on average, over a long period of time — inwaterbodies, aquifers, and the atmosphere. For shorter time intervals such as a single year,a couple of seasons, or a few months, the volume of water stored in the hydrosphere willvary as water exchanges take place between the oceans, land and the atmosphere. Thisexchange is usually called the turnover of water on the Earth, or the global hydrologicalcycle, as shown in Fig. 2.1.

16 Energy ManagementWater Management16
Fig. 2.1 Global hydrological cycle.
Solar heat evaporates water into the air from the Earth’s surface. Land, lakes, rivers andoceans send up a steady stream of water vapour; this spreads over the surface of the planetbefore falling down again as precipitation. Precipitation falling on land is the main source of theformation of the waters found on land: rivers, lakes, groundwater, and glaciers. A portion ofatmospheric precipitation evaporates; some of it penetrates and charges groundwater, while therest — as river flow — returns to the oceans where it evaporates: this process repeats again andagain. A considerable portion of river flow does not reach the ocean, having evaporated in theendotherm regions, and those areas with no natural surface runoff channels. On the other hand,some groundwater bypasses river systems altogether and goes directly to the ocean or evaporates.Quantitative indices of these different components of the hydrological cycle are shown in Figure2.2. Every year the turnover of water on Earth involves 577,000 km3 of water. This is water thatevaporates from the oceanic surface (502,800 km3) and from land (74,200 km3). The same amountof water falls as atmospheric precipitation, 458,000 km3 on the ocean and 119,000 km3 on land.The difference between precipitation and evaporation from the land surface (119,000 – 74,200= 44,800 km3/year) represents the total runoff of the Earth’s rivers (42,700 km3/year) anddirect groundwater runoff to the ocean (2100 km3/year). These are the principal sources offresh water to support life necessities and man’s economic activities.
Fig. 2.2 The hydrological cycle.
TO TA L GLO BA L (W a ter) 2.5% OF TO TAL G LO BA L (Freshwater)
0.3% Freshwater Lakes andR iver S torage. On ly this
potion is renewab le
0.9% Oth er Includ ingsoil moisture, swampwate r and perm afrost
97.5%Sa lineW ate r
29.9% Fre shG round w ate r
68.9% G laciers & Pe rm anen tS n ow C ove r
Cloud s
Co n d en sa tion
P recip itat io n
(R a in F a ll, D riz zle , Sn ow, H ail S le e t)
S un R ad ia tio n
Ru n O ff E vap o ra tio n
Transp ira tio n
R ive r S ea
Va po riza tion
P erco lat ion G rou nd W ate r F lo w Sprin g
S no w
In fil tra tion

17Energy Management Hydrological Cycle 17
Oceans cover most of the Earth’s surface. On average, the depth of the world’s oceans isabout 3.9 kilometers. However, maximum depths can be greater than 11 kilometers. Thedistribution of land and ocean surfaces on the Earth is not homogeneous. In the SouthernHemisphere there is 4 times more ocean than land. Ratio between land and ocean is almostequal in the Northern Hemisphere. Geographers recognize three major ocean basins: Pacific;Atlantic; and Indian.
The water found in the ocean basins is primarily a byproduct of the lithospheric solidificationof rock that occurred early in the Earth’s history. A second source of water is volcanic eruptions.The dissolved constituents found in the ocean come from the transport of terrestrial salts inweathered sediments by leaching and stream runoff. Seawater is a mixture of water and varioussalts. Chlorine, sodium, magnesium, calcium, potassium, and sulfur account for 99% of thesalts in seawater. The presence of salt in seawater allows ice to float on top of it. Seawater alsocontains small quantities of dissolved gases including: carbon dioxide, oxygen, and nitrogen.These gases enter the ocean from the atmosphere and from a variety of organic processes.Seawater changes its density with variations in temperature, salinity, and ocean depth. Seawateris least dense when it is frozen at the ocean surface and contains no salts. Highest seawaterdensities occur at the ocean floor.
The hydrologic cycle is used to model the storage and movement of water between thebiosphere, atmosphere, lithosphere and hydrosphere. Water is stored in the followingreservoirs: atmosphere, oceans, lakes, rivers, glaciers, soils, snowfields, and groundwater. Itmoves from one reservoir to another by processes like: evaporation, condensation,precipitation, deposition, runoff, infiltration, sublimation, transpiration, and groundwaterflow.
River water is of great importance in the global hydrological cycle and for the supply ofwater to humankind. This is because the behaviour of individual components in the turnoverof water on the Earth depends both on the size of the storage and the dynamics of watermovement. The different forms of water in the hydrosphere are fully replenished during thehydrological cycle but at very different rates. For instance, the period for complete recharge ofoceanic waters takes about 2500 years, for permafrost and ice some 10,000 years and for deepgroundwater and mountainous glaciers some 1500 years. Water storage in lakes is fullyreplenished over about 17 years and in rivers about 16 days.
Based on water exchange characteristics, two concepts are often used in hydrology andwater management to assess the water resources in a region: the static storage component andthe renewable waters. The static storage conventionally includes freshwater with a period ofcomplete renewal taking place over many years or decades such as large lakes, groundwater, orglaciers. Intensive use of this component unavoidably results in depleting the storage and hasunfavorable consequences. It also disturbs the natural equilibrium established over centuries,whose restoration would require tens or hundreds of years.
Renewable water resources include waters replenished yearly in the process of the waterturnover of the Earth. These are mainly runoff from rivers, estimated as the volume per unit

18 Energy ManagementWater Management18
of time (m3/s, km3/year, etc.) and formed either within a specific region or from external sources,including groundwater inflow to a river network. This kind of water resource also includesthe yearly renewable upper aquifer groundwater not drained by the river systems. However,on the global scale, these volumes are not large compared with the volume of river runoff andare of importance only for individual specific regions.
Table 2.1 Periods of water resources renewal on the earth
Water of Hydrosphere Period of Rrenewal
World Ocean 2500 years
Groundwater 1400 years
Polar ice 9700 years
Mountain glaciers 1600 years
Ground ice of the permafrost zone 10,000 years
Lakes 17 years
Bogs 5 years
Soil moisture 1 year
Channel network 16 days
Atmospheric moisture 8 days
Biological water Several hours
In the process of turnover, river runoff is not only recharged quantitatively, its quality isalso restored. If only man could suddenly stop contaminating rivers, then with time watercould return to its natural purity. Thus, river runoff, representing renewable water resources,is the most important component of the hydrological cycle. It exerts a pronounced effect onthe ecology of the earth’s surface and on human economic development. It is river runoff thatis most widely distributed over the land surface and provides the major volume of waterconsumption in the world.
2.2 ATMOSPHERIC WATERAtmospheric water exists as water vapour, droplets and crystals in clouds. The actual volumeof water in the atmosphere is very small and varies with changes in temperature, pressureand geographical location. Water vapour can move long distances in the atmosphere in arelatively short period of time because of the high velocity winds in the upper atmosphere.The average water molecule is in the atmosphere for 12 days before it precipitates. Theatmospheric movement of water vapor from sea to land and land to sea seems to beunbalanced. Twenty percent of water vapour from the oceans moves inland but only 12percent moves out to sea. However, this exchange is balanced by runoff water that flowsfrom the land to the sea.

19Energy Management Hydrological Cycle 19
2.3 PRECIPITATIONWater evaporated from oceanic surfaces (86%) combines with water evaporated from the land(14%) to produce clouds. Seventy-eight percent of all rain falls on the oceans. The remaining22% falls on land. Hence, the land receives a net moisture donation from the oceans.Precipitation can be defined as any aqueous deposit, in liquid or solid form, that develops in asaturated atmospheric environment and generally falls from clouds. A number of differentprecipitation types have been classified by meteorologists including rain, freezing rain, snow,ice pellets, snow pellets, and hail. Fog represents the saturation of air near the ground surface.Classification of fog types is accomplished by the identification of the mechanism that causedthe air to become saturated. The distribution of precipitation on the Earth’s surface is generallycontrolled by the absence or presence of mechanisms that lift air masses to cause saturation. Itis also controlled by the amount of water vapor held in the air, which is a function of airtemperature. A figure is presented that illustrates global precipitation patterns.
Precipitation is often intercepted by vegetation before it reaches the surface of the ground.However, precipitation, which reaches the ground, follows two basic pathways: surface flow andinfiltration. Some water soaks into the subsurface through infiltration, this water moves throughthe pores of the soil until the soil reaches saturation. Infiltration lessens with soil saturation leadingto surface flow. Once infiltrated, water continues to filter through soil or rock through verticalmovement called percolation. Percolation results in the movement of water from the soil layer tothe groundwater. This is usually seasonal, occurring only when the soil is saturated and whenroots and evaporation are not resulting in a net movement of soil water towards the surface.
In certain locations on the Earth, acid pollutants from the atmosphere are being depositedin dry and wet forms to the Earth’s surface. Scientists generally call this process acid deposition.If the deposit is wet, it can also be called acid precipitation. Normally, rain is slightly acidic.Acid precipitation, however, can have a pH as low as 2.3.
The distribution of precipitation falling on the ground surface can be modified by thepresence of vegetation. Vegetation in general, changes this distribution because of the fact thatit intercepts some of the falling rain. How much is intercepted is a function of the branchingstructure and leaf density of the vegetation. Some of the water that is intercepted never makesit to the ground surface. Instead, it evaporates from the vegetation surface directly back to theatmosphere. A portion of the intercepted water can travel from the leaves to the branches andthen flow down to the ground via the plant’s stem. This phenomenon is called stem flow.Another portion of the precipitation may flow along the edge of the plant canopy to causecanopy drip. Both of the processes described above can increase the concentration of thewater added to the soil at the base of the stem and around the edge of the plant’s canopy. Rainthat falls through the vegetation, without being intercepted, is called through fall.
2.4 SURFACE WATERDespite the ecological significance of surface water, it comprises only a very small proportionof the world’s water. Surface flow can occur in four ways: as overland flow, as through flow,as groundwater flow and as stream flow in rivers and streams. Overland flow occurs onlywhen the soil layer is saturated and storage basins (lakes, wetlands, rivers) are full. It occurs at

20 Energy ManagementWater Management20
the end of storm events and during ice melt in spring. It is relatively rare in natural environments(e.g. forested), but is more common in urban and even rural areas. Through flow is the movementof water laterally through the soil and it occurs most commonly on slopes.
Groundwater flows beneath the surface beyond the soil-moisture root zone. Excess surfacewater moves through soil and rock until it reaches the water table. The water table is theupper limit of groundwater and is the contact point between saturated and aerated rocks andsoils. Groundwater flows from areas with a higher water table to areas where the water tableis lower. There is often a distinction between shallow groundwater flowing through glacialsands and gravels and deep groundwater flowing through underlying bedrock. An aquifer is apermeable layer of rock, which can both store and transmit large amounts of groundwater.
Eight per cent of water travels from the land to oceans via surface flow. Ninety-five percentof this surface flow returns to the ocean as overland flow and stream flow. Only 5% returns tothe ocean by means of slow-moving groundwater. These percentages indicate that the smallamounts of water in rivers and streams are very dynamic, whereas the large quantities of sub-surface groundwater are sluggish.
Runoff is the surface flow of water to areas of lower elevation. On the micro scale, runoffcan be seen as a series of related events. At the global scale runoff flows from the landmassesto the oceans. The Earth’s continents experience runoff because of the imbalance betweenprecipitation and evaporation.
2.5 INFILTRATIONInfiltration is the movement of water from precipitation into the soil layer. Infiltration variesboth spatially and temporally due to a number of environmental factors. After a rain, infiltrationcan create a condition where the soil is completely full of water. This condition is, however,only short-lived as a portion of this water quickly drains (gravitational water) via the forceexerted on the water by gravity. The portion that remains is called the field capacity. In thesoil, field capacity represents a film of water coating all individual soil particles to a thicknessof 0.06 mm. The soil water from 0.0002 to 0.06 mm (known as capillary water) can be removedfrom the soil through the processes of evaporation and transpiration. Both of these processesoperate at the surface. Capillary action moves water from one area in the soil to replace lossesin another area (biggest losses tend to be at the surface because of plant consumption andevaporation). This movement of water by capillary action generally creates a homogeneousconcentration of water throughout the soil profile. Losses of water stop when the film ofwater around soil particles reaches 0.0002 mm. Water held from the surface of the soil particlesto 0.0002 mm is essentially immobile and can only be completely removed with hightemperatures (greater than 100 degrees Celsius). Within the soil system, several different forcesinfluence the storage of water.
2.6 GROUNDWATERGroundwater is all the water that has penetrated the earth’s surface and is found in one of twosoil layers. The one nearest the surface is the “zone of aeration”, where gaps between soils are

21Energy Management Hydrological Cycle 21
filled with both air and water. Below this layer is the “zone of saturation”, where the gaps arefilled withwater (Fig. 2.3). The water table is the boundary between these two layers. As theamount of groundwater increases or decreases, the water table rises or falls accordingly. Whenthe entire area below the ground is saturated, flooding occurs because all subsequentprecipitation is forced to remain on the surface.
Through flow is the horizontal subsurface movement of water on continents. Rates ofthrough flow vary with soil type, slope gradient, and the concentration of water in the soil.Groundwater is the zone in the ground that is permanently saturated with water. The top ofgroundwater is known as the water table. Groundwater also flows because of gravity to surfacebasins of water (oceans) located at lower elevations.
Fig. 2.3 Groundwater zones.
The amount of water that can be held in the soil is called “porosity”. The rate at whichwater flows through the soil is its “permeability”. Different surfaces hold different amounts ofwater and absorb water at different rates. Surface permeability is extremely important forhydrologists to monitor because as a surface becomes less permeable, an increasing amount ofwater remains on the surface, creating a greater potential for flooding. Flooding is very commonduring winter and early spring because the frozen ground has no permeability, causing mostrainwater and melt water to become runoff.
Fig. 2.4 Groundwater flow.
Water that infiltrates the soil flows downward until it encounters impermeable rock (shownin grey), and then travels laterally (Fig. 2.4). The locations where water moves laterally arecalled aquifers. Groundwater returns to the surface through these aquifers (arrows), whichempty into lakes, rivers, and the oceans. Under special circumstances, groundwater can even
Surface Layer
Zone of Aeration
W ater Table
Zone of Saturation
River W ater Table
Lake
Ocean
Im permeable Rock

22 Energy ManagementWater Management22
flow upward in artesian wells. The flow of groundwater is much slower than runoff, withspeeds usually measured in centimeters per day, meters per year, or even centimeters per year.
Comparison of Advantages of Surface versus Subsurface Water Reservoirs:
The comparison of advantages between surface and subsurface storage are givenin the following Table (USDI 1985).
Table (USDI 1985)
Subsurface Reservoirs Surface Reservoirs
Many large capacity sites are available Few sites available
Slight to no evaporation loss High evaporation loss even in humid climate
Require little land area Require large land area
Slight to no danger of catastrophic Ever present danger of catastrophic failurestructural failure
Uniform water temperature Fluctuating water temperature
High biological purity Easily contaminated
Reservoir serves as conveyance system Water must be conveyed
Water must be pumped Water may be available by gravity flow
Water may be mineralized Water generally of relatively low mineral content
Difficult and costly to investigate, Relatively easy to investigate, evaluate andevaluate and manage manage
Recharge opportunity usually dependent Dependent on annual precipitationon surplus surface flows
Recharge water may require No treatment requiredexpensive treatment
Continuous expensive treatment of Little treatment requiredrecharge areas or wells
Minor flood control value Maximum flood control value
2.7 EVAPO-TRANSPIRATIONEvaporation and transpiration are the two processes that move water from the Earth’s surfaceto its atmosphere. Evaporation is movement of free water to the atmosphere as a gas. It requireslarge amounts of energy. Transpiration is the movement of water through a plant to theatmosphere. Scientists use the term evapo-transpiration to describe both processes. In general,the following four factors control the amount of water entering the atmosphere via these twoprocesses: energy availability; the humidity gradient away from the evaporating surface; thewind speed immediately above the surface; and water availability. Agricultural scientists
23Energy Management Hydrological Cycle 23
sometimes refer to two types of evapo-transpiration: Actual Evapo-transpiration and PotentialEvapo-transpiration. The growth of crops is a function of water supply. If crops experiencedrought, yields are reduced, irrigation can supply crops with supplemental water. By determiningboth actual evapo-transpiration and potential evapo-transpiration a farmer can calculate theirrigation water needs of their crops.
The distribution of precipitation falling on the ground surface can be modified by thepresence of vegetation. Vegetation in general, changes this distribution because of the fact thatit intercepts some the falling rain. How much is intercepted is a function of the branchingstructure and leaf density of the vegetation. Some of the water that is intercepted never makesit to the ground surface. Instead, it evaporates from the vegetation surface directly back to theatmosphere. A portion of the intercepted water can travel from the leaves to the branches andthen flow down to the ground via the plant’s stem. This phenomenon is called stem flow.Another portion of the precipitation may flow along the edge of the plant canopy to causecanopy drip. Both of the processes described above can increase the concentration of thewater added to the soil at the base of the stem and around the edge of the plant’s canopy. Rainthat falls through the vegetation, without being intercepted, is called through fall.
2.8 RECHARGERecharge is the process that allows water to replenish an aquifer. This process occurs naturallywhen rainfall filters down through the soil or rock into an aquifer. Artificial recharge is achievedthrough the pumping (called injection) of water into wells or by spreading water over thesurface where it can seep into the ground. The land area where recharge occurs is called therecharge area or recharge zone.
When the withdrawal of groundwater in an aquifer exceeds the recharge rate over a periodof time, the aquifer is over withdrawal. There are two possible effects from the over withdrawalof water from an aquifer.
First, when the amount of fresh water being pumped out of an aquifer in a coastal areacannot be replaced as fast as it is being withdrawn, salt water migrates towards the point ofwithdrawal. This movement of salt water into zones previously occupied by fresh water iscalled salt-water intrusion. Salt-water intrusion can also occur in inland areas where brinywater underlies fresh water.
Secondly, in some areas over withdrawal can make the ground sink because groundwaterpressure helps to support the weight of the land. This is called subsidence. Sinkholes are anexample of this effect.

This pageintentionally left
blank

33333 GROUNDWATERGROUNDWATERGROUNDWATERGROUNDWATERGROUNDWATEROCCURRENCEOCCURRENCEOCCURRENCEOCCURRENCEOCCURRENCE
3.1 INTRODUCTIONAll that water occurs below the surface of the earth is termed as sub-surface water,undergroundwater or simply groundwater. The role of groundwater in sustaining the race ofthe man on this planet has of late acquired such an importance that presently all big and smallcountries are giving top priorities to short and long-term schemes, envisaging exploration andexploitation of groundwater reserves in their perspective regions. Groundwater is one portionof the earth’s water. Various forms of water always move in natural circulation system, knownas the hydrologic cycle.
Seawater because of sun’s heat evaporates to the atmosphere, and by the wind it’s blownto the above of land. In a high elevation place, these vapors will be compacted and when itssaturation point is exceeded, it falls again to the earth as rainwater. Most part of rainwaterflows at surface as surface water, such as rivers, lakes, or swamps. A small portion of rainwaterinfiltrates into soil and percolates to reach saturated zone and joins groundwater. Part of water,which infiltrates near surface, will evaporate again through plants (evapotranspiration). Directevaporation lasts on opened water body, whilst surface run-off will eventually gather back tothe sea, and hydrological process as mentioned above, will last over and over again.
Hydrogeology may be defined as the science of the occurrence, distribution and movementof water below the surface of the earth, with emphasis on geology.
3.2 GROUNDWATER OCCURRENCEGroundwater is part of water below surface (sub-surface water), in zone of saturation (Figs.3.1 and 3.2). Vertical distribution of sub-surface water may be divided into zone of aerationand saturated zone. Zone of aeration comprises of interstices, which are partly occupied withwater, and air, while all interstices in saturated zone is filled only with water. Water fills inzone of aeration is called as vadose water. Vadose water, which occurs near surface and availablefor roots of vegetation, is defined as solumn water. It is also called zone of non-saturation andstarts from the surface extending to different depths. In this zone, the open spaces betweenthe soil particles and rock spaces never get completely filled with water. Groundwater in thiszone is under a perpetual downward movement mainly under the influence of gravity. Waterin this zone is under no hydrostatic head. Within this zone, a thin belt of soil — water is

26 Energy ManagementWater Management26
sometimes also distinguished which comprises uppermost thickness of the ground in whichsome water is held-up while percolating downwards by the root zone of vegetable cover andsome chemicals. This water is then easily lost to the atmosphere through transpiration.
Fig. 3.1 Distribution of subsurface water. Fig. 3.2 Water in saturation zone.
The Capillary water is the water occupies capillary zone and is observed at the boundarybetween the zone of saturation and zone of aeration. Capillary fringe is characteristic of fine-grained sediments in which the water may rise much above the main water level of the zone ofsaturation. Groundwater occurs in saturated zone filled in all rock interstices or fissures(Fig. 3.2). In many cases a significant rise and fall in the level of this zone is observed as acharacteristic feature during different part of the year. Since in this zone all the openings arecompletely filled with water, there is no or very little downward movement. The predominantmovement is a type of flow and is controlled by the head of the water.
A third zone of intermittent saturation is then easily recognized which marks the depthsbetween the zone of aeration and zone of saturation.
3.3 SOURCE OF GROUNDWATERAlmost all groundwater can be thought of as a part of the hydrologic cycle and is derived fromone of the following sources:
Meteoric Water: (or the water derived from precipitation). Although great part of the rainwater reaches the sea through surface flows or run-off, a considerable part of water falling onthe surface in the form of precipitation infiltrates or percolates downwards, below the surfaceand forms the groundwater. Most of the water obtained from underground supplies belong tothis category. The infiltration of rain water and melted water starts immediately after thewater reaches the ground, and may also take place from surface water bodies such as rivers,lakes and sea, in an almost continuous process.
Connate Water: Water that has been out of contact with the atmosphere for at least anappreciable part of a geological period is termed as connate water. It consists of fossil interstitialwater that has migrated from its original burial location. This water may have been derivedfrom oceanic or fresh water sources and, may be, is highly mineralized. Many importantsedimentary rocks, like limestone, sandstone are deposited and consolidated under water.
Groundwater in saturated zone
zone
of
aera
tion
zone
of
satu
ratio
n
Vad
ose
wat
er
im pe rm eab le rock
g round su rfac e
W ater table
soil w ater zone
C apillaryzone
In te rm ediatevadose
zone
Groundwater orphreatic w ater

27Energy Management Groundwater Occurrence 27
Although compaction might squeeze out most of the water initially present in the pores betweengrains, yet some water might still be retained in the inter-granular spaces of such rocks. It ishowever, of not much importance in yielding supplies for human consumption.
Juvenile Water: It is also called magmatic water. This water is derived from magma; where theseparation is deep, the term plutonic water is applied, while volcanic water is derived fromrelatively shallow depth (3 km to 5 km). New water of magmatic or cosmic origin that has notpreviously been a part of the hydrosphere is referred to as juvenile water.
3.4 FACTORS CONTROLLING GROUNDWATERRainfall: The amount of rainfall in any area plays an important role in determining thegroundwater. It is estimated that about 5 cm rainfall in one hour facilitates more run-off andresults in less filtration. Contrarily, a rainfall of about 5 cm in 24 hours creates fewer run-offsand more filtration. However, much depends on other factors such as topography, vegetation,evapotranspiration and water bearing properties of rocks and soils and their nature.
Topography: this effects run-off and filtration. Steep slope of ground activates more run-offwater and less filtration. In another situation, a gentle slope region facilitates more or lessequal run-off and filtration. In horizontal ground, the run-off will be minimal and consequentlyfiltration increases, adding more filtrated water to the subsurface water.
Vegetation cover: Vegetation intercepts much of the rainfall and has an effect on the rechargeof groundwater. If vegetation is very less or absent, this results in more run-offs and lessfiltration. However, when thick vegetation cover is covered with grassland, filtration is morein the grassland than in the thick cover forest. Thick cover vegetation also intercepts much ofthe rainfall and reduces the recharge.
Evapotranspiration: Evaporation is caused by the action of solar radiation and wind, whichevaporates water molecules from such surface bodies as rivers, lakes, reservoirs etc. This processmay also be affected to a depth of 1 to 2 meters below the soil zone. All plants transpire waterthrough their green leaves and take less water from the shallow water bearing formations. Therate of transpiration depends on the atmospheric temperature and velocity of wind. Thecombined process of evaporation and transpiration is commonly referred to asEvapotranspiration.
Water bearing properties of rocks and soils: Water bearing properties such as porosity,permeability, fissures, jointing, types of rocks etc play an important role in groundwaterformation. Highly porous and permeable rock or soil facilitates more recharge. Water bearingproperties play an important role in the circulation of groundwater.
3.5 WATER BEARING PROPERTIES OF SOILS AND ROCKSPorosity: Porosity, a water bearing property, is the percentage ratio of volume and voids to the
total volume of rock or soil. It can be expressed as: n=
×100, where n is porosity, Vv is
volume of voids and V is total volume.

28 Energy ManagementWater Management28
During natural formation of rock pores, voids and interstices develop. Such originallydeveloped porosity is known as original porosity or primary porosity. Sedimentation andcrystallization of igneous rocks and the flocculation process in clay are responsible for theformation of primary porosity. Secondary porosity is developed due to weathering and fracturingof rocks, metamorphism, chemical reaction, biological processes such as animal and insectburrowing, penetration of root system into the soil or rock layers etc. Grain size, shape,roundness and angularity influence porosity. Uniform grain size provides considerable porespace whereas poorly sorted grains restrict void space. This results in more porosity in well-sorted grains less in poorly sorted grains. Cemented grains with mineral matter provide verylittle pore space and consequently reduce porosity. Fractured and jointed blocks provide largespaces for storage of groundwater. Open solution cavities also provide pore space.
However, porosity depends on the arrangement, shape and size of the grains. The averageporosities for some common soils and rocks are listed in Table 3.1.
Table 3.1 Average porosities of some common rocks and soils
Rock / Soil Average Porosity (%)
Soils 50 – 60
Clay 45 – 55
Silt 40 – 50
Mixture of sand 35 – 40
Uniform sand 30 – 40
Gravel 30 – 35
Cavernous limestone 25 – 35
Sandstone 10 – 20
Vesicular basalt 5 – 10
Shale 1 – 10
Limestone 1 – 10
Crystalline massive granite, Gabbros, Gneisses, etc 1 – 3
In other words, porosity is the capacity of the substance to store subsurface water. Storageof groundwater depends on the porosity of the rocks or soils. All the water stored in thesubsurface layers cannot be recovered from wells. Large amounts of water are always retainedin the rock due to the peculiar capillary action forming a film around thee particles. Thevolume of water available for draining out from the rocks is known as specific yield.
The volume of water retained in the rocks and not available for draining out is termed Specificretention. Hence, the effective porosity = specific yield + specific retention. These parameters ofrocks or soils are determined with pumping and recovery tests from wells in the area.

29Energy Management Groundwater Occurrence 29
Permeability and Transmissibility: Permeability is defined as the capacity to transmit waterand other fluids through a unit section in a unit time under a hydraulic gradient. It is alsocalled the hydraulic conductivity. In other words, it is the velocity of percolation. For practicalwork in groundwater hydrology, where water is the prevailing fluid, hydraulic conductivity= k is employed. The rate of hydraulic conductivity depends on the degree and nature ofarrangement of grains from coarse to fine. For example, well-sorted materials of larger grainsize have a high hydraulic conductivity and permit the flow of large quantities of water orother fluids.
A medium has a unit hydraulic conductivity if it transmits in unit time a unit volume ofgroundwater at the prevailing kinematic viscosity through a cross-section of unit area measuredat right angles of direction of flow under a unit hydraulic gradient (dh/dl).
k = –v/(dh/dl)=(m/day)/(m/m)= m/day.
Where v = velocity of specific discharge (the negative sign indicates that the flow of wateris in the direction of decreasing head).
Hydraulic conductivity of geologic materials depends on a variety of physical factorsincluding porosity, particle size and distribution, shape of particles, arrangement of particles,and other factors. A rock formation has hydraulic conductivity k and saturated thickness b,then it has transmissibility coefficient, T = K × b = (m/day) × (m)= m2/day
Transmissibility may be defined as the rate at which water of prevailing kinematic viscosityis transmitted through a unit width of aquifer under a unit hydraulic gradient.
The higher value of T is meant that lithology of rock is an aquifer with high potentialgroundwater.
The representative values of physical parameters associated with various types of aquifermaterials are shown in Table 3.2.
Table 3.2 Representative values of physical parameters associated withvarious types of aquifer materials.
Porosity Specific Hydraulic
Material (%) Yield (%) Conductivity
(m/day)
Coarse Gravel 28r 23 150r
Medium Gravel 32r 24 270r
Fine Gravel 34r 25 450r
Coarse Sand 39 27 45r
Medium Sand 39 28 12r
Fine Sand 43 23 2.5r
Contd.

30 Energy ManagementWater Management30
Porosity Specific Hydraulic
Material (%) Yield (%) Conductivity
(m/day)
Silt 46 8 0.08h
Clay 42 3 0.0002h
Fine-grained sandstone 33 21 0.2v
Medium-grained sandstone 37 27 3.1v
Limestone 30 14 0.94v
Dolomite 26 0.001v
Dune sand 45 38 20
Loess 49 18 0.08v
Peat 92 44 5.7v
Schist 38 26 0.2v
Shale 6
Slate 0.00008v
Till (predominantly silt) 34 6
Till (predominantly sand) 31 16 0.49r
Till (predominantly gravel) 16 30r
Tuff 41 21 0.2v
Basalt 17 0.01v
Weathered gabbro 43 0.2v
Weathered granite 45 1.4v
v - indicates vertical measurement of hydraulic conductivity,
h - indicates vertical measurement of hydraulic conductivity,
r - indicates measurement on a repacked sample
Water bearing properties such as porosity, specific retention and hydraulic conductivityplay important roles in the movement of subsurface water. Depending on their water bearingproperties, rock materials are classified as aquifers or water bearing and yielding formations.
3.6 TYPES OF AQUIFERSAquifer is a formation that contains sufficient saturated permeable material to yield significantquantities of water to wells or springs. This implies an ability to store and transmit water.Unconsolidated sands and gravels are a typical example. Synonyms frequently employed include:water bearing formation and groundwater reservoir.
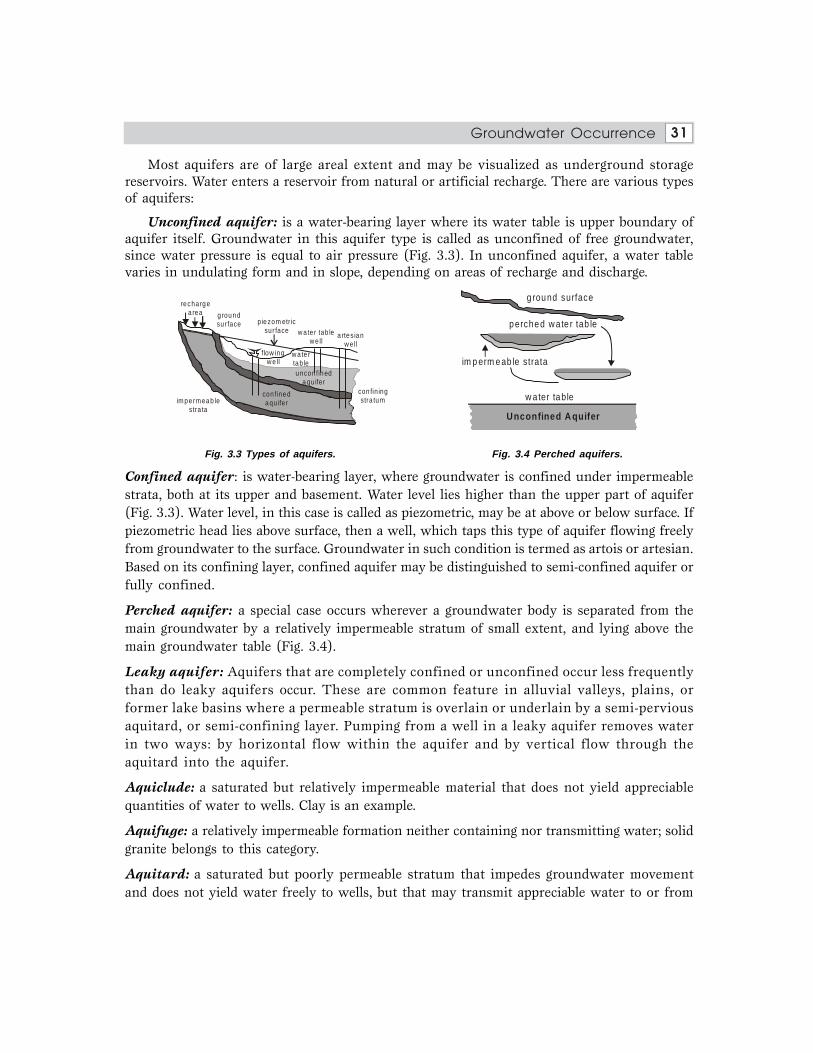
31Energy Management Groundwater Occurrence 31
Most aquifers are of large areal extent and may be visualized as underground storagereservoirs. Water enters a reservoir from natural or artificial recharge. There are various typesof aquifers:
Unconfined aquifer: is a water-bearing layer where its water table is upper boundary ofaquifer itself. Groundwater in this aquifer type is called as unconfined of free groundwater,since water pressure is equal to air pressure (Fig. 3.3). In unconfined aquifer, a water tablevaries in undulating form and in slope, depending on areas of recharge and discharge.
Fig. 3.3 Types of aquifers. Fig. 3.4 Perched aquifers.
Confined aquifer: is water-bearing layer, where groundwater is confined under impermeablestrata, both at its upper and basement. Water level lies higher than the upper part of aquifer(Fig. 3.3). Water level, in this case is called as piezometric, may be at above or below surface. Ifpiezometric head lies above surface, then a well, which taps this type of aquifer flowing freelyfrom groundwater to the surface. Groundwater in such condition is termed as artois or artesian.Based on its confining layer, confined aquifer may be distinguished to semi-confined aquifer orfully confined.
Perched aquifer: a special case occurs wherever a groundwater body is separated from themain groundwater by a relatively impermeable stratum of small extent, and lying above themain groundwater table (Fig. 3.4).
Leaky aquifer: Aquifers that are completely confined or unconfined occur less frequentlythan do leaky aquifers occur. These are common feature in alluvial valleys, plains, orformer lake basins where a permeable stratum is overlain or underlain by a semi-perviousaquitard, or semi-confining layer. Pumping from a well in a leaky aquifer removes waterin two ways: by horizontal flow within the aquifer and by vertical flow through theaquitard into the aquifer.
Aquiclude: a saturated but relatively impermeable material that does not yield appreciablequantities of water to wells. Clay is an example.
Aquifuge: a relatively impermeable formation neither containing nor transmitting water; solidgranite belongs to this category.
Aquitard: a saturated but poorly permeable stratum that impedes groundwater movementand does not yield water freely to wells, but that may transmit appreciable water to or from
g round surface
perched w ate r tab le
im p erm eab le strata
w a ter table
uncon fined aqu iferUnconfined A quifer
g roundsur face p iezom etr ic
sur face
recha rgea rea
w a te rtab le
w a te r tab lew e ll
a rtes ianw e ll
flow ingw e ll
con finedaqu iferim pe rm eab le
stra ta
con fin ingstra tum
unconfinedaqu ifer

32 Energy ManagementWater Management32
adjacent aquifers and, where sufficiently thick, may constitute an important groundwaterstorage zone; sandy clay is an example.
3.7 AQUIFER’S LITHOLOGYMany types of formations serve as aquifers. A key requirement is their ability to store water inthe rock/alluvium pores. Porosity may be derived from inter-granular spaces or from fractures.The role of various geological formations as aquifers is briefly described below.
Alluvial deposits: The deposits, which are derived as a result of erosion process from olderrocks. These deposits comprise of unconsolidated materials, such as sand and gravel (Figs. 3.5and 3.6). Groundwater occupied rock interstices, and distributed over flat or plain areas.Probably 90 percent of all developed aquifers consist of unconsolidated rocks. The aquifersare recharged chiefly in areas accessible to downward percolation of water from precipitationand from seasonal streams.
Fig. 3.5 Pores between grains. Fig. 3.6 Colluvium - boulders and cobblesA very unusual stack of very large rounded mixed with sand and mud in a
boulders left by Pleistocene glaciers. debris flow deposit. Very porous sedimentThe lack of sediment or cement that can transmit a lot of groundwater,
between grains allows groundwater but the mud and sand fill the poresto pass through the pores more easily. and make the rate of water flow, slow.
Young volcanic deposits: are deposits of volcanic product, consist of unconsolidated andconsolidated materials. Groundwater fills in either interstices of unconsolidated materials orfissures of consolidated rocks. These deposits are distributed adjacent to volcano areas.
Limestone: is originally marine deposit with carbonate contents, which due to geologic processis being uplifted to the surface. Here, groundwater occurred in fissures, cavities and solutionchannels (Figs. 3.7, 3.8 and 3.9). This rock crops out in areas where formerly, there was sea.Owing to geologic, physical and chemical processes, in several areas it formed a particularmorphology, known as karst. Limestone varies widely in density, porosity, and permeability,depending on degree of consolidation and development of permeable zones after deposition.Openings in limestone may range from microscopic original pores to large solution cavernsforming subterranean channels sufficiently large to carry the entire flow of a stream.

33Energy Management Groundwater Occurrence 33
Sandstone: sandstone and conglomerate are cemented forms of sand and gravel. Thesesedimentary rocks show great variation in their water yielding capacity, which is chieflycontrolled by their texture and nature of cementing materials. Coarse-grained sandstone withimperfect cement may prove as excellent aquifers (fig. 3.10).
zone of fracture
fault
Fig. 3.7 Groundwater occurrence in Fig. 3.8 Spring discharging groundwaterlimestone aquifer. directly into stream, a common occurrence
in limestone terrain.
Fig. 3.9 Solution by acidic water flowing Fig. 3.10 Cement between grains decreasesalong cracks and bedding planes enhances the permeability of sedimentary rocks,
the permeability of limestone beds. compared to non-cemented sediments.
Igneous rocks: igneous rocks are either intrusive or extrusive in nature. The intrusive igneousrocks are dense in texture with all the component minerals very closely knitted so that verylittle interstices are left. These would be barren of groundwater under normal conditions, butsometimes fissures and cracks capable of holding some reserves traverse them. The extrusiverocks exhibit great variation in their water bearing properties. The composition of rocks andtheir mode of formation from lava as well as the nature of the original topography are factors,which generally define the water bearing capacity of these rocks (Figs. 3.11 and 3.12).
Metamorphic rocks: metamorphic rocks behave as poor sources and sites for wells unlessjoints and other cracks traverse these on a large scale. Metamorphic rocks like schist; shale andgneisses, which are often foliated and highly fractured, may prove exceptionally good aquifers.

34 Energy ManagementWater Management34
But marble and quartzite are normally almost impermeable except along original bedding if thesame is not completely destroyed during metamorphism.
Fig. 3.11 Columnar joints (vertical) and lava Fig. 3.12 Cracks, both horizontal and vertical,tubes form in many basalt flows and make are common in massive igneous and metamorphicthese geologic formations very permeable. rocks. Areas with many of these fractures
can pass a great deal of groundwater.
3.8 GROUNDWATER FLOWFactors which influence the movement of water below surface are, energy difference in levelof groundwater itself, permeability of aquifer and, viscosity of groundwater.
Groundwater needs energy to move through interstices. The source of movement is apotential energy. The potential energy of groundwater is reflected by phreatic/piezometrichead at given place. Groundwater flowing from higher potential energy points towards lowerpotential energy points; there are no groundwater flows between points, which have samepotential energy. Imaginary line connecting points, which have same potential energy, is knownas groundwater contour line or isohypse line. There is no groundwater flows along the contourline since groundwater flows is perpendicular to contour line (Fig. 3.13).
Fig. 3.13 Groundwater flow net. Fig. 3.14 A thermal spring system.
Groundwater flow generally moves from recharge to discharge area and might appear tothe surface due to various factors.
dm
dl
dq
h
h-dh
flow line
equ ipotentia lline
dq
dq dq
decend ing cool surface w a te r
H E ATperm eab lezone
hot sp ring
cooling magma cham ber
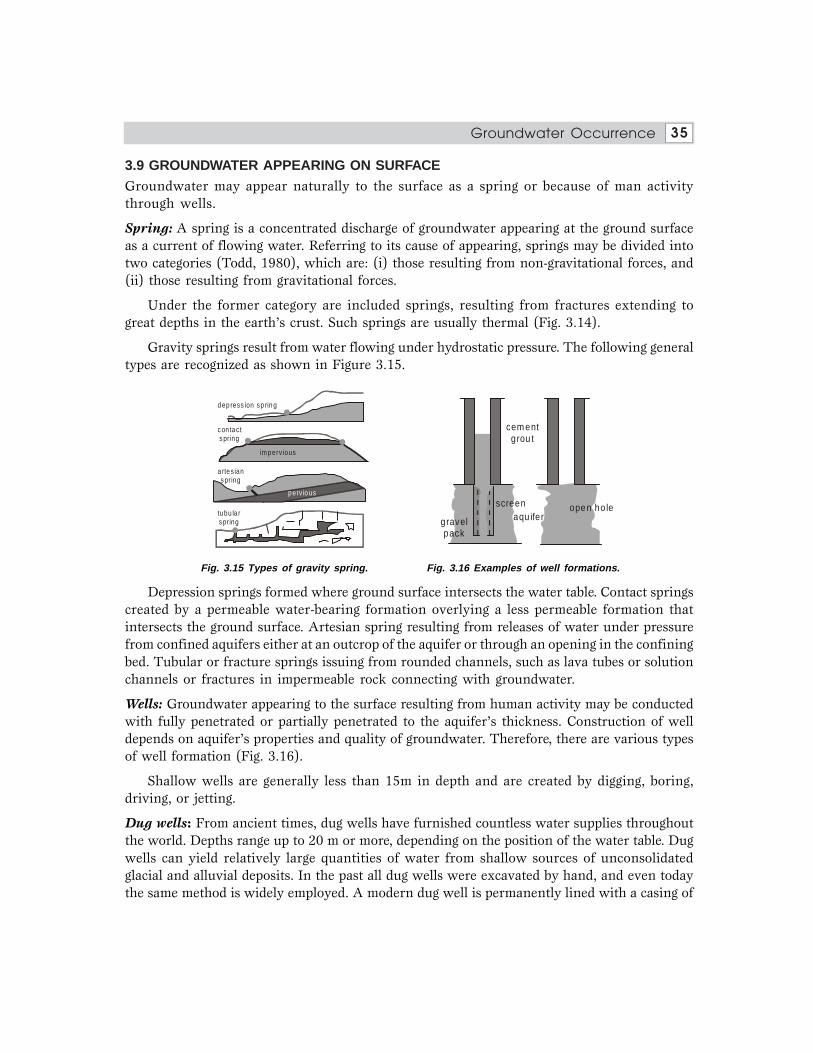
35Energy Management Groundwater Occurrence 35
3.9 GROUNDWATER APPEARING ON SURFACEGroundwater may appear naturally to the surface as a spring or because of man activitythrough wells.
Spring: A spring is a concentrated discharge of groundwater appearing at the ground surfaceas a current of flowing water. Referring to its cause of appearing, springs may be divided intotwo categories (Todd, 1980), which are: (i) those resulting from non-gravitational forces, and(ii) those resulting from gravitational forces.
Under the former category are included springs, resulting from fractures extending togreat depths in the earth’s crust. Such springs are usually thermal (Fig. 3.14).
Gravity springs result from water flowing under hydrostatic pressure. The following generaltypes are recognized as shown in Figure 3.15.
Fig. 3.15 Types of gravity spring. Fig. 3.16 Examples of well formations.
Depression springs formed where ground surface intersects the water table. Contact springscreated by a permeable water-bearing formation overlying a less permeable formation thatintersects the ground surface. Artesian spring resulting from releases of water under pressurefrom confined aquifers either at an outcrop of the aquifer or through an opening in the confiningbed. Tubular or fracture springs issuing from rounded channels, such as lava tubes or solutionchannels or fractures in impermeable rock connecting with groundwater.
Wells: Groundwater appearing to the surface resulting from human activity may be conductedwith fully penetrated or partially penetrated to the aquifer’s thickness. Construction of welldepends on aquifer’s properties and quality of groundwater. Therefore, there are various typesof well formation (Fig. 3.16).
Shallow wells are generally less than 15m in depth and are created by digging, boring,driving, or jetting.
Dug wells: From ancient times, dug wells have furnished countless water supplies throughoutthe world. Depths range up to 20 m or more, depending on the position of the water table. Dugwells can yield relatively large quantities of water from shallow sources of unconsolidatedglacial and alluvial deposits. In the past all dug wells were excavated by hand, and even todaythe same method is widely employed. A modern dug well is permanently lined with a casing of
dep ress ion sp ring
con tacts pr ing
im pervious
a rtes ians pr ing
perv ious
tubu la rs pr ing
cem entgrou t
open holeaqu ifer
gravelpack
screen

36 Energy ManagementWater Management36
wood staves, bricks, rock, concrete or metal. A properly constructed dug well penetrating apermeable aquifer can yield 2500 to 7500 m3/day, although most domestic dug wells yield lessthan 500 m3/day.
Bored wells: Where a water table exists at a shallow depth in an unconsolidated aquifer, boredwells can furnish small quantities of water at minimum cost. Bored wells are constructed withhand operated or power driven earth augers. Hand bored wells seldom exceed 20 cm in diameterand 15 m in depth. Power driven augers will bore holes up to 1m in diameter and, underfavourable conditions, to depths exceeding 30 m.
Driven wells: A driven well consists of a series of connected lengths of pipe driven by repeatedimpacts into the ground to below the water table. Water enters the well through a drive pointat the lower end of the well. This consists of a screened cylindrical section protected duringdriving by a steel cone at the bottom. Diameters of driven wells are small, most falling in therange of 10-15cms. Most depths of the wells are less than 15 m although a few exceed 20 m. Assuction type pumps extract water from driven wells, the water table must be near the groundsurface if a continuous water supply is to be obtained. Yields from driven wells are small, withdischarges of about 100 – 250 m3/day.
Jetted wells: Jetted wells are constructed by the cutting action of a downward direction streamof water. Small diameter holes of 3 to 10 cm are formed in this manner to depths greater than15 m. Jetted wells have only small yields and are best adapted to unconsolidated formations.
Horizontal wells: Subsurface conditions often preclude groundwater development by normalvertical wells. Such conditions may involve aquifers that are thin, poorly permeable, or underlainby saline water. In other circumstances, where groundwater is to be derived primarily frominfiltration of stream flow, a horizontal well system may be advantageous. Infiltration galleriesand collector wells are under the category of horizontal well. An infiltration gallery is a horizontalconduit for intercepting and collecting groundwater by gravity flow. Galleries normallyconstructed at the water table elevation, discharge into a sump where a pump lifts the water toground surface for use. Collector wells are normally constructed to draw water for cities andindustries located near rivers. Groundwater pumped from collector wells tapping permeablealluvial aquifers has often proved to be a successful solution. If located adjacent to a surfacewater source, a collector well lowers the water table and thereby induces infiltration of surfacewater through the bed of the water body to the well. In this manner, greater supplies of watercan be obtained than would be available from groundwater alone. The large area of exposedperforations in a collector well causes low inflow velocities, which minimize incrustation,clogging, and sand transport. Polluted river water is filtered by its passage through theunconsolidated aquifer to the well. Yields vary with local conditions; the average yield for alarge number of such wells approximate 27,000 m3/day. Collector wells can also function inpermeable aquifers removed from surfacewater. Several such installations gave an averageyield of about 15,000 m3/day.
In order to know about the discharge of well, pumping test should be conducted. Its principlesare to pump out groundwater from a well with a certain constant discharge and observe

37Energy Management Groundwater Occurrence 37
drawdown of groundwater level during pumping (Fig. 3.17). From the result of observationspecific capacity of well are known — a volume of water which is resulted, in a unit volume ifwater level in well is declining in a unit length (for example liter/second per meter drawdown).Apart from that, pumping test may calculate aquifer’s parameters such as hydraulic conductivityvalue. Groundwater drawdown in a single well is different with drawdown of multiple wells.Drawdown in multiple wells will influence between each other, depends on wells’ distance(Fig. 3.18).
Fig. 3.17 Effect of pumping test. Fig. 3.18 Drawdown effect on multiple wells pumping.
In an area where many wells tap the groundwater from the same aquifer, pumping willform a cone of depression. If it happens in a coastal area, seawater encroachment may occur —brackish or saline water flows to the land. Meanwhile, if this condition lasted in a confinedaquifer with clay layer as its confining bed, a land subsidence potentially occurs.
3.10 GROUNDWATER EXPLORATIONGroundwater is one of the earth’s most widely distributed replenishable resources. Groundwatercaters to the requirements of the agricultural, domestic and industrial sectors. The totalgroundwater on the earth is 35 times greater than the surface water. Subsurface water isavailable in appreciable quantities over surface water, but sometimes we are not able to tap thisgroundwater resource. The reason is non-uniform distribution of groundwater resources. Themovement and availability of water is mainly controlled by aquifer parameters. The compositionand lithological variation of the earth differ in subsurface layers depending on various factors.
The main objective of groundwater exploration is to locate aquifers capable of yieldingwater in sufficient quantity of suitable quality for domestic, industrial and agricultural purpose.To estimate various parameters of groundwater resources for long term, following scheme ofinvestigations are normally undertaken:
Remote sensing studies: Satellite-based data provide quick and useful baseline information onthe factors controlling the occurrence and movement of groundwater. A systematic study andinterpretation of satellite imageries lead to better delineation of perspective groundwater zonesin a region. Such perspective zones identified from the satellite imageries are followed uponthe ground through detailed hydrogeological and geophysical investigations before actual drillingis carried out for exact assessment about potential site. The usefulness of satellites data in
d ischarge
o rig ina l p lez om e tric
= draw dow n draw dow nc urve
Q
confined aqu ifer
S
Q 1 Q 2 Q 3
s fo r Q 1 s fo r Q 2 s fo r Q 3
confined aquifer
com pos ite draw dow n (s )curve fo r a ll th reew e lls pum ping
o rig ina l plezom etric su rface

38 Energy ManagementWater Management38
identifying linear features, such as lineaments representing fractures, faults, shear zones, whichare usually the zones of localization of groundwater and certain geomorphic features such asalluvial fans, valley fills, palaeo-channels etc. often form good aquifers as well establishedperspective groundwater zones in a region.
Topographical survey: In this survey, surface map is prepared and grid lines are laid on theground and reduced levels are determined for each of the grid points.
Hydrogeological studies: In this survey, response of rainfall pattern is studied on water levelfluctuation and total quantity added annually by rainfall in the upper unconfined aquifer iscomputed. The Central Groundwater Board, Ministry of Water Resources has published ahydrogeological map of India. This map illustrates the overall hydrogeological parameters ofthe region. The occurrence and abundances of groundwater in a given terrain mainly dependson the water holding capacity of the lithological types and their associated structural features,which enable the rocks to allow the surface water to percolate and accumulate in the subsurfacehorizons. The distribution of groundwater directly depends on the nature of vertical andlateral extent of rock types, their interconnected structural elements and the weathered profilecapable of yielding percolation of surface and subsurface water. In hydrogeological investigationwell inventory plays a vital role. Well inventory studies provide information on groundwaterconditions of an area than do other hydrogeological aspects. A well inventory study includesthe dimensions of existing wells, soil type, lithology, structural features, water level fluctuations,depth of wells, length of water column, mode of extraction of water, quality of water etc. Ahydrogeological map of given area is to be prepared on the basis of such hydrogeological factorsas surface water bodies, their distribution and extent, available well inventory details andwater table contours. Aquifers are to be delineated with reference to the water table, lithologicalcontacts, extent and attitudes of structural features etc., recharge and discharge basins ofgroundwater. These studies are carried out in order to ascertain the success of water supplyproject dependent upon the aquifers traced by geological and geophysical investigations. Thestudy involves an evaluation of:
(i) Quantity of water that the aquifer in question receives from different sources in givenperiods.
(ii) The porosity, thickness and width of aquifer.(iii) The permeability parameters of the aquifer which are necessary for defining the rate
of flow of water through the ground, and the quantity of water lost from the aquifer toother formations through seepage, springs and by evaporation and transpiration.
(iv) The scope for recharge or replenishing the aquifers through natural and artificialmethods and economics involved in the same.
Geophysical survey: Geophysical investigations play an important role in hydrogeologicalstudies. These are most successful when used in combination with geological methods.Geophysical investigations are usually carried out after studying the geology and hydrogeologyof an area. They are employed to understand the nature of the subsurface, lithology, thicknessand depth of the water bearing horizons. Electrical, magnetic, induced polarization, seismicmagnetic and gravity methods are the most important geophysical methods used in exploration.

39Energy Management Groundwater Occurrence 39
These methods make use of the physical properties of electrical conductivity, magneticsusceptibility, elasticity and density. These physical properties differ depending on the rocktype, structure, and degree of water saturation, physical, chemical and mineralogical changes.Electrical methods are extensively used for the exploration of subsurface water.
Geoelectric monitors are deployed to evaluate electrical properties of the aquifer systemleading to determination of saturated thickness in subsurface. In this method, electrodes areinserted in the ground and connected in a circuit to a source of electrical energy. Under suchcircumstances, current flows from one electrode, passes through the ground and leaves throughthe other electrodes. The depth to which the current penetrates depends upon the distancebetween the two outer electrodes. Thus, it makes penetration to great depths possible byincreasing the spacing between the electrodes. The variations in the value of resistivity withdepth are plotted. The resistivity curves thus obtained are then interpreted for the presence ofwater. For accurate interpretation, however, detailed knowledge of stratification is verynecessary. The range of resistivity generally encountered in various soils and rocks is given inTable 3.3 hereunder:
Table 3.3 Resistivity range of various formations
Resistivity(Ohm-m)
Sand 500 – 1500
Clays, saturated silt 0 – 100
Clayey sand 200 – 500
Gravel 1500 – 4000
Weathered rock 1500 – 2500
Sound rock >5000
3.11 AQUIFER PERFORMANCE TESTThis test is carried out on existing tube wells or new tube wells along with nearby tube well inthe zone of influence and groundwater hydraulic parameters are determined for estimatinglong-term groundwater reserves.
Based on studies mentioned above, total replenishable resources are estimated and waterextraction levels are recommended equivalent to rate of recharge. These reserves are availablefor long term, unless consecutive draughts occur for 3 to 5 years. For such eventualities, staticwater reserves are estimated and worked out as to how many years, these reserves can sustainin absence of recharge. If static reserves for 3 to 5 years are available, area is suitable for longterm withdrawal of water (25 to 50 years); provided withdrawal is limited to rate of dynamicwater reserves added by various recharge components annually.
After above comprehensive studies, recommendations are made about yield potential,qualitative and quantitative aspects and extent of utilization of water.
Material

This pageintentionally left
blank

44444 WATER LOSSESWATER LOSSESWATER LOSSESWATER LOSSESWATER LOSSES
4.1 INTRODUCTIONLosses from precipitation in engineering are defined as the quantity which does not yield forirrigation, domestic, water supply and any other such uses. Thus, for a surface water resourceengineering the difference between precipitation and runoff in a stream is, a loss which can betaken as the sum of the losses of (i) evaporation, (ii) transpiration, (iii) interception, (iv)depression storage and (v) infiltration. These losses form a major portion of the hydrologicalcycle. Evaporation is a major loss followed by transpiration and infiltration. Infiltration, whichmight be a loss to a surface water hydrologist, is a major gain to those dealing with groundwater potential and utilization.
Precipitation – Surface runoff = Total loss (Evaporation + Transpiration +Interception + Depression Storage + Infiltration)
Before the rainfall reaches the outlet of a basin as runoff, certain demands of the catchmentsuch as interception, depression storage and infiltration have to be met. If the precipitation notavailable for such runoff is defined as losses.
4.2 EVAPORATIONMany areas of the world are arid or semiarid. The problem caused by the loss of water storedin lakes and reservoirs for irrigation and domestic use by evaporation during summer monthsis acute and perennial, and the loss is enormous. Table 4.1 shows the estimation of watersurface area available for water evaporation control by monolayer films. The evaporation lossof water is of the order of 1.32 × 10¹² gallons.
Table 4.1 Estimation of water surface area available for water evaporation
Area of arid, semiarid and long dry spell regions of India 2,00,000 sq. km
Estimated water area in these regions (1% of above) 20,000 sq. km
Estimated water area where film application may be feasible (10% of above) 2,000 sq. km
Evaporation loss of water over this per year (Estimated depth of 3 meters) 6×10⁹ m3
(1.32 × 10¹² gallons)

42 Energy ManagementWater Management42
Evaporation is the process in which a liquid changes to the gaseous state at the free surface,below the boiling point through the transfer of heat energy. Consider a body of water in pond.The molecules of water are in constant motion with a wide range of instantaneous velocities.An addition of heat causes this range and average speed to increase. When some moleculespossess sufficient kinetic energy, they may cross over the water surface. Similarly, the atmospherein the immediate neighbourhood of the water surface contains water molecules within thewater vapour in motion and some of them may penetrate the water surface. The net escape ofwater molecules from the liquid state to the gaseous state constitutes evaporation. Evaporationis a cooling process in that the latent heat of vaporization (at about 585 cal/g of evaporatedwater) must be provided by the water body. The equivalent molecular weight of air is 28.95and that of water vapour is 18, i.e., water vapour is 62% lighter than air. This helps watervapour to rise into the atmosphere to a height where it condenses. Importance of evaporationand its potential can be gauged from water budget of continents and oceans (Table 4.2).
Table 4.2 Evaporation from continents
Precipitation Evaporation % Loss by Evaporation Runoff
(mm/year) (mm/year) (mm/year) (mm/year)
Africa 690 430 62.3 260
Asia 600 310 51.7 290
Australia 470 420 89.4 50
Europe 640 390 60.9 250
North America 660 320 48.5 340
South America 1630 700 42.9 930
Land area 730 420 57.5 310
Table 4.3 Average values of losses for North and South India for various months of the year
Month Jan Feb Mar Apr May Jun Jul Aug Sep Oct Nov Dec
Losses for North India 70 90 130 160 270 240 180 140 140 130 90 80(mm)
Losses for South India 100 100 180 230 250 180 150 150 150 130 100 100(mm)
Average annual rainfall in India is about 1120mm, which is equal to 370 million hectare-mof water. Total runoff by all the rivers of the country is 170million hectare-m. If annual groundwater recharge is 37million hectare-m is also lost to atmosphere and transpiration. Part of the37million hectare-m is also lost to atmosphere as transpiration. The factors affecting evaporationare: (i) vapour pressures at the water surface and air above, (ii) air and water temperature,(iii) wind speed, (iv) atmospheric pressure, (v) quality of water and (vi) size of water body.
Continent

43Energy Management Water Losses 43
Factors Affecting Evaporation
Vapour pressure: The rate at which molecules leave the water depends on the vapour pressureof the liquid. Similarly, the rate at which molecules enter the water depends on the waterpressure of the air. The rate of evaporation, therefore, depends on the difference between thesaturation vapour pressure at the water temperature, ew and the actual vapour pressure in theair, ea. Thus EL = C (ew – ea). Where EL = rate of evaporation (mm/day) and C = a constant;ew and ea are in mm of mercury. This is known as Dalton’s law of evaporation. Evaporationcontinues till ew = ea. If ew > ea condensation takes place.
Temperature: The rate of emission of molecules from liquid water is a function of itstemperature. The higher the temperature, the greater the energy of the molecules and the rateof emission. Regarding air temperature, although there is a general increase in the evaporationrate with increasing temperature, a high correlation between evaporation rate and airtemperature does not exist. Thus for the same mean monthly temperature, it is possible tohave evaporation to different degrees in a lake in different months.
Wind: Since turbulence varies with speed, there must necessarily be a relation betweenevaporation and wind movement. Wind aids in removing the evaporated water vapour fromthe zone of evaporation and consequently creates greater scope for evaporation. However, ifthe wind velocity is large enough to remove all the evaporated water vapour, any furtherincrease in wind velocity does not influence the evaporation. Thus the rate of evaporationincreases with the wind speed up to a critical speed beyond which any further increase in thewind speed has no influence on the evaporation rate. This critical wind speed value is a functionof the size of the water surface. For large water bodies high-speed turbulent winds are neededto cause maximum rate of evaporation.
Atmospheric pressure: Other factors remaining same, a decrease in barometric pressure, asin high altitude, increases evaporation. Atmospheric pressure is so closely related to otherfactors affecting evaporation that it is practically impossible to study the effect of its variationsunder natural conditions. The number of air molecules per unit volume increases, with pressure.Consequently, with high pressure there is more chance that vapour molecules escaping fromthe water surface will collide with air molecules and rebound into the liquid. Hence, evaporationwould be expected to decrease with increasing pressure. The reduction in pressure with increasein elevation acts to increase evaporation at high elevations. This effect is offset by the generaldecrease in temperature with elevation and hence the relation between elevation and evaporationis not clearly defined. It has been shown also that evaporation at high altitude is greatlyinfluenced by the orientation of the slope.
Quality of water: The rate of evaporation is less for salt water than for fresh water anddecreases as specific gravity increases. The evaporation rate decreases about 1 percent foreach 1 percent increase in specific gravity until crusting takes place, usually at a specific gravityof about 1.30. Evaporation from seawater has been estimated to be about 2 to 3 percent, lessthan fresh water when other conditions are the same. Turbidity appears to have noticeableeffect on evaporation rate.

44 Energy ManagementWater Management44
Heat storage in waterbodies: Deep-water bodies have more heat storage than shallow ones.A deep lake may store radiation energy received in summer and release it in winter causingless evaporation in summer and more evaporation in winter compared to a shallow lake exposedto a similar situation. However, the effect of heat storage is essential to change the seasonalevaporation rates and the annual evaporation rate is seldom affected. Different evaporatingsurfaces like soil, barren land, forest area, houses and lakes affect evaporation to the extentthey have the potential. Black cotton soils help to evaporate the soil water faster than red soilbecause such soils have the potential to absorb incoming radiation more effectively. Evaporationfrom wet soil is faster and it reduces gradually as soil becomes drier.
Measuring Evaporation
It is rather impossible to measure evaporation directly in the field. Evaporation from watersurface is estimated by different methods and its values are correlated to field data. Whileestimating evaporation from open storages, it is necessary to know seepage that occurs fromthe bed of the reservoir. Not much information about the determination of loss of water fromstorages that can be attributed solely to seepage from the bed and slides is available. In India,attempts have been made to develop seepage meters. A seepage meter (Fig 4.1) developed bythe Irrigation Research Institute, Poondi, Chennai, was installed in the deeper section of BuderiTank and seepage loss through its bed measured. The device consist of two cylindrical pan,1.2294m diameter and 0.43m high with a hole of 38.10mm diameter in the center and shortmetal pipes of about 101.60mm in length welded to the holes to project outside from the bottom.The later pipes serve to connect the pans to each other with the help of a rubber hose. One ofthe pans is inverted and rammed into the bed such that at least 228.60mm of its sides penetrateinto the soil, the other pan with its open end facing upwards is supported on a frameworkabove first pan with its bottom at least 228.60mm below the water surface of the tank. The toppan is covered by a lid to prevent loss of water due to evaporation, and water is poured into itto the same level as that in the tank on the outside of it. When the water from the bottom panseeps through the bed of the tank, the water level in the top pan gets lowered correspondinglyand thus serves to indicate directly the loss of water due to seepage from the tank bed. It hasbeen reported that consistent values could not be obtained.
Fig. 4.1 Seepage meter (IRI, Poondi, Chennai).
Fram ew orksuppo rtingthe top pan
L id fo r the pan
Top pan 101.6m m ,0 .4572m m h igh
M etalc lam p
Tank bedB o ttom pan 101 .6m mand 0 .4572m m h igh
O pen and d riven a tleast 229m m in to theg round
R ubberhose
228m m
0.4572m mm etal p ipe

45Energy Management Water Losses 45
At the Irrigation Research Institute, Roorkee, attempts were made to improve the seepagemeter developed by Regional Salinity Laboratory, Soil Conservation Service Riverside,California, by replacing the plastic bag by a constant head vessel (Fig. 4.2) to measure seepagein channels. The seepage meter essentially consists of seepage cup, constant head vessel andswivel head joint. The seepage meter before use was standardized. The value obtained by aseepage meter is to be multiplied by a coefficient greater than one for less pervious soil and lessthan one for more pervious soils.
Fig. 4.2 Seepage meter (IRI, Roorkee).
The methods available to estimate evaporation losses from surfaces of large water bodiesare:
1. Evaporation pans2. Empirical equations3. Water balance method4. Energy budget method5. Mass transfer method
1. Evaporation Pans: Evaporation measurement using pans is the most reliable and thebest ofall the available methods. An evaporimeter as specified by IS: 5973 – 1970 for Indianconditions is a pan of 1.22m in diameter and 0.255m deep. It is a modified version of the USWeather Bureau class A pan since the latter is made of galvanized iron and is not painted whiteoutside. The Indian Standard pan is made up of 0.90mm thick copper sheet with hexagonalwire netting of galvanized iron mesh covering it to protect its water from birds. The details ofIS specified pan are given in Fig. 4.3. The pan is placed over a wooden platform of 10cm heightso that circulation of air is possible all around the pan. This also helps to thermally insulate the
G
TP
Q
S
G raduated tube
0 .05m
6 .4m m tube
V a lv e V 13m m p ipe
S w iv e l headP las tic tube 13m m
C onstant head vesse l (M a rio tte ’s tube )
32m m B
6 .4m m × 13m mstiffene r
B a ffle p la te
13m m6:1
S eepage cup
S tiffener 6 N o.
6 .4m m
C harn fe rredouting edge
T
15m m 0.3m
1.52
4m0.
31m
Ope
ratin
g he
ad
A irva lve 6 .4mm
381m m dia
162m m
H

46 Energy ManagementWater Management46
pan completely from ground. Water level in the pan is recorded by a point gauge arrangementplaced inside a stilling basin. Normally, an evaporation pan is placed along with other weathermeasuring instruments for recording humidity, temperature, rainfall, wind speed and otherparameters. Measurement is taken at least once a day by adding water to the pan by a calibratedcylindrical glass jar to bring the water level to the previous position. This gives directly theevaporation depth over the time lapse. If there is rainfall exceeding the depth of evaporation,then water is taken out of the pan in the same way by the measuring jar and knowing thedepth of rainfall from the rain gauge the evaporation depth is found out by subtraction.
Fig. 4.3 IS specified evaporation measuring pan.
US Weather Bureau Class A Land Pan – It is standard pan of 1210mm diameter and 255mmdepth. The depth of water is maintained between 18cm and 20cm (Fig. 4.4). The pan is normallymade of unpainted galvanized iron sheet. The pan is placed on a wooden platform of 15cmheight above the ground to allow free circulation of air below the pan. Measuring the depth ofwater with a hook gauge in a stilling well makes evaporation measurements.
Colorado Sunken Pan – This pan, 920mm square and 460mm deep is made up of unpaintedgalvanized iron sheet and buried into the ground within 100mm of the top (Fig. 4.5). Thechief advantage of the sunken pan is that radiation and aerodynamic characteristics are similarto those of a lake.
The rm om ete r
C lam parrangem en t
S til ling w e ll
W ire m esh c over
0 .9 m m copper sheet
P o in t gaugeW oodenbase
1220 m m
25 m m255 m
100 m m
Fig. 4.4 US Weather Bureau Class A Land Pan. Fig. 4.5 Colorado Sunken Pan.
W ater leve l in pan
G L
1210 D ia
255
150
W oodensupport (SQ )
50
W ater levelsam e as G L
G L50
920 Sq
460


48 Energy ManagementWater Management48
#2. Calculate the daily lake evaporation from the following data from a class – A pan.Assume pan coefficient as 0.80.
Date 10/8/03 11/8/03 12/8/03 13/8/03 14/8/03
Rainfall (mm) 10 0 19 4 10
Water added (mm) +6 +15 –6 +12 +10
Solution: Daily pan evaporation is the sum of the rainfall and the water added or taken outfrom the pan. Calculation is carried out daily in the following table.
Day Water Added / Taken Rainfall Pan Evaporation Lake EvaporationOut (mm) (mm) (mm) (mm)
10/8/03 +6 10 16 12.80
11/8/03 +15 0 15 12.00
12/8/03 –6 19 13 10.40
13/8/03 +12 4 16 12.80
14/8/03 +10 10 15 12.00
2. Empirical Equations: A large number of empirical equations are available to estimate lakeevaporation using commonly available meteorological data. Most formulae are based on theDalton-type equation and can be expressed in the general form E = K. f(u) (es – ea). Where Eis lake evaporation in mm/day, es is saturated vapour pressure at the water – surface temperaturein mm of mercury, ea is actual vapour pressure of overlying air at a specified height in mm ofmercury, f(u) is wind speed correction function and K is coefficient. The term ea is measuredat the same height at which wind speed is measured. Other commonly used empirical evaporationformulae are as shown in Table 4.5.
Table 4.5 Lake evaporation calculation by empirical equations
Name of Equation Evaporation Rate (mm/day) Terms Used
Meyer’s formula E 1U16
.C.(e – e )s a= +LNM
OQP
U is monthly mean wind speed in km/h
USA, small at 9m aboound. C = 0.36 for largelake, 1915 deep lakes and 0.50 for shallow lakes.
Rhower’s formula E = 0.77 (1.465 – 0.000732 P) × P is the mean barometric reading in mmUSA, 1931 (0.44 + 0.0733 U) (es – ea) Hg and U the mean wind velocity at
0.6m above ground in km/h.
Penman’s formula E = 8.9 (1 + 0.15U) (es – e
a) U is measured at 2m above ground level.
England, Small lake
USBR formula E = 0.833 (4.57 t + 43.3) E is mm/month, t mean annualtemperature in oC.
Contd...

49Energy Management Water Losses 49
Name of Equation Evaporation Rate (mm/day) Terms Used
Lake Mead E = 0.046 × t × w × [1–0.03 t is number of days of evaporation, ta
formula (ta – t
s)] (e
s – e
a) average air temperature in o C+1.9 oC, t
s
(mm/day) is the average water surface temperatureo C, w is 1.85 U, ea and es in mb.
Lake Hefner E = 0.028 U (es – e
a) e
a and e
s in mb.
Fitzgerald E = (10.2 + 3.14 U) (es – e
a)
Shahtin E = (3.5 + 0.53 U) (es – e
a) U is measured at 2m above ground.
Mamboub’s eqn.
Kuzmin formula E = (152.4 + 19.8 U) (es – e
a) U is measured at 8m above ground.
(mm/month)
Marciano and E = 0.918 U (es – e
a) U is measured at 8m above ground.
Harbeck’s formula
Wind speed at any height h1 up to 500 m above ground is calculated using the (1/7)th
power law given as Uhi = Uh
, where Uh is the wind speed measured at height h.
Among all the above equations, Meyer’s formula is widely used for the computation of lakeevaporation.
#3 A reservoir with average surface spread of 5.0 km2 in December has the water surfacetemperature of 30°C and relative humidity of 40%. Wind velocity measured at 2.0m above theground at a nearby observatory is 15 km/h. Calculate average evaporation loss from the reservoirin mm/day and the total depth and volume of evaporation loss for December.
Solution: For water surface temperature of 30°C, the saturation vapour pressurees = 31.81 mmHg. (Ref: Table 4.6)
Relative humidity (RH) = 40% = 0.40
To use Meyer’s equation, wind speed is to be converted to a height of 9 m above ground by(1/7)th power law, U (at 9 m above ground level) = 15× (9/2)1/7 = 18.6 km/h.
Saturation water pressure of air ea = es × RH = 31.81 × 0.40 = 12.724 mmHg.
Using Meyer’s equation, evaporation loss is computed as :
E = C 1U16
(e – e ) 0.40 118.616
(31.81–12.724) 16.51mm /days a+LNM
OQP = +F
HGIKJ =
Depth of evaporation in December = 31 × 16.51 = 511.81 mm.
Volume of evaporated water from the reservoir for December will be
(320.5 × 5.0 × 106) × 10–3 =2.559 mm3 = 255.9 ha.m.

50 Energy ManagementWater Management50
Table 4.6 Saturation vapour pressure of water
Temperature Saturation Vapour Pressure es Slope of Plot between (1) and (2)
(o C) (mmHg) (millibar)
(1) (2) (3) (4)
0.0 4.58 6.11 0.30
5.0 6.54 8.72 0.45
7.5 7.78 10.37 0.54
10.0 9.21 12.28 0.60
12.5 10.87 14.49 0.71
15.0 12.79 17.05 0.80
17.5 15.00 20.00 0.95
20.0 17.54 23.38 1.05
22.5 20.44 27.95 1.24
25.0 23.76 31.67 1.40
27.5 27.54 36.71 1.61
30.0 31.81 42.42 1.85
32.5 36.68 48.89 2.07
35.0 42.81 57.07 2.35
37.5 48.36 64.46 2.62
40.0 55.32 73.14 2.95
42.5 62.18 84.23 3.25
45.0 71.2 94.91 3.66
3. Water Balance Method: Water balance or water budget method balances all the incoming,outgoing and stored water in a lake or reservoir over a period of time. The equation in itssimplest form is SInflow – SOutflow = Change in storage + Evaporation loss. OrE = I – O ± S. It can be more generalized by taking all the factors of inflow and outflow.Above equation can be written as: E = (P + Isf + Igf) – (Osf + Ogf + T) + S, where P is theprecipitation, Isf the ground water inflow, Osf the surface water outflow, Ogf the ground wateroutflow, T the transpiration loss, DS is the change in storage. Measurement of all quantities ispossible except Igf, Ogf and T. Therefore, this equation fails to give accurate results since groundwater inflow and outflow are very difficult to measure for a lake or reservoir. It may give fairlygood result if considered annually but should not be used for daily estimation of evaporation.This equation is good for theoretical considerations or may be applied to watertight lakeslocated on impervious rocks for budgeting annual water.
4. Energy Budget or Energy Balance Method: Like water balance, energy balance or energybudget for lakes or reservoirs can be carried out to calculate lake evaporation. This methoduses the conservation of energy by incorporating all the incoming, outgoing and stored energyof a lake in the following form.

51Energy Management Water Losses 51
Hli + Hsi – Hso – Hlo = Hi + Hif + Hs + He + Hlr + Hgf
Hli = Long wave radiation incident on the surface of water
Hsi = Solar radiation (heat) or net energy received at water surface by short wave
Hso = Reflected solar energy
Hlo = Reflected long wave radiation
Hi = Increase in stored heat energy of water
Hif = Net energy converted / conducted from and out of the system by flow of water
Hs = Energy conducted from water mass to air as sensible head
He = Energy used for evaporation = ρ × E × LH
Hlr =Long wave radiation emitted from water
Hgf = Heat flux into ground water
ρ = Density of water (cm3/g)
E = Evaporation rate (cm/day)
LH = Latent heat of vaporization (cal/g)
The above energy terms are expressed in calories per unit surface area per day. A waterbody and energy terms are shown in Fig. 4.6. Daily calculation of lake evaporation by thismethod is unreliable due to difficulties in measuring all the parameters involved in the equation,but good estimate can be obtained if applied to monthly or yearly values. We can measure orcalculate all other terms except the sensible heat transfer between water surface and atmosphereHs. It can be measure by:
β = Hs/He
Fig. 4.6 Energy balance for lakes.
Back radiatio nlo ngwave(H + H )lr lo
Incom ingsola rradiation(H + H )ij s l
Reflec tedradiation(H )so
Evapora tionhea t loss(H = E . L )e H
Sensiblehea t lossto a ir (H )s
Increasedheat energ yof w ater (H )l
(H )lf
(H ) Hea t takesout of systemby flow of wa ter
if
(H ) He at flux to ground wate rgf

52 Energy ManagementWater Management52
Above equation is known as Bowen’s ratio, defined as the ratio between heats lost byconduction to heat lost by evaporation. Estimate of β can be made from the relation
β = c.p (T – T )
100(e – e )s a
s a
Where p is atmospheric pressure in millibars, Ts and Ta are the water surface and airtemperature in o C, c is a constant varying between 0.58 and 0.66 (average value being 0.61),es and ea are the saturation vapour pressure at water surface and air temperatures in millibar.From above equation, we get Hs = β . ρ . LH . E
Therefore, He + Hs = ρ LH (1+β) E
or, E = ( – )
( )H HL
e s
Hρ β1 +
Therefore, E = (H H – H – H – H – H – H – H )
Lli si so lo i if lr gf
H
+
+[ ( )]ρ β1
Values of radiation from sun and sky (Hli + Hsi) are available for different latitudes. Reflectedsolar radiation is dependent on factors like spectral wavelength and turbidity of water and air.For water, it can be taken between 5 to 15% of incident radiation. Neglecting Hsi, net effect ofall the long wave radiation Hlr is given in calories per square centimeter per day as the sum ofincoming long wave radiation from atmosphere Hli plus reflected long wave radiation – Hlo
and long wave radiation emitted by water – Hlr as
Hlr = Hli – (Hlo + Hlr) = (1 – r) Hli
The incident solar energy is calculated by the equations proposed by Penman (1948) as
Hli = (0.18 + 0.55n/N) Io, Where Io is the solar radiation received at earth’s outer surfacein (cal/cm2-day), n is the actual number of bright sunshine hours, N is the possible maximumnumber of hours of sunshine at the place. Io converted to mm of evaporable water/day. Thenet outgoing thermal radiation expressed by Penman is given as:
Hnet = σ T4 [0.56 – 0.092 ea0.5] (0.1 + 0.90n/N), in which σ is the Stefan–Boltzmann
constant = 2 × 10⁻⁹mm of water/day, T is the water surface temperature in °Kelvin, Hif can
be calculated from the relation Hif =
W H .TL
sh. e e
H
, in which Wsh is the specific heat of water in
cal/g o C. Hn can be calculated from the relation Hn = Hli (1 – r) – Hnet
Net energy added into lake water, Hif is measured by knowing all the volume of water inflowing and coming out of the lake and their corresponding temperatures during the period ofwater budget. This term should sum all channel inflows and outflows, evaporation, condensation,rainfall, seepage and other losses. The term increase in stored heat energy of water for the lake orreservoir is a difficult parameter to obtain, which can be computed by knowing precisely the

53Energy Management Water Losses 53
average temperature of lake water and the volume of water at the beginning and end of thebudget period. Application of the energy budget principle gives good results for watertight lakesand it may give highly erroneous and confusing results for other lakes.
5. Mass Transfer Method
This method is based on theories of turbulent mass transfer in boundary layer to calculate themass water vapour transfer from the surface to the surrounding atmosphere. Accuracyestimation of the amount of water vapour transferred to atmosphere from a lake surface is stillinvestigated. With the use of quantities measured by sophisticated instrumentation, this methodcan give satisfactory results. The equation proposed by Thornthwaite and Holzman (1939)takes the following form:,
E = 0.000119(e – e )(u – u )
p lnhh
i 2 2 1
2
1
×FHG
IKJ
LNM
OQP
where E is m/sec, u2 and u1 are the velocities of wind in m/
sec at heights h2 and h1 m respectively, e2 and e1 are vapour pressure of air in pascal (Pa) atheight(s) h2 and h1, p is mean atmospheric pressure in Pa (1 N.m2 = 1 Pa; 1 kPa = 10 mb)between lower height h1 and upper height h2. Height h1 is taken close to water surface level.
4.3 TRANSPIRATION
Plants absorb water from the soil through minute root hairs at the tips of their rootlets. Mineralsalts are also absorbed in very dilute solution, using water as the vehicle. The solutions aretransported through roots and stems to the leaves where plant food is produced from the sapand carbon dioxide absorbed from the atmosphere, using the energy from the sun operatingchlorophyll. These plant foods, again using water as the vehicle, are distributed through theplant for cell growth and tissue building. Most of the water absorbed through the roots isdischarged from the plant as vapour in the process known as transpiration. As much as 99%of the total water received by a plant through its roots is lost to the atmosphere by this process.
Evapotranspiration: while transpiration takes place, the land areas in which plants standalso lose moisture by the evaporation of water from soil and water bodies. In hydrology andirrigation practice, it is found that evaporation and transpiration processes can be consideredadvantageously under one head as Evapotranspiration. Evapotranspiration also uses the termconsumptive use to denote this loss. For a given set of atmospheric conditions,Evapotranspiration obviously depends on the availability of water. If sufficient moisture isalways available to completely meet the needs of vegetation fully covered the area, the resultingevapotranspiration (PET). Potential evapotranspiration no longer critically depends on soiland plant factors but depends essentially on climatic factors. The real evapotranspirationoccurring in a specific situation is called actual evapotranspiration (AET). If the water supplyto the plant is adequate, soil moisture will be at the field capacity and AET will be equal toPET. If the water supply is less than PET, soil dries out and the ration AET/PET would be lessthan 1.0. A relation between AET/PET and available moisture can be developed for different

54 Energy ManagementWater Management54
types of soils on the basis of experimental results. For the same AET/PET ratio, sandy soil hasmore available moisture than clayey soil. In other words, for the same percentage of availablemoisture, ratio of AET/PET will be less for sandy soil than clayey soil (Fig. 4.7).
Fig. 4.7 Comparison of AET/PET ratio for sandy and clayey soils.
Factors Affecting Transpiration
1. Solar radiation: Transpiration and plant growth are related to radiation received. Thuswhile 75 to 90% of daily soil evaporation occurs between sunrise and sunset, about 95% ofthe daily transpiration occurs during the daylight hours. Optimum temperature and radiationfor maximum growth vary with the plant species but all activity virtually ceases when thetemperature drops to near 4.5°C.
2. Moisture: Some investigators believe that transpiration is independent of availablemoistureuntil it has recorded to the wilting point (moisture content at which permanent wiltingof plants occurs) while others assume that transpiration is roughly proportional to the moistureremaining in the soil and available to plants.
3. Rate of plant growth: The transpiration is closely related to the rate of plant growth iswell established. Thus there is a pronounced seasonal and annual variation in addition tothe diurnal cycle. Transpiration is restricted to the growing season and stage of developmentis an important factor.
Measurement of Transpiration/Evapotranspiration
Transpiration
Most measurements are made with a “Phytometer” a large vessel filled with soil in which oneor more plants are rooted. The only escape of moisture is by transpiration (the soil surface issealed to prevent evaporation) that can be determined by weighing the plant and the containerat desired intervals of time. By providing aeration and additional water a phytometer studymay be carried through the entire cycle of a plant. It is virtually impossible to simulate naturalconditions and therefore the results of phytometer observations are mostly of academic interest
Rat
io A
ET
/PE
T
F ie ldcapacity
Sandysoil
C layeyso il
W ilt ingpoint
Percentage o f available mo isture
100 75 50 25 0
0.5
1.0
0

55Energy Management Water Losses 55
to the hydrologist. Transpiration ratio (TR) is the ratio between the amount of water consumedand the dry matter produced (exclusive of the roots, sometimes only the grains).
TR = weightof waterconsumed
weightof dry matter produced e.g. TR (wheat) = 450, TR (rice) = 700.
The transpiration varies approximately exponentially with the temperature (Meyer).According to him transpiration starts at 5°C and the average annual losses in the North CentralUnited State of America are:
(i) Grains: 22.5 to 25 cm(ii) Grass: 22.5 to 25 cm
(iii) Crops: 22.5 to 25 cm(iv) Deciduous trees: 20 to 30 cm(v) Small trees and bush: 15 to 20 cm
(vi) Conifers: 10 to 15 cm.Evapotranspiration: There are numerous approaches to estimation of evapotranspiration,none of which is generally applicable for all purposes. In some hydrologic studies, mean basinEvapotranspiration is required while in other cases water used of a particular crop cover orchange in water use resulting from changed vegetal cover is required. Evapotranspiration canbe estimated by various methods such as: (1) Experimental methods, and (2) Climatic approach.
1. Experimental Methods: The measurement of evapotranspiration for given vegetationtype can be carried out in two ways: either by using field plots or by using Lysimeters.
Field Plots: Application of a water budget to field plots produces satisfactory results only underideal conditions that are rarely exist. Precise measurement of percolation is not possible andconsequent errors tend to be accumulative. In special plots, all the elements of the waterbudget in a known interval of time are measured and the evapotranspiration determined as:
Evapotranspiration = [precipitation + irrigation input – runoff – increase in soil storage– groundwater loss].
Measurements are usually confined to precipitation, irrigation input, surface runoff andsoil moisture. Groundwater loss due to deep percolation is difficult to measure and can beminimized by keeping the moisture condition of the plot at the field capacity.
Lysimeters: A lysimeter is a special tank containing soil, which is set in the same surroundingas that in the field. A lysimeter is buried to the level of natural soil and its diameter varies from0.60m to 3.3m and depth varies from 1.8m to 3.3m. Details of a lysimeter are shown in Fig 4.8.Arrangements are made to weigh the lysimeter whenever reading is required to be taken. Ametering device measures outflow from the lysimeter. If P is precipitation to the system, W thewater supplied, and O the quantity of water drained out of the system, then Evapotranspirationis calculated as P + W = O + Et + ∆S, where Et is the evapotranspiration and ∆S the changein soil moisture storage. P, W and O are measured directly. When arrangement for weighing alysimeter is made, then ∆S can be found out by the difference of the weight of the lysimeter

56 Energy ManagementWater Management56
before and after the experiments over the periods of days. Knowing all other quantities ofequation, Et can be computed. To produce results very close to field, soil conditions, moisturecontent, plant types and the methods of water application should be properly chosen suchthat they represent the surrounding natural condition. The vegetation around the lysimetershould be the same as that inside in order to avoid disturbing border effects. To the same end,the depth of lysimeter should not be less than 1.5m and area not less than 1.0 sq. m. Lysimeterare expensive to maintain and time consuming.
Fig. 4.8 A Lysimeter.
2. Climatic Approach: Several empirical techniques have been developed for estimatingpotential evapotranspiration from readily available climatic data. Some empirical andtheoretical equations are derived on the basis of regional relationship between measured Et
and climatic factors. The following methods are the combination of some empirical, analyticaland theoretical approaches.
Blaney – Criddle Method: Blaney and Criddle (1962) proposed an empirical relation, whichis used largely by irrigation engineers to calculate crop water requirement of various crops.Estimation of potential evapotranspiration (consumptive use) is carried out by correlating itwith sunshine temperature. Sunshine at a place is dependent on latitude of the place andvaries with month of the year. Table below gives the values of percentages of monthly daytimefor use in Blaney – Criddle equation. PET for a crop during its growing season is given byPet = ΣK.F; where F = (0.0457Tm + 0.8128) P.
Here K is the monthly crop coefficient to be determined from experimental data, F themonthly consumptive use factor, PET the potential evapotranspiration in cm, Tm the meanmonthly temperature in °C, P is the monthly percentage of hours of bright sunshine inthe year.
0 .6 to 3.3 m
1 .8 to 3.3 m
A Lys im e te r
0

57Energy Management Water Losses 57
Table 4.7 Monthly daytime percentage hours (P) to be used by blaney – Criddle formula
NorthLatitude Jan Feb Mar Apr May Jun Jul Aug Sep Oct Nov Dec(Deg.)
0 8.5 7.66 8.49 8.21 8.50 8.22 8.50 8.49 8.21 8.50 8.22 8.50
5 8.32 7.56 8.47 8.29 8.66 8.40 8.68 8.60 8.23 8.42 8.06 8.30
10 8.13 7.47 8.45 8.37 8.81 8.60 8.86 8.71 8.25 8.34 7.91 8.10
15 7.94 7.36 8.43 8.44 8.89 8.80 9.05 8.83 8.28 8.26 7.75 7.88
20 7.74 7.25 8.41 8.52 9.15 9.00 9.23 8.96 8.30 8.18 7.58 7.66
25 7.53 7.14 8.39 8.61 9.33 8.23 9.45 9.09 8.32 8.09 7.40 7.42
30 7.30 7.03 8.38 8.72 9.53 9.49 9.67 9.22 8.33 7.99 7.19 7.15
35 7.05 6.88 8.35 8.83 9.76 9.77 9.93 9.37 8.36 7.87 6.97 6.86
40 6.76 6.72 8.33 8.95 10.02 10.08 10.22 9.54 8.39 7.75 6.72 6.52
45 6.42 6.54 8.30 9.09 10.33 10.47 10.57 9.75 8.41 7.60 6.42 6.13
50 5.98 6.30 8.24 9.24 10.68 10.91 10.99 10.00 8.46 7.45 6.10 5.65
55 5.42 6.01 8.16 9.41 11.13 11.53 11.56 10.34 8.52 7.25 5.65 5.03
60 4.67 5.65 8.08 9.65 11.74 12.34 12.31 10.70 8.57 6.68 4.31 4.22
Table 4.8 Mean monthly values of possible sunshine hours (N)
North Latitude in Degrees
Month 0° 10° 20° 30° 40° 50°
Jan 12.1 11.6 11.1 10.4 9.6 8.6
Feb 12.1 11.8 11.5 11.1 10.7 10.1
Mar 12.1 12.1 12.0 12.0 11.9 11.8
Apr 12.1 12.4 12.6 12.9 13.2 13.8
May 12.1 12.6 13.1 13.7 14.4 15.4
Jun 12.1 12.7 13.3 14.1 15.0 16.4
Jul 12.1 12.6 13.2 13.9 14.7 16.0
Aug 12.1 12.4 12.8 13.2 13.8 14.5
Sept 12.1 12.9 12.3 12.4 12.5 12.7
Oct 12.1 11.9 11.7 11.5 11.2 10.8
Nov 12.1 11.7 11.2 10.6 10.0 9.4
Dec 12.1 11.5 10.9 10.2 9.1 8.1

58 Energy ManagementWater Management58
Table 4.9 Monthly crop coefficient factor K to be used for blaney – cridle method
Crop → Rice Wheat Maize Sugarcane Cotton Potato Corn Vegetable
Light Dense
Value of K 1.1 0.65 0.65 0.90 0.65 0.70 0.75 0.80 1.20
Range of K 0.85- 1.3 0.5-0.75 0.5-0.75 0.8-1.0 0.5-0.9 0.65-.075 0.65-0.85 0.7-1.0 1.1-1.4
#4 Use Blaney–Criddle method to calculate consumptive use (PET) for rice crop grown fromJuly to September in Maharashtra at a latitude 20 N from the following data taken from a nearbyobservatory. Find the net irrigation demand for rice using the given rainfall during crop period.
Month → Jul Aug Sep
Mean Temp. °C 13 16 25
Rainfall, (mm) 15 20 10
Sol: For rice crop, monthly crop coefficient K of equation may be taken as 1.10. Meanmonthly sunshine hours for latitude of 20N for the months of July, August and September areobtained from Table and tabulated below.
Blaney–Criddle Method of Computation of Consumptive Use of Rice Crop for Example
Mean Monthly % Monthly Effective Depth ofMonth Monthly (P) of Day Consumptive K PET Rainfall at Irrigation
Temp. Time Hours Use Factor (4) × (5) 80% Demand(Tm) from Table (F) (cm) (6)-(7)
(cm)
1 2 3 4 5 6 7 8
Jul 13 7.74 10.89 1.1 11.98 1.20 10.78
Aug 16 7.25 11.19 1.1 12.31 1.60 10.71
Sep 25 8.41 16.44 1.1 18.00 0.80 17.28
F for col. (4) for July = (0.0457 Tm + 0.8128) × P= (0.0457 × 13 + 0.8128) × 7.74 = 10.89 cm
F (August) = (0.0457 × 16 + 0.8128) × 7.25 = 11.19 cmF (September) = (0.0457 × 24 + 0.8128) × 8.41 = 16.44 cmThe net irrigation demand = 10.78 + 10.71 + 17.28 = 38.77 cm.
Penman Method: Penman developed a theoretical formula based on the principles of bothenergy-budget and mass–transfer approaches to calculate potential evapotranspiration. A simple
energy budget neglecting all minor losses can be written as Et = α
+ α
, where H is the
heat budget of an area with crops which is the net radiation in mm of evaporable water per day,Et the daily evaporation from free water surface in mm/day, a is a constant (called psychrometricconstant whose value is 0.49 mmHg/°C or 0.66 mb/°C), A the slope of the saturated vapour

59Energy Management Water Losses 59
pressure vs. temperature curve at mean air temperature, Ea is the drying power of air whichincludes wind velocity and saturation deficit and is estimated from the relation:
Ea = 0.002187 (160 + u2) (es – ea); where u2 is the mean wind speed in km/day measured2m above the ground, es is saturation vapour pressure at mean air temperature in mm Hg, ea isactual vapour pressure in the air in mm of mercury and H is the daily net radiation in mm ofevaporable water and is estimated from the energy budget theories using the relation:
H = Ha (1 – r) (0.29 cosφ + 0.55n/N) – σT4 (0.56 – 0.092 ea ) (0.10 + 0.9 n/N); whereHa is the extraterrestrial solar radiation received on a horizontal surface in mm of evaporablewater per day, φ the latitude of the place where PET is to be computed, r is the reflectioncoefficient whose values for close crops may be taken as 0.15 – 0.25, for barren land0.05 – 0.45 and for water surface 0.05, n is the actual duration of bright sunshine which is afunction of latitude and is an observed data at a place, N is the maximum possible hours ofbright sunshine available at different location, σ is the Stefan-Boltzman constant =2.01 × 10⁻⁹ mm/day, Ta is the mean air temperature in °K = (273+o C) and ea is the actualvapour pressure in mm of Hg. The wind speed measured at any other height z can be reduced
to 2m height by the relation: u2 = u 2z
FHG
IKJ
0 143.
Knowing all other data from the table and measuring n, ea, u2 at the place, PET can easilybe calculated from the relation given by Penman. This method is finding its increasing applicationfor crop water estimation by various countries.
Hargreaves Method: Hargreaves proposed monthly consumptive use coefficient k for variouscrop groups which when multiplied with monthly pan evaporation values gives PET.
PET (Et) = Σk.Ep; Where k is monthly consumptive use coefficient, which is dependent onthe crop grown, Ep the pan evaporation in mm and PET in mm. consumptive use coefficient k isdifferent for different crops and is different for the same crop at different places. For the same crop,it is different during stages of its growth. Various research stations report values of k for differentcrops. In absence of figure for specific crop, data from Table 4.10 below may be used with caution.
Table 4.10 Values of Hargreaves monthly consumptive use coefficient k
Crop Group Important Crops Under the Group Et/Ep
Group A Potato, cotton, maize, bean, peas, jowar, beat 0.20 – 1.00
Group B Tomato, olive, plumes and some delicious fruits 0.15 – 0.75
Group C Onions, grapes, melons, carrots, hops 0.12 – 0.60
Group D Wheat, barley, celery and other grass type plants 0.10 – 0.90
Group E Pesters, plantin, orchard crops etc 0.70 – 1.10
Group F Orange, fruits, citrus crop 0.60
Group G Sugarcane, alfalfa etc 0.50 – 1.00
Paddy Maximum at 50% of growth is 0.80 – 1.30

60 Energy ManagementWater Management60
Et (Cu) is the evapotranspiration and Ep is the pan evaporation. Et/Ep = k is the consumptive usecoefficient. For dark vegetation plants, k should be taken higher for the same group and forlighter crop, it is lesser. Tall plants have higher value of k than small plants of same degree ofgreenness and density.
Table 4.11 Hargreaves average value of consumptive use coefficient (k = Et /Ep)
Values of k (Average)
% of Crop Group
Growing A B C D E F G Rice Wheat Cotton Maize
Season L P P L
1 2 3 4 5 6 7 8 9 10 11 12 13
0 0.20 0.15 0.12 0.08 0.90 0.60 0.50 0.80 0.14 0.30 0.22 0.40
5 0.20 0.15 0.12 0.08 0.90 0.60 0.55 0.90 0.17 0.40 0.22 0.42
10 0.36 0.27 0.22 0.15 0.90 0.60 0.60 0.95 0.23 0.51 0.23 0.47
15 0.50 0.38 0.30 0.19 0.90 0.60 0.65 1.00 0.33 0.62 0.24 0.54
20 0.64 0.48 0.38 0.27 0.90 0.60 0.70 1.05 0.45 0.73 0.26 0.63
25 0.75 0.56 0.45 0.33 0.90 0.60 0.75 1.10 0.60 0.84 0.35 0.75
30 0.84 0.63 0.50 0.40 0.90 0.60 0.80 1.14 0.72 0.92 0.58 0.85
35 0.92 0.69 0.55 0.46 0.90 0.60 0.85 1.17 0.81 0.96 0.80 0.96
40 0.97 0.73 0.58 0.52 0.90 0.60 0.90 1.21 0.88 1.10 0.95 1.04
45 0.99 0.74 0.60 0.58 0.90 0.60 0.95 1.25 0.90 1.10 1.03 1.07
50 1.00 0.75 0.60 0.65 0.90 0.60 1.00 1.30 0.91 1.00 1.08 1.09
55 1.00 0.75 0.60 0.71 0.90 0.60 1.00 1.30 0.90 0.91 1.08 1.10
60 0.99 0.74 0.60 0.77 0.90 0.60 1.00 1.30 0.89 0.80 1.07 1.11
65 0.96 0.72 0.58 0.82 0.90 0.60 0.95 1.25 0.86 0.65 1.05 1.10
70 0.91 0.68 0.55 0.88 0.90 0.60 0.90 1.20 0.83 0.51 1.00 1.07
75 0.85 0.64 0.51 0.90 0.90 0.60 0.85 1.15 0.80 0.40 0.93 1.04
80 0.75 0.56 0.45 0.90 0.90 0.60 0.80 1.10 0.76 0.30 0.85 1.00
85 0.60 0.45 0.36 0.80 0.90 0.60 0.75 1.00 0.71 0.20 0.73 0.97
90 0.46 0.35 0.28 0.70 0.90 0.60 0.70 0.90 0.65 0.12 0.62 0.89
95 0.28 0.21 0.17 0.60 0.90 0.60 0.55 0.80 0.58 0.10 0.50 0.81
100 0.20 0.20 0.17 0.60 0.90 0.60 0.50 0.20 0.51 0.10 0.40 0.70
Seasonal – – – – – – – – 0.61 0.61 0.68 0.86
Value
P = Poona, L = Ludhiana. Local values of k should be used whenever available.
#5 Use Hargreaves method to calculate crop water requirements for paddy to be grownfrom January 10 to March 30. Class A pan evaporation values for the months are 11, 12and 14 cm respectively. Rainfall during the three months can be taken as 10, 15 and 30mm.Calculate the gross irrigation requirement at the head of field if irrigation efficiency is 85%.

61Energy Management Water Losses 61
Solution: Referring above Table 4.10 for rice, value of k for the percent of growing season arefound and entered in column 5 of Table below. Et values are computed in column 6. Cropperiod for paddy is taken as 80 days from January 10 to March 30.
No. of Rainfall Net irri.
Days During Requirement Gross irri.
Up to the = col. 6 – Requirement
Mid month 80% × col = col. 8 /Point (cm) 7. (cm) Efficiency
1 2 3 4 5 6 7 8 9
10 – 31 Jan 11 100(11/80) = 11 0.98 10.78 1.0 9.98 11.74
13.75
1 – 28 Feb 38 100(38/80) = 12 1.28 15.36 1.5 14.16 16.66
47.50
1 – 30 Mar 71 100(71/80) = 14 1.20 16.80 3.0 14.40 16.94
88.70
Total 80 days 42.94 38.54 45.34
Consumptive use for paddy = 42.94 cm.
Net irrigation requirement = consumptive use – effective rainfall = 38.54 cm
Gross irrigation demand = net irrigation demand / efficiency = 45.34 cm.
4.4 INTERCEPTIONThe losses occur on account of evaporation of water caught and held in suspension byvegetation. When it rains over a catchment not all the precipitation falls directly onto theground. Before it reaches the ground, a part of it may be caught by the vegetation andsubsequently evaporated. The volume of water so caught is called interception. The adhesiveforce between the water drops and the vegetation holds back the drops of water against gravityuntil they grow in size to over weigh and slip down. The intercepted precipitation may followone of the three possible ways:
1. It may retain by the vegetation as surface storage and returned to the atmosphere byevaporation; a process called interception loss.
2. It can drip off the plant leaves to join the ground surface or the surface flow, calledthrough fall, and
3. The rainwater may run along the leaves and branches and down the stem to reach theground surface, called stem flow.
Interception loss is solely due to evaporation and does not include transpiration, throughfall or stem flow. Factors on which interception depends are: (a) intensity and duration ofstorm, (b) density of trees, (c) types of trees and other obstructions, (d) season of the year and(e) wind velocity at the time of precipitation.
Date % Growing
Season
Pan
Evaporation
Ep (cm)K
Et
= k. Ep

62 Energy ManagementWater Management62
The amount of water intercepted in a given area is extremely difficult to measure. It dependson the species composition of vegetation, its density and also on the storm characteristics. It isestimated that of the total rainfall in an area during a plant growing season the interceptionloss is about 10% to 20%. Interception is satisfied during the first part of a storm and if an areaexperiences a large number of small storms, the annual interception loss due to forests in suchcases will be high, amounting to greater than 25% of the annual precipitation. Quantitatively,the variation of interception loss with the rainfall magnitude per storm for small storms is asshown in Fig 4.9. It is seen that the interception loss is large for a small rainfall and levels off toa constant value for larger storms. For a given storm, the interception loss is estimated as:Ii = Si + Ki. E. t. where Ii = interception loss in mm, Si = interception storage whose valuevaries from 0.25 to 1.25 mm depending on the nature of vegetation, Ki = ratio of vegetalsurface area to its projected area, E = evaporation rate in mm/h during the precipitation andt = duration of rainfall in hours.
Fig. 4.9 Interception losses.
It is found that coniferous trees have more interception loss than deciduous ones.Also, dense grasses have nearly same interception losses as full-grown trees and canaccount for nearly 20% of the total rainfall in the season. Agricultural crops in theirgrowing season also contribute high interception losses. In view of these, the interceptionprocess has a very significant impact on the ecology of the area related to silviculturalaspects and in the water balance of a region. However, in hydrological studies dealingwith floods interception loss is rarely significant and is not separately considered. Thecommon practice is to allow a lump sum value as the initial loss to be deducted from theinitial period of the storm.
Horton (1919) proposed a straight-line relation between precipitation P in mm and totalinterception loss Ii for ash tree in the following form: Ii = 0.38 + 2.3P
Depending on the vegetal cover and precipitation, a general form of equation forinterception loss can be written as: Ii = a.P + b (1 – e –p/b); where a and b are constantswhich depend on the factors of infiltration loss, a varies between 0.01 and 0.2 and bbetween 2.5 and 38% of rainfall, P is the precipitation depth in mm. When the intensityof rainfall is 25-mm/h interception rates vary between 15% for soybean crop and 57%for tall grass.
100
80
60
40
05 10 15 20 25 30
R a infa ll (m m )
B eech trees
Inte
rcep
tion
Loss
as
Per
cent
age
Rai
nfal
l
2 0
0

63Energy Management Water Losses 63
4.5 DEPRESSION STORAGEWhen the precipitation of a storm reaches the ground, it must first fill up all depressionsbefore it can flow over the surface. The volume of water trapped in these depressions is calleddepression storage. This amount is eventually lost to runoff through processes of infiltrationand evaporation and thus forms a part of the initial loss. Depression storage depends on a vastnumber of factors such as: (a) the type of soil, (b) the condition of the surface reflecting theamount and nature of depression, (c) the slope of the catchment and (d) the antecedentprecipitation, as a measure of the soil moisture. Qualitatively, it has been found that antecedentprecipitation has a very pronounced effect on decreasing the loss to runoff in a storm due todepression. Values of 0.50cm in sand, 0.4cm in loam and 0.25cm in clay can be taken asrepresentatives for depression storage loss during intensive storm.
A general form of depression storage curve can be given as: VSD = K (1 – e –Pe/k); where Kis the capacity of the basin to store water in its depressions, VSD the depression storage volume,Pe the volume of precipitation in excess of infiltration and interception. It is an exponentiallydecaying curve and attains the value of K when the ratio Pe/K increases. Depression storagehelps to reduce soil erosion and increase soil moisture content. Therefore, farmers areencouraged to go for terrace farming to conserve soil and rain water for beneficial uses. Butthis water is a definite loss of water resource project. The sum of infiltration and depressionstorage can vary from 10 to 50 mm per storm depending on their intensity, duration and othercharacteristics.
4.6 INFILTRATIONIt is well known that when water is applied to the surface of a soil, a part of it seeps into thesoil. This movement of water through the soil surface is known as infiltration and plays a verysignificant role in the runoff process by affecting the timing distribution and magnitude of thesurface runoff. Creation of hydrogen bond between soil particles and the water initiate theinfiltration process. The adhesive force of attraction between soil and water, the surface tension,capillary and gravitational forces help to force more water between the pores of soil particlesas more water is added to the system due to rain. Further, infiltration is the primary steps inthe natural groundwater recharge.
Infiltration is the flow of water into the ground through the soil surface and the processcan be easily understood through a simple analogy. Consider a small container covered withwire gauze as in Fig. 4.10. If water is poured over the gauze, a part of it will go into thecontainer and a part overflows. Further, the container can hold only a fixed quantity andwhen it is full no more flow into the container can take place. This analogy, though a highlysimplified one, underscores two important aspects, viz., (i) the maximum rate at which theground can absorb water, the infiltration capacity and (ii) the volume of water that it canhold, the field capacity. Since the infiltrate water may contribute to groundwater dischargein addition to increasing the soil moisture, the process can be schematically modeled as inFig. 4.11. This figure considers two situations, viz, low-intensity rainfall and high-intensityrainfall, and is self-explanatory.

64 Energy ManagementWater Management64
Fig. 4.10 Concept of infiltration. Fig. 4.11 Concept of groundwater discharge.
Infiltration capacity is the maximum rate at which a given soil can absorb water under agiven set of conditions at a given time. At any instant the actual infiltration ft can be equal toinfiltration capacity f0 only when the rainfall intensity is greater than f0, otherwise actualinfiltration will be equal to the rate of rainfall. This can be observed during low intensityrainfall when there is no surface runoff produced due to precipitation. Once water enters intothe soil, the process of transmission of water within the soil known as percolation takes place,thus removing the water from near the surface to down below, charging the groundwaterreservoir. Infiltration and percolation are directly interrelated. When percolation stops,infiltration also stops. During any storm, infiltration is the maximum at the beginning of thestorm, decays exponentially and attains a constant value of fc as the storm progresses.
Factors Affecting Infiltration
Factors affecting infiltration depend on both meteorological and soil medium characteristics.
Surface entry: If a soil surface is bare, the impact of raindrops causes in washing offinerparticles and clogs the surface. This retards infiltration. An area covered by grass andother bushy plants has better infiltration capacity than a barren land.
Percolation: For infiltration to continue, the force of gravity and capillary actions must transmitwater that has entered the soil down. When percolation rate is slow, the infiltration rate isbounded by the rate of percolation. This depends on the factors like type of soil, its composition,permeability, porosity, stratification, presence of organic matter and presence of salts.
Antecedent moisture condition: Infiltration depends on the presence of moisture in the soil.For the second storm in succession, the soil will have lesser rate of infiltration than the firstmaiden storm of the season. Except sandy soil most other soils have swelling ingredients,which swells in presence of water and reduce infiltration rate to the extent of their presence.
Climatic conditions: Temperature affects the viscosity of water. Flow of water within thebody of the soil is laminar, the flow being directly related to viscosity. In summer therefore, lessviscous water causes more infiltration than in winter. Other climatic factors may not influence
Inpu t
Sp ill
W iregauze
to s torage
S urfa ceru no ff
L ow intens ityra in fall
H igh in ten sityra in fall
Inf iltra tion
S oilm o isturesto rageca p ac ity
P erc ola tio n tog rou nd w ate r
N o c on trib ution tog rou nd w ate r flo w
T o g rou nd w a te r flo w
(a ) (b )

65Energy Management Water Losses 65
infiltration rate to the extent, temperature does, and therefore, temperature can be consideredas the only vibrant climatic factor affecting infiltration.
Rainfall intensity and duration: During heavy rainfall, the topsoil is affected by mechanicalcompaction and by the inwash of finer material. This leads to faster decrease in the rate ofinfiltration than with low intensities of rainfall. Duration of rainfall affects to the extent thatwhen the same quantity of rain falls in n number of isolated of a continuous one, the infiltrationwill be higher in the former case.
Human activities: When crops are grown or grass covers a barren land, the rate of infiltrationis increased. On the other hand construction of roads, houses etc reduce infiltration capacityof an area considerably.
Depletion of groundwater table: Position of groundwater should not be very close to thesurface for infiltration to continue. The quantity of infiltrated water entering into the soilshould be drained out fully from the topsoil zone so that there is some space available for theinfiltrated water to store during next rain.
Quality of water: Water containing silt, salts and other impurities affect the infiltration to theextent they are present. Salts present affect the viscosity of water and may also react chemicallywith soil to form complexes, which obstruct the porosity of soil, thereby affecting infiltration.Silts clog the pore spaces retarding infiltration rate considerably.
Vegetation: Soil covered with vegetation has greater than barren land. Because of growth anddecay of roots and bacterial activities, dense natural forest provides good infiltration thansparsely planted crops.
Grain size of soil particle: Other factors remaining the same, infiltration rate is directlyproportional to the grain size diameter. When swelling minerals like illite and montmorilloniteare present in soils, the infiltration rate reduces.
Catchment parameters: A correlation between the drainage density and infiltration can beestablished for various basins. Such curves exhibit negative correlation. When the drainagedensity increases, infiltration capacity decreases.
Field Measurement Using Infiltrometers
Single tube infiltrometer: This is a simple instrument consisting essentially of a metal cylinder,30 cm diameter and 60 cm long, open at both ends. This cylinder is driven into the ground toa depth of 50 cm (Fig. 4.12). Water is poured into the top part to a depth of 5 cm and pointer isset to mark the water level. As infiltration proceeds, the volume is made up by adding waterfrom burette to keep the water level at the tip of the pointer. Knowing the volume of wateradded at different time intervals, the plot of the infiltration capacity versus time is obtained.The experiments are continued till a uniform rate of infiltration is obtained and this may taketwo to three hours. The surface of the soil is usually protected by a perforated disc to preventformation of turbidity and it’s setting on the soil surface. Sufficient precautions should betaken to drive the cylinder into the ground with minimum disturbance to the soil structure.The major criticism is that water spreads out immediately beyond the bottom of the cylinderthat does not represent a true condition in the field.

66 Energy ManagementWater Management66
Double tube infiltrometer: To overcome the objections of a single ring infiltrometer a set oftwo concentric hollow cylinders of same length are used (Fig. 4.13). Water is added to both therings to maintain the same height. Reading of the burette for the inner cylinder is taken asinfiltration capacity of the soil. The outer cylinder is maintained to prevent spreading of waterfrom the inner one. The important disadvantages still prevalent in these types of infiltrometersare: (i) the raindrop — impact effect is not simulated, (ii) the driving of the tube or ringsdisturbs the soil structure, and (iii) the results of the infiltrometer depend on some extent ontheir size. Larger diameter infiltrometers give more accurate and always lesser value of infiltrationthan smaller diameter type.
Fig. 4.12 Single tube infiltrometer. Fig. 4.13 Double tube infiltrometer.
#6 Observations on double cylinder infiltrometer on an experimented farm were recordedas under. (i) Draw infiltration depth versus time curve, (ii) Rate44 of infiltration (I) versusTime curve and (iii) Obtain equation of both of them.
Time Point Gauge Reading withHr-min Reference to Beginning (m)
10-31 14.5
10-32 14
10-35 12.8
10-40 11.3
10-45 10.27 / 15 Refilling
11-00 12.40
11-15 10.30 / 14 Refilling
11-30 12.60
11-45 11.50 / 14 Refilling
12-00 12.95
12-15 11.95
12-45 10.15 / 14.7 Refilling
13-15 13
13-45 11.30
G L
O uter r ingInne r ring
G .L .
Remark

67Energy Management Water Losses 67
Solution:
Time Time Cumulative Infiltration Depth (cm) Rate of
Hr – min Difference Time Point Gauge Difference Cumulative Infiltration(min) (min) (min) Reading Depth I=(5)/(2) × 60
1 2 3 4 5 6 7 8
10-31 - - 14.5 - - -
10-32 1 1 14 0.5 0.5 30
10-35 3 4 12.8 1.2 1.7 24
10-40 5 9 11.3 1.5 3.2 18
10-45 5 14 10.27/15 1.03 4.23 12.36 Refilling
11-00 15 29 12.4 2.6 6.83 10.4
11-15 15 44 10.3/14 2.1 8.93 8.4 Refilling
11-30 15 59 12.6 1.4 10.33 5.6
11-45 15 74 11.5/14 1.1 11.43 4.4 Refilling
12-00 15 89 12.95 1.05 12.48 4.2
12-15 15 104 11.95 1 13.48 4
12-45 30 134 10.15/14.7 1.8 15.28 3.6 Refilling
13-15 30 164 13 1.7 16.98 3.4
13-45 30 194 11.30 1.7 18.68 3.4
Figure # 6 (i)
Cum
ulat
ive
Dep
th (
cm)
Infil
trat
ion
C um ulative Tim e (m in)
y = 1.2 t0.514
100
10
1
0 .1
10 100 10001
Remark

68 Energy ManagementWater Management68
Figure # 6 (ii)
Cum
ulat
ive
Dep
th (
c)In
filtr
atio
n
C um ula tive T im e (m in)
20
18
16
14
12
10
8
6
4
2
00 50 100 150 200 250
y = 1 .2 t0.514
Figure # 6 (iii)
From Graph: β = (log y1 – log y2)/ (log x1 – log x2)
= (log 13 – log 7) / (log 100 – log 30) = 0.514.α= 1.2
Now y = α.tβ = 1.2.t.0.514
I = dy/dt = 1.2 × 0.514 × t0.514 – 1 = 0.617 t–0.486
Rainfall simulator: In this small plot of land of about 2m x 4m size, is provided with a seriesof nozzles on the longer side with arrangements to collect and measure the surface runoff rate.The specially designed nozzles produce raindrops falling from a height of 2m and are capableof producing various intensities rainfall. The terminal velocity of rainfall is assumed to beclose to raindrops through a height of 5–6m may be the ideal situation. Rainfall intensities of44.5 mm/h or multiple of it are generally created under such conditions. Arrangement is madeto collect the runoff from the plot, which can be measured (SRD). Prior to the experimental arun is made covering the plot with a polyethylene sheet to know the average rate of rainfall(Pd). Test run starts after removal of the polythene cover from the field and continues till asteady state of runoff from the plot is obtained. The following water budget equation is used toestimate infiltration rate from the experiment.
35
30
25
20
15
10
5
0
Rat
e of
Infil
trat
ion
(cm
/hr)
C um ulative Tim e (m in)
I = 0 .6168 t–0.486
0 20 40 60 80 100 120 140 160 180 200

69Energy Management Water Losses 69
Fd = Pd – SRD – Sol, where Fd is the depth of infiltrated water in mm, Pd the simulatedmeasured rainfall depth in mm, SRD the measured surface runoff depth in mm, Sol the depressionstorages, surface detention, abstraction and other losses in mm. When steady state is reached,the analytical run is carried out, the volume Sol being no more effective, the constant rate ofinfiltration is calculated from the relation Fd = (Pd – SRD). When rainfall stops, runoff from theplot continues and the values of depression storage plus surface detention can be measured fromthe recession between stop of rainfall and the last drop of water flowing out of the plot as runoff.
Block furrow method: The method consists of blocking the furrows at two ends, unit distanceapart so as to assess the volume storage difference in the furrow in relation to time. Theinstrument includes a float mechanism and a water stage recorder. In this method, PVC platesare inserted at a spacing of 1 m. Water is applied from the tank into furrow regulating it in sucha way that water level in furrow remain constant through out the test. Thus, water test fromthe furrow due to infiltration is refilled by supply tank. To measure the rate of infiltration thefall of the level of water in the supply tank is measured by piezometer for a fixed interval oftime. The volume of water lost can also be calculated for the same interval of time. Equivalentdepth of infiltration is obtained by multiplying the difference of piezometric reading with ratioof water supply to water applied.
Volume of water supplied = πr2h .
Volume of water applied = spacing of furrow in cm × 100r = radius of supply tank in cm.
A graph can be plotted between the rate of infiltration and cumulative time, and alsobetween the depth of water in tank and time. The depth versus time curve will be a parabola.
Let the equation of curve be y = α. tβ. To obtain rate of infiltration I =
= α.β.tβ–1
Fig. 4.14 Block furrow infiltrometer.
FIE
LD C
HA
NN
EL
B LO C K E D B Y S T E EL P LA TE
S P A C IN G O FF U R R O W
1 m
W
BLOCK FURROW INFILTRO METER
PIE
ZO
ME
TE
R S U P P LY TA N K
VA LV E
W AT E RS U P P LY P IP E
S TE EL P L AT E1 5 C M B E L LO W
F U R R O WB O T TO M
F U R R O W
H O O K G A U G E
1 m LE N G THB LO C K
h
S TE EL P L AT E

70 Energy ManagementWater Management70
#7 Following data collected on a farm for blocked furrow infiltrometer test. Diameter of adrum of supply tank = 30.8 cm and spacing of furrows are 70 cm; obtain the equation forcumulative infiltration depth y versus cumulative time T and rate of infiltration.
Time Piezometer Reading in SupplyHr-min Tank (cm) 26.8
9 – 06 26.8
9 – 08 21.1
9 – 10 15.0
9 – 12 11.2 / 25 Refilling
9 – 15 17.1
9 – 18 10.4 / 29.5 Refilling
9 – 20 26.3
9 – 25 15.7
9 – 30 7.3 / 29.1 Refilling
9 – 40 12.8 / 28.2 Refilling
9 – 50 13.4
9 – 55 5.1 / 29.9 Refilling
10 – 00 22.7
10 – 10 9.0 / 24.5 Refilling
10 – 25 5.3 / 26.5 Refilling
10 – 40 8.5 / 28.4 Refilling
10 – 55 6.6 / 28.5 Refilling
11 – 10 12.5 / 26.7 Refilling
11 – 30 3.2 / 30.0 Refilling
11 – 50 6.4
Remark

71Energy Management Water Losses 71
Solution:
Time Diff in Cumulative Piezometer Difference Equivalent Cumulative Rate of
Hr – Minute Time Reading H (cm) Depth of Depth of Infiltration,
min t (min) (cm) Infiltration infiltration, I (cm/hr)
(cm) y (cm)
1 2 3 4 5 6 7 8 9
9–06 – – 26.8 – – – –
9 –08 2 2 21.1 5.7 0.607 0.607 18.21
9–10 2 4 15.0 6.1 0.65 1.257 19.5
9–10 2 6 11.2/25.0 3.8 0.40 1.657 12.0 Refilling
9–15 3 9 17.1 7.9 0.84 2.497 16.8
9–18 3 12 10.4/29.5 6.7 0.713 3.21 14.26 Refilling
9–20 2 14 26.3 3.2 0.34 3.55 10.2
9–25 5 19 15.7 10.6 1.13 4.68 13.56
9–30 5 24 7.3/29.1 8.4 0.89 5.57 10.68 Refilling
9–40 10 34 12.8/28.2 16.3 1.73 7.30 10.38 Refilling
9–50 10 44 13.4 14.8 1.57 8.87 9.42
9–55 5 49 5.1/29.9 8.3 0.88 9.75 10.56 Refilling
10–00 5 54 22.7 7.2 0.76 10.51 9.12
10–10 10 64 9.0/24.5 13.7 1.46 11.97 8.76 Refilling
10-25 15 79 5.3/26.5 19.2 2.04 14.01 8.16 Refilling
10–40 15 94 8.5/28.4 18.0 1.92 15.93 7.68 Refilling
10–55 15 109 6.6/28.5 21.8 2.32 18.25 9.28 Refilling
11–10 15 124 12.5/26.7 16.0 1.70 19.95 6.80 Refilling
11–30 20 144 3.2/30.0 23.5 2.50 22.45 7.50 Refilling
11–50 20 164 6.4 23.6 2.51 24.96 7.53
Remark

72 Energy ManagementWater Management72
Figure # 7(i)
Figure # 7(ii)
Cum
ulat
ive
Infil
trat
ion
Dep
th (c
m)
C um u la tiv e T im e (m in )
3 0
2 5
2 0
1 5
1 0
5
0
y = 0 .43 t0.774
0 2 0 4 0 6 0 8 0 1 00 1 20 1 40 1 60 1 80
Figure # 7(iii)
Rat
e of
Infil
trat
ion
(cm
/hr)
C um ulative Tim e (m in)
35
30
25
20
15
10
5
0
I = 0 .3328 t–0.226
0 10 20 30 40 50 60 70
1 00
1 0
1
0 .1
1
1 0
1 00 1 000
y = 0 .43 t0.774
Cum
ulat
ive
infil
trat
ion
Dep
th (c
m)
C u m u la tiv e T im e (m in )

73Energy Management Water Losses 73
Volume of water supplied from supply tank = πr2h (1)
Volume of water required = y′ × w × L
= y′ × 70 × 100 (2)
Equating equation (1) and (2)
πr2 h = y′ × 70 × 100
Therefore, π × (15.4)2 × h = y′ × 70 × 100
Therefore, y′ =π × ×
×( . )15 470 100
2 h = 0.1064 h
Now from graph of cumulative depth versus cumulative time, y = α . tβ
Therefore, log y = log α + β log t
Y = c + mx
From log – log graph equation, I =
=α . β . tβ – 1
From graph, β = log y – log ylogx – logx
1 2
1 2
=log50 – log10
log – log50400 774 . 0
α = 0.43
Now, y = α.tβ = 0.43 . t0.774
I =
=0.43 × 0.770 × t0.774–1 = 0.3328 × t–0.226
Inflow–outflow method: This method is also known as volume balance method. It is consideredto be the most satisfactory one because it gives the average infiltration value by compensatingvarious errors, inherent in the furrow, arising out of soil heterogeneity, furrow cross sectionaldifference, cracks and puddling effects. The cylinder infiltrometer is used for basin and borderirrigation. Inflow–outflow method is most conventional for furrow.
In this method, the furrow is divided into a number of sections and Parshall’s flumes orother suitable water measuring devices are installed at each station to measure the flow rate.The furrow cross sectional profile is determined at the representative locations in the testsection with a point gauge before admitting water. The furrow spacing is measured from thecenter of the water in the test section and the depth of flow at different points at definitetime intervals are also reckoned. From the above measurements, it is possible to obtain thefurrow cross sectional area and wetted perimeter. The average value of wetted perimetermultiplied by length of the test section gives the wetted area. Furrow irrigation is determinedby following relationship.
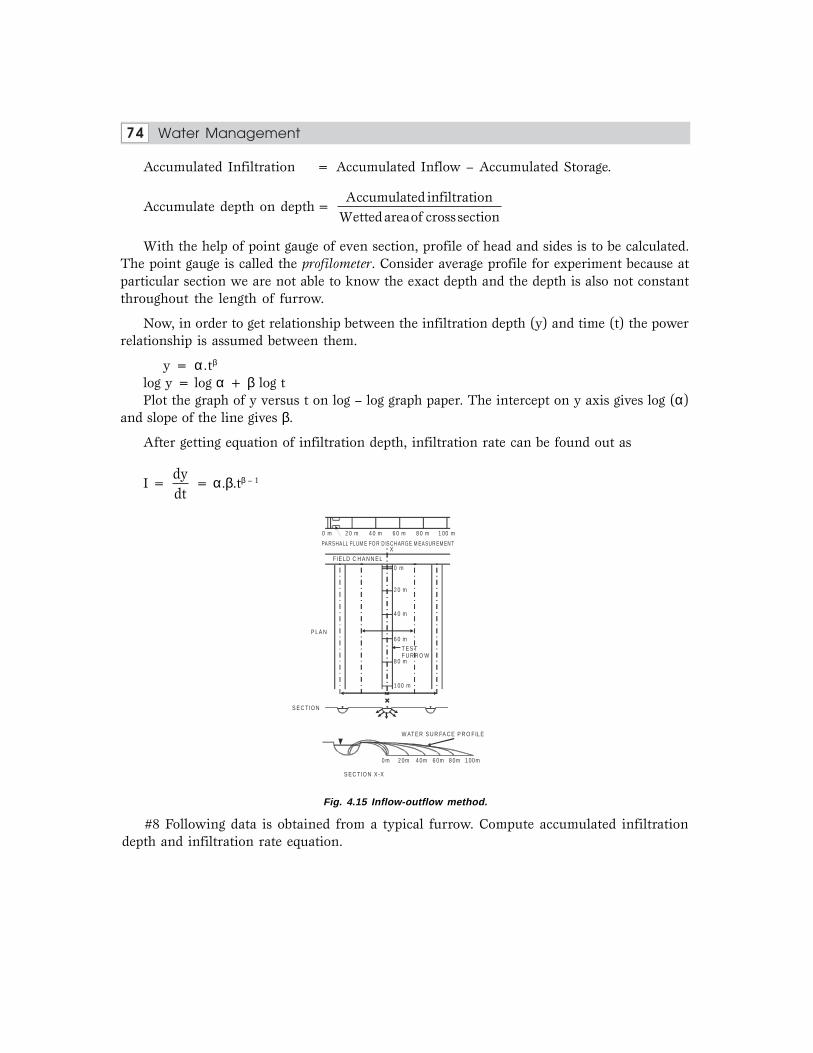
74 Energy ManagementWater Management74
Accumulated Infiltration = Accumulated Inflow – Accumulated Storage.
Accumulate depth on depth =Accumulated infiltration
Wettedareaof crosssection
With the help of point gauge of even section, profile of head and sides is to be calculated.The point gauge is called the profilometer. Consider average profile for experiment because atparticular section we are not able to know the exact depth and the depth is also not constantthroughout the length of furrow.
Now, in order to get relationship between the infiltration depth (y) and time (t) the powerrelationship is assumed between them.
y = α .tβ
log y = log α + β log tPlot the graph of y versus t on log – log graph paper. The intercept on y axis gives log (α)
and slope of the line gives β.
After getting equation of infiltration depth, infiltration rate can be found out as
I =
= α.β.tβ – 1
Fig. 4.15 Inflow-outflow method.
#8 Following data is obtained from a typical furrow. Compute accumulated infiltrationdepth and infiltration rate equation.
PA RSHA LL FLUM E FO R D IS CH AR GE M EASUR EM EN T
F IE LD C H A N N E L
T E S TF U R R O W
W AT E R S U R FA C E P R O FIL E
S E C T IO N X -X
0 m 2 0 m 4 0 m 6 0 m 8 0 m 1 00 m
0 m 2 0m 4 0m 6 0m 8 0m 1 00m
X
0 m
2 0 m
4 0 m
6 0 m
8 0 m
1 00 m
P LA N
S E C TIO N

75Energy Management Water Losses 75
Stream Size Distance Advance Time Wetted Perimeter Furrow Cross-sectional Area(lit/min) (m) ‘t’ (min) (cm) Corresponding to Average Depth
of Flow (cm2)
20 3.5 21.3 93.00
74 40 6.83 21.7 90.50
60 11.75 22.1 91.50
80 17.41 22.5 92.50
100 23.75 22.9 92.40
110 26.83 23.2 91.91
Solution:
Stream Size Distance Advance Time Accumulated Wetted Furrow Cross-sectional(lit/min) (m) ‘t’ (min) Inflow Perimeter Area Corresponding to
(lit) q × t (cm) Average Depth of Flow (cm2)
1 2 3 4 (1 × 3) 5 6
20 3.50 259.00 21.3 93.00
74 40 6.83 505.42 21.7 90.50
60 11.75 869.50 22.1 91.50
80 17.41 128 8.34 22.5 92.50
100 23.75 1757.50 22.9 92.40
110 26.83 1985.42 23.2 91.91
Accumulated Storage Wetted Area Accumulated Accumulated(lit) (cm2) Infiltration volume Infiltration Depth
(lit) (cm)
7 (2 × 6) ×100/1000 8 (5 × 2 × 100) 9 (4 – 7) 10 (9/8 × 100)
186 42,600 73 1.71
362 86,800 143.42 1.65
549 132,600 320.50 2.41
740 180,000 548.34 3.04
924 229,000 833.50 3.64
1011.01 255,200 974.41 3.82

76 Energy ManagementWater Management76
Figure # 8 (i)
Figure # 8 (ii)
Sample calculation:
1. Accumulated inflow = q × advance time = 74 × 3.5 = 259.0 lit2. Accumulated storage = cross-sectional area × distance = 93 × 20 × 100 = 186000
cm3 = 186 lit3. Wetted area = wetted perimeter × length from upstream end of furrow = 21.3 × 20
× 100 = 42600 cm2
4. Accumulated infiltration = accumulated inflow – accumulated storage = 259 – 186= 73 lit = 73,000 cm3
5. Accumulated depth of infiltration = (accumulated infiltrated volume/wetted area) =(73,000/42,600) = 1.71 cm
y = 0.6 t0.56
Take t = 6.83y = 0.6 (6.83)0.56 = 1.76 from graph and from tabley = 1.65
per cent error = [(1.76 – 1.65)/1.76 × 100] = 6.25%equation y = 0.6 t0.56
Acc
umul
ated
Dep
th fo
infil
trat
ion
(cm
)
A dvance T im e (m in)
y = 0.6 t0.56
10
1
0 .1
1000 .1 1 10
4 .5
4
3 .5
3
2 .5
2
1 .5
1
0 .5
0
Acc
umul
ated
Dep
th o
f Inf
iltra
tion
(cm
)
A dv a nc e T im e (m in )
y = 0 .6 t0.56
0 5 1 0 1 5 2 0 2 5 3 0

55555 WATER CONSERVATIONWATER CONSERVATIONWATER CONSERVATIONWATER CONSERVATIONWATER CONSERVATION
5.1 INTRODUCTIONThe term conservation has been widely used in different fields. Economists considerconservation as managing the resources in such a way that maximum human needs will besatisfied. The water conservation can be considered as prevention against loss of waste.Technically, this can be achieved by putting the water resources of the country for the bestbeneficial use with all the technology available in hand. As far as India is concerned, in most ofthe places, there is a rainfall during monsoon months and very little rain during other months.The monsoon rainfall often comes in pattern, which leaves some drought period in between.For this drought period, conservation of water is necessary. Conservation of water in droughtprone area will help in providing more irrigation for development of agricultural potential ofthese areas.
5.2 DEVELOPMENT OF NEW SUPPLIESIn order to effectively use and conserve limited water resources, supply oriented measuressuch as better use of existing supplies and development of new supplies are required to betaken up. Various techniques developed in different parts of the world for better use of existingsupplies and developing new supplies are:
1. Rain water conservation,2. Effective use of surface runoff,3. Improving groundwater storage, and4. Soil conservation
Rain Water Conservation: The rainwater conservation techniques for better use of existingsupplies practiced at different parts of the world are as follows
(i) Rainwater harvesting: The uncertain rain in drought prone area, if harvested overlarge area, can yield considerable amount of water. If 1 mm of rain falls on one-hectarearea, it leads to harvesting of 10,000 liters of water. Rainfall harvesting is very convenientmethod for those areas having as less as 50 to 100 mm average annual rainfall. For rainharvesting use of soil cover in the form of plastic and rubber sheets, land alteration,reducing soil porosity by chemical treatment can also be practiced.

78 Energy ManagementWater Management78
(ii) Rainfall cistern system: In a rainfall cistern system, runoff collected from roof topsof the houses is used for various purposes including irrigation in droughts of shortduration of 10 to 15 days.
(iii) Weather modification: Modifying suitable clouds artificially can augment the rainfallin areas. Weather modification can be of much use when shortage in water supply isacute. Even a small contribution from seeding is helpful and economically acceptablein such critical situations.
Effective Use of Surface Runoff: Manipulation of vegetative covers, soils, snow and othermeasures in a watershed can jointly increase water yield. Water losses from large bodies can beminimized by using some chemicals like aliphatic alcohols, acetyl alcohol etc. Floating blocksof wax and certain light material like rubber can also be used as evaporation suppressant. Inone such experiment at Stevens Creek Reservoir in Australia hexadeconal chemically knownas acetyl alcohol was used. Though this chemical is cheaper and does not impart any colour,odor, or biological activity to the water still there is a scope for research in this field. At Aji –I reservoir near Rajkot in Gujarat state of India, acetyl alcohol in the form of powder was used,which gave very successful results. Due to the above treatment, the average saving inevaporation losses was found to be of the order of 16.5%.
Improving Groundwater Storage: The groundwater is used by pumping from aquifers. Forgroundwater, a hydrologic equilibrium must exist between all water entering and leaving thebasin or aquifer. The equilibrium can be maintained by artificial recharge. In artificial recharge,it is tried to spread water on more and more area for deep percolation into the ground. Thespreading of water may be done by flooding water in a relatively flat area, constructing basinsby excavation or by construction of dykes or small dams.
Soil Conservation: Erosion is the detachment and transportation of the soil, which will affect theplant growth. It necessitates need of soil conservation. Soil and water conservation of agriculturalland are somewhat same which include contour farming, mechanical measures such as contourbunding, graded bunding, bench terracing on steep slopes and run off harvesting storage.
5.3 REDUCING DEMAND OF WATERChanging crop pattern may reduce water demand in agriculture. In industry, it can be reducedby changes in technology product.
Reducing Evapotranspiration: This aspect is very important in drought prone area. Placingmoisture tight barriers or water retardent mulches on the soil surface can prevent this loss.Non-porous materials such as asphalt sheets, plastic film or metal soils could be used for reducingevaporation from soil surface.
Adjusting Cropping Pattern: A suitable crop-breeding program should be developing for thedrought prone area. Plant suitable for drought prone area should have shorter growth period,high yield capacity with less demand of water, low transpiration rate, etc.
Improving Irrigation Practices: Drip irrigation is suitable technique in water scare area aswell in undulating area. In drip irrigation amount of water can be adjusted to the soils dependingupon type of soils, crop and climatic conditions.

79Energy Management Water Conservation 79
Reduction of Seepage: By lining of canals and channels seepage can be reduced, leading to savingof water. According to US Department of the Interior Bureau of Reclamation, different lining likehard surface lining, buried membrane linings, earth linings can be practiced for this purpose.
5.4 EVAPORATION CONTROLThe problem of evaporation control from a storage reservoir is quite complex and needs carefulconsiderations. Huge quantities of water are lost from storage reservoirs by evaporation everyyear. With the rapid increase in the development activities of the country, the need forconservation of stored water is keenly felt. The huge cost at which the storage reservoirs arebuilt, calls for minimizing evaporation to the maximum extent possible. The need forminimization of evaporation loss is even greater in the case of semi-arid and arid regions. Theloss of water from free surfaces of reservoirs assumes great importance especially when rainsfall in an arid region. The meteorological factors like, temperature of surface water, dew pointtemperature of air, wind movement, and atmospheric pressure, which are responsible forevaporation, cannot be controlled under normal conditions and at reasonable cost.
Methods for Controlling Evaporation: Different methods for controlling evaporations arebroadly classified as: (i) Physical, (ii) Biological and (iii) Chemical method.
Physical Methods: Physical methods can be classified as follows:
(a) Planting of trees all around the lake or reservoir to reduce the wind velocity. By plantingtrees all around the tank, one can reduce the wind velocity, which can blow on thesurface of the tank effecting reduction in evaporation. Moreover, the leaves of thetrees due to transpiration can create humid air above the water surface of the tank,thus helping to reduce the water evaporation.
(b) Partitioning the bigger tanks into smaller areas so that wind blowing on these areas iscut down and the evaporation reduced. If one can make smaller compartments havingsmaller areas the wind, which is blowing on the surface of the tank, gets broken, thusreducing the evaporation of water.
(c) Tank or reservoir can be covered with suitable material to reduce the evaporation.Here one can make use of plastic balls, which can float on the water surface, or onecan use plastic sheets to reduce the water evaporation. This may not be economicalfor larger reservoirs and sometimes water may get polluted.
(d) Construction of tanks of high depth and smaller water surface areas. This method isvery useful for drought prone areas water is pumped to appropriate deeper pockets sothat the surfaces exposed to evaporation are effectively reduced. Such a method wassuccessfully tried for Lake Worth in Texas (1988). There is thus a great scope of suchtechnique in all tropical drought prone or arid areas. In Gujarat (India), this methodwas tried for Nyari Lake near Rajkot in year 1987-88.
(e) Construction of underground storages or reservoirs in place of surface storage orreservoirs. This method involves planning use of underground storages for water ratherthan overground storages. This can certainly be done with great advantage in cases

80 Energy ManagementWater Management80
where aquifers for such storages are available and these do not entail higher lateraldispersion losses. Subsurface dams can also be constructed in such schemes to preparelimited aquifers and thereby raise the level of storage, reducing subsequent pumping.Subsurface dams or underground check dams have been constructed across streamsor rivulets in water deficient areas to hold groundwater and recharge the adjoininglimited aquifers. One of the outstanding applications of this method was recharge ofthe aquifer (adjoining Talaji rivulet near the town Talaji, Gujarat, India) wheresignificant water level rises were registered after the limited monsoons. The mainadvantage of this method is that loss of valuable lands and forest areas due to surfacesubmergence can be avoided. Unlike in the case of surface storages, the evaporationlosses are minimal. This method consists of managing the available reservoir inconjunction with other reservoirs by drawing water for consumption such that theaggregate area exposed to evaporation especially in summer months is minimum.
(f) Minimizing exposed water surfaces through storage management or integrated reservoirmanagement.
Biological Methods: There are many locations requiring phreatophyte control to reducenon-beneficial consumption of water by plant growth of little economic value. Salt cedar, willowsand cottonwoods not only consume large amount of water but they also aggravate meanderingthus causing further water loss. Techniques of phreatophyte control are being perfected andcontinued research proposes further improvements. A major difficulty however is that effectivecontrol generally requires repeated treatment with resulting high costs. Possibly this may berelieved by management techniques that will result in grasses becoming established in place ofthe phreatophytes.
Chemical Method: These methods although useful to certain extent and have been usedsuccessfully in some areas, cannot be used for the entire water surface available in the country.One of the novel methods used for reducing the evaporation from water surface is the chemicalmethod. There are some compounds called long chain fatty alcohol, which when put on watersurface spread spontaneously and form a monomolecular film. This technique of spreadingmonomolecular films for suppressing water evaporation has been tried on a large scale inAustralia for the first time in early 50s using monomolecular films of cetyl alcohol. This waterevaporation retardant was also called hexadecanol having a formula C16H33OH. This is a whitewaxy crystalline solid compound generally available in flakes or powder form and is derivedfrom tallow sperm oil. Its specific gravity 0.85 and melting point 50°C. The monomolecularfilm formed by hexadecanol on water surface is only about 0.015 micron in thickness. Anotherlong chain fatty alcohol called stearyl alcohol having a formula C18H37OH is also used withcetyl alcohol. Cetyl alcohol was mainly used as a retardant. In some cases cetostearyl alcoholi.e. mixture of cetyl and stearyl alcohols were used as effective evaporation retardants.
These chemicals can be dispersed in different forms:
(i) Solution using suitable solvents.(ii) Fine powder, as molten liquids or as slurry.

81Energy Management Water Conservation 81
(iii) Emulsion or suspension.(iv) Pellets.
Solution: Different countries have adopted different solvents for the preparation of the solutionof cetyl alcohol. Studies have indicated that mineral turpentine is the most suitable solvent.Known quantity of cetyl alcohol in powder form is added to a gallon of mineral turpentine toobtain desired concentration, say, one pound in two gallons of turpentine, etc.
Fine Powder: Another form of application of the chemical is in powder form. Cetyl alcohol,which is supplied in the form of big lumps, has to be pulverized and made into fine powderbefore it could be applied to water surface. The big lumps are broken to small pieces by meansof hammer. The pieces are then fed to a powder-grinding machine. The spacing of the grinderplates is adjusted to get the powder of required fineness.
Emulsion or Suspension: The use of the solvent, mineral turpentine is costly and dispensingthe chemical in emulsion form has been tried. The emulsion is prepared by adding knownquantity of cetyl alcohol in powder form to two gallons of water containing small quantity ofsoap or chekol or surfactants and heating the same to 67°C when a paste is formed. Water isthen added to give the required concentration.
If the water is used for the preparation of emulsion is impure, that is, if it contains largequantity of bacteria or carbonaceous dust, oil content, etc., emulsion cannot be formed andthere will be only lumps of cetyl alcohol with impurities. Hence, tap water is quite necessaryfor the preparation of emulsion.
Cetyl alcohol in an emulsion or solution form can be very successfully dispensed by shoredispensers and raft dispensers. It can also be supplemented by dispensing from boat. The shoredispensers are placed along upwind side. Application may have to be made daily to maintainthe film throughout the period of experiment.
Pellets: Pellets can be applied by hand or from constant feed chambers. But the experimentshave proved that the use of pellets is not encouraging due to various factors like the mineraloffering relatively small surface exposure for the generation of the film and formation of algae,abrasion with gauge raft etc.
Comparison of Different Methods: Cluff and Resnick have drawn the under mentionedcomparisons between the dispensing of long chained alcohol in solid, powder, solution andslurry forms.
The advantage when applied, as powder is that no additives are required which may increasethe cost or may be toxic to fish and animal life. Although easy to apply in the form of solid, thespreading rate of solid material is too slow to be of practical value in the formation of aneffective monolayer. Other disadvantages are: (i) excessive point application of powder toachieve the same spreading rate as emulsion and solution, and (ii) the problems encounteredin the development of a simple wind activated dispenser for powder within economic range foruse of small reservoir.
The spreading rate of solid material decreases with increasing chain length and decreasingtemperature.

82 Energy ManagementWater Management82
Application in the form of solution has several advantages: (i) spreading rate is fast; it isindependent of temperature and slightly affected by increasing chain length of alcohol, (ii)relatively small amounts of solution are needed to generate a film, and (iii) being in liquidform, continuous application is simplified.
The disadvantages are: (i) the solution cannot be used in late full winter and spring, and(ii) the cost of the solvent would be prohibitive unless suitable wind activated dispenserscould be developed.
In emulsion form, the advantages are: (i) it yields a satisfactory spreading rate and highevaporation suppression ability, (ii) the unit material cost is much lower than in solution, and(iii) ease in dispensing with a wind activated screw dispenser. The disadvantages are:requirement of an emulsifier which is to be cleared by health authorities, and total cost ofmaterial and transportation might be higher than for power.
Monolayer Properties of Alcohols and Alkoxy Ethanols
Film Pressure Area Isotherms: All the alcohols and alkoxy ethanols have been obtained inpure form. This property can give us an idea whether particular film forms condensed film or notand also gives various two dimensional phase changes especially liquid condensed to solid state.
Rate of Spreading and Equilibrium Spreading Pressure: These properties are importantto understand whether these compounds spread reasonably fast or not and also the equilibriumpressure obtained should be high. It has been observed that alkoxy ethanols exhibit high rateof spreading and equilibrium spreading pressure as compared to corresponding alcohols.
Collapse Pressure: The higher the collapse pressure, the better is the stability of the film. Ithas been observed that collapse pressure of alkoxy ethanols is higher than that of the alcohols.
Mixed Monolayer: Instead of using single component, we can use mixture of two componentsso that the mixed monolayer formed by these two components may be better in terms of waterevaporation retardation. In practice, it may not be economical to conduct experiments withpure compounds or sometimes mixed components may be naturally available, under thesecircumstances it is better to study the behaviour of mixed monolayer.
From exhaustive study, it has been concluded that the alcohol mixtures viz.C16 – OH + C18 – OH (1: 3) seem to be better than other alcohol mixed films as regardsevaporation reduction.
Amongst the alkoxy ethanols C18 – OC2H4OH + C22 – OC2H4OH (1: 9) seems to be thebest monolayer from the point of view of evaporation retardation as compared to alcoholmixtures and other alkoxy ethanols mixtures.
Formation of Monolayer: The process of film formation is as follows — the OH radical ofmolecule of cetyl alcohol is attracted to the water, which also contains OH radicals. Themolecules leave the solid spontaneously to form a monolayer floating on the water surface.This OH radical is immersed under water and the rest of the molecules stand on the surface.These molecules form the film. It has been found that maximum retardance of evaporation

83Energy Management Water Conservation 83
will be at a pressure 40 dynes/cm. Riedeal used monolayer of fatty acids and found thatthe evaporation reduction depends on the film pressure or surface concentration. R.McArthur and Durham from their studies demonstrated that the efficiency of the monolayerto reduce evaporation increased with dosage as expressed in multiples of the theoreticalquantity needed to form monolayer up to a maximum value after which a constant efficiencywas reached.
Polymorphism
Polymorphism is the property possessed by certain chemical compounds of crystallizing inseveral forms, which are generally different. Two properties of long chain n¾alcohols in theapplication of the materials to reservoir surfaces for retarding evaporation are the spreadingrate of the monolayer as it forms from the floating alcohol crystal and permeability of themonolayer to water vapour molecules. Both these properties depend in part on the chainlength of the alcohol. The spreading rate also depends on which polymorph of the alcohol ispresent. The polymorphic changes of alcohols, in turn, occur at temperature, which dependson the chain length.
Film Pressure
The film pressure should be of the order of 40 dynes/cm because evaporation reduction is thegreatest in that range and substantially decreased effectiveness results from lower film pressure.Maintenance of optimum film pressure with additional material is complicated by temperatureeffect. To obtain high efficiency in evaporation reduction, it is necessary that, as the temperaturechanges, first to generate a fully compressed layer at the highest possible degree of compressionby continuous supply of fresh retardant material to compensate for loss due to attrition, etc.
Effect of Impurities
Effective life of alkanol film depends on its continued existence in the liquid condensed state.Bodies that cause solidification on the film are therefore detrimental. Dust, carbonaceous matterand possibly algae solidify on the film and if the contaminants have sufficiently high specificgravity, they cause the film to sink.
The film destroying impurities most commonly met in practice are proteins arising fromaquatic life and carbonaceous dust. The spreading front of the solvent, if alcohol is dispensedin solution form, helps to clean protein deposits off the water surface. The effective life of themonolayer is, therefore, shorter on the reservoir water than on tap water.
Effect of Wind
There are several factors influencing the survival and effectiveness of monolayer of whichwind can be considered the most important. The rate of movement of monolayer is a functionof the wind velocity. With winds 24 to 32 km/h, it appears impracticable to maintain anyappreciable coverage. On the basis on the experiments conducted in Australia, it is stated thatfor wind up to 8 km/h evaporation saving has been 40% or more. When wind velocity is 24km/h or more, no saving can be effected.

84 Energy ManagementWater Management84
5.5 EQUIPMENTSFollowing are the main equipments required:
Floating Rafts: This dispensing unit consisting of a drum of capacity 181.83 liters installed on afloating raft 2.49 m × 2.49 m in size (Fig 5.1). The raft is constructed of light material, about38.10 mm thick over six floating drums. Attached to the floating raft is a frame carrying a drumof capacity 18.18 liters, which is kept floating on the surface. The delivery unit comprises of acontrol valve and a delivery tube, which draws the solution from the 181.84 liters drum, with itsdelivery and kept 76.20 – 152.40 mm below the water surface by the float drum of 18.18 literscapacity. The number of raft dispensers depends upon the shape and extent of water spread.
Fig. 5.1 Floating raft.
Shore Dispensing Unit: This type of dispensing unit consists of 181.84 liters drum installedon a portable stand made of mild steel angles (Fig 5.2). These are placed on the periphery ofthe water spread to deliver the solution at the shoreline. The position and location of thesedepend on extend of water spread and direction of wind.
Fig. 5.2 Shore dispensing unit.
Level gauge(optiona l)
Lug w e ldedto d rum
W ater leve l
Ven t
C ontro l va lve
Filter
P ivo t
F loa t
P.V.C . tubea ttached to float
R a ft d ispens er
W ind vane
Ven t
W ind contro lled va lveLeve
l gau
ge o
ptio
nal
Dru
m s
uppo
rts
F i lter
H and contro l ledvalve
P.V.C . tube
S hore
W ater level

85Energy Management Water Conservation 85
Boat: One ordinary rowboat or motorized one for towing the floating rafts, and for going overthe water spread for testing the surface pressure is required.
Meteorological Equipments: Temperature of air and humidity are measured by usingmaximum and minimum thermometers, wet and dry bulk thermometers or any other type ofhygrometer. These thermometers being housed in standard Stevension screen. Anemometerseither direct reading or recording type, measure temperature of water.
5.6 STUDIES ON EVAPORATION CONTROLThe problem of evaporation control from a storage reservoir is quite complex and needs carefulconsiderations. Huge quantities of water are lost from storage reservoirs by evaporation everyyear. With the rapid increase in the development activities of the country, the need forconservation of stored water is keenly felt. The huge cost at which the storage reservoirs arebuilt, calls for minimizing evaporation to the maximum extent possible. The need forminimization of evaporation loss is even greater in the case of semi- arid and arid regions. Lossof water from free surfaces of reservoirs assumes great importance especially when rains fail inan arid region. If the lake is meeting with the entire needs of water supply of a town theshortage can cause scare. Meteorological factors causing evaporation cannot be controlled byhuman beings. The only practicable alternative is to cover the water spread with a self-supporting membrane. Researchers have tried various materials to create such membranes,cetyl and stearol alcohols forming strong monolayer have been amongst the foremost. Theyrequire organic solvents like petrol, white spirit, mineral turpentine, synthetic thinners,kerosene, and indicator oil. The alcohols can be dispensed in solid or liquid forms.
India, which lies partly in tropical and partly in sub-tropical region, is characterized byirregular and unequal rainfall during the precipitation months. The frequent monsoon failureand existence of a large area of arid regions in the country has increased strain on the availablesurface water. To combat this problem, Research Stations in the country have conducted fieldand laboratory experiments for controlling evaporation for the past few decades. A review ofthe work done by these Research Stations is given as under.

86 Energy ManagementWater Management86
Case Study – Kukkarahalli Tank and Khodiyar Irrigation Scheme
1.0 Name of the organization Karnataka Engineering Research Institute, Junagadh Irrigation DivisionKrishnarajasagar
2.0 Address Karnataka Engineering Research Institute, Junagadh Irrigation Division,Krishnarajasagar, India Junagadh, India
3.0 Name of reservoir Kukkarahalli Tank Khodiyar Irrigation Scheme
3.1 Total capacity at(a) FRL (WS 66.77 Ha) Max depth 10.67m 38.22 Mm3
(b) Sill level ---- Nil
3.2 Levels at(a) 75% Capacity Not available RL 24.16 Mm3
(b) 50% Capacity Not available RL 16.11 Mm3
4.0 Total losses including 2.893 Mm3/day 4.26 Mm3
seepage loss
4.1 (a) Method of estimation which methods have been adopted at By pan evaporimeter of evaporation loss Karnataka Research Institute,(b) Comparative study Krishnarajasagar By standard of CDO of different method
4.2 Method for estimation of Only savings effected per day has been By V Notchseepage losses found out by eliminating seepage loss
5.0 Evaporation loss(a) In winter season Nil 2.688 Mm3 in Rabi season(b) In summer season Only savings effected per day has been 1.578 Mm3 after Rabi season
found out
6.0 Seepage loss at(a) FRL Seepage loss has been eliminated 0.05m per month (CDO
Standard)(b) Intermediate level — 0.05m average per month
7.0 Retardant used for Cetyl alcohol surface treatment with Cetyl alcoholreduction of evaporation chemical retardantloss with method and experience
8.0 Saving in evaporation loss Not available 10% (3.22 Mm3)
8.1 % of total capacity ofreservoir
8.2 % of summer capacity of Not available 26.29%reservoir
9.0 Year and period of study Feb, April, May 1962 28/4/1988 to 14/6/1988
10.0 Meteorological data Not available Not availablepertaining to period ofstudy

87Energy Management Water Conservation 87
Case Study – Malan Irrigation Scheme and Udaisagar Lake
1.0 Name of the organization Water Resources Department, Gujarat Hindustan Zinc Limited
2.0 Address Bhavnagar Irrigation Division, Pan Hindustan Zinc Limited,Wadi, Bhavnagar, India Zinc Smelter, Udaipur, India
3.0 Name of reservoir Malan irrigation Scheme Udaisagar lake
3.1 Total capacity at(a) FRL 11.44 Mm3/FRL 104.26 m 29.73 Mm3 / FRL 551.83 m(b) Sill level 0.00 mcft 93.90 m 3.54 Mm3 at 544.43 m
3.2 Levels at(a) 75% Capacity 103.26 m 550.75 m(b) 50% Capacity 102.03 m 549.50 m
4.0 Total losses including 0.65 Mm3 0.7618 Mm3
seepage loss
4.1 (a) Method of estimation Thin film by Cetyl stearyl alcohol Pan evaporationof evaporation loss measurement(b) Comparative study if Not done Not donedifferent method
4.2 Method for estimation of Assumed 0.12% per day Seepage is nil beingseepage losses impervious bed of the lake
5.0 Evaporation loss(a) In winter season 1.26 m without WER chemical, and 0.2685 Mm3 (21/1/87 to 28/2/87)(b) In summer season 1.02 m using WER chemical 0.4933 Mm3 (1/3/87 to 15/6/87)
6.0 Seepage loss at(a) FRL Not available Not available(b) Intermediate level 0.28 m in summer Here seapage log has to be
given not the capacity
7.0 Retardant used for reduction Cetyl alcohol in powder form (dusting Retardant used was ACILOLof evaporation loss with from boat) TA – 1618 WERmethod and experience
8.0 Saving in evaporation loss
8.1 % of total capacity of Not available 0.80% (0.22772 Mm3)reservoir
8.2 % of summer capacity of 9.15% Not availablereservoir
9.0 Year and period of study 1/3/1988 to 31/5/1988 21/1/87 – 15/6/87
10.0 Meteorological data Wind velocity: 11.17 km/h Wind velocity – 15 – 20 km/hpertaining to period of Temperature: Max. Min & Max Temp – 6°C & 46°Cstudy 1800 hrs – 37.87°C
D B Temperature 800 hrs – 28.50°C Relative humidity – 14% to 60%1800 hrs – 34.70°C Panevaporimeter – 10% to 47%W B Temperature 800 hrs – 23.00°C Wind direction – Towards east1800 hrs – 27.00°C Lake temperature – 5°C to45°C Rainfall - Nil

88 Energy ManagementWater Management88
Following table gives a list of countries where Cetyl alcohol was successfully used.
Sr. PercentageNo. Saving Effected
1 Australia Reservoir of areas from 2 to 20 acres 20 to 70%
2 Japan Evaporation pans over a period of three 53% OED paste
months in summer
3 USA USA Laboratory experiments 13 to 60%
4 Australia (CSIRO) — 52%
5 USA 100000 gallons capacity aerator tank 30 11% Sept 14 to 23 & Octfeet diameter and 14 feet deep 11 to 18
33% August 30 to Sept 7
6 South Dakota Pactola 14%
7 Nairobi Reservoir area 6.5 acres 30%
8 Tabora, Tanzania Reservoir of 105 acres water spread 30%
9 Malaya — 11%
10 Spain Reservoir areas 31 acres 35% 4% solution inwhite spirit
31% 35% solutionkerosene
5.7 CONSERVATION OF SOIL MOISTURETo appreciate the need of conserving the soil moisture, it is important to know the relationwhich exists between the amount of rain received, and the possible loss of this rain in wayswhich do not contribute to crop production. Now, the waters which fall as rain upon a fieldmay be lost to it by running off its surface, as is too often the case on hilly farms; it may belost by percolating downward beyond the reach of root action; or it may be lost by surfaceevaporation from the ground itself. As a rule, it is only that water which passes through theplant that materially contributes to its growth. However the mixture which evaporates fromthe surface of the soil does indirectly help the plant by leaving the chemical salt it may haveheld in solution nearer the surface of the ground, where it is more likely to be taken up bythe roots, and in assisting that soil life which develops fertility.
Need of Conserving Soil Moisture
There is hardly any productive land, which, under field conditions, can retain as much as 30kg of water to the 100 kg of soil, unless they lie close to or below the water table. In proof ofthis statement the water content of several field soils 32 hours after a rain of 100 mm may beceted which fell during 4 days. The same fields had received 111 mm 20 days earlier, andduring the intervening 20 days there had been a rainfall of 30 mm.
Country Observations Remark

89Energy Management Water Conservation 89
Type of Soil First Foot, Per Cent Pounds Per cu. ft Second Foot, Percent
Clay soil contained 33.91 26.79 26.60
Clay loam contained 23.88 26.57 26.45
Clay loam contained 28.75 26.45 27.06
Sandy clay loam contained 26.48 25.95 25.46
Sandy clay loam contained 24.69 24.76 22.81
Sandy clay loam contained 24.61 24.12 21.44
Sandy loam contained 17.65 18.00 15.81
Sandy loam contained 17.65 18.00 14.59
Saving Soil Moisture by Ploughing
Ploughing land in the fall has a very appreciable influence on the per cent of water the surface1m to 1.2 m of such soil may contain the following spring, and it is observed that a meandifference of 2.31 per cent more water in the upper 1oam of immediately adjacent lands ploughedlate in the fall, as compared with that not ploughed, the surface of neither having beendistributed. The larger quantity of water in the fall ploughed ground, in this case amounting tonot less than 6 pounds per square foot, was partly due to two causes; namely, the loose, opencharacter of the overturned soil, causing it to act as a much during the fall, and again in thespring, after the snow had disappeared; and the more uneven surface, which tended to permitmore of the melting snow and early spring rains to percolate into the soil.
Late fall ploughing, leaving the surface uneven and furrows in such a direction as to diminishwashing, works in a decided manner, on rolling land, to hold the winter snows and rains wherethey fall, giving to such fields a more even distribution of soil water in the spring. And when it isobserved that heavy lands, after a dry season, seldom become fully saturated with water duringthe winter and spring, the importance of fall ploughing in such cases can be appreciated.
From the standpoint of large crops, which result from the best use of soil moisture, there isone thing more important for a farmer to strive for than the earliest possible stirring of the soilin the spring, after it has sufficiently dried so as not to suffer in texture from puddling. Whenthe soil is wet, when its texture is close from the packing which has resulted from the wintersnows and early spring rains, the loss of water is very rapid, as it has been pointed out; it maybe more than 20 tonnes daily per acre, and this loss may extend to depths exceeding four feet.
5.8 SOIL MULCHESWhen the effectiveness of very thin soil mulches is measured, it is found that here; too, thelessening of the rate of evaporation may be very considerable. Thus it was found, by laboratorymethods, that when the evaporation from an unstirred surface was at the rate of 6.24 tonnesper acre daily, from the same surface, when stirred to a depth of 0.5 inch and 0.75 inch, theloss was only 5.73 tonnes and 4.52 tonnes respectively. Again, when the surfaces were covered

90 Energy ManagementWater Management90
with a fine, dry clay loam to a depth of 0.5 inch to 0.75 inch, the daily loss was then at the rateof 6.33 tonnes per acre per day for the naked surface, but only 4.54 tonnes and 2.4 tonnes forthe mulches, respectively.
There is thus left no room to doubt the efficacy of dry earth mulches, as conservators ofsoil moisture, but it should be said that not all soils are equally effective in their power todiminish evaporation.
5.9 INFLUENCE OF FARMYARD MANURE ON SOIL MOISTUREFarmyard manure has a marked effect upon the amount and distribution of soil moisture incultivated fields. When coarse manure is plowed under, its first effect is to act as mulch to theunstirred soil, by breaking the capillary connection between it and the surface layer. Thetendency, therefore, is to cause the surface soil to become drier than it would otherwise havebecome in the same time, and frequently to an injurious extent, especially in times of springdroughts, before seeds have germinated or young plants have developed a root system reachinginto the deeper soil. On such occasions as these, the heavy roller is of service in making abetter capillary connection with the unstirred subsoil.
Farmyard manure has a general tendency to leave the upper three feet of soil more moistthan it would be without it, and the drier the season and more thorough the manuring, themore marked is its influence. In experiments to measure this influence under field conditions,it is found that for manured fallow ground the surface foot contained 18.75 tonnes morewater per acre than adjacent and similar but unmanured land did, while second foot contained9.28 tonnes and third 6.38 tonnes more water, making a total difference in favour of themanured ground amounting to 34.41 tonnes per acre. The largest observed difference was72.04 tonnes in the dry season of 1891. Early in the spring, on ground manured the yearbefore and fallow, there was an observed difference amounting to 31.58 tonnes per acre.
It is a fact long ago observed that increasing the organic matter in the soil increases itswater-holding power, and this being true, it was to be expected that the surface foot would bemore moist as a consequence of manuring.
Influence of Vegetation
Organic matter: The influence of vegetation upon infiltration and soil water storage isparticularly due to the effect of organic matter on and in the soil and plant roots. Measurementshave shown a positive correlation between the quantity of organic matter present in the soiland its water holding capacity. Increased soil porosity and water absorbing capacity have beenfound to follow forest planting in fields formerly cultivated.
Plant roots: Channels left by decayed roots also perform an important function in percolationand storage of water.
Plant and animal life: The soil under a relatively undisturbed forest and range cover is thehome of much animal life. In the process of nutrition, the worms pass great quantities of soiland organic debris through their bodies, thereby together with bacterial action, promoting

91Energy Management Water Conservation 91
humification and the incorporation of organic matter with mineral soil. All such life, plant andanimal influence the moisture intake and moisture holding capacity of the soil, either directlyor indirectly. Any modification of the plant cover and surface soil by cultivation, burning orovergrazing induces conditions unfavorable to the optimum development of these soil faunaand flora and results in a reduction in the capacity of the soil to take up water.
Sheltering: Vegetation shades the ground and minimizes wind movement. The effect tends toreduce evaporation and snow melting rates. It is found that evaporation of water from snow inforest areas may be only about one third as fast as from open areas. Also snow-melting rateshave been observed to be as much as one third more rapid in the open than in the forest.
Stream temperature: D R Dewalle et al., (1977) have demonstrated that (i) maximum dailywater temperatures near inlet in the unshaded reach increase almost linearly with distance,and (ii) farther from the inlet, maximum water temperatures increase exponentially and approachan equilibrium condition.

This pageintentionally left
blank

66666 RAIN WATER HARVESTINGRAIN WATER HARVESTINGRAIN WATER HARVESTINGRAIN WATER HARVESTINGRAIN WATER HARVESTING
6.1 INTRODUCTIONAccording to the National Drinking Water Mission, a village is classified as a problem village if:
• The source of water i.e., a well or hand pump is located at a distance of more than 1.4km from habitat.
• The source dries up during the summer months.
• The source has inadequate supply. The Government norm for adequate supply inrural areas is 40 liters/capita/day and 30 liters/cattle/day.
• If the source contains total dissolved solids/arsenic/fluoride/iron in concentrationsabove their permissible limit.
According to Agarwal (2000), the number of such problem villages identified in 1972 was150,000 and out of these, 94,000 were provided a source of drinking water by 1980, as perGovernment records. The number of remaining problem villages should then have become56,000. However, a separate inventory showed that the total number of problem villages hadnow become 231,000 in the same year 1980. Again according to Government reports, 192,000villages were provided a source by 1985, but 140,975 villages remained without a source. Outof these, by 1997, the problems of 110,371 villages were apparently addressed, but still thenumber of remaining problem villages was 61,747 instead of 30,604 which one can obtainthrough simple subtraction.
This bewildering and confusing statistical jugglery is a sad reflection on the failure of themethodology used till now in solving the problems, which have also increased manifold overthe years. It also means that:
• The solutions found to problem villages were not sustainable.
• Some new villages which were earlier having an adequate source have turned‘problematic’, possibly because of over-exploitation and
• The increasing practice of tapping deeper aquifers has led to problems of drinkingwater quality.

94 Energy ManagementWater Management94
One important point to be noted is that in all the Government machinery approaches sofar, the methodology adopted was to locate what was already provided for by nature if possible,at the problem village itself, or otherwise provided through expensive pipelines from elsewhere,where the natural source was available at that point in time.
There was hardly any attempt at creating a new source at the problem village itself throughharvesting and conserving the precipitation endowment received annually.
The second reason was that the Government efforts failed at the operation and maintenancelevel. This happened because the people were not involved in the process of solving the problem.The people were neglected and in turn they neglected the upkeep of the sources made availableby the Government department.
Rain water roof catchment systems (RRCS) as existing in many individual homes of thestates mentioned were also surveyed and studied. Among the north–eastern states of India,Arunachal Pradesh, Nagaland, Mizoram, Manipur, Meghalaya, Assam and Sikkim, RRCS areaccepted particularly in those places where the homes are scattered and the piped water supplysystem could not reach individual homes. In contrast, the RRCS cannot be applied in denselypopulated areas, where there are many industries/factories or excessive traffic load is causingto precipitate acid rains. In all the states as mentioned the average rainfall is of the order of1500 – 3000 mm and there is no concentration of industries.
6.2 RAIN WATER HARVESTINGThe term rainwater harvesting refers to direct collection of precipitation falling on the roof oronto the ground without passing through the stage of surface runoff on land. It is sometimesused to describe the entire gamut of water harvesting. We shall use it here only in the specificsense. There are two types of rainwater harvesting, roof water harvesting and ‘In situ’ waterharvesting. In this chapter, roof water harvesting (RWH) methods are described.
Basically, there are two types of rainwater harvesting schemes those designed foragricultural use and those designed for human use. Rainwater catchment schemes intendedfor agricultural use require large catchment areas. In this case, use of the ground surfaceis the obvious choice. However, water for human use should be more convenient andcleaner than water for agriculture use. Roofs are an obvious choice for a catchment surfaceas their elevation protects them from contamination and damage which are common toground surface catchments.
The advantages of rainwater roof catchment system are:
• The quality of rainwater is high, if collected and stored in a hygienic manner.• The system is independent, and therefore suitable for scattered settlements.• Local materials and craftsmanship can be used in rainwater system construction.• No energy costs are needed to run the system.• Ease of maintenance by the owner/user.

95 Energy Management Rain Water Harvesting 95
The disadvantages of rainwater roof catchment system are:
• The high initial cost.• The water available is limited by rainfall and roof area. For long dry seasons, the required
storage volume may be too high, which is very expensive.• Mineral free water has no taste while people may prefer the taste of mineral rich water.• Mineral free water may cause nutrition deficiencies in people who are already on
mineral deficient diets.
6.3 ROOF WATER HARVESTING (RWH)Traditionally, rain water harvesting comprises collection of the precipitation falling onto theroof or terrace of a building and storing it in a waterproof sump at ground level for use yearround or in periods of scarcity of supply from other sources such as a pond or a well. Roofwater harvesting was practiced, as a matter of necessity, mostly in the low rainfall areas of thecountry, having annual rainfall less than 500 mm per year. Roof water harvesting and storagesystems are a common features of all old buildings in North Gujarat, Saurashtra and WesternRajasthan. Roof water harvesting was also practiced in some coastal areas where thegroundwater was brackish.
Modern construction during the last 50 years, especially in urban areas, has no provisionfor the collection and storage of roof water. The increase of population and inefficientsystem of distribution of municipal water supply has led to seasonal scarcity of domesticwater supply in practically all the urban agglomerates. The utility of roof water harvestingis now being realized and the movement of roof water harvesting is slowly gatheringmomentum in urban areas. In prevailing situations of uncertain supply, having a captivesource of potable water is a main resource for a dweller. The rainwater stored over theground in a sump or recharged into a dug well or open well, provides much-needed succourduring the summer months. Traditionally, the rainwater collected from roofs was alwaysstored in sumps. In modern days, the roof water is stored in a sump and/or recharged intothe local aquifer. The practice of using rainwater for directly recharging the local aquiferis becoming popular in urban areas.
Roof water harvesting has also become necessary now in hilly areas having high rainfall.The traditional perennial sources of water in such areas are springs. However, the yield ofthese springs has either dwindled over the years due to deforestation or the total amountsupplied by them has become inadequate because of increase in population.
In some parts of Andhra Pradesh, Madhya Pradesh, Gujarat and Rajasthan, the level offluoride in groundwater is above the permissible limit (1.5 mg/l). In parts of West Bengal andBangladesh, the groundwater also contains arsenic above the permissible limit of 50 micrograms/liter. In these situations also, roof water harvesting is desirable although there may be noshortage of groundwater. Rainwater is practically free of dissolved solids and also does nothave substances such as arsenic and fluoride.

96 Energy ManagementWater Management96
There are areas where there is no problem with groundwater quality, or where the watertable in the monsoon season does not rise up to ground level. In such areas, it is desirable andcheaper to recharge the collected precipitation into the groundwater reservoir through apercolation pit in the ground or through an existing open well or a tube well. However inareas where the groundwater quality is poor due to excess occurrence of dissolved salts/fluoride/arsenic or due to anthropogenic pollution, surface storing in sumps or other storage structuresbecomes a necessity. Sumps are also the only option for storing the roof harvested water in thecase of a hilly terrain, having slopes or a laterite cover, as in such areas, aquifers having adequatestorage capacity are generally absent.
If roof water harvesting is practiced on a large scale in an urban area, then it also helps inreducing the severity of floods, which follow a heavy downpour. Similarly if it is used for spotrecharging by large number of households, then it helps in restoring the water table and alsoin improving the quality of water. Another benefit accruing from roof water harvesting in anurban area is that it reduces the demand on the municipal water supply system that in generalis inadequate to meet the needs of each and every household.
Feasibility of Roof Water Harvesting
The initial step in planning and developing a rainwater roof catchment system involves anappraisal of the feasibility of the system. The feasibility can be determined in light of threeconstraints: technical, economical and social.
Technical: The initial consideration of the feasibility of rainwater roof catchment systemconcerns water availability as compared to its user demand. The total rainwater availabledepends on a catchment area and annual precipitation. The total annual demand is based ontotal design population and per capita rate of supply, which is 40 lpcd in Indian villages. If thesupply exceeds demand, then rainwater roof catchment system is feasible from a technicalpoint of view, based on total maximum supply over the period of a year. If the supply is lessthan demand, then possible solutions include increasing the catchment area or reducing thedemand for rainwater.
Economical: The cost of proposed rainwater roof catchment system must be evaluatedand compared with the costs of alternative water supply improvements. Costs ofcatchment and storage demand on which existing structures can be used, and the cost ofmaterials. Though system may be economically justifiable, it must also be affordable tothe household.
Social: Once it has been tentatively established that it is technically and economically feasibleto construct a rainwater roof catchment system, the next step involves social and communityassessment. This stage is critical to the success of the catchment scheme.
Components of Rainwater Roof Catchment System
The components of a rainwater roof catchment system include the roof, the gutter system andthe storage tank (Fig. 6.1).
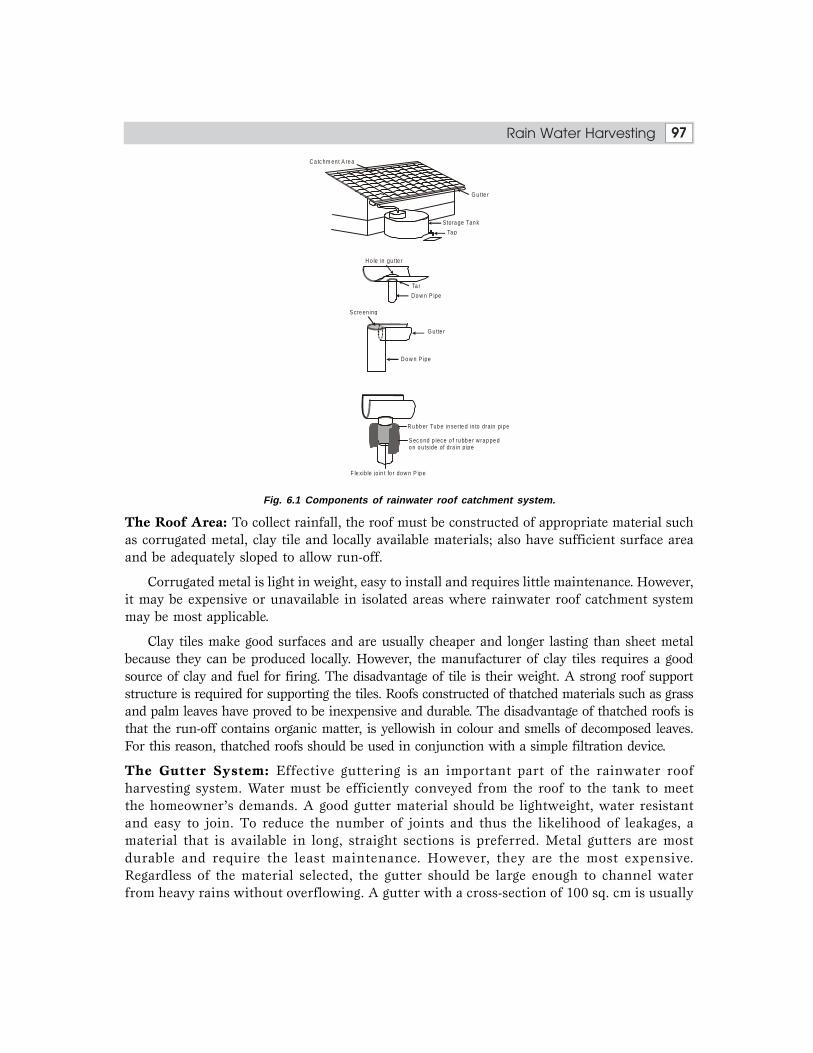
97 Energy Management Rain Water Harvesting 97
Fig. 6.1 Components of rainwater roof catchment system.
The Roof Area: To collect rainfall, the roof must be constructed of appropriate material suchas corrugated metal, clay tile and locally available materials; also have sufficient surface areaand be adequately sloped to allow run-off.
Corrugated metal is light in weight, easy to install and requires little maintenance. However,it may be expensive or unavailable in isolated areas where rainwater roof catchment systemmay be most applicable.
Clay tiles make good surfaces and are usually cheaper and longer lasting than sheet metalbecause they can be produced locally. However, the manufacturer of clay tiles requires a goodsource of clay and fuel for firing. The disadvantage of tile is their weight. A strong roof supportstructure is required for supporting the tiles. Roofs constructed of thatched materials such as grassand palm leaves have proved to be inexpensive and durable. The disadvantage of thatched roofs isthat the run-off contains organic matter, is yellowish in colour and smells of decomposed leaves.For this reason, thatched roofs should be used in conjunction with a simple filtration device.
The Gutter System: Effective guttering is an important part of the rainwater roofharvesting system. Water must be efficiently conveyed from the roof to the tank to meetthe homeowner’s demands. A good gutter material should be lightweight, water resistantand easy to join. To reduce the number of joints and thus the likelihood of leakages, amaterial that is available in long, straight sections is preferred. Metal gutters are mostdurable and require the least maintenance. However, they are the most expensive.Regardless of the material selected, the gutter should be large enough to channel waterfrom heavy rains without overflowing. A gutter with a cross-section of 100 sq. cm is usually
C a tc hm en t A re a
G u tte r
Stora ge Tan k
Ta p
H o le in gu tte r
Ta r
D o w n P ipe
S cre en ing
G u tte r
D o w n P ipe
R u bb er Tub e in se rte d in to dra in pipe
S ec o nd p iece o f ru bb e r w rap pe do n o utside of dra in p ipe
F le xib le jo in t fo r dow n P ip e

98 Energy ManagementWater Management98
sufficient to meet this requirement. The minimum recommended depth is 7.0 cm for anygutter. The gutter should be placed at a uniform slope to prevent water from pooling oroverflowing. The slope should be about 1 cm per meter. To collect the water running offduring light and heavy rains, the roof should overhang the gutter by 1 or 2 cm. The guttershould extend beyond the roof edge by about 7 cm.
The Storage Tank: A satisfactory storage tank is the most important part of the rainwaterroof water harvesting system. It is difficult to construct and must be a durable device, hence itis the most expensive component of the system. The materials used are masonry, concrete,ferro-cement, plastic, metals sheet etc. The design stage of the project involves sizing the storagetank. There are a number of methods that can be used to determine tank volume.
Dry Season Demand versus Supply: This approach considers the length of the dry periodas a design constraint. The tank is designed so that it accommodates the household demandaround during the dry season. For this reason, the method is most appropriate where there isa definite wet/dry period during the year.
The length of the dry period can be estimated by:
• Asking farmers and residents about the longest drought they remember.• By estimating from official weather analysis data the number of consecutive dry months
per year. The dry season demand versus supply method should also consider themaximum drought length in light of its probability of occurrence.
The dry season demand versus supply gives only a rough estimate of supply and demand.However, it does not take into account variations in annual rainfall patterns. A better methodof tank sizing involves the Mass Curve Analysis Technique.
Mass Curve Analysis: A more accurate method of sizing a tank involves an analysis of datausing the mass curve technique. Successful use of the technique requires approximately 10years’ data.
First, an approximation of the run-off coefficient is required. Some rainwater will be lost duringcollection. This amount is represented as a fraction called the run-off coefficient. This is not aprecise value but is estimated on the basis of the type of roof, the condition of gutters andpiping, and the evaporation expected from the roof and tank. Approximate runoff coefficientvalues are:
Table 6.1 Runoff coefficients
Type of Roof Good Gutters Poor Gutters
Metals 0.9 0.8
Other roofs 0.8 0.7
The Filter: Whenever it is apprehended that water may contain dust or other organic matterfrom the roof, simple filtration device using crushed charcoal, sand and gravel or coconutfibers or some combinations thereof as media may be installed over the storage tank.

99 Energy Management Rain Water Harvesting 99
Status of Rainwater Roof Catchment System in North-Eastern State
For roofing material corrugated GI sheets have been extensively used. In few cases, thatchedroof and roof made of leaves are also seen. For gutter system, the sheet metals (galvanized ironsheet) are used in many cases, though bamboo was also found in few cases. The sheet metalhas the advantage as it can be sloped and jointed easily as required. The roof overhang must be3 – 5 cm and the depth of the gutter is 7 – 15 cm. For storage purpose, the plastic tanks are verycommon. In very few cases, metal sheet tanks were also observed. In some cases, concretetanks were also observed. The stone masonry tanks, which are very old, are no more in use. Insome areas, where economically weaker sections of the community reside, the local governmentsupplied storage tanks made of plastics are popularly used.
In the state Meghalaya and Manipur, small filters packed with gravels of various sizeswere constructed by the state PHED and supplied free to the owners for boosting theproject. They are installed in line above the storage tank. In Tripura, small filters wereconstructed by the state government in collaboration with UNICEF and they are alsosupplied free of cost in some communities. Later on, these types of filters are constructedby local NGOs.
In the surveys conducted in these states in respect of rainwater used the following figuresof water use pattern by the people were observed. Actually the use of rainwater can be broadlycategorized for the rainy or wet season and the dry season or no-rain period.
Table 6.2 Use of rainwater
Purpose Wet Season Dry Season
For drinking 30 – 35% 24 – 32%
For cooking 90 – 96% 70 – 85%
For washing clothes 75 – 90% 55 – 65%
For washing utensils 85 – 95% 60 – 68%
For bathing 40 – 58% 0
For use in latrine 34 – 48% 18 – 30%
For livestock 50 – 90% 12 – 45%
For irrigation 30 – 60% NIL
The less use of rain water for latrine is due to the fact that many rural houses do not havelatrine inside their houses and they use jungle/bushes for defecation.
For drinking water, many people carry water from public hydrants or springs, thoughthey are located at long distances and nowhere, it was found that the people use directlyrainwater collected in the storage tank. Either they boil the water or use some water filteravailable in the market.
Only in Tripura in few houses, there is arrangement of adding bleaching powder solutionin the filter; though it is being done in a very irregular way.

100 Energy ManagementWater Management100
Operation and Maintenance
Rooftop catchment surfaces collect dust, organic matter and bird droppings, which can clogchannels, cause sediment buildup on the tank bottom apart from contamination of the storedwater. During periods of no rain, these materials are accumulated on the roof and they arewashed off with the first rain.
The following steps are necessary for proper maintenance of various components:
Roof: (i) Roof must be periodically cleaned out of dust, branches of trees, leaves, bird droppingsetc. (ii) Corrugated metal sheet requires to be painted preferably before each monsoon. (iii)Clay tiles are to be checked from time to time and broken tiles are to be replaced. (iv) Supportstructure of the roof is to be checked time to time.
Gutter System: (i) The gutter must be cleaned frequently to prevent overflowing duringheavy rains. (ii) The joints of the gutter should be checked periodically and made correct ifthere is a likelihood of leakage. The joints can be sealed with tar or rubber and the jointingcompound should not contaminate water. (iii) The slope of the gutter should also be checkedfrom time to time. (iv) Metal gutters are required to be painted when required. The support ofthe gutter should also be checked. This can be accomplished by tying wire around the gutterand fastening it the to roof (Fig. 6.2).
Storage Tank: The maintenance requirements of the tank will eventually depend on theeffectiveness of the first flush system and the frequency of roof and gutter cleaning.Contamination can be avoided by diverting the first 10 – 20 liters of rain from the tank. Flushtraps can be used to prevent the first flush from reaching the tank. In this case, the plastic pipeover the reservoir collects the first flush water from the roof and the removable end allowsdischarge after each rainstorm as shown in Fig. 1, (P20 IWWA).
Another important factor is the quality of the tank cover and screening on inlet and outlet.Sunlight reaching the water will promote algae growth. Unprotected openings will alsoencourage mosquito breeding. So, the following steps are necessary: (i) The inside of all tanksrequire periodic cleaning. The water should be scrapped annually. Vinegar, baking soda orbleaching powder solutions are commonly used as cleaning agents. (ii) Sediments should beremoved and walls should be scrapped annually. (iii) Care must be taken not to contaminatethe next volume of incoming storage water. (iv) If cracks in the tank wall are observed, theyshould be replastered after each cleaning of the tank surface. (v) After cleaning and afterdisinfections, the water should be allowed to enter. (vi) The tank cover should be checked fortightness so that mosquito and other insects cannot find entry inside the tank. (vii) The entrypipe and the overflow pipe should be checked for proper screening arrangements to prevententry of flies etc. (viii) Sheet metal tanks require to be painted periodically to prevent formationof rust.
Filter: Wherever filters are fitted over storage tank, they require frequent inspection, cleaningof the media and periodically flushing to prevent bacterial build up on the filter medium.However, in most instances the use of a filter is impractical due to the frequent maintenancerequired (Figs. 6.2 and 6.3).

101Energy Management Rain Water Harvesting 101
Instead of disinfecting all the water stored in the storage tank, it is desirable to disinfectonly that portion of water, which will be consumed for drinking and cooking. So coveredstorage vessel inside the house is required.
Fig. 6.2 Storage tank with flush trap.
Fig. 6.3 Schematic view of roof water harvesting system.
Quantification of the Roof Harvested Water
The amount of the water, which can be collected out of the total precipitation on a roof,depends upon the amount of rainfall, the area of the roof and the type of roof. There is nohard data generated as yet for the collection efficiency of various types of roofs. Table 6.3,which is based on educated guesswork, will give some idea about the collection efficiency.
C over
E a rthe r P o t filledw ith L im e
R a inw a te r Pipe
A irven t P ipe
U nde rg roundStorage tank(3 .0 × 2.20 × 1 .50 m )
R O O F
G utte r
F iller
P VC P ipe 75 m m D ia , 1 .2 m Long
R em ovable E nd C ap
W ash out va lve
30 cm
G L
100 cm
120 cm

102 Energy ManagementWater Management102
Table 6.3 Roof size for generating runoff of 10,000 liters in a locality having seasonal rainfall of 500 mm.
Estimated Collection Efficiency(as % of Precipitation)
1 Cement concrete 85 23.5
2 Tin sheets 75 26.7
3 Baked tiles 60 33.3
4 Thatch 40 50
Assuming an average rainfall of 500 mm and the per capita requirement of potable waterfor domestic use as 20 liters/person and family of five, the storage required to providerequirements for 100 days (summer season) is 10,000 liters. The roof area required for generatingthis amount of runoff in the case of roofs of different types is given in Table 6.3.
These calculations are for storage sump. The roof area is to be increased by about 30% incases where the harvested roof water is used for recharging the local aquifer. This is becauseonly about 70% of the recharged water can be recovered through pumping.
The roof area will proportionately increase or decrease if the local rainfall is less or morethan the 500 mm value used in this model calculation. In general, the non-monsoon periodrainfall amounts to 15% to 20% of the total annual rainfall. The rainfall value used for thecalculations in Table 6.5 is for the monsoon season. Any shortfall in the average annual rainfallby 15% to 20% will not therefore reduce the total runoff stored in the 10,000-liter tanks.However, it is advisable, especially in the case of low rainfall areas that the roof area be kept20-25% larger than that calculated using the average seasonal rainfall. Such a step wouldcompensate for the effect of low precipitation in drought years.
Examples of Roof Water Harvesting in Urban Areas
Roof water harvesting is coming into vogue in urban areas. The municipal authorities ofChennai have made it a mandatory requirement of building plans submitted for approval. Afew illustrative examples of roof water harvesting from individual buildings are described. Anintegrated approach is adopted for storing all the rainwater received by the building and theopen ground of a plot of land. Some of the roof water is stored in a sump and the rest isrecharged to the ground. The surface runoff from the open ground/lawn/garden within thecompound wall of a building is also diverted towards a recharge facility and this water, alongwith rainwater is transferred underground. A sediment trap and a filter bed are used forremoving the suspended particles and organic debris before the water is sent into an open wellor a bore well or a percolation pit. Figure 6.4 to 6.8 shows the various methods which can beused for transferring roof water or runoff water from the plot to a dug well/bore well/pit/soakway etc. (Ranade, 2000).
Example 1: The Centre for Science and Environment (CSE), New Delhi, is doing a laudablework in making our society aware of our society aware of our traditions of water harvesting,
Type of Roof Roof Size in m2Sr. No.

103Energy Management Rain Water Harvesting 103
and is also promoting this practice to alleviate water insufficiency. It is also engaged indemonstrating how water harvesting can be put into actual practice. The CSE building islocated on a 1000m2 plot. Residents are practicing both surface storage and recharge of therain endowment received on their plot since 1999, Figs. 6.4 to 6.8.
Fig. 6.4 Schematic diagram of water harvesting system at CSE, New Delhi (Renade, 2000)
Fig. 6.4 Shows map of the building and compound area of the CSE, New Delhi showingvarious components of an integrated water harvesting system (Ranade, 2000).
C heck bund
U nde r g roundw a te r tank
R echa rge troughunder front ga te
Storm w ater dra ins
The w a ter ha rv esting s ys temin the build ing
A bandoned borew e ll
S oak w ays
Fig. 6.5 Schematic diagrams of a recharge pits and a soakway (Ranade, 2000).
R C C sla bw ith m a nho le
F rom c atc hm en t
P erfo rate d/h oney co m b edb ric kw o rk
3 0 cm s filter m ed ia
F il ter bed su m p6 0 cm × 60 c m × 60 cm
B ore hole (1 50 - 3 00 m m dia)ca se d w ith s lo tted p ipe
B ric kb a t fi lte r m ed ia
2.5
- 5m
dee
p
1 .5 - 3 .0 m
R C C sla b w ithm a n ho le
10 m
dee
p

104 Energy ManagementWater Management104
Fig. 6.6 Recharging a dug well with run-off water (Ranade, 2000).
Fig. 6.7 Arrangement for percolation of water accumulated near a compound wall (Ranade, 2000).
Runoff
F ilter bed P erfora ted p ipe
R echa rge dugw e ll
Runoff
Perfo ra tedcove r
Brickbat fi ltermed ia
1 -
1.5
m
0.5 - 1 m
Fig. 6.8 Recharging a dug well with harvested roof water (Ranade, 2000).
Filtra tion tank
Filter bed
R echa rge dugw e ll

105Energy Management Rain Water Harvesting 105
The annual average rainfall in Delhi is 600 mm or 0.6 m. The total water endowment ofthe CSE premises is therefore 600,000 liters. They have used a combination of surface storageand various types of recharge devices such as an abandoned bore well and several soak ways.A soak way is a bore well having a diameter of about 30 cm and depth of 3 to 10m and is casedwith a perforated pipe. A soak way may be filled with filter media such as brick fragments,gravel and coarse sand. A small sump is built at the top of the soak way to prevent a gush ofwater in the soak way (Fig. 6.5). The annually harvested water quantity is estimated as 366,000liters or 65% of the received rainfall. CSE claims that during the last two monsoon seasons nota single drop of rainwater drained out from their premises, even after a heavy downpour. Wemay therefore assume that the remaining 35% of the endowment is used in soil moisturereplacement, evapotranspiration by garden plants, and natural recharge or evaporation loss.The total cost of installing the various units excluding cost of pre-existing underground watertank and pond is estimated at Rs. 36,000.
Example 2: Water-born bacteria and viruses are rampant during the monsoon season. Slumdwellers are particularly prone to cholera, diarrhea and other water-born diseases. Provisionof clean water is very important. Tamil Nadu chapter of the National Water Harvesters Networkhas developed a water harvesting structure of 3000 liters capacity on a tenement building inKuil Thotam, a slum area of Chennai, using a roof area of 1.85m × 1.85 m. Chennai has anannual average rainfall of 1200 mm and receives some rainfall every month. Some clean watercan get collected in the Sintex tank (Fig. 6.9). Over 1500 liters of water was collected in theSintex tank during the first few rain showers in actual practice. The harvested water wassubjected to laboratory tests and found to be of potable standard.
Fig. 6.9 Roof water harvesting system at a slump tenament in Kuil Thotam, Chennai (Khurana, 1999).
R a in w ate r p ipe
O p en spa ce
S an d
S m a ll P ebb leb ed
M e d iu m P eb b leb ed
F il trat ion Tan kD e ta il
F iltra tion Tank
R wate r p
ipe

106 Energy ManagementWater Management106
A commonly raised quarry by those intending to install facilities for recharging the harvestedwater is about the rate at which the runoff from roof or ground level will be accepted by thelocal aquifers. This is a difficult question to answer generally. The hydraulic conductivity (k)of soils or aquifer material is a key parameter, which varies very widely. For example, cleangravel has k values ranging between 1 and 100 cm/sec while the k value for sandy loam rangesbetween 0.003 to 0.005 cm/sec and that of clay can be less than 0.00001 cm/sec. Soils aremixture of gravel, sand, silt and clay whose proportions in the soil vary from place to place.The best way to know the infiltration rate is by a trial experiment. It is also advisable toprovide buffer storage Ranade type figure (Fig. 6.5). This will ensure that the runoff after aheavy storm does not overflow the recharge pit.
Examples of Mass Scale Urban Harvesting
Case of Aizawl, Capital of Mizoram, N E, India: The public water supply system of Aizawl,capital of Mizoram state in N E, India, comprise lifting water from the Tlawng River. It iscapable of supplying water to 80,000 people at the rate of 135 lpcd. However, this is quiteinadequate to meet the needs of the present population, which has doubled. Some of thenewer localities are not even connected to piped water supply system. The houses in Aizawltraditionally have sloping galvanized iron sheets as roofs. These are used for rainwaterharvesting. About 10,000 houses have constructed such structures to alleviate the uncertaintyof year round supply. The annual average rainfall at Aizawl is 2500 mm. A 50m2 roof area caneasily produce enough runoff to store 10,000 liters which can be used during the summerseason (120 days) by a family of 8 persons at the rate of 10 lpcd. The storage tanks are made ofRCC, ferrocement or plastic (Dunglena, 2001).
Case of National Capital Territory (NCT) of Delhi: If roof water harvesting of the type mentionedabove can be undertaken on a large scale in an urban metropolis, then it can make a substantialimprovement in the status of year round availability of potable water. The present water requirementof Delhi is about 3324 million liters/day while installed capacity is about 2634 mld (Ranade, 2000).The supply is approximately 80% of the demand with a shortfall of about 790 mld.
Sharma and Sharma (2000) have carried out a multi-spectral analysis of satellite data toestimate the roof area available for rainwater harvesting in Delhi city, Delhi state and theNational Capital Territory region. These authors estimate 66.5 sq. km as the rooftop area ofDelhi amenable to harvesting. This works out to around to around 35% of the city area. Thetotal of rainwater that can be harvested from this roof area is estimated as 39 mcm, 80% ofwhich can be recharged to groundwater. The additional quantity thus made available throughroof water harvesting is about 88 mld, which is 11% of the daily requirement.
6.4 WATER HARVESTING BY PONDSThe traditional practice of collecting rainwater in village ponds suffers from following limitations:
1. Large open surface is subjected to high rate of evaporation losses.2. Large bed area effecting high seepage losses.

107Energy Management Rain Water Harvesting 107
In spite of limitations, the village ponds, the bulk water requirement for half the year is metfrom them. Small groundwater mound formed under the pond bed, used to partially supplythrough wells dug in the pond bed. This traditionally practiced rainwater-harvesting structureserved water supply since ages. During scarcity years, some deepening of ponds is made, but it isbeing done on a haphazard manner, does not help much.
Pond Lining
The limitations of the traditional ponds, especially the quality deterioration and seepage lossescould be completely stopped by using plastic membrane. The simple technique has provedeffective. The evaporation loss could be checked by use of chemical retardants and adoptingsystem of multiple ponds system (compartments). Limitation of the depth factor has to beaccepted and required storage could be built by increasing the length and breadth of the pond.Of course, the places where salty water table is at greater depth, pond storage can be increasedeven with less open surface, and thereby reducing the evaporation loss. Such favorable locationsmay not be provided with plastic lining, provided the rate of salt contamination from sedimentsis within limits. Plastic lining is a rather costly proposition, however, it envisages the use oflocal water resources and regular maintenance is almost negligible.
This technology involves lining of the walls and floor of the pond, tank reservoir withtough, wide-width low-density polyethylene (LDPE) film. These LDPE films are available inwidths of 4 to 12 m and thickness 100 to 250 microns. These films meet specifications as perIS: 2508 – 1984. This film has excellent water barrier properties, very good blend of physicalproperties such as tensile impact strength coupled with good weatheribility and chemicalresistance properties. These films also prevent the inherent salinity of the soils and salinegroundwater from seeping into pond or tank and starts contamination. The construction ofplastic lined pond includes excavation work, screening work for removing big boulders andsharp-edged gravel, which could damage the plastic film, dressing of sides and beds so thatlining is not punctured, laying plastic film on beds and sides, brick lining on the sidewalls, soilfilling on the floor, inlet system and distribution system. At present, 19 villages of Bhal area ofGujarat have 20 such plastic lined ponds (Fig. 6.10).
Fig. 6.10 Water harvesting by means of brick and plastic lined ponds.
M onson
W in te r
S um m erLaye r ofB lac k S o il
B rick lin ingL .D .P.E . F ilmlay er

108 Energy ManagementWater Management108
6.5 WATER QUALITY CONSIDERATIONAlthough, the stored rainwater will not always meet WHO standards, it frequently does so,and generally speaking it is of far higher quality than most of the traditional sources and manyof the improved water sources found in the developing countries (Gould, 1991).
Roof catchment system can provide good quality of rainwater; clean enough for any one todrink, so long as the points discussed are incorporated. Roofs should be very clean that willnot add pollutants to the water. These should also be free from overhanging trees since theseprovide sanctuary for birds and animals, which could defecate on the roof and thus contaminatethe rainwater. The cistern should be securely covered to prevent the entry of dirt, animals andlight, all of which contribute to biological contamination (Latham & Gould, 1986). Provisionshould be made for cleaning the cistern on a regular basis. Implementation of a filtration unitat the entrance of the cistern may help to improve the quality of water.
A study of cisterns rainwater quality carried out in the West Bank, examined its chemicaland biological contamination. Samples from 500 cisterns were collected, tested and analyzedthree times during the study.
The chemical analyses included the determination of the concentration of major cations(calcium, magnesium, sodium, potassium) and anions (chloride, carbonate, bicarbonate). Theanalyses also included measurement of pH, electric conductance, total dissolved solids, andtotal hardness. The results of chemical analyses are presented in Table 6.4. The analysesrevealed that none of chemical constituents exceeded WHO standards with the exception ofsome high and low values of some parameters. This means that, chemically, the cisterns wateris of high quality and very suitable for drinking and domestic purposes.
Table 6.4 Results of the chemical analysis of cistern water samples
Constituents WHO standards Concentration Observed in (mg/l)
(mg/l) Minimum Maximum Average of 500
pH 6.5 – 9.2 7.50 9.00 8.10
EC (µ mho/cm) <250 0.17 1.20 0.45
TDS 200 – 500 80.00 560.00 237.50
TH 200 – 500 70.00 423.00 182.60
Calcium 75 – 200 18.10 94.60 45.10
Magnesium 50 – 150 1.00 92.00 20.80
Sodium 100 – 200 5.00 41.00 11.00
Potassium 0 – 10 1.00 12.00 3.30
Chloride 200 – 600 18.00 138.00 41.70
Carbonate 0 – 50 1.20 67.20 21.10
Bicarbonate 0 – 500 41.60 315.50 146.90

109Energy Management Rain Water Harvesting 109
The study of biological contamination was limited to the investigation of the presence oftotal coliforms. Samples from 500 rainwater cisterns were tested. 135 out of 500 samplescontained coliforms and 365 samples contained zero coliforms. The total coliform colony countsrevealed through sample testing are presented in Table 6.5. It reveals that 27% of the cisternswater in the West Bank is contaminated by coliforms and did not meets WHO drinking waterstandards, while 73% is not contaminated and meets WHO drinking water standards. Despitethis finding, it may still be concluded that cisterns water in general is safe and of good qualityfor drinking and domestic uses.
Table 6.5 Total coliform counts in 100 ml samples of cistern water in the West Bank
Total coliform counts Total number % Total numberin 100 ml samples of samples of samples
0 365 73.0
1 – 10 25 5.0
11 – 20 38 7.6
21 – 30 30 6.0
31 – 40 17 3.4
41 – 50 10 2.0
>50 15 3.0
Total 500 100.0
Operation and maintenance of rainwater roof catchment system is the family’sresponsibility and this is the most advantageous side of the rainwater roof catchment system.In the beginning, there may be little difficulties and after sometimes they gain experienceespecially in the use of water; lessons learned during the first year’s dry season about correctwater use would likely be used in subsequent years. If the tank runs dry during the dryseason, it is possible that water is being used for purpose other than what it was intendedfor. The user must be aware of the dangers of using too much water too early in the dryseason. It is the project’s responsibility to ensure the householder is fully aware of the usesof rainwater before the first dry season arrives. Water shortage during the dry season, can beavoided by making sure the tank is full at the end of the wet season and the calculatedminimum demand remains constant throughout the year. It is recommended that watercollected from a thatched or leaky roof be used for livestock consumption, irrigation use orfor flushing toilets. It will be a good idea to set up a programme of inspection and repair ofsystems. This should include education for the user and training of local technicians tocarry out repairs. Local authorities should encourage maintenance and organize inspectionfrom a central agency.
The project developer must determine the extent of community needs. This must be donein the light of traditional practices within the community. The role of women and the childrenin carrying water and the amount of time spent in this activity should be examined. Particularly,

110 Energy ManagementWater Management110
the women can help in mobilizing support for the rainwater collection system raising theinitial capital. Women and children also can contribute most of the labour. The engineer shouldcollect information on existing catchment technologies and discuss the community theusefulness of water supplied by a roof system. The community’s need for communal versusindividual catchment system should be evaluated.
The project engineer must also compile a resources inventory of local skills, materials andexperience that can be used in rainwater roof catchment system. Materials, which are easy toobtain by local people who know how to work with the materials, will result in a rooftopsystem that is cheap and simple to build and repair. To make the system widespread, some sortof financial help is to be given to the villagers. This can be in the form of subsidy or lowinterest loan. The Government or local societies can come forward for this so that the wholeburden is not put on the beneficiary itself.
Rainwater collection system, though implemented in many parts of north – eastern states,is not gaining popularity because the owners do not properly maintain the system. Thewater collected in this system is not of standard quality and mainly used for other purposesexcept drinking and cooking.

77777 ARTIFICIAL RECHARGEARTIFICIAL RECHARGEARTIFICIAL RECHARGEARTIFICIAL RECHARGEARTIFICIAL RECHARGEMETHODSMETHODSMETHODSMETHODSMETHODS
7.1 INTRODUCTIONThe term Artificial Recharge refers to transfer of surface water to sub-surface aquifers throughhuman intervention. Augmentation of groundwater resources through artificial recharge canbe considered as an activity, which supplements the natural process of recharging the aquifersthrough percolation of a fraction of the rainfall through the soil to the water table. Artificialrecharge thus becomes relevant in a situation witnessed by India, where the rainfall is seasonaland is not spread uniformly over the year and quantum of natural recharge is inadequate tomeet the increasing demand on groundwater resources.
7.2 NATURAL RECHARGE MEASUREMENTS IN INDIANatural recharge measurements carried out in about 20 basins, well distributed over the variousclimatic and geomorphic zone obtaining in the country, suggest that about 5 to 10 percent ofthe seasonal rainfall is contributed as annual recharge in the peninsular hard rock regions,whereas in the alluvial areas, about 15 to 20 percent of the rainfall is contributed to groundwater(Athavale, 1992). The natural recharge process is seasonal nature, but the exploitation ofgroundwater is continuous and is increasing every year. Groundwater exploitation in Indiahas increased with leaps and bounds and the number of shallow wells has increased rapidlyover the past 40 years. The growth of groundwater abstraction structures from 1950 to 1990clearly depicts the increasing use of groundwater utilization in agricultural sector.
As a result, many areas in the country are showing signs of over-exploitation. In severalareas, the withdrawal of groundwater is in excess of the annual input through natural rechargeand this is manifested through lowering of water table, drying of wells and deterioration inquality. The effects of overexploitation become more apparent in hard rock covered droughtprone areas. In several thousand villages and some urban locations, the drinking water demandin summer is met through water tankers.
Artificial recharge can be used in such situations to augment the groundwater reserves bytransferring the surface water to the aquifers during the monsoon months and using this waterin summer months. At present, a large percentage of the precipitation is lost to sea throughrunoff or is lost through evaporation from surface storage structures. Artificial recharge can also

112 Energy ManagementWater Management112
be used for improving the quality of groundwater in areas where it is brackish or contains toxicchemicals such as fluoride and arsenic, in concentrations above their permissible limits.
7.3 CONCEPT OF ARTIFICIAL RECHARGEArtificial recharge projects are designed to serve one or more of the following purposes.
1. Maintain or augment the natural groundwater as an economic resource.2. Co-ordinate operation of surface and groundwater reservoirs.3. Combat adverse conditions such as progressive lowering of groundwater levels,
unfavorable salt balance and salt-water intrusion.4. Provide subsurface storage for local or imported surface water.5. Reduce or stop significant land subsidence.6. Provide a localized sub-surface distribution system for established wells.7. Provide treatment and storage for reclaimed wastewater for subsequent reuse.8. Conserve or extract energy in the form of hot or cold water.
7.4 METHODS OF ARTIFICIAL RECHARGEArtificial recharge may be defined as the planned activity of man whereby surface water fromstreams and lakes is made to infiltrate to the ground, commonly at rates and in quantities manytimes in excess of natural recharge. Increasing water demands require more storage of water intimes of water surplus for use in times of water need. Traditionally, this has been achievedthrough dams. However, dams have finite life because of eventual structural failure andsediment accumulation in the reservoir. Also, good dam sites are becoming increasingly scarce,not possible in flat areas; they lose water by evaporation and can also have adverse environmentaland socioeconomic impact. If water cannot be stored above the ground, it must be storedbelow the ground, via enhanced or artificial recharge of groundwater.
Recharge
Artificial recharge of groundwater can be achieved with surface infiltration system (basins,spreading facilities), wells trenches, pits, shafts etc. Surface infiltration systems require theavailability of adequate land with permeable soils, vadose zones without restricting layers thatproduce excessive perched mounds and unconfined aquifers of sufficient transmissivity toprevent undue occurrence of groundwater mounds. Also, Vamoose zones and aquifers shouldbe free from undesirable chemicals (contaminated areas, pollution plumes) that can movewith the recharge flow system to where they are not wanted.
Where suitable conditions for surface infiltration systems do not exist or aquifers are confined,recharge can be accomplished with wells, pits or shafts. Water source for recharge include anyexcess surface water from streams, irrigation canals, aqueducts and storm water runoff.
For unpolluted water, the only pretreatment that may be necessary before infiltration issediment removal, as it can be accomplished with pre-sedimentation basins (with or withoutuse of coagulants) or vegetative filtration in overland flow type systems.

113Energy Management Artificial Recharge Methods 113
Sustainability
Recharge systems using clean water should be completely sustainable. Clogging of the surfacewhere infiltration takes place will occur because of biological activity and/or accumulation ofsuspended solids. For surface infiltration systems such clogging can readily be remedied byperiodic drying and cleaning of the infiltration system (removing the clogging layer by shavingor scraping the surface). For well recharge, remedy of clogging is more difficult and adequatepretreatment of the water is necessary to prevent clogging as much as possible. Frequent pumpingof the recharge well (5 minutes each day, for example) to reverse the flow may prevent ordelay clogging. Periodic redevelopment of the well by surging, jetting or other techniques maykeep well clogging under control.
Considerations
The type of the artificial recharge system that can be developed at any specific site is controlled,to a large degree, by the geologic and hydrologic conditions that exist at that site.
Site selection criteria, in addition to economic considerations, should include at least thefollowing:
(1) Source of recharge water(2) Chemical and physical characteristics of the recharge water(3) Availability of an aquifer suitable for artificial recharge(4) Thickness and permeability of the material overlying the aquifer, if any(5) Thickness and permeability of the aquifer(6) Chemical characteristics of water in the aquifer(7) Proximity of the potential recharge site to an appropriate well field cone of depression(8) Water level differences between the aquifer and the recharge site(9) Topography
Mainly there are three main categories of artificial recharge as listed below.
(A) Direct methods.(B) Indirect methods.(C) Incidental methods.
(A) Direct Methods: Direct methods of recharge can further be subdivided into two maincategories as surface methods and sub-surface methods.
A – I: Surface Methods: In this method of recharge, water is applied on the permeable groundsurface where it infiltrates into the unsaturated zone to reach slowly the undergroundwatertable. Surface techniques, especially spreading techniques of artificial recharge are most widelyused because of their economy and easiness in operation. Various types of spreading techniquesare as follows:
• Basins• Furrows and ditches
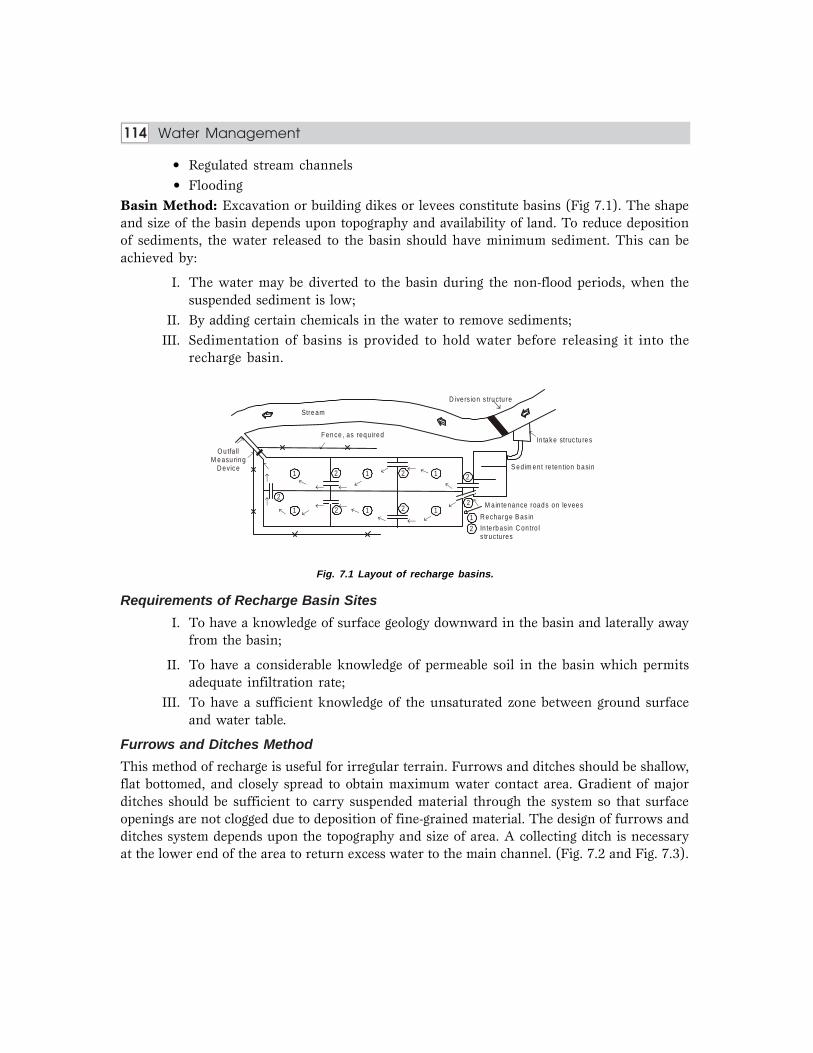
114 Energy ManagementWater Management114
• Regulated stream channels • Flooding
Basin Method: Excavation or building dikes or levees constitute basins (Fig 7.1). The shapeand size of the basin depends upon topography and availability of land. To reduce depositionof sediments, the water released to the basin should have minimum sediment. This can beachieved by:
I. The water may be diverted to the basin during the non-flood periods, when thesuspended sediment is low;
II. By adding certain chemicals in the water to remove sediments;III. Sedimentation of basins is provided to hold water before releasing it into the
recharge basin.
2 1
1
1
1
1
1 2
2
2
2
→→
→
→
→
→
→→
→ → →
→→
→
→
→
→
→→
→
→
→
→
2
2→
→
1
2
Stream
D ive rs ion s tructure
Fence , as required
O u tfa llM easu ring
D evic e
In te rbasin C on tro ls tructu res
M a in tenance roads on levees
R echa rge B as in
S ed im ent re ten tion basin
In take struc tu res
→
Fig. 7.1 Layout of recharge basins.
Requirements of Recharge Basin Sites
I. To have a knowledge of surface geology downward in the basin and laterally awayfrom the basin;
II. To have a considerable knowledge of permeable soil in the basin which permitsadequate infiltration rate;
III. To have a sufficient knowledge of the unsaturated zone between ground surfaceand water table.
Furrows and Ditches Method
This method of recharge is useful for irregular terrain. Furrows and ditches should be shallow,flat bottomed, and closely spread to obtain maximum water contact area. Gradient of majorditches should be sufficient to carry suspended material through the system so that surfaceopenings are not clogged due to deposition of fine-grained material. The design of furrows andditches system depends upon the topography and size of area. A collecting ditch is necessaryat the lower end of the area to return excess water to the main channel. (Fig. 7.2 and Fig. 7.3).

115Energy Management Artificial Recharge Methods 115
Fig. 7.2 Furrows and ditches method.
G ate AndM easuring
D evic e
D ive rs ion Structu re
Stream M easuring D evic e
C o llectingD itch
D itc h C u tle ts I f R e qu ired
D itch N
o. 2
Ditc
h N
o . 3
Ditc
h N
o. 4
Ditc
h N
o . 5
Ditc
h N
o . 6
Di tc
h N
o . 7
S upply D itchW ire B ound C hec k D am s as R equired
P rev ail in g G ro und Slope G ene ral ly G rea ter Th an 3%
Ditch No . 1
She
et F
low
A lte rna tive D ivers ionas R equ ied
S upply D itch
O rig ina l G roundw ater TableD ra in
D itch
Fig. 7.3 Artificial recharge using ditches and drains.
o rig ina lg roundw a te rtab le
circ u la r battery o f w e lls
2ρL L
Q 0
n
r
H
Q 0Q 0
n
H 0
s 0
2w
s0 q 0
galle ry
o rig ina lg roundw te rtable
q 0q0
q 0
2q0
LL
H
z
H 0
Fig. 7.4 Artificial recharge with parallel ditches and drains.
Fig. 7.5 Artificial recharge with a spreading pond surrounded by a concentric battery of wells.

116 Energy ManagementWater Management116
Stream Channel Method: (Figs. 7. 6 & 7.7)
The object of this method is to extend the time and area over which water is recharged from anatural influent channel. It requires upstream storage facilities to regulate stream flows and toenhance infiltration. The flow rate of the water should be such that it should not exceed theabsorptive capacity of downstream channels. Different types of stream channel include:
• Widening, leveling or scarifying a bed of channel,• Permanent low check dams,• Temporary low check dams of stream bed materials,• L – shaped finger levees.
Fig. 7.6 Patterns of furrows and ditches system.
Fig. 7.7 Stream channel modification method.
7.5 THEORY OF ARTIFICIAL RECHARGE BY SPREADINGAs a variant of induced recharge, the most likely set-up of an artificial recharge scheme consistsof a series of spreading ditches and infiltration galleries arranged alternately at equal intervals,as shown in Fig. 7.3. For unconfined aquifers pervious up to the ground surface, this set-up
B . D O N D R IT E D ITC H PATT ER N
D S . D ive rs ion Structure C . C O N TR O U R D IT C H PAT TE R N
A . LAT ER A L B ITC H PATTR E N
Stream
C ontro l D itc h
D S
D S
D S
Stre
am
Stream
H O O K LE V E E
Path o f Flow
o f Wate r
Rive
r Flo
w
R iver Bank
R ive r Bank
FIN G ER B IK ES

117Energy Management Artificial Recharge Methods 117
offers few difficulties. With slight modifications, it may also be applied for artesian aquiferswhen the confining layer on top is thin. For confined aquifers covered by thick deposits of lesspervious material, recharge must be accomplished by injection wells, having their own problemand possibilities. The simplest construction of parallel spreading ditches and infiltration galleriesis shown in Fig. 7.4, where the coefficient of transmissivity, kH, of the aquifer as well as themaximum allowable drawdown, So, are determined by the local geo-hydrological conditions.The other factors indicated in this figure, q0, L and w, must be chosen such that the purposesof the recharge scheme are fulfilled, that is to say, an adequate detention time of the rechargewater in the sub-soil and no rapid clogging of the spreading basins. When it is provisionallyassumed that both the spreading basin and the gallery for groundwater recovery fully penetratethe saturated thickness of the aquifer, these requirements may be formulated mathematically as
(a) detention timeT = pHL/q0 or q0 = pHL/T
(b) drawdownS0 = [q0 / (kH)] L or q0 < kHSo
(c) entry rateve = q0 / w or q0 < ve w
The last requirement can always be satisfied by increasing the width of the spreadingbasin, while the first two requirements give as length and flow rate
L = kS T/ p q (H/ T) kS pT H kSo o o o= = P T/
With shallow aquifers composed of fine sand, H and k will be small, calling for a shortlength and a low flow rate, which can best be accomplished with the scheme of Fig. 7.3.With deep aquifers built up of coarse sand and high values of H and k, the length and, inparticular, the flow rate may be much greater. The scheme of Fig. 7.3 may again be used, butin plan it tends to be rather square, leading more or less automatically to the recharge schemeof Fig. 7.5, here consisting of a spreading pond surrounded by a circular battery of wells forrecovery of groundwater.
Spreading in shallow phreatic aquifer: The design procedures to be used in this case canbest be demonstrated with an example (Huisman, 1985). Consider an aquifer composed of finesand with a coefficient of permeability k = 0.12 × 10⁻³ m/s, a porosity p = 0.38, a saturatedthickness, Ho, before spreading of 15 m, a maximum allowable rise of water table equal to S0 =2 m, giving together an average saturated thickness during spreading of H = 16 m. A capacityQ0 = 30×106 m3/year or 0.951 m3/s is sought, with a detention time T = 8 weeks or 4.84 ×10⁶ s and a maximum allowable entry rate ve = 0.4 m/day or 4.63 × 10⁻⁶ m/s. This gives aslength and flow rate (Fig. 7.4).
L = 012 10 2 4 84 10
0 38
6. ..
–3× × × ×= 55.3 m

118 Energy ManagementWater Management118
q0 = 16012 10 2 0 38
4 84 106
. ..
–3× × ××
= 69.5 × 10⁻⁶ m3 m–1 s–1
The width of the spreading basin thus equals
2w = 2 69 5 10
4 63 10× ×
×.
.
–6
–6 = 30.0 m
and the combined length of the spreading basins
B = 0 951
2 69 5 10.. –6× × = 6840 m
the total area between the infiltration galleries equals
A = 6840 × [30.0 + (2 × 55.3)] = 0.962 × 10⁶ m2
This area could also have been calculated directly:
A =
+
= (0.757 × 10⁶) + (0.205 × 10⁶) = 0.962 × 10⁶ m2
The amount of water in dynamic storage, that is, in the pores of the formation between theoriginal and the present water table is
V=p S0 (L + 2w) B, of which a fraction, µ/p, can be used. With, for instance, µ = 0.25and the other factors as assumed before,
V = 0.25 × 2 × (55.3 + 30.0) × 6840 = 0.292 × 10⁶ m3, allowing an interruption in thespreading operations for a period, t = V/Qo = (0.292 × 10⁶)/0.951 = 0.307 × 10⁶ s or 3.6days.
This period will seldom be adequate to let a wave of polluted river water pass the point ofintake. The calculations given above have the attraction of being simple and straight forward,but they have strongly simplified reality, demanding at this point a number of corrections. Thefirst simplification is the assumption of a constant saturated thickness, H, in the calculation ofthe drawdown, So
So = [qo/(kH)]L = 2.0 m
Taking into account the variations in water table elevation as well as the recharge byavailable
rainfall, P (say 400 mm/year or 12.7 x 10⁻⁹ m/s), with the notation of Fig. 3a, the
following as a correct calculation
(H0 + S0′)2 – H0
2 =
–
and for the case under consideration S′0 = 2.01 m, a negligible difference compared withthe value of 2.0 m originally assumed.

119Energy Management Artificial Recharge Methods 119
The second simplified concerns the assumption that the spreading ditch fully penetratesthe saturated thickness of the aquifer and does so over a width 2w. To correct this, the spreadingditch is first replaced by a fully penetrating one of zero width, increasing the flow length by anamount w and giving an additional drawdown
∆S1 = +
w= 0.51 m
Replacing this ditch by the real one gives, the additional drawdown as
∆S2 = π
ln
+
= –0.21 m
together
∑ = 2.01 + 0.51 – 0.21 = 2.31 m
The third simplification involves the finite length of the spreading ditch. When the areaavailable has a more or less square plan, the total length of the spreading ditches, calculated at6849m, must be broken up into 6 units, each of a length B = 1140 m. This gives a ratio of Bover L equal to 1140/55.3 –~ 20 and, a weighted average reduction in drawdown by a factor of
16
(2α2 + 4α3) = 1.04, thus ΣS0 = 2.31/1.04 = 2.22 m
When the increase in drawdown from 2.0 to 2.14 m is not acceptable, the foregoing calculationsmust be made a new, starting from a value of S0 equal to 1.85 m, as indicated in Fig. 3a. Thepiezometric level inside the gallery is less than that which corresponds with H0 = 15 m, but thisdoes not affect the groundwater tables outside the recharge area. With a number of spreadingditches parallel to one another, the capacity of the gallery equals 2 × 69.5 × 10–6 = 139 × 10–6 m3
m–1 s–1, giving for a circular drain of 0.5 m outside diameter the additional drawdown due to partialpenetration as
∆S =π
ln
Ω =
139 100 12 10
××
–6
–3( . )π ln
150 5π ×
FHG
IKJ.
= 0.83 m
to which must be added the entrance resistance caused by clogging. Finally, it should be notedthat, at the outset of the calculations, a spreading ditch fully penetrating the saturated thicknessof the aquifer over a width 2w has been assumed. Replacing this ditch by the real one slightlylowers the minimum detention time, but with regard to the improvement in water qualityduring underground flow, this decrease is more than compensated by an increase in averagedetention time, roughly by a factor (L+w)/L to 6.2×10⁶s or 10 weeks.
Spreading in deep phreatic aquifer: The difference in spreading operations for deep andshallow aquifers is not a principal one, but only concerns the layout of the spreading area.Again, this can best be clarified with an example, assuming in this case that Qo = 30 × 106 m3/year = 0.951 m3/s, k = 0.4 × 10⁻³ m/s, p = 0.38, µ = 0.32, ve = 5 cm/h = 13.9 × 10⁻⁶ m/s,
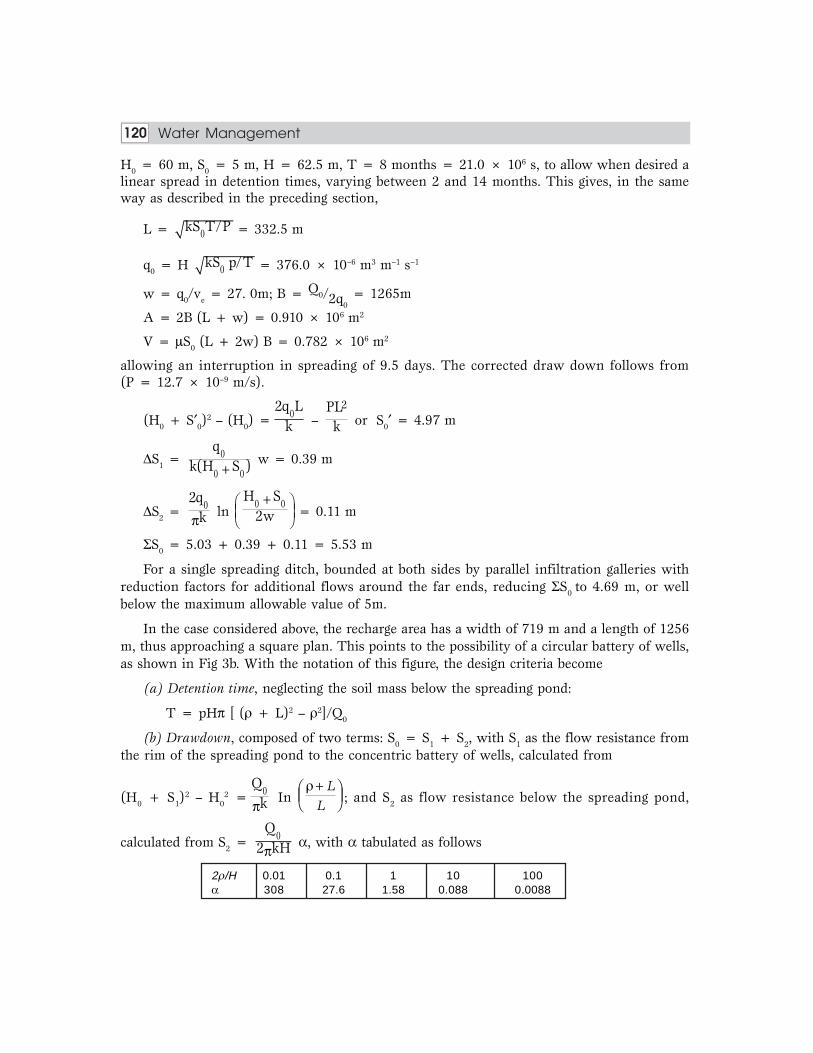
120 Energy ManagementWater Management120
H0 = 60 m, S0 = 5 m, H = 62.5 m, T = 8 months = 21.0 × 10⁶ s, to allow when desired alinear spread in detention times, varying between 2 and 14 months. This gives, in the sameway as described in the preceding section,
L = = 332.5 m
q0 = H = 376.0 × 10⁻⁶ m3 m–1 s–1
w = q0/ve = 27. 0m; B = Q0/2q0 = 1265m
A = 2B (L + w) = 0.910 × 10⁶ m2
V = µS0 (L + 2w) B = 0.782 × 10⁶ m2
allowing an interruption in spreading of 9.5 days. The corrected draw down follows from(P = 12.7 × 10⁻⁹ m/s).
(H0 + S′0)2 – (H0) =
–
or S0′ = 4.97 m
∆S1 =
+ w = 0.39 m
∆S2 = π
ln +
= 0.11 m
ΣS0 = 5.03 + 0.39 + 0.11 = 5.53 m
For a single spreading ditch, bounded at both sides by parallel infiltration galleries withreduction factors for additional flows around the far ends, reducing ΣS0 to 4.69 m, or wellbelow the maximum allowable value of 5m.
In the case considered above, the recharge area has a width of 719 m and a length of 1256m, thus approaching a square plan. This points to the possibility of a circular battery of wells,as shown in Fig 3b. With the notation of this figure, the design criteria become
(a) Detention time, neglecting the soil mass below the spreading pond:
T = pHπ [ (ρ + L)2 – ρ2]/Q0
(b) Drawdown, composed of two terms: S0 = S1 + S2, with S1 as the flow resistance fromthe rim of the spreading pond to the concentric battery of wells, calculated from
(H0 + S1)2 – H0
2 =π
In ρ +F
HGIKJ
LL
; and S2 as flow resistance below the spreading pond,
calculated from S2 = π
α, with α tabulated as follows
2ρ/H 0.01 0.1 1 10 100α 308 27.6 1.58 0.088 0.0088

121Energy Management Artificial Recharge Methods 121
With sufficient accuracy, α may be calculated fromα = exp (0.415 – 1.29x + 0.004 x2 + 0.0073 x3) with x = ln (2ρ/H)
(c) Entry rate
ve = Q0 /(πρ 2)With the same data as used in the example above, this gives
(c) ρ = 147.6 m(a) L = 390.4 m
(b) S1 = 7.67 m
S2 = 1.28 m
S0 = 8.95 m
The value for So is much larger than the maximum allowable value of 5.0 m. To remedythis situation, the value of ρ is increased to 285 m, producing
(a) L = 306 m
(b) S1 = 4.44 m
S2 = 0.58 m
S0 = 5.02 m
This value for S0 is close enough to the maximum allowable value of 5.0 m to be acceptable.With regard to the entry rate, a full pond of 285 m radius is not necessary and may be replacedby a circular ditch with an outer radius of, again, 285 m and a width of 41.2 m only.
The total area occupied by this circular scheme equals π (285 + 306)2 = 1.097 × 10⁶ m2 or21% more than with the rectangular one. The amount of water in dynamic storage now equals
V = µ S0 π ρ2 µ πρ
ρ
S rdrL
2
+
z
with, approximately, S =S0 ln L r
L
++
ρρ ρ
b gb g
/
ln /
This gives
V = µS0π L
L
++
ρ ρρ ρ
b gb g
2 2
2
–
ln /
and in the case under consideration V= 0.927 × 10⁶ m3, allowing an interruption in operatingoperations of no less than 11.3 days.
As a regards the pumping equipment of the wells for groundwater recovery, the additionaldrawdowns of point abstraction and partial penetration should be taken into account. With

122 Energy ManagementWater Management122
say, 40 wells, the individual capacity equals 23.8 × 10⁻³ m3/s and the intervals between wells99 m. With a screen length of 20 m (p = 20/60 = 0.333) and an outside diameter of the gravelpack of 2r0 = 0.60 m, this gives
∆Spa =23 8 10
2 0 4 10 6099
2 0 3.
.ln
.
–3
–3
×× × × ×
FHG
IKJπ π = 0.63 m
∆Spp =23 8 10
2 0 4 10 601 0 333
0 3331 0 333 20
0 30.
.– .
.ln
( – . ).
–3
–3
×× × ×
×LNM
OQPπ = 1.20m
to which must still be added the additional resistance caused by clogging of the well screenand gravel pack.
7.6 CHECK DAMA check dam is essentially a masonry or concrete overflow type barrier constructed across thestream having well defined banks with flatter bed gradient. The stream generally has a goodbase flow after the rainstorm.
Mainly check dams are of two types: (i) Gated Check Dam, and (ii) Non-Gated CheckDam. In gated type check dam, the barrier wall has slot openings, which allows storm floodwith silt to facilitate easy discharge of flood during initial period of monsoon. After two orthree storms plates are placed in the slots. Silt is removed after every four to five years in orderto improve the percolation rate through streambed. Now a days fiber reinforced glass plasticgates are used because steel gates are liable to rusting action and cement-concrete blocks aretoo heavy to operate.
In non-gated type check dams simple masonry weir is constructed across the stream. Theheight of the dam is kept low so that storm flood is contained within the banks. To enhancepercolation and to increase reservoir storage, regular desilting of check dam is necessary forthis type of structures. The dam storage percolates down to create recharge mound, which isrecovered for irrigation use. To take greater advantage of the stream flow, many times a seriesof check dams are constructed all along its course. (Fig. 7.8)
7.7 PERCOLATION TANKA percolation tank is generally constructed in low-level wasteland or a small drain. It has welldefined catchment and spillover is diverted to a nearby natural drain. It consists of earthenembankment and an overflow type masonry waste weir. Permeable formation in the reservoirbed is an essential requirement of percolation tank. The tank acts as storage of interceptedrunoff, which percolates down to phreatic aquifer creating a recharge mound. The percolationtime depends upon the permeability of bed formation. Normally it is expected that betweentwo consecutive rain spells, most of the storage percolates down. This, during 2 to 3 rainfallcycles, the actual recharge gain is two to three times the storage capacity of the tank. Theshape and size of the recharge mound depends on the nature of phreatic aquifer underlyingthe surface. This type of recharge structure is useful in area having sandstone and limestoneformation underlying (Refer Fig. 7.9).

123Energy Management Artificial Recharge Methods 123
Fig. 7.8 Construction of check dam across the stream.
Fig. 7.9 Schematic diagram of percolation tank.
Tank is a general term used for surface water storage of moderate size. The storage mayhave come into being due to interception of rainwater in a natural depression or a man-made excavation. Such waterbodies are popularly called ponds. Alternatively water storagemay be done by closing the openings of a natural saucer shaped landform by constructingbunds sized embankments. The storage so constructed is called a tank. The tank bundsare mostly constructed with earth to keep cost of construction low and commensuratewith the benefits envisaged.
S TR E AM
C ontro lling G ate
Feede r C ana l
E a rthen Bund
W ell
S eepage
P LAN
E arthen BundW ater Level
P e rm eab le B ed
C R O SS -S E C TIO N S eepage
W ell
w e ll P LAN
F lo w
H .F.L
M a x W a te r Le ve l
N O N -G ATE DC H E C K D AM
P erv io u s B edS eepa g e
C R O SS -S E C TIO N
F lo w
S lot fo r O pen in g
P LAN
C ATE DC H E C K D AM
S eepa g e
w e ll
w e ll
S eepa g e
C R O SS -S E C TIO N
P erv io u s B ed
M a x W a te r Le ve l

124 Energy ManagementWater Management124
Water storages of large size not called tanks but they are referred to as reservoirs. Such reservoirsare formed in the river valleys by constructing a barrier or a data using masonry, concrete or earthdepending upon site conditions. Technically bund is a miniature form of a dam.
Due to simplicity in construction it was a very popular mode of conserving rainwater. InSouth India where river flows are monsoon fed tank assumes special importance. In the plainsof Uttar Pradesh, West Bangal and Orissa as also on the plateaus of Madhya Pradesh tank canbe extensively practiced.
7.8 CLASSIFICATION OF TANKSRoughly bunds with less than 12 meters height create tanks. From the consideration of heightof bunds, up to 4.5 meters height bunds generate small tank. Medium tanks are formed bybunds up to 9 meters height. It may, however be remembered that this classification is veryapproximate because shape and size of the tank is not dependent on the height of the bundalone. It is equally affected by the topographical features of the region.
Network of Tanks
The tank system may exist with each tank as a separate entity or in the form of a group oftanks in a series or tanks with inter-connection. In tank system, following types of networkexist:
(i) Isolated tanks;(ii) Tanks with inter-connection; and
(iii) Tanks in series.Isolated tanks: When a tank is fed by an independent free draining catchment and also whenthe surplus flows do not form network inflow into another tank, the tank system is calledisolated tank system. Mostly large and medium-large tanks are constructed as isolated tankswith independent catchment area. Also in the plains and on plateau land tanks exist in isolation.
Tanks with inter-connection: Sometime a group of tanks may be so situated that they couldbe inter-connected to receive flows through, as well as deliver flows to, other tanks in thegroup severally. It thereby implies that the tanks have a combined catchment. Any surplusreceived by a tank from the catchment lying above is transferred to other tanks. Dependingupon prevailing hydro-meteorological condition the tanks are capable of feeding each other inreverse. Thus optimum water utilization is achieved.
Tank in series: Such tanks are located alongside the river drainage channels. They are fed byinflow drains and serviced by escape or outflow drains. The tanks in upper reaches get theirsupplies from the catchment through inflowing drains. It then lets its surplus flow downthrough an escape or outflow drain, which contributes to the inflow of the tank lower downin the series. Thus while the uppermost tanks have substantial free catchment, the tankslower down have limited free catchment falling between two tanks. The tanks lower down inseries get inflows immediately after rainfall from their free draining catchments. But suppliesfrom already intercepted catchment are received only after the upper tanks existing in southern

125Energy Management Artificial Recharge Methods 125
States of the country from series network. The advantage of this system is that, surplus waterfrom the upper tank does not go waste but is picked up by the lower tanks. Thus optimumwater gets conserved.
It, however, suffers from one disadvantage relating to safety. Since each tanks has vastcombined catchment, in case of breach in the upper tank, lower tanks also become prone tosevere flooding endangering safety of the tank bund. To avoid this, breaching sections areprovided at appropriate places in each tank.
Definitions
Before proceeding with the subject matter it is worthwhile to understand the terms commonlyused for tank.
(i) Free catchment: Catchment area is defined as that area, which always contributes thesurplus rainwater, received by it to the natural drainage grid present in the area. It is thisarea, which is responsible for maintaining flow in the natural drainages like rivers. Whenthe catchment lying above any storage structure like a tank bund or a dam is notintercepted by another structure then it is called free catchment of that structure.
(ii) Breaching section: Overtopping of tank bund by floodwater is dangerous to the safetyof the bund. Hence every precaution is taken to avoid its overtopping. To achieve thisobject, a natural saddle on the periphery of the tank is selected. In the saddle, an ordinaryretaining wall is constructed. Its height is kept higher than full tank level but lower thantop of the tank bund. When the water level in the tank rises dangerously the rushingwater breaches the periphery of the tank at this section. Thus the tank is protected andbreach is localized to predetermined sections. If such a location is not available naturallybreaching section may be constructed at a suitable site away from the bund.
(iii) Escape channel: The floodwater rushes out of the breached section. To carry theoutflow safely, channel of adequate capacity is provided below the breaching section.It is called and escape channel. By diverting water in the escape channel safely of thetanks on the downstream in a series network is ensured.
(iv) Full tank level (FTL): It is that level up to which water is stored in the tank forutilization during fair weather. Normally full tank level (FTL) is governed by the topof the escape or surplus weir. As soon as water level starts rising above this level,water starts spilling over the weir.
(v) Maximum water level (MWL): It is the level up to which the water may get storedtemporarily in the tank during high flood inflows. The maximum water level (MWL)depends upon the waterway provided to pass flood discharge safely. The top of bundis generally kept above this level by keeping adequate free board.
Tank Bunds
Tank bund is an embankment of low height. Generally it is made of earth. Since earth ofvarious types is available, tank bunds may be constructed using principles adopted forconstruction of earth dams. Generally tank bunds of three types are constructed. They are:

126 Energy ManagementWater Management126
(a) Homogeneous Type: (Tank bund of Type A) In construction of this type uniform andhomogeneous material is used. It is constructed with relatively flat side slopes fromconsideration of stability. Most of the bunds belong to this type (Fig. 7.10).
Fig. 7.10 Homogeneous tank bund (Type – A).
When the height of tank bund is more than 5 meters the section is modified suitably withseepage checking trenches, blankets, toe drains. Design principles of earth dams are dealt withsubsequently in this book.
(b) Zoned Type: (Tank bund of Type B) When earth of different types is locally availablethe bund may be constructed by dividing the section in different zones (Fig. 7.11).
Fig. 7.11 Zoned tank bund (Type – B).
Outer zone is generally made of pervious material. The inner zone is made of impervious material.
(c) Diaphragm Type: (Tank Bund of Type C) Many times zoning is done by providing acentral core wall, called diaphragm. It is generally constructed with masonry or concrete(Fig. 7.12).
Fig. 7.12 Tank bund with diaphragm (Type – C)
2 :1
F.T.L .
Im pervious R ock La ye r
cut-o ff
G r it
1½ :1P I P
F.T.L .
P e rvious zone
M asonrycore w a ll
P e rvious
Im pervious Stratum
1½ : 1
2 : 1
F.T.L . Stone P itch ing
L ine o f S atura tion
H om ogeneousM ateria l
2 :1 2 :1

127Energy Management Artificial Recharge Methods 127
In such types the diaphragm is taken quite deep in the foundation preferably up toimpervious stratum.
Design of Tank Bund
Although high bunds are designed on the principles for design of earth dam small tankbunds are constructed using empirical standards. Commonly adopted bund dimensions aregiven in Table 7.1.
Table 7.1
Height of Bund above DeepBed (Meters)
More than 7.5 1.8 2.7
6.0 to 7.5 1.5 1.8
4.5 to 6.0 1.2 1.5
2.5 to 4.5 0.9 1.2
The side slope of Tank bund is kept quite flat. 2:1 (Horizontal: Vertical) is a common slope.However for lesser heights steeper slopes may be adopted.
Like earth dams the upstream face of the tank bund is generally given stone pitching. It isalso called revetment. Thickness of the pitching may vary from 0.3 to 0.6 meters. A toe is alsoprovided to support the sloping face. General arrangement is shown in Fig. 7.13.
Fig. 7.13 Stone pitching of tank bund.
Storage capacity of a tank: Storage capacity of a tank can be calculated using trapezoidal
formula. It is stated as:
V = H/3 (A1 + A2 + A – A1 2 )
Where V is volume of space enclosed between two adjacent contours.A1 & A2 are the areas enclosed in two contours.H is contour interval.
This method is useful in finding capacity in two successive contours only. But sincetank bunds are of small heights the method is quite useful. The effective or utilizationstorage in a tank is the volume between level of sill of the outlet or lowest sluice and fulltank level.
H .F.L Top o f bund
Stone P itch ing
G rave l laye r
Toe
Free Board (Meters) Top Width (Meters)

128 Energy ManagementWater Management128
Escape Weirs
It is already mentioned that tanks are small storage works constructed to meet local requirements.Obviously attempt is not made to contain full runoff coming down from the catchment area. Itis therefore necessary to make suitable arrangement to pass down excess water beyond FullTank Level (FTL) safely. Structure constructed to provide passage to excess water is calledescape weir. It is also called tank surplus weir. The water starts spilling over the weir as soonas tank is filled up to its crest. However temporarily due to rush of incoming water the level inthe tank rises above F.T.L. The new level reached is called Maximum Water Level (MWL). Itdepends on the extent of flood. For design purposes M.W.L. is calculated taking into accountmaximum flood discharge likely to occur and the waterway available at the site of the escapeweir. The surplussing or spilling water is carried down through a channel, which is generallya natural drainage and has enough capacity.
Selection of site for a tank weir: Following points may be taken into consideration whileselecting a site for a tank weir: -
(i) Tank weir performs the function of surplussing excess flow. Therefore it is preferableto locate the weir in a natural saddle away from the tank bund.
(ii) To carry surplus flows existence of a well-defined escape channel is very necessary ata site selected for construction of a weir.
(iii) The saddle, where Natural Surface Level (NSL) is approximately same, as full tanklevel (FTL) should be given first preference.
(iv) Hard foundation if available at the site reduces the cost of construction of bedprotection works.
(v) When a site away from tank bund is not available, as far as possible weir may belocated on one end of the tank bund.
(vi) Surplus weir may be housed in the body of the tank bund only as a last resort.(vii) Care should be taken to see that escape channel carrying surplussing water is not
likely to damage cultivated areas.Types of weirs: Escape weirs constructed in tank irrigation system is similar to a diversionweir or an anicut constructed across the river channel. It may be constructed either withmasonry or rockfill or concrete depending upon availability of construction material and siteconditions.
Masonry weirs: This type of weir is most commonly used in a tank irrigation system. Masonryweirs are generally constructed with vertical drop and are designed as gravity weirs. Self-weight of the body wall is the only restoring external force and it counteracts all dislodgingforces like water pressure, uplift etc. On the body wall of the weir dam stones may be erectedto enable extra storage. Depending upon the site conditions, masonry weirs may be constructedin three ways as given below.
(a) Masonry weir with horizontal floor: In this type of weir, vertical drop is given asshown in Fig. 7.14.

129Energy Management Artificial Recharge Methods 129
Fig. 7.14 Masonry weir with horizontal floor.
This type is suitable when on the downstream side hard rock is available in the foundationand the height of the weir is less than one meter or so.
(b) Masonry weir with depressed floor: This type is similar to one explained above exceptthat the downstream apron is depressed below the ground level. Fig. 7.15.
Fig. 7.15 Masonry weir with depressed floor.
By depressing the apron below ground level a sort of stilling pond is formed. It helps indissipating the energy of water spilling over the crests of the weir. This type of arrangement isgenerally used for weirs with greater heights say more than 2.5 meters. They are then designedlike a fall.
(c) Masonry weir with stepped floor: When the topography is such that there is nospace for constructing horizontal or depressed horizontal apron, weir with steppedapron may be constructed as shown in Figure 7.16. It is something like steps and issuitable for low heights of body wall.
Fig. 7.16 Masonry weir with stepped apron.
F.T.LDam stone
M asonry Tauls
Concrete
Curtain
F.T.L
D am Stone
Ap ron
Talus
Body w a ll
G.L.
D epressed floor
4 : 1
F.T.L.
Body w a ll
N .S .L . M asonry
Steps Talus

130 Energy ManagementWater Management130
Rockfill weirs: It is constructed with dry rock fill if such material is locally available in sufficientquantity. Fig. 7.17.
Fig. 7.17 Rock fill weir.
To support the rock fill masonry retaining walls are constructed as shown in the fig. 7.17Top surface of the weir is plastered. This type of weir acquires a very big section because theslopes are quite flat.
Concrete weirs: Typical profile is shown in Fig. 7.18. The weir is constructed with reinforcedconcrete to make the section monolithic. This type is constructed mostly where foundationsare pervious.
In this type of weir, a sloping glacis is provided on the downstream side. It helps in creatinga hydraulic jump on the sloping face. When hydraulic jump is created the energy of flow isdissipated. Thus the bed is protected below the weir.
Fig. 7.18 Concrete weir.
Design of Tank Weirs
Maximum flood discharge of tank: Since the weir has to safely pass down excess flow,estimation of peak flow becomes a first step in design of tank weirs. Catchment area of tank issmall and fan shaped, so in practice, is difficult to measure the discharge. It is, therefore, estimatedusing empirical formulae. In north India Dicken’s formula is used, while for south India Ryve’sformula has been developed. Ryves formula is stated as below: -
Q = C.M2/3
Where Q is peak flow in cumec
F.T.L.
1 IN 4
S tone ap ron
R ock f ill M asonry R ock f ill
1 IN 20
Sheet p iles
Bou lde r
pitch ing
1 IN 5 D /S G lacis
1 IN 4
F.T.L.

131Energy Management Artificial Recharge Methods 131
M is catchment area in sq km
C is a constant
= 6.74 for areas within 24 km from coast
= 8.45 for areas with in 24-161 km from coast
= 10.1 for limited hilly areas.
This formula can be applied for a free catchment. For a tank in series or interconnectedtanks the formula needs correction. Modified formula is
Qm = CM2/3 – Cm. Mm2/3
Where Mm is the catchment area in sq km intercepted by upstream tank
Cm is new coefficient, which varies from 0.2 to 0.33.
Waterway of the weir: The weirs constructed are generally broad crested weirs and theformula, which gives discharge over broad crested weir, can be used. Generally velocity ofapproach is neglected. The discharge formula is in the form –
Q = C.L.H3/2
L = Q / C.H3/2
Where L is length of weir in metersH is design head over weir; it is given by (MWL – FTL) in MC is a constant= 1.84 for weir crest up to 0.9 m width.= 1.66 for weir crests more than 0.9 m width.= 1.66 for crests with dam stones.= 1.47 for crests with d/s sloping face.
Length of apron: Usually length of horizontal downstream apron is kept 2(D+H) from toeof body wall. Here D is height of the body wall above floor and H is maximum water head overthe crest of the wall. A further factor of safety of 1.5 is provided when important areas liebelow the surplus weir. Then length is kept 3(D+H).
Length of stone talus or pitching: Generally 3(D+H) to 5(D+H) length of stone pitchingis provided on the downstream of apron in continuation. Greater length is provided for weakerfoundation material.
Rehabilitation and Modernization of Tanks
There has been heavy siltation in large number of tanks. Surveys indicate that the waterholding capacity of these tanks has been reduced by about one-third due to siltation,completely eliminating dead storage and reducing infiltration. In olden times villagecommunity did periodical desilting. In present set-up, such social obligation no moreexists. In short, the up keep of the tanks have been neglected and their capacity is reduceddue to siltation.

132 Energy ManagementWater Management132
To restore the lost area under storage and to increase the tank area there is urgent need torehabilitate and modernize the age – old tanks. Rehabilitation can be achieved by desilting thetank. Modernization involves strengthening and raising height of bund, improvement ofsurplussing arrangement, minimizing evaporation losses.
Design Problems
# 1: Free catchment of an isolated tank is 50 sq km. Average annual rainfall recorded is 100cm, nearly 80% of which occurs in a short period of two months and the rest is distributedover balance period. Taking dependability of average year rainfall to be 60% calculate thegross storage capacity required for the tank. Assume that only 30% of the rainfall flows downas surface run-off. Also calculate design flood likely to be generated by the catchment. Area iswithin 80 km from coast.
Step 1: Average annual rainfall = 100 cmFor calculating storage capacity, we may use only that part of runoff, which occursin the rainy season because it is stated that balance rainfall is distributed over a 10month period and may produce insignificant runoff. It will be accommodated invacant space of the tank.
Effective rainfall = 80 ×100100
= 80 cm
Step 2: In the question dependability level is given to be 60% of average flow,
Dependable rainfall = 80 ×60
100 = 48 cm
Step 3: Runoff factor is given to be 30% of rainfall
Runoff expected at bund site = 48 × 30
100= 14.40 cm
or Gross storage capacity required =14.40100
×50 × 1000 × 1000
= 7.2 × 10⁶ cubic metersStep 4: Design flood can be calculated using Ryve’s formula
Q = C M2/3
Where Q is peak flood in cubic metersC can be taken to be 8.45M is 50 sq. kmQ = 8.45 × 502/3 = 114.68 cubic meters
#2: In the catchment of problem 1, another tank has been constructed on the upstream.Free catchment of new tank is 10 sq km. Calculate modified gross storage capacity and designflood as also percent reduction for the existing tank. Assuming that upstream tank releases 1/5th of its runoff.
Step 1: Free catchment of the existing tank= 50 – 10 = 40 sq km

133Energy Management Artificial Recharge Methods 133
Intercepted catchment = 10 sq km
Runoff in tank = 14.40 cm (from step 3 of problem 1)
Step 2: Modified runoff into existing tank
= Runoff from free catchment +1/5 (runoff from intercepted catchment)
= 5.76 × 10⁶ + 0.288 × 106
= 6.048 × 10⁶
Step 3: % reduction in storage = 7.2 –6.048
7 2.× 100 = 16%
Step 4: Modified design flood is given by using the relation Qm = C.M2/3 – Cm. Mm2/3
Where Cm = 0.2 C and Mm is 10 sq km
Qm = 8.45 × 502/3 – 0.2 × 8.45 × 102/3
= 114.68 – 7.84
= 106.84
Step 5: % Reduction
In design flood =114 68 106 84
114 68. – .
..× 100 = 6.84 %
7.9 FLOODING METHODSThe flooding method involves diversion of water to form a thin sheet flowing over relativelyflat land. Flow rate should be minimum so as not to disturb vegetation and soil covering andhighest infiltration rate can be achieved. Peripheral dikes or ditches should surround the entireflooding area (Refer Figs. 7.19 & 7.20).
Following factors should be observed:
I. The velocity of flow should be minimum possible so as not to disturb the vegetationand soil cover.
II. If we assume that land is available without cost then this method is cheaper.III. For maximum efficiency, manual labour should be employed.
Fig. 7.19 Schematic diagram of contour bunding.
100 110 120
B und Tren c h
P LA N V IE WB und Tren c h
S E C T IO N A L V IE W

134 Energy ManagementWater Management134
Fig. 7.20 Flooding technique of recharge.
A – II: SUB-SURFACE METHODS
Sub-surface techniques are very much useful when there is a low permeability between theground surface and the unsaturated upper level of the recharged aquifer. Generally, thesetechniques are useful when surface methods cannot be satisfied technically and economically.The following are some sub-surface techniques of recharge:
Recharge through wells. Recharge through pits and shafts.
Sub-surface methods have following advantages:1. They occupy smaller area.2. Utilize better quality recharge water.3. They are capable of recharging confined aquifers.4. They can be designed to avoid mixing of recharge and pumped water.
Recharge Through Wells
This structure is generally constructed in streambed and on upstream side of possible checkdam across the stream. It consists of 8-10 deep bore wells of 300 mm diameter with 200 mmslotted PVC pipe and annular space filled with sand and gravel. Water can be rechargedunderground through wells where deep confined aquifers or space limitations precludeapplication of other methods. Considerable care should be taken in operation and constructionof recharge wells to minimize the effects of clogging which may take place because of entrapmentof finer aquifer particles, from filtration of suspended materials in the recharge water, frombacteria and from chemical reaction between recharge and ground water. Generally, gravelpacked wells can recharge more efficiently. Recharge water should be clear, should not havehigh sodium content, and should be chlorinated (Figs. 7.21 & 7.22).
D e live ry C ana l
S hee t F low
R etu rn C a nal
E m b ankm en t
D ire ctio n o f F lowSteam
Fig. 7.21 Recharge (Injection) well for unconfined aquifer.
L ow P erm ea b il ityM a ter ia l
W ate r Press ure S urface
P erm ea b le M ate r ia l
S cre en

135Energy Management Artificial Recharge Methods 135
Fig. 7.22 Recharge (Injection) well serving several aquifers.
Recharge Through Pits and Shafts
Recharge through pits method is useful at a place where there is shallow impermeablestrata, which can be excavated in due course to open up permeable strata, which lies below it,and small recharging pit like structure is created. Abandoned gravel pits and pits formed bysale of excavated material are useful locations. Provision should be made to remove the siltaccumulation periodically (Figs. 7.23 & 7.24).
Fig. 7.23 Recharge pit.
Fig. 7.24 Abandoned gravel pit.
C asing
P erm ea b le M ate ria l
L ow P erm eab ilityM a ter ia l

136 Energy ManagementWater Management136
Unfortunately, pits used for storage or treatment of liquid wastes provides a significantsource of inadvertant recharge, which leads to complex and widespread problems of groundwaterpollution. Examples include sewage treatment lagoons, industrial waste holding or disposalponds and oil field brine evaporation pits, to mention only a few of an exceedingly large numberof practical situations.
Recharge shafts (Fig. 7.25) are generally deeper and of smaller diameter than pits. Theirpurpose is also to penetrate low permeability layers. Shafts may be lined or unlined, open orfilled with coarse material and large or small. They are constructed by hand, with draglinesand backhoes or are drilled or bored where the recharge water contains sediment, shafts maybecome plugged fairly rapidly.
Commonly, recharge shafts are used in conjunction with pits (Fig. 7.26). Both suffer fromdecreasing recharge rates with time due to the accumulation of fine-grained materials and tothe plugging effect brought about by microbial activity. Rates through recharge pits may bemaintained by periodically allowing the facility to become dry or by scraping and removing theaccumulated material from the sides and bottom. Shafts are less easy to maintain owing totheir smaller diameter and greater depth. In some cases, the coarse material used to fill theshaft must be replaced.
Fig. 7.25 Recharge shafts.
Fig. 7.26 Combination of recharge shafts and recharge pits.
C ana l o r Po n d level

137Energy Management Artificial Recharge Methods 137
Spreading Above Groundwater Table
In practice, the groundwater table may be so far below the ground surface that the availabledifference in head between this table and the water level in the spreading ditch cannot fully beutilized. With the circular spreading scheme of the last section, this is, for instance, the casewhen S0 in Figure 7.5 is larger than 8.95 m. With very coarse-grained aquifers, an unsaturatedzone between the bottom of the spreading ditch and the top of the groundwater mound couldnow occur, as shown in Fig. 7.27.
Fig. 7.27 Spreading ditch above the Fig. 7.28 Spreading ditch above thegroundwater table. groundwater table.
For parallel and circular systems respectively, the head loss here is given by
Sp =qkH
0 L, Sc =QkH0
2π ln L +F
HGIKJ
ρρ
; Z0 = 12
0qkH
w; Z0 = QkH
0
2π.
With finer grained aquifers on the other hand, the air present in the pores of theformation will be dissolved and carried on by the downward percolating recharge water,while re-supply of air from the ground surface will be too limited to maintain an unsaturatedzone. A closed body of groundwater will thus be formed, shown in Fig. 7.28. For a cleanditch without clogging, its necessary width is given by (Vermeer, 1974):
2w′ = 2qk
0 + 4π
(H0 + S′0)e – πkz ′0/(2q0
)
with S′0 = q
k0
π (L+W)
whereas for a clean circular pond without clogging (Fig. 7.29), the necessary diameter, 2ρ, may be
calculated by trial and error from S0 = S1+S2 = QkH
0
2π ln
L+ρρ
αFHG
IKJ +
LNM
OQP, with α is a function of
2ρ/H. For instance, Q=20 × 106 m3/year = 0.634 m3/s, k = 0.4 × 10⁻³ m/s, H = 50 m, L + ρ =500 m, the distance from the ground surface to the groundwater table S0 = 10 m and moreover, so
q0
2q0q0
2w
z’0
s’0
H 0
L+w
q0
q 0 Q 0
Q /n0
z0
s p sc
L w L

138 Energy ManagementWater Management138
(L + ρ)/ρ =[2 (L + ρ)/H][H/(2ρ)], so
lnL
H+F
HGIKJ = L
NMOQP +
FHG
IKJ
ρρ
ρρ
ln2(L+ )
lnH2
then,
100634
2 0 4 10 50 50=
× × ××F
HGIKJ +
FHG
IKJ +
LNM
OQP
..
,–3π ραln
2 500ln
H2
or
α = ln (2ρ/H) – 1.01
With the approximation for α, this yields by trial and error
2ρ/H = 3.67 or ρ = 92 m
Fig. 7.29 Spreading pond above the groundwater table.
By Constructing Subsurface Dyke: (Fig. 7.30)
This can be achieved by constructing subsurface dike in the streambed. These subsurfacebarrier will stop the under ground flow below the bed level. It extends upto impermeable layerbelow the streambed and thus one phreatic aquifer is created.
Fig. 7.30 Subsurface dyke.
G R O U N D W ATE R FLO W
P hreatic A quife rS U BS U R ED Y KE
R eg ionalW ater tab le
IM P ER M E AB LE R O C K
Strea m B ed
W atertab le
Q nn
Q 0
2ρ
H
Q nn
L +
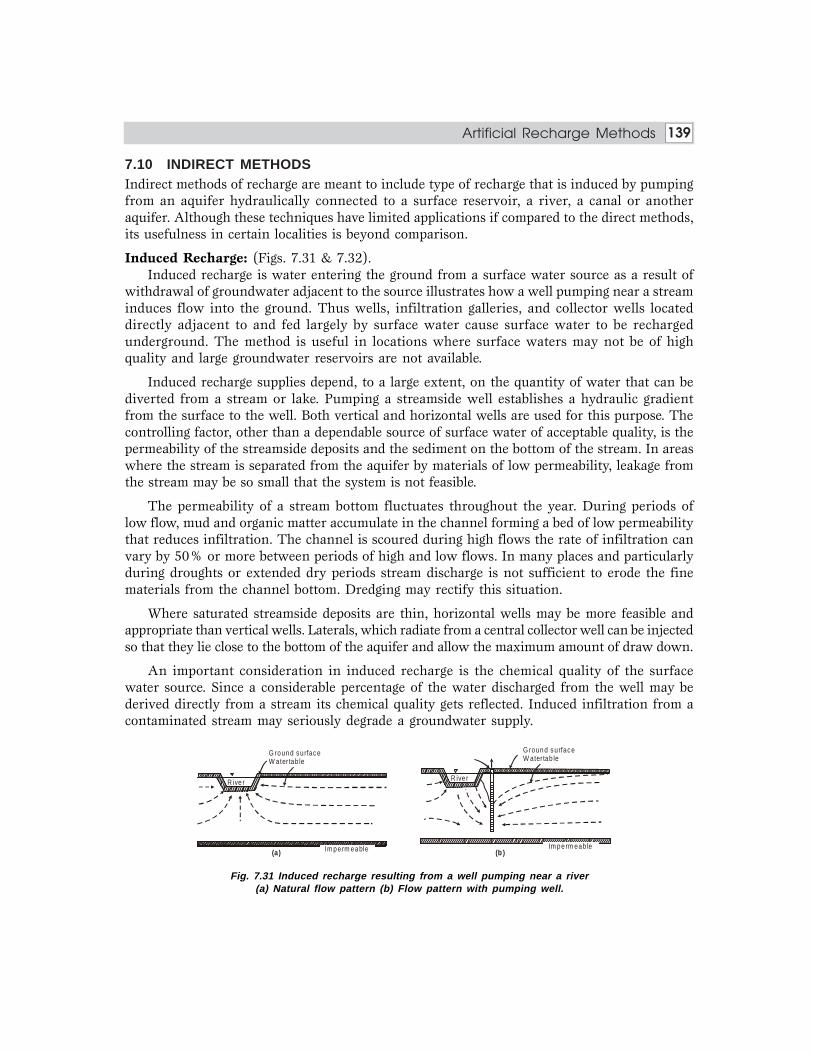
139Energy Management Artificial Recharge Methods 139
7.10 INDIRECT METHODSIndirect methods of recharge are meant to include type of recharge that is induced by pumpingfrom an aquifer hydraulically connected to a surface reservoir, a river, a canal or anotheraquifer. Although these techniques have limited applications if compared to the direct methods,its usefulness in certain localities is beyond comparison.
Induced Recharge: (Figs. 7.31 & 7.32).Induced recharge is water entering the ground from a surface water source as a result of
withdrawal of groundwater adjacent to the source illustrates how a well pumping near a streaminduces flow into the ground. Thus wells, infiltration galleries, and collector wells locateddirectly adjacent to and fed largely by surface water cause surface water to be rechargedunderground. The method is useful in locations where surface waters may not be of highquality and large groundwater reservoirs are not available.
Induced recharge supplies depend, to a large extent, on the quantity of water that can bediverted from a stream or lake. Pumping a streamside well establishes a hydraulic gradientfrom the surface to the well. Both vertical and horizontal wells are used for this purpose. Thecontrolling factor, other than a dependable source of surface water of acceptable quality, is thepermeability of the streamside deposits and the sediment on the bottom of the stream. In areaswhere the stream is separated from the aquifer by materials of low permeability, leakage fromthe stream may be so small that the system is not feasible.
The permeability of a stream bottom fluctuates throughout the year. During periods oflow flow, mud and organic matter accumulate in the channel forming a bed of low permeabilitythat reduces infiltration. The channel is scoured during high flows the rate of infiltration canvary by 50% or more between periods of high and low flows. In many places and particularlyduring droughts or extended dry periods stream discharge is not sufficient to erode the finematerials from the channel bottom. Dredging may rectify this situation.
Where saturated streamside deposits are thin, horizontal wells may be more feasible andappropriate than vertical wells. Laterals, which radiate from a central collector well can be injectedso that they lie close to the bottom of the aquifer and allow the maximum amount of draw down.
An important consideration in induced recharge is the chemical quality of the surfacewater source. Since a considerable percentage of the water discharged from the well may bederived directly from a stream its chemical quality gets reflected. Induced infiltration from acontaminated stream may seriously degrade a groundwater supply.
G round surfac e W atertab le
Im pe rm eable
R ive r
(a)
G round surfac e W atertab le
R ive r
Im pe rm eable(b )
Fig. 7.31 Induced recharge resulting from a well pumping near a river(a) Natural flow pattern (b) Flow pattern with pumping well.

140 Energy ManagementWater Management140
Fig. 7.32 Induced recharge resulting from a collector well on stream bed.
Hydraulics of Induced Recharge
Apart from geohydrological constants, which cannot be altered, induced recharge is governedby two factors: the rate, q0, of groundwater abstraction from the gallery and the influent river(Fig. 7.33). These factors, however, cannot be chosen at will but must satisfy variousrequirements. To prevent a rapid clogging of the streambed, the rate at which the river waterenters the aquifer must be low. To assure a satisfactory purification of the river water duringits underground flow towards the gallery, the distance of travel must not be too small (not lessthan 50 – 100 m) and the detention time, in particular, must exceed a minimum value of 30 –60 days, depending on local circumstances. In order not to hinder other groundwater usersmore than the minimum value is strictly necessary, the lowering of the groundwater tablefinally must be limited. With the notation in Fig. 7.33 and assuming a homogeneous and isotropicaquifer with a constant coefficient of transmissivity, kH, and the interval L small compared tothe aquifer width W, as it usually is, these requirements may be formulated as follows:
q0 < Ωve
q0 < pHL/T
q0 < kHS0/L
with, again assuming L<<W,
q0 =qa + qn; qn = 12
PW + (kHS0/W)
In these formulas, W is the wetted circumference of the river bed in contact with theaquifer, ve the maximum allowable value for the average entry rate of river water into the sub-soil, p the pore space, H the saturated thickness and k the coefficient of permeability of theaquifer, T the minimum acceptable detention time, P the amount of residual rainfall and S0 themaximum value of the drawdown, S, which increases linearly with the distance from thebounding rivers. With regard to the requirements for the detention time and drawdown, nocompromise is possible, giving for the interval L

141Energy Management Artificial Recharge Methods 141
L > qa T/(pH) and L < kHS0 / (qa + qn)
or L = q
q qkp
S Ta
a n+FHG
IKJ 0
With qa a few to many times larger than qn, say qa –~ 4qn, this formula may be simplified to
L = 0.9 ( / )k p S T0
Assuming, for instance, n aquifer with W = 6000 m, H = 22 m, k = 0.4 × 10⁻³ m/s,p = 0.4 and P = 16 × 10–9 m/s (500 mm/year) and requiring a detention time, Td, longer than6 × 106 s (70 days) and a drawdown, S0, not exceeding 1.5 m, the distance L becomes:
L = 0.9 0 4 10
0 415 6 106.
..
–3¥ ¥ ¥ ¥ ª 85.38 say 85 m
Starting from this value, the requirements for the detention time and drawdown give
qa < 0 40 22 85
6 106
. ¥ ¥¥
or qa < 124.67 × 10⁻⁶ m3m–1s–1
q0 < 0.4 × 10–3 × 22 × 1.5/85 or q0 < 155.29 × 10⁻⁶ m3m–1 s–1 and with
qn = 12
16 10 6000¥ ¥ ¥FHG
IKJ
–9 + [0.4 × 10–3 × 22 × (1.5/6000)]
= (48 × 10–6) + (2.2 × 10⁻⁶)qn = 50.2 ×10⁻⁶ m3/msqa < (155 × 10–6) – (50 × 10–6) or qa < 104.8 × 10⁻⁶ m3m–1s–1
or qa < 105 × 10–6 m3m–1s–1
As the smaller of the two values for qa, this is the deciding one, giving with a river width of,for instance, 40 m an average entry rate into the sub-soil equal to
ve = 105 × 10–6/40 = 2.62 × 10⁻⁶ m/s
or 0.2 m/day, which seems quite acceptable. For a city of 100 000 inhabitants, with a dailyconsumption of 20 000 m3 or on average 0.23 m3/s, the gallery yield of 133 × 10–6 m3m–1s–1
means a length of bank infiltration equal to
B = 0 262
155 10.
–6¥ 1690 m
for which it will not be difficult to find an appropriate place. Slightly better results in theisrespect could be obtained by a small reduction in the value of L, from 90 to 84 m, increasingthe gallery yield to 143 × 10–6 m3 m–1 s–1 and decreasing the required gallery length to 1600 m.
Without saying so expressly, the calculations carried out so far are based on a one-dimensional flow pattern, showing only horizontal flow lines perpendicular to the river. Such

142 Energy ManagementWater Management142
a flow net would indeed be present when the length of the gallery parallel to the river isinfinite and when both the gallery and the river fully penetrate the saturated thickness of theaquifer and, moreover, do so with vertical sides. This, however, will never be the case, slightlychanging the results obtained above.
For the water flowing directly beneath the water table, the detention time will be somewhatsmaller than the value of Td assumed so far, but for all other flow lines the detention time willbe longer, giving an average value appreciably above the design value. Due to a greater lengthof flow and to the presence of vertical flow components, the drawdown, S0, will increase by∆s. With a fully penetrating gallery of zero width in the centre of the river, the length of flow,L, increases by Ω/ 2, augmenting the drawdown to
So = qkH
L0 , by ∆S1 = qkH
0
2W
Replacing the fully penetrating gallery by the real one gives as additional drawdown due topartial penetration
∆S2 = [q0/(πk)] ln (H/Ω)
For the correct example quoted above
S0 =155 10
0 4 10 2285 150
¥¥ ¥
¥ =–6
–3.. m
∆S1 = 155 10
0 4 10 22402
¥¥ ¥
–6
–3. = 0.35m
∆S2 = 155 10
0 4 102240
07¥
¥ ¥FHG
IKJ =
–6
–3.–0.
pln m
ΣS0 = 1.50 + 0.35 – 0.07 = 1.78 m
It should be noted, moreover, that according to Fig. 7.33, the entry of river water isconcentrated near the shoreline. In extreme cases, clogging will occur here, shifting the rechargetowards the centre of the streambed, thus increasing the length of flow and the drawdown. Toprevent this as much as possible, the design rate of entry should be chosen small.
Due to the finite length of the gallery and the additional inflow around the far ends, thecapacity for the same drawdown will be larger, equal to αΒq0 with α equal to
B/L 2 5 10 20 50 100
α 2.29 1.65 1.39 1.23 1.13 1.07
For the same capacity, the drawdown will correspondingly be smaller. In the examplementioned above,

143Energy Management Artificial Recharge Methods 143
B/L = 1700 / 85 = 20, α = 1.23
Giving ΣS0 = 1.78/1.23 = 1.45 m
Well below the maximum allowable value of 1.50 m. Incidentally, due to clogging andpartial penetration of the gallery, the piezometric level of the water inside the gallery is lowerthan that which corresponds with the drawdown of 1.45 m. The influence of partial penetrationmay again be calculated as
∆S1 = [q0/(πk) ln (H/Ω′)]
with Ω′ as the wetted perimeter of the gallery. With a gallery of, say, 0.6 m diameter, this givesfor the case under consideration
∆S′ =155 10
0 4 10¥
¥ ¥
–6
–3.p ln
2206p ¥
FHG
IKJ.
=0.30 m.
Fig. 7.33 Hydraulics of induced recharge.
The influence of clogging cannot be calculated, but it is wise to anticipate a value of 0.5 –1 m, keeping in mind that cleaning of the gallery is impossible.
The calculations made so far are based on a constant water level in the bounding rivers.When these water levels vary, a change in groundwater levels will also occur, influencing theratio between artificial and natural groundwater abstracted. In the case where the river showsa sinusoidal variation (Fig. 7.33), z = z0 Sin (ωt), then assuming that W is so large that mutualinterference may be neglected, the variation in river water abstraction, qa, equals
∆qa = wm w a p a wmakH Z e Sin t L with kHL0
14
12
– – , /( )+FHG
IKJ =
With the example described before, µ= 0.30, yearly fluctuations and Z0 = 1.5 m
∆qa =
23154 10
0 30 8 10 15 28 10684 517 6 3 1 1p
.. ( . )–3 /
¥¥ ¥ ¥ = ± ¥- - - -e m m s
Ω
res idualra in fa ll P
g roundw a ter d ivide orig ina l g roundw ate r table
q = q + q0 a 0
qs
s
q n
s o
LW

144 Energy ManagementWater Management144
With a steady state river water abstraction equal to qa = 101 × 10–6 m3 m–1 s–1, this amountwill now vary between 73 × 10–6 m3 m–1 s–1 and 129 × 10–6 m3 m–1 s–1, making 51 to 90% ofthe gallery yield, q0, of 143 × 10–6 m3 m–1 s–1.
Incidental Methods: (Fig. 7.34)
Incidental recharge includes non-deliberate replenishment from irrigation system,leaking domestic and industrial systems and disposed industrial and domestic waste waters.In spite of its significant contribution to the groundwater, this last method was the leastinvestigated technique.
The incidental recharge occurs where water enters the ground due to activities whoseobjective is not artificial recharge (Todd, 1985). Examples include water from irrigation, septictanks, water mains, waste-disposal facilities.
Fig. 7.34 Incidental recharge by (a) Irrigation (b) Overland flow.
7.11 METHODS OF ARTIFICIAL RECHARGE PRACTICED BY PEOPLE IN DROUGHTPRONE AREA
Groundwater Recharge by Diverting Surplus Water of Pond Into Well
A pond which has become a storage pond only due to excessive silting and through whichvery little percolation takes place, can be utilized for recharging by this method. A bore or awell can be dug in pond when it is dry. The bore is to be drilled upto the aquifer. The top of thebore pipe is kept open above the maximum water level to allow air to escape.
In this method of recharge, first of all, a borehole of suitable diameter is drilled up to theaquifer layer. In this borehole, pipe is fitted as shown in figure. The upper end of pipe is kept at

145Energy Management Artificial Recharge Methods 145
maximum water level and two right angle elbows are fitted at this level. At upper end oneadditional pipe of about one meter is fitted which will act as an air escape pipe. In order to keeppipe in position, a masonry foundation of 1.0 m × 1.0 m × 1.0 m is constructed. By thismethod, whenever the water surface reaches at maximum water level the surplus water willenter the pipe and reaches to aquifer. (Figs. 7.35 & 7.36).
Fig. 7.35 Groundwater recharge by diverting surplus water of pond into well.
Fig. 7.36 Details at “A”.
Recharging Well from Nearby Stream or River
Natural small stream or river water is first diverted into one or two small tanks provided witha filter media and then the relatively clear water is taken into the well by means of pipe. By thismethod open wells can be recharged, as it is possible to desilt this type of well. (Fig. 7.37).
M ax. W ater Level A ir vent p ipe
P ipe up toperm eable laye r
A

146 Energy ManagementWater Management146
Fig. 7.37 Recharging well from nearby stream or river.
Recharging well by constructing it in the River Bed
When the river is dry, a series of wells can be constructed in the river bed with a filter mediaand air vent pipe is provided to allow air to escape. During monsoon, the wells will pour largequantity of water into the ground (Refer Fig. 23).
Stream bed
Max Water Level
Wire mesh
Strainer (perforated) pipe
Air vent pipe
Gravels
Holes provided for air escape
Fig. 7.38 Recharging well by constructing it in the river bed.
Recharge by Excavating Soak Trenches in The River Bed
In this method of recharge soak trenches of 3.0 m diameter and 3.0 m depth with filter mediaare constructed at several distance apart in the river bed as shown in the Fig. 7.39. In eachsoak trench, borehole of 10 to 15 cm diameter is drilled up to aquifer. Necessary strainer pipeand filter medium are to be provided as shown in the Fig. 7.39.
Trench connectingnatural drain or stream
Cart Track
Stream or River
Pipe
Filter tankWell

147Energy Management Artificial Recharge Methods 147
Fig. 7.39 Soak trenches in the riverbed.
Recharging of Tube Well by Syphonic Action
When the riverbed level near the vicinity of tube well is relatively lower, then the tube well canbe recharged by Syphonic action. As shown in the figure, first close the outlet of the deliverypipe and then connect the delivery pipe by a syphon pipe upto the river. Now start the pump sothat water will flow from the tube to the river and then stop the pump. The reverse flow willstart due to Syphonic action and filtered river water will flow into the well (Fig. 7.40).
Fig. 7.40 Recharging of tube well by syphonic action.
Hydraulics of Injection Wells
For new wells, without clogging, the injection head only depends on the capacity and thegeohydrological situation and can easily be calculated with the formulae and assumptionsalready made:
(a) all recharge wells have the same water level, at a distance S0 above the original horizontalgroundwater table;
(b) by the use of well pumps with a steep characteristics, all recovery wells have thesame capacity.
R e ch arg e B o re
1 .2 0 c m
G rave lM e ta l
R u bb le
P ipe leadu pto p e rv iou sstra ta
Straine r P ip e
G roundw ater R echarg ing by C onstruc ting S oak P it in r iver B ed
6 0 cm6 0 cm1 .2 0 c m
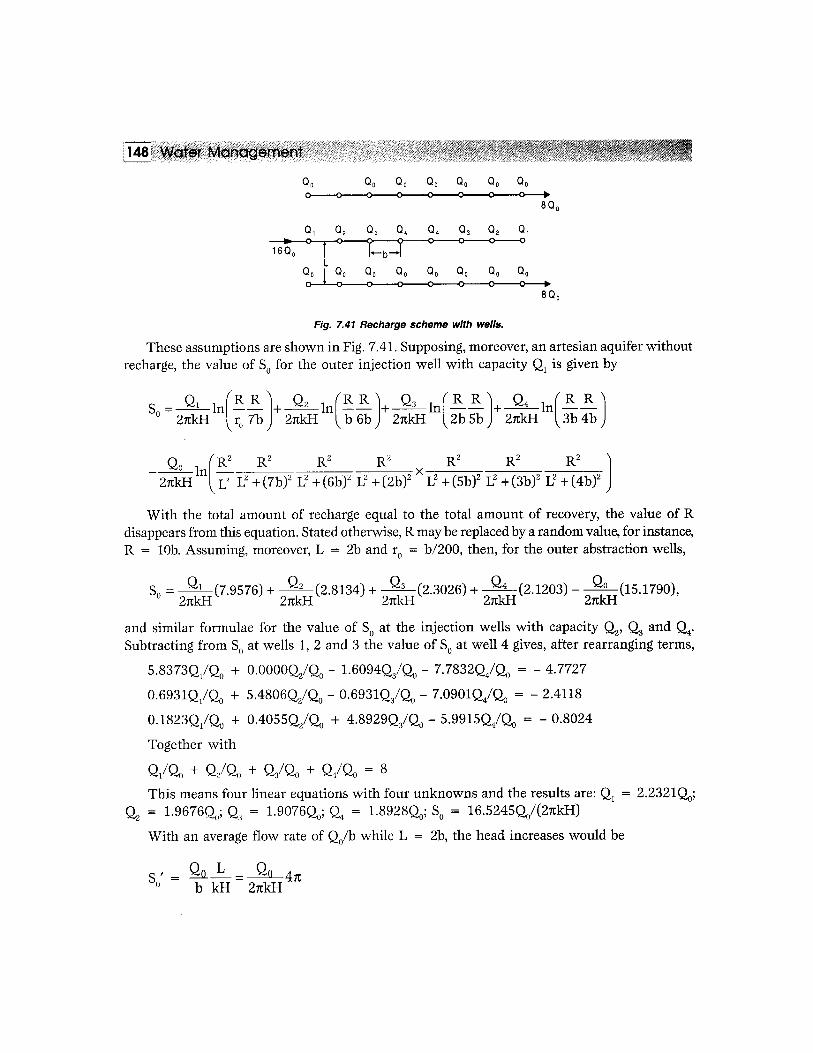

149Energy Management Artificial Recharge Methods 149
Because of the influence of finite length, this value must be divided by α2. With B/L = 4,α2 = 1.17. This result, however, must still be augmented by the influence of point injection;while noting that Qinj = 2Q0,
∆S0′ =2
2 20
0
Qrπ πkH
lnbF
HGIKJ , and with r0 = b/200,
∆S0′ = 6.9209 Q0/(2πkH)
Together S0 = (S′0/α2) + ∆S′0 =17.6613 Q0/(2πkH) or 7% above the correct value.
According to the calculations given above, the capacity of the outer injection wells is 12%above and of the inner wells 5% below the average value. These differences are higher whenthe ratio L/b increases. For L=4b and a more or less square recharge scheme, they amount to+20% and –11%. When, during operation, clogging of the injection wells occurs, thesedifferences will decrease.
Increasing the injection head to overcome the clogging of the formation surrounding thewell screen has little influence on the cost of operation, but it may result in soil cracks throughwhich the recharge water flows upward to the ground surface. To investigate this danger, Fig.7.42 shows the pressure distribution in the sub-soil before and during injection. From soilmechanics, it is known that the vertical grain pressure equals the difference between the soilpressure and water pressure:
σg = σs – σw
Fig. 7.42 Pressure distribution in sub-soil.
Using the notation of Fig. 7.42, the smallest grain pressure occurring at the top of theartesian aquifer equals, before injection,σg =ρs gA – ρw g (A – D), with ρs and ρw as the mass densities of soil and water, respectively.The horizontal grain pressure normal to the vertical planes is smaller by a factor α
σgh = α σg
and will, during injection, decrease by an amount ρw g (S0 + Sc ), where Sc is the increaseof the injection pressure, S0, by clogging. Together these give

150 Energy ManagementWater Management150
σgh = α ρs gA – a ρw g (A – D) – ρw g (S0 + Sc)
To prevent vertical cracks from developing, this pressure must be larger than zero or
S0 + Sc < α rr
s
w A (A – D)the real value of α is impossible to determine, but according to
theory its minimum value equals (neglecting cohesion)
α = tan2 452
–fFHG
IKJ
with ϕ as the angle of internal friction. For sand, this angle varies between 30° and 40°, thusα = 0.33 to 0.22. Using the lowest value and assuming for water saturated sand ρs=2ρw, onefinally gets
S0+Sc < 0.22 (A+D)
Meaning that for D = 0, the water level inside the well may not rise more than 0.22Aabove the ground surface or with, for instance, A = 20 m, not more than 4.4 m above the
ground surface. In the example given above, S0 = QkH
0
2p (16.5)
Assuming Q0 = 0.02 m3/s and kH = 0.03 m2/s, then S0 = 1.75 m, giving for the rise, Sc, inthe injection head due to clogging Sc = 4.4 – 1.75 = 2.65 m, which is a rather small value.
The changes in the injection head may also be caused by variations in the temperature, Tr,of the recharge water. In temperature climates, Tr = T0 + Tc Sin(wt) which variationspropagate through the aquifer with little damping but a large delay. Neglecting this dampingaltogether, it gives for the temperature at a distance x down stream of the line of recharge wells
Tx = T0 + Tc Sin (ωt – δx)
The average temperature over the flow length L, thus becomes
Ta = 1 1
212
0
0LT dx T L LT t Lx
L
cz = + FHG
IKJ
FHG
IKJ[2 / ]sin sin –d d w d
with δL = ρ ωρ
For sandy aquifers
δL = 1.8 ω Td and Td = 60 days, δL = 182365
60 186. .¥ ¥ =p , and [2/(δL)] sin 12
dLFHG
IKJ =
(2/1.86) sin (1.86/2) = 0.86
With T0 = 12oC and Tc = 10oC, the average temperature of the water in the recharge areathus varies from 12° – 8.6° = 3.4o C to 12°+8.6° = 20.6oC, causing variation in the kinematic

151Energy Management Artificial Recharge Methods 151
viscosity and the injection head by a factor 206 42 53 4 42 5
1611 5. .
. ..
.++
FHG
IKJ =
When the maximum allowable injection head is 4.4 m, the value in autumn may thus notrise above 2.7 m, a serious reduction indeed.
Recharging of Hand Pump by Roof or Terraced Water
The water from the terrace or roofs of the houses are collected into small masonry tank underground and is taken into the casing pipe of the tubewell or hand pump as shown in the figure.In this method, first of all rainwater is collected in masonry tank of size 1.0 m×1.0 m ×1.0 mdepth provided with baffle walls (stabilization tank) to have primary removal of waste materials.Pipe connecting stabilization tank to casing pipe of hand pump is fitted. Allow first rainwaterto drain off out side by means of two valves arrangement as shown in Fig. 7.43.
Fig. 7.43 Recharging of hand pump by roof or terraced water.
Excavating Soak Trenches at the End of Farm Slope (Fig. 7.44)
Soak trenches filled with filter media can be constructed at the end of farm slope so thatrainwater as well as excess water due to flood irrigation is collected into it. By doing this, notonly that groundwater will be recharged but also moisture in the root zone will be maintained.This will be much more useful when there is a gap between two rains.
Fig. 7.44 Excavating soak trenches at the end of farm slope.

152 Energy ManagementWater Management152
Constructing Farm Ponds
During monsoon, the surface runoff takes place in the farms. Looking to the direction of flow,a suitable pond can be constructed in the farm, which will serve as storage as well as percolationpond. Till water is available at surface, it can be pumped directly and later on it can be availableby lifting. (Fig. 7.45).
Fig. 7.45 By constructing farm ponds.
Constructing Hidden Weir in the River Bed
When the river is dry, remove the sand from the riverbed and create a barrier of clay filledplastic bags. Cover this barrier by L.D.P.E. plastic sheet and 30 cm thick fine clay layer asshown in the figure. Backfill the excavated sand in the trench. This barrier will reduce theflow below the bed level and increase time of percolation. Such a weir can be constructed atapproximate 1 km distance from each other throughout the stream. (Fig. 7.46).
Constructing Soak Channel on Downstream Side of Farm
On downstream side slope of the farm excavate one channel of size 2.0 m × 2.0 m × 2.0m depth. In this channel, first of all fill the pebbles of 5 to 10 cm size up to 1.0 m depth andremaining 1m depth with gravels and sand as shown in the figure. By this method rainwaterwill be percolated in the subsurface. (Fig. 7.47).
Fig. 7.46 By constructing hidden weir in the river bed.

153Energy Management Artificial Recharge Methods 153
Fig. 7.47 By constructing soak channel on downstream side of farm.
7.12 WELL CLOGGING MECHANISM AND THEIR PREVENTIONAccording to experience gained all over the world, the main causes for the clogging of injectionwells are:
(a) the presence of air bubbles in the recharge water;(b) the presence of suspended matter in the recharge water;(c) the growth of bacteria in the gravel pack and surrounding formation;(d) reactions between the recharge water on one hand and, on one other hand, the native
groundwater and aquifer material present in the formation;(e) mechanical jamming.These causes, their identification and prevention when possible will be discussed in the
next paragraphs. Identification is greatly facilitated by the installation of piezometers as shownin Fig. 7.48, one at the outer circumference of the gravel pack and others at distances of, say,2 and 5 m from the well center. At any moment, these piezometers show where clogging hastaken place, while the rise of water level with time gives valuable information about the natureof the clogging matter. Needless to say that, for this purpose, the changes in water levelaccompanying variations in capacity and temperature should first be eliminated.
Fig. 7.48 Installation of piezometers for the identification of injection well clogging.
1 2 3
sc2
sc
s 0
s c1
P iezom e te r
clogging o f grave l pac k
clogging o f fo rm ation w a llclogging o f fo rm ation
groundwater table
be fore injection
aqu iferw e ll sc reen
g rave l pac ksand trap
gro und surface
S oa k cha nn e l
5 0 cm Sa n d lay erM a ter lay er 5 0 cm
G rave l layer 1 m
Slope
FAR M
Cha
nne l
2 .0 m

154 Energy ManagementWater Management154
Presence of air bubbles: During injection, air bubbles may be entrained by the free fall of thewater when the injection pipe ends some distance above the water level in the well casing andmay come out of solution when the water pressure drops below atmospheric. In water at rest,air bubbles with diameters between 0.1 and 10 mm rise at velocities of 0.3 – 0.4 m/s, meaningthat injection with higher flow rates carries them downward, through the well screen openingsinto the gravel pack and surrounding formation. Here, they clog the pores between the individualgrains, causing an additional resistance, which in its turn decreases the injection capacity andthe amount of air supplied. On the other hand, the air bubbles present will dissolve into thewater flowing by, together meaning that already after a short time an equilibrium situation isbrought about and no further increase in injection head occurs (Fig. 7.49). The entrainmentof air can easily be prevented by carrying the supply to some distance below the static waterlevel in the well. In the upper part of this pipe, water pressures below atmospheric would stilloccur, unless at the lower end an orifice is installed, giving such a flow resistance that everywherea water pressure 1 – 2 m positive is maintained. With the pressure diagram of Fig. 7.50, thisflow resistance can easily be calculated.
Fig. 7.49 Increase of injection head with time.
air
bacteria
susp ended matter
tim e
sc
Fig. 7.50 Water pressure during injection.

155Energy Management Artificial Recharge Methods 155
When the valve in the supply pipe of Fig. 7.50 is used to reduce the capacity of this particularwell, it should be realized, however, that an additional lowering of the pressure would occur.
The solubility of air in water decreases with rising temperature, meaning that air bubbleswill also evolve when cold recharge water is mixed with warm groundwater. For a temperatureincrease of 10o C, the solubility decreases by a factor 0.8. This can be compensated, however,by a pressure increase from 1 to 1.25 atm, so that no difficulties will arise when the top of thewell screen is more than 2.5 m below the water level in the well. This is always the case.
As already mentioned, clogging by air bubbles is easily recognized by a sharp increase inthe injection head directly fter recharge operations starts, reaching its maximum value alreadyafter some hours (Fig. 7.49). When the operation is stopped, the water in the well will, moreover,foam due to escaping air bubbles.
Presence of suspended matter: Clogging by suspended matter manifests itself by an increasein the injection head, Sc, which, for a particular well and recharge water, grows linearly withtime (Fig. 7.49), while it is proportional to the square of the capacity. This can easily be explainedby assuming cake filtration to occur, the cake having a constant coefficient of permeability, k’,while its thickness, t, increases by the deposition of suspended matter present in a gravimetricconcentration, c, in the recharge water. For a fully penetrating well in an aquifer of depth H,this gives with the notation of Fig. 7.51.
Fig. 7.51 Injection well clogging.
Darcy – Sc = + + ′ π
= ′ + π ′
Continuity – = Π + ′ρ
! " , where ρd is the mass density of the deposits
and (p – p′) the decrease in pore space. Integration between the limits t = 0, l = 0 and t = t,l = l gives, after rearranging terms,

156 Energy ManagementWater Management156
+ = + π ′ ρ
!"
By substitution
Sc = ′ + π ′ π ′ ρ
!"
This looks rather complicated, but with l << ro, it reduces to
ln + = + ≈
Therefore, after substitution,
Sc = ′
′ ′ ρ
!"
Assuming that p′ and thus k′/k has some minimum values, Sc may be simplified
to Sc = α [Q20 ct/(4π2r2
0H2)], where α is a constant.
With the entrance rate
ve = Q0 /2 π r0 H
this may be further simplified to
Sc = αve2 ct
once the value of α has been determined for an existing well, operating with a particularrecharge water, the clogging rate for the other wells in the same formation using the samerecharge water, but having a different capacity, diameter or depth of penetration, can easily becalculated. The results, however, cannot be used for other aquifers or other types of rechargewater as now the values of k′, p′, ρd and thus α are changed in an unknown way. Even theinfluence of the concentration, c, of suspended particles in the same recharge water is lessstraightforward than would follow from the formula given above. Cases are known where cwas drastically reduced by pre-treatment, using chemical coagulation, flocculation, settlingand filtration, without a noticeable change in the clogging rate. Afterwards, this has beenexplained by considering the untreated water to contain negatively charged particles, whichare difficult to retain by the negatively charged sand grains in the formation, leading to deep-bed filtration and a low clogging rate. After treatment, the remaining particles had a positivecharge and were easily captured by the negatively charged sand grains, resulting in cakefiltration and, notwithstanding the much smaller amount, in about the same rate of clogging.The pre-treatment, incidentally, still had advantages as the small amount of penetration alloweda more rapid and more complete removal of the clogging by cleaning. To evaluate the influence

157Energy Management Artificial Recharge Methods 157
of pretreatment, only tests in situ can give reliable results, while filtration tests in the laboratoryare only a poor substitute.
Another problem is that for waters with a low suspended matter content, drinking waterfor instance, there is no relation between turbidity and clogging rate, making evaluation offield tests rather difficult. More meaningful results in this respect can be obtained withmembrane filter test, whereby the water to be investigated is filtered at a constant head (2 atm)and a constant temperature (10o C) through a membrane with a specified diameter (42 mm),having very fine openings (0.45 µm). With the notation of Fig. 7.52.
Fig. 7.52 Membrane – filter test.
Darcy - z0 = zmembrane + zcake
z0 =π
#
π β + = ′ β + ′
$
#
continuity = πρ
! " #
and with the value of Q given above
dt = ρ β + ′
!$
integration between the limits t = 0, l = 0 and t = t, l = l gives
t = ρ ′ β + β ′
!$
constant z0
cake, pe rm eab ility k ’m em bran e
D
Q


159Energy Management Artificial Recharge Methods 159
Fig. 7.54 Decrease of turbidity and MFI by rapid filtration as a function of the iron dose.
Fig. 7.55 Relation between clogging rate and membrane filter index.
During well injection, the physical and chemical environment of the recharge water changes,by which dissolved impurities may be transformed into suspended ones. Small amounts of ironand manganese present in any recharge water may fall out by contact flocculation or may beprecipitated, together with carbonates, by changes in pH and redox potential, again resultingin clogging by suspended impurities. The removal of clogging by suspended matter can easilybe obtained by well cleaning, but it is seldom 100% effective.
Growth of bacteria: Bacteria are also suspended matter, but their combined volume is extremelysmall. With, for instance, 100 bacteria/cm3, each with a volume of 2 µm2, the suspended mattercontent of the recharge water equals 0.2 parts per billion, from which no clogging needs to befeared. Bacteria, however, are living things and multiply rapidly. In time t, their number growthsfrom n0 to n according to
M FI
100
10
01
5 10 15 20 25 30 35 40
turbidity
M FI
tubidity(FTU)
1.6
1.4
1.2
1.0
0.8
0.6
0.4
0.2
Fe (m g/l)3 +
100
10
10 .1 1 10 100
fo r ve = 1 m /hou r at 10°C
M FI (s/ l )2
c logg ing rate in m /year

160 Energy ManagementWater Management160
n = n0 e0.693t/Td
with Td as the doubling time. With an entrance velocity ve, the number passing the wall of theborehole in time dt equals
dN = ve no dt
In time t, this number increases to
dN = venoe dtt Td0 693. /
giving at a time T after injection starts
N = v n e dte ot T
T
d0 693
0
. /z = veno Td
0693. e t Td0 693 1. / –d i
Assuming ve = 1 m/hour = 24 m/day, no = 100/cm3 = 108/m3, Td = 0.3 day, then afterT = 1, week = 7 days
N = 24 × 108 ×0 3
06930.693 7 0.3.
./e ¥ = 1.1 × 10¹⁶
With a volume of 2 (µm)3 = 2 × 10–18 m3 each and a porosity of 45%, this means a layer witha thickness
l = 11 10 2 10
0 554 10 4
16..
–18–2¥ ¥ ¥ = ¥ =m cm
after some time completely sealing the wall of the borehole. Real situations in the meanwhileare less dramatic, as the calculations given above pre-suppose an unlimited food supply. Thisfood, however, is only present in small amounts in the recharge water, meaning that alreadyafter short time equilibrium situation arises, where the available food is used to maintain thepopulation at a constant number (endogenic respiration) and no further growth occurs. Duringthis endogenic phase, bacteria need about 0.03 kg BOD per day and per kg of dry matterconforming to a volume of roughly 10 l. With an entrance rate of 1 m/h and recharge waterwith a BOD of 5 mg/l the food supply equals 0.120 kg BOD m-2 day-1, which is able to maintainindefinitely a 40 mm thick layer of bacteria.
From the description given above, it will be clear that the rise, Sc, in the injection head dueto bacterial clogging reaches its maximum value already after some days (Fig. 7.49). Whenlarge amounts of biodegradable matter are present in the injection water, a complete sealing ofthe well may occur within 1 or 2 weeks. Bacteria preferably grow where their food supply ismost abundant, that is, in the well screen openings and the gravel pack when present and herethe resistance will be concentrated (Fig. 7.48). Growth of bacteria can be prevented in twoways: (i) by removing their food prior to injection, for instance, by a preceding slow sandfiltration; (ii) by killing the bacteria with chlorine, maintaining inside the well a residual of 1 –2 ppm.
Clogging caused by bacteria can easily be removed by burning them away with chlorine.Some operators prefer to do this once or twice a year instead of the continuous chlorination

161Energy Management Artificial Recharge Methods 161
mentioned above under (ii). Bacterial clogging disappears by it when the well is taken out ofservice and the food supply stops. The ensuing putrefaction, however, may impart a horribletaste to the water present in the formation.
Reactions involving the recharge water: For completeness, it may be recalled that reactionsbetween the two types of water can only occur at the start of the injection process, at theinterface between the recharge water and the displaced native groundwater. In fine-grainedformations, this mixing zone is narrow and no adverse effects need to be feared. In coarsegrained and fissured rock formations, an appreciable amount of mixing may take place, buthere the openings are so large that the reduction in permeability by the deposits formed isagain small. The most important reaction follows the mixing of anaerobic groundwatercontaining ferrous iron with aerobic recharge water, producing insoluble ferric oxide hydrates.To be doubly safe, the recharge operations proper could be preceded by an injection of anaerobicwater, pushing the zone of possible reactions to such a distance away from the well that theincrease, Sc, in the injection head is always negligible.
The adverse effects between the recharge water and the aquifer material mainly concernthe swelling and dispersion of clay particles, present as silt in the formation. This clay consistsof small negatively charged threads, plates or flocs, kept together by positively charged ions, inparticular, by those having a multiple charge. In aquifers containing fresh water, the swellingof clay particles and the reduction of pore space occur when the ratio between Ca2++ Mg+
and Na++K+ is reduced and/or the ionic strength is lowered. This can probably be preventedby choosing another type of recharge water or by adding CaCl2 to the recharge water. It mayfurther be reduced by a pre-flush with water containing high amounts of CaCl2. When freshwater is injected into a saline aquifer, the processes of mixing and cationic exchange producea zone of advancing water with the low ionic strength of fresh water and the high SAR valueof saline water. This combination strongly reduces electrostatic bonding and produces theswelling and dispersion of clay particles when present. The dispersed clay particles are entrainedby the flowing water over considerable distances, but sooner or later they are captured in theconverging spaces between adjoining sand grains, thus decreasing pore space and permeability.Flushing with CaCl2 to increase the bonding strength is again a preventing measure, but it isnot always effective. Polyvalent metal ions give better results, but they may not be applied indrinking water practice.
The cleaning of wells clogged by the swelling and
dispersion of clay particles in the surrounding aquifer has only very limited effects.
Mechanical jamming: With a dual-purpose well, the direction of flow reverses periodically,which might lead to a decrease in pore space, lowering the permeability of the formation in theimmediate vicinity of the well (mechanical jamming). The influence on the rise Sc in the injectionhead can be calculated in the same way as indicated below:
Sc = ′ + π ′

162 Energy ManagementWater Management162
With, for instance, Q0 = 10 × 10–3 m3/, k = 0.3 × 10⁻³ m/s, k′ = 0.7 k, H = 30 m,r0 =0.3 m, then
l(m) 0.5 1.0 2.0
Sc(m) 0.08 0.11 0.16
meaning that adverse effects are small.
Summing up, it may be said that injection well clogging by air bubbles and bacteria caneasily be prevented, while clogging due to mechanical jamming is rare and its influence on therise, Sc, in the injection head always small. Clogging due to the interaction between the rechargewater and the aquifer material can only partially be prevented by the addition of chemicals,which may adversely affect the quality of the artificial groundwater recovered. Looking foranother site or another quality of recharge water may now be a better proposition. Clogging bysuspended matter can be prevented to a large degree by pre-treatment, but this may involvehigh costs of operation. This clogging can also be removed by well cleaning and in many casesthis is more economic solution.
7.13 CLEANING OF INJECTION WELLSEven with good quality recharge water, injection wells clog easily and they should thereforealways be designed and constructed in such a way that an effective cleaning can be obtainedwith simple means. In many cases, moreover, this offers a more economic solution than upgradingthe pre-treatment to prevent clogging from taking place. The cleaning of injection wells can beeffected in three ways: (a) at short intervals, varying from about once a day to once a month,by simple back pumping at about the same capacity as the injection rate for a period of about0.25 h. This procedure can even be executed automatically, obviating the need for labour. (b)at long intervals, ranging from about 6 months to 5 years, using more intensive hydraulicmeans such as back-pumping at high rates, treating the screen section by section and, inparticular, by the creation of flow reversals, (c) only when the treatment mentioned under (b)is not adequate, it may be followed by the application of chemicals to liberate, disintegrate,disperse and dissolve clogging matter. This chemical cleaning is dangerous, both for the welland for the operating personnel and should therefore only be practiced as a last resort.
Back-pumping: Stopping the injection and pumping the well creates a flow reversal, whichfirst liberates the clogging material in the gravel pack and at the formation wall, and then pullsthis material through the screen openings into the well and out through the pump. Whenclogging is due to suspended matter in the recharge water, back-pumping for 5 – 15 minutes atabout the same capacity as the injection rate removes some 80% of the increase in the injectionhead, Sc. Pumping for longer periods makes little sense, while increasing the capacity to 3 – 5times the injection rate perhaps removes another 10% of Sc. The most attractive combinationof pumping rate, pumping period and intervals between pumping varies from one well to anotherand should be established each time anew by field trials. Pumping should start at a low rate toprevent excessive drawdown and a collapse of the well casing and screen. Otherwise, thiscleaning method is simple, hardly affects the total amount of water injected, can be done

163Energy Management Artificial Recharge Methods 163
automatically, but it requires the presence of a pump and possibility of discharging the dirtywater. With dual-purpose wells, this is seldom a problem, but with single purpose wells, theinstallation of a submersible pump with discharge piping may be rather expensive.Notwithstanding their low efficiency, air lift-pumps, as shown in Fig. 7.56, may now be moreeconomical proposition with the added advantage of low maintenance costs. However, pumpinglowers the groundwater table and a small-saturated thickness, which are otherwise very wellsuited for artificial recharge. In some cases, this problem can be solved by installing a batteryof, for instance, eight small-diameter recharge wells at a distance of, say, 3 m around the injectionwell to be cleaned.
Fig. 7.56 Air lift pump for a regular cleaning of injection wells.
Fig. 7.57 Hydraulic cleaning of well screens.
back-pum ping
groundwater tableduring in jection
during back-pum ping
in jection
air

164 Energy ManagementWater Management164
More intensive hydraulic methods: When the cleaning method is not feasible or not effectivein the long run, more vigorous means must be applied. Scrubbing with brushes removes depositson the inside of a well screen and casing. Slots in the well screen may be cleaned with powerfulwater jets directed horizontally outward, as shown in Fig. 7.57. These jets also agitate andclean the inside of the gravel pack, while a submersible pump removes the liberated cloggingsimultaneously. To clean the outside of the gravel pack and the formation wall, large values ofthe entrance velocity, ve, are necessary, which can be obtained by treating the screen sectionby section, for instance as shown in Fig. 7.58. This is particularly effective when the gravelpack has been clogged by, for instance, bacterial growth or iron deposits, but due to shortcircuiting (Fig. 7.59) it is of less help to remove clogging at the formation wall.
These clogging, mainly originating from suspended solids in the recharge water, clingtenaciously to the grains of the formation and are very difficult to dislodge. Straight pumping,even at high entrance rates, has often little effect and the best way to liberate them is thecreation of flow reversals. Once they are free, they can easily be pulled through the gravelpack and screen openings into the well and out through the pump. Flow reversals can beaffected in different ways, but in the case under consideration the use of compressed air, asshown in Fig. 7.60, is most simple and effective. The operation starts with the air cock openand the three-way valve turned so as to deliver air down the air line. The combination of droppipe and inside airline operates as a regular air lift pump, abstracting water from the well andout through the discharge pipe. After the water has become clear, free of suspended matter,the supply of air is cut off and the water in the well is allowed to regain its static level.
Fig. 7.58 Cleaning a well Fig. 7.59 Short-circuiting Fig. 7.60 Cleaning of injectionSection by suction. during sectional cleaning. wells using air.
The air cock is now closed and the three way valve is turned so that the air supply isdirected down the bye pass to the top of the well. This air forces the water out of the casing
well screen
gravel pack
form ation wall
aqu ifer
to pum p
ve
subm ersible pum p
rubber cuff
electric motor

165Energy Management Artificial Recharge Methods 165
and back through the screen openings into the formation, agitating the sand and loosening theclogging. After the water level has been lowered to the bottom of the drop pipe, the air willescape upward through this pipe, without the danger of air clogging the formation. The aircock is now opened, allowing a rapid rise of the water level in the well and inflow of groundwaterat high velocities. This inflow is further promoted by directing the air supply down the airlineto pump the well. The procedure is repeated several times, until the pumped water has becomeclear and no more debris can be drawn into the well. Sometimes it is necessary to remove thewashed-in material by boiling, to keep the well screen active over its full length. From thedescription given above, it will be clear that hydraulic cleaning is a rather complicated operation,taking 1-2 days to perform. Keeping injection wells operable in this way is therefore only anacceptable proposition when the intervals between cleaning are long, e.g. more than one year.
Chemical cleaning: In some cases, the clogging material is so strongly attached to the grains ofthe gravel pack and surrounding formation, that the shear stresses created by hydraulic cleaningare inadequate to dislodge them. The surging described above must now be preceded by chemicaltreatment of which the most important are: (1) Chlorine or chlorine compounds, such as sodiumhypochlorite (NaOCl) or calcium hypochlorite [Ca(OCl)2], to burn away deposits of bacterialslimes. Moreover, they kill the bacteria present and when the distance over which this occurs islarge, subsequent growth of bacteria is greatly retarded. (2) Acids, such as hydrochloric acid(HCl), sulphuric acid (H2SO4) or sulphamic acid (NH2SO3H), to dissolve deposits of calciumcarbonate, magnesium hydroxide and iron and manganese oxide hydrates, which moreover actas cementing agents forming thick encrustations around the well screen. (3) Polyphosphates todisperse deposits of iron and manganese oxide hydrates, silt and clay particles.

This pageintentionally left
blank

88888 CASE STUDIESCASE STUDIESCASE STUDIESCASE STUDIESCASE STUDIES
8.1 IN SITU WATER HARVESTING FOR DRINKING WATER SUPPLY ATCHERRAPUNJI, MEGHALAYA
Cherrapunji has the dubious distinction of being one of the highest rainfall places in theworld and still suffering a shortage of drinking water supply in the pre-monsoon months.The situation is prima facie paradoxical as it indicates water scarcity in the midst of superabundance of precipitation.
Cherrapunji is located on the southern fringe of the Shillong plateau, on an E-W trendingescarpment at an altitude of 1310 m. Traditional water supply to the town is through thespring issuing from surrounding hills. The annual rainfall is about 11,000 mm, most of itcoming in the period June to September. The local rock is limestone. These escarpments aredevoid of any soil cover because of the intensity of rainfall and consequently have hardly anyvegetative cover. It is claimed that the discharge from the springs has declined but no one hasactually measured this. The reason for scarcity, therefore, seems to be an increase in populationand per capita consumption.
Roof water harvesting, introduced by the public health engineering department ofMeghalaya, comprises the collection of rainwater from house rooftops through gutters, itsfiltration and subsequent storage above the ground in a reservoir with an average storage of 7cu.m. These systems are designed to supply 10 liters per capita per day for 90 days. The lifespan of the system is about 15 years with the costs worked out to Rs. 14,000 per cubic meterin the year 1991.
The alternative technology comprising in situ water harvesting is described here. Pits ofsize 10m × 10m × 10m at elevated sites close to a cluster of 10 –12 houses can be constructed.The cost of such a pit, with concrete lining, reinforced concrete roofing with inlet holes,distribution pipelines, two transient storage galvanized iron tanks etc. based on the 1990-91rate schedule of PHED of Meghalaya, works out much cheaper than the system developed bythe PHED. In addition, such situ systems are able to supply water at a rate of 40 lpcd throughoutthe year to an estimated population of 60 persons living in this cluster of 10 – 12 houses. Thiswater supply will be by gravity flow as in the case of the water supply from springs. Thedissolved solids and iron content will be lower than the permissible limits. It may require
168 Energy ManagementWater Management168
chlorinating treatment for organic contamination but this also happens with water suppliedby the PHED (Athavale, 2001).
Other options for improving the water supply situation for Cherrapunji town are gullyplugging, creating open wells in streambeds and storing the water in abandoned limestonequarries and augmentation of spring discharge by constructing horseshoe shaped subsurfaceimpervious barriers below the discharge point (Athavale, 1991).
8.2 CASE STUDIES OF ARTIFICIAL RECHARGE(a) Artificial Recharge Project in Amravati and Jalgaon District of Maharashtra
The artificial recharge project undertaken by Central Groundwater Board, central region, Nagpur,in orange growing areas of Warud, Amravati District and the banana growing areas of Jalgaondistrict, has demonstrated the feasibility of utilizing simple structures like percolation tanks,check dams, recharge dug wells and recharge shafts. The findings of the project in Amravatidistrict are (1) Efficiency of the percolation tanks constructed under the project varies from 78to 91%, (2) Efficiency of cement plugs varies from 81.1 to 97.5% and (3) Construction of asubsurface barrier increased the water level on the upstream of this structure by 3 m.
The findings of Jalgaon district are: (1) Efficiency of percolation tanks constructed in theproject varies from 95 to 97%, (2) Disused dug wells can be used as a recharge shaft to augmentthe depleted aquifers and (3) Artificial recharge through injection tube wells is feasible (Sharmaet al., 1998). The experimental results prompted the local people to participate and adopt someof these methods individually. This is one of the major achievements of this project. Theaugmentations of groundwater through percolation tanks is a viable methodology to replenishthe depleting alluvial aquifers in the districts of Dhule, Jalgaon, Akola, Buldhana and Amravatiof Vidarbha region in Maharashtra.
(b) Artificial Recharge in Mehsana Area and Coastal Saurashtra, Gujarat
A project on augmenting the depleted aquifers in the Mehsana area was conducted by theCentral Groundwater Board. They simultaneously undertook a project on artificial rechargefor controlling the saline ingression in the coastal belt of Gujarat. Both projects receivedassistance from the UNDP (Phadtare, 1982).
After detailed hydrogeological surveys and groundwater draft estimation, the alluvial areaaround Kamliwara in the Central Mehsana area was selected for pilot experiments on artificialrecharge through pressure injection and surface spreading methods during 1983. The sourceof water drawn for the artificial recharge through pressure injection test was from the phreaticaquifer below the Saraswati riverbed. Since groundwater was used for artificial recharge, theinjection water was devoid of silt and other impurities and probably chemically compatiblewith the water getting recharged in the aquifer. The experimental results did not show anyadverse effect of clogging. The pressure injection experiment was conducted continuously forabout 250 days with an average injection quantity of 225 cubic meters per day. During therecharge cycle, a rise in water level of 5 meters in the injection well and 0.6 to 1.0 m in wells150 meters away from the injection well were observed. The higher rate of injection

169Energy Management Case Studies 169
continuously for about 250 days was probably sustained because of contemporaneouswithdrawal from the aquifer through nearby irrigation wells.
In Mehsana area, artificial recharge experiments through the spreading method were alsoconducted using canal water. A spreading channel of 3.3 meters width, 400 meters in lengthwith 1:1 side slope was constructed and the canal water was fed for 46 days. The recordedbuildup in water level of 3.5 to 5.0 cm was observed up to 15 m from the recharge channel andabout 20 cm at a distance of 200 m. A recharge rate of 260 cubic meters per day was estimatedusing an infiltration rate of 17 cm/day. Dissipation in recharge mound (1.42 in) was observedin 15 days.
Another experiment using a recharge pit (1.7 in × 1.7 in × 0.75 in) to study the feasibilityof recharging the shallow aquifers was conducted at Dabhu in central Mehsana area. Canalwater was used for the experiment and the pit was covered to prevent dust deposition andevaporation losses. It was reported that during the recharge phase of 60 days, the recharge wasat the rate of 17.3 cubic meters per day with an infiltration of 0.5 m/day. A rise of 4.13 m in thewater level was observed at a distance of 5 meters from the recharge pit. Both these rechargemethods were effective in alluvial areas.
Artificial recharge through pressure injection technique was tried on a pilot scale usinggroundwater from a phreatic aquifer for a short period in the Mehsana alluvial aquifers. Tiwariand Srivastav (1983) have reported the results of this experiment. The source well was locatedin Saraswati River and the water was carried to an injection well at a distance of 130 meters bya 10 cm (diameter) pipeline. On-line flowmeter and pressure gaugeswere fitted to monitor theflow rate and cumulative quantity and to record the pressure developed during the injectionexperiment. The injection recharge experiment was conducted with 8 liters per second (lps)rate for about an hour. The injection rate was increased to 12 lps and the test was continuedfor 90 minutes. A drastic reduction in recharge rate (3 lps) was reported and the cause ofreduction was attributed to back pressure, due to clogging of the injection well. Due to wellclogging, the water level could not reach its initial static level even after eight days. Though inthis case, the silt free shallow groundwater was used for recharge, the observational resultsclearly indicate the necessity of understanding probable clogging problems, which may arisedue to many other factors apart from silt entry.
Studies on control of salinity in coastal Saurashtra using the spreading and injection methodshave indicated that the recharge pit and the injection shaft can affect recharge at the rate of192 and 2600 cubic meters per day respectively. Canal water was used for these rechargestudies. It was reported that problems in land acquisition in this highly developed area make itdifficult to select suitable sites for spreading structures.
The Gujarat Water Resources Development Corporation conducted pressure injection test,for a short period, in 1974 near Ahmedabad city. Processed water from the city water workswas injected for 72 hours in a deep tube well and a pressure varying between 80 and 100 psiwas applied with a rate of 45 liters per second.

170 Energy ManagementWater Management170
(c) Analysis of Two Tanks in VUDA area for Artificial Recharge
The Vadodara Urban Development Authority (VUDA) desired to model two existing villagetank by increasing capacity by desilting, increasing height of tank and provide a water weir, ifnecessary. It is also desired to use stored water in tank for recharging surrounding area throughinjection wells.
The VUDA area is formed of typically alluvial fill material of fluvial and marine origin depositedduring the Quaternary period (last 1 million years) of the geological history. The alluvium iscomposed of alternative layers of sand and clays. The sandy layers from the aquifers yieldgroundwater. The thickness ratio of sand to clay in the area is approximately 1:4. The aquifersbelow the depth of 100m contain highly saline water (TDS above 10,000) and are not useful.The aquifers up to the depth of 100m i.e. up to blue clay horizon contain mix quality zones offresh and brackish water (TDS 2000 – 4000). The blue clay marks the total marine origin oflower formations, while upper formations are of fluvio-marine origins. It is important to notethat the aquifers to be developed have limited storage capacity and have relatively poor quality.A comprehensive summary of well inventory results of the study area is given in Table 8.1.
Table 8.1 Summary of well inventory
Sama Chhani
OW TW OW TW
Aquifer TypeUC SC UC SC
Wells No.4 33 - 39
Depth m 10-17 50-70 - 60-100
Diameter mm 3000 150-200 - 200-250
SWL (1999) m 8-10 15-30 20-25 -
Pump Hp 5 5-15 - 30
Discharge lpm 30 300-600 - 800-1500
Quality B B B B, SuUse D D, I - D, I
Aquifer type: UC – Unconfined, SC – Semiconfined
Quality: B – Brackish, S – Saline, Su – SulphateUse: D – Domestic, I - Irrigation
Three exploratory bores of 200mm diameter and 30 – 45m depths, one each on the bank ofthe existing village tank have been taken for the study of aquifer material, water level andquality. The bores were converted into shallow tube wells by providing blind/slotted PVCcasing and gravel pack. They were used for determining permeability by pump out tests.Recharge tests were carried out by adding clean water from outside source.
The bore at Sama, drilled up to 32m depth encountered two aquifer layer; 10.5-21.0m and 16.0-30.0m depth. These have been provided with 110mm PVC slotted pipes. The top 10.5m is yellowsilty soil and the two aquifers have been separated by 8m thick (18-26m depth) yellow silty clay.
Particular Unit

171Energy Management Case Studies 171
The bore at Chhani encountered two aquifer zones; first, 18m thick (10-28m depth) and second,13m thick (33-43m depth) of fine to medium sand and gravel deposit. The top soil of clay, silt andsand mixture was encountered up to 10m depth. The yellow silty clay, with kankar of 5m thickness(28-33m depth) separates the two-aquifer zones. While developing the hole, the lower 10m thickzone between 33 and -43m depth has been provided with 110mm PVC slotted pipe.
Permeability and Recharge Tests: Permeability tests for Chhani and Sama tanks werecarried out by pumping water at a constant rate and measuring steady state drawdown inexploratory bores.
An observation of in-situ tests permeability tests and recharge tests are as shown in Table 8.2.
Table 8.2 Recharge and permeability tanks
Permeability(cm/sec)
Chhani 29.0 lpm at 14.8m recharge head 4.5 × 10⁻⁴
Sama 14.0 lpm at 3.4m recharge head 7.12 × 10⁻⁴
Based on topographical survey, contour maps and area capacity tables were prepared foreach tank. FRL and area capacity at two tanks are given in Table 8.3.
Table 8.3 FRL, area and capacity of tanks
Tank FRL Area at FRL Capacity at FRL(m) (m2) (m3)
Chhani 36.5 1,50,490 6,40,120
Sama 36.3 56,280 1,52,870
Computer Modeling of Chhani Tank: To carry out recharge study for Chhani tank area, thecomputer model is developed using MODFLOW software developed by US Geological Survey.The study area is discretised into a grid of 114 rows and 119 columns with variable size.Minimum spacing of 9.5m is selected in tank area and the grid spacing was increased awayfrom tank area near constant head boundary. The aquifer is considered as confined withbottom RL as –6.0m and top RL +4.0m. It is assumed that constant head boundary existsabout 800m away from tank boundary.
The results of pumping test were confirmed by model test. For a 37 lpm pumping of a welllocated at row –53 and column –35 and using permeability value of 4.67 m/day, the drawdownwas computed by model as 1.15m as compared to observed drawdown of 1.34m. Hencepermeability of 4.6 m/day is considered for recharge modeling.
Based on available water in the tank and capacity of recharge wells, 20 wells recharging ata rate of 50 lpm are feasible.
In recharge modeling, 20 wells of 50 lpm steady state recharge were considered surroundingthe tank periphery. The static water level was considered as RL 7.0m. After the simultaneous
Tank Recharge Rate

172 Energy ManagementWater Management172
recharge from all 20 wells the resulting water level was obtained by model. The contours ofwater levels are shown in Fig. 8.1. A cross sectional view showing water level mound acrosstank area is shown in Fig. 8.2. The results indicate that maximum water level of 14.7m isachieved near recharge wells. An average water level below tank area is found to be 14.12m.
Fig. 8.1 Water level contour in Chhani tank area.
Fig. 8.2 Cross section xx showing water level rise due to recharge in Chhani tank.
7.5
7.0
7.5
7.57.
57.5
7 .0
7.0
7.0
7.08.5
8.5
8.5
8 .5
8.5
8 .08.0
8.0
8.0
8.0
9.5
9.5
9.5
9 .5
9.09.0
9.0
9.0
9.0
10 .510
.5
10 .5
10.
5
1 0.5
11.0
11.0
11.0
11.0
11 .5
11.5
11.5
11.5
12 .0
12 .0
12.0
12.0
12 .5
12.5
12.5
12.5
13.0
13.0
13.0
13.5
13 .
513 .5
0
020
040
06
0080
01
000
120
014
001
600
180
020
00
2000 1800 1600 1400 1200 1000 800 600 400 200
38
34
10
6
2
3
1
1
37-0 FRL 36-5GL
33-0
14-7 14-12
RECHARG E WELL
RECHARG E MO UND
GL
0 20 0 40 0 60 0 80 0 10 00 12 00 14 00 16 00 18 00 20 00 22 00
Distance (m )

173Energy Management Case Studies 173
Computer Modeling of Sama Tank: To carry out recharge study for Sama tank area, anothercomputer model is developed. The study area is discretised in to a grid of 109 rows and 91columns with variable size. Minimum spacing of 10m is selected in tank area and the gridspacing was increased away from tank area near constant head boundary. The aquifer systemis considered as two confined aquifer layers as shown in Table 8.4.
Table 8.4 Aquifer layers at Sama tank
Top RL Bottom RL Permeability(m) (m) (m/day)
1 + 4.0 + 8.0 0.615
2 + 16.0 + 23.5 0.615
The permeability value is adopted from calculation based on field recharge tests. It isassumed that constant head boundary of 9.0m exists about 800m away from tank boundary.In recharge modeling, 10 wells of 30 lpm steady state recharge were considered surroundingthe tank periphery. As aquifer system is comprised of two layers, it is considered that eachwell is recharging water at a rate of 27 m3/day in top layer and 15 m3/day in bottom layer.The static water level was considered as RL 9.0m. After the simultaneous recharge from all10 wells, the model obtained the resulting water level. The results indicate that maximumwater level of 28m is achieved near recharge wells. An average water level below tank areais found to be 25.5m.
Recharge Scheme: It is proposed that water from village tank will be used for recharge throughrecharge wells. The available water for storage is considered as volume of water between FRLand sill outlet pipe, which leads water, through filter unit to recharge well. Net available rechargewater is considered 80% of total volume, allowing 20% evaporation losses. As all tanks bedcomprise of clay layer, seepage losses are considered negligible. The filter unit is designed asslow sand filter with filtration rate of 3.5 lit/min.
Recharge rate is estimated by recharge test in an exploratory bore at each tank. Number ofrecharge wells possible at each tank is worked out by dividing net volume of recharge water byrecharge capacity exchange of well at each site.
Chhani Tank: SWL at exploratory bore was 30.8m below GL. Recharge rate observed atexploratory bore was found to be 37 lpm with 16.3m head i.e. recharge water level 14.5 belowGL. Considering that inlet pipe from the tank will approximately be at GL, recharge head canbe increased to 25m with recharge level 5.8m below GL. The difference of 5.8m between GLand recharge level is necessary to accommodate filter bed unit of about 2.7m height and pipelosses to supply recharge water from tank to recharge well through filter bed unit by gravity. Itis estimated that recharge rate will be 50 lpm with 25m head.
Area of filter bed will be 50/3.5 = 14.3 m2. An area of 20m2 is provided to allow forreduction in capacity due to clogging. Area of 4m × 5m is provided for filter bed. 4m × 1mdry chamber is provided for installation of control valve and water meter.
Layer

174 Energy ManagementWater Management174
Filter bed to provide with 2 layers of sand (0.4m), 2 layers of graded gravel (0.3m) and onelayer of gravel (0.4m) for laying 100m slotted PVC pipe. Recharge well comprising of 200mhole, 100mm blind/slotted casing and gravel pack.
Volume of water available between FRL 36.5m and outlet pipe sill at RL 33.0m is 468920m3
(604120 – 135200). Net volume available allowing 20% for evaporation losses will be 468920 ×0.8 = 375000m3.
During three monsoon months, there will be overflow. Hence storage will be needed for 9months i.e. 270 days with recharge rate of 50 lpm i.e., 72 m3/day, number of wells will be375000/(270 × 72) = 19.29 say 20 wells.
There can therefore be 20 recharge wells around periphery of tank, at locations, dependingon demand of users.
Rise of water level at recharge well is up to RL 14.7m as against maximum possible RL of33.0 i.e. sill of outlet pipe of filter unit. Additional recharge would have been possible if availablewater from tank was larger. Total recharge from Chhani tank will be 72 m3 per day. If domesticwater supply requirement is considered as 100 liter/capita/day, this can meet requirement of720 persons.
Sama Tank: SWL was 3.4m below GL. Recharge rate at exploratory bore was 14 lpm at 3.4mrecharge head i.e. recharge level just at GL. As exploratory bore was just at bank of tank, GWLwas converted to tank water level. A minimum 3m difference is necessary between outlet pipesill level and recharge level so as to provide filter bed unit and recharge by gravity head. Theexploratory bore site is not suitable for actual recharge well. The recharge well location hastherefore to be at some distance away from tank where GWL is about 10m lower than outletpipe sill. By this way, larger recharge will be available. It is informed that recharge rate can beincreased to 30 lpm if recharge head is increased from 3.4m to 7.0m. FSL of tank is 36.3moutlet pipe sill is provided at RL 34.0m.
Filter bed area will be 30/3/5 = 8.0 m2. However 12.0 m2 (4m × 3m) is provided forprobable clogging of filter bed. 4 × 1m dry chamber is provided to install control valve andwater meter. Filter bed is provided with 2 layers of sand (0.4m), 2 layers of graded level (0.3m)and one layer of gravel (0.4m) for laying 100 mm slotted PVC pipe. Recharge hole comprisingof 200m hole, 100 mm blind/slotted PVC pipe, with gravel pack. Volume of water between FRL36.3 m and outlet pipe sill 34.0 is 152870 – 37540 = 35,330 m3. Net volume available forrecharge is 0.8 × 135330 = 108300 m3. During three monsoon months tank will overflowand hence storage will be needed to be used for nine months only. Recharge rate per well is 30lpm (43.2 m3/day). Number of recharge wells feasible = 108,300/ (43.2 × 279) = 9.2 say 10.
Therefore, 10 recharge wells around periphery of Sama tank are feasible. They may beprovided at location depending on demand of users. Rise of water level at recharge well is upto RL 28.0m as against maximum possible RL of 34.0m i.e. sill of outlet pipe filter unit.Additional recharge would have been possible if available water from tank was larger. Totalrecharge from Sama tank will be 43.2 m3 per day. If domestic water supply requirement isconsidered as 100 liter/capita/day, this quantity can meet requirement of 432 persons.

175Energy Management Case Studies 175
8.3 ARTIFICIAL RECHARGE — SIPHON RECHARGE EXPERIMENT (NATIONAL GEOPHYSICAL RESEARCH INSTITUTE)
An experiment of transferring the supernatant water in the tank to a dry well in the commandarea using the siphon principle was conducted in Anantapur district of Andhra Pradesh.Anantapur district is located in the low rainfall semi-arid tropical belt of India. The averageannual rainfall at Anantapur city is 560 mm (70 years average). Statistical studies indicatedthat the number of events having rainfall greater than 60 mm in a day during the SW monsoonseason is one event per year. The natural recharges studies conducted using tritium injectiontechnique indicated that 7% to 8% of rainfall replenishes the water table aquifer every year.Despite having poor rainfall and recharge, the cropping area in this district has increased from46,000 hectares to 910,000 hectares (ha) over a period of 100 years. The irrigation requirementis met with tanks and groundwater. The total number of tanks in this district is about 1200.Out of these 274 are large tanks having command area of 40 ha or more.
An old minor irrigation tank called Yerracheruvu is located near Kandukunu village. Due toheavy siltation in the tank bed area (more than 2 meters) over a period of about 90 years, thestorage capacity of the tank and the depth of storage have been reduced considerably. The tankevaporation studies indicate that the evaporation rate in the pan, located in the Yerracheruvutank, over the period June 1986 to January 1987 varied from 5 mm to 8 mm per day. Thecumulative evaporation over the period was estimated to be 1.68m column to storage. Because ofsignificant reduction in the storage volume and increase in the area of cultivation in the commandarea of this tank over the years, the surface irrigation has failed to meet the demands of irrigation.This has compelled the farmers to depend on the groundwater from dug-cum-bore wells. Inorder to increase the potential of these wells, the farmers have decided to convert this irrigationtank into a percolation tank by closing the sluice. The dug well lithological section and wellperformance clearly indicate the non-influence of the tank due to poor recharge from the tank bed.
In Yerracheruvu tank, it was noticed that although the tank was full after a thunderstorm,the nearest command area well still remained dry indicating that no percolation was takingplace. A study on transferring the tank water to the dug-cum-bore well near the bund (30meters on the downstream side) was therefore initiated for artificially recharging the aquiferin the command area using siphon principle. The dug well had an in-well borehole to a depthof 16.5 m from the bottom of the dug well. A pit (2.7m× 1.8m × 1.9m), excavated by thefarmer around the borehole for installation of pump was used as a discharge point of the tankwater. A 2.5 cm diameter plastic pipe with a foot valve at the tank end and a control valve atthe pit end was used to transfer the water and for controlling the discharge. A domestic watersupply meter was used to monitor and quantify the discharge during the recharge operations.The siphon recharge approach deployed in Kandakuru tank is shown schematically in Fig 8.3.
The recharge experiment was commissioned on July 16, 1986 and terminated on January20, 1987. The recharge rate varied between 30 and 40 lpm. The recharge rate was adjusted toa steady state level in the pit. Nearly 10,000 cubic meters of water was transferred during theexperiment lasting for 190 days. During the recharge, the turbidity and conductivity of therecharge water was monitored continuously. Well performance monitoring has indicated thata bore well in the neighborhood (500 m away) had improved its yield (from 20 lpm to 27 lpm).

176 Energy ManagementWater Management176
Fig. 8.3 Schematic diagram for siphon recharge.
This pilot scale experiment demonstrated that:
(a) Augmenting the groundwater reserves of an aquifer subjected to overdraft is feasible.(b) Using the traditional tank as a silt trap, the artificial recharge will be effective without
clogging due to suspended matters.(c) Artificial recharge can minimize the losses due to evaporation.(d) The effective storage of a tank can be increased by simultaneous artificial recharge
operations, and(e) The quantum of transfer of tank water to the aquifers can be increased several fold by
using larger diameter pipes for the siphons and several wells in the command area.
Design of “Kund” for Rain Water Harvesting — A Case Study of Churu, Rajasthan
Kund is the complete system for collecting and storing precipitation run off. Kund has twoimportant parts; namely catchment area and storage tank. Catchment area is artificiallyprepared, sloping, impervious structure known as paithan. Storage on the other hand isdone in circular underground tank (also known as Kund or wekk), which is usually placedat the center of the paithan. The storage tanks are filled during monsoon season due tocollection of rainwater over the paithan. Water users are thus left with fixed volume ofwater until the next rainy season. A wire mesh across water inlets prevents debris andreptiles from falling into the well pit. The side of the well pit is covered with lime and ash.Most pits have dome shaped cover (Dhola), or at least a lid, to protect the water. If need be,water can be drawn out with a bucket. The depth and diameter of Kunds depend on theiruse (drinking or domestic water requirements). Fig. 8.4 shows a typical Kund structure inthe Churu district.
S IP H O N F OR A R T IF IC IA L R E C H A R G E E X P ER IM E N T
V IL L A G E : K A N D U K U R U D IS T R IC T: A N A N TA P U R S TAT E : A N D H R A P R A D IS H
SECTION ON "AA "
D U G C U MB O R E W E L L
2 .5 C m o f P V C P IP E F O R S IP H O N
P LA N
KA
ND
UK
UR
UTA
NK
E A R T H E N B U N DA
AA
A

177Energy Management Case Studies 177
Fig. 8.4 Kund, traditional rainwater harvesting structure.
The amount of water harvested from water harvesting scheme depends upon the frequency,intensity and duration of rainfall, catchment characteristics, rainwater harvesting method usedand response of the system that depends on maintenance and operation of the structure. Howlong the supply could last depends upon size of storage and water demand. The quality ofharvested water depends upon design of structure, operational procedures and on educationand sensitization of users on water quality issues.
Use of Kunds is an ancient practice of water harvesting in Thar Desert. The Kunds wereand still are owned mostly by community and some privately. The first known construction ofa Kund in western Rajasthan was during 1607 AD by Raja Sursingh in village Vadi-Ka-Melan.In the Mehrangarh Fort in Jodhpur, a Kund was constructed during the regime of MaharajaUdai Singh in 1759 AD. During the great famine of 1895-96, construction of Kunds was takenup on a wide scale. Unfortunately use of Kunds as rainwater harvesting structures declinedthereafter owing to availability of water through community and other schemes. Thoughsuch schemes have provided drinking water at a high cost for human consumption, cattlehave suffered as they are fed with the available low quality groundwater. Some of the problemsrelated to Kunds are deterioration in quality water with time making it unacceptable,

178 Energy ManagementWater Management178
development of cracks and hence seepage from catchment area and tank, soil erosion due toimproper location/construction of structure, inadequate/sub optimal design, construction andmaintenance of structure, silting of catchment area due to shifting sand dunes and failure ofcleaning the catchment surface before the onset of monsoon etc.
Recently with lot of emphasis on rainwater harvesting, hundreds of such Kunds werebuilt in Churu district under the drought relief works. Many more projects for construction ofsuch Kunds are under active consideration. It is thought that with technical inputs for design,construction and maintenance of these Kunds they can be developed as sustainable, reliableand economical sources of water with improved quality.
Study area: Churu district is located in the North Eastern Rajasthan and is bounded byGanganagar and Hanumangarh district in North, Sikar, Jhunjhunun and Haryana state in theeast, Nagaur in south and Bikaner district in west. It lies between latitude 27°2510 to28°5920 north and longitude 73° 3730 to 75° 4030 east. Average altitude is about 400 mfrom mean sea level. Climate of area is absolutely dry with scanty rainfall. It is very hot duringsummer and very cold during winter. Annual rainfall of various blocks (tehsils) of 2000 to2003 as well as normal rainfall is given in Table 8.5.
Table 8.5 Annual rainfall in Churu District, in mm
Sr. No. Name of Tehsil Normal 2003 2002 2001 2000
1 Churu 355.5 570 288 413 230
2 Sarda Shahar 251 366 110 336 317
3 Ratangarh 420 440 78 257 184
4 Sujangarh 396 371 130 276 352
5 Rajgarh 273 366 210 480 187
6 Taranagar 323 363 157 429 127
There are very few wells in this area for irrigation purpose. The wells, Kuias, Johad andKunds are used for drinking purpose. The water table depth is comparatively shallow towardseastern half of the district (33 to 56 m). It is deeper towards western half and ranges between40 and 115.44 m. Practically there is no river in the district, however, in extremely high rainyevents Kantli river enters in the extreme southern peripheral village of Rajgarh block.
The undulating sand dunes and sandy plains represent the entire district. Fairly open andflat plains have also been observed in Rajgarh and Sujangarh blocks of the district. Isolatedhillocks of considerable height and restricted extension have also been observed towardssoutheastern part of the district at Gopalpura, Dungras, Balera, Rndhisar and Biramsar.However, one or two small hillocks of granite are also exposed towards extreme north ofRajgarh block at village Galar in block, Rajgarh and village Sandan in block Sujangarh.
The main water bearing formation in the district are younger and older alluvium ofquaternary age, tertiary sandstone, Nagaur sandstone, Bilara limestone and Jodhpuri sandstone.

179Energy Management Case Studies 179
The groundwater in the district occurs under semi confined to confined conditions. Theoccurrence of perched waterbodies above saturated zone has also been found in some part ofChuru, Rajgarh and Taranagar block. These bodies have very limited potential of groundwater.The pH of soil is normal (8 to 8.7) and conductivity of soil is good.
Methodology: In order to analyze the present structures, data were collected from 81 existingold as well as recent structures in Churu district. Of these, 13 structures were constructedprior to 1960, 23 were constructed between 1960 and 1980, 1 was from 1980 to 2000. Cost ofmany of the old structures was not available, however those of last year varies fromapproximately Rs. 20,000 to 100,000 depending upon the size of structure.
The life of Kund and the user’s financial condition play a major role in selection ofdependability factor. For drinking water purpose, less risk and so higher dependability factor isconsidered as compared to the irrigation projects. Table 8.6 shows the size of storage tank fordifferent diameter of paithan considering dependability factors of 90% and 70% and runoffcoefficient 0.85.
Table 8.6 Optimum tank capacity for different Paithan diameter
Paithan diameter (ft) 20 30 40 50
Paithan diameter (m) 6.1 9.1 12.2 15.2
Paithan area (m2) 29.2 65.7 116.7 182.4
Dependability factor 90% 70% 90% 70% 90% 70% 90% 70%
Block/Tehsil Optimum tank capacity in liters of water
Churu 4500 7100 10200 16100 18100 28600 28300 44700
Sardarshar 4100 6700 9200 15100 16300 26800 25400 41800
Ratangarh 3700 6400 8400 14300 15000 25500 23400 39800
Sujangarh 5600 8300 12700 18700 22500 33200 35200 51900
Rajgarh 4200 7400 9400 16700 16600 29800 26000 46500
Taranagar 5000 6800 11300 15200 20100 27100 31400 42300
On the basis of data collected of different Kunds, an analysis of their paithan area andcatchment area was made. Figure 8.5 shows the points for each combination of paithan areain ft and storage tank capacity in liters. As can be seen, there are wide variations on storagecapacity for same size of paithan. For example, for 50 ft2 of paithan area, storage tank capacityranging from 32,795 lit. to as high as 269,185 lit. was found. The capacity of tank variedwith local mason or person who designed it and was mostly based on their past experience.A linear trend line shows some correlation between paithan size and storage tank capacitybut correlation is not very strong with R2 (coefficient of determination) value of only 0.42.Correlation equation is:
Storage tank capacity in liters = 2328.9 × Paithan diameter in ft – 32435 (Fig. 8.5)

180 Energy ManagementWater Management180
Fig. 8.5 Relation between Paithan size and storage capacity.
With this equation average capacity of storage tank works out to 14,100 liters for 20 ft2
paithan area and 84,000 for 50 ft2 paithan area, which indicates that most of the time,storage tanks are traditionally designed for less than 50% dependability factor, still someof the tanks were much below the desired storage capacity of 90% dependability factor.For example a 40 ft paithan area tank was found with the storage capacity of only 2,800liters.
A similar analysis of slope indicated that the slope of catchment area varied withconstruction material used, finish of catchment area, and the person who undertook the workof Kund. The slopes varying from 0.75% to 5% were found in existing structures.
The above analysis indicates that some guidelines should be made for optimal design ofsuch Kunds for the future projects to conserve the rainwater at a high efficiency. Also, thestructures need certain considerations for ensuring a better maintenance of the quality ofwater stored. Some recommendations based on the present study are as follows:
1. The paithan size must be calculated based on the required capacity of storage tank,design annual rainfall, dependability factor and tunoff coefficient as suggested above.
2. The demand of water consideration should be based on I S recommendation. TheKund for individual family of 5 members normally should be 20,000 or 22,000 literscapacity.
3. Slope 1.5% is recommended for paithan.4. The storage tank of the Kund should be constructed at the one end of paithan in case
Kund is constructed for drinking water purpose. This will ensure better quality ofstored water, as the users themselves would not contaminate the paithan.
5. A small ditch should be provided at the bottom of Kund to remove water. This willfacilitate proper cleaning of tank from time to time.
6. Over flow arrangement for first flush (for drinking water Kunds) should be made.7. Enough funds should be earmarked for maintenance of Kunds as it was found that in
absence of maintenance the paithan and tanks leaked and so the Kunds become useless.
5000 00
4500 00
4000 00
3500 00
3000 00
2500 0
2000 00
1500 00
1000 00
5000 0
010 40 60 80 100 120 140 1600
Siz
eo
fst
ee r
agew
ay
tan
k
y = 2 328.9 × .32435R = 0.42 05
2
S ize o f P a lth an , ft
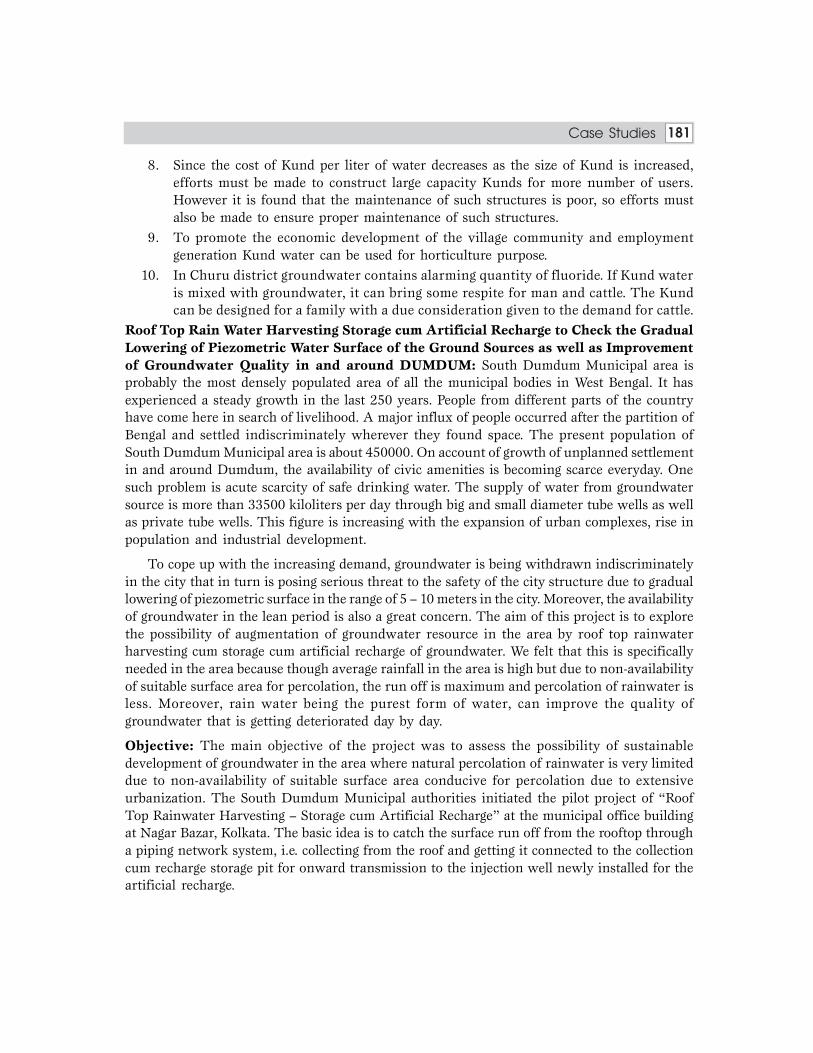
181Energy Management Case Studies 181
8. Since the cost of Kund per liter of water decreases as the size of Kund is increased,efforts must be made to construct large capacity Kunds for more number of users.However it is found that the maintenance of such structures is poor, so efforts mustalso be made to ensure proper maintenance of such structures.
9. To promote the economic development of the village community and employmentgeneration Kund water can be used for horticulture purpose.
10. In Churu district groundwater contains alarming quantity of fluoride. If Kund wateris mixed with groundwater, it can bring some respite for man and cattle. The Kundcan be designed for a family with a due consideration given to the demand for cattle.
Roof Top Rain Water Harvesting Storage cum Artificial Recharge to Check the GradualLowering of Piezometric Water Surface of the Ground Sources as well as Improvementof Groundwater Quality in and around DUMDUM: South Dumdum Municipal area isprobably the most densely populated area of all the municipal bodies in West Bengal. It hasexperienced a steady growth in the last 250 years. People from different parts of the countryhave come here in search of livelihood. A major influx of people occurred after the partition ofBengal and settled indiscriminately wherever they found space. The present population ofSouth Dumdum Municipal area is about 450000. On account of growth of unplanned settlementin and around Dumdum, the availability of civic amenities is becoming scarce everyday. Onesuch problem is acute scarcity of safe drinking water. The supply of water from groundwatersource is more than 33500 kiloliters per day through big and small diameter tube wells as wellas private tube wells. This figure is increasing with the expansion of urban complexes, rise inpopulation and industrial development.
To cope up with the increasing demand, groundwater is being withdrawn indiscriminatelyin the city that in turn is posing serious threat to the safety of the city structure due to graduallowering of piezometric surface in the range of 5 – 10 meters in the city. Moreover, the availabilityof groundwater in the lean period is also a great concern. The aim of this project is to explorethe possibility of augmentation of groundwater resource in the area by roof top rainwaterharvesting cum storage cum artificial recharge of groundwater. We felt that this is specificallyneeded in the area because though average rainfall in the area is high but due to non-availabilityof suitable surface area for percolation, the run off is maximum and percolation of rainwater isless. Moreover, rain water being the purest form of water, can improve the quality ofgroundwater that is getting deteriorated day by day.
Objective: The main objective of the project was to assess the possibility of sustainabledevelopment of groundwater in the area where natural percolation of rainwater is very limiteddue to non-availability of suitable surface area conducive for percolation due to extensiveurbanization. The South Dumdum Municipal authorities initiated the pilot project of “RoofTop Rainwater Harvesting – Storage cum Artificial Recharge” at the municipal office buildingat Nagar Bazar, Kolkata. The basic idea is to catch the surface run off from the rooftop througha piping network system, i.e. collecting from the roof and getting it connected to the collectioncum recharge storage pit for onward transmission to the injection well newly installed for theartificial recharge.

182 Energy ManagementWater Management182
Study of the lithological log of the tube wells constructed in the area indicates that beneatha thick clay bed (35 – 45m) there occurs an aquifer of moderately good groundwater potentialdown to the depth of 45 – 150 m with thin intervening clay layers. This aquifer is being exploitedby a large number of tube wells, as a result of which the groundwater level (piezometric surface)has been lowered considerably in the last two decade. The present disposition of piezometricsurface of groundwater is around 15 m below ground level. It is reported that in the last twodecades there has been a significant drop of piezometric surface level in the tune of 5 to 9 m inthis area. Since the aquifer is composed of medium to coarse-grained sand of moderate permeability,the water harvesting potential is quite high in this aquifer.
Considering different hydrometeorological, hydrological and hydrogeological aspects, it wasdecided to construct roof top rain water harvesting system with primary objective to recharge togroundwater in the underlying aquifer and to create storage of rainwater of 20000 liters capacityfor utilization for the purpose like washing of pavements, car washing, gardening etc.
Based on the size of the roof area, available rainfall in the monsoon months and roofcatchment efficiency, it is considered that a total quantity of 4, 50,560 liters can be availablefrom rainwater harvesting of the rooftop of the building. Allowing a storage facility of 20000liters in the storage tank that has been created, rest of the harvested rain water would berecharged to groundwater.
The other objective was to examine the possibility and extent of qualitatively andquantitatively improvement of the groundwater that is deteriorating increasingly. A monitoringwell is placed at a distance of 100 feet down gradient for surveillance purpose.
Profile of Area: The boundary of the area has always been expanding since its birth. The area hasrailway track as its western boundary from Patipukur to Bediapara, Baguiati canal as its easternboundary, Clive House as its northern boundary and Dakshindari as its southern boundary.
Latitude and longitude of city : 22°28′00′′ : 22°37′30′′80°17′30′′ : 88°25′00′′
Climate :Type of climate : Tropical sub-humid to humidMaximum Temperature : 40.3° CMinimum Temperature : 10° CRainfall:Average Annual Rainfall : 1600 mmDistribution of Rainfall :
January 17.60 mm July 308.70 mm
February 29.40 mm August 320.50 mm
March 35.38 mm September 241.00 mm
April 50.00 mm October 117.60 mm
May 126.40 mm November 32.34 mmJune 273.42 mm December 7.35 mm

183Energy Management Case Studies 183
Geological formation: The area is located on the lower deltaic plain of the Ganga Bhagirathidelta. It is covered by the sediments deposited by the river system flowing through it duringquaternary period. The succession of sediments of Quaternary age consists of clay, silt, fine —medium to coarse sand and occasional gravel and pebbles. Both recent and Pleistocene sedimentshave been deposited successively by the Ganga River as the flood plain deposits. From thestudy of litho logical logs generated from boreholes drilled by different agencies, it can beconcluded that the lithological sequence is topped by a clay layer of 30 – 60 thickness in thisarea. The top clay layer is followed by fine to medium sand layers of clay and sand bed. Thefloor of the quaternary deposits in this area may be fixed at depth between 296m and 414mbelow ground level. Two horizons of pit have been observed in the boreholes between 2 -5mand 12m and 12.6m during the metro railway excavations. The litho log of area is characterizedby the occurrence of a clay bed in the upper part of the sedimentary column and another claybed at bottom. Both the upper and bottom clay beds are dark grey in colour, sticky and areplastic to semi-plastic in nature. A conspicuous feature is the occurrence of fine to coarse sandhorizon mixed occasionally with gravel and sandwiched between clay beds.
The continuity in the sequence of sand, which forms the aquifer material, is broken by theoccasional occurrence of clay lenses of limited lateral extent. The entire sandy sediment up toa depth of 150 meters is on an average moderately well sorted. The borehole lithologs indicatethe occurrence of yellow to brownish coloured sand in the depth span of 20 to 80 m, whichsuggests oxidizing condition of deposition. The colour of the sediments occurring below theabove horizon varies from grey to light grey which appears to have been deposited underreducing conditions.
Hydrogeology: Quaternary sediments having a sequence of clay, silty clay, sand and sandcontaining gravel underlie SDDM area. The upper layer is underlined by coarse clasticconsisting of sand, fine medium and coarse grain mixed with gravel in some places. Thesecoarse clastics form the aquifer. The shallow aquifers that are available within less than 20meters level are water table aquifers.
The sediments exhibit typical deltaic deposition showing facies variation at a few placeshaving sand and pebbles from the aquifer materials. The most prolific water bearing formationis available within 60 – 180 meters consisting of fine to medium sand of 20 – 40 meters thickness.However, in places brackish water aquifers capped the freshwater aquifers.
The piezometric surface of fresh water aquifer on the central part of the city has beenlowered by 5 – 9 meters over the last four decades and as a result of which the flow directionof groundwater has changed from southerly to easterly and south easterly direction. This isdue to over extraction of groundwater compared to natural recharge.
The deeper aquifer in SDDM area is recharged from northern and western part of the areaoutside Kolkata where these sand beds are exposed almost near to the surface. These areas aremainly in Kanchrapara – Kalyani – Ranghat – Shantipur area in Nadia District in North. Thenear surface aquifers of these areas that get recharge mainly from the rainfall and this waterinfiltrates into the deeper aquifers of SDDM area.

184 Energy ManagementWater Management184
With the progress of urbanization, the groundwater withdrawn has been increased to analarming extent. The depletion of the piezometric head has been registered most prominentlyin SDDM area.
As in some areas of SDDM has been a major decliment of piezometric head observed andthe groundwater exploitation can’t be stopped, the need for artificial recharge of this aquifer isstrongly felt.
Rooftop Rainwater Harvesting: From the record, it has been observed that the static waterlevel (SWL) has dropped from 8.84m below ground level in 1994 to 13.85m below groundlevel in 2004, i.e. in the last ten years the SWL has lowered by more than 5 meters. This isindeed an alarming situation and unless augmentation of groundwater is done throughrainwater harvesting, both the quality and quantity of groundwater in the area is bound to beaffected adversely.
Keeping above in mind and office of the Councilors of South Dumdum Municipality, Kolkataentrusted the job of roof top rainwater harvesting cum artificial recharge of groundwater atthe office building of the Municipality. Rainwater harvesting potential of the building wascarried out as per the following details:
Average rainfall per annum: 1600 mm
Rain water collection efficiency = rainfall (mm) × collection efficiency= 80% of maximum rainfall = 1280 mm
Available roof top area in the office building is 550 m2
Height of rainfall = 1.28 mVolume of rainfall = Area × height of rainfall = 704 m3
Coefficient of roof catchment = 0.8Coefficient of evaporation, spillage and first flush = 0.8
Harvested potential = 704 × 0.8 × 0.8 = 450.56 m3 = 450560 litersWork done:
• All the rainwater drop pipes were connected in Ring Main System with a slope towardsthe collection pit.
• SWR water drop pipes of 100 mm were connected horizontally in 150 mm diameterpipes with inclination that was reduced to 100 mm diameter pipes for gaining velocityup to the collection pit. Strainer has been provided for arresting unwanted solids,leaves/straws etc. Arrangement for flushing the first rainwater has been provided beforerainwater enters the collection pit by providing suitable valves.
• 150 mm diameter SWR pipes drawn from collection pit to the recharge pit.• Overflow pipe for recharge pit has been provided.• An air vent above the tubewell is also to be provided.• Sinking of 150 mm diameter tubewell upto a drilled depth of 105 meters and lowered
depth of 99 meters BGL by providing PVC casing pipes and ribbed screens having

185Energy Management Case Studies 185
1 mm slot width. The discharge of the newly sunk tube well had been recorded to be15100 Imperial gallons per hour. During the heavy monsoon period, it has been observedthat the tube well sunk for artificial recharge of groundwater is capable of rechargingall the water that overflowed to the well from the storage tank.
• The total cost of the completed project — Rs. 421,572/-.
Artificial Recharge Experiment for Underground Storage of Water Based on SiphonPrinciple
The principal source of natural replenishment to aquifers is infiltration from precipitation.This annual replenishment of aquifers is limited to a small fraction of precipitation due torunoff and evaporation. The situation is even worse in arid and semi-arid regions like Gujarat,where the loss due to evaporation is high. As a result of rapid development in agriculture andindustry during the last two decades, demand for water in Gujarat has increased enormously.In absence of available surface water supplies, the groundwater reservoir has been subjectedto large-scale exploitation through an increasing number of tube wells by both governmentand private agencies. This heavy withdrawal of groundwater has resulted in lowering thewater level at an alarming rate in parts of north Gujarat. One of the methods of remedying thesituation is artificial recharging of aquifers in this region. A recharge scheme involvingpurification of water through the upper sand layers in the Sabarmati riverbed and its directinjection to a tube well on the riverbank through a siphon arrangement was suggested byPhysical Research Laboratory, Ahmedabad. The construction of tube wells and otherarrangements were done by Gujarat Water Resources Development Corporation.
Experimental Details: A 350 mm diameter shallow gravel packed tube well (depth 21,34m) was constructed in the riverbed of Sabarmati River adjacent to the fair weather bridgelinking Gandhinagar with Ahmedabad via Hansol. This well taps the unconfined aquifer inthe riverbed between 6.04 and 21.34 m below riverbed level. This well (source well) is usedto supply adequate quantity of naturally filtered river water. The water from the source wellflows into a deep tube well (depth 238 m), (hereafter called injection well) tapping confinedaquifers below 74 m depth. A schematic diagram showing the arrangement of source well,injection well, connecting siphon pipe and observation well at the site of experiments isshown in Fig. 8.6.
The injection recharge experiments was started at 10.53 hours on 29th May 1977 andcontinued till 15.55 hours on 7th June 1977, when it was stopped for studying the dissipationor recharge mound. The priming of the siphon was adopted by evacuating the siphon pipeusing a water ring type vacuum pump of capacity 50 m3/minute. During the period of experimentwater level fluctuations in (i) injection well and (ii) the observation well was regularly monitoredat suitable intervals. Recharge rate during a given interval was computed from the readingsshown by a flow meter on the siphon pipe.
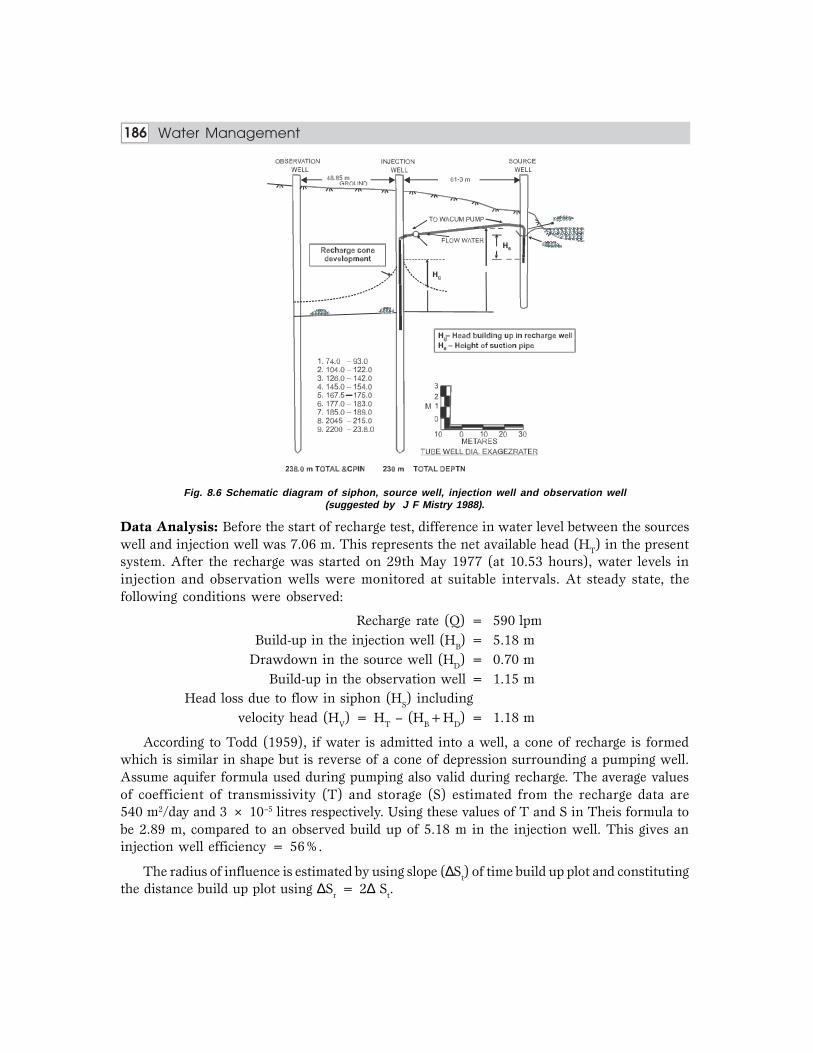
186 Energy ManagementWater Management186
Fig. 8.6 Schematic diagram of siphon, source well, injection well and observation well(suggested by J F Mistry 1988).
Data Analysis: Before the start of recharge test, difference in water level between the sourceswell and injection well was 7.06 m. This represents the net available head (HT) in the presentsystem. After the recharge was started on 29th May 1977 (at 10.53 hours), water levels ininjection and observation wells were monitored at suitable intervals. At steady state, thefollowing conditions were observed:
Recharge rate (Q) = 590 lpmBuild-up in the injection well (HB) = 5.18 m
Drawdown in the source well (HD) = 0.70 mBuild-up in the observation well = 1.15 m
Head loss due to flow in siphon (HS) includingvelocity head (HV) = HT – (HB+HD) = 1.18 m
According to Todd (1959), if water is admitted into a well, a cone of recharge is formedwhich is similar in shape but is reverse of a cone of depression surrounding a pumping well.Assume aquifer formula used during pumping also valid during recharge. The average valuesof coefficient of transmissivity (T) and storage (S) estimated from the recharge data are540 m2/day and 3 × 10⁻⁵ litres respectively. Using these values of T and S in Theis formula tobe 2.89 m, compared to an observed build up of 5.18 m in the injection well. This gives aninjection well efficiency = 56%.
The radius of influence is estimated by using slope (∆St) of time build up plot and constitutingthe distance build up plot using ∆Sr = 2∆ St.

187Energy Management Case Studies 187
Using the formula for steady uni-directional flow in a leaky artesian aquifer (Huisman, 1972),the permeability (k) of the unconfined aquifer in the riverbed is estimated to be 70 m day.
It was earlier shown that at steady recharge rate, loss of head due to flow of water throughthe siphon (i.e. Hs + Hv) is 1.18 m. However, for recharge rate of 590 lpm through 200 mmdiameter siphon pipe the velocity head is only 5 mm and hence not considered. Using tablesbased on William and Hazen’s formula for estimating head loss through a 200 mm diameterstandard pipe, the equivalent length of the siphon pipe for the observed head loss of 1.18 mworks out to 1180 m. This, when compared with the actual, 75 m length of siphon pipe indicatesthe extent of head loss due to: (i) Entrance, (ii) two 90° bends, (iii) pipe joints and welding,(iv) sluice valve, (v) flow meter, (vi) sudden contraction and expansion (there is 2 m segmentof 150 mm diameter pipe in the line), (vii) several ups and downs and (viii) exit of water etc.Head loss due to all these, affects the recharge rate of system adversely. In suitably designedsiphon, it is possible to reduce this head loss significantly as has been shown later, to achievea higher recharge rate through the system.
The efficiency of the injection well is observed to be about 56%. For economical rechargingoperation, it is desirable to have wells with as high efficiency as possible. In practice, it may notbe difficult to construct wells with 75 – 80% efficiency. Increased efficiency of the injectionwell will result in lesser build-up in the injection well, which in turn results in an increasedavailable head for siphon and ultimate increase in the recharge rate. In the following we estimatethe increase in recharge rate for assumed well efficiencies and improved low resistance PVCsiphon keeping other parameters of the experiment constant.
Using the values of coefficient of transmissivity (T = 540 m2/day) and storage(S = 3 × 10⁻⁵ litres) as determined from the recharging test, steady state build-up (HB) forvarious injection well efficiencies (56%, 70%, 80% and 90%) has been calculated for differentrecharge rates. This formula has been used in these calculations. Steady state draw down (HD)in source well for different recharge rates have been estimated using the value of 18 hydraulicconductivity (K = 70 m/day) estimated earlier from the recharge test. Source well efficiencyis assumed 100%.
The loss of head in the siphon (Hs) can be easily reduced to 30% of its present value byreducing the number of bends, welded joints etc. and by using a continuous non-collapsible 200mm diameter PVC pipe. It can be seen from Fig. 3 (P 203 JFM) that in the improved systemsteady state rate of recharge at Hansol may be expected to be 680 lpm for 56%, 800 lpm for 70%,890 lpm for 80% and 970 lpm for 90% injection well efficiency. The expected recharge rate inAhmedabad (for a minimum available head of 25 m) by using this system will be higher than2170 lpm for 56%, 2500 lpm for 70%, 2700 lpm for 80% and 2990 lpm for 90% injection wellefficiency. It may be noted that in estimates made above, the value of Transmissivity and availablehead considered are lower than those estimated by Sharma and Desai (1974) at Ahmedabad (T= 745 m2/day) and HT > 30 m) and therefore the projections made are in fact conservative.
Consequent upon increase in recharge rate, the velocity of water across the screens, inboth injection and source well will increase. In order to minimize corrosion and to reduce, anypossible suction of silt from the source well it is desirable to increase the open area of screens.

188 Energy ManagementWater Management188
This may be easily done by increasing the well diameter and changing the design of slottedsection and artificial filter.
8.4 WATER QUALITY IMPROVEMENT BY ARTIFICIAL RECHARGE — KANHAPROJECT, VADODARA
Geology: The site is covered by a recent to sub-recent alluvium formation followed by tertiarybeds. The details of the bore well dug by GWRDC in Kalali have been mentioned in the datacollection. From available lithological data, it can be said that aquifer stratification of the study areaconsists of topsoil upto 3.5m followed by yellowish clay layer upto 10m, which is underlain by dullbrown sandy strata of thickness 37.8 m. The next sandy layer is preceded by sticky reddish brownto yellowish clay layer of about 17m. Information beyond 61.2 m below ground level is not available.The depth to water table varies between 14 and 18 meters, across the site according to topography.The landfill site lies on the northwest side of the tributary of Vishawamitri River.
Description of the Problem: The case can be considered as contamination of groundwaterresource by leachates. The contaminated discharge well (having diameter 200 mm and 110 ftdeep) under study is located at Kanha project in the vicinity of the VMC landfill. The mainreason of contamination being that the landfill is located near the tributary of Vishwamitri River,which overflows during monsoon and floods the landfill site and hence there is a potential forhigh leachate generation (Fig. 8.7). Secondly, the leachates generated from the landfill can penetrateinto the ground and thus contaminate the underlying aquifer since the landfill has not beenoriginally designed to accept waste and there is no information available regarding placement ofgeomembrane or any other such material at the base, which acts as a barrier. Henceforth, the riskof having a high volume of leachates and its subsequent seepage into the ground is high. Thethird reason is that contamination by leachate poses a great threat to groundwater resourcessince leachates contain multiple pollutants, which might not be easy to remove or treat.
Fig. 8.7 Landfill site.
As the remedy was to be designed for a single well, privately owned by Kanha Project, thecost effectiveness of the remedy was of foremost importance. Hence solutions such as themethod of “pump and treat” in order to contain the contaminant plume were not feasible. So,the technique of artificial recharge was selected as a remedial measure and a recharge well


190 Energy ManagementWater Management190
The outcome of the study will provide an insight of the existing situation and can also beused to aid in decision making for planning issues such as issues related to remediation of thecontaminated aquifer, water resources development, health hazards, etc.
Fig. 8.9 Storage sump to collect rainwater from terrace.
Table 8.7 Groundwater quality of discharge well under study before and afterintroduction of the recharge well
Before After SO-10500:199 (F.R)
18-12-02 23-12-03 Desirable Permissible
Total dissolved solids (TDS) in mg/l 1481.90 894.00 500 2000
Bicarbonates in mg/l 866.20 464.00 200 600
Chloride in mg/l 149.10 200.00 250 1000
Calcium in mg/l 8.00 48.00 75 200
Magnesium in mg/l 21.60 53.00 30 100
pH 7.69 7.80 6.5 8.5
Application of groundwater hydraulics to the problem
Aquifer details:
Hydraulic conductivity, K = 32.48 m/day
= 3.76 × 10– 4 m/sec Hydraulic gradient, i = dh/dl = 0.01
Velocity of Uniform Flow, Uo = K × i= 3.76 × 10–4 x 0.01= 3.76 × 10⁻⁶ ≈– 4 × 10⁻⁶ m/sec
Characteristics

191Energy Management Case Studies 191
Details of source and sink:Discharge of well, Q = 144 lpm = 2.4 ×10 –3 m3 / sec
Total water bearing strata tapped, b = 30 mStrength of source and sink, m = Q / b
= (2.4 × 10⁻³) / 30= 0.8 × 10⁻⁴ m3 / sec/m
Estimation of composite stream function for source, sink and uniform flow (Fig. 8.10).
Fig. 8.10 Estimation of composite stream function for source, sink and uniform flow.
Distance between source and sink = 7.2 m
The source and sink are required to be placed equidistant to the origin for generating a
flownet of the composite flow.
Therefore, distance of source and sink with respect to origin, a = 3.6 m
Co-ordinates of source = (–3.6, 0)
Co-ordinates of sink = (3.6, 0)
Composite stream function:
Ψ = Ψuniformflow + Ψsource + Ψsink
= Uoy + θπ
– θπ
Ψ uniformflow = Uoy = 4y x 10–6 m2/sec
Ψ source = θπ
=
0 8 102 1
. –4¥p
q = 40 10
1¥ –6
pq
Ψ sink = – θπ
= –
0 8 102 1
. –4¥p
q = ––640 10
1¥p
q
Q G
S O URC E
U N IFO RMFLO W
S IN K
x
y

192 Energy ManagementWater Management192
Table 8.4: Stream functions for source, sink & uniform flow
Distance Uniform Source Sink
‘y’ w.r.t. origin u =4y × 10–6 w=
×
θπ
w=
×
θπ
Deg Rad m m2 /sec m2 /sec m2 /sec
9 / 2 0 0.5 –2 × 10⁻⁶ –2 × 10⁻⁶ 2 × 10⁻⁶
18 / 1 0 1 –4 ×10⁻⁶ –4 × 10⁻⁶ 4 × 10⁻⁶
36 / 5 2 –8 × 10⁻⁶ –8 × 10⁻⁶ 8 × 10⁻⁶
45 / 4 2.5 –10 × 10–6 –10 × 10–6 10 × 10–6
72 2 / 5 4 –16 × 10–6 –16 × 10–6 16 ×10–6
90 / 2 5 –20 × 10–6 –20 × 10–6 20 × 10–6
108 3/ 5 6 –24 × 10–6 –24 × 10–6 24 × 10–6
126 7 / 1 0 7 –28 × 10–6 –28 × 10–6 28 × 10–6
135 4 / 5 7.5 –30 × 10–6 –30 × 10–6 30 × 10–6
144 8 / 1 0 8 –32 × 10–6 –32 × 10–6 32 × 10–6
162 9 / 1 0 9 –36 × 10–6 –36 × 10–6 36 × 10–6
180 10 –40 × 10–6 –40 × 10–6 40 × 10–6
Estimation of dimensions of Rankine oval body
Location of stagnation point:
Fig. 8.11 Location of stagnation points.
Stagnation point, rs = a ( / )1 + m aUoπ
= 3.6 10 8 10
3 14 4 10 3 6+ ¥
¥ ¥ ¥.
. .
–4
–6
= 5.9908 m ≈– 6.0 m
Hence co-ordinates of the two stagnation point w.r.t. origin are (–6,0) and (6,0)
= 0
r1
r2
S 2S 1 1 2
rS rS
a
p (x,y )
a

193Energy Management Case Studies 193
Fig. 8.12 Maximum height of Rankine oval body.
h = a cot phU
mo
h = 3.6 × cot 314 4 10
0 8 10.
.
–6
–4
× × ××
h
By trial and error, the value of h is 4.38 m
Analytical Result
Distance of stagnation point w.r.t. origin , rs = 6.0 m
Maximum height of Rankine oval body, h = 4.38 m
r1 r2
a
h
P
a
rs

This pageintentionally left
blank

99999
PERFORMANCE PERFORMANCE PERFORMANCE PERFORMANCE PERFORMANCE IIIIINDICATORSNDICATORSNDICATORSNDICATORSNDICATORSOF ARTIFICIAL RECHARGEOF ARTIFICIAL RECHARGEOF ARTIFICIAL RECHARGEOF ARTIFICIAL RECHARGEOF ARTIFICIAL RECHARGESTRUCTURESSTRUCTURESSTRUCTURESSTRUCTURESSTRUCTURES
9.1 INTRODUCTIONGroundwater use for domestic, industrial and agricultural purposes in India has been growingsteadily over the years. The report of the Groundwater Resources Estimation Committee(GWREC) has indicated that in India during the period 1952 – 1992, the number of dug wellsincreased from 3.86 million to 10.12 million, while the number of shallow tube wells increasedfrom 3000 to 5.38 million. The total area irrigated by groundwater increased from 6.5 millionha. in 1951 to 35.38 million ha. (gross) in 1993. Of the 716 blocks in the country, 250 (3.5%)are “overexploited” while 179 (2.5%) are “dark” (GWREC 1997).
A substantial portion of the hard rock belts of India, area is experiencing acute conditionsof groundwater overexploitation as a result of phenomenal increase in the rates of abstractionof groundwater, particularly by the agricultural sector which far cruised the recharge rates.Groundwater resources in the hard rock areas face the twin problems of overexploitation andgroundwater pollution. Steep lowering of groundwater levels and the consequent decrease inwell yields has started affecting even small rural communities, creating social tensions betweenneighboring villages and even among individuals within the same village.
While insufficient availability of groundwater is one side of the problem, the deterioratingquality of groundwater is the other side, equally vexing. Pollution of groundwater due toexternal contaminants produced by industrial, urban and agricultural activities is quite welldocumented (Bhatnagar and Sharma, 2001); overexploitation of groundwater that leads tolowering of groundwater levels also leads to increasing content of total dissolved solids (TDS)in groundwater.
A major problem encountered in developing groundwater resources in hard rock areas isthe sharply declining groundwater levels, leading to the formation of overexploited pockets.Bore wells drilled in hard rocks often become unproductive as the weathered / partly weatheredrocks as well as the shallower water bearing fracture zones progressively become desaturated.In such areas, bore wells are drilled deeper year after year with the hope of encountering deepfracture zones leading to mining of groundwater, since there is no replenishment of the deepfracture zones taking place.

196 Energy ManagementWater Management196
Now that overexploitation exists in many parts of India, it is worthwhile to briefly examineas to what constitutes an overexploited area and the indicative hydro-geological parameterscharacterizing such areas. The report of GWRDC (1997) recommends that using the ratio ofnet draft to total utilizable groundwater resources can assess the level of groundwaterdevelopment in area. Areas with stage of groundwater development less than 65% are classifiedas “white” those with 65% but less than 85% “grey” more than 85% but less than 100% as“dark” as and more than 100% as “overexploited”. The report further adds that over exploitedareas show significant long-term decline in both pre and post-monsoon groundwater levels.
An area may be classified as overexploited if one or more of the following hydrogeologicalfeatures are encountered:
• When groundwater levels do not recover to their original levels on a long-term basis• When discharge exceeds recharge by an appreciable volume• When shallow aquifers progressively become unproductive• When groundwater is pumped from depths greater than that to which adequate recharge
currently takes place• When the natural gradient is reversed and remains so throughout the year.
In order to counter the overexploitation of hard rock aquifers, the concept of rainwaterharvesting and artificial recharge to the groundwater system has lately caught the imaginationof technocrats dealing with water resources as well as lay public. It is well known that artificialrecharging of aquifers has in many cases resulted in a remarkable recovery of groundwaterlevels locally in the vicinity of artificial recharging structures, at least in the first few years oftheir construction.
The most common artificial recharge structures are percolation ponds, check dams, sub–surface dykes, spreading basins and injection wells.
Out of these structures a detailed study of performance of percolation tanks, check damsand dual purpose wells (ASR wells) was carried out by the author in Saurashtra region of theGujarat State of India. The details are described in this chapter.
The ever-increasing demand for water and the deteriorating quality of available groundwaterresources have already precipitated a major water crisis in the Saurashtra region of Gujarat.The region receives approximately 500 mm average annual rainfall, lion’s share of which isreceived during the monsoon season (Mid – June to September). Due to the high year–to–year variation in the annual rainfalls, the region is heavily prone to droughts.
Over the past few years, local water harvesting and groundwater recharge have emergedas a major strategy in Saurashtra to mitigate the impact of the recurring droughts, which aremanifested by severe shortage of water for irrigation and drinking, and fodder scarcity. ManyNGOs in the region and government agencies had constructed nearly 1400 percolation tanksin the region. It is important to analyze the impacts of these interventions, before advocatingthem as a viable approach for addressing water scarcity, and drought proofing.

197Energy ManagementPerformance Indicators of Artificial Recharge Structures 197
A study was undertaken to analyze the hydrological impacts of the local recharge. Siteswere selected for detailed keeping in view the unique geological settings of the areas wherethese structures are located. Water levels in the percolation tanks, check dams, ASR wells, andsurrounding observation wells were taken at 15-day intervals. Based on the data gathered,recharge rates and efficiency of percolation tanks are calculated. Based on the recharge rateestimates, performance indicators for the recharge systems were estimated. The paper presentsthe results of the study with regard to the following: [1] maximum rise in the water mount andthe duration of rise; [2] radius of influence of percolation tanks; and [3] recharge rate and therecharge rate equation.
9.2 METHODOLOGY ADOPTED(1) Selection of suitable sites for recharge installations(2) Monitoring water levels of source area and observation wells falling under the
influenced area.(3) Collection of evaporation data from nearby station.(4) Calculation of recharge rates from water level fluctuations and evaporation data.(5) Preparation of dimensionless graph to study nature of water mound developed.(6) Preparation of recharge rate graph and to find recharge rate equation from log – log graph.
9.3 PERCOLATION TANKS
General Introduction
Four ponds have been selected for the study keeping in view the different geology and areas:
(1) Pichhvi Percolation Tank: More than thousand percolation ponds have beenconstructed by NGOs in Saurashtra region for groundwater recharging. To representthe vastness of the whole scenario of the groundwater recharging by percolation tanks,a case study of Pichhvi percolation tank has been taken in detail. The evaporation andwater level fluctuation data is collected from irrigation department.
(2) Hamirpura Percolation Tank: With the observation of the results of the tank in1998, Hamirpura Watershed Programme was developed for the Hamirpura andsurrounding villages. With the use of bulldozers constantly for 15 days they havedeveloped about 300 earthen bunds called para in local parlance. This is facilitatingmore percolation of water in ground, even if there is 30 cm of rainfall in a day.
(3) Shingoda Percolation Tank: This village of Paddhari taluka is located at about 8 kmsfrom Hamirpura. There is scarcity of drinking water in the village. The water workswell of the village get dried up and as a result District Panchayat tankers have tosupply water to the village during March, April, May. The tank is constructed inwasteland adjoining to water works well. In 1995, spillway portion has been constructedby using free stones available from village and cement of worth Rs.12,000. Every yearin April-May, its desilting is done by people. While in adjoining Hamirpura village, thetank is not desilted. This tank has been selected and its monitoring is done to study theeffect of silting on recharge rate.

198En
erg
y Ma
na
ge
me
nt
Wa
ter M
an
ag
em
en
t198
LOCATION, SOILS, TOPOGRAPHY AND GEOLOGY
Table 9.1 Location, soils, topography and geology for percolation tank
Sr. Village Location Soils/Topography Geology RemarkNo. Taluka Dist. Latitude Longitude
District Km North East
1. Pichhvi 20o59′ 70°44′30′′ Moderate salinity, Miliolite limestone, 7 to 4m Constructed by Govt.Kodinar 20 clayey, montmorillonitic thick, hoighly carveneous in before 50 yearsAmreli 100 (calcareous), hyperthermic nature forms local aquifer. renovated and
lithic ustochrepts. Very The quality of ground water desilted by Swadhyaygently sloping coastal is good. Parivar in 1994.plain with moderate erosion
2. Hamirpura 20°26′ 70°35′ Clayey, montmorillonitic, Deccan trap of cretaceoecocene Constructed byMorbi 18 hyperthermic lithic ustochrepts. age volcanic in nature having ORPAT in 1995Rajkot 35 Well drained, gently sloping, thickness of 10 to 26 m. Below
dissected alluvial plain with it compact trap is encountered.moderate erosion
3. Chhalla- 22°28′ 70°27′ Moderate salinity, clayey, Gaj limestone having thickness Constructed byRupavati 27 montmorillonitic (calcareous), 10 to 20 m acts as a local aquifer Swadhyay ParivarDhrol 63 hyperthermic lithic ustochrepts. in 1995. DesiltingJamnagar Very gently sloping coastal plain carried out every year
with moderate erosion
4. Singhoda 22°25′ 70°32′ Moderate salinity, clayey, Deccan trap of cretaceoecocene Constructed byPadadhari 8 montmorillonitic (calcareous), age volcanic in nature having Swadhyay ParivarRajkot 32 hyperthermic lithic ustochrepts. thickness of 8 to 20 m. Below it in 1995. Desilting
Very gently sloping coastal plain compact trap is encountered. carried out every yearwith moderate erosion

199Energy ManagementPerformance Indicators of Artificial Recharge Structures 199
(4) Chhalla Rupavati Percolation Tank: Population of the village is 1088. The work wasstarted on 20/4/96 and was completed on 27/5/96. The construction involves earthwork of total 30,500 cubic meters. As a result of this good quality of water is availablein adjoining wells. Local stones available free of cost and cement of worth Rs.16,000has been used for the work. Thirty-five tractors were engaged for 2092 hours.
Nature of Water Mound Developement
Taking reduced levels in the area of the tanks was the contour map of percolation tanksdeveloped. With the help of the contour map area v.s elevation, volume stored v.s elevationand volume stored vs. area graphs were developed. Out of this the graphs of Hamirpurapercolation tank is as follow:
Fig. 9.1Graphs for Hamipura percolation tank.
Ele
vatio
n(m
)
1 0 099 .5
99
98 .5
9897 .5
97
96 .5
9695 .5
0 50 00 10 000 15 000 20 000 25 000
50 00 10 000 15 000 20 000 25 000 30 000 35 000 40 000
10 099 .5
99
98 .5
9897 .5
97
96 .5
9695 .5
0
Ele
vatio
n(m
)
A rea (m )2
A rea v/s E leva tion
Vo lu me v /s E le va tion
50 00 10 000 15 000 20 000 25 000 30 000 35 000 40 000
25 000
0
Ele
vatio
n(m
2 )
Vo lu me v /s A rea
20 000
15 000
10 000
50 00
0
G - 5 .4
G - 5 .5
G - 5 .6
Vo lu me v /s A rea (m )2
Vo lu me s to re d (m )3
H am irpu ra P e rc o la tio n Ta n k Vi lla ge : H a m irpu ra Ta . : M orb i D is t. : R a jk o t

200 Energy ManagementWater Management200
Water level fluctuation in the surrounding observation wells were observed continually at15 day interval for a whole year and water mound and decay graphs were developed for all theponds. Out of these for Hamirpura percolation tank is given in Fig. 9.2 as below:
Fig. 9.2 Recharge mound development.
Recharge Rate Calculation
Water level fluctuations in recharge tanks were taken weekly continuously for two years fromthe water level difference total loss of water calculated. Out of this weekly evaporation deductedand cumulative recharge volume calculated. The water spread area according to water levelcalculated. From this recharge rate mm/day found out. The recharge rate graph of Hamirpurapercolation tank is as shown in Fig. 9.3.
Fig. 9.3 Recharge rate graph.
To obtain the equation of recharge rate a graph of cumulative days vs. recharge rate wasplotted on log – log graph paper for Hamirpura percolation tank as shown in Fig. 9.4a, b and c.
Fig. 9.4 (a)
H am ir pu r a Perco la tion Tank
Wa
ter
Leve
lR.L
.(m
)
D istanc e (m )-1000 -500 0 50 0 10 00 15 00
27 -09 -9 725 -10 -9 722 -11-9 7
20 -12 -9 7
96
94
95
93
929190898887
100
Recharge Rate G raph for Year 19 96
10
11 10 100 1000
Cumulative Days
Re c
ha g
era
tem
m/D
a y
5045403530
25201510
50
Recharge Rate for Year 1996-97Hamirpura Percolation Tank
Recharge rate(mm/day)
AverageRecharge Rate
Re
ch
arg
eR
ate
mm
/Da
y
96
Ju
n
27
-Ju
l
21-S
ep
30-N
ov
8-F
eb
8-J
un
28
-Ju
n
21
-Ju
l
23-A
ug
20-S
ep
29-N
ov
7-F
eb
18
-Apr
Date
Vill:- Hamirpur, Dis:-Thorbi
Contd...

201Energy ManagementPerformance Indicators of Artificial Recharge Structures 201
(b)
(c)
Fig. 9.4 Graphs for recharge rate calculation.
Rech. Rate formula
Year Intercept on Y Axis Slope of Graph
(REch. Rate)
−β=
−
“”
1996 13 –0.09
1997 13 –0.114
1998 13 –0.13
Average 13 –0.111
100
Recharge Rate G raph for Year 1997
10
1
1 10
Rec
hag
e ra
te m
m/D
ay
100 1000
Cum ulative Days
100
Recharge Rate Graph for Year 1997
10
1
Rec
hag
e ra
te m
m/D
ay
Cum ulative Days1 10 100
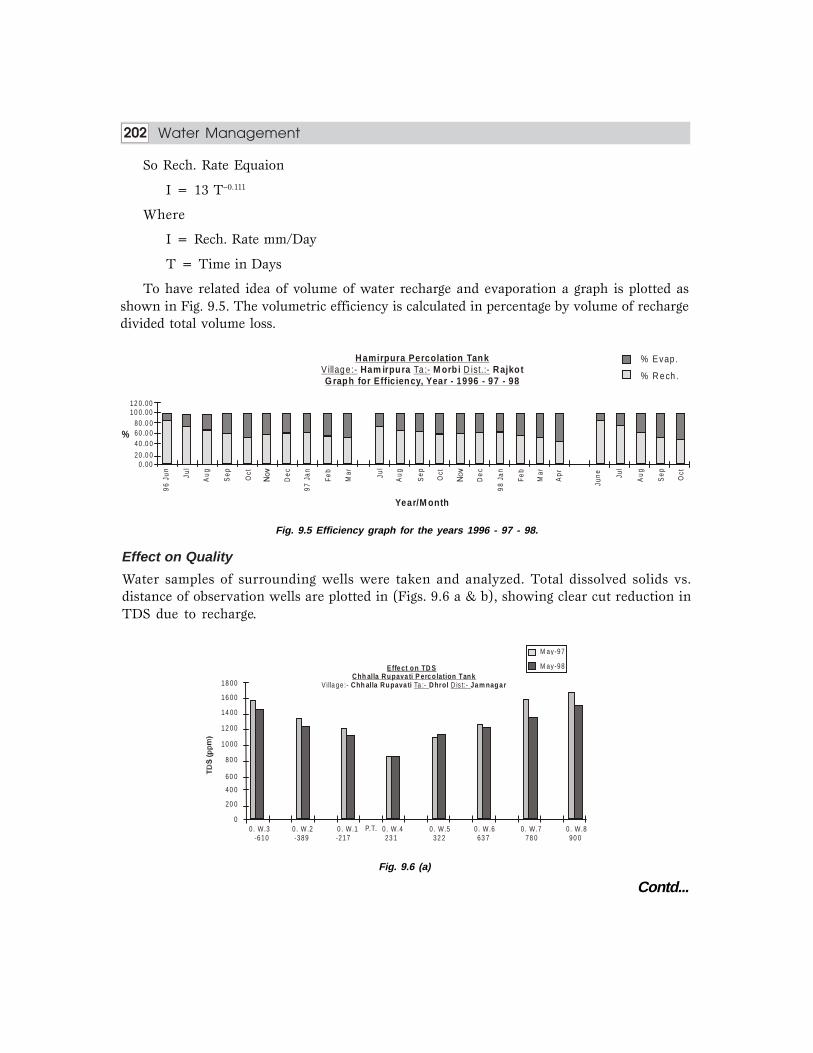
202 Energy ManagementWater Management202
So Rech. Rate Equaion
I = 13 T–0.111
Where
I = Rech. Rate mm/Day
T = Time in Days
To have related idea of volume of water recharge and evaporation a graph is plotted asshown in Fig. 9.5. The volumetric efficiency is calculated in percentage by volume of rechargedivided total volume loss.
Fig. 9.5 Efficiency graph for the years 1996 - 97 - 98.
Effect on Quality
Water samples of surrounding wells were taken and analyzed. Total dissolved solids vs.distance of observation wells are plotted in (Figs. 9.6 a & b), showing clear cut reduction inTDS due to recharge.
Fig. 9.6 (a)
0 . W.3 0 . W.2 0 . W.1 0 . W.4 0 . W.5 0 . W.6 0 . W.7 0 . W.8P.T.-610 -389 -217 23 1 32 2 63 7 78 0 90 0
Effe ct on TD SChh alla Rupava ti P erc o lation Tank
Villa ge :- Chh alla Rupava ti Dhrol Ja m naga rTa :- D is t:-
M ay -97
M ay-98
18 00
16 00
14 00
12 00
10 00
80 0
60 0
40 0
20 0
0
Hamirpura Percolation Tank
G raph for Effic iency, Year - 1996 - 97 - 98 Ham irpura M orb i RajkotV illage :- Ta :- D ist.:-
% R ech .
% E vap .
%
12 0 .0010 0 .00
80 .0 060 .0 040 .0 0
20 .0 00 .00
96
Jun
Jul
Au
g
Se
p
Oct
De
c
97
Jan
Fe
b
Mar Ju
l
Se
p
Oct
De
c
98
Jan
Fe
b
Mar
Ap
r
Se
p
Oct
Jun
e
Jul
Year/M onth
Au
g
Au
g
Contd...

203Energy ManagementPerformance Indicators of Artificial Recharge Structures 203
(b)
Fig. 9.6 Effect of percolation tank on TDS.
Table 9.2 Maximum water mound rise at different distances in observation wells
Upstream Side (m) Downstream Side (m)
200 400 600 800 1000 1200 200 400 600 800 1000 1200 1400
Pichhvi (Miliolite 6.2 4.4 3.0 1.8 1 0 8 6.6 5.4 3.8 1 0.8 0limestone, Desilted)
Hamirpura 2.3 1.7 0.9 0 — — 3 2.1 1.4 1.1 0.9 0 —Weathered basaltrock)
Chhalla Rupavati 4.45 3.05 1.45 0 — — 5.1 3.9 3.2 0.9 0 — —(Gaj limestone,Desilted)
Table 9.3 Radius of influence and duration of water mound
Radius of Influence Duration of Water Total Duration of(m) Mound (days) Duration Water Stored
U/S D/S Develop. Decay (days) in PT (days)
Pichhvi (Miliolite 1100 1300 165 100 265 270limestone, Desilted)
Hamirpura (Weathered 720 1100 170 120 290 300basalt rock)
Chhalla Rupavati 780 1000 170 90 260 220(Gaj limestone, Desilted)
O ct97O c t-98
10 00
90 080 070 060 050 0
40 030 0
20 0
0
10 0
0 . W.3 0 . W.2 0 . W.1 0 . W.4 0 . W.5 0 . W.6 0 . W.7 0 . W.8P.T.-610 -389 -217 23 1 32 2 63 7 78 0 90 0
Name ofPercolation Tank
Name of PercolationTank
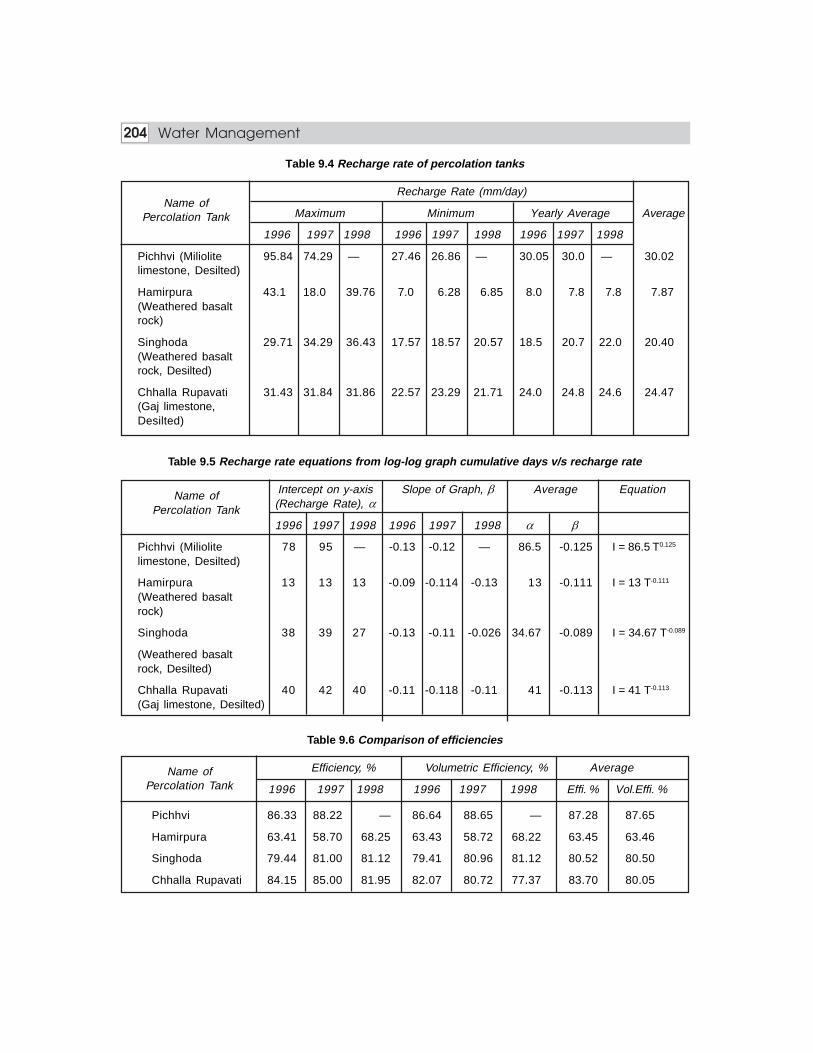
204 Energy ManagementWater Management204
Table 9.4 Recharge rate of percolation tanks
Recharge Rate (mm/day)
Maximum Minimum Yearly Average Average
1996 1997 1998 1996 1997 1998 1996 1997 1998
Pichhvi (Miliolite 95.84 74.29 — 27.46 26.86 — 30.05 30.0 — 30.02limestone, Desilted)
Hamirpura 43.1 18.0 39.76 7.0 6.28 6.85 8.0 7.8 7.8 7.87(Weathered basaltrock)
Singhoda 29.71 34.29 36.43 17.57 18.57 20.57 18.5 20.7 22.0 20.40(Weathered basaltrock, Desilted)
Chhalla Rupavati 31.43 31.84 31.86 22.57 23.29 21.71 24.0 24.8 24.6 24.47(Gaj limestone,Desilted)
Table 9.5 Recharge rate equations from log-log graph cumulative days v/s recharge rate
Intercept on y-axis Slope of Graph, Average Equation(Recharge Rate),
1996 1997 1998 1996 1997 1998
Pichhvi (Miliolite 78 95 — -0.13 -0.12 — 86.5 -0.125 I = 86.5 T0.125
limestone, Desilted)
Hamirpura 13 13 13 -0.09 -0.114 -0.13 13 -0.111 I = 13 T-0.111
(Weathered basaltrock)
Singhoda 38 39 27 -0.13 -0.11 -0.026 34.67 -0.089 I = 34.67 T-0.089
(Weathered basaltrock, Desilted)
Chhalla Rupavati 40 42 40 -0.11 -0.118 -0.11 41 -0.113 I = 41 T-0.113
(Gaj limestone, Desilted)
Table 9.6 Comparison of efficiencies
Efficiency, % Volumetric Efficiency, % Average
1996 1997 1998 1996 1997 1998 Effi. % Vol.Effi. %
Pichhvi 86.33 88.22 — 86.64 88.65 — 87.28 87.65
Hamirpura 63.41 58.70 68.25 63.43 58.72 68.22 63.45 63.46
Singhoda 79.44 81.00 81.12 79.41 80.96 81.12 80.52 80.50
Chhalla Rupavati 84.15 85.00 81.95 82.07 80.72 77.37 83.70 80.05
Name ofPercolation Tank
Name ofPercolation Tank
Name ofPercolation Tank

205Energy ManagementPerformance Indicators of Artificial Recharge Structures 205
9.4 CHECK DAMS
General Introduction
For the present study, five check dams have been presented.
(a) Constructed by Government.(b) Tree lover Premjibhai initiated in one Upleta area.(c) Sutrapada check dam where sweet water is available in spite is surrounded by intruded
sea water.(d) Sajan Timba check dam of Liliya taluka situated in high flouride content area.(e) A check dam constructed by Swadhyay Parivar in Mendarda taluka of Junagadh district.
Chokli Check Dam: Constructed in 1993 in Junagadh district and located at the distance of2 kilometers from Rajkot-Junagadh highway. After seeing the results of this check dam, onlyin Mendarda taluka, 32 more check dams have been constructed. Since last 3 years at 10 every15 days interval, water levels have been taken of the wells surrounding the check dam.
Arnhi Check Dam: This is one of the 135 check dams built in Upleta taluka.
Sutrapada Check Dam: This is located at distance of 2 kms from sea shore. The water in allthe wells in the village is salty due to intrusion of sea water. Only the water in wellssurrounding this check dam is sweet. Total population of the village is 18800. With the useof freely available limestone and using cement of Rs.12,000 — the spillover portion has beenconstructed. 217 members of 70 families have jointly worked for 27 days for the constructionof this check dam.
Bhiyal Check Dam: The data taken here about the check dam constructed by Govt. is beingcollected and monitored. There is no desilting in this check dam. Therefore, there can becomparison of effects of silting in Chokli check dam of the same Mendarda taluka.
Hathigadh-Khara Check Dam: In Liliya taluka of Amreli district, there is huge problem offloride in water. There is no medicine of flourosis in medical science. In collaboration withNetherland Government, Government of Gujarat has developed a deflorination plant. But dueto the problem of effluent disposal the plant is lying idle. This check dam has been selectedwith a purpose to study effects on fluoride of surrounding wells.

206En
erg
y Ma
na
ge
me
nt
Wa
ter M
an
ag
em
en
t206LOCATION, SOILS, TOPOGRAPHY AND GEOLOGY
Table 9.7 Location, soils, topography and geology for check dams
Village LocationSr. Taluka Dist. Latitude LongitudeNo. District Km North East
1. Chokil 20° 0′30′′ 70°15′ Fine, montmorillonitic Deccan trap of cretaceoecocene Constructed byMendarda 10 (calcareous) hyperthermic vertic age volcanic in nature having Swadhyay ParivarJunagadh 22 ustochrepts. thickness of 7 to 26 m. Below it in 1993. Desilting
Moderately shallow, fine soil on compact trap is encountered. carried out every yearvery gently sloping alluvialplain (with mounds)
2. Arnhi 20°50 ′ 70°10′10′ Clayey, montmorillonitic, (calcar- Deccan trap of cretaceoecocene Constructed byUplete 22 eous), hyperthermic, paralithic age volcanic in nature having Premjibhai in 1996Rajkot 95 vertic ustochrepts. Well drained, thickness of 9 to 19 m. Below it
gently sloping, dissected alluvial compact trap is encountered.plain
3. Sutrapada 22°50′ 70°20′ Fine, loamy, mix (calcareous), Miliolite limetone, 15 to 40 m 3 km from ArabianVeraval 22 ustochrepts. typic ustochrepts. depths are highly carveneous in sea cost constructed(Patan) Well drained, fine clayey soils nature form, local aquifer by Swadhyay ParivarJamnagar 120 on very gently coastal plain Yielding saline quality of water.
4. Bhiyal 22°30 ′ 71°20′ Fine, montmorillonitic (calcareo- Miliolite limestone, 12 to 20 m Constructed byMendarda 26 us) hyperthermic vertic depths are highly carveneous in Governmet onJunagadh 57 ustochrepts. Moderately shallow, nature forms local aquifer. tributary of
fine soils onfine soils on very Yielding saline quality of water. Madhuvanti rivergently sloping alluvial plain(with mounds)
5. Hathigadh- 22°45 ′ 71°29′ Fine, montmorillonitic Deccan trap of cretaceoecocene of Constructed byKahra (calcareous), hyperthermic typic 15 to 20 m depth becomes compact Swadhyay ParivarLeliya 10 chromusterts. Moderately drained, at depth having max.Amreli 57 fine soils, on gently sloping depth more than 150 m contains
ground plains with slight salinity fluoride contents
Soils / Topography Geology Remark

207Energy ManagementPerformance Indicators of Artificial Recharge Structures 207
Recharge Rate
A survey was conducted to find out reduced level in and around check dams and contourmaps were prepared. From the contour map graphs of cross sectional distance vs. elevationwere prepared. Cross-section areas at different distances were also plotted and area of eachcross-section were found out, from which average area is calculated. A table of reduced levelsand corresponding cross-section area, width, perimeter, water spread distances from checkdam were tabulated. With the help of these tables and weekly observations at check dams thetotal water loss and evaporation was found out from this wetted area and recharge rate werecalculated. The equations of the recharge rate were found out in similar way as done for thepercolation tanks.
Water Mound Development and Decay
Fig. 9.7 Location of observation wells for Chokli check dam.
Water level fluctuations in 12 observations wells for 2 years were observed and reducedwater level was calculated. Water level maps for water mound rise and decay were preparedand were plotted for 3 cross-sections as shown below.
40 0
37 5
30 0
22 5
15 0
75
0
-750
-150
-225
-300
-375
-450
-525
-600
67 5
-750
-825
-900-300 -225 -150 -75 0 15 0 22 5 30 0 37 5 45 0 52 5 60 0 67 5 75 0
3
2
O W 10
(-206 , 2 1 )
O W 1
(-26 , - 94)O w 2
(-188 ,-1 51)
O W 3(-192 ,-1 63) O W 4
(38 ,-3 22)
3
1
1
2O W 8
(545 , 192 )
O W 12
(175 , 245 )
O W 7
(320 , 167 )
O W 9
(362 , 105 )
O W 5
(67 , 2 1 )
O W 5
(11 , 140)
O W 6
(190 , 32 )
0 75 15 0 30 0

208 Energy ManagementWater Management208
Fig. 9.7 a, b c Water mound development graphs for Chokli check dam.
Distance (m )
(b) Water m ound development at sec . 2 - 2
-400 -300 -200 -100 0
93
92
91
90
89
88
87
86
85
R.L
.inm
.
04 -08 -9 7
01 -09 -9 7
20 -10 -9 7
10 0 20 0 30 0 40 0 50 0 60 0 70 0
(c) Water m ound development at sec. 3 - 3
Distance (m )
92
91
90
89
88
87
86
85-200 -100 0 10 0 20 0 30 0 40 0
R.L
.inm
.
04 -08 -9 7
01 -09 -9 7
20 -10 -9 7
(a) Water m ound development at s ec. 1 - 104 -08 -9 7
01 -09 -9 7
20 -10 -9 7
-200 -150 -100 -50 0 50 10 0 15 0 20 0 25 0 30 0 35 0
Distance (m )
93
92
91
90
89
88
87
86
85
84
R.L
.inm
.
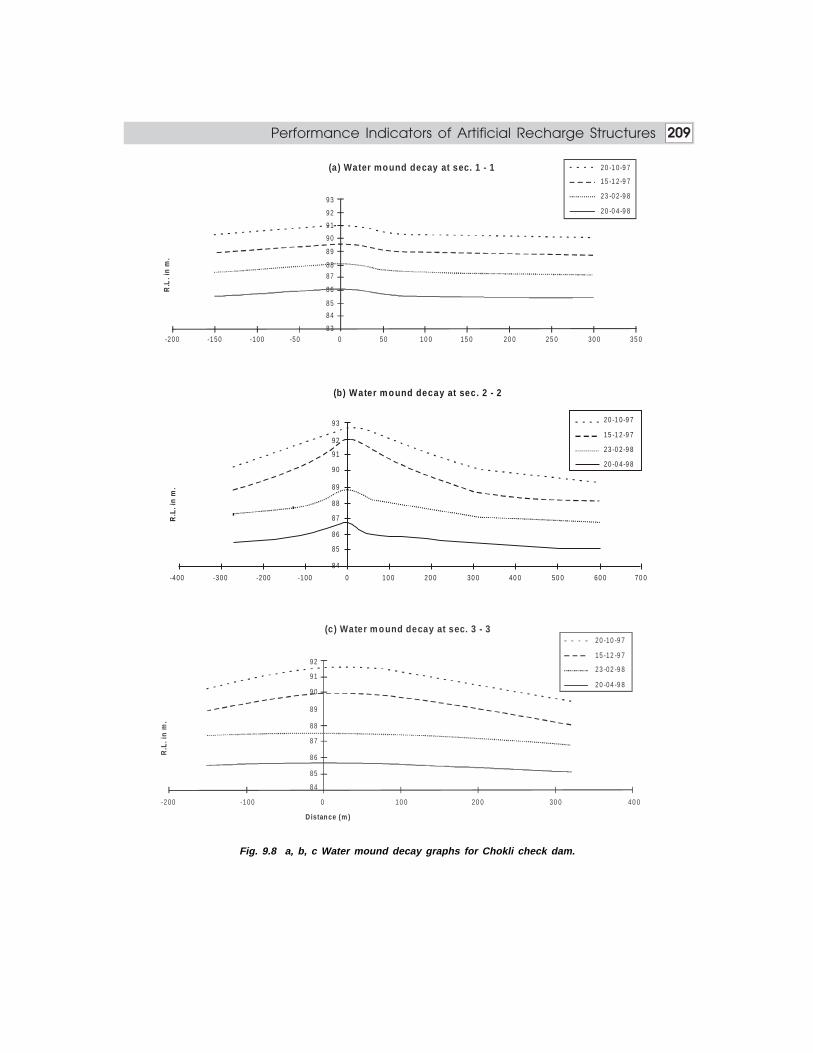
209Energy ManagementPerformance Indicators of Artificial Recharge Structures 209
Fig. 9.8 a, b, c Water mound decay graphs for Chokli check dam.
93
92
91
90
89
88
87
86
85
84
-400 -300 -200 -100 0 10 0 20 0 30 0 40 0 50 0 60 0 70 0
(b) Water m ound decay at sec. 2 - 2
R.L
. in
m.
20 -1 0-9 7
15 -1 2-9 7
23 -0 2-9 8
20 -0 4-9 8
93
92
91
90
89
88
87
86
85
84
83-200 -150 -100 -50 0 50 10 0 15 0 20 0 25 0 30 0 35 0
(a) Water mound decay at sec. 1 - 1R
.L.i
nm
.20 -1 0-9 7
15 -1 2-9 7
23 -0 2-9 8
20 -0 4-9 8
92
91
90
89
88
87
86
85
84
-200 0-100 10 0 20 0 30 0 40 0
(c) Water m ound decay at sec. 3 - 3
R.L
.in
m.
D istance (m )
20 -10 -9 7
15 -12 -9 7
23 -02 -9 8
20 -04 -9 8

210 Energy ManagementWater Management210
Recharge Effect on Water Quality
[A] Effect on TDS
From water analysis reports graphs for April 97, and Oct. 97, 98 were prepared to show theeffect on TDS for Sutrapada check dam. Similarly for Hathigadh Khara check dam graphswere prepared.
[B] Effect on Fluorides
Hathigadh Khara check dam is in fluoride affected area. From water analysis report all the parametersexcept fluoride were within water limit. Water is unfit for potable use only due to fluoride contentmore than 1.5 ppm to study the effect of recharge on fluoride graphs was prepared.
Fig. 9.9 Effect of recharge on TDS for Sutrapada check dam.
Fig. 9.10 Effect of recharge on fluoride for Hathigadh Khara check dam.
3
2 .5
2
1 .5
1
0 .5
0O W -5 O W -6 C .D . O W -1 O W -2 O W -3O W -4
O bs ervation W e lls
Hath igad h Khara Chec k D amVillage: Ta .: D ist.: Hathigadh Khara Leliy a Am reli
E ffe ct o f Chec k Dam on Flouride s
M ay-98O c t-98
Righ tLe ft
Flo
urld
es
(pp
m)
A p r. 9 7O c t 9 7
O c t 9 8A pr. 9 8
16 00
14 00
12 00
10 00
80 0
60 0
40 0
20 0
0
O bservat ion W ells, D istance Increases from check Dam
Srtrapa da Chec k D amVilla ge :- Ta .:- D is t:- Sutrapada Ve rav al Junagadh
Effe ct on TDS
O W -3O W -2 O W -6

211Energy ManagementPerformance Indicators of Artificial Recharge Structures 211
Fig. 9.11 Effect of recharge on fluoride on upstream and downstream.
Results of Check Dams
Effect of Check Dam on Surrounding Wells
Table 9.8 Maximum water mound rise at different distances in observation wellsfor Chokli check dam (1996 - 98)
Upstream Side (m) Downstream Side (m)
150 200 300 400 100 150 200 300 400 500
Mound Height developed (m) 1.2 1.1 0.87 0.1 4.2 4.0 3.6 1.5 0.5 0.2
Radius of Influence on upstream is 430 m and on down stream 550 m
Table 9.9 Recharge rate of check dams
Recharge Rate, Mm/day Overall
Maximum Minimum Average Aveg.
1996 1997 1998 1996 1997 1998 1996 1997 1998
Chokli (weathered 113.84 62.49 69.23 39.18 26.85 26.28 55.19 44.85 43.79 47.94basalt rock, desilted)
Arnhi (weathered 38.54 41.73 38.82 22.25 20.23 18.74 29.17 30.98 30.0 30.05basalt rock,)
Bhiyal (weathered 44.9 45.8 61.5 38.2 34.7 27.2 40.2 38.82 24.9 34.64basalt rock, )
Table 9.10 Recharge rate equations from log-log graph cumulative days v/s recharge rate
Name of Intercept on y-axisCheck Dam (Recharge Rate),
1996 1997 1998 1996 1997 1998
Chokli 70 68 64 -0.10 -0.92 -0.065 67.33 -0.086 I = 67.33 T0.086
Arnhi 60 58 55 -0.261 -0.183 -0.171 57.67 -0.205 I = 57.67 T-0.205
Bhiyal 41 43 65 -0.022 -0.031 -0.18 49.66 -0.078 I = 49.66 T-0.078
3
2 .5
2
1 .5
1
0 .5
0O W -2 O W -4 C .D . O W -6 O W -5 O W -3O W -1
O bs erva tion W e lls
M ay-9 8O c t-98
D/S Sid eU/S Sid e
Flo
urld
es (
ppm
)
Dist. from CD (m)
Name of Check Dam
Slope of Graph, Average Equation

212 Energy ManagementWater Management212
Table 9.11 Comparison of recharge and evaporation volumes
Name of Recharge Volume Evaporation Volume Average RatioCheck Dam m3/season m3/season m3/season VR/VE
96-97 97-98 98-99 96-97 97-98 98-99 Rech. Evap.Vol. Vol.
Chokli 17015 16783 16593 5235 5553 5564 16797 5451 3.08
Arnhi 7009 11421 21029 3002 4731 8144 13153 5292 2.48
Bhiyal 16414 16024 14702 6856 6272 5947 15713 6358 2.47
Table 9.12 Comparison of efficiencies
Name ofCheck Dam
1996 1997 1998 1996 1997 1998 Effi. % Vol.Effi. %
Chokli 91.56 89.95 89.33 90.23 90.36 89.98 90.28 90.19
Arnhi 82.64 84.29 78.39 81.98 82.05 78.69 81.77 80.90
Bhiyal 85.10 85.47 80.92 89.84 88.80 86.60 83.83 88.41
9.5 AQUIRER STORAGE RECOVERY (A.S.R.) WELLSIn this section, data collection of recharge wells and some other structures constructed byGujarat Government for preventing salinity ingress are included.
More than 5,00,000 wells are drawing water from unconfined aquifer in Saurashtrapeninsular region. Due to overexploitation of aquifer, water table goes below and quality ofwater detoriated considerably. As a result many wells become abandoned and sea water intrusionadvances nearly 1 km inland. The coastal area of Saurashtra is 900 km2 long i.e. every year 900km2 land faces the problem of sea water intrusion. The area between Una and Madhavpur wasknown as Lilee Nager due to greenery. Now the same soil has become saline.
In 1993, some farmers of this area recharged their open wells from storm water runoff inmonsoon or by diverting water from stream, river or pond into wells. By observing good results,many farmers come forward to recharge their wells. The thought spread like a fire and morethan one lakh wells are recharged upto 1998.
Here four cases are selected for data collection and analysis.
(1) A well recharged from farm runoff at Khadvanthli.(2) A well recharged from the reservoir created by a check dam constructed on Madhuvanti
River at Mithapur.(3) A well in Goraj village of Mangrol taluka, where Warabandhi for recharging wells is practiced.(4) A well in floride affected area village Sajantimba, Ta : Leliya or Amreli district.
All these wells are irrigation wells. They are recharged when water is surplus in monsoon(July, Aug, Sept) and water is withdrawn during needy period. So these wells are called A.S.R.
Efficiency, % Volumetric Efficiency, % Average

213Energy ManagementPerformance Indicators of Artificial Recharge Structures 213
(Aquifer Storage Recovery) wells. As they are dual purpose wells, due to surveying and desiltingeffect, their discharging rate is not reduced considerably. The quality of water is improvedwhich improves the quality of soils also. As a result, so many farmers have earned additionalincome of Rs.20,000 per annum each.
Mithapur A.S.R. Well :This village is on bank of Madhuvanti river. One farmer has laid apipe line by excavating more than 8.0m average in rocky area (by help of explosive) andrecharged his well. The district panchayat has constructed one check dam in upper region.The well gets recharged upto the month of February from this reservoir. Due to this rechargethe quality and water level of surrounding wells are also improved considerably. Formally thewell becomes dry in the month of February. Now water is available throughout the year andfarmer is able to take three crops in a year.
Goraj A.S.R. Well: This village is just 8 km from Arabian sea coast. More than 200 dug wellsare constructed by farmers. Nearly all are recharged in monsoon. In the well under study,water is diverted from tributary of river. The porosity of calcarious lime stone in this region ishigh. As a result intake capacity of well is excellent so farmers have agreed for Warabandhi fordiverting stream water into wells. Varabandhi for recharging wells might have been practicedfor the first time in the world.
Sajantimba A.R.S. Well: This village is in Liliya taluka, a floride-affected area of Amrelidistrict. To study the effect of recharge on fluride, water analysis of surrounding and rechargewells are collected and analysed in water supply and sewage board laboratory at Bhavnagar.

214En
erg
y Ma
na
ge
me
nt
Wa
ter M
an
ag
em
en
t214LOCATION, SOILS, TOPOGRAPHY AND GEOLOGY
Table 9.13 Location, soils, topography and geology for A.S.R. wells
Village Location Taluka Dist. Latitude LongitudeDistrict Km North East
1. Khadvanthil 22° 0′30′′ 70°30′ Clayey, montmorillonitic (calcar- Deccan trap of cretaceoecocene An ope well rechargeGondal 23 eous), hyperthermic paralithic age volcanic in nature having from farm runoffRajkot 55 vertic ustochrepts. Very gently thickness of 9 to 20 m. Below it since 1993
sloping dissected alluvial plain compact trap is encountered.with moderate erosion
2. Mithapur 21°30 ′ 70°20′ Clayey, montmorillonitic, (calcar- Deccan trap of cretaceoecocene A well recharge fromMendarda 12 eous), hyperthermic, paralithic age volcanic in nature having the river MadhuvantiJunagadh 43 vertic ustochrepts. Well drained, thickness of 8 to 25 m. Below it directly by laying 30
gently sloping, dissected alluvial compact trap is encountered. cm dia. pipelineplain
3. Goraj 21°15′ 70°0′ 30′′ Fine, loamy, mix (calcareous), Miliolite limetone, 10 to 45 m Warabandhi forMangrol 8 ustochrepts. typic ustochrepts. depths are highly carveneous in recharging wells form
Well drained, fine clayey soils nature form, local aquifer strom water drains.Jamnagar 64 on very gently coastal plain Yielding saline quality of water.
4. Sajantimba 21°48 ′ 71°27′ Fine, montmorillonitic (calcareo- Decan trap of creataceoecocene Located on tributoryLilya 10 us) hyperthermic vertic of 15 to 20 m depth becomes of Shetrunji river.Amreli 57 ustochrepts. Moderately shallow, compact at depth having max. Fluoride affected area.
fine soils onfine soils on very depth more than 150 m containsgently sloping alluvial plain fluoride contents(with mounds)
Soils/Topography Geology RemarkSr.No.

215Energy ManagementPerformance Indicators of Artificial Recharge Structures 215
Study of Water Level Fluctuations in ASR & Observation Wells
To study the nature of water level fluctuations a graph date vs. water level R.L. is plotted forKhandvanthali A.S.R. wells. To study the cummulative effect premonsoon and postmonsoon(May, Oct.) vs. water depth in well graph is plotted for three years.
Fig. 9.12 Water level fluctuation in Khadvanthali ASR well.
Fig. 9.13 Water level fluctuation from 1994 – 98 in Khadvanthali ASR well.
Nature of Water Mound
To study the effect of water recharge on surrounding wells, a water mound development anddecay graphs were plotted for Khadvanthali A.S.R. well.
95
93
91
89
87
85
83
81
79
77
75
30-A p r 19-Jun 08-A ug 27-S ep 16-Nov 05-Jan 24-F eb 15-A p r 04-Jun 24-Jul
A .S .R .W e ll
O .W -1 ,153M .
O .W -2 ,270M .
O .W -3 ,416 .10M .O .W -4 ,601M .
For Khadvanthali A .S.R . WellV illage: hadvanthali G ondal Rajkot D is t. :K Tal,:
Date
Water Level Fluctuation in A.S.R. and Observation W ells
25
20
15
105
00 .2 0 .61 1 .3 2 .49 3 .43
1994 O ct. 1995 O ct. 1996 O ct. 1997 O ct. 1998 O ct.
15.78 16.8918.69
19.5820.46
M ay M ay M ay M ay M ay
Year
Note: W ell is Rechaged Since 1993
Rise and Fall of Water Level in A .S.R . W ellFor Khadvanthali A.S.R. W ell
Village: Tal.: Dist.: Khadvanthali Gondal Rajkot
Wat
er D
epth
(m
)

216 Energy ManagementWater Management216
Fig. 9.14 a, b Water mound development in Khadvanthali ASR well.

217Energy ManagementPerformance Indicators of Artificial Recharge Structures 217
Effect on Water Quality
[A] Effect on T.D.S.
To study the effect of recharge on water quality, water quality analysis report for two wellsone in weather basalt rock (Khadvanthli) and other in miliolite limestone (Goraj) were used toplot the graphs.
Fig. 9.15 a, b, c, d Effect of recharge on water quality.
1500
1000
500
01996 1997 1998
TD S -M ayTD S -O ct.
Year
G oraj A .S.R . WellEffect in M ay & Oct.
(a) Effect on TDS in A.S.R. Wells
(b) G oraj A .S.R. WellEffect on TDS Due to D istance From A.S.R. Well. For May & O ct. 1998
1600140012001000
800600400200
0
TD S -M ayTD S -O ct.
720.O .W.-3516 O .W.-2203 O .W.-1O .R .W
Distance in m . from A.S.R . Well
107210001210
1320
670510 590 613
YEAR
1600140012001000
800600400200
01998199719961969
(c) Khadvanthali A.S.R . W ell For May & Oct.
TD S -M AY
TD S -O CT.
900800700600500400300
O .R .W 153 O .W -1 270 O .W -2 416.1 O .W-3 601.1 O .W-4
(d) Khadvanthali A.S.R. WellEffect on TDS Due to D istance From A.S.R. Well. For Oct. 98
850
720680680570
Distance in m. from A.S.R. Well

218 Energy ManagementWater Management218
[B] Effect on Fluoride
To study the effect of recharge in fluoride affected area Sajantimba A.S.R. well was selectedand graphs were plotted.
Fig. 9.16 a, b, c Effect of recharge on fluoride in Sajantimba ASR well.
Flo
rid
e(p
pm
)
70060050040030020010000
1
2
3
4
5
6
7 M ay '98
O ct '98pe rmissible lim it
Distance in m . from A.S.R . W ell
(c) Effect on Flouride Content
7
6
54
3
2
1
0
M ay
O ct.pe rm issible lim it
( ) jV illage :- Ta .:- D is t.:-Sajantim ba Leliya Am reli
Effect on Flouride Content in A .S.R. and Obs. Wells
A.S
.R.
We
ll
OW
-1.
(18
6m)
OW
-2.
(60
0m)
OW
-3.
(62
0m)
Flo
rid
e(p
pm
)
1.6
1.41.2
1
0.8
0.60.4
0.2
0
Ma
y-9
7
Ma
y-9
8
Oct
-97
Oct
-98
Flo
rid
e(p
pm
)
(b) Effect on Flouride Content in A .S.R . Well
Month / Year
(a) Sajantimba A.S.R. Well

219Energy ManagementPerformance Indicators of Artificial Recharge Structures 219
Results of Aquifer Storage Recovery Wells
Development of Water Mound
Table 9.14 Development of water mound
Height of Radius of Period of Period of Month of Max.
Water Mound Influence, m Development, Decay, Days Height
1997 1998 days
Khadvanthali 6.13 6.03 570 120 220 Middle Oct.
Goraj 8.67 8.14 530 100 200 Middle Nov.
Summary of Results
From the foregoing discussion, following conclusions emerge.
(i) The height of water mound developed in A.S.R. wells in miliolite limestone is 8.4 m ascompared to A.S.R. wells in weathered trap 6.1 m but radius of influence are 530 mand 570 m and period of development of water mound is 100 days and 120 days whereasperiod for decay is 200 and 220 days, respectively indicating miliolite limestone greaterpermeability. Water mound height in limestone is higher but less life period.
(ii) Silting in percolation tanks and check dams not only decreases the storage capacitybut also reduces recharge rate as seen from following results.
Average Rech. Recharge Rate Vol. of Rech./Rate, Mm/day Equations Vol. of Evapo.
Normal Percolation Tank 7.87 I = 13 T–0.111 1.83Desilted Percolation Tank 20.40 I = 34.67 T–0.089 4.20Normal Check Dam 30.05 I = 57.67 T–0.205 2.48Desilted Check Dam 47.94 I = 67.33 T–0.086 3.08
(iii) Recharge structures have effect upto greater extent on downstream as compared toupstream as seen from following results.
Radius of Influence
U/S D/S
Percolation Tank Miliolite limestone 1100 1300Gaj limestone 780 1000Weathered basalt rock 720 1100
Check Dam Weathered basalt rock 430 550
(iv) The T.D.S. values, which is a quality parameter is remarkably less at the vicinity ofrecharge structure and increases alongwith the distance of the structure. This is dueto dilution caused by recharge.
(v) Monitoring one check dam and one aquifer storage recovery well in flouridecontaminated area indicated a significant decrease in flouride content, which provesthat recharge methods are effective in reducing effects of flouride.
Name of Well

220 Energy ManagementWater Management220
(vi) The values of linear and volumetric efficiencies are nearly the same for all percolationtanks and check dams. This can also be taken as performance indicator of successfulrecharge effort.
(vii) The percolation tanks and check dams are said to be successful if the efficiency ismore than 70% and said to be effective if it is more than 80%.
(viii) The desilted percolation tanks and check dams have very long life, it can not be predictedbut the life of percolation tanks and check dams is 6 to 7 years. So it is better to desiltthe existing percolation tanks and check dams than to construct new one.
(ix) Recharge rate is maximum (30.25 mm/day) in miliolite limestone, medium (24.47 mm/day) in Gaj limestone and minimum (20.40 mm/day) in weathered basalt rock.Recharge rate equations for percolation tank areI = 86.5 T–0.125 for miliolite limestoneI = 41 T–0.113 for Gaj limestoneI = 34.67 T–0.89 for weathered basalt rock
This indicates recharge structures are more effective in miliolite limestone.
From the above, one can deduce that for success of any recharge structures in Saurashtraregion following serves as the performance indicators.
(a) Height of water mound formed(b) Areal extent of water spread both upstream and downstream of the structure.(c) Linear and volumetric efficiency(d) Water quality parameters such as TDS and Flouride(e) Management of recharge structure
Given a scenario like Saurashtra, it is needless to say that though the water is trapped in anunconfined aquifer, it is only through the recharge efforts; water is made available in difficultperiods either during a draught cycle or in summer. This itself speaks volumes of the rechargeefforts put in by the people of Saurashtra.

10.1 INTRODUCTIONAt present, 6 out of 10 people live within 60 km of the coast and by the end of 2020 more thantwo-third of the population of developing countries, i.e. around 4,000 million people, will livein the vicinity of the sea. For ages, mankind is attracted to these areas because of the availabilityof an abundance of food (e.g., fisheries and agriculture) and the presence of economic activities(e.g., trade, harbors, ports and infrastructure). Due to increasing concentration of humansettlements, agricultural development and economic activities, the shortage of fresh groundwaterfor domestic, agricultural, and industrial purposes becomes more striking in these coastal zones,resulting in seawater intrusion and related deterioration of the water quality.
During the latter part of 20th century there has been a widespread increase in urbanization.As many major cities in the developing world are situated on the coast, and many lie onunconsolidated aquifers, this has placed increasing importance on coastal unconsolidatedaquifers for water supply. As little as 2% seawater in freshwater can render the water non-potable, and saline water has been reported to be the most common pollutant in freshgroundwater (Todd (1980)). The problem of seawater intrusion requires the application ofspecific management techniques.
The term sea water intrusion specifically describes the situation where modern seawaterdisplaces, or mixes with, freshwater within an aquifer in response to a change in the hydro-geological environment. The expression is, however, frequently used to describe any casewhere waterbodies of differing salinities occupy the same aquifer system. The most commonprocesses responsible of salinization in coastal aquifers are:
1) Present-day (active) seawater intrusion due to overpumping and upward displacementof the freshwater-saline interface.
2) In the case of confined aquifers, the natural geochemical evolution of groundwateralong a particular flow-path may result in a progressive increase of salinity. If theaquifer is made of partly flushed marine sediments, groundwater may acquire achemical signturel (either sodium chloride or calcium chloride facies) similar tothe observed trend in the case of seawater intrusion. Refreshing of aquifers maylead to important.
1010101010 SEA WATER INTRUSIONSSEA WATER INTRUSIONSSEA WATER INTRUSIONSSEA WATER INTRUSIONSSEA WATER INTRUSIONS

222 Energy ManagementWater Management222
3) Changes in water chemistry due to cation exchange in coastal aquifers (Appelo andPostma, 1994).
4) Dissolution by groundwater of evaporitic minerals interbedded in the stratigraphiccolumn. Intense pumping may force groundwater leaching of low permeability horizonscontaining soluble salts.
5) Upward leakage from a deeper confined aquifer into a shallow phreatic water-bearinghorizon may also result in a marked increase of salinity.
6) Irrigation returns flow or infiltration of industrial wastewaters or sewage.7) Infiltration from estuaries or artificial canals containing brackish waters. In this case,
three different water types may be interacting in the aquifer.8) Presence of connate, trapped brines or brackish waters mixed in different proportions
with shallow groundwater.9) Incorporation of sea salt spray into infiltrating waters in the soil layer.
In the simple case of direct seawater intrusion or a simply mixture of two water types, themixing proportions of the two end-members (e.g. seawater and fresh groundwater or riverwater from an estuary) can be derived from a simple linear relationship. This approach can befollowed using a series of physical, chemical or isotopic parameters, as long as there is sufficientcontrast (in the chemical or isotopic contents) between the two types of waters, and theparameters are conservative. Among these parameters, the most commonly used are: electricalconductivity, chloride, bromide, sodium, oxygen- 18, deuterium, etc.
Fig. 10.1 Simplified freshwater-saltwater interface in a coastal water-table aquifer.
Already at this moment, many coastal aquifers in the world, especially shallow ones,experience an intensive salt water intrusion caused by both natural as well as man-inducedprocesses (Oude Essink, 2000a).
Human interferences, such as mining of natural resources (water, sand, oil and gas)and land reclamation (causing subsidence) threaten coastal lowlands. Consequently,salinities of surface water systems increase and land degradation occurs because soilsbecome more saline. As a result, poor crop yields are produced due to salt damage andindigenous crops might be substituted by more salttolerant crops. If even the salt-tolerant
LA N D SU R FA C EW AT ER TA B LE
FR E S H W AT E R
IN TE R FA C E
S EA LE V E L
S EA FL O O R
h
S ALT W ATE R
z

223Energy Management Sea Water Intrusions 223
crops cannot withstand the high salinities, the population might eventually migrate fromthe barren land and resettle in more fertile arable territories, which could cause socialcommotions. In addition, coastal aquifers within the zone of influence of mean sea level(M.S.L.), are threatened by an accelerated rise in global mean sea level. This rise in globalmean sea level, 50 cm for the coming century as the present best estimate, could evenmore jeopardize vulnerable coastal aquifers than they are threatened today. Subsequently,the salinization of coastal aquifers will accelerate. This could mean a reduction of freshgroundwater resources. In addition, the present capacity of the discharge systems in severalcoastal lowlands may be insufficient to cope with the excess of seepage water, especially inthose coastal areas, which are below M.S.L. This seepage will probably have a highersalinity than at present.
10.2 CAUSES OF SEA WATER INTRUSIONSea water intrusion is caused primarily by the reduction of fresh water discharge to thesea as a result of groundwater abstraction. The water is derived from one of the threesources: drainage from the water table; release from elastic storage; and drainage at theseawater/fresh water interface, where fresh water is replaced by salt water (Essaid, 1986).The salt-water wedge consequently moves inland, flushing decreases, and the thickness ofthe wedge increases. If some fresh water flow is maintained at the coast, a new equilibriumeventually develops.
Groundwater abstraction above the interface causes up-coning. Depending on aquifercharacteristics, well penetration, and pumping rate, a stable situation may be attained, wheresalt water does not reach the well. However, when this critical state is exceeded, salt waterenters the well, mixes with the fresh water, and the quality of the discharge decreases.
Abstraction is not the only control on the position of the saline water/freshwater interface.A number of other factors can affect its position including:
1) Seasonal changes in natural groundwater flow2) Tidal effects3) Barometric pressure4) Seismic waves5) Dispersion6) Climate change — global warming and associated sea level rise.
Some of these have short-term implications (tidal effects and barometric pressure) someare periodic (seasonal changes in groundwater flow) and others are long term (climate changeand artificial influences).
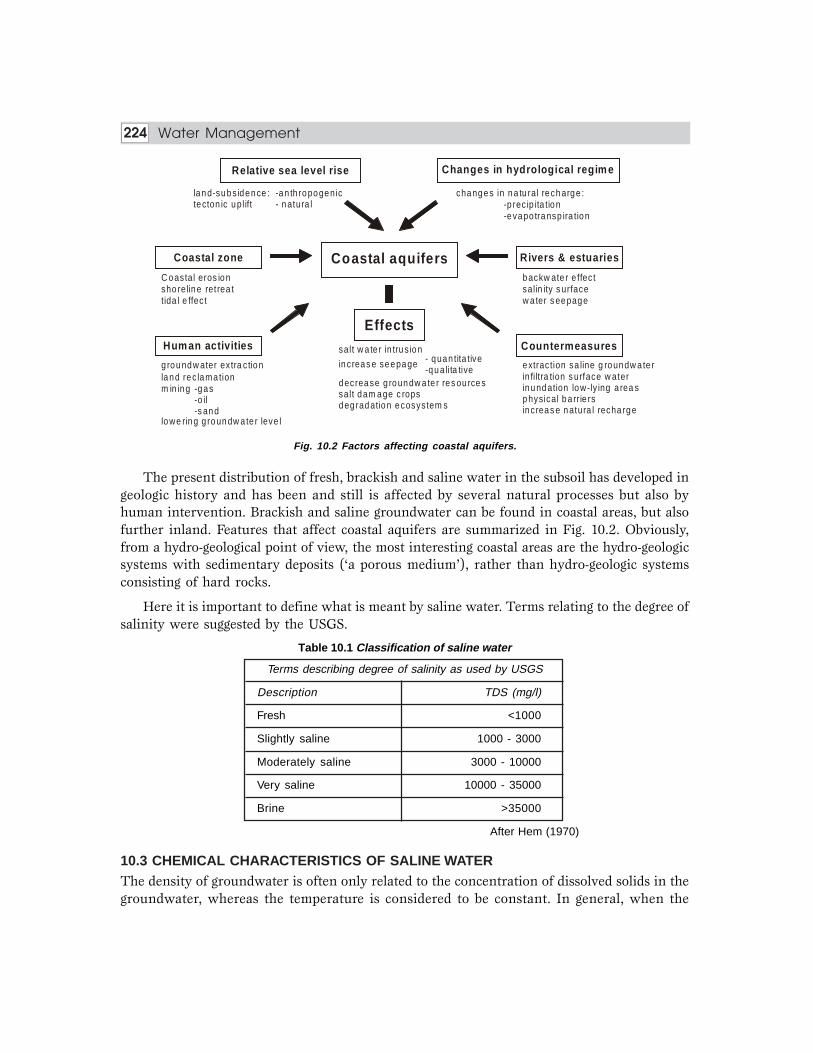
224 Energy ManagementWater Management224
Fig. 10.2 Factors affecting coastal aquifers.
The present distribution of fresh, brackish and saline water in the subsoil has developed ingeologic history and has been and still is affected by several natural processes but also byhuman intervention. Brackish and saline groundwater can be found in coastal areas, but alsofurther inland. Features that affect coastal aquifers are summarized in Fig. 10.2. Obviously,from a hydro-geological point of view, the most interesting coastal areas are the hydro-geologicsystems with sedimentary deposits (‘a porous medium’), rather than hydro-geologic systemsconsisting of hard rocks.
Here it is important to define what is meant by saline water. Terms relating to the degree ofsalinity were suggested by the USGS.
Table 10.1 Classification of saline water
Terms describing degree of salinity as used by USGS
Description TDS (mg/l)
Fresh <1000
Slightly saline 1000 - 3000
Moderately saline 3000 - 10000
Very saline 10000 - 35000
Brine >35000
After Hem (1970)
10.3 CHEMICAL CHARACTERISTICS OF SALINE WATERThe density of groundwater is often only related to the concentration of dissolved solids in thegroundwater, whereas the temperature is considered to be constant. In general, when the
Relative sea level rise Changes in hydrological regim e
Coastal zone Coastal aquifers Rivers & estuaries
Hum an activities
EffectsCountermeasures
land-subs idence :tecton ic uplift
-an th ropogenic- natura l
changes in na tu ral recharge :-p rec ip ita tion-evapo transp ira tion
C oastal eros ionsho reline ret rea ttida l e ffec t
backw ate r e ffec tsalin ity s urfacew a ter s eepage
g roundw ater ex tra c tion increas e seepage - quan tita tive-qua lita tive
decrease g roundw a te r res ou rcessalt dam age c ropsdeg radation ecosystem s
extrac tion sa line g roundw a te rin fi ltra tion s urface w aterinundation low-ly ing a rea sphysical ba rr ie rsincreas e natura l recha rge
land rec lama tionm in ing -gas
-o il-s and
lowe ring g roundw a te r leve l
salt w a te r in trus ion

225Energy Management Sea Water Intrusions 225
quality of groundwater is in question, the salinity or total dissolved solids (TDS) is considered.An advantage of using TDS is that a rapid determination of TDS is possible by measuring theelectrical conductivity of a groundwater sample.
The concentration of dissolved solids is subdivided into negative (anions) and positiveions (cations), see table 10.2. For instance, ocean water consists of 11 main components:Since in coastal groundwater chloride (Cl–) is the predominant negative ion, which ismoreover investigated intensively, the interest is often focussed on the chloride distribution.When, in fact, only changes in the chloride distribution are simulated, the distribution ofall dissolved solids is meant. In other words, the distribution of chloride ions is consideredto represent the distribution of all dissolved solids. As such, a proportional distribution ofall dissolved solids, which is present in ocean water, is also assumed to be present ingroundwater under consideration.
The applied classification of fresh, brackish and saline groundwater based on chlorideconcentrations according to Stuyfzand (1993) is presented in Table 2.2. Obviously, there arevarious other classification systems possible, e.g. because the definition for fresh groundwaterdepends on the application of the groundwater. For instance, the drinking water standard inthe European Community equals 150 mg Cl—/l (Stuyfzand, 1986), while according to theWorld Health Organisation, a convenient chloride concentration limit is 200 mg Cl–/l (Custodioet al., 1987). A chloride concentration equal to 300 mg Cl–/l indicates the taste limit of humanbeings according to ICW (1976), while Todd (1980) gives 100 mg Cl–/l as the limit when saltcan be tasted. Livestock can endure higher concentrations: up to 1500 mg Cl–/l may be accepted,in case the chloride concentration stays constant.
Table 10.2 Composition of ocean water
(The three components with low concentrations are Strontium (± 8 mg/l), Barium(±5 mg/l) and Fluoride (±1 mg/l).
IONS mg/l
Negative ions Cl– 19000
SO4
–2 2700
HCO3
– 140
Br– 65
Total negative ions 21905
Positive ions Na+ 10600
Mg+2 1270
Ca+2 400
K+ 380
Total positive ions 12650
Total Dissolved Solids 34555

226 Energy ManagementWater Management226
Table 10.3 Classification into eight main types of fresh, brackish or saline groundwater
Chloride Concentration(mg Cl–/l)
depending on the basis of 0 – 5
chloride concentration, after
Stuyfzand (1993). Oligohaline
Oligohaline-fresh 5 – 30
Fresh 30 – 150
Fresh-brackish 150 – 300
Brackish 300 – 1000
Brackish-saline 1000 – 10000
Saline 10000 – 20000
Hyperhaline or brine ≥ 20,000
10.4 CONCEPT OF FRESH-SALINE INTERFACE
A coastal aquifer contains the interface between the fresh water, which has relative density ofapproximately unity, and seawater that has a relative density in the order of 1.025. This differencein density results in the seawater lying underneath the freshwater on the landward side ofcoastline. The simplest way to view the situation is to assume that the fresh and saline waterare immiscible. Thus the interface is sharp. In practice the fresh and saline water are miscible.Therefore, the interface is not sharp and a mixing zone exists, the thickness of which dependsupon the hydrodynamics of the aquifer. If this transition zone is only a small fraction of thesaturated thickness of the aquifer then the assumption of a sharp interface is reasonable and agood mathematical description of the shape of the saline wedge can be obtained. This idealizedview of the situation is shown in Fig. 10.1. The thickness of the freshwater wedge decreases inthe seaward direction and the slope of the water table steeping towards the coast. Therefore,the shape of the interface is concave upwards.
Although the differences in density appear to be small, they have a significant effecton piezometric heads and thus on the groundwater system. In many approaches, onlyfresh groundwater is considered in coastal aquifers, so no density differences are takeninto account. In reality, however, density flow may highly affect groundwater flow inthese coastal aquifers. In this chapter, a straightforward concept is applied which takesinto account density flow in a simple way: the interface approximation based on the BadonGhijben- Herzberg principle.
Badon Ghijben-Herzberg principle: The Badon Ghijben (1889) - Herzberg (1901) principle(BGH) describes the position of an interface between fresh and saline groundwater (Fig. 10.3).Following represents the Badon Ghijben-Herzberg principle:
Main Type of Groundwater

227Energy Management Sea Water Intrusions 227
Fig. 10.3 The Badon Ghijben-Herzberg principle: a fresh-salt interface in an unconfined coastal aquifer.
pressure saline groundwater = pressure fresh groundwater
ρsHg = ρf (H+h)g ⇔ ρsH + ρfh
h = ρ ρ
ρs f
f
– H ⇔ h = αH
For ρs = 1025 kg/m3 and ρf =1000 kg/m3, the relative density difference α = 40. Theequation is correct if there is only horizontal flow in the fresh water zone and the saline wateris stagnant. Though the position of the interface is not correct at the outflow zone, the use ofthe equation still gives a rather good approximation of the real situation. The Badon Ghijben-Herzberg principle was originally formulated for the situation that the transition zone betweenfresh and saline groundwater is only a small percentage of the thickness of the saturatedfreshwater body (thus, mostly in the order of several metres). Under these circumstances, afresh-salt interface should be applied. This situation occurs in unspoiled sand-dune areas or(coral) islands, where the freshwater lens evolves by natural groundwater recharge. In addition,the principle can only be applied in case the vertical flow component in the freshwater body isnegligible. In reality, however, such systems seldom occur. Most systems are not hydrostatic(the Dupuit-Forcheimer condition 2 should not be applied), and as a result, the formula leadsto (small) errors, especially in the vicinity of the outflow zone. Nevertheless, though the positionof the interface is not completely correct, the use of the equation still gives a rather goodapproximation of the real situation. As a matter of fact, the principle should only be appliedunder the following conditions:
1. The aquifer is homogeneous,2. Hydrodynamic dispersion is negligible,3. Vertical flow in the aquitard, horizontal flow is negligible,4. Horizontal flow in the aquifer, vertical flow is negligible,5. Saline groundwater is at rest: q
s = 0.
10.5 PHENOMENON OF ZONE OF DISPERSIONThe general pattern of fresh groundwater flow in coastal aquifers is from inland rechargeareas where groundwater levels (hydraulic heads) typically are highest to coastal discharge
h
H
fresh
sa line
h f
sea
fresh
h
H
s
f
sa line
h f
= ( - ) /s f f
O u tf lo w
S ea h
HCalcula ted
A c tu a l In te rfa ce
Interface
Fa ce

228 Energy ManagementWater Management228
areas where groundwater levels are lowest. Hydraulic head (often simply referred to as “head”)is a measure of the total energy available to move groundwater through an aquifer, andgroundwater flows from locations of higher head (that is, higher energy) to locations of lowerhead (lower energy). The distribution of hydraulic head within an aquifer is determined bymeasuring ground-water-level elevations in observation wells that are open to a small intervalof the aquifer. The groundwater level (elevation) at each well, most often is reported as metersabove or below sea level. The upward direction of some of the groundwater flow paths nearand beneath the ocean in the aquifer system indicates that groundwater heads in the deeperpart of the flow system are above sea level near the coast.
Fresh groundwater comes in contact with saline groundwater at the seaward margins ofcoastal aquifers. The seaward limit of freshwater in a particular aquifer is controlled by theamount of freshwater flowing through the aquifer, the thickness and hydraulic properties ofthe aquifer and adjacent confining units, and the relative densities of saltwater and freshwater,among other variables. Because of its lower density, freshwater tends to remain above thesaline (saltwater) zones of the aquifer, although in multilayered aquifer systems, seaward-flowing freshwater can discharge upward through confining units into overlying saltwater. Ingeneral, saltwater is defined as water having a total dissolved-solids concentration greater than1,000 milligrams per liter (mg/L). Seawater has a total dissolved-solids concentration of about35,000 mg/L, of which dissolved chloride is the largest component (about 19,000 mg/L).
The freshwater and saltwater zones within coastal aquifers are separated by a transitionzone (sometimes referred to as the zone of dispersion) within which there is mixing betweenfreshwater and saltwater (Figs. 10.4). The transition zone is characterized most commonly bymeasurements of either the total dissolved-solids concentration or of the chloride concentrationof groundwater sampled at observation wells. Although there are no standard practices fordefining the transition zone, concentrations of total dissolved solids ranging from about 1,000to 35,000 mg/L and of chloride ranging from about 250 to 19,000 mg/L are common indicatorsof the zone. In general, the term “transition zone” implies a change in the quality of groundwater from freshwater to saltwater, as measured by an increase in dissolved constituents suchas total dissolved solids and chloride.
Within the transition zone, freshwater flowing to the ocean mixes with saltwater by theprocesses of dispersion and molecular diffusion. Mixing by dispersion is caused by spatialvariations (heterogeneities) in the geologic structure and the hydraulic properties of an aquiferand by dynamic forces that operate over a range of time scales, including daily fluctuations intide stages, seasonal and annual variations in groundwater recharge rates, and long-term changesin sea-level position. These dynamic forces cause the freshwater and saltwater zones to moveseaward at sometimes and landward at sometimes. Because of the mixing of freshwater andsaltwater within the transition zone, a circulation of saltwater is established in which some ofthe saltwater is entrained within the overlying freshwater and returned to the sea, which inturn causes additional saltwater to move landward toward the transition zone (Fig. 10.4). Thehorizontal (or lateral) width of the transition zone can be narrow or very wide. The verticalthickness of the transition zone also varies among aquifers, but generally is much smaller thanthe horizontal width and is limited by the total thickness of the aquifer.

229Energy Management Sea Water Intrusions 229
Fig. 10.4 (a)
Fig. 10.4 (b)
Figure 10.4 Salt Water Intrusion in a Coastal Aquifer: a) balance between fresh waterand static salt water and b) circulation of salt water from the sea to the zone of diffusion andback to the sea (modified from Henry, 1964).
For the convenience of illustrating freshwater-saltwater interactions as simply as possibleand facilitating simplified scientific analysis of these interactions when possible, the freshwaterand saltwater zones often are assumed to be separated by a sharp boundary that is referred toas the freshwater-saltwater interface, such as those shown in Fig. 10.4. Although the depth tothis interface is quite variable, it can be estimated approximately under some circumstances byusing a technique known as the Ghijben - Herzberg relation.
The variety of geologic settings, aquifer types, and hydrologic conditions along the Atlanticcoast has resulted in many patterns of freshwater-saltwater flow and mixing in coastal aquifers.Following are some case studies that illustrate some of the important freshwater-saltwaterenvironments that exist in aquifers along the Atlantic coast and highlight the many variablesthat control the natural occurrence and flow of freshwater and saltwater in coastal aquifers.The case studies progress from the glacial aquifer of Cape Cod, Massachusetts (Fig. 10.5),which is representative of shallow, single-layer aquifers, to two of the most productive regionalaquifer systems in the United States—the Northern Atlantic Coastal Plain aquifer system thatextends from Long Island, New York, through North Carolina, and the Floridian aquifer systemthat extends from South Carolina to Alabama. These are thick, multilayered aquifer systemsthat underlie thousands of square miles.

230 Energy ManagementWater Management230
Fig. 10.5 Patterns of the freshwater-saltwater transition zone at three sites in the Cape Cod aquifer,Massachusetts.
In addition, the transition zone is also increasing as a result of the circulation of brackishwater due to inflow of saline groundwater (mixing with fresh groundwater due to hydrodynamicdispersion), the tidal regime and human activities, such as (artificial) recharge and groundwaterextraction at high and variable rates (Cooper et al., 1964).
10.6 ANALYTICAL FORMULAE FOR THE FRESH – SALINE INTERFACEIn the following, analytical formulae for the interface between fresh and saline groundwaterare presented for unconfined, confined and semi-confined aquifers, illustrated with somesimple examples. For more information, see van Dam (1983, 1992). These analyticalsolutions increase the understanding of groundwater flow and fresh groundwater resourcesin coastal areas.
Unconfined aquifer (1D situation)
Freshwater lenses have evolved in unconfined (phreatic, water table) aquifers due to naturalgroundwater recharge (Fig 10.6). The three governing equations are (van Dam, 1992):
(I) Darcy : q = –k (H + h)dhdx
(II) Continuity : dq = f dx(III) BGH: h = α H
Where
• q = groundwater flow per unit coast length (L2 T–1),
• H = depth of the fresh-salt interface below mean sea level (L),
• f = natural groundwater recharge (L T–1),
• x = horizontal position (distance from the axis of symmetry) (L),
• α = relative density difference (ρs – ρf )/ρf (–),
• h = piezometric head of fresh water with respect to mean sea level (L).

231Energy Management Sea Water Intrusions 231
Fig. 10.6 The fresh-salt interface in an unconfined aquifer.
Combining the equations gives:
dq = fdx ⇔ q = fx + C1
– k(H + h) dhdx
= fx + C1 ⇔ – k(H + αH)α dHdx
= fx + C1
HdH = fx C
kdx H
fx C x C
k++
¤ =+
+1 2
21 2
112
12
1( )
– –
( )a a a a
The analytical formulae are as follows:
H =– –
( )fx C x C
kh Hq f x C
21 2
1
2 21
++
== +
α αα
Example 10.1: Elongated Island
A one-dimensional phreatic groundwater flow is considered through an elongated islandor a strip of sand-dunes where a freshwater lens has evolved due to natural groundwaterrecharge (Fig. 10.7). The boundary conditions are:
Fig. 10.7 The fresh-salt interface in an elongated island.


233Energy Management Sea Water Intrusions 233
In many shallow phreatic aquifers, the freshwater body originally touches the imperviousbase, thus creating a salt water wedge of length L, see Fig. 10.8. The corresponding boundaryconditions are:
x = 0: q = q0 (q0 = –fW) .→ C1 = q0
x = 0: H = 0 C2 = 0where
• W = width of the coastal aquifer up to the water divide (L),• q0 = natural groundwater outflow at the coastline x=0 (negative sign) (L2 T–1).
Saline groundwater is stagnant. The length of the salt water wedge L is:
x = L : H = Dwhere D = thickness of the aquifer (L). The equations of this case become:
H = – –
( )fx q xk
o2 21 + α α
h = αH
q = fx + q0
q0 = – fW
L = –q
fo –
qf
kf
DoFHG
IKJ +
22 1– ( )α α
For example, if W=3000 m, f=1 mm/day, α=0.020, k=20 m/day and D=50 m, then thelength of the salt water wedge L is 175.1 m.
Unconfined aquifer (axial-symmetric situation)
The three equations for the axial-symmetric situation, that is a circular sandy island withrecharge, are (Van Dam, 1992):
(I) Darcy: Q = – 2πrk(H+h)
(II) Continuity: dQ = f2πrdr ⇔ Q = fr2π+C1
(III) BGH: h = αH ⇔
= α
Combining these equations gives:
–2k(H+αH)α
= fr+
π
HdH = –+
π+ α α
dr ⇔ 12
H2 = +
π+α α


235Energy Management Sea Water Intrusions 235
Fig. 10.9 The fresh-salt interface in a confined aquifer.
A confined aquifer is enclosed by two aquicludes. The three equations involved are(Fig. 10.9).
(I) Darcy : q = – kH dhdx
(II) Continuity : q = q0
(III) BGH : h = α (H + A)where
• q0 = fresh groundwater flow from recharge in the uplands, per unit coast length (L2T–1),• A = height of the sea level with respect to the top of the aquifer (L).
Combining the equations: – kH dhdx
= qo ⇔ HdH = – qk
o
a dx
12
2H = –q xk
o
a + C ⇔ H =
–2q xk
Co
a+ 2
Example 10.4: Salt Water Wedge in a Confined Aquifer
The freshwater body touches the impervious base, thus creating a salt water wedge(Fig. 10.10). The corresponding boundary condition is:
x = 0 ; H = 0 → C = 0
Fig. 10.10 The salt water wedge in a confined coastal aquifer.

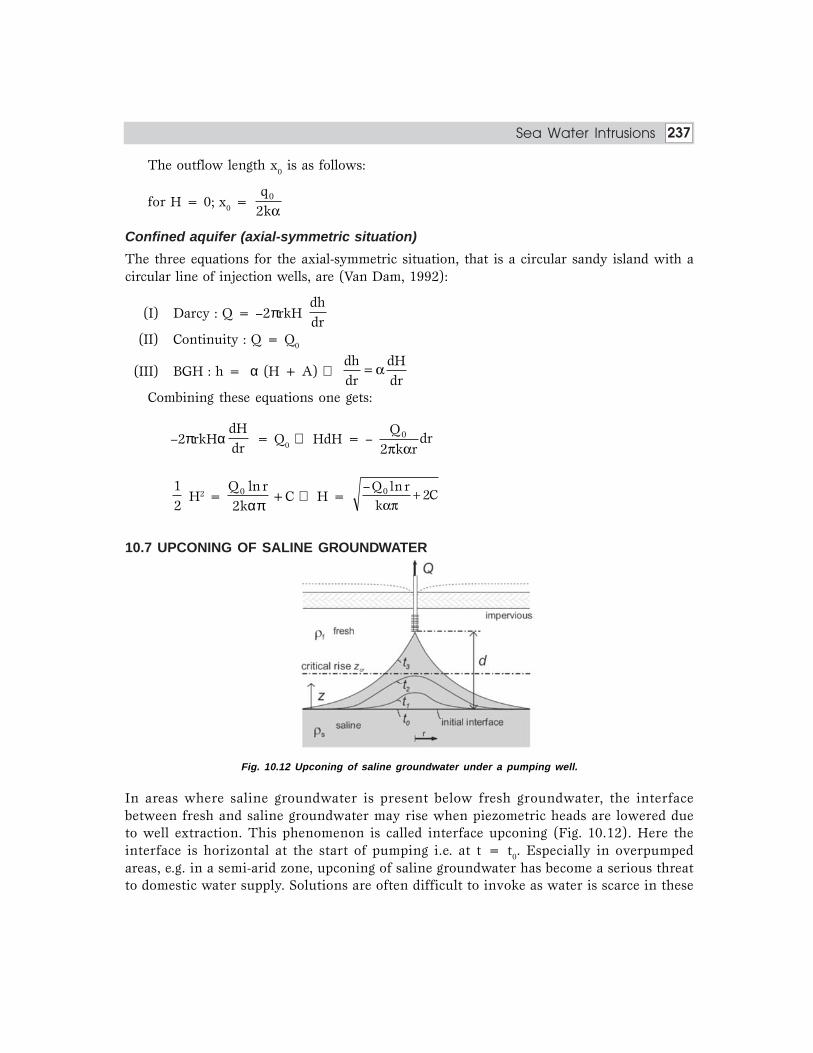
237Energy Management Sea Water Intrusions 237
The outflow length x0 is as follows:
for H = 0; x0 = qk
0
2 a
Confined aquifer (axial-symmetric situation)
The three equations for the axial-symmetric situation, that is a circular sandy island with acircular line of injection wells, are (Van Dam, 1992):
(I) Darcy : Q = –2πrkH dhdr
(II) Continuity : Q = Q0
(III) BGH : h = α (H + A) ⇔ dhdr
dHdr
= a
Combining these equations one gets:
–2πrkHαdHdr
= Q0 ⇔ HdH = – Qk r
dr0
2p a
12
H2 = Q r
k0
2lnαπ
+C ⇔ H = – lnQ r
kC0 2
ap+
10.7 UPCONING OF SALINE GROUNDWATER
Fig. 10.12 Upconing of saline groundwater under a pumping well.
In areas where saline groundwater is present below fresh groundwater, the interfacebetween fresh and saline groundwater may rise when piezometric heads are lowered dueto well extraction. This phenomenon is called interface upconing (Fig. 10.12). Here theinterface is horizontal at the start of pumping i.e. at t = t0. Especially in overpumpedareas, e.g. in a semi-arid zone, upconing of saline groundwater has become a serious threatto domestic water supply. Solutions are often difficult to invoke as water is scarce in these

238 Energy ManagementWater Management238
areas and illegal extractions are not easily to be stopped. As a result of the extraction andthe lowering of the piezometric heads in the fresh and saline groundwater zone, the interfacewill rise. In case of a continuous extraction of fresh water, the interface will rise until itreaches the pumping well. From that moment, the quality of the extracted groundwaterdeteriorates, and the pumping has to stop. When the pumping is stopped, the denser salinewater tends to settle downward and to return to its former position. In order to avoid or tolimit these negative effects, one should keep the extraction rate, and so the lowering of thepiezometric head, below a certain limit. After reducing the extraction significantly, theinterface may descend to its original position, though at a very slow pace. Another solutionis to replace the extraction well to a location where saline groundwater is positioned atgreater depth from the well.
10.8 EFFECT OF A RELATIVE SEA LEVEL RISEChanges in global mean sea level (M.S.L.) will probably directly affect the coastal surfacewater system, rivers and estuaries, as well as the coastal aquifers.
Coastal aquifers within the zone of influence of mean sea level, obviously situated nearbythe coastline itself, will be threatened seriously by sea level rise. Sea level rise will acceleratethe salt water intrusion into these groundwater flow systems, which could result in a decreaseof fresh water resources. In addition, the mixing zone between fresh and saline groundwaterwill be shifted further inland. Groundwater abstraction wells, which were previously locatedbeyond the saline water zone, will there be in areas where upcoming of saline groundwatercan easily occur. This can be considered as one of the most serious effects of sea level rise forevery coastal aquifer where groundwater is heavily exploited.
Causes of Sea Level Rise
Thermal Expansion of Ocean Water: Thermal expansion of ocean water is an importantfactor contributing to rise in sea level. It depends heavily on the temperature level of the oceanwater and salinity.
Melting of Mountain Glaciers and Small Icecaps
Ablation of and Accumulation on Polar Ice Sheets: The polar ice sheets will also react toclimate change. Moreover the process of disintegration of ice sheets which are sensitive tosmall change in sea level or melting rates can accelerate the sea level rise process.
Here, the impacts of a relative sea level rise on the coastal surface water system, rivers andestuaries, and coastal aquifers are discussed:
• The coastal surface water system will directly sense the impacts of sea water level rise.Increases in storm surges, wave attack, flooding, and collapses of coastal protectiondefences could directly induce the inundation of populated areas and loss of lives mustbe feared. Furthermore, in the medium term, sea level rise would cause an increase incoastal erosion. If no compensating measures such as sand-suppletion are taken, itcould result in severe shoreline retreat. Shoreline retreat will also affect coastal aquifers

239Energy Management Sea Water Intrusions 239
(Fig. 10.13), e.g., by reducing the width of the sand-dunes along the coastline wherefresh groundwater resources are situated and by diminishing the length over whichnatural groundwater recharge occurs. Both events may lead to a decrease in freshgroundwater resources.
• Rivers and estuaries will experience an increased salt water intrusion in case of sealevel rise, if the river bed elevation can not match with sea level rise. Because thesediment load at many river mouths is reduced significantly these last decades amongothers due to human activities (building dams, sand-mining), quite some rivers andestuaries are expected to have an increased salt water intrusion. This could threatenadjacent aquifers along rivers and estuaries from which groundwater is extracted.Furthermore, the backwater effect of sea level rise would also decrease the safetyagainst flooding over large distances upstream the river mouth. Especially areas adjacentto rivers with valley slopes only slightly steeper than river slopes have to be protectedby embankments.
• Coastal aquifers within the zone of influence of M.S.L. can be threatened by sea levelrise (Fig. 10.13). Intrusion of salt water is accelerated into these aquifers, which couldresult in smaller freshwater resources (Oude Essink, 1999b, 2000a). Furthermore,seepage will increase quantitatively in those areas and this seepage could contain moresaline groundwater. In consequence, crops may suffer from salt damage and fertileagriculture land might change into barren land. In addition, the mixing zone betweenfresh and saline groundwater will be shifted further inland. Extraction wells, whichwere previously located beyond the salinization zone, will then be situated in areaswhere upconing of brackish or saline groundwater can easily occur. This can beconsidered as one of the most serious effects of sea level rise for every coastal aquiferwhere groundwater is heavily exploited.
It is important to recognize that impacts of sea level rise must be considered in relation toimpacts of human activities. It is very likely that not sea level rise, but human activities willcause a severe salinization of most coastal aquifers in the future. A reason for this assumptioncan, among others, be deduced from the time lag between causes and effects. Sea level risetakes place progressively. The time characteristic of sea level rise is in the order of decades. Onthe other hand, the time characteristic of human activities, such as groundwater extractionprojects, is in the order of years. Before negative impacts, such as upconing, are recognized, itmay be too late to take countermeasures.
Saltwater Intrusion into Estuaries
During extended droughts, decreased river flow allows the saline water to migrate up theestuary. A rise in sea level will also cause saltwater to migrate upstream. The general methodsof preventing saltwater intrusion up estuaries are similar for sea level rise, drought conditions,and storm surge. Storm surge elevates the ocean in relation to the estuary water level, causingsaltwater intrusion. A major difference is that storm surge and drought conditions last for alimited duration, whereas the sea level rise is expected to last much longer.

240 Energy ManagementWater Management240
Fig. 10.13 Effects of a sea level rise on coastal aquifers.
In order to minimize saltwater migration, river basin commissions provide low-flowaugmentation and water conservation requirements during periods of low flow. Water fromrainfall and snowmelt are stored in large surface reservoirs and released continuously duringdroughts to maintain a flow that helps repel the saltwater from migrating upstream. Theseplanning agencies recognize the need to sustain stream flows to protect freshwater intakes,instream uses (including fish migration and fish production), and shellfish beds, as well astreated-waste assimilation, recreation, and salinity repulsion. An economic justification is usuallynecessary, showing that the cost of the mitigation is less than the anticipated benefits.
10.9 CONTROL OF SALT WATER INTRUSIONIt takes a considerable time before the salinization of the subsoil of groundwater systems dueto the negative effects of human activities (e.g. dramatic lowering of the piezometric heads dueto excessive overpumping) is actually observed. The main reason is that in the salinizationprocess enormous volumes of fresh groundwater have to be replaced by saline groundwater.
Besides technical countermeasures as described below, other instruments are availableto cope with salt-water intrusion problems. For instance, an intensive cooperation between(local) authorities and water users is essential to control the extraction per capita. Educating,training, informing the water users, and participation of water users in regular decisionscould be very effective in coming to a lower water use. In addition, groundwater extractionscould be restricted through a system of permits. It may be necessary to reduce agricultural
natural groun dwa ter recharg e
freshwater lens
sa lin egrou nd water
imperv ious
se a
natural groun dwa ter recharg e
freshwater lens
sa lin egrou nd water
sa lt wa ter we dg e
natural groun dwa ter recharg e
freshwater lens
salinegroundw ater
low-lyingarea
brack ishgroundw ater
natural groun dwa ter recharg e
se alev elrise
x
sh orelineretre at
x
sa lin egrou nd water
imperv ious
freshwater lens
natural groun dwa ter recharg e
se alev elrise
x
sh orelineretre at
sa lin egrou nd water
sh ift of wedge
freshwater lens
sa lt wa ter we dg e
natural groun dwa ter recharg e
se alev elrise
x low-lyingarea
salinegroundw ater
brack ishgroundw ater
freshwater lens
inflow of salinegrou nd water

241Energy Management Sea Water Intrusions 241
activities and move to other places. A shift to more salt resistant crops could enlighten theneed to extract groundwater of high quality. Finally, in some areas (e.g. tropical islands),desalinization of saline water could relieve the stress on groundwater resources though atthe expense of high-energy costs.
10.10 COUNTERMEASURES TO CONTROL SALT WATER INTRUSIONAs countermeasures to control the salt-water intrusion probably also need a long time tobecome effective, they should be taken in due time. In general, the salinization may be substantialin coastal groundwater flow systems where the existing piezometric heads are lower than afew meters above M.S.L. In those cases, countermeasures should be applied to reduce salt-water intrusion. The following countermeasures against the salinization process can beconsidered (Fig. 10.14).
Fig. 10.14 Countermeasures to control salt water intrusion.

242 Energy ManagementWater Management242
Recent increases in global population, together with enhanced standards of living, havecreated greater demand on water resources, requiring improved groundwater management.Any new groundwater development should take into account the possibilities of saline intrusion,and ensure adequate control, with prevention of saline intrusion being seen as the ideal. Anyintrusion carries with it the risk that the matrix of the aquifer will become contaminated,causing a permanent loss of freshwater storage capacity. The impact of saline intrusion on theNile delta is described in a case study.
Where the possibility of intrusion exists, appropriate monitoring procedures should beroutinely carried out. A network of sampling piezometers should be established to monitorheads and salinity changes along the coastal fringe.
Actual methods for controlling saline intrusion vary widely according to geology, extent ofthe problem, water use, and economics. They generally rely on the principle that, in order tolimit seawater intrusion, some freshwater outflow above the saline wedge must be maintained.They can be broadly divided into methods relying on barriers and those dependent on aquifermanagement; some of these are discussed briefly below.
Barriers: Barriers to saline intrusion include recharge mounds, abstraction troughs, andphysical barriers.
Abstraction Troughs: An abstraction barrier is created by maintaining abstraction along a lineof wells close to the coast. This creates a pumping trough, with seawater flowing inland to thetrough, and freshwater flowing seaward. The fresh water can then be utilized by inland wells.
Recharge Mounds (Injection Barrier): This approach uses recharge wells to maintain a pressureridge along the coast. The injected water flows both landward and seaward. Ideally high qualityfresh water is required for recharge, necessitating the development of a supplemental source.
Physical Barriers: An impermeable subsurface barrier may be created through the verticalextent of the aquifer, parallel to the coast. The barrier may be constructed of various materialsincluding sheet piling, puddled clay, cement grout, or bentonite. The approach is best appliedto small-scale problems.
Aquifer Management: Aquifer management i.e. modification of pumping, is generally carriedout on a regional scale. Modification requires changes in operational practices.
Control of Pumping: Modifying pumping practice and/or well system through reduction ofwithdrawal rates and/or adequate relocation of extraction wells. The desired extraction rateshould preferably be extracted by well-distributed shallow wells to prevent excessive upconing.In most situations, groundwater withdrawal for domestic, agricultural and industrial watersupply has not been reduced during periods of droughts, so that salt water intrusion tends tooccur anyway. In the case where an aquifer is underlain by saline fluid, upconing can belimited by proper design and operation of wells (Bowen (1986)). For example, wells should beas shallow as is feasible, and should be pumped at a low, uniform rate. Riddel (1933) suggestedthat a multiple well system with small individual pumping rates was preferable to a high capacitysingle well. Another alternative is an infiltration gallery (i.e. horizontal well) which has beenreported to help reduce the upconing that can result from heavy pumping by a vertical well(Das Gupta (1983)). However, these are expensive to install, and similar benefits may beobtained by utilizing several shallow wells.
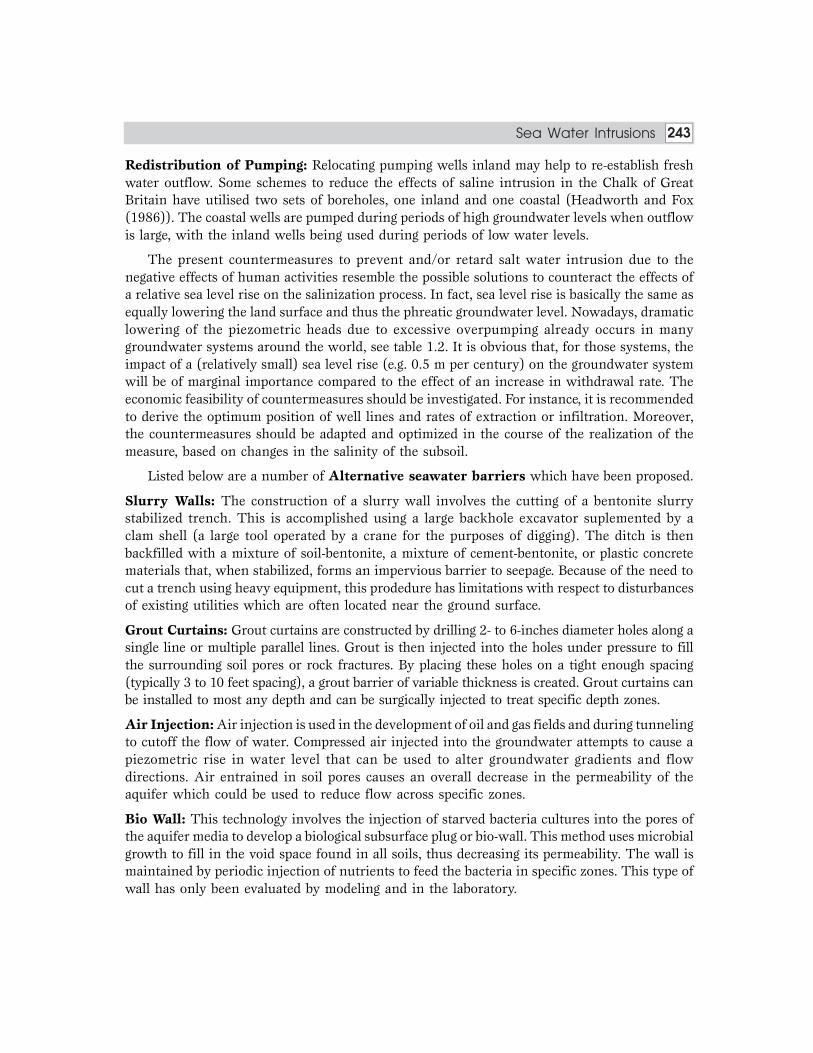
243Energy Management Sea Water Intrusions 243
Redistribution of Pumping: Relocating pumping wells inland may help to re-establish freshwater outflow. Some schemes to reduce the effects of saline intrusion in the Chalk of GreatBritain have utilised two sets of boreholes, one inland and one coastal (Headworth and Fox(1986)). The coastal wells are pumped during periods of high groundwater levels when outflowis large, with the inland wells being used during periods of low water levels.
The present countermeasures to prevent and/or retard salt water intrusion due to thenegative effects of human activities resemble the possible solutions to counteract the effects ofa relative sea level rise on the salinization process. In fact, sea level rise is basically the same asequally lowering the land surface and thus the phreatic groundwater level. Nowadays, dramaticlowering of the piezometric heads due to excessive overpumping already occurs in manygroundwater systems around the world, see table 1.2. It is obvious that, for those systems, theimpact of a (relatively small) sea level rise (e.g. 0.5 m per century) on the groundwater systemwill be of marginal importance compared to the effect of an increase in withdrawal rate. Theeconomic feasibility of countermeasures should be investigated. For instance, it is recommendedto derive the optimum position of well lines and rates of extraction or infiltration. Moreover,the countermeasures should be adapted and optimized in the course of the realization of themeasure, based on changes in the salinity of the subsoil.
Listed below are a number of Alternative seawater barriers which have been proposed.
Slurry Walls: The construction of a slurry wall involves the cutting of a bentonite slurrystabilized trench. This is accomplished using a large backhole excavator suplemented by aclam shell (a large tool operated by a crane for the purposes of digging). The ditch is thenbackfilled with a mixture of soil-bentonite, a mixture of cement-bentonite, or plastic concretematerials that, when stabilized, forms an impervious barrier to seepage. Because of the need tocut a trench using heavy equipment, this prodedure has limitations with respect to disturbancesof existing utilities which are often located near the ground surface.
Grout Curtains: Grout curtains are constructed by drilling 2- to 6-inches diameter holes along asingle line or multiple parallel lines. Grout is then injected into the holes under pressure to fillthe surrounding soil pores or rock fractures. By placing these holes on a tight enough spacing(typically 3 to 10 feet spacing), a grout barrier of variable thickness is created. Grout curtains canbe installed to most any depth and can be surgically injected to treat specific depth zones.
Air Injection: Air injection is used in the development of oil and gas fields and during tunnelingto cutoff the flow of water. Compressed air injected into the groundwater attempts to cause apiezometric rise in water level that can be used to alter groundwater gradients and flowdirections. Air entrained in soil pores causes an overall decrease in the permeability of theaquifer which could be used to reduce flow across specific zones.
Bio Wall: This technology involves the injection of starved bacteria cultures into the pores ofthe aquifer media to develop a biological subsurface plug or bio-wall. This method uses microbialgrowth to fill in the void space found in all soils, thus decreasing its permeability. The wall ismaintained by periodic injection of nutrients to feed the bacteria in specific zones. This type ofwall has only been evaluated by modeling and in the laboratory.
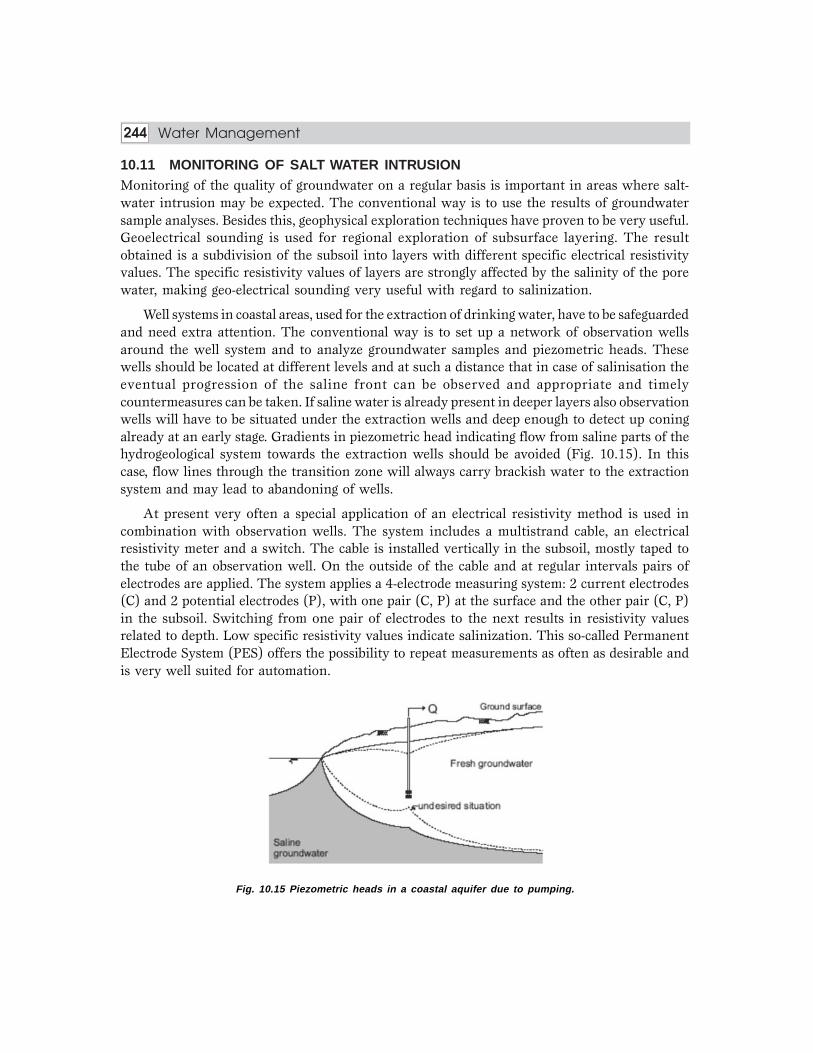
244 Energy ManagementWater Management244
10.11 MONITORING OF SALT WATER INTRUSIONMonitoring of the quality of groundwater on a regular basis is important in areas where salt-water intrusion may be expected. The conventional way is to use the results of groundwatersample analyses. Besides this, geophysical exploration techniques have proven to be very useful.Geoelectrical sounding is used for regional exploration of subsurface layering. The resultobtained is a subdivision of the subsoil into layers with different specific electrical resistivityvalues. The specific resistivity values of layers are strongly affected by the salinity of the porewater, making geo-electrical sounding very useful with regard to salinization.
Well systems in coastal areas, used for the extraction of drinking water, have to be safeguardedand need extra attention. The conventional way is to set up a network of observation wellsaround the well system and to analyze groundwater samples and piezometric heads. Thesewells should be located at different levels and at such a distance that in case of salinisation theeventual progression of the saline front can be observed and appropriate and timelycountermeasures can be taken. If saline water is already present in deeper layers also observationwells will have to be situated under the extraction wells and deep enough to detect up coningalready at an early stage. Gradients in piezometric head indicating flow from saline parts of thehydrogeological system towards the extraction wells should be avoided (Fig. 10.15). In thiscase, flow lines through the transition zone will always carry brackish water to the extractionsystem and may lead to abandoning of wells.
At present very often a special application of an electrical resistivity method is used incombination with observation wells. The system includes a multistrand cable, an electricalresistivity meter and a switch. The cable is installed vertically in the subsoil, mostly taped tothe tube of an observation well. On the outside of the cable and at regular intervals pairs ofelectrodes are applied. The system applies a 4-electrode measuring system: 2 current electrodes(C) and 2 potential electrodes (P), with one pair (C, P) at the surface and the other pair (C, P)in the subsoil. Switching from one pair of electrodes to the next results in resistivity valuesrelated to depth. Low specific resistivity values indicate salinization. This so-called PermanentElectrode System (PES) offers the possibility to repeat measurements as often as desirable andis very well suited for automation.
Fig. 10.15 Piezometric heads in a coastal aquifer due to pumping.

245Energy Management Sea Water Intrusions 245
10.12 AN OVERVIEW OF SALT WATER INTRUSION ALONG GUJARAT COAST, INDIAGujarat has approximately one-third part of the total coastal length of India. In Gujarat, whichhas 1600 km long coastal reach, Saurashtra has 925-km long coastal reach, starting fromBhavnagar to Okha and from Okha to Malia.
Geographically Saurashtra has an extent of about 60,000 km2 lying on the Arabian Seacoast. The extensive sheet of lava covers more than half of the area of the region. The centralportion of Saurashtra is like turtle’s back. There are total 71 rivers flowing in all the directionsfrom the central portion of the plate and meeting the sea. All these river basins are more or lesshomogeneous in their hydrometeorological characteristics. All these rivers are short in lengthand getting flood instantaneously and recedes quickly having rising limb flood hydrograph notmore than 3 to 4 hours. Thus during rains, they gets flooded instantaneously and flood recedesquickly. Except Shetrunji and Bhadar rivers, all the rivers run dry after monsoon. The permeablegeological formations along Saurashtra coast have produced rich aquifers of sweet water inlow rainfall region but the overexploitation of groundwater has resulted into pollution of theaquifers by the seawater ingress.
Sea water intrusion is found in public and individual water wells at many coastal areas ofSaurashtra region of Gujarat state. Fluctuations occur depending on seasonal rainfall (aquiferrecharge) and tidal movement. Over-pumping of these sensitive aquifers, which are under theinfluence of seawater intrusion, will further degrade the aquifers and pull in more seawater,thus increasing their salt content. Chloride, sodium, carbonate, bicarbonate, pH and conductivitylevels are all elevated as more seawater is pulled into the freshwater. The tidewater throughcreeks mixed up with groundwater and has further deteriorated the quality of the groundwater.In case of lack of sufficient rainfall and irrigation facility farmers were compelled to use thispoor quality of water to protect their crops which has resulted into the damaging of the soilstructure of their farms. This has reduced the productivity as well as the cost of the land.
In absence of farming some people have diverted towards mining of limestone, which is animportant ingredient in manufacturing of cement. In addition, these stones are also used toconstruct houses and are locally called “Bela stones”. Due to the mining of limestone the seawater intrusion in the fresh water aquifer has been increased as was acting as a protectinglayer to prevent the intrusion. Another problem causing concern in this area is the layer ofMiliolitic limestone, which is very cavernous and permeable in nature through which seawaterintrudes at very fast rate. In addition, with the establishment of gigantic industries in thecoastal belt, the demand of groundwater has been increased.
The Government first notices the deterioration in water quality in early 60s, but the problemwas limited in both area and intensity. But by 1970, the problem was intensified and becamewidespread, causing alarm at all levels and demanding immediate action between the 160 kmlong coast between Madhavpur to Una. The area affected by seawater intrusion has increasedfrom 35,000 ha in 1971 to 1,00,000 ha in 1977. The area irrigated by groundwater supply hasbeen reduced from approximately 24,500 ha to 16,900 ha as many wells had to be abandoned inthe same period. Approximately 2,80,000 people of living in the 120 villages of the area wereaffected which has further resulted into the migration of people from their motherland.

246 Energy ManagementWater Management246
In 1976, to study the effects of salinity ingress in coastal region, Government of Gujarathad appointed a High Level Committee – I (H.L.C. - I). The area selected for preventive measureswas between rivers Madhuvanti near Madhavpur and Rawal near Una. Based on the studiesof H.L.C. – I area Government of Gujarat had appointed High Level Committee – II (H.L.C. -II) in 1978 to study and prevent the salinity ingress problems in rest of the coastal area ofSaurashtra and Kutch. H.L.C. – II committee has divided the coastal reach into three parts:
1) Bhavnagar to Una reach.2) Madhavpur to Malia reach.3) Malia to lakhapat reach for Kutch region.
Consequences of Salinity Ingress
In Bhavnagar to Una reach, total 166 villages of seven coastal talukas of Bhavanagar; Amreliand Junagadh districts are affected by salinity ingress covering an area of about 1,39,212 hectares.4600 open wells without pump sets and 4200 wells with pump sets have gone out of order.Total population of 2,20,000 souls was affected by salinity ingress. The break up of affectedarea by various stages of salinity is as under.
Area affected by inherent salinity 87,867 haArea affected by seawater ingress 33,055 ha
Marshy land including tidal ingress 18,290 ha
Total 1,39, 212 ha
In Una to Madhavpur reach, total 120 villages of five talukas are affected by salinity ingresscovering an area of about 1,00,000 ha. 12,562 wells have gone saline affecting the populationof about 2,80,160 souls and irrigation land of 19,850 ha.
Area affected by seawater intrusion 86,243 haMarshy land 13,757 ha
Total 1,00,000 ha
In Madhavpur to Maliya reach, 248 villages are affected by salinity ingress in 13 talukas ofJunagadh, Porbandar, Jamnagar and Rajkot districts covering an area of about 4,60,120 ha.The break up of affected area by various stages of salinity is as under.
Alluvial Ghed area coral beds, saline alluvial of Maliya 1,70,200 haMarshy land 99 500 ha
Area having inherent salinity 1,32,230 haArea having seawater ingress 17,600 ha
Area affected by seawater inundation 40,590 ha
Total 4,60,120 ha
Moreover 6,000 open wells and 5,388 wells with pump sets are affected by salinity in above area.

247Energy Management Sea Water Intrusions 247
Effect of salinity has become so severe that people and cattle actually start migrating fromcoastal villages towards the nearby urban areas and are depending less and less on land fortheir lively-hood.
The rate of growth in population is observed as 27 per 1000 souls as the state as a whole,whereas in salinity-affected area of coastal strip this rate is 7 to 20.
Adverse effect of salinity is also reflected in agriculture activity along the coastal area. Forexample, Mahuva taluka of Bhavnagar District, once known for its rich output of Coconut,Banana, Guava and ‘Jamadar’ Mango plantations, has turned into shambles due to salinity.The yield per hectare has gone down considerably affecting local market. The farmers residingnear the saline reaches are in despair. Their land value had also gone down more over fruitshave also lost their quality.
In these circumstances, an immediate implementation of integral programme of preventingsalinity ingress had become necessary in the interest of common people of the affected area.
Solution of the Problem
The H.L.C. formed by the Government of Gujarat have studied the area and suggested somesolutions as under.
1) Management techniquesa. Change in cropping patternb. Regulation of groundwater extraction
2) Recharge technique which suggests construction ofa. Recharge reservoir.b. Recharge wells.c. Recharge tanks.d. Check dams.e. Spreading channels.f. Nala plugs.g. Afforestation.
3) Salinity control techniques suggests construction ofa. Tidal regulators and Bandharas.b. Fresh water barriers.c. Extraction barriers.d. Static barriers.
4) Coastal land reclamation.
Management Techniques
The techniques suggested under this measure will require imposing some controlling on publicincluding farmers through legislation and extension services. Excessive use of groundwaterby constructing number of open wells and tube wells has to be checked so that the total

248 Energy ManagementWater Management248
withdrawal is not more than the annual recharge. The farmer can also be trained to go in forcrops, which can resist salinity.
Cropping Pattern
The cropping pattern of an area depends upon mainly on soil types, prevailing climate and theirrigation facilities available.
The area between Bhavnagar to Una mainly grows the crops of Groundnut, Jowar andBajra in Kharif and Wheat in Rabi. The area between Madhavpur to Porbandar grows thecrops of Jowar, Gram, Wheat, Groundnut and Bajra etc. In low-lying area of Ghed Cotton issown in Kharif depending upon the availability of rainfall. In Jamnagar district Bjara, Groundnutand Cotton are sown in Kharif and Wheat, Mustard, Potato, Garlic, Chilly; Lucerne etc. aresown in Rabi depending upon rainfall available. In Morbi and Maliya talukas of Rajkot districtCotton, Bajra, Jowar and Groundnut are sown in Kharif and Wheat in Rabi. Horticulturecrops like Coconut, Guava, Pomegranate and Mangoes are planted in Bhavnagar to Una reach.While in Madhavpur to Maliya reach, there are no horticulture plantations found.
In order to make use of the saline water for irrigation, following table suggests guidelinesdepending upon the degree of salinity and soil types. Crops like Date palm, Bor, Bamboo,Eucalyptus, Guava, and Coconut are moderately to highly salt tolerant crops. Crops like Wheat,Bajra, Jowar, Mustard, Cotton, Castor can withstand the salinity up to some limit.
10.13 RECHARGE TECHNIQUESSome forms of Artificial Recharge Techniques have to be adopted in areas where groundwaterwithdrawal is higher than the natural recharge.
Artificial Recharge can be undertaken by creating storage of freshwater and maintaining thehead for as long a period as possible to accelerate the induced infiltration. The induced rechargecan be done by construction of check dams, recharge tanks, spreading channels, reservoirsand recharge wells.
Check Dams are used for creating small storages on existing rivers for recharge. The effectswill depend on type of formations under the water-spread areas. These check dams will becharged often by releasing water from U/S feeder tanks wherever possible.
Recharge Tanks are constructed by making use of local depressions near the riverbanks.These recharge tanks are filled by diverting surplus water of river through linking channels.
Recharge Wells are constructed for deeper as well as lateral recharge by puncturing severaldifferent geological formations, through riverbed.
Afforestation has positive role in increasing retention and improving soil permeability andthereby the rate of recharge. This technique being slow is used as supporting one in conjunctionwith above recharge techniques.
Gully Plugging is also done on all the small tributaries of the rivers to supplement filter ofvegetation cover. The gully plugging can arrest floodwaters and detain the same for longerduration on ground for recharge and also check soil erosion.

249Energy Management Sea Water Intrusions 249
10.14 SALINITY CONTROL STRUCTURESTidal Regulator: Tidal Regulator is a gated structure constructed near the mouth of the riverto prevent upland movement of tidal water in the upstream and to create sweet water storagein the upstream, which is used for lift irrigation. The reservoir water so stored will also rechargethe aquifers of the surrounding area. Moreover it also stops the tidal inundation.
The main function of the Tidal Regulator is to prevent the tidal ingress into the lands bysealing the mouth of the river. Hence, generally the gates remain in closed condition round theyear to prevent the entry of tidewater into the lands.
There are 71 major and minor rivers within the reach between Bhavnagar and MaliyaMiyana. Tides are entering through estuaries of the rivers twice a day. Due to flat slopes of theriverbeds near the mouth, tides are running into the land for about 2 to 6 km distance. It isgenerally observed that village wells surrounding this tidal estuary have been converted salinedue to the constant process of tidal ingress into the land. As a result of over-withdrawal ofsweet water from these wells, process of contamination is increasing year by year and moreand more numbers of wells are turning saline which are affecting agricultural land andproduction there from. Besides direct infiltration of seawater also take place through riverbedsand contaminate groundwater. It is therefore, necessary to stop tidal ingress into the land bysealing the mouths of these rivers by construction of some structures near the mouths.
It is proposed to categorize such structures into two types. Structures on large rivers wouldbe constructed with gates, while structures on small rivers would be constructed withoutgates as solid barriers. The height of these structures will be so kept as to keep submergence ofland to the minimum and yet the projects remain economically viable.
The structures with gates on the large rivers, which will be named as Tidal Regulator,will be constructed with impervious cut off below the foundation. Such cut off will be takendown to relatively impervious strata that will enable to prevent tidal ingress even throughfoundations strata directly to contaminate groundwater. Thus, the tidal regulator will bedesigned and constructed in such a way that it would not only arrest the tides entering theestuary from surface but it would also be possible to prevent seepage of sea water into the landand polluting sweet groundwater.
The top of the gate will be kept above maximum tide level during the year. It is wellknown that tidal range across Saurashtra coast is nearly the highest in the country. But fordesign of Tidal Regulator one has to deal with maximum tide level or highest of high tidelevel. Normal practice of keeping the top of the gate about 1 meter above highest of high tidelevel so that the waves from the sea do not splash above the gates and pollute the sweetwater reservoir behind the gate.
Extra exercise is also necessary to study the submergence on the up stream of this structurewhen the maximum design flood passes over the structure. If a good valley is available on theup stream of the structures and it is convenient to store water at a higher level without increasingsubmergence substantially and affecting surrounding villages. It can be attempted to raise thecrest of the Tidal Regulators to store more sweet water for irrigation use.

250 Energy ManagementWater Management250
During floods, gates are opened and regulated as per flood forecast so as to allow the flowof the excessive flood water without creating undesirable submergence of the land in the upstream. As soon as the flood starts receding, the gates are closed to store fresh water on upstreamside. The stored sweet water will improve the existing water supply of the affected villagessituated near Tidal Regulator. Thus villages situated in the periphery of the proposed TidalRegulators will be benefited by improved quality of water due to such structures.
The sweet water reservoir that will be created behind Tidal Regulator is proposed to beused for irrigation in the surrounding command areas through lift. It will be possible to doirrigation, three to four times during monsoon and protect Kharif crop. As the gates areprovided on the Tidal Regulators, it will be possible to fill the reservoir during every flood inthe monsoon by proper regulation of gates. Incidentally, it will also be possible to increaserecharge into the groundwater through the command area also. Thus, the recharge of sweetwater through command area will be over and above that which will take place through thebed of the reservoirs.
The reservoir waters will improve the surrounding village wells, thereby water supplyproblems of the surrounding villages will also be solved to a great extent. The lands around thereservoirs will be leached out through use of sweet water for irrigation and will make it possibleto fetch higher yields from the same fields.
Bandhara: Bandhara is an ungated structure constructed near the mouth of the river to preventupland movement of tidal water in the upstream. It stores the sweet water in upland whichhelps to recharge the aquifer for pushing the salt water seawards and for lift irrigation. Thus itreduces the pressure on groundwater utilisation and over withdrawal of groundwater. Bandharaworks on the same function to prevent the tidal ingress into the land by sealing the mouth ofthe river.
As per normal practice, the top of the Bhandharas shall be kept 1 meter above the highesttide level so that the waves from the sea side will not splash above the Bhandharas and pollutesweet water reservoirs behind them. In case where submergence does not become a problem,the Bhandharas shall be raised even higher to store more sweet water.
It is also possible to do irrigation three to four times during monsoon from the reservoir.This will facilitate to protect Kharif irrigation and at the same time increase recharge fromlarger areas by spreading reservoir waters in the command areas through lift. The surroundingvillages will get benefit by the probable improvement in the well waters.
Bhandharas will be constructed with impervious cut off below the foundation. Such cutoff will be taken down to relatively impervious strata and will enable to prevent tidal ingressthrough foundation strata directly to contaminate groundwater.
Spreading Channel (Static Barrier): Spreading channels (Static Barriers) are preferred whenexisting river channels are to be used as connecting channels from upstream reservoirs tospreading channels or when recharge is desired in narrow strip near seashore for creatingfresh water barrier to stop seawater intrusion (Fig. 10.16).

251Energy Management Sea Water Intrusions 251
Fig. 10.16 Construction of spreading channel to prevent seawater intrusion in coastal aquifer.
Linking Canal: A canal joining two or more rivers or stream in coastal region is called Linkingcanal. Sometimes in the coastal region rainfall occurs over a small region due to cyclonicstorms. Because of this rainfall there might be a runoff in one river and other nearby river mayrun dry. If a canal joining these two rivers is constructed then runoff water from one river canbe diverted to another river and recharge over larger area can be obtained. If in case both therivers get flood then also linking canal gets flooded and more area comes under freshwaterrecharge. These types of canals are suitable for areas where a porous stratum, limestone layeris situated near the upper layer (Fig. 10.17).
Radial Canal: Radial canals are constructed towards the landward side from the reservoircreated by the construction of tidal regulator or bandhara in the coastal region. Slope of theland is towards bandhara or tidal regulator while these canals constructed towards landwardside from the reservoir. Thus depth of these canals increases as it goes away from reservoir.Floodwater will flow in these canals and farmers of surrounding regions can take advantage ofthis water and irrigate their fields, thus much more area can be benefited (Fig. 10.14).
10.15 COASTAL LAND RECLAMATIONAlong most of the coastal length of Gujarat, high tides are covering more than 0.3 millionhectares of land and are converting this land saline. It is possible to reclaim these saline landsby constructing bunds along the seacoast to stop tidal ingress and by leaching the salts withthe application of sweet water. Initially sweet water will be made available from proposedreservoirs in this reach. The lands so re-claimed would then be available for the cultivation.

252 Energy ManagementWater Management252
Fig. 10.17 Map showing location of linking canal, radial canal and bandhara.

1111111111 REUSE OF WATERREUSE OF WATERREUSE OF WATERREUSE OF WATERREUSE OF WATER
11.1 INTRODUCTIONWorld has witnessed rapid economical growth, urbanization, and population growth and thathas developed serious environmental concerns range from pollution largely urban and industrial,to resource management of water, land, forests, and energy.
A common approach used to evaluate water availability is the water stress index, and ismeasured as the annual renewable water resources per capita that are available to meetneeds for domestic, industrial, and agricultural use. Projections predict that in 2025, two-thirds of the world’s population will be under conditions of moderate to high water stressand about half of the population will face real constraints in their water supply. This includesnumerous nations with adequate water resources, but also has arid regions where droughtand restricted water supply are common (north-western China, western and southern India,large parts of Pakistan and Maxico, the western coasts of the US and South America, and theMediterranean region).
It is essential that about 80% of wastewater in developing countries is used in irrigation.The double “R” mainly reclamation and reuse of wastewater belong to concept of cleantechnology and have been practiced in many parts of the world. Table 11.1 shows global dataon wastewater irrigation practice in past two decades especially in semi-arid areas of bothdeveloped and developing countries.
Table 11.1 Global data on wastewater irrigation practice
Country & City Irrigated Area Country & City Irrigated Area(ha) (ha)
Argentina, Mendoza 3700 Peru, Lima 6800
Australia 10,000 Saudi Arabia, Riyadh 2850
Bahrain, Tubli 800 South Africa, Johannesburg 1800
Chile, Santiago 16,000 Sudan, Khartoum 2800
China, all cities 13,30,000 Tunisha, Tunis 4450
Federal Rep of Germany 3000 Tunisha, other cities 2900Braunschweig
Germany, Other cities 25,000 USA, Chandler, Arizona 2800
Contd.
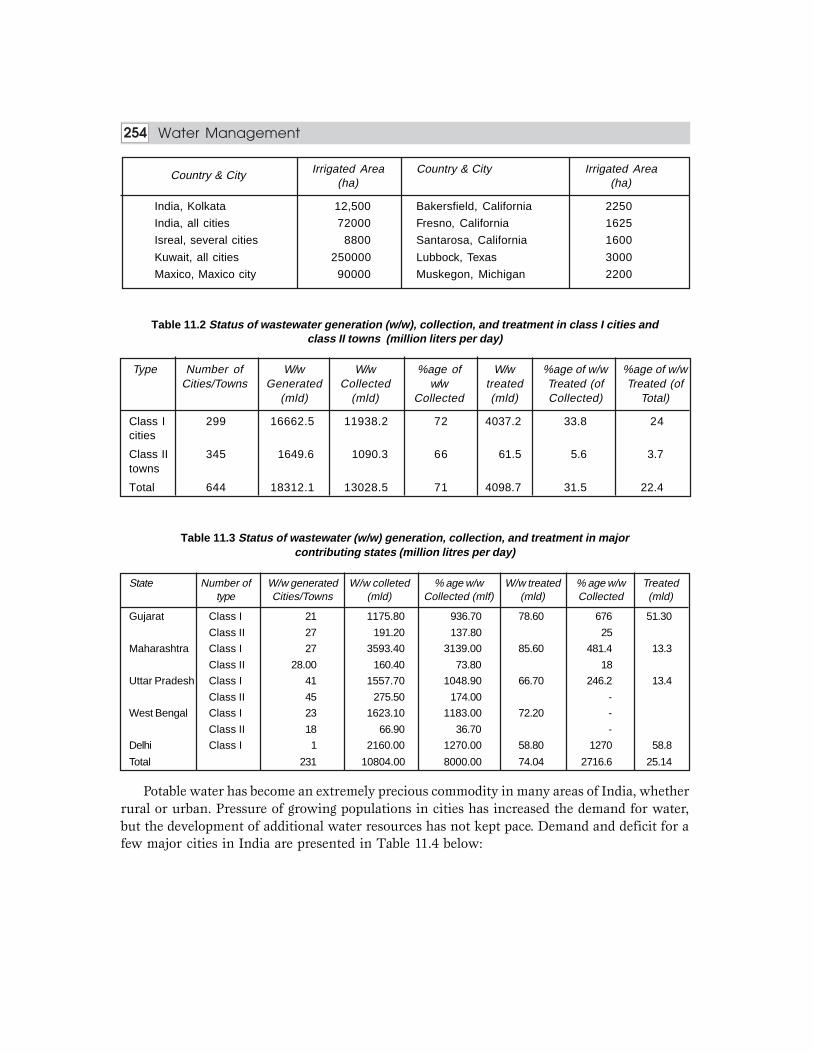
254 Energy ManagementWater Management254
Irrigated Area Country & City Irrigated Area(ha) (ha)
India, Kolkata 12,500 Bakersfield, California 2250
India, all cities 72000 Fresno, California 1625
Isreal, several cities 8800 Santarosa, California 1600
Kuwait, all cities 250000 Lubbock, Texas 3000
Maxico, Maxico city 90000 Muskegon, Michigan 2200
Table 11.2 Status of wastewater generation (w/w), collection, and treatment in class I cities andclass II towns (million liters per day)
Type Number of W/w W/w %age of W/w %age of w/w %age of w/wCities/Towns Generated Collected w/w treated Treated (of Treated (of
(mld) (mld) Collected (mld) Collected) Total)
Class I 299 16662.5 11938.2 72 4037.2 33.8 24cities
Class II 345 1649.6 1090.3 66 61.5 5.6 3.7towns
Total 644 18312.1 13028.5 71 4098.7 31.5 22.4
Table 11.3 Status of wastewater (w/w) generation, collection, and treatment in majorcontributing states (million litres per day)
State Number of W/w generated W/w colleted % age w/w W/w treated % age w/w Treatedtype Cities/Towns (mld) Collected (mlf) (mld) Collected (mld)
Gujarat Class I 21 1175.80 936.70 78.60 676 51.30
Class II 27 191.20 137.80 25
Maharashtra Class I 27 3593.40 3139.00 85.60 481.4 13.3
Class II 28.00 160.40 73.80 18
Uttar Pradesh Class I 41 1557.70 1048.90 66.70 246.2 13.4
Class II 45 275.50 174.00 -
West Bengal Class I 23 1623.10 1183.00 72.20 -
Class II 18 66.90 36.70 -
Delhi Class I 1 2160.00 1270.00 58.80 1270 58.8
Total 231 10804.00 8000.00 74.04 2716.6 25.14
Potable water has become an extremely precious commodity in many areas of India, whetherrural or urban. Pressure of growing populations in cities has increased the demand for water,but the development of additional water resources has not kept pace. Demand and deficit for afew major cities in India are presented in Table 11.4 below:
Country & City

255Energy Management Reuse of Water 255
Table 11.4 Demand and deficit for a few major cities in India
Metropolitan City Demand (mld) Deficit (mld)
Delhi 3830 880
Hyderabad 1100 250
Mumbai 4000 1030
Chennai 300 165
Bangalore 840 175
Bhopal 335 70
Kolkata 2258 690
Jaipur 349 313
Water has always been used and reused by man. The natural water cycle, evaporationand precipitation, is one of reuse. Cities and industries draw water from surface streams anddischarge wastes into the same streams, which, in turn, become the water supplies fordownstream users. In the past, dilution and natural purification were usually sufficient forsuch system to perform satisfactorily, but, in recent years, population and industrial growthhave made it evident that wastewater must be treated before discharge to maintain the qualityof the stream.
11.2 CONCEPT OF REUSE OF WATERThe reuse of treated effluents is most applicable where large volumes of water are usedand the wastes are not too contaminated. Industrial wastes may be heavily contaminatedand therefore may not offer much potential for the recovery of clean water. The locationof the treatment plant and the possible transport of the renovated water are importantconsiderations. Treatment processes work most efficiently and economically when dealingwith a steady flow of wastewater, rather than with the irregular flow normally experiencedfrom urban sources.
Wastewater reclamation is the treatment or processing of wastewater to make it reusable,and water reuse is the use of treated wastewater for a beneficial use such as agriculturalirrigation and industrial cooling. In addition, direct wastewater reuse requires existence ofpipes or other conveyance facilities for delivering reclaimed water. Indirect reuse, throughdischarge of an effluent to receiving water for assimilation and withdrawals downstreams, isrecognized to be important but does not constitute planned direct water reuse. In contrast todirect water reuse, water recycling normally involves only one use or user and the effluentfrom the user is captured and redirected back into that use scheme. In this context, waterrecycling is predominantly practiced in industry such as in pulp and paper industry (Metcalf& Eddy, 1991).

256 Energy ManagementWater Management256
Fig. 11.1 Quality changes during municipal use of water and the concept ofwastewater reclamation and reuse. (Mc Gauhey, 1968)
Figure 11.1 shows, conceptually, the quality changes during municipal use of water in atime sequence. Through the process of water treatment, a drinking water is produced whichhas an elevated water quality meeting applicable standards for drinking water. The municipaland industrial uses degrade water quality, and the quality changes necessary to upgrade thewastewater then becomes a matter of concern of wastewater treatment. In the actual case, thetreatment is carried out to the point required by regulatory agencies for protection of otherbeneficial uses. The dashed line in Fig. 11.1 represents an increase in treated wastewaterquality as necessitated by wastewater reuse. Ultimately as the quality of treated wastewaterapproaches that of unpolluted natural water, the concept of wastewater reclamation and reuseis generated (McGauhey, 1968). Further advanced wastewater reclamation technologies, suchas carbon adsorption, advanced oxidation, and reverse osmosis, will generate much higherquality water than conventional drinking water, and it is termed repurified water. Today,technically proven wastewater reclamation or purification processes exist to provide water ofalmost any quality desired.
Domestic reuse offers the best recycle opportunity, but, even then, the amount of waterrecycled falls short of the total amount of water used. The wastewater arriving at the treatmentplant is generally found to be less than the amount originally supplied to the municipal watersystem. Losses occur, and they may be quite large in warm dry areas, where domestic reuse ismost likely to be practiced.
Another consideration is the character of the wastewater entering the renovation plant,especially if this waste includes some industrial pollutants. Care should be taken to excludematerials that would be detrimental to the application for which the reclaimed water is to beused. This is especially true for the domestic reuse. Such materials may not be only thoseusually considered toxic. Ordinary salt brines, for example, are undesirable if the renovatedwastewater is to be demineralized. A survey of the sewer system will determine how much ofthe available wastewater could be reused. Water highly contaminated with metals or containinga high total concentration of dissolved solids may be unacceptable Fig. 11.2. Treated wastewater
Tlm e S equence (N o Sc ale)
Wa stew a te r
U npo llutedWa te r
Tre atedE ffluent
R eclaim edWa te r
R epu rifiedWa te r
Wat
er T
r ea t
men
t
D rink ing Wa te r
Was
tew
a ter
Tre
a tm
ent
Wa t
er R
e cla
ma
tion
and
Reu
se
Munic ip al a n d In d
u st rial U
se
Qua
lity
of W
ate
r

257Energy Management Reuse of Water 257
may be deliberately used in a planned way for a variety of purposes some of which are shownin Fig. 11.3. Intentional reuse is not new, but there is a growing recognition of the need for it.
Fig. 11.2 Simplified wastewater reuse scheme.
Fig. 11.3 Intentional reuse of wastewater.
Definitions
Municipal wastewater: The spent water of a community: it consists of water that carrieswastes from residences, commercial buildings, and industrial plants and surface or groundwaterthat enter the sewerage system.
Indirect reuse: Indirect reuse of wastewater occurs when water already used one or moretimes for domestic or industrial purposes is discharged into fresh surface or undergroundwater and is used again in its diluted form.
Direct reuse: The planned and deliberate use of treated wastewater for some beneficial purpose,such as irrigation, recreation, industry, the recharging of underground aquifers, and drinking.In-plant water recycling: The reuse of water within industrial plants for conservation andpollution control purposes.
Industrial wastewater: The spent water from industrial operations, which may be treatedand reused at the plant, discharged to the municipal sewer, or discharged partially treated oruntreated directly to surface water.
Advanced waste treatment: Treatment systems that go beyond the conventional primaryand secondary processes. Advanced waste treatment processes usually involve the addition ofchemicals (biological nitrification — denitrification, the use of activated carbon), filtration, orseparation by use of membranes.
D isc har ge of ho use ho ld sew a ge
TR U N KS EW E R
E ven flowto p lan t
W as te rw a te rrenov atio n p lan t
S ludg esre tu rn ed tosew er
C lean w a te r fo r reuse To m u n icipa ld isp osa l p lan t
D isc har ges o f in dus tr ia l w as tesun su itab le fo r rec lam ation
M U N IC IPALW AS TE W ATER
IN D U S TR IA LW AS TE W ATER
M U N IC IPALN O N PO TA B LE
D R IN K IN G R E C R E AT IO N FIS HC U LTU R E A G R IC U LT U R E IN D U S TR Y
S W IM M IN G B O AT IN G FIS H IN G IN TR A P L AN T G E N E R A L
S TO C KW ATE R IN G
O R C H AR D SA N D
V IN EYA R D S
FO D D E R , F IBE RC R O PS AN D
S EE D C R O P S
C R O PS C O N S U M E DA FT E R P R O C E S SIN G
C R O PSC O N SU M E D
R AW

258 Energy ManagementWater Management258
11.3 CATEGORIES OF WASTEWATER REUSEIn the planning and implementation of wastewater reclamation and reuse, the intendedwastewater reuse applications govern the degree of wastewater treatment required and thereliability of wastewater treatment processing and operation. In principle, wastewater or anymarginal quality water can be used for any purpose provided that they meet the water qualityrequirements for the intended use. Seven categories of reuse of municipal wastewater areidentified in Table 11.5, along with the potential constrains. Large quantities of reclaimedmunicipal wastewater have been used in four reuse categories: agricultural irrigation, landscapeirrigation, industrial recycling and reuse, and groundwater recharge.
In California, where the largest number of wastewater reclamation and reuse facilitieshave been developed, at least 432 million cubic meters (106 m3) of municipal wastewater arebeneficially used annually. This figure corresponds to around 8 per cent of municipal wastewatergenerated in the State (State of California, 1990).
In Japan, there were 876 publicly owned treatment works (POTWs) operating in 1991,discharging approximately 110×106 m3/year of secondary treated effluents. Of theseapproximately 100×106 m3/year of reclaimed wastewater from 99 POTWs are reused beneficiallyin such uses as industrial uses (41%), environmental water and flow augmentation (32%),agricultural irrigation (13%), non-potable urban use and toilet flushing (8%), and seasonalsnow-melting and removal (4%) (Asano et al., 1996).
Fig. 11.4 Types and volume of wastewater reuse in California and Japan.
Contrary to the arid or semi-arid regions of the world where agricultural and landscapeirrigation are the major beneficial use of reclaimed wastewater. Wastewater reuse in Japan isdominated by the various non-potable, urban uses such as toilet flushing, industrial use, streamrestoration and flow augmentation to create so called “urban amenities”. Figure 11.4 showsthe comparative diagrams for Japan and California, depicting the various reclaimed water usesand the corresponding volumes per year (State Water Resources Control Board, 1990; JapanSewage Works Association, 1994).
S no w m e lt ing /rem ova l6%
N on -p o ta ble u rban use andto ile t f lu sh ing 8 %
Indu stria l use 41 %
E nv iron m enta l w ate ran d flow
au gen ta tion 32 %
Japan
10 0 × 1 06 m 3/yea r
Indu stria l use 2%
O ther o r m ixed used 1%
A gricu ltu r a li rr iga tion 60%La ndscape irr iga tion
an d im po und m ents16 %
G r oundw ate rrech age 14 %
R ecre a tio na l im po und m ents 3%
W ild li fe hab ita l 4 %
C a lifo rn ia432 × 10 6 m3/ye ar
A gricu ltu r a lIrr iga tio n 13%
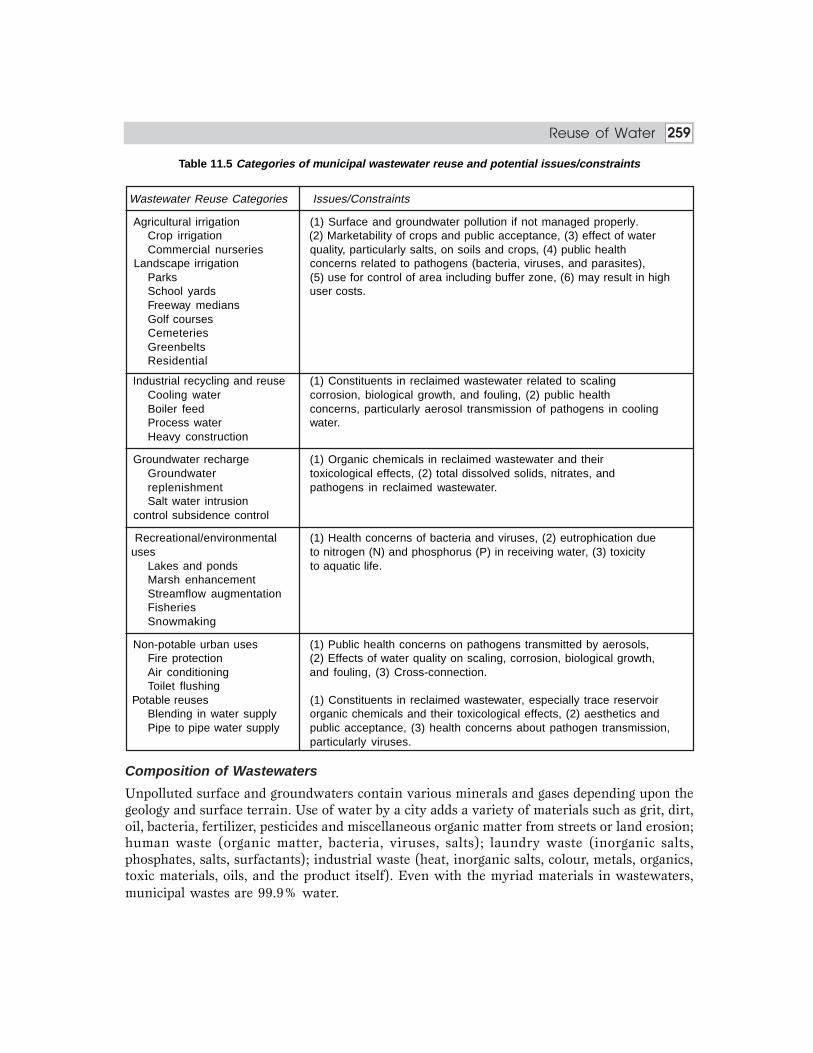
259Energy Management Reuse of Water 259
Table 11.5 Categories of municipal wastewater reuse and potential issues/constraints
Wastewater Reuse Categories Issues/Constraints
Agricultural irrigation (1) Surface and groundwater pollution if not managed properly.Crop irrigation (2) Marketability of crops and public acceptance, (3) effect of waterCommercial nurseries quality, particularly salts, on soils and crops, (4) public health
Landscape irrigation concerns related to pathogens (bacteria, viruses, and parasites),Parks (5) use for control of area including buffer zone, (6) may result in highSchool yards user costs.Freeway mediansGolf coursesCemeteriesGreenbeltsResidential
Industrial recycling and reuse (1) Constituents in reclaimed wastewater related to scalingCooling water corrosion, biological growth, and fouling, (2) public healthBoiler feed concerns, particularly aerosol transmission of pathogens in coolingProcess water water.Heavy construction
Groundwater recharge (1) Organic chemicals in reclaimed wastewater and theirGroundwater toxicological effects, (2) total dissolved solids, nitrates, andreplenishment pathogens in reclaimed wastewater.Salt water intrusion
control subsidence control
Recreational/environmental (1) Health concerns of bacteria and viruses, (2) eutrophication due uses to nitrogen (N) and phosphorus (P) in receiving water, (3) toxicity
Lakes and ponds to aquatic life.Marsh enhancementStreamflow augmentationFisheriesSnowmaking
Non-potable urban uses (1) Public health concerns on pathogens transmitted by aerosols,Fire protection (2) Effects of water quality on scaling, corrosion, biological growth,Air conditioning and fouling, (3) Cross-connection.Toilet flushing
Potable reuses (1) Constituents in reclaimed wastewater, especially trace reservoirBlending in water supply organic chemicals and their toxicological effects, (2) aesthetics andPipe to pipe water supply public acceptance, (3) health concerns about pathogen transmission,
particularly viruses.
Composition of Wastewaters
Unpolluted surface and groundwaters contain various minerals and gases depending upon thegeology and surface terrain. Use of water by a city adds a variety of materials such as grit, dirt,oil, bacteria, fertilizer, pesticides and miscellaneous organic matter from streets or land erosion;human waste (organic matter, bacteria, viruses, salts); laundry waste (inorganic salts,phosphates, salts, surfactants); industrial waste (heat, inorganic salts, colour, metals, organics,toxic materials, oils, and the product itself). Even with the myriad materials in wastewaters,municipal wastes are 99.9% water.

260 Energy ManagementWater Management260
Because of the many materials in wastewater at very low concentrations, it is impracticableto measure all of them. Measurement of classes of contaminants has become the rule; thus, themeasure of the organic matter in sewage relies upon the biochemical oxygen demand (BOD)and the chemical oxygen demand (COD) and the total organic carbon (TOC). The BODmeasures the oxygen required by organisms, the COD measures the oxygen required tochemically oxidize the organics, and the TOC directly measures the organic carbon.Determinations of solids are relatively easy. The microbiological characteristic principallydepends upon measuring the coliform group of bacteria.
As wastewater reuse increases, it will be necessary to measure and monitor the waterquality to a much greater degree. Good progress is being made in this field of work.
Outline for wastewater reclamation and reuse facilities plan
The planning efforts for wastewater reclamation and reuse facilities are as under:
Study area characteristics: Geography, geology, climate, groundwater basins, surface waters,land use, population growth.
Water supply characteristics and facilities: Agency jurisdiction, sources and qualities ofsupply, description of major facilities, water use trends, future facilities needs, groundwatermanagement and problems, present and future freshwater costs, subsidies and customer prices.
Wastewater characteristics and facilities: Agency jurisdiction, description of major facilities,quantity and quality of treated effluent, seasonal and hourly flow and quality variations, futurefacilities needs, need for source control of constituents affecting reuse, description of existingreuse (users, quantities, contractual and pricing agreements).
Treatment requirements for discharge and reuse and other restrictions: Health andwater quality related requirements, user-specific water quality requirements, use area controls.
Potential water reuses customers: Description of market analysis procedures, inventory ofpotential reclaimed water users and results of user survey.
Project alternative analysis: Capital and operation and maintenance costs, engineeringfeasibility, economic analysis, financial analysis, energy analysis, water quality impacts, publicand market acceptance, water rights impacts, environmental and social impacts, comparison ofalternatives and selection.
Recommended plan: Description of proposed facilities, preliminary design criteria, projectedcost, list of potential users and commitments, quantity and variation of reclaimed water demandin relation to supply, reliability of supply and need for supplemental or back-up water supply,implementation plan, and operational plan.
Construction financing plan and revenue programme: Sources and timing of funds fordesign and construction; pricing policy of reclaimed water; cost allocation between water supplybenefits and pollution control purposes; projection of future reclaimed water use, freshwaterprices, reclamation project costs, unit costs, unit prices, total revenue, subsidies; sunk costsand indebtedness; analysis of sensitivity to changed conditions.

261Energy Management Reuse of Water 261
11.4 TECHNOLOGICAL INNOVATIONSThe contaminants in reclaimed wastewater that are of public health significance may beclassified as biological and chemical agents. Where reclaimed wastewater is used forirrigation, biological agents including bacterial pathogens, helminthes, protozoa, and virusespose the greatest health risks. To protect public health, considerable efforts have beenmade to establish conditions and regulations that would allow for safe use of reclaimedwastewater. Summaries of recommended microbiological quality guidelines by the WorldHealth Organization (1989) and the State of California’s Wastewater. Reclamation Criteria(1978) are presented in Table 11.6. The WHO guidelines emphasize the use of a series ofstabilization ponds for producing an acceptable microbial water quality; whereas, theCalifornia criteria stipulate conventional biological wastewater treatment, filtration, andchlorine disinfection.
Of the known water-borne pathogens, enteric viruses have been considered the most criticalin wastewater reuse in the developed world because of the possibility of infection with lowdoses and difficulty of routine examination for their presence. Thus, essentially pathogen-freeeffluent via secondary treatment and tertiary treatment including chemical coagulation,flocculation, filtration, and disinfection is necessary for reclaimed wastewater applicationswith higher potential exposures; e.g., spray irrigation of food crops eaten uncooked, parks andplaygrounds, and unrestricted recreational impoundments.
Because of the stringent water quality requirements imposed upon such water reuseapplications, the importance of granular-medium filtration, as a tertiary treatment step, hasbeen demonstrated. The filtration removes substantial numbers of particles in wastewater;thus, promotes effective disinfection as well as esthetic enhancement of reclaimed water forbeneficial uses. Figure 11.5 shows schematic diagram of full treatment as well as less costlyalternatives, contact and direct filtration.
Table 11.6 Summaries of recommended microbiological quality guidelines and criteria by the WorldHealth Organization (1989) and the State of California’s Wastewater Reclamation Criteria (1978)
Intestinal Fecal Coliforms WastewaterNematodes, (cfu/100mL) (b) Treatment ExpectedEggs/L (a) or Total Coliforms to Achieve that
(NMP/100mL) (c) Microbiological Quality
WHO Irrigation of crops 1 1000 A series oflikely to be eaten stabilization pondsuncooked, sports or equivalentfields, public parks treatment
California Spray and surface No standard 2.2 Secondaryirrigation of food recommended treatmentcrops, high exposure followed bylandscape irrigation filtrationsuch as parks and disinfection
Contd...
Category Reuse Conditions
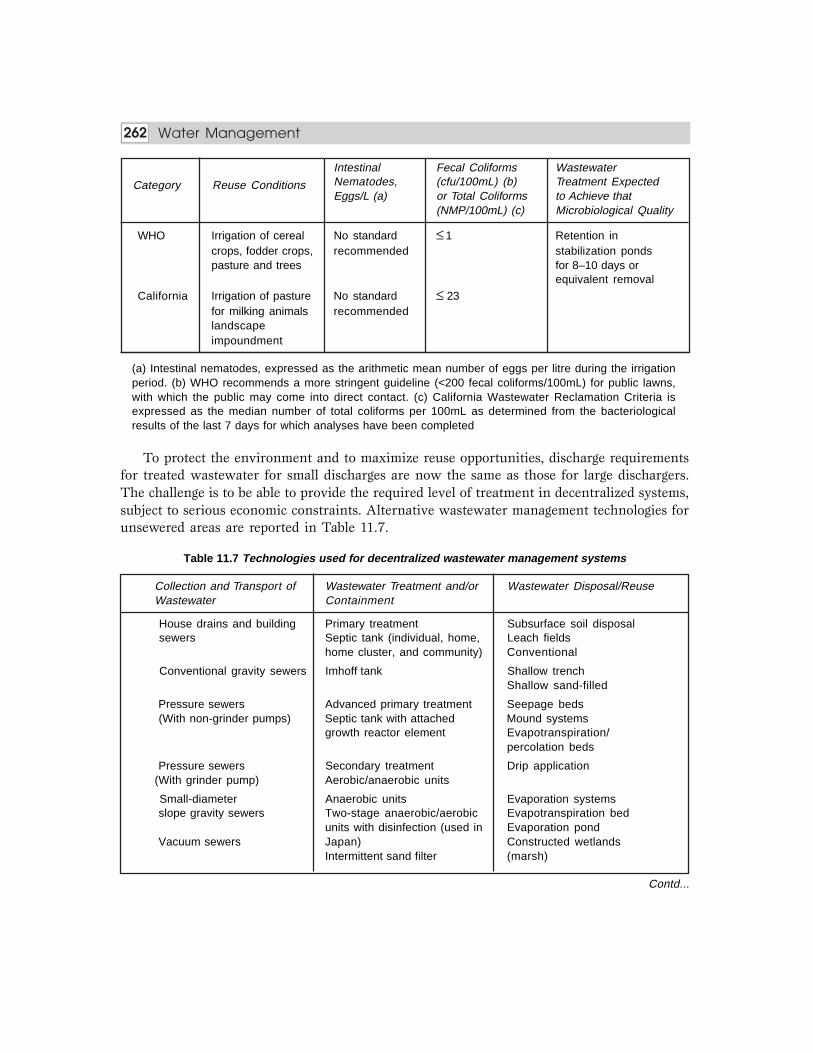
262 Energy ManagementWater Management262
Intestinal Fecal Coliforms WastewaterNematodes, (cfu/100mL) (b) Treatment ExpectedEggs/L (a) or Total Coliforms to Achieve that
(NMP/100mL) (c) Microbiological Quality
WHO Irrigation of cereal No standard 1 Retention incrops, fodder crops, recommended stabilization pondspasture and trees for 8–10 days or
equivalent removal
California Irrigation of pasture No standard 23for milking animals recommendedlandscapeimpoundment
(a) Intestinal nematodes, expressed as the arithmetic mean number of eggs per litre during the irrigationperiod. (b) WHO recommends a more stringent guideline (<200 fecal coliforms/100mL) for public lawns,with which the public may come into direct contact. (c) California Wastewater Reclamation Criteria isexpressed as the median number of total coliforms per 100mL as determined from the bacteriologicalresults of the last 7 days for which analyses have been completed
To protect the environment and to maximize reuse opportunities, discharge requirementsfor treated wastewater for small discharges are now the same as those for large dischargers.The challenge is to be able to provide the required level of treatment in decentralized systems,subject to serious economic constraints. Alternative wastewater management technologies forunsewered areas are reported in Table 11.7.
Table 11.7 Technologies used for decentralized wastewater management systems
Collection and Transport of Wastewater Treatment and/or Wastewater Disposal/ReuseWastewater Containment
House drains and building Primary treatment Subsurface soil disposal sewers Septic tank (individual, home, Leach fields
home cluster, and community) Conventional
Conventional gravity sewers Imhoff tank Shallow trenchShallow sand-filled
Pressure sewers Advanced primary treatment Seepage beds (With non-grinder pumps) Septic tank with attached Mound systems
growth reactor element Evapotranspiration/percolation beds
Pressure sewers Secondary treatment Drip application(With grinder pump) Aerobic/anaerobic units
Small-diameter Anaerobic units Evaporation systems slope gravity sewers Two-stage anaerobic/aerobic Evapotranspiration bed
units with disinfection (used in Evaporation pond Vacuum sewers Japan) Constructed wetlands
Intermittent sand filter (marsh)
Contd...
Category Reuse Conditions

263Energy Management Reuse of Water 263
Collection and Transport of Wastewater Treatment and/or Wastewater Disposal/ReuseWastewater Containment
Combinations of the above Recirculating granular medium Land disposalfilter (sand, crushed glass)Peat filterConstructed wetlands Surface applicationRecycle treatment systems Drip applicationToilet flushing Discharge to water bodiesLandscape watering and toiletflushing Combinations of the aboveOnsite containmentHolding tankPrivy
Fig. 11.5 Schematic diagram of filtration systems using wastewater reclamation and reuse
11.5 TYPES OF WASTEWATER REUSEDirect reuse: It involves transmission of wastewater treated or untreated directly to somespecific intended use, by means of pipes or other conveyance facilities for delivering reclaimedwater. No natural buffers such as lakes, rivers or ground water serve as intermediaries to
A . F u ll T rea tm en t ( Tit le 22 )
P o ly m er A lum
S econd aryE ffu en t
R ap idM ix
F loccu la t ion
C la ril ica t ion
G r anu la rM ed iu mFiltr a t ion
C h lor ineC on ta c tB as in
R ec la im e dW as tew a te r
C l2
B . D ir ec t F i ltr at io n
S econd aryE fflue nt
R ap idM ix
F loccu la t ion
G r anu la rM ed iu mFiltr a t ion
C h lor ineC on ta c tB as in
C l2
P o ly m er A lum
C . C o n tac t F i ltra tion
S econd aryE fflue nt
R ap idM ix C h lor ine
C on ta c tB as in
G r anu la rM ed iu mFiltr a t ion
C l2
R ec la im e dW as tew a te r
P o ly m er A lum

264 Energy ManagementWater Management264
expose wastewater to natural purification and dilution system. (e.g. Irrigation for agriculture,parks, golf courses, lawns, processing and cooling water for industries, recreational waterponds like swimming, boating, fishing etc).
Indirect reuse: Here effluent is discharged to receive water for assimilation and withdrawaldownstream. It involves natural buffer as an intermediary stage and includes greater temporaland spatial separation of treatment and reuse. Greater time provides opportunity for monitoringand testing water quality before use and spatial separation allows for dilution and improvementin aesthetic property of water. (e.g. Ground water recharge, upstream disposal. Chennairefineries Ltd., gets effluent from the city’s sewer unit plants and use it as their process waterafter treating the sewage by biological and advanced treatment methods like ion exchange andreverse osmosis).
Inadvertent/unplanned reuse: As the name suggests, occurs when water is withdrawn,used by one party, returned to a water source (e.g. lake, river, aquifer) without specific intentionor planning to provide water for use of other parties.
Planned reuse: Involves collection and purposeful provision of wastewater for subsequent use.
Potable reuse: Planned direct or indirect reuse for some beneficial purposes (e.g. drinking,cooking, bathing, laundry etc.).
Non-potable reuse: Inadvertent indirect reuse (e.g. fire fighting, toilet flushing etc.). Dependingupon the intended wastewater reuse application, municipal wastewater reuse is categorizedalong with the potential constraints in Table 11.8.
Table 11.8 Wastewater reuse and constraints
Wastewater Reuse Potential Constraints
Agricultural irrigation — crop Effect of water quality, particularly salts on soils andirrigation, commercial nurseries. crops.
Landscape irrigation — park, Public health concerns related to pathogens, surface andschoolyard, golf course, and greenbelt, groundwater pollution, marketability and publicresidential. acceptance.
Industrial reuse — cooling, boiler feed, Water constituents related to scaling, corrosion, etc.,process water, heavy construction. public health concerns, particularly aerosol
transmission of organics and pathogens in cooling andprocess water.
Groundwater recharge Trace organics and toxins in reclaimed water.
Recreational and environmental uses —lakes, ponds, marsh enhancement, Public health concerns, aesthetics due to odour.fisheries, snowmaking.
Nonpotable urban uses — fire Public health concerns, effects of water quality onprotection, air conditioning, toilet scaling, corrosion, fouling etc.flushing.
Potable reuse — blending in water supply Trace organic, toxins, aesthetics and public acceptance,and public health.

265Energy Management Reuse of Water 265
Irrigation Reuse
Reusing of Municipal wastewaters for irrigation is the oldest and largest reuse. Advancedtreatment of wastewaters is not always required, but each potential reuse should be thoroughlyanalyzed to determine the quality required. The advantages and the reuse of treated wastewaterfor irrigations are:
1. Low-cost source of water.2. An economical way to dispose of wastewater to prevent pollution and sanitary problems.3. An effective use of plant nutrients content in wastewater.4. Providing additional treatment before being recharge to the groundwater reservoir.When wastewater is used for irrigation, a number of possible disadvantages have to be considered:
1. The supply of wastewater is continuous throughout the year, while irrigation is seasonaland dependent on crop demands.
2. Treated wastewater may plug nozzles in irrigation systems and clog capillary pores ofheavy soils.
3. Some of the soluble constituents in wastewater may be present in concentrations toxicto plants.
4. Health regulations restrict the application of wastewater to edible crops.5. When wastewater is not properly treated, it may be a nuisance to the environment.
Current standards for irrigation water are compared to those of WHO and the USEPA forurban reuse in Table 11.9.
Table 11.9 Comparison of agricultural reuse guidelines
Parameter India Irrigation WHO (A) EPA Food Crop EPA Non-food Crop
Fecal coliform NS ≤ 1000 Nil ≤ 200
Intestinal nematodes NS ≤ 1 NS NS
BOD5
≤ 100 NS ≤ 10 ≤ 30
Suspended solids ≤ 200 NS ≤ 30 ≤ 30
Residual chlorine NS NS ≥ 1 ≥ 1
TDS ≤ 2100 NS NS NS
NS = No Standard
Recreational Reuse
Reuse of wastewater in recreational lakes is becoming increasingly popular in the arid areas ofthe United States. The state of California has pioneered in recreational reuse, with severallakes in existence for a number of years. Lakes at Santee and Indian Creek Reservoir near LakeTahoe are probably the best known. Tuscon, Arizona is installing recreational lakes derivedfrom treated wastewaters.
Wastewater used in recreational lakes must satisfy both health standards and standardsthat will make the lake acceptable from the recreational purposes. Although there are no

266 Energy ManagementWater Management266
national public health standards, at least one state, California, has written standards that canbe used as an example. For unrestricted recreational use, wastewater in California must bebiologically treated, chemically flocculated, filtered to produce a turbidity of not more than 10turbidity units, and adequately disinfected. Adequate disinfection is defined as 2.2-coliform/100 ml. The mean is determined over a 7 days period. These standards were arrived at afterseveral years of careful observations, including monitoring for viruses.
The public health standards cannot be used alone to define an adequate treatment system,since they do not deal in detail with problems related to ammonia in the water. Limiting theamount of the major nutrients (generally involves phosphorus or nitrogen, or both) can controlexcessive algae growth.
For cost-estimating purposes, Fig. 11.6 shows a treatment system that should satisfactorilyproduce recreational lake water. The system includes conversion of nitrogen to nitrate andphosphorus removal down to the level of about 0.1 mg/lit, as P. Organic removal should beexcellent because of the two-stage biological treatment and filtration suspended solids in thetreated water should be almost zero.
Fig. 11.6 Treatment system for producing recreational lake water.
Sewage and Industrial Waste reuse
Industrial use of municipal wastewater has been practiced for some time. Early examples in theUnited States include the Bethlehem Steel Company at Baltimore, Maryland, and the NevadaPower Company at Las Vegas, Nevada. Until recently, nearly all of the reuse was for coolingwater. Interest in using the wastewater for other industrial purposes is increasing. In the UnitedStates, it has been characteristic of industrial reuse that one plant only uses the effluent from agiven sewage treatment plant. This occurs because the need for large volumes of cooling waterand the one plant can use a significant fraction of the treatment plant output. The result is a verysimple distribution system. Because of the cost of distribution system, this tendency towards asmall number of users, probably located close to the treatment plant, is likely to continue.
Because there are many possible industrial uses for renovated wastewater, a wide variety oftreatment systems might be employed. Secondary effluent with no further treatment has beenused in some cases for cooling purposes. Calcium phosphate scale problems are likely, however,when no precautions are taken for phosphate removal. For most reuse situations, especially thoseinvolving more than a single user, it is unlikely that secondary treatment alone will be satisfactory.Chemical clarification with a phosphorous precipitating chemical would significantly improve theacceptability of the water from both the standpoint of phosphorus content and turbidity. Figure
R .A .W
W AS TE W AT ER
P R IM A R YTR E ATM E N T
A C TIVAT E DS LU D G E
B IO LO G IC A LN ITR IF IC AT IO N
C H LO R IN AT IO ND U A L -M E D IAFILT R AT IO N
TW O - STAG ELIM E TR E ATM E N T
R E N O VATE D W AT ERTO R E C R E ATIO N A L LAK E

267Energy Management Reuse of Water 267
Fig. 11.7 Treatment system for producing industrial water.
Manufacturing produces large quantities of BOD. The major contributors are the chemicalindustry, the pulp and paper industry, and the food processing industries. Table 11.10 liststypical BOD and suspended solids levels produced by a variety of industries.
Table 11.10 Typical process waste strengths
Type of Industry Process Wastes (mg/l)
BOD Suspended Solids
Petroleum refining 310 370Leather and leather products 1300 1700Flat glass 310 370Concrete, gypsum and plastic products 310 10000Primary metal industries 310 370Industrial launderers 870 1100Meat products 800 520Dairy products 2100 370Preserved fruits and vegetables 1400 370Grain mill products 3200 4500Bakery, mixed 2500 1100Fats and oils 1300 1100Seafood and fish 1400 600Food preparations 4100 930Medicinal and botanicals, fermentation 4500 4700Paints and allied products 2500 600Industrial organic chemicals 310 370Miscellaneous chemical products 2500 2600
Source: Sell, 1992 (sell, N J (1992) Industrial Pollution Control: Issues and Technologies. Van Nostrand ReinholdPublishing Co. Inc, New York.
11.7 shows a treatment that should have widespread usefulness. Nitrification could be included ifammonia is a problem. Clarification could be carried out with lime, aluminium salts, or iron salts.Lime, however, would appear to have several advantages over the other materials: it does not addextraneous ions such as chloride or sulfate; it removes some heavy metals; and it produces waterthat is less likely to be corrosive. If clarification were carried out with good solids control, filtrationwould not be required. For the relatively small additional cost, however, its inclusion significantlyincreases dependability. At Las Vegas, a system using lime treatment is followed by a holding pondrather than a filter. The pond is very effective for solids control.
R .A .W P R IM AR YTR E ATM E N T
A C T IVATE DS L U D G E
C H E M IC A LC LA R IF IC ATIO N
W AS T E W AT ER
C H L O R IN AT IO ND U A L
M E D IAFILT R AT IO N
R E N O VATE D W AS T E W AT ER

268 Energy ManagementWater Management268
Pollutants of concern in wastewater, if reuse is considered, are listed in Table 11.11 wherethe different classes of industrial wastewater pollutants are categorized alongwith measuredparameters and potential reuse concerns.
Table 11.11 Constituents of concern in wastewater effluent
Constituent Measured Parameter Reason for Concern
Suspended Suspended solids Suspended solids can lead to the development of sludgesolids including volatile and deposits and anaerobic conditions when untreated
fixed solids wastewater is discharged in the aquatic environment.Excessive amounts of suspended solids cause pluggingin irrigation systems.
Biodegradable BOD, COD Composed principally of proteins, carbohydrates, andorganics fats, if discharged into the environment, their biological
decomposition of biodegradable organics can lead to thedepletion of dissolved oxygen in receiving waters andto the development of septic conditions.
Pathogens Indicator organisms, Communicable diseases can be transmitted byand total and fecal pathogens in wastewater, bacteria, virus, and parasites.coliform bacteria
Nutrients Nitrogenrus, and Nitrogen, phosphorus and potassium are essentialpotassium nutrients for plant growth, and their presence normally
enhances the value of the water for irrigation. Whendischarged to the aquatic environment, nitrogen andphosphorus can lead to the growth of undesirable aquaticlife. When discharged in excessive amounts on land,nitrogen can also lead to the pollution of groundwater.
Stable Specific compounds These organics tend to resist conventional methods of(refractory) (e.g. phenols, pesticides, wastewater treatment. Some organic compounds areorganics and chlorinated toxic in the environment, and their presence may limit
hydrocarbons. the suitability of the wastewater for irrigation.
Hydrogen ion pH The pH of wastewater affects metal solubility. Theactivity normal pH range in municipal wastewater is 6.5 – 8.5,
but industrial waste can alter pH significantly.
Heavy metals Specific elements (e.g., Some heavy metals accumulate in the environment andCd, Zn, Ni, and Hg) are toxic to plants and animals. Their presence may
limit the suitability of the wastewater for irrigation.
Dissolved Total dissolved solids, Excessive salinity may damage some crops. Specificinorganics electrical conductivity, and ions such as chloride, sodium, and boron are toxic to
specific elements (e.g., some crops. Sodium may pose soil permeability problems.Na, Ca, Mg, Cl, and B)
Residual Free and combined Excessive amount of free available chlorine (0.05 mg/lchlorine chlorine Cl
2) may cause leaf-tip burn and may damage some
sensitive crops. However, most of the chlorine in reclaimedwastewater is in a combined form, which does notcause crop damage. Some concerns are expressed as tothe toxic effects of chlorinated organics in regards togroundwater contamination.
Source: Papadopoulus I, 1992: Rehabilitation of the areas irrigated with wastewater in the state of Kuwait. Assignment report,World Health Organization.

269Energy Management Reuse of Water 269
Large cities generate large quantities of sewage. In most cities, the sewage is treated anddischarged as treated water. In the present situation most of the treated sewage is used forfarming. The treated sewage can also be used by industry as an alternate source of water.Depending on the use of treated water in an industry, the secondary treated sewage may haveto be subjected to further treatment termed as Tertiary treatment. Various unit operations suchas clarification, filtration, and chemical treatment desalination may be incorporated in thetreatment scheme to produce desired quality of water for reuse. Sewage generally contains lowconcentration of impurities and most of the pollutants being of organic nature. It is treated atlow cost using naturally available micro-organism and conventional methods of clarification,filtration and chlorination. The treated sewage can be used by industries as cooling towermake-up. In case the industry needs water with low dissolved solids, for use as process waterboiler feed water, or as replacement of raw water, the sewage after secondary and tertiarytreatment may be treated by technologies such as RO or EDR to produce high quality water.In most cases, where industry is buying water from industrial development corporations orstate government, implementation of sewage reuse is economically viable. Sewage reuse plantshave already been adopted by industry in Chennai (Chennai Refineries Ltd., Madras FertiliserLtd.), and by Rashtriya Chemical & Fertilizer Ltd., in Mumbai.
Industrial wastewater is the other source of water for reuse. As compared to sewage reuse,the industrial wastewater reuse system is slightly expensive. This is because the industrialwaste is more completed to treat. On the other hand, operation of industrial waste reuse plantis more dependable as constant quality wastewater is available at the outlet of existing EffluentTreatment Plant. For ready reference a case study to indicate technocommercial feasibility ofusing sewage as industrial water is given hereunder as case A.
Case Study A – Feed and treated water quality (colony sewage)
Treated sewage forcooling tower makeup
pH 7 – 8 7 – 8
COD mg/l 250 – 300 < 10BOD mg/l 180 – 200 < 3.5Total suspended solids mg/l 130 – 150 < 10Total dissolved solids mg/l 400 – 600 400–600
Parameters Feed

270 Energy ManagementWater Management270
Fig. 11.8 Reuse of domestic sewage as cooling tower makeup – Case study -A
Industrial wastewater is the other source of water for reuse. As compared to sewage reuse,the industrial wastewater reuse system is slightly expensive. This is because the industrial wasteis more complicated to treat. On the other hand operation of industrial waste reuse plant is moredependable as a constant quality wastewater. Two case studies (Case study B and C) are presentedhere to prove the point.
Case study B – Feed and treated water quality (Low TDS industrial waste water)
Parameters Inlet Feed Quality Treated Waste Water Quality
pH 6.0 – 9.50 7.0 – 7.5Suspended solids mg/l 200 > 5Total dissolved solids mg/l 250 250
Total hardness (CaCO3) mg/l 200 200
Total alkalinity mg/l 210 max 210 maxChloride (as Cl) mg/l 80 max 80 maxPhosphate mg/l 15 15
Sulphate mg/l 100 max 100 maxSilica (as SiO
2) mg/l 20 max 20
Oil and grease mg/l 10 max ND
TOC mg/l 100 max 15 maxCOD mg/l 150 max < 20BOD mg/l 30 max < 2.0Residual chlorine mg/l – 0.2– 0.6
R AW S E W A G E
30 0 M 3/D AY
B AR
S C EE R N
G R ITR E M O VA L
PA R S H A L
FL U M E
G R IT
A ER AT IO NTA N K
FIN A LC LA R IF IE R
S LU D G EP U M P
S LU D G E R E C YC LEE XC E S S S LU D G ETO D R Y IN G B ED
C LE ARW AT E RTA N K
FILT E RP U M P
P R ES S U R ES AN D F ILT E R
A C TIVATE DC A R B O N F ILTE R
C H LO R IN AT IO N(H Y P O C H LO R ITE )
TR E ATE D W AT ER
B AC K W A S H TA N K& PU M P
A IR SC O U R IN GB LO W ER

271Energy Management Reuse of Water 271
Fig. 11.9 Low TDS industrial wastewaters reuse system – Case study - B
Case study C: Feed and treated water quality (Industrial cooling tower blowdown)
Parameters Feed Treated water qualityreuse as CT makeup
pH 7.4 – 7.8 7 – 7.2
Turbidity NTU 3 – 5 1
Total dissolved solids mg/l 1200 – 1400 < 200
Total hardness (CaCO3) mg/l 500 – 600 < 100
Chloride mg/l 200 – 260 < 25
Sulphates mg/l 7 – 11 —
Phosphates mg/l 300 – 500 —
Silica (as SiO2) mg/l 105 – 120 < 20
Soluble iron mg/l 0.1 – 0.2 —
Soluble zinc mg/l 0.5 – 0.7 —
COD mg/l 0 – 60 < 1
BOD mg/l — < 1
Free chlorine mg/l < 0.5 < 0.5
Total ammonia (NH3) 10 - 50 < 10
C O M BIN EDW AS TE WATER
(35 5 M 3/H R )
C O LLE C TIO N P IT(4H R S.C SP )
TR AN S FERPU M PS (1+ 1)
FL ASHM IXER
SL U D G EBL AN K ETC L AR IFIE R
PO LY. ALU M IN IU M C H LO R ID E (PAC )
PO LYE LE C TR O LY TE
C L 2
C H LO R IN EC O N TA C T TAN K
FILTER F EEDPU M PS (1+ 1)
SL U D G E TO
D R YIN G BE D SSL U D EPU M PS (1+ 1)
F ILTER B AC K W A SH
D U ALM E D IA F ILT ER S
(D M F)
AC TIVATEDC A R BO N F ILTE R S
(AC P )
C H LO R IN EC O N TA C T TAN K
TR EAT ED WATER PU M PS (1+ 1)
TR EAT ED WATERFO R R EU SE35 0/M 3 /h r
BA C K W AS H
AIR SC O U R IN GBL O W ER
BA C K W AS HPU M P (1N o )
C L 2

272 Energy ManagementWater Management272
Fig. 11.10 Cooling tower blowdown reuse system – Case study - C
Domestic Reuse of Non-potable Water
Non-potable uses are not particularly new. At the Grand Canyon in Arizona, wastewater hasbeen reused for toilet flushing for many years. Treatment consists of biological oxidation followedby filtration and chlorination. On Pikes Peak in Colorado, a novel treatment system was recentlyinstalled to produce water for various non-potable uses. It consists of a special pressurized, activatedsludge system using a membrane for solids removal in place of the final settler.
Quality standards for non-potable reuse have not been set on a national level. Local healthauthorities are responsible for approval of these systems. The major concern is for pathogenicorganisms. Therefore, adequate disinfection is of great importance.
Since these systems have been small and for very specialized situations making meaningfulcost estimates are difficult. A large-scale system might consist of conventional biologicaltreatment followed by filtration and chlorination.
Utilization of non-potable domestic reuse systems is and will be greatly restricted by theneed for a complete dual distribution system. In large cities, the cost would probably beprohibitive; in small towns, however, dual systems may be practical. Such systems have beenproposed in the mid Southwest.
Domestic Reuse of Near Potable Water
There has been a great deal of talk about potable reuse, but little activity. The only long-termoperation has been that at Windhoek, Southwest Africa (Namibia), reported on by Cillie et al.(1967) and Stnder and Funke (1967), where about one third of the municipal water supply isrenovated wastewater.
CAS E ST UDY - (C)POLYELECTROLYTE
DOLOMITE LDUENa2Co3
FASTE WATER FROM
COOLING TOWERBLOW DOWN200 m /hr.3
FLASHMIXER
SLUDGE BLANKETCLARIFIER
H SO2 4
PH ADJUSTMENT
CHLORINE
CHLORINE
CONTACT TAN K
FILTER BACK WASH
SLUDGE
FILTER FEEDPUMPS
AIR S COURING BLOWER
FRESSUREBAND FILTERS
SODIUM
BISULHTTE ANTIBCALENT
FILTRATETANK
MICBONFILTERS
S10 < mg/12HARONESS < 100 mg/1
BACKWASHPUMP
SLUDGE PEMP
SLUDGEPUMP
TO SLUDGEBRYINC SED
CHEMICALCLKA NLNG
SYSTEM
RO
BLOCK
VENT ALKASS
DEGASS ER& TANK
AIR B LOWER REJECT FOR DISPOSAL(40 mS/hr.)
PERMEATEFOR REUSE150 m /hr.3

273Energy Management Reuse of Water 273
Because of the limited experience with direct reuse of renovated wastewater, there are nostandards to apply to such waters. Standards for drinking water such as those of the US PublicHealth Service (1962), apply to water sources that are as free as possible from pollution. Manyin the water field believe that renovated wastewater should meet additional standards beyondthose written for large unpolluted sources. The most important areas of concern are traceorganic pollutant, metals, and pathogens, especially viruses. Analytical techniques to detectvery low concentrations of organics and virus are in an early stage of development, are expensive,and are time consuming. Analyses for metals are sensitive and generally adequate.
One answer to the problem is to insist that the water be overtreated to a point at whichthere could be absolutely no doubt of the water purity, even in the absence of adequate analyticaltechniques. Such procedure may be tolerated in some cases to obtain potable water, but thiswould not be possible for large volume uses.
A system such as that shown in Fig. 11.11 might be used for demineralization step; this isvery much like the advanced waste treatment plant at South Lake Tahoe, as it is presentlyoperated. The product water from the system will meet the quantitative values of the USPublic Health Service Drinking Water Standards. Although there is no standard for ammonia,nitrification would be necessary to reduce the ammonia concentration to aesthetically acceptablelevels. Limited virus determinations from the Tahoe plant showed no virus recovery from theproduct water. Whether demineralization would be required, or to what degree, would dependupon the fraction of recycle and the mineral content of the make up water supply. A materialbalance would have to be made for each particular situation to determine demineralizationrequirements. A 40% total dissolved solids removal would probably cover most situations. Ionexchange is shown in the diagram as the method of demineralization because it presentlyappears to be as cheap as any other method and offers some degree of trace organic removal.Since ion exchange would probably be operated to give almost total removal of minerals, notall of the water would have to be treated. If demineralization were not included, there is achance that the nitrate concentration would exceed the standard of 10 mg/lit, as nitrogen. Insuch cases, the necessary nitrate removal could be obtained by biological denitrification ofpart of the flow.
Fig. 11.11 Treatment system for producing acceptably potable water.
R AW
W AS T E R W ATE R
P R IM AR YTR E ATM E N T
A C T IVATE DS LU D G E
B IO LO G IC A LN ITR IF IC AT IO N
G R AN U LA RC A R B O N
TR E ATM E N T
D U A L -M E D IA
FILT R AT IO N
TW O - STAG ELIM E
TR E ATM E N T
LO NE XC H A N G E C H L O R IN AT IO N R E N O VATE D
W AS T E W AT ER

274 Energy ManagementWater Management274
Reuse of Water in Tall Buildings
A rather unusual application of reuse techniques is to be seen in nearly seven tall commercialbuildings ranging from 20 to 25 stories that were constructed in recent years in Bombay. Theneed for such reuse stems from the need to fully air-condition the buildings. Cooling water isre-circulated through a mechanical draught tower located at the top of the building, and make-up water requirements amounting from 150 to 250 m3/day depending on the size of the buildinghave to be obtained from sources other than municipal water supply because of acute shortage.
A way was soon found to meet this urgent need. Based on feasibility studies, it was shownthat the most economical and dependable way of meeting these requirements was to take thesewage of the building itself to the basement for treatment in a compact plant to make it fit forreuse as cooling water. The building drain is carried to the basement with an arrangement forbypassing the sewage to municipal sewer if desired. Likewise, an arrangement is provided fortapping municipal sewage if necessary to augment the flow through the treatment plant. Asthe latter arrangement is not routinely used, the plant design has to take into account the factthat practically all the building wastewater is received within the usual office working hours,since these are mostly office buildings. Treated water thus needs to be stored (Fig. 11.12).
Raw sewage enters the aeration tank after screening. No grit removal is found necessary inthese plants. The process adopted is the extended aeration process. Odour-free operation ismost important at all times since the plant is located within the building. For the same reason,an anaerobic sludge digester with gas production would not be acceptable. In sizing the aerationtank and the units that follow the flow pattern of the incoming wastewater is kept in view.
Fig. 11.12 Reuse of water in tall buildings – flowsheet
To determine the quality and quantity of water required for reuse in the tall buildings thefollowing approach is followed: An open re-circulating system is generally adopted for air-conditioning cooling water and the amount of water to be kept re-circulating in the system is
AIR-CON DITIO NING WAT ERRE CIR CU LATIO N
BU LDINGTE RRAC E
COO LIN GTO W ER
AC ID DO SIN G
BU IL DINGDRA IN AG E
SL OW DOW NAN D O THE R LO SE S
ROA D
SC REEN
GRO UND LE VEL
SE TTLIN G SE TTLESA NDFILTER
SOF TEN ER CHL OR IN E
WAS TEPU M P
SL UDGE BA CK WASH
EX TERN EDRE ACTION
RE G ENE RAT IONWAS TE
1 234
5RE TURN S LUD G E
CHE MMU N IC IPALSE WAGE
RE TURN S IG V E

275Energy Management Reuse of Water 275
approximately 11 liters/min for every ton of refrigeration capacity when temperature drop is5°C in the cooling tower. For such a situation, the water lost in evaporation (E) is about 1% ofthe re-circulating water.
Windage loss (W) is of the order of 0.1 to 0.3% of the re-circulating water when mechanicaldraft towers are used, but increases to 0.3 to 1.0% for atmospheric towers. Blow downrequirement (B) is estimated from the following equation if maximum permissible cycles ofconcentration (C) are known.
B = E W C
C+ ( – )
–11
; Where B, E, and W are in liters/min.
For trouble-free operation and minimum use of water quality control chemicals in the re-circulating water, the cycles of concentration are generally kept at 2.0 to 3.0 and, in no case,more than 4.0 in cooling towers such as these in Bombay. Hence, for a 100-tonnes air-conditioningplant re-circulating 1100 liters/min of water with a temperature drop of, say, 10°C through amechanical draft tower where cycles of concentration are to be restricted to 2.0.
E = 2% × 1100 = 22 liters/min; W = 0.2% × 1100 = 2.2 liters/min
B = 22 2 2 1 2
2 1+ . ( – )( – )
= 20 litres/min (approx)
The total make-up water requirement thus equals 44.2 liters/min (=22+2.2+20) or63.4 m3/day for 24-hrs working of this 100-tonnes plant.
Similarly, if 3.0 cycles of concentration are permissible, the total requirement of make-upwater reduces to 47.7m3/day for 100-tonnes plant.

This pageintentionally left
blank

1212121212 VIRTUAL WATERVIRTUAL WATERVIRTUAL WATERVIRTUAL WATERVIRTUAL WATER
12.1 INTRODUCTIONVirtual Water: This is a concept that was developed by Prof. Tony Allan, which refers to thevolume of water needed to produce a commodity or service. For example, it typically takes1,000 tonnes of water to produce one tonne of wheat. This represents the Virtual Water valueof wheat. As such, it is easier and less ecologically destructive, to import one tonne of wheatthan to pipe in 1,000 tonnes of water (Turton, 2000a). Virtual Water is also present inhydroelectric power and constitutes the volume of water needed to produce a given unit ofhydroelectricity (Turton, 1998).
Virtual Water is a fascinating concept that is now being developed and refined for use bydecision-makers at the strategic level of society. Recourse to trade in times of scarcity has beenan age-old mechanism by which society has managed to cope with acute water deficit. Thismechanism is now being considered as a component of a longer-term strategy. As such, thetrade in Virtual Water has shown itself elsewhere to be economically viable, andpolitically silent. A fine line exists between viable trade in Virtual Water and food aid. Assuch a balance needs to be struck between economic development and foreign trade. Similarly,post-colonial dependency is also politically risky. Therefore, a balance needs to be struck betweena policy of national self-sufficiency and food security. All policies are doomed to fail however,if the underlying driver of water deficit is ignored. As such, water deficit is not really theproblem. It is merely the manifestation of a greater and more complex problem — uncontrolledpopulation growth.
12.2 THE CONCEPTS OF WATER FOOTPRINT AND VIRTUAL WATER
Water Footprint
Water footprint is quite simply the volume of water used. At the individual level, this is expressedin litres. But at the national level, this becomes complex — the water footprint of a nation isequal to the use of domestic water resources, minus the virtual water export flows, plus thevirtual water import flows.
The total ‘water footprint’ of a nation is a useful indicator of a nation’s call on the globalwater resources. The water footprint of a nation is related to dietary habits of people. High

278 Energy ManagementWater Management278
consumption of meat brings along a large water footprint. Also the more food originates fromirrigated land, the larger is the water footprint. Finally, nations in warm climate zones haverelatively high water consumption for their domestic food production resulting in a largerwater footprint. At an individual level, it is useful to show the footprint as a function of fooddiet and consumption patterns.
1 cup of coffee needs 140 litres of water.1 litre of milk needs 800 litres of water.1 kg of wheat needs 1100 litres of water.1 kg of rice needs 2300 litres of water.1 kg maize needs 900 litres of water.
• The production of one kilogram of beef requires 22 thousand litres of water.• To produce one cup of coffee, we need 140 litres of water.• The water footprint of China is about 775 cubic meter per year per capita. Only about
3% of the Chinese water footprint falls outside China.• Japan with a footprint of 1100 cubic meter per year per capita, has about 60% of its
total water footprint outside the borders of the country.• The USA water footprint is 2600 cubic meter per year per capita.
(Source: UNESCO-IHE - Water Footprint)
Virtual Water
Virtual water is the amount of water that is embedded in food or other products needed for itsproduction. Trade in virtual water allows water scarce countries to import high waterconsuming products while exporting low water consuming products and in this way makingwater available for other purposes [World Water Council].
Ten litres of orange juice needs a litre of diesel fuel for processing and transport, and 220litres of water for irrigation and washing the fruit. The water may be a renewable resource,but the fuel is not only irreplaceable but is a pollutant, too.
For example, the virtual water content (in m3/tonne) for potatoes is 160. Others examples maize=450; milk=900; wheat=1200; soyabean=2300; rice=2700; poultry=2800;eggs=4700; cheese=5300; pork=5900; and beef=16000.
Showing people the ‘virtual water’ content of various consumption goods will increase thewater awareness of people.
12.3 DEFINITIONSVirtual water content: The virtual water content of a product is the volume of water used toproduce the product, measured at the place where the product was actually produced. Thevirtual water content of a product can also be defined as the volume of water that would havebeen required to produce the product in the place where the product is consumed. The adjective‘virtual’ refers to the fact that most of the water used to produce a product is in the end not

279Energy Management Virtual Water 279
contained in the product. The real water content of products is generally negligible if comparedto the virtual water content.
Virtual water export: The virtual water export of a country or region is the volume ofvirtual water associated with the export of goods or services from the country or region. It isthe total volume of water required to produce the products for export.
Virtual water import: The virtual water import of a country or region is the volume ofvirtual water associated with the import of goods or services into the country or region. It isthe total volume of water required (in the export countries) to produce the products for import.Viewed from the perspective of the importing country, this water can be seen as an additionalsource of water that comes on top of the domestically available water resources.
Virtual water flow: The virtual water flow between two nations or regions is the volume ofvirtual water that is being transferred from one place to another as a result of product trade.
Virtual water balance: The virtual water balance of a country over a certain time period isdefined as the net import of virtual water over this period, which is equal to the gross importof virtual water minus the gross export. A positive virtual water balance implies net inflow ofvirtual water to the country from other countries. A negative balance means net outflow ofvirtual water.
National water saving: A nation can save its domestic water resources by importing a water-intensive product rather than produce it domestically.
Global water saving: International trade can save water globally if a water-intensive commodityis traded from an area where it is produced with high water productivity (resulting in productswith low virtual water content) to an area with lower water productivity.
Coping strategy: A coping strategy is the output of the decision-making elite, usually in theform of some coherent policy or set of strategies such as water demand management, thatseeks to manage the water scarcity in some form or another (Turton & Ohlsson, 1999). Acoping strategy is the synthesis of a logical series of options that decision-makers consider,thereby converting those options into a clearly defined policy choice with which to confrontthe problems of rising levels of water scarcity in a given state or regional setting. A copingstrategy contains a logic of its own that is based on political rationality, which in turn may notcoincide with an outsider’s perception of rationality.
Problemshed: This is a conceptual unit in which the remedy for a problem can be found. Inother words, conventional wisdom would have us believe that watersheds are the unit ofmanagement, but it is also at this level that water deficit exists.
Sectoral water efficiency: The Sectoral Water Efficiency (SWE) is the ratio of water consumedwithin a given economic sector (expressed as a percentage of total national water consumption)in relation to contribution of the same economic sector to overall GDP (expressed as a percentageof total GDP) (Sectoral Water Efficiency = Sectoral Water Consumption as %: SectoralContribution to GDP as %) (Turton, 1998:7).

280 Energy ManagementWater Management280
Water deficit: This refers to the prevailing condition that exists when the consumption offreshwater within a given social entity exceeds the level of sustainable supply (Turton, 2000b).
Water scarcity: This is the condition that exists when the demographically induced demandfor water exceeds the prevailing level of local supply, meaning that supply-sided augmentationbecomes necessary (Turton & Meissner, 2000).
12.4 UNDERLYING ASSUMPTIONSIn order to fully understand the relative advantages and disadvantages of a Virtual Water-based coping strategy, it is necessary to first focus attention on some of the key underlyingassumptions of which five are strategically significant.
1. The notion of a nation-state with geographic integrity and decision-making sovereigntyis taken as a given. This implies that within each nation-state there is a group of decision-makers that have the responsibility of maximizing national security by increasing thelikelihood of economic prosperity and social stability.
2. The watershed or river basin is the unit of management.3. River basins are natural creations, having taken millions of years to develop. Nation-
states, it can be argued, are largely unnatural in the sense that human beings onto anatural world have imposed them.
4. Water scarcity is a localized phenomenon, manifesting largely within a given watershedor river basin.
5. It is necessary to understand that national political economies are subordinate to regionalpolitical economies.
12.5 POPULATION - FOOD - TRADE NEXUSBefore one can fully understand the implications of Virtual Water, one needs first to understandthe role of water in society within the context of a developing state or region. The so-calledpopulation-food- trade nexus really lies at the very heart of the subject. In this regard, thereare five strategically important issues that need to be understood.
1. Population growth is the fundamental driver of water scarcity. In fact, water scarcityis not the problem — it is merely a manifestation of a far more fundamental problem —rapid and unchecked population growth.
2. This population-related sanctioned discourse has two distinct manifestations that needto be understood. For reasons of simplicity, let us call these two manifestations the visibleand invisible fractions of water consumption patterns. The visible water fraction is easyto understand because it is the one that is most readily perceived by the layperson. Thiscan best be illustrated by means of a graph showing the direct correlation betweenpopulation growth and water demand in a given spatial entity. Figure 12.1 shows thedirect correlation between population growth and water demand for the city of Windhoek.From this, it is clear that a close correlation exists between population growths.

281Energy Management Virtual Water 281
Fig. 12.1 Growth of Windhoek’s population and water demand (after Jacobson et al., 1995). This canbe thought of as being the visible fraction of water demand.
This is typical of the problem being faced by urban water supply schemes so the literatureis rich with examples. While this is clearly an important aspect of water resourcemanagement, it does not tell the full story and as such can be misleading to strategicdecision-makers. This is where the invisible water fraction becomes relevant. Ohlsson(1999) provides an insight into the problem by showing a breakdown of water needs forone human being expressed in liters of water per day. In terms of this analysis, onehuman being can survive on 2-5 liters per day for drinking purposes; between 25 and100 liters per day are needed for domestic use such as sanitation services, washing ofclothes and cooking utensils, etc; and between 1,000 and 6,000 liters per day are usedfor food and biomass production. From this it is evident that the volumes of water that alocal authority would need to supply — the so-called visible fraction of water consumption— is in the order of 27-105 liters per person per day. This falls into absolute insignificancewhen compared to the invisible fraction of water consumption for the same person,which according to Ohlsson (1999) ranges between 1,000 and 6,000 liters per day(depending on where that person lives and what type of diet is taken as being normal).Stated differently, at the lowest end of the scale, the invisible water fraction (for food) is37 times greater than the visible fraction. At the highest end of the same scale, theinvisible fraction of water in the form of food is a staggering 57 times greater than thevisible fraction. This nuance is largely ignored in the literature.This can be understood by means of a simpler illustration. Let us take the basic waterrequirement (BWR) as 50 liters per person per day. Let us then accept that a healthy dietconsists of 3000 calories of food per person per day. We know that on average, it takesaround one liter of water to produce one calorie of food. This translates to 3000 liters ofwater per person per day for the invisible fraction of water for food production, which isa staggering 60 times greater than the visible fraction of water consumption. Thereforein order to ensure an adequate supply of food and water for one person for a year, a
whopping 1113 tonnes of water is needed of which a mere 1
60th (18 tonnes) is related to
the visible fraction.
20 0
15 0
10 0
50
19 30 19 60 19 90
20
15
10
5
W ater D e m and
P op lu tio n
An
nu
al W
ater
Dem
and
(mill
ion
m)
3
Year
Po
pu
lati
on
(th
ou
san
ds)

282 Energy ManagementWater Management282
3. We need to take yet another fundamental fact into consideration. This is related tothe Sectoral Water Efficiency (SWE) of agriculture versus industry. Ohlsson (1999)states that a reasonably acceptable global benchmark figure for agricultural waterconsumption is 65-70% of the total water abstractions in a given country. This willobviously vary from country to country, largely as the result of agriculturaldependence. In developing countries this can be higher. An acceptable internationalbenchmark for industrial water abstraction is in the order of 20-25% of the totalwater abstraction in any given country. Of this a small fraction (9%) is consumptiveuse, with the rest being recaptured via treatment and recycling technologies andtherefore made available for other economic purposes or activities. The worldbenchmark for household water abstraction is only 5-10% of the total waterabstraction in any given country. So, in terms of pure abstraction alone, agricultureis by far the largest user of water in any given economy.Thus, in general terms, the agricultural SWE is low whereas the industrial SWE tendsto be high. In fact water that is diverted away from agricultural use into the industrialand urban domestic sectors, can produce 70 times more economic value for givenvolume of water (Ohlsson, 1999).
Table 12.1 Selected SWE statistics for four SADC member states during 1995 (after Turton 1998)
Botswana Agricultural 48:5 HighIndustrial 20:46 Medium
Namibia Agricultural 68:14 MediumIndustrial 3:26 Medium
South Africa Agricultural 72:6 MediumIndustrial 11:30 Medium
Zimbabwe Agricultural 79:14 LowIndustrial 7:30 Medium
4. Having noted that an industrialized economy tends to be more water efficient, anothercritical aspect also becomes relevant to this guide. This different SWE characteristicallows the notion of economic gearing to be brought to bear on the problem of waterdeficit. This in turn implies a better water use pattern, and in particular, the ability togenerate foreign currency with which to finance Virtual Water imports.
5. The latter issue of social stability gives us a clue as to the existence at strategic levels ofyet another critically important aspect, namely the social ability to adapt to changinglevels of water deficit.
12.6 STRATEGIC ISSUESThere are seven key issues that need to be understood.
1. By broadening the water management paradigm from the watershed or river basin levelof analysis, to the problemshed level of analysis, an increased range of options become

283Energy Management Virtual Water 283
available to the strategic-level decision-maker. It is this fact alone, that has mitigatedagainst the confidently prophesied water wars in the Middle East (Allan, 1998).
2. By reaching into the problemshed for a solution, vast quantities of Virtual Water becomeavailable at reasonable (usually subsidized) prices, with the added advantage of beingenvironmentally sustainable. The current global grain surplus sees Virtual Water thathas been harvested from the soil profiles of water abundant countries, often at highlysubsidized rates, becoming a viable means of balancing local-level water deficits. Duringtimes of drought, countries often resort to importing grain or foodstuffs. This time-tested remedy has always been available to governments in water stressed regions.The only difference between this normal coping strategy, and a Virtual Water-basedsolution, is the fact that the former is a once off act, whereas the latter is a deliberatepolicy choice.
3. There is a definite conceptual difference between a country that uses Virtual Water asa rational coping strategy and a country that relies on food aid for survival. Japan, forexample, does not grow all of its own food, but Japan is certainly not aid-dependent.Botswana and South Africa are shifting away from a policy of national-self-sufficiencyin food to one of food security instead. The difference between a country that has arational coping strategy based on Virtual Water and an aid-dependent country istherefore the ability to pay.
4. A rational coping strategy that is based on the merits of virtual water implies a fundamentalre-think of the policy of national self-sufficiency in foodstuffs. In fact, a Virtual Waterparadigm is based on a policy of food security instead, with a strong and diversified economywith which Virtual Water imports can be paid for in a sustainable manner. This does notimply that a new form of post-colonial political or economic dependence is being accepted.It does imply however, that a balance needs to be struck between the relative merits (anddemerits) of national self-sufficiency versus food security. For example, South Africa as adiversified political economy was forced to adopt a national self-sufficiency policy as theresult of apartheid-induced sanctions. This implied massive mobilization of water forirrigation purposes, to the extent that environmental sustainability became a key issue.Virtual water is therefore environmentally friendly, and as such ought to be supported byenvironmental NGOs and special interest groups as a fundamental component of sustainabledevelopment in water deficit regions of the world.
5. Virtual water is politically silent (Allan, 2000). It is therefore never expected to becomefront-page news in any country that uses it as a coping strategy. In fact, research showsthat where it is used, the political decision-makers concerned can keep up the necessary liethat water deficit is not a problem for economic growth and social stability.
6. Virtual water is not a universal panacea of all water-related problems however. Thisfact needs to be appreciated as well. While water deficit can be balanced at the strategiclevel of a given country, it will not necessarily relate to food security at the householdlevel of society.

284 Energy ManagementWater Management284
7. Virtual water can become a powerful tool for balancing the water budget at a regionallevel. This is particularly useful within the context of SADC, where development isspatially uneven and where water distribution patterns do not match economicdevelopment patterns. As such, by considering a virtual water paradigm as afundamental driver of intra-regional trade and development, it cans fast-trackagricultural and economic development in a more equitable and sustainable way.
12.7 THE ECONOMICS OF WATER USEWater should be considered as an economic good. The problems of water scarcity, water excessand deterioration of water quality would be solved if the resource ‘water’ were properly treatedas an economic well. The logic is clear: clean fresh water is a scarce good and thus should betreated economically. There is an urgent need to develop appropriate concepts and tools to do so.
In dealing with the available water resources in an economically efficient way, there arethree different levels at which decisions can be made and improvements be achieved. The firstlevel is the user level, where price and technology play a key role. This is the level where the‘local water use efficiency’ can be increased by creating awareness, charging prices based on fullmarginal cost and by stimulating water-saving technology. Second, at a higher level, a choice hasto be made on how to allocate the available water resources to the different sectors of economy(including public health and the environment). Water is used for the production of several ‘goods’and ‘services’. People allocate water to serve certain purposes, which generally implies that other,alternative purposes are not served. Choices on the allocation of water can be more or less‘efficient’, depending on the value of water in its alternative uses. At this level, we speak of‘water allocation efficiency’. Water is a public good, so water allocation at the country or catchmentlevel is principally a governmental issue. The question is here how all demands for water canbest be met and where — in case of water shortage — supply should be restricted.
Beyond ‘local water use efficiency’ and ‘water allocation efficiency’ there is a level at whichone could talk about ‘global water use efficiency’. It is a fact that some regions of the world arewaterscarce and other regions are water-abundant. It is also a fact that in some regions there isa low demand for water and in other regions a high demand. Unfortunately there is no generalpositive relation between water demand and availability. Until recently people have focusedvery much on considering how to meet demand based on the available water resources atnational or river basin scale. The issue is then how to most efficiently allocate and use theavailable water. There is no reason to restrict the analysis to that. In a protected economy, anation will have to achieve its development goals with its own resources. In an open economy,however, a nation can import products that are produced from resources that are scarcelyavailable within the country and export products that are produced with resources that areabundantly available within the country. A water-scarce country can thus aim at importingproducts that require a lot of water in their production (water-intensive products) and exportingproducts or services that require less water (waterextensive products). This is called import ofvirtual water (as opposed to import of real water, which is generally too expensive) and willrelieve the pressure on the nation’s own water resources. For water-abundant countries an

285Energy Management Virtual Water 285
argumentation can be made for export of virtual water. Import of water-intensive products bysome nations and export of these products by others include what is called ‘virtual watertrade’ between nations.
12.8 VIRTUAL WATER TRADEFor the production of nearly all goods water is required. The water that is used in the productionprocess of an agricultural or industrial product is called the ‘virtual water’ contained in theproduct. For example, for producing a kilogram of grain, grown under rain-fed and favourableclimatic conditions, we need about one to two cubic metres of water, that is 1000 to 2000 kg ofwater. For the same amount of grain, but growing in an arid country, where the climaticconditions are not favourable (high temperature, high evapotranspiration) we need up to 3000to 5000 kg of water.
If one country exports a water-intensive product to another country, it exports water invirtual form. In this way some countries support other countries in their water needs. Forwater-scarce countries, it could be attractive to achieve water security by importing water-intensive products instead of producing all water-demanding products domestically. Reversibly,water-rich countries could profit from their abundance of water resources by producing water-intensive products for export. Trade of real water between water-rich and water-poor regionsis generally impossible due to the large distances and associated costs, but trade in water-intensive products (virtual water trade) is realistic. Virtual water trade between nations andeven continents could thus be used as an instrument to improve global water use efficiencyand to achieve water security in water-poor regions of the world.
12.9 METHOD FOR CALCULATING AMOUNT OF VIRTUAL WATER
Calculation of Specific Water Demand Per Crop Type
Per crop type, average specific water demand has been calculated separately for each relevantnation on the basis of FAO data on crop water requirements and crop yields:
SWD[n,c] = γ
..........(1)
G loba l w ater use e ffic iency
W ate r a llocation e ff ic ienc y
Local wa ter use efficiency
V irtua l w a te r trade betw een w ate r-scarce and w a te r-ab undant reg ions
value o f w a ter in its a lte rnativ e uses
technology, w a te r p rice, env iro m en ta law areness o f wa te r user


287Energy Management Virtual Water 287
Fig. 12.2 Steps in the calculation of global virtual water trade.
Calculation of Virtual Water Trade Flows and the National Virtual Water Trade Balance
Virtual water trade flows between nations have been calculated by multiplying internationalcrop trade flows by their associated virtual water content. The latter depends on the specificwater demand of the crop in the exporting country where the crop is produced. Virtual watertrade is thus calculated as:
= × .......(4)
in which VWT denotes the virtual water trade (m3yr–1) from exporting country ne to importingcountry ni in year t as a result of trade in crop c. CT represents the crop trade (ton yr–1) fromexporting country ne to importing country ni in year t for crop c. SWD represents the specificwater demand (m3 tonnne–1) of crop c in the exporting country. Above equation assumes thatif a certain crop is exported from a certain country, this crop is actually grown in this country(and not in another country from which the crop was just imported for further export).Although a certain error will be made in this way, it is estimated that this error will notsubstantially influence the overall virtual water trade balance of a country. Besides, it ispractically impossible to track the sources of all exported products.
The gross virtual water import to a country ni is the sum of all imports:
= ∑
.......(5)
The gross virtual water export from a country ne is the sum of all exports:
= ∑
! .......(6)
C lim atic param eters
C rop coefficien t
K c [-]
C rop yieldC Y [ton ha ]
-1
G loba l crop tradeC T[ton y t ]
-1
R e f. c ropev apotransp .Eo [m m day ]
-1
C rop evapotranspirationEo [m m day ]
-1
C rop w ate r requirem en t
C W R [m 3 ha ]-1
Specific w ate r dem andS W D [m 3 ton ]
-1
G loba l virtual w a ter trade
V W T [m 3 YT ]-1

288 Energy ManagementWater Management288
The net virtual water import of a country is equal to the gross virtual water import minus thegross virtual water export. The virtual water trade balance of country x for year t can thus bewritten as:
= −" # # ! # .......(7)
where NVWI stands for the net virtual water import (m3yr-1) to the country. Net virtual waterimport to a country has either a positive or a negative sign. The latter indicates that there is netvirtual water export from the country.
12.10 CALCULATION OF A NATION’S ‘WATER FOOTPRINT’The total water use within a country itself is not the right measure of a nation’s actualappropriation of the global water resources. In the case of net import of virtual water importinto a country, this virtual water volume should be added to the total domestic water use inorder to get a picture of a nation’s real call on the global water resources. Similarly, in the caseof net export of virtual water from a country, this virtual water volume should be subtractedfrom the volume of domestic water use. The sum of domestic water use and net virtual waterimport can be seen as a kind of ‘water footprint’ of a country, on the analogy of the ‘ecologicalfootprint’ of a nation. In simplified terms, the latter refers to the amount of land needed for theproduction of the goods and services consumed by the inhabitants of a country. Studies haveshown that for some countries the ecological footprint is smaller than the area of the nation’sterritory, but in other cases much bigger (Wackernagel and Rees, 1996; Wackernagel et al.,1997). The latter means that apparently some nations need land outside their own territory toprovide in their goods and services.
The ‘water footprint’ of a country (expressed as a volume of water per year) is defined as:
Water footprint = WU + NVWI ...(8)
in which WU denotes the total domestic water use (m3yr-1) and NVWI the net virtual waterimport of a country (m3yr-1). As noted earlier, the latter can have a negative sign as well.
Total domestic water use WU should ideally refer to the sum of ‘blue’ water use (referringto the use of ground and surface water) and ‘green’ water use (referring to the use ofprecipitation). However, data on green water use on country basis are not easily obtainable.Normally definition of water use to blue water use. It should be noted that ‘net virtual waterimport’ as defined in eqn. 8 includes both ‘blue’ and ‘green’ water.
Calculation of National Water Scarcity, Water Dependency and Water Self-sufficiency
One would logically assume that a country with high water scarcity would seek to profit fromnet virtual water import. On the other hand, countries with abundant water resources couldmake profit by exporting water in virtual form. In order to check this hypothesis we needindices of both water scarcity and virtual water import dependency. Plotting countries on agraph with water scarcity on the x-axis and virtual water import dependency on the y-axis,would expectedly result in some positive relation.

289Energy Management Virtual Water 289
As an index of national water scarcity, we use the ratio of total water use to water availability:
= $
%.......(9)
In this equation, WS denotes national water scarcity (%), WU the total water use in thecountry (m3yr-1) and WA the national water availability (m3yr-1). Defined in this way, waterscarcity will generally range between zero and hundred percent, but can in exceptional cases(e.g. groundwater mining) be above hundred percent. As a measure of the national wateravailability WA we take the annual internal renewable water resources, that are the averagefreshwater resources renewably available over a year from precipitation falling within acountry’s borders (Gleick, 1993).
The water dependency (WD) of a nation is calculated as the ratio of the net virtual waterimport into a country to the total national water appropriation:
≥
" $ & "
'" (
& " ) .......(10)
The value of the water dependency index will vary per definition between zero and hundredpercent. A value of zero means that gross virtual water import and export are in balance orthat there is net virtual water export. If on the other extreme the water dependency of anation approaches hundred percent, the nation nearly completely relies on virtual water import.
As the counterpart of the water dependency index, the water self-sufficiency index isdefined as follows:
(
$ & " *
'"
& " ) .......(11)
The water self-sufficiency of a nation relates to the water dependency of a nation in thefollowing simple way:
WSS = 1 – WD .......(12)
The level of water self-sufficiency (WSS) denotes the national capability of supplying the waterneeded for the production of the domestic demand for goods and services. Self-sufficiency is hundredpercent if all the water needed is available and indeed taken from within the own territory. Waterself-sufficiency approaches zero if a country heavily relies on virtual water imports.
12.11 DATA SOURCESData on crop water requirements are calculated with FAO’s CropWat model for Windows,which is available through the web site of FAO (www.fao.org). The CropWat model uses the

290 Energy ManagementWater Management290
FAO Penman- Monteith equation for calculating reference crop evapotranspiration. TheCropWat model calculates crop water requirement of different crop types on the basis of thefollowing assumptions:
(1) Crops are planted under optimum soil water conditions without any effective rainfallduring their life; the crop is developed under irrigation conditions.
(2) Crop evapotranspiration under standard conditions (ETC), this is the evapotranspirationfrom disease-free, well-fertilised crops, grown in large fields with 100% coverage.
(3) Crop coefficients are selected depending on the single crop coefficient approach, thatmeans single cropping pattern, not dual or triple cropping pattern.
Climatic Data
The climatic data needed as input to CropWat is taken from FAO’s climatic database ClimWat,which is also available through FAO’s web site. The ClimWat database contains climatic datafor more than hundred countries. For many countries climatic data are available for differentclimatic stations.
Crop Parameters
In the crop directory of the CropWat package sets of crop parameters are available for 24different crops. The crop parameters used as input data to CropWat are: the crop coefficientsin different crop development stages (initial, middle and late stage), the length of each crop ineach development stage, the root depth, and the planting date. For the 14 crops where cropparameters are not available in the CropWat package, crop parameters have been based onAllen et al. (1998).
Crop Yields
Data on crop yields is taken from the FAOSTAT database, again available through FAO’swebsite.
Table 12.2. Availability of crop parameters
Crops for which crop parameters have been taken Crops for which crop from parametersfrom FAOs CropWat package have been taken Allen et al. (1998)
Banana Maize Sugar beet Artichoke Onion dry
Barley Mango Sugarcane Carrots Peas
Bean dry Millet Sunflower Cauliflower Rice
Bean green Oil palm fruit Tobacoo Citurs Safflower
Cabbage Pepper Tomato Cucumber Spinach
Cotton seeds Potato Vegetable Lettuce Sweet potato
Grape Sorghum Watermelon Oats
Groundnut Soyabean Wheat Onion green

291Energy Management Virtual Water 291
12.12 SPECIFIC WATER DEMAND PER CROP TYPE PER COUNTRYThe calculated crop water requirements for different crops in different countries are shown inAppendix I. The crop water requirements as calculated here refer to the evapotranspirationunder optimal growth conditions. This means that the calculated values are overestimates,because in reality there are often water shortage conditions. On the other hand, the calculatedvalues can also be seen as conservative, because they exclude inevitable losses (e.g. duringtransport and application of water) and required losses such as drainage. The calculated cropwater requirements differ considerably over countries, which is mainly due to the differencesin climatic conditions.
12.13 GLOBAL TRADE IN VIRTUAL WATER
International Trade in Virtual Water
The calculation results show that the global volume of crop-related virtual water trade betweennations was 695 Gm3/yr in average over the period 1995-1999. For comparison: the globalwater withdrawal for agriculture (water use for irrigation) was about 2500 Gm3/yr in 1995and 2600 Gm3/yr in 2000 (Shiklomanov, 1997,). Taking into account the use of rainwater bycrops as well, the total water use by crops in the world has been estimated at 5400 Gm3/yr(Rockström and Gordon, 2001,). This means that 13% of the water used for crop productionin the world is not used for domestic consumption but for export (in virtual form). This is theglobal percentage; the situation strongly varies between countries.
Considering the period 1995-1999, the top-5 list of countries with net virtual water exportis: 1st United States, 2nd Canada, 3rd Thailand, 4th Argentina, and 5th India. The top-5 list ofcountries in terms of net virtual water import for the same period is: 1st. Sri Lanka, 2nd Japan,3rd Netherlands, 4th Republic of Korea, and 5th China. Top-30 lists are given in Table 12.3.The ranking lists do not considerably change if we look into particular years within the five-year period 1995-1999.
Fig. 12.3 National virtual water trade balances over the period 1995-1999

292 Energy ManagementWater Management292
Green coloured countries have net virtual water export. Red coloured countries have netvirtual water import.
National virtual water trade balances over the period 1995-1999 are shown in the colouredworld map of Fig. 12.3. Countries with net virtual water export are green and countries withnet virtual water import are red.
Some countries have net export of virtual water over the period 1995-1999, but net importof virtual water in one or more particular years in this period (Table 12.4). There are alsocountries that show the reverse (Table 12.5).
Table 12.3. Top-30 countries of virtual water export and top-30 countries of virtual water import (over1995-1999).
Net Export Volume Net Import Volume(109 m3) (109 m3)
United States 758.3 1 Sri Lanka 428.5
Canada 272.3 2 Japan 297.4
Thailand 233.3 3 Netherlands 147.7
Argentina 226.3 4 Korea Rep. 112.6
India 161.1 5 China 101.9
Australia 145.6 6 Indonesia 101.7
Vietnam 90.2 7 Spain 82.5
France 88.4 8 Egypt 80.2
Guatemala 71.7 9 Germany 67.9
Brazil 45.0 10 Italy 64.3
Paraguay 42.1 11 Belgium 59.6
Kazakhstan 39.2 12 Saudi Arabia 54.4
Ukraine 31.8 13 Malaysia 51.3
Syria 21.5 14 Algeria 49.0
Hungary 19.8 15 Mexico 44.9
Myanmar 17.4 16 Taiwan 35.2
Uruguay 12.1 17 Colombia 33.4
Greece 9.8 18 Portugal 31.1
Domincan Republic 9.7 19 Iran 29.1
Romania 9.1 20 Bangladesh 28.7
Sudan 5.8 21 Morocco 27.7
Bolivia 5.3 22 Peru 27.1
Saint Lucia 5.2 23 Venezuela 24.6
United Kingdom 4.8 24 Nigeria 24.0
Burkina Faso 4.5 25 Israel 23.0
Sweden 4.2 26 Jordan 22.4
Malawi 3.8 27 South Africa 21.8
Dominica 3.1 28 Tunisia 19.3
Benin 3.0 29 Poland 18.8
Slovakia 3.0 30 Singapore 16.9
Country Country

293Energy Management Virtual Water 293
Table 12.4. Countries with net export of virtual water in the period 1995-1999 that have however net importin particular years. A ‘minus’ indicates a negative virtual water trade balance (i.e. net export of virtual
water). A ‘plus’ indicates a positive virtual water trade balance (i.e. net import of virtual water)
Country 1995 1996 1997 1998 1999
Brazil – + – – –
Syria – – – – +
Greece – – – + –
Sudan – + + + –
United Kingdom + + – + +
Burkina Faso – + + – –
Benin + – – – –
Slovakia – – + – –
Ecuador – – – + –
Bulgaria – + + – –
Cuba + – – + –
Finland – – – – +
Yugoslavia – – + – –
Uganda – – + + +
Papua N. Guinea – – + – +
Bahamas + – – – –
Montserrat – – – – +
Tajikistan + – – – –
Cameroon – – + + –
Martinique – + + + +
Pakistan – – + – +
Solomon Islands – + – + +
Central Africa – + – + –
Samoa – – – + –
Wallis Island – + + + +

294 Energy ManagementWater Management294
Table 12.5 Countries with net import of virtual water in the period 1995-1999 that have however net exportin particular years. A ‘minus’ indicates a negative virtual water trade balance (i.e. net export of virtual
water). A ‘plus’ indicates a positive virtual water trade balance (i.e. net import of virtual water)
Country 1995 1996 1997 1998 1999
St. Kitts & Nevis – + – + +
Guinea Bissau + + – – +
Burundi + + – + +
Tonga + + – + +
Mongolia – + + + +
Nepal + + + – +
Kyrgyzstan + + – – –
Macedonia – + + + +
Lithuania + + + – –
Bermuda + + + – –
Bahrain + + + – +
Gambia + + + – +
Bosnia + – + + +
Madagascar + – – + +
George + + + + –
Croatia – – + + +
Nicaragua + + – + +
Uzbekistan + + + + –
Czech Republic – + + + –
Philippines – – + + +
Russian Fed. – – + – +
Mexico + + – + +
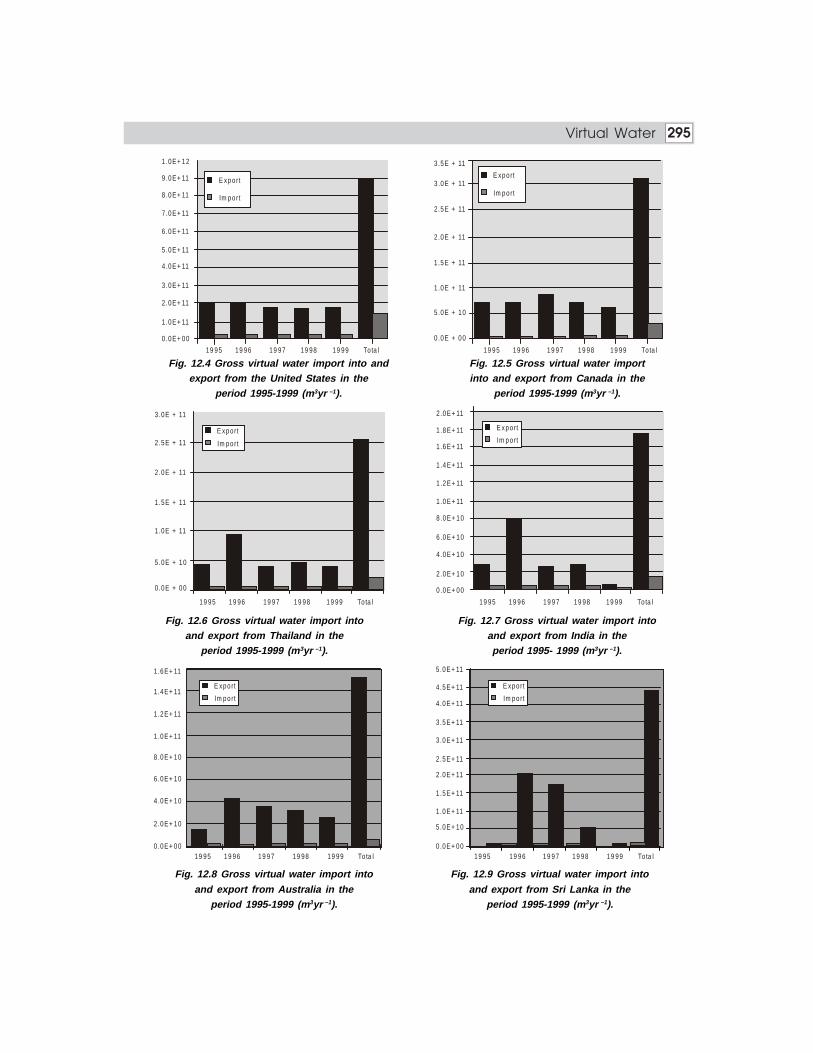
295Energy Management Virtual Water 295
Fig. 12.4 Gross virtual water import into and Fig. 12.5 Gross virtual water importexport from the United States in the into and export from Canada in the
period 1995-1999 (m3yr –1). period 1995-1999 (m3yr –1).
Fig. 12.6 Gross virtual water import into Fig. 12.7 Gross virtual water import intoand export from Thailand in the and export from India in the
period 1995-1999 (m3yr –1). period 1995- 1999 (m3yr –1).
Fig. 12.8 Gross virtual water import into Fig. 12.9 Gross virtual water import intoand export from Australia in the and export from Sri Lanka in the
period 1995-1999 (m3yr –1). period 1995-1999 (m3yr –1).
3 .5E + 11
3 .0E + 11
2 .5E + 11
2 .0E + 11
1 .5E + 11
5 .0E + 10
0 .0E + 00
1 .0E + 11
19 95 19 96 19 97 19 98 19 99 To ta l
E xport
Im port
1 .0E+ 12
9 .0E+ 11
8 .0E+ 11
7 .0E+ 11
6 .0E+ 11
5 .0E+ 11
4 .0E+ 11
3 .0E+ 11
2 .0E+ 11
1 .0E+ 11
0 .0E+ 00
E xport
Im port
19 95 19 96 19 97 19 98 19 99 To ta l
19 95 19 96 19 97 19 98 19 99 To ta l
E xport
Im port
3 .0E + 11
2 .5E + 11
2 .0E + 11
1 .5E + 11
5 .0E + 10
0 .0E + 00
1 .0E + 11
19 95 19 96 19 97 19 98 19 99 To ta l
E xport
Im port
2 .0E+ 11
1 .8E+ 11
1 .6E+ 11
1 .4E+ 11
1 .2E+ 11
1 .0E+ 11
8 .0E+ 10
6 .0E+ 10
4 .0E+ 10
2 .0E+ 10
0 .0E+ 00
19 95 19 96 19 97 19 98 19 99 To ta l0 .0E+ 00
5 .0E+ 10
1 .0E+ 11
1 .5E+ 11
2 .0E+ 11
2 .5E+ 11
3 .0E+ 11
3 .5E+ 11
4 .0E+ 11
4 .5E+ 11
5 .0E+ 11
E xport
Im port
19 95 19 96 19 97 19 98 19 99 To ta l0 .0E+ 00
2 .0E+ 10
4 .0E+ 10
6 .0E+ 10
8 .0E+ 10
1 .0E+ 11
1 .2E+ 11
1 .4E+ 11
1 .6E+ 11
E xport
Im port

296 Energy ManagementWater Management296
International Virtual Water Trade by Product
The total volume of crop-related virtual water trade between nations in the period 1995-1999can be for 30% which can explain by trade in wheat. Next come soyabeans and rice, whichaccount respectively for 17% and 15% of global crop-related virtual water trade.
Inter-regional Trade in Virtual Water
Fig. 12.10 Virtual water trade balances of 13 world regions over the period 1995-1999. Green coloured regionshave net virtual water export; red coloured regions have net virtual water import. The arrows show the largest net
virtual water flows between regions (>100 Gm3).
Virtual Water Trade Balance Per World Region
The virtual water trade balances of the 13 world regions are shown in Fig. 12.11a and 12.11b.The former shows the gross import and export of virtual water for each region. The lattershows the difference between the two, the net import, which is positive in some cases andnegative in others.
North America is by far the biggest virtual water exporter in the world, while Central andSouth Asia is by far the biggest virtual water importer.
Fig. 12.11a Gross virtual water import and export per region in the period 1995-1999 (Gm3).
E xport
Im port
Ce ntra l
A fricaCe ntra l
Ame ric aCe ntra l
and So uth Asia
Ea stern Eu ro pe
MiddleEa st
No rthAfric a
No rthAme ric a
Oc eania FS U So uth So uthAme ric a
So uthEa st Asia
WesternEu ro pe
0
200
400
600
800
1000
1200

297Energy Management Virtual Water 297
Fig. 12.11b Net virtual water import per region in the period 1995-1999 (Gm3).
CONCLUDING REMARKS
Here virtual water trade related to crop trade between nations mentioned. Also other goodscontain virtual water, for instance meat, dairy products, cotton, paper, etc. In order to get acomplete picture of the global virtual water trade flows, also other products than crops have tobe taken into account. For instance, the virtual water trade balance of the Netherlands drawnin the current study suggests that this country has an incredibly high net import of virtualwater, due to the large import of feed for the Dutch bio-industry. The balance will look quitedifferently if we would take into account the export of virtual water that relates to the exportof meat from the Netherlands.
Knowing the national virtual water trade balance is essential for developing a rationalnational policy with respect to virtual water trade. But for some large countries it might be asrelevant to know the internal trade of virtual water within the country. China for instance,relatively dry in the north and relatively wet in the south, domestic virtual water trade is arelevant issue.
Ce ntra lA frica
Ce ntra lAme ric a
Ce ntra land So uth
Asia
Eastern Euro pe
MiddleEast
No rthAfric a
No rthAme ric a
Oc eania FS U SouthAfric a
SouthAme ric a
SouthEast Asia
WesternEuro pe
-150 0
-100 0
-500
0
500
1000

298En
erg
y Ma
na
ge
me
nt
Wa
ter M
an
ag
em
en
t298
Appendix : I Crop water requirements (m3/ha) (source: crop wat model)
Country Banana Barley Bean Ground Maize Potato Sugar Vegetables Onion Rice Wheat CottonGreen Nut Cane Dry Seed
Afghanistan 6800 3770 3540 3890 3340 2980 12740 4040 — 5900 4350 7410
Australia 8970 4030 2670 5930 4380 5790 18520 1190 6620 8600 4730 8710
Bangladesh 7050 3520 3260 4600 3350 3420 13460 3300 — 8200 4260 8300
Brazil 7730 4220 2250 4830 3480 4400 14250 3180 6630 7800 3320 6680
Canada 7120 3560 2200 3180 3170 3130 12830 2950 6920 6200 3740 4872
China 6180 4100 4120 4960 3600 4070 9870 2920 6680 6800 4040 6780
Germany 7120 3560 2200 3180 3170 3130 12830 2460 6590 6900 3740 3880
India 8610 3780 5190 6930 4720 4820 20300 5460 6400 9880 6910 9190
Indonesia 8640 4180 3020 5010 4850 6170 16480 2680 5170 9300 3950 7080
Israel 13070 8800 — 5980 6350 4780 24710 4400 6160 12000 6100 11920
Italy 6630 4850 3530 5370 2460 5500 18920 4070 6710 6400 6540 8752
Japan 6400 3650 2980 4620 3160 2410 10100 2810 6190 7600 3760 6510
Korea 6600 2460 2980 3370 2190 2300 10600 3790 6820 6570 3820 7020
New Zealand 6570 3640 2120 3540 3250 6290 12850 2430 5740 — 3030 6110
Singapore 7810 3560 3180 4950 4250 4480 15020 3050 6820 — 4150 8930
South Africa 8970 4030 2670 5930 4380 4680 18520 4490 — — 4730 8710
Sri Lanka 8970 5590 4570 6870 6640 6930 15780 5140 — — 8730 —
U K 7120 3580 2200 3180 3170 3290 12830 2450 3780 5900 3740 —
U S A 6570 3640 2120 3180 3170 3290 12830 2450 4830 8600 3740 6210

1313131313 CREATION OF SWEETCREATION OF SWEETCREATION OF SWEETCREATION OF SWEETCREATION OF SWEETWATERWATERWATERWATERWATER
13.1 ARTIFICIAL RAINThere is a river in the sky a complex, swirling, tumultuous river of air and water. Sometimeswe cannot see the water, when it is in the form of vapor. At other times, airborne droplets ofwater gather in clouds, which, of course, can be seen. We should not assume that cloudscontain water and the surrounding air does not, because the surrounding air carries vapor,which often flows into the cloud. And, also, clouds dissolve into vapor and fade away. But theclouds we see with our eyes contain water brought along a step in the process of becomingrain. With clouds we can have rain. Without clouds we cannot. But with clouds we do notnecessarily have rain. The droplets of water often fail to take the further step of becomingraindrops, accretions of water become heavy enough to fall to the ground.
This exasperates the farmer — when lush clouds, apparently containing a great deal ofmoisture, float over his dry fields and fail to precipitate out even one small part of the moisturecarried by and flowing into these clouds. Cloud census studies have shown that seasons withconsiderable cloud cover can also be dry seasons.
Why? Can we coerce the droplets into becoming drops heavy enough to fall onto theground? Can we haul down needed moisture from sky?
A FEW YEARS AGO many of us thought we had been theorized that minute particles ofdust, present throughout the atmosphere, were a necessary ingredient of rain, something forthe droplets to cluster on and grow. In 1946, Dr. Vincent J. Schaefer, of the General ElectricCo., sprinkled particles of dry ice from an airplane and produced precipitation. A little later Dr.Bernard Vonnegut of General Electric ran onto silver iodide as the ideal particle or crystal. Afew experiments produced seemingly awe-inspiring results.
And so, “scientific rainmaking” came into being. The scientific basis of it was “artificialnucleation” — that is, the supplying of artificial nuclei or particles to clouds thought to lacksufficient natural nuclei.
A comment on terminology should be inserted at this point. The word “rainmaking”seems to imply the creation of water, whereas so-called rainmakers cannot produce waterthat does not already exist in the air. Perhaps “rain increasing” should be used. Further, the

300 Energy ManagementWater Management300
phrase “Weather control” implies a management of the elements beyond present conception.Perhaps “weather modification” states more accurately what we can now visualize. Theterms “rainmaking” and “weather control”, however, have become common and are moreeasily recognized.
Artificial nucleation is tied in with the ice crystal theory. According to the theory, naturalice crystal formation occurs at quite low temperatures (– 40° F). Presumably the crystals growby attracting other moisture particles until they become heavy enough to fall out of the cloudsas snow, which melts on the way down and becomes rain.
Dropping dry ice (carbon dioxide) on clouds cools areas of those clouds and starts theprocess of crystal formation. The effect can be substantial if the clouds are near the temperatureat which ice crystals form naturally.
Supplying nuclei to clouds does not cool them, but with nuclei the ice crystal formationoccurs at higher temperatures — that is, below freezing but closer to the freezing level. Somenatural nuclei or dust particles start the process at temperatures between –40° and 5°. Butcrystals of silver iodide (artificial nuclei) start it between 5° and 25°.
Therefore, silver iodide not only can start rainfall in clouds too warm for natural rainfallproduction but also can increase rainfall in clouds already producing small amounts bynucleating the warmer lower sections.
Another method of producing rainfall is of interest, although not of commercial importance.In warm regions, non-freezing clouds release rain, obviously by some other process than theformation of ice crystals.
It is commonly believed that precipitation results when larger than normal water dropletsfall relative to other droplets, collecting enough smaller ones to grow to raindrop size largeenough to fall out of the cloud. The answer lies in providing the larger droplets.
Such clouds, found in the Southern States and farther north in the summer, have beensuccessfully seeded by water sprayed from airplanes.
But airplanes cost money to operate and flying them into storm clouds can be dangerous.The large commercial “cloud – seeders” therefore do not use dry ice or water but rely on silveriodide, which can be released from ground generators. The minute crystals drift away fromthe generators and presumably get sucked into the updrafts of storm clouds.
Experts suggest that rainmaking is a pretty big business, even with its uncertainties.
The study indicates that the rainmakers really have modified the weather significantlyan assumption that a majority of scientists familiar with the subject do not go along withwholeheartedly. Most of them seem to agree that nucleating agents can modify weather incertain circumstances. Some think these circumstances occur frequently enough so that mancan change the whole pattern of water distribution, with a tremendous impact on the economy.Others are skeptical of large–scale effects. Most of them say: “A lot more has to be learnedabout the rainmaking process before we can tell”.

301Energy Management Creation of Sweet Water 301
The rainmakers answer the argument by saying that nature is an inefficient rainmaker,with only about 1 percent of a cloud’s moisture falling to the ground in an ordinary storm. Bysupplying more nuclei they may increases this efficiency up to 2 percent. Such amounts areinsignificant, they say, and the vast streams of moisture floating in the sky will replenish theclouds almost immediately.
Whatever the merits of this, rainmaking, viewed on a grander scale, may indeed increasesubstantially the amount of mineral–free water available for man’s use.
FOR ONE THING, it seems perfectly obvious that many airborne streams of moistureescape the land and give much of their water back to the seas. Rainmaking might make itpossible for us to take better advantage of the rain potential of these airborne streams beforethey get away. For another thing, it has been suggested that precipitating moisture out ofclouds at earlier stages of storm development might speed up the hydrologic cycle and establisha new rainfall regime. This would mean more use and reuse of air-borne moisture.
But even if rainmaking could not increase the net amount of moisture on the ground, it might yetaffect the distribution of this moisture in such a way as to produce tremendous economic benefits.
DOES IT REALLY WORK? That is the question farmers ask. Scientists reply that it doesin certain circumstances.
Seeding with dry ice and water admittedly has modified clouds and has producedprecipitation. Silver iodide can do the same.
But scientists disagree as to whether the more economic method of seeding clouds bymeans of ground generators produced, or can produce, the substantial increases in rain andsnowfall claimed by the private “cloud-seeders”.
The problem of evaluation is inherent in the ground–generator method. Seeding with dryice or water, the operator can usually turn around and see the results. The seeded clouds oftenchange from and precipitation falls before his eyes. But when he releases silver iodide from agenerator he cannot see the material. Does the generator produce the right–sized crystals? Dothey get into the storm clouds in the right quantities at the right altitude? Does the silveriodide retain its effectiveness or does it decay because of temperature, pressure, or exposure toultraviolet rays. There can be many a slip between the cup and the lip.
The fact that he seeds during storm situations, usually when at least some rain fall naturally,makes visual observation impossible in most cases and makes measurement of any manmadeincrease extremely complicated.
And so, instead of seeing the cause and effect, he has to guess. And he has to attempt a measurementof the manmade increase by means of statistical evaluation. He has to compare the “target area”rainfall with rainfall of past years or, more commonly, with rainfall received in adjacent areas.
Statistical analyses – usually provided by the cloud–seeder himself and imperfectlyunderstood by the layman – can often show spectacular and convincing results. But sometimesfigures the statistical people can bury good results in a pile of figures. Thus, there is controversy.

302 Energy ManagementWater Management302
The analyses themselves get complicated, but the problem of analysis can be stated quite simply.
When the target area gets more rain than outside areas, say three control areas labeled “A”“B” and “C,” the cloud-seeder usually satisfies his clients. Yet the center of a storm may havepassed over the target area to produce the result naturally and the cloud-seeder may have donenothing.
When the target area gets more rain than A and B, but less than C, the clients may nurse asmall doubt or two. And when the target area gets less than A, B, and C — then they becomeskeptics. Yet in both cases the cloud-seeder may have increased rainfall on the target area overthe amount, which would have fallen naturally.
Rainfall results in the target areas usually fall within the realm of historical variation. Wecan always suspect therefore, that increases are only accidental. If we only knew how muchrain would have fallen naturally, we can never know and we have to satisfy ourselves with astatistical substitute.
A study of an entire river basin in the United States, based on physical assumptionsconsiderably more modest than some cloud-seeders have asserted, showed a benefit — costratio of 20 to 1. Obviously experiments in certain areas—possibly mountain areas where airmovements showed into the clouds and where temperatures should be more favorable—theseshould show a higher benefit — cost ratio. Experiments in some areas should prove to be morenearly marginal.
Experiments in the United States have attracted a great deal of interest in foreign countries.At least 26 countries, on every continent except Antarctica, have carried out experiments inrecent years.
Farmers in South Africa have used rockets to disperse silver iodide at high altitudes, thepurpose being to reduce hail damage. Farmers in the Bayonne region of France have usedground generators for the same purpose. The theory of hail prevention is that, by precipitatingout moisture at earlier stages, cloud seeding can prevent large hail–producing storms fromdeveloping. The same theory applies to lightning prevention and thus has interest for fightingforest fires. Some cloud-seeders in the United States like hail–prevention projects becausewhile farmers do not always want more rain they almost always want to prevent hail if theycan. Thus such projects sometimes get a steadier financial support.
Formosa and Sweden have undertaken projects to increase hydroelectric power. Ownersof sugar plantations is Cuba have financed rain–increasing projects despite an average of morethan 1200 mm inches of rainfall a year. Additional rainfall means additional sugarcane forthem.
Much of the work in foreign countries has been of high caliber. But it still has not suppliedthe answers.
Analysis of experiments will produce some answer helpful to farmers and other waterusers in deciding whether weather control activities are a good bet or not. But the real andpositive answers will come from further research into rainfall processes. The sky is wild,

303Energy Management Creation of Sweet Water 303
unpredictable laboratory; research in weather is difficult and often frustrating. All the same,science moves inexorably onward, learning more and more about the possibilities for modifyingor controlling weather.
Perhaps these possibilities will narrow down to certain limited applications. It is conceivable,though, that weather control can become a regular feature of crop production.
Russian Air Force used this technique on 9th May 2005, to prevent rain on Moscow citycelebrating freedom festival. A group of eleven planes of Air Force of Russia flying at a high3000m – 8000m spray silver iodie, liquid nitrogen and dry ice in air at 50 to 150 km away fromMoscow city. Due to this spray rainfall before the cloud reach to Moscow city. The event wasvery important, as leaders from 53 countries were present in this celebration.
13.2 REVERSE OSMOSISThe acute shortage of water in future will be at such a level that the man has to turn to fetchwhatever the water is available on the earth. The only alternative left out in the use of seawater,which is highly salty. It is strong belief that in future due to the scarcity of the sweet water, thesea water available in plenty will definitely survive the living being on the earth. The seawaterwill be used as a supplement to the available sweet water.
The seawater can be converted into sweet water by the following modern technologicalprocesses.
(1) Distillation• Multistage flash distillation (MSF)• Cold distillation• Vapour compression and MSF
(2) Reverse Osmosis
All these processes are very expensive and distillation and demineralization is more expensivethan Reverse Osmosis process. To survive in future, the treatment cost will not be the criteriabut the most importance is to have the availability of water
As in future, looking to the increased use of the seawater, the technocrats have developedand still working for technologies development of seawater treatments. Amongst the seawatertreatment processes, the Reverse Osmosis process is being used extensively because of itsreliable results and less costlier as compared with the other seawater desalination processes.
General Aspects of Pretreatment
Feed water pretreatment is probably the most important factor in contributing to successfulRO plant operation. Pretreatment system is designed for a particular feed water. The extenttype of treatment depends on the feed water quality and quantity, membrane type andconfiguration. There is no universal method of pretreatment which can cover all situations.Pretreatment should ensure removal of suspended and dissolved materials such as organic andinorganic particles, iron, manganese and other undesirable constituents.

304 Energy ManagementWater Management304
The treatment is usually conventional. Coagulation and flocculation, filtration, finemesh cartridge filter are very commonly used. Inhibitors or pH control is used to preventscaling and reduce the rate of Fe++ oxidation. Sulphuric or hydrochloric acid is used forpH adjustment.
Chlorination is also done. In case of polyamide membrane, chlorination is followed bydechlorination.
So it is absolutely essential that the feed water be thoroughly analyzed before setting up ofthe RO plant.
The major pretreatment requirement for any reverse osmosis device is to prevent themembrane to ‘fouling’. The phenomenon of fouling is complex and is complicated which involvesthe trapping of some type of material within the reverse osmosis device itself or on the surfaceof the membrane.
Since the causes, symptoms and cure are different; following five potential problems shouldbe considered before designing the pretreatment units.
(1) Membrane scaling(2) Metal oxide precipitation
(3) Device plugging(4) Colloidal fouling(5) Biological growth inside device
Principles of Reverse Osmosis
The reverse osmosis process can be described by considering the normal osmosis process. Theclassical demonstration of osmosis involves fixed quantities of two solutions of differentconcentration separated by a semi-permeable membrane, which is permeable to the solvent(water) and impermeable to the solute (dissolved salts). The more concentrated solution iscontained in a closed vessel, which is fitted with a pressure gauge. The less concentratedsolution; generally pure water is contained in a vessel open to the atmosphere. At zero time,the levels of the two liquids are equal. As time passes, the levels of the pure water falls at adecreasing rate while that in the closed vessel rises correspondingly, thereby increasing thepressure of the gauge. The flow of solvent from lower concentration to higher concentrationceases when the concentration of the solvent is equal on both sides of the membrane. At suchan equilibrium stage, the hydrostatic head developed is referred to as the “OSMOTICPRESSURE”, or the difference in the osmotic pressure between the two solutions.
If a pressure in excess of the osmotic pressure is now applied of the more concentratedsolution chamber, pure solvent is caused to flow from this chamber to the pure solvent side ofthe membrane, leaving a more concentrated solution behind. This phenomenon is the basis ofthe reverse osmosis process. The figure shows the principles of reverse osmosis (Figs 13.1,13.2 and 13.3).

305Energy Management Creation of Sweet Water 305
Fig. 13.1 Principle of osmosis.
Fig. 13.2 Osmotic pressure.
Fig. 13.3 Osmosis reverse.
Operation of Reverse Osmosis System
Reverse osmosis employs a semi-permeable membrane and a pressure driven mechanism todrive fresh water to one side of the cell, while concentrating salts on the input or rejection sideof the cell in this process, fresh water is literally squeezed out of the feed water solution.
Fig. 13.4 shows the simplest arrangement of a reverse osmosis system consisting of highpressure pump to pressurize the feed water, a membrane element, a pressure vessel to housethe membrane element, and regulating valve to control the flow and pressure. Normally a
M e m b ra ne
OSMOSISW h e n flu id s o f d iffe re n t c o n c e ntra tio n s ina v e s s e l a re se p a ra te d b y a m e m b ran e , the d ilu te s o lu tio n w il l f lo w th ro ug h th e m e m b ran e in to th e c o nc e n tra te d s o lu tio n .
F re s h w a te r S e a w a ter
OSMOTIC PRESSURET h e le v e l o f th e d ilu te s o lu tio n d ro ps an dth e le v e l o f th e c o n c e ntra te d s o lu tio n r is e su n til a n " e qu i lib r iu m " is rea ch e d . T h e p re s s u re d iffe re n c e b e tw e e n the s e tw o le v e ls is th e " o sm o tic p re ss u re" .
Fres h w ate r
M em brane
Seaw a ter
O smo tic
P ressu re
3 5 0 P S I
P ressure
REVERSE OSMOSISIf a pressure in excess of the osmoticpressure is applied to the concentratedsolution, the flow is reversed from the concentrated so lu tion to the d ilu tedsolution. Th is is "reverse osm osis".
Fres h w ate r
M em brane
Sea w ater

306 Energy ManagementWater Management306
reverse osmosis system is employed with some pre-treatment and post treatment. The pre-treatment is required to remove suspended solids, colloids, metals, etc. to avoid fouling andchoking of the membrane surface which otherwise reduces the water flux. Post-treatmentusually consists of pH-adjustment and chlorination or depends upon end–product reuse.
Most reverse osmosis systems in use today employ semi–permeable “asymmetric membranes”made from cellulose acetate or polyamide, or “composite membranes” made with a dense thinpolymer coating on a sulfone support film. The dense rejecting skin of the composite membranescan be up to 10 times thinner than the skin of the cellulose acetate membranes.
The rejection of the dissolved species depends not only on the size of the rejected species,but also on the chemistry of the membrane and the rejected species. The rejection of lowmolecular mass is generally low with the asymmetric cellulose acetate and polyamide membraneswhile with composite membranes; moderate to good rejections can be obtained with manyintermediate and even low molecular mass organics.
The percent rejections tend to be constant over a wide range of concentrations while onlythe applied pressure will have to be varied. The concentration in the water passing throughthe membrane will be proportional to the concentration retained. The higher the fraction offeed which passes the membrane, that is, the higher the “recovery” of water, the higher will bethe concentration in the product water. The retained water is often termed the “concentrate”and the product water the “permeate”.
Fig. 13.4 Flow diagram of reverse osmosis system.
Membrane for Reverse Osmosis
The selection of polymers for reverse osmosis membranes is a formidable task. For selection ofeach membrane material, the parameters as method of preparation, molecular weight distribution,and pre–treatment will decidedly influence the final properties of the membrane. Since, the goalis a membrane that will ensure good, reliable performance in a commercial permeator, a specificpolymer type must be selected and its production must be undertaken on a commercial scale.
Performance Criteria for Reverse Osmosis Membranes
(1) Hydrophilic membrane, which selects water molecules over ions (governs the numberof pressurized stages needed to produce potable water).
(2) Good salt rejection ability.
P R E - TR E AT M E N T
H IG HP R E SS U R E
P U M P
M EM B R A NEA S S E M B LY FR E S H
WATE R
P O ST.TR E AT M E N T
B R IN ED IS C H A RG E
S A L IN EFE E D W ATE R
S TA B ILIZE DFR E S H W AT E R

307Energy Management Creation of Sweet Water 307
(3) Permeation rate of water per unit pressure gradient which determines the size ofequipment per unit production rate of potable water.
(4) Membrane durability which determines the replacement rate of membrane.(5) Capability of being fabricated with high surface to volume ratio (hollow fibers, thin films).(6) Wide operating range
: (a) Ion content of water source. : (b) Pressure : (c) Temperature : (d) Operating pH – range
(7) Resistance to chemical agents, heat and biological attack.(8) Low cost.(9) Versability to fit different requirements.
Indeed a large variety of membranes have been developed. The different membranesavailable are:
(1) Cellulose acetate membranes.(2) Polyamide membranes.(3) Thin film composite membranes.(4) Dynamic membranes.
Table 13.1 Comparison of different membrane modules
Characteristics Plate and Tubular Module Spiral Wound Hollow FineFrame Module Module Fibre
Packing density 50 (Low) 100 (Low) 300 (High) 5000 (Highest)(sqft/cuft)
Suspended High High Fair Poorsolids tolerance
Pretreatment Flexible in Flexible in Extensive Morepretreatment pretreatment pretreatment is extensive
required. pretreatment
Cost Very expensive High capital Low Cost is lowerat large scale cost due to low manufacturing than alloperations packing density cost.
Cleaning of Easy cleaning Very good in Easy cleaning, Difficultmembrane cleaning by chemically cleaning due to
mechanical and and very small spacinghydraulic means. hydraulically. between fibers.
Assembly and Appreciable Difficult to Factory Skilledreplacement manual labour handle large assembly and assembly
is required for number of easy field required.membrane tubes and lack replacement.assembly and of membranereplacement replacement
technology.

308 Energy ManagementWater Management308
13.3 R.O. PLANT AT THERMAL POWER STATION AT SIKKA, GUJARAT, INDIAA case study for large Reverse Osmosis Plant Thermal Power Station at Sikka, Jamnagar isselected to study the Reverse Osmosis plant. Thermal power station having the total waterrequirement of 30,00,000 litres/day for its boiler feed water and service water for its plant andhousing colony. The housing colony is having a population of 3100 and the domestic waterrequirement is 10,00,000 liters of this total demand only 16,00,000 litres/day (Av.) waterquantity is available from nearby Sasoi dam. In water scarcity because of the scarce rainfall insome of the years, the Sasoi dam water storage was not adequate. An available groundwater isalso saline like the sea water because of near by location of Arabian sea. This shows theinadequacy of the groundwater hence an alternative was the use of sea water which is availableadjacent to the Thermal power station.
The seawater is diverted through an excavated channel and further treated by the ReverseOsmosis process. In the Reverse Osmosis process limiting parameters to the Reverse Osmosisfeed water are as follows for spiral modules (Table 13.2).
Table 13.2 Limiting parameters
Parameters Limitations
Turbidity Less than 1 NTU
Free chlorine Nil
Iron, manganese Less than 0.05 ppm
Bacteria and organics Nil
Oil and grease Nil
Temperature Less than 45° C
Silting index Less than 4.0
pH 3 to 10
Table 13.3 Analysis of Arabian sea water sample
Parameters Results
TDS, ppm 38,926
Turbidity, NTU 30
pH 8.2
P-Alkalinity as CaCO3, ppm NIL
MO-Alkalinity as CaCO3, ppm 116
Chloride as chloride ppm 21,500
Chloride as CaCO3, ppm 30,315
Total hardness as CaCO3, ppm 6800
Calcium hardness as CaCO3, ppm 1050
Magnesium hardness as CaCO3, ppm 5750
Sulphate as sulphate, ppm 3000Contd.

309Energy Management Creation of Sweet Water 309
Parameters Results
Sulphate as CaCO3, ppm 3120
Silica (dissolved) as SiO2, ppm 1.2
Corrected conductivity at 25°C µmhos/cm 61800
Residual chlorine, ppm —
Free CO2 as CO
3 ppm 15
Free CO2 as CaCO
3, ppm 17
It clearly seems from the above two tables (Table 13.2 & 13.3) of requirement of ReverseOsmosis feed water and sea water analysis, that extensive pretreatment before the actual ReverseOsmosis process is very essential. The pretreatment comprises of coagulation, sedimentation,filtration, chlorination and dechlorination. The pretreatment or unit operation is a costly processbut is a must for running Reverse Osmosis process very smoothly. If the cost of the totalReverse Osmosis process is say 10 Rs. / lit, the approximately 7 Rs. / lit is the unit operationcost and rest 3 Rs. / lit is the cost Reverse Osmosis process. As a total solid contains of theseawater is very high (38,000 – 42,000 ppm) a very high pressure (60 – 65 Kg / sqm) isrequired to have the reliable results of the Reverse Osmosis effluents.
As per the requirement of the Reverse Osmosis feed water, the primary treatment to theSea water is given by
(1) Chlorination followed by coagulation and flocculation with FeSO4, cation polyelectrolyteand recirculation of settled sludge.
(2) Sedimentation and filtration.(3) Activated carbon filter.(4) Micron cartridge filter.
The post-treatment degasification by degassifier.
Following are the pretreatment units
(1) Flash mixer.(2) Sludge blanket type clariflocculator with sludge recirculation system.(3) Rapid gravity dual media filter.(4) Sludge collection sump and disposal system.(5) Activated carbon filter (ACF).(6) Chemical dosing system.(7) Micron cartridge filter (MCF).
Reverse Osmosis Process
High pressure pump: High pressure pump is used to feed the filtered and pretreated water tothe reverse osmosis unit at high pressure. This is horizontal multistage centrifugal pump madeof S.S. provided with a butterfly valve at the suction and check and globe valve at the discharge.The electric motor drive of the pump is coupled with an energy recovery turbine at the back.

310 Energy ManagementWater Management310
The high pressure pump is provided with suction and discharge pressure gauges to indicaterespective pressure and pressure switches at the suction and discharge of pumps to preventthe pump from operating in the event of low suction or high discharge pressure. There areresidual chlorine analyzer, pH meter, temperature indicator in common suction header whiletemperature indicator and high pressure switch at common discharge header.
Data:
Nos. : 3 working + 1 standby.Capacity (cu.m/hr) : 215Head (kg./sq.cm) : 64.35Liquid to be handled : Filtered Sea WaterType : Multistage Centrifugal Horizontal.
Motor:
Nos. : FourkW / rpm : 600 / 2975Supply Voltage : 6600 V, 3 Phase 50 Hz
Energy recovery turbine (ERT): This system is provided to take advantage of highpressureenergy of high-pressure pumps. The highly pressurized rejected water is fed into reverse pumptype turbine which in turn produces rotation power output used to assist main electric motorin driving the high pressure pump thus saving a very considerable proportion of power todrive the pump.
This system is directly coupled with motor shaft. Reverse Osmosis rejected water is fed toit. It is provided with actuated globe valves at suction and globe valve at discharge. The dischargewater is sent to reject storage tank.
Data:
Nos. : 3 working + 1 standby.Material of construction : DUPLEX – SSCapacity (cu.mt/hr) : 135Inlet pressure (psig) (min./max.) : 850/900Liquid to be handled : RO Reject Water.
Reverse osmosis unit: RO unit is provided to reduce dissolved solids from the RO feed waterand to get the purified water (permeate water). The permeate water is then passed throughdegassifier. The reject water is then passed through the energy recovery turbine to save theconsiderable amount of electric power.
RO feed water, under high pressure, enters into pressure tubes of the RO unit whichpasses through the RO membrane elements. The permeate travels through the header whereasthe concentrated reject water, which contains very high dissolved solids passes through EnergyRecovery Turbine (ERT) and then collected in reject water storage tank. The reject water isused for backwash of Activated Carbon Filter (ACF) and Rapid Sand Filter (RSF).

311Energy Management Creation of Sweet Water 311
The Reverse Osmosis Unit consists of three stream (A,B & C). Each stream consists offour sub-streams of six pressure tubes each in single pass array. Each pressure tube containssix membranes elements which are interconnected inside the pressure tubes with help of “O”rings placed in the interconnectors.
Fig. 13.5 RO Unit at thermal power station.
Data:
No. of stream : Three (RO – A / B & C)No. of substream : Four (RO – A / B / C – 1/2/3/4)No. of pressure tubes : Six/SubstreamMembrane type : 8040 HYS SWCINo. of membrane element : Six/Pressure TubeTotal no of pressure tube : 72Total no of membrane element : 432Length and size of pressure tube : 12.4mFlow array : Single passMax. feed flow (cu.mt/hr) : 53.7Operating pressure (kg/sq.cm) : 64.35Max. permeate flow (cu.mt/hr) : 15.3
Degasser tower (DGT): Degasser tower is an atmospheric tower provided for removalof residual gases like carbon dioxide. It is made from mild steel rubber lined (MSR/L)internally and provided with polypropylene pall rings supported on MSR/L coated tray.To distributes the incoming water from the top header the lateral type of distributionsystem is provided.
The bottom tray distributes the draft of low-pressure air from the blower from top andgoing upwards. Packing is provided to increase the surface area by breaking the water.

312 Energy ManagementWater Management312
Data:Nos. : TwoDiameter (mm) : 1400Height (mm) : 3000Material of construction : MSR / LType of packing : Polypropylene pall rings
Degasser air blower: Degasser air blower is provided for blowing the air the bottom of degassertower and carbon dioxide from permeate water is removed by this blown up air.
Data:Nos. : Two + Two standbyType : CentrifugalCapacity (cu.m/min) : 46.2Head (mm WC) : 50
Motor:Nos. : FourkW / rpm : 1.5 / 1400Supply voltage : 3 Phase. 415 V AC, 50 Hz
Caustic soda (NaOH) dosing system: Caustic soda (NaOH) may be dosed in the permeatewater after degasification to increase the pH of water to make it suitable for further use.Sometimes it may happen that pH of the RO feed water is acidic and hence the permeate wateris also having low pH value. This low pH value water is not suitable for further domestic,drinking or other use and hence if the permeate water is having low pH value then onlycaustic dosing system is need based applicable.
Permeate storage tank (PRST): Permeate storage tank is provided with an inlet for degassedwater, outlet leading to overflow, drain connections and level indicating transmitter, permeatetransfer pump suction, permeate flushing pump suction.
To pump the degassed water from permeate storage tank permeate transfer pump is providedwith pressure gauge and non – return valve at the discharge line.
Data:Nos. : OneMaterial of construction : MSR / LDiameter (mm) : 3600Length on straight (mm) : 5000Liquid to be handled : Degassed permeate water
Pump:Nos. : Two + One standbyType : Horizontal centrifugalCapacity (cum / hr) : 93Liquid to be handled : Degassed permeate water

313Energy Management Creation of Sweet Water 313
Motor:Nos. : ThreekW / rpm : 7.5 / 2915Supply voltage : 3 phase, 415 V Ac, 50 Hz
Reject water storage tank (RJST): Reject water storage tank is provided to store the reverseosmosis rejected water which can be used for back washing of activated carbon filters andrapid gravity dual medial filter by operating the rejected water transfer pumps.
Data:RJST
Nos. : OneDimensions (mm) : 12500 × 8000 × 2500 LWDMaterial of construction : RCC
Pump:Nos. : Two + Two standbyType : Vertical turbineCapacity (cum / hr) : 265Liquid to be handled : Rejected water
Motor:Nos. : FourkW / rpm : 30 / 1500Supply voltage : 3 Phase, 415 V Ac, 50 Hz
Cleaning system: To remove foulants from the RO membrane element and to fill up thepressure tubes with disinfectant solution, cleaning system is provided. Cleaning system comprisesthe following.
(1) Cleaning solution tank (CST)(2) Cleaning solution pump.(3) Micron cartridge filter.
(1) Cleaning solution tank: Cleaning solution tank is provided with high-speed mixer, gaugeglass type indicator, overflow and drain piping.
Data:
Nos. : OneMaterial of construction : MSR / LDiameter (mm) : 1600Depth (mm) : 2600Liquid to be handled : Cleaning solution
Agitator:Nos. : OneType : Top mounted three blade propeller type.

314 Energy ManagementWater Management314
Motor:Nos. : One
kW / rpm : 1.50 / 925
Supply voltage : 3 Phase, 415 V Ac, 50 Hz
(2) Cleaning solution pump: Pump is provided to recirculate cleaning solution from the tankto the micron cartridge filters to reverse osmosis elements and back to the tank. Pump iscomplete with suction discharge valves and piping and pressure gauge.
Data:Nos. : One + One standby
Type : Horizontal centrifugal
Capacity (cu.m/hr) : 55
Head (kg/sq.cm) : 3.0
Liquid to be handled : Cleaning solution
Motor:Nos. : Two
kW / rpm : 15 / 1470
Supply voltage : 3 Phase, 415 V Ac, 50 Hz
(3) Micron cartridge filter: The micron cartridge filter is provided for removing the suspendedparticles from the cleaning solution upstream of the Reverse Osmosis unit during cleaning Solutionapplication. The filter cartridge must be replaced when differential pressure across the cartridgefilters approaches 1 kg /sqcm or when the flow rate reduces, which ever occurs earlier.
Data:Nos. : One + One Standby
Material of construction : MSR / L
Diameter (mm) : 400
Height on straight (mm) : 1150
Filtration size (micron) : 10
Nos. of element in each : 14
Operating Consideration for RO
Observe the following general operating points in day use of RO system.
1. Check the RO flow adjustment at least once in every shift and readjust if needed.
2. Check the chemical dosing and readjust if required.
3. SHMP dosing is very important to inhibit the formation of scale within the ROmembrane element so analyze the brine sample and adjust the dosing accordingly.

315Energy Management Creation of Sweet Water 315
4. For solving any operational problem during normal use maintain the log sheetaccurately.
5. Regular visual inspection, repairs of any leaks, cleaning and touch of painting shouldbe done for preventive maintenance.
6. Do not operate RO system at reduced capacity.
Change in Parameters After RO Process
After Reverse Osmosis process significant changes found in the following parameters.
Table 13.4 Effect of RO process on different parameters
Percentagereduction
TDS, ppm 38,972 457 98.82
Chloride as chloride, ppm 21,550 264 98.77
MO – Alkalinity as CaCO3, ppm 96 6 93.61
Total hardness as CaCO3, ppm 6800 12 99.82
Calcium hardness as CaCO3, ppm 1050 2 99.80
Sulphate as SO4, ppm 3000 10 99.66
Silica (dissolved) as SiO2, ppm 1.2 0.2 83.33
Conductivity (corrected) at 25° C µmhos/cm 61,950 725 98.88
Free CO2 as CO
2, ppm 12.32 2.65 78.49
13.4 LOW TEMPERATURE THERMAL DESALINATION (LTTD) PLANT
The temperature difference which exists between the surface layer (28~30°C) and deepsea layer (7~15°C) of the ocean could be effectively utilized to produce potable waterapart from power generation, air conditioning and aquaculture. This technology is knownas Low Temperature Thermal Desalination. In Low Temperature Thermal Desalination,relatively warm water is flashed inside a vacuum flash chamber and the resultant vapouris condensed in a condenser using cold water. This technology has been utilized in thefirst ever-low temperature thermal desalination plant, which has been commissioned atKavaratti.
The plant is housed in a structure on the shore. The bathymetry at the island is suchthat 400m water depth is available around 400m from the shore. Due to this specialfeature a long pipe about 600m long to draw cold water has been deployed with one endat about 350m water depth. Refer Fig. 13.6 for lay out and Fig. 13.7 for conceptual cross-section.
Parameters Before After

316 Energy ManagementWater Management316
Fig. 13.6 Lay out of LTTD plant at Kavaratti.
Locat ion :Capacity :
W arm Water Tem pe rature :Cold Water Tem perature :
Cold Water Intake :
Kav aratti1,00 ,0 00 liters/day28 °C13 °C35 0m d epth
1. Flash Cha m ber2. Conde nse r3. Tre st le4. Sea W ater Sum p5. Ou tput Fres h W ate r
W arm Water Intak eW arm Water O utlet
Cold Water IntakeCold Water O utlet
Fig. 13.7 Conceptual cross-section of LTTD plant.
Though the concept was known for a long time, due to practical difficulties, it was never attempted.
This approach of providing water is extremely useful for islands like Kavaratti where thereis no other source of fresh water and the environment is extremely fragile.
Features of LTTD Plant
• Doesn’t require pre-treatment of feed water.
• Assured consistent quality water as per BIS/WHO standards
• Operational simplicity and easy maintenance
• No environmental (chemical or thermal) pollution
• Highly nutrient cold water enhances marine life
FLASH C HAMB ER
WAT ER VA POU R
DE NISTE R
WAR M W ATE RPU MP
DISC HARG E
PU MP
SH ELL & TUBECON DEN SER
FR ESH
WAT ER PU MP
VA CUUMPU MP
COL D WAT ER
PU MP
FR ESH WATER COL D WAT ER

317Energy Management Creation of Sweet Water 317
This opens a new vista for setting up much larger barge mounted desalination plants toaddress our ever-increasing need for potable water.
Floating Desalination Plant
• The Fresh water produced is of very good quality.• The production rate was 1 lakh litres per day and the plant was continuously run for
10 days.• The deepest single point mooring (400m depth) in India was achieved.• All cold water pipe and mooring components were recovered safely at the end of the
experiment.• Currently floating plant of 5 to 10 MLD capacity is being designed for main land
requirement.• Such larger rating barge mounted plants are expected to produce water at costs less
than 9 paise/litre.
13.5 AFFORDABLE DESALINATIONThe affordable desalination small structure erected on a tiny house of Kerala coastal bed yieldingpotable water having TDS 109 ppm from air moisture. This portable light weight plant issimple, low cost and window like structure made from aluminium and glass.
Each panel costs around Rs. 600. On a good sunny day, it can produce two litres of potablewater. Most of the wells on the coastal belt yield saline water due to upcoming. Fresh wateravailability in coastal belts is rapidly declining. The shallow fresh water aquifers are replacedby saline water (Terry Thomas, 2005).
The Apparatus
The present model occupies an area of about 0.7 square meters. Major parts are of aluminum.It has two frames. The upper frame fitted with a glass, rests above the lower base with the helpof hinges. Lower frame, made of aluminum sheet has thermocol insulation. Fine sand is spreadabove the aluminum sheet. Row water enters the system through low-head distribution pipesand soaks the sand layer to its field capacity. The upper glass frame, like a windowpane, fitscorrectly on the lower base. Using a few ‘C’ clamps, it is made airtight.
Solar Distillation
Sunlight falling through the glass panel heats up the sand. Water slowly evaporates and thevapour condenses on the inner side of the glass sheet.
The still is kept at an angle such that, the condensed vapour slowly flows out of the outletof the still. This is then transferred to a utensil through a pipe.
10 Litres a Day
After a thorough survey, it was found out that an average family could manage their drinkingand cooking needs with 10 liters of water per day. Five panels would be required to provide

318 Energy ManagementWater Management318
this much of water. The cost would be around Rs. 3000. According to Planet Kerala worksmen,these stills can be made out of locally available materials by any person with some basicfabrication aptitude. Once installed, there is no recurring or maintenance cost. Rewashing ofdeposited salt and maintenance is very simple and easy. For the cloudy days in monsoon aguiding angle made of alummium at the lower side of the glass panel is provided for catching rain.
It is time for the government and NGOs to adopt such system for pilot studies. A couple ofstills can be installed in houses where family members can take interest and observe the resultscarefully. Subsequently, amendments improvements can be made in the panels after obtainingthe vital feedback.
13.6 NET IS USED TO CAPTIVE WATERThere are used various kind of techniques used to save and also collect the water. In this casemany countries in the universe carried on their experiment till now. Through the experimenta scientist of Chillie has found out a process that is cheap and as easy as ABC.
This process helps to convert vapour into water with the use of this process, scientistsPilar Serecidany has the ability to collect the water if it is not raining. In the epicenter of thisprocess he has used net which is as like as volley-ball net, when the air which is fall of vapourare passing through the net then the vapour which is attached with the net, and then thevapour converted into little bit of water that trickles into a half-rounded pipe. A thin pipe alsoattached with this pipe is connected with a water tank that is situated in a village, which is farfrom the place. The net is made with polypropylene or plastic. The net is 12 metres long andwhose height is 4 metres. This net is used in Chellie’s water collecting process. Generally thesenets are spread in mountainous valleys. When the air, which is fall of vapour, is passing throughthe net then each drop of water becomes as precious as gold. At Chungungo Chillie’s forestdepartment with the use of 75 nets collects 10000-litre water everyday. This process is sosimple, easy and effective. To fulfill their thirst the villagers fetched the water from so kilometersfar away, with the use of this technique now Chungungo is looked like as green as grass. Thisprocess is easy, simple which does not need extra researches on it. According to scientists toconvert salted water to normal drinking water this process is better than other expensiveprocesses. In the deserted area, this process is worth. Coming through the successive waywith the use of this technique at Chango sercidae claimed that this process has the ability toprevent the scarcity of water in India and other countries in the world.

Abu Sharekh M S (2002) Rainwater roof catchment systems for household water supply inthe West Bank, Hydrology Journal, 25 (4), December, pp 31- 40. Indian Association ofHydrologists, Roorkee, India.
Adams B (1980) Saline intrusion — A brief literature study, Report No. WD/ST/8D/1, BritishGeological Survey, Wallingford.
Agarwal A (2000) Drough? Try capturing the rain, an occasional paper from the Centre forScience and Environment, New Delhi, India. pp 1-16.
Allan J A & Karshenas M (1996) Managing environmental capital: The Case of Water inIsrael, Jordan, the West Bank and Gaza, 1947 to 1995, in Allan, J.A. & Court, J.H. (Eds.) 1996.Water, Peace and the Middle East: Negotiating Resources in the Jordan Basin. I.B. TaurusPublishers: London
Allan J A & Mallat C (1995) Water in the Middle East: Legal, Political and CommercialImplications, London: British Academy Press.
Allan J A & Radwan L (undated) Perceptions of the Values of Water and Water Environments. Proceedingsof the 4th European Seminar on Water Geography. London: Middlesex University and SOAS.
Allan J A (1994) Overall perspectives in countries and regions, in Rogers, P. & Lydon, P.(Eds.). 1994. Water in the Arab World: Perspectives and Progress. Harvard University Press:Cambridge.
Allan J A (1996) Water use and development in arid regions: Environment, EconomicDevelopment and Water Resource Politics and Policy, in Water Use and Development, Vol. 5,No. 2; 107-115.
Allan J A (1998) ‘Virtual water’: An essential element in stabilizing the political economies ofthe Middle East. Yale University Forestry & Environmental Studies Bulletin, No. 103; 141-149.
Allan J A (1998) Virtual water: A strategic resource global solutions to regional deficits. InGroundwater, Vol. 36, No. 4 ;545-546.
Allan J A (1998) Why value water? Some perspectives on the political economy of water and theenvironment in the mediterranean region. In Ferragina, E. (Ed.) 1998. L’Aqui nei paesi Mediterranei.Proceedings of the International Convention held in Naples on 4-5 December 1997.
Allan J A (1999) Avoiding war over natural resources. In Fleming, S. (Ed.) War and Water.Geneva: ICRC Publication Division.
REFERENCES

320 Energy ManagementWater Management320
Allan J A (1999) Global systems ameliorate local droughts: Water, Food and Trade. Paper presentedat the Exploratory Workshop on Drought and Drought Mitigation in Europe, 1-3 March 1999,Space Applications Institute, European Commission, DG Joint Research Centre.
Allan J A (1992) Substitutes for water are being found in the Middle East and North Africa, inGeoJournal, Vol. 28, No. 3: 375-385.
Andrews R W (1981) Salt-water intrusion in the Costa de Hermisillo, Mexico: A numericalanalysis of water management proposals. Groundwater, 19(6), 635-647.
Apello C and Geirnaert W (1991) Processes accompanying the intrusion of salt water. InHydrogeology of Salt Water Intrusion, Vol. 11, W. De Breueck, (Ed.), International Associationof Hydrogeologists, Hannover, pp. 291-303.
Arceivala S J (1969) Reuse of water in tall building, Report on pilot study and design. AICPollution Control Division, Bombay, India.
Arora C L and Rose R N (1981) Demarcation of fresh- and saline-water zones using electricalmethods (Abohar area, Ferozepur district, Punjab). Journal of Hydrology, 49, 75-86.
Asano T et al (1996) Evaluation of the California wastewater reclamation criteria using entericvirus monitoring data. Water Science and Technogy, 26, 7 – 8, 1523-24.
Ashton P and Haasbroek B (2000) Water demand management and social adaptive capacity: ASouth African Case Study. Forthcoming chapter in a book as yet untitled. Available in draftfrom the CSIR, Division of Water, Environment and Forestry Technology, P.O. Box 395, Pretoria0001, South Africa.
Athavale R N (2003) Water harvesting and sustainable supply in India, Centre forEnvironmental Education, Rawat Publication, Ahmedabad.
Athavale R N, Muralidharan D and Rangarajan R (1994) Borehole injection studies in DeccanTrap Basalts near Nagpur — Proceedings of the Second International Symposium on ‘ArtificialRecharge of Groundwater’, Ed. A. Ivan Johnson and R. David G. Pyne, pp.775-788.
Bobba A G (1993) Mathematical models for saltwater intrusion in coastal aquifers, WaterResources Management, 7, 3-37.
Bowen R (1986) Groundwater, 2nd ed., Elsevier Applied Science Publishers, London, 427 pp.
Central Groundwater Board (1992) Proceeding of Workshop on Artificial recharge ofgroundwater — Lowcost rainwater management for increasing irrigation and groundwaterrecharge, pp 131. New Delhi, India.
Central Groundwater Board (1994) Manual on artificial recharge on groundwater — technicalseries and No 3 pp. 215.
CGWB, Govt. of India (1993) — Proceedings of the workshop on “Artificial Recharge ofGroundwater in Basaltic and Sedimentary Rock Aquifers” held at Indore (M.P.), March, 1993.
Chow VT (1964) Handbook of Applied Hydrology, McGraw Hill, New York.
321Energy Management References 321
Cillie GG et al., (1967) Water pollution control federation, Washington DC, p 1-35, Proc.International Conference on Water Pollution.
Cooper H J et al., (1964) Seawater in coastal aquifers, US Geological Survey—Water- supplypaper 1613-C, USGS, pp. 84
Custodio E (1985) Saline intrusion. In: Hydrogeology in the Service of Man, IAHS PublicationNo. 154 Volume I, IAHS, Wallingford, pp. 65-90.
Das Gupta A (1983) Steady interface upconing beneath a coastal infiltration gallery.
Groundwater, 21 (4), 465-474.
Das Gupta A (1986) Simulated salt-water movement in the Nakhon Luang aquifer, Bangkok,Thailand. Water Resources Journal, 148, 35-44.
Das Gupta A and Siddique M (1981) Hydrodynamic response of Nakhon Luang Aquifer,Bangkok, Thailand. Groundwater, 19 (5), 469-475.
Das Gupta A and Yapa PNDD (1982) Saltwater encroachment in an aquifer: a case study.Water Resources Research, 18 (3), 546-556.
Dave K N (2004) An integral study of major SIP structures in Saurashtra region, a dissertationsubmitted for postgraduate degree at M S University of Baroda, India.
Drabbe J and Bandon-Ghyben W (1888-1889) Nota in verband met de voorgenomen putboringnajib Amsterdam. In: Tijdschrift van het Koninklijk Institute van Ingenieurs. The Hague,Netherlands, pp. 8-22.
Essaid H I (1986) A comparison of the coupled fresh water-salt water flow and the Ghyben-Herzberg sharp interface approaches to modeling of transient behaviour in coastal aquifersystems. Journal of Hydrology, 86, 169-193.
Flavin R J and Joseph J B (1983) The hydrogeology of the Lee valley and some effects ofartificial recharge- Q.J. Eng.Geol. London, 16,65-82.
Floyd L et al., (1994) Recharge Well Technology at the Water Campus Project, Scottsdale,Arizona, Proceedings of the Second International Symposium on Artificial Recharge ofGroundwater, Walt Disney World Swan, Florida, pp. 220.
Freeze R A and Cherry J A (1979) Groundwater, Prentice-Hall, Englewood Cliffs.
Geirnaert W and Laeven M P (1992) Composition and history of groundwater in the westernNile Delta. Journal of Hydrology, 138, 169-189.
Gerges N Z, Sibenaler and Armstrong D (1994) Experience in Injecting Storm Water intoAquifers to Enhance Irrigation Water Supplies in South Australia, Proceedings of the SecondInternational Symposium on Artificial Recharge of Groundwater, Walt Disney World Swan,Florida, pp. 436.
Goldenberg LC (1985) Decrease of hydraulic conductivity in sand at the interface betweenseawater and dilute clay suspensions. Journal of Hydrology, 78, 183-199.

322 Energy ManagementWater Management322
Goldenberg LC, Mandel S and Magaritz M (1986) Water-rock interaction at the mixing zonebetween chemically different bodies of groundwater - implications for management of sandyaquifers. Hydrological Sciences Journal, 31, 413-425.
Goldman MD. Gilad A. Ronen and A. Melloul (1991) Mapping of seawater intrusion into thecoastal aquifer of Israel by the time domain electromagnetic method. Geoexploration, 28, 153-174.
Gupta A B, Goyal Rohit and Dhotre S T (2006) Optimum design of Kund of rainwater harvesting— A case study of Churu, Rajasthan, 38th Annual Convention, IWWA, Jaipur, pp 223 – 227.
Headworth H and G Fox (1986) The South Downs Chalk aquifer: its development andmanagement. Journal of the Institute of Water Engineers and Scientists, 40, 345-361.
Hem J D (1970) Study and interpretation of the chemical characteristics of natural water,USGS Water Supply Paper 1473, USGS.
Henry H R (1960) Salt intrusion into coastal aquifers. In: IASH Publication No. 52 Commissionof Subterranean Waters, IASH, Wallingford, pp. 478-487.
Herzberg B (1901) Die Wasserversorgung einiger Nordseebader. Jour. Gasbeleuchtung andWasserversorgung, 44, 815-819, 842-844.
Hillel I Shuval (1977) Water Renovation and Reuse, Academic Press, New York.
Hubbert M K (1940) The theory of groundwater motion. Journal of Geology, 48, pp. 785- 944.
Huisman L and Olsthoorm T N (1983) Artificial Groundwater Recharge, Pitman AdvancedPublishing Program, Boston.
Huisman L and F W J Van Harren (1966) Treatment of water before infiltration and modificationof water quality during its passage underground — International Water Supply Association,Seventh Congress, Barcelona, 1966, pp.G1-26.
Idris H and Nour S (1990) Present groundwater status in Egypt and the environmental impacts.Environmental Geology and Water Science, 16 (3), 171-177.
International Association of Scientific Hydrology (1967), Artificial recharge and managementof aquifers, Symposium, Haifa Publication, No. 72.
Jacobson P J, Jacobson K M and Seeley M K (1995) Ephemeral Rivers and Their Catchments:Sustaining People and Development in Western Namibia. Windhoek: Desert Research Foundationof Namibia.
James B. Flanigan, Paul A. Sorensen and Melanie A. Tucker (1994) Use of HydrogeologicalData in Recharge Pond Design, Proceedings of the Second International Symposium on ArtificialRecharge of Groundwater, Walt Disney World Swan, Florida, pp. 139.
Jawad Al-Sulaimi and Akashi Asano ( 2000) Wastewater Reclamation and Reuse, New AgeInternational Pvt Ltd., New Delhi.

323Energy Management References 323
John M, Dickenson P E and Steven B Bachman (1994) The optimization of spreading groundoperations — Proceedings of Second International Seminar on ‘Artificial Recharge ofGroundwater’, Ed. A. Ivan Johnson and R. David G. Pyne, ASCE Publications.
Johnson A I and Pyne G (1994) Proceedings of Second International Symposium on Artificialrecharge of groundwater – II, ASCE Publication, New York.
K R Karanth and Srinivasa Prasad P (1979) Some studies on hydrologic parameters ofgroundwater recharge in Andhra Pradesh, J. Geological Society of India. Vol. 20 pp. 404-414.
Kadam R V and Kelkar V N (2001) Water reuse, Indian Water Works Association, Proceedings.of Water Crisis Management Seminar, pp. 39–52.
Kanitkar M A (2002) Critical study on reuse of wastewater, A dissertation submitted for Postgraduate degree at M S University of Baroda, India.
Karanth K R (1987) Groundwater Assessment Development and Management, Tata McGrawHill Publishing Co Pvt Ltd., New Delhi.
Karmakar S M (2006) Affordable desalination, Civil Engineering Today, ASCE – IS, Vol 3,pp 12,
Kashef A I (1971) On the management of groundwater in coastal aquifers. Groundwater, 21(2), 12-20.
Kashef A I (1977) Management and control of salt-water intrusion in coastal aquifers.Critical R/eviews in Environmental Control, 7, 217-275.
Kashef A I (1983) Salt-water intrusion in the Nile Delta, Groundwater, 21 (2), 160-167.
Kelkar U et al., (2005) Wastewater recycle and reuse — A need of the hour in India, IndianWater Works Association, Theme: Sustainability of water and wastewater system, 37th Annualconvention, Hyderabad, India.
Kulkarni S Y, Rosal R L (1990) Contribution of percolation tanks in recharge of groundwaterin Maharashtra state. All India Seminar on modern techniques of rain water harvestingconservation and artificial recharge, Pune.
Lichtenthäler G and Turton A R (1999) Water Demand Management, Natural ResourceReconstruction and Traditional Value Systems: A Case Study from Yemen. Paper presented in theWorkshop No. 4: Water and Social Stability of the 9th Stockholm. Water Symposium “UrbanStability through Integrated Water-Related Management”, hosted on 9-12 August by theStockholm Water Institute (SIWI) in Stockholm, Sweden. Also available as Occasional PaperNo. 14 from Website.
Lichtenthäler G (1996) Tribes and trends: changing perceptions of the value of water in Yemen.In Perceptions of the Value of Water and Water Environments. Proceedings of the EuropeanSeminar on Water Geography. 6-10 September 1996, London, SOAS, University of London.
Lichtenthäler G (1999) Water management and community participation in the Sa’dah Basin ofYemen: Politics, Perceptions and Perspectives. Preliminary Investigations for a World Bank Pilot Project.

324 Energy ManagementWater Management324
Lloyd J W, Howard K W F, Pacey N R and Tellam J H (1982) The value of iodide as a parameterin the chemical characterisation of groundwaters. Journal of Hydrology, 57, 247-265.
Mc Gauhey P H (1968) Engineering Management of Water Quality, P 1450. McGraw Hill Co.New York.
Metcalf and Eddy (1991) Wastewater Engineering, Treatment, Disposal and Reuse. 3rd edition,McGraw Hill, New York.
Michael O’ Shea (1994) Borehole recharge — a drought management strategy in N. London,UK, Proceedings of the Second International Symposium on Artificial Recharge of Groundwater,Walt Disney World Swan, Florida, pp. 210.
Mistry J F (1988) Important aspects of river valley projects, Vol. 1, Hydrology and WaterPlanning, Mahajan Book Distributors, Ahmedabad.
Modi P N (1990) Irrigation Water Resources and Waterpower Engineering, Standard Book HousePublication, Delhi, India.
Muralidharan (1997) Captive sustainable drinking water source well and wasteland developmentin hard rock areas – Proceedings of National Conference on “Emerging Trends in the Developmentof Sustainable Groundwater Sources”, August 27 & 28, 1997, J.N.T.U., Hyderabad.
Murlidharan D, Athavale R N (1998) Artificial recharge in India, Proceeding of Base Paper,NGRI, Hyderabad, India.
Nair C. (1991) Bangkok’s deteriorating groundwater. Waterlines, 9 (3), 21-23.
Nauras A S (2004) Spot solution in contaminated aquifer by artificial recharge — A case studyof Kanha project, Vadodara (Gujarat), A dissertation submitted for postgraduate degree at M SUniversity of Baroda.
Ohlsson L and Turton A R (1999) The turning of a screw: social resource scarcity as a bottleneckin adaptation to water scarcity. Proceedings of the 9th Stockholm Water Symposium. Availablein Draft from Website.
Ohlsson L (1999) Environment scarcity and conflict: a study of Malthusian concerns.
Department of Peace and Development Research, Göteborg University ISBN 91-87380- 43-9.
Okubo T and Matsumoto J (1979) Effect of infiltration rate on biological clogging andwater quality changes during artificial recharge — Water resources research. pp. 1536 –1542, 1616 – 1622.
Okubo T and Matsumoto J (1979) Effect of infiltration rate on biological clogging and Waterquality changes during artificial recharge — Water Resources Research, pp.1536-1542, 1616-1622.
Panda N et al., (2005) Organic agriculture: Science and belief, pp 19-20, Agrobios, Vol 4, No. 4.
Patel A S (2000) Development of performance indicators for artificial recharge structures inSaurashtra region of Gujarat. Ph. D. Thesis, M.S. University of Baroda, Vadodara.

325Energy Management References 325
Patel A S and Parthasarathy G S (1997) Development and management perspective of coastalgroundwater of Saurashtra Region-,Gujarat — a paper published in National Workshop onEnvironmental Pollution and Control organised by K.L.E.S.’s College of Engg. and Tech.,Belgaum, Karnataka, April 12-13, 1997.
Patel A S and Parthasarathy G S (1997) Sustainable development of groundwater throughNGOs A Case Study of Saurashtra Region (Gujarat) — a paper published in National Seminar(NCGW-97) at Hyderabad (AP), J.N.T. University, Aug. 27-28, 1997
Patel A S et al., (2003) Manual of Water Harvesting, GSFC Science Foundation, Vadodara, India.
Patel A S and Parekh VP (2005) Effect of seawater intrusion preventive structures in Meghalbasin of Saurashtra Region, Hydrology Journal, Volume 27, November 1-2, March — June2004 Indian Association of Hydrologists (IAH) ISSN 0917-569X
Patel A S and Parekh VP (2005)Effect of Sabli — netravati spreading channel to control SeawaterIntrusion in Saurashtra Coast, National Conference on Sustainable Management of WaterResources at College of Agricultural Engineering and Technology Junagadh AgriculturalUniversity, Junagadh, published by Himanshu Publications at Udaipur and Delhi.
Patel A S and Trivedi Ankita (2006) Water management of north Gujarat. 38th Annual conventionIWWA, organized by IWWWA, UNICEF, GTZ Germany, at Birla Auditouium, Jaipur
Patra K C (2001) Hydrology and Water Rresources Eengineering, Narosa Publishing House,New Delhi.
Phadtare P N et al., (1982) Report on concept, methodology and status of work, Pilot projecton Artificial Recharge, Central Groundwater Board, Ahmedabad, India.
Prasad P R, A Pekdeger and W Ohse (1983) Geochemical and geophysical studies of salt waterintrusion in coastal regions. In Relation of Groundwater Quantity and Quality (Proceedings ofthe Hamburg Symposium, August 1983. IAHS Publ. No. 146, F. X. Dunn, G. Matthess and R.A. Gras, editors, IAHS Press, Wallingford, Oxon, pp. 209-218.
Raghunath H M (2007) Groundwater, Third Ed. New Age International (P) Ltd., New Delhi
Ranade (2000) A water harvesting manual for urban areas: Case Studies from Delhi: PublicationCentre for Science and Environment, New Delhi.
Rao K N et al., (1971) Potential evapotranspiration over India, Symposium on Water Resources,IISc, Bangalore, India, pp. 2-14.
Revelle R (1941) Criteria for recognition of sea water in ground-waters. Transactions of theAmerican Geophysical Union, 22, 593-597.
Riddel J O (1933) Excluding salt water from island wells — a theory of the occurrence ofgroundwater on experience at Nassau, Bahama Islands. Civil Engineering, 3, 383-385.
Roger E (1987) Water Rreuse and the Cities, The University Press of New England, Printed inIndia by Scientific Publishers, Jodhpur.

326 Energy ManagementWater Management326
Rushton K R (1980) Differing positions of saline interfaces in aquifers and observationboreholes. Journal of Hydrology, 48, 185-189.
Salvi N S (2002) Roof top rainwater harvesting for Mumbai, pp. 201 – 206, 34th AnnualConvention of Indian Water Works Association, Bangalore.
Segol G, Pinder G and Gray W (1975) A Galerkin finite element technique for calculating thetransient position of the salt water front. Water Resources Research, 11(2), 343-347.
Sharma and Sharma (2000) Multispectral analysis of satellite digital data to estimate roof area and rainwater available for artificial recharge in Delhi area, Proceedings of national seminar on rain waterharvesting, Delhi, May 22-23. Published by Central Groundwater Board, New Delhi, pp. 152-167.
Shearer T R (1991) Saline intrusion at Valle San Quintin, Mexico BC: Geophysical boreholelogs, Report No. WD/91/45R, British Geological Survey, Wallingford.
Shuval H L and Katzenelson (1972) Detection of Enteric Viruses in the Water Environment inWater Pollution Microbiology, 47–71, Wiley, New York.
Sikarwar R S, Rank H D and Subbaiah R (2005) Impact assessment of water harvestingstructures in Ladudi watershed, Proceedings of sustainable Management of Water Resources,Himansu Publication, Udaipur, India, pp. 121–124.
State of California (1978), Waste waster reclamation criteria, California administrative codetitled 22, Div. 4, Environment health, Dept of health services, Berkley, CA.
Stnder and Funke (1967), Conservation of water reuse in South Africa, Chem. Engg. Prog.Symp. Series 63. Amer. Inst. Them. Engg. New York.
Subramanya K (2002) Engineering Hydrology, Tata McGraw Hill Publishing Co. Ltd., New Delhi.
Sukhija B S, Reddy D V, Nandakumar M V, and Rama (1997) A method for evaluation of artificialRecharge through percolation tanks using Environmental chloride, Groundwater, Vol. 35, No.1.
Sukhija D S et al., (1997) Proceedings of Artificial Recharge Structures: evaluating theirfunctional efficacy and evolving criteria for their siting. NGRI, Hyderabad, India.
Tellam J H and Lloyd J W (1986) Problems in the recognition of seawater intrusion by chemicalmeans: an example of apparent chemical equivalence. Quarterly Journal of Engineering Geology,19, 389-398.
Tellam J H, Lloyd J W and Walters M (1986) The morphology of a saline groundwater body:its investigation, description and possible explanation. Journal of Hydrology, 83, 1- 21.
Tiwari and Srivastave (1983).
Todd D K (1980) Groundwater Hydrology, 2nd ed., John Wiley & Sons, New York, pp. 535 .
Trivedi D P (1999) Study of reverse osmosis plant for sea water, A dissertation submitted forPostgraduate degree at M S University of Baroda, India.
Turton A R and Meissner R (2000) The hydrosocial contract and its manifestation in society:A South African Case Study. Forthcoming chapter in a book as yet untitled.

327Energy Management References 327
Turton A R and Ohlsson L (1999) Water scarcity and social stability: Towards a DeeperUnderstanding of the Key Concepts Needed to Manage Water Scarcity in Developing Countries.Paper presented to the 9th Stockholm Water Symposium. Available in Draft from Website.
Turton A R (1998) The hydropolitics of Southern Africa: The Case of the Zambezi RiverBasin as an Area of Potential Co-Operation Based on Allan’s Concept of Virtual Water.Unpublished M.A. Dissertation, Department of Political Science, Pretoria: University of SouthAfrica (UNISA).
Turton A R (1999) Water scarcity and social adaptive capacity: Towards an Understanding ofthe Social Dynamics of Water Demand M anagement in Developing Countries. MEWREWOccasional Paper No. 9. Water Issues Study Group, School of Oriental and African Studies(SOAS), University of London. Available from Website.
Turton A R (2000a) Precipitation, people, pipelines and power in Southern Africa: Towards a ‘VirtualWater’-based Political Ecology Discourse. In Stott, P. and Sullivan, S. (Eds.) Political Ecology: Science,Myth and Power. London: Arnold & New York: Oxford University Press ISBN 0 340-76165 2
Turton A R (2000b) Water and sustainable development: a southern perspective. Forthcomingin Encyclopedia of Life Support Systems (EOLSS). London: EOLSS Publishers. Available inDraft from Website
Turton A R (2000c). Water wars in Southern Africa: challenging conventional wisdom. InSolomon, H. and Turton, A.R. (Eds.) Water Wars: Enduring Myth or Impending Reality?African Dialogue Monograph Series No. 2. Durban: ACCORD Publishers ISSN 1562-7004
Turton A R (2000d) Water, development and conflict in Africa. Presentation to the AfricanDialogue Lecture Series held on 29 August at Pretoria University. Available as a Power Pointpresentation from the Centre for International Political Studies (CIPS)
Turton A R, Moodley S, Goldblatt M and Meissner R (2000) An analysis of the role of virtualwater in meeting water scarcity: An Applied Research and Capacity Building Project.Johannesburg: Group for Environmental Monitoring (GEM) and IUCN (NETCAB).
U S Public Health Service (1962) Drinking water standard, US Department of Health Educationand Welfare, Washington D C.
UNEP (1998, 2001), State of the environment, India, United Nation Environmental Program.USDI (1985) Groundwater Manual, pp. 480.
Verma C V J (1996) Manual on Eevaporation and its Restriction from Free Water Surface, Oxfordand IBH Publishing Co. Pvt. Ltd., New Delhi.
Verma C V J et al., (1997) Second international R & D conference: Water and Energy, Vol. 2,CBIP, New Delhi.
Yadav S R et al., (2005) Rainwater harvesting and groundwater recharge for sustainabledevelopment of urban areas, Proceeding of Sustainable Management of Water Resources,Himansu Publication, Udaipur, India, pp. 121–124.

This pageintentionally left
blank

INDEX
A
(A.S.R.) Wells 212Aquiclude 31Aquifers 21, 30, 212Aquifuge 31Aquitard 31Artificial Rain 299Artificial Recharg 111, 116, 144, 168, 170, 175, 185, 188
B
Bored Wells 36
C
Check Dam 122, 205, 211Coastal Aquifers 224, 229Confined Aquifer 31Conservation of Soil Moisture 88
D
Desalination 317Driven Wells 36Droughts 4Dug Wells 35
E
Escape Weirs 128
Estuaries 239Evaporation 41Control 79, 85
Pans 45Evapotranspiration 22, 53, 55
F
Factors AffectingEvaporation 43Infiltration 64Transpiration 54
Farm Ponds 152Floods 4Fresh–Saline Interface 226, 230Fresh-Salt Interface 235
G
Groundwater 20, 25, 27, 34, 35Exploration 37Occurrence 25
H
Horizontal Wells 36Hydrological Cycle 15, 26
I
Induced Recharge 140

330 Energy ManagementWater Management330
Infiltration 20, 63Infiltrometers 65Injection
Recharge 185Wells 147, 162
Interception 61
J
Jetted Wells 36
K
Kunds 177
L
Leaky Aquifer 31Lysimeters 55
M
Measurement of Transpiration/Evapotranspiration 54Measuring Evaporation 44Methods of Artificial Recharge 112
N
Natural Recharge 111
P
Perched Aquifer 31Percolation 122
Tanks 197Permeability 29Phreatic Aquifer 117, 119Ponds 106Precipitation 19
R
Rain Water Harvesting 77, 181, 184
Rainfall Simulator 68Recharge 23
Rate 200Techniques 248Through Pits and Shafts 135Through Wells 134
Recharging 146Well 145
Recreational Reuse 265Reuse of Water 8, 255, 274Reverse Osmosis 303, 305, 306Roof Water Harvesting (Rwh) 95, 167
S
Salinity Control 249Salinity Ingress 246Salt Water Intrusion 239, 240, 241, 244, 245Sea Water Intrusion 223Seawater Barriers 243Sewage and Industrial Waste Reuse 266Soil Mulches 89Source of Groundwater 26Spring 35Subsurface Dyke 138Surface Water 19
T
Tanks 124Transition Zone 228Transmissibility 29Transpiration 53
U
Unconfined Aquifer 31Upconing 237
V
Virtual Water 277, 278, 285, 291
W
Wastewater 8, 259

331Energy Management Index 331
Reclamation 260Reuse 258
Water Availability 2Conservation 10Footprint 277, 288Harvesting 106, 167, 176Mound 199, 207, 215Requirements 3Quality 6, 108, 188, 210
Wedge 232, 235Weirs 128, 130Well Clogging 153Wells 35
Z
Zone of Dispersion 227