water inflow into underground facilities . and rock grouting … · 2012-03-02 · working report...
TRANSCRIPT

Working Report 2002-26
Water inflow into underground facilities . and rock grouting
- Experiences from Finland
Ursula Sievanen
Annika Hagros
May 2002
POSIVA OY
. T6616nkatu 4, FIN-00100 HELSINKI, FINLAND
Tel . +358-9-2280 30
Fax +358-9-2280 3719

Working Report 2002-26
Water inflow into underground facilities and rock grouting
- Experiences from Finland
Ursula Sievanen
Annika Hagros
May 2002

INSINOORITOIMISTO
SAANIO & RIEKKOLA OY ~ SAATE 14.5.2002
SAA TE TYORAPORTIN T ARKAST AMISEST A JA HYV AKSYMISEST A
TILAAJA:
TILAUS:
YHTEYSHENKILOT:
TYORAPORTTI:
TEKIJAT
TARKASTAJA
HYVAKSYJA
Posiva Oy T6616nkatu 4 00100 HELSINKI
9531/01/JPS, 9672/01/JPS, 9522/02/JPS
jil9$~ Jukka-Pekka Salo Posiva Oy Reijo Riekkola Saanio & Riekkola Oy
Water inflow into underground facilities and rock grouting - Experiences from Finland
Ursula Sievanen Saanio & Riekkola Oy
~~ Annika Hagros Saanio & Riekkola Oy
~~ola Saanio & Riekkola Oy toimitusjohtaja

Vastaanottaja
SAATE 15.5.2002
x Sopimuksen mukaan x Hyvaksyttavaksi
JPS Posiva Oy
x Toimenpiteita varten Tiedoksi Lausuntoa varten Palautan Arkistoitavaksi
Lahettaja
Pyydan yhteydenottoa Pyydan palauttamaan Muu
Ursula Sievanen
Tervehdys
Tassa orginaali ja kopio tyoraportista "Water inflow into underground facilities and rock grouting - Experiences from Finland".
Kaksi liitetta on A3-kokoisia (liitteet rullalla pahvit6tter6ssa). Ajatus olisi etta ne tulisi taitettuna raporttiin. Mallin naette kopioidusta versiosta.
Abstrakti ja tiivistelma ovat levykkeella.
Ohessa on myos ehdotus jakelusta. Tarkistaisitko sen Jukkis?
Ystavallisin terveisin
Ursula Sievanen
Saanio & Riekkola Oy • Laulukuja 4 • 00420 Helsinki Puhelin 09 - 566 6500 Faksi 09 - 566 3354

Working Report 2002-26
Water inflow into underground facilities and rock grouting
- Experiences from Finland
Ursula Sievanen
Annika Hagros
Saanio & Riekkola Oy
May 2002
Working Reports contain information on work in progress
or pending completion.
The conclusions and viewpoints presented in the report
are those of author(s) and do not necessarily
coincide with those of Posiva .

WATER INFLOW INTO UNDERGROUND FACILITIES AND ROCK GROUTING- EXPERIENCES FROM FINLAND
ABSTRACT
Groundwater inflow into an excavation can cause many problems during construction and operation phases. Rock grouting is frequently used method to seal rock. Grouting will be an important method to seal the underground rock characterization facility ONKALO and final repository for spent nuclear fuel from Finnish nuclear power plants, for which purpose this work is made.
Besides theoretical studies of groundwater inflow and especially grouting, practical experiences are valuable. The purpose of this study is to compile and analyse experiences on groundwater inflow and grouting works made in six Finnish underground excavations. The factors of main interest are geological and hydrogeological factors affecting the water inflow and grouting, grouting materials and methodology as well as the grouting results achieved. The selected cases are the repositories for low and medium level nuclear waste at Olkiluoto and Hastholmen, the Turku-Naantali district heating tunnel and three shallow civil caverns in Helsinki area. The cases are located in geologically different conditions, at different depths and they have been constructed for different purposes. The material from these cases is miscellaneous.
Olkiluoto VLJ repository is an example of a relatively dry cavern, where only minor post-grouting had to be made, but not successfully. Hastholmen VU repository represents a cavern with high water inflows and high amount of consumed cement in both pre- and postgrouting. However, the amount of inflowing water has reduced considerably. The descending trend has been significant during operation of the repository. Turku-Naantali district heating tunnel was studied carefully after construction. It was a challenging project where much pre- and post-grouting was made. The three shallow caverns in the Helsinki area were more conventional projects with different grouting experiences.
Target inflows were usually reached, but locally there were places where grouting did not lead to desired reduction of inflow. Water inflow of couple of litres per minute per 100 tunnel-m is realistic to reach, although not in all kind of geological environments. Cement takes varied a lot, typically between ten to hundreds of kg/borehole-m.
Saving for example in pre-investigations, pre-grouting or time hit back in a couple of cases. Pre-grouting reduced the need for post-grouting, and pre-grouting generally led to success in reducing the inflow. A typical problem in post-grouting in couple of cases was that the inflows into the tunnel moved to other fractures. Several geological factors were observed to affect the grouting result. Clay and chlorite infillings were associated to fractures with higher inflow and with difficulties in grouting. Besides fracture zones, long fractures were associated to higher inflows in a couple of cases. Environmental effects (decrease in groundwater table or changes in saline-fresh water interface) were usually quite well controlled in the studied cases.
Keywords: Water inflow, grouting, grouting experiences, ONKALO, final repository

VUOTOVESIVIRTAAMA KALLIOTILOIHIN JA INJEKTOINTI KOKEMUKSIA SUOMESTA
TIIVISTELMA
Vuotovesivirtaama kalliotiloihin aiheuttaa monenlaisia ongelmia louhinnan ja tilan kayton aikana. Injektointi on paljon kaytetty menetelma kallion tiivistamisessa. Injektointi tullee olemaan myos tarkea menetelma tiivistettaessa maanalaista tutkimustilaa ONKALOa ja kaytetyn ydinpolttoaineen loppusijoitustilaa, jonne loppusijoitetaan suomalaisista ydinvoimaloista kertyva kaytetty polttoaine. Tama tyo liittyy kaytetyn polttoaineen loppusij oitustutkimuksiin.
Vesivuotojen ja injektointiasioiden teoreettisen tarkastelun lisaksi kaytannon kokemukset ovat arvokkaita. Taman tyon tarkoitus on koota ja analysoida kokemuksia tunneleiden vesivuodoista ja tehdyista injektoinneista. Tarkastelussa on kuusi tunnelikohdetta Suomesta. Tyossa on tarkasteltu erityisesti mitka geologiset ja hydrogeologiset tekijat ovat vaikuttaneet vuotovesivirtaamiin ja injektointiin, mita injektointiaineita ja -menetelmaa on kaytetty seka saavutettuja tiiveystuloksia. Valitut kohteet ovat matala- ja keskiaktiiviselle ydinjatteelle tarkoitetut loppusijoitusluolat Olkiluodossa ja Hastholmenissa, Turku-Naantali kaukolampotunneli ja kolme yleisokayttoon tarkoitettua kalliotilaa paakaupunkiseudulla. Tarkastellut kohteet sijaitsevat erilaisissa geologisissa ymparistoissa, eri syvyyksilla ja ne on rakennettu eri kayttotarkoitusta varten. Tutkittu materiaali on hyvin vaihtelevaa.
Olkiluodon VU-luola edustaa suhteellisen kuivaa maanalaista tilaa, jossa tehtiin vain vahan jalki-injektointeja, ei tosin kovin onnistuneesti. Hastholmenin VU-luolassa puolestaan oli suuret vesivuodot ja seka esi- etta jalki-injektoinneissa kaytettiin hyvin suuret maarat sementtia. Vesivuotoja saatiin pienennettya huomattavasti ja laskeva trendi on ollut huomattavaa rakentamisen jalkeenkin. Turku-Naantali kaukolampotunnelin vuotovesi- ja injektointikokemukset tutkittiin rakentamisen jalkeen. Kyseessa oli haastava projekti, jossa tehtiin paljon esi- ja jalki-injektointeja. Kolme kalliotilaa paakaupunkiseudulla olivat tavanomaisia tunneliprojekteja erilaisine injektointikokemuksineen.
Tavoitteena olleet vuotovesivirtaamat yleensa saavutettiin, vaikkakin paikallisesti ei aina injektoinnilla paasty haluttuun vesivuodon pienenemiseen. Muutamaan litraan minuutissa sataa tunnelimetria kohden on realistista paasta, vaikkakaan ei kaikenlaisissa geologisissa ymparistoissa. Sementtimenekit vaihtelivat suuresti, tyypillisesti kymmenesta satoihin kg/porareika-m.
"Saastely" mm. esitutkimuksissa, esi-injektoinneissa ja kuivumisajoissa kostautui muutamassa kohteessa. Esi-injektointi vahensi jalki-injektoinnin tarvetta, ja yleensa esiinjektoimalla saatiin vesivuotoja pienenemaan. Kahdessa kohteessa jalki-injektoinneissa havaittiin vuotojen siirtyvan muualle. Useiden geologisten tekijoiden havaittiin vaikuttavan injektointitulokseen. Savi- ja kloriittitaytteisiin rakoihin liittyi usein muita suurempia vesivuotoja ja vaikeuksia injektoinnissa. Rako- ja ruhjevyohykkeiden lisaksi pitkiin rakoihin liittyi suurehkoja vesivuotoja muutamassa kohteessa. Ymparistovaikutukset (pohjaveden pinnan alenema tai muutokset makean ja suolaisen veden rajapinnassa) hallittiin yleensa hyvin tarkastellussa kohteissa.
Avainsanat: vuotovestvtrtaama, injektointi, injektointikokemukset, ONKALO, loppusijoitustilat

PREFACE
This work belongs to Posiva site characterization programme for final disposal of spent nuclear fuel. The work has been ordered from and supervised by Posiva. The authors wish to thank Posiva's contact person Mr. Jukka-Pekka Salo and other commentators Mr. Aimo Hautojarvi, Mr. Mauri Toivanen and Mr. Antti Ikonen.
The contributions of many experts have been of essential help in this work. A special gratitude is addressed to Mr. Pekka Anttila at Fortum Power and Heat, Mr. Jouni Maidell at Public Works Department of the City of Helsinki, to Mr. Goran Backblom at Conrox (Taby, Sweden), Mr. Reijo Riekkola, Mr. Matti Kalliomaki and Mr. Matti Kokko at Saanio & Riekkola Oy.

1
TABLE OF CONTENTS
ABSTRACT
TIIVISTELMA
PREFACE
TABLE OF CONTENTS ..................................................................................... 1
1 INTRODUCTION ....................... ................................................................ 3
2 CASE STUDIES ......................................................................................... 5 2.1 Olkiluoto VLJ Repository ................................................................... 5
2.1.1 General ........................................................................................... 5 2.1.2 Geological and hydrogeological environment .................................. 6 2.1.3 Engineering geology and grouting experiences ............................... 7 2.1.4 Conclusions ................................................................................... 13
2.2 Hastholmen VLJ Repository ............................................................ 15 2.2.1 General ......................................................................................... 15 2.2.2 Geological and hydrogeological environment ................................ 16 2.2.3 Engineering geology and grouting experiences ............................. 17 2.2.4 Conclusions ................................................................................... 24
2.3 Turku-Naantali District Heating Tunnel ............................................ 25 2.3.1 General ......................................................................................... 25 2.3.2 Geological and hydrogeological environment ................................ 26 2.3.3 Engineering geology and grouting experiences ............................. 26 2.3.4 Conclusions ................................................................................... 32
2.4 Underground facilities in Helsinki area ............................................ 34 2.4.1 General ......................................................................................... 34 2.4.2 Leppavaara underground car parking and civil shelter ................... 35 2.4.3 Merihaka sport hall and civil shelter ............................................... 40 2.4.4 Helsinki university library underground store ................................. 47
3 DISCUSSION AND CONCLUSIONS ....................................................... 55
REFERENCES ................................................................................................. 59
APPENDICES .................................................................................................. 63

3
1 INTRODUCTION
Groundwater inflow into an excavation can cause many problems during construction and and operation phases. Rock grouting is one possible and much used method to seal rock. Grouting will be an important method to seal the underground rock characterization facility ONKALO (Aikas 2001) and final repository for spent nuclear fuel from Finnish nuclear power plants, for which purpose this work is made. Other, complementary methods to control water inflows are shotcreting and concrete linings.
Besides theoretical examination of groundwater inflow and especially grouting, practical experiences are valuable, ~hen estimating for example: • What are realistic expectations for water inflow into ONKALO and final disposal
facilities? • Can current grouting methods and materials be regarded to lead to satisfying results? • What are the main factors that may lead to successful/unsuccessful results?
The purpose of this study is to compile and analyse experiences on groundwater inflow and grouting works made in six different Finnish underground excavations. The factors of main interest are geological and hydrogeological factors affecting the water inflow and grouting, grouting materials and methodology, other information during grouting works and the grouting results achieved. The selected cases are two repositories for low and medium level nuclear waste at Olkiluoto and Hastholmen, the Turku-Naantali district heating tunnel and three shallow civil caverns in Helsinki area.
This work does not contain theoretical examination of the problem, that can be found for example in reports by Sievanen (2001) and Backblom (2002). The latter report is a case study like this report, but based on Swedish experiences.
The material and documents used in the study are miscellaneous. From Olkiluoto VU repository and Hastholmen VLJ repository several detailed reports of geological and hydrogeological conditions exist. In Hastholmen the grouting works were studied and reported afterwards. Grouting work was not studied separately in Olkiluoto and this study here is based on designs and grouting logs etc. The Turku-Naantali district heating tunnel was studied very carefully and the text here is a summary of the original report. There are no published documents from Leppavaara underground car parking and civil shelter, Helsinki university library underground stacks, or Merihaka sport hall and civil shelter. The analysis is made on the basis of engineering geological mappings, registered grouting logs and minutes from construction meetings etc.
There is no unambiguous way to describe, classify or analyse grouting results etc. It is usually made on the basis of so-called "engineering judgement". The geological and hydrogeological conditions are described according to Finnish engineering geological classification system (Korhonen et al. 1974 and Gardemeister et al. 1976), Appendix 1.

5
2 CASE STUDIES
2.1 Olkiluoto VLJ Repository
2.1.1 General
Teollisuuden Voima Oy constructed an underground repository for low and medium level radioactive waste at Olkiluoto island in the western Finland (Figure 2-1 ). It was constructed in the turn of 90s and it was taken into operation in 1992.
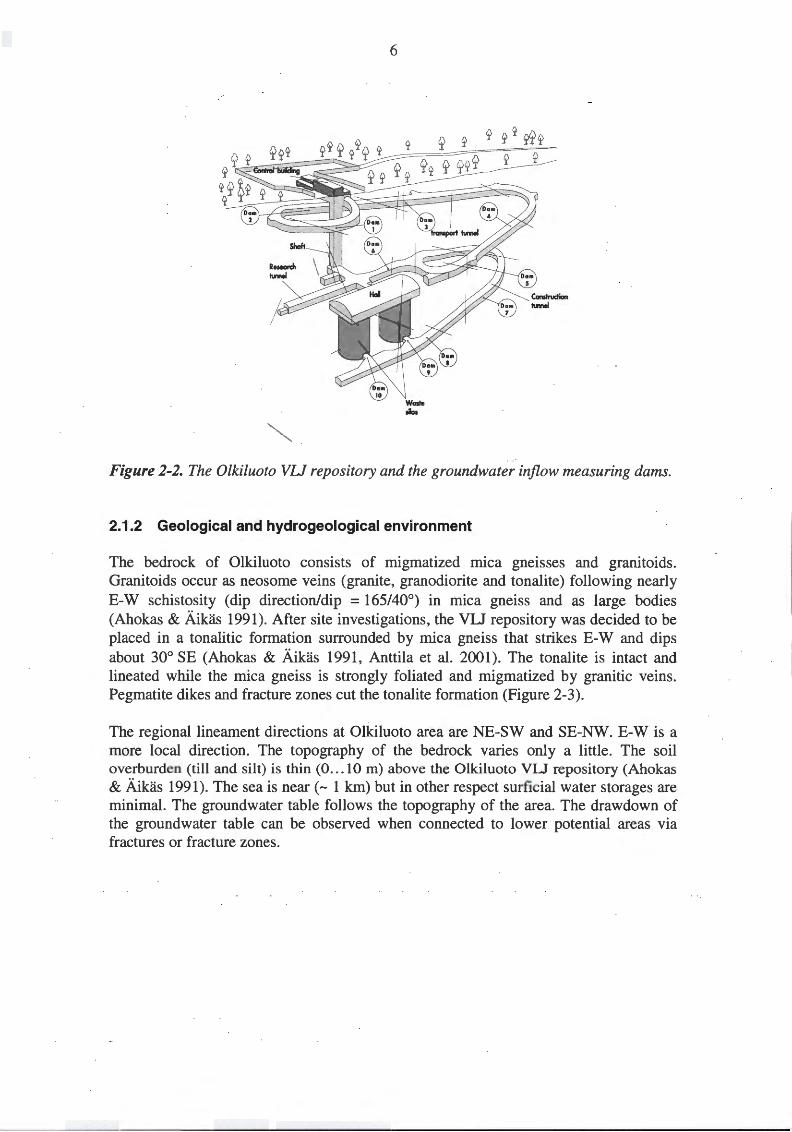
The Olkiluoto VLJ repository consists of two tunnel loops (transport tunnel and construction tunnel), shaft and two waste silos (Figure 2-2). The upper tunnel is about 600 m long and the lower about 400 m. The total volume is about 90 000 m3
. The repository extends to the depth level-95 m from the sea level.
The repository is excavated in good quality, typical Finnish bedrock of tonalite and mica gneisses. Exceptionally scanty grouting was made in the repository since the cavern was relatively dry (some tens of Umin). No pre-grouting was made and only one tunnel section needed post-grouting. However, experience from Olkiluoto VU repository is of interest because it is located near the planned final disposal facilities of spent nuclear fuel.
Figure 2-1. The location of the Olkiluoto VU repository.
6
Figure 2-2. The Olkiluoto VU repository and the groundwater inflow measuring dams.
2.1.2 Geological and hydrogeological environment
The bedrock of Olkiluoto consists of migmatized mica gneisses and granitoids. Granitoids occur as neosome veins (granite, granodiorite and tonalite) following nearly E-W schistosity (dip direction/dip = 165/40°) in mica gneiss and as large bodies (Ahokas & Aikas 1991). After site investigations, the VLJ repository was decided to be placed in a tonalitic formation surrounded by mica gneiss that strikes E-W and dips about 30° SE (Ahokas & Aikas 1991 , Anttila et al. 2001). The tonalite is intact and lineated while the mica gneiss is strongly foliated and migmatized by granitic veins. Pegmatite dikes and fracture zones cut the tonalite formation (Figure 2-3).
The regional lineament directions at Olkiluoto area are NE-SW and SE-NW. E-W is a more local direction. The topography of the bedrock varies only a little. The soil overburden (till and silt) is thin (0 ... 10 m) above the Olkiluoto VLJ repository (Ahokas & Aikas 1991). The sea is near (- 1 km) but in other respect surficial water storages are minimal. The groundwater table follows the topography of the area. The drawdown of the groundwater table can be observed when connected to lower potential areas via fractures or fracture zones.

7
B - B
(@) Codeofhc:bnmne
100 • - -Figure 2-3. West-East section of the bedrock of the Olkiluoto VU repository (Ahokas & Aikiis 1991 ).
2.1.3 Engineering geology and grouting experiences
General engineering geology
According to the engineering geological mapping (Ildivalko & Aikas 1991, Ikavalko & Niskanen 1989a and 1989b) the tonalite of Ulkopaa is massive, sparsely fractured and unweathered. Tonalite is lineated and mica gneiss is strongly foliated. Some fracture zones are strongly weathered. The constructability of tonalite is good/easy. Mica gneiss around tonalite is more fractured. Besides three main fracture directions there is occasional fracturing in the Ulkopaa. Fractures are typically closed and filled. The observed fracture minerals are kaolinite, chlorite, sulphide, calcite and clays (Ikavalko & Aikas 1991, Aikas & Sacklen 1993).
The Olkiluoto VU repository intersects 12 distinct hydraulically significant fracture zones (Figure 2-3). Those were classified into five groups (Table 2-1). Here the main attention is paid to those with significant water inflow. The water leakages/droppings in the repository are connected to fracture zones, pegmatite veins or long fractures (Ikavalko & Aikas 1991). Rusty concretions occur commonly with water leakages.
The most significant inflows, main leaking zones and the grouted section are presented in Figure 2-4. Smaller leakage areas exist throughout the tunnel. In the following text the main leaking zones related to fracture zone/pegmatite vein are described. Zones are dealt with more in detail in the same context as grouting operations.

8
RC is several meters wide, water conductive fracture zone in the western curve of the transport tunnel. It intersects the tunnel twice. The central part of it is 1 - 2 m wide crushed shear zone (RiiV).
RG is about one metre wide crushed zone (Rilll-RiiV, see Appendix 1). It is situated near RC and they are connected to each other - or even coalesce. Dropping water leakage and moisture is characteristic to RG, but water presumably originates from RC.
VLJ repository intersects the fracture zone RH in four places. Fracturing is clearly denser than in the surroundings. In the upper part the zone is crushed (RiiD-RiiV). The water leakage is dropping or flowing. Most of the water origins from the third intersection.
RD is a zone of individual fractures following a pegmatite vein. It is assumed to intersect the tunnels twice. The lower intersection is one carbonate filled fracture. During excavation much water seeped in through this zone.
The maximum horizontal stress increases with depth being about 5 - 6 MPa in the depth of the silos (70- 100 m) (Kuula & Johansson 1991), and its direction is mainly NE-SW which is also the direction of one main fracture set. The vertical stress varies more strongly and no correlation with depth can be observed. The vertical stress/horizontal stress ratio is 1 - 2 on average at different depth levels.
Table 2-1. Classification of hydraulically significant fracture zones of Olkiluoto VU repository (Ahokas & Aikiis 1991).
Description Example Very wide rock type zones including fracturing RA,RB Few metres wide fracture zones RC, RG, RH, RJ Fracturing connected to pegmatite veins RE,RF Dense fracturing
..... RI,RK
Individual fractures RD,RO

9
L---------------L---------------~--------------~--~c
Figure 2-4. The most significant water inflow areas (gray raster and dots) (lkiivalko & Aikiis 1991), main leaking zones (RC, RG, RH and RD), other leakages and the post-grouted section (striped with the text "grouted section") in Olkiluoto VU repository.
Detailed fracture geology
The fracture data of the tunnels are analysed detailed here. The studied groups were 1) those in the post-grouted tunnel section, 2) those conducting water/moisture into the tunnel excluding the grouted section and 3) dry fractures. In the original engineering geological mapping (Ildivalko & Aikas 1991) the division was different and the hydraulically conductive fractures were not studied separately.
The post -grouted tunnel section is about 45 m long. The RiiV-V section (see Appendix 1) is about 20 m long and the main part of the water inflow into the repository (70% of total inflow) from this section.
In the post-grouted tunnel section 86% of the rock in the vicinity of fractures belongs to the class M1-2 (Appendix 1). Fractures are typically filled with chlorite and kaolinite. Fracture widths are typically 0- 1 mm. Nine percent of fractures belongs to the RiiV-class and five percent to the RiV-class (see Appendix 1). Here the fractures are filled, and typical fillings are chlorite, kaolinite and other clays. Fracture widths are 0- 1 mm. The rock is crushed, and moderate inflows (several to tens of liters per minute) are associated to these section. The geological maps show that the amount of water inflow from RC is 2.0+5.21/min (upper and lower intersection) which is much less than measured from nearby dam 4 (30 ... 35 1/min). The dam 4 collects water from longer area, and part of the water probably originate from the bottom of the tunnel. More than half of the fractures are steeply dipping. Fracture surfaces are typically undulating and smooth. Some are undulating and rough. About 75% of the fractures are 1 ... 3 m long and 15% are 4 ... 5 m long.
Other leaking tunnel sections (without grouting) can be seen in Figure 2-4. Moderate inflows occur in the first intersection of RC (RiiV -RiV) and in the third intersection of

10
RH (RiiV). Except these Ri-areas, the surrounding rock is typically massive (M1-2) and non-orientated. Typically the water inflow is only moisture or dropping. Fractures with greater water inflow are very rare (1 % ).
Fractures are typically filled and the most common fillings are chlorite and kaolinite. In M1-3 areas epidote, calcite, clays and sulphide are also existing, and in the RiiV-V-zones other clay minerals occur besides kaolinite. Fracture widths in M1-3 areas are typically 0- 1 mm but rarely more (some even 9 mm). In the RiiV-V-zones widths are typically 1- 2 mm with moderate water inflow.
Most of the fractures are steeply dipping. The fracture surfaces are typically undulating and smooth (80 % ). Also undulating slickensided and rough surfaces exist. 50 % of the fractures are 1 ... 3 m long and about 25% are 4 ... 5 m long. Exceptionally long fractures (even 30 or 50 m) appear to be many, and higher inflows are connected to those fractures .
The tunnel without leakages belongs mainly to M1-class and the rock is non-orientated. Rock belonging to the class RiiV make up about 1 % and RiV make up about 0.4 %. Most of the fractures are filled with chlorite and kaolinite. In the Ri-sections other clays besides kaolinite are common. Fracture widths are typically 0 mm and rarely 1 mm. Most of the fractures are steeply dipping, undulating smooth or rough. 90 % of the fractures are less than five metres long.
The bedrock around the silos is similar to the rock in the other tunnel. No significant fracture zones cut silos - the one cutting the eastern silo is characterised to be denser fracturing. The mapping of water inflow into silos and shaft was difficult because of condensed water and waters from upper wall covering the lower. In the western silo only eight fractures with moisture were observed. 75 fractures with moisture were observed in the eastern silo. The moisture or dropping often flow from the contacts of pegmatites or long fractures.
Grouting
No pre-grouting was done in the Olkiluoto VLJ repository. Most part of the tunnel was dry. Only two fans in about 45 metre long tunnel section were post-grouted. The other, smaller water leakages were reduced by shotcreting. The inflow areas, the main leaking zones and the post-grouted tunnel section in the Olkiluoto VLJ repository are presented in Figure 2-4.
According to design the need for grouting in silos and other structures were to be determined as the construction proceeded. Preliminary pre-grouting plans and patterns were made for example for silos. The bottom of silos were to be grouted from the construction tunnel with a fans including tens of grouting holes of the length exceeding the diameter of silos (about 20 m). The walls of the silos were to be sealed from the hall with several tens of grouting holes around the silos. Also guidelines considering used cementitious and chemical grouts were given, as well as instructions for equipment and grouting pressures.

11
However, according to the owner/contractor pre-grouting was not regarded necessary in Olkiluoto VLJ repository. After excavation one section conducted water tens of litres per minute and post-grouting was done. Nearly 70 % of the amount of water leakages into the tunnel flow in from nearby fracture zones of this section (Hakala 1998). Other leakages were sealed with shotcrete.
The Riiii-IV zones intersect the access tunnel aslope, thus two grouting fans were designed; the first to grout the RC-zone (floor and the walls; 9 holes) and the second to grout the RC+RG intersection (arch and the walls; 10 holes) (Figures 2-5 and 2-6).
8-8, Prd 3, 1,511
----- -!'----+---~'~-+---+-- -·~
I I \ I I \ I I \
Figure 2-5. Post-grouting in Olkiluoto VU repository; upper fan: the floor and the walls.
\ \ \ \ \ \
\\ \\ \
A-A, Pral1 . MO
I I I I I
4'100
I
I I
I I
I
-----
Figure 2-6. Post-grouting in Olkiluoto VU repository; lower fan: the arch and the walls.

12
Grouting holes varied between 5 ... 20 m, being often 12 ... 15 m long. The grout was Rapid P40/7 cement with Melment L10/40 additive. The water/cement ratio was typically l/2 The grout take varied between 6.6 ... 104.0 kglborehole-m (mean value 18 kglborehole-m) . The total grout take was about 5800 kg cement. The grouting times per hole varied from ten minutes to three hours. The used grouting equipment was Craelius ZBE and the used grouting pressures varied between 0. 7 ... 1.5 MP a.
The grouting logs reveal that in many holes the grout drained back to the tunnel from a nearby fracture zone or a grouting hole, and thus the desired result was not reached. In about half of the holes no special problems were reported.
Groundwater inflow measurements
There are ten water inflow measuring dams in the Olkiluoto VLJ repository (Figure 2-2). Also the total amount of groundwater inflow is monitored by measuring the out pumped water at the pump station. The groundwater inflow into the repository has been observed since the end of 1988 (Ohberg & Ahokas 1991, Nykyri et al. 1994, 1995a, 1995b, Ohberg 1996, 1997, Hakala 1998, Hakala & Ohberg 1998, Sievanen & Ohberg 1999, 2000, Hagros & Ohberg 2001).
The measuring dams are situated so that dam 3 gathers waters from fracture zones RD, RI and RH (first intersection), dam 4 gathers from RC and RG. Water from RD run to dam 7 and from RH (fourth intersection) into dam 8. It should be remembered that the amount of inflow in each dam is not directly the same as the inflow from a fracture zone.
The first measurings during construction phase showed that shotcreting diminished a little the amount of water inflow into some dams. However, an exceptional observation was made in dam 7 where water inflow increased from 2 1/min to 5.51/min. This is probably due to shotcreting upper in the tunnel so that the leakages moved lower.
Measuring dam 4 is situated in the middle of the grouted section (Figure 2-7). The measured inflows have been 30 ... 35 1/min (inflow from RC is 2.0+5.2 1/min). The measurings during the construction phase show that after grouting (and shotcreting) the water inflow into dam 4 increased (Figure 2-7). At first, the inflow diminished near zero, and later the measurings showed increased values. The effect of the water used in construction works is not clear. It is presumable due to the grouting that the inflow moved upward in the tunnel and some new flow paths opened.
The hydrogeological monitoring in the Olkiluoto VU repository showed a weak descending trend in the beginning of operation of the repository (Hakala 1998). Later it has stabilized (Sievanen & Ohberg 2000, Anttila et al. 2001). Four dams are totally dry. The average water inflow into the repository has been about 40 - 45 1/min (or about 41/min/100 m), from which 68% is from RC and RG. Excluding the effect of the fracture zones RC and RG, the water inflow per 100 tunnel-m is estimated to be less than 1.5 1/min.

• I ---- ·--t----··--r ·-·· .. ··-··· 15. 11 .N H . l .et I. I .H 11 .t .lt to.U . U 10.3.10 1.7.10 tl. tl.to U . l .tt
13
0~~~~~~~~~~~
~ ~ ~ ~ ~ - ~ ~ ~ ~ ~
Figure 2-7. Groundwater inflow into the measuring dam 4 in the Olkiluoto VU repository during construction (left) and operation (right).
Environmental effect
There are more than twenty ground water hydraulic head measuring wells (boreholes) at the Ulkopaa. In some of the holes there are several measuring sections at different depth intervals. Besides those, there are three groundwater measuring stations in the repository.
The hydraulic heads/groundwater table at Ulkopaa have been monitored since 1980 (Ohberg & Ahokas 1991, Nykyri et al. 1994, 1995a, 1995b, Ohberg 1996, 1997, Hakala 1998, Hakala & Ohberg 1998, Sievanen & Ohberg 1999, 2000, Hagros & Ohberg 2001 ). The effect of excavation works was observed in several measuring wells/sections. Typically the hydraulic heads decreased a few metres (0.1. .. 5.6 m (Hakala 1998)) compared to the 80s, but in some measuring sections hydraulic heads ascended a little (0.1 ... 1.5 m). In some measuring wells/sections the descending or ascending trend can still be observed.
Remarkable drawdown in groundwater table can not be seen in the areas above the inflow areas in the repository. But it has to be remembered that there are only two shallow observation holes above the eastern part of the VLJ repository. One is right above the post-grouted tunnel section and in that hole the drawdown of groundwater table was about 4 metres (Hakala 1998).
2.1.4 Conclusions
From the beginning the Olkiluoto VU repository was relatively dry- only a couple of fracture zones with significant inflow are intersected by the tunnels. The total ground water inflow into the repository has been about 40 ... 45 1/min. Pre-grouting was designed to be made according to water loss measurements. During construction pre-grouting was not regarded to be needed in the repository. One tunnel section of about 45 m (two fracture zones RC and RG) conducts about 70 % of waters into the repository. Here post-grouting was made to seal the fracture zones. Below the depth

14
level -60 m the groundwater leakages are very small. Ten years after construction the long term trend does not show significant decrease in the amount of water inflow.
The post-grouting of the fracture zones RC and RG was not successful. Grout often extruded out from nearby fractures, zones or holes. As a result the post-grouting did not diminish water inflow into the dam 4 and thus the total inflow. The leakages only moved to a little and tunnel started to leak again. Generally the changes in groundwater table were small. Typically few metres, which is a few percent of the depth of the repository.
The fractures in the post-grouted tunnel section were 0 ... 1 mm of width and they were typically filled with chlorite and clay. About 15 % of the fractures belongs to RiiV-V classes (crushed rock) according to Finnish engineering geological rock classification. About 7 5 % of the fractures are 1 ... 3 m long and 15 % are 4 ... 5 m long.
Elsewhere the leakages are low. Fractures with higher water inflows (some deciliters to few liters) are very rare (1 %). Those fractures are typically filled and the most common fillings are chlorite and clay. Fracture width were typically 0 ... 1 mm; in RiiV-V zones widths are typically 1- 2 mm with moderate water inflow. Very long fractures (even 30 or 50 m) appear several, and higher inflows are connected to those fractures. In the areas without water inflows the fracture apertures are typically 0 mm and rarely 1 mm. Those fractures are also filled with the same infillings and 90 % of the fractures are less than five metres long.
There is not satisfactorily information about the effect of the water inflow and later post-grouting on the groundwater table, because there is only one shallow observation well above the that tunnel section. In that observation well the groundwater level decreased several metres soon after the construction.
Better results in grouting of RC and RG zones would probably have been achieved if the properties of the zones had been investigated better beforehand or the existing information had been utilized better, so that a decision about pre-grouting of the zone had been made. Performed post -grouting result in decreased water inflow in the grouted area but the leakages were redirected to other flow paths and total leakages did not diminish.

15
2.2 Hastholmen VLJ Repository
2.2.1 General
The low- and intermediate-level waste from the Loviisa nuclear power plant is being disposed of in the bedrock of the power plant site in the island of Hastholmen (Figure 2-8). Hastholmen island is located in front of the town of Loviisa on the coast of the eastern Gulf of Finland. The underground VLJ repository was constructed during 1993- 1997 and the operation began in 1998, when the disposal of low-level wastes started. The repository (Figure 2-9) includes a 1 170 m long access tunnel (55 000 m3
),
two vertical shafts (7 000 m3), control and maintenance facilities (5 600m3
), connecting tunnel and loading area (13 300m3
), two disposal tunnels for maintenance waste (6 300m3
) and one disposal hall for solidified waste (KJV hall) (23 500m3) . The total
excavated volume of the repository is approximately 110 000 m3. The lowest repository
level is -119.5 m (below sea level) (Saari 2001 , Anttila 1997).
Figure 2-8. The location of the VU repository at Hiistholmen, Loviisa.

Return air shaft
-112.00
KJV-hall
16
-110.00
Connecting tunnel
Figure 2-9. Hiistholmen VU repository.
2.2.2 Geological and hydrogeological environment
Main staircase
+12.00
1 Lift and i stair shaft
t-
maintenance facilities
The island of Hastholmen is situated in the western part of the extensive rapakivi area of Southeastern Finland. Rapakivi is an anorogenic granite that has intruded into the surrounding metamorphosed bedrock. The island is located in a large rock block surrounded by fracture zones. The VLJ repository itself is located in the western part of the island (Viljanen 1996).
Hastholmen forms a hydrological unit of its own. The surface waters flow directly into the sea (Anttila et al. 1999). The uppermost part of the Hastholmen bedrock seems to be hydrogeologically anisotropic. Approximately at level -10 m and lower the hydraulic head is entirely determined by the sea level. Apparently the hydrogeological system is

17
controlled by a gently dipping crush zone in the upper part of the bedrock (so-called upper crush zone). Due to good hydraulic connections the fresh groundwater is discharged horizontally into the sea at shallow depths. In the uppermost surface bedrock the hydraulic connections are weak and boreholes even very close to each other may not be in any way connected. In all, the surface bedrock of Hastholmen seems to be hydrogeologically complicated (Herva & Ahokas 1994).
2.2.3 Engineering geology and grouting experiences
General engineering geology
An engineering geological mapping of the underground rooms and shafts was performed during the construction work. The mapping concentrated on the quality and structure of the rock mass, especially in jointing and broken zones encountered in the tunnels (Viljanen 1996). Terminology, classification properties and abbreviations used in the mapping are based on the Finnish engineering geological rock classification system (Gardemeister et al. 1976, Korhonen et al. 1974) (Appendix 1). A basically similar mapping has been previously carried out in the access tunnel (Viljanen 1994).
The rock type of the repository is rapakivi granite, which is present in several variants, pyterlite and wiborgite being the most common ones. The main rock-forming minerals are feldspars, quartz, mica and hornblende. Grain size varies from fine-grained to coarse-grained. Typical rock quality is mass-structured, unweathered (RpO) and sparsely-slightly fractured (see Appendix 1). Locally there are densely fractured sections with varying degree of weathering (Rp0-3). The variation in rock mass quality is minor. The general quality of the rock mass is intact, mass-structured and brittle. In densely fractured zones and sections the rock mass quality is broken. The most significant of these zones are found in vertical shafts, control and maintenance facilities and KJV hall (Viljanen 1996):
Lift and stair shaft: At level -92 ... -99 m a fracture- to crush-structured (Riiii-N, Appendix 1) zone dips gently NNE (023°/6°). There are three separate, 0.5 - 1.0 m wide sections of dense fracturing with abundant clay filling. Degree of weathering is usually Rpl-3. This zone represents structure R1 ("upper crush zone") of the rock model of the disposal site (Anttila & Viljanen 1995). Return air shaft: Several nearly horizontal fracture zones (fracture- to crush-structured) at levels -12 ... -13 m, -51. .. -53 m, -59 ... -61 m, -72 ... -74 m and -93 ... -96 m, the most significant zone of fracturing being between -51 and -61 m (represents structure Rl). Degree of weathering is mainly Rpl-3. Control and maintenance facilities: On the left-hand wall of the room, at section 10- 25 m, there is a wide, fracture- to crush-structured (Riiii-N) section. Degree of weathering is Rpl-2. The structure dips gently east (090°/10°). KJV hall: On the roof and upper parts of the walls of the hall approximately from section mark PL 53 m onwards there is a zone of slickensided fractures dipping gently SE (135°/15°). The width of the block- to fracture-structured (Rill-lll), unweathered zone varies between 0.1 - 1.0 m. In the rock model this zone is denoted as structure R 17. During excavation the zone required temporary rock support.
18
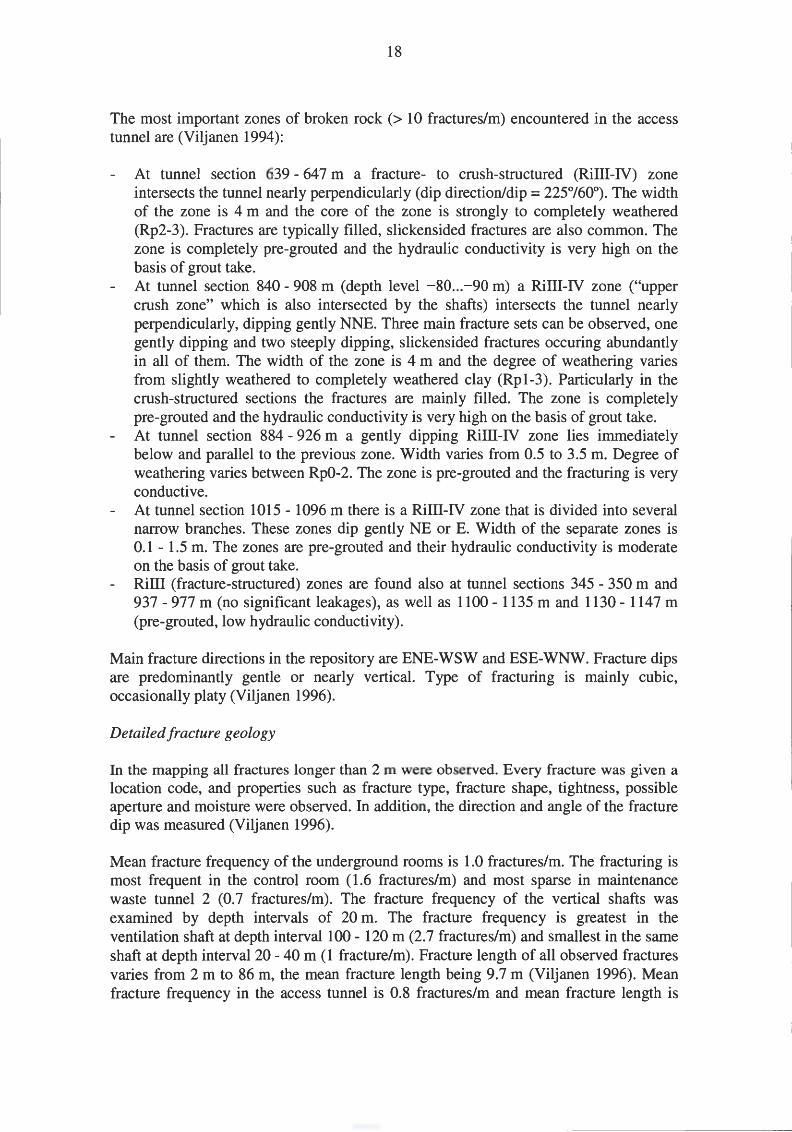
The most important zones of broken rock (> 10 fractures/m) encountered in the access tunnel are (Viljanen 1994):
At tunnel section 639- 647 m a fracture- to crush-structured (Rilli-IV) zone intersects the tunnel nearly perpendicularly (dip direction/dip= 225°/60°). The width of the zone is 4 m and the core of the zone is strongly to completely weathered (Rp2-3). Fractures are typically filled, slickensided fractures are also common. The zone is completely pre-grouted and the hydraulic conductivity is very high on the basis of grout take. At tunnel section 840 - 908 m (depth level -80 ... -90 m) a Rilll-IV zone ("upper crush zone" which is also intersected by the shafts) intersects the tunnel nearly perpendicularly, dipping gently NNE. Three main fracture sets can be observed, one gently dipping and two steeply dipping, slickensided fractures occuring abundantly in all of them. The width of the zone is 4 m and the degree of weathering varies from slightly weathered to completely weathered clay (Rp1-3). Particularly in the crush-structured sections the fractures are mainly filled. The zone is completely pre-grouted and the hydraulic conductivity is very high on the basis of grout take. At tunnel section 884- 926 m a gently dipping Rilll-IV zone lies immediately below and parallel to the previous zone. Width varies from 0.5 to 3.5 m. Degree of weathering varies between Rp0-2. The zone is pre-grouted and the fracturing is very conductive. At tunnel section 1015 - 1096 m there is a Rill-IV zone that is divided into several narrow branches. These zones dip gently NE or E. Width of the separate zones is 0.1 - 1.5 m. The zones are pre-grouted and their hydraulic conductivity is moderate on the basis of grout take. Rill (fracture-structured) zones are found also at tunnel sections 345 - 350 m and 937- 977 m (no significant leakages), as well as 1100- 1135 m and 1130- 1147 m (pre-grouted, low hydraulic conductivity).
Main fracture directions in the repository are ENE-WSW and ESE-WNW. Fracture dips are predominantly gentle or nearly vertical. Type of fracturing is mainly cubic, occasionally platy (Viljanen 1996).
Detailed fracture geology
In the mapping all fractures longer than 2 m were observed. Every fracture was given a location code, and properties such as fracture type, fracture shape, tightness, possible aperture and moisture were observed. In addition, the direction and angle of the fracture dip was measured (Viljanen 1996).
Mean fracture frequency of the underground rooms is 1.0 fractures/m. The fracturing is most frequent in the control room (1.6 fractures/m) and most sparse in maintenance waste tunnel 2 (0.7 fractures/m). The fracture frequency of the vertical shafts was examined by depth intervals of 20 m. The fracture frequency is greatest in the ventilation shaft at depth interval 100 - 120 m (2. 7 fractures/m) and smallest in the same shaft at depth interval 20 - 40 m ( 1 fracture/m). Fracture length of all observed fractures varies from 2 m to 86 m, the mean fracture length being 9.7 m (Viljanen 1996). Mean fracture frequency in the access tunnel is 0.8 fractures/m and mean fracture length is

19
10.6 m (Viljanen 1994). It should be noted that fractures< 2 m long were not taken into account.
Fracture types were classified as open, tight, filled or slickensided. The proportion of open fractures is greatest in the lift and stair shaft (52%), tight fractures occur most often in the control room ( 40 %) and filled and slickensided fractures in maintenance waste tunnel 2 (37 and 22 %, respectively) . In all, open and tight fractures are slightly more common than filled fractures and clearly more common than slickensided fractures. Fracture fillings are usually less than 2 mm thick, the maximum thickness observed being however 100 mm. The thickest fillings have been encountered in the fracture zones of the return air shaft (Viljanen 1996). In the access tunnel 38% of fractures are tight, 31% filled, 26% open and 5% slickensided (Viljanen 1994).
The most typical fracture minerals are chlorite, dolomite and calcite. Frequently these occur in the same fracture with chlorite always nearest to rock surface and calcite or dolomite as the actual fracture filling. Other fracture minerals, particularly in clayey fillings, are kaolinite, illite, fluorite, hematite, K-feldspar, quartz and plagioclase. Clay filling is present especially in broken zones. Fluorite is a typical fracture mineral occuring as purple or yellow, cubic-like crystals (Anttila 1997). Fracture minerals of the VLJ repository are more closely studied by Lindberg (1994, 1996).
Mapped fracture apertures varied from 0 mm to 40 mm, although only 8 fractures with apertures 2: 4 mm were observed. The fracture with the 40 mm aperture is located on the roof of the connecting tunnel by the maintenance waste tunnels. Mean apertures in different parts of the repository vary between 0.5 - 1.3 mm. Steeply dipping fracturing is more open than other fractures and is often associated with ENE-WSW or ESE-WNW oriented fracturing. Fracture apertures may have changed due to excavation (Viljanen 1996, Anttila 1997). In the access tunnel the fracture apertures varied between 0 - 50 mm, the majority of apertures being less than 2 mm, although large apertures were slightly more common in the access tunnel than in the underground rooms (Viljanen 1994).
Small-scale roughness of fracture surfaces has been divided into three classes, smooth, irregular and rough. Smooth fractures are predominant in all parts of the underground rooms (54- 89 % ). The proportion of irregular fractures varies between 11 - 42 % and the proportion of rough fractures between 0 - 5 % in different parts of the repository (Viljanen 1996). Large-scale roughness of fracture surfaces (fracture shape) was examined in the access tunnel, where the defined classes were planar, curved and stepped. The most common fracture shape was planar, curved fractures being clearly less frequent and stepped fractures quite rare (Viljanen 1994).
Dampness of fractures has been classified into six classes 0 ... 5 (0 = fracture is dry, 5 =fracture is flowing wet, water leakage litres/min). The mean dampness (the average of the dampness classes 0 ... 5) varies between 0.21 and 0.85 in different parts of the repository. Most fractures belong to classes 0 (fracture is dry) and 1 (fracture is damp but no free water is present). The proportion of dry fractures is 53%. The control room, particularly the back part of it (connecting tunnel), is the driest, whereas the fractures in the fracture zones of the shafts are clearly the dampest. Since systematic pre-grouting
20
has been used in the excavation work, dampness observations as such do not reflect the natural conditions. Due to grouting, no actual leaking fractures were encountered (Viljanen 1996, Anttila 1997). However, leaking fractures were observed during the geological mapping of the access tunnel. Leaking fractures (classes 4 and 5) made up 2.6% of all fractures in the tunnel. They occured in the latter part of the tunnel (from level-60 m onwards) (Viljanen 1994).
Grouting
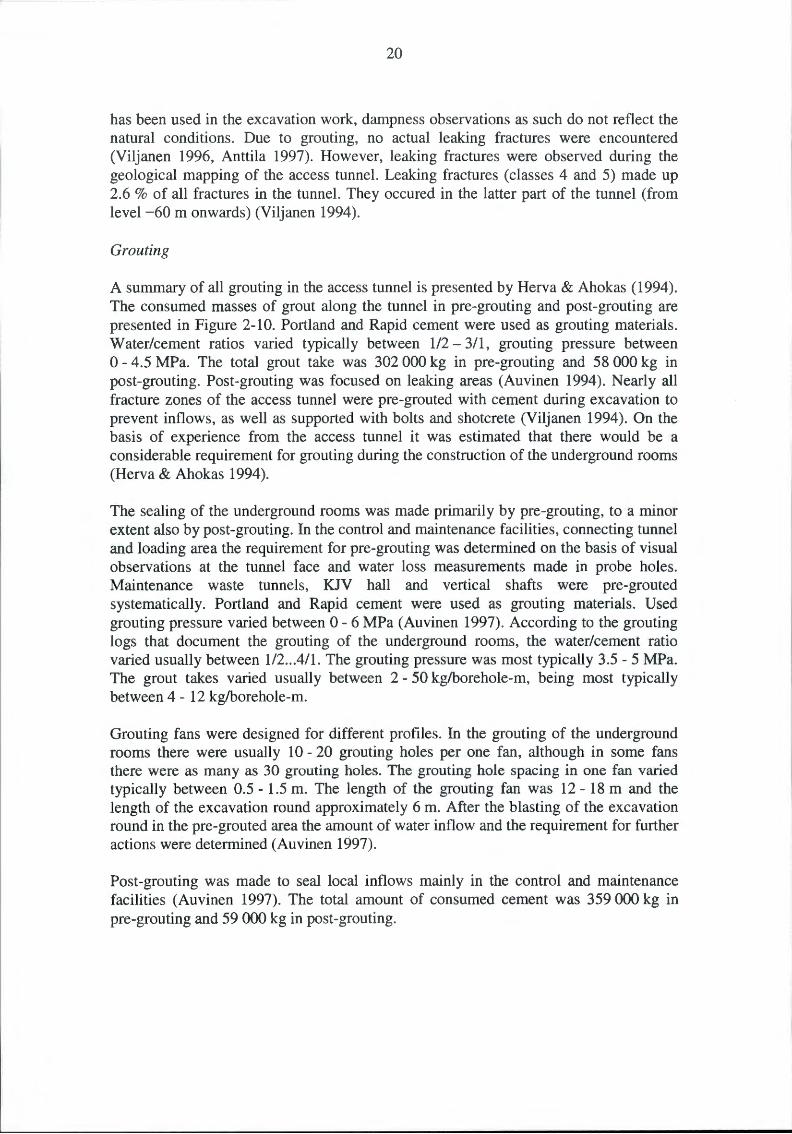
A summary of all grouting in the access tunnel is presented by Herva & Ahokas (1994). The consumed masses of grout along the tunnel in pre-grouting and post-grouting are presented in Figure 2-10. Portland and Rapid cement were used as grouting materials. Water/cement ratios varied typically between 112 - 3/1, grouting pressure between 0 - 4.5 MPa. The total grout take was 302 000 kg in pre-grouting and 58 000 kg in post-grouting. Post-grouting was focused on leaking areas (Auvinen 1994). Nearly all fracture zones of the access tunnel were pre-grouted with cement during excavation to prevent inflows, as well as supported with bolts and shotcrete (Viljanen 1994). On the basis of experience from the access tunnel it was estimated that there would be a considerable requirement for grouting during the construction of the underground rooms (Herva & Ahokas 1994 ).
The sealing of the underground rooms was made primarily by pre-grouting, to a minor extent also by post -grouting. In the control and maintenance facilities, connecting tunnel and loading area the requirement for pre-grouting was determined on the basis of visual observations at the tunnel face and water loss measurements made in probe holes. Maintenance waste tunnels, KJV hall and vertical shafts were pre-grouted systematically. Portland and Rapid cement were used as grouting materials. Used grouting pressure varied between 0- 6 MPa (Auvinen 1997). According to the grouting logs that document the grouting of the underground rooms, the water/cement ratio varied usually between 112 .. .4/1. The grouting pressure was most typically 3.5- 5 MPa. The grout takes varied usually between 2- 50 kg/borehole-m, being most typically between 4- 12 kglborehole-m.
Grouting fans were designed for different profiles. In the grouting of the underground rooms there were usually 10- 20 grouting holes per one fan, although in some fans there were as many as 30 grouting holes. The grouting hole spacing in one fan varied typically between 0.5- 1.5 m. The length of the grouting fan was 12- 18 m and the length of the excavation round approximately 6 m. After the blasting of the excavation round in the pre-grouted area the amount of water inflow and the requirement for further actions were determined (Auvinen 1997).
Post-grouting was made to seal local inflows mainly in the control and maintenance facilities (Auvinen 1997). The total amount of consumed cement was 359 000 kg in pre-grouting and 59 000 kg in post -grouting.

21
PRE-GROUTING
- ·· ~9750 2500)
200)) • Right wall
1500) D Left wall 0)
,:,t.
~ Arch 100))
5CXX) • Floor
0 8 ~ § § 8 8 ~ ~§ ~8 (") ....... CO a~
I I I I I I I o-~ ~ .-
5S 5S 0 0 0 0 0 ~ t2 LO LO ~
('I (") '<;f -o ....... CO
Tunnel section (m)
POST -GROUTING
16((()
140CO
120CO 100))
0) 80CO ~ ,:,t.
6(XX)
40CO
20CO
0
fiS § 5S § fiS 8 fiS 8 5S ~ ~ ~§§§~§§~ '<;f ~ -o ....... ....... CO CO I
I I I I I I
I I I 0'- ..- ~ r-- ....- r-- ,.... r--
0 0 0 0 § 0 8 0 8 0
~ 0 ~ 5S ~ ~ lt) lt)
'<:1 ~ 1.1) -o ....... ....... CO CO
Tunnel section (m)
Figure 2-10. Consumed masses of grout in the pre- and post-grouting of the access tunnel of Hiistholmen VU repository (Auvinen 1994 ).
Groundwater inflow measurements
Ground water inflow measurements have been made more or less regular I y from December 1993 onwards (the underground excavation of the access tunnel started in May 1993). In the access tunnel water inflows were measured from pump tubes and measuring dams. Inflows were significant! y larger in the tunnel section below the socalled upper crush zone. When the access tunnel was completely excavated (May 1994), total inflow was 300 1/min. By July 1994 the total inflow had decreased to approximately 250 1/min. Grouting made in the tunnel have significantly reduced the inflows at least in the upper part of the access tunnel (Herva & Ahokas 1994 ).

22
The total inflow in the access tunnel decreased to approximately 230 1/min at lowest before the construction of the underground rooms started. During this excavation phase the approximate total inflow increased slightly from 270 1/min (January 1995) to 290 1/min (January 1996), the maximum measured inflow being 320 1/min. After the excavations were finished in January 1996, the inflows began to decrease again to approx. 230 1/min by the end of 1996. The decrease in the inflow was partly caused by the systematic pre-grouting of the underground rooms and shafts, and locally also by the post-grouting, which was made in the access tunnel as well. Inflows have probably also been reduced by changes in the in situ stresses and the closing of fractures due to geochemical precipitation, particularly in the access tunnel (Anttila 1997). The most water inflow occured in the access tunnel section 952 - 1140 m, which is situated below the upper crush zone R 1. The next most significant leaking section was the crush zone itself. The contribution of the underground rooms to the total inflow increased as the excavation proceeded (Ahokas & Hanninen 1996).
After the contruction of the repository was completely finished, the amount of inflow has been measured at several locations in the repository. The development of the total inflow during 1996- 2000 is presented graphically in Figure 2-11 . The observed inflows are based on both manual measurements from the drainage basins and the operating hours of drainage pumps. The excavation work was finished in the beginning of 1996, after which the total inflow has been constantly decreasing (Saari 2001).
The approximate total inflow was 225 1/min in the beginning of 1997 and 180 1/min at the end of the same year. At the end of 1998 it was 150 1/min and at the end of 1999 it was 140 1/min. The amount of inflowing water has also been decreasing during 2000, being approximately 120 1/min at the end of 2000 on the basis of the operating hours of drainage pumps. Measured from drainage basins the total inflow varied between 130 - 170 1/min during 2000. Values measured from drainage pumps can be regarded as more reliable, as they measure the monthly inflow instead of relying on short-term observations (Saari 2001 ).
Typically half of the total inflow of the repository has originated from the access tunnel and half from the underground rooms. The maintenance waste tunnels are practically dry (Saari 2001).
The target value that was set for the maximum inflow of the access tunnel, 10 1/min/100 m (115 1/min for whole tunnel length), was not reached during the excavation of the tunnel, although later the total inflow has decreased below this. The target value for the waste disposal rooms, defined in the design phase, was 0.2 l/h/m2
(80 1/min in total for the disposal rooms), which was reached. The total inflow was rather large due to the inflows into the access tunnel. The decrease in the total inflow has been influenced by post-grouting in the access tunnel, precipitation in fractures and improved ventilation (Auvinen 1997).

23
LEAKAGE IN 1996 - 2000 IN HASTHOLMEN VLJ-REPOSITORY
I I I I I I t I t I 1 I . . . ~ ...... f ..... ~ .... -~.- -. -. f ..... j . -. -. ~- .. . -. f ... -. j --. -. ~- ... --f -. -.. ~ ..... T -. . . . . ... . 280
I I I I I I I I t 1 I t t · ·: · · · · · -~- · · · · · ~ · · · ·- r--- · ·r · · · · · ~ · ·- ·- ~-- ·- ·-r · · · · ·1· ·- ·- T-- ·- · r · · ·- ·1·--- · -~- · · ·-- ·- ·- ·
:: :::::::.:::-::::::::::::: L:::: ::::: !: : · :: r:::: ::::::::::::::::::: ::t ::: ::t :::::::::::: :::::1 I I I I I I 1
I I I I I
I I I I I I I .. . , ... .. ..... ,. ......... , .......... , ............ , ......... , .... -.... ........ .... ....... .. 220 I I I I I I I
I I I t I I 1
t I I I I
I I I I I I .. .. .. ........... .. . .. ...... .. ...... ... . .. ........ .. .... ...... ................... .. I I I I t t
I I I t t I
I I I t t I . .
t I I t
120 -- ·-·r ··-· ·r·· ·· ·l·--··r··--·r··· --l----·r·····r···· -1· ·-··r··· ··r· ·· -·r ·····r 100 ~~--~--~~--~--~--~~--~--~~--~--~--~~
1.01 .96 1.05.96 1.09.96 1.01 .97 1.05.97 1.09.97 1.01 .98 1.05.98 1.09.98 1.01.99 1.05.99 1.09.99 1.01 .00 1.05.00 1.09.00 1.01 .01
Time
Figure 2-11. Total water inflow into Hiistholmen VU repository during 1996-2000 (Saari 2001 ).
Environmental effect
During the construction of the repository the ground water table was observed to decline slightly over the whole island; typically the decrease of groundwater table was a few metres (Anttila 1997). Especially in the observation holes near the repository the groundwater table sank due to water inflow and pumping of groundwater out of the repository. In one hole very close to the access tunnel, the decrease was 20 m (Anttila 1997). It is obvious that this decrease will be observed as long as pumping continues, which means in practice as long as the repository is in operation. During 1996- 2000 there occured some rising of groundwater table, however, due to the decrease of the amount of water inflow. The ground water table did not seem to rise anymore in 2000. All in all the hydrological conditions around the repository seem to be close or moving towards the situation before the construction (Saari 2001).
The construction of the repository has caused some changes in the position of the interface of the fresh and saline groundwater. The changes result from the alterations between fractures, when some previously water conductive fractures have closed and some fractures have opened, due to excavation or grouting. Most commonly the interface has risen, which is caused by the groundwater drawdown. Occasionally the interface has also lowered, possibly due to an opening of a fracture conveying fresh water to the observation borehole (Anttila 1997).
As a whole the interface of the fresh and saline groundwater has risen during the construction by about 10- 50 m in the observation boreholes (Anttila 1997). During the year 2000 the groundwater around the repository has become more saline and the

24
interface of the fresh and saline groundwater is, at least locally, slightly lowering. This is probably due to the decreasing amount of inflowing water into the repository. The repository is situated entirely in the zone of saline water (Saari 2001).
2.2.4 Conclusions
Much pre- and post-grouting had to be made in Hastholmen VLJ repository to diminish groundwater inflow. High inflows (up to 300 1/min) were associated to the access tunnel and especially to a couple of fracture zones intersecting it. Nearly all fracture zones in the access tunnel were pre-grouted. Elsewhere in the repository the inflows were smaller (up to 150 1/min) and the decision of need for pre-grouting was mostly determined by visual observations and water loss measurements. Waste halls and shafts were grouted systematically. Total cement take was high: in pre-grouting 661 000 kg and in post -grouting 117 000 kg.
Fracture system is cubic in Hastholmen which is typical for rapakivi granites. Fractures in the repository are relatively long (mean length approx. 10 m; fractures < 2 m long were not studied, however) and the proportion of open fractures is quite high, approximately 30 %. Fracture apertures were typically 0 ... 4 mm and mean aperture in different part varies between 0.5 ... 1.3 mm. Fracture infillings were typically less than 2 mm thick. Geologically the circumstances indicated high hydraulic conductivities and thus high inflows were reasonable to be expected. This was seen as high grout take. The experience from the access tunnel partly evidenced that the amount of water inflow was directly dependent on the surface area of the excavated space. On the other hand it was assessed that the relative amount of inflow would significantly decrease as the distance to the upper crush zone would increase during the excavation of the underground rooms (Herva & Ahokas 1994 ). This prediction turned out to be correct, as the amount of inflow increased only slightly (from 270 1/min to 290 1/min) during the construction of the underground rooms whereas the total excavated volume doubled.
The set target value for the water inflows was reached in the disposal rooms but not in the access tunnel during the construction. The total inflow was rather large due to the inflows into the access tunnel. During the operation of the repository ( 1996 ~) the total amount of water inflow has diminished significantly. In the beginning of 1996 it was about 300 Vmin and after five years it is about 150 Vmin. This is estimated to be due to changes in in situ stresses and geochemical precipitation.
Typically the decrease of groundwater table was a few metres. In one hole very close to the access tunnel the decrease was 20 m. The construction of the repository caused changes in the position of the interface of the fresh and saline groundwater. Most commonly the interface has risen. Probably due to the diminished amount of water inflow the interface is slightly lowering.

25
2.3 Turku-Naantali District Heating Tunnel
The construction and research process is thoroughly documented and studied by Gardemeister and Koskiahde (1984). The text here is a summary of the report in question. A sketch of the tunnel, geology, pre-groutings and shotcretingsare presented in the Appendix 2.
2.3.1 General
Turku-Naantali district heating tunnel in Southwest Finland is constructed in the turn of 80s. It transfer heat from Naantali coal-fired power plant to nearby towns (Naantali, Raisio, Turku, Kaarina). Main part of pipelines are in a 14 km long tunnel from Naantali to Turku Luolavuori (Figure 2-12). The tunnel is situated in varying geological conditions, because it goes beneath the gulf of Raisio, Aurajoki river and several clay valleys. Besides, many environmental risks were possible in construction. For these reasons much geological and environmental information was collected during construction phase.
The tunnel is composed of three underground sections constructed in hard crystalline bedrock. The depth of the tunnel varies a lot as the profile of bedrock surface varies remarkably. The lowest point of the tunnel is at a depth level-90 m from sea level and the highest at + 26 m. It should be remembered that when the tunnel goes deep there is typically a sea gulf, a river or some other (clay) valley and a fracture zone above.
Figure 2-12. Turku-Naantali district heating tunnel (Gardemeister & Koskiahde 1984).

26
2.3.2 Geological and hydrogeological environment
Steep rocky hills and clay valleys between them are typical for Turku-Naantali Area. Tills and coarse-grained soils are sparsely occurring. Clays and till in valleys diminish naturally groundwater flow compared to the situation with large amount of coarsegrained soils.
The bedrock of Turku area consists mainly of gneisses and granites. The general tectonic trend is SW -NE. The other clear trend is perpendicular to this. These large scale features are due to the fracturing characteristics of the bedrock. Along the tunnel line the topography of the bedrock is very sharp-featured with 50 ... 60 m relative differences in altitude. Naturally the main groundwater reservoirs are situated in topographic valleys.
Along the tunnel line the most common massive rock types are tonalite (29 % ), diorite (9%) and granite (6% ). In these rocks the main fracture direction (nearly vertical) and weak schistosity follow the general tectonic trend. This trend is very clearly evident in fracturing and in schistosity of mica gneisses (51 % ).
Constructed areas, which were located on fine-grained soils/clays, influenced strongly design/alignment because of the risk of settlement of ground. In the area these risk areas are many and they were outlined. In the tunnel influence areas the allowed drawdown of groundwater table defined the allowed groundwater inflow and it was defined according to the precipitation and infiltration coefficient.
2.3.3 Engineering geology and grouting experiences
Engineering geology
The bedrock is mainly unweathered. However, totally weathered rock was observed in fracture zones. Nearly 40% of rock was moderately or highly schistosed. Dominant grain size was medium.
Platy fracture system was typical to strongly schistosed gneisses. Cubic or cuneiformlike fracturing was observed locally in granites and diorites. Sparsely fractured rock was typically observed in tonalites, weakly schistosed gneisses and granites. Denser fracturing was observed in the areas of low topographic valleys.
Turku-Naantali district heating tunnel intersects 316 fracture zones. These were classified according to Finnish engineering geological rock classification system (Gardemeister et al. 1976 and Korhonen et al. 1974), see Table 2-2.

27
Table 2-2. Fracture zones in Turku-Naantali district heating tunnel (Gardemeister & Koskiahde 1984 ).
Ri-class1> Number % oftotal Width2> % oftotal number (m) width
RiV 56 18 173 20 RiiV 132 42 250 28 Rilll 101 32 380 43 Rill 27 8 81 9
Sum 316 100% 884m 100% I) .
Fmmsh engmeenng geologtcal rock classtficat10n system (see Appendix 1) 2
) Observed, not absolute
% oftunnel length 1.3 1.8 2.7 0.6
6.4%
More than half of the fracture zones were narrow (< 1 m) and about 15% were more than one blasting round (about 4 m). The widest zone (150 m) was found under Turku City area, where one horizontal Rill-Ill zone was intersected. Steeply dipping, SW-NE fracturing was observed in schistosed/orientated rock types in the tunnel. In other rocks the fracture direction was varying. From Raisio to Harkamaki the tunnel intersects the tectonic orientating in the angle of 27° and in Turku City the angle is nearly perpendicular.
Grouting
According to pre-investigations (mapping, seismics and corings) about 21 % of the tunnel length was regarded to need pre-grouting. The water tightness criteria was set on the basis of groundwater conditions and drawdown calculations. The tunnel was divided into three classes of water tightness: 31/min/100 m, 5 1/min/100 m and 10 1/min/100 m.
Pre-grouting was planned to be performed as cement grouting. Post-grouting with cement or chemical grouts was planned to be done in areas where set water tightness was not reached or where water inflow could cause damage to machinery or disturb working. Corings were made to design excavation, reinforcement and sealing acts beforehand. This was regarded to be essential in intersecting fracture zones.
In the beginning of the excavation not much grouting was done. The deeper the tunnel was excavated, the more difficulties were met. Under deep valleys, ground water pressure increased, and often the water tightness criterion was strictest under clay valleys. In these cases the capacity of grouting equipment was found to be insufficient.
The need of pre-grouting was recommended to be determined with water loss measurements (in one or two holes) as follows:
In floor probehole water loss < 2 1/(min·m·MPa): No grouting. In floor probehole water loss > 2 1, in arch < 2 1: Floor will be grouted according to drill pattern. In floor probehole water loss > 2 1, in arch > 2 1: Whole grouting curtain will be grouted.

28
Pre-grouting was recommended in the following cases: < 3 1/min and < 5 1/min areas: streamy inflows in the drift or in bore holes. < 10 1/min area: significant inflows which disturb excavation or reinforcement. If the rock quality was discovered to get substantially worse.
Probe drilling and water loss measurements were done less than recommended, because of tight timetable.
Dripping inflows in vulnerable areas (machinery, pipelines etc.) were handled with cover plates, which was very economical.
In pre-grouting, Rapid-cement was used as the grout. Occasionally, such additives as bentonite, Intrusion Aid and fillers and (high grout takes) were used. The use of chemical grouts was occasional. Water/cement ratios varied typically between 211 ... 4/1 . Starting pressure was usually 1.0 ... 1.5 MPa and the maximum pressure was 3.0 MPa. The grouting of the hole was usually stopped when grout take was 3 ... 51/min/hole for about 15 min. Typically a pre-grouting fan comprised 13 . .. 14 holes, each 5 . .. 12 m long, around the tunnel perimeter (Figure 2-13).
About 10 % of the tunnel was pre-grouted, which was exactly the same as estimated beforehand. Cement take was relatively high in Turku-Naantali district heating tunnel. In average the grout take was 45 kg/borehole-m, but even a take of 211 kglborehole-m in average was registered (Turku Luolavuori). The quality of rock was observed to have a great influence on grout take and time.
"Saving" in time after pre-grouting hit back after blasting round many times; Due to the lack of hardening times, unhardened grouts ran into the tunnel, or grouting in the drift had to be made with low pressure so as to prevent the grout from squeezing back into the tunnel.
Significantly much post-grouting was done in Turku-Naantali district heating tunnel. The average grout take (cement) was 38 kglborehole-m. Over 50% of pre-grouted areas (about 750 m) had to be post-grouted. Also chemical grouts (silicate-based Stabilodur and resin-based Geoseal) were used in post-grouting.
According to the instructions: If water loss measurement< 0.2 1/(min·m·MPa): No post-grouting. If water loss measurement 0.2 ... 2.0 1/(min·m·MPa): Chemical post-grouting. If water loss measurement> 2.0 1/(min·m·MPa): Cement post-grouting.
Because of tight timetable, water loss measurements were not usually made, but the choice of the grout was made according to visual observations. Chemical grouts were silicate-based Stabilodur and resin-based Geoseal. Also Terraseal was tested.

29
-- -- .- n-o\e_:---_J-:,_--1:1--:---,-_,......---It G(Ou\\n~ l
--~ ~~---, --,----1 I I
-3m
I I
-~ ___ I __ . i ~e t ~- ..... ~ ~
-....::::~ I ------ -- --- ---
Figure 2-13. Grouting hole pattern of a pre-groutingfan (Gardemeister & Koskiahde 1984 ).
A typical problem with post-grouting was that the inflows moved to another place nearby the grouted area. Chemically grouted areas revealed a surprising problem: grouted fractures reopened typically in 6 months. The estimated reason concerned the chemical reactions and mixing process.
In Turku-Naantali district heating tunnel the grout take in post-grouting compared to pre-grouting was high (82 % ). The big need of post-grouting is probably explained with too early working after pre-grouting, too little probe drilling and water loss measurements and breaking the pre-grouting curtain in next blasting rounds. One interesting notice was that in one area where probe drilling and water loss measurements were done systematically, and grouting fans were 15 m long, the need of post-grouting was only 2.6 % of tunnel length. In the other tunnel section only little pre-investigations were made and grouting fans were 5 ... 9 m, and there even 81.5% of pre-grouted tunnel needed post-grouting.

30
The effect of rock quality on pre-grouting
The effect of rock quality on pre-grouting results was examined. The examined rock properties were rock quality and fracturing, which were compared to the grout takes and grouting time. The more fractured rock the bigger grout take (Figure 2-14). However, the type of a fracture zone had more importance in grout take in non-orientated rocks than in orientated rocks. The total grout take was even two times larger in non-orientated rocks than in orientated rocks.
Grouting time was not dependent on orientation, although there was a clear difference in grout takes. Only the number of fractures and clay fillings increase grouting times. The result can be interpreted so that there are more open fractures in the areas of non-orientated rocks.
Most (2/3) of the pre-grouted tunnel sections were situated like estimated beforehand according to the bedrock topography. The rest 113 were areas where water inflow originated from individual fractures which are practically impossible to locate beforehand.
Groundwater inflow measurements
The water inflow measuring dams were located in the areas of the change of target inflows. During construction also the out pumped water was measured and the results were of a help when determining the need for grouting.
In the area of < 3 1/min/1 00 m the measured inflows varied between 0.5 ... 41/min/100 m. There was one area with exceptionally high water inflows under Turku City area, where the measured inflow was about 10 1/min/1 00 m in one short tunnel section. Except this tunnel section the target inflow was reached. The average inflow was 2.5 1/min/100 m.
In the area of < 51/min/100 m the measured water inflows varied typically between 1. . . 61/min/100 m. There was one area where the limit was removed later. Except this tunnel section the average inflow was about 3.5 1/min/100 m.
In the area of< 10 1/min/100 m the measured water inflows varied typically between 1 ... 8 1/min/1 00 m. There were some areas with higher inflows. Except these tunnel sections the average water inflow was 3.5 1/min/100 m.

Rock '· Fracquality .turing
I 0•1
ta.l
StJ5 o-1
$t/S 2.-)
tcl
reS 11 '
tar Aiti ·Ut 1 Lifl 1·l
31
-to -_..,-
·-so _.., - JO - 10 _..,
-SO -40 -:JC -10 -10
- so -4G -· -10 ... to
- 10 _., -10
"' O,t4 -60 llto O,Wt -SO
-olD
- ~ -ZC -tO
.. so -40 - .JJO -to -10
-60 -so -40 , -JO : - zo ! -JO I
Figure 2-14. The effect of rock quality on pre-grouting in Turku-Naantali district heating tunnel ( Gardemeister & Koskiahde 1984 ).
Environmental effect
The drawdown of groundwater table was monitored in thirty observation wells. In eight wells the drawdown was observed and most of them were in Turku City area. In one valley area of Turku City area much grouting was done, but the groundwater table remained 0.5 ... 1.5 m lower than in the end of 70s. It is uncertain how much draw down was caused by the tunnel.

32
The settlement of soil caused by Turku-N aantali tunnel is interpreted to be small, although the reasons for soil settlement in Turku area have not been analysed in detail. Generally the settlements have been varying from few millimetres to about 150 mm (70 observation bolts).
In Raisio area decreasing in the yield of domestic water wells was observed although drying did not happen anywhere.
2.3.4 Conclusions
The biggest problems during the construction of Turku-Naantali district heating tunnel concerned sealing works, although the target inflows were usually reached. In the beginning the problems were related to the capacity of the cement grouting equipment. Despite more effective grouting equipment and additive grouting instructions, the borings, grout takes and grouting times exceeded what was estimated (Gardemeister & Koskiahde 1984).
Because of tight time table less probe drilling and water loss measurements were done than planned, and this "saving" was the reason that many times the drift was excavated too close to the water leaking zone or it was even penetrated. This led to post -grouting and the desired water tightness was not easy to reach. As well the water-cement ratio was difficult to optimize because the saving in water loss measurements and thus the cement takes increased and the planned grouting time was exceeded due to the re- and post-groutings.
The grout takes in Turku-Naantali tunnel were relatively high. Not much probe drillings were done to optimize the fans and thus the lengths of fans were not varied much. Also, often the fans were bored at the same time which led to the situation that the grout squeezed out through nearby holes during grouting.
Remarkably much post-grouting was done in Turku-Naantali district heating tunnel. The amount of post-grouting was quite same as pre-grouting. About 10% of the tunnel was pre-grouted, which was exactly the same as estimated beforehand. Many pre-grouted areas needed post -grouting because of too short hardening time after pre-grouting, too few probe drillings and water loss measurements. A typical problem with post-grouting was that the inflows moved to another place nearby the grouted area. Chemically grouted areas revealed a surprising problem: grouted fractures reopened typically in 6 months and started to leak again. The estimated reason concerned the chemical reactions and mixing process. Gardemeister and Koskiahde (1984) suggest that these problems could have been avoided with careful selection and mixing of grout.
One interesting notice, when the post-groutings were analysed, was that pre-grouted areas needed much post-in one area where probe drilling and water loss measurements were done systematically, and grouting fans were 15 m long, the need of post-grouting was only 2.6% of tunnel length. In the other tunnel section only little pre-investigations were made and grouting fans were 5 ... 9 m, and there even 81.5 % of pre-grouted tunnel needed post-grouting. The effect of rock quality is not commented.

33
The quality of rock affected the average grout take and grouting time. The grout take increased as the fracture density increased, but absolute cement take was about twice as much in all fracture density classes in unoriented rocks compared to the cement take in oriented rocks. There was no such difference in grouting times. This led to a conclusion that in the bedrock of Turku area water conductive fractures are more open in average in unoriented rocks than in oriented rocks. Another observation was that the number of fractures and clay fillings increased grouting times.
With regard to the environmental effect the Turku-Naantali district heating tunnel was quite successful: except few places the target water inflow was reached and thus the impact on groundwater table and soil depression was small.
Most (2/3) of the pre-grouted tunnel sections was situated like estimated according to the bedrock topography. The rest 113 were areas where water inflow originated from individual fractures which are practically impossible to locate beforehand.
A general problem was related to communication between different phases. Taking more advantage of the results of the engineering geological mapping, less post-grouting would have probably been needed.

34
2.4 Underground facilities in Helsinki area
2.4.1 General
Three underground facilities for civil use purposes are also studied here. All of them are recently constructed (around the year 2000) and they are located in Helsinki area. They differ from other cases in many ways: they are meant for civil use and constructed in city area, which both reasons cause special requirements on water inflows. Also they all are excavated at quite shallow depths (at most approx. 30 - 35 m below ground surface) compared to three other cases studied here.
Helsinki university library underground store and Merihaka sport hall and civil shelter are located in the area of Helsinki City (Figure 2-15). Leppavaara underground car parking and civil shelter is located in the town of Espoo.
Figure 2-15. The location of studied underground facilities in Helsinki area; Leppiivaara underground car parking and civil shelter, Merihaka sport hall and civil shelter, and Helsinki university library underground store.

35
2.4.2 Leppavaara underground car parking and civil shelter
The information presented in this chapter is based on unpublished documents, plans and minutes produced by the client (City of Espoo, Technical Department), the designer (Saanio & Riekkola Oy) and the contractor (Lemminkainen Construction Ltd.).
Leppavaara underground car parking and civil shelter has been constructed in Espoo, the neighbouring city of Helsinki. The location of Leppavaara is presented in Figure 2-15. The shelter is situated in Ruusutorppa area, southwest of the Leppavaara railway station. The civil shelter will be composed of two shelters, designed for 5 850 and 7 743 people. Normally the shelter is used for car parking and it is designed for 679 cars in total. The excavation work of the first shelter started in late 1998 and was mainly executed during 1999. Rock support and sealing works of the first phase were finished in spring 2000. The first shelter (Figure 2-16), constructed in the first phase, was taken into operation in 2001, and the construction of the second shelter will be finished by the end of2006.
The shelter is comprised of five parking halls (Figure 2-16). Two air intake shafts and one return air shaft serve for ventilation. The parking halls are 16.5 m wide and 4.5 m high. The access tunnels are 7.5 m wide and their inclination varies from 1:8 to 1: 15. The total excavated volume is 115 500 m3
, of which 106 000 m3 is excavated underground. The floor level of the halls is -1.0 ... -3.5 m and the arch is at level +3.5 .. . +5.1 m (sea level= 0 m). The bedrock surface is at level +10.5 .. . +22.0 m.
Geological and hydrogeological environment
The topography of the Ruusutorppa area is subdued, and the construction site comprises a till-covered bedrock hill rising rather gently from the surrounding clay terrain (the greatest difference in altitude approximately 15 m). The thickness of the soil overburden covering the hill is 0.5- 3 m at most (at the locations of the shafts).
The bedrock of the site is a part of the schist-gneiss area extending across Espoo. Rock types include mica gneisses, quartz-feldspar gneisses and hornblende gneisses. The rocks have a mixed, veined-gneissic structure. Massive granite-pegmatite bodies also occur.
In the hill area of Ruusutorppa the bedrock is sparsely or slightly fractured, and the hill is surrounded by .zones of weakness in the north and in the south. The area is dominated by horizontal fracturing, whereas vertical fracturing often is almost completely absent. At the margins of the bedrock hill the horizontal fracturing is extremely open, and the fractures are filled will glacial materials. Such clay fractures extend to a depth of 3 m in the bedrock and make the construction of e.g. ramps and shafts more difficult.
The halls are located below the groundwater table. Groundwater table is being monitored by the Geotechnical Department of the City of Espoo.

36
Figure 2-16. The Leppiivaara underground shelter, illustrated on a topographical map.
Engineering geology
During the construction work the excavated surfaces were mapped according to Finnish engineering geological rock classification system (Gardemeister et al. 1976, Korhonen et al. 1974), summarized in Appendix 1. The mapping results are presented in Figure 2-17. The rock mass quality observed during construction was largely similar to what had been expected on the basis of geological pre-investigations. Significant zones of weakness were not encountered in the underground halls, although the shafts on the margin of the shelter are very close or adjacent to the zones of weakness observed previously on the sides of the hill.
The bedrock in the Leppavaara shelter is mostly composed of mica gneiss and, to a lesser extent, pegmatite. Quartz-feldspar gneiss occurs occasionally. Rock mass quality is usually Se1 - Se3 or Li2- Li3. Foliation strikes NE-SW and dips steeply. Fracturing is often steeply dipping and parallel to foliation, the main fracture direction being 330°/90° (dip direction/dip). Horizontal fracturing also occurs. The rock mass is mostly sparsely to slightly fractured, abundant fracturing occurs also. Areas of pronounced fracturing can be found e.g. in the middle of hall 1 and in the eastern end of halls 3, 4 and 5. A long and narrow, NE-SW oriented fracture zone extends from hall 5 near shaft 2.2 to halls 4, 3 and 2. Inflows are associated with all above-mentioned fracture zones, in addition there is a large leaking area in the western part of hall 1 (between section marks PL 20- 27 m, in dense horizontal fracturing) as well as many inflows in the access tunnels, particularly in the Gyldenarinkatu access tunnel.
Some very thick clay fillings (up to 300 mm) can be found in the fractures. Clay samples were examined to determine the possible occurrence of swelling clay. The samples were found to be inactive.

37
l'eg!Ntlte 0 LNkage 0 au.rtz.f. gneiss ; Fr..:turea
Mic• QMias ...__Foliation • Amphibolite -~- ,r..:l set
Figure 2-17. Engineering geological mapping in Leppiivaara underground car parking and civil shelter.
Grouting plans and experiences
Groundwater table was monitored in the area during the excavation work. In the beginning of the project a special attention was paid to the groundwater table in a nearby clay area, but afterwards the clay has been excavated due to other construction projects.
According to grouting plans, the sealing of the rock mass in leaking areas was to be made mainly by pre-grouting. If necessary, post-grouting would also be made. Guidelines on grouting work defined by the designer are summarized in Table 2-3. For grouting of horizontal fractures a groutable CT -bolt was developed during the work in order to be able to grout troublesome horizontal fractures. The surrounding buildings and structures were to be taken into account in the grouting work. Environmental requirements did not allow any groundwater drawdown. Inflows were to be measured every two weeks.
It was estimated beforehand, on the basis of geological information, that grout take would generally be small, but there are open fractures in the area, particularly horizontal fractures, that may consume large amounts of grout. In the area of shaft 2.1 there are very water conductive zones. In the area of hall 2 - profile 18, horizontal fractures are present above the halls.

38
Table 2-3. The designer's guidelines for grouting of the Leppiivaara shelter.
Borehole design - Length of probe holes 10 - 20 m - Probe holes can be used for grouting if necessary - Overlapping of probe holes 5 m - Length of grouting holes ( 10 - 25 m) will be chosen so that the pre-grouted area will cover a
length of 3 - 8 excavation rounds in front of the tunnel face
Materials Rapid or Partek Ultrafm will be used as grouting cement Water-cement ratio is 112 ... 1/1 Melment L 10/40 or Partek Parmix + Na-bentonite will be used as additive If no additive is used, the w/c ratio will be 3/1 - 0.8/1 Grouting of cable bolts and Titan-Ischebeck anchors will be made with w/c ratio 2/1 - 0.8/1 Polyurethane-based Tacss 020 will be used for chemical grouting, if necessary (mainly post -grouting)
Assessment of requirement for grouting - The shafts will be pre-grouted - The tunnel/hall sections predicted to leak will be pre-grouted - Post-grouting will be made if necessary, depending on inflow observations and
measurements - The requirement for grouting will be determined during the construction by means of probe
drillings and water loss measurements - The extent and locations of the drillings will be determined on the basis of rock mass
quality during the work
Water loss measurements - Water loss measurements will be made by single packer method - If the measured Q is larger than 21/(min·m·MPa), pre-grouting will be started - For lower values the contractor will decide on pre-grouting
Grouting work - Pre-grouting will be made in two phases:
( 1) In the first phase every second hole will be drilled and pre-grouted (2) In the second phase the remaining holes will be drilled and pre-grouted
- The interval between the grouting phases shall be 2 days - The setting time of grouted bolts shall be 3 days - Grouting of a hole has to be made uninterruptedly - Pre-grouting can be limited to only a part of the profile depending on water loss
measurements - In pre-grouting the maximum grouting and stopping pressure is 0.5- 0.8 MPa, temporarily
the pressure can be 1 MPa - In post-grouting the maximum grouting and stopping pressure is 0.2- 0.5 MPa
According to the grouting logs, Rapid cement and Rheocem 650 were used as grouting cement. Besides access tunnels, lift shafts and ventilation shafts, local pre-grouting was made in halls 1 and 3, and post-grouting in halls 1, 2, 3 and 4. Systematic grouting was

39
made only locally. Grouting was performed according to plans, and no major problems occured. In pre-grouting there were usually 5- 12 grouting holes per one grouting fan. The grouting hole spacing in one fan was usually 1.5- 3 m, although in access tunnel 1 (Gyldenarinkatu) at the tunnel portal the grouting hole spacing was approximately 1 m. The grouting equipment was Scania (occasionally Craelius) and the grouting pressure was typically 0.5- 1 MPa. Water/cement ratio varied usually between 112 ... 2/1. Grout take was even slightly smaller than planned. The total grout take was about 41 000 kg cement in pre-grouting and 23 000 kg cement in post-grouting, adding to about 64 000 kg in total. In pre-grouting the grout takes varied between 1- 83 kg/borehole-m, the average grout take being 9.2 kg/borehole-m. In post-grouting the range was 0.3-410 kg/borehole-m, the average grout take being 20 kg/borehole-m. The average grouting time per hole was about 60 minutes (range from 10 min to 5 h) for pre-grouting and 75 minutes (range from 10 min to 8.5 h) for post-grouting. Thereby both grouting times and particularly grout takes were greater in post-grouting than in pre-grouting. In pre-grouting the largest grout takes were observed in shaft 1.2 and in access tunnel 1 (Gyldenarinkatu) at the tunnel portal, in post-grouting the grout take was greatest in the Gyldenarinkatu access tunnel and in the floor of hall 1. Some post -grouting was made in areas that had been pre-grouted before.
Areas with leakages can be seen on the engineering geological map in Figure 2-17. The total inflow has been approximately 60- 100 1/min which has been regarded as acceptable (no specific target value for total inflow has been set).
Groundwater table has lowered at the site of the shelter, but because of other extensive construction in the area it is impossible to distinguish the actual effect of the underground constructions on the groundwater situation. Surface building construction (including surface excavation), asphalt covering and channel constructions have considerably altered the groundwater infiltration and flow conditions in the area.
Conclusions
The starting point in Leppavaara underground car parking and civil shelter was to design and construct a large underground cavern into a bedrock dominated by open horizontal fracturing with clay infillings in the upper part of the bedrock.
The rock mass quality observed during construction was largely similar to what had been expected on the basis of geological pre-investigations, and presumably for that reason the grouting works were succeeded to be focused right and optimized well.
The sealing of the rock mass in leaking areas was to be made mainly by pre-grouting. If necessary, post-grouting would also be made. A special groutable bolt was developed during the work in order to be able to grout troublesome horizontal fractures. Besides access tunnels and shafts, local pre-grouting were made in halls 1 and 3, and post-grouting in halls 1, 2, 3 and 4. Systematic grouting was made locally. Grouting was performed according to plans, and no major problems occured. Grout take was even slightly smaller than planned. However, both grouting times and grout takes per borehole-m were greater in post-grouting than in pre-grouting. Water inflow into the facility was moderate 60 ... 100 1/min = 3 ... 5 1/min/100 tunnel-m.

40
2.4.3 Merihaka sport hall and civil shelter
The information presented in this chapter is based on unpublished documents, plans and minutes produced by the client (PWD Construction Management/City of Helsinki), the designer (Saanio & Riekkola Oy) and the contractor (Lemminldiinen Construction Ltd.).
Merihaka sport hall and civil shelter was constructed near the eastern shoreline of Helsinki in 2000. The site is situated in a fully constructed area, on the eastern side of the Hakaniemi market place and the underlying Metroline transportation system (Figure 2-15). The underground shelter consists of three large halls, a tunnel connecting them, and ventilation and personnel shafts. The halls are approximately 97- 233 m long, 5.4- 7.9 m high and 11 - 17 m wide. Hall 1 is used as a sport hall, hall 2 is for parking and hall 3 for technical use. The halls are also designed to serve as a civil shelter for 6 000 people. The lowest floor level of the shelter is approx. -20 m. The excavated volume of the shelter is 72 000 m3
•
Geological and hydrogeological environment
The shelter is constructed in bedrock which is mostly composed of migmatized mica gneiss. The bedrock surface in the area of the shelter is mainly between levels -1 and -5 m, according to surface drillings. Soil overburden is approx. 1 - 5 m thick, reaching a maximum thickness of 10 m in two bedrock depressions in the area (to the northeast and northwest of the shelter). The overburden consists of former sea-bottom sediments and landfill on top of them. The fill is mostly very water conductive. It is connected with the sea water.
Groundwater observations have been made in the area since the construction of Metroline. Groundwater table has varied in the 90s between levels -0.8 and 0.0 m and the perched water table between -0.4 and +0.6 (perched water is a separate water body above the main groundwater table). Closer to the sea the groundwater and perched water tables are affected by sea level fluctuations .
According to hydraulic measurements in investigation boreholes drilled at the location of the shelter, many water conducting fractures exist in the area.
Engineering geology
An engineering geological mapping of the excavated surfaces was made between 17th April and 16th November 2000 (Appendix 4). The rock mass quality was mapped according to Finnish engineering geological rock classification system (Gardemeister et al. 1976, Korhonen et al. 1974). Previously an adjoining tunnel has been mapped to serve for the designing of the Merihaka shelter.
The shelter is situated in fine- to medium-grained migmatitic mica gneiss. Medium- to coarse-grained pegmatite bodies occur locally. The main rock-forming minerals are quartz, feldspars and micas. Rock quality varies slightly.

41
Outside fracture zones the rock mass is mainly unweathered (RpO) and locally slightly weathered (Rp1). In fracture zones the degree of weathering varies from slightly weathered to completely weathered (Rp1- 3). The structural type of mica gneiss is mixed-structured whereas pegmatite is mass-structured. Mica gneiss is mostly moderately foliated (S2). The direction of the schistosity varies, being commonly approx. W-E oriented and dipping steeply (70- 90°) south or north.
The type of fracturing is cubic-wedge fracturing. Fracture density of the rock mass is mainly sparsely fractured or slightly fractured. In fracture zones the rock mass is occasionally abundantly to densely fractured (see Appendix 1 for terminology).
The main fracture sets are fracturing parallel to schistosity, dipping steeply south or occasionally north; direction of dip is southeast, south, southwest or north horizontal fracturing SE-NW oriented moderately dipping fracturing, direction of dip northeast local north-south oriented steeply dipping fracturing.
Fractures are mostly tight or filled. Rust, carbonate and mica are typical fracture fillings. Fractures parallel to schistosity are frequently slickensided. Clay occurs locally, mostly in fracture zones. The activity of the clay has not been examined, but according to earlier studies in the adjoining tunnel the clay is not active.
The rock mass quality of the intact rock mass is mixed-structured, sparsely or slightly fractured. According to the predominant rock quality the rock mass is brittle, unweathered and moderately foliated.
The fracture zones are often clay-filled, vertical or sub-vertical, SW-NE or E-W oriented, dipping south or southeast. The most significant fracture zones are
- W-E oriented Riill in hall 1 SW-NE oriented Rilll zone intersecting hall 1, hall 2 and hall 3 in the underground passage to shaft A Rim zone in the underground passage to shaft C.
Rock mass quality according to the Q-classification is predominantly fair (class C) or poor (class D) (Appendix 3).
Groundwater inflow control and grouting experiences
Groundwater table in observation wells around shafts B and C was not allowed to sink due to excavation. The designed maximum groundwater inflows for different parts of the shelter are presented in Figure 2-18.

42
Designed maximum inflows for shafts and halls: Shaft A and personnel shaft Hall1 part 1 Hall1 part 2 Hall 1 part 3 and shaft B Hall2 part 1 Halls 2 and 3 and return air shaft TOTAL
11/min 21/min 51/min 91/min 21/min 20 1/min
391/min
Figure 2-18. Merihaka shelter, areas of different inflow requirements.
To reach these goals and minimize the risks to groundwater conditions caused by excavation, the rock mass was to be sealed by pre- and post-grouting during construction. Large-scale pre-grouting was planned to be performed. Nearly the whole excavated area was to be systematically pre-grouted. In areas with strict inflow requirements, the plan was to carefully pre-grout the floor, walls and arch. Grouting was meant to create a tight grouted zone to border groundwater flow from the nearby market hall. A summary of the contractor's grouting plans is presented in Table 2-4. They differ only slightly from the original plans of the designer.
In pre-grouting the number of grouting holes per one grouting fan was usually 5- 10 in the tunnels and 5- 15 in the halls. The grouting hole spacing in one fan varied typically between 1- 2.5 m.

43
Table 2-4. The contractor's grouting plans for the Merihaka shelter. Contractor's plans correspond well the designer's plans.
Borehole design - Length of probe holes 5 - 25 m - Probe holes can be used for grouting if necessary - Length of grouting holes 10- 25 m
Schedule - Start of work on week 8/2000, grouting will be made throughout the excavation work - Daily working time 06:00 to 22:00 - If necessary, grouting will be made also during nights and weekends
Materials Microcement Rheocem 650 and Rapid cement will be used as grouting cement Rheobuild 2000 will be used as additive
Drilling - Pre-grouting is aimed to be made after every third excavation round - Overlapping of pre-grouting is 5 metres - Vertical grouting holes will be drilled every 10 metres - Grouting holes will be drilled without interruption to full length, unless low rock quality
requires phased grouting
Water loss measurements - Water loss measurements will be made by single packer method - If the measured Q is larger than 0.6 1/(min·m·MPa), pre-grouting will be started - Otherwise the supervisor will decide on pre-grouting
Grouting work - Grouting will be made in two phases:
( 1) In the first phase every second hole will be grouted (2) In the second phase the remaining holes will be grouted
- The interval between the grouting phases shall be approx. 2 days - In pre-grouting the maximum grouting and stopping pressure is 0.5-0.8 MPa, temporarily
the pressure can be 1 MPa; the minimum pressure is ground water pressure + 0.2 MPa
Underground construction was planned to be performed complying with the following principles: 1. The excavations are mainly pre-grouted systematically. 2. A tight zone (grouting curtain) is constructed in the access tunnel by grouting. 3. Inflows are located in advance by drilling probe holes in areas where no systematic
pre-grouting is made. 4. Inflows are monitored. 5. Post-grouting is made when necessary. 6. Groundwater table is monitored. 7. If necessary, water will be fed through ex1sttng infiltration wells or new
groundwater infiltration wells will be constructed.

44
Surface excavations (at the places of the shafts) extending under ground water table were to be made watertight and the groundwater table was not allowed to sink outside the excavation.
The total inflow to the openings was to be measured by the contractor once a week on average. The areal distribution of the inflows was to be observed during the geological mapping in the beginning of the construction, and later the inflows to different areas were to be estimated from channels, when the channel excavations were finished. If the total inflows were to exceed the target values, the openings were to be divided into separate inflow areas by constructing dams to measure the amount of water inflow of the areas.
Horizontal and gently dipping open fractures were identified in the roof of the hall 1 and hall 2. Water losses up to 150 1/(min·m·MPa) were measured in places. This place was not sealed since it was that far away from the roof of the hall. More often the water loss measurements showed values between < 1. .. 6 1/(min·m·MPa). The grouting fans for different profiles included both steep grouting holes to catch the horizontal fracturing and gentle grouting holes to catch the other fracturing. The grouting equipment was Craelius (locally Hany) and the grouting pressure varied between 0.2 ... 1.0 MPa being typically~ 0.8 MPa. Microcement Rheocem was usually used as the grout and the wc ratio was varied usually between 112 ... 4/5. The total grout take in pre-grouting of halls and tunnels was about 100 000 kg cement, which is - 8.7 kglborehole-m on average (range 0.4 ... 66.7 kglborehole-m). The highest grout takes were associated to the steeply dipping Rill -zone intersecting the halls and to eastern parts of the halls. The average grouting time per hole was about 1 hour (range between 10 min to 3 hours 20 min).
The shafts were systematically pre-grouted as well. The grouting fans consisted of 4 ... 16 holes depending on the size and shape of the shaft. The grout take was about 13 000 kg cement in total, which means about 11.0 kg cement per borehole-m (1.4 ... 90.9 kg/borehole-m). In shaft C the grout take was clearly higher compared to the others (23 kglborehole-m).
Post-grouting was done in the areas where highest grout takes were observed during pre-grouting- in the nearby Rill-zone and locally in the eastern parts of the halls. Also post-grouting was done all over the hall 3. Total grout take was about 20 000 kg cement and on average 22 kglborehole-m (4 ... 250 kg/borehole-m). The highest grout takes during post-grouting were in hall 2.
One exceptional observation was that there were problems in hardening of the cementitious grout in shaft C, which required much regrouting. The reason for this is not studied but shaft C is located near the sea and landfill areas. The problem with the hardening of the grout may be due to brackish water or some chemicals from landfills.
Due to sufficient pre-grouting the Merihaka shelter turned out to be quite dry. Water inflows occured only locally, mainly in hall 2 in the E-W oriented fracture zone, in hall 1 and in the underground passage to shaft A (between section marks PL 40- 130 m). The inflows were mainly separate moisture observations on wall surfaces and arch or
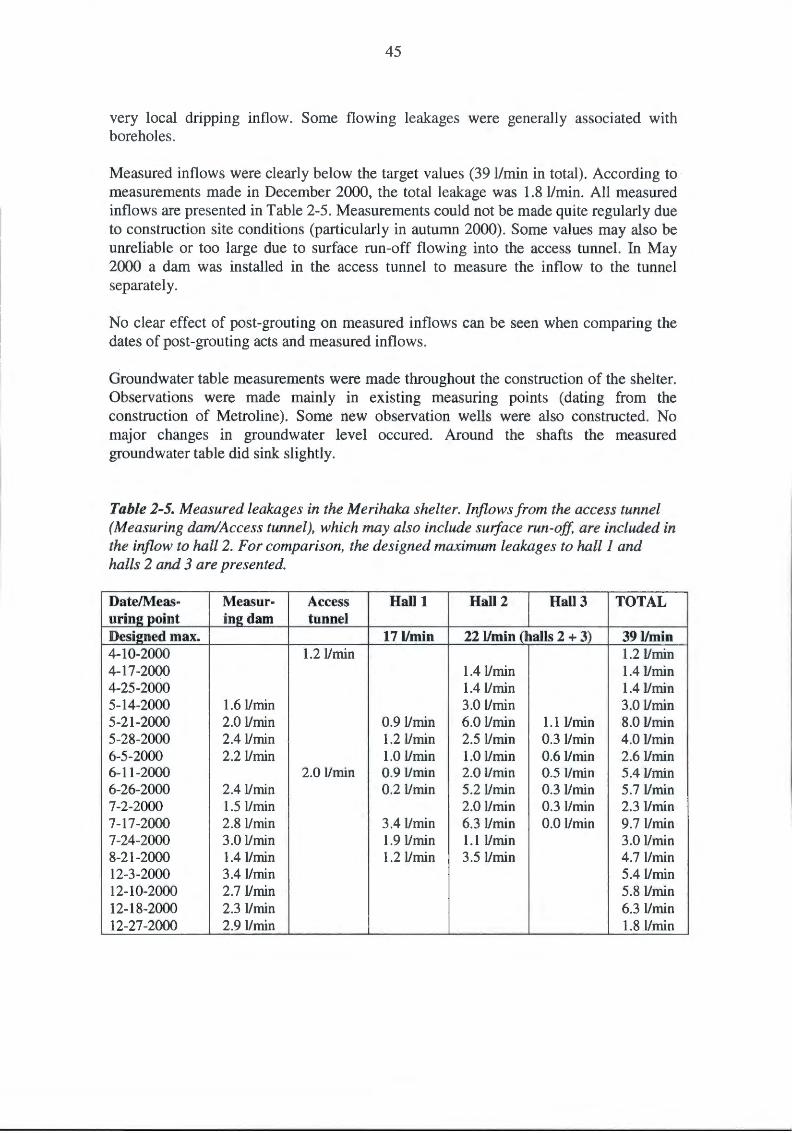
45
very local dripping inflow. Some flowing leakages were generally associated with boreholes.
Measured inflows were clearly below the target values (39 Vmin in total). According to · measurements made in December 2000, the total leakage was 1.8 Vmin. All measured inflows are presented in Table 2-5. Measurements could not be made quite regularly due to construction site conditions (particularly in autumn 2000). Some values may also be unreliable or too large due to surface run-off flowing into the access tunnel. In May 2000 a dam was installed in the access tunnel to measure the inflow to the tunnel separately.
No clear effect of post-grouting on measured inflows can be seen when comparing the dates of post -grouting acts and measured inflows.
Ground water table measurements were made throughout the construction of the shelter. Observations were made mainly in existing measuring points (dating from the construction of Metro line). Some new observation wells were also constructed. No major changes in groundwater level occured. Around the shafts the measured groundwater table did sink slightly.
Table 2-5. Measured leakages in the Merihaka shelter. Inflows from the access tunnel (Measuring dam/Access tunnel), which may also include surface run-off, are included in the inflow to hall 2. For comparison, the designed maximum leakages to haUl and halls 2 and 3 are presented.
Date/Meas- Measur- Access Halll Ha112 Ha113 TOTAL urin~ point in~ dam tunnel Designed max. 171/min 221/min (halls 2 + 3) 391/min 4-10-2000 1.21/min 1.21/min 4-17-2000 1.41/min 1.4llmin 4-25-2000 1.4llmin 1.41/min 5-14-2000 1.61/min 3.0 l/rnin 3.0 1/min 5-21-2000 2.0 llmin 0.9l/min 6.0 l/rnin 1.1llmin 8.0 1/min 5-28-2000 2.41/min 1.21/rnin 2.5 llrnin 0.3llmin 4.0 1/rnin 6-5-2000 2.21/min 1.0 llmin 1.0 llrnin 0.6llmin 2.61/min 6-11-2000 2.0 llrnin 0.9llmin 2.0 1/min 0.5 1/min 5.41/min 6-26-2000 2.41/min 0.21/rnin 5.2l/rnin 0.31/min 5.7 1/min 7-2-2000 1.51/min 2.0 1/rnin 0.31/min 2.31/min 7-17-2000 2.8l/min 3.41/rnin 6.3 1/rnin 0.0 llmin 9.7 1/min 7-24-2000 3.0 1/min 1.9 1/rnin 1.11/rnin 3.0 1/rnin 8-21-2000 1.41/min 1.21/min 3.5 1/rnin 4.71/min 12-3-2000 3.4l/min 5.41/min 12-10-2000 2.7llmin 5.81/min 12-18-2000 2.3 1/min 6.3llmin 12-27-2000 2.91/min 1.8llmin

46
Conclusions
Merihaka shelter in Helsinki city area is an example of successful grouting. The environmental requirements were very tight, but still the inflows were clearly below the target value (391/min in total). Groundwater table around two shafts was not allowed to sink due to excavation. The designed maximum groundwater inflows for different parts of the shelter varied between 2 ... 20 1/min. Total allowed inflow was set to be 39 1/min.
Rock mass quality according to the Q-classification is predominantly fair (class C) or poor (class D). Typical for the bedrock was horizontal fractures with high water losses, even 150 1/(min·m·MPa). Clay fillings were present.
The rock mass was planned to be sealed by pre- and post-grouting during construction. The used grout was mainly microcement. Nearly the whole excavated area was to be systematically pre-grouted. The grouting pattern was designed to catch both horizontal and other fractures. Inflows were located in advance by drilling probe holes in areas where no systematic pre-grouting was made. The highest grout takes were associated to a steeply dipping Rilll-zone intersecting the halls.
Due to sufficient pre-grouting the Merihaka shelter turned out to be quite dry and no major changes in groundwater level occured. Measured total inflow was only about 5 % of the set target values.

47
2.4.4 Helsinki university library underground store
The information presented in this chapter is based on unpublished material produced by the client (University of Helsinki), the designer (Saanio & Riekkola Oy) and the contractor (Lemminkainen Construction Ltd.), as well as the designer of Kluuvi parking hall (Rockplan Ltd).
University of Helsinki has constructed an underground store to enlarge the facilities of the university library (Figure 2-19). The store is located in central Helsinki, surrounded by other underground facilities . A parking hall was constructed at the same time on the western side of the library store. The first construction phase began in the spring 1998 and was completed at the end of 2000. The second construction phase, producing a further enlargement of the library archive, was planned to commence 10 to 15 years after the first phase. The underground store (first phase) contains a four-storey structure in a cavern and 4 staircases and elevators to the ground in four shafts. There is also a tunnel for service traffic. The cavern (hall) was designed to be 212 m long, 16.6 m high and 21.2 wide, with a volume of 80 000 m3
. It is situated between levels -24 to - 7 m, whereupon 15 - 20 metres of bedrock remain above it. Two tunnels were also excavated, one leading to the main access tunnel and one to shaft C.
Geological and hydrogeological environment
The store was constructed in the middle of a bedrock elevation covered by an approx. 0 - 3 m thick soil overburden. The ground surface level varies generally from + 10 to + 15 m. There is one bedrock depression (crushed zone) to the west of the bedrock elevation and one to the north. These are covered with overburden up to 35 m and 15 m thick, respectively. The overburden comprises of till, sand, silt, clay and landfill.
The bedrock is mainly composed of migmatite with granite and mica gneiss. The strike of foliation is E-W and the foliation dips steeply (55 - 90°) south. Thin fracture zones are common! y found in the area.
Groundwater measurements had not been previously made at the location of the store, but some observations had been made in the vicinity of the bedrock elevation for about ten years. According to them, groundwater situation has been stable in the area, the greatest fluctuations being approximately 2 m. The groundwater table at the southern edge of the store was approximately at level 0 in January 1998. Groundwater observations were planned to be made in seven boreholes drilled at the location of the shelter in January 1998.

48
Figure 2-19. Helsinki university library and the underground library store.
Engineering geology
An engineering geological mapping has been made in the underground store (Figure 2-20) following the Finnish engineering geological rock classification system (Gardemeister et al. 1976, Korhonen et al. 1974) (Appendix 1). The main rock type of the store is migmatitic mica gneiss with 0- 20% neosome. Locally there are large sections (up to tens of square metres) of pegmatitic granite. The main rock-forming minerals of these rocks are quartz, feldspars and micas. The grain size of mica gneiss varies from fine-grained to medium-grained. Pegmatitic granite is usually coarsegrained. Spatial variation in rock quality can be seen in both the degree of weathering and the degree of foliation.
In the rock mass outside the fracture zones the degree of weathering is mainly RpO and locally Rp0-1 (locally in the hall between section marks PL 90- 180 m and in the vicinity of shaft C). In fracture zone R3 the degree of weathering is Rp1-2 and in fracture zone R4 it is Rp1-3.
The degree of foliation is typically weakly to moderately foliated (S 1-2), locally there is strong foliation. Foliation dips often steeply (70- 80°) south with a strike perpendicular to the longitudinal axis of the hall, approx. E-W oriented.

49
The predominant type of fracturing is wedge fracturing, whereas mixed fracturing occurs locally. Fracture frequency varies from sparsely fractured to densely fractured. Fractures are typically long forming thus large blocks as well.
As regards main fracture directions, different areas can be distinguished. Throughout the store a main fracture set is parallel to foliation, perpendicular to the hall, and dips steeply (70- 80°) south. The fracture frequency of this set varies usually between 1 - 7 fractures/m. Between fracture zones R3 and R4 the fractures of this direction are long and undulating and occur sparsely. As to other main fracture sets, the hall is divided into two dissimilar areas by crush zone R4. In addition, the tunnel leading to shaft C and the connecting tunnel to Kluuvi have their own fracturing characteristics.
In the hall on the southern side of R4 the other main fracure sets are: a NNE-SSW oriented fracture set dipping moderately or steeply (50- 80°) east (1 - 7 fractures/m); and a NE-SW oriented steeply dipping (NW/80°) fracture set (1- 7 fractures/m). In the hall on the northern side of R4 the fracturing is clearly denser. The other main fracure sets are: long NW -SE oriented moderately dipping (NE/60°) fractures (5- 15 fractures/m); and NNE-SSW oriented steeply dipping (WNW/80°) fractures (1 - 7 fractures/m) . In the tunnel leading to shaft C horizontal fractures are more common than in the hall, and the third main fracture set is parallel to the tunnel, dipping east, with 5 - 7 fractures/m. In the connecting tunnel to Kluuvi the other main fracture set is NNE-SSW oriented, moderately to steeply dipping fracturing.
In the hall between section marks PL 0- 50 m the fractures are typically open and frequently coated with rust, in other parts of the store fractures are filled and coated with rust. In the connecting tunnel to Kluuvi chlorite and carbonate have been encountered as fracture fillings. Clay fillings are common in fracture zones, to the north of crush zone R4 and in the tunnel leading to shaft C. Fracture filling samples were taken from crush zone R4 (3 samples) and from the right-hand wall of the hall between section marks PL 140- 160 m (4 samples), and they were analyzed by X-ray diffraction method at the Geological Survey of Finland. Along with feldspars and quartz all samples contained illite and swelling smectite (in fine fraction the content of illite+smectite varied between 10 - 60 %) as well chlorite, and some samples contained also carbonate (calcite) and kaolinite. Because of the swelling smectite two extra samples were taken (one from R4 and another from the right-hand wall between section marks PL 130- 140 m) and tested by swelling pressure tests at GEO/City of Helsinki. The former sample was also tested by free swelling test. The clays were slightly active. The maximum swelling pressure was 71.4 kPa in the former sample and 96.4 kPa in the latter. The free swelling of the sample from R4 was 100%.
Outside the fracture zones the rock mass quality is Se2-3/h (RpO, S2) in the hall between section marks PL 0- 60 m, Se3/h-Rilli (Rp0-1, S2) in the hall between section marks PL 60- 190 m, and Se2-3/h-Rilll (Rp0-1, S2) in the connecting tunnel to Kluuvi and in the vicinity of shaft C.

or k 1
•iston insti l uulti k
LJ Liiker k
1
tJ=C n @
14 .5
11 . 7
10.2
7.0
50
Yliopisto k
5
~ I
1.3.8
9.9
· · ·v···
Vertical foliation Foliation and dip
Fracturing and dip
Fracturing p•rallel to folilltlon •nd dip
- --~---
---o---
Sm
Sel-l
S2
D
Vertical fracturing
Horizontal fracturing
Long fractures
Clay minerallnfllllng
Rock mall quality
Degree of -atherlng
Cl-c:la11 and itl borders
Dropping leakage
Moisture due to leakage
Fracture zonn
Rock Mass Classification
Rock Classes G F E D c B A
exceptional poor extremly poor very poor poor fair good very good
Rokennuskohteen nHnl jo oso.te
KOY HELSINGIN KIRJASTOLUOLAT HELSINKI P;jtuslusla~
RG-KARTOITUS 1:1000
Figure 2-20. Engineering geological mapping and Q-classification of the Helsinki university library store.

51
Fracture zones observed in the store are:
Rl, a NE-SW oriented Riiii zone, which intersects the connecting tunnel to Kluuvi, has a width of 0.5 m and dips gently east; could be an extension of crush zone R4 R2, a W-E oriented Riiii zone near shaft C, which dips steeply south and has a width of 1 m R3, a NE-SW oriented nearly vertical Rim fracture zone, which crosses the southern part of the hall, is thin (0.2 m) and clay-filled R4, a NE-SW oriented steeply dipping RiiV zone, which intersects the hall in the middle, is 1 m wide on average, clay-filled and slightly to completely weathered; this crush zone also intersects the channel, and the zone or a branch of it intersects the lower part of shaft B the hall is intersected between section marks PL 90- 180 m by a moderately dipping, 70 m wide Se3-Riiii zone, which is parallel to NW-SE oriented fractures dipping NE there are local Rim sections in the connecting tunnel to Kluuvi and in the vicinity of shaft C.
Rock mass quality according to the Q-classification is good (class B) in the hall between section marks PL 0 - 50 m, fair (class C) in the connecting tunnel to Kluuvi and between section marks PL 50 m and crush zone R4. Immediately to the north of R4 the rock mass quality is poor (D). In other areas and in the fracture zones the Q-values are reduced by the occurrence of swelling clays (all clays were assumed similar to the samples) and abundant fracturing here and there. In these areas as well as in fracture zones Rl, R2 and R3 the rock quality is very poor (E) and in R4 it is extremely poor (F).
Grouting plans and experiences
The library store is located within a bedrock elevation where the rock mass is tight. The hydraulic conductivity of the rock mass was estimated to be 3·10-8 rnls according to hydraulic testing in a horizontal borehole drilled near the cavern. Water inflow in the underground store was estimated to be -4 1/min/1 00 m and thereby total inflow approx. 10 1/min (without grouting). Due to groundwater recharge and flow conditions in the area it was assessed that the possible groundwater immediately above the store would leak into the excavation and the groundwater table could lower locally even down to the floor level of the cavern. Therefore it was estimated that the actual total inflow to the store would be approximately 51/min when the excavation work is finished and the groundwater situation has stabilized. It was evaluated that the excavation would not have a harmful effect on nearby foundations or vegetation in spite of local lowering of ground water table.
According to previous investigations the rock mass quality of the bedrock elevation is so tight that further sealing of the rock mass by grouting was not deemed possible. Sealing could only be done if single, very water conductive fracture zones or fractures would be encountered during excavation.
52
Underground excavation was planned to be done without causing harmful changes in hydrogeological conditions. The target was to limit the total inflow to 7 1/min. The underground construction was planned to be carried out complying with the following principles:
Possible inflows will be predicted in the excavation phase by probe drillings and on the basis of possible leakages in the blasting holes, and they are sealed mainly by pre-grouting. The library access tunnel and the tunnel leading to shaft C as well as all shafts will be pre-grouted systematically. Inflow is monitored by weekly measurements if possible. Leakages will also be mapped every two weeks. If necessary, post-grouting will be performed to limit inflows. Groundwater and perched water tables in the surroundings of the Kaisaniemenkatu bedrock settlement and The House of the Estates will be monitored regularly (every two weeks) during the work by means of existing observation well network. If necessary, groundwater will be infiltrated through existing wells or new groundwater infiltration wells will be constructed.
Grouting (both pre- and post-grouting) was made in all four shafts, in the tunnels and in some sections of the hall, e.g. in the vicinity of fracture zone R3. The used grout was Rapid cement. In pre-grouting the number of grouting holes per one grouting fan was usually 10- 12 in the tunnels and 13 in the hall. The grouting hole spacing in one fan was usually 1- 1.5 m in the tunnels and 2-4 m in the hall.The length of the grouting holes varied between 4- 15 m in the pre-grouting of the shafts. A grouting hole length of 5 m was used in the post-grouting of shaft C. Various pre-grouting fans were designed for shafts and tunnels.
Rapid cement was used as the grout. Water/cement ratio was typically between 111 ... 311 and used grouting pressures usually 0.5 ... 1.5 MPa. The grouting equipment was Craelius. Grouting times varied between 4 minutes to 3 hours per hole.
In pre-grouting of the shafts the grout takes varied between 4 ... 27 kg/borehole-m being the highest in the shaft C, which required also post-grouting (12 kg/borehole-m). Grouting information of shafts is collected into the Table 2-6. In pre-grouting of the hall 2 060 kg cement was used in total (6 kg/borehole-m on average).
According to the mapping the underground store was generally quite dry. Local surfaces moistened by leakage were observed. Dropping inflows occured in fracture zones R3 and R4, locally to the north of R4 and near shaft C.
Measured inflows into the library store are presented in Table 2-7. Determination of actual inflows has occasionally been disturbed by grouting, boring of bolt holes, washing of rock surfaces, after-treatment of shotcrete surfaces and the leaking of surface waters into shafts and access tunnel. The library store was almost completely excavated before the end of 1998, and during this time inflows were under control. Between October 1998 and August 1999 only the combined inflows of the library store and the adjacent parking hall were measured. This total inflow was mostly about

53
15- 30 1/rnin (share of library store 5- 10 1/min by a rough estimation) between October 1998 and February 1999. Later the total inflow increased further e.g. due to leaking of surface waters (excavation of the shafts). For example, in early April 1999 the measured total inflow was 721/rnin, of which only 121/min originated from the library store and the parking hall. This is below the combined target value (221/rnin). Later this target value was changed to 15 1/rnin, and the measured inflows have also decreased, being roughly 20 1/rnin (including some extra water) between June-September 1999. In September 1999 the inflow of the library store alone was measured again, and it was 6. 7 1/rnin (including some extra waters), being thus below the limit 7 1/rnin.
The excavations did not have any significant effect on the groundwater table in the surroundings of the store. Groundwater table showed normal seasonal fluctuations. During the construction the groundwater table sank only locally in the immediate vicinity of the store. In the measuring points on Fabianinkatu the groundwater table declined to level -1.5 at lowest, and groundwater infiltration was started at this location in December 1998.
Table 2-6. Grout takes in the shafts of Helsinki university library underground store.
Shaft/Grout Pre-grouting Pre-grouting Post-grouting Post-grouting take Total kg cement kg/borehole-m Total kg cement kg/borehole-m Shaft A 1340 12.9 - -ShaftB 110 3.6 - -Shaft C 1430 27.0 700 11.7 ShaftD 815 15.7 - -
Table 2-7. Measured inflows into the university library store. Erroneous values (due to e.g. washing of rock surfaces) are excluded.
Date/Inflows Access tunnel to Library store Excavated volume library store
Target value 71/min 5-11-1998 0.5 1/rnin 5-18-1998 0.81/rnin 10 000 m3
5-25-1998 0.11/rnin 6-1-1998 0.91/rnin 16 200m3
6-15-1998 1.0 1/rnin 21 600m3
6-29-1998 0.71/rnin 25 800m3
7-6-1998 0.8 1/rnin 29 200m3
7-13-1998 0.71/rnin 31 800m3
7-20-1998 2.91/rnin 33 900m3
8-17-1998 6.0 1/rnin 41400 m3
9-28-1998 7.0 1/rnin 43 000 m3
9-10-1999 6.7 1/rnin 75 900m3

54
Conclusions
Not much grouting was planned for Helsinki university library underground store. Only shafts and adjacent tunnels were designed to be systematically pre-grouted, other grouting was optional if regarded necessary. Pre-grouting was made in all four shafts and post-grouting in one shaft. Pre-grouting was also regarded necessary in the tunnels and in some sections of the hall. The consumed masses were not large but grouting times were great.
Beforehand the inflow in the underground store was successfully estimated to be 3.91/min/100 m (total inflow approx. 10 1/min). The target value was set to be 7 1/min (respectively 2.7 1/min/100 m), which was barely reached (6.7 1/min = 2.6 1/min/100 m). The excavations did not affect ground water table in the surroundings of the store.
Generally Helsinki university library underground store was a construction contract without any special problems considering water inflows and grouting.
55
3 DISCUSSION AND CONCLUSIONS
Experiences on water inflow and grouting from six Finnish underground facilities are studied in this report. The studied excavations are located in geologically different conditions and they have been constructed for different purposes. Olkiluoto VLJ repository and Hastholmen VLJ repository are storages for low and medium level nuclear waste. They are located on islands and they extend to about -100 m depth. Fourteen kilometres long Turku-Naantali district heating tunnel is also locally relatively deep (down to -90 m), and it passes through very different geological formations . Three shallow (down to a depth of 35 m below ground surface) caverns for civil use purposes located in Helsinki area were also studied.
The purpose of this study was to combine and analyse experiences on grouting to restrict water inflows. Information of geology and hydrogeology as well as grouting materials, patterns and grouting technique were of interest. Following issues were paid special attention to:
• Did pre-investigations give accurate information of geological and hydrogeological conditions from water inflow and grouting point of view?
• Were the amount of water inflow estimated accurately beforehand? • What amount of water inflows were reached? Were the set target inflows reached by
grouting? • How did different geological factors affect grouting? • What special problems were associated in grouting?
The material and documents used in this work were miscellaneous: published research reports, designer's documents, unpublished construction site minutes and logs, engineering geological maps as well as discussions with designers.
Olkiluoto VLJ repository is an example of a relatively dry cavern (- 4 1/min/100 tunnel-m) where minor post-grouting had to be made, but not successfully. Hastholmen VLJ repository represents a cavern with high water inflows (- 20 1/min/100 tunnel-m) and high amount of consumed cement in both pre- and post-grouting. However, after construction the amount of inflowing water has reduced considerably and the descending trend has been significant during operation of the facility (from approx. 300 1/min to 150 1/min). Turku-Naantali district heating tunnel was studied carefully after construction. It was a challenging project where much pre- and post-grouting was made. The three shallow shelters in the Helsinki area were more conventional projects with different grouting experiences. Information of water inflows and grout takes from the studied cases is collected into Table 3-1.

56
Table 3-1. Amount of water inflows and grout takes in six different underground facilities.
Volume Target inflow Measured Measured (1000 m3
) (Vmin or total inflow inflow (Vmin/ Vmin/100 m) (Vmin) 100 tunnel-m)
Olkiluoto 90 - 40 .. .45 -4
VLJ repository
Hastholmen 110 115+80 150 -20
VLJ repository = 195 (earlier 300) (access tunnel)
Turku-Naantali district (length 3 I 5 I 10 350 .. .490 2.5 .. . 3.5 heating tunnel 14 km) 1/min/100 m
Leppavaara underground 106 - 60 . .. 100 3 . . . 5 car parking
Merihaka sport shelter 72 39 1.8 - 0.2
Helsinki university 80 7 6.7 2.6
library store
Grout take (1000 kg cement)
5.8
758
-
64
133
6.5
Target inflows varied from couple of litres per minute per 100 m tunnel up to about 10 1/min/100 tunnel-m. Target inflows were usually reached, but locally there were places where grouting did not lead to desired reduction of inflow. However, during construction water inflow is difficult to measure and the results may be influenced by water used in construction. Based on gathered experiences it is estimated that inflow of some couple of litres per minute is realistic to reach, although not for all kind of geological environments (like Hastholmen rapakivi area with open fractures). Grouting fans included typically about 10 grouting holes (5 ... 15) of the length of usually 10 ........ 20 m and the hole spacing was usually about 1.5 m (0.5 ... 3 m). Grouting materials were typically cementitious (ordinary Rapid cement or microcements), chemical grouts were used seldom. Cement takes varied a lot, typically between ten to hundreds of kg/borehole-m.
Saving for example in pre-investigations, pre-grouting or time hit back in a couple of cases, for example in Olkiluoto VLJ repository and Turku-Naantali district heating tunnel. However, these cannot be regarded as unsuccessful projects; Olkiluoto VLJ repository was dry although post-grouting did not reduce inflow. In Turku-Naantali tunnel the final aim concerning environmental effect was reached with much post-grouting, but not easily. A typical problem in post-grouting in these two cases was that the inflows moved to other fractures.
Pre-grouting reduced the need for post-grouting, and pre-grouting generally led to success in reducing the inflow. A good example of this is Merihaka sport hall and civil shelter.

57
The predicted amount of water inflow corresponded quite well the measured inflow in Helsinki university library underground store. The behaviour of water inflow into Hastholmen VLJ repository as the construction proceeded was estimated well. In other cases such estimations were not made.
Several geological factors were observed to affect the grouting result. Clay and chlorite infillings were associated to fractures with higher inflow and with difficulties in grouting. Naturally the wider fracture apertures the higher inflows; that was clear reason for high inflows in Hastholmen VLJ repository. Besides fracture zones, long fractures were associated to higher inflows in a couple of cases. In Turku-Naantali tunnel it was seen that the grout take increased as the fracture density increased. Another observation was that the number of fractures and clay fillings increased grouting times.
Environmental effects (decrease in groundwater table or changes in saline-fresh water interface) were usually quite well controlled in the studied cases.
Based on experiences from six underground facilities the following remarks are made: • Comprehensive pre-investigations are of great value and are very often an essential
part of planning successful control of water inflow by grouting. • Good pre-investigations should produce information about hydraulic conductivities
/transmissivities of rock mass/fracture zones/even single fractures, fracturing system (fracture orientations, lengths, connectivity, even channeling of flow) and fractures (aperture and its variation, infillings).
• Well made pre-grouting is usually likely to decrease water inflow, but results of post -grouting are much more uncertain.
• Current grouting methods and materials can lead to satisfying results in "normal environment" if grouting works are focused and designed right, being suitable for the geological environment.
• 2 ... 3 1/min/100 tunnel-m is a realistic target for water inflow in ordinary tunneling projects with conventional grouting technique and materials in "normal environment".
• Such geological factors like clay infillings in fractures cause difficulties in grouting. • High uncertainties are involved in measuring the water inflow. • To estimate water inflow into underground facilities hydraulic conductivity and its
variation as well as the ground water pressure should be known well. • Decisions and investments made by an owner/a contractor play a very important
role.

59
REFERENCES
Ahokas, H. & Hanninen, T. 1996. Hydrological monitoring during construction of the VLJ Repository in Loviisa. Vantaa, Finland: IVO International Oy. Working Report IVONLJ 96-07. (In Finnish with an English abstract)
Ahokas, H. & Aikas, K. 1991. Geology and hydrogeology of the Cape Ulkopaa at Olkiluoto. Teollisuuden Voima Oy, Helsinki, Finland. Nuclear waste commission of Finnish Power Companies. Report YJT-91-05. (In Finnish with an English abstract)
Anttila, P. 1997. Geological studies during the first construction stage of the VLJ -repository in Loviisa, Finland, summary report. Vantaa, Finland: IVO Power Engineering Ltd. Working Report IVONLJ 97-03. (In Finnish with an English abstract)
Anttila, P. & Viljanen, E. 1995. Core drillings YTS, YR6, YT7, LPVA4, LE3, LE4, and LE5 at Hastholmen in Loviisa. Vantaa, Finland: IVO International Ltd. Working Report IVONLJ 95-02. (In Finnish)
Anttila, P., Ahokas, H., Front, K., Hinkkanen, H., Johansson, E., Paulamaki, S., Riekkola, R. , Saari, J., Saksa, P., Snellman, M., Wikstrom, L. & Ohberg, A. 1999. Final disposal of spent nuclear fuel in the Finnish bedrock - Hastholmen site report. Helsinki, Finland: Posiva Oy. POSIV A 99-08.
Anttila, P. , Saari, J., Johansson, E. , Sievanen, U., Ohberg, A. & Snellman, M. 2001. Long term monitoring of two underground repositories for low- and medium-level reactor waste in Finland. Proceedings of the ISRM Regional Symposium Eurock 2001 . Rock Mechanics- a challenge for society. June 4-7, 2001 Espoo, Finland.
Auvinen, K. 1994. The rock mechanical stability of the access tunnel of the Loviisa VLJ repository. IVO International Ltd. Working Report IVONLJ 94-09. (In Finnish with an English abstract)
Auvinen, K. 1997. The rock mechanical stability of the VLJ Repository in Loviisa, Finland. Vantaa, Finland: IVO Power Engineering Ltd. Working Report IVONLJ 97-02. (In Finnish with an English abstract)
Backblom, G. 2002. Experience on grouting to limit inflow to tunnels - Research and development and case studies from Sweden. Posiva Oy, Helsinki, Finland. Working report 2002-18.
Gardemeister, R., Johansson, S., Korhonen, P., Patrikainen, P., Tuisku, T. & Vahasarja, P. 1976. Application of the engineering geological classification system. Technical Research Centre of Finland, laboratory of geotechnics, Espoo, Finland. Bulletin 25. (In Finnish)
Gardemeister, R. & Koskiahde, A. 1984. Engineering geological experiences during the construction of a district heating tunnel. Imatran Voima Oy, Helsinki, Finland. IVO report series R-investigations R-84-1. (In Finnish)

60
Hagros, A. & Ohberg, A. 2001. Hydrological monitoring in the VLJ repository at Olkiluoto during 2000. Teollisuuden Voima Oy, Helsinki, Finland. Working Report VLJ-5/01. (In Finnish with an English abstract)
Hakala, T. 1998. Evaluation of the research and monitoring program of the bedrock in the VLJ-repository at Olkiluoto. Teollisuuden Voima Oy, Helsinki, Finland. Working Report VLJ-1/98. (In Finnish with an English abstract)
Hakala, T. & Ohberg, A. 1998. The hydrological monitoring of the Olkiluoto VLJ-repository in 1997. Teollisuuden Voima Oy, Helsinki, Finland. Working report VLJ-7/98. (In Finnish with an English abstract)
Herva, S. & Ahokas, H. 1994. Effects of the excavation of an access tunnel of the VLJ Repository on the hydrogeology at Hastholmen. IVO International Oy. Working Report IVONLJ 94-06. (In Finnish with an English abstract)
Ikavalko, 0. & Niskanen, P. 1989a. Engineering geological mapping and photographing of the transport tunnel of the Olkiluoto VLJ-tunnel. Teollisuuden Voima Oy, Helsinki, Finland. TVONU Final disposal, Working report 89-01. (In Finnish)
Ikavalko, 0. & Niskanen, P. 1989b. Engineering geological mapping and photographing of the hall, the service space and the excavation tunnel of the Olkiluoto VU -tunnel. Teollisuuden Voima Oy, Helsinki, Finland. TVONLJ Final disposal, Working report 89-09. (In Finnish)
Ikavalko, 0. & Aikas, K. 1991. Engineering geology of the VLJ-repository. Teollisuuden Voima Oy, Helsinki, Finland. Nuclear waste commision of Finnish Power Companies. Report YJT-91-05. (In Finnish with an English abstract)
Korhonen, K-H., Gardemeister, R., Jaaskelainen, H., Niini, H. & Vahasarja, P. 1974. Rock classification in civil engineering. Technical Research Centre of Finland, laboratory of geotechnics, Espoo, Finland. Bulletin 12. (In Finnish)
Kuula, H. & Johansson, E. 1991. The rock mechanical stability of the VLJ repository. Teollisuuden Voima Oy, Helsinki, Finland. Report YJT-91-03. (In Finnish with an English abstract)
Lindberg, A. 1994. The petrographic bedrock mapping and fracture description from the driving tunnel of the low- and intermediate-level nuclear waste repository of Loviisa power plant. IVO International Oy. Working Report IVONLJ 94-02. (In Finnish with an English abstract)
Lindberg, A. 1996. The petrographic bedrock mapping of the repository for low- and intermediate-level nuclear waste at Hastholmen Island, Loviisa. Vantaa, Finland: IVO International Oy. Working Report IVONU 96-02. (In Finnish with an English abstract)

61
Nykyri, M., Helenius, J., Johansson, E. & Nieminen, J. 1994. The monitoring of the bedrock of VLJ-repository in 1992. Teollisuuden Voima Oy, Helsinki, Finland. TVONLJ-Final Disposal, Working Report 94-02. (In Finnish with an English abstract)
Nykyri, M., Helenius, J., Johansson, E. & Ohberg, A. 1995a. The monitoring of the bedrock of VLJ-repository in 1993. Teollisuuden Voima Oy, Helsinki, Finland. TVONLJ-Final Disposal, Working Report 95-01. (In Finnish with an English abstract)
Nykyri, M., Helenius, J., Johansson, E., Snellman, M. & Ohberg, A. 1995b. The monitoring of the bedrock of VLJ-repository in 1994. Teollisuuden Voima Oy, Helsinki, Finland. TVONLJ-Final Disposal, Working Report 95-02. (In Finnish with an English abstract)
Saari, J. 2001. Hydrological monitoring in the VLJ-repository in 2000 in Loviisa, Finland. Fortum Engineering Ltd. Working Report FORTUMNLJ 01-01. (In Finnish with an English abstract)
Sievanen, U. 2001. Leakage and Groutability. Posiva Oy, Helsinki, Finland. Working report 2001-06.
Sievanen, U. & Ohberg, A. 1999. Hydrogeological monitoring in the VLJ-repository at Olkiluoto during 1998. Teollisuuden Voima Oy, Helsinki, Finland. Working report VLJ-4/99. (In Finnish with an English abstract)
Sievanen, U. & Ohberg, A. 2000. Hydrogeological monitoring in the VU-repository at Olkiluoto during 1999. Teollisuuden Voima Oy, Helsinki, Finland. Working report VLJ-4/00. (In Finnish with an English abstract)
Viljanen, E. 1994. Engineering geological mapping of the access tunnel for the repository of low- and medium-level reactor waste at the Loviisa NPP site. IVO International Ltd. Working Report IVONLJ 94-03. (In Finnish with an English abstract)
Viljanen, E. 1996. Engineering geological mapping of the repository of low- and medium-level reactor waste at the Loviisa NPP site. Vantaa, Finland: IVO International Ltd. Working Report IVONU 96-01. (In Finnish with an English abstract)
Aikas, T. 2001. ONKALO URFC at Olkiluoto: Going underground for site confirmation. Proceedings of the ISRM Regional Symposium Eurock 2001, Espoo, Finland, 4.-7. June 2001. Rock Mechanics - a challenge for society, Sarkka, P. & Eloranta, P. (Eds). A.A.Balkema Publishers, Lisse, Netherlands. Pages 3-12.
Aikas, K. & Sadden, N. 1993. Fracture mapping in the research tunnel. Teollisuuden Voima Oy, Helsinki, Finland. TVO/Research tunnel, Work report 93-01.
Ohberg, A. 1996. The hydrological monitoring of the VU-repository in 1995. Teollisuuden Voima Oy, Helsinki, Finland. Working report VLJ-2/96. (In Finnish with an English abstract)

62
Ohberg, A. 1997. The hydrological monitoring of the VLJ-repository in 1996. Teollisuuden Voima Oy, Helsinki, Finland. Working report VLJ-7/97. (In Finnish with an English abstract)
Ohberg, A. & Ahokas, H. 1991. The hydrological monitoring at Cape Ulkopaa 1980-1989. Teollisuuden Voima Oy, Helsinki, Finland. TVONLJ-Final Disposal, Working report 91-04. (In Finnish)

63
APPENDICES
Appendix 1: Summarizing tables of Finnish engineering geological rock classification
Appendix 2: Geology and grouting information of Turku-Naantali district heating tunnel
Appendix 3: Q-classification of the bedrock in Merihaka sport hall and civil shelter
Appendix 4: Engineering geological mapping of the Merihaka shelter

APPENDIX 1
Finnish engineering geological rock classification system ("RG-system") (Gardemeister et al. 1976, Korhonen et al. 1974)
Table 1. Description of rock mass quality.
Structural Structural types of rock Structural types and Hardness and solidity of rock mass frequency of fractures toughness of mass (described in terms of the main rock
most dense fracturing) types Intact rock mass Mass-structured M a Sparsely fractured Mal
Slightly fractured Ma2 Abundantly fractured Ma3 p = soft
Schistose structured Li Sparsely fractured Lil h = brittle Slightly fractured Li2 s = tough Abundantly fractured Li3 k = hard
Mixed-structured Se Sparsely fractured Sel Slightly fractured Se2 Abundantly fractured Se3
Loose rock mass Loose-structured Lo Sparsely fractured Lol Slightly fractured Lo2 Abundantly fractured Lo3
Weathered- structured Ra Should be described as thoroughly as possible (RpO- Rp3) bearing in mind the degree of weathering
Broken rock mass Cleft-structured Rii Planar fractures divide the rock mass into two or more separate sections
Block-structured Rill Abundantly fractured No fracture filling Fracture-structured Riiii Densely fractured Minor filling in fractures Crush-structured RiiV Abundantly or densely Fractures filled with clay
fractured minerals Clay-structured RiV - Abundant clay material
in rock mass
Table 2. Description of fracturing (specific fracturing codes for different structural types of rock mass (Ma, Li, Se, Lo, Ri) are presented in Table 1 ).
Fracture frequency Descriptive term Code < 1 fractures/m Sparsely fractured Rkl 1-3 fractures/m Slightly fractured Rk2 3-10 fractures/m Abundantly fractured Rk3 > 10 fractures/m Densely fractured Rk4

Table 3. Degree of weathering.
Degree of weathering Code Unweathered RpO Slightly weathered Rpl Strongly weathered Rp2 Completely weathered Rp3
Table 4. Degree of foliation.
Degree of foliation I Foliation Code for Code for Code for code massive rock schistose rock mixed rock
Non-foliated 0 MO - so Weakly foliated 1 Ml - Sl Moderately foliated 2 - L2 S2 Strongly foliated 3 - L3 S3
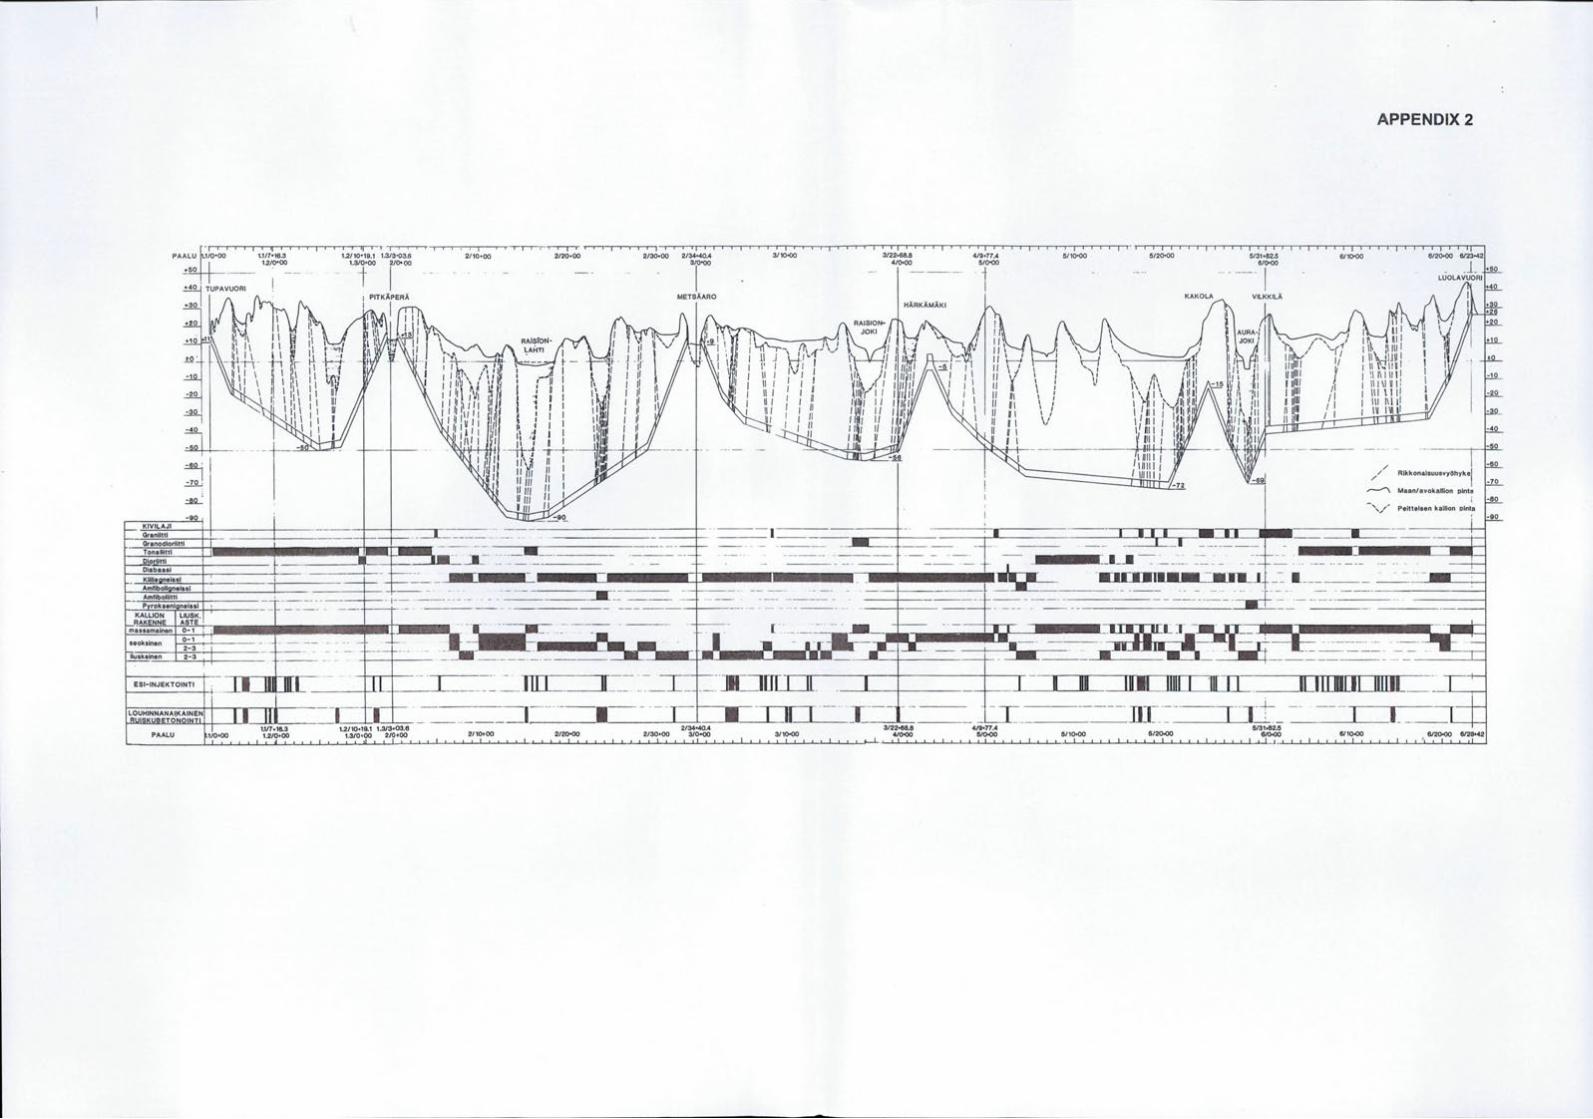
APPENDIX2
PAAL 0 1.1/7+16.3 1.2/10•19.1 1.3/3•03.6 2/10•00 2/20•00 2/30+00 2/34•40.4 3/10+00 3/22•68.8 4/9•77.4 5/10+00 4 1 ..,.---r--r-T -r,---r-r~~
5/20+00
seokslnen
lluskeinen
-~::: ' TUPA~UORI - 12/~00---1
.
3t00
i/O<OO . - --
3
10<00 ··-41
1o-oo_______ Sto-OQ
I (\ 1\ · 1 PITKAPERA METSAARO .. . +SO I !1\1. (\A I I - I HARKAMAKI
·30 I
2-3 2-3
rtl\ ''r ,,,1 11.1
~,n
/ /
/
......-..-'"\
----~
RikkonalsuusvyOhykel
Maan/avokalllon pinta
~~•- ~~-~-~·=_~ -~d_l -~-j~~:~i~·---~~~j -.-t- -=-=-~~ -~-~ -- . ------~~ --~~-+ ::-_-- ··--~~- ~ ----- - --1
~ -·- ! -~rt· T -~--.:: =. ~- -- ----~-... ~·~~·~~-r- ---------- --· -----
~~-- - -L-~ --- .. - -~~-~ . ---==---~-----~-~~---- - ...L....j
ESI-INJEKTOINTI - --=-~ -~--m---~--- --- ______ Jlr~rrJ...J-ll. - - HH ··~~~~~IIIJI. ILIIIILIDIIIII_ ___ ~·-·~ _ __ ----IJo·-----I·---1-- -- - - -' -·r ---------n-~-- -- ·----~--1-~-__._- - - -- - --- _L _ ··-- - --- - ~- -
2/34+40.4 3/22+68.8 4/9•77.4 5/31+82.5 PAALU .1/0•00 2/10+00 2/20<00 2/30+00 3/0+00 3/1o-OD 4/o-DO 5/0+00 5/10+00 5/20+00 6/0+00
I I I I I I I I I I I I I I I I I t I I I I I I I I I I I I I I I I I I I L...-.L I I I I I I I I I I I I I I I I I I I I I I I I I I I I I I I I I I I I I I I I I I I I I ~. J . ...L..I._L..L.......L..L...L...L.....Jo.......L..J.....J-...L...L.J'--L.......L_L....L..l......C'--L.l......C...J
6/10+00 6/2o-QO 6/26+42

AP
PE
ND
IX 3
0 0
..q-....r
I I
I 0
v 11
11 11
0 0
0
~§§
0:: w
t-
Pl158.60
..J w
J
: (J)
<C ~
<C J
: ii: w
:E
Pl125.00 P\.91.10
w
J:
PL101,
Pl100.20
t-Q
t,)
LL 0 z
N
"' 0
~ ~
~ t-<C (.)
u:: (J) (J)
f'\.U80
<C ..J (.)
t,)
I
a
PlO

'J .. ,~
I
~ zy/!!!
PI
~'f .. ~ .. .r; •• ~
~ ~"';''~~
~\" - ·-'~ ~s~.
.. /
t "W-'
'}--"' 6
-SoZ
I
... >,. 'i1
:r. .HALL 2 ~ "'.l~~N ,,J!..'T
.;.-{~
I -!'-Ql-U"' w
~
:11
, -t~ 4<.
1 !.~-!o-QL-lfm
\ '! \ !' 0 \ l" , .. \ )" ~-
G \ ~ 1.( b )i .. , ~ -- ;,i!o_ ""'-'""" ...J-11~_.--.-. - --- 3"\- - t •}:0 ~ ... .., .. ::JI...,-._ r --- _""!!,. 3- 7lm ~6 'o
::{1 ("''', ?10 ¥-.- --- -- --' ., ;., ' ,, ' ""'"""" - ,, ~v;' J ' -fl
1
'\. \ V w .o, oo '.O"'' ~ I ><.1
\..,7o ' 1 :11 ~ !I ( I ~ J ' I 'i\ l . ' .1/!.. 1.,., ~ ,., 'tl _) l
"' ll Jd .
Bi Biotite
Ko Carbonate
Ki Mica
KL Chlorite
So Cloy
Ru Rust
2/m Fractures per metre
Ri 11 Block-structured
Ri Ill F rocture-structured
6 Moisture due to leakage
~ Dropping leakage
• Flowing leakage
:::Cl::::::: Border of leakage area
MERIHAKA SHELTER Engineering-geological mopping
~
---.-20 -....... - ~
- - v-20-
- - v-60 -
-- .()- --
I
--9--Sel-2
Mol
MIGMKGN
~ 1::::::::::::::::::::::::::::::1
APPENDIX 4
SHAFT B
Inclined foliation and dip
Inclined fracturing and foliation and dip
Vertical fracturing and foliation
Single significant fracture or group of fractures
Inclined fracturing and dip
Vertical fracturing
Horizontal fracturing
Mixed-structured, sparsely-slightly fractured
Moss-structured, slightly fractured
Migmotitic gneiss
Pegmotite
Shotcrete