water in - macmillan publisherscdn-media.macmillan.com.au/mea/downloadpdfs/9781420232639.pdf ·...
TRANSCRIPT
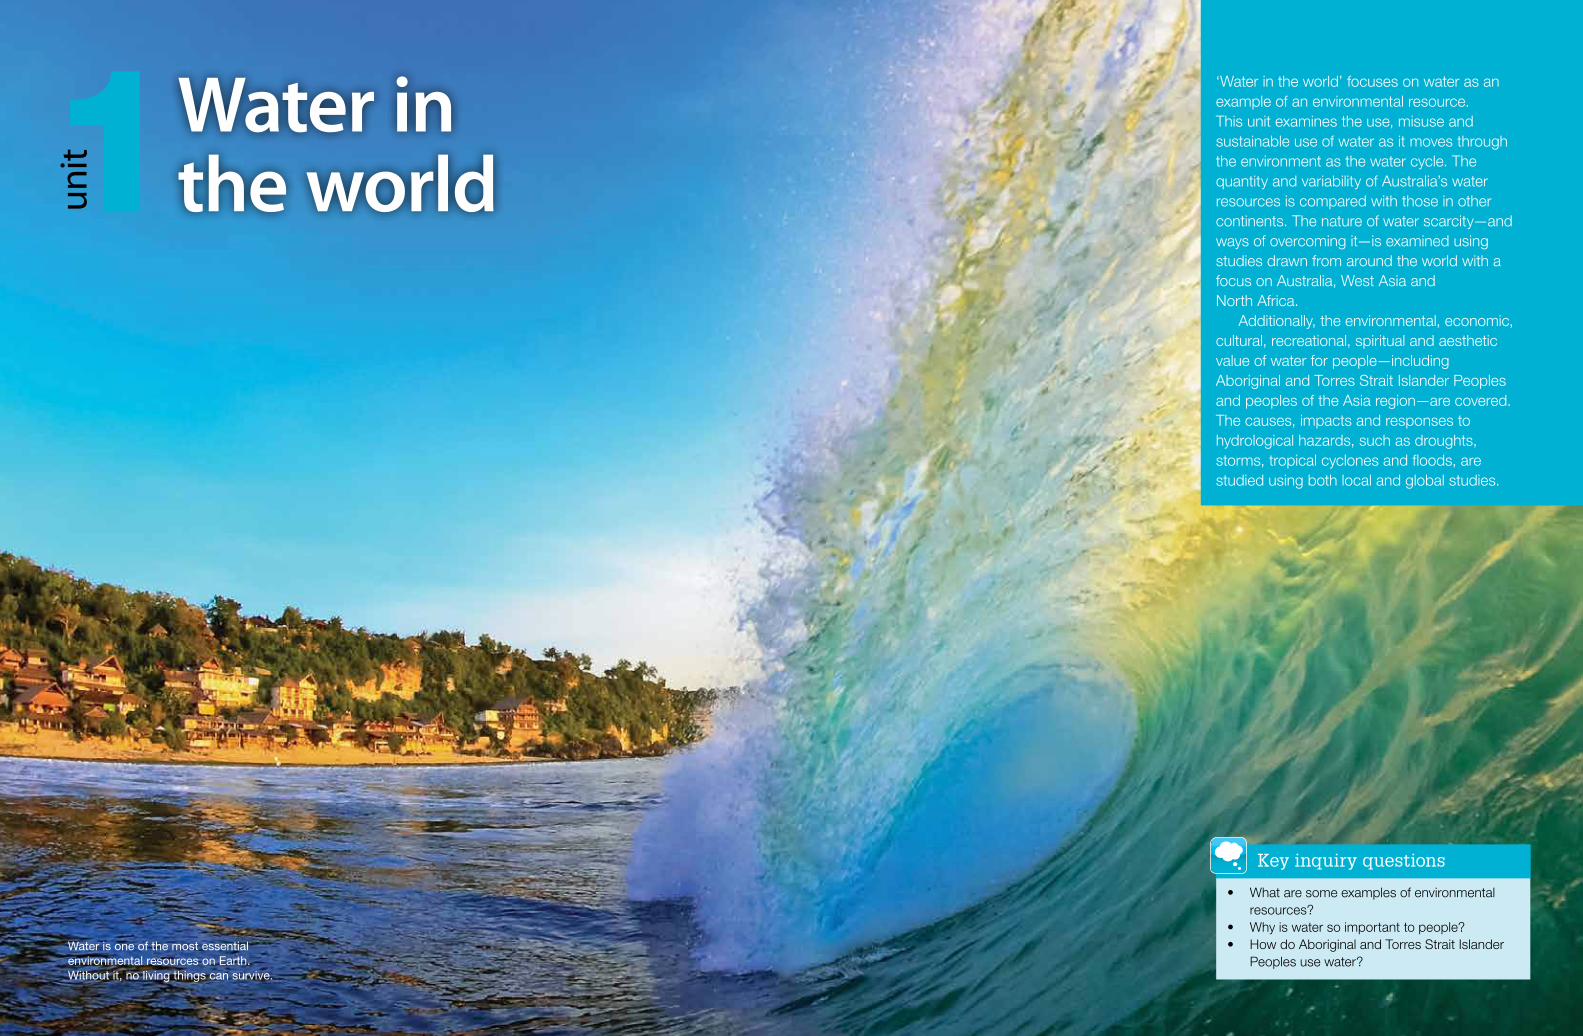
‘Water in the world’ focuses on water as an example of an environmental resource. This unit examines the use, misuse and sustainable use of water as it moves through the environment as the water cycle. The quantity and variability of Australia’s water resources is compared with those in other continents. The nature of water scarcity—and ways of overcoming it—is examined using studies drawn from around the world with a focus on Australia, West Asia and North Africa.
Additionally, the environmental, economic, cultural, recreational, spiritual and aesthetic value of water for people—including Aboriginal and Torres Strait Islander Peoples and peoples of the Asia region—are covered. The causes, impacts and responses to hydrological hazards, such as droughts, storms, tropical cyclones and floods, are studied using both local and global studies.
Key inquiry questions
• What are some examples of environmental resources?
• Why is water so important to people?• How do Aboriginal and Torres Strait Islander
Peoples use water?
1 Water in the worldun
it
Water is one of the most essential environmental resources on Earth. Without it, no living things can survive.

Geovocab
continuous resource: resources always available e.g. sun, wind, tides and geothermal
developed countries: world’s richest countries, generally located in Northern America, Western Europe, Japan and Australia
developing countries: world’s poorest countries, generally located in Africa, Asia and Central and South America
ecological footprint (EF): area of land and water required to provide resources and services and to absorb wastes produced by humans
environmental resource: resources occurring naturally within environments: atmosphere (air), lithosphere (land, soil, minerals), hydrosphere (rivers, oceans) and biosphere (plants and animals)
fossil fuels: non-renewable resources such as coal, oil and natural gas
Geographic Information System (GIS): system for capturing, storing and analysing data about Earth
inquiry process: six stages in a geographical investigation
non-renewable resource: resources formed slowly—often over millions of years—and once used cannot be replenished in the short-term, e.g. gold, diamonds, coal
renewable resource: resource replenished in a relatively short period of time, e.g. plants and animals
sustainability: ongoing capacity of Earth to provide sufficient quantity and quality water to maintain human and environmental life now and in the future
water footprint (WF): volume of fresh water used to produce the goods and services consumed by humans
Earth is a huge storehouse of environmental resources, classified as continuous (e.g. sun, tide, wind and geothermal), renewable (e.g. soil, plants and animals) and non-renewable (e.g. oil). Regardless of where we live, everyone requires air to breathe, soils to produce food, forests to generate oxygen, and water to drink. Water also can be classified as continuous (e.g. water cycle), renewable (e.g. river is constantly fed by precipitation) and non-renewable (e.g. overexploitation of fossil groundwater).
Everyday, everywhere, living things require water to survive. Humans depend on water to drink, grow food and mine minerals for computers, cars and drones. Farmers depend on water to irrigate crops, and industry requires water to produce energy from fossil fuels.
Sustainable management strategies aim to reduce the huge human water footprint to maintain healthy ecosystems. Otherwise, future generations will be unable to enjoy drinking clean water—a fact of life we now take for granted.
chap
ter Environmental
resources and water Only when the last tree has died and the last river
been poisoned and the last fish been caught will we realise that we cannot eat money.
Cree proverb
1
Think, puzzle, explore
• Place Why does the quantity of water consumed vary between places?
• Space Why does geothermal and tidal power vary over space?
• Environment What are the impacts of overuse of water on the environment?
• Interconnection How is water and energy interconnected?
• Sustainability How can humans sustainably manage garbage floating in the ocean?
• Scale How large is the human water footprint and why does it vary at different scales (local, national and global)?
• Change How are changes to food wastes and food miles connected to water?
Geoskills in focus
• Observing water use, misuse, overuse and sustainability using the inquiry process
• Collecting and analysing relevant geographical data on water
• Concluding different perspectives on the use and management of water resources
• Communicating ideas using web 2.0 tools, graphs, maps, statistics and photographs
• Reflecting on actions to ensure a sustainable water supply
Elephant shower in Kerala, India

ISBN 978 1 4202 3263 9 ISBN 978 1 4202 3263 9
Environmental resources and waterC
ha
pte
r 1
76
GeoWorld 7: Australian Curriculum
DOING IT WRONG DOING IT RIGHT
Rooftop runoff directed to street drain
Excessive use of herbicides and pesticides
Rooftop storm water into rain barrel
Sweep driveway dirt to lawn or garbage not the road
Collect dog waste
Water is treated in the pond and recycled
Take hazardous household waste to waste depot
Roof top storm water onto gardens
Car washing
Wash car at the car wash
Excessive use of fertiliser
Thin soil stores little water
Oil and gas residue
Rainwater infiltrates gravel
Rainwater infiltrates thick soil
1.1 Water: use, misuse, overuse and sustainable use
The world’s fresh water supplies from rivers, lakes and groundwater are shrinking due to use, misuse and overuse. As a result, by 2025 approximately 33% of the world’s population will lack access
to adequate drinking water. Water shortages, conflicts over water use and the impacts of anticipated climate change require sustainable management strategies.
1.1.1 Overview of the use, misuse, overuse and sustainable use of water in the world
1.1.2 Sustainable and unsustainable use of water
Geoactivities 1.1
Knowledge and understanding 1 Why is water an environmental resource? 2 How is water connected to the production
of energy? 3 Describe the spiritual, cultural and aesthetic values
of water.
Inquiry and skills 4 Refer to 1.1.1.
a List the use of water for agriculture.b Name one example when water is misused. c What is the difference between misuse and
overuse?
d What are two examples of the overuse of water?e List some sustainable water strategies.f Explain how water is everywhere, all the time.
5 Refer to 1.1.2. a List how water is misused in the home.b Suggest strategies to use water more sustainably. c Draw a mind map of how water is used in
your school.
AgriculturalWater is used for:• crops: staple crops (rice, potatoes, wheat) and
organic crops• animals: open grazing and feedlots (cattle)• non crops: cotton, tobacco, opium, Christmas trees
and biofuel
DomesticWater is used for:• drinking• washing• cooking
EconomicWater is used:• to produce energy which
is essential for economic growth • for irrigation to increase agricultural goods for export• in industrial processes to produce goods, and then to
transport goods around the world Healthy water is essential for:• the growth of the pearl industry• wetlands, which produce fish – a source of food• tourism and recreation (e.g. surfing)
EnergyWater is used to produce energy:• Non-renewable resources: oil, natural gas and coal; rare
earth elements used in wind power• Renewable resources: geothermal, tidal, hydropower
EnvironmentThe environment requires water for the functioning of terrestrial (land) and marine ecosystems. Ecosystems support a diversity of species and food webs in wetlands, rivers and oceans (e.g. fish, shell fish and krill).
IndustrialWater is used in:• the conversion of raw resources into manufactured
goods• production of mobile phones, computers and
microchips• making clothes (such as cotton for jeans)• construction materials for roads, homes and skyscrapers
MiningWater is required to mine:• diamonds, gold, silver, copper and rare earths• fossil fuels such as oil, coal and natural gas
Misuse• pollution of water from arsenic, mercury, radioactive
materials, chemical wastes and sewage• wasted water through vampire power or standby power
(when electrical goods are not turned off)• wasted food, which requires water for production
Overuse• fossil groundwater – more water is taken out of the
ground than renewed• over-irrigation caused decline in the area of the Aral Sea
and increased saline soils, killing plants and crops
Spiritual, cultural and aestheticWater has spiritual and cultural significance for: • Aboriginal and Torres Strait Islander Peoples• Indigenous peoples around the world• religions such as Hinduism, Christianity, Islam and
JudaismWater has value for tourists visiting: • World Heritage Sites (e.g. Iguassu Falls) • frozen water environments such as Antarctica and
Mount Everest
Sustainable useIncrease in population, increased demand for water and anticipated climate change places pressure on water use. Sustainable strategies include:• recycling grey water, desalination plants, storm water
harvest and re-use, virtual trade in water, fog harvesting , inter-regional transfer of water, reducing water consumption
• use of hydropower, geothermal power and tidal power
Transport Water is used by:• local communities e.g. canoes used by indigenous
people along the Amazon River• container ships transporting goods such as cars• tourism e.g. speed boats and sailing

ISBN 978 1 4202 3263 9 ISBN 978 1 4202 3263 9
Environmental resources and waterC
ha
pte
r 1
98
GeoWorld 7: Australian Curriculum
Underground mining / primary source: deposits under the Earth are generally carrot shaped. The larger top of the pipes (top of the carrot) yields large quantities of diamonds. Mining in the narrower end becomes less profitable
Surface mining / secondary source: erosion causes loose diamonds to move downhill and be deposited in rivers and then to the ocean
1.6 Water and blood in diamonds
Geoactivities 1.6
Knowledge and understanding 1 Explain why diamonds are classified as non-
renewable resources. 2 Describe how a diamond ring requires large
quantities of water. 3 Describe the impact of conflict diamonds on
people and countries. 4 ‘Child labour exists from mining to polishing
diamonds’. Outline the meaning of this statement.
Inquiry and skills 5 Refer to 1.6.1.
a What are diamonds? b Where are diamonds formed? c What are the differences between primary and
secondary sources of diamonds? d Explain the diamond process from the earth to
the ocean. 6 Discuss the use of water in the production process
of diamonds. 7 Visit the De Beers website and examine their
strategies for sustainable use of water in diamond mining.
8 Refer to 1.6.2. The aerial photograph of the Diavik mine has been divided into nine sections: left (L), centre(C) and right (R) along the horizontal axis; foreground (F), middle distance (M) and background (B) along the vertical axis.
a Compare the centre middle distance of the Diavik diamond mine with the left foreground.
b Draw a sketch of the Diavik diamond mine labelling natural and human features.
c Compare the aerial photograph of the Kimberley Diamond mine in South Africa with the Argyle mine in Australia. Include shape and settlements.
9 What’s more valuable: a flawless, one-carat diamond or 1000 gallons of fresh water?
10 Role play: The following people are part of the diamond industry—child labourer in India, child solider in conflict wars, jewellery shop owner, head of a diamond company such as De Beers, Botswana Government, environmentalist, newly engaged woman and the electronic industry using diamonds. List the advantages and disadvantages of diamonds to their life, country or organisation. Present your findings as an oral report.
11 Design a poster showing different perspectives on diamonds. Present as poster or PowerPoint slide.
12 Research organisations that are working towards a better future for people working in the diamond industry, such as Amnesty International. What are they doing to help?
13 Refer to an atlas or the internet and draw the location of the Argyle diamond mine showing latitude and longitude. Calculate the approximate distance to your school.
Geoskills in focus
The photographs in 1.6.2 are called oblique photographs. The scale near the camera is larger than the scale at the back of the photographs.
1.6.1 Formation of diamonds
1.6.2 a) The Kimberley Diamond mine South Africa is the biggest hand dug hole in the world with a depth of over 1,000 metres. The mine produced over 3 tonnes of diamonds until it was closed in 1914;
1.6.2 b) The Diavik diamond mine in Canada commenced production in 2001
Diamonds are a non-renewable resource, and huge quantities of water required in their mining and processing go into getting the ‘sparkle’ on an engaged woman’s finger.
Water-intensive mines Approximately 26 000 kg of diamonds are mined annually. To unearth one carat of primary source diamonds requires the removal of millions of tons of dirt by huge machines. Afterwards, large volumes of water are used to extract the diamonds from the gravel. Furthermore, secondary source diamonds involve labour-intensive work using shovels and sieves to scour away 2.5 million m3 of soil every day out of rivers and lakes.
Sustainable use of waterMost carats are mined in Africa (61%). Other large diamond mining countries include Russia (15%), Australia (14%) and Canada (9%).
The Argyle diamond mine located in the Kimberley region in Western Australia caused
groundwater pollution and sedimentation in rivers resulting in the loss of marine species. Today the mine is self-sufficient in water—it no longer requires 3500 million L of water a year from Lake Argyle and most wastewater is recycled.
De Beers’ companies dominate the global diamond mine industry—they are responsible for 43% of global diamond production (value) and 30% of carats (volume). Approximately 95% of its rough diamond production in southern Africa is located in dry environments. Ensuring more sustainable production, the water footprint has been reduced by recycling water, using seawater for processing alluvial mining operations and reducing waste into rivers aimed to protect aquatic life.

ISBN 978 1 4202 3263 9 ISBN 978 1 4202 3263 9
Environmental resources and waterC
ha
pte
r 1
1110
GeoWorld 7: Australian Curriculum
1.9 What you wear requires water
Natural fibres and ecofashionNatural fibres play an important role in conserving global resources such as:
• Hemp: the ecological footprint of hemp is smaller than most plants used for fibre. The plant does not require irrigation.
• Organic cotton: uses less fertilisers and pesticides and as a result protects the quality of surface and groundwater.
Technology is developing self cleaning wool and silk, insect-resistant fibres and plants requiring less water. The Cleaner Cotton™ project aims to produce cotton using less water and chemicals.
The fashion industry is highly competitive so it reduces costs by using sweatshop labour (low pay and poor working conditions) and child labour. Organisations such as Clothes for a Change promote non-sweatshop and non-child-labour clothes, and support sustainable cotton production and organic fibres.
1.9.1 Use of natural fibres—renewable resources
Cotton: world’s most widely used natural fibre and ‘king’ of global textiles industry
1.9.2 Top 10 cotton producing countries
Pakistan 11%Brazil 6%Uzbekistan 5%Australia 2%
China 34%
India 25%
USA 13%
Turkey 2%Turkmenistan 1%Syria 1%
Clothes require water in their production, whether they are made from natural fibres (e.g. wool) or synthetic fibres derived from petrochemicals (e.g. polyester). The textile industry is the third largest consumer of water in the world after the paper and oil industries. The industry produces 70 million tons of waste water in a year and up to 600 L of water to dye 1 kg of fabric. When clothes are purchased, additional water is used to wash clothes and at the end of their life they are buried in landfill or recycled.
Thirsty cotton Natural fibres are renewable resources. These fibres are divided into two components requiring different quantities of water:
• plant fibres e.g. cotton, flax, hemp, sisal and coconut
• animal fibres e.g. wool and silk
In Australia traditional Aboriginal societies separated plant fibres by soaking stems, leaves and bark in water until the non-fibrous tissue rotted away. Afterwards they were used for bags and ritual objects in religious ceremonies.
Approximately 700 gallons of water or 22 bathtubs of water are used to manufacture one cotton T-shirt, and 17–20% of industrial water pollution comes from textile dyeing and treatment. The unsustainable use of irrigation led to the decline of the Aral Sea when cotton, referred to as ‘white gold’, became a major crop for former Soviet Russia.
In Australia there are 361 cotton farms located in NSW and Queensland. The largest cotton farm in Australia is Cubbie Station. The station has permits to divert and store more than 500 000 ML (megalitres) of water, which is about the same quantity of water required to fill Sydney Harbour.
Wool: excellent insulation during colder temperatures
Silk: developed in ancient China remains the ‘queen’ of fabrics
Jute: strong threads used in sackcloth sustains the livelihoods of millions of small farmers in developing countries
Geoinfo
In the production of a cotton T-Shirt approximately 60 kg of water is used and about 45 kg of waste water is discharged per kg of output.
Geoactivities 1.9
Knowledge and understanding 1 Explain why natural fibres are an environmental
resource and require water. 2 Distinguish between natural and synthetic fibres
and whether they are renewable or non-renewable. 3 Explain how fibres were produced by traditional
Aboriginal societies. 4 Discuss the importance of promoting
environmentally sustainable fibres.
Inquiry and skills 5 Refer to 1.9.1.
a Which fibre could possibly replace glass fibres in automobiles?
b List the fibres from goats, sheep and silkworms.c Name the fibre suitable to make mattresses.
6 Refer to 1.9.2 and calculate the total percentage of cotton grown in China, India and USA.
7 Investigate ten clothes in your cupboard. Draw a table with two columns: a) where they are made, and b) what fibres are used in their production. Calculate the proportion of clothes made from natural fibres, synthetic fibres and a mixture of the two.
8 Design a collage of different clothes and the resources used in their production. Use magazines or the internet and present your findings as a Prezi.
9 Imagine you are employed as a socially and environmentally conscious worker selling clothes. Explain what this means.
10 Draw up a cost and benefit table for the fashion industry. Include environmental, economic and social aspects.
11 Research Cubbie Station in Australia. Include location, size, use of water and economic returns.
12 Inquiry task: In pairs select one natural fibre and answer the inquiry questions. What is it? Where is it grown or grazed? How does it become a fibre? What is it used for? How much water is used in its production? Why is it a sustainable or unsustainable fibre? Present your report as an essay or web page to the class.
13 Research the use of camel hair for clothing. Where it is produced? How it is made into clothing? What are the advantages and disadvantages of using this fibre for clothes?
14 ICT: Using research from the internet, briefly outline the process of wool from the farm to clothes.

ISBN 978 1 4202 3263 9 ISBN 978 1 4202 3263 9
Environmental resources and waterC
ha
pte
r 1
1312
GeoWorld 7: Australian Curriculum
1.10 Irrigation for food and fibre
• The subak system in Bali was used in Bali about 1000 years ago. It moved water from Mt Batur and Mt Agung to the ocean, via an elaborate system of canals, dams, bamboo pipes and tunnels through rice fields. The subak system plays an important role in rice production and improved quality of life for farmers. It distributes irrigation water equitably and is part of Hindu ceremonies. Some areas are divided into areas of 100 hectares with 350–400 members. The elected head of each subak (pukasi) is responsible for allocating water to the farms. If a person was murdered over a water conflict, locals believed the evil spirits would disturb the serenity of the rice field, so a cock fight would be performed in the village to appease the spirits.
Modern irrigation systems The nature of irrigation has changed with the construction of huge dams and thousands of kilometres of pipes, and the ability to monitor water measuring instruments from satellites. The Great Man-Made River in Libya is the world’s largest irrigation project. It consists of 4000 km of pipes supplying 6 500 000 m3 of fresh water per day to Libya’s cities.
Irrigation occupies a small area of land in Australia but provides large quantities of food and fibre for domestic purposes and exports. There are 40 000 irrigators in Australia. The Murray Darling Basin is Australia’s largest irrigation region, valued at $11 billion per year for products and crops produced. Modern irrigation technology includes drip irrigation monitored from satellite, which informs farmers when to irrigate their crops and as a result reduces water waste. To control the overuse of water, the majority of irrigated water is controlled by regulations and licences. Sustainable irrigation practices are the key to Australia’s ability to continue to produce food and fibre as well as conserve the environment.
Geoactivities 1.10
Knowledge and understanding 1 What is irrigation? 2 Where are most irrigated areas located? 3 Explain how irrigation contributes to food
production. 4 Describe two different traditional irrigation systems. 5 Discuss how modern irrigation systems aim to
reduce water waste.
Inquiry and skills 7 Refer to 1.10.1 and explain the movement of
water in the falaj system from A to B. 8 Refer to 1.10.2 and draw and label a form line
sketch of growing rice in Bali using the subak system.
9 Investigate the irrigation system at home, in the school and used by the local council. Determine whether the systems are water-efficient. If not, suggest solutions to reduce water wastage.
10 ‘Irrigation is critical to providing fresh and affordable food’. Discuss this quote.
11 Discuss the contribution of irrigation to the Australian economy and its impacts on rural areas.
Geoinfo
• 15% of irrigated land is degraded.• Irrigated land is twice as productive as rain-fed or
dry land irrigation.• Most irrigation farms use two to three times more
water than required.
1.10.1 The Falaj irrigation in Oman
A
B
1.10.2 The Falaj irrigation in Oman
Irrigation refers to the application of water to the land in order to grow crops or pastures. Although only 18% of cultivated land is irrigated, agriculture accounts for 70% of water withdrawn from rivers and aquifers. Approximately 68% of the world’s irrigated area is located in Asia, with large areas located along the Ganges, Indus and Yangtze Rivers.
Irrigation is important as it contributes to 40% of global food production. In developing countries irrigation increases crop yields between 100% and 400%, and it accounts for 80% of food production in Pakistan and 70% in China. About 50% to 80% of water is wasted when crops are over-irrigated, pipes leak and water flowing through open channels is evaporated. Improved water management is important to increase food production for a growing global population.
Traditional irrigations systems Ancient Egyptians used the flooding of the Nile River to irrigate fields, and the Incas developed terrace irrigation in the Andes Mountains of Peru. Qanats were used in ancient Persia (Iran) to provide water to settlements located in dry environments. Otherwise referred to as falaj (in Oman), foggara (in Africa), or subak (in Bali), these irrigations systems impacted on the development of settlements and agriculture:
• The falaj system in Oman, dating back to 2500 bc. Five of the country’s 3000 functioning irrigation systems were listed as World Heritage sites in 2006. Water is channelled from underground to provide water for domestic purposes and to grow date palms, vegetables and corn. Today a full-time falaj worker ensures water sharing is fair and equitable.

ISBN 978 1 4202 3263 9 ISBN 978 1 4202 3263 9
Environmental resources and waterC
ha
pte
r 1
1514
GeoWorld 7: Australian Curriculum
1.12 Ocean garbage patches: misuse of water
Paper bag Compostable** plastic Recyclable bag
Municipal waste 33.9 kg 1.28 kg 4.7 kg
Water 1004 gallons 672 gallons 40 gallons
Electricity 649 mJ* 325 mJ 148 mJ
Fossil fuels 922 mJ 1219 mJ 457 mj
*mJ: millijoule is a unit of energy ** Compostable: 90% biodegradation of plastic bags within 180 days in compost
1.12.1 The Great Pacific Garbage Patch
Humans produce 20 times more plastic than 50 years ago. Asia accounts for 30% of the global consumption followed by North America (26%) and Western Europe (23%). Plastic degrades slowly in landfills, but on the other hand it does make cars lighter so they require less oil and emit less CO2. Some plastics are biodegradable and break down upon exposure to water, sunlight, bacteria or algae.
Australians consume 4.5 billion plastic bags each year. Biodegradable plastic bags and paper bags are alternatives to plastic bags but have other
Every year 7 billion kilograms of rubbish such as cardboard, plastic cups, bottles and cans are dumped into the ocean. Leaking containers of radioactive waste and nerve gas disposed at sea contaminate fish and cause death to consumers. Medical wastes wash up on beaches, while a 3000-passenger cruise ship produces 8 tons of solid waste a week.
The top five marine debris items are: cigarettes (28%), plastic bags (12%), plastic food wrappers/containers (8%), caps and lids (8%) and plastic beverage bottles (6%).
Great pacific garbage patch The Pacific, Atlantic and Indian Oceans are important environmental resources but are threatened by floating garbage—90% of which is plastic. Over 18 000 pieces of plastic per square kilometre bobs around in oceans and is consumed by 44% of seabirds and 267 marine species.
The Great Pacific Garbage Patch, located in the North Pacific Ocean, was formed by slow swirling ocean currents called gyres. These currents move garbage from the coasts of Asia and North America towards the centre of the ocean, referred to as the ‘patch’. It is difficult to clean up, because ‘out of sight and out of mind’ mentality pervades most organisations. What’s more, micro-plastics released by synthetic clothing during washing ends up in the oceans, where it enters the marine food chain.
Plastic from petroleumPetroleum is vital for the production of nail polish, lipstick, synthetic clothing fibres and plastics. All these consumer goods require water. About 8% of the world’s annual oil production is used to manufacture plastic. Due to its low cost and ease of manufacture, 33% of plastic is a ‘single life product’. The average plastic bag is used for 12 minutes and only one in 200 is recycled. What a waste of water!
environmental problems. The Say-NO-to-Plastic Bags campaign contributed to 45% reduction in plastic bags provided by supermarkets over the past few years.
Geoactivities 1.12
Knowledge and understanding 1 Explain how rubbish ends its life in the ocean—
an important water resource. 2 List the advantages and disadvantages of plastic. 3 Describe the links between water and plastic. 4 Discuss how individuals, retailers and companies
could reduce the use of plastic and as a result conserve water.
Inquiry and skills 5 List the top five marine debris items.
a Draw the data as a column graph.b Design an advertisement showing how these
five items can be reduced. 6 Refer to 1.12.1.
a What is the latitude and longitude of the Great Pacific Garbage Patch?
b Why is it hard to find the exact location of the Great Pacific Garbage Patch?
c How large is the patch?d What is the source of the rubbish?e How long does a disposable diaper (nappy) take
to photo degrade?
f What are the impacts of plastic on marine and bird species?
g Why are ocean patches difficult to clean? 7 Refer to 1.12.2.
a What are the advantages of plastic bags over paper bags and vice versa?
b What are the advantages of recyclable bags over paper and plastic bags?
c Compostable bags sound environmentally friendly as they self destruct after a few months. Explain their problems.
8 Inquiry task: Research how many plastic bags you use in your home over a week. Report the statistics back to the class. Collate class statistics. Analyse the results. Suggest solutions to reduce their use.
9 ICT: View satellite imagery showing ocean deserts online. What is meant by an ‘ocean desert’ and how does it impact on other environmental resources?
10 Research the organisation Save the Plastic Bag on the internet. What is its aim and how effective is its campaign?
1.12.2 Impact of different bags (per 1000 bags)
Geoinfo
Enough plastic bags are produced every year to circle the planet four times.
ISBN 978 1 4202 3263 9 ISBN 978 1 4202 3263 9
Environmental resources and waterC
ha
pte
r 1
1716
GeoWorld 7: Australian Curriculum
1.14 Using geothermal water In Australia, geothermal energy heats swimming pools, powers 25% of Birdsville in Queensland, and heats the Geoscience building in Canberra. Geothermal power ranges in scale:
• from large projects e.g. generating electricity to power 725 000 homes from The Geysers in California
• to small projects e.g. the Oserian flower farm in Kenya, utilising steam wells to power greenhouses.
As Iceland has extensive volcanic activity, about 26% of the nation’s energy is produced by geothermal power plants providing heat and hot water to 87% of the country’s buildings. Geothermal energy heats pavements in the capital city, Reykjavík, and is utilised by the high water-energy consuming Alcoa aluminium processing plant.
Hot rocks—future energyEnergy from subterranean heat is no longer limited to volcanic regions. By drilling deep holes into the ground, geothermal energy is available everywhere. Referred to as the Enhanced Geothermal System (EGS), the hot rock project in South Australia’s Cooper Basin sends cold water
1.14.1 Geothermal tourism in Iceland
1.14.2 Geothermal house
Vents to house
Heat pump/exchanger
Ground loop
Pipes are buried to a depth below the freezing line, where the ground temperature isconstant
3 m
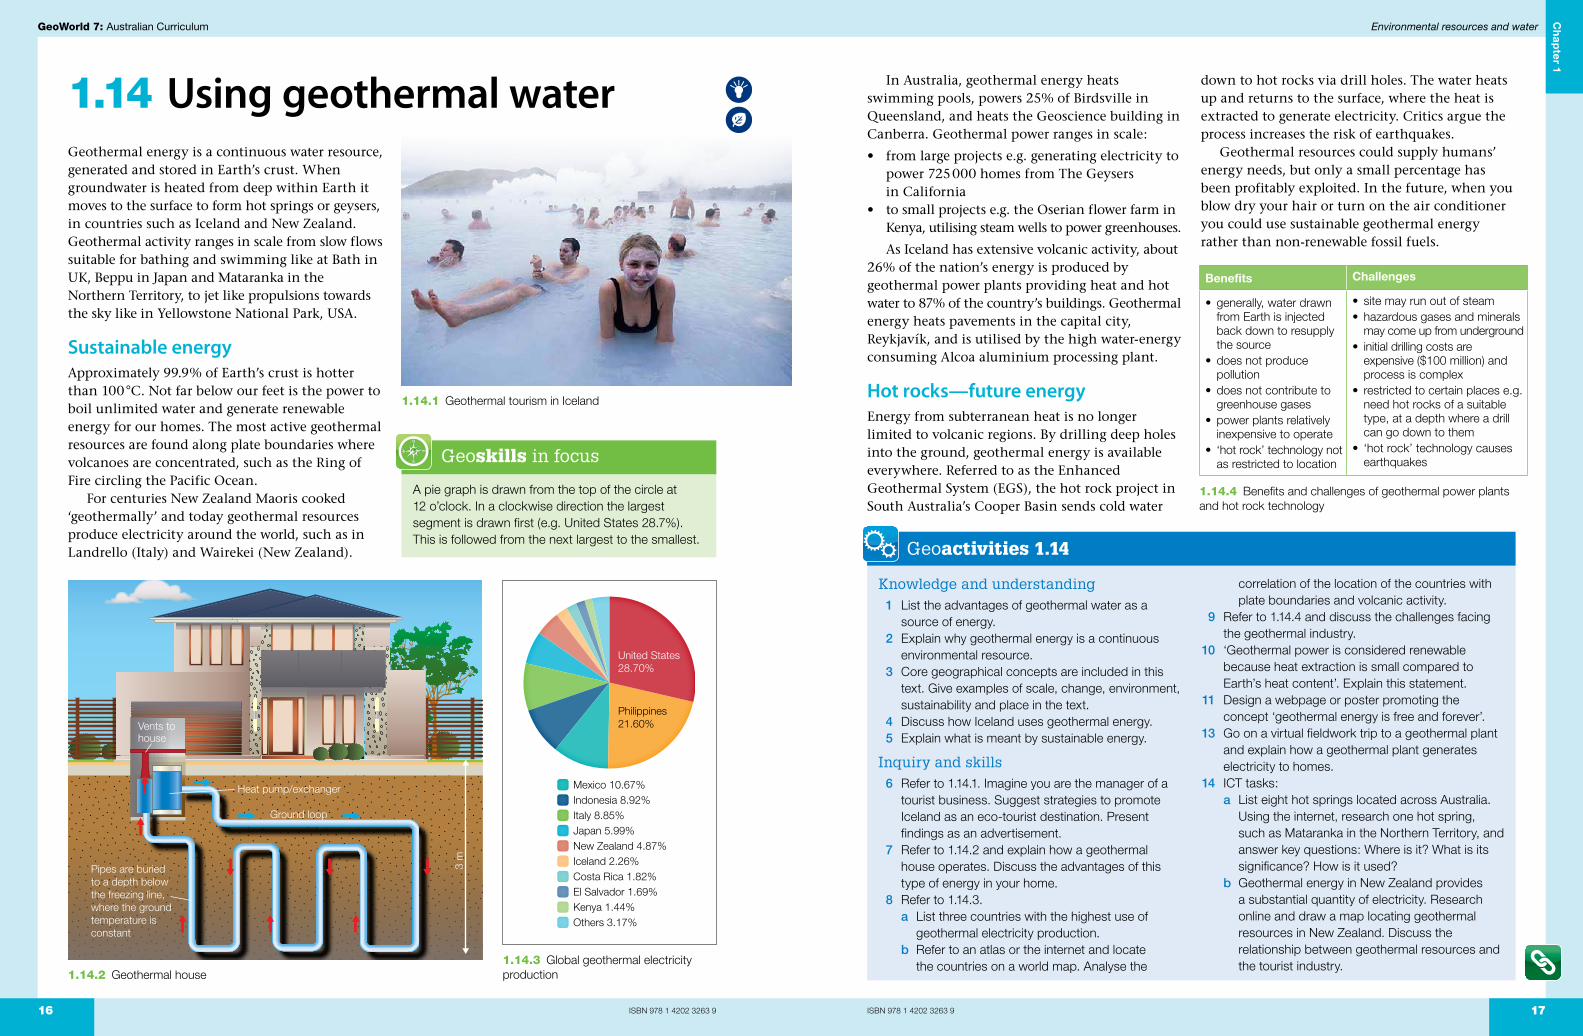
1.14.3 Global geothermal electricity production
Mexico 10.67%Indonesia 8.92%Italy 8.85%Japan 5.99%New Zealand 4.87%Iceland 2.26%Costa Rica 1.82%El Salvador 1.69%Kenya 1.44%Others 3.17%
United States28.70%
Philippines 21.60%
Geothermal energy is a continuous water resource, generated and stored in Earth’s crust. When groundwater is heated from deep within Earth it moves to the surface to form hot springs or geysers, in countries such as Iceland and New Zealand. Geothermal activity ranges in scale from slow flows suitable for bathing and swimming like at Bath in UK, Beppu in Japan and Mataranka in the Northern Territory, to jet like propulsions towards the sky like in Yellowstone National Park, USA.
Sustainable energyApproximately 99.9% of Earth’s crust is hotter than 100 °C. Not far below our feet is the power to boil unlimited water and generate renewable energy for our homes. The most active geothermal resources are found along plate boundaries where volcanoes are concentrated, such as the Ring of Fire circling the Pacific Ocean.
For centuries New Zealand Maoris cooked ‘geothermally’ and today geothermal resources produce electricity around the world, such as in Landrello (Italy) and Wairekei (New Zealand). Geoactivities 1.14
Knowledge and understanding 1 List the advantages of geothermal water as a
source of energy. 2 Explain why geothermal energy is a continuous
environmental resource. 3 Core geographical concepts are included in this
text. Give examples of scale, change, environment, sustainability and place in the text.
4 Discuss how Iceland uses geothermal energy. 5 Explain what is meant by sustainable energy.
Inquiry and skills 6 Refer to 1.14.1. Imagine you are the manager of a
tourist business. Suggest strategies to promote Iceland as an eco-tourist destination. Present findings as an advertisement.
7 Refer to 1.14.2 and explain how a geothermal house operates. Discuss the advantages of this type of energy in your home.
8 Refer to 1.14.3.a List three countries with the highest use of
geothermal electricity production.b Refer to an atlas or the internet and locate
the countries on a world map. Analyse the
correlation of the location of the countries with plate boundaries and volcanic activity.
9 Refer to 1.14.4 and discuss the challenges facing the geothermal industry.
10 ‘Geothermal power is considered renewable because heat extraction is small compared to Earth’s heat content’. Explain this statement.
11 Design a webpage or poster promoting the concept ‘geothermal energy is free and forever’.
13 Go on a virtual fieldwork trip to a geothermal plant and explain how a geothermal plant generates electricity to homes.
14 ICT tasks: a List eight hot springs located across Australia.
Using the internet, research one hot spring, such as Mataranka in the Northern Territory, and answer key questions: Where is it? What is its significance? How is it used?
b Geothermal energy in New Zealand provides a substantial quantity of electricity. Research online and draw a map locating geothermal resources in New Zealand. Discuss the relationship between geothermal resources and the tourist industry.
Benefits Challenges
• generally, water drawn from Earth is injected back down to resupply the source
• does not produce pollution
• does not contribute to greenhouse gases
• power plants relatively inexpensive to operate
• ‘hot rock’ technology not as restricted to location
• site may run out of steam• hazardous gases and minerals
may come up from underground• initial drilling costs are
expensive ($100 million) and process is complex
• restricted to certain places e.g. need hot rocks of a suitable type, at a depth where a drill can go down to them
• ‘hot rock’ technology causes earthquakes Geoskills in focus
A pie graph is drawn from the top of the circle at 12 o’clock. In a clockwise direction the largest segment is drawn first (e.g. United States 28.7%). This is followed from the next largest to the smallest.
down to hot rocks via drill holes. The water heats up and returns to the surface, where the heat is extracted to generate electricity. Critics argue the process increases the risk of earthquakes.
Geothermal resources could supply humans’ energy needs, but only a small percentage has been profitably exploited. In the future, when you blow dry your hair or turn on the air conditioner you could use sustainable geothermal energy rather than non-renewable fossil fuels.
1.14.4 Benefits and challenges of geothermal power plants and hot rock technology

Ch
ap
ter 1
ISBN 978 1 4202 3263 918
GeoWorld 7: Australian Curriculum
ISBN 978 1 4202 3263 9
Environmental resources and water
19
a What is a map projection?b What occurs when you flatten a globe onto a flat
piece of paper?c Why are their different map projections? d What are the strengths and weaknesses of four
different map projections?e Do countries look their true size on all projections?
Explain your answerf Why is Australia at the bottom of most world
projections? What projection has Australia at the top?
g Why does this textbook have Australia in the centre of many of its world maps?
h How has technology enabled geographers to obtain a more accurate view of the world?
i Imagine you were an alien what does the Earth look like from space?
1.17 Fun with map projectionsFor over 2000 years people have seen a distorted world through maps, as it is impossible to accurately represent Earth on a flat piece of paper or on a computer screen. Imagine peeling an orange and pressing the orange peel flat on a table. The peel would break as it was flattened. Making accurate maps of the world is also difficult, because it is mathematically impossible to flatten a sphere onto a piece of paper without distorting or cracking it. Geographers aim to choose the best map projection for a topic such as environmental resources studied in this topic.
Limitless mapsMap projections represent a three-dimensional surface of the Earth on a two-dimensional plane. The transformation includes distortion such as area, shape, direction and distance. Map projections are constructed to preserve one or more of these properties—though not all simultaneously. The challenge when selecting a map projection is whether the information requires accurate shape or size of
objects, but not both. By blending maps or hybrid maps it is possible to create a map balancing the distortion of both size and shape.
There are limitless maps, each presenting its own point of view or perspective. As an Australian have you wondered why our island continent is generally located at the bottom or at the edge of world maps? Why not top and centre?
Old Mercator projectionMercator published his map projection in 1569. It was a map for the sailor, navigator and world traveller. The scale and shape of regions near the equator are accurate but regions closer to the poles appear larger. The Mercator projection is unusable when latitudes are greater than 70° north or south of the equator, at it distorts countries. Greenland is as large as Africa, when in reality it is closer to Mexico in size, while Antarctica appears the largest continent on Earth. Despite these faults, Google Maps and Geographical Information Systems (GIS) use variations of Mercator projections for map images.
Future mapsIn the past the shape of Earth and its continents were constructed by map-makers using a pen while walking through isolated places, such as the rainforests in Papua New Guinea. Today remote sensing uses satellites and computers to measure Earth and identify physical and human features. Map-makers in hot air balloons used to use primitive cameras to acquire aerial photographs, whereas today high-tech cameras in aeroplanes capture photographs at different angles to create detailed maps of different places.
Infrared sensing detects the temperatures of different objects on the ground and helps map living objects, such as the distribution of plant and animal species. A microwave cooks meals, but also provides a map of what exists beneath the Earth’s surface e.g. the distribution of non-renewable minerals. Places can now be mapped using radar sensing when obscured by clouds and rain.
Map Projection Use Strengths Weaknesses
Mercator Popular for navigation Scale and shape of regions near the equator more accurate
Regions near the poles appear larger than in reality
Mollweide Thematic maps such as distribution of rainforests and population
Area more accurate Distortion towards the poles. Poles not shown
Peters Popular for determining flooded area or area under crops
Area more accurate Shape exaggerated
McArthur’s Southern hemisphere at top of map
Different perspective Can be any projection with the same problems
1.17.2 What a human head would look like if it were ‘unwrapped’ like a Mercator map projection. Which is more disturbing: the world presented this way or a human head?
1.17.1 Common map projections
Geoactivities 1.17
Knowledge and understanding 1 ‘There is no perfect map’. Explain this statement. 2 Discuss why different maps are used for different
geography topics.
Inquiry and skills 3 Peel an orange into segments and press it flat
on a table. Explain the relationship between this activity to globes and maps.
4 Inquiry task: Refer to the photo and answer the inquiry questions.
A variety of maps, photographs and satellite images help geographers map the world more accurately. By using both technology and fieldwork a clearer picture of Earth emerges, for instance the impact of humans on environmental resources.

Ch
ap
ter 1
ISBN 978 1 4202 3263 920
GeoWorld 7: Australian Curriculum
ISBN 978 1 4202 3263 9
Environmental resources and water
21
1.19 Spy in the sky: geospatial revolution
as medicinal plants and hunting grounds. Additionally, GPS assists these tribes to guard against threats to their environmental resources from logging, drug lords and mining operations.
The Jane Goodall Institute uses Google Earth to monitor forest projects and chimpanzee populations in Tanzania and Uganda. Using satellite collars, Save the Elephants organisation uses Google Earth to track and protect elephants from poaching. In 2010, Defenders of Wildlife used Google Earth to view millions of litres of crude oil gushing out of the BP well in the Gulf of Mexico and to show its impacts on marine and bird species.
Fieldwork: geocachingGeocaching is an outdoor game using GPS coordinates (latitude and longitude) to find the geocache hidden at a location. Geocaches are placed in over 100 countries and there are more than five million geocachers worldwide. The geocache contains geographical questions for students to answer before moving onto the next location.
Geoactivities 1.19
Knowledge and understanding 1 ‘Smile, you’re on satellite imagery!’ What do you
think this means? 2 Explain how Google Earth can be used in the
geography classroom. 3 Google Earth helps geographers understand the
use and misuse of environmental resources. What does this mean?
4 Discuss the advantages of Google Earth Outreach to indigenous communities in isolated locations.
Inquiry and skills 5 Refer to 1.19.2 and estimate how many
hippopotamuses are in the photograph. Explain why they congregating at this place.
6 ‘The Geospatial Revolution examines the world of digital mapping and how it changes the way we think, behave, and interact’ (National Geographic). Explain this quote.
7 Fieldwork: Organise a geography geocache activity at your school.
8 ICT tasks: Google Eartha Using Google Earth track the routes of
chimpanzees in the Gombe Forest in Tanzania. What should be done to conserve the chimpanzee?
b Measure the distance from home to a mine in the Pilbara using a Google Earth ruler.
c Plan a holiday to three countries. Collect three photographs of each country and write a summary of their main environmental resources.
9 Virtual fieldwork:a Take a virtual trip in the Amazon and describe
what you observed. b Take a virtual ride in the Tour de France. What
environmental resources do you pass on your journey?
10 ICT task: Refer to the Google Earth Blog and complete the following activities. a Tour with geographers on the job around the
world. Describe the different jobs requiring geography.
b Take a tour of Asian countries. Provide an overview of the environmental resources in three countries.
c Complete the orientation quiz. 11 Why is the United Nations Environment
Programme Atlas of our Changing Environment a useful site for environmental managers and geography students?
Geoinfo
• Some 6578 satellites have launched into orbit since 1957.
• Since 2002, all geostationary satellites move to a graveyard orbit at the end of their operational life.
1.19.1 Google Earth as a geographical tool: A weather satellite image shows tropical cyclone Yasi in the Coral Sea approaching the coast of Australia on 1 February 2011 1.19.3 GPS helps Amazon tribes fight exploiters
1.19.2 A big herd of hippopotamuses swimming in a river in Tanzania caught on Google Earth
You may have dreamed of riding camels through the Sahara desert, surfing giant waves in Hawaii, floating in hot air balloons above the Grand Canyon or climbing Mt Everest. Most people, unable to participate in these activities, instead travel the world via Google Earth. With a finger tap on the computer, Google Earth lets you fly, spin and zoom down to any place on Earth and experience virtual fieldwork by wandering through the Amazon jungle exploring rivers, forests and remote villages.
The geospatial revolution uses Google Earth satellite images, aerial photographs and Geographic Information Systems (GIS) to create geographical knowledge vital to the interconnected global community. Google Earth technology enables people to observe an approaching cyclone on a mobile phone, and a Global Positioning System (GPS) in your car helps you find where to go for your sports match.
Google, a corporation specialising in internet searches, processes over one billion search requests a day. It provides geographical information from a variety of perspectives and includes geographical tools such as photographs, graphs and statistics. The Google Earth Blog shares satellite images and the Google Earth Community adds place markers such as mines, roads, forests, restaurants and hospitals onto these maps.
Earth observation satellitesEarth observation satellites show changes in environmental resources, such as deforestation in the Amazon rainforest, melting glaciers, impacts of oil drilling in the Arctic and damage to coral reefs. Satellites track wildlife such as polar bears and hippopotamuses and show the impact of natural disasters such as tsunamis and cyclones. Instant disaster information on an earthquake allows quick emergency responses from international organisations (e.g. United Nations), governments (AusAID) and non-government organisations (e.g. World Vision).
Google Earth monitors the environment. It shows before and after satellite images of changing environmental resources via the United Nations Environment Programme (UNEP) and is used by conservation organisations promoting sustainability, such as the World Wildlife Fund (WWF).
High-tech tribes Google Earth Outreach provides non-profit organisations with resources to visualise environmental problems and potential solutions. The Surui in Brazil and the Wayana and Trio in Suriname face threats to their forest and culture. These tribes have been trained to use GPS, map their land and locate resources such

Ch
ap
ter 1
ISBN 978 1 4202 3263 922
GeoWorld 7: Australian Curriculum
ISBN 978 1 4202 3263 9
Environmental resources and water
23
1.20 Inquiry process: dung beetles improve water quality
Geographers are curious people who ask endless questions about environmental resources such as water: Some questions covered in this chapter include: What are the different uses of water? When does water change from a renewable resource into a non-renewable resource? How much water is used in a pair of jeans? How is water embedded within modern gadgets such as mobile phones? Why should we manage water sustainably?
Finding answers to these questions involves working through the inquiry process.
Inquiry processThere are six stages in a geographical investigation or inquiry process: observe, question, collect, analyse/conclude, communicate and respond. Investigations need not follow every step in the diagram, but may follow loops where geographers return to ask more questions and undertake more analysis, similar to an interconnected jigsaw puzzle.
After observing environmental resources, geographers generate questions to be addressed in the inquiry, for example an inquiry into how dung beetles conserve water (1.20.2). Now, fired with questions, information is collected from different sources using primary and secondary data then collated and processed into maps, tables, graphs and diagrams. The information is analysed and a conclusion made after balanced judgement. Research findings are communicated using a variety of methods, such as verbal, audio, text, graphs, statistics, photographs, maps and information and communication technologies (ICT).
At the conclusion of the investigation geographers reflect on research findings and decide if action is required in relation to the sustainability of environmental resources.
Primary sources Secondary sources
Original material collected by the researcher
Collected by someone else besides the researcher
Interviews, surveys, questionnaires, measurements and photographs. Also field sketches, diagrams, maps and statistics
Internet material, newspapers, journals, magazines, photographs and images from Flikr and Wikipedia, maps, diagrams, sketches, tables, statistics
1.20.3 Primary and secondary sources
Dung beetles the clean teamDung beetles do not drink water. They reduce nutrient runoff into rivers and dams and reduce algal blooms in water sources. They assist root penetration, increase water infiltration through the soil, decrease irrigation and decrease water contamination.
Dung or animal faeces have been used as fertilisers on farms for centuries. Today the Maasai in Africa burn cow dung to repel mosquitoes and in Tibet cow dung lines walls to keep homes warm and produce biogas to generate electricity and heat.
Dung beetles recycle animal faeces. Within a few hours of elephant dung hitting the ground, beetles turn the dung into balls and bury them. As a result the soil becomes more fertile and crop productivity increases reducing the need for artificial fertilisers. In Kruger National Park in South Africa more than 7000 beetles in a single pad of elephant dung are found busy recycling waste.
In Australia, every hour 12 000 000 cow pats are dropped on the ground. Dung beetles recycle cow dung contributing to the decline in dung feeding flies. Buffalo flies attracted to the pats cost the Northern Territory beef industry $13 million a year due to hide damage and lost production.
1 Why are dung and dung beetles environmental resources?
2 What is the relationship between dung and dung beetles?
3 How are dung beetles conservers of water?
4 How do dung beetles improve water quality and soil health and reduce diseases?
5 Why are dung beetles demanded in the 21st century around the world?
6 What primary and secondary sources would you use to find out further details on dung and dung beetles?
7 What should I do about promoting dung beetles as conservers of water and excellent recyclers?
8 How will I present my research?
1.20.2 Geographical inquiry questions on dung beetles
1.20.1 Jigsaw inquiry process
1Observe
2QuestionPlan
3CollectRecordEvaluateRepresent
4AnalyseConclude
5Communicate
6ReflectRespond
Geoactivities 1.20
Knowledge and understanding 1 List the main stages in the inquiry process. 2 Distinguish between primary and secondary
sources.
Inquiry and skills 3 Refer to the information on these pages and
answer the inquiry questions in figure 1.20.2. 4 Numerous questions on water were mentioned
on the previous page. Investigate two of questions following the inquiry process.

ISBN 978 1 4202 3263 924
GeoWorld 7: Australian Curriculum
ISBN 978 1 4202 3263 9
Environmental resources and water
25
Ch
ap
ter 1
Geothink Multiple uses of water1 Refer to 1.22.2.
a From the diagram, list two environmental resources for each type of resource—continuous, non-renewable and renewable.
b List the different uses of water.c Explain the interconnections between water and
mining minerals for goods such as mobile phones.
d How can energy-efficient buildings reduce the use of water?
e Describe where water could be overused and misused unless managed sustainably.
f Identify the factors that enrich human life.
1.22.1 Samsø: The energy self-sufficient island 1.22.2 Water use in daily life
Forests
Water
Energy-efficient buildings
Processing natural gas
Smelting and refining
Hydroelectricity
Export natural gas
Wind energy
Farm crops and cattle
Geothermal energy
Mineral processing
Underground mining
Coal-fired power
Solar energy
Open cut miningSpecies
Coal seam gas
Underground coal gasification
Rehabilitation wetlands absorb wastes
AirSun
Gas
Eco-energy island conserves waterSamsø is an energy self-sufficient Danish island. Wind turbines and solar power produce energy for the 4000 inhabitants, and 40% of the energy produced is exported to the mainland. The island obtains hot water from renewable energy, and saves water because the transport of fossil fuels from the mainland is no longer required. Wastewater and sewage is recycled using renewable energy and food scraps are composted.
Samsø is experiencing seawater intrusion into its freshwater aquifers. With rising sea levels, salt penetrating the aquifers could present a future risk to available water.
Knowledge and understanding1 Where is Samsø located?2 Why is Samsø called an energy self-sufficient island?
Inquiry and skills3 Refer to 1.22.1.
a Calculate the combined number of offshore and onshore wind turbines on Samsø
b How many households receive heating from straw fired plants?
c What happens to excess energy produced? d Why are wind turbines and solar power panels
referred to as renewable resources?e Explain how reducing food wastes and
composting food scraps reduces water used or improves the environment.
f Explain the interconnections between energy and water on Samsø.
g Discuss the energy processes operating on Samsø compared to your home.

Key inquiry questions
• How do places affect liveability?• Which is the most liveable city in the world?• What strategies can be taken to improve
liveability?
unit2 Place and
liveability
Santorini is Greek island in the southern Aegean Sea. Santorini remained after a volcanic explosion, which destroyed early settlements and created the current geological caldera
‘Places are for living in’ focuses on the factors that influence the decisions people make about where to live, and their perceptions of the liveability of places. The unit examines the influence of accessibility to services and facilities, and the environmental quality on the liveability of places. People make choices where to live influenced by culture, age, income, social connectedness, community identity and perceptions of crime and safety. Strategies used to enhance the liveability of places—especially for young people—are examined. The unit includes local and global examples, with a focus on Australia, Europe and countries of the Asia region.

Geovocab
sea gypsy: nomad, constantly moving around the oceans fishing and collecting seafood, and living most of their lives on boats or homes built in the sea
sense of place: feeling of belonging to a place and of a place being a part of a person’s identity
Web 2.0 tools: websites that are not static and allow input from the user
People live in some extreme and sometimes dangerous locations on the planet. Many of these locations have harsh natural environments, such as freezing cold temperatures, or are threatened by natural hazards such as volcanoes. Other locations are made extreme by their remoteness or human activities including war or the use of technology like nuclear power. To many people these places are unliveable because they do not offer the conditions we are prepared to live with. While some people have very little choice about where they live, most people make their locational choices for a variety of social, cultural, economic, environmental, political and technological reasons.
Two women in Afghanistan, waiting on a dirt road for a four-hour drive from their village to a hospital for the birth of a baby.
cosmopolitan: mixture of culturesecological footprint per capita: amount of land used to provide
each person with their needsghost town: once-flourishing town wholly or nearly deserted,
usually as a result of the exhaustion of some natural resourceGlobal Positioning System (GPS): space-based satellite
navigation system nomadic: moving from place to place, usually when seasons change
population density: number of people for every square kilometre of land
refugee: In 1951 the UNHCR defined a refugee as someone who ‘owing to a well-founded fear of being persecuted for reasons of race, religion, nationality, membership of a particular social group or political opinion, is outside the country of his nationality, and is unable to, or owing to such fear, is unwilling to avail himself of the protection of that country’
chap
ter Liveability: living in
extreme places Anywhere is paradise; it’s up to you.
Author unknown
7
Geoskills in focus
• Planning a geographical inquiry into extreme places that people live in.
• Collecting and interpreting geographical data sources.
• Evaluating and analysing geographical data on some extreme places in which people live.
• Concluding and communicating information using a range of texts.
• Reflecting on the inquiry process and responding to an issue.
Think, puzzle, explore
• Place What are the factors that affect a place where people live?
• Space What does liveability mean to different people?
• Environment Why do people live in extreme places?
• Interconnection What are the interconnections between the environment and liveability?
• Change Why do people change where they live?

Ch
ap
ter 7
ISBN 978 1 4202 3263 9214
GeoWorld 7: Australian Curriculum
ISBN 978 1 4202 3263 9
Liveability: Living in extreme places
215
7.1 Cold and remote
Sense of placeAnimism and stories of supernatural creatures are important to Inuit culture and an important reason for many Inuit to live in Nunavut. The Aurora Borealis is believed to be the images of relatives and friends dancing in the afterlife or the souls of killed animals. These beliefs contribute to the Inuits’ sense of place and belonging.
Climate change?Families separated from their villages and hunters unable to reach bears and seals because of melting ice are warning signs that climate change is threatening traditional lifestyles. Ancestral knowledge, scientific research and technology are being used to create liveable and sustainable Inuit communities for the future. Traditional knowledge is taught in schools, tribal elders are honorary teachers, and architects are designing buildings for a world affected by climate change.
Geoactivities 7.1
Knowledge and understanding 1 List three reasons why the Inuit live in the Arctic. 2 Explain the high cost of living in Nunavut. 3 Discuss the advantages and disadvantages of
living in Arctic and Sub Arctic regions. 4 Suggest reasons why young Inuit would think the
Artic was an unsuitable place to live. What is meant by the term ‘bright lights’?
5 Do the Inuit live in Nunavut for economic, social, cultural, political or environmental reasons?
Inquiry and skills 6 Refer to Refer to 7.1.1.
a Describe the climate of Iqaluit. What are the hottest and coldest months, annual temperature range and annual precipitation?
b What would it be like in Iqaluit in January? Draw a table with three columns labelled ‘feel’, ‘see’ and ‘hear’. Complete the table with your answers.
c What would happen to the Arctic Ocean around Nunavut in winter?
d How do people make cold climates more liveable?
7 Refer to 7.1.2.a Calculate the distance from Iqaluit to
Cambridge Bay.b What percentage of Nunavut is above the
Arctic Circle? 8 Refer to 7.1.3 and 7.1.4 and explain how
technology and the Aurora Borealis affect the liveability of Nunavut for Inuit people.
9 GIS: Use an interactive map at to create a map showing Nunavut communities and two other layers of your choice e.g. transportation links, seals, whales, oil and gas resources.
Geoinfo
In Inuit language, Nunavut means ‘our land’.
7.1.4 Aurora Borealis and an Inukshuk—a stone figure of a human traditionally used by the Inuit for various forms of communication
7.1.2 An Inuit hunter uses a satellite phone
7.1.1 Location of Nunavut Territory
70
60
50
40
30
20
10
0
10
5
0
-5
−10
−15
−20
−25
−30
Tem
per
atur
e in
°C
Rainfall in m
illimetres
Rainfall in millimetresTemperature in °C
Jan Feb Mar Apr May Jun Jul Aug Sep Oct Nov Dec
7.1.3 Average rainfall and temperatures in Iqaluit (Nunavut), Canada
Spectacular and wild places capture our imagination. They include the highest, driest, hottest, coldest and wettest environments on Earth, where population densities are very low. People have lived in these environments for thousands of years. Indigenous communities such as the Bedouin in the Sahara Desert and the Yanomami in the Amazon Rainforest live in extreme places because:
• sacred ancestral sites are located there• they have developed a common sense of
identity in these locations through culture, language and lifestyle
• traditional ecological knowledge enables them to live there sustainably
• they possess legal title to the land.
Nunavut: homeland and supermarketThe Inuit are Indigenous people who live in the Arctic and sub-Arctic regions of Siberia and North America. The Arctic experiences a polar climate with long, cold winters and short, cool summers. Precipitation is low and mostly falls as snow. For thousand of years the Inuit have lived as nomadic fishers and hunters using traditional knowledge to survive. Their culture was based on seasonal cycles of the land and sea. The use of igloos and dog sleds in winter changed to animal skin huts and kayaks in summer. The traditional diet of the Inuit consists of whales, walruses, seals and fish, because most plants cannot grow there.
Today Inuit live and work in permanent communities along the coast. Homes are modern and connected to the internet via satellite. Hunting parties use GPS and motorised vehicles to move between communities where there are no roads or rail lines. Everything arrives or leaves by plane or sea, adding to the cost of food and clothing. The Inuit still rely on hunting and fishing as their supermarket.

Ch
ap
ter 7
ISBN 978 1 4202 3263 9216
GeoWorld 7: Australian Curriculum
ISBN 978 1 4202 3263 9
Liveability: Living in extreme places
217
A floating futureScientists warn of rising sea levels placing several areas of the globe in danger of vanishing from the map, disappearing under water. Society must adapt and perhaps floating houses are an option.
Geoactivities 7.2
Knowledge and understanding 1 Explain why the Dutch are planning floating cities
such as the Lilypad. 2 List three examples of the connection sea gypsies
have with the sea. 3 What two issues are threatening the liveability of
oceans for sea gypsies? 4 Suggest ways that tourism would guarantee the
survival of the Uros culture. 5 Create a definition for the term ‘disneyfication’. 6 How important is culture as a location factor for the
Uros and sea gypsies? 7 What factors make the reed islands of Lake
Titicaca liveable places for young indigenous Uros people?
Inquiry and skills 8 Refer to 7.2.1.
a Is there any evidence of sanitation in the photograph? What do you think happens to human waste?
b As a class discuss the basic needs of young children. Create a list of these needs.
c Watch a YouTube clip or documentary on sea gypsies. In pairs, undertake a further investigation of sea gypsies and their children.
Consider education, culture, safety and health. Decide whether the basic needs of sea gypsy children are being met. Draw a conclusion about the suitability of the ocean as a place for children to live.
9 Refer to 7.2.2. Using an atlas, the internet or Google Earth, locate Lake Titicaca in Peru. a What is the latitude and longitude of Lake
Titicaca?b Measure the distance from Puno to Conima.c What is the length and breadth of Lake Titicaca?
Calculate the area of the lake. 10 Collect images of lake Titicaca, the Uros people
and the reed islands to make a digital photo collage. Add captions to your images.
11 Refer to 7.2.3.a What features of the Lilypad make it a
sustainable option for living in a world facing climate change?
b Would you consider living on a floating island? What would be the advantages and disadvantages?
c Where might people living on floating islands get employment?
d What would the island need to contain to be an attractive place for teenagers?
Geoinfo
• Many sea gypsies are stateless, meaning they do not belong to a country.
• When sea gypsies step on solid ground they often suffer land sickness.
7.2.3 Lilypad islands—possible future floating worlds
Recycles waste
A central lake collects and purifies rainwater
Sources of power include solar panels on mountainsides, wind turbines and wave power generators. Produces more power than it consumes and is carbon neutral
Mountains and forests provide scenic variety
No roads and cars. Transport is by boat with three marinas
Floats on ocean currents
Houses 50 000 people
7.2 Floating worlds
7.2.1 Young sea gypsies in Semporna, Borneo. Today many sea gypsies still live in small communities built on stilts in shallow coastal bays
7.2.2 Lake Titicaca
Coastal islands and cities such as the Maldives and New York may become unliveable in the future because of climate change. While the Netherlands continues to build structures to hold back the sea, Dutch architects are now designing floating cities like the lilypad to house climate refugees.
The Indian and Pacific Oceans are already home to thousands of nomadic fishermen and hunters. The Bajau Laut and the Moken are two of Asia’s sea gypsy communities. They live on small boats with no fixed address and rely on the sea for food and trade.
Sea gypsies: body and soulSea gypsies have developed unique physical adaptations. They can free dive to over 20 m, slow their heart rate to 25 beats per minute to reduce buoyancy, and have extraordinary underwater vision. The Moken and Bajau have a spiritual bond with the sea. Bajau thank the God of the Sea for good catches and use mediums to remove bad spirits. Overfishing and piracy are threatening the safety and food security of the oceans, while young people are seeking employment and a sustainable lifestyle on land.
Reed islands Islands made from floating aquatic plants can be found in Lake Titicaca, Peru. The Uros people
made permanent islands from layers of totora— a thick reed. The reeds were used to make homes, watchtowers and boats and the Uros survived by fishing, hunting and collecting birds’ eggs. Storms were the biggest threat to the liveability of the islands. Today the lake is home to several hundred Uros. Traditional activities are still important but life has modernised with solar power, television, the internet and motorised boats.
Cultural survival The Uros moved their islands to safe locations near shore after violent storms in the 1980s— they could work and study in Puno, and tourism expanded. Uros showcase their culture to 200 000 tourists a year with 80% of the population now in tourism-related employment. These changes have improved the islands for younger generations who now study hospitality, foreign languages and tourism. While the Uros have been criticised for allowing the ‘disneyfication’ of their culture, tourism may guarantee the future liveability of the islands and the survival of the Uros culture.

Ch
ap
ter 7
ISBN 978 1 4202 3263 9218
GeoWorld 7: Australian Curriculum
ISBN 978 1 4202 3263 9
Liveability: Living in extreme places
219
destroy crops and livestock, but the rich soils allow farmers to harvest three crops of rice a year.
Why take the risk? About 500 million people across the planet live on or near volcanoes, but consider themselves to be safe because:
• there are often many years between eruptions • modern technology monitors volcanic activity • early warning systems reduce the risk of death.
The economic benefits of living near volcanoes, cultural beliefs and benefits of modern technology make these dangerous locations liveable for millions of people. Not all people are happy living with volcanoes, but many can’t afford to move.
Is Australia safe?In 2010 and 2011, volcanic eruptions in Iceland and Chile produced millions of tonnes of ash, which circled the globe and delayed air travel in Europe, South America and Australia. Australia’s proximity to the ‘Ring of Fire’ puts people at risk. Indonesia sits beneath the aviation corridors linking Australia to Asia and Europe. Darwin’s global ash-monitoring centres issued over 1700 advisories to airlines on threats from active volcanoes in 2011. The Bureau of Meteorology stated it was ‘virtually impossible to fly in and out of Australia without going over volcanic activity’.
7.3.3 Ash clouds travel the globe
7.3 Nature’s dangerous places
7.3.1 The world’s most dangerous volcanoes 7.3.2 Indonesians live with volcanoes every day
There are over 1500 active volcanoes in the world—an average of 20 erupt daily. Although volcanoes are linked to destruction and death, millions of people choose to live near them because:
• volcanic soils are rich in nutrients important for agriculture
• they provide employment in tourism (e.g. hot mud baths), construction (e.g. providing stones for buildings) and mining (e.g. sulphur is used in medicine)
• they provide geothermal energy.
Volcanoes—life and death Indonesia sits along the Ring of Fire—where Earth’s tectonic plates collide and cause earthquakes and volcanic eruptions. Some 240 million people live in the shadow of Indonesia’s active volcanoes, where ash clouds, mudflows, poisonous gases, lava flows and
tsunamis threaten lives and livelihoods. In 2011, clouds of ash from mount Merapi caused the evacuation of over 50 000 people.
Volcanoes have cultural and economic significance. Indonesians believe that rumbling volcanoes signal restless gods. People perform rituals in which they offer rice, money and chickens to the gods to appease them, and Balinese sleep with their heads toward nearby volcanoes. Hindu priests climb Mt Agung in Bali and collect hot water to sprinkle on rice farms to ensure a profitable harvest. Volcanic eruptions might
Geoinfo
• Ash clouds are responsible for 28% of volcano-related deaths.
• About 50–60 volcanoes erupt every year.
Geoactivities 7.3
Knowledge and understanding 1 What are the economic benefits of living near
volcanoes? 2 Explain the disadvantages of living near volcanoes. 3 Indonesians accept volcanic activity for cultural
reasons. What does this mean? 4 How has technology reduced the danger of
living near volcanoes? 5 How are Australians affected by volcanic activity? 6 Why do you think the economic benefits of living
near volcanoes seem to be more important to Indonesians than the risk to life and property?
Inquiry and skills 7 Refer to 7.3.1.
a Where is the Ring of Fire located?b Discuss the relationship between Indonesia’s
volcanoes and the Ring of Fire. 8 Refer to 7.3.4.
a Explain how a volcanic eruption affects people living in distant places.
b How long did it take the Chile ash cloud to reach Australia each time?
c Use a world globe to explain the direction the ash cloud travelled the world.
9 Creativity: Create a multimedia presentation called ‘Living dangerously with volcanoes’, using a webpage, PowerPoint, Prezi, animation or movie. Refer to specific countries and volcanoes in your presentation.

Ch
ap
ter 7
ISBN 978 1 4202 3263 9220
GeoWorld 7: Australian Curriculum
ISBN 978 1 4202 3263 9
Liveability: Living in extreme places
221
After an accident The effects of the world’s worst nuclear accident in 1984, at Chernobyl in Russia, continue today. Radioactive isotopes spread across 200 000 km2 of Europe, causing 134 workers to die and thousands of children to develop cancer. The land became too contaminated to farm. Farmers are currently growing radioactive crops to make biofuels—the crops suck up radioactive materials, making the soil suitable to grow food within decades rather than hundreds of years.
For many people, the fear of a nuclear accident would prevent them from living beside a nuclear neighbour. After the clean-up of the Fukushima area, evacuated people will decide whether they should return home.
7.4.3 A bullet hole in the window of a family home in Afghanistan
7.4 Humans cause dangerous places
7.4.1 The path of radiation
Human behaviour can make places unsafe to live in. Colombia’s killings and Rio de Janeiro’s ‘quicknappings’ have contributed to these places being labelled as dangerous. In Rio people are abducted and taken to ATMs to pay their ransom.
People live in dangerous places because they are poor. About 5000 people live in a squatter settlement at Tudor Shaft in South Africa. Their homes are built on radioactive ground, where radiation is 15 times higher than normal. One wonders: is it better to have a home located in a dangerous place or be homeless?
Nuclear neighbours Approximately 1 million people live within a 30 km radius of a nuclear power station. After the 2011 nuclear disaster at Fukushima, Japan, people questioned the safety of living adjacent to these
plants. Nuclear power provides clean, cheap electric power as an alternative to coal-fired power stations. In July 2012 there were 435 nuclear power plant units in 31 countries, with another 62 under construction.
Although reactors are built to the highest safety standards, accidents can cause death, sickness, starvation and environmental contamination. Natural hazards, human error, increasing population, war, terrorism and ageing plants create safety risks. In 2011, the Fukushima Daiichi plant was severely damaged by an earthquake and tsunami.
Resolution of nuclearcrisis is unclear
Decontaminationis difficult
Concerned aboutgovernment-set
safety standards
Difficult working andliving conditions
Opposition fromfamily members
Already found newemployment
61.3%
83.1%
65.7%
41.6%
7.1%
14.6%
7.4.2 Will Japan’s evacuees return home?
Geoinfo
Contaminated tuna from Japan’s nuclear accident have been caught in California.
War zone: AfghanistanIn every war zone, civilian lives are at risk. The United Nations has declared Afghanistan an extremely dangerous place. Between 2008 and 2012, 8000 civilians have died in Afghanistan. People in war zones often seek safety in camps for Internally Displaced Persons or refugees where conditions are poor but they are safe.
Geoactivities 7.4
Knowledge and understanding 1 Construct a mind map showing potential threats
to the safety of nuclear plants. 2 Suggest reasons why people live close to
nuclear power plants. 3 What made the area around the Fukushima
power plant unliveable? 4 Explain why Afghanistan is a dangerous place
for civilians.
Inquiry and skills 5 Refer to 7.4.1.
a Explain three ways someone could be contaminated by radiation.
b List three possible impacts on the health when people are contaminated by radiation .
6 Refer to 7.4.2. b Discuss the influence of age on people’s
plans to return home.c Would you return knowing what the radiation
risks are? 7 Survey your class:
a Develop a questionnaire with 3 questions that will reveal the attitude of your classmates to living near a nuclear reactor.
b Graph the results, analyse them and make a concluding statement.
8 Which do you consider to be the most liveable place: a war zone or adjacent to a nuclear power plant? Discuss with a classmate and come to a consensus. Present your opinion to your class.

Ch
ap
ter 7
ISBN 978 1 4202 3263 9222
GeoWorld 7: Australian Curriculum
ISBN 978 1 4202 3263 9
Liveability: Living in extreme places
223
Ghost towns appear when a resource is depleted (e.g. Big Bell, WA) or when railroads and roads bypass them. In developing countries, garbage dumps become liveable because waste creates employment.
Necessity and choiceAt Lake Assal—a desert salt lake in Djibouti (East Africa)—salt provides an income for the Afar people. Temperatures reach 55 ºC and there is no shade or fresh water. Work starts at 4 am and finishes by 8 am to avoid the heat, and while water is delivered once a week by truck. Camel caravans transport the salt across the desert to towns in the Ethiopian highlands. In a country with 60% urban unemployment there are few other job opportunities.
In Australia high wages attract thousands of workers to remote places such as the Kimberly and Bass Strait. Money compensates workers for difficult environmental conditions and isolation.
In USA, ‘ice road truckers’ deliver critical supplies to remote oil communities like Deadhorse, Alaska. Treacherous conditions including blizzards, whiteouts, steep icy slopes and rockfalls cause serious accidents and deaths. This dangerous job attracts people to Alaska prepared to risk danger to make money.
Trash is treasureIn developing countries millions of city residents live in slums near garbage dumps where they work as waste pickers. An estimated 1.5 million waste pickers in India collect materials such as plastic, metals and e-waste which they sell for as little as $1 a day. They are exposed to poisons, chemicals and disease, but without education, access to transport and other opportunities there are no other work options.
Young men move to Gaddani (Bangladesh) and Alang (India) where the 800 ships that become obsolete each year are grounded. They work as ship breakers, facing death and disability each day. Rusty machinery, jagged steel and chemicals like mercury create hazardous working conditions. On one occasion a worker was cut in half by a moving cable.
Many Australians would never consider living in some of these places. Would you?
Geoactivities 7.7
Knowledge and understanding 1 Draw and complete the following table for
5 locations mentioned in these pages. An example has been completed for you.
Place e.g. Big Bell
Country Australia
Resource being exploited
Gold
Necessity or choice for workers
Choice
Key concepts Ghost town Resource exhausted
2 Name two jobs dependent on Lake Assal’s resources.
3 Create a simple flow diagram to illustrate the development of ghost towns.
4 Which would be worse, waste picking or ship breaking? Justify your answer after considering the advantages and disadvantages of each job.
Inquiry and skills 5 Refer to 7.7.1 and 7.7.2 and Geoinfo.
a What resources made Bodie and Deadhorse liveable places?
b Why would waste picking be called the industry that is always hiring?
c Why would waste picking be considered a health hazard?
d Why do many of the world’s poorest people work in places that Australians would consider unliveable?
6 ICT tasks:a Use Google Earth or other satellite imagery
online to look at Alang.b Use the image to count the number of ships
grounded at Alang. Draw and label a sketch map. Find a more recent image using Google Earth. Make a comparison.
Geoinfo
• Each camel in a ‘camel caravan’ carries twenty 7 kg slabs of salt.
• Waste picking is known as the industry that is always hiring.
7.7 Places, resources and jobs
7.7.1 Abandoned buildings at Bodie
The Afar mining salt at Lake Assal in Djibouti, East Africa
Camel caravans transport salt to the Ethiopian Highlands
Rubbish pickers at a dump in Brazil
Ship cutters at Alang in India
Saloons, gambling halls and opium dens were all features of life in Bodie—a thriving Wild West gold rush town of 10 000 people. Settlers came from across the globe, but when the gold ran out the town was abandoned. Bodie soon became USA’s most famous ghost town.
Resources attract peopleHuman migration and settlement are linked to the availability of environmental resources. Populations concentrate around resources that provide employment. New towns emerge with the discovery of minerals like in the Pilbara, WA.
7.7.3 Local resources provide jobs for poor people in developing countries

Ch
ap
ter 7
ISBN 978 1 4202 3263 9224
GeoWorld 7: Australian Curriculum
ISBN 978 1 4202 3263 9
Liveability: Living in extreme places
225
AnimapsAnimaps allows you create maps featuring moving markers, pop-up images and text, and changing lines and shapes. Animaps play like a video and can be paused, slowed or fast-forwarded.
Tubechop Allows you to select parts of video clips and other movies to put into your presentations. It also allows you to add sections from different clips together to create a new presentation.
Xtranormal Create an animated conversation on your topic. Turn your information into a conversation or debate and show different perspectives.
Geoactivities 7.9
Knowledge and Understanding 1 What are web 2.0 tools? 2 Why are web 2.0 tools useful in Geography? 3 Name 4 web 2.0 tools that can be used to
create maps. 4 List 3 tools that can allow you to include video
clips such as YouTube. 5 Explain the advantages of Survey monkey over
traditional survey methods. 6 Explain why infographics are an interesting away
to display information. 7 How is an infographic different to a Glogster? 8 List 4 uses of word clouds. 9 Visit Google Earth. Make a list of the different
types of images and maps that can be produced using this tool. Create a map of your local community. Add placemarks and photographs. Zoom in on a satellite image of your house and take a screenshot. Include this image on your map.
Inquiry and skills 10 Creativity: Visit one web 2.0 tool that interests
you. Look at samples from the gallery if one exists. Follow a tutorial on creating your own presentation. Create a simple presentation about you and the place where you live. Add features that make your place liveable.
7.9 Communicating geographical information
7.9.1 Geographical inquiry involves presenting data
CommunicationGraphical information
Use geographical vocabulary, concepts
an conventions
Use appropriate methods including
ICT
Use written, oral, visual and/or graphic
forms
Display data in graphs, tables, maps
or statistics
Online presentation tools are known as web 2.0 tools. These tools provide exciting ways to for geographers to communicate geographical inquiry or research findings and results. Web 2.0 tools allow you to create:• graphs using your own statistics e.g. Create-a-graph• surveys that can be collated for analysis and
converted to graphs e.g. Survey Monkey, Edmodo• interesting maps e.g. Scribble maps• movies, photo-stories, animations e.g. Animoto,
Xtranormal, Tubechop• presentations with links to visual material you have
created or found e.g. Prezi, Glogster, Infographics• summaries and evaluations in an interesting format
e.g. Wordle and TagxedoOnline tutorials make the use of these tools very
simple. Some useful and fun tools are listed below.
Google Earth Google Earth contains many tools for both research and presentation. You can choose your own satellite images and add information, create maps by adding layers of information, and create guided tours and 3D images.
Scribble maps Using base maps you can add travel paths, photographs, a legend or create outlines of places with movable boundaries and labels. You can export, send and print the maps.
StatplanetStatPlanet creates interactive maps with existing data you import into the program. It also produces interactive graphs, charts and infographics. A simple interactive map can be created using can use StatPlanet Lite while more advanced features are available at StatPlanet Plus.
GlogsterA ‘glog’ is an interactive online poster used to present a variety of information using maps, graphs, posts, and active links to information in video clips such as YouTube and to websites.
PreziPrezi is a zooming presentation tool that allows photographs, Word documents, PDF files, video clips, graphs, tables and other tools to be integrated.
Infographics Infographics present information visually and graphically using geographical tools such as maps, graphs and diagrams as well as short pieces of text. A lot of information is presented in a small space and in a visually attractive format. You can create your own infographics on sites such as such as Visually and Infogr.am, while Wordle and Tagxedo can be used for simple infographics like word clouds.
Survey monkeyYou can create surveys, email the link to your participants and receive completed surveys online. Results can be presented as graphs or tables.

ISBN 978 1 4202 3263 9226
GeoWorld 7: Australian Curriculum
ISBN 978 1 4202 3263 9
Liveability: Living in extreme places
227
Ch
ap
ter 7
ISBN 978 1 4202 3263 9226
GeoWorld 7: Australian Curriculum
ISBN 978 1 4202 3263 9
Liveability: Living in extreme places
227
Pack your bags—criteria based decision-making1 Read the scenario. It gives you some information
about who you are and a question to answer. 2 Use the Geographical Inquiry Process to complete
steps 2 to 5.
Step 1: Your question—Which city is the most liveable for you, Berlin or New York?
Scenario: You cannot believe your luck. You work for a company with overseas branches in New York and Berlin. They are offering you a 2-year contract overseas. You get to choose the city you want to live in.
About you:Single and 25 years old. You have never travelled overseas. You like open spaces, outdoor activities and sport. In Australia you do a lot of water sports, soccer and cycling. You have always wanted to visit the ‘Big Apple’ but love the idea of skiing in Europe, and you like cold climates. You want to do a lot of travelling to visit as many countries as you can. The company pays you well for your age but you will have to be careful with your spending. You love history and geography, so visiting museums, historical sites and interesting places is important to you. You only speak English but learnt a bit of German at school. The company will fly you to your destination and home again at the end of your contract.
You have 7 days to make a decision.
Step 5: Reflect and respond Is there other information about each city you thought would have been useful in making your choice? Have you learned new skills doing this activity? Would you do things differently next time?
Geothink
John Doe
LuandaAngola
1st
Luxury apartment(two-bed unfurnished)
rent per month
Cinematicket
MusicCD
Daily newspaper(international)
Cup of coffee(inc. service)
Hamburgermeal
Litre petrol(unleaded)
Litre ofmilk
TokyoJapan
2nd
MoscowRussia
4th
BeijingChina16th
LondonUK
17th
ParisFrance
17th
SydneyAustralia
24th
New YorkUS
27th
BerlinGermany
61st
Buenos AiresArgentina
161st
4480
2840
2304
1874
2500
1927
1418
2560
1051
960
8.32
12.78
8.49
7.50
10.30
8.67
5.51
7.68
7.00
4.16
18.56
13.49
13.79
13.12
14.99
14.01
13.59
9.74
13.13
6.99
3.16
3.55
6.19
3.00
1.80
2.63
3.40
1.60
2.63
2.99
2.43
4.26
5.30
4.59
2.30
3.50
2.27
2.81
3.50
2.66
11.20
4.61
3.62
2.20
3.97
5.17
3.66
3.81
4.81
2.95
0.35
0.90
0.49
0.62
1.13
1.22
0.68
0.51
1.19
0.65
2.11
1.69
3.33
1.86
0.76
1.18
1.56
0.77
0.83
0.80
ADMIT
ONE
7.10.2 Infographic on cost of living in different countries
Step 2: Collecting, recording, evaluating and representing dataInvestigate New York and Berlin using the information provided on these pages and research on the internet. You could look up official tourist sites, infographics and expat blogs. You need information on: location (including distance from Australia, neighbouring countries), climate, transport, cost of living/affordability, language, entertainment/recreation, places of interest to visit (cultural and natural environments).
Put your information into a table as you collect it. Think about which liveability criteria are the most important for you.
Step 3: Analyse You should do a SWOT analysis for each location before making your decision. Divide a page into 4 sections. Label them Strengths, Weaknesses, Opportunities and Threats.
Draw a conclusion about which place best suits your needs. Which place is the most liveable for you? Make your decision.
Step 4: Communicate To help the next person from your company facing the same choice, present your judgement about the liveability of New York and Berlin using ICT tools such as:• an animated film using the program Xtranormal. • a Glogster page• a Prezi • a report for a Travel Magazine with text, graphics
and pictures using a publishing template.
7.10.1 Climate of New York City and Berlin