water guidelines 31-07-2014 - unsd — welcome to unsd · guidelines for the compilation of ......
TRANSCRIPT

D R A F T
1
Guidelines for the Compilation of Water Accounts and Statistics
Prepared by UNSD
This is a revised draft of the Guidelines for the Compilation of Water Accounts and Statistics that has been prepared by the UNSD and steered by an Editorial Group composed of experts from countries and international organizations. The document takes into account the contributions of the Expert Group Meeting held in New York in November 2013, the comments provided during tests in workshops, and the inputs received from teleconferences with the Editorial Board and participants to the Expert Group Meeting. The document has been submitted to the Technical Committee of the SEEA for comments, and was brought to the UNCEEA for additional comments. It should be considered a live document which can be subject to further change.

D R A F T
2
6 June 2014 Rev 27
Guidelines for the Compilation of Water Accounts and Statistics
The Guidelines are organized in five chapters. Chapter 1 explains why the implementation of the System of Environmental-Economic Accounts (SEEA) provides a sound basis for monitoring water policies. Chapter 2 provides an overview of the principles and key accounting concepts as the relate to water. Chapter 3 provides practical guidance on how to compile the data needed from the different sources, and how it is integrated to create a complete and consistent picture. Chapter 4 discusses the derivation of indicators and other ways of making the information produced accessible to the different users. Finally, Chapter 5 focuses on strategies to institutionalize the accounts and maintaining a positive feedback loop to increase the detail and quality of the data.
Detailed Outline Introduction Chapter 1 DEVELOPING AN INTEGRATED MONITORING
FRAMEWORK FOR WATER This chapter discusses different water policy needs and how official statistics respond to these needs through the integration of sectoral statistics into the System of Environmental-Economic Accounts (SEEA), a comprehensive framework which facilitates consistency checks, and produces comparable information. The SEEA-Water, a subsystem of the SEEA, and the International Recommendations for Water Statistics (IRWS) are presented as additional tools to specifically respond to the needs of water management and policy design and evaluation. This chapter shows how the information can be organized using a structure of quadrants covering a wide variety of policy objectives, and how these quadrants translate into official statistics processes. I. Water policy needs for information and official statistics • Official statistics in support of water policy • The experience with the System of National Accounts • An standardized system for the environment

D R A F T
3
II. Water policy information and its organization in quadrants • Quadrant I, improving access to drinking water and sanitation services • Quadrant II, managing water supply and demand • Quadrant III, improving the condition and services provided by water related ecosystems • Quadrant IV, adapting to extreme events • Water governance related information III. Incorporating water monitoring in National Statisti cal Systems (NSS) • Institutional arrangements for an integrated monitoring system for water • National Strategy for the Development of Statistics • Examples from countries Chapter 2 INTEGRATION OF DATA IN ACCOUNTS TO RESPO ND TO
POLICY NEEDS This chapter provides an overview of the principles and key accounting concepts as they relate to water in order to develop a monitoring system of comprehensive, consistent and comparable policy relevant information. The chapter also gives an overview of the standards that are used to classify economic activities and products. The concepts are explained through numerical examples, which illustrate the use of the standard tables for checking data consistency, as well as for providing the basis for planning the data collection processes. I. Overview of the Accounting Framework • Accounts of the SNA • Accounts and tables of the SEEA II. International Classification Standards • Industry (ISIC) and product (CPC) classifications • Industrial activities and products most relevant for water accounts III. Concepts of the National Accounts • Sequence of Economic Accounts • Monetary Supply and Use Tables IV. Concepts of the Water Accounts • Asset Accounts • Physical Supply and Use Tables • Emissions account • Sequence of economic accounts for water supply and sewerage Chapter 3 THE DATA COLLECTION AND COMPILATION PROC ESSES This chapter is based on the list of data items of the IRWS. The different sources of data are discussed as well as the particularities of the data corresponding to different aspects of the natural and economic water cycles. The importance of prioritizing the data items according to each country’s water policies are highlighted.

D R A F T
4
The methodologies to collect data are discussed, including the use of water monitoring networks, satellite information, surveys, censuses and administrative records. How and when estimates should be used is another topic of this chapter. The chapter also addresses the issues of data editing, imputation and validation. The explanations are illustrated with several examples and exercises. I. Setting priorities for data collection • The Physical Water Cycle • Waterborne Pollution Accounts • The Sequence of Economic Accounts for Drinking Water Supply and Sewerage • Water-Related Social-demographic Data Items • Project “Cards” for Waterborne Pollution II. Physical data items of stocks and flows within the environment • Precipitation and Evapotranspiration • Inflows and outflows to/from other territories and the sea • Other flows within the environment • Surface water stocks • Groundwater stocks III. Physical data items of flows to/from and within the economy • Abstractions of water • Water supplied and received by economic units • Returns of water • Losses IV. Physical data items related with polluting releases and emissions • Wastewater supplied and received • Wastewater returns • Waterborne releases and emissions V. Monetary data items • Value and costs of water and sewerage services • Taxes, subsidies and investment grants • Assets, investments and depreciation • Tariffs and charges for water supply and sewerage services VI. Social demographic data items • Main source of drinking water used by populations • Main type of toilet and sewage disposal used by populations Chapter 4 DISSEMINATION OF THE ACCOUNTS AND STATIS TICS TO
DIFFERENT TARGET AUDIENCES This chapter discusses how the data compiled in the accounts can be used to inform the different audiences. The chapter provides recommendations on what information to report and how to report it, including several examples from countries. The international initiatives that collect the data from countries and their relationship with the data items of the accounts are also briefly discussed. The core water account tables are provided as a tool for providing the minimum information useful for international comparisons. I. Information and indicators for different audiences • The information pyramid

D R A F T
5
• Indicators for each of the policy quadrants • Core water tables II. Monetary balances and indicators • The sequence of economic accounts for the whole economy • The sequence of economic accounts for water supply and sewerage • Types of indicators derived from the sequence III. Water flow balances and indicators • Sequence of water flows and tables • Types of indicators derived from the sequence of water flows • Pollution related indicators • Numerical example IV. International data collection initiatives • Data items collected through different initiatives
Chapter 5 INCORPORATING WATER ACCOUNTS AND STATIST ICS TO
THE REGULAR STATISTICAL PRODUCTION PROCESS This chapter provides an overview of the principles and key accounting concepts as they relate to water in order to develop a monitoring system of comprehensive, consistent and comparable policy relevant information. The chapter also gives an overview of the standards that are used to classify economic activities and products. The concepts are explained through numerical examples, which illustrate the use of the standard tables for checking data consistency, as well as for providing the basis for planning the data collection processes. I. Inter-organizational collaboration • Identification of partners and stakeholders • Institutionalization process II. Strategic management cycle • Assessment of the National Statistical System • Statement of strategy and implementation • Evaluation III. Production management cycle • Assessment of the production process • Action plan for improvement and its implementation • Evaluation

D R A F T
6

D R A F T
7
24 June 2014
Introduction These Guidelines provide country experts and trainers with a comprehensive set of practical materials to assist in the compilation of water accounts and statistics, in order to develop a monitoring system for water policies. The document is intended for staff of National Statistics Offices, Water Ministries and Agencies, and other stakeholders in countries. The tables and accounting methods presented are based on the System of Environmental-Economic Accounting for Water (SEEA-Water), adopted in 2007 by the United Nations Statistical Commission, and the SEEA Central Framework (SEEA-CF), adopted in 2012 by the UNSC as an international statistical standard. The Guidelines provide additional and more detailed guidance to that provided by the International Recommendations for Water Statistics (IRWS), adopted in 2010 by the UNSC. The Guidelines were prepared as part of the SEEA-Water implementation strategy which was adopted by the United Nations Statistics Commission (UNSC) in 2008. The strategy, proposed after ample consultation by the United Nations Committee of Experts on Environmental Economic Accounts (UNCEEA), aims to integrate SEEA-Water into the national policy framework of integrated water resources management within national statistical systems. It puts great emphasis on linking the implementation of water accounts to users’ demand as well as more broadly into national economic policies. The implementation strategy comprises the following four components:
(a) Development of the International Recommendations for Water Statistics (IRWS), accompanied by guidelines on supplementary data collection and compilation;
(b) Development of training and promotional material; (c) Development of a technical cooperation program consisting of regional activities as well as
pilot projects in selected countries in various regions; (d) Harmonization of international data collection activities with the SEEA-Water concepts and
definitions. As mentioned before, the IRWS were adopted by the UNSC in 2010. Several regional and sub-regional workshops have been organized after the adoption of the IRWS. The Guidelines were developed following recognition by the UNCEEA of the importance of providing assistance to countries in their development or water accounts and statistics. As such there was high demand for supporting materials for implementation. The IRWS provide some of this support, but the Guidelines go into more details, providing practical examples based on experiences in countries and on exercises tested in workshops. The Guidelines also provide a bridge between the concepts and tables of the SEEA-Water and the IRWS, and the ones adopted more recently with the SEEA-CF. A knowledge base will complement the Guidelines with additional resources, such as presentations, worked examples, standardized tables, and diagrams. This will constitute a “living” source of materials which will be constantly updated. In order to steer the process of elaboration of the Guidelines, as well as to provide inputs to the document an Editorial Board, consisting of experts representing countries and organizations, was established. The editorial board had periodic meetings mostly via teleconferences.

D R A F T
8
An expert group, including producers and users of water information from various countries and organizations, was formed to review the complete draft of the document. The expert group met in New York in November 2013 to review the document and provide feedback for its finalization. The document also underwent a broad consultation among key stakeholders, and was then submitted to the UNSC for endorsement. The Guidelines are written for people from a wide variety of professional backgrounds (e.g. economists, statisticians, engineers, chemists, biologists, etc), so the document is written in a simple language easy to understand by non-specialists. The Guidelines can be read from cover to cover, or according to each reader’s specific needs. The following table illustrates the organization of the document, and provides guidance on how to read it depending on the specific requirements of different people interested in water accounts. Key question answered Main audience Chapter 1 How to develop integrated
information systems useful for water policy design and evaluation?
For people who want to have a quick overview. Sponsors, managers, and partners of the accounting projects should read this chapter.
Chapter 2 How do accounts work? For people who want a more in depth understanding of the main assumptions in the accounting model.
Chapter 3 What data are needed? How are data incorporated in the accounts?
For the experts that will be collecting and compiling the data. Important for setting priorities in data collection and making requests of information to the different organizations that provide data.
Chapter 4 How are results interpreted and communicated to different audiences?
For the managers responsible for delivering the results of the accounts.
Chapter 5 How can water accounts become a continuous process?
For the managers in charge of the implementation of the accounts.
Master Exercise How can the accounting concepts be more easily grasped?
For the experts that will be collecting and compiling the data. The exercise complements the explanation in chapters 2 and 3 with an exercise with different levels of difficulty.
The audiences for whom the document is written are usually part of one of the following three groups: statisticians, national accountants, and water specialists. The materials, examples and exercises of the Guidelines should assist the members of these three groups in their mutual understanding and the joint preparation of water accounts and statistics.

D R A F T
9
19 May 2014 Rev 20
Chapter 1 DEVELOPING AN INTEGRATED MONITORING
FRAMEWORK FOR WATER This chapter discusses different water policy needs and how official statistics respond to these needs through the integration of sectoral statistics into the System of Environmental-Economic Accounts (SEEA), a comprehensive framework which facilitates consistency checks, and produces comparable information. The SEEA-Water, a subsystem of the SEEA, and the International Recommendations for Water Statistics (IRWS) are presented as additional tools to specifically respond to the needs of water management and policy design and evaluation. This chapter shows how the information can be organized using a structure of quadrants covering a wide variety of policy objectives, and how these quadrants translate into official statistics processes. II. Water policy needs for information and official statistics • Official statistics in support of water policy • The experience with the System of National Accounts • An standardized system for the environment IV. Water policy information and its organization in quadrants • Quadrant I, improving access to drinking water and sanitation services • Quadrant II, managing water supply and demand • Quadrant III, improving the condition and services provided by water related ecosystems • Quadrant IV, adapting to extreme events • Water governance related information V. Incorporating water monitoring in National Statisti cal Systems (NSS) • Institutional arrangements for an integrated monitoring system for water • National Strategy for the Development of Statistics • Examples from countries

D R A F T
10
.I. Water policy needs for information and official statistics The integral role of water in development is widely recognized, and water issues are very high in national and international development agendas. This has resulted in several international agreements specifying targets for water supply and sanitation, as well as a target on the implementation of integrated water resources management plans. The importance of reliable information for development purposes is also well established. Policy makers, citizens, and the international community are well aware of the role of information in supporting results-based management, better governance, and greater aid effectiveness. However, “the absence of systematic data collection in most countries impedes regular reporting on water resources and water-use trends.” (WWDR4, page 158). Informing water policy requires a great variety of data. Hydrometeorological data is only a subset of the data required to understand today’s water issues. Data from many other fields of expertise are necessary to understand the complex interrelationships of water with aspects of human well-being. Data must be integrated, analyzed and converted into useful information for policy-makers, the general public, managers and researchers1. Due to the nature of water, a wide variety of measures are necessary to understand the various ramifications of the decisions which are made. A comprehensive conceptual framework is therefore necessary to guide the process of data integration and its transformation into policy relevant information. Official statistics are characterized by the systematic collection and processing of data from various fields. Official statistics increasingly include data concerning issues related to the environment, including water. Official statistics can provide the information needed to support decision making processes in the field of water. Official statistics in support of water policy needs for information Countries collect, process and disseminate official statistics on behalf of national governments through the ensemble of statistical agencies and units which form their national statistical system (NSS). Although most countries have set up statistical systems, their organization varies from country to country. The United Nations Statistical Commission (UNSC) was established in 1947 as the apex entity of the global statistical system which brings together the Chief Statisticians from member states. It is the highest decision making body for international statistical activities, particularly with regards to the setting of statistical standards, the development of concepts and methods, and their implementation at the national and international level. The Statistical Commission oversees the work of the United Nations Statistics Division (UNSD), and is a Functional Commission of the UN Economic and Social Council2. The UNSC adopted a set of fundamental principles of official statistics, which guide the work of many NSS around the world. On 29 January 2014, the General Assembly endorsed the Fundamental Principles of Official Statistics adopted by the Statistical Commission in 1994 and reaffirmed in subsequent sessions. Endorsement by the United Nations General Assembly marks the first time the Fundamental Principles have received such high recognition at the global political level3. The principles recognize the importance of official statistics for the national and global development agendas. They stress the role official statistics play in informed policy decision making in support of sustainable
1 World Water Development Report 2 2 UNSD website: http://unstats.un.org/unsd/statcom/commission.htm 11 February 2014 3 UNSD website: https://unstats.un.org/unsd/default.htm 11 February 2014

D R A F T
11
development, peace and security, as well as for mutual knowledge and trade among States and peoples which demand openness and transparency. The principles call for professional independence and accountability of the NSS, as well as coordination among different providers of information. International efforts have been devoted to strengthening the NSSs, especially in developing countries. Worth mentioning is the Partnership in Statistics for Development in the 21st Century (PARIS21) founded in November 1999 by the United Nations, the European Commission, the Organisation for Economic Co-operation and Development, the International Monetary Fund, and the World Bank, in response to the UN Economic and Social Council resolution on the goals of the UN Conference on Development. PARIS21 was born as a response to the challenges faced by both statisticians and decision-makers. The Partnership's Consortium was set up as a global framework of national, regional and international statisticians, analysts, policy-makers, development professionals and other users of statistics. It is a forum and network to promote, influence and facilitate statistical capacity development and the better use of statistics4. The efforts to improve NSSs are embodied in a strategic planning process known as the “National Strategy for the Development of Statistics (NSDS)” which will be described in more detail below. Some examples describing how the NSS are set up in various countries are provided below. The experience with the System of National Accounts Many countries around the world have built on decades of experience in the integration of economic information through the System of National Accounts (SNA), which is an internationally agreed standard adopted by the UNSC through a rigorous process. One of the best known economic indicators, Gross Domestic Product (GDP), can be calculated from the SNA, as well as many other economic indicators which are widely accepted and comparable between countries and through time. The SNA provides standards to compile measures of economic activity in accordance with strict accounting conventions based on economic principles. The accounting framework of the SNA allows economic data to be compiled and presented in a format designed for the purposes of economic analysis, decision-making and policy-making. The accounts themselves present in a condensed way a great mass of detailed information about the working of an economy. The SNA conceptual framework is the basis for producing comprehensive, consistent and comparable economic information.5 The first edition of the SNA was published in 1953. It was then reviewed in 1968, again in 1993, and recently in 2008. Throughout the years the system has been widely used and improved to guide countries in the design of their economic information systems, which provide an information pyramid to suit the needs of researchers, managers and policy makers. The data that supports the information pyramid is continuously collected in order to provide the information required at the different levels. A clear linkage between data, which is costly to collect, and information, which adds value, is therefore established.
4 Paris 21 website (history): http://www.paris21.org/history. 11 February 2014 5 United Nations.- System of National Accounts.- 2008

D R A F T
12
Figure 1.1.1 Information pyramid
Source: based in UNSD-IRWS Other standards have been developed to complement the SNA, such as the International Standard Industrial Classification of All Economic Activities (ISIC) and the Central Product Classification (CPC), providing harmonized methodological bases for National Statistical Systems. A standardized system for the environment More than twenty years ago, Agenda 21 identified the need for a systems approach to monitoring the transition to sustainable development and proposed a specific solution: the development of integrated environmental and economic accounts. Over the past two decades, the international official statistics community has responded to this need through the development of the System of Environmental-Economic Accounts (SEEA). In 2012, the UNSC adopted the Central Framework of the SEEA as an international standard for environmental-economic accounts. The SEEA Central Framework is a multipurpose conceptual framework for understanding the interactions between the economy and the environment, and for describing stocks and changes in stocks of environmental assets. The SEEA brings statistics on the environment and its relationship with the economy into the core of official statistics6. It provides internationally agreed-upon standards for the compilation of measures to describe the environment and its interactions with the economy. The SEEA was developed through a process similar to the one which led to the adoption of the SNA. It was a collaborative effort of the United Nations Statistics Division (UNSD), FAO, Eurostat, IMF, OECD and the World Bank, as well as experts from different countries. In February 2012, the Central Framework of the SEEA (SEEA-CF) was adopted by the United Nations Statistical Commission. The accounting framework of the SEEA allows for different data about the environment and its interactions with the economy to be compiled and presented in a format designed for purposes of environmental-economic analysis, decision-making and policy-making. The accounts themselves present in a condensed way a great mass of detailed information about the environment, the economy and their interactions.
6 System of Environmental-Economic Accounting, Central Framework. White cover publication. 2012
Raw Data
Compilation
Indica-tors
Raw Data
Compilation
Indica-tors
Less detail
More detail

D R A F T
13
The strengths of using the national accounting framework to describe the interactions between the environment and the economy are manifold. First, the SNA is an international standard for compiling economic statistics. It provides a set of internationally agreed concepts, definitions and classifications which ensures the quality of the statistics produced. The SEEA builds up on the infrastructure created around the SNA for integration of environmental information, using concepts, definitions and classifications coherent with those of the SNA. This ensures the consistency and comparability of environmental and economic statistics and facilitates and improves the analysis of the interrelations between the environment and the economy.7 Second, the accounting framework contains a series of identities (for example, those involving supply and use), which can be used to check the consistency of data. Organizing environmental and economic information into an accounting framework has the advantage of improving basic statistics8. Third, the accounting structure also allows for the calculation of indicators which are precisely defined, consistent and interlinked with each other because they are derived from a fully consistent data system. Compared to the use of loose sets of independently calculated indicators, using indicators that are derived from the accounts has the advantage of enabling further analyses of interlinkages and of causes for changes, complemented by scenarios and prognoses on the basis of scientific macro-economic models.9 The following figure illustrates the integration of sectoral statistics into environmental accounts. While statistics provide different sets of data for different specific purposes, accounts provide a compehensive “image”, which emphasizes the relationships between the different elements of a complex system. Moreover, data gaps can be identified and the remedies put in place.
Figure 1.1.2 From sectoral to integrated information
7 SEEA-Water 2.24 8 SEEA-Water 2.25 9 SEEA-Water 2.26
Sectoral Data Integrated information

D R A F T
14
After the adoption of the SEEA-CF, the SEEA Experimental Ecosystem Accounting was developed and presented to the UNSC in 2013. It was designed to track changes in ecosystems, and link those changes to economic and other human activity. Ecosystem accounting is still experimental, and has not yet been adopted as an international statistical standard. It provides a synthesis of the current knowledge in the field and is a starting point for the development of ecosystem accounting at national and sub-national levels. The concepts of environmental economic accounting were developed for the case of water before the SEEA-CF was adopted as an international statistical standard. The SEEA-Water was adopted as an interim statistical standard by the UNSC in 2007. It constitutes a subsystem of the SEEA-CF to provide the information framework linking the hydrological cycle with the economy. It includes physical and monetary data that describe the natural water cycle as well as the water cycle through the economy. This conceptual framework is intended to support decisions that have an impact on water resources, their use and their development. Being a subsystem of the SEEA, the framework will facilitate evaluation of the interactions between water resources and other natural resources, as well as ecosystem services. As part of the implementation for the SEEA-Water, the International Recommendations for Water Statistics (IRWS) were developed as an agreed set of recommendations for compiling internationally comparable information related to water. The recommendations provide a list of data items to support the collection, compilation, and dissemination of water statistics, and their integration in water accounts. In 2013 the UNSC also endorsed the Framework for the Development of Environment Statistics (FDES 2013). The FDES is a multi-purpose conceptual and statistical framework that is comprehensive and integrative in nature and marks out the scope of environment statistics. It provides an organizing structure to guide the collection and compilation of environment statistics at the national level. It brings together data from the various relevant subject areas and sources. It is broad and holistic in nature, covering the issues and aspects of the environment that are relevant for policy analysis and decision making by applying it to cross-cutting issues such as climate change. The UNSC endorsed the FDES, as well as the Core Set of Environment Statistics, and an Action Plan for putting the FDES to work10. The core set of Environment Statistics includes data about water based on the IRWS definitions. .II. Water policy information and its organization in quadrants
As mentioned before, the System of National Accounts (SNA) serves as a platform to produce all kinds of economic indicators, such as Gross Domestic Product (GDP), Gross Fixed Capital Formation (GFCF), and many others, which are useful for policy design and evaluation. These indicators are comparable, consistent, and provide a comprehensive view of the economy. The sequence of national accounts generates several balancing items, which are indicators themselves, or used with other data such as population, yield additional indicators. In the same way, the System of Environmental-Economic Accounts (SEEA) provides the basis for developing all kinds of policy relevant indicators to guide policy design and evaluation. The indicators provided by the SEEA include many other aspects not included in the SNA. Moreover, the indicators calculated with the SEEA are coherent with those calculated with the SNA. The combination of indicators based on the SNA and the SEEA provides a great variety of indicators on the economy and environment to inform policy makers. Likewise, several indicators specific to water can be derived from the SEEA-Water. They also assist, in combination with other statistical standards, with the integration of social data, such as demographic and labor statistics.
10 UNSD website: http://unstats.un.org/unsd/environment/fdes.htm
D R A F T
15
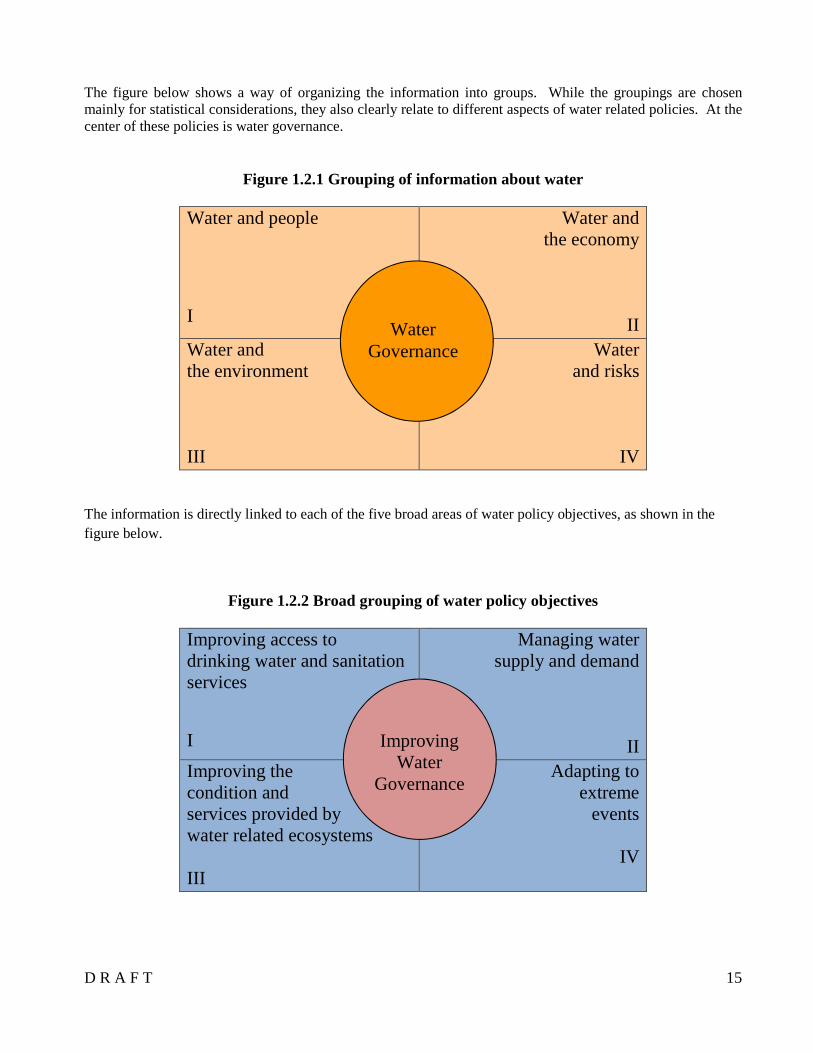
The figure below shows a way of organizing the information into groups. While the groupings are chosen mainly for statistical considerations, they also clearly relate to different aspects of water related policies. At the center of these policies is water governance.
Figure 1.2.1 Grouping of information about water
Water and people I
Water and the economy
II Water and the environment III
Water and risks
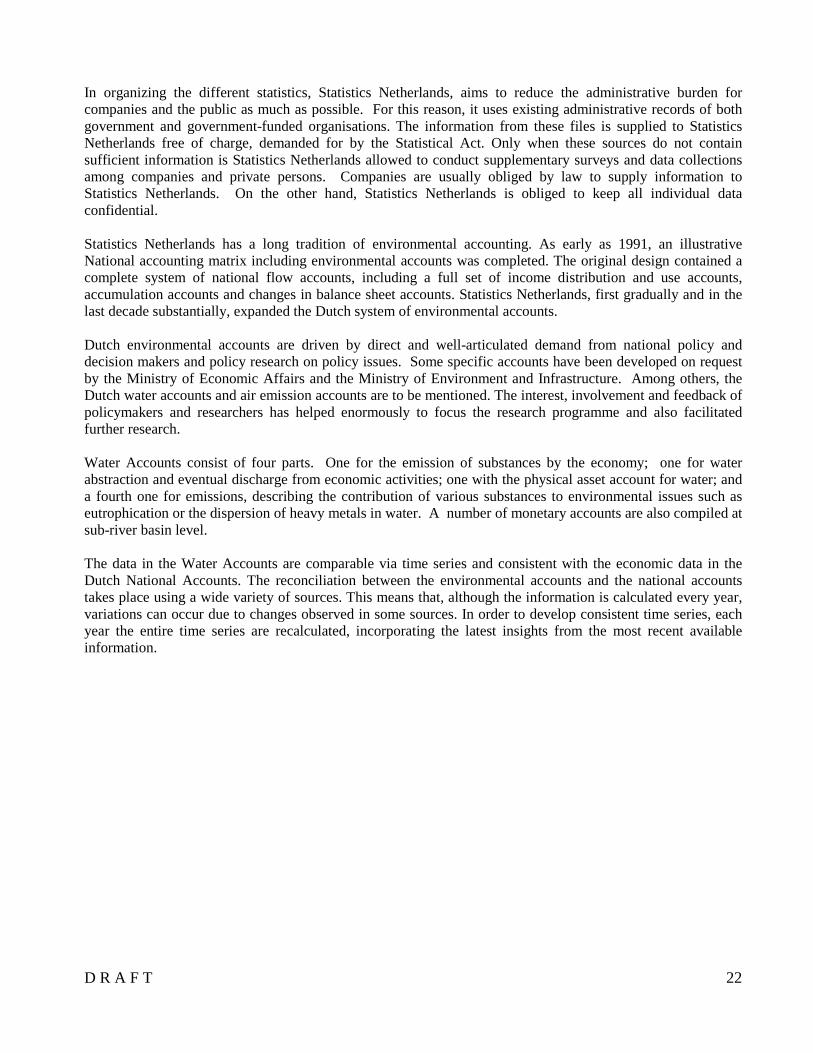
IV The information is directly linked to each of the five broad areas of water policy objectives, as shown in the figure below.
Figure 1.2.2 Broad grouping of water policy objectives
Improving access to drinking water and sanitation services I
Managing water supply and demand
II Improving the condition and services provided by water related ecosystems III
Adapting to extreme
events
IV
Improving Water
Governance
Water Governance

D R A F T
16
Depending on country priorities and water management issues, as well as the degree of statistical development and available resources, each country can decide on the level of detail for the data collection and compilation process for each of these five groups. Depending on the level of detail and type of information to be collected, countries may decide to implement different sections of the SEEA, usually starting with those in the standard Central Framework (CF), and then moving to the SEEA Ecosystem Experimental Accounts. This is explained below for each group or quadrant. Quadrant I, Improving access to drinking water and sanitation services The first quadrant refers to all the information related to the provision of drinking water and sanitation services to households, including health centers and schools. It includes physical and monetary data about the production and consumption of drinking water and sewerage, products classified with the four-digit codes of CPC 18000 and 94110, produced by the activities of water supply and sewerage, classified with the four-digit codes of ISIC 3600 and 3700. The physical information includes the amount of water supplied by the utilities11 to households (which can be classified by income), as well as to other users, the amount of wastewater generated and either collected by wastewater utilities or discharged directly to the environment. The monetary information includes the price of the services, as well as all the financial flows of the water and wastewater utilities, including fixed capital formation, consumption of fixed capital, and compensation of employees (see chapter 2). This monetary information is part of the Global Analysis and Assessment of Sanitation and Drinking Water (GLAAS) project led by the World Health Organization. Quadrant II, Managing water supply and demand The second quadrant, Managing water supply and demand, refers to the information related to the water cycle in nature and in the economy. It includes the abstraction, use, reuse, and return of water resources by the different economic activities and households, as well as hydrological information required to estimate total renewable water resources. The information includes amounts, in physical units, of water abstracted by the different economic activities, water supplied to the different users, wastewater generated by the different users, wastewater treated and sent for reuse or discharged to the environment. The monetary information includes gross value added, as well as intermediate consumption, especially of water (CPC 18000) and sewerage (CPC 94110). Gross fixed capital formation and consumption of fixed capital is also important for understanding water supply needs, not only for drinking water as mentioned in quadrant I, but also water supply for agriculture. Quadrant III, Improving the condition and services provided by water related ecosystems The third quadrant, improving the condition and services provided by water related ecosystems, refers to all the biophysical information necessary for tracking changes in extent and condition of water-related ecosystems, as well as for measuring the ecosystem services provided. The measurements include statistical data as well as cartography about the conditions and provisioning services of the related ecosystems.
11 The term utility is used for both private and public enterprises that perform the activities of drinking water supply and sewage collection and treatment.

D R A F T
17
The information includes the different characteristics and state of water bodies (rivers, lakes, wetlands, aquifers), such as the amount of pollutants in the water and water beds, the quantity and diversity of aquatic life living in the water bodies, the disturbances to the natural path of water, etc. It also includes flow analyses to determine flow patterns and quantify required environmental flows. A wide variety of indicators related to quadrant III can be calculated from the data integrated in the SEEA Experimental Ecosystem Accounts. The following types of indicators can be generated:
• Water quality indicators • Actual renewable water resources based on the ecosystem carrying capacity and regulating services • Ecosystem carrying capacity to absorb the different types of pollutants • River fragmentation indicators • Wetland extent • Environmental flows • Mean species abundance
Quadrant IV, Adapting to extreme events The fourth quadrant, adapting to extreme events, refers to the information related to extreme events having an impact on water ecosystems, such as floods and droughts. It includes information about the frequency and magnitude of the events and their effects on the population and economy. It includes all the expenditures related to mitigation, adaptation, as well as remediation. The information includes magnitude and return periods of precipitation, storms, as well as hydrologic droughts. Other data include cartographic information about areas prone to flooding, data on housing and economic activities in those areas, and artificial reservoir storage capacity for flood control. A wide variety of indicators related to quadrant III can be calculated from the data integrated in the various accounts. The following type of indicators can be generated:
• Direct economic losses due to hydro-meteorological events • Actual renewable water resources based on the ecosystem carrying capacity and regulatory services • Ecosystem carrying capacity to absorb the different types of pollutants • Environmental flows
Water governance related information The information in the different quadrants described above will be useful for assessing aspects of water governance. For example, all the financial information, the information on human resources required for the water sector and for water resources management provide the basis for informing about water governance. The SEEA provides a framework for coordinated work among the different institutions participating in water management activities.

D R A F T
18
.III. Incorporating water monitoring in National St atistical Systems (NSS) The NSS must be able to respond in a precise, effective, and sustainable manner to ongoing changes in societies and economies including, among other things, new information requirements. This response should entail a co-ordinated national effort aimed at improving the mechanisms and processes needed to produce relevant statistics. While national statistical offices are usually responsible for compiling and disseminating official statistics, statistical units in line ministries are also responsible for collecting and providing sector specific data which are key to monitoring development progress. It is, therefore, imperative that the specific information requirements of each relevant sector are integrated into the design of the NSS.
• development policies require comprehensive data from a variety of sectors to be effective; • it is necessary to integrate and disseminate data collected by line ministries and national statistical
offices to meet the results-based development agenda A NSS brings together key stakeholders, including institutions involved in producing, supplying and using official statistics. Typically, the NSO has a legal mandate to coordinate activities so that data collected, compiled and disseminated by different sectors and agencies are consistent and comparable and can be used with confidence. Sectoral statistics are produced through the statistical system of each sector which may be functionally centralized or decentralized within the NSS. Mainstreaming of sectoral statistical systems requires that stakeholders involved in producing, supplying and using sectoral statistics are more involved in the functioning of the NSS. They should also work with each other and with the NSO to develop shared goals and cross-cutting strategies, and to streamline institutional and coordination arrangements. The intended outcome is an NSS capable of efficiently and effectively monitoring development progress, which can be brought about by implementing the following objectives and strategies:
• Make more efficient use of resources: By creating coordination mechanisms, agreeing common legal and institutional frameworks, developing NSS-wide financing strategies and human resource policies, and sharing physical, information technology, and communication infrastructures.
• Improve the productivity of data management: By streamlining management processes by, for example, creating a data warehouse.
• Increase the availability of quality data: By developing a common data dictionary and standards of data quality, and agreeing on comprehensive data production and dissemination policies.
• Raise the public profile for statistics: By developing a coherent NSS-wide advocacy strategy. National Strategy for the Development of Statistics Many countries around the world have developed a strategic planning process known as the “National Strategy for the Development of Statistics (NSDS)”. An NSDS enables countries to build a reliable statistical system that produces the data necessary to design, implement, and monitor national development policies and programs. Given that water is a priority for many countries, it should be incorporated in the NSDS. An NSDS is expected to provide a country with a framework for strengthening statistical capacity across the entire NSS. The NSDS provides a vision for where the NSS should be in five to ten years, sets priorities and

D R A F T
19
identifies milestones for getting there. It presents a comprehensive and unified framework for continual assessment of user needs and priorities for statistics, and for building the capacity needed to meet these in a more coordinated, synergistic and efficient manner. It also provides a framework for mobilizing, harnessing and leveraging resources (both national and international) and a basis for effective and results-oriented strategic management of the NSS. The key principles are that an NSDS should:
• be nationally led and owned, with high level political support and champions; • be demand-focused and integrated into national development policy processes, taking account of
countries’ regional and international commitments; • be developed in an inclusive and consultative way; • assess all statistical sectors and user needs and provide a vision and strategic plan for national statistics; • set out a comprehensive statistical development program which is prioritized and timetabled, to build
the capacity to deliver results. This should incorporat plans for implementation, monitoring, and evaluation, but also be flexible enough to cope with change;
• address institutional and organizational constraints and processes, including resources, for the sustainable development of statistical systems and outputs;
• build quality “fit for purpose”, drawing on best international practices and standards; • build on what exists and is being developed and continue to satisfy immediate needs for statistics
during the NSDS process; • respond to user needs but be realistic about resources; • serve as a coherent framework both for international support for statistical development and statistics
programs across the NSS. Institutional arrangements for an integrated monitoring system for water The practices to achieve an integrated monitoring system for water may vary depending on the degree of centralization or decentralization of the national statistical system (NSS). NSS that are less advanced and complex should adopt at an early stage the principles of integration of environmental statistics into the design of their statistical production process. More advanced statistical systems should incorporate the principles of integration in the re-engineering of their statistical production process and institutional arrangements. It should be recognized that one single and detailed implementation approach towards an integrated monitoring system for water is neither possible nor desirable because national statistical systems are different. There are, however, general principles and good practices that are presented in these Guidelines. Integration requires a broad and comprehensive system-wide approach encompassing:
a) the adoption of an integrated conceptual framework as the umbrella framework for organizing water information. This is provided by the SEEA in general and the SEEA-Water in particular;
b) the creation of institutional arrangements for integrating the information; and c) the establishment of an integrated information production process.
These building blocks are interlinked and mutually reinforcing structures for setting up integrated statistical systems. The integrated conceptual framework provided by the SEEA-Water is perfectly aligned with other internationally accepted standards and international recommendations. The framework is also comprehensive, including all the flows and stocks at the base of the behavior of all inland water systems. The institutional setting has an important role to play in the building blocks of the integrated statistical production process. The functions and responsibilities of the lead statistical agency in the country can be carried out more efficiently if it is supported in this role by institutional arrangements such as advisory committees,

D R A F T
20
relationship meetings, memorandums of understanding, service level agreements, technical cooperation, and a legal framework that protects the confidentiality and integrity of the data while allowing for the sharing of data between partner statistical agencies. It is crucial for integration to apply uniform concepts, definitions and classifications based on internationally accepted standards and classifications, for which the SEEA-Water functions as the umbrella framework. The use of harmonized terminology, concepts, definitions, and classifications is necessary in a national statistical system so that the various data collections are comparable and can be related to each other. In all phases of the integrated statistical production process, common concepts are recommended. To ensure the use of consistent terminology and definitions, statistical agencies should establish a terminology management strategy to reduce the use of inconsistent terminology applied in questionnaires and in dissemination. For this purpose the appropriate tools, including thesaurus and glossary of concepts should be developed and adopted across the organization. The glossaries, as a minimum, should contain a concept label, definition, detailed source information and related terms. Integrated statistics obtained through the use of harmonized classification devices are more powerful than statistics collected without harmonization. Harmonization has been achieved, for example, through the implementation of standards such as the International Standard Industrial Classification of All Economic Activities (ISIC) (United Nations (2008a). It should be noted that integration is a broader concept than harmonization as it goes beyond harmonizing concepts, definitions, classifications or standards. The harmonization of standards is only one dimension of integration. Nevertheless, coordination among agencies is essential for achieving the integration of information and therefore relevance for the decision making process. Water is a cross-cutting issue that usually requires information from several agencies, such as, the water resources ministry or agency, the meteorological office, the regulator of water supply and sewerage service providers (or the utility or utilities when this is possible), the ministry of agriculture, the electricity company or regulator, etc. It is important that one agency assumes the leadership of efforts to compile integrated water accounts and statistics, and convenes the other agencies in order to integrate and harmonize the information. The IRWS discuss all these issues of inter-organizational arrangements for a data collection strategy in chapter V. These Guidelines further discuss the topic in Chapter 5. Examples in countries Recent reforms to Mexico’s National Statistical Systems In 2006 article 26 of the Federal Constitution of Mexico was modified in order to include the creation of a National Statistical and Geographical Information System (SNIEG). A new law was enacted in 2008 to regulate the system. The new law states that the purpose of the SNIEG is to produce Information of National Interest, which is necessary for the design and evaluation of public policies in Mexico. The information produced by the SNIEG is considered official and of mandatory use by the Federal Government, the States and the Municipalities. The legislative changes make INEGI, the National Institute of Statistical and Geographical Information, an entity with full technical and operational autonomy. INEGI is no longer part of the Mexican Executive Branch, but an autonomous entity similar to other bodies, such as the Federal Elections Institute and the Central Bank.

D R A F T
21
INEGI is ruled by a Board of Governors consisting of 5 members appointed by the President of Mexico and ratified by Congress. INEGI becomes the coordinator of the SNIEG. It changes its role of mainly an information producer to the coordinator of the production of Information of National Interest. The Information of National Interest has to support the design and evaluation of public policies. It has to be produced periodically according to scientifically based methodologies. The law requires the integration of Specialized Technical Committees for the different topics in which the Information of National Interest is grouped. The committees are formed by the different line ministries that produce or use the information included in the committee’s domain, as well as different agencies and organizations that provide technical inputs to the process. A specialized technical committee of information about water (CETAGUA) was created in 2010. This committee is responsible for determining the information that will be classified as of national interest, as well as establishing the priorities of INEGI and the relevant Ministries in the different projects related to Information of National Interest. The CETAGUA is presided over by the National Water Commission of Mexico (CONAGUA), which is the entity in charge of water policy design and implementation in Mexico. INEGI is the permanent secretariat. The CETAGUA was formed based on the experience of inter-organizational cooperation for water information that started in 2005 with the creation of a group of mainly federal government agencies with the purpose of sharing water policy relevant information. The different information projects are shared among the members of the committee and synergies are sought among the agencies. The SEEA-Water is used as the methodological basis for guiding the priorities of information collection and dissemination. The National Statistical System of the Netherlands The Netherlands has a highly centralized statistical system. Statistics Netherlands is the agency responsible for collecting and processing data in order to publish statistics to be used in practice, by policymakers, and for scientific research. The agency was created in 1899, and until January 2004, it was a department of the Ministry of Economic Affairs. Since 2004, it is an autonomous agency with its own legal personality, even though the minister of Economic Affairs is still politically accountable for the creation of conditions for an independent and public production of high quality and reliable statistics, as well as for its legislation and budget. In order to guarantee the independence and impartiality of the National Statistical System, there is an independent body, the Central Commission for Statistics (CCS), which oversees official statistics in the Netherlands. The CCS is made up of a chairman and between six and ten additional members. The members of the CCS cannot be civil servants subordinated to the Minister. The CCS has, among other duties, to foster the provision of statistical information for the government which meets the needs of practice, policy and science, to assess the work programs of Statistics Netherlands, and to draw up management regulations. Every year, Statistics Netherlands implements a statistical programme laid down in the corresponding annual plan, based on a long-term work program submitted to the CCS. The statistical output has to comply with national and international legal obligations. The output to be achieved as part of the normal statistical program is translated into performance indicators, which are included in the annual reports, submitted for approval by the CCS.
D R A F T
22
In organizing the different statistics, Statistics Netherlands, aims to reduce the administrative burden for companies and the public as much as possible. For this reason, it uses existing administrative records of both government and government-funded organisations. The information from these files is supplied to Statistics Netherlands free of charge, demanded for by the Statistical Act. Only when these sources do not contain sufficient information is Statistics Netherlands allowed to conduct supplementary surveys and data collections among companies and private persons. Companies are usually obliged by law to supply information to Statistics Netherlands. On the other hand, Statistics Netherlands is obliged to keep all individual data confidential. Statistics Netherlands has a long tradition of environmental accounting. As early as 1991, an illustrative National accounting matrix including environmental accounts was completed. The original design contained a complete system of national flow accounts, including a full set of income distribution and use accounts, accumulation accounts and changes in balance sheet accounts. Statistics Netherlands, first gradually and in the last decade substantially, expanded the Dutch system of environmental accounts. Dutch environmental accounts are driven by direct and well-articulated demand from national policy and decision makers and policy research on policy issues. Some specific accounts have been developed on request by the Ministry of Economic Affairs and the Ministry of Environment and Infrastructure. Among others, the Dutch water accounts and air emission accounts are to be mentioned. The interest, involvement and feedback of policymakers and researchers has helped enormously to focus the research programme and also facilitated further research. Water Accounts consist of four parts. One for the emission of substances by the economy; one for water abstraction and eventual discharge from economic activities; one with the physical asset account for water; and a fourth one for emissions, describing the contribution of various substances to environmental issues such as eutrophication or the dispersion of heavy metals in water. A number of monetary accounts are also compiled at sub-river basin level. The data in the Water Accounts are comparable via time series and consistent with the economic data in the Dutch National Accounts. The reconciliation between the environmental accounts and the national accounts takes place using a wide variety of sources. This means that, although the information is calculated every year, variations can occur due to changes observed in some sources. In order to develop consistent time series, each year the entire time series are recalculated, incorporating the latest insights from the most recent available information.

D R A F T
23
REFERENCES: System of Environmental-Economic Accounting, Central Framework. White cover publication. 2012. United Nations World Water Assessment Programme and United Nations Statistics Division.- Monitoring Framework for Water: the System of Environmental-Economic Accounts for Water (SEEA-Water) and the International Recommendations for Water Statistics (IRWS).- 2011 UNESCO-WWAP and UNSD. United Nations Statistical Commission (Room Documents for the 43rd Session).- Guidelines on Integrated Economic Statistics .- March 2012 http://unstats.un.org/unsd/statcom/doc12/RD-IntegratedEcoStats.pdf The United Nations World Water Development Report 2.- UNESCO 2006 The United Nations World Water Development Report 4: Managing Water under Uncertainty and Risk.- UNESCO 2012 Paris 21 Secretariat.- A Guide to Designing a National Strategy for the Development of Statistics (NSDS).- November 2004. African Development Bank.- Mainstreaming sectoral statistics systems in Africa: a guide to planning a coordinated national statistical system.- November 2007. Paris 21 Secretariat.- The NSDS Approach in a Nutshell.- De Haan, Mark (1997); Water accounts in the Dutch NAMEA: A “NAMWA” for 1991; CBS; Voorburg. Graveland, C. (2006), Dutch water flow accounts with preliminary results for 2003 and 2004. Eurostat paper, Heerlen/The Hague. Graveland, C. and Baas, K. (2012). Improvement of the national water balance; Water stocks; feasibility of water balances per river basin. Final report on Eurostat Water Statistics Grant: Grant Agreement NO. 50303.2010.001–2010.564, Heerlen/The Hague. Statistics Netherlands Implementation of the System of Environmental-Economic Accounting Central Framework in the Netherlands, 2013. Sixty-first plenary session: Key challenges in implementing the System of Environmental-Economic Accounting. Economic and Social Council. Schenau, S. Delahaye, R. Edens, B. van Geloof, I, Graveland, C. and van Rossum, M. (2010). The Dutch environmental accounts: present status and future developments. Statistics Netherlands (CBS), The Hague/Heerlen.

D R A F T
24
28 May 2014
Rev 47 Chapter 2 INTEGRATION OF DATA IN ACCOUNTS TO RESPO ND TO
POLICY NEEDS This chapter provides an overview of the principles and key accounting concepts as they relate to water in order to develop a monitoring system of comprehensive, consistent and comparable policy relevant information. The chapter also gives an overview of the standards that are used to classify economic activities and products. The concepts are explained through numerical examples, which illustrate the use of the standard tables for checking data consistency, as well as for providing the basis for planning the data collection processes. V. Overview of the Accounting Framework • Accounts of the SNA • Accounts and tables of the SEEA • Set of statistical methodologies for compiling information VI. International Classification Standards • Industry (ISIC) and product (CPC) classifications • Industrial activities and products most relevant for water accounts VII. Concepts of the National Accounts • Sequence of Economic Accounts • Monetary Supply and Use Tables VIII. Concepts of the Water Accounts • Asset Accounts • Physical Supply and Use Tables • Emissions account • Sequence of economic accounts for water supply and sewerage

D R A F T
25
.I. Overview of the Accounting Framework The System of Environmental Economic Accounts for Water (SEEA-Water) and the International Recommendations for Water Statistics (IRWS), in combination with other statistical standards, provide the methodological basis for developing a monitoring system that provides comprehensive, consistent and comparable information for water policy design and evaluation. The SEEA-Water is a subsystem of the System of Environmental Economic Accounts (SEEA). It applies the accounting concepts, structures, rules and principles of the System of National Accounts (SNA), which allows comparing and contrasting data across a broad spectrum of environmental and economic issues. The SEEA-Water is based on a systems approach in which inland water resources and the economy are viewed as an interconnected network of institutional and natural units. The focus is placed on the behavior of a system of natural elements (inland water resources) interacting with a system made of institutional units that exchange goods and services, including water (the economy). The methodological basis builds upon the existing capacity created around the System of National Accounts (SNA). The point of departure of the SNA is the economy of a country, which is viewed as a system or network of economic interrelations (SNA 2008, Par. 2.8). Accounts of the SNA In an economy, at a point in time, the supply of goods and services has to balance with the use of those goods and services. In the same way, the monetary flows used for the transactions of those goods and services have to be in balance. The sequence of economic accounts is the tool provided by the SNA to perform balance all the aforementioned flows step by step. Through each step of the sequence different concepts, useful for economic policy analysis, are brought into play. Two sets of accounts are part of the sequence:
1. Current accounts (“flow accounts”), which focus on understanding the present or current dynamics of the system, including its structure (the connections or interrelations in the network), and
2. Accumulation accounts (“stock or asset accounts”) which focus on how the current or present dynamics of the system is affecting its future state, in order to understand the behaviour of the system through time (dynamic behaviour).
The final component of the sequence of accounts is the balance sheet, which provides a summary of the accounts, showing the dynamic history of the system. The table below summarizes the different accounts which comprise the SNA. They can be performed in sequence, known as the sequence of economic accounts, starting from production accounts and ending with the balance sheet. The Goods and Services account is not considered part of the sequence of accounts, but it is part of the current or flow accounts. The goods and services account is one of the most basic, if not the most basic, identity of the SNA. The whole sequence of accounts can be viewed as built around the goods and services account by adding transactions relating to the generation, distribution and redistribution of income and saving (SNA 14.11).

D R A F T
26
Table 2.1.1. Accounts of the System of National Accounts
Type of
Accounts Classification of the different Accounts in the SNA
Current
accounts (SNA
2.83)
Production account (SNA 2.86)
Inco
me
Acco
un
ts
Primary
distribution
of income
accounts
(SNA 2.90)
Generation of income account (SNA 2.91)
Allocation of
primary income
account (SNA
2.92)
Entrepreneurial account (SNA 7.22)
Allocation of other primary income
account (SNA 7.22)
Redistributi
on of
income
accounts
(SNA 8.1)
Secondary distribution of income account (SNA 2.95)
Redistribution of income in kind account (SNA 2.98)
Use of
income
accounts
(SNA 9.1)
Use of disposable income account (SNA 9.1)
Use of adjusted disposable income account (SNA 9.1)
Accumulation
accounts (SNA
2.107)
Capital account (SNA 2.110)
Financial account (SNA 2.1120)
The other changes in assets
accounts (SNA 12.1)
Other changes in the volume of assets account
(SNA 2.114)
Revaluation account (SNA 2.115)
Balance sheet
Goods and services account (SNA 14.1)*
* The goods and services account is not part of the “sequence of accounts,” but it is a current or flow account.
Adapted from figure 2.2 of the SNA 2008.
Each account yields a balancing item, which is the starting point of for the next account in the sequence. With the financial account the total supply of monetary flows is fully balanced with the total use of those monetary flows, yielding a zero balance. Each balancing item provides a useful indicator for economic policy design and evaluation. The following table shows the balance of each account.

D R A F T
27
Table 2.1.2. Balance of each of the accounts in the SNA
Accounts
Balance Obtained
Production account (SNA 2.86) • Gross Value Added
Inco
me
Acco
un
ts
Primary
distribution of
income
accounts (SNA
2.90)
Generation of income
account (SNA 2.91)
• Gross Operating Surplus
Allocation of primary
income account (SNA
2.92)
• Balance of primary income
Redistribution
of income
accounts (SNA
8.1)
Secondary distribution of
income account (SNA
2.95)
• Gross Disposable income
Redistribution of income
in kind account (SNA
2.98)
• Gross Adjusted disposable income
Use of income
accounts (SNA
9.1)
Use of disposable income
account (SNA 9.1)
• Gross Saving
Use of adjusted
disposable income
account (SNA 9.1)
Capital account • Net lending or borrowing
• Changes in net worth due to saving
and capital transfers
Financial account • Zero
Other changes in the volume of assets account • Changes in net worth due to other
changes in volume of assets
Revaluation account • Changes in net worth due to nominal
holding gains and losses
The balance of the Goods and Services account is zero. The total supply and total use of goods and services is balanced with one single account. The figure below shows an example, from the Unu-Water exercise, of the balance of monetary flows in an economy. “Supply” is shown on the left side, and “use” on the right side. The accumulated height of the bars on the left side has to be the same as the one on the right.

D R A F T
28
Figure 2.1.1. Balanced supply and use of monetary units
“Supply” “Use”
The following concepts are used in the figure above. An abridged definition is provided below together to the reference to the System of National Accounts 2008 (SNA).
Consumption Consumption of goods and services is the act of completely using up the goods and services in a process of production or for the direct satisfaction of human needs or wants. (SNA 9.39)
Consumption of Fixed Capital
Consumption of fixed capital is the decline, during the course of the accounting period, in the current value of the stock of fixed assets owned and used by a producer as a result of physical deterioration, normal obsolescence or normal accidental damage. (SNA 6.240).
Final Consumption Expenditure
Final consumption expenditure is the amount of expenditure on consumption goods and services. (SNA 9.7).
Intermediate Consumption
Value of the goods and services consumed as inputs by a process of production, excluding fixed assets whose consumption is recorded as Consumption of Fixed Capital. (SNA 6.213)
Gross Capital Formation (GCF)
Gross capital formation shows the acquisition less disposal of produced assets for purposes of Fixed Capital Formation, inventories or valuables. (SNA 10.24)
Net Borrowing / Net Lending
Difference between changes in net worth due to saving and capital transfers and net acquisition of non-financial assets. If the amount is negative it represents net borrowing. (SNA 10.28).
Output Output is defined as the goods and services produced by an establishment, excluding the value of any goods and services used in an activity for which the establishment does not assume the risk of using the products in production... (SNA 6.89)
Subsidies on Products Is a subsidy payable per unit of a good or service. (SNA 7.100)
Net borrowing 2
Taxes on products 6
Output
161
Final Consumption
Expenditure
73
Intermediate
consumption
62
Gross Capital Formation
34
GDP
105

D R A F T
29
Taxes on Products Taxes on products consist of taxes on goods and services that become payable as a result of the production, sale, transfer, leasing or delivery of those goods or services, or as a result of their use for own consumption or own capital formation. (SNA 7.73). The figure actually shows taxes net of subsidies on products, which means that subsidies on products were subtracted from taxes on products.
Output supplies 161 monetary units, Taxes less subsidies on products provide 6 monetary units, and Net borrowing provides an additional 2 monetary units. Total supply is therefore 169 = 161 + 6 +2 monetary units. These monetary units are used for Intermediate Consumption, 62; for Final Consumption Expenditure, 73; and for Gross Capital Formation, 34. Total use is therefore 169 = 62 + 73 +34. Note that Gross Domestic Product (GDP) is the difference between Output and Intermediate Consumption, plus taxes less subsidies on products not included in the Output. The balance shown above can be found step by step, using intermediate balances that result from each account of the sequence of accounts. The example is a simplified version of the sequence of accounts. For simplicity, some elements of the accounts have been left out. Besides the concepts defined above, the following concepts are needed for the sequence, excluding the intermediate balances shown in yellow.
Capital transfers Capital transfers are unrequited transfers where either the party making the
transfer realizes the funds involved by disposing of an asset (other than cash or inventories), relinquishing a financial claim (other than accounts receivable) or the party receiving the transfer is obliged to acquire an asset (other than cash) or both conditions are met. (SNA 8.10). For example, investment grants.
Current Transfers Current transfers consist of all transfers that are not transfers of capital. (SNA 8.39)
Compensation of employees
Compensation of employees is defined as the total remuneration, in cash or in kind, payable by an enterprise to an employee in return for work done by the latter during the accounting period. (SNA 7.5)
Property income Is the income that accrues by lending or renting financial or natural resources, including land, to other units for use in production (SNA 7.2). Property income is the sum of investment income and rent. (SNA 7.107). It includes resource rent, interest, distribution of income of corporations, reinvested earnings on foreign direct investments, investment income disbursements. It could be receivable or payable.
Taxes (or subsidies) on production
All taxes (or subsidies) except taxes (or subsidies) on products, payable (or receivable in the case of subsidies) regardless of the profitability of the production. They include: a). Taxes on payroll or work force b). Recurrent taxes on land, buildings or other structures c). Business and professional licenses d). Taxes on the use of fixed assets or other activities e). Stamp taxes f). Taxes on pollution g). Taxes on international transactions (SNA 7.97) Taxes on production are called “Other Taxes on Production” in the SNA. Subsidies on production are called “Other Subsidies on Production.”

D R A F T
30
Transfer Transactions in which one party provides a good, service or asset to the other but does not receive a recompense in return. This kind of transaction is sometimes called a “something for nothing” transaction, or a transaction without a quid pro quo. (SNA 3.58)
Figure 2.1.2. Graphical representation of the sequence of economic accounts
The sequence can be described, in a simplified way, as follows:
• The first account in the sequence, the production account, subtracts Intermediate Consumption from Output, yielding the first balance, which is Gross Value Added.
• The next account, the Generation of Income Account, subtracts Compensation of Employees and Taxes net of subsidies on production from Gross Value Added, yielding the second balance, which is Gross Operating Surplus.
• The Allocation of Primary Income Account, takes Gross Operating Surplus, adds the Compensation of Employees, as well as Taxes net of subsidies, and subtracts and/or adds Property Income, yielding the third balance, which is Balance of Primary Income.
• The Secondary Distribution of Income Account, takes the Balance of Income and adds Current Transfers, yielding the fourth balance, which is Gross Disposable Income.
• The Redistribution of Income Account, takes the Gross Disposable Income and subtracts Final Consumption Expenditure, yielding Gross Saving.
• The Capital Account, takes Gross Saving and adds or subtracts Capital Transfers, then subtracts Gross Capital Formation, yielding Net Lending, if the balance is positive, or Net Borrowing, if the balance is negative.
Total SupplyProduction
Account
Generation of
Income Account
Allocation of
Primary Income
Account
Secondary
Distribution of
Income Account
Redistribution of
Income Account
Net borrowing 2 Net borrowing 2
Taxes on prods 6 Taxes on prods 6
Balance of Primary
Income 105
Gross Disposable
Income
105
Gross Saving 32
Capital Account
Compensation of
employees
42
Output
161
Gross Value
Added
99
Gross Operating
Surplus 42
Final Consumption
Expenditure
73
Taxes less subsidies
on production 15
Gross Capital
Formation
34
Intermediate
consumption
62

D R A F T
31
• The Financial Account, yields a zero balance, which shows that total supply is equal to total use. This is implicit in the figure, since the size of the bars on the right side (representing use) add to the size of the bar on the far left (total supply).
The sequence of economic accounts is a useful tool for balancing the monetary flows in an economy step by step. This provides more control throughout the balancing process, while bringing into play additional concepts useful for the definition of a wide variety of indicators. The sequence of economic accounts is usually done by institutional sectors, but can be performed for the whole economy, or can be performed for an industry, as shown in the last section of this chapter for the case of water supply and sewerage. The end balance of economic flows is capital formation and net lending or net borrowing. Gross Capital Formation less Consumption of Fixed Capital is Net Capital Formation, which changes the stocks of produced non-financial assets. Net Lending, or Net Borrowing, is translated into the acquisition and/or disposal of financial assets or liabilities. The accumulation history is recorded as stocks of assets. In fact “assets are a means of carrying forward value from one accounting period to another” (SNA 3.5). In the SNA, assets are divided into financial and non-financial. Non-financial assets can be produced (the result of accumulation of products) or non-produced assets. All financial assets are non-produced. The table below shows the complete classification of assets in the SNA.
Table 2.1.3. Classification of assets in the SNA
Non-financial
Produced (SNA 10.9)
Fixed assets Inventories Valuables
Non-produced (SNA 10.14)
Natural resources Contracts, leases, and licenses Goodwill and marketing assets
Financial (SNA 11.8)
Non-produced
Monetary gold and Special Drawing Rights (SDRs) Currency and deposits
Debt securities Loans Equity and investment fund shares/units Insurance, pension and standardized guarantee schemes Financial derivatives and employee stock options Other accounts receivable/payable
Of special interest to environmental economic accounting are the supply and use tables, and the input-output tables, which are part of the Goods and Services Account. They are useful tables for describing the structure, or economic interrelations that exist at the interior of an economy. These tables show the flow of products from one industry to another, as well as from industries to final consumers.

D R A F T
32
Accounts and Tables of the SEEA The SEEA follows a structure that is similar to the SNA. The tables below show accounts and tables that are characteristic of the SEEA and its subsystems:
Table 2.1.4. SEEA tables and accounts
Tables or accounts Brief description Supply and use tables in physical and monetary terms (SEEA 2.3.2)
Show the flows of natural inputs, products and residuals for the different sectors or industrial activities. Supply and use tables are also compiled in monetary terms, especially to show information about the water supply and sewerage industries. Supply and use tables also include the release of pollutants.
Asset accounts (SEEA 2.3.3) Show the opening and closing stocks of environmental assets and the different types of changes of the stocks over an accounting period, in order to determine the depletion, if applicable, of the environmental assets.
Sequence of economic accounts (SEEA 2.3.4)
Follows the broad structure of the SNA sequence of accounts, showing the balancing items, such as value added, operating surplus, and net lending or borrowing. These balances can be adjusted using depletion measures from asset accounts.
Functional accounts (SEEA 2.3.5) These accounts highlight the relevant monetary information about transactions related to environmental activities and environmental goods and services.
Employment, demographic and social information tables (SEEA 2.3.6)
These complementary tables enhance the usefulness of the information in the other tables and accounts by relating environmental and economic data to estimates of employment, population and various demographic breakdowns.
A brief description of the five groups of accounts in the SEEA follows: Supply and Use Tables in Physical and Monetary Terms Monetary supply and use tables record all the flows of products in an economy between different economic units in monetary terms. They are compiled to describe the structure of an economy and the level of economic activity (SEEA 2.30). Monetary supply and use tables are a component of the SNA. They can be constructed with the information already available in the national accounts. The information has to be disaggregated and often complemented in order to respond to the needs of information for water policy. A very similar structure to the monetary supply and use tables can be used to record information of flows of materials and energy that enter and leave the economy and flows of materials and energy within the economy itself. When this information is recorded in the tables they are called physical supply and use tables. In the case of water, the flows of materials are flows of water expressed in units of volume per unit of time (e.g. million cubic meters per year). In the physical supply and use tables the flows from the environment to the economy are recorded as natural inputs (e.g. abstractions of water). Flows within the economy are recorded as product flows, and flows from the

D R A F T
33
economy to the environment are recorded as residuals (SEEA 2.14). Residuals may also be captured, collected, treated, recycled or reused by economic units (SEEA 3.74) remaining in the economy. Emission accounts have the same structure of the physical supply and use tables, but instead of showing amounts of water supplied or used they show amounts of pollutants supplied or used. Releases are polluting substances released by establishments and households as a result of production, consumption and accumulation. Emissions are releases to the environment. Releases and emissions only consider the amounts of pollution added by the activities. Asset accounts The intent of asset accounts is to record the opening and closing stock of environmental assets and the different types of changes in the stock over an accounting period. One motivation for accounting for environmental assets is to assess whether current patterns of economic activity are depleting and degrading the available environmental assets (SEEA 2.49). Asset accounts can be recorded in physical and monetary terms. In the case of water asset accounts are only recorded in physical terms, since there is yet no standardized way of valuing water assets. Asset accounts start with the opening stock of environmental assets, at the beginning of the accounting period, and end with the closing stock, at the end of the accounting period. The changes in between are recorded as additions and reductions in stock, and include a description of the additions and reductions. Sequence of economic accounts A wide range of monetary flows are recorded in the sequence of accounts of the SNA. The SEEA sequence of accounts follows the broad structure of the SNA sequence of accounts, showing the balancing items, such as value added, operating surplus, and net lending or borrowing. These balances are adjusted using depletion measures from asset accounts. The table below shows the accounts that make the SEEA sequence of economic accounts.
Table 2.1.5. SEEA sequence of economic accounts Account Balancing items 1 Production account • Gross value added (GVA)
• Net value added = GVA less consumption of fixed capital (CFC) • Depletion adjusted Net Value Added = Net Value Added less
depletion of natural resources 2 Generation of income
account • Gross operating surplus (GOS) • Net operating surplus = GOS less CFC • Depletion adjusted net operating surplus = Net operating surplus less
depletion of natural resources 3 Allocation of primary
income account • Gross balance of primary income • Net balance of primary income = Gross balance of primary income
less CFC.

D R A F T
34
• Depletion adjusted net balance of primary income = net balance of primary income less depletion adjusted natural resources
4 Secondary distribution of income account
• Gross disposable income • Net disposable income = Gross disposable income less CFC • Depletion adjusted disposable income = Net disposable income less
depletion of natural resources 5 Use of disposable income
account • Gross saving • Net saving = Gross saving less CFC • Depletion adjusted net saving = Net saving less depletion of natural
resources 6 Capital account • Net lending or borrowing The sequence of economic accounts is also useful for understanding the financial flows of specific sectors or industries. For example, the sequence is very useful for identifying financial gaps in the water supply and sewerage industries. Functional accounts These accounts, also known as environmental activity accounts, provide further disaggregation of the conventional industry and product classifications in order to highlight environmental activities and products. They include monetary information about activities undertaken to preserve and protect the environment. There are also taxes and subsidies that reflect efforts by governments to influence the behaviour of producers and consumers with respect to the environment. Environmental activities are classified as:
• Environmental protection activities, which have the primary purpose of preventing, reducing and eliminating pollution and other forms of degradation of the environment. This includes wastewater management activities.
• Resource management activities, which have the primary purpose of preserving and maintaining the stock of natural resources and hence safeguarding against depletion. This includes management of water resources activities.
Environmental goods and services include specific services, “connected” products and “adapted” goods. “Adapted” products include, for example, phosphate-free washing products and highly biodegradable products. “Connected” products include, for example, septic tanks, biological activators of septic tanks and services for collecting septic tank sludge. Employment, demographic and social information tables The usefulness of the information in the various tables and accounts of the SEEA-CF can be enhanced by relating different environmental and economic data to estimates of employment, estimates of population, various demographic breakdowns (such as age, household income levels, and household characteristics related to material well-being), and social measures, such as health and education (SEEA 6.48).

D R A F T
35
Set of statistical methodologies for compiling information In order to guarantee comparability and consistency of the information several statistical methodologies and classifications should be used. The figure below shows some of the methodologies that are linked to the different components of the SEEA, as illustrated in the figure below.
Figure 2.1.3 Set of statistical methodological guidelines for compiling information
.II. International classification standards Accounts are designed to provide information about the behaviour of institutional units and the activities in which they engage, namely production, consumption, and accumulation. This is achieved by recording the exchange of goods, services and assets between institutional units in the form of transactions12. Institutional units can be households, and legal or social entities, which include enterprises, government units, and non-profit institutions. The statistical work is aimed at collecting data from each element of the system (the institutional units) and aggregate them according to specific rules in order to understand the behaviour of the interconnected elements. In order to better understand the system according to the different production activities, enterprises are broken
12 System of National Accounts 2008, paragraph 1.7

D R A F T
36
down into one or more establishments. An establishment is an enterprise, or part of an enterprise, that is situated in a single location and in which only a single productive activity accounts for most of the value added. For statistical purposes the establishment becomes the basic statistical unit. In some cases it may not be possible or practical to divide enterprises into establishments, and therefore the information is reported by enterprises. Industry and product classifications In order to combine the data, the establishments are classified according to the International Standard Industrial Classification of All Economic Activities (ISIC). Likewise the products produced, consumed or accumulated by each establishment are classified according to another standard, the Central Product Classification (CPC). This standard classifications and their relevance to water are described below. The ISIC is organized in a hierarchical four-level structure of mutually exclusive and collectively exhaustive categories. Each category is coded with a letter for the section, and then numerically with two digits for divisions, three for groups, and four for classes. The zeros to the left are relevant in the classification codes of industrial activities and products (e.g. growing of non-perennial crops has the ISIC code 011 and not 11, which corresponds to manufacture of beverages). EXAMPLE: Operation of waterway locks is identified by the code 5222, according to ISIC.
• It belongs to section H, transportation and storage; • division 52, warehousing and support activities for transportation; • group 522, support activities for transportation; • class 5222, service activities incidental to water transportation.
Different versions of the ISIC have been adopted by the United Nations Statistical Commission (UNSC) through the years. The most recent version of the standard is revision 4, which was adopted in 2006. The Central Product Classification (CPC) provides standardized mutually exclusive and collectively exhaustive categories of products (goods and services) produced by the different industries. The most recent version of the classification is version 2, which was completed on 31 December 2008. The classification of products is divided into sections, divisions, groups, classes and subclasses with identifiers of up to 5 digits. EXAMPLE: Seeds of wheat belong to CPC subclass 01111.
• They belong to section 0, agriculture, forestry, and fishery products; • division 01, products of agriculture, horticulture and market gardening; • group 011, cereals; • class 0111, wheat • subclass 01111, wheat, seed.
CPC classifies products into categories based on the physical properties and the intrinsic nature of the products as well as the principle of industrial origin. The table below shows in the columns the different industries by ISIC section category and in the rows it shows the products by the different CPC section categories. As it can be seen through the diagonal of the table below, there is some correlation between the industries and the products, e.g. industries in section A of ISIC (agriculture, forestry and fishing) are the main producers of products in section 0 of CPC (agriculture, forestry and fishing), even though, industries in this section also produce food products, in section 2, for example.

D R A F T
37
Table 2.2.1. Relationship of Industrial and Product Classification
The grey shading shows the products that are produced by the activity shown in the corresponding column. For example, Agriculture, forestry and fishery products are produced by agriculture, forestry and fishing, as well as by manufacturing. The latest version of CPC is version 2, which was completed in 2008. Different regions and countries have adapted the standard classifications for their own specific needs. Some examples follow:
Region or Country Standard Classification of Industries
Standard Classification of Products
European Community Statistical Classification of Economic Activities in the European Community (known by the French acronym NACE).
Statistical Classification of Products by Activity in the European Economic Community (CPA)
Canada, Mexico and the United States of America
North American Industry Classification System (NAICS)
North American Product Classification System (NAPCS)
Australia and New Zealand Australian and New Zealand Standard Industrial Classification
Australian and New Zealand Standard Product Classification (ANZSPC)
A B C D E F G H I J K L M N O P Q R S T U
Agr
icul
ture
, for
estr
y an
d fis
hing
Min
ing
and
quar
ryin
g
Man
ufac
turin
g
Ele
ctric
ity, g
as, s
team
and
air
cond
ition
ing
supp
ly
Wat
er s
uppl
y; s
ewer
age,
was
te
man
agem
ent a
nd r
emed
iatio
n ac
tiviti
es
Con
stru
ctio
n
Who
lesa
le a
nd r
etai
l tra
de; r
epai
r of
mot
or
vehi
cles
and
mot
orcy
cles
Tra
nspo
rtat
ion
and
stor
age
Acc
omm
odat
ion
and
food
ser
vice
act
iviti
es
Info
rmat
ion
and
com
mun
icat
ion
Fin
anci
al a
nd in
sura
nce
activ
ities
Rea
l est
ate
activ
ities
Pro
fess
iona
l, sc
ient
ific
and
tech
nica
l ac
tiviti
es
Adm
inis
trat
ive
and
supp
ort s
ervi
ce a
ctiv
ities
Pub
lic a
dmin
istr
atio
n an
d de
fenc
e;
com
puls
ory
soci
al s
ecur
ity
Edu
catio
n
Hum
an h
ealth
and
soc
ial w
ork
activ
ities
Art
s, e
nter
tain
men
t and
rec
reat
ion
Oth
er s
ervi
ce a
ctiv
ities
Act
iviti
es o
f hou
seho
lds
as e
mpl
oyer
s;
undi
ffere
ntia
ted
good
s- a
nd s
ervi
ces-
prod
ucin
g ac
tiviti
es o
f hou
seho
lds
for
own
use
Act
iviti
es o
f ext
rate
rrito
rial o
rgan
izat
ions
and
bo
dies
0 Agriculture, forestry and fishery products
1 Ores and minerals; electricity, gas and water
2 Food products, beverages and tobacco; textiles, apparel and leather products
3 Other transportable goods, except metal products, machinery and equipment
4 Metal products, machinery and equipment
5 Constructions and construction services
6 Distributive trade services; accommodation, food and beverage serving services; transport services; and electricity, gas and water distribution services
7 Financial and related services; real estate services; and rental and leasing services
8 Business and production services9 Community, social and personal
services
Industries by ISIC section
Products by CPC section

D R A F T
38
(ANZSIC) Brazil National Classification of Economic
Activities (CNAE) List of industry products (PRODLIST)
Most of the regional and country specific classifications of industrial activities and products follow the same principles of the ISIC and CPC. However, they may have more detailed classifications or provide a different disaggregation. Correspondence tables for the different classifications have been developed in order to facilitate their comparability. Industrial activities and products most relevant for water accounts The two products most relevant to water resources management and water policy are natural water (CPC 18000), which is a good, and sewage treatment services (CPC 94110), which is a service:
Product subclass according to CPC
Description of products related to water
Remarks
18000 Natural water Includes potable and non-potable water, suitable for further use, including treated and untreated water.
94110 Sewerage and sewage treatment services
Includes sewage removal services and sewage treatment services.
The two products above are generated primarily by two industrial activities: water supply (ISIC 3600) and sewerage (ISIC 3700):
Industry class according to ISIC
Description of activities related to water
Remarks
3600 Water collection, treatment and supply
In water accounts it is important to separate the establishments that supply water through water supply networks in cities (drinking water that is used in households and industries connected to the water supply network) from the ones that operate irrigation canals, or supply water for other purposes.
3700 Sewerage This activity includes the collection and treatment of wastewater.
The following table shows a breakdown of industrial activities or divisions of activities that are most relevant in terms of use of water:
Industry category according to ISIC
Description of activities related to water
Remarks
Section A (Divisions 01 to 03)
Agriculture, forestry and fishing
This is the activity that uses the largest proportion of inland water resources abstracted for off-stream uses in the world. The main use of water is irrigation of crops. The abstraction may be performed by this industrial activity or by ISIC 3600, which supplies the water to agriculture.
0161 Operation of agricultural irrigation equipment.
A support activity that includes the operation of agricultural irrigation equipment.
3510 Electric power generation It is important to separate the establishments that

D R A F T
39
Industry category according to ISIC
Description of activities related to water
Remarks
produce electricity in hydroelectric plants (instream use) from the establishments that produce it through other types of power stations, using water mainly for cooling (offstream use)..
5222 Operation of waterway locks The operation of locks requires large quantities of water. This use of water is considered an instream use.
Section B (Divisions 05 to 09)
Mining and quarrying Mining industries may be significant water users and may also be significant sources of water discharges and waterborne emissions (pollution). Water use by mining industries includes abstracting water as a part of mine dewatering operations (i.e., removing water from mines to make them passable by labour and equipment so that minerals can be recovered) (IRWS 3.50).
Section C (Divisions 10 to 33) and Section F (Divisions 41 to 43)
Manufacturing and construction
The following divisions are usually most relevant for water accounts: 10 – Manufacture of food. 11 – Manufacture of beverages. 17 – Manufacture of paper and paper products. 19 – Manufacture of coke and refined petroleum 20 – Manufacture of chemicals and chemical products
Divisions 38 to 99 A wide variety of service industries, including wholesalers, retailers, accommodation and food service activities.
Often, these industries are supplied by the water supply industry (activity 3600) through the drinking water supply network. The following divisions are usually most relevant for water accounts: 55 – Accommodation. 56 – Food and beverage service activities.
Also, for the functional accounts, the activity 3900, remediation activities and other waste management services is of special interest to water. It includes the decontamination of soils and groundwater at the place of pollution. It also includes the decontamination and cleaning up of surface water following accidental pollution.
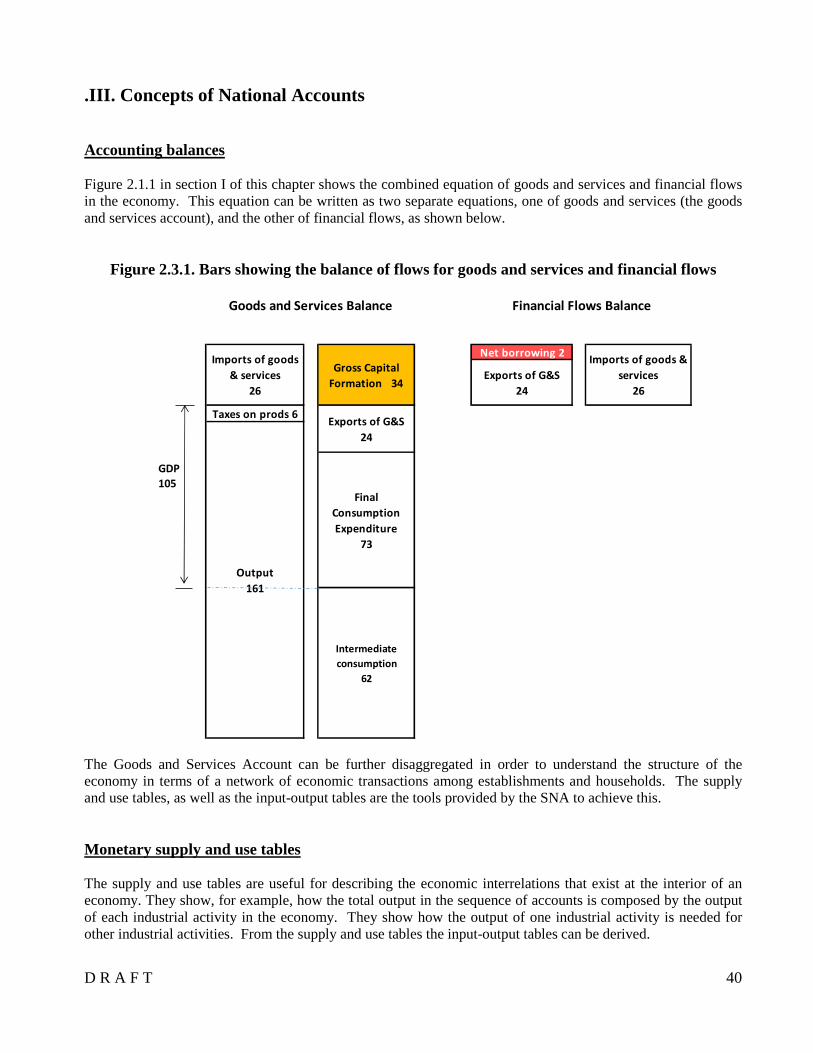
D R A F T
40
.III. Concepts of National Accounts Accounting balances Figure 2.1.1 in section I of this chapter shows the combined equation of goods and services and financial flows in the economy. This equation can be written as two separate equations, one of goods and services (the goods and services account), and the other of financial flows, as shown below.
Figure 2.3.1. Bars showing the balance of flows for goods and services and financial flows
The Goods and Services Account can be further disaggregated in order to understand the structure of the economy in terms of a network of economic transactions among establishments and households. The supply and use tables, as well as the input-output tables are the tools provided by the SNA to achieve this. Monetary supply and use tables The supply and use tables are useful for describing the economic interrelations that exist at the interior of an economy. They show, for example, how the total output in the sequence of accounts is composed by the output of each industrial activity in the economy. They show how the output of one industrial activity is needed for other industrial activities. From the supply and use tables the input-output tables can be derived.
Net borrowing 2
Taxes on prods 6Exports of G&S
24
Output
161
Final
Consumption
Expenditure
73
Intermediate
consumption
62
Gross Capital
Formation 34
Goods and Services Balance Financial Flows Balance
Imports of goods
& services
26
Imports of goods &
services
26
Exports of G&S
24
GDP
105

D R A F T
41
The supply table has industrial activities in the columns and products in the rows. Each column shows the output of the industrial activity in terms of the product indicated in the corresponding row. There is an additional column, which shows the value of the imports of the different products. The tables below show an example of monetary supply and use tables. They are part of the Unu-Water example provided as part of these Guidelines. For simplicity, the tables show all the quantities at basic prices, which means that taxes, trade margins, and transport margins are excluded. Subsidies on products are included. The tables show the economic activities grouped in five columns, and the products grouped in five rows.
Table 2.3.2. Example of monetary supply table (in monetary units per year)
The use table has a structure very similar to the supply table, but it shows uses instead of supply. The columns of industrial activities show the intermediate consumption of each product necessary to produce the products shown in the supply table.
Table 2.3.3. Example of monetary use table (in monetary units per year)
Agr
icul
ture
Indu
stry
and
ser
vice
s
Ele
ctric
ity
Wat
er S
uppl
y (d
rinki
ng
wat
er)
Sew
erag
e
Tot
al p
rodu
ctio
n (b
asic
pric
es)
Impo
rts
Tot
al s
uppl
y (b
asic
pr
ices
)
Agricultural products 25 25 5 30Industrial and service products 99 99 21 120Electricity 4 2 18 24 0 24Water ("drinking") 7 7 0 7Sewerage 6 6 0 6
29 101 18 7 6 161 26 187
OutputA
gric
ultu
re
Indu
stry
and
se
rvic
es
Ele
ctric
ity
Wat
er S
uppl
y (d
rinki
ng w
ater
)
Sew
erag
e
Inte
rmed
iate
co
nsum
ptio
n (p
urch
aser
s'
Fin
al c
onsu
mpt
ion
Gro
ss C
apita
l F
orm
atio
n
Exp
orts
Tot
al u
se (
basi
c pr
ices
)
Agricultural products 3 6 9 14 1 6 30Industrial and service products 6 22 7 1 1 37 37 32 14 120Electricity 2 12 2 1 17 7 24Water ("drinking") 2 2 5 7Sewerage 3 3 3 6
11 45 7 3 2 68 66 33 20 187
Intermediate Consumption Final Use
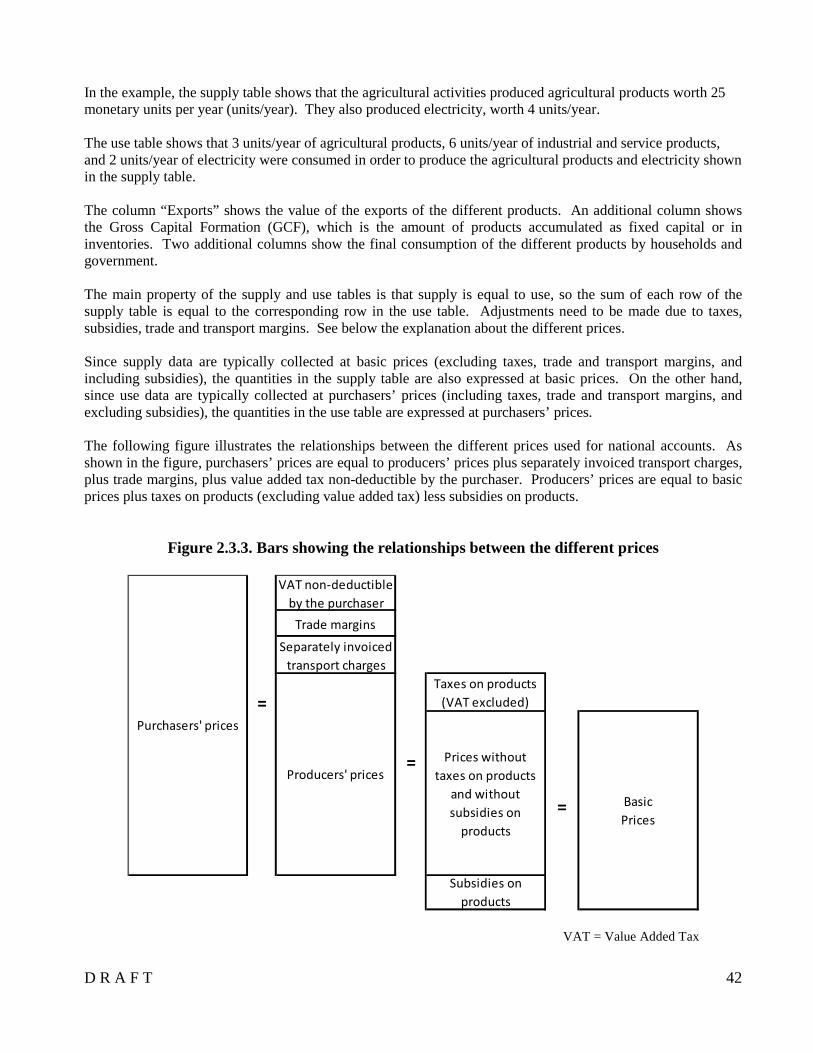
D R A F T
42
In the example, the supply table shows that the agricultural activities produced agricultural products worth 25 monetary units per year (units/year). They also produced electricity, worth 4 units/year. The use table shows that 3 units/year of agricultural products, 6 units/year of industrial and service products, and 2 units/year of electricity were consumed in order to produce the agricultural products and electricity shown in the supply table. The column “Exports” shows the value of the exports of the different products. An additional column shows the Gross Capital Formation (GCF), which is the amount of products accumulated as fixed capital or in inventories. Two additional columns show the final consumption of the different products by households and government. The main property of the supply and use tables is that supply is equal to use, so the sum of each row of the supply table is equal to the corresponding row in the use table. Adjustments need to be made due to taxes, subsidies, trade and transport margins. See below the explanation about the different prices. Since supply data are typically collected at basic prices (excluding taxes, trade and transport margins, and including subsidies), the quantities in the supply table are also expressed at basic prices. On the other hand, since use data are typically collected at purchasers’ prices (including taxes, trade and transport margins, and excluding subsidies), the quantities in the use table are expressed at purchasers’ prices. The following figure illustrates the relationships between the different prices used for national accounts. As shown in the figure, purchasers’ prices are equal to producers’ prices plus separately invoiced transport charges, plus trade margins, plus value added tax non-deductible by the purchaser. Producers’ prices are equal to basic prices plus taxes on products (excluding value added tax) less subsidies on products.
Figure 2.3.3. Bars showing the relationships between the different prices
VAT = Value Added Tax
VAT non-deductible
by the purchaser
Trade margins
Separately invoiced
transport charges
=
=
=
Purchasers' prices
Taxes on products
(VAT excluded)
Prices without
taxes on products
and without
subsidies on
products
Subsidies on
products
Basic
Prices
Producers' prices

D R A F T
43
The following table shows the use table at purchasers’ prices, which is the usual way of recording the tables.
Table 2.3.4. Use table at purchasers’ prices (in monetary units per year)
From the supply and use tables Gross Value Added (GVA) can be calculated as the difference between output at basic prices and intermediate consumption at purchasers’ prices of each column, as shown below.
Table 2.3.5. Balance of supply and use (in monetary units per year)
The sum of GVA of all the industries at basic prices plus all taxes on products less all subsidies on products is the Gross Domestic Product (GDP). In the example we know that all taxes on products less all subsidies on products is equal to the difference of total use at purchasers’ prices and total use at basic prices = 193 – 187 = 6. GDP is the therefore equal to 18 + 62 + 11 + 4 + 4 + 6 = 105 units/year. In the example, the gross value added of the water and sewerage industrial activities combined represent 7.6% [ (4+4)/105*100% ] of the GDP of the country or territory.
Agr
icul
ture
Indu
stry
and
se
rvic
es
Ele
ctric
ity
Wat
er S
uppl
y (d
rinki
ng w
ater
)
Sew
erag
e
Inte
rmed
iate
co
nsum
ptio
n (p
urch
aser
s'
Fin
al c
onsu
mpt
ion
Gro
ss C
apita
l F
orm
atio
n
Exp
orts
Tot
al u
se
(pur
chas
ers'
Agricultural products 3 6 9 17 1 6 33Industrial and service products 6 16 7 1 1 31 42 33 18 124Electricity 2 12 2 1 17 7 24Water ("drinking") 2 2 4 6Sewerage 3 3 3 6
11 39 7 3 2 62 73 34 24 193
Intermediate Consumption Final Use
Agr
icul
ture
Indu
stry
and
ser
vice
s
Ele
ctric
ity
Wat
er S
uppl
y (d
rinki
ng
wat
er)
Sew
erag
e
All
indu
strie
s
Total output at basic prices 29 101 18 7 6 161Intermediate consumption at purchasers' prices 11 39 7 3 2 62Gross Value Added (GVA) at basic prices 18 62 11 4 4 99

D R A F T
44
.IV. Concepts of the Water Accounts Asset accounts The figure below illustrates the main components of the water cycle. It shows two main subsystems, the economy, and Inland Water Resources, which are interconnected by the water flowing between each other. Water also flows to and from the atmosphere, and to and from other countries or territories.
Figure 2.4.1. Diagram showing the complete water cycle
The figure above can be redrawn in order to show in more detail how the different flows are interconnected, as well as showing the names and codes, based on the IRWS, of each of the different flows. This is similar to figure 2.3.1 showing all the economic flows. The diagram also shows numerical values of the flows, based on the Unu-Water exercise being used throughout the Guidelines. All the flows have to be in equilibrium. This means that the sum of the quantities of flows entering the diagram has to be the same as that of the sum of the quantities flowing out of the diagram. The clouds shown in the diagram indicate the boundaries of the area of analysis.

D R A F T
45
Figure 2.4.2. Diagram showing the complete water cycle with data from the example
(million cubic meters per year)
The equilibrium of the flows entering or leaving the subsystem of Inland Water Resources can be written as follows:
B.1 + B.2 + H.1 = C.1 + C.2.1 + C.2.2 + E.1 + changes in the stocks of IWR

D R A F T
46
This equation is the basis for the asset accounts. The quantities of the example are shown in the table below.
Table 2.4.1. Asset account for the example (million cubic meters)
The equation can also be balanced step by step using a sequence similar to the sequence of economic accounts The following tables show this sequence for the numerical example, expressed in millions of cubic meters per year.
Table 2.4.2. Example of sequence of physical water accounts (million cubic meters)
TOTAL
Opening stock of water
Additions to stock 38 604
B.1 Precipitation 12 800B.2 Inflows from other countries 1 000H.1 Returns from the economy 21 604
Reductions in stock 38 604
C.1 Evaporation and/or transpiration
(evapotranspiration)
9 600
C.2.1 Outflows to other countries 700C.2.2 Outflows to the sea 2 225E.1 Abstractions 22 879
Closing stock of water
1 Renewable water Resources Uses Balance
B.1 Precipitation 12 800
B.2 Inflows from other countries or territories (OECD-Eurostat q. 4) 1 000
C.1 Evapotranspiration 9 600
Bal01 Total Renewable Water Resources (TRWR) 4 200
2 Ouflowing TRWR & returns Resources Uses Balance
Total Renewable Water Resources (TRWR) 4 200
H.1 Returns of water to inland water resources 21 605
E.1 (offstream) Abstractions from inland water resources (offstream) 3 279
E.1 (instream) Abstractions from inland water resources (instream) 19 600
Bal02 Outflowing TRWR & returns 2 926

D R A F T
47
Like in the case of the sequence of economic accounts, the information in the sequence of water accounts can also be illustrated using bars in cascade as shown in the figure below.
3 Water supplied and received Resources Uses Balance
E.1 (offstream) Abstractions from inland water resources (offstream) 3 279
E.1 (instream) Abstractions from inland water resources (instream) 19 600
E.2 & E.3 Abstractions from other sources (sea & precipitation) 39
G.2 Imported water 0
F.3.2/G.3.2 Reused water 40
I.1 Losses in transportation and distribution 556
F.2 Exported water 0
Bal 03 Water supplied or self supplied to resident u sers 22 402
4 Wastewater generated Resources Uses Balance
Bal 03 Water supplied/received by resident users 22 402
"Water consumption" 1 123
Bal04 Wastewater (as defined in SEEA, regardles of q uality) 21 279
5 Final balance of wastewater Resources Uses Balance
Bal04 Wastewater (as defined in SEEA, regardless of quality) 21 279
I.1 Losses in transportation and distribution 556
H.2 Returns to the sea 190
F.3.2/G.3.2 Water for reuse 40
H.1 Returns of water to inland water resources 21 605
6 Final balance of discharges Resources Uses Balance
Bal02 Outflowing TRWR & returns 2 926
C.2.1 Outflows to neighboring countries or territories 700
C.2.2 Outflows to the sea 2 226
Bal05 Net changes in Inland Water Resources 0
7 Balance Sheet Opening Changes Balance
A. Inland water resources 3 000 0 3 000

D R A F T
48
Figure 2.4.4. Water cycle expressed as a sequence of physical water accounts, not to scale (million cubic meters per year)
As seen in the figure, precipitation (B.1) and inflows (B.2) provide, together with the returns to inland water resources, the amount of water that is evapotranspired (E.1), that is abstracted (E.1), or that flows to neighboring countries (C.2.1) or outflows to the sea (C.2.2). The abstractions of water from inland water resources (E.1) plus the abstractions of water from the sea (E.3) plus for reuse (F.3.2), less losses (I.1) and less “water consumption” is “wastewater” which may return to inland water resources (H.1) and may be abstracted again, returns to the sea (H.2) or is again supplied to the economy for reuse (F.3.2).
B.2. Inflows 1 000
C.2.1 Neighb 700
I.1 Losses 556
E.3 From sea 39 H.2 To Sea 190
F.3.2 Reuse 40 F.3.2 Reuse 40
B.1 Precipitation
12 800
Bal01 TRWR
4 200
Bal02 Outflows
2 926
No changes in IWR
stocksC.2.2 Outflows to
sea "Water cons"
1 123
H.1 Returns
to IWR
21 605Bal04 "Wastewater"
21 279
E.1 Abstractions
22 879
C.1 Evapo-
transpiration
9 600
H.1 Returns
to IWR
21 605

D R A F T
49
In the example, a considerable amount of the abstractions is water turbinated in hydroelectric plants. After water is turbinated it is returned to the rivers and streams where it is abstracted again. Physical supply and use tables The figure below reveals the structure of the Inland Water Resources subsystem and the Economy subsystem. It shows the interrelationships of the different elements that make up both subsystems. Understanding the structure is useful for predicting the behavior of the whole system.
Figure 2.4.5. Diagram showing the components and interrelationships of the subsystems of the water cycle
The figure below shows in more detail the example (based on the Unu-Water exercise) of the components and interrelationships in the Economy subsystem. The economy is made of industries, households, and government, and the interrelationships between them are the amounts of water flowing between. The water flows between industries, households, and government can be recorded in supply and use tables as shown below.

D R A F T
50
Figure 2.4.6. Example of water flows in the economy (million cubic meters)
The information in the figure above can be recorded in the form of supply and use tables. The simplified supply and use tables below show the flows within the economy (products with CPC codes); the flows from the environment to the economy, natural inputs (e.g. surface water and groundwater abstractions); and the flows of water from the economy to the environment, which are recorded as residuals. As in the case of monetary supply and use tables, the sum of each row in the supply table is equivalent to the sum of the corresponding row in the use table. In the example, the 469 million cubic meters of drinking water supplied by the water supply activity (ISIC 36-A), as shown in the supply table, is used by industries and households. Industries use 119 million and households use 350 million, as shown in the use table.

D R A F T
51
Table 2.4.3. Example of physical water supply table (in million cubic meters per year)
Table 2.4.4. Example of physical water use table (in million cubic meters per year)
Adding detail to the asset account As in the case of water flows in the economy, more details can be added to the asset table shown in table 2.4.1, which only has one column with totals. In order to add more details to the table, it is necessary to make some
Agr
icul
ture
, IS
IC 0
1-03
Indu
stry
and
ser
vice
s IS
IC 0
5-99
, ex
cept
351
0, 3
6, a
nd 3
7
Hyd
roel
ectr
icity
, IS
IC 3
510
The
rmoe
lect
ricity
, IS
IC 3
510
Wat
er S
uppl
y (d
rinki
ng w
ater
),
ISIC
36-
A
Wat
er S
uppl
y (ir
rigat
ion
wat
er),
IS
IC 3
6-B
Sew
erag
e, I
SIC
37
Hou
seho
lds
Env
ironm
ent
Tot
al
Water ("drinking"), CPC 18-A 469 469Water ("irrigation"), CPC 18-B 1 120 1 120Reuse water 40 40Surface water 22 441 22 441Groundwater 438 438Seawater 39 39Losses 50 190 316 556Wastewater 640 141 19 600 618 286 280 21 565Evaporation, transpiration, inclusion in products
960 61 0 32 70 1 123
1 650 202 19 600 650 659 1 436 326 350 22 918 47 791
Agr
icul
ture
, IS
IC 0
1-03
Indu
stry
and
ser
vice
s IS
IC 0
5-99
, ex
cept
351
0, 3
6, a
nd 3
7
Hyd
roel
ectr
icity
, IS
IC 3
510
The
rmoe
lect
ricity
, IS
IC 3
510
Wat
er S
uppl
y (d
rinki
ng
wat
er),
IS
IC 3
6-A
Wat
er S
uppl
y (ir
rigat
ion
wat
er),
IS
IC 3
6-B
Sew
erag
e, I
SIC
37
Hou
seho
lds
Env
ironm
ent
Tot
al
Water ("drinking"), CPC 18-A 119 350 469Water ("irrigation"), CPC 18-B 1 120 1 120Reuse water 40 40Surface water 335 19 600 650 420 1 436 22 441Groundwater 155 83 200 438Seawater 39 39Losses 556 556Wastewater 326 21 238 21 564Evaporation, transpiration, inclusion in products 1 124 1 124
1 650 202 19 600 650 659 1 436 326 350 22 918 47 791

D R A F T
52
assumptions regarding the flows of inland water resources. The figure below shows a simplified diagram of the flows. According to this diagram, the asset account can be constructed to reflect these details.
Figure 2.4.7. Water flows within the Inland Water Resources Subsystem (million cubic meters per year)
The diagram shows that all the precipitation falls on land and then runs off through surface water bodies, or infiltrates (momentarily forming part of “soil water”) to the aquifers. The rest of the precipitation evaporates or is transpired back to the atmosphere. Surface water bodies receive returns from the economy as well as inflows from other countries or territories. They are reduced by abstractions of the economy from surface water bodies. If no additional information is available, it can be assumed that there are no changes in the stocks of inland water resources and that all the water left outflows to downstream territories or outflows to the sea. The case of aquifers is similar. The stocks of groundwater are reduced by abstractions and increased by infiltration and returns from the economy. The water left is assumed to outflow to the sea. It is important to note that there are also flows between the aquifers and surface water bodies, which for simplicity are not shown in the figure. They can be excluded in a first approximation, but may need to be considered when the calculations are further refined, as shown in figure 2.4.8. The asset account corresponding to the diagram above is shown below. The opening and closing stocks of water are unknown, but they remain constant, since additions and reductions are equivalent.

D R A F T
53
Table 2.4.5. Asset table corresponding to the flows in figure 2.4.7 (in million cubic meters per year)
The diagram above can be further detailed in order to show that evapotranspiration includes evaporation in lakes and artificial reservoirs and to show all the flows among the different water bodies, as shown in the figure below.
Artificial
reservoirsLakes
Rivers and
streamsAquifers
Land or
"Soil
water"
TOTAL
Opening stock of waterOpening
A.1.1
Opening
A.1.2
Opening
A.2
Opening A.1 +
Opening A.2
Additions to stock 1 708 12 800 38 604
B.1 Precipitation 12 800 12 800B.2 Inflows from other countries 1 000D Inflows from other inland water
resources
640 3 200
H.1 Returns from the economy 1 068 21 604
Reductions in stock 1 708 12 800 38 604
C.1 Evaporation and/or transpiration
(evapotranspiration)
9 600 9 600
C.2.1 Outflows to other countries 700D Outflows to other inland water
resources
3 200 3 200
C.2.2 Outflows to the sea 1 270 2 225E.1 Abstractions 438 22 879
Closing stock of waterClosing
A.1.1
Closing
A.1.2
Closing
A.2
Closing A.1 +
Closing A.2
0
700
955
22 441
24 096
24 096
1 000
2 560
20 536

D R A F T
54
Figure 2.4.8. Water flows within the Inland Water Resources Subsystem (million cubic meters per year)
With this additional information the asset account can now have more details as shown below. Now the opening and closing stocks of water in artificial reservoirs, lakes, and aquifers (the latter very difficult to measure or estimate) are shown in the asset table.

D R A F T
55
Table 2.4.6. Asset table corresponding to the flows in figure 2.4.8 (in million cubic meters per year)
The accounts can be simplified or detailed according to the data available, and the demands of information. Waterborne pollution The diagram below is similar to those in figures 2.3.1 and 2.4.1. It shows the flows of waterborne pollution, from the moment they are released by economic activities and households to the moment they reach the environment. The quantities shown correspond to the Unu-Water exercise. In the example, organic pollution is measured in terms of metric tons of biochemical oxygen demand for five days (BOD5). For simplicity of the example, only organic pollution from point sources is considered, but other types of pollution may be included. The diagram shows that 106 units of pollution (measured in thousands of metric tons of BOD5 per year) were released by economic activities and households. Wastewater Treatment Plants (WWTPs) removed 68 units, and 4 units were included in wastewater that was supplied for further use in the economy. Only 34 units of pollution were part of the emissions (emissions are releases to the environment).
Artificial
reservoirsLakes
Rivers and
streamsAquifers
Land or
"Soil
water"
TOTAL
Opening stock of water 800 1 100 4 000 Opening A.1 +
Opening A.2
Additions to stock 2 240 1 810 25 586 1 392 12 610 43 638
B.1 Precipitation 80 110 12 610 12 800B.2 Inflows from other countries 1 000 1 000D Inflows from other inland water
resources
2 160 1 700 3 734 640 8 234
H.1 Returns from the economy 20 852 752 21 604
Reductions in stock 2 281 1 770 25 586 1 392 12 610 43 639
C.1 Evaporation and/or transpiration
(evapotranspiration)
40 70 9 490 9 600
C.2.1 Outflows to other countries 700 700D Outflows to other inland water
resources
100 1 000 3 860 154 3 120 8 234
C.2.2 Outflows to the sea 1 426 800 2 226E.1 Abstractions 2 141 700 19 600 438 22 879
Closing stock of water 759 1 140 4 000 Closing A.1 +
Closing A.2

D R A F T
56
Figure 2.4.9. Example of pollution flows in the economy (pollution expressed in thousands of metric tons of BOD5 per year)
Further disaggregation of the data is possible, as shown in the figure below. The figure shows the amount of pollution released by households and the amount of pollution released by industries. It also shows the collection of releases by sewerage and the emissions to the environment, as well as the releases that are incorporated in water for reuse.
Figure 2.4.10. Example of pollution flows in the economy (pollution expressed in thousands of metric tons of BOD5 per year)
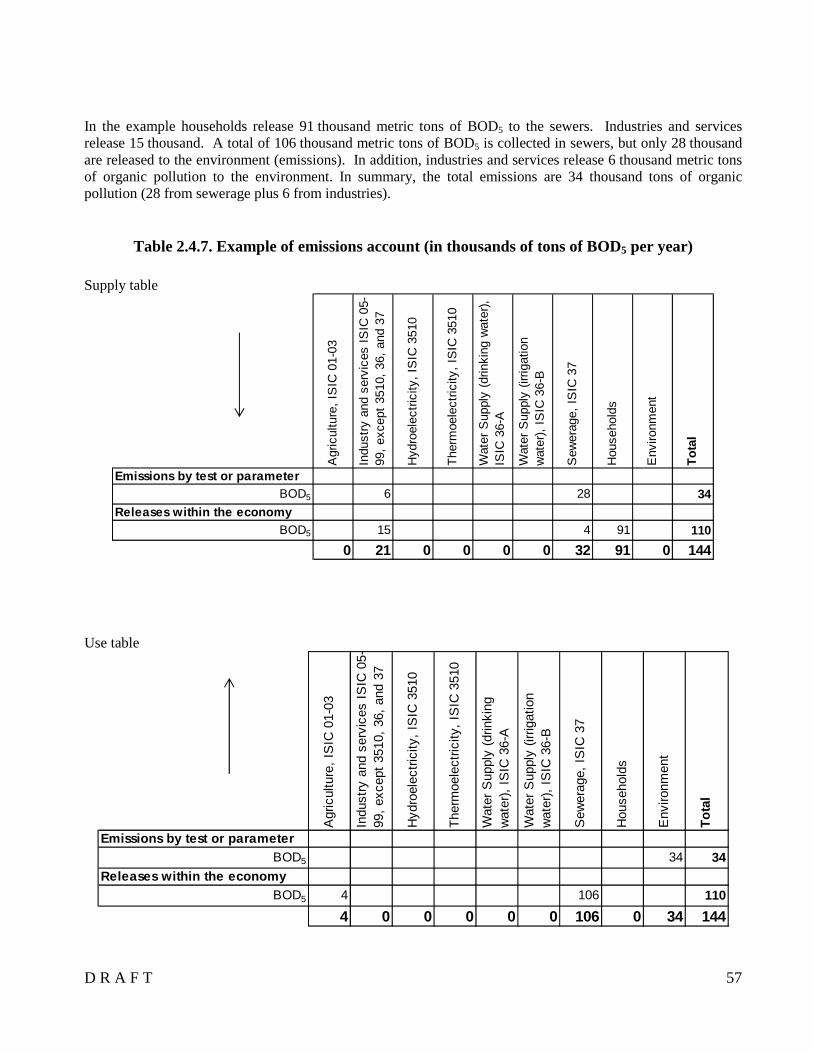
D R A F T
57
In the example households release 91 thousand metric tons of BOD5 to the sewers. Industries and services release 15 thousand. A total of 106 thousand metric tons of BOD5 is collected in sewers, but only 28 thousand are released to the environment (emissions). In addition, industries and services release 6 thousand metric tons of organic pollution to the environment. In summary, the total emissions are 34 thousand tons of organic pollution (28 from sewerage plus 6 from industries).
Table 2.4.7. Example of emissions account (in thousands of tons of BOD5 per year)
Supply table
Use table
Agr
icul
ture
, IS
IC 0
1-03
Indu
stry
and
ser
vice
s IS
IC 0
5-99
, ex
cept
351
0, 3
6, a
nd 3
7
Hyd
roel
ectr
icity
, IS
IC 3
510
The
rmoe
lect
ricity
, IS
IC 3
510
Wat
er S
uppl
y (d
rinki
ng w
ater
),
ISIC
36-
A
Wat
er S
uppl
y (ir
rigat
ion
wat
er),
IS
IC 3
6-B
Sew
erag
e, I
SIC
37
Hou
seho
lds
Env
ironm
ent
Tot
al
Emissions by test or parameterBOD5 6 28 34
Releases within the economy BOD5 15 4 91 110
0 21 0 0 0 0 32 91 0 144
Agr
icul
ture
, IS
IC 0
1-03
Indu
stry
and
ser
vice
s IS
IC 0
5-99
, ex
cept
351
0, 3
6, a
nd 3
7
Hyd
roel
ectr
icity
, IS
IC 3
510
The
rmoe
lect
ricity
, IS
IC 3
510
Wat
er S
uppl
y (d
rinki
ng
wat
er),
IS
IC 3
6-A
Wat
er S
uppl
y (ir
rigat
ion
wat
er),
IS
IC 3
6-B
Sew
erag
e, I
SIC
37
Hou
seho
lds
Env
ironm
ent
Tot
al
Emissions by test or parameterBOD5 34 34
Releases within the economy BOD5 4 106 110
4 0 0 0 0 0 106 0 34 144

D R A F T
58
The tables above only show quantities of organic pollution measured with the BOD test. However, other parameters may be added, such as, Chemical Oxygen Demand (COD), Total Suspended Solids (TSS), heavy metals, etc. The structure of the tables is the same, but more rows are added to indicate the amounts of pollution in terms of the different parameters or tests performed to water. The supply table shows the amounts of pollution “flowing out” of the different economic activities and households. The use table shows the amounts of pollution “flowing into” the different economic activities, and to the environment (i.e. emissions). The quantities of pollution cannot be added, since they are different (e.g. the BOD5 measurement cannot be added to the amount of heavy metals). Sequence of economic accounts for the water supply and sewerage industries The activities of water supply (drinking water supply) and sewerage, which are usually known together as the sector of “water and sanitation” is of especial interest for water policy. The same concepts that are used for national accounts can be used to describe the monetary flows of “water and sanitation.” The following diagram shows the monetary flows related to the water supply and sewerage industries. The diagram is in fact a component of the diagram of the whole economy shown in figure 2.1.1.

D R A F T
59
Figure 2.4.10. Diagram showing the monetary flows affecting the water supply and sewerage industries
The diagram can be illustrated with a numerical example (refer to the Unu-Water exercise of this Guidelines). The following numerical information will be used to prepare the accounts for the water supply industry. The quantities are expressed in monetary units per year:
• the output of the water supply industry is 7 units/year (at basic prices). This is the total amount billed as concept of water supply, including taxes and excluding subsidies on products.
• 3 units/year are spent on the different goods and services consumed as inputs in the processes of providing the services (intermediate consumption).
• 2 units/year are spent in compensation of employees, which includes wages, salaries and employee’s social contributions.
• 0.9 units/year are received from the government as concept of subsidy on production. • 0.4 units/year are paid for the concept of property income. This includes interest on loans payable and
also the amounts payable for the concept of royalties or water rights to the government for the abstraction of water.

D R A F T
60
• 2.1 units/year were spent on gross fixed capital formation. These are the investments made in infrastructure and equipment for water supply.
The table shows all the information as a sequence of economic accounts. On the left side of the tables the SNA codes are shown (See Annex 1 of SNA 2008).
Table 2.4.8. Simplified sequence of accounts for the water supply industries (monetary units per year)
The sequence considers that, with time, the infrastructure will have to be replaced due to its normal wear and tear. This is accounted for as consumption of fixed capital. Still gross saving is larger than the consumption of fixed capital, therefore, the infrastructure can be replaced when needed by using gross saving, which every year may be transformed to financial assets for later application to fixed capital formation. In order to consider the fact that in many countries, especially developing countries, water and sewerage bills are not paid in full, it is important to make adjustments in the financial assets. The accounts are recorded in accrual terms. This means that output is measured as the amount billed, not necessarily paid. Net lending is transformed into financial assets, and financial assets include accounts receivable, which are the amounts billed, but not yet paid. If the accounts receivable accumulate and become difficult to recover, they may be written off after some time. Accumulation accounts include an account called “Other changes in the volume of assets.” In this account the writing off of accounts receivable can be recorded as changes in volume of assets.
Receivable Payable Balance Description
P1 Output (at basic prices) 7.0 Sales of water (amounts billed). Includes
subsidies on products, excludes taxes on
products.
P2 Intermediate consumption (at
purchasers' prices)
3.0 Payable for electricity, chemical products, water,
etc.
B1g Gross value added (basic prices) 4.0
D1 Compensation of employees 2.0 Wages, salaries, employers' social contributions
D29 Taxes on production
D39 Subsidies on production 0.9
B2g Gross operating surplus 2.9
D4 Property income 0.4 Includes payment of interest. Also royalties for
the abstraction of water, for example.
D5 to D7 Current transfers Includes government transfers (subsidies) and
also income taxes.
B8g Gross saving 2.5
D9 Capital transfers Includes investment grants.
P51c Consumption of fixed capital 2.2 Replacement of infrastructure or construction of
new infrastructure.
B101 Changes in net worth due to saving
and capital transfers
0.3
K Other flows 1.4 Accounts receivable not recovered.
K Other flows
B10 Changes in net worth -1.1

D R A F T
61
For the example, it is considered that the accounts receivable that will be written off represent 20% of total sales = 0.2 * 7.0 = 1.4 monetary unit. The following table shows the recording of the changes in volume of the financial assets (writing off of accounts receivable) for the water supply industry. Therefore, since in the previous table we had that the changes in net worth (balance B101) was 0.4, less 1.4 due to the write off of the accounts receivable, the total changes in net worth are -1.0. This means that every year the net worth of the assets of the water supply industry are reduced in 1.1 monetary units. Therefore the industry is not sustainable from the economic point of view. The water “tariffs” or rates need to be raised, subsidies need to be increased, or the efficiency in the collection of bills has to be increased.
Table 2.4.9. Summary of changes in net worth (monetary units per year)
B101 Changes in net worth due to saving and
capital transfers
0.3
B102 Changes in net worth due to other
changes in volume of assets
-1.4
B103 Changes in net worth due to nominal
holding gains/losses
0.0
B10 Changes in net worth -1.1

D R A F T
62
Figure 2.4.11. Graphical example of sequence of economic accounts for the water supply industry
(monetary units per year) The bars show how the output, or “revenues” of the water supply industry are affected by the different expenses, as well as the different transfers or subsidies, leaving a final balance at the end, which is carried over to the next year. The change in net worth is negative, which means that the stock of economic assets of the water supply industry is decreasing. This may mean that the infrastructure to provide the service (e.g. pipes, pumps, electric equipment) is getting older and is not being replaced at the rate necessary to keep it working as it currently is.
B9 Net lending 0.4 B101 Ch nw 0.3
D4 Prop. Inc. 0.4
Output excluding
taxes and
subsidies on
products
6.0
D31 Subsidies on
products 1.0
P1 Output of
water supply
industry at
basic prices
7.0
B8g Gross
Saving
2.5
D39 Subsidies on
production 0.9
B102 Other
changes 1.4
B10 ch. net
worth -1.1
P2 Intermediate
consumption at
purchasers' price
3.0
B1g Gross Value
Added at basic
prices
4.0D1
Compensation
employees 2.0
B29 Gross
Operating
Surplus
2.9
P5g Gross Capital
Formation 2.1
P51c Consumption of
Fixed Capital
2.2

D R A F T
63
The case of the sewerage industry is very similar to the case of the water supply industry. The calculations are summarized in the table below. One difference is that the property income includes the payment of “royalties” for the use of the water bodies to discharge wastewater, 0.2 monetary units, and also the payment of interest on a loan, 0.1 units, total = 0.2+0.1 = 0.3 units.
Table 2.4.10. Simplified sequence of accounts for the sewerage industries (monetary units per year)
As in the case of water supply, it can be said that the expenses can be covered with the “tariffs” or rates paid by the users complemented with subsidies (subsidies on products, and subsidies on production). As in the case of water supply, it is important to consider that, with time, the infrastructure will have to be replaced due to its normal wear and tear. This is accounted for as consumption of fixed capital. Still gross saving is larger than the consumption of fixed capital, as shown in the table below, therefore, the infrastructure can be replaced when needed by using the gross saving, which every year may be transformed to financial assets for later application to fixed capital formation. The case of the sewerage industry is similar to water supply. Not all the amounts billed to the users are paid. In this case accounts receivable are 20% of the sales = 0.2*6.0 = 1.2 monetary units. The table below shows the summary. As in the case of the water supply industry, in the case of the sewerage industry the net worth of the assets of the sewerage industry is reduced by 0.3 monetary units every year.
Receivable Payable Balance Description
P1 Output (at basic prices) 6.0 Sales of sewerage services (amounts billed).
Includes subsidies on products, excludes
taxes on products.
P2 Intermediate consumption (at
purchasers' prices)
2.0 Payable for electricity, chemical products,
water, etc.
B1g Gross value added (basic prices) 4.0
D1 Compensation of employees 1.5
Wages, salaries, employers' social
contributions
D29 Taxes on production 0.0
D39 Subsidies on production
B2g Gross operating surplus 2.5
D4 Property income 0.3 Includes payment of interest. Also royalties
for the abstraction of water, for example.
D5 to D7 Current transfers Includes government transfers (subsidies)
and also income taxes.
B8g Gross saving 2.2
D9 Capital transfers Includes investment grants.
P51c Consumption of fixed capital 1.3 Replacement of infrastructure or construction
of new infrastructure.
B101 Changes in net worth due to saving
and capital transfers
0.9
K Other flows 1.2 Accounts receivable not recovered.
K Other flows
B10 Changes in net worth -0.3

D R A F T
64
Table 2.4.11. Summary of changes in net worth (monetary units per year)
B101 Changes in net worth due to saving
and capital transfers
0.9
B102 Changes in net worth due to other
changes in volume of assets
-1.2
B103 Changes in net worth due to nominal
holding gains/losses
0.0
B10 Changes in net worth -0.3

D R A F T
65
Figure 2.4.12. Graphical example of sequence of economic accounts for the sewerage industry (monetary units per year)
As in the case of water supply, the bars show how the output, or “revenues” of the sewerage industry are affected by the different expenses, as well as the different transfers or subsidies, leaving a final balance at the end, which is carried over to the next year. The change in net worth is negative, which means that the stock of economic assets of the sewerage industry is decreasing. This may mean that the infrastructure to provide the service (e.g. pipes, pumps, electric equipment) is getting older and is not being replaced at the rate necessary to keep it working as it currently is.
B10 Ch net worth -0.3
D4 Prop. Inc. 0.3
P51c CFC
1.3
D1
Compensation
employees 1.5
P2 Intermediate
consumption at
purchasers' price
2.0
B102 Other
changes 1.4
Output excluding
taxes and
subsidies on
products
6.0
P1 Output of
sewerage
industry at
basic prices
6.0
B1g Gross Value
Added at basic
prices
4.0
B29 Gross
Operating
Surplus
2.5
B8g Gross
Saving
2.2
B9 Net lending
1.2B101 Ch nw 0.9
P5g Gross Capital
Formation 1.0

66
REFERENCES: United Nations Statistics Division.- International Standard Industrial Classification of All Economic Activities, Revision 4 (ISIC).- New York 2008. United Nations Statistics Division.- Central Product Classification, Revision 1.1 (CPC).- New York 2002. (Publication Series M, No. 77/Ver.1.1) United Nations Statistics Division.- International Recommendations for Water Statistics.- 2012. United Nations Statistics Division.- System of Environmental-Economic Accounting for Water (SEEA-Water).- 2012. United Nations Statistics Division – System of Environmental-Economic Accounting Central Framework (SEEA-CF). White cover publication. 2012 United Nations Statistics Division.- System of National Accounts (SNA) 2008

67
25 June 2014
Rev 34
Chapter 3 THE DATA COLLECTION AND COMPILATION PROC ESSES This chapter is based on the list of data items of the IRWS. The different sources of data are discussed as well as the particularities of the data corresponding to different aspects of the natural and economic water cycles. The importance of prioritizing the data items according to each country’s water policies are highlighted. The methodologies to collect data are discussed, including the use of water monitoring networks, satellite information, surveys, censuses and administrative records. How and when estimates should be used is another topic of this chapter. The chapter also addresses the issues of data editing, imputation and validation. The explanations are illustrated with several examples and exercises.
VII. Setting priorities for data collection • The Physical Water Cycle • Waterborne Pollution Accounts • The Sequence of Economic Accounts for Drinking Water Supply and Sewerage • Water-Related Social-demographic Data Items • Project “Cards” for Waterborne Pollution VIII. Physical data items of stocks and flows within the environment • Precipitation and Evapotranspiration • Inflows and outflows to/from other territories and the sea • Other flows within the environment • Surface water stocks • Groundwater stocks IX. Physical data items of flows to/from and within the economy • Abstractions of water • Water supplied and received by economic units • Returns of water • Losses X. Physical data items related with polluting releases and emissions • Wastewater supplied and received • Wastewater returns • Waterborne releases and emissions XI. Monetary data items • Value and costs of water and sewerage services • Taxes, subsidies and investment grants • Assets, investments and depreciation • Tariffs and charges for water supply and sewerage services XII. Social demographic data items • Main source of drinking water used by populations • Main type of toilet and sewage disposal used by populations

68
.I. Setting priorities for data collection An action plan needs to be developed in order to collect all the necessary information to describe the water and monetary cycles described in Chapter 2. Typically, the action plan will include activities to be developed by different actors, including the National Statistics Office, the Ministry of Water Resources or agencies in charge of water resources management, the Ministry of Environment, the Meteorological Agency, and research centers. Therefore, the roles and responsibilities of each of the actors need to be clarified. This requires institutional arrangements to facilitate the sharing of responsibilities and data among the different actors. Section F of Chapter V of the IRWS has a detailed explanation of issues regarding roles and responsibilities of the different actors involved in the preparation of water accounts and statistics. The list of recommended data items presented in Annex I of the IRWS can be used as a checklist for developing an action plan for data collection. The complete list of data items in the IRWS has 400 elements, which includes information about water quantities in physical units, about the amount of waterborne pollutants, monetary information, and social demographic information related to water. However, with a minimum set of only 30 data items13 it is possible to assemble a comprehensive picture, and identify key areas for further work. Each data item can be assigned a priority, and responsibilities can be assigned to the different agencies to collect the data with quality specifications and within a time frame. The following tables provide general guidelines for the development of an action plan based on the minimum set of data items. Even though priorities may be different in each country, due to their characteristics and specific policy demands, most of the cases can be covered with the minimum set. Note that with the adoption of the SEEA-CF in 2012, some of the data items in the IRWS were modified. For example, in the IRWS emissions was used to call releases to the economy and releases to the environment, now emissions only refers to releases to the environment. See the updated list of data items in the annexes of these Guidelines. The Physical Water Cycle The sequence of physical water accounts, illustrated in figure 2.4.2 of Chapter 2, can be constructed with the following minimum set of data items. Num IRWS code Name of Flow Relevance Availability
of estimates
Availability of reliable statistics
1 B.1 Precipitation. High High High 2 B.2 Inflows from other countries Depends Depends Medium 3 C.1 Evapotranspiration High Medium Low 4 H.1 Returns to Inland Water
Resources Medium Low Low
5 E.1 Abstractions of Inland Water Resources
High High Medium
13 Three of the data items are not included in the list of 400 data items of the IRWS. “Water consumption” is defined in the IRWS, but it is not in the list of data items. Property Income and Current Transfers are data items of the SNA, but are not included in the IRWS.

69
6 E.2 Collection of precipitation Low Medium Low 7 E.3 Abstractions from the sea Depends Medium High 8 I.1 Losses High Medium Low 9 F.2 Exported water Depends High High 10 G.2 Imported water Depends High High 11 F.1/G.1 Water supplied/Water Received Medium High High 12 F.3.2/G.3.2 Reused water Depends Medium Low 13 Not in IRWS Final Water Use in SEEA-CF
or “water consumption” in the IRWS.
Medium Medium Low
14 H.2 Returns to the sea Depends Low Low 15 C.2.1 Outflows to neighboring
countries Depends Medium Medium
16 C.2.2 Outflows to the sea Depends Medium Low The 16 data items indicated above describe the complete water cycle. For most countries, less data items may be necessary. For example, in most cases there are no imports or exports of water; islands do not have inflows or outflows of water to other countries; and collection of precipitation represents a very small percentage of water abstractions in most countries. The complete water cycle may be detailed according to the needs of each country. In most cases it is important to divide the abstractions into surface water abstractions, and groundwater abstractions, as well as to identify the activities that abstract and use water. Waterborne Pollution Accounts A comprehensive description of how waterborne pollution flows from the economy to the environment in a country or territory may be constructed with the following minimum set of data items. Num IRWS code Name of Flow Relevance Availability
of estimates
Availability of reliable statistics
1 J Waterborne releases14 to other economic activities
High Medium Medium
2 K.1 Waterborne emissions to the environment from point sources
High Medium Medium
3 K.2 Waterborne emissions to the environment from non-point sources
Medium Medium Low
To complete the picture it is also necessary to know the amount of releases that are removed by wastewater treatment plants. 14 In the IRWS data item J is found as “waterborne emissions to other economic units; however, in the SEEA-CF emissions only refer to pollution flowing to the environment. For flows of pollution in the economy the term “releases” is used in the SEEA-CF.

70
The Sequence of Economic Accounts for Drinking Water Supply and Sewerage The sequence of economic accounts for drinking water supply and sewerage, illustrated in figure 2.4.8 of Chapter 2, can be constructed with the following nine data items. Num IRWS
code SNA code
Name of Flow15 Relevance Availability of
estimates
Availability of reliable statistics
1 L.1 P1 Output (at basic prices) of Drinking Water Supply and Sewerage Activities
High High High
2 L.3 P2 Intermediate Consumption High High High 3 L.2 D1 Compensation of Employees Medium Medium Medium 4 M.1.2 D29 Other Taxes on Production Medium Medium Low 5 N.1.2 D39 Other Subsidies on Production Medium Low Low 6 Not in
IRWS D4 Property Income Medium Low Low
7 Not in IRWS
D5 to D7 Current Transfers Medium Medium Low
8 N.2 D9 Capital Transfers Medium Medium Low 9 P.1 P51g Gross Fixed Capital Formation High Medium Low Some of the details that are important to know are the taxes on products (excluded from output, if it is recorded at basic prices) and subsidies on products (included in output, if it is recorded at basic prices). It is also important to know the Consumption of Fixed Capital, which is a measure of the depreciation of the infrastructure for delivering the services of drinking water and sewerage. Water-Related Social-demographic Data Items The data items for water-related social-demographic information are shown below. Num IRWS
code Name of Stock Relevance Availability
of estimates
Availability of sound statistics
1 S Population by main source of drinking water.
High High High
2 T Population by type of toilet and sewage disposal used.
High High Medium
It is useful to develop project “cards” for each of the data items that need to be collected and processed in order to compile the accounts. Each “card” should provide a summary of the work to be performed, so that tasks can be assigned to the different actors. The following are examples of “cards” to be developed for each data item.
15 The names of these flows are according to the SNA terminology.

71
Project “Cards” for the Physical Water Cycle The following examples of project “cards” correspond to the data items related with the physical water cycle. Precipitation (data item B.1) Sources of data: Data about precipitation is usually collected by meteorological agencies. The data is collected daily, or even more often, in several locations of a country or territory. Data processing required: Determination of volumes of precipitation by geographic areas (i.e. the point data collected in stations has to be interpolated to estimate volumes). This work is performed by meteorologists, who may use a geographical information system for the interpolation process (e.g. through isohyets or Thiesen polygons). Priorities: In a first stage it is important to calculate the normal or long term average precipitation in volume for the country and relevant subnational areas. It is also important to build long time series of annual precipitation, as well as to determine the monthly averages to identify intra-annual patterns. Relevant agencies:
• Meteorological organization. Statistical projects to be developed:
• Precipitation statistics for the whole country or territory, including annual average and monthly average to identify inter-annual and intra-annual patterns.
• Precipitation statistics for subnational areas (e.g. for each state or province, and for each watershed or hydrologic unit).
Inflows from other countries (data item B.2) Sources of data: Inflows from other countries or territories is typically monitored by agencies in charge of water management. In some transboundary watersheds there are international commissions that monitor the flows crossing the borders (e.g. International Boundary and Water Commission of the United States and Mexico). For transboundary watersheds the Ministry of Foreign Affairs may play an important role in data management of the flows between countries. Data processing required: Volumes of water flowing from other countries during the year, including surface and groundwater. Groundwater inflows may not be measured regularly, but it may be important to perform estimates. Priorities: In a first stage only surface water may be measured or estimated, based on data from stream gages. In a second stage groundwater should also be estimated. Relevant agencies:
• Water management agency or Water Resources Ministry. • Ministry of Foreign Affairs in case of transboundary watersheds.
Statistical projects to be developed: • Time series of surface water inflows from neighboring countries. • Estimates of groundwater inflows from neighboring countries.
Evapotranspiration (data item C.1) Sources of data: Evapotranspiration is not easy to measure directly. It is typically estimated as the difference between precipitation and runoff (surface and subsurface). Data processing required: Estimates of the volume of evapotranspiration, which may be calculated as a residual of total precipitation less surface and subsurface runoff. Measurements of pan evaporation (from meteorological or climatological stations) are useful for estimating evapotranspiration. If soil water

72
abstractions are considered for crops, then evapotranspiration from crops should be excluded from this data item. It should be included in final water use or “water consumption.” Priorities: In a first stage a rough estimate of the total evapotranspiration may be enough. In a second stage the evaporation from each surface water body may need to be reported separately from the evapotranspiration in the land areas. It is also important to separate crop evapotranspiration, which will be accounted as part of “water consumption” or Final Water Use, from total evapotranspiration. In countries with considerable amounts of snow and ice it may also be necessary to estimate the amount of sublimation (i.e. solid water, or ice, becoming vapour) occurring. Relevant agencies:
• Meteorological organization. • Water management agency or water resources ministry.
Statistical projects to be developed: • Estimates of evapotranspiration at national and subnational levels. • Evaporation in artificial reservoirs and lakes.
Returns to inland water resources (data item H.1)
Sources of data: Estimates from residual of water abstractions less “water consumption” or Final Water Use. Data processing required: The total amount of “wastewater” (see SEEA-CF definition) generated can be estimated as the difference between water abstracted and water consumed. A portion of the “wastewater” generated will become returns to the sea, another one will be reused, and the rest will become returns to inland water resources. A portion of the losses will also become returns to inland water resources. Priorities: In a first stage estimate the returns of water from agriculture, manufacturing and sewers, based on water abstractions and water consumption coefficients. It is necessary to identify the amount of water returned to the sea (returns may be identified by the authorities based on the location of discharges to the sea), and possibly to land. Relevant agencies:
• Ministry of Environment • Water management agency or Water Resources Ministry. • Wastewater utilities.
Statistical projects to be developed: • Study to determine water consumption coefficients. • Inventory of discharge points.
Abstractions of inland water resources (data item E.1)
Sources of data: The agency in charge of providing water abstraction permits may have administrative records of the volumes of surface and groundwater abstracted. The agencies in charge of collecting fees for abstracting water (e.g. “redevance prelevement”) should have administrative records of the volumes of water declared by the abstractors of water for the purpose of paying the fees. Water management agencies and ministries of agriculture may perform estimates of the amount of water required by crops, from which abstractions of soil water may be estimated. Data processing required: Estimates of abstractions based on administrative data, such as the registry of water permits and the reports of payments of volumetric fees for the abstraction of water. Priorities: In a first stage only surface and groundwater abstracted for agriculture, water utilities, manufacturing industries, and thermoelectricity (i.e. nucleoelectric, carboelectric, gas, etc.) may be reported. In a second stage the amount of water turbinated in hydroelectric plants may be reported. In a third stage the

73
volume of rainwater “abstracted” by crops (i.e. “green water”) may be reported.
Relevant agencies: • Water management agency or water resources ministry. • Water utilities, or water utility association or regulator. • Agency of Electricity Production. • Ministry of Agriculture • National Statistics Office
Statistical projects to be developed: • Inventory of water utilities. • Inventory of crop lands with types of crops and water requirements (e.g. based on analysis of
satellite images and complemented by agricultural surveys). • Inventory of thermoelectric plants with type of cooling system with power capacity and energy
generated. • Inventory of hydroelectric plants with power capacity and energy generated. • Incorporate questions about water abstractions in economic censuses.
Collection of Precipitation (data item E.2)
Sources of data: The amount of precipitation collected may be estimated from the calculation of the surface areas connected to rain drains, as well as the volume of tanks used for collecting the precipitation. This information is not usually collected by water management agencies. Special surveys or estimates need be conducted. Data processing required: Estimates of the amount of water collected on the roof of houses based on precipitation patterns and roof areas. Information regarding the sales of tanks used for water collection may be useful. Priorities: The amount of precipitation collected may be estimated, even though in most cases it may be a very small amount, compared with the total abstractions of water. Therefore, this is usually a low priority data item. Relevant agencies:
• Non-government agencies that promote the collection of precipitation. • Water management agency or water resources ministry. • National Statistics Office.
Statistical projects to be developed: • Survey to households to estimate the proportion of water used by households that is collected from
precipitation (E.g. in Australia a survey showed that about 8% of the water used in households is collected from precipitation. The water collected is mainly use to irrigate gardens).
Abstractions from the sea (data item E.3)
Sources of data: Water utilities and water management agencies may have inventories of desalination plants with operating flows to estimate the abstractions from the sea.
Data processing required: Statistics of the amounts of sea water treated in desalination plants. Estimates of the abstractions of sea water for other uses, such as cooling of thermoelectric plants. Priorities: For most countries desalination still represents a small proportion of the total water abstractions, therefore, may be considered a low priority data item. Relevant agencies:
• Water management agency or water resources ministry.

74
• Water utilities, or water utility association or regulator. • Agency in charge of electricity production.
Statistical projects to be developed: • Inventory of desalination plants with production capacities.
Losses (data item I.1)
Sources of data: Data may be compiled by a water utility association or by a regulator. Water suppliers for irrigation. Data processing required: Estimates of losses in drinking water supply networks. The proxies unaccounted for water (UFW) or non-revenue water (NRW) are typically used. Estimates of losses in conveyance canals for irrigation. Priorities: In many developing countries losses in drinking water supply systems represent a large proportion of the drinking water abstracted by water utilities. Losses in drinking water supply networks may well exceed 40% of the water abstracted for injection in the networks. Therefore it is a very important data item. Losses in irrigation conveyance systems also represent a large proportion of the water abstracted, also easily exceeding 40% of the water abstracted for irrigation. Therefore, it is also important to quantify the losses in agriculture. Relevant agencies:
• Water utilities, or water utility association or regulator. • Water suppliers for irrigation or associations of irrigators.
Statistical projects to be developed: • Statistics on the amount of water abstracted by drinking water utilities, and the amount of water
actually delivered to the users. It is important to quantify the number of meters in working conditions that are used to measure the amounts of water delivered to the users.
• Statistics on the amount of water abstracted from inland water resources and the amounts that are actually delivered to the farmers.
Water Exported to the Rest of the World (data item F.2)
Sources of data: Water is not typically exported from one country or territory to another. An exception is the case of Israel, that supplies water to Palestine. Data processing required: Volume of water supplied to other countries or territories from the production records of the water suppliers. Water may be exported after treatment or before treatment. Priorities: For the countries or territories that export water, this is an important data item.
Relevant agencies: • Water utilities that supply water to other countries or territories. • Ministry of Foreign Affairs
Statistical projects to be developed: • Time series of water supplied to other countries or territories.
Water Imported from the Rest of the World (data item G.2)
Sources of data: Same as F.2, but from the country or territory receiving the water.
Data processing required: Same as F.2, but from the country or territory receiving the water.
Priorities: Same as F.2, but from the country or territory receiving the water.

75
Relevant agencies: • Same as F.2, but from the country or territory receiving the water.
Statistical projects to be developed: • Same as F.2, but from the country or territory receiving the water.
Water Supplied/Water Received (data items F.1 and G.1)
Sources of data: Drinking water utilities need to know the amount of water that is actually delivered to the users in order to bill them. Billed volumes of water provide the information about water delivered to the users connected to the drinking water supply network. It is important to quantify the number of meters in working condition that allow the measurement of the water delivered. Data may be compiled by a water utility association or by a regulator. For the case of agriculture, the irrigation districts or farmer associations may collect the data regarding the amounts of water delivered to the farmers. Data processing required: Estimates of water supplied to households and to industries by water utilities, based on administrative records (including desalinated water). Data may be estimated or measured by meters installed in households and businesses connected to the water supply network. Estimates of water supplied to agriculture by water suppliers for irrigation, based on administrative records. Priorities: In a first stage amount of drinking water supplied by utilities to households and industries (after losses are discounted). Amount of water supplied by water suppliers for irrigation. Relevant agencies:
• Water utilities, or water utility association or regulator. • Water suppliers for irrigation or associations of irrigators.
Statistical projects to be developed: • Statistics of the amount of water billed to households and different industries by drinking water
utilities. • Statistics about water meters installed in drinking water supply connections.
Water Supplied/Received for Further Use (data items F.3.2 and G.3.2)
Sources of data: Wastewater utilities have information regarding the amount of water that they supply for reuse after treatment or without treatment. Data processing required: Estimates of wastewater (treated or untreated) supplied by wastewater utilities to industries and agriculture for further use. Reuse typically occurs from urban sewerage systems to farms for irrigation, to manufacturing industries, and also for use in cooling in thermoelectric plants. Priorities: In a first stage amount of wastewater collected in sewers that is sent for reuse in agriculture and other industries. In a second stage reuse by the different industrial activities may be estimated. Relevant agencies:
• Wastewater utilities. Statistical projects to be developed:
• Inventory of wastewater treatment plants with destination of treated volumes. Final Water Use or “Water Consumption” (not included in IRWS list of data items)
Sources of data: Research studies about the amount of water that is evaporated or incorporated in products by the different industrial activities and households. Data processing required: Estimates of the difference between water used and wastewater generated by households and the different industrial activities.

76
Priorities: In a first stage coefficients for households and industries connected to the water supply network may be estimated. In a second stage a more detailed industry by industry calculation of coefficients should be performed. Crop evapotranspiration should be included in this data item if the water used by the crops is considered as an abstraction or as water received from other economic units. Otherwise crop evapotranspiration is included in data item C.1, Evapotranspiration. Relevant agencies:
• Water utilities, or water utility association or regulator. • Water suppliers for irrigation or associations of irrigators. • Water resources ministry or agency.
Statistical projects to be developed: • “Water consumption” coefficients for different industries.
Returns to the Sea (data item H.2)
Sources of data: Estimates based on the identification of direct discharges to the sea.
Data processing required: Estimates from amounts of water abstracted and water consumed by the activities that discharge water directly to the sea. Priorities: Only in coastal areas the identification of discharges to the sea is necessary.
Relevant agencies: • Ministry of Environment • Navy or agency in charge of coastal areas (for discharges to the sea). • Wastewater utilities.
Statistical projects to be developed: • Inventory of wastewater treatment plants that discharge to the sea. • Inventory of discharge points to the sea.
Outflows to other countries (data item C.2.1) Sources of data: Same as B.2, but for water outflowing to other countries.
Data processing required: Same as B.2, but for water outflowing to other countries. Priorities: Same as B.2, but for water outflowing to other countries.
Relevant agencies: • Same as B.2, but for water outflowing to other countries.
Statistical projects to be developed: • Same as B.2, but for water outflowing to other countries.
Outflows to the Sea (data item C.2.2) Sources of data: Measurements of flows at the mouth of rivers and streams. Estimates of the amount of subsurface water flowing to the sea. Data processing required: The volume of water flowing to the sea may be calculated from the measurements in stream gages at the mouth of rivers and streams. Since it is likely that not all the flows of rivers and streams are measured, the missing flows need to be estimated. Estimating the amount of subsurface water flowing to the sea require the identification of the flows and the estimation of the amount of water flowing using permeability coefficients and areas.

77
Priorities: In a first stage only the volume of surface water flowing to the sea may be estimated. In a second stage an estimate of the volume of groundwater flowing to the sea may be estimated.
Relevant agencies: • Water management agency or water resources ministry.
Statistical projects to be developed: • Time series of outflows to the sea. The average as well as the median flows are useful.
The balance of the water flows will modify the water stocks. Measurements of water stocks serve as a verification of the flow data items, as well as a way of finding missing flow data items. The following project “cards” complement the previous data items. Inland Water Stocks (data item A) Sources of data: Agencies in charge of water resources management, which usually collect data of levels in artificial reservoirs and lakes, as well as indirect measurements of the groundwater level. Data processing required: Estimates of the volume of water stored in artificial reservoirs and lakes based on the measured levels for specific dates (e.g. beginning of accounting year for several years). It may also be necessary to make some estimates of the volume of water stored in aquifers, and estimates of amount of snow at specific dates. Priorities: In a first stage only the volume of water in a few artificial reservoirs and lakes may be reported, and then a more complete inventory of reservoirs and lakes may be elaborated with the corresponding volumes. Changes in volume are usually more relevant than the volumes themselves and therefore it is important to develop long time series. In a second phase estimates of volumes in aquifers and in snow, when applicable, can be performed. In a third stage the volume of soil water may be estimated, as well as water in wetlands. Note that the stock of water in rivers and streams is usually not considered relevant for water accounts, due to their flowing nature. Relevant agencies:
• Water management agency or water resources ministry Statistical projects to be developed:
• Inventories of artificial reservoirs and lakes. • Inventory of aquifers. • Inventory of wetlands. • Inventory of snow areas and glaciers.
Project “Cards” for Waterborne Pollution The following examples of project “cards” correspond to the data items related with waterborne pollution. Waterborne pollutant releases to other economic units (data item J)
Sources of data: Data from wastewater utilities.
Data processing required: Estimates of the different types of waterborne pollution released by economic activities and households to the sewer network. Pollution is measured using different parameters, usually based on laboratory tests of wastewaters. Priorities: In a first stage, estimates of amounts of point source organic pollution (e.g. measured as BOD

78
and/or COD) generated by households and industries. In a second stage, amounts of other types of point source pollution (e.g. nutrients and heavy metals). Relevant agencies:
• Wastewater or sewerage utilities. • Ministry of Environment.
Statistical projects to be developed: • Inventory of wastewater treatment plants.
Waterborne pollutant emissions to the environment from point sources (data item K.1)
Sources of data: Estimates of waterborne pollution emitted to inland water resources, to the sea, or to land, by households and the different economic activities. Data processing required: Estimates of the different types of waterborne pollution released by economic activities and households. Amount of pollution retained in wastewater treatment plants based on treatment efficiencies reported by the wastewater treatment operators. Pollution is measured using different parameters, usually based on laboratory tests of wastewaters. Some pollution may be collected in sewer networks and the rest discharged directly to the environment. The waterborne pollution collected in sewer networks is also discharged to the environment with or without treatment. Priorities: In a first stage, estimates of amounts of point source organic pollution (e.g. measured as BOD and/or COD) generated by households and industries. Amount of pollution retained in wastewater treatment plants based on treatment efficiencies reported by the wastewater treatment operators. In a second stage, amounts of other types of point source pollution (e.g. nutrients and heavy metals). Relevant agencies:
• Wastewater utilities. • Ministry of Environment.
Statistical projects to be developed: • Inventory of discharge points. • Inventory of wastewater treatment plants.
Waterborne pollutant emissions to the environment from non-point sources (data item K.2)
Sources of data: Estimates of waterborne pollution emitted to inland water resources, to the sea, or to land, by diffuse sources of pollution, such as the following: fertilizers, herbicides, and insecticides from agricultural lands; oil, grease, and toxic chemicals from urban runoff and energy production; organic matter from septic systems. Data processing required: Information about the amount of nitrogen and phosphorous applied to crops in the form of fertilizers. Priorities: In a first stage, amounts of non-point source pollution (e.g. from fertilizers and pesticides in agriculture). Relevant agencies:
• Ministry of Environment. • Ministry of Agriculture (for non-point pollution emitted by agricultural activities).
Statistical projects to be developed: • Map of agricultural and industrial areas that discharge non-point pollution.

79
Project “Cards” for the Sequence of Economic Accounts for Drinking Water Supply and Sewerage The following examples of project “cards” correspond to the data items related with the Sequence of Economic Accounts for Drinking Water Supply and Sewerage. Output of Drinking Water Supply and Sewerage Activities (SNA data item P1, IRWS data item L.1)
Sources of data: Drinking water and sewerage utilities. Data may be concentrated by a water utility association or by a regulator. Also irrigation districts or irrigation associations that supply water to farmers. Data processing required: Estimate the total sales of water and sewerage services provided by drinking water utilities, sewerage utilities, and irrigation districts or irrigation associations.
Priorities: In a first stage total sales based on financial statements of water and sewerage utilities. In a second stage estimates of the amounts of money spent by households and industries in perform the self- provision of water and sewerage. Relevant agencies:
• Water utilities, or water utility association or regulator. • Wastewater utilities. • Water suppliers for irrigation or associations of irrigators.
Statistical projects to be developed: • Financial statements of drinking water and sewerage utilities. • Economic censuses to drinking water and sewerage industries (design or improvement).
Intermediate Consumption (SNA data item P2, IRWS data item L.3)
Sources of data: Drinking water and sewerage utilities. Data may be concentrated by a water utility association or by a regulator. Data processing required: Expenses on goods and services for providing drinking water and sewerage services. Typically the main amounts for intermediate consumption include electricity and chemical products for treating water. Priorities: In a first stage total expenses on products that are consumed to provide the services. This includes electricity, chemical products, IT services, etc. In a second stage estimates of the amounts of money spent by households and industries to perform the self-provision of water and sewerage. Relevant agencies:
• Water utilities, or water utility association or regulator. • Wastewater utilities. • Water suppliers for irrigation or associations of irrigators.
Statistical projects to be developed: • Financial statements of drinking water and sewerage utilities. • Economic censuses to drinking water and sewerage industries (design or improvement).
Compensation of employees (SNA data item D1, IRWS data item L.2)
Sources of data: Drinking water and sewerage utilities. Data may be concentrated by a water utility association or by a regulator. Data processing required: Data from drinking water and sewerage utilities regarding wages and salaries of employees, as well as employers’ social contributions.

80
Priorities: In a first stage total sales based on financial statements of water and sewerage utilities. In a second stage estimates of the amounts of money spent by households and industries to perform the self provision of water and sewerage. Relevant agencies:
• Water utilities, or water utility association or regulator. • Wastewater utilities. • Water suppliers for irrigation or associations of irrigators.
Statistical projects to be developed: • Economic censuses to drinking water and sewerage industries (design or improvement).
Other Taxes on Production (SNA data item D29, IRWS data item M.1.2)
Sources of data: Drinking water and sewerage utilities. Data may be concentrated by a water utility association or by a regulator. Data processing required: Other taxes on production consist mainly of taxes on the ownership or use of land, buildings or other assets used in the production or on the labor employed, or compensation of employees paid. (SNA 7.73). The use of the terms “direct” and “indirect” taxes has fallen out of favor in economics and SNA. It includes all taxes except taxes on products, payable regardless of the profitability of the production. They include: a). Taxes on payroll or work force b). Recurrent taxes on land, buildings or other structures c). Business and professional licenses d). Taxes on the use of fixed assets or other activities e). Stamp taxes f). Taxes on pollution (if they are not considered as property income). g). Taxes on international transactions (SNA 7.97) Priorities: “Other” taxes on production includes the taxes that are not taxes on products, and that are generated as a result of engaging on production activities. Relevant agencies:
• Water utilities, or water utility association or regulator. • Wastewater utilities. • Water suppliers for irrigation or associations of irrigators.
Statistical projects to be developed: • Economic censuses to drinking water and sewerage industries (design or improvement).
Other Subsidies on Production (SNA data item D39, IRWS data item N.1.2)
Sources of data: Drinking water and sewerage utilities. Data may be concentrated by a water utility association or by a regulator. Data processing required: “Other” subsidies on production consist of subsidies except subsidies on products that resident enterprises may receive as a consequence of engaging in production. For example: a). Subsidies on payroll or workforce. b). Subsidies to reduce pollution. Priorities: “Other” subsidies on production includes the subsidies that are not subsidies on products, and that are generated as a result of engaging on production activities. Relevant agencies:
• Water utilities, or water utility association or regulator. • Wastewater utilities.
81
• Water suppliers for irrigation or associations of irrigators. Statistical projects to be developed:
• Economic censuses to drinking water and sewerage industries (design or improvement). Property Income Payable or Receivable (SNA data item D4)
Sources of data: Drinking water and sewerage utilities. Data may be concentrated by a water utility association or by a regulator. Data processing required: Property income includes the investment income that is payable by the water and sewerage service providers, interest payable on loans, dividends payable. It also includes the resource rent that is payable for the use of natural resources (e.g. royalties paid to the government for the abstraction of water resources). Priorities: It is important to estimate the amounts payable as dividends and royalties for the use of water resources. Relevant agencies:
• Water utilities, or water utility association or regulator. • Wastewater utilities. • Water suppliers for irrigation or associations of irrigators.
Statistical projects to be developed: • Economic censuses to drinking water and sewerage industries (design or improvement).
Current Transfers (SNA data item D5 to D7)
Sources of data: Drinking water and sewerage utilities. Data may be concentrated by a water utility association or by a regulator. Data processing required: This item includes income or wealth taxes that are payable by water suppliers, as well as non-life insurance premiums payable. It also includes other transfers from the government to water suppliers and sewerage service providers. It includes international cooperation transfers receivable. Priorities: It is very important to identify current transfers that mean additional expenditures (e.g income taxes), as well as current transfers that are used to complement the sales of water and sewerage services. Relevant agencies:
• Water utilities, or water utility association or regulator. • Wastewater utilities. • Water suppliers for irrigation or associations of irrigators.
Statistical projects to be developed: • Economic censuses to drinking water and sewerage industries (design or improvement).
Capital Transfers (SNA data item D9, IRWS data item N.2)
Sources of data: Drinking water and sewerage utilities. Data may be concentrated by a water utility association or by a regulator. Data processing required: This item includes not only investment grants, but many other transfers received for fixed capital formation.
Priorities: It is very important to identify capital transfers that contribute to capital expenditures (Gross Fixed Capital Formation). Transfers may include grants from the government to water utilities for the construction or upgrading of water supply and sewerage infrastructure.

82
Relevant agencies: • Water utilities, or water utility association or regulator. • Wastewater utilities. • Water suppliers for irrigation or associations of irrigators.
Statistical projects to be developed: • Economic censuses to drinking water and sewerage industries (design or improvement).
Gross Fixed Capital Formation (SNA data item P51g, IRWS data item P.1)
Sources of data: Drinking water and sewerage utilities. Data may be concentrated by a water utility association or by a regulator. Data processing required: Analysis of the different infrastructure projects for water supply and sewerage.
Priorities: Estimates of capital expenditures in water supply and sewerage infrastructure.
Relevant agencies: • Water utilities, or water utility association or regulator. • Wastewater utilities. • Water suppliers for irrigation or associations of irrigators.
Statistical projects to be developed: • Economic censuses to drinking water and sewerage industries (design or improvement).
As mentioned above, it is also very important to estimate the Consumption of Fixed Capital, as well as the information about water tariffs or rates. Also, taxes and subsidies on products should be considered. They do not show explicitly in the sequence of economic accounts in case output is at basic prices. The following project “cards” address these additional data items. Consumption of Fixed Capital (SNA data item P51c, IRWS data item Q)
Sources of data: Drinking water and sewerage utilities. Data may be concentrated by a water utility association or by a regulator. Data processing required: Estimates of the value of water supply and sewerage and its depreciation.
Priorities: Estimates of the depreciation of the infrastructure for water supply and sewerage.
Relevant agencies: • Water utilities, or water utility association or regulator. • Wastewater utilities. • Water suppliers for irrigation or associations of irrigators.
Statistical projects to be developed: • Economic censuses to drinking water and sewerage industries (design or improvement). • Develop an inventory of water supply and sewerage infrastructure. The inventory will be useful to
estimate the total value of the infrastructure, as well as its depreciation. Depreciation should be calculated according to the SNA (see definition of Consumption of Fixed Capital)
Tariffs and charges for water supply and sewerage services (data item R) Brief description: Tariff structures for drinking water and sewerage services.

83
Sources of data: Water and wastewater utilities. Data may be concentrated by a water utility association or by a regulator. Municipal or state governments. Data processing required: Collection of tariff structures published.
Priorities: In a first stage the average price of water and sewerage in selected cities. In a second stage tariff structures of the different water suppliers in the country or territory. Relevant agencies:
• Water utilities, or water utility association or regulator. • Wastewater utilities. • Municipal and state governments.
Statistical projects to be developed: • Water price surveys to state and municipal authorities.
Taxes on Products (SNA data item D21, IRWS data item M.1.1)
Sources of data: Drinking water and sewerage utilities. Data may be concentrated by a water utility association or by a regulator. Data processing required: Taxes on products consist of taxes on goods and services that become payable as a result of the production, sale, transfer, leasing or delivery of those goods or services, or as a result of their use for own consumption or own capital formation. (SNA 7.73). Priorities: Taxes on products are already excluded in the calculation of output at basic prices. Taxes and subsidies on products create the difference (together with trade and transport margins) between basic prices and purchasers’ prices. Relevant agencies:
• Water utilities, or water utility association or regulator. • Wastewater utilities. • Water suppliers for irrigation or associations of irrigators.
Statistical projects to be developed: • Economic censuses to drinking water and sewerage industries (design or improvement).
Subsidies on Products (SNA data item D31, IRWS data item N.1.1)
Sources of data: Drinking water and sewerage utilities. Data may be concentrated by a water utility association or by a regulator. Data processing required: Is a subsidy payable per unit of a good or service. The subsidy may be a specific amount of money per unit of quantity of a good or service, or it may be calculated ad valorem as a specified percentage of the price per unit. (SNA 7.100). Priorities: Subsidies on products are already included in the calculation of output at basic prices. Taxes and subsidies on products create the difference (together with trade and transport margins) between basic prices and purchasers’ prices. Relevant agencies:
• Water utilities, or water utility association or regulator. • Wastewater utilities. • Water suppliers for irrigation or associations of irrigators.
Statistical projects to be developed: • Economic censuses to drinking water and sewerage industries (design or improvement).

84
Project “Cards” for information about water-related social-demographic data items The following examples of project “cards” correspond to the data items related with social-demographic aspects, specifically the ones related with indicators 7.8 and 7.9 of the Millennium Development Goals (MDGs). Population by main source of drinking water (data item S)
Sources of data: Administrative records of water and wastewater utilities. Population and housing census data, household surveys. From this information the MDG indicators are calculated, therefore several international and national reports should exist. Data processing required: Extract data from population census about the different sources of drinking water, as well as the way in which sewage is disposed of by households. Priorities: In a first stage data at national level for rural and urban population. In a second stage subnational disaggregation. Relevant agencies:
• National Statistics Offices (for population and housing censuses and household surveys) • Water utilities, or water utility association or regulator.
Statistical projects to be developed: • Analysis of data from population and housing censuses. • Analysis of data from household surveys. • Incorporation of new questions in population and housing censuses and household surveys
Population by type of toilet and sewage disposal used (data item T) Sources of data: Administrative records of water and wastewater utilities. Population and housing census data, household surveys. These are MDG indicators, therefore several international and national reports should exist. Data processing required: Extract data from census about the different sources of drinking water, as well as the way in which sewage is disposed of by households. Priorities: In a first stage data at national level for rural and urban population. In a second stage subnational disaggregation. Relevant agencies:
• National Statistics Offices (for population and housing censuses and household surveys) • Water utilities, or water utility association or regulator.
Statistical projects to be developed: • Analysis of data from population and housing censuses. • Analysis of data from household surveys. • Incorporation of new questions in population and housing censuses and household surveys
Each of the data items mentioned above, as well as other data items that add details to the overall assessment, will be described in detail in the following sections of the chapter.

85
.II. Physical data items of flows and stocks within the environment As explained in Chapter 2, in an accounting cycle, the opening stocks of inland water resources are affected by the different flows of water. Some flows will increase the stocks and others decrease them. The characteristics of the flows and the collection of information about them are discussed below. Additions to the stocks of Inland Water Resources Stocks of inland water resources are increased by precipitation, and inflows of water from other countries or territories. Economic activities and households increase the stocks of inland water resources by returning some or all the water they abstracted, as will be described in section III of this chapter. Precipitation within countries or territories (data item B.1 in the IRWS) is usually one of the main sources of renewable water resources. Data about precipitation is collected daily or even hourly through meteorological or climatologic stations, usually operated by national meteorological agencies. The national meteorological agencies may work in coordination with other agencies, which due to the nature of their activities, collect meteorological and climatic data (e.g. agencies in charge of electricity production, airport authorities, waterway and lock operators, etc). For water accounts and statistics the data collected in the different stations (points) has to be aggregated to obtain the total volume of precipitation falling in the territory. In order to aggregate data from each station, which is expressed in height units (e.g. millimeters or inches), it is necessary to determine a weighted average of the precipitation based on the area of influence of each rainfall gauge. Inflows of water from upstream countries or territories (data item B.2 in the IRWS) is another important source of renewable water for many countries that share watersheds or river basins (i.e. transboundary watersheds or river basins). They include surface and groundwater naturally flowing (i.e. by gravity) from the neighboring territories. Inflows include the water flows crossing the borders of two countries, and the water flows that are used as borders. For the latter it is necessary to estimate the share of the bordering river or stream that corresponds to each of the bordering countries. Data about the amount of water flowing through transboundary rivers may be collected regularly using stream gauges. If there is a treaty among the territories sharing the watersheds, the amount of water crossing the borders may be clearly specified (data item B.2.1), and it may be regularly monitored by the transboundary agency set in place for the compliance of the treaty. Groundwater flowing across borders is difficult to measure and only estimates, based on the characteristics of the soil and precipitation patterns, may be available. Reductions in the stocks of Inland Water Resources Stocks of inland water resources are decreased by evapotranspiration (which includes evaporation and transpiration, even sublimation in the case of ice and snow), outflows to other countries or territories, and outflows to the sea. Also, economic activities and households decrease the stocks of inland water resources by abstracting water, as will be described in the following section of this chapter. Evapotranspiration (data item C.1 in the IRWS) is the total quantity of water transferred from the Earth to the atmosphere. A large portion of the precipitation is almost immediately returned to the atmosphere as evaporation
86
and transpiration. The rest of the precipitation, often called effective precipitation, falls on the ground and flows through the territory (data item D in the IRWS) as surface runoff or as infiltration in the soil. The evapotranspiration is not regularly measured, as the precipitation is. The evapotranspiration is estimated through several methods. Often the evapotranspiration is estimated as a residual of precipitation less the amount of water that flows as surface runoff and the amount that percolates or infiltrates underground recharging the aquifers (subsurface runoff). Runoff and infiltration may be estimated using empirical coefficients specific for each territory. Measurements from stream gauges also provide data useful for the estimation of the runoff. Estimates of the evapotranspiration can be provided by the agency in charge of calculating the water balances (or water budgets), typically the Ministry or Agency in charge of water resources management. Evapotranspiration (data item C.1 in the IRWS) should not be confused with the potential evaporation measured with pans (i.e. pan evaporation) in climatologic stations, nor with the reference evaporation (ETo) used for calculating crop evapotranspiration for irrigation plans. Crop evapotranspiration should be considered as Final Water Use or “Water Consumption” if it comes from crops that were irrigated or whose abstraction of water from soil water was accounted for. Outflows of water to downstream territories (data item C.2.1 in the IRWS) is analogous to inflows of water (data item B.2) described above, but viewed from the side of the upstream territory. Outflows of water to the sea (data item C.2.2 in the IRWS) include surface and groundwater “naturally” flowing to the sea. They include the amount of water from rivers and streams that flow to the sea. They also include the amount of groundwater flowing to the sea. If there are stream gauges at the mouth of rivers then these measurements can be used to estimate the total amount of surface water flowing to the sea. The flow of groundwater to the sea is more difficult to estimate. Estimates can be made by the specialists based on the soil characteristics and measurements of the piezometric levels of the water flowing to the sea. Natural transfers between other resources in the territory occur between surface water, groundwater and soil water resources. It is common to simplify the water cycle as precipitation falling on land (data item B.1), then becoming surface water (data item D.5) or groundwater by infiltrating to the aquifers (data item D.6), or simply returning to the atmosphere by evapotranspiration (data item C.1). Water eventually leaves the country or territory by flowing to the sea (data item C.2.2) or flowing to another country or territory downstream (data item C.2.1). See figure 3.1.2 below. Processing water flow data The following figure depicts the main natural flows of water in a country or territory. The red circles show the points in which the flows are traditionally measured: B.1(precipitation) is measured with rain gauges in climatologic stations, B.2(1) (surface water from neighboring territories), D.3.c (flows from rivers to other surface waters) and C.2.2.a (surface water to the sea) are measured using stream gauges located at selected points of rivers and streams. Empirical coefficients and models are used to estimate the other flows, which may be calibrated using the measured flows.

87
Figure 3.2.1. Typical points of measurement of the flows of the natural water cycle
Precipitation In order to obtain the precipitation of a country or territory it is necessary to convert the precipitation data collected in different stations located throughout the territory into a total volume of water. In order to do this, an “area of influence” has to be assigned to each data point, to compensate for the irregular distribution of the stations. There are different methods to obtain the precipitation of a country or territory based on the data from rainfall stations. A widely used method is the Thiessen polygons method, which consists on dividing the territory into regions surrounding each rainfall station. The resulting regions are such that every point inside of them is closer to the station to which it belongs than to any other station. This method in mathematics is known as the method of Voronoi diagrams. Also, the isohyets can be drawn by interpolating the different data points in order to obtain curves of equal precipitation. From the contours formed it is possible to determine the volume of precipitation that fell on a territory. The methods mentioned above can be applied using Geographic Information Systems (GIS) software. Sometimes it is necessary to average precipitation for different regions. For this, it is important to use the area of each region to obtain the volumes of precipitation, which can then be added. Precipitation Example, depth to volume (Unu-Water): According to the Meteorological Office of Unu (MeteoU), the average precipitation in the territory is 800 mm/year. Since the area of the country is 16 000 km2 then the total average volume of precipitation in the country is: 16 000 km2 x 800 mm/year x 1 000 000 m2/km2 x 0.001 mm/m = 12 800 millions of m3/year Which is the same as 12 800 hm3/year or 12.8 km3/year. The Ministry of Water Resources of Unu (UMWR) estimates that 20% of the precipitation becomes surface runoff and 5% infiltrates to the aquifers. Therefore, total evapotranspiration = 100% - 20% - 5% = 75%. Evapotranspiration = 12 800 hm3/year x 75% = 9 600 hm3/year
Aquifer 1
sea
Lake 1
Res 1
Territory boundary
B.1
C.1.1.a (1)
B.2 (1)
B.2 (2)
C.2.2.b
C.2.2.a
D.3.c
D.3.c
D.3.b
D.3.a
C.1.1.a (2)
D.5 (1)
D.3.c
D.6
C.1.1.b
C.1.1.b
D.5 (2)
D.1.c
D.2

88
The following data is necessary for water accounts:
• Annual accumulated precipitation: precipitation falling during the year in a country or territory. It is useful to have long time series in order to identify variations through the years.
• Annual normal precipitation: normal is a long term average used for climatologic variables. It corresponds to the annual average for a period of 30 years or more (e.g. 1961-1990, or 1971-2000).
• Monthly normal precipitation: the average monthly precipitation for a period of 30 years or more. This information is useful to identify the annual pattern of rain, in many cases with a clearly identified rainy season and a dry season.
The data should be expressed as volume of water to be used in water accounts, and also in height or depth units (e.g. millimeters or inches) for comparison purposes. It is important to mention that raw data is collected in height or depth units (usually in millimeters). It is very important to look at long term trends. For example, the figure below shows the precipitation in the island of Mauritius from 1996 to 2012. In the year 1999, a strong “La Niña” year the precipitation was equivalent to only 53% of the 1971-1990 normal.
Figure 3.2.2. Annual precipitation in Mauritius
Source: Statistics Mauritius. It refers only to the island of Mauritius.
The average precipitation for each month of the year is also very important to understand how the water management challenges. Most industrialized countries exhibit a relatively uniform pattern of precipitation throughout the year, while developing countries, most of them located less than 30 degrees in latitude from the equator, exhibit important contrasts between the wet half of the year and the dry half of the year. A country like France receives about 55% of the precipitation in 6 contiguous months of the year and 45% in the other six months. On the other hand, Brazil receives 69% of the precipitation in six contiguous months of the year, and only 31% the rest of the year.

89
The following figure shows the contrast in monthly precipitation for the island of Mauritius, where 71% of the precipitation fall in six months (December to May). A country like Mauritius faces the challenge of managing strong interannual and intrannual variations of precipitation. This challenge can be managed from the supply side, e.g. increasing water storage capacity, or from the demand side, e.g. creating a system able to change demands of water depending on the precipitation received in the different months and years.
Figure 3.2.3. Monthly Average Precipitation in Mauritius
SOURCE: Statistics Mauritius.
Evapotranspiration Evapotranspiration can be estimated as the difference of precipitation less surface runoff and less infiltration to the aquifer, as explained above: C.1 – B.1 – D.5 – D.6 In dry countries, where evaporation is limited by the available water, evapotranspiration increases with the amount of water entering the territory (B.2). That is, if more water enters the territory more water is available for evaporation. This amount may not be very significant when compared with the total amount of precipitation and evapotranspiration in a country. In wet countries evapotranspiration does not change with additional water entering the territory, since without B.2 there is already enough water for reaching the full evaporation potential. Evapotranspiration may be in the range of 30% to 70% in countries with abundant precipitation (more than 1000 mm/year), and is usually more than 90% in countries with low precipitation (precipitation of less than 600 mm/year). Values between 70% and 90% are found in all the other countries16. Some examples are shown below:
16 These patterns can be observed in the FAO Aquastat database: http://www.fao.org/nr/water/aquastat/main/index.stm

90
LONG TERM AVERAGE ANNUAL PRECIPITATION AND EVAPOTRA NSPIRATION IN DIFFERENT COUNTRIES Algeria: 89 mm/year (211 975 hm3/year). Evapotranspiration = 95% of precipitation. Australia: 472 mm/year (3 617 000 hm3/year). Evapotranspiration = 88% of precipitation. Mauritius: 2 011 mm/year (3 751 hm3/year). Evapotranspiration = 30% of precipitation. Mexico: 760 mm/year (1 489 000 hm3/year). Evapotranspiration = 73% of precipitation. Brazil: 1 782 mm/year (15 173 516 hm3/year). Evapotranspiration = 64% of precipitation. Also the evaporation (data item C.1.1) can be calculated for the different artificial reservoirs and lakes, even though it usually represents a small portion of the total evapotranspiration (data item C.1), it is useful for estimating the water available for use from artificial reservoirs and lakes. Surface runoff and infiltration to the aquifers Usually surface runoff data is collected from stream gauges located at different points of rivers and streams. The data have to be interpreted in order to calculate the total runoff (data item D.5) in a watershed or catchment, and then aggregated for a country or territory. Empirical coefficients are used to estimate surface runoff in watersheds that do not have stream gauges. The aquifer recharge or infiltration to aquifers (data item D.6) is also estimated based on the characteristics of each aquifer recharge zone. Rain runoff models can be used for developing better estimates of D.5 and D.6 in specific watersheds. There are also flows of water from surface water bodies to aquifers and vice versa. These flows may be excluded in a first stage, but it may be necessary to estimate them in many cases. The amount of water flowing to the sea (data item C.2.2) can be directly measured in rivers and streams that have stream gauges located at their mouth, and estimated for the cases in which measurement is not available. The same for the inflows from countries upstream (data item B.2) and outflows to countries downstream (data item C.2.1).

91
Figure 3.2.4 Simplified diagram of flows of the natural water cycle (not all flows shown)
Natural flows are affected by abstractions and returns of water done by the different economic activities and households, as will be described in the next section of the chapter. A brief summary of the raw flow data and processing needed to incorporate them in the accounts is described below.
Data item Raw data that can be used Processed data for the accounts B.1 Precipitation • Daily precipitation data by
climatologic station. • Average annual precipitation
volume for the whole country or territory, or by hydrologic units. Precipitation may be available as volume, or converted if height and area are provided.
• Also, as a reference, long term average annual and monthly precipitation (“normal” precipitation) expressed as height and as volume.
C.1 Evapo-transpiration • Daily evaporation measured in climatologic stations using evaporation pans is useful for estimating the evaporation from lakes and reservoirs, but total evapotranspiration may be
• It can be estimated as the difference between total precipitation less surface runoff and infiltration (see explanation above).
C.2.2 (2)
C.1
D.6
D.5
C.2.2 (1)
B.2 (1)
B.1
SOIL SURFACE WATER BODIES
AQUIFERS
SEA
COUNTRIES DOWNSTREAM
COUNTRIES UPSTREAM
C.2.1 (1)
C.2.1 (2)
B.2 (2)

92
Data item Raw data that can be used Processed data for the accounts less than the total evaporation measured with evaporation pans (they show potential evaporation).
• This concept includes evaporation from lakes and artificial reservoirs, as well as transpiration from plants, and even sublimation, in the case of ice and snow.
B.2 Inflows from countries upstream.
• Data from stream gauges. • Data from reservoirs shared
with the country upstream. • Information of international
treaties for transboundary watersheds and aquifers.
• Annual volume of surface water flowing from one country to the other.
• Also, estimates of the annual volume of groundwater flowing from one country to the other.
D.5 Surface runoff • Data from stream gauges • Annual volume of surface water that would flow in a watershed if no abstractions and returns existed. Information from water balances by hydrologic units.
D.6 Infiltration to aquifers
• Piezometric levels, aquifer configurations, types of soil.
• Annual volume of water that infiltrates to the aquifers.
C.2.1 Outflows to countries downstream
• Data from stream gauges. • Data from reservoirs shared
with the country downstream. • Information of international
treaties for transboundary watersheds and aquifers.
• Same as B.2, but in relation to downstream countries.
C.2.2 Outflows to the sea
• Data from stream gauges • Annual volume of water discharged to the sea by rivers and streams.
• Also, estimates of the volume of water discharged by aquifers to the sea.
D.1 Natural transfers from surface water to groundwater
• Data from stream gauges. • This flow is not shown in figure 3.2.4, but in many cases it may be necessary to consider it to account for the flows of water between surface water and groundwater.
D.2 Natural transfers from groundwater to surface water
• Data from stream gauges • This flow is not shown in figure 3.2.4, but in many cases it may be necessary to consider it to account for the flows of water between surface water and groundwater.

93
The stocks of inland water resources Stocks of inland water resources (data item A in the IRWS) include surface water stocks (data item A.1 in the IRWS), groundwater stocks (data item A.2 in the IRWS), and soil water stocks (data item A.3 in the IRWS). Surface water stocks include, among others, the water stored in artificial reservoirs (data item A.1.1) and lakes (data item A.1.2). Usually the different water management agencies keep track of the volume of water stored in artificial reservoirs and lakes. The depth of water in artificial reservoirs and lakes is measured using measuring sticks (limnimeters) permanently installed in some specific locations of the reservoir or lake. The depth of water is transformed into volume using storage capacity curves. Usually daily, or sometimes even hourly, measurements are available. The availability of the measurements depends on the relevance of the reservoir or lake for water management. The volume of water in reservoirs and lakes used for flood protection has to be closely monitored especially during a storm. Also, artificial reservoirs and lakes used for water supply or hydroelectricity are constantly monitored. Measuring the volume of water in rivers and streams (data item A.1.3) is usually considered not relevant for water resources management and may be difficult to properly use when compiling water accounts, so for most cases it is recommended not to use them in the accounts. The volume of water in wetlands (A.1.4) may also be difficult to obtain, and highly variable throughout the year. In some cases lakes are classified as wetlands. The volume of water in snow, ice and glaciers (data item A.1.5) may be difficult to estimate, but may be relevant for some countries. Groundwater stocks (data item A.2) are not as readily available as the information on surface water stocks. Groundwater stocks may be estimated from the water tables in aquifers based on records from piezometric measurements in different points. It is very important to first understand the delimitation and hydrology of the different aquifer systems of the country or territory. Soil water stocks (data item A.3), which is the amount of water in the unsaturated layers of soil, may be harder to measure or even to estimate. Processing water stock data Surface water Data on surface water stocks may be easier to obtain than that of other water stocks. It is therefore advisable to start the data compilation process with surface water stocks. An inventory of artificial reservoirs and lakes is usually the starting point. For each artificial reservoir or lake it is important to collect data about the storage capacity, as well as the volume of water stored at regular intervals of time (once a year or even once a month). The level of water is usually measured as depth of water in the reservoir or lake. The depth of water is transformed into volume using storage capacity curves, which may change with time due to silting of the reservoirs. Bathymetric studies have to be performed in order to redefine the configuration of the reservoirs and lakes, and determine the storage capacity curves when they change over the years (usually through long periods of time). Long time series of water stocks in specific lakes and reservoirs, as well as the aggregated data of all the lakes and reservoirs of a country or territory are useful for understanding the cyclic variations of precipitation and runoff in a country or territory. The graph below shows the volume of water stored in a lake from 1942 to 2009 (for the 1st of

94
January of each year). The graph is helpful for understanding the periodicity of the dry and wet years. Most likely, in the area of the example, severe droughts occurred around the years 1954, 1990, and 2002.
Figure 3.2.5 Water stock in a lake 1942 to 2009
Groundwater For groundwater stocks it is useful to create an inventory of aquifers and identify the volume of water recharged to each aquifer, as well as the amount of water abstracted through specialized studies. It is necessary to first define the configuration of the aquifer systems (recharge area, storage zone, discharge area, etc.) Piezometric levels at different points of the aquifer can be useful for identifying changes in stock of water of each aquifer. All this information is collected and process by the agencies in charge of water resources management: water resources ministry, water agency, or water commission. A brief summary of the raw data about the stocks and processing needed to incorporate them in the accounts is described below.
Data item Raw data that can be used Processed data for the accounts A.1.1 Water stocks in artificial reservoirs
• Water levels measured in limnimeters at different points in time.
• Storage capacity curves.
• Integrated inventory of artificial reservoirs.
• Volume of water at the beginning or end of each year, or even of each month.
• Also useful to have volume of water at the beginning or end of each month.
A.1.2 Water stocks in lakes
• Water levels measured in limnimeters at different points in time.
• Storage capacity curves
• Integrated inventory of lakes. This inventory could be integrated to the inventory of artificial reservoirs.
• Volume of water at the beginning or end of each year, or even of each month.
• Also useful to have volume of

95
Data item Raw data that can be used Processed data for the accounts water at the beginning or end of each month.
A.1.3 Water stock in rivers and streams
• Flow of water measured in stream gauges. To be used for estimating flows and not stocks.
• Not recommended to consider as a stock of water.
A.1.4. Water stock in wetlands
• For some wetlands, possibly water levels measured in limnimeters at different points in time.
• Estimate of the volume of water in wetlands.
• If the wetland can be considered a lake, integrate in inventory of lakes and process as a lake.
• Other wetlands can be incorporated in a specific inventory of wetlands.
A.1.5. Water stock in snow, ice and glaciers
• Estimates of the volume of snow, ice and glaciers.
• Water content in volume of snow, ice and glaciers.
A.2 Groundwater stocks • Piezometric levels at some points.
• Inventory of aquifers (specify delimitations).
• Estimates of the volume of water at the beginning or end of each year.
A.3 Soil water stocks • Estimate of humidity in the soil at different points in time.
• Estimate of the volume of water in soil. Need to separate from wetlands (configuration defined) and aquifers (areas with 100% saturation).
Integrating data into the accounts
The data available from different sources have to be processed in order to be incorporated in the accounts. The data items corresponding to the hydrologic cycle need to be combined with data about flows to the economy and from the economy (abstractions [E], returns [H], and losses [I]), which will be described in the following section of this chapter. It is unlikely that a country has information about all the data items, therefore it is important to set priorities in the process of data collection and compilation. The table below shows the standardized asset account table with the data items needed to complete it.

96
Table 3.2.1 Physical asset account for water resources showing relevant IRWS data items
Source: adapted from table 5.11.2 of the System of Environmental-Economic Accounts (SEEA)
The information shown may be too much to be collected on a first stage. Therefore the table can be constructed with a first set of data items as shown below. The following table shows the most relevant data items, which could be used in a first stage of preliminary accounts.
Artificial
reservoirsLakes
Rivers and
streamsWetlands
Glaciers,
snow and
ice
Aquifers Soil water TOTAL
Opening stock of waterOpening
A.1.1
Opening
A.1.2
Opening
A.1.4
Opening
A.1.5
Opening
A.2
Opening A.1 +
Opening A.2
Additions to stock
Precipitation B.1 (1) B.1(2) B.1(3) B.1(4) B.1(5) B.1(6) B.1 (1 to 6)
Inflows from other countries B.2 (2) B.2
Inflows from other inland water
resources
D.1 + D.4 +
D.6
D.1 + D.2 + D.3 + D.4
+ D.5 + D.6
Returns H.1.1.1 H.1.1.2 H.1.1.3 H.1.1.4 H.1.2 + I.1 H.1 + I.1
Reductions in stock
Evaporation and/or transpiration
(evapotranspiration)
C.1.1 (1) C.1.1 (2) C.1.1 (3) C.1.1(4)* C.1 - C.1.1
(1 to 4)
C.1
Outflows to other countries C.2.1 (2) C.2.1
Outflows to other inland water resources
D.2 + D.4 D.5 + D.6 D.1 + D.2 + D.3 + D.4
+ D.5 + D.6
Outflows to the sea C.2.2 (2) C.2.2
Abstractions E.1.1.1 E.1.1.2 E.1.1.3 E.1.1.4 E.1.2 E.1
Closing stock of waterClosing
A.1.1
Closing
A.1.2
Closing
A.1.4
Closing
A.1.5
Closing A.2 Closing A.1 +
Closing A.2
D.1 + D.3
B.2 (1)
C.2.1 (1)
C.2.2 (1)
D.2 + D.3 + D.5

97
Table 3.2.2 Physical asset account showing IRWS data items to be collected on a first stage
In the table above it is assumed that simply all the precipitation (data item B.1) falls on the whole land area of the country, without identifying the precipitation that falls on the reflecting pools of artificial reservoirs, lakes, and wetlands, which typically represent less than 10% of the total area of a country. All the evapotranspiration (C.1) is lumped into the soil water column. It is assumed that the water falling on the soil either runs off as surface water (D.5) or infiltrates to aquifers (data item D.6). Water entering the country or territory is in rivers and streams (B.2). This simplification provides the following equation:
B.1 – C.1 – D.5 – D.6 = 0 Therefore, the evapotranspiration can be estimated as follows: C.1 = B.1 – D.5 – D.6. This equation and more detailed ones are used for water balances done by water agencies and ministries. Water balances are a very important source of information for the water accounts. The problem of scale in water resources Aggregating data through space and time (national and annual) may hide important contrasts. Therefore, while it is important to have some aggregates at the national and annual level, in many cases it is also very important to have the information for smaller territorial areas (e.g. hydrographic regions) and for seasons or months of the year, as illustrated by the examples below. In Peru the average precipitation of the country is around 1600 mm/year. However, 80% of the population lives on the Pacific side, where the average precipitation is only 274 mm/year.
Artificial
reservoirsLakes
Rivers and
streamsAquifers Soil water TOTAL
Opening stock of waterOpening
A.1.1
Opening
A.1.2
Opening
A.2
Opening A.1 +
Opening A.2
Additions to stock
Precipitation B.1 B.1
Inflows from other countries B.2 B.2
Inflows from other inland water
resources
D.6 D.5 + D.6
Returns I.1 H.1 + I.1
Reductions in stock
Evaporation and/or transpiration
(evapotranspiration)
C.1 C.1
Outflows to other countries C.2.1 C.2.1
Outflows to other inland water
resources
D.5 + D.6 D.5 + D.6
Outflows to the sea C.2.2 C.2.2
Abstractions E.1.2 E.1
Closing stock of waterClosing
A.1.1
Closing
A.1.2
Closing A.2 Closing A.1 +
Closing A.2
H.1.1
E.1.1
D.5

98
Figure 3.2.6 Geographical contrast of renewable water in Peru
In Thailand the annual average precipitation (normal precipitation 1971-2000) is 1 573 mm/year. However, 80% of it falls in the wetter half of the year, between May and October. On the other hand, the Netherlands receives an average precipitation of 845 mm/year (normal precipitation 1981-2010), but has a more uniform pattern of precipitation, receiving 52% of the precipitation in the wetter half of the year.
Figure 3.2.7 Precipitation patterns in different countries.
Initial national aggregated assessments are useful to guide the process of water accounts and statistics compilation. However, disaggregation of the data should be considered for the mid-term and long-term plans of implementation of water accounts and statistics. Water data is usually organized by hydrologic regions comprising one or several watersheds or catchment areas. The hydrologic regions may be defined in a nested way, in order to have different levels of detail. The boundaries of the hydrologic regions rarely match the administrative and/or political boundaries, which makes it difficult to combine hydrologic information with economic and social information. Regions combining hydrologic and
0%
10%
20%
30%
40%
50%
60%
70%
80%
90%
100%
TRWR Population
Normal Precipitation in Thailand 1971-2000 (mm)
0
50
100
150
200
250
300
Jan Feb Mar Apr May Jun Jul Aug Sep Oct Nov Dec
Normal Precipitation in the Netherlands 1981-2010 (mm)
0
10
20
30
40
50
60
70
80
90
Jan Feb Mar Apr May Jun Jul Aug Sep Oct Nov Dec

99
administrative or political boundaries (possibly at municipal level) may be created in order to be able to combine the different types of information. Water balances, as well as data about water abstractions, are usually done on an annual basis, and therefore additional efforts need be made in order to have seasonal or monthly accounts, in case they are considered necessary. Unu-Water Example The following diagram shows a simplification of the water cycle in the ficticious country of Unu (See complete Unu-Water example included with the Guidelines). This rough simplification is the starting point for refining the data, using a holistic approach.
Figure 3.2.8 Simplified natural water cycle in Unu (units in millions of cubic meters of water per year, hm3/year)

100
Table 3.2.3 Simplified asset table for the Unu example (units in millions of cubic meters of water per year, hm3/year)
Examples The following table shows the asset accounts for Mexico with average approximate figures. For the average approximate figures it is assumed that in the long term the changes in stocks are negligible. The numbers in red are residuals for balancing the table.
Table 3.2.4 Physical asset account for Mexico with average approximate figures (units in billion cubic meters of water, km3)
Artificial
reservoirsLakes
Rivers and
streamsAquifers Soil water TOTAL
Opening stock of waterOpening
A.1.1
Opening
A.1.2
Opening
A.2
Opening A.1 +
Opening A.2
Additions to stock 81.7 1489 2111.57
Precipitation 1489 1489
Inflows from other countries 49.57
Inflows from other inland water
resources
70 399
Returns 11.7 174
Reductions in stock 81.7 1489 2111.57
Evaporation and/or transpiration
(evapotranspiration)
1090 1090
Outflows to other countries 44.94
Outflows to other inland water
resources
399 399
Outflows to the sea 51.6 372.63
Abstractions 30.1 205
Closing stock of waterClosing
A.1.1
Closing
A.1.2
Closing
A.2
Closing A.1 +
Closing A.2
174.9
49.57
44.94
321.03
540.87
540.87
329
162.3
Source: based on CONAGUA.- Statistics for Water in Mexico 2011.

101
The information in the table can be presented as a diagram, as shown below.
Figure 3.2.9 Simplified diagram showing flows of the natural water cycle in Mexico (units in billion cubic meters of water, km3)
Source: based on CONAGUA.- Statistics for Water in Mexico 2011.
Some basic indicators that can be derived from the table above are the following:
• Internal renewable water resources = B.1 – C.1 = 1 489 – 1 090 = 399 • Total renewable water resources = B.1 – C.1 + B.2 = 399 + 49.6 = 448.6 • Dependency ratio = B.2/(B.1 – C.1 + B.2) = 0.11 = 11%
C.2.1 (1) 44.94
C.2.2 (2) 51.6
C.1 1090
D.6 70
D.5 329
C.2.2 (1) 321.03
B.2 (1) 49.57
B.1 1489
SOIL SURFACE WATER BODIES
AQUIFERS
SEA
COUNTRIES DOWNSTREAM
COUNTRIES UPSTREAM
C.2.1 (2)
B.2 (2)

102
Table 3.2.5 Physical asset account based on the case of the Netherlands with data of 2010 (units in billion cubic meters of water, km3)
Artificial
reservoirsLakes
Rivers and
streamsAquifers Soil water TOTAL
Opening stock of waterOpening
A.1.1
Opening
A.1.2
Opening
A.2
Opening A.1 +
Opening A.2
Additions to stock 2.9 32.45 126.01
Precipitation 32.45 32.45
Inflows from other countries 83.34
Inflows from other inland water
resources
2.90 10.22
Returns 0
Reductions in stock 2.9 32.45 126.01
Evaporation and/or transpiration
(evapotranspiration)
22.23 22.23
Outflows to other countries 0
Outflows to other inland water
resources
10.22 10.22
Outflows to the sea 2.9 93.56
Abstractions 0
Closing stock of waterClosing
A.1.1
Closing
A.1.2
Closing
A.2
Closing A.1 +
Closing A.2
90.66
83.34
7.32
90.66
90.66
Source: based on information provided by CBS Netherlands.
The information in the table can be presented as a diagram, as shown below.

103
Figure 3.2.10 Simplified diagram showing flows of the natural water cycle in the Netherlands (units in billion cubic meters of water, km3)
Source: based on information provided by CBS Netherlands. Some basic indicators that can be derived from the table above are the following:
• Internal renewable water resources = B.1 – C.1 = 32.45 – 22.23 = 10.22 • Total renewable water resources = B.1 – C.1 + B.2 = 10.22 + 83.34 = 93.56 • Dependency ratio = B.2/(B.1 – C.1 + B.2) = 0.89 = 89%
BIBLIOGRAPHY: World Meteorological Organization.- Guide to Hydrological Practices.- Volume I. Hydrology – From Measurement to Hydrological Information.- 2008. (WMO No. 168) World Meteorological Organization.- Guide to Hydrological Practices.- Volume II. Management of Water Resources and Application of Hydrological Practices.- 2009. (WMO No. 168)
C.2.1 (1) 0
C.2.2 (2)
C.1 22.23
D.6 2.90
D.5 7.32
C.2.2 (1) 90.66
B.2 (1) 83.34
B.1 32.45
SOIL SURFACE WATER BODIES
AQUIFERS
SEA
COUNTRIES DOWNSTREAM
COUNTRIES UPSTREAM
C.2.1 (2) 0
B.2 (2)
COUNTRIES UPSTREAM

104
.III. Physical data items of flows to/from and within the economy Flows of water in the economy and to/from the environment The different economic units of a country or territory abstract water (data item E.1 in the IRWS) from inland water resources for performing the activities of production, consumption and accumulation. Water also flows from the economy to inland water resources or the rest of the environment due to returns after use (data item H.1 in IRWS) and also due to losses (data item I.1 in the IRWS). A portion of the water abstracted is returned to the environment as evaporation and another portion (usually smaller) is incorporated in products. Additionally, some water is abstracted from the seas and oceans, usually for desalination (data item E.3 in the IRWS), and some water is discharged in the seas and oceans (data item H.2 in the IRWS). These flows are shown in the following figure.
Figure 3.3.1 Diagram of flows of water between the economy and the environment (not all flows shown)
Data about abstractions of water from inland water resources (data item E.1) by economic activities, especially from surface water (data item E.1.1) and from groundwater (data item E.1.2) are considered essential for fact based water management. Once water is abstracted from inland water resources, or even from the oceans and seas, it is important to understand how it is used by the different economic activities and households, and then returned to the environment. It is assumed that the amount of water that is accumulated in the economy is negligible, and therefore, all the water abstracted by the economy has to leave the economy as returns (data item H.1 in the IRWS), as losses (data item I.1 in the IRWS) or as “water consumption” (mainly evapotranspiration in economic activities and a small portion which is incorporated in products). Once water is abstracted, it enters the economy and flows from one activity to another until it is returned to the environment. Water abstracted may be supplied to other economic units (data item F.1), mainly by the water supply industry. Water supplied is received (data item G.1) by other economic units and households. Water is also reused in the economy and therefore wastewater can be supplied for further use (data item F.3.2), as shown in the diagram below.
H.2 H.1
I.1 E.1
Water in the atmosphere
Water on land surface or subsurface
Water in oceans and seas
Economic units and households
E.3

105
Figure 3.3.2 Diagram of flows of water within the economy and to/from the environment (not all flows shown)
For the organization of the information it is important to classify the different economic activities according to the International Standard Industrial Classification of All Economic Activities (ISIC), or other equivalent classification system, so that the data is comparable with those collected for other accounts and statistics, as well as with data from other countries. See chapter 2 for a detailed description of this. Processing data about water flows in the economy and to/from the environment A brief description of the raw data and processing needed to incorporate the data in the accounts is described below.
Table 3.3.3. Sources of Information for Each Data Item
Data item Raw data commonly available Processed data for the accounts E.1 Abstraction of water from inland water resources (for drinking water supply). ISIC 3600-1
• Inventory of drinking water utilities or companies.
• Water “produced” by drinking water utilities or drinking water companies.
• Volume of the water rights held by water utilities.
• Volume declared by water utilities for the payment of water fees or royalties.
• Integrated inventory of water utilities.
• Total amount of water abstracted by water utilities.
• Important to disaggregate in surface water (E.1.1) and groundwater (E.1.2) abstracted.
E.1 Abstraction of water from inland water resources (for agriculture). ISIC 01 to 03.
• Inventory of irrigation associations or agriculture water suppliers.
• Area irrigated and types of crops from agricultural censuses and surveys.
• Volume of the water rights held by agricultural users or irrigator
• Total amount of water abstracted by agriculture. Useful to separate the water abstracted by the irrigation associations or water suppliers to agriculture, from farmers directly abstracting water.
• Important to disaggregate in
G.3.1
G.3.2
F.3.2
G.3.1
H.1 H.2
H.1
F.3.1
F.3.1
E.1(1)
G.1(1)
F.1
G.1(2) F.1
I.1
E.1(2) Households
Water on land surface or subsurface
Industries
Water supplier
Sewerage
Water in oceans and seas

106
Data item Raw data commonly available Processed data for the accounts associations.
• Volume declared by agricultural users for the payment of water fees or royalties.
surface water (E.1.1) and groundwater (E.1.2) abstracted.
E.1 Abstraction of water from inland water resources (for non agriculture industries. Off-stream)
• Volume of the water rights held by industries.
• Volume declared by industries for the payment of water fees or royalties.
• Total amount of water abstracted by non agriculture industries (excluding power plants).
• Important to disaggregate in surface water (E.1.1) and groundwater (E.1.2) abstracted.
E.1 Abstraction of water from inland water resources (for cooling in thermoelectric plants) ISIC 3510-1
• Inventory of thermoelectric plants.
• Electricity generated, type of cooling system and volume of water used in each plant.
• Total amount of water abstracted for power plants that use water for cooling.
• Important to disaggregate in surface water (E.1.1) and groundwater (E.1.2) abstracted.
E.1 Abstraction of water from inland water resources (for hydroelectricity) ISIC 3510-2
• Inventory of hydroelectric plants.
• Electricity generated and volume of water turbinated in each hydroelectric plant.
• Total amount of water abstracted for hydroelectricity. The abstractions include water that is turbinated more than once through plants in cascade.
E.1 Abstraction of water from inland water resources (for the operation of waterway locks) ISIC 5222
• Inventory of waterway locks. • Volume of water required in
each operation of the lock. • Number of times the locks are
operated in a year.
• Total amount of water abstracted for the operation of waterway locks.
E.2 Collection of precipitation
• Estimate of the number of buildings with rainwater tanks for the collection of precipitation.
• Volume of water stored in the rainwater tanks.
• Amount of water collected in rainwater tanks or other means.
E.3 Abstraction from the sea
• Inventory of desalination plants. • Volume of water “produced” in
the desalination plants.
• Amount of water abstracted by desalination plants.
F.1 Water supplied (drinking water) ISIC 3600-1
• Water billed to the different users.
• Amount of water billed to households.
• Amount of water billed to the different industries connected to the water supply network.
F.1 Water supplied (non drinking water) ISIC 3600-2
• Inventory of non-drinking water suppliers, e.g. suppliers of water for irrigation.
• Water supplied (non drinking). Includes bulk water or water supplied to irrigation.
F.3.1 Wastewater for treatment or disposal
• Same as G.3.1, but may be collected from economic activities discharging to the
• Wastewater entering the sewer network.

107
Data item Raw data commonly available Processed data for the accounts sewers.
F.3.2 Wastewater for further use
• Wastewater to be reused from inventories of WWTPs.
• Surveys to different industries to know the amount of wastewater they are reusing.
• Wastewater to be reused.
G.1 Water received • Same as F.1. • Same as F.1. G.3.1 Wastewater received for treatment or disposal
• Inventory of WWTPs with flows of operation.
• Flows at different points of the sewer network.
• Wastewater entering the sewer network.
G.3.2 Wastewater received for further use
• Same as F.3.2, but may be collected from economic units that reuse water.
• Wastewater received by the economic units for further use.
H. Returns of water by economic units
• Water consumption coefficients for the different economic units and households not connected to the sewerage network.
• Abstractions of water (E) and water received (G) by the different economic activities and households to be able to estimate the returns.
• Estimates of the returns generated by the different economic activities and discharged directly to inland water resources (H.1) or to the sea (H.2).
I.1 Losses of water in distribution
• Water utilities measure the amount of water “produced” (injected to the water supply network) and water billed by water utilities.
• Unaccounted for Water (UFW) or Non revenue water (NRW) to be used as proxies of losses of water in distribution.
WWTPs = Wastewater Treatment Plants One of the most relevant pieces of information is water abstraction17 by the different industries. With data of abstractions the other data can be estimated if it is not available. The following paragraphs will focus on the data collection process for water abstractions. The strategy to collect data depends on the type of water management system that is in place in the country. In some countries the water management system requires the declaration of volumes abstracted by the users, or the collection of data by the water supply industry, among other mechanisms that generate administrative data useful for the accounts. In other cases different censuses and surveys, such as agricultural censuses or surveys to water supply industries, may provide the data needed to compile the accounts.
17 Water abstractions receive different names in the water management literature, such as water “withdrawals,” or “water use” to designate the same concept. These Guidelines recommend the use of the term “abstraction” to specifically designate the water that is taken from the environment and used in the economy.

108
Water management administrative records Some countries, such as Australia and Chile, have a system of water rights and keep a registry of the amount of water that each user is allowed to abstract. The registry of water abstraction rights may provide a first approximation of the abstractions of water, especially if the registry is kept up to date, and water rights are verified by the authorities. The volume of water granted for abstraction in the system of water rights may be used as a proxy, but it is important to keep in mind that the information may not be very accurate as it is common to grant water rights for volumes greater than what is actually used. Other countries, such as France and Spain, require the abstractors to pay a fee or royalty for each volumetric unit of water abstracted. The abstractors have to measure and report the amount of water abstracted, and this information may be verified by the authorities. Other countries, such as Mexico, have a dual system (i.e. a water rights system with a public registry, and a system of fees or “royalties” that users have to pay for each cubic meter of water abstracted), and the information from both mechanisms can be contrasted. The quality of the information from these records depends on the efficacy of the water management system. Water rights or permits have to be verified by the authorities and the payment of fees has to be enforced. Other problems are due to the fact that water users tend to request water rights with volumes higher than the actual volume abstracted. Often, the water rights registries are not classified according to ISIC categories and it can become difficult to get detailed information by industry.
Example: Registry of water rights in Mexico. Major reforms to the water management system in Mexico created a Public Registry of Water Rights. Further reforms in 1999 promoted the regularization of water rights and the improvement of the registry. The following graph was constructed using the information in the registry.
The graph shows the proportions of water abstracted by the different activities, according to the registry. It can be seen that there is a steady increase of the amount of water abstracted by agriculture throughout the period 2001 to 2009.
Source: CONAGUA.- National Water Information System. https://sisgrh.imta.mx/sina
Water abstractions in Mexico
0
10000
20000
30000
40000
50000
60000
70000
80000
90000
20
01
20
02
20
03
20
04
20
05
20
06
20
07
20
08
20
09
mill
ion
cubi
c m
eter
s pe
r ye
ar
Other industries
Cooling inthermoelectricityAgriculture
Drinking watersupply

109
Example: Declaration of volumes abstracted for the payment of fees in France. In the French water management system water users have to declare the amount of water they abstract and pay a fee for each cubic meter of water abstracted. Besides funds for water management, this system provides valuable information about the amount of water abstracted. The following graph was constructed using these data.
In the case of France, it is interesting to note that the main abstractions are for cooling in thermoelectricity, while the agricultural sector abstracts a smaller proportion than drinking water supply. The large amounts of water abstracted for thermoelectricity may be explained by the extensive use of nuclear fueled thermoelectric plants. The small amount of water abstracted for agriculture may be explained by the temperate climate with precipitation all year round. See comparison of precipitation in countries in figure 3.1.8. Source: Commissariat Général au Developpement Durable.- Le financement de la gestion des ressources en eau en France.- Etudes & Documents.- January 2012.
If there is no registry of water rights and/or fees or royalties collected for the water abstracted, estimates will have to be made based on different data, such as population, irrigated area, type of industries, industrial production, electricity generated, etc. In any case, it is important to start with rough estimates to have an idea of orders of magnitude of the different abstractions. Then, conventional statistical data collection operations should be carried out. Typically, in water resources management, water abstracted for hydroelectricity and for the operation of locks is not considered an abstraction. For completeness, in the SEEA-Water and IRWS water turbinated in hydroelectricity and water for the operation of waterway locks are considered abstractions of water. It is therefore useful to distinguish two types of abstractions: for off-stream uses and for in-stream uses. Off-stream uses take the water out of the water source to use it somewhere else. This type of water use is also known as “consumptive use” of water. In-stream uses do not remove water from its source, or water is immediately returned with little or no alteration. The table below shows the typical way in which water abstractions are grouped by water managers. Further detail is recommended once an initial assessment is performed. In addition to off-stream uses and in-stream uses there are “in-situ,” or “on-site” uses of water. In-situ uses of water are not considered abstractions of water in the SEEA-Water and IRWS, since water is never moved from its original
Water abstractions in France
0
5 000
10 000
15 000
20 000
25 000
30 000
35 000
40 00020
00
2001
2002
2003
2004
2005
2006
2007
mill
ion
cubi
c m
eter
s pe
r ye
ar Other industries
Agriculture
Drinking watersupply
Cooling inthermoelectricity

110
location. In-situ uses include navigation, fishing, swimming, and recreational activities on water. These uses are not addressed in these Guidelines. Off-stream uses of water include the following:
Table 3.3.4. Off-stream Uses of Water
Water Management Group
Abstractor of water Main Users of water abstraction
Main purpose of abstraction
Water supply to human settlements
Water utilities or companies (ISIC 3600)
Households and industries connected to water supply networks
Produce drinking water to distribute it to households and industries through water supply networks.
Households Households Use in households Agriculture Agricultural industries
(ISIC 01-03) Agricultural industries (ISIC 01-03)
Irrigation of crops, raising livestock, raising fish (aquaculture)
Water suppliers for irrigators (ISIC 3600), e.g. irrigator associations.
Agricultural industries (ISIC 01-03)
Convey water to farmers for irrigation
Industrial water (mainly manufacturing, cooling sometimes included here)
Water utilities or companies (ISIC 3600)
All other industries not included in other sections of the table.
Use in manufacturing processes, mining, beverage production, etc. Industries using the
water they abstract (self abstraction)
Cooling water (for thermoelectricity)
Thermoelectric power establishments (ISIC 3510)
Thermoelectric power establishments (ISIC 3510)
Cooling of hot steam used to move turbines.
In-stream uses of water include the following:
Table 3.3.5. In-stream Uses of Water
Water Management Group
Abstractor User Purpose of abstraction
Water for hydroelectricity Hydroelectric power plants (ISIC 3510)
Hydroelectric power plants (ISIC 3510)
Use of the mechanical energy of water to move turbines. It includes both, conventional hydroelectric plants and run-of-the river hydroelectric plants.
Water for operation of navigation locks
Waterway lock operators (ISIC 5222)
Waterway lock operators (ISIC 5222)
Lifting and lowering of ships.
Freshwater Aquaculture Freshwater aquaculture farmers (ISIC 0322)
Freshwater aquaculture farmers (ISIC 0322)
Derivation of water for culturing or farming of aquatic organisms (fish, molluscs, crustaceans, plants, crocodiles, alligators and amphibians).

111
In-situ uses of water include the following:
Table 3.3.6. In-situ Uses of Water
In-situ Use Economic Activities Associated Remarks Swimming Sports activities and amusement and
recreation activities (ISIC 93) The economic activity in ISIC is defined in general terms, not specifically related to the use of water.
Recreational activities Sports activities and amusement and recreation activities (ISIC 93)
The economic activity in ISIC is defined in general terms, not specifically related to the use of water.
Fishing Freshwater fishing (ISIC 0312) ISIC 0311 refers to marine fishing. In addition non-freshwater inland water fishing could be possible, but not included in the ISIC classification.
Navigation Inland Water Transport (ISIC 502) The economic activity in ISIC includes inland passenger water transport (ISIC 5021) and inland freight water transport (ISIC 5022)
Below follows a brief discussion about the information related to the relevant different uses of water mentioned above. Water supply to human settlements a). Water utilities or water companies Water utilities or companies can be public or private. They are directly responsible for delivering water to households and industries. Water utilities (industry class 3600 of the International Standard Industrial Classification of All Economic Activities [ISIC]) abstract water from various sources. Depending on the quality of the water at the source, water utilities may treat the water abstracted to make it appropriate for human consumption. Then the water is distributed to the final consumers through a water supply network. Water utilities18 belong to the same ISIC class as other suppliers of water (such as irrigation associations in charge of supplying water to farmers), but they should be kept separate for the purposes of water accounts and statistics, since the nature of their activities is different to that of water utilities, which usually do not provide water to farmers, since the water they produce has drinking quality and would be too expensive to use for agricultural purposes in most cases, except for high value crops or flowers (e.g irrigation of orchids). To perform their activities water utilities collect the following data:
IRWS Data Item Brief description Main issues Abstractions of surface water (data item E.1.1)
The amount of water abstracted from artificial reservoirs, lakes, rivers or streams.
The data available may refer to “water produced,” which is measured at the point where it is injected to the water supply network. Losses between the point
18 The term water utility will be used to refer to government or privately owned companies that provide the service of drinking water supply.

112
IRWS Data Item Brief description Main issues Abstractions of groundwater (data item E.1.2)
The amount of water pumped from aquifers or collected from springs.
of abstraction and the entrance of the water supply network may be omitted (they may be in the order of 2%). Sometimes water is measured at the water treatment plants. Any of these measurements can be used in lieu of the actual abstraction.
Abstractions of sea water (data item E.3)
Water treated in desalination plants, if they exist, before being injected to the water supply network.
Data should be collected regularly for the operation of the desalination plant.
Amount of water supplied (data item F.1)
Amount of water billed to the users.
The amount of water billed to the users may be measured with meters at the point of connection to the water supply network. When meters are not available the amount of water delivered is estimated. The water billed is separated into water billed to households (usually representing between 70% and 90% of the water supplied, non-revenue water discounted), and water billed to the different types of industries and services, a detailed breakdown may not be available.
Losses of water in distribution (data item I.1)
Difference between the amount of water injected in the water supply network and the amount of water delivered to the users (water billed).
Water utilities typically use the difference of “water produced” and “water billed” as a proxy for losses. This proxy is known as Unaccounted For Water (UFW) or the Non Revenue Water (NRW). Estimates of the proportion of UFW or NRW that corresponds to leaks, theft or errors in measurements may be available. UFW or NRW may be more than 20%. In many cases it may be even above 50%.
The responsibility of drinking water supply may be municipal, provincial or national. Depending on the institutional arrangement the data collection strategy should be designed. In some cases there is a national regulator or association that collects the data from the individual utilities. In other cases the data needs to be collected directly from the municipalities. In this case a specific census or survey needs to be performed. Example of Data Collection Mechanisms in Countries
• In Brazil the responsibility of drinking water supply belongs to each of the more than 5000 municipalities. IBGE, the National Statistics Office performs a census to collect data from all the water utilities (“Pesquisa Nacional de Saneamiento Basico”).
• In Great Britain the Office for Water (Ofwat) regulates the 10 private companies that provide the water supply service. The companies have to provide all the detailed operation data to Ofwat.
• In the Netherlands the Dutch Drinking Water Association (Vewin) collects data from the 10 companies that deliver the service and produces a statistical report every year.
• In Mauritius there is only one water utility (Central Water Authority) which supplies drinking water and produces an annual report with all the data related to the activity.
• In Mexico the responsibility of drinking water supply belongs to each of the more than 2400 municipalities. INEGI, the National Statistics Office, with the collaboration of the National Water Commission, performs an economic census for all the water utilities in the country every five years.
• In Peru the Regulator of Water Supply and Sewerage Services (SUNASS) collects data from 50 water

113
supply and sewerage utilities, which provide water and sewerage services to nearly 60% of the population of the country.
Sample forms and reports are provided in the annexes. In order to better control the quality of data related to water utilities, it is useful to have the following:
• An inventory of water utilities or water companies. Some water utilities are also wastewater utilities. • An inventory of water treatment plants. • An inventory of desalination plants.
Economic censuses or surveys to industries may provide more detailed data about the amount of water that is supplied to each type of industry. At a first stage the amount of water supplied by the water utilities to all industries may be sufficient. At a second stage the censuses and surveys may provide the details according to the types of industries classified by ISIC categories. b). Bulk water companies Often water has to be conveyed long distances before it is distributed through water supply networks. There are some enterprises that deliver water (“bulk water”) to water utilities for distribution. These companies are also classified as ISIC 3600. In water accounts it may be necessary to include these companies as a separate activity generating a different product in order to correctly quantify the amount of water produced. c). Households Typically, households receive the water they need from a water supply network operated by a water utility. Generally between 70% to 90% of the water supplied by water utilities (excluding losses or non-revenue water) is for households, the rest is supplied to the different industries (i.e. manufacturing, services, etc.) and public services connected to the water supply network. Example of water supplied to households and industries in Spain In Spain, a 2010 survey shows that the water distributed by water utilities was delivered in the following proportions (after non-revenue water was discounted): To Households 71% To Economic Activities 20% To Municipal Uses and other 9%
Source: Instituto Nacional de Estadística. Nota de prensa 5 July 2012. In rural areas or low density population urban areas households may have their own well and abstract the water they need with a pump. For completeness, it is important to estimate the amount of water that is abstracted by households. Typically this amount is small compared to the water abstracted by water utilities and may be omitted. The amount of water used by households varies depending on the socioeconomic level of the household, the climate, and the accessibility of water. Example of household water use

114
The average amount of water received in households (IRWS data item G.1) from water utilities is: In Great Britain 136 L/person/day. Source: 2005-2006 Ofwat report. In Peru 139 L/person/day. Source: SUNASS 2012, from 50 service providers (serving 60% of pop.) In Spain 144 L/person/day. Source: INE 2010 based on survey to water utilities. In Norway 199 L/person/day. Source: Statistics Norway 2013 (data of year 2012) In New York 473 L/person/day. Source: calculated from New York City Water Board Bluebook, 2012 d) Industries connected to the water supply network Water utilities supply water to most of the industries located within the reach of the drinking water supply network. Usually between 10% to 30% of the water supplied through the drinking water supply network is for all the different types of industries connected, such as, hotels, restaurants, retail stores, financial institutions, manufacturing industries, and government service offices. See below a more detailed description of water use in industries. e) “Water consumption,” losses and returns Practically all the water abstracted by economic activities is returned to the environment (the accumulation is negligible) and reincorporated to the water cycle. The water abstracted is first returned to the environment in the form of losses. Some of the losses go to the atmosphere and become vapor, others return to inland water resources. The water that reaches the economic activities for which it was intended is then evaporated, transpired in the processes, and a portion is incorporated in the products. The remaining water is then discharged to the sewers (data item F.3.1) or returned to the environment (data item H). A more detailed discussion about this can be found in the next section of the chapter. In most water-distribution systems, a large percentage of the water is lost in transit from the abstraction point to the point of final use. The losses (data item I.1) measured as unaccounted for water (UFW) or non-revenue water (NRW) is typically 20-30 percent of the abstraction. Some systems, especially older ones, may lose as much as 50 percent. Water loss can be attributed to several causes, including leakage, metering errors, public usage such as fire-fighting and pipe flushing, and theft. Leakage is usually the major cause. (Adapted from IRC Paper) UFW or NRW can be estimated by calculating the difference between the amount of water abstracted by the water utility (plus the water received from bulk water suppliers) and the amount of water billed to the consumers. Agriculture, forestry, and fishing Abstractions of water by agriculture, forestry and fishing include the water abstracted for irrigation of crops (the largest portion), water abstracted for raising livestock, and water abstracted for aquaculture. Some countries may also estimate the amount of water that is taken up by the roots of the plants and trees that form forests. Note that irrigation of golf courses is classified separately under the operation of sport facilities (ISIC 9311). Determining the amount of water abstracted by agriculture, forestry and fishing is usually very difficult. Several methods can be used to estimate the amount of water abstracted, but none of them may prove accurate enough. It is suggested that several methods are used in order to provide different references that can increase the reliability of the estimates. When available, registries of water rights or water permits should be used. They provide a first approximation and depending on the maturity of the water rights system, they may provide comparable statistics. Data from

115
agricultural censuses and surveys should also be used to provide additional elements for the calculation of the abstractions. The following paragraphs provide guidelines for each of the four cases mentioned above (irrigation, livestock, aquaculture, and forests): a). Irrigation Crops require water for the photosynthesis, a process that allows plants to transform the solar energy into the chemical energy (glucose) they need to live and thrive. Water is taken up by the roots of the plants from the soil in the root zone and then transported to the leaves and transpired through the leaves of the plants. If enough water is available in the soil then the crops will be able to grow healthy. To ensure the healthy growth of the crops (more production), soil water, which comes from precipitation is often complemented with irrigation, a technique in which water is abstracted from surface or groundwater sources and is transported up to the root zone, so that it can be used by the crops. The amount of water needed by crops is calculated by estimating the crop evapotranspiration (not to be confused with evapotranspiration in the water cycle, which is data item C.1), which is the amount of water that is evaporated from the soil where the crops grow plus the amount of water that is transpired by the crops. If there is no irrigation (rainfed agriculture) then all the abstraction of water by the crops is considered to be soil water abstraction (E.1.3) and can be estimated as the crop evapotranspiration, even though in some cases the crops may not be getting the total amount of water that they would need to grow healthy. The amount of soil water abstraction (E.1.3) is also known as the “green water” that is used by the crops. If irrigation is used to complement precipitation falling on the fields, then it is assumed that the amount of precipitation is not enough to cover the total amount needed by the crops. It means that the crop evapotranspiration is larger than the rain effectively being available to be used by the crops. Therefore the amount of surface water (E.1.1) and groundwater (E.1.2) abstracted (also known as “blue water”) for irrigation can be estimated as the complement of the crop evapotranspiration not covered by precipitation, plus the additional water abstracted due to losses in conveying water from the sources to the fields. To estimate crop evapotranspiration many factors have to be considered, such as solar radiation, air temperature, relative humidity, and wind speed. The soil texture, structure, density, and chemistry are also important factors. Also the plant type, root depth and foliar density, height, and stage of growth. Crop evapotranspiration can be measured using lysimeters, but it is expensive and time consuming. Instead empirical formulas are often used. The formulas combine the different factors mentioned above. For simplicity, it is common practice to use a reference crop evapotranspiration based on standard grass, for which biophysical characteristics are well studied, and a crop coefficient to convert the reference crop evapotranspiration to the actual crop evapotranspiration for a specific crop. Example of Crop Evapotranspiration or Crop Water Requirement The table below shows the reference evapotranspiration for the San Joaquin Valley in California. It shows the number of cubic millimeters that evaporate each month per square millimeter of standard grass (mm/month).
Month Jan Feb Mar Apr May Jun Jul Aug Sep Oct Nov Dec
Reference evapotranspiration, ETo (mm/month)
31 57 94 130 173 198 220 197 145 102 53 31

116
For corn the crop coefficients are kc1 = 0.19, kc2 = 1.06, and kc3 = 0.55, which convert the reference daily evapotranspiration (ETo) into the specific evapotranspiration (ETc) for corn. The graph below shows the specific daily evapotranspiration of corn for the 137 days it takes from planting to the end of season in mm/day (May to September).
The total crop evapotranspiration (ETc) for the cycle is 638 mm. If the precipitation effectively provided 250 mm of water during the season, then an additional 388 mm of water have to be provided from surface and groundwater sources. One hectare of corn requires: 10 000 m2 x 0.388 m = 3 880 m3 of water to complement natural precipitation. If there is double cropping (two planting and harvesting seasons) then the water requirements for the second cycle have to be added. Crops that do not receive irrigation (known as rainfed crops or dryland agriculture) satisfy their needs using the moisture of the soil or “green water.” This might be enough in some regions where precipitation provides enough water at the right time of the crop growth. Irrigation complements “green water” with water that is abstracted from inland water resources and then transported to the roots of the plants (“blue water”) to complement the naturally available water. Depending on the proportion of green and blue water, irrigation might be called full or supplementary irrigation. b). Livestock The water requirements for livestock can be estimated with the population of livestock and the water requirements for each type of livestock in the climate where the livestock is. It is then necessary to estimate what proportion of the water requirement is provided by naturally occurring water and what proportion is provided by man-made works. c) Water suppliers for irrigators Water suppliers for irrigators belong to the same ISIC class as water utilities (industry class 3600 of the International Standard Industrial Classification of All Economic Activities [ISIC]). They include irrigation associations in charge of supplying water to farmers and other types of arrangements. Even though they are in the same ISIC class as water utilities, they should be kept separated. Since this usually involves large irrigation projects, good estimates of the amount of water abstracted should be available from the supplier (e.g. irrigation district, user association, etc.) d). “Water consumption,” losses and returns agriculture In agriculture a large amount of water is usually lost between the point of abstraction and the point of irrigation. Losses can be in the order of 40% of the water abstracted, or even more. The primary variables associated with losses in conveyance of water to farms are (from USGS guidelines):
(1) water source (groundwater or surface water),
0.0
2.0
4.0
6.0
8.0
1 8
15
22
29
36
43
50
57
64
71
78
85
92
99
106
113
120
127
134

117
(2) condition of irrigation canals/ditches/pipes, (3) distance transported, and (4) climatic conditions.
Water abstracted from sources near fields often does not have as much loss when compared to water that is transported over long distances. It is not uncommon for groundwater-irrigation wells to be within a relatively close distance to the field that is being irrigated. Irrigation water can be diverted adjacent to the field and can be transported under a pressurized-pipe system or directly into the irrigation system, which tends to have lower losses due to the more efficient transport systems. In areas where the irrigation water is diverted adjacent to the field, losses may be considered negligible and the majority of losses are considered to be occurring because of the irrigation-system efficiency. Losses can be estimated based on areas with similar regional characteristics that have known losses. Industrial water (excluding agriculture and cooling or thermoelectric plants) This group consolidates a wide range of economic activities ranging from financial institutions, construction sites, retail stores, and manufacturing industries. Some of the establishments that belong to this group are located in urban areas and are connected to the water supply network, receiving their water from water utilities. a) Service industries Retail stores, hotels, restaurants, financial institutions, government offices, and others are usually connected to the drinking water supply network and do not abstract their own water. The amount of water they use is the amount of water they receive from the water supply network (data item G.1). The data about the amount of water used can be obtained from water utilities, even though the level of disaggregation may not be desirable, and the classification according to ISIC may be difficult. Some hotels located outside of the cities and/or close to the coast, may have their own boreholes or wells, or they may even have their own desalination plant and abstract water from the sea (data item E.3). b) Manufacturing industries Manufacturing industries may be connected to the drinking water supply network or have their own well or borehole to abstract water for their needs, especially those industries located out of the cities. Therefore, the water they use is the sum of the water received from the water supply network (data item G.1) and the water they abstract themselves (data item E.1) c) Mining and quarrying This includes the abstraction of water used in the extraction of minerals that might be in the form of solids, such as coal, iron, sand, and gravel; liquids, such as crude petroleum; and gases, such as natural gas. It includes quarrying, milling, re-injecting abstracted water for secondary oil recovery, and other operations associated with mining activities.

118
Cooling in thermoelectric plants (ISIC 3510-1) More than 70% of the electricity in the world is produced in thermal power plants (thermoelectric plants), which include plants that use as fuel nuclear reactions, natural gas, oil, and coal, among others. In these plants heat is transformed into mechanical energy. Thermal power plants can be classified by the type of fuel they use or by the type of moving fluid used (steam turbine, gas turbine, combined cycle...). To estimate water abstractions the type of fuel is more relevant than the type of moving fluid used. Water is used in different cycles of the energy producing process. The most relevant in terms of water use is the cycle to remove heat (i.e. cooling) from the steam moving the turbines. Abstractions for cooling of thermoelectric plants represents more than 50% of national water off-stream abstractions in several European countries (Eurostat 2010). In the US this abstraction represented 49% of the total off-stream abstractions in 2005, and about 28% of these abstractions were saline surface water. There are two general types of cooling technologies: the open loop cooling system, also known as “once-through” cooling; and the closed loop cooling system, also known as “recirculation.” Open-loop cooling systems (“once-through”) require the largest amount of water abstraction because water is not recirculated. Water is abstracted, circulated through the heat exchangers, and then returned to a water body. This technology is common in older facilities. Closed-loop cooling systems (“recirculation”) use cooling ponds and cooling towers to recirculate water within the system, thus reducing the overall water abstraction requirements. Abstractions of water to replace cooling water lost to evaporation, blowdown, drift, and leakage are considered “makeup” water. A cooling pond is a shallow reservoir with a large surface area to remove heat from circulation water. A cooling tower is a structure designed to remove heat from water. The FAO Aquastat, based on estimates by the Electric Power Research Institute, suggests the following approximate coefficients: Cooling System Type of fuel Abstraction of water
(m3/MWh) Evaporation or “water
consumption” (m3/MWh)
Open-loop (“once-through”) Nuclear 95 – 230 1.5 Open-loop (“once-through”) Fossil, biomass, waste 76 – 190 1 Closed-loop (“recirculation”) Nuclear 3 – 4 3 Closed-loop (“recirculation”) Fossil, biomass, waste 2 – 2.3 2 As can be seen in the table above, the type of cooling system is the most significant factor that determines the amount of water abstracted for thermoelectric plants. Open-loop systems abstract an average amount of water that is in the range of 100 m3/MWh, while closed-loop systems abstract an average amount in the range of 2 or 3 m3/MWh. On the other hand, water consumption is within the same range for all types of cooling systems. The water used for cooling may be freshwater, saline water, or even reused water. The water could be abstracted from surface water sources (E.1.1) or from the sea (E.3.). It is rarely abstracted from groundwater sources due to the large volumes required. Sometimes water is supplied by other economic units, e.g. treated wastewater supplied by a wastewater utility. In order to better control the quality of data related to thermoelectricity, it is useful to have the following:

119
• An inventory of thermoelectric plants, including nucleoelectric plants, carboelectric, gas, etc. • The electric production capacity of each plant (this is measured in power units, typically Mega Watts
[MW]), and the actual amount of electricity generated each year (this is measured in energy units, typically Mega Watts-Hour [MWh], or in the international units Joules [J]).
• The type of water they use: freshwater, saline water, or sea water. Hydroelectricity (ISIC 3510-2) Hydroelectric plants use the force of gravity moving water to produce electricity. Water is passed through a turbine that moves a generator that produces electricity. The water used is immediately returned to the water body from which it was abstracted and therefore this use is considered an in-stream use. There are basically two types of hydropower plants:
• Conventional plants, with medium to large drops (could be up to hundreds of meters of height differential), usually requiring a dam for the storage of large quantities of water.
• Run-of-the-river power plants, which do not require the storage of water. They are small or micro hydro power plants with a difference in the level of water of fewer than 10 meters (sometimes even less than 3 meters). They only use the amount of water naturally flowing through a river or stream. They are located in rivers with large continuous flows of water throughout the year.
Roughly about 19% of the electricity generated in the world is hydroelectric. The amount of water that passes through hydroelectric turbines to produce electricity in the world (sometimes the same water is turbinated several times) is roughly four times larger than the amount of water abstracted for off-stream uses. However, this water is traditionally reported separate from the other uses, since all the water abstracted is immediately returned to the water course from which it was abstracted with minimum changes in physical properties. Also, the same water may be used several times in a river and therefore the aggregated amount of water turbinated may be much higher than the amount of water flowing through the river. In order to better control the quality of data related to hydroelectricity, it is useful to have the following:
• An inventory of hydroelectric plants. • The electric production capacity of each plant (this is measured in power units, typically Mega Watts
[MW]), and the actual amount of electricity generated each year (this is measured in energy units, typically Mega Watts-Hour [MWh] or in the international units Joules [J]).
According to simple physical principles, the energy produced in a hydroelectric plant is directly proportional to the volume (V) of water turbinated and the difference in elevation of the water before and after passing through the turbine (H). The proportionality is given by the density of water and the efficiency of the plant. Therefore, if the amount of energy produced is known, as well as the difference in elevation, the volume of water turbinated may be estimated. For example, a hydroelectric plant that uses a difference of elevation of 30 meters, and turbinates 100 m3/s of water, with an efficiency of 80%, has a power capacity of (30m)(100m3/s)(80%)(1000 kg/m3)(9.81m/s2)= 23 544 000 Watts = 23.544 MW. (Note that 9.81 m/s2 is the acceleration of gravity, and 1000 kg/m3 is the density of water at 20 centigrades). This means that if the plant operates all year round, it can generate (23.544 MW)(365 days)(24 hours/day) = 206 245 MW-h

120
Operation of waterway locks (ISIC 5222) Large amounts of water are used to raise and lower the level of the boats in waterways when passing through dams or when there is a need to go through waterways that are at different elevations. Water is returned to the water body immediately after use in the locks and therefore is considered an instream water use, which is recorded as an abstraction according to the IRWS. Example: Water Used for Locks in the Panama Canal In the Panama Canal ships are raised from the sea level to lake Gatun located about 26 meters above sea level using 3 locks. Then the ships are lowered using other 3 locks to be returned to the sea level on the other side of the continent. Each lock requires about 88 000 m3 of freshwater to fill, but water from some locks is reused in the lock downstream. It is estimated that every year about 3 400 million m3 of freshwater19 are abstracted from lake Gatun and lake Miraflores, according to the SEEA-Water criteria, for the operation of the Panama Canal locks to move about 12 500 ships. Integrating data into the accounts Diagrams, such as the ones shown in figures 3.3.1 and 3.3.2, are easy to understand, but when more elements are added they become too complex and difficult to read. Also, diagrams cannot be easily entered in a computer. For the reasons mentioned above, tables are used instead of diagrams. The tables used are coherent with the supply and use tables used for the System of National Accounts, and allow for the calculation of indicators that combine physical and monetary information. The supply and use tables are recorded considering that data is collected from each economic unit or household (the boxes in the diagrams above) and that the connections between them are unknown. The basic structure of the supply and use tables of the SEEA is shown below. A complete explanation can be found in chapter 2.
Table 3.3.1. Simplified Physical Supply Table
19 According to SEEA-Water the water used to fill the locks is an abstraction, if the water flows directly from Inland Water Resources. In the case of the Atlantic Ocean side 88 000 m3 of water are enough to fill the three locks, while in the case of the Pacific Ocean side about 97 000 m3 are needed to fill the first lock, then water is discharged into the Miraflores lake, and abstracted again to fill the other two locks that drain directly to the Pacific Ocean.
SUPPLY
Industries
(except water
supply and
sewerage)
Water supply
ISIC 3600
Sewerage ISIC
3700Households
Environment
to EconomySUM
Product Natural water (CPC 18000) F.1 F.1
Natural inputs Inland water resources E.1 (1+2) E.1
Residuals Losses of water I.1 I.1
Residuals Sewage F.3.1 (1) F.3.1 (2) F.3.1
Residuals Treated wastewater H.1(4) + H.2(4) H.1(U)+H.2(U)
Residuals Water returns H.1(1) + H.2(1) H.1(2) + H.2(2) H.1(3) + H.2(3) H.1(T)+H.2(T)
Residuals Final Water Use WatCons(1) WatCons(2) WatCons

121
The rows in the supply table show the water that is flowing out of each of the industries indicated in the columns, as indicated by the arrows.
Table 3.3.2. Simplified Physical Use Table
In a similar fashion, the rows in the use table show the water that is flowing into each of the industries indicated in the columns, as illustrated by the arrows. Only some flows are shown in the tables above for illustration purposes. More details are usually added by breaking down the column of industries into several columns showing the different groups of industries, using the ISIC classification.
USE
Industries
(except water
supply and
sewerage)
Water supply
ISIC 3600
Sewerage ISIC
3700Households
Economy to
EnvironmentSUM
Product Natural water (CPC 18000) G.1(1) G.1(2) G.1
Natural inputs Inland water resources E.1 (1) E.1 (2) E.1
Residuals Losses of water I.1 I.1
Residuals Sewage G.3.1 G.3.1
Residuals Treated wastewater H.1(U) + H.2(U) H.1(U)+H.2(U)
Residuals Water returns H.1(T) + H.2(T) H.1(T)+H.2(T)
Residuals Final Water Use WatCons WatCons

122
BIBLIOGRAPHY: Website of the California Irrigation Management Information System (CIMIS).- http://wwwcimis.water.ca.gov/cimis FAO Aquastat (Amit Kohli and Karen Frenken).- Cooling water for energy generation and its impact on national-level water statistics.- April 2011. FAO.- Crop evapotranspiration.- Guidelines for computing water requirements.- Irrigation and drainage paper 56.- 1998. US Geological Survey.- Estimated Use of Water in the United States in 2005. Circular 1344. 2009 US Geological Survey.- Guidelines for Preparation of State Water-Use Estimates for 2005. Techniques and Methods Book 4, Chapter E1. 2007 US Geological Survey.-Documentation of Methods and Inventory of Irrigation Data Collected for the 2000 and 2005 U.S. Geological Survey Estimated Use of Water in the United States, Comparison of USGS-Compiled Irrigation Data to Other Sources, and Recommendations for Future Compilations. Scientific Investigations Report 2011–5166 Hunaidi, Osama.- National Research Council of Canada.- Detecting Leaks in Water-Distribution Pipes.-October 2000. The World Bank.- Water, Electricity, and the Poor: who benefits from utility subsidies? 2005. Grigg, Neil S.- Water Resources Management (Principles, Regulations, and Cases).-1996

123
.IV. Physical data items related with emissions
In the previous section of this chapter the data items related to the abstraction and supply of water to the different economic units and households were covered. This section covers all the data items related with water leaving the economic units after use. It also covers the data items related to the incorporation of pollutants to the returned water. Economic units use water for their different activities and then discharge it directly to the environment or to a sewer network. The activities that use water often add pollutants to the water they return. In some cases water is not returned to the environment or discharged to the sewer network but reused in the economy. Water policy makers require information to understand the impacts of the water returned to the environment and the pollutants added. They also require information about how water is reused in the economy reducing the amount of water that needs to be abstracted directly from the environment. Wastewater Wastewater by type of water users discharging The same economic units that were mentioned in the previous section as users of water, discharge “wastewater” after using the water they abstracted or received from other economic units. For the purposes of accounts and statistics, “wastewater” is defined as all the water that is discarded that is no longer required by the owner or user. A brief discussion for each type of user follows: Households return about 80% of the water they abstract or receive to the environment, to a sewer network or to another sanitation facility (septic tank, latrine, etc.). Households located in densely populated areas usually discharge all their wastewater to the sewer network and it is possible to estimate the volume of wastewater generated based on the data of the volume of water supplied to households by water utilities20 and the percentage of water that is consumed. Households located in areas of low population densities (rural areas) may discharge their wastewater to the sewer network or they may discharge it in septic tanks or drains that discharge the water to a river, to a lake or simply to a land area. In order to estimate the amount of water discharged by households to sewers and to the environment it is important to collect information from population censuses and household surveys about the proportion of people that discharge wastewater to the different sanitation facilities: sewers, septic tanks, latrines, or open defecation (see section on water-related social-demographic data items). Industries connected to the sewer network discharge the water that is not consumed in their processes to the sewer network. Some economic units, especially those with polluting processes, may be required to perform some type of treatment of the wastewater before discharging it to the sewer network. Other economic units, especially service industries and financial institutions, may discharge their wastewaters the same way as households. The volume of wastewater discharged is a percentage (in the order of 80% to 90%) of the volume of water used. Sewerage industries collect wastewaters from households and industries and treat them in wastewater treatment plants (WWTP) before returning the treated wastewater to water bodies or land. In many cases a WWTP is not available and the wastewaters are returned to the environment without treatment. Sewerage industries also collect
20 In this document the term water utility is used to refer to drinking water supply companies, which may be public or private.

124
storm water (rainwater that runs off in urban areas and is collected in the sewer networks or a separate drainage network). In some areas there is a separate system for the collection of storm water, so that sewage and rainwater are not mixed, otherwise, a mixture of sewage and rainwater is sent to WWTPs or to the environment. The problem with mixing sewage and rainwater is that the volume of rainwater may be very large (often in short periods of time), exceeding the capacity of the WWTPs. Industries not connected to the sewer network return their wastewater to a water body or to land. Regulations may impose specific requirements for discharging wastewaters and the industries may have to operate their own wastewater treatment plant (WWTP). Agriculture returns a portion (roughly between 20% and 40%) of the water used to water bodies or to land (then it infiltrates to the aquifers). The return of water does not occur in a single location, as in the cases mentioned above, but in a diffuse way. For this reason the waterborne pollution in returns of water from agriculture are considered non-point sources of pollution (see below non-point sources of pollution). The SEEA-CF classifies the discharges of water from agriculture as wastewater. However, for water resources management, the returns of water from agriculture are not considered wastewaters. Thermoelectric plants use water for cooling. A small portion (between 1% and 5%) of the water used is evaporated and the rest is returned to water bodies. Sewerage industries typically do not collect the wastewater from thermoelectric plants. The SEEA-CF classifies the returns of water from thermoelectric plants as wastewater. However, for water resources management, the returns of water from thermoelectric plants are not typically considered wastewaters. Hydroelectric plants return all the water used to water bodies. The SEEA-CF classifies the returns of water from hydroelectric plants as wastewater. However, for water resources management, the returns of water from hydroelectric plants are not typically considered as “wastewater.” Data collection The data described below is useful for the compilation of water accounts and statistics. The experts in the National Statistics Office should work in close collaboration with the experts in the Ministry of Environment, the Ministry of Water and/or the National Water Authority to compile or estimate the data required. The following are common sources of data:
• Water and/or sewage utilities, companies, associations or regulators. • Departments in charge of controlling polluting discharges (they may issue permits and develop
inventories of polluting discharges). • Research institutions which may have specific industry indices or coefficients useful for estimating water
consumption. Data collection of wastewater should be done in conjunction with data collection of emissions, since the two topics are closely related. Households
• Number of households and number of inhabitants per household from population censuses, household surveys and population projections. Water utilities have the number of water supply connections, which is useful to estimate the population receiving water from the water utility. It is also necessary to have data on the number of households connected to sanitation facilities different to sewers (see section on water-related social-demographic data items).

125
• Data from water utilities on the amount of water supplied to households (IRWS data item F.1). This should be based on the readings of meters in households.
• Estimate of the proportion of water used that is consumed by households. Typically about 20% of the water used is not returned or discharged (water consumption), but if possible a more specific number should be used. This proportion is not typically measured, but the result of specific research or estimates.
• Data from the sewer industry about the wastewater collected, usually measured at WWTPs is useful to estimate the amount of wastewater discharged to the sewers by households.
Industries connected to the sewer network
• Data from water utilities on the amount of water supplied to industries (IRWS data item F.1). This should be based in the readings of meters in industries. If possible the data should be disaggregated by type of industry. It should be grouped according to ISIC or other equivalent classification.
• Data from the sewer industry about the number and types of industries connected to the sewer network. • Data from the sewer industry about the amount of wastewater collected, usually measured at WWTPs is
useful to estimate the amount of wastewater discharged to the sewers by households. Sewer industries
• Inventory of WWTPs with flows of operation and type of treatment (primary, secondary, tertiary) and technology (activated sludge, biodisks, etc.)
• Data from the sewerage industry about the number and types of establishments connected to the sewer network, and estimates of the volume of wastewater collected.
• Data from the sewerage industry about the number of households connected to sewer network, and estimates of the volume of wastewater collected.
Industries not connected to the sewer network
• Inventory of discharges from the ministry of environment or water authority. The inventory can provide data about the location of the discharges and the volume of water discharged (IRWS data item H, and possibly H.1, H.2 and H.3).
Agriculture
• The data used to estimate the abstractions of water in agriculture and consumption coefficients described in the previous section can be used to estimate the returns of water.
Thermoelectric plants
• Inventory of thermoelectric plants from the ministry of energy or electric companies. The inventory can provide data about the location of each thermoelectric plant, the amount of energy generated, the type of plant, the type of cooling system and the volume of water used.
Hydroelectric plants
• Inventory of hydroelectric plants from the ministry of energy or electric companies. The inventory can provide data about the location of each hydroelectric plant, the amount of energy generated, and the volume of water used.
Data in the accounts The data collected is compiled in the supply and use tables as shown below. The column “Other industries” should be subdivided according to the specific purpose of the accounts.

126
A complete example is included in the guidelines.
Table 3.4.1 Physical Supply Table (in million cubic metres per year)
Water supply industry
Sewerage industry
Other industries Households Flows from the environment
Natural Inputs (from Inland Water Resources)
Wastewater and reused water
F.3 F.3
Return flows of water
H H H
Evaporation, transpiration and incorporation into products
Table 3.4.2 Physical Use Table (in million cubic metres per year) Water supply
industry Sewerage industry
Other industries Households Flows to the environment
Natural Inputs (from Inland Water Resources)
Wastewater and reused water
G.3
Return flows of water
H
Evaporation, transpiration and incorporation into products
The tables facilitate the verification of the consistency of data. The sum of the rows in the supply table has to be the same as the sum of the rows in the use table. The sum of columns should also be the same in the supply and in the use tables; however, data from the other sections is required to complete the columns.

127
Waterborne polluting releases Pollutants and measuring tests Returns of water to the environment usually include pollutants added by the economic units as a result of their production processes or consumption patterns, which affect the receiving water bodies (or land) in various ways. In order to compile water accounts and statistics a list of pollutants has to be defined according to the specific needs of each country, including national and international legislation. The variety of pollutants that can be found in wastewaters is as wide as the number of elements and compounds existing in the planet. Different countries and organizations may group the pollutants differently according to their specific needs. Emission statistics and accounts are based on the results of tests or analyses (e.g. BOD, COD, TSS) done to wastewater samples. These tests are used to quantify the different types of pollutants that cause pollution problems in water. It is important to clearly distinguish these three elements. A brief description of each of the three elements is presented below.
1. Pollution problems. The discharge of pollutants to water may have an impact on public health, on the aquatic life and also on some economic activities, which may incur in additional costs for treating the polluted water before using it. Many diseases in humans are transmitted by the ingestion of water contaminated with pathogens. Fish require oxygen in water to live and thrive, but organic matter discharged in water causes the proliferation of micro-organisms that consume the oxygen present in water. Aquatic weeds and algae may increase in an uncontrolled way due to an excess of nutrients (mainly nitrates and phosphates) present in water. Even treated wastewater may contain small quantities of pollutants that are harmful for aquatic life and humans, such as some metals, pesticides and pharmaceutical products.
2. Pollutants. Polluting discharges include pathogens, which cause diseases in humans when ingested. They
also include organic matter, which is food for microorganisms that reproduce and deplete the oxygen needed by fish. Phosphates and nitrogen contained in fertilizers are nutrients that cause the proliferation of aquatic weeds and algae, which may affect other forms of aquatic life and cause problems for navigation.
3. Parameters (Based on different laboratory tests). There is a wide variety of chemical and biological tests used to detect and quantify the different types of waterborne pollutants in wastewaters, and also in water bodies. Some tests are fairly inexpensive and easy to perform and other tests are expensive and difficult to perform correctly. The choice of the tests in each country depends on the type of pollution problems that affect the country, the pollutants present in water, the way in which the information will be analyzed and presented, as well as the availability of data.
The following table summarizes the main pollution problems with the pollutants that cause them and the tests to measure them.

128
Relevance for Water Policies
Pollutants Parameters (Based on Laboratory Tests) Main issues
Transmission of diseases through water
Pathogenic viruses, bacteria, protozoa, and parasitic worms (helminthes) from excreta of people with diseases.
• Fecal coliforms • E. coli • Enterococci
• Relevant in countries with low access to improved sanitation and improved water sources.
• Important in water bodies where people swim.
• Data refers to specific locations and is not suitable for aggregation in accounts.
• This pollution is easily removed by disinfection in WWTPs.
Reduction of dissolved oxygen in water.
Organic Matter • Biochemical oxygen demand (BOD)
• Chemical oxygen demand (COD)
• Total organic carbon (TOC)
• The most widespread type of pollution. Commonly referred as conventional or classic pollution.
• Most of it is removed by conventional WWTPs with secondary treatment.
• May be less relevant in countries with high levels of wastewater treatment.
Proliferation of aquatic weed and algae (eutrophication)
Nutrients • Total Nitrogen (TN) • Total Phosphorus (TP) • Total Kjehldahl
Nitrogen (TKN)
• Conventional WWTPs do not remove most of the nutrients. A tertiary treatment is necessary.
• Important if the water goes to lakes or other water bodies with slow moving water.
• Fertilizers used in agriculture are an important source of nutrients and they are difficult to control because they are non-point sources of pollution.
Poisoning of aquatic life and humans
Toxic substances that often accumulate through the food chain (E.g. metals, persistent organic pollutants, and cyanides). Also known as micro-pollutants.
• Tests to detect the presence of metals (e.g. Arsenic, Cadmium, Chromium)
• Tests to detect persistent organic pollutants (POPs), such as PCBs.
• Tests to detect cyanides.
• These pollutants are not removed in conventional WWTPs. Special tertiary treatment techniques are needed.
• The tests are often expensive and there is no widespread use.
• This category includes metals, persistent organic pollutants (e.g. pesticides and pharmaceutical substances)
• Since they are usually present in small quantities, may not be suitable for aggregation in accounts.
Other
Substances that change the physical properties of water.
• Total Solids (TS) • Total suspended solids
(TSS)
• The determination of solids in wastewater is a simple and inexpensive way of quantifying the

129
Relevance for Water Policies
Pollutants Parameters (Based on Laboratory Tests) Main issues
It includes a wide variety of properties that may reveal the presence of pollutants.
• Temperature • Conductivity • Acidity (pH) • Color
overall amount of pollution, when information from more specific tests is not available.
• Temperature is useful for quantifying the amount of heat discharged to water, especially from cooling processes.
• Conductivity reflects the presence of salts.
• Acidity and color reveal the presence of other pollutants, mainly from manufacturing processes.
The choice of the tests used to measure the pollution or to refer the statistics will depend on the pollution problems that are considered relevant for the accounts and statistics to be performed, as well as the potential availability of data. Economies at early stages of development will usually put more emphasis on “conventional” or “classic” pollutants, such as organic matter. In more advanced economies with ample wastewater treatment capacity, nutrients or poisonous substances may be more policy relevant. In any case, it is recommended to start the data collection and compilation of statistics and accounts with quantities referring to classic tests, such as BOD, COD, TSS, TN and TP, which are more widely available and easier to incorporate in the accounting format. Other variables can be incorporated later. A discussion of the main issues to consider for each type of pollutant and tests to measure them is presented below. a). Pathogens Pathogenic viruses, bacteria, protozoa and helminths can be present in sewage and if not properly managed can affect people. The following are examples of pathogens that could be found in water:
• Viruses of hepatitis and polyomielitis. • Bacteria vibrio cholera and salmonella. • Protozoa Cryptosporidium parvum and the Giardia lamblia. • Helminths (parasitic worms) Taenia solium and Heterobilharzia americanum.
Pathogens are difficult to monitor directly. Instead, indicator micro-organisms have been used to suggest their presence. Commonly used indicator bacteria are fecal coliforms, Escherichia coli (E. coli) and enterococci, which are not pathogens. Pathogens are easily removed by disinfection in WWTPs. The data about pathogens can be reported in specific points, such as in places used for swimming, but it is not suitable for aggregation in emission accounts. Also, depending on the characteristics of the water bodies, pathogens may die quickly or survive longer, therefore their effect is highly variable and not suitable of aggregation throughout large areas. b). Organic matter

130
Organic matter is the most common type of pollution of water bodies, since it is discharged by households and different industries. It is the main pollutant present in sewage, which contains excreta collected from households. Organic matter is food for many microorganisms that live in water. By processing their food, these microorganisms consume the dissolved oxygen in the water that contains them. The reduction of dissolved oxygen in water bodies affects the health of fish and other aquatic life. Organic matter is usually not a problem in small quantities, since it can be eliminated by the microorganisms naturally living in water bodies. There are different tests used to estimate the amount of organic matter in a wastewater sample. The Biochemical Oxygen Demand (BOD) and the Chemical Oxygen Demand (COD) are two of the most commonly used tests:
• BOD provides an indication of the amount of waterborne biodegradable organic matter present in wastewater. It “simulates” the oxidation process in the aquatic environment. It is expressed as the amount of oxygen (mg/L)21 needed for biochemical conversion of the organic matter. It is only an indicator of the biodegradable organic matter that can be digested by aerobic micro-organisms. The test is relatively easy to perform, but it takes a minimum of five days to complete and if not performed correctly may easily provide erroneous results. BOD5 is measured for a five-day period, while BOD7 is measured for a seven-day period. BOD5 is most commonly used around the world.
• COD provides an indication of the total amount of waterborne organic matter in wastewater, biodegradable and non-biodegradable. Since it includes non-biodegradable matter it is usually larger than BOD. It is expressed as the amount of oxygen (mg/L) needed for full chemical conversion of the organic matter. The test is faster that BOD, since it only takes about two hours to perform, compared with several days for BOD. The COD test was developed as an alternative to the lengthier BOD test. COD also measures a different set of substances, including those that will not or not easily degrade in the aquatic environment.
BOD and COD are regularly measured by WWTP operators, since they are instrumental for the operation of the plants. Other tests have been developed to measure organic matter, such as the Total Organic Carbon (TOC), which is usually more expensive and requires specialized equipment. The measurements are done for samples of wastewater and are expressed as concentrations (e.g. mg/L). In order to be able to aggregate the data it is necessary to convert the concentrations into loads, which are expressed in mass units (e.g. kg or tons). To do this it is necessary to measure or estimate the corresponding amount of wastewater for which the concentrations were measured, as it will be explained and exemplified below. WWTPs usually eliminate more than 80% of the organic matter present in wastewaters. c). Nutrients Phosphorus and nitrogen are essential nutrients for the plants and animals that make up the aquatic food web. However, if they are present in excess, they cause dramatic increases in aquatic plant growth and changes in the types of plants, causing eutrophication. Phosphorus is less abundant in undisturbed water bodies, therefore even small increases in phosphorus can have a significant impact. Phosphorus and nitrogen are present in discharges from WWTPs, runoff from fertilized lawns and cropland, failing septic systems, runoff from animal manure storage areas. The amount of nutrients present in wastewater is typically measured by:
21 Milligram per liter (mg/L) is equivalent to 0.001 g of substance in one liter of water. Equivalent to 1 part per million (ppm).

131
• Total nitrogen (TN) provides a measure of the amount of nitrogen present in wastewater in different nitrogen compounds. TN includes organic nitrogen, ammonia, nitrates and nitrites, which are measured using different tests. Each of these forms of nitrogen is biologically convertible to one of the other forms. The measurements are typically expressed as concentration of nitrogen (mg/L).
• Total phosphorus (TP) provides a measure of the amount of phosphorus present in wastewater including organic and inorganic (mineral) phosphorus. The measurements are typically expresses as concentration of phosphorus (mg/L).
Nitrogen and phosphorus are often measured by the operators of WWTPs. As in the case of organic matter, the measurements done at different locations may be integrated in the accounts by aggregation. In order to be able to aggregate the data it is necessary to convert the concentrations (e.g. mg/L) into loads in mass units (e.g. kg or tons). To do this it is necessary to measure or estimate the corresponding amount of wastewater for which the concentrations were measured, as it will be explained and exemplified below. A large proportion of nutrients are discharged to the environment in the form of non-point sources, making it difficult to measure. Indirect estimation, such as through the sales of fertilizers should be used in addition to the data collected from point sources. WWTPs with only secondary treatment do not remove nutrients. Tertiary treatment processes are necessary to remove residual nitrogen and phosphorus after secondary treatment. d). Poisonous substances The substances included in this category are those that cause harm to living beings in small quantities and usually accumulate in the food chain, which means that the concentration is larger in the predator than in the prey. The main substances included in this category are metals and metalloids, organic chemical pollutants (e.g. from pesticides) and cyanides. These substances are detected with chromatography and spectroscopy techniques.
• Many metals, especially some “heavy metals,” such as lead (Pb), mercury (Hg) and cadmium (Cd) are highly toxic. They are called “heavy metals” because they have a high atomic mass. Some “metalloids,” such as arsenic (As) are also very toxic. Also some “light metals,” such as beryllium (Be) are also toxic. Metals and metalloids are often found in compounds, which are also toxic.
• Persistent organic pollutants (POPs) are chemical substances that persist in the environment, bioaccumulate through the food web, and pose a risk of causing adverse effects to human health and the environment. Many of them are compounds of chlorine (organohalogens), such as polychlorinated biphenyls (PCBs), and some are used as pesticides, such as DDT. They do not decompose easily and can be transported long distances across international boundaries.
• Cyanides are compounds that have carbon and nitrogen, but are considered “inorganic” even though they have carbon. They are toxic substances that result from mining and other industrial processes.
Since relatively small quantities of these pollutants have a great effect, they are also called micro-pollutants. Their effect is usually more localized and their aggregation may not be as meaningful as that of the other pollutants. Nevertheless aggregates can show general emission trends and possible threats due to their widespread use. WWTPs with only secondary treatment do not remove micro-pollutants. Tertiary treatment processes are necessary to remove these pollutants. e). Other pollutants that change the physical properties of water

132
There are other tests and measurements that do not specifically measure any of the pollutants mentioned above, but are useful for the compilation of statistics and accounts, such as Total Suspended Solids (TSS) and temperature:
• Total Suspended Solids (TSS) provides an unspecific measure of the amount of waterborne pollutants in wastewater that can pass a filter. The measurements are typically expressed as concentration (mg/L).
• Temperature is useful to estimate the amount of heat that is discharged in the wastewater. The temperature is typically measured in Celsius or Fahrenheit degrees.
• Conductivity measures the ability of water to pass an electrical current. It is used as an indicator of the presence of salts in water. Salts tend to concentrate in returns from irrigated agricultural fields. It is commonly measured in Siemens per meter.
TSS is regularly measured by WWTP operators, since it is instrumental for the operation of the plants and can be aggregated for emission accounts. Other characteristics such as pH, odor, color and turbidity may also be measured, but may not be easily used for emission accounts. Sources of pollution .a). Point source emissions Point-source emissions have a clearly identifiable outlet: pipes, ditches, channels or tunnels that directly discharge wastewater to a water body (or to land). Non-point source emissions (often from diffuse emissions) do not have a clearly identifiable outlet, such as in agriculture, or the number of outlets is too large to be identified individually, such as in the case of households not connected to sewers. It is relatively easier to control data from point source emissions than from non-point source emissions. Point source emissions can be associated to inventories of discharges to water, which should include WWTPs operated by sewerage utilities or companies and by the different industries. .b). Non-point source emissions Data of emissions from non-point sources can be estimated indirectly from the amount of pesticides and fertilizers used in the case of agriculture. Other estimates can be made for the case of roads, or for human settlements not connected to sewerage networks. .c). Sources of polluting wastewaters The following table shows the main sources of some of the pollutants found in wastewaters
Group of Pollutants
Pollutants Main wastewater sources
Pathogens Pathogenic viruses, bacteria and helmiths.
• Households • Hospitals • Hotels.
Organic Matter Biodegradable • Households. • Agroindustries (food industries).

133
Nutrients Nitrogen • Fertilizers in returns and runoff from agricultural fields.
• Discharges from WWTPs. Phosphorus • Fertilizers in returns and runoff from agricultural
fields. • Discharges from WWTPs. • Detergents in sewage.
Poisonous substances
Metals • Urban runoff. • Steel industry. • Industries using electroplating. • Pesticides, herbicides, defoliants (specially
arsenic). • Industries that use coal (specially lead). • Refrigeration and air conditioning industries
(cadmium). • Leather tanning industry (chromium).
Persistent Organic Pollutants (POPs): PCBs, PBTs, etc.
• Pesticides (e.g. DDT), herbicides. • PCBs are used as coolants and in electric
components. • Pharmaceuticals (from pharmaceutical industries
and from household sewage after consumption). Other Heat • Water used for cooling (E.g. thermoelectric
plants). Color • Leather tanning industry.
Data collection Data collection will depend on the list of pollutants that are considered relevant for the accounts and statistics to be performed. As mentioned above it is recommended to start the compilation of the accounts with measures of pollutants that are more widely available, such as BOD, COD, TSS, TN and TP. The experts in the National Statistics Office should work in close collaboration with the experts in the Ministry of Environment, the Ministry of Water and/or the National Water Authority to compile or estimate the data required. The following are common sources of data:
• Water and/or sewage utilities, companies, associations or regulators. • Departments in charge of controlling polluting discharges (they may issue permits, and develop
inventories of polluting discharges). • Research institutions which may have specific industry indices or coefficients useful for estimating
emissions. a). Point source emissions It is important to first estimate the waterborne pollution in wastewater collected by sewerage from households (IRWS data item J.1). To estimate it the following data is useful:
• number of households connected to sewers, • number of people per household, and • average amount of polluting emissions per person.

134
• population connected to sewers and to other sanitation facilities. The average amount of polluting emissions per person, can be based on measurements from the sewer industry. A population equivalent load is used in many countries to express the pollution in terms of people. EXAMPLES: The Dutch association of drinking water companies (Vewin) estimates that the pollution load per inhabitant, measured according to BOD, COD, TKN, TP and SST is as follows:
Measurement test or indicator
Discharge (Grams/inhabitant/day)
BOD5 50-65
COD 90-150 TKN 14-18 TP 2-4 TSS 45-68
Source: Vewin statistics 2008 In France the population equivalent load is defined as follows:
Measurement test or indicator
Discharge (Grams/inhabitant/day)
BOD5 60
COD 135 TN 9.8 TP 3.5
The amount of TSS, BOD5, COD, TN and TP, among other quantities, collected by the sewer network can be estimated based on the number of people connected to the sewer network and the population equivalent. EXAMPLE: In a country of 50 million inhabitants 85% of the population is connected to the sewer network. The population equivalent daily load is 70 g of TSS, 60g of BOD5 and 130 g of COD. The load expressed as: BOD5 is 50 million x 60 g/day x 365 days = 1.1 tons/year COD 50 million x 130 g/day x 365 days = 2.4 tons/year TSS 50 million x 70 g/day x 365 days = 1.3 tons/year The load collected by sewerage is 85% BOD5 0.9 tons/year COD 2.0 tons/year TSS 1.1 tons/year Data from the WWTPs is very useful to estimate the discharges collected by the sewer system and the emissions discharged to water bodies (data item K.1 in the IRWS). Operators of WWTPs systematically collect data about the wastewater influent (flow entering the WWTP) and the effluent (flow leaving the WWTP). An inventory of

135
WWTPs with the amounts of polluting emissions entering and leaving (influent and effluent) the plants, type of plants and method of treatment is very useful for the development emission statistics and accounts. The operators of WWTPs usually perform frequent tests and may have long records of daily (or even hourly) concentrations of the different indicators. Annual load (mass) values (concentrations multiplied by the corresponding flow) should be used for emission accounts. The operation data from the WWTPs can be compared with the calculations of household emissions to determine industrial pollution collected by the sewer system (IRWS data item J.1). The sewerage utility may also have data about the industries discharging to the network and the amount of pollution discharged. For industries not connected to the sewer network an inventory of discharges from the ministry of environment or water authority may be available. The inventory can provide data about the location of the discharges and the pollutants discharged (IRWS data item K.1). In some countries a chart to estimate the polluting emissions is published (e.g. in France the government publishes a “Tableau des coefficients specifiques de pollution pour l’estimation forfaitaire (TEF),” which is used for the payment of pollution fees). Example of Charts to Estimate Pollution In France, the Water Agencies (“Agences de l’Eau”) collect a fee for the mass of emissions discharged to water by industries and households. The following discharges pay a fee: - Biochemical Oxygen Demand for five days (BOD5) - Chemical Oxygen Demand (COD) - Total suspended solids (TSS) - Acute toxicity measured with Daphnia - Dissolved salts, measured with conductivity tests - Reduced nitrogen (Kjendahl nitrogen) (“azote réduit” NR) - Nitrogen oxide (“azote oxydé” NO, nitrates and nitrites) - Total phosphorous (TP) - Absorbable Organohalogens (AOX) - Toxic metals and metalloids. Calculated 10As+50Cd+Cr + 5Cu+50Hg + 5 Ni + 10 Pb + Zn - Heat The fees have to be paid for each kilogram (or other units of measurement) of emissions discharged to water bodies. The physical and monetary amounts have to be declared to the authorities. If measurement devices are not installed, there is an estimation chart with coefficients for each type of industry (the “Tableau d’Estimation Forfaitaire”). With this information accounts and statistics are integrated. The data on point source emissions can be aggregated and shown in flows between the different economic units as shown below. Example of Pollution flows in France The following diagram was published in the 1990s by the Ministry of Environment of France in preparation of the 1992 water law. The diagram shows the point polluting emissions discharged through sewerage. OM = Organic Matter, and TSS = Total suspended solids. WWTP = Wastewater Treatment Plants. Quantities in million tons per year.

136
The diagram shows that the waterborne emissions to water bodies in France had about 0.859 tons/year (0.583+0.276) of organic matter and 1.096 tons/year of total suspended solids (0.855 + 0.241). Wastewater treatment plants eliminate 41% of the organic matter and 45% of the suspended solids. Households are responsible for 75% of the organic emissions and 88% of the suspended solids. NOTE: organic matter is estimated as the average of COD and BOD. Source: Ministere de l’Environnement .- Pour que l’eau vive: Trois années de concertation et de décisions sur la gestion de l’eau en France.- Paris 1992 Agriculture is a special case of industry that returns large amounts of water. However, the waterborne emissions of these returns are considered non-point sources of pollution (IRWS data item K.2) because they don’t have a specific point of discharge. The main pollutants in agricultural returns are the result of the application of fertilizers and pesticides. Pollution due to fertilizers can be measured based on nitrogen and phosphorus tests. Pollution due to pesticides can fall in the category of Persistent Organic Pollutants (POPs). These pollutants are spread in large areas washed by natural runoff resulting from precipitation or the water applied through irrigation. b). Non-point source emissions Statistics and accounts of waterborne emissions from non-point sources to the environment (data item K.2 in the IRWS) can be estimated based on the guidelines provided above for the case of agriculture and households (in the case they are not connected to the sewer network). Also data of pesticides and fertilizers purchased by farmers (agriculture) can be useful in estimating the emissions.
HOUSEHOLDS INDUSTRIES CONNECTED TO SEWERS
SEWERS
OM = 1.105 TSS = 1.745
OM = 0.364 TSS = 0.248
NATURAL WATER BODIES
WWTP
OM = 0.609 TSS = 0.897
POLLUTION ELIMINATED
OM = 0.885 TSS = 1.139
OM = 0.583 TSS = 0.855
OM = 0.276 TSS = 0.241

137
EXAMPLE: The US Environmental Protection Agency has estimated the amount of fertilizers used in agriculture in the United States. This is closely related to non-point pollution of water bodies.
Data in the accounts The data collected is compiled in the supply and use tables as shown below. The column “Other industries” should be subdivided according to the specific purpose of the accounts. The list of pollution parameters has to be determines according to the list of pollutants identified in the data collection and compilation strategy. A complete example is included in the guidelines.

138
Table 3.4.3 Physical Supply Table for Gross Releases of Substances to Water (in tons per year)
Pollution parameter
Water supply industry
Sewerage industry
Other industries
Households
Flows from the environment
Emissions22 (to the environment) TSS K K K
BOD5 K K K COD K K K
TN K K K TP K K K
Chromium K K K Mercury K K K
Releases (to the economy) TSS J J
BOD5 J J COD J J
TN J J TP J J
Chromium J J Mercury J J
Table 3.4.4. Physical Use Table for Gross Releases of Substances to Water (in tons per year)
Pollution parameter
Water supply industry
Sewerage industry
Other industries
Households
Flows to the environment
Emissions (to the environment) TSS K
BOD5 K COD K
TN K TP K
Chromium K Mercury K
Releases (to the economy)
22 According to the SEEA-CF, emissions are flows of pollution to the environment only. Releases may flow to the environment or to the economy.

139
TSS J J J BOD5 J J J COD J J J
TN J J J TP J J J
Chromium J J J Mercury J J J
The tables facilitate the verification of the consistency of data. The sum of the rows in the supply table has to be the same as the sum of the rows in the use table. BIBLIOGRAPHY Chapman, Deborah (editor).- Water Quality Assessments - A Guide to Use of Biota, Sediments and Water in Environmental Monitoring - Second Edition.- UNESCO/WHO/UNEP 1996. Water Quality Assessments - A Guide to Use of Biota, Sediments and Water in Environmental Monitoring - Second Edition. UNESCO/WHO/UNEP .-1996 http://www.bfhd.wa.gov/info/tkn.php
Volunteer Stream Monitoring: A Methods Manual is organized into six chapters. All chapters include
references for further reading. http://water.epa.gov/type/rsl/monitoring/vms11.cfm http://water.epa.gov/type/rsl/monitoring/vms50.cfm

140
.V. Monetary data items Monetary Supply and Use Tables The main advantage of compiling the Physical Supply and Use Tables (PSUT) described in section 2 is to be able to combine the monetary information of the national accounts with physical quantities. The tables have the same structure in order to facilitate the combination of information. Monetary data items L, M, N, P and Q in the IRWS are usually part of the information collected by national accountants to integrate the production accounts, but more detail is needed for the purposes of water accounts. Below are the SNA supply and use tables showing the IRWS data items and their codes:
Table 3.5.1. Monetary supply table showing IRWS data items
The supply table above shows, in each row, the output by products from each industry shown in the columns. All products can be produced by the different industries, but if the industries are broken down into establishments and classified accordingly, it is expected that most of the output from the water supply industry (ISIC 3600) is natural water (CPC 18000), and most of the output from the sewerage industry (ISIC 3700) is sewerage service (CPC 94110). It is expected that the other industries do not produce water or provide sewerage services, or that the production is relatively small. Therefore the production numbers appear mainly in the diagonal, as shown above.
Table 3.5.2. Monetary use table showing IRWS data items
SUPPLY (at basic prices)
Industries (except
water supply and
sewerage)
ISIC 3600 Water
supply
ISIC 3700
Sewerage
services
All other products not in IRWS
Natural water (CPC 18000) L.1.1
Sewerage (CPC 94110) L.1.2
T O T A L not in IRWS L.1.1 L.1.2
USE (at purchaser's prices)
Industries (except
water supply and
sewerage)
ISIC 3600 Water
supply
ISIC 3700
Sewerage
services
All other products not in IRWS L.3.1 L.3.2
Natural water (CPC 18000) L.4
Sewerage (CPC 94110) L.5
T O T A L not in IRWS L.3.1 L.3.2
GROSS VALUE ADDED (at basic prices) not in IRWS L.1.1 - L.3.1 L.1.2 - L.3.2
Of which:
Compensation of employees not in IRWS L.2.1 L.2.2
Other taxes on production not in IRWS M.1.2.1 M.1.2.2

141
The use table below shows, in each row, the intermediate consumption by products by each industry shown in the columns. By subtracting the totals in the use table to the totals in the supply table Gross Value Added is found, as explained in Chapter 2. The supply table is recorded at basic prices and the use table at purchasers’ prices, so the difference obtained is defined as “Gross Value Added (GVA) at basic prices” in the SNA. Gross Value Added represents the contribution of labor and capital to the production process (SNA 6.71). Compensation of employees (data items L.2.1 and L.2.2), and other taxes on production (data items M.1.2.1 and M.1.2.2) are part of the value added. Purchasers’ prices are equal to basic prices plus taxes less subsidies on products (data items M.1.1 and N.1.1), plus separately invoiced transport charges, plus wholesalers’ and retailers’ margins, plus Value Added Tax (VAT) not deductible by the purchaser. The relationships of prices are shown in figure 2.3.1 of Chapter 2. Usually water and sewerage industries do not invoice transport charges separately, and there are no wholesalers’ or retailers’ margins. Therefore purchasers’ prices are equal to basic prices plus taxes on products (excluding deductible VAT, but including non-deductible VAT), less subsidies on products.
Figure 3.5.1. Bars showing the relationships of prices for water supply and sewerage
The tables below show the case of the numerical example used throughout the document.
VAT non-deductible
by the purchaser
Purchasers'
prices
(L.4 and L.5) Producers' prices
Taxes on products
(VAT excluded)
Prices without
taxes on products
and without
subsidies on
products
Basic
Prices
(L.1.1 and L.1.2)
Subsidies on
products (N.1.1)
All taxes on
products
(deductible VAT
by purchaser
excluded)
(M.1.1)

142
Table 3.5.3. Example of monetary supply table at basic prices (monetary units per year)
The supply table shows that the country of the example produces the equivalent of 7 monetary units of water, and 6 monetary units of sewerage, at basic prices. There are no imports of water or sewerage, which is usually the case, and there is a subsidy of 1 monetary unit per year for water supply. Therefore, the total supply of water at purchasers’ prices is 6 monetary units per year.
Table 3.5.4. Example of monetary use table at purchasers’ prices (monetary units per year)
The use table shows that the equivalent of 2 monetary units per year worth of water supplied are used in the production processes of the country. 4 monetary units per year worth of water supplied are used for final consumption (e.g. in households). In the case of sewerage, 3 monetary units per year worth of sewerage services are used in the production processes, while 3 monetary units per year are used for final consumption (e.g. in households). The table also shows that the water supply industry requires 3 monetary units worth of different products (e.g. electricity, chlorine, etc.) for the production of water. The sewerage industry requires 2 monetary units worth of different products (e.g. electricity, chemical products, etc.) for providing the service of sewerage. From the tables it is possible to determine that the Gross Domestic Product (GDP) of the country is 161 (output at basic prices) less 62 (intermediate consumption at purchasers’ prices) plus 6 (all taxes less subsidies) equal to 105
All
indu
strie
s (e
xcep
t w
ater
sup
ply
and
Wat
er S
uppl
y (d
rinki
ng
wat
er)
Sew
erag
e
Tot
al p
rodu
ctio
n (b
asic
pric
es)
Impo
rts
Tot
al s
uppl
y (b
asic
pr
ices
)
Impo
rt t
axes
Tra
de a
nd t
rans
port
mar
gins
Tax
es le
ss s
ubsi
dies
on
pro
duct
s
Non
ded
uctib
le V
AT
Tot
al s
uppl
y (p
urch
aser
s' p
rices
)
All products (except water and sewerage) 148 148 26 174 5 0 2 181Water ("drinking") 7 7 0 7 -1 6Sewerage 6 6 0 6 6
148 7 6 161 26 187 5 0 -1 2 193
Output
All
indu
strie
s (e
xcep
t w
ater
Wat
er S
uppl
y (d
rinki
ng w
ater
)
Sew
erag
e
Inte
rmed
iate
co
nsum
ptio
n (p
urch
aser
s'
Fin
al c
onsu
mpt
ion
Gro
ss C
apita
l F
orm
atio
n
Exp
orts
Tot
al u
se
(pur
chas
ers'
All products (except water and sewerage) 52 3 2 57 66 34 24 181Water ("drinking") 2 2 4 6Sewerage 3 3 3 6
57 3 2 62 73 34 24 193
Intermediate Consumption Final Use

143
monetary units per year. The water supply and sewerage industries represent 7.6% of the country GDP (i.e. output of 7+6, less intermediate consumption of 3+2, divided by a GDP of 105). Often, national accounts in countries do not show the details of the columns and rows of water supply and sewerage. These rows and columns are usually lumped together with other industries and products, such as electricity and gas. Therefore, it is necessary to perform additional work in order to “open up” national accounts in order to show the specific information for “water and sanitation.” For water and sewerage the use tables only shows explicitly the products consumed in the production process. It does not show accumulation. This means that it doesn’t show how much money is being spent on civil construction and equipment, for example. Civil construction and equipment, as well as other products that are accumulated are part of Gross Fixed Capital Formation (GFCF). The use table shows that the country is spending 34 monetary units per year on GFCF, but it doesn’t explicitly show for which industries. Additional information is needed to show what portion of the 34 monetary units per year corresponds to water supply and sewerage infrastructure, as will be shown below. It is important to mention that values in accounting tables are recorded in accrual terms. This means that they are recorded at the time economic value is created, transformed, exchanged, transferred or extinguished. For this reason, output is recorded as the amount receivable (which corresponds to billed amounts). However, often water and sewerage utilities are unable to collect the total amounts billed. For this reason it is important to record in the financial assets the accounts receivable, which often will not be collected and will have to be written off. Accumulation Accounts The information compiled above provides an understanding of the current monetary flows related to water supply and sewerage, but does not provide information related to the accumulative effects through time. The sequence of economic accounts, as shown in chapter 2 section 2 of the Guidelines, provide information about the changes in net worth for each accounting period. A balance sheet provides information about the history of the stocks of assets. For water supply and sanitation it is important to understand how fixed capital stocks change through time. In the accumulation accounts, which are analogous to the physical asset accounts presented in the first section of this chapter, the changes in value of the stocks of fixed capital, are recorded. The following table shows the accumulation accounts for fixed capital of water supply and sewerage in terms of IRWS data items.

144
Table 3.5.5. Accumulation accounts for fixed capital of water supply and sewerage with IRWS data items
Using the information of the same example as before, the table will be as follows. It was assumed that the fixed capital for water supply at the beginning of the accounting period had a value of 15 monetary units, while the fixed capital for sewerage had a value of 8 monetary units. The value of fixed capital, as well as the Consumption of Fixed Capital (i.e. a measure of the depreciation of infrastructure) can be calculated based on data, such as the cost of replacing each kilometer of water supply and sewerage pipes, the lifespan of the pipes, the cost of replacing the different treatment plants and wastewater treatment plants, as well as other pieces of equipment, and their corresponding lifespans. Fixed capital can also include the investments done by households on water supply and sewerage equipment.
Table 3.5.6. Example of capital account for water supply and sewerage (monetary units)
The example shows that the value of fixed capital (i.e. the infrastructure) has decreased in the current accounting period. If this continues to happen through the years, the water supply and sewerage systems will eventually collapse and stop providing the services, or the quality of the services will decrease, as the infrastructure ages. If the financial assets increase in the amount that the fixed assets decrease, then the financial assets can eventually be converted to fixed capital, reverting the process. It is important to do the complete sequence of economic accounts in order to better understand the financial flows of water supply and sewerage, and consider not only fixed capital, but also other types of assets.
Water supply Sewerage
Opening stock of fixed capitalOpening O.1.1 Opening O.1.2
Increases of value of fixed capital
Gross fixed capital formation P.1.1 P.1.2
Other changes in value of fixed assets not in IRWS not in IRWS
Reductions of value of fixed capital
Consumption of fixed capital Q.1.1 Q.1.2
Other reduction in value of fixed assets not in IRWS not in IRWS
Closing stock of fixed capital Closing O.1.1 Closing O.1.2
Water supply Sewerage
Opening stock of fixed capital 15.0 8.0
Increases of value of fixed capital 2.1 1.0
Gross fixed capital formation 2.1 1.0
Other increases in value of fixed assets
Reductions of value of fixed capital 2.2 1.3
Consumption of fixed capital 2.2 1.3
Other reduction in value of fixed assets
Closing stock of fixed capital 14.9 7.7

145
Sequence of economic accounts for water supply and sewerage As explained in Chapter 2, it is important to add more details about the activities of drinking water supply and sewerage, usually known as “water and sanitation.” The sequence of economic accounts is a useful tool for evaluating the economic sustainability of drinking water supply and sewerage systems. The sequence of accounts for water supply and sewerage activities may include formal establishments dedicated to the activity of water supply and sewerage, as well as other providers of the services, such as, households themselves, groups of households, non-specialized industries, etc. The same concepts and methods can be applied as in the case of establishments that supply water and do sewerage as a primary activity. The following table provides a brief description of each of the data items used in the sequence of economic accounts for water supply and sewerage.
Table 3.5.7. Description of the data items used in the economic sequence of accounts Code Concept Description P1 Output at producers' prices or
at basic prices Amounts billed by the water supply and sewerage industries for the sales of water and sewerage. If it is at producers’ prices, it includes taxes and excludes subsidies on products. If it is at basic prices, it includes subsidies and excludes taxes on products. Note that output is calculated with the billed amounts (receivable) and not the actual amounts received. An important financial asset to observe is accounts receivable, which shows the billed amounts that were not paid during the current period.
P2 Intermediate consumption Amounts payable for the purchase of electricity, chemical products, water, administrative services, etc.
D1 Compensation of employees Amounts payable to people working in the industry for the concepts of wages and salaries, as well as the social contributions payable by the employers.
D21 Taxes on products Taxes directly applied to the price of water and sewerage D29 Other taxes on production Taxes not directly applied to the price of water and
sewerage. D2 Taxes on production and
imports D21 + D29
D31 Subsidies on products Subsidies directly applied to the price of water and sewerage
D39 Other subsidies on production Subsidies not directly applied to the price of water and sewerage.
D3 Subsidies D31 + D39 D4 Property income Property income includes several concepts, such as
payment of interests on loans, equity and dividends paid to the owners of the capital used. It also includes the payment of royalties, levies or duties for the use of water or the use of water bodies.
D5-D7
Current transfers Includes taxes on income, wealth, etc. It also includes net social contributions and social benefits.

146
Code Concept Description P51c Consumption of fixed capital It measures the depreciation of the equipment and
infrastructure according to the criteria of the national accounts.
D9 Capital transfers Includes investment grants and other transfers for the acquisition of assets. Capital transfers are often large and irregular.
P51g Gross fixed capital formation It includes the acquisition of fixed assets, such as pipes, pumps, buildings, and other infrastructure for the production of water and the provision of sewerage services. The disposals of fixed assets are subtracted from the acquisitions.
P52 Changes in inventories Changes in the amounts of goods that are purchased for production. The changes in the inventories of water are usually negligible, since the amounts of water stored in the systems owned by the utilities is relatively small.
P5g Gross capital formation Gross capital formation includes gross fixed capital formation, changes in inventories, and acquisition less disposal of valuables.
F Net acquisition of financial assets
Financial assets include currency and deposits, debt securities, equity and investment shares, financial derivatives, accounts receivable, etc.
F Net acquisition of financial liabilities
Financial liabilities include loans, accounts payable, etc.
Each concept in the previous table can be measured or estimated based on the information provided by water and sewerage utilities through censuses, surveys, or from different administrative records. The International Recommendations for Water Statistics (IRWS) provides guidance in how to collect the data. The concepts and codes used in the SNA have a corresponding code in the International Recommendations for Water Statistics (IRWS), as shown in the following table.
Table 3.5.8. Relationship of concepts and codes of the SNA and IRWS Code SNA Concept Code IRWS data item P1 Output. If output is expressed at
basic prices then taxes on products are excluded and subsidies on products are included. See figure 3.4.1 above.
L.1 Value of shipments/sales/turnover. Taxes on products (D21) are excluded, and subsidies on products (D31) are included, so that L.1 is expressed at basic prices.
P2 Intermediate consumption. It is expressed at purchasers’ prices.
L.3 Purchases of goods and services
D1 Compensation of employees L.2 Compensation of employees D21 Taxes on products M.1.1 Taxes on products D29 Other taxes on production M.1.2 Other production taxes D2 Taxes on production and imports M.1 Taxes = M.1.1 + M.1.2 D31 Subsidies on products N.1.1 Subsidies on products

147
Code SNA Concept Code IRWS data item D39 Other subsidies on production N.1.2 Other subsidies on production D3 Subsidies N.1 Subsidies = N.1.1 + N.1.2 D4 Property income This concept may include the payment of interests for
a loan received, profits, or even the payment of fees or levies (also called royalties) for the use of water.
D5 to D7
Current transfers Not included in IRWS
P51c Consumption of fixed capital Q Depreciation of assets D9 Capital transfers N.2 Investment grants P51g Gross fixed capital formation P.1 Capital expenditures P52 Changes in inventories Not included in IRWS. This is not a very significant
concept for water and sewerage industries, since there is no significant accumulation of the products generated.
P5g Gross capital formation Since changes in inventories (P52) are negligible for the industry, it can be assumed that gross capital formation (P5g) = gross fixed capital formation (P51g).
F Net acquisition of financial assets
Not included in IRWS.
F Net incurrence of financial liabilities
Not included in IRWS.
Water supply and sewerage tariffs and charges Tariffs (or rates) and charges (data item R) allow relating monetary data with physical data. Tariffs (or rates) and charges are prices which link quantities (“physical quantities”) with value. The SNA provides the following definition: value (v) at the level of a single, homogeneous good or service is equal to the price per unit of quantity (p) multiplied by the number of quantity units (q), that is v = p * q. (SNA 15.10). In a similar way tariffs and charges (data item R.1) multiplied by quantities supplied (data item F.1) are equal to value (data item L.1). However, there is usually an offset, which is a fixed amount charged independently of the quantity of product supplied. Therefore: For water supply:
L.1.1 = F.1 * R.1 + R.2 (F.2 could also be included if there are exports of water)
For sewerage: L.1.2 = F.3*R.3 + R.4 (F.4 could also be included if there are exports of wastewater) The water supplied (data item F.1) is the water billed to the users, which is charged at a volumetric rate (data item R.1) in addition to a minimum or fixed charge, charged regardless of the amount of water used (data item R.2). In many cases there are no meters to determine the quantities of water actually delivered to each user, and therefore estimates have to be made.

148
In a similar way, sewerage is charged based on the volume of wastewater collected (data item F.3.1), a volumetric rate (data item R.3) and a minimum or fixed charge (data item R.4). Often, only the water supplied is measured, and sewerage is charged as a percentage of the amount of water billed. Water supply and wastewater collection companies or utilities may have different tariff structures. However, the price structure usually has the following elements:
• A fixed price (f), which is independent of the amount of water consumed (data item R.2 and R.4). • A minimum volume (m), for which consumers only pay the fixed price and beyond which a volumetric
price is applied. • Blocks for which different unit prices are established (data items R.1 and R.3).
The figure below shows the various possibilities of tariff structures. The graphs show the volumetric amount of water billed in the horizontal axis, and the total monetary amount to be paid in the vertical axis. The tariff structure type C-3 is very common in many countries.
Figure 3.5.2. Tariff structures used for water supply and sewerage
In the graphs, f= fixed part of the tariff, which is paid regardless of amount of water used (data item R.2 and R.4), q is quantity of water billed (data item G.1) in physical data. Tariff structures may be different for households (sometimes referred as “domestic or residential tariff”) and for the different industries connected to the water supply network. It is also important to consider initial connection charges, meter rental charges, and other charges that are not related to the quantity of water used.
TYPE A (flat) B
Constant increase
C
IBT= Increasing Block
Tariffs
(“with memory”)
D
DBT= Decreasing
Block Tariffs
E
VDT= Volume
Differentiated Tariffs
(“no memory”)
1. Without fixed
part
0
2. With fixed
part
3. With fixed
part and
minumum
volume
q q
$ $
q
$
q
$
f
q
$
q
$
q
$
q
$
q
$
q
$
q
$
q
$
q
$
f
m
f
m m
m
f
f f f
f f

149
EXAMPLE: Metered Water Rates in New York City, for households.
A. The charge for water measured by meter is $3.17 per one hundred cubic feet provided (1.12 USD/m3) B. The minimum charge imposed for water service is $0.43 per day per water meter within a Bill Period. The following figure shows the tariff structure
The wastewater charge for any property supplied with water from the Water Supply System is one hundred fifty-nine percent (159%) of the charges for water supplied to that property from the system, including any surcharges, unless otherwise provided in the Rate Schedule.
Source: New York City Water Board, water and wastewater rate schedule, effective July 2011
In many cases there are tariff collection problems, so only one portion of the water billed is actually paid. It is therefore important to quantify the proportion of water billed that is actually paid. Integrating data into the accounts Some of the data required may have already been collected for the compilation of national accounts. It may have been collected through economic censuses or surveys applied to establishments performing the activities of water supply and sewerage. It is therefore very important to identify the different water and sewerage service providers. It is necessary to have an inventory of providers that provide the service as a primary activity, as a secondary activity, and also, at some stage, incorporate the households that perform the activities on own account (e.g. installation of own pump to abstract water from a well, installation of a septic tank to collect sewage generated in the household, etc.) A brief description of the raw data and processing needed to incorporate them in the accounts follows. General information about the collection of monetary data from industries can be found in the International Recommendations for Industrial Statistics 2008:
Table 3.5.9. IRWS data items and processing required for data compilation IRWS Data item and
SNA code in parenthesis
Raw data that can be used Processed data for the accounts
L.1. Value of shipment/sales/
• Inventory of water and sewerage utilities.
• Sales should exclude taxes on products, and include
Cubic meters of water received per month
USD per month
12.90
1
1.12

150
IRWS Data item and SNA code in parenthesis
Raw data that can be used Processed data for the accounts
turnover (P1) • Data on sales of water from financial accounts of water and sewerage utilities.
• Output of the ISIC 3600 and ISIC 3700 columns in the national accounts.
• Data from households regarding expenditures for own-supply of water and sewerage (e.g. operation of a pump to abstract water from a well, maintenance of septic tank, etc.). Compare with L.2 and L.3 below.
subsidies on products. They are recorded at basic prices.
• Sales are recorded in accrual terms, so the amount billed is recorded (the amount actually collected may differ, and this should be recorded as part of the financial assets (i.e. accounts receivable)
• Compare data with national accounts data.
L.2 Compensation of employees (D1)
• Data on remuneration paid to employees from financial accounts from of water and sewerage utilities.
• Estimates of labor costs based on time spent by households for own supply of water and sewerage.
• The value of remuneration in cash or in kind paid to the employees.
L.3 Purchases of goods and services (P2)
• Data on sales of water from financial accounts of water and sewerage utilities.
• Intermediate consumption of the ISIC 3600 and ISIC 3700 columns in the national accounts at purchaser’s prices.
• Data from households regarding expenditures for own-supply of water and sewerage (e.g. operation of a pump to abstract water from a well, maintenance of septic tank, etc.)
• Purchases should include taxes on products and exclude any subsidies on products. They are recorded at purchasers’ prices.
M.1.1 Taxes on products (D21)
• Data on the taxes payable by the purchaser for the amount of water received from the utilities or the sewerage service received. It excludes VAT because it is “deductible” (SNA 7.89)
• Basic prices exclude all taxes on products.
M.1.2 Other production taxes (D29)
• Data on all taxes payable that are not taxes on products. They include payroll taxes, recurrent taxes on buildings or other structures, and taxes on pollution (SNA 7.97).
• Important to include taxes, “royalties” or “duties” paid for the volume of water abstracted or the pollution discharged in water bodies. These taxes may also be considered as rent (property

151
IRWS Data item and SNA code in parenthesis
Raw data that can be used Processed data for the accounts
income) for the use of subsoil resources or royalties for permission to extract resources (SNA 7.154 and 7.160)
N.1.1 Subsidies on products (D31)
• Data on the subsidies for the amount of water received from the utilities or the sewerage service received.
• Basic prices include all subsidies on products.
N.1.2 Other subsidies on production (D39)
• Data on subsidies, except subsidies on products, that are receivable by the producer for engaging on the production of water or sewerage. They include subsidies on payroll, and subsidies to reduce pollution.
• Includes subsidies for reducing pollution.
O.1 Gross value of fixed assets (AN1)
• Inventory of water and sewerage infrastructure. Valuation of the infrastructure
• Difficult to calculate with precision. Need to make estimates based on the main information about the infrastructure, such as length of pipes and their lifespan).
P.1 Capital expenditure (CAPEX) (P51g)
• Value of expenditures on new and fixed assets.
• Gross Fixed Capital Formation (GFCF) in national accounts. Need to find mainly in construction rows.
•
Q. Depreciation (P51c) • The loss of value of fixed asset. Need to use SNA methodologies for Consumption of Fixed Capital (CFC).
• Compare data from financial accounts and national accounts.
R. Tariffs and charges • Tariff schedules from water and sewerage utilities. See the structures shown in figure 3.3.3
• Find average tariffs for households and different types of industries.
Section 2 of chapter 2 provides an example of the use of the sequence of economic accounts to determine the changes in net worth. The World Health Organization (WHO) has prepared a guidance document of a proposed methodology to identify and track financing for water, sanitation and hygiene (WASH) in a coherent and consistent manner across several countries. The methodology was designed to help countries track financing to the WASH sector on a regular and comparable basis and analyse this information to support evidence-based policymaking based on useful indicators. WHO and the UNSD are working in partnership in order to harmonize SEEA-Water accounts with what has been called the WASH accounts.

152
BIBLIOGRAPHY: United Nations.- International Recommendations for Industrial Statistics 2008. United Nations.- System of National Accounts 2008. OECD.- Managing Water for All: An OECD Perspective on Pricing and Financing. 2009
WHO.- Tracking financing to sanitation, hygiene and drinking-water at national level – the UN-Water GLAAS
TrackFin Initiative, Guidance Document, Draft for Testing. 2014

153
.VI. Water-related social-demographic data items
Social demographic data items in the IRWS are listed under subheadings S, population by main source of drinking water, and T, population by type of toilet and sewage disposal. These data items are the basis for reporting on indicators 7.8 and 7.9 of the Millennium Development Goals (MDG). These goals are monitored by the Joint Monitoring Programme of the World Health Organization (WHO) and the United Nations Children’s Fund (UNICEF). Population by main source of drinking water According to the JMP, for the purposes of the MDGs, an improved drinking-water source is defined as one that, by nature of its construction or through active intervention, is protected from outside contamination, in particular from contamination with faecal matter. Improved drinking water sources include the following23:
• Piped water into dwelling, also called a household connection. It is defined as a water service pipe connected with in-house plumbing to one or more taps (e.g. in the kitchen and bathroom).
• Piped water to yard/plot, also called a yard connection. It is defined as a piped water connection to a tap placed in the yard or plot outside the house.
• Public tap or standpipe. It is a public water point from which people can collect water. A standpipe is also known as a public fountain or public tap. Public standpipes can have one or more taps and are typically made of brickwork, masonry or concrete.
• Tubewell or borehole. It is a deep hole that has been driven, bored or drilled, with the purpose of reaching groundwater supplies. Boreholes/tubewells are constructed with casing, or pipes, which prevent the small diameter hole from caving in and protects the water source from infiltration by run-off water. Water is delivered from a tubewell or borehole through a pump, which may be powered by human, animal, wind, electric, diesel or solar means. Boreholes/tubewells are usually protected by a platform around the well, which leads spilled water away from the borehole and prevents infiltration of run-off water at the well head.
• Protected dug well. It is a dug well that is protected from runoff water by a well lining or casing that is raised above ground level and a platform that diverts spilled water away from the well. A protected dug well is also covered, so that bird droppings and animals cannot fall into the well.
• Protected spring. The spring is typically protected from runoff, bird droppings and animals by a "spring box", which is constructed of brick, masonry, or concrete and is built around the spring so that water flows directly out of the box into a pipe or cistern, without being exposed to outside pollution.
• Rainwater. It refers to rain that is collected or harvested from surfaces (by roof or ground catchment), and stored in a container, tank or cistern until used.
Unimproved drinking water sources include the following:
• Unprotected spring. This is a spring that is subject to runoff, bird droppings, or the entry of animals. Unprotected springs typically do not have a "spring box".
• Unprotected dug well. This is a dug well for which one of the following conditions is true: 1) the well is not protected from runoff water; or 2) the well is not protected from bird droppings and animals. If at least one of these conditions is true, the well is unprotected.
23 From http://www.wssinfo.org/definitions-methods/watsan-categories/ Consulted on 5 June 2014.

154
• Cart with small tank/drum. This refers to water sold by a provider who transports water into a community. The types of transportation used include donkey carts, motorized vehicles and other means.
• Tanker-truck. The water is trucked into a community and sold from the water truck. • Surface water is water located above ground and includes rivers, dams, lakes, ponds, streams, canals, and
irrigation channels. • Bottled water. It is considered to be improved only when the household uses drinking-water from an
improved source for cooking and personal hygiene; where this information is not available, bottled water is classified on a case-by-case basis.
The data can be obtained from population and housing censuses, which are typically conducted every 10 years, and from household surveys, which are typically conducted every 3 to 5 years. Line ministries and water utilities keep records on the number and type of facilities constructed. This information can be useful when a census or survey is not available or for data between censuses and surveys. The level of disaggregation of the data available may not be sufficient to identify each of the improved or unimproved water sources as described by the JMP. The United Nations Statistics Division recommends the following breakdown for the data collected through population and household censuses: 1. Piped water inside the unit
1.1. From the community scheme 1.2. From an individual source
2. Piped water outside the unit, but within 200 metres 2.1. From the community scheme
2.1.1. For exclusive use 2.1.2. Shared
2.2. From an individual source 2.2.1. For exclusive use 2.2.2. Shared
3. Other 3.1. Borehole 3.2. Protected dug well 3.3. Protected spring 3.4. Rainwater collection tank 3.5. Vendor-provided water 3.6. Bottled water 3.7. Tanker trucks 3.8. Unprotected dug well/spring/river/stream/lake/pond/dam
Geographical and socio-economic disaggregation is desirable. There is no standard definition of rural and urban, therefore, the definition from each country has to be used. Information on who usually goes to collect water for the household, especially in rural areas, by sex and age group is useful for analysis of gender equality issues.
Population by type of toilet and sewage disposal used According to the JMP, for the purposes of the MDGs, an improved sanitation facility is defined as one that hygienically separates human excreta from human contact.

155
Improved sanitation facilities include the following: • Flush toilet. It uses a cistern or holding tank for flushing water, and a water seal (which is a U-shaped pipe
below the seat or squatting pan) that prevents the passage of flies and odours. A pour flush toilet uses a water seal, but unlike a flush toilet, a pour flush toilet uses water poured by hand for flushing (no cistern is used).
• Piped sewer system. It is a system of sewer pipes, also called sewerage, that is designed to collect human excreta (faeces and urine) and wastewater and remove them from the household environment. Sewerage systems consist of facilities for collection, pumping, treating and disposing of human excreta and wastewater.
• Septic tank. It is an excreta collection device consisting of a water-tight settling tank, which is normally located underground, away from the house or toilet. The treated effluent of a septic tank usually seeps into the ground through a leaching pit. It can also be discharged into a sewerage system.
• Flush/pour flush to pit latrine. It refers to a system that flushes excreta to a hole in the ground or leaching pit (protected, covered).
• Ventilated improved pit latrine (VIP). It is a dry pit latrine ventilated by a pipe that extends above the latrine roof. The open end of the vent pipe is covered with gauze mesh or fly-proof netting and the inside of the superstructure is kept dark.
• Pit latrine with slab. It is a dry pit latrine whereby the pit is fully covered by a slab or platform that is fitted either with a squatting hole or seat. The platform should be solid and can be made of any type of material (concrete, logs with earth or mud, cement, etc.) as long as it adequately covers the pit without exposing the pit content other than through the squatting hole or seat.
• Composting toilet. It is a dry toilet into which carbon-rich material (vegetable wastes, straw, grass, sawdust, ash) are added to the excreta and special conditions maintained to produce inoffensive compost. A composting latrine may or may not have a urine separation device.
• Special case. A response of "flush/pour flush to unknown place/not sure/don’t know where" is taken to indicate that the household sanitation facility is improved, as respondents might not know if their toilet is connected to a sewer or septic tank.
Unimproved sanitation facilities include the following:
• Flush/pour flush to elsewhere. It refers to excreta being deposited in or nearby the household environment (not into a pit, septic tank, or sewer). Excreta may be flushed to the street, yard/plot, open sewer, a ditch, a drainage way or other location.
• Pit latrine without slab. It uses a hole in the ground for excreta collection and does not have a squatting slab, platform or seat. An open pit is a rudimentary hole.
• Bucket. It refers to the use of a bucket or other container for the retention of faeces (and sometimes urine and anal cleaning material), which are periodically removed for treatment, disposal, or use as fertilizer.
• Hanging toilet or hanging latrine. It is a toilet built over the sea, a river, or other body of water, into which excreta drops directly
• No facilities or bush or field. It includes defecation in the bush or field or ditch; excreta deposited on the ground and covered with a layer of earth (cat method); excreta wrapped and thrown into garbage; and defecation into surface water (drainage channel, beach, river, stream or sea).
As for the case of improved water, the United Nations Statistics Division recommends the following breakdown for the data collected through population and household censuses: 1. With toilet within housing unit
1.1. Flush/pour flush toilet 1.2. Other

156
2. With toilet outside housing unit 2.1. For exclusive use
2.1.1. Flush/pour flush toilet 2.1.2. Ventilated improved pit latrine 2.1.3. Pit latrine without ventilation with covering 2.1.4. Holes or dug pits with temporary coverings or without shelter 2.1.5. Other
2.2. Shared 2.2.1. Flush/pour flush toilet 2.2.2. Ventilated improved pit latrine 2.2.3. Pit latrine without ventilation with covering 2.2.4. Holes or dug pits with temporary coverings or without shelter 2.2.5. Other
3. No toilet available 3.1. Service or bucket facility (excreta manually removed) 3.2. Use of natural environment, for example, bush, river, stream, and so forth
As for the case of improved water, geographical and socio-economic disaggregation is desirable. There is no standard definition of rural and urban, therefore, the definition from each country has to be used. Also, Information on who usually goes to collect water for the household, especially in rural areas, by sex and age group is useful for analysis of gender equality issues. Data processing Population and housing censuses collect the data by housing unit. Therefore, the data have to be transformed into number of people with access to improved water by multiplying the number of housing units with access by the number of inhabitants in each housing unit. A brief description of the raw data and processing needed to incorporate them in the accounts is described below:
Data item Raw data commonly available Processed data for the accounts S.1.1 Piped water into the housing unit/living quarters
• Number of households with piped water from population and household censuses or surveys
• Number of drinking water supply connections to households from drinking water utilities
• Based on the national criteria to define urban and rural population, and the number of people that form a household it is possible to estimate the number of people using piped water.
• Connections refer to dwellings where more than one household can live. Need to define the number of people in each dwelling.
• Censuses and surveys can be used as reference to check administrative data from water utilities.
S.1.2. Public standpipe • Number of households that use • Based on the national criteria to

157
Data item Raw data commonly available Processed data for the accounts water from public standpipes from population censuses and household surveys
• Number of public standpipes through which the water utilities supply water.
define urban and rural population, and the number of people that form a household it is possible to estimate the number of people that use public standpipes.
• Water utilities may provide the number of standpipes installed. An estimate of the number of people that use each standpipe may be useful to estimate the coverage.
• Censuses and surveys can be used as reference to check administrative data from water utilities.
S.1.3 Boreholes • Data from population censuses and household surveys.
• Similar to previous case
S.1.4 Protected dug wells
• Data from population censuses and household surveys.
• Similar to previous case
S.1.5 Protected springs • Data from population censuses and household surveys.
• Similar to previous case
S.1.6 Rainwater collection
• Data from population censuses and household surveys.
• Similar to previous case
S.1.7 Bottled water (along with other improved sources for hygiene and cooking)
• Data from population censuses and household surveys.
• Similar to previous case
T.1.1 Flush/pour or flush toilet to piped sewer system
• Number of households with connections to the sewer system from population censuses and surveys
• Number of sewer connections to households from sewerage utilities
• Based on the national criteria to define urban and rural population, and the number of people that form a household it is possible to estimate the number of people with connection to the sewer system. More details may be difficult to determine.
• Connections refer to dwellings where more than one household can live. Need to define the number of people in each dwelling.
• Censuses and surveys can be used as reference to check administrative data from sewerage utilities.
• Specific surveys should be
T.1.2 Flush/pour or flush toilet to septic tank T.1.3 Flush/pour toilet to pit T.1.4 Ventilated improved pit (VIP) latrine T.1.5 Pit latrine with slab T.1.6 Composting toilet/latrine

158
designed to obtain more detailed information.
EXAMPLE: POPULATION CENSUSES IN MEXICO The National Institute of Statistics and Geography of Mexico (INEGI) has performed a population and housing census every five years since 1990. The censuses include the number of households and number of inhabitants in households with the following characteristics:
1. Piped water inside the household 2. Piped water outside of the household, but in the plot. 3. Access to piped water from a neighboring household 4. A public tap or standpipe 5. Household drains connected to the public sewerage network. 6. Household drains connected to a septic tank 7. Household drains that discharge to a river, lake or to the sea. 8. Household drains that discharge to a cliff or crack
In partnership with the National Water Commission of Mexico (CONAGUA) the information collected is analyzed according to different sizes of population centers.
Source: CONAGUA.- Análisis de la Información del Agua de los Censos y Conteos 1990 a 2005.- Mexico 2007. BIBLIOGRAPHY: United Nations Development Group.- Indicators for Monitoring the Millennium Development Goals – Definitions, Rationale, Concepts, and Sources. Electronic updatable manual. http://mdgs.un.org/unsd/mi/wiki/MainPage.ashx Consulted on 5 June 2014. United Nations Statistics Division.- Principles and Recommendations for Population and Housing Censuses. Revision 2 (ST/ESA/STAT/SER.M/67/Rev. 2).- 2008. WHO/UNICEF Joint Monitoring Programme (JMP) for Water Supply and Sanitation http://www.wssinfo.org/definitions-methods/watsan-categories/

159
6 June 2014
Rev 21
Chapter 4 DISSEMINATION OF THE ACCOUNTS AND STATIS TICS TO DIFFERENT TARGET AUDIENCES
This chapter discusses how the data compiled in the accounts can be used to inform the different audiences. The chapter provides recommendations on what information to report and how to report it, including several examples from countries. The international initiatives that collect the data from countries and their relationship with the data items of the accounts are also briefly discussed. The core water account tables are provided as a tool for providing the minimum information useful for international comparisons. V. The dissemination process • Audiences of the information • Making information accessible to the users • Types of information for water policy design and evaluation VI. Information about drinking water and sanitation services • Information to be disseminated • Accounts and statistics related to the information to be disseminated • How the information can be disseminated VII. Information about water resources management • Information to be disseminated • Accounts and statistics related to the information to be disseminated • How the information can be disseminated VIII. Information related to water pollution and water quality • Information to be disseminated • Accounts and statistics related to the information to be disseminated • How the information can be disseminated IX. Information about extreme events and other relevant information • Information to be disseminated • Accounts and statistics related to the information to be disseminated • How the information can be disseminated X. International data collection initiatives • Data items collected through different initiatives • Core water tables

160
.I. The dissemination process Audiences of the information The wide variety of data compiled through the process of integration of water accounts and statistics described in the previous chapters provides the platform for producing information aimed at different users. Users of the information may include policy makers, the general public, managers, analysts, and researchers, among others. Users may need specific information to be used in their own diagnoses, information presented in the form of indicators, or indicators combined in the form of indices. Understanding the needs of the information users or audiences is one of the most important considerations for the disseminating process24. Different audiences will require the information with different levels of detail. Policy makers and the wider public generally require indicators and other forms of summary or aggregated information, while researchers may require a much higher level of detail, i.e. microdata. The pyramid of information shown in figure 1.1.1 of chapter 1, has at its bottom a large amount of detailed data. At its top it shows highly aggregated information or indicators. The SEEA and the SNA, as well as other statistical methodologies, provide the mechanisms for compiling the information to be able to connect the bottom of the pyramid with the top. The dissemination of information should be performed according to a set of principles. Chapter VIII of the IRWS provides several recommendations for the dissemination of information, including dissemination principles, as well as other relevant aspects to consider. This Chapter of the Guidelines provides a more specific discussion about the information needed to support the different water policy targets, grouped according to the quadrants presented in Chapter 1. Reporting to international organizations is also an important aspect of the dissemination process. There are several initiatives collecting data from countries, as well as estimating data when necessary. As it will be shown in the last section of this chapter, the core tables provide a standardized way for organizing the data in order to facilitate reporting to international organizations, as well as facilitating comparisons among countries and through time. Making information accessible to the users Information may be disseminated through the Internet, through printed publications, or it may be presented through the media. Not only is it important to choose which information to present, but also to make sure that the information is presented in a way which is most meaningful to users. Demonstrating to governments and the public the relevance of the information produced is essential in generating greater public support for these programs. This support enhances collection and compilation of data, improves respondent relations and bolsters visibility of the products generated. The document “Making Data Meaningful: A Guide for Writing Stories About Numbers” by the United Nations Economic Commission for Europe discusses different techniques to achieve this. Numerical information only conveys a message when the quantities can be compared through time and space. Time series can help identify trends or cycles. Comparisons of indicators from different countries, or from different subnational areas, can be helpful for identifying policy priorities or to understand the effectiveness of the different policy options.
24 UNSD. International Recommendations for Water Statistics. 2012

161
The information can be presented using tables, diagrams, graphs, or maps in order to help the users in its interpretation. Types of information needed for policy design and evaluation To guide the dissemination process, the information can be organized according to the four quadrants or groups described in chapter 1 of these Guidelines. The grouping is useful to clearly identify the policy relevance of the information by linking it to different policy objectives. The following sections will discuss the information that is needed for each quadrant or policy group. Each country can decide the level of detail for the data collection and compilation process for each of the groups. Depending on the level of detail and type of information to be collected, countries may decide to implement different sections of the SEEA, usually starting with those in the Central Framework (CF), and then moving to the SEEA Ecosystem Experimental Accounts. Below there is a brief description of the different types of information and indicators that are needed for each quadrant or group.

162
.II. Information about drinking water and sanitatio n Information to be disseminated The policies related to drinking water and sanitation (See quadrant I of Figure 1.2.2 in Chapter 1) require information mainly to support the targets related with “the progressive realization of the right to water and sanitation through increasing the number of people with access, improving existing service levels and progressively eliminating inequalities in access to services reflecting the established principles of the human right to water and sanitation, as recognized in Resolution 64/292 of the UN General Assembly in July 2010.”25 Water statistics and accounts should provide social demographic information about the main source of drinking water used, as well as the main type of toilet and sewage disposal used by the population, as explained in section VI of Chapter 3 of these Guidelines. This information is closely related to the Millennium Development Indicators 7.8 and 7.9. The table below summarizes the types of information and indicators needed for this group of water policies.
Type of Information
Common indicators for water policy design and evaluation
Presented as
Social-demographic • Proportion of total population with access to improved water and sanitation.
• Proportion of total population, highlighting rural and urban differences, as well as subnational differences.
Physical • Amount of water used by households.
• Household water use per person per day.
• Losses of water in water supply networks (unaccounted for water or non-revenue water may be used as proxies).
• Proportion of water abstracted that is lost in the water supply network.
Monetary • Total expenses for drinking water supply and sanitation.
• May be presented as a proportion of the country GDP.
• Efficiency in the collection of water tariffs or rates.
• Proportion of amounts billed by drinking water suppliers and sewerage providers that is actually collected.
• Financial sources which cover the expenses of drinking water supply and sanitation.
• Proportion that is covered by the users of the service and proportion that is covered through transfers from the government, or other sources.
• Investments (Gross Fixed Capital Formation) in infrastructure for drinking water supply and sanitation.
• May be presented as proportion of total Gross Fixed Capital Formation in the country.
25 UN-Water. A Post-2015 Global Goal for Water. 27 January 2014.

163
Other • Labor intensity of drinking water supply and sanitation.
• Number of employees per water supply and sewerage connection.
Accounts and statistics related to the information to be disseminated The household and population censuses as well as the information from water utilities is useful for the determination of the proportion of people with access to improved water, as explained in section VI of Chapter 3. The monetary supply table of the national accounts shows the total sales for the concept of water supply in one column, and for the concept of sewerage in another column. On the other hand, the monetary use table of the national accounts shows the monetary values of all the products needed for providing the services of water supply and sewerage (intermediate consumption), such as electricity, chemical products, IT services, etc. The use table also shows the final expenditures done by households for the services of water supply and sewerage. National accounts also include information about Compensation of Employees, Gross Fixed Capital Formation, as well as other concepts. The information recorded in the national accounts may not have the level of detail needed for the purposes of water policy design, and therefore additional surveys and data need to be collected and compiled using the same concepts. More precision can be obtained by adding the information about own production in the activities of water supply and sewerage. This is explained in more detail in section V of Chapter 3. The physical supply table of the SEEA shows the total amount of water supplied by the water supply industry, and the amount of water that the different users discharge in the sewers. The physical use table of the SEEA shows the total amount of water received by the different economic activities and households from the water suppliers. As in the case of monetary tables, it is important to add physical information of own production for the activity of water supply and sewerage. It is very important to split the activity of water supply, identified in the International Standard Industrial Classification of All Economic Activities as division 36, into drinking water supply and supply of water for other uses, such as irrigation. How the information can be disseminated The information may be presented as time series showing the proportion of people using improved access to water supply and sewerage. It is also important to provide time series about the investments made in water supply and sewerage. Long time series reveal the policy emphasis in different periods of time. For example, the figure below shows that in the decade of 1960 to 1970 the greatest number of Mexicans received access to improved water.

164
Figure 4.2.1 Population that gained access to improved water and improved sanitation in Mexico each decade
The information can also be presented in maps, in order to show the subnational variations of the proportion of people with improved access to water supply and sewerage. The maps are useful for the identification of subnational areas where more investments are needed.

165
Figure 4.2.2 Investments on water supply and sewerage as proportion of GDP in Mauritius
GFCF = Gross Fixed Capital Formation.
Source: Statistics Mauritius It is also important to provide information about all the financial flows associated with water supply and sewerage. This can be achieved by performing the full sequence of economic accounts for water supply and sewerage, as shown in section IV of Chapter 2. Figures 2.4.11 and 2.4.12 show a graphical presentation of the sequence of economic accounts for water supply and sewerage.

166
.III. Information about water resources management Information to be disseminated The policies related to water resources management (See quadrant II of Figure 1.2.2, of Chapter 1) require information mainly to support targets associated with improvements in the sustainable use and development of water resources. Different policy measures will be necessary to balance renewable water resources with increasing abstractions. Achieving this balance can involve policy measures either directed at reducing water demand, or increasing water supply. There is therefore some overlap with the information of the previous section, as access to improved water affects the abstraction of water resources. Reduction in water demand either requires a reduction in the losses of water incurred during conveyance and distribution and a better allocation of the resource. On the supply side, there are different options for increasing water storage and conveyance capacity. This includes the construction of dams, aqueducts, and water supply networks. The table below summarizes the types of information and indicators needed for this group of water policies.
Type of information
Common indicators for water policy design and evaluation
Presented as
Physical • Abstractions of water by the different economic activities and households.
• As proportion of Total Renewable Water Resources.
• Amount of water used26 by the different industries and households.
• Usually shown proportion of water used by the following groups of users:
o agriculture, o households, o manufacturing, mining,
and services. o cooling for electricity
production. • Losses of water in agriculture
(e.g. in conveyance systems) • Losses of water in water supply
networks (unaccounted for water or non-revenue water may be used as proxies).
• Proportion of water abstracted that is lost in the drinking water supply network and in irrigation canals.
• Storage capacity • Artificial reservoir storage capacity per capita, or as proportion of surface runoff.
• Storage capacity of lakes, aquifers, and soils.
26 Water use includes the abstractions for own use, as well as water received from other economic units (e.g. water suppliers).

167
Monetary • Water productivity by economic activity
• Ratio of Gross Value Added to Water Abstractions or Water Use by the different economic activities.
• Investments (Gross Fixed Capital Formation) in water infrastructure.
• Gross Fixed Capital Formation in different water infrastructure, as proportion of GDP.
Other • Labor intensity of drinking water supply and sanitation.
• Number of employees per water supply and sewerage connection.
Accounts and statistics related to the information to be disseminated The physical supply and use tables of the accounts show the amounts of water abstracted by the different economic activities and households. They also show the amounts of water received from other economic activities, as well as losses in distribution. The monetary supply and use tables show Gross Value Added by the different economic activities, such that the productivity ratios can be calculated. National accounts also provide information about investments (Gross Fixed Capital Formation) in water infrastructure. The previous section of this chapter includes water infrastructure directly related to drinking water supply and sewerage. This section includes investments in water supply infrastructure for irrigation, artificial reservoirs, aqueducts, and other infrastructure not directly related to drinking water supply and sewerage. How the information can be disseminated In order to present a holistic view of water supply and demand dynamics, users should be provided with information about the complete water cycle. For example, the figure below is useful for identifying the main components of the water cycle in Mexico. The figure shows that a large proportion of the rainfall is transformed into evapotranspiration, and the rest infiltrates to the aquifers or runs off through the surface. Water is then used by the different economic activities and households. Water used is then “consumed” (See concept of Final Water Use in chapter 3) or returned to inland water resources to eventually flow to the sea. In the diagram, a large proportion of the water use is for hydroelectricity.

168
Figure 4.3.1 Representation of the water cycle in Mexico
Even though the figure above is based on average flows it is helpful to fully understand water supply and demand dynamics. It is also important to construct time series of some of the relevant data.For example, a time series of precipitation, as exemplified in figure 3.2.2 in chapter 3, helps to illustrate the extent of variations in water supply conditions which policy makers are likely to face across time. Information such as this supports a more holistic approach to water management. Time series of precipitation should be presented on a monthly (see for example figure 3.2.3 in chapter 3) as well as annual basis. Dry and wet years can be identified by looking at the time series of the volume of water stored in lakes and artificial reservoirs. See for example figure 3.2.5 in Chapter 3. It is important to also show long time series of the abstractions of water through time. For example, the figure below shows a steady increase of water abstractions from 1960 to 1980 in the United States of America. Since 1980 the abstractions have not grown significantly, even though the population continues to grow.

169
Figure 4.3.2 Trends in water abstractions and population in the USA
Source: USGS 2005. Estimated Use of Water in the United States in 2005
Physical data can be combined with monetary data, and even social data, for the presentation of interrelationships between variables. For example, the figure below shows the share of GDP by economic activity in Botswana. This information is contrasted with the share of water use, as well as formal employment.
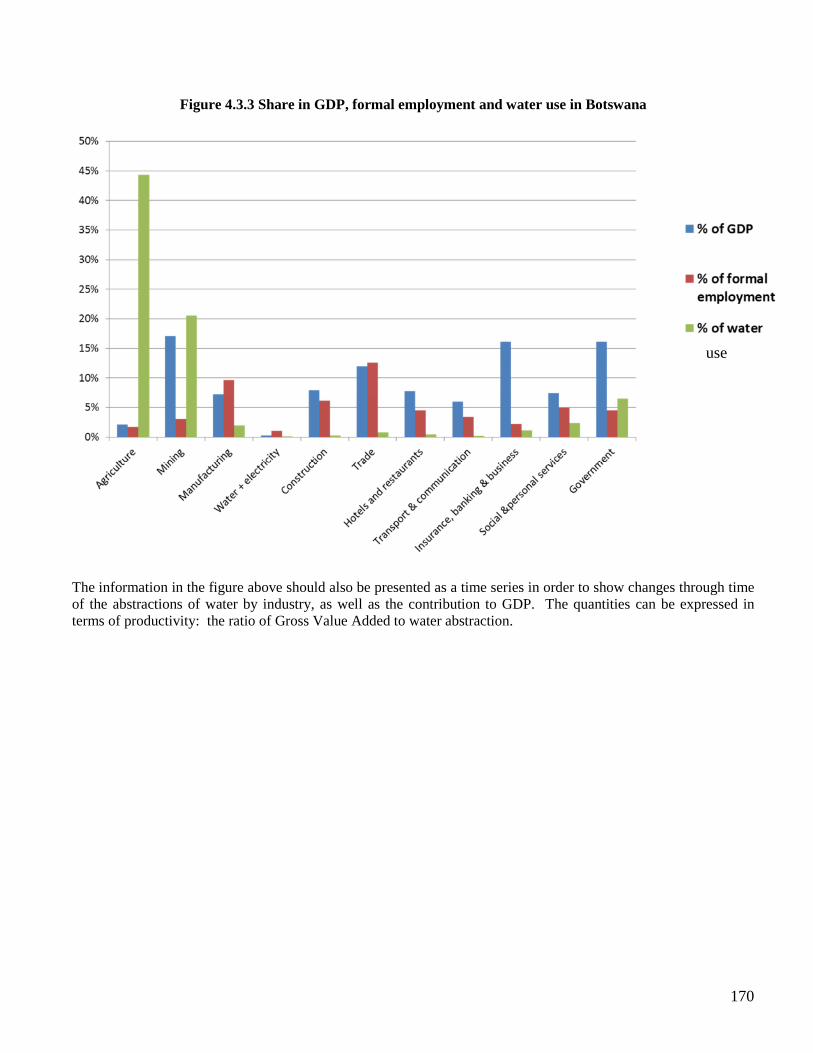
170
Figure 4.3.3 Share in GDP, formal employment and water use in Botswana
The information in the figure above should also be presented as a time series in order to show changes through time of the abstractions of water by industry, as well as the contribution to GDP. The quantities can be expressed in terms of productivity: the ratio of Gross Value Added to water abstraction.
use

171
.IV. Information related to water pollution and water quality Information to be disseminated The policies related to water pollution and water quality (See quadrant III of Figure 1.2.2 in Chapter 1) require information mainly to support targets associated with the reduction of water pollution and increasing water quality. The table below summarizes the types of information and indicators needed for this group of water policies.
Type of Information
Common indicators for water policy design and evaluation
Presented as
Physical • Wastewater treated. • Pollutants removed from
wastewater.
• Proportion of polluted wastewater that is treated.
• Proportion of pollution that is removed by wastewater treatment plants.
• Pollution generated, as measured by different parameters.
• Pollution loads generated by the different economic activities and households.
• Pollution removed by wastewater treatment plants.
• Proportion of pollution generated by economic activities and households that is removed by wastewater treatment plants.
• Water quality of different water bodies.
• Pollution parameters at different points.
Monetary • Value added per unit of pollution emitted.
• Ratio of Gross Value Added and pollution generated by economic activity or group of economic activity.
Section IV of Chapter 3 discusses the different parameters which can be measured to determine the pollution loads in wastewater. Pollution loads can be expressed in terms of different parameters (E.g. BOD5, COD, heavy metals, nitrogen, etc.)
Accounts and statistics related with the information to be disseminated The pollution loads generated by the different economic activities and households is recorded in the emission accounts, as described in section IV of Chapter 2. Emission accounts have the pollution loads generated by the different economic activities, as well as the pollution loads removed and emitted to inland water resources. This information can be contrasted with the information in monetary supply and use tables in order to generate combined indicators. In addition, the SEEA Experimental Ecosystem Accounts can provide information related to the following issues:
• Water quality. • Ecosystem carrying capacity to absorb the different type of pollutants.

172
• River fragmentation indicators. • Wetland extent. • Environmental flows. • Mean species abundance.
How the information can be disseminated The information can be presented as a time series showing the total emissions of economic activities and households in the country or territory. Emissions can be contrasted with economic growth in order to show coupling or decoupling. For example, the figure below shows emissions to water in the Netherlands. The figure shows that emissions of heavy metals and nutrients to the water courses have consistently decreased despite economic growth from 1995 to 2008.
Figure 4.4.1 Economic growth and net emissions of pollution in the Netherlands

173
.V. Information about extreme events and other relevant information Information to be disseminated The policies related to extreme hydrometeorological events (See quadrant IV of Figure 1.2.2 in Chapter 1) require information mainly to support the targets related to reducing the risk of water-related disasters. This includes information about droughts, floods, hurricanes, etc, as well as their effects on populations and economic activities. Besides the information included in the four “quadrants” or groups described in chapter 1, additional information should be collected concerning other issues, such as information related with water governance.
Accounts and statistics related with the information to be disseminated The SEEA Experimental Ecosystem Accounts can provide information related to extreme hydrometeorological events:
• Wetland extent. • Water flow regulatory services provided by the watersheds.
The information about the storage capacity provided by artificial reservoirs, lakes, aquifers, wetlands, and land, is also very important to assess the vulnerability of a country or territory to floods and droughts. Other statistics, such as time series of precipitation, frequencies of hurricanes impacting in the country or territory, maps of flood prone areas, etc, are also useful for policy design and evaluation. The information about financial flows, which is mentioned in the previous sections, is useful for evaluating water governance indicators. How the information can be disseminated Long time series of precipitation and water stored in lakes and/or artificial reservoirs are useful for the identification of drought periods, and to estimate their intensity. Indicators showing the storage capacity (natural and/or artificial) per capita are useful to assess the vulnerability to floods and droughts. Economic information from national accounts and statistics is useful for assessing the damage caused by droughts and floods.

174
.VI. International data collection initiatives There are several international initiatives collecting data from countries or agencies within countries. Some examples of international initiatives for data collection related to water are the following: FAO Aquastat survey on water, OECD-Eurostat water questionnaire, UNSD-UNEP water questionnaire, WHO and UNICEF Joint Monitoring Programme (JMP) for Water Supply and Sanitation, Global Analysis and Assessment of Sanitation and Drinking-Water (GLAAS), among others. The information compiled according to the statistical methodologies presented in these Guidelines can be used to respond to all these international initiatives. Data collected Section 1 of Chapter 3 provides a list of 30 data items which constitute a minimum set creating a comprehensive picture of the flows. The following table shows this list of data items and indicates the international initiatives which collect information for each data item.
Num
IRWS
code/SNA code
Name of Flow
Data collected by
FAO Aquastat
OECD-Eurostat
UNSD-UNEP
WHO- GLAAS
WHO-UNICEF
JMP 1 B.1 Precipitation. X X X 2 B.2 Inflows from other countries X X X 3 C.1 Evapotranspiration X X 4 H.1 Returns to Inland Water
Resources
5 E.1 Abstractions of Inland Water Resources
X X X
6 E.2 Collection of precipitation 7 E.3 Abstractions from the sea 8 I.1 Losses X X 9 F.2 Exported water X X 10 G.2 Imported water X X 11 F.1/G.1 Water supplied/Water
Received X X
12 F.3.2/G.3.2 Reused water X 13 “Water
consumption” Final Water Use in SEEA-CF
14 H.2 Returns to the sea 15 C.2.1 Outflows to neighboring
countries X X X
16 C.2.2 Outflows to the sea 17 J Waterborne releases to other
economic activities
18 K.1 Waterborne pollutant emissions to the environment from point sources
19 K.2 Waterborne pollutant emissions to the environment

175
Num
IRWS
code/SNA code
Name of Flow
Data collected by
FAO Aquastat
OECD-Eurostat
UNSD-UNEP
WHO- GLAAS
WHO-UNICEF
JMP from non-point sources
20 L.1 Output (at basic prices) of Drinking Water Supply and Sewerage Activities
TrackFin27
21 L.3 Intermediate Consumption TrackFin 22 L.2 Compensation of Employees TrackFin 23 M.1.2 Other Taxes on Production TrackFin 24 N.1.2 Other Subsidies on Production TrackFin 25 Not in IRWS Property Income TrackFin 26 Not in IRWS Current Transfers TrackFin 27 N.2 Capital Transfers TrackFin 28 P.1 Gross Fixed Capital
Formation TrackFin
29 S Population by main source of drinking water.
X
30 T Population by type of toilet and sewage disposal used.
X
FAO-Aquastat also compiles information about the storage capacity of artificial reservoirs in countries. This data item is not included in the list above, but is also part of the list of data items of the IRWS and is very important for water policy design and evaluation. None of the initiatives listed above collect information about pollution loads generated or emitted to inland water resources. Core water tables The SEEA provides great flexibility in the compilation of water accounts in order to satisfy the needs of countries with different water problems and at different levels of development. Each country can decide which accounts and tables to compile according to its own priorities identified. However, some basic information may be common to most countries and can be used to do comparisons among countries. This basic information in the accounts can be summarized in the core water tables. The core tables can be useful to collect data from countries and to make international comparisons. Core tables provide the information needed by most international questionnaires. The core water tables aim to provide the minimum information useful for policy design and evaluation. They provide both monetary and physical information in a combined presentation. As such, the core water tables give a succinct, policy relevant presentation. The core tables build upon the SEEA Central Framework, SEEA-Water, and the IRWS.
27 The TrackFin initiative is expected to collect all or most of the data items about monetary flows.

176
Table 4.6.2 SEEA core water table 1: combined physical and monetary table (preliminary)
Note 1: the codes in the tables are provided as an indication that the data items are in the IRWS. They may be to be revised. Note 2: The rows and columns highlighted in yellow show the information of most relevance to quadrant I.
Supply of water products (Currency units)
Natural water L.1.1 L.1.1 L.1.1 L.1.1 L.1.1 L.1.1 L.1.1 M.1.1.1-N.1.1.1L.1.1+M.1.1.1-
N.1.1.1
Sewerage services L.1.2 L.1.2 L.1.2 L.1.2 L.1.2 L.1.2 L.1.2 M.1.1.2-N.1.1.2L.1.2+M.1.1.2-
N.1.1.2
Natural water L.4 L.4 L.4 L.4 L.4 L.4 L.4 L.4 L.4 L.4Sewerage services L.5 L.5 L.5 L.5 L.5 L.5 L.5 L.5 L.5 L.5Other products
Use of water (Millions m3) E+G E+G E+G E+G E+G E+G E+G F.2+F.4 E+G+F.2+F.4Total Abstraction E E E E E E E E
G G G G G G G F.2+F.4 G G G+F.2+F.4Distributed water G.1+G.2 G.1+G.2 G.1+G.2 G.1+G.2 G.1+G.2 G.1+G.2 G.1+G.2 F.2 G.1+G.2 G.1+G.2 G.1+G.2+F.2Received wastewater G.3+G.4 G.3+G.4 G.3+G.4 G.3+G.4 G.3+G.4 G.3+G.4 G.3+G.4 F.4 G.3+G.4+F.4
F+H F+H F+H F+H F+H F+H F+H G.2+G.4 F+H+G2+G4F F F F F F F G.2+G.4 F+G2+G4
Distributed water/water for own use F.1+F.2 F.1+F.2 F.1+F.2 F.1+F.2 F.1+F.2 F.1+F.2 F.1+F.2 G.2 F.1+F.2+G.2Wastewater F.3.1+F.4.1 F.3.1+F.4.1 F.3.1+F.4.1 F.3.1+F.4.1 F.3.1+F.4.1 F.3.1+F.4.1 F.3.1+F.4.1 G.4.1 F.3.1+F.4.1+G.4.1Reused water F.3.2+F.4.2 F.3.2+F.4.2 F.3.2+F.4.2 F.3.2+F.4.2 F.3.2+F.4.2 F.3.2+F.4.2 F.3.2+F.4.2 G.4.2 F.3.2+F.4.2+G.4.2
H H H H H H H Hof which: losses I I I I I I I I
Water consumption (Millions m3)
P.1.1 P.1.1 P.1.1 P.1.1 P.1.1 P.1.1 P.1.1 P.1.1P.1.2 P.1.2 P.1.2 P.1.2 P.1.2 P.1.2 P.1.2 P.1.2O.1.1 O.1.1 O.1.1 O.1.1 O.1.1 O.1.1 O.1.1 O.1.1
O.1.2 O.1.2 O.1.2 O.1.2 O.1.2 O.1.2 O.1.2 O.1.2
To
tal
ISIC 01-03ISIC 05-33, 41-43
ISIC 36 ISIC 37ISIC
38,39, 45-99
Total industry
Hou
seho
lds
Gov
ern
me
nt
Total supply of productsIntermediate consumption and final use (Currency units)
Industries (by ISIC division)
Rest of the world
Taxes less subsidies on
products, trade and transport margins
ISIC 35
Actual final consumption
Gross value added (Currency units)Employment
Supply of water (Millions m3)Supply of water to other economic units
Use of water received from other economic units
Total returns
Gross fixed capital formation (Currency units)For water supplyFor sewerage/sanitation
Closing Stocks of fixed assets for water supply (Currency units)Closing Stocks of fixed assets for water sanitation (Currency units)

177
Table 4.6.3. SEEA core water table 2: water resources accounts (preliminary)
Note 1: the codes in the tables are provided as an indication that the data items are in the IRWS. They may need to be revised. Table 4.1.1 shows the SEEA core water table 1 highlighting the physical and monetary information directly related to the activities of water supply and sewerage, as well as the use of the products generated, namely natural water and sewerage services. Table 4.1.2 shows the SEEA core water table 2 with all the relevant information about the water cycle.
TotalSoil water
Artificial reservoirs
Lakes Rivers and
streams
Glaciers, snow and
ice
H.1.1.1 H.1.1.2 H.1.1.3 H.1.1.4 H.1.2 HB.1 B.1 B.1 B.1 B.1B.2 B.2 B.2 B.2 B.2 B.2
D.1 D
E.1.1.1 E.1.1.2 E.1.1.3 E.1.1.5 E.1.2 E.1.3 E.1of which for hydro power E.a.a
for cooling E.a.e
C.1 C.1 C.1 C.1 C.1C.2.1 C.2.1 C.2.1 C.2.1
C.2.2 C.2.2 C.2.2 C.2.2D.2 DOutflows to other inland water D.2
Abstraction
Evaporation & actual Outflows to other territoresOutflows to the sea
Inflows from other inland D.2Discoveries of water in
Reductions in stock
Additions to stockReturnsPrecipitationInflows from other territories
Type of water resourceSurface water Ground-
water

178
REFERENCES: United Nations Economic Commission for Europe. Making Data Meaningful: A Guide for Writing Stories About Numbers. UN 2009. ECE/CES/STAT/NONE/2009/4 Hsu, A., L.A. Johnson, and A. Lloyd. 2013. Measuring Progress: A Practical Guide From the Developers of the Environmental Performance Index (EPI). New Haven: Yale Center for Environmental Law & Policy. United Nations Statistics Division.- International Recommendations for Water Statistics.- 2012. World Health Organization. Tracking national financial flows into sanitation, hygiene and drinking-water (GLAAS working paper). 2012

179
24 June 2014 Rev 15
Chapter 5 INCORPORATING WATER ACCOUNTS AND STATIST ICS TO THE REGULAR STATISTICAL PRODUCTION PROCESS
This chapter discusses the different considerations necessary for the regular production of water accounts and statistics. The chapter addresses the issues related to the establishment of a long term program of implementation of the accounts within the National Statistics System (NSS), involving several steps which include strategic planning; coordination, monitoring and reporting; and improving statistical systems. Different tools to achieve implementation will be discussed in this chapter, such as National Strategies for the Development of Statistics (NSDS), which are the most widely used tool for statistical planning in developing countries. Their concepts are however applicable to developing and developed countries. IV. Inter-organizational collaboration • Identification of partners and stakeholders • Institutionalization process V. Strategic management cycle • Assessment of the National Statistical System • Statement of strategy and implementation • Evaluation VI. Production management cycle • Assessment of the production process • Action plan for improvement and its implementation • Evaluation
180
I. Inter-organizational collaboration Identification of partners and stakeholders The data required to compile water accounts and statistics, as explained in Chapter 3, is collected by different members of the National Statistical System (NSS), including the National Statistics Office, and several line ministries, agencies, or authorities, which will be referred to generically as agencies or organizations in this Chapter. Agencies typically involved in the production and use of water accounts and statistics include28:
• National statistical offices • Government agencies (at the national, state/provincial or local levels) responsible for:
o Water o Meteorology and hydrology o Agriculture o Environment o Energy o Central Planning o Finance (or central banks) o Geology or geological survey o Land use and land planning
• Water suppliers and sewerage service providers (government and non-government) • Water research organizations (e.g. government agencies, universities) • Non-governmental organizations (e.g. water industry associations, farmer associations)
The roles of the different agencies regarding water policy and management may be more or less centralized depending on the country. Chapter V of the IRWS provides guidance about the institutional arrangements needed. Some countries have a national Ministry of Water Resources, like in the case of China and India, or a national Ministry of Water Resources and Irrigation, like in the case of Jordan and Egypt. These ministries play a key role in defining the country’s water policies. They should therefore be among the main partners in defining the strategic planning which leads to the regular production of water accounts and statistics. Other countries may have a national water agency in charge of water management and policy definition, which may be under the coordination of a national Ministry of Environment, as is the case in Mexico. Other countries may have a decentralized arrangement, with provincial, state, or regional water ministries or agencies with autonomy of action, but possibly under the coordination of an environment ministry, as is the case of France and the United Kingdom. It is therefore essential to fully understand the legal framework which determines the roles and responsibilities of different agencies. Once this is understood, it is important to identify the key partners for initiating a long-term strategy for the production of water accounts and statistics. An agency should be identified from the beginning to sponsor and lead the initiative. In many cases two or three agencies may assume the leadership. For example, the Ministry of Water Resources, in partnership with the National Statistical Office, may decide to implement the strategy for producing water accounts and statistics in the country. These two agencies may convene the other agencies to join the initiative.
28 United Nations Statistics Division. International Recommendations for Water Statistics. 2012

181
Water accounts and statistics should also be seen as a component of a strategy with wider scope for the production of environmental-economic accounts. The production of water accounts and statistics should therefore be under the leadership or co-leadership of the country’s overall strategy for environmental-economic accounts. In some cases however, water accounts and statistics may be prioritized and defined as the initial field to be developed, leaving the inclusion of other environmental accounts and statistics for future stages.
Inter-organizational arrangements: the case of Australia
In Australia, environmental data are dispersed over numerous agencies, departments and institutes, requiring considerable effort to attain compatibility and accuracy. In its role as the NSO, the Australian Bureau of Statistics (ABS) has had a prominent role in building partnerships, alliances and collaborations to assist the development of the ABS Water Account, Australia using the SEEA-Water framework. The ABS has worked closely both formally and informally with the Department of Environment, the Bureau of Meteorology (BOM), the National Water Commission and the regional authorities to promote the use of the SEEA framework and harmonise the different standards and classifications from among the producers of environmental data. This involved a range of activities on environmental accounting including regular senior level meetings, joint membership of working groups, development of case studies and projects which incorporated both commonwealth and regional agencies, presentations to staff across agencies and the placement of an ABS officer in the BOM to provide technical advice and expertise. As well as significantly improving the timing and quality of the ABS Water Accounts and the information base for environmental policy development and monitoring, these collaborations have enhanced the skills and capabilities of staff within these agencies.
Institutionalization process Strategies defined by the leading agencies will be ineffective if they do not consider the cultural and institutional characteristics at the core of the organizations which are responsible for transforming these strategies into outcomes. Organizations and the individuals who populate them are suspended in a web of values, norms, rules, beliefs, and taken-for-granted assumptions. These cultural elements are integral to the functioning of any organisation, and specify the forms and procedures it should adopt29. As such they provide organizational blueprints and create the environment in which strategies are implemented, known by social scientists as institutions. Institutions may be defined as the rules that guide how people within societies live, work, and interact with each other.30
29 Meyer, John W. and Brian Rowan. “Institutionalized organizations: formal structure as myth and ceremony.” American Journal of Sociology 83: 340-363. 1977. 30 Millennium Ecosystem Assessment, 2005.

182
High-level management support and commitment is a crucial condition for implementing the strategies defined by the leading organizations. As part of building a strong system of management culture including values, norms and shared beliefs to support integration, senior management should focus on labor relations, human resources issues, recruitment of professionals, provision of training to all classes of staff and the development of training material. This is due to the fact that integration of accounts and statistics will change the roles and responsibilities of staff involved in their production. The institutional, organizational and legal conditions of each country may be reflected in different legislative frameworks and codes of practice. Strategic planning helps to establish within the national statistical system the institutional arrangements needed to promote the coherence of water related statistics across the entire national statistical system, and delegate responsibility from collection to data exchange, to compilation and dissemination for an efficient management of the statistical program.
Inter-organizational arrangements: the case of Brazil
In Brazil water resources data are dispersed across several institutions. Initiatives related to environmental-economic accounting began in early 1990 but only became concrete in 2012. An agreement signed by the National Institute of Geography and Statistics (IBGE), the National Statistics Office; the National Water Agency (ANA), the federal water resources authority; and the Secretariat for Water Resources and Urban Environment of the Ministry of Environment, the water resources policy coordinator, created the Committee which has the mandate to develop water accounts in Brazil (see figure below).
Figure – Water accounts inter-organizational arrangements.
The Water Accounts Committee has presented the first results in accordance with the SEEA. Historical data concerning information on physical water from 2000 to 2013 has been consolidated so far. The ANA is responsible for managing the National Hydro-Meteorological Network with water quality and quantity data coordinating the National Water Resources Information System (GIS technology) and publishing the Brazilian Water Resources Report. The Report has been published annually for the last 5 years, and is the result of a multi institutional partnership. It presents water statistics compiled from over 50 state water resources and environment institutions and about 10 federal institutions. IBGE also plays an important role in this partnership, applying a number of national surveys related to manufacturing, water supply, wastewater treatment and

183
agriculture activities. Some adjustment to these surveys will be necessary to improve data collection for water accounts. The Ministry of Environment coordinates the process of environmental data collection. This collaborative process among institutions related to water, statistics and environment, has improved data quality and provided the institutional arrangements necessary to enable to process of generating water accounts.
Inter-organizational arrangements are instrumental for the implementation of a process to produce water accounts and statistics. The coordination and governance functions and responsibilities of the lead statistical agency in the country can be carried out more efficiently if this role is supported by inter-organizational arrangements such as advisory committees, relationship meetings, memorandums of understanding, service level agreements and technical cooperation. These mechanisms of structured communication, coordination and governance arrangements between all suppliers of data at the national level provide cohesion across the statistical system for the production of integrated water accounts and statistics. From strategic planning to production The leading partners in a country, in collaboration with the various stakeholders, should develop a long-term plan or strategy to implement water accounts, usually as part of a wider strategy of implementation of environmental-economic accounts. Strategic planning should be translated into operational planning, involving specific programs, projects, and processes. Strategic planning is in fact a never ending cycle of continuous adaptation to the realities encountered in the implementation process. The next section will therefore present strategic planning in the form of a strategic cycle. Once the process of production of accounts is in place, another cycle, more operational in nature, is set in place. This is referred to as the cycle of production in the next sections. Both cycles are interrelated. The strategic cycle provides resources to the production cycle by getting high level sponsorship from the different partners and sponsors. The production cycle is responsible for delivering the high quality outputs needed by the different users of the information. There are several project management methodologies and standards which are useful for the implementation of the accounts in countries. For example, the Project Management Institute, a not-for-profit professional organization for the project management profession, has developed several tools for implementing organization wide processes, such as the Organizational Project Management Maturity Model (OPM3). This model is a standard developed precisely to translate strategy into successful outcomes.

184
II. Strategic management cycle The most important consideration is to see strategic management as a continuous process, and the preparation of the initial document represents only the beginning. To be effective, statistical systems must remain flexible and be able to respond to new demands for data in a changing environment. Any long-term or medium-term plan will therefore inevitably require modification in the light of experience. As such the strategic management process should build in mechanisms to monitor and evaluate progress, to review the strategy and to make modifications when required31. This continuous process is illustrated in the figure below as the strategic cycle. A similar continuous process or cycle should also exist at the operational or production level, as illustrated in figure 5.3.1. The interconnected elements of the cycle are described below. Assessment of the National Statistical System The long-term strategy should start with the assessment of the current status of the National Statistics System (NSS) in the production of water accounts and statistics. Based on the assessment a strategy for the production of water accounts and statistics should be developed, and the strategy should lead to action plans which are implemented and then managed with regular feedback, monitoring, and adaptation. The data necessary for water accounts and statistics come from a wide variety of sources, which involve a wide variety of actors. The implementation strategy should therefore seek the involvement of all relevant stakeholders. It will require coordinating mechanisms, which vary depending, among other things, on how the different water policy and management tasks are shared by the different government agencies.
31 Paris 21 Secretariat.- A Guide to Designing a National Strategy for the Development of Statistics (NSDS).- November 2004

185
Figure 5.2.1 Strategic Cycle
The assessment should address the following issues:
• Policy needs of information • Legal and institutional framework, linkages, and coordination • Methodologies and quality of statistics • Taking stock of the existing capacity for data needs and to fill data gaps • Identify key statistical outputs against agreed quality criteria
The policy needs of information can be evaluated with the four quadrants for grouping water information presented in Chapter 1. For the legal and institutional framework, linkages, and coordination it is important to identify the mandates of the agencies providing the data described in Chapter 3. The issue of inter-organizational arrangements has been addressed in the section above. Statement of strategy and implementation A statement of strategy, taking into account the national and regional policy needs, is an important step to establish a road map for developing the required scope, detail and quality of water accounts and statistics. For this purpose, it is proposed that countries establish a statement of strategy for the implementation of the 2012 SEEA, and within the SEEA, the SEEA-Water, and supporting statistics at the national level. This statement can be incorporated in the review of the National Strategy for the Development of Statistics (NSDS) that will be described below.

186
The statement of strategy aims to establish the set of actions to accomplish statistical and institutional goals for the sustainable improvement of water accounts and statistics programmes, while ensuring adherence to best practices in official statistics. In developing the statement of strategy, consultations are needed, preferably in a national seminar, with all stakeholders, policy planners and other users including the academia and business community. Such a discussion is expected to help the leading agencies to prioritize the problem areas and ultimately write a plan for the improvement of the supporting statistics with a view to compile water accounts and statistics within the framework of the 2012 SEEA, SEEA-Water, and the International Recommendations for Water Statistics (IRWS).32 The statement of strategy should include a mandate, a mission statement, values, high level goals, specific goals, and required activities. The mission statement, values, and high level goals can be part of a larger program, rather than just for water, which may include a whole set of environmental accounts and statistics. The required activities are part of the action plan, which is described below. The strategies have to be properly and effectively implemented through a costed and time-bound action plan, including, if needed, a financial plan incorporating proposals for external assistance.33 An NSDS is a tool expected to provide a country with a strategy for strengthening statistical capacity across the entire national statistical system (NSS). The NSDS will provide a vision for where the NSS should be in five to ten years and will set milestones for getting there. It will present a comprehensive and unified framework for continual assessment of evolving user needs and priorities for statistics and for building the capacity needed to meet these priorities in a more coordinated, synergistic and efficient manner. It will also provide a framework for mobilising, harnessing and leveraging resources (both national and international) and a basis for effective and results-oriented strategic management of the NSS.34 NSDS is the most widely used tool for statistical planning in developing countries, but its concepts are applicable to developing and developed countries. It provides guidance for developing a strategic plan of implementation, which allows the NSS to respond to policy needs. The NSDS is designed through a participatory process led by national authorities, in close collaboration with key actors in the NSS. Whether the NSDS approach is successful or not depends to a great extent on: i) a significant political commitment at the highest level; ii) the degree to which the country is committed to this approach and the intensity of the dialogue between producers and users; iii) the mobilization of necessary resources; and iv) the quality of the dialogue with technical and financial partners (TFPs).35
32 United Nations Statistics Division. Developing a global programme for the implementation of the 2008 SNA and supporting statistics 33 Paris 21 Secretariat.- A Guide to Designing a National Strategy for the Development of Statistics (NSDS).- November 2004 34 Paris 21 Secretariat.- A Guide to Designing a National Strategy for the Development of Statistics (NSDS).- November 2004 35 Paris 21 Secretariat.- The NSDS Approach in a Nutshell.

187
Evaluation In the strategic cycle, the evaluation should provide information about how the information produced has had an impact on policy decisions, as well as to identify the information gaps. Partners and stakeholders need to be consulted in order to evaluate the effectiveness of the strategy for the production of water accounts. The evaluation should consider issues such as inter-organizational collaboration. Evaluation should consider whether institutional changes are taking place as stated in the strategy. Issues such as the credibility of the data produced should also be evaluated. The evaluation should consider whether there is professional independence and accountability of statistical agencies essential to ensure public trust. The principles of official statistics adopted by the General Assembly of the United Nations provide a good basis for evaluating the NSS and provide recommendations for improving the strategies.

188
.III. Production management cycle Assessment of production processes The previous chapters of these Guidelines provide recommendations on how to collect data and compile it to produce information relevant for water policies. However, producing water accounts and statistics once is not enough. It is necessary to develop a process of sustained and regular production of the information so that trends can be identified. It is therefore necessary that accounts become the result of a regular process of production. The production process can be seen as a cycle of continuous improvement, as illustrated in the figure below, aimed at producing high quality data for different users of the information.
Figure 5.3.1 Production Cycle
The cycle starts with the assessment of the production process. In a first round this may mean the assessment of the pilot accounts or the first edition of the accounts. It could also be the assessment of the existing production process of water and/or environment statistics. From this assessment an action plan for improvement may be designed.

189
From strategic planning to data collection processes in Colombia
Colombia’s National Statistical Office, DANE, has been compiling environmental accounts for over 15 years. In the past few years there has been growing interest in water statistics and accounts partially due to the devastating impacts the La Niña phenomenon had on the country in 2010 and 2011. Between 2011 and 2012 DANE coordinated a national process to elaborate a data collection strategy for water statistics as a first step in the establishment of a water statistics program. To elaborate the strategy a multi-stakeholder platform was set-up consisting of the key actors in the water policy and water information sectors. Approximately 11 institutions participated, including the Institute of Hydrology, Meteorology and Environmental Studies, the Ministry of Environment and the Superintendence of Public Household Services among others. The group followed the recommendations set out in the IRWS, and implemented a process that consisted of the following steps: i) determination of data needs through dialogue with users; ii) a review of existing water statistics, iii) an exercise to prioritize data for collection; iv) agreement on the roles and responsibilities for producing the water statistics and; v) elaboration of a document which outlines the data collection strategy. From the strategy, processes were developed in order to regularly produce statistics for monitoring Colombia’s National Integrated Water Management Policy, to publish the National Water Study, to compile water accounts, to generate information that is required by regional and urban water authorities, and to respond to several international initiatives.
Action plan for improvement and its implementation The International Recommendations for Water Statistics (IRWS) provide guidelines for implementation, which are useful for developing the action plan. Based on the action plan for improvement of the process of production, priorities need to be set in order to develop a list of required activities. Priorities should be established in terms of data items, geographic areas of the country where the accounts will be prepared, frequency of data production, and the disaggregation of data by industries. See section E of Chapter V of the IRWS. Since most likely the action plan will include activities to be developed by different agencies, it is important to clarify the roles and responsibilities of each of the actors. The strategic cycle should provide the inter-organizational arrangements needed for the execution of the action plan. See section F of Chapter V of the IRWS for a more detailed explanation of issues regarding roles and responsibilities of the actors involved in the preparation of water accounts and statistics. The list of recommended data items presented in Annex I of the IRWS can be used as a checklist for developing the action plan. Each data item can be assigned a priority, and responsibilities can be assigned to the different agencies to collect the data with quality specifications and within a time frame. Section 1 of Chapter 3 presents a list of prioritized data items with project “cards” which may be useful for developing the action plan. Administrative records from water and wastewater utilities and from water ministries or agencies may be invaluable sources of data. They may replace existing censuses and surveys, providing accurate data at lower costs. A constant dialogue should therefore be established with the relevant agencies. In many cases

190
there are intermediate organizations who collect the data, such as water utility associations or regulators of the water supply and sewerage industries. The action plan should consider all the possible methods of improving the process. Quality of official statistics is a central concern for all national statistical offices (NSOs). At the 2010 session of the UNSC, it was proposed that NSOs developed a National Quality Assurance Framework (NQAF) for the production of their official statistics. An expert group meeting was organized to develop guidelines for the implementation of NQAF. Quality is best defined with the broad notion of fitness for purpose. The consensus among statistical agencies is that that the concept of fitness for purpose of statistical information is multi-dimensional and that there is no one single measure of data quality. Examples of the common quality dimensions or components include:
1. relevance; 2. accuracy; 3. reliability; 4. timeliness; 5. punctuality; 6. accessibility; 7. clarity; 8. interpretability; 9. coherence; 10. comparability; 11. credibility; 12. integrity; 13. methodological soundness; 14. and serviceability.
The dimensions of quality are overlapping and interrelated and, therefore, the adequate management of each of them is essential if information is to be fit for purpose36. All these different dimensions of quality should be considered in the design of the action plan for improvement of the process of production of water accounts and statistics. Evaluation The continuous process of improvement of water accounts and statistics requires constant feedback from the users of the information. Many users of the information are also suppliers of the data required for the accounts, such as the ministries and agencies for water. The quality of the data produced should be evaluated. Quality is usually defined using the broad notion of fitness for purpose.. The following characteristics may be evaluated: accuracy, timeliness, accessibility, interpretability, and comparability. The results of the evaluation will be useful for a new assessment of the production process, which will lead to a new plan of action for the next cycle.
36Expert Group on NQAF. Guidelines on NQAF. 2008

191
The frequency of publishing accounts and statistics is an important element to consider. The additional resources needed to increase the frequency of publication may well offset the value of maintaining a network of information suppliers and users of the information, the latter providing constant feedback to the process. REFERENCES:
United Nations Statistics Division. Developing a global programme for the implementation of the 2008 SNA and supporting statistics Paris 21 Secretariat.- A Guide to Designing a National Strategy for the Development of Statistics (NSDS).- November 2004. Paris 21 Secretariat.- The NSDS Approach in a Nutshell. International Monetary Fund. Data Quality Reference Site. http://dsbb.imf.org/pages/dqrs/home.aspx Expert Group on NQAF. Guidelines on NQAF. 2008 Project Management Institute. Organizational Project Management Maturity Model Millennium Ecosystem Assessment, 2005. Ecosystems and Human Well-being: Synthesis. Island Press, Washington, D.C. United Nations Statistical Commission (Room Documents for the 43rd Session).- Guidelines on Integrated Economic Statistics .- March 2012 http://unstats.un.org/unsd/statcom/doc12/RD-IntegratedEcoStats.pdf