water environment issues in indonesia: challenges and ... · water environment issues in indonesia:...
TRANSCRIPT

Water Environment Issues in
Indonesia: Challenges and
Opportunities
Prof. Tjandra Setiadi
Centre for Environmental Studies
Institut Teknologi Bandung (ITB)
Bandung, Indonesia
1
Presentation Outline
Water Environment In
Indonesia
Case Studies
Water Challenges
and Opportunities
in Indonesia
Examples of Colalboration
2

Water Environment in Indonesia
3

Introduction
Indonesia water resource:
6 % of world water
resource
21% of asia pasific water
resource
4

5

6

Four Water Classes (Quality)(Government Regulation No 82 Year 2001
• Class I : Best Quality designated for raw water for water supply; and include Class II till IV (BOD < 2 mg/L)
• Class II : designated for water sport activities (not a direct contact) and include Class III and IV (BOD <3 mg/L)
• Class III: designated for fishery (aquaculture) and include Class IV (BOD < 6 mg/L)
• Class IV : designated for irrigation (BOD < 12 mg/L)
• For most of the rivers in Indonesia: intended to be Class II.
7
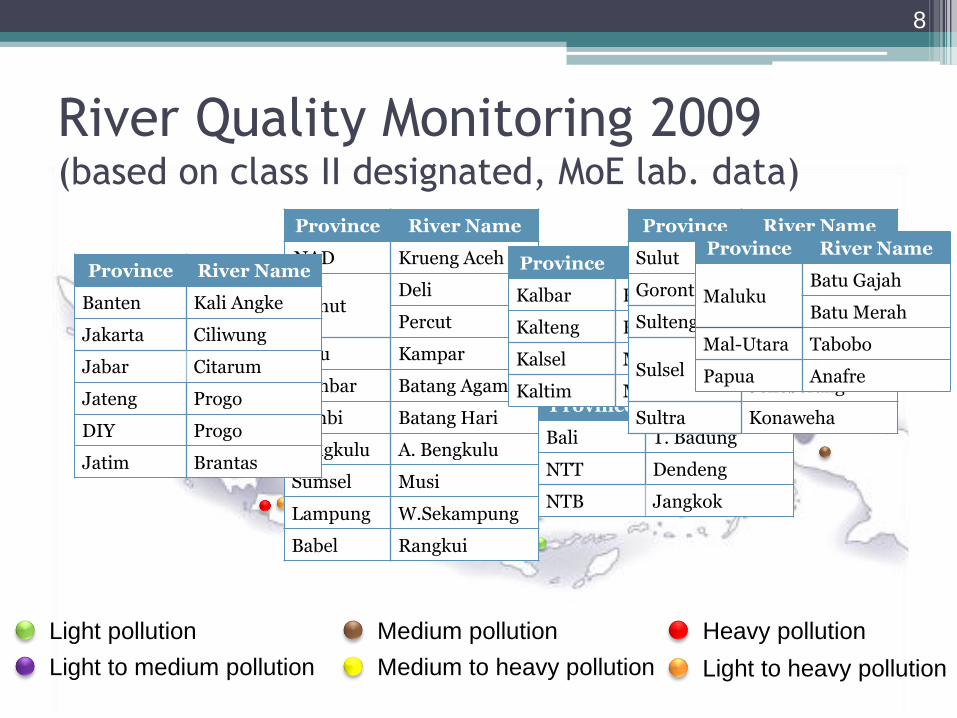
River Quality Monitoring 2009(based on class II designated, MoE lab. data)
Light pollution
Light to medium pollution
Medium pollution
Medium to heavy pollution
Heavy pollution
Light to heavy pollution
Province River Name
NAD Krueng Aceh
SumutDeli
Percut
Riau Kampar
Sumbar Batang Agam
Jambi Batang Hari
Bengkulu A. Bengkulu
Sumsel Musi
Lampung W.Sekampung
Babel Rangkui
Province River Name
Banten Kali Angke
Jakarta Ciliwung
Jabar Citarum
Jateng Progo
DIY Progo
Jatim Brantas
Province River Name
Bali T. Badung
NTT Dendeng
NTB Jangkok
Province River Name
Kalbar Kapuas
Kalteng Kahayan
Kalsel Martapura
Kaltim Mahakam
Province River Name
Sulut Tondano
Gorontalo Bone
Sulteng Palu
SulselTallo
Jeneberang
Sultra Konaweha
Province River Name
MalukuBatu Gajah
Batu Merah
Mal-Utara Tabobo
Papua Anafre
8

Light pollution
Light to medium pollution
Medium pollution
Medium to heavy pollution
Heavy pollution
Light to heavy pollution
Sumatera
Java
KalimantanSulawesi
Papua
Bali & Nusa Tenggara
Maluku
River Quality Monitoring 2009(based on class II designated, MoE lab. data)
9

Light pollution
Light to medium pollution
Medium pollution
Medium to heavy pollution
Heavy pollution
Light to heavy pollution
Sumatera
Java
KalimantanSulawesi
Papua
Bali & Nusa Tenggara
Maluku
River Quality Monitoring 2013(based on class II designated, MoE lab. data)
10

River Quality Monitoring (percentage of heavy-polluted river in Indonesia
2009 - 2013)
11

Water Resources Degradation
Domestic activites
Industry activities either small and big scale
Agriculture and mining
Deforestration in the upper part of the river
stream
12

Banten Province
Case Study
13

Map of Banten Province
Tanggerang
City
Tanggerang
RegencySerang
City
Cilegon City
Serang Regency
Pandeglang RegencyLebak Regency
14

CIUJUNG
CIBANTEN
CID
UR
IAN
DAS BAYAH
CIDANAU
CIBALIUNG
Banten Province
BANTEN HAS 13 WATERSHEDS
15
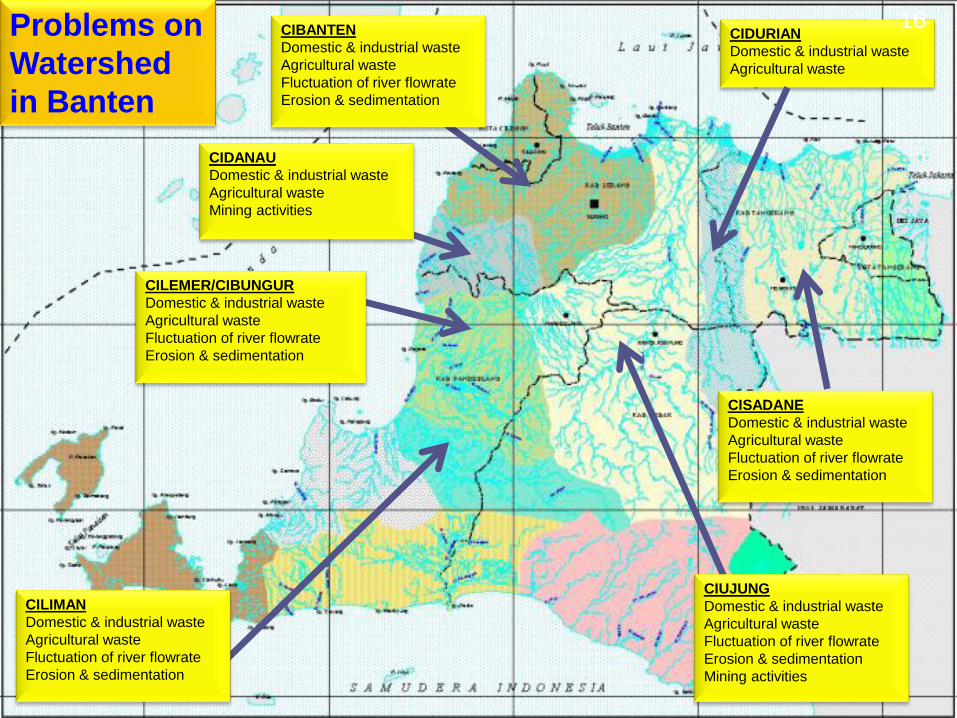
CIDURIAN
Domestic & industrial waste
Agricultural waste
Problems on
Watershed
in Banten
CIBANTEN
Domestic & industrial waste
Agricultural waste
Fluctuation of river flowrate
Erosion & sedimentation
CIDANAU
Domestic & industrial waste
Agricultural waste
Mining activities
CILEMER/CIBUNGUR
Domestic & industrial waste
Agricultural waste
Fluctuation of river flowrate
Erosion & sedimentation
CISADANE
Domestic & industrial waste
Agricultural waste
Fluctuation of river flowrate
Erosion & sedimentation
CIUJUNG
Domestic & industrial waste
Agricultural waste
Fluctuation of river flowrate
Erosion & sedimentation
Mining activities
CILIMAN
Domestic & industrial waste
Agricultural waste
Fluctuation of river flowrate
Erosion & sedimentation
16

Citarum River – West Java Province
Case Study
17

18
BOD Load from Industry: source : Data Team Leader ICWRMIP Sub.Comp..1

• Discharge Load of TN and TP
Discharge LoadTN TP
Pollution level
source : Data Team Leader ICWRMIP Sub.Comp..1

Source: ISTAT, C. Costantino, F. Falcitelli, A. Femia, A. Tuolini, OECD-Workshop, Paris, May 14–16, 2003)
What has happened can be explained by the following diagram:

Water Risks or Challanges:
In Indonesia
• Decreasing Water Availability and Reliability of Supply.
• Declining Water Quality
• Failure to Meet Basic Water Needs.
21
Opportunities
• At the same time, these risks present possible opportunities for the water industries that produce technologies and provides services for meeting water needs.
• Careful analysis of opportunities and needs may prove valuable to corporations and investors who are seeking to capitalize on smart and effective solutions to water problems.
22

Example of Collaboration ITB with
Japanese Companies:
- Low Cost Membrane – Asahi Kasei
- MBR – Toray Membrane
-MBR – Industrial Scale
23
Low-cost water treatment system using submerged
membrane filtration in developing countries
Taro Miyoshia,*, Tjandra Setiadib, Agus Jatnika Effendic, Hiroyuki Maedad,
Takashi Tsukarahad, Hosang Yid, Hyoyong Jund, Masao Saitoe, Hideto
Matsuyamaa,**
a Center for Membrane and Film Technology, Department of Chemical Science
and Engineering, Kobe University, Kobe, Japan b Centre for Environmental Studies, Institut Teknologi Bandung (ITB),
Bandung, Indonesia c Department of Environmental Engineering, Institut Teknologi Bandung (ITB),
Bandung, Indonesiad Microza & Water Processing Division, Asahi Kasei Chemicals Corporation,
Tokyo, Japan e Center for Collaborative Research and Technology Development, Kobe
University, Kobe, Japan
Journal: Desalination and Water Treatment, 1-8, 2015.
24
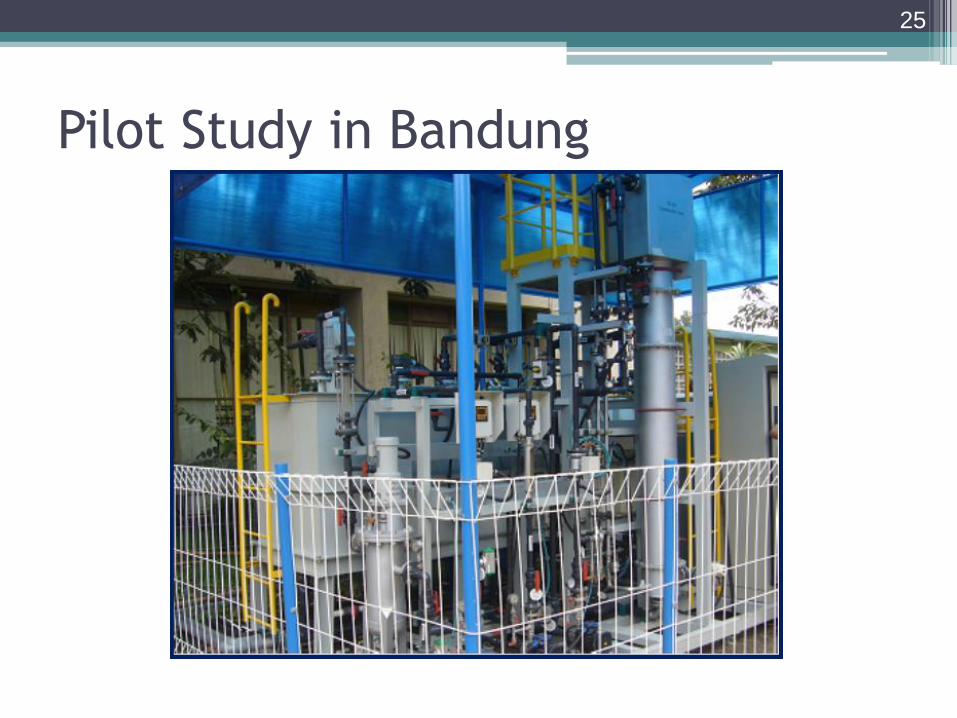
Pilot Study in Bandung
25

Conclusions of the study
• The applicability of submerged membrane filtration without any chemical dosing to the treatment of river water containing high turbidity was investigated.
• The operation of the pilot-scale submerged membrane filtration unit was very stable and can be continued for three months without any irregular membrane cleanings.
• Increase in membrane flux and decrease in frequency of regular maintenance cleaning did not affect the rate of membrane fouling development.
• Owing to its higher membrane flux and less frequent maintenance cleaning, operating expenditure of the membrane based water treatment system was equal or even lower in comparison to the conventional water treatment system based on coagulation, sedimentation, and sand-filtration.
26

Application of MBR for treating
Produced Water from an oil and
gas company
27

Characteristics of the Produced Water• High TDS
• Fluctuated COD (300 – 4000 mg/l, including data from pilot test)
• High oil and grease
28
No. Parameter Unit Max. Value
1 Total Dissolved Solids mg/L 4000
2 Temperature ° C 40
3 pH pH Units 6 - 9
4 Hydrogen Sulfide (H2S) mg/L 0.5
5 Ammonium (NH3-N) mg/L 5
6 COD mg/L 200
7 Phenol mg/L 2
8 Oil and Grease mg/L 25
Regulation

Pilot Test PerformanceSchematic Diagram: Flat-Sheet Toray membrane
29

Pilot Test PerformanceMLSS Profile (Until 1 July 2015)
30
Day
0 20 40 60 80
ML
SS
(p
pm
)
0
2000
4000
6000
8000
10000
MLSS
Acclimatization Finished
Level Control Break
• Acclimatized well• Remain stable until
level-control break
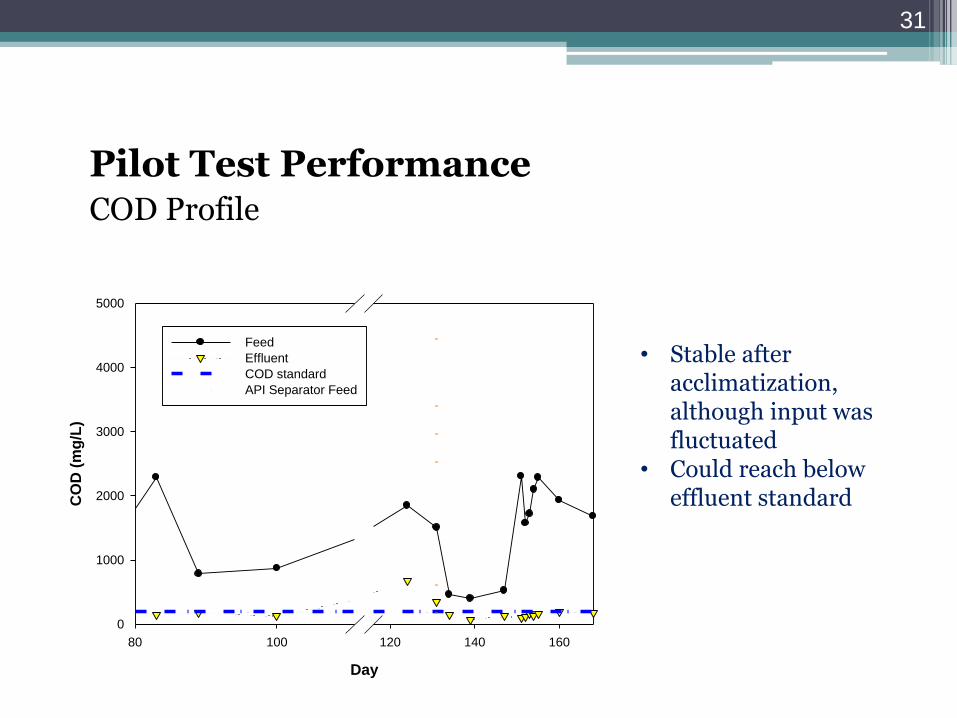
Pilot Test PerformanceCOD Profile
31
• Stable after acclimatization, although input was fluctuated
• Could reach below effluent standard
Day
80 100 120 140 160
CO
D (
mg
/L)
0
1000
2000
3000
4000
5000
Feed
Effluent
COD standard
API Separator Feed

Pilot Test PerformanceOil Content Profile
32
• Oil is totally removed by membrane
• Could be a problem, therefore use DAF in real plant
• Not problem in this test if performs membrane cleaning
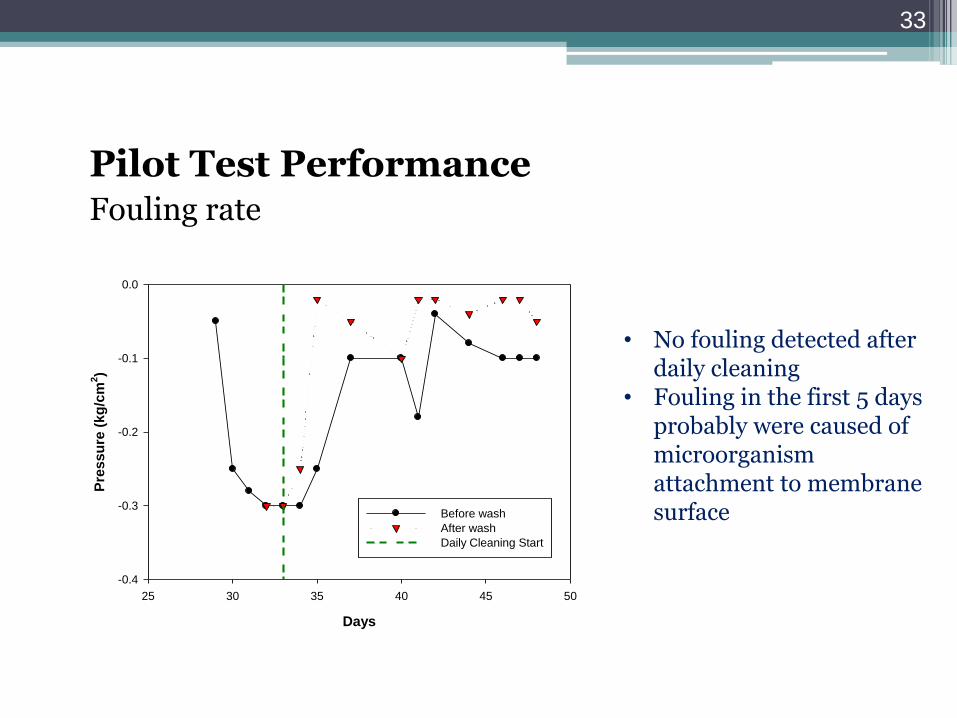
Pilot Test PerformanceFouling rate
33
• No fouling detected after daily cleaning
• Fouling in the first 5 days probably were caused of microorganism attachment to membrane surface
Days
25 30 35 40 45 50
Pre
ss
ure
(k
g/c
m2)
-0.4
-0.3
-0.2
-0.1
0.0
Before wash
After wash
Daily Cleaning Start

Application of MBR Treating 1
ton COD per day from an
Oleochemical Industry
34

MBR during construction
35

MBR after 6 months operation
36

West HallINSTITUT TEKNOLOGI BANDUNG
37