water energy nexus - international energy agency · water-energy nexus introduction water and...
TRANSCRIPT

WaterEnergyNexus
Excerpt from the World Energy Outlook 2016

INTERNATIONAL ENERGY AGENCY
The International Energy Agency (IEA), an autonomous agency, was established in November 1974. Its primary mandate was – and is – two-fold: to promote energy security amongst its member
countries through collective response to physical disruptions in oil supply, and provide authoritative research and analysis on ways to ensure reliable, affordable and clean energy for its 29 member countries and beyond. The IEA carries out a comprehensive programme of energy co-operation among its member countries, each of which is obliged to hold oil stocks equivalent to 90 days of its net imports. The Agency’s aims include the following objectives:
n Secure member countries’ access to reliable and ample supplies of all forms of energy; in particular, through maintaining effective emergency response capabilities in case of oil supply disruptions.
n Promote sustainable energy policies that spur economic growth and environmental protection in a global context – particularly in terms of reducing greenhouse-gas emissions that contribute to climate change.
n Improve transparency of international markets through collection and analysis of energy data.
n Support global collaboration on energy technology to secure future energy supplies and mitigate their environmental impact, including through improved energy
efficiency and development and deployment of low-carbon technologies.
n Find solutions to global energy challenges through engagement and dialogue with non-member countries, industry, international
organisations and other stakeholders.IEA member countries:
Australia Austria
Belgium Canada
Czech RepublicDenmark
EstoniaFinland
FranceGermany
GreeceHungary
Ireland Italy
JapanKoreaLuxembourgNetherlandsNew Zealand NorwayPolandPortugalSlovak RepublicSpainSwedenSwitzerlandTurkey
United KingdomUnited States
The European Commission also participates in
the work of the IEA.
© OECD/IEA, 2016International Energy Agency
9 rue de la Fédération 75739 Paris Cedex 15, France
www.iea.org
Please note that this publication is subject to specific restrictions that limit its use and distribution.
The terms and conditions are available online at www.iea.org/t&c/
Together
SecureSustainable

Introduction
Water and energy underpin economic and social development. Water is needed for each stage of energy production, and energy is crucial for the provision and treatment of water. This interdependency has significant implications for both energy and water security. With both water and energy needs set to increase, it has become ever more important to understand the linkages between the two, to anticipate future stress points and to implement policies, technologies and practices that soundly address the associated risks.
In the energy community, much of the attention has centred on the impact of water availability on the different processes of the energy sector and the energy sector’s impact on water quality and quantity. The World Energy Outlook (WEO) assessed this very topic in 2012 and in the years since, has provided deep dives on different components of this issue, including the impact of water scarcity on coal-fired power plants in India and China.
What is less well understood is how much energy the water sector uses—this information is vital if we are to identify chokepoints and implement effective solutions. To this end, in addition to updated projections for future freshwater requirements for energy production under different scenarios, this excerpt from the World Energy Outlook 2016 undertook analysis to provide a first systematic global estimate of the amount of energy used to supply water to consumers. It assesses how much energy is required for a range of processes in the water industry, including wastewater treatment, distribution and desalination and how these needs might grow over the next 25 years. It also lays out where existing energy efficiency and energy recovery potentials can be exploited.
The chapter draws on the broader analysis and modelling in the World Energy Outlook 2016 and makes reference to two scenarios. Based on a detailed review of policy announcements and plans, the New Policies Scenario reflects the way that governments, individually or collectively, see their energy sectors developing over the coming decades. Its starting point is the policies and measures that are already in place, but it also takes into account, in full or in part, the aims, targets and intentions that have been announced, even if these have yet to be enshrined in legislation or the means for their implementation are still taking shape. The climate pledges, known as Nationally Determined Contributions (NDCs), that are the building blocks of the Paris Agreement provide a rich and authoritative source of guidance for this scenario.
The decarbonisation scenario referred to in this excerpt is the 450 Scenario and it is quite different in design from the New Policies Scenario. The New Policies Scenario starts with certain assumptions on policy and then sees where they take the energy sector. The 450 Scenario starts from a certain vision of where the energy sector needs to end up and then work back to the present. The objective of this scenario is to limit the average global temperature increase in 2100 to 2 degrees Celsius above pre-industrial levels.
More information on the assumptions that underpin this analysis is available in Chapter 1 of the World Energy Outlook 2016, which is available to download.
1Water-energy nexus© O
ECD
/IEA
, 201
6

Making this excerpt available for World Water Day is an attempt to draw attention to critically important issues on both sides of the energy-water nexus. The findings show that there are ways to mitigate risks. Policies and technologies already exist that can help ease chokepoints and reduce demand in both sectors, meaning that water does not have to be a limiting factor for the energy sector and a rise in water demand does not have to be accompanied by an equal rise in energy demand. However, there are trade-offs to consider and successful action will require a strong, coordinated focus across different branches and levels of government, as well as collaboration between policy-makers, researchers, industry and consumers. This report bears witness to the importance and benefits of such collaboration, as many research institutions, companies and experts provided input to make this report a success.
2 World Energy Outlook 2016 Excerpt© O
ECD
/IEA
, 201
6

Acknowledgements
This study was prepared by the WEO Energy Outlook (WEO) team in the Directorate of Sustainability, Technology and Outlooks (STO) as part of the 2016 edition of the WEO, in co-operation with other directorates and offices of the Agency. The principal authors were Fabian Kęsicki and Molly A. Walton, who co-ordinated and co-led the work. Tim Gould and Laura Cozzi, Heads of the WEO Energy Supply Outlook and Energy Demand Outlook Divisions, designed and directed the study, and the Director of STO, Kamel Ben Naceur, provided guidance throughout. Other principal contributors were Paul Hugues, Rakyung Park, and David Wilkinson, alongside contributions from Stéphanie Bouckaert, Davide D’Ambrosio, Nathan Frisbee, Paweł Olejarnik, Johannes Trüby and Brent Wanner. Teresa Coon provided essential support.
Robert Priddle carried editorial responsibility.
The study benefited from numerous inputs, comments and feedback from senior IEA management and IEA experts, in particular: Paul Simons, Laszlo Varro, Alessandro Blasi, Aad van Bohemen, Joerg Husar, Eric Masanet, Philippe Benoit, Cedric Philibert, Caroline Lee, Jacob Teter and David Townsend. Xavier Leflaive from the OECD also contributed to the report. Sebastien Postic (MINES ParisTech, France), Adriano Vinca and Marianna Rottoli (both from the Politecnico di Milano) provided valuable input to the analysis. Thanks go to the IEA’s Communication and Information Office for their help in producing the final report, particularly Astrid Dumond for production and to Bertrand Sadin for graphics. Debra Justus was the copy-editor.
The work could not have been achieved without the support, data and advice provided by Danfoss; International Institute for Applied Systems Analysis (IIASA); University of Kassel; Utrecht University; and the World Resources Institute. We would also like to thank the Danish Environmental Protection Agency; Empresa de Pesquisa Energética (EPE); General Electric; KAPSARC; Masdar; Peking University; Schlumberger; Ministry of Energy, Chile; Veolia; and the World Bank who provided consultations that contributed to the report.
Many senior government officials and international experts provided input and reviewed the draft of the report. Their comments and suggestions were of great value. They include:
Noel Bakhtian Independent expert Lily Baldwin Chevron Diana Bauer Department of Energy, United States David Bijl Utrecht University, Netherlands Rina Bohle Zeller Vestas Adam Carpenter American Water Works Association Lauren Fillmore Water Environment & Reuse Foundation Arjen Y Hoekstra University of Twente, Netherlands Aksel Jepsen Danfoss Carey King University of Texas at Austin, United States Richard Lavergne Ministry of Environment, Energy and the Sea, France
3Water-energy nexus© O
ECD
/IEA
, 201
6

Tianyi Luo World Resources Institute Jordan Macknick National Renewable Energy Laboratory, United States Rory Moses McKeown World Health Organisation Alessandro Nardella ENI Frank Niele Royal Dutch Shell Sugam Rudresh Council for Energy, Environment and Water, India Nort Thijssen Royal Dutch Shell Jay Wagner Plexus Energy Mads Warming Danfoss Alistair Wyness IPIECA Water Working Group Zhilong Zhang Shenhua Group
The individuals and organisations that contributed to this study are not responsible for any opinions or judgments it contains. All errors and omissions are solely the responsibility of the IEA.
Comments and questions are welcome and should be addressed to:
Tim Gould Directorate of Sustainability, Technology and Outlooks International Energy Agency 9, rue de la Fédération 75739 Paris Cedex 15 France
Email: [email protected]
More information about the World Energy Outlook is available at www.worldenergyoutlook.org.
4 World Energy Outlook 2016 Excerpt© O
ECD
/IEA
, 201
6
Executive Summary
Energy needs water, water needs energy; and these linkages have enormous significance for economic growth, life and well-being. Water is essential for all phases of energy production, from fossil fuels to biofuels and power plants: energy use is vital for a range of water processes, including water distribution, wastewater treatment and desalination. Almost all the weaknesses in the global energy system, whether related to energy access, energy security or the response to climate change, can be exacerbated by changes in water availability. Almost all of the fault lines in global water supply can be widened by failures on the energy side.
The inter-dependencies between energy and water are set to intensify in the coming years, as the water needs of the energy sector rise. The energy sector is responsible for 10% of global water withdrawals, mainly for power plant operation as well as for production of fossil fuels and biofuels. In our main scenario, these requirements grow over the period to 2040: water withdrawals for the energy sector rise by less than 2% to reach over 400 billion cubic metres (bcm), while the amount of water consumed (i.e. that is withdrawn but not retuned to a source) increases by almost 60% to over 75 bcm. In the power sector there is a switch to advanced cooling technologies that withdraw less water, but consume more. A rise in biofuels demand pushes up water use and greater deployment of nuclear power increases both withdrawal and consumption levels.
On the other side of the energy-water equation, this WEO provides a first systematic global estimate of the energy used to supply water to consumers, a source of demand that is set to grow rapidly over the coming decades. Today, the amount of energy used in the water sector is almost equivalent to the entire energy demand of Australia. Most of this is in the form of electricity; in 2014 some 4% of global electricity consumption was used to extract, distribute and treat water and wastewater, along with 50 million tonnes of oil equivalent of thermal energy, mostly diesel used for irrigation pumps and gas in desalination plants. Over the period to 2040, the amount of energy used in the water sector is projected to more than double. The largest increase comes from desalination, followed by large-scale water transfer and increasing demand for wastewater treatment (and higher levels of treatment).
Low carbon does not necessarily mean less water
While a lower carbon pathway offers significant environmental benefits, the suit of technologies and fuels used to achieve this pathway could, if not properly managed, exacerbate water stress or be limited by it. Some technologies, such as wind and solar PV, require very little water; but the more a decarbonisation pathway relies on biofuels production, the deployment of concentrating solar power, carbon capture or nuclear power, the more water it consumes. As a result, in scenario consistent with holding the global average temperature rise to 2 degrees Celsius, water withdrawals are 12% lower in 2040 relative to our main scenario but consumption is 2% higher.
5Water-energy nexus© O
ECD
/IEA
, 201
6

Actions to close the water gap have major implications for energy use
Desalination and water reuse can help countries who have limited freshwater resources narrow the gap between freshwater withdrawals and sustainable supply, but they also contribute to the rise in the water sector’s energy demand. Although desalination and water re-use meet less than 1% of global water needs today, these processes account for almost a quarter of total energy consumption in the water sector. By 2040, they account for 4% of water supply, but 60% of the water sector’s energy consumption. Desalination capacity is projected to increase significantly in the Middle East, as several of the countries with the lowest renewable water resources are located there. While this helps to close the water gap, it comes at a cost: by 2040, desalination accounts for over 10% of the Middle East’s total final energy consumption.
There is huge untapped potential for energy savings in the water sector
Energy consumption in the water sector can be reduced by 15% in 2040 if the economically available energy efficiency and energy recovery potentials in the water sector are exploited. The largest savings are possible in wastewater treatment, desalination and water supply. At a local level, energy use for wastewater treatment can account for a large share of a municipal’s energy bill, but the wastewater itself contains significant amounts of embedded energy that is typically not used. Pioneering efforts, led by some municipalities in the EU and US, have shown that improving energy efficiency and harnessing embedded energy can move their operations towards ‘energy neutrality’, where energy needs are entirely satisfied with own generation. Capitalizing on energy recovery could provide over 55% of the electricity required for municipal wastewater treatment by 2040, but without greater attention from policymakers and municipalities this potential risks being unfulfilled. There is also a major opportunity to reduce water losses along the supply chain, and thereby save energy as well. If all countries were able to reduce their water losses to levels seen in the best-performing countries, the equivalent of the entire electricity needs of Poland could be saved today.
Integrated thinking on energy and water is essential to mitigate future stresses
Understanding energy-water linkages and developing policies and practices to ensure that the development of one sector does not have unintended consequences for the other, is pivotal to the prospects for successful realisation of a range of sustainable development and climate goals. There are several points of intersection between the new United Nations Sustainable Development Goals (SDG) on clean water and sanitation (SDG 6) and affordable and clean energy (SDG 7) that, if managed well, can help with the attainment of both sets of goals. More broadly, policies and technologies in these sectors can be much more effective if considered in an integrated manner, for example by co-locating energy and water infrastructure, utilising the energy embedded in wastewater, and using alternative sources of water for energy production.
6 World Energy Outlook 2016 Excerpt© O
ECD
/IEA
, 201
6

Water-energy nexusStress points, savings and solutions
Highl ights
• Energy needs water, water needs energy: the dependencies in both directions are set to intensify rapidly. The availability of water affects the viability of energy projects and must be considered when deciding on energy options. And the dependence of water services on the availability of energy will impact the ability to provide clean drinking water and sanitation services.
• In the New Policies Scenario, water withdrawals for primary energy production and power generation rise by less than 2% through 2040 to reach over 400 bcm, while the amount of water consumed in the energy sector increases by almost 60% to over 75 bcm. A shift towards higher efficiency power plants with advanced cooling systems lowers withdrawals (but tempers consumption), while a rise in nuclear power generation and in biofuels production increase both.
• Switching to a lower carbon pathway could, if not properly managed, exacerbate water stress or be limited by it. While withdrawals in the 450 Scenario are 12% lower in 2040 compared with the New Policies Scenario, consumption is 2% higher due to more biofuels production and the deployment of concentrating solar power, carbon capture and storage and nuclear power – each of which can be water intensive.
• Energy consumption of the water sector worldwide was 120 Mtoe in 2014; a majority of this was in the form of electricity, corresponding to 4% of total global electricity consumption. Of the electricity consumed for water, around 40% is used to extract water, 25% for wastewater treatment and 20% for water distribution. Roughly half of thermal energy used in the water sector is to pump groundwater for agricultural purposes, with the remainder for desalination.
• In the New Policies Scenario, global energy use in the water sector more than doubles by 2040. Electricity consumption rises by 80% by 2040, equivalent to twice the electricity consumption of the Middle East today. The largest increase comes from desalination, which grows over eight-fold, accounting for more than 20% of water-related electricity demand in 2040. There is significant potential for energy savings in the water sector. The pursuit of a co-ordinated suite of policy measures can reduce electricity consumption by 225 TWh and increase electricity generation from wastewater by 70 TWh relative to the New Policies Scenario.
• Over the next 25 years there is a general shift towards more water-intensive energy and energy-intensive water. But there are options available to avoid potential stress points by integrating energy and water policies and infrastructure, tapping the energy embedded in wastewater, improving the efficiency of the water and energy sector, and using alternative water sources in the energy sector.
7Water-energy nexus© O
ECD
/IEA
, 201
6
1 OverviewWater for energy. Energy for water. Two sets of linkages with enormous significance for economic growth, life and wellbeing. Water is needed for all phases of energy production, for fossil-fuel extraction, transport and processing, power production and irrigation of feedstock for biofuels. Water can also be produced as a by-product of fossil-fuel production. Energy is required for a range of water-related processes, such as water transport, wastewater treatment and desalination; and, energy can be produced as a by-product from wastewater treatment. Both sides of this equation come with considerable risks. In its Global Risks Report, the World Economic Forum asks expert respondents to rank a series of potential global threats according to their likelihood and impact: in the 2016 edition, energy (a failure of climate change mitigation and adaptation, or a severe energy price shock) and water (water crises) are identified as three out of the top-five risks facing the world in the next decade (World Economic Forum, 2016). Moreover, the interdependency of these two resources has also emerged as a critical global issue, recognised by a host of fora and institutions as a potential source of vulnerability.1 And water and energy are front and centre in the new UN Sustainable Development Goals (SDG 6 and 7). Most of the weaknesses in the global energy system examined in this Outlook, whether related to energy access, energy security or the environmental impacts of energy use, can be exacerbated by changes in water availability, variability and predictability. Most of the fault lines in global water supply can be widened by failures on the energy side. Managing these interdependencies has become the focus for a wide range of policy-makers, businesses and other stakeholders.
Recognising the importance of the nexus between these two resources, the World Energy Outlook in 2012 (WEO-2012) examined the water requirements of the energy sector and the issue has been taken up in subsequent years, most recently in WEO-2015 with a study of the impact of water scarcity on the choice of cooling technology in coal-fired power plants in India and China. This, the second dedicated chapter to water and energy in the WEO series, updates and expands upon the previous analysis. In addition to new projections for future freshwater requirements2 for energy production in various scenarios, this chapter assesses for the first time the energy used for a range of different processes in the water industry, such as wastewater treatment, distribution and desalination, highlighting opportunities for improved efficiency as well as the potential vulnerabilities and stress points.
1.1 The state of global water resources
Water in and of itself is an abundant resource; however, freshwater makes up only 2.5% of global water resources. Of that, less than 1% is available for human consumption, as
1. These links and potential trade-offs were the subject of the UN World Water Day and its World Water Development Report in 2014.2. Unless otherwise noted, the term “water” in this chapter refers to accessible renewable freshwater.
8 World Energy Outlook 2016 Excerpt© O
ECD
/IEA
, 201
6

nearly 70% of the world’s freshwater is locked up in glaciers and ice, roughly 30% is deep underground and some is contaminated and not suitable for human consumption or use. The amount of renewable water resources that exist in each country varies widely and annual averages often mask considerable seasonal variability (see Box 1 for a list of terms used in this chapter). Many countries face some degree of water stress – more than a billion people live in areas of water stress, a figure expected to more than triple by 2025 (WWAP, 2014). By 2040, almost one out of every five countries is anticipated to have an extremely high ratio of withdrawals to supply, including countries in the Middle East, Central Asia and India (Luo, et al., 2015).
Global freshwater withdrawals from surface water and groundwater sources have increased by roughly 1% per year since the 1980s as demand in developing countries has surged (WWAP, 2016). Currently, groundwater provides roughly a third of supply. Groundwater supplies are being systematically diminished by a rate of extraction at 1-2% per year globally, outpacing recharge rates (WWAP, 2012). An estimated 21 of the world’s 37 largest aquifers are severely over-exploited and since the greater part of the world’s freshwater resources come from groundwater, better management of aquifers will be particularly important. Given the interconnectedness of the hydrological cycle, excessive withdrawals in one area can easily have knock-on effects in others, e.g. the removal of groundwater from an aquifer can reduce the discharge rate to rivers and wetlands or could result in seawater intrusion into an aquifer. Transboundary water basins represent a particular governance challenge – there are over 270 transboundary river basins in the world, covering approximately 60% of the globe’s freshwater flow and roughly 40% of the population (Giordano, et al., 2013). Additionally, there are an estimated 600 aquifers that are shared by two or more nations (IGRAC). How a river or aquifer is managed or used in one location can drastically affect other locations further up or downstream.
Water availability can also be affected by water quality, as the cost of treatment may be prohibitive, creating physical water scarcity of economic water resources. While potable water is not needed for all purposes – such as in certain industries and agriculture – clean water is crucial for households. Toxic contamination, eutrophication, micro-pollutants (such as medicines, cleaning products) and acidification are harmful to human and ecosystem health. They also increase the cost and associated energy requirements involved in removing nutrients and pesticides to improve the quality of the water to meet drinking water standards (OECD, 2012). Similarly, thermal pollution, can impact the ecology of a waterbody in addition to diminishing its effectiveness as a medium for cooling thermal power plants.
There is increased uncertainty about future water availability and the impact that climate change will have on water resources. In some areas, it could be beneficial, while in others it could amplify or introduce scarcity. It is expected that climate change will alter the intensity, frequency, seasonality and amount of rainfall, aspects which impact both surface water flows and groundwater recharge, as well as the temperature of the resource
9Water-energy nexus© O
ECD
/IEA
, 201
6
(IPCC, 2013).3 These changes could manifest themselves in several ways, including reduced snowpack and the timing of snowmelt, a rise in sea level, higher rates of evaporation, more frequent and widespread droughts, downpours and heat waves. With continued population and economic growth and deteriorating water quality (both from physical and thermal pollution), a changing climate is set to place further constraints on a finite resource.
Box 1 ⊳ Glossary of energy and water terms
Surface water: Natural water in lakes, rivers, streams or reservoirs.
Groundwater: Water that is below the land surface in pores or crevices of soil, sand and rock, contained in an aquifer.
Aquifer: Large body of permeable or porous material situated below the water table that contains or transmits groundwater.
Freshwater: Water with less than 1 000-2 000 parts per million (ppm) of dissolved salts.
Non-freshwater resources: Includes brackish or saltwater; urban or industrial wastewater (with or without treatment); and agricultural drainage water. Also referred to as alternative or non-conventional water resources.
Renewable water resources: Total amount of surface and groundwater resources generated via the hydrological cycle.
Non-renewable water resources: Deep aquifers that have minimal rate of recharge during an average human life-time.
Water stress: Defined as when renewable annual freshwater water supplies fall below 1 700 cubic metres (m3) per person; water scarcity is below 1 000 m3 per person; and absolute scarcity below 500 m3 per person.
Water withdrawal: The volume of water removed from a source; by definition withdrawals are always greater than or equal to consumption.
Water consumption: The volume withdrawn that is not returned to the source (i.e. it is evaporated or transported to another location) and by definition is no longer available for other uses.
Water sector: Includes all processes whose main purpose is to treat/process or move water to or from the end-use: groundwater and surface water extraction, long-distance water transport, water treatment, desalination, water distribution, wastewater collection, wastewater treatment and water re-use.
Water treatment: Process of removing contaminants from water or wastewater in order to bring it up to water quality standards and for storage in freshwater reservoirs.
Desalination: Reducing the contents of total dissolved solids or salt and minerals in sea or brackish water.
3. For more analysis on the impact of rising temperatures on energy production, see Redrawing the Energy-Climate Map 2013: World Energy Outlook Special Report.
10 World Energy Outlook 2016 Excerpt© O
ECD
/IEA
, 201
6

Water distribution: Delivery of treated water to the customers via distribution networks (pumping, pressurising, storing and distributing).
Wastewater treatment: Involves collection (pumping, transporting sewage), treatment (primary, secondary, tertiary) and discharge.
Re-used water treatment: Processes related to re-using or recycling the not discharged, treated wastewater effluent (conventional tertiary treatment, membrane treatment).
1.2 Water demand by sector4
The rate of demand growth for water has been double the rate of population growth over the last few decades. Over the next 25 years, water withdrawals are expected to increase by almost 10% from 2014 levels, while consumption rises by over 20% over the same period.5 Regional patterns of withdrawals and consumption can vary widely, depending on how economies are structured. Irrigated agriculture accounts for more than 40% of the world’s crop production (WWAP, 2012). Irrigated agriculture is already the world’s largest water user, accounting for roughly 70% of total global freshwater withdrawals and up to 85% in some developing countries, although its share of withdrawals is projected to fall back slightly over the period to 2040 (Figure 1). Agriculture is also responsible for the bulk of water consumption, stemming from evaporation from land surfaces during irrigation and transpiration from plants.
Withdrawals to meet municipal water demand accounted for 13% of the total in 2014 and are projected to rise to 17% in 2040. Three-fifths of the increase comes from three regions: India, Africa and other developing countries in Asia (excluding China). The levels of consumption in the municipal end-sector are lower, accounting for 5% of total global consumption in 2014. Future trends will be shaped by growing urbanisation and rising standards of living, as changes in dietary preferences and more demand for goods require increasing quantities of water. Additionally, over 650 million people, primarily in sub-Saharan Africa, lack access to an improved source of drinking water and 2.4 billion do not have access to improved sanitation (United Nations Children’s Fund/World Health Organization, 2015). One of the UN Sustainable Development Goals (SDG 6) is to ensure the availability and sustainable management of water and sanitation for all. The pursuit of this goal, to provide improved access to drinking water for the remaining 10% of the global population without adequate supply and improved sanitation for the one-third that lacks it, could increase domestic demand, and the energy and infrastructure necessary to provide such services.
4. Analysis in this chapter focuses on freshwater use. While non-freshwater sources are already being used, either to replace or complement freshwater, in many places the use of alternative sources is at a nascent stage or is not yet economic, relative to freshwater. 5. See Box 2 for information on the methodology and source of our projections for water withdrawals and consumption.
11Water-energy nexus© O
ECD
/IEA
, 201
6

Figure 1 ⊳ Global water demand by sector to 2040
1 000
2 000
3 000
4 000
5 000
2014 2025 2040
bcm
Withdrawal
500
1 000
1 500
2 000
2 500
2014 2025 2040 bc
m Primary energy
production*
Industry Municipal Agriculture
Consumption
Power generation
Agriculture remains the primary source of global water demand, but other sectors gain ground
* Primary energy production includes fossil fuels and biofuels.
Notes: bcm = billion cubic metres. Water withdrawals and consumption for crops grown as feedstock for biofuels is included in primary energy production, not in agriculture. See Box 2 for a detailed description of the methodology used to project water availability and demand.
Sources: Luck, et al. (2015); Bijl, et al. (2016); Wada, et al. (2016); IEA analysis.
Almost 10% of global water withdrawals in 2014 were for industry (excluding the energy sector). In advanced industrial nations, industry accounts for 12% of water withdrawals, whereas in many developing countries, industry accounts for less than 8%. Water is used in industry for processing, but also for fabricating and washing. Industry is the second-largest water consuming sector (after agriculture), its share projected to stay steady around 8% to 9% over the Outlook period. The energy sector, including power generation and primary energy production, is often included in the industry sector in analyses of water use. Energy is considered separately here (and in detail in the next section), an approach which shows that, in 2014, primary energy production and power generation accounted for roughly 10% of total worldwide water withdrawals and around 3% of total water consumption.
2 Water for energy 2.1 Overview
Water is an important input for nearly all forms of energy. Within the energy sector, the power sector is by far the largest source of water withdrawals, although in terms of consumption, primary energy production is larger (Table 1). Global aggregates, provided here, give invaluable overall guidance; but assessment of the impact of withdrawals and consumption, in terms of water stress or competition with other users, naturally needs to be very location specific (see section 4.1 for regional profiles). Even those parts of the energy sector with very low water needs in a global context can have major local implications, and vice versa.
12 World Energy Outlook 2016 Excerpt© O
ECD
/IEA
, 201
6

Table 1 ⊳ Energy-related water withdrawals and consumption, 2014
Withdrawal (bcm)
Share of total energy water withdrawals
Consumption (bcm)
Share of total energy water consumption
Power 350 88% 17 36%
Fossil fuels 230 58% 13 28%
Nuclear 112 28% 4 8%
Renewables* 9 2% 1 1%
Primary energy production 47 12% 30 64%
Coal 11 3% 10 22%
Oil 8 2% 6 13%
Conventional 7 2% 6 12%
Unconventional 1 0% 1 1%
Natural gas 2 0% 2 3%
Conventional 1 0% 1 2%
Unconventional 1 0% 1 1%
Biofuels** 26 7% 12 25%
Total 398 100% 48 100%
* Renewables includes bioenergy, geothermal, concentrating solar power (CSP), solar photovoltaics (PV) and wind. ** Refers to irrigated crops grown as feedstock for biofuels.
Notes: Estimates of water requirements for energy production are based on the application of published water withdrawal and consumption factors. These factors are applied in each WEO region by fuel type and electricity generating (and cooling) technology. More information on the water factors used and key assumptions are at www.worldenergyoutlook.org/resources/water-energynexus/. Hydropower is not included in the estimates presented here (see power sector section below for further details).
Power sector
Thermal power plants6 made up 70% of total installed capacity worldwide in 2014 and are the main source of water demand in the power sector (Figure 2). The power sector withdraws significant amounts of water – mostly from surface water sources – after which much of it is returned (often at a different temperature [thermal pollution]). While several factors, such as the fuel mix, the power plant’s role in the electricity system (i.e. baseload or peaking), turbine design and weather influence the amount of water required, the type of cooling technology used is a key determinant of how much freshwater is withdrawn and ultimately consumed and the overall efficiency of thermal power plants (IEA, 2012a; IEA, 2015).
There are three main types of cooling technologies – once-through7, wet-tower8 and dry cooling. There are trade-offs associated with each in terms of water withdrawals versus
6. Includes coal, natural gas, oil, nuclear, geothermal and CSP. 7. Once-through is also referred to as open-loop cooling.8. Wet-tower is also categorised as a closed-loop or wet re-circulating system. Cooling pond is another system in this category.
13Water-energy nexus© O
ECD
/IEA
, 201
6
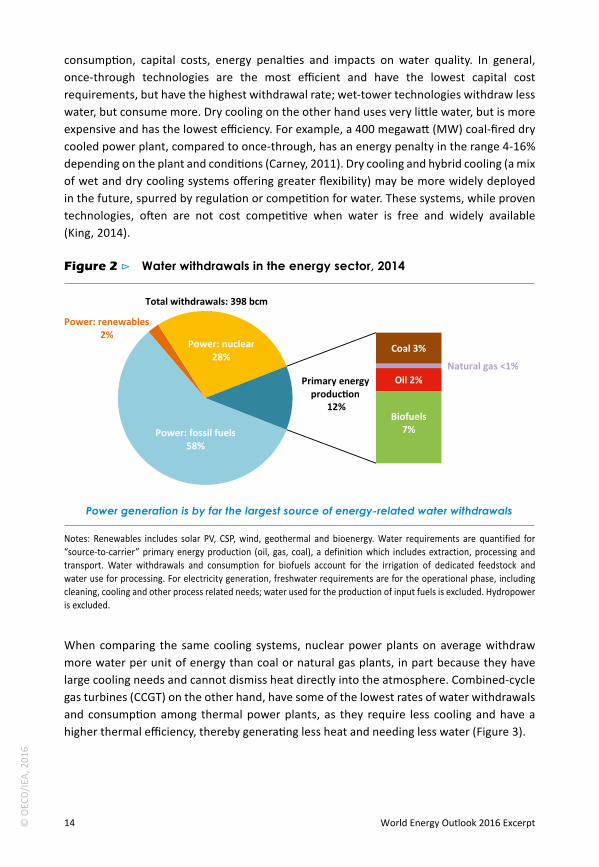
consumption, capital costs, energy penalties and impacts on water quality. In general, once-through technologies are the most efficient and have the lowest capital cost requirements, but have the highest withdrawal rate; wet-tower technologies withdraw less water, but consume more. Dry cooling on the other hand uses very little water, but is more expensive and has the lowest efficiency. For example, a 400 megawatt (MW) coal-fired dry cooled power plant, compared to once-through, has an energy penalty in the range 4-16% depending on the plant and conditions (Carney, 2011). Dry cooling and hybrid cooling (a mix of wet and dry cooling systems offering greater flexibility) may be more widely deployed in the future, spurred by regulation or competition for water. These systems, while proven technologies, often are not cost competitive when water is free and widely available (King, 2014).
Figure 2 ⊳ Water withdrawals in the energy sector, 2014
Power: fossil fuels 58%
Power: renewables 2%
Power: nuclear 28%
Coal 3% Natural gas <1%
Oil 2%
Biofuels 7%
Total withdrawals: 398 bcm
Primary energy production
12%
Power generation is by far the largest source of energy-related water withdrawals
Notes: Renewables includes solar PV, CSP, wind, geothermal and bioenergy. Water requirements are quantified for “source-to-carrier” primary energy production (oil, gas, coal), a definition which includes extraction, processing and transport. Water withdrawals and consumption for biofuels account for the irrigation of dedicated feedstock and water use for processing. For electricity generation, freshwater requirements are for the operational phase, including cleaning, cooling and other process related needs; water used for the production of input fuels is excluded. Hydropower is excluded.
When comparing the same cooling systems, nuclear power plants on average withdraw more water per unit of energy than coal or natural gas plants, in part because they have large cooling needs and cannot dismiss heat directly into the atmosphere. Combined-cycle gas turbines (CCGT) on the other hand, have some of the lowest rates of water withdrawals and consumption among thermal power plants, as they require less cooling and have a higher thermal efficiency, thereby generating less heat and needing less water (Figure 3).
14 World Energy Outlook 2016 Excerpt© O
ECD
/IEA
, 201
6
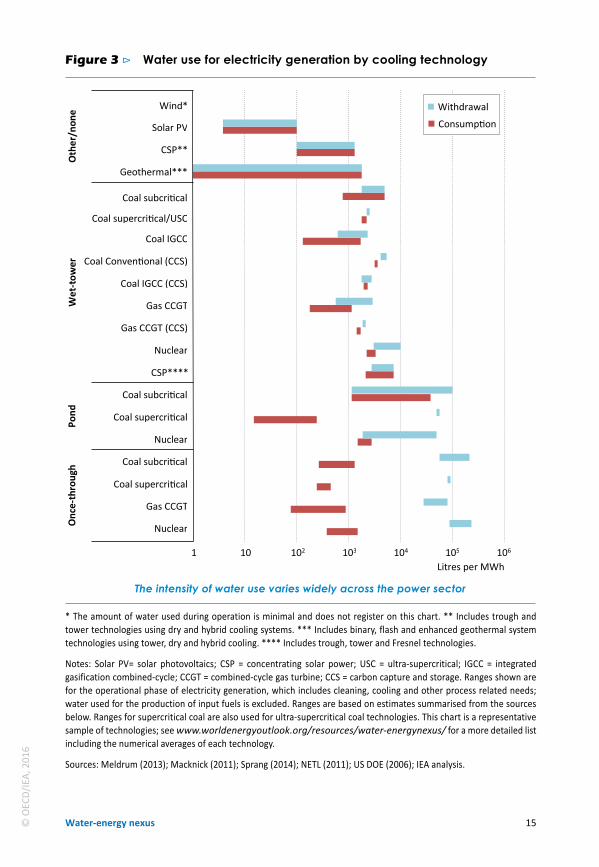
Figure 3 ⊳ Water use for electricity generation by cooling technology
1 10 102 103 104 105 106
Nuclear
Gas CCGT
Coal supercritical
Coal subcritical
Nuclear
Coal supercritical
Coal subcritical
CSP****
Nuclear
Gas CCGT (CCS)
Gas CCGT
Coal IGCC (CCS)
Coal Conventional (CCS)
Coal IGCC
Coal subcritical
Geothermal***
CSP**
Solar PV
Wind*
Onc
e-th
roug
h Po
nd
Wet
-tow
er
Oth
er/n
one
Litres per MWh
Consumption Withdrawal
Coal supercritical/USC
The intensity of water use varies widely across the power sector
* The amount of water used during operation is minimal and does not register on this chart. ** Includes trough and tower technologies using dry and hybrid cooling systems. *** Includes binary, flash and enhanced geothermal system technologies using tower, dry and hybrid cooling. **** Includes trough, tower and Fresnel technologies.
Notes: Solar PV= solar photovoltaics; CSP = concentrating solar power; USC = ultra-supercritical; IGCC = integrated gasification combined-cycle; CCGT = combined-cycle gas turbine; CCS = carbon capture and storage. Ranges shown are for the operational phase of electricity generation, which includes cleaning, cooling and other process related needs; water used for the production of input fuels is excluded. Ranges are based on estimates summarised from the sources below. Ranges for supercritical coal are also used for ultra-supercritical coal technologies. This chart is a representative sample of technologies; see www.worldenergyoutlook.org/resources/water-energynexus/ for a more detailed list including the numerical averages of each technology.
Sources: Meldrum (2013); Macknick (2011); Sprang (2014); NETL (2011); US DOE (2006); IEA analysis.
15Water-energy nexus© O
ECD
/IEA
, 201
6
A common assumption is that switching to a lower carbon pathway would reduce water requirements. However, the use of clean energy technologies can increase or decrease water demand depending on the technology employed. For example, solar PV and wind do not require heat to make electricity and so consume little or no water during operation (some water is needed to clean solar panels). Renewable energy sources that use heat to drive a steam cycle, such as CSP and geothermal, often use water for cooling. Depending on the cooling technology, CSP’s water withdrawals and consumption can be of the same order as conventional power plants. This can be problematic for CSP, as the best locations are often in arid areas with water supply constraints. Enhanced geothermal systems, depending on the location of the resource, can require water to be injected in order to power the steam cycle. While some of the water can be recaptured and reinjected to form a closed-loop system, geothermal systems can experience significant losses, resulting in elevated levels of consumption, compared with other thermal power plants. Carbon capture and storage (CCS) equipment, which carries high expectations as a way to extend the use of fossil fuel-based power plants, reduces carbon-dioxide (CO2) emissions but can almost double a plant’s water withdrawals and consumption, depending on the cooling technology used.
Hydropower relies on water passing through turbines to generate electricity, while also serving as a major source of global energy storage. A majority of the water withdrawn is returned to the river; however, hydropower’s water consumption varies depending on a range of factors such as technology type (reservoir versus run-of-river), reservoir size, climate, engineering and amount of demand from end-users (such as agriculture and recreation). The amount consumed is highly site-specific and the measurement methodology is not agreed upon. Because of this, we do not present ranges for water withdrawals and consumption for hydropower.
Primary energy production
Water needs for energy production vary widely, depending on the fuel and the phase of the fuel cycle (extraction, processing and transport) (Figure 4). Water is a critical input for crops used for biofuels, which are the largest source of water withdrawals and consumption for primary energy production. The scale of water use for biofuels depends on whether or not crops are rain-fed or irrigated.9 For irrigated crops, the total water use depends on the type of feedstock, regional climate and production technology used (Wu, et al., 2014). It is estimated that roughly 2% of total water for irrigation is used for producing biofuels (WWAP, 2009). However, there remain significant opportunities to improve efficiency and reduce water demand. For example, the provision of energy subsidies to farmers often has the unintended consequence of encouraging farmers to use water inefficiently and pump aquifers at an unsustainable rate (WWAP, 2012).10 Advanced biofuels currently rely
9. In our analysis we only consider freshwater used for irrigation of biofuel feedstocks, often referred to as blue water, and do not include soil moisture from rainwater (green water). 10. See India Energy Outlook 2015: World Energy Outlook Special Report for a discussion of energy subsidies and agriculture in India.
16 World Energy Outlook 2016 Excerpt© O
ECD
/IEA
, 201
6

primarily on waste products (agricultural, food and municipal waste); and in this case the water use is attributed to the primary objective. However, should there be a shift towards dedicated crops for advanced biofuels, water use for energy could increase. In addition to concerns about water quantity, there are also concerns about the impact on quality, due to the potential run-off of effluent, which can contain high levels of fertilisers and pesticides, and soil erosion which can pollute waterways. Water is also required for the biofuel conversion process and refining. Compared with oil and gas, biofuel refineries need significant amounts of water, mostly in the form of steam for fermentation.
Water use for coal production comes primarily from activities associated with mining, with variance in quantity between surface and underground mines and according to the depth, geology, and width of the coal seam and the energy content of the coal. Some mines need to be de-watered before production can begin; if the water is re-used, it can supplement or reduce the amount of freshwater required, though it is often highly contaminated and requires treatment. Depending on the quality and the destination, coal may be washed to improve its quality and the efficiency of its transport and use. There are concerns about the impact of coal mining on water quality, the potential for run-off or drainage, spills from settling ponds, discharge of produced water and contamination of surface or groundwater sources by mine tailings.
Water needs for the production of conventional oil depends on the technology used, the geology of the field and the extent of secondary recovery. Water injection as a means to improve oil recovery, can require significant volumes of water, as much as ten-times more than primary recovery, depending on the technique. Production of extra-heavy oil, such as oil sands, is also water intensive, both for surface mining and steam-assisted gravity drainage (SAGD), where steam is used to make heavy oil flow (although SAGD is generally less water intensive than surface mining). The amount of water needed for extraction of conventional natural gas is minor compared to other fossil fuels.
Unconventional oil and gas production that requires hydraulic fracturing, such as tight oil and shale gas, are not necessarily more water intensive than their conventional counterparts per unit of energy produced. If water injection is being used to enhance recovery, then conventional oil can be in a comparable range to tight oil. The water requirements for shale gas are slightly higher than those of conventional gas, given the additional water required for fracturing. The water needs of an individual unconventional gas well depends on the extent of the reservoir, the depth and thickness of oil and gas-bearing layers, the productivity of the well, the number of fracturing stages and the quantity of flow-back recycled (Clark et al., 2013). While the water demand for each individual well is small, the cumulative requirements, depending on the scale of operations and the frequency of drilling, must be considered against other regional variables, such as water availability and the seasonality of flows, competing uses, the geology and population growth (IEA, 2012b).
17Water-energy nexus© O
ECD
/IEA
, 201
6

Figure 4 ⊳ Water use for primary energy production
1 10 102 103 104 105 106 107
Sugarcane ethanol
Corn ethanol
Cellulosic ethanol**
Soybean biodiesel
Rapeseed biodiesel
EHOB (in-situ)
Tight oil
EOR (thermal)*
Conventional oil
Coal-to-liquids
Gas-to-liquids
Shale gas
CBM
Tight gas
Conventional gas
Coal-to-gas
Coal
Biof
uels
Foss
il fu
els
Litres per toe
Consumption Withdrawal
Crops used for biofuels can have high water intensities
* See the WEO’s water-energy website for water use for EOR-CO2, EOR-chemical and EOR-other gas, www.worldenergyoutlook.org/resources/water-energynexus/. ** Excludes water use for crop residues allocated to food production.
Notes: CBM = coalbed methane; EOR = enhanced oil recovery; EHOB = extra-heavy oil and bitumen. Ranges shown are for “source-to-carrier” primary energy production, which includes withdrawals and consumption for extraction, processing and transport. Water use for biofuels production varies considerably because of the differences in irrigation needs and methods among regions and crops; our analysis considers only the water used for irrigation and excludes rainwater. The minimum for each crop represents non-irrigated crops whose only water requirements are for processing into fuels. This chart is a representative sample of fuels; see www.worldenergyoutlook.org/resources/water-energynexus/ for a full list, including the numerical averages of each fuel.
Sources: Schornagel (2012); Olsson (2015); US DOE (2006); IEA analysis.
18 World Energy Outlook 2016 Excerpt© O
ECD
/IEA
, 201
6
Public concerns about water use for unconventional oil and gas have centred on the potential for increased competition for water in water-stressed areas and the risk of contamination of aquifers from fracturing operations or from gas and chemical interactions with shallower groundwater formations. They also include the treatment and disposal of wastewater, either from extracted formation water (as in coalbed methane extraction) or flow-back water and drilling/fracturing liquids.11 Appropriate regulation and adherence to best practices for lifecycle management of water can reduce the quantities of freshwater required, reduce environmental risks and decrease disposal costs. There are alternatives to water for fracturing, as well as foams that can reduce water use by up to 90%. But for the moment, the non-water alternatives all have their own drawbacks: for example, propane has been used as a fracturing fluid, but is flammable and so requires extra safety precautions. Using foams can reduce water usage but involves higher volumes of chemicals and is less effective. Fracturing can also be done with non-fresh water resources, but accessing these resources involves additional cost and the industry has thus far generally preferred to focus on improved management of other sources of water, such as recycling and re-use.
Refining, which combines thermal and chemical processes, also requires water either as a direct input or for cooling to turn oil and natural gas into end-use products. The total use will depend on the complexity of the refinery, the type of cooling system and the extent of re-use and recycle.
2.2 Future water requirements for energy production
Water is a potential chokepoint for energy, but the risks are not shared evenly across the sector or across the world. In the New Policies Scenario, global freshwater withdrawals in the energy sector rise from 398 billion cubic metres (bcm) in 2014 – less than the mean annual discharge of the Mekong River (475 bcm) – to just over 400 bcm in 2040. Consumption increases from 48 bcm, roughly 12% of energy-related water withdrawals in 2014, to over 75 bcm (Figure 5). The power sector continues to account for the majority of water withdrawals in the energy sector, though its share declines with time. Primary energy production is responsible for almost two-thirds of energy sector water consumption today, a share that continues to rise to 2040.
Water withdrawals increase by roughly 1.5% by 2040, but the rise is not a steady one. In the first part of the Outlook period, water withdrawals decline temporarily, as the retirement of less efficient subcritical coal plants and the deployment of more supercritical and ultra-supercritical coal plants, pushes down withdrawals. These reductions are partly offset by increased withdrawals for nuclear power and biofuels production. After 2025, power sector withdrawals roughly stabilise, but demand for biofuels in the transport sector, which grows
11. Concerns include the potential for increased seismic activity associated with hydraulic fracturing and deep aquifer disposal of wastewater. See Chapter 6 in World Energy Outlook-2015 for more on key public concerns associated with unconventional gas production.
19Water-energy nexus© O
ECD
/IEA
, 201
6

on average by 3.5% per year in the period 2025-2040, pushes overall withdrawals higher. While the fuels and technologies that drive water withdrawals from the energy sector shift, overall growth is slow, rising on average less than 0.1% per year. By contrast, the average annual growth rate of water consumption over the projection period is 1.8% reflecting the shift in the power sector towards more consumption-intensive technologies, increased biofuels supply for transport and, to a lesser extent, increased fossil-fuel production.
Figure 5 ⊳ Global water use by the energy sector by fuel and power generation type in the New Policies Scenario, 2014-2040
100
200
300
400
2014 2025 2040
bcm
Withdrawal
20
40
60
80
2014 2025 2040
Biofuels Fossil fuels
Other renewables Biomass Nuclear Oil Gas Coal
Consumption Primary energy:
Power:
bcm
Energy-related water withdrawals rise by less than 2% to 2040, but consumption rises by almost 60%
Note: Other renewables includes wind, solar PV, CSP and geothermal.
Non-OECD countries account for most of the global increase in energy-related water withdrawals and consumption, mirroring the trends in global energy demand (Table 2). In the OECD countries, total water withdrawals fall by almost a quarter between 2014 and 2040, the average annual rate falling faster than energy demand. In non-OECD countries, however, water withdrawals rise by 35%. In terms of consumption, the increase in non-OECD countries is over 30-times greater than in OECD countries, where consumption stays relatively stagnant over the course of the projection period.
The United States, which accounts for 40% of OECD electricity generation, accounts for almost two-thirds of both water withdrawals and consumption in the energy sector in the OECD as coal and nuclear power are key power generators in the United States. The US’ share of the OECD’s withdrawal and consumption remains steady to 2040. In the non-OECD, Asia accounts for half of water withdrawals in 2014 and 60% of consumption. By 2040, Asia accounts for over 55% of withdrawals and almost 70% of consumption. Within Asia, India overtakes China to become the largest source of energy-related water demand, as its coal demand more than doubles and the production of biofuels for transport rises.
20 World Energy Outlook 2016 Excerpt© O
ECD
/IEA
, 201
6

Table 2 ⊳ Energy-related water withdrawals and consumption in the New Policies Scenario (bcm)
Withdrawal Consumption
2014 2025 2040 2014-2040* 2014 2025 2040 2014-2040*
OECD 215 182 159 -1.1% 21 24 22 0.1%
Americas 165 140 121 -1.2% 16 18 17 0.3%
United States 141 121 103 -1.2% 14 17 15 0.2%
Europe 46 38 35 -1.0% 5 4 4 -0.5%Asia Oceania 4 4 4 -0.4% 1 1 1 0.4%Non-OECD 182 186 244 1.1% 26 35 54 2.8%
E. Europe/Eurasia 68 61 60 -0.5% 4 4 4 0.3%
Asia 92 101 140 1.6% 15 23 37 3.4%
China 45 43 55 0.8% 11 11 15 1.3%
India 35 47 68 2.6% 3 9 20 7.3%
Middle East 3 4 5 1.8% 2 2 3 1.9%
Africa 6 5 11 2.5% 1 2 2 1.8%
Latin America 13 15 28 2.9% 4 4 7 2.5%
World 398 369 403 0.1% 48 59 76 1.8%
European Union 51 42 39 -1.0% 4 4 4 -0.6%
* Compound average annual growth rate.
Note: Table includes withdrawals and consumption for the power sector and primary energy production.
Power sector
Though the power sector remains the largest source of energy-related water withdrawals in the New Policies Scenario, at over 280 bcm in 2040, they are almost 20% lower than today. Water consumption, on the other hand, stays steady at 17 bcm; but the source of consumption shifts. There are several factors at work here, starting with the changes that take place in the power mix in different regions. A trend that affects water use is the lower share of coal-fired generation in the global mix, although the implications for water withdrawals and consumption depend on the particular fuels or technologies that take its place. In the United States, for example, coal-fired power generation declines by around 40%, and water withdrawals for the power sector decrease by over 30%. Although some of the fastest growing sources of generation in the United States are solar PV and wind, which are much less water intensive than coal, some coal-fired generation is replaced by geothermal and nuclear, which are also water dependent. Another feature is the increase in the use of non-fresh water sources for cooling, especially for coal-fired power plants in China and the United States. There is also an increase in the average level of efficiency of the global coal fleet, reflecting the retirement of less efficient plants and the increase in power generation from more efficient designs (see Chapter 5). For example, although China’s coal-fired electricity generation increases by 4% from 2014 to 2040, water withdrawals for those plants decline by almost 40% (14 bcm). This is, in part, due to the increase in the average efficiency of China’s coal-fired power plants (by four percentage points), which reflects the
21Water-energy nexus© O
ECD
/IEA
, 201
6
decline in the share of coal-fired generation from less efficient subcritical power plants from almost 60% to just over 10%.
The shift away from coal-fired generation using once-through cooling systems lowers water withdrawals; but the rising deployment of more efficient coal-fired power plants using wet-tower cooling systems tempers the rate of decline in water consumption; global water consumption by coal-fired power plants decreases at a much slower average annual rate than withdrawals (-1.5% versus -2.2%) and in 2040 still accounts for almost one-out-of-two units of water consumed by the power sector. As well, electricity generation from nuclear power plants almost doubles, with the majority of plants relying on once-through cooling systems. As a result, water withdrawals for nuclear plants increase by almost 20%, as growth in water withdrawals from nuclear generation in non-OECD countries offset the decline (-10%) in OECD countries.
Primary energy production
In the New Policies Scenario, water withdrawals for primary energy production also grow at a faster average annual rate than consumption. By 2040, water withdrawals are two-and-a-half times higher than in 2014, reaching 120 bcm, while consumption roughly doubles (to reach 60 bcm). Of the primary fuels, biofuels are by far the largest source of demand for both water withdrawals and consumption, accounting for 80% of water withdrawals for primary energy production and over 60% of water consumption in 2040. Whether to bolster energy security or as part of a decarbonisation strategy, policies that mandate an increase in the production of crops for biofuels, such as sugarcane, corn and soybean for ethanol and biodiesel, result in a steep rise in energy-related water demand. Even though India is projected to fall well short of its ambitious blending targets for biofuels, it helps propel the increase in water withdrawal and consumption for biofuels over the period to 2040, along with Brazil and China. Whereas China meets biofuel demand through a diverse set of feedstocks, India relies primarily on sugarcane for producing bioethanol, which requires significant amounts of water.
Among the fossil fuels, the production of coal requires the most water. Global coal production grows only modestly to 2040 in the New Policies Scenario, with China maintaining its role as the largest coal producer in the world, even though India’s production rises substantially (see Chapter 5). Water withdrawals for coal increase by 4%, to reach 12 bcm in 2040, while consumption reaches 11 bcm. More rapid increases in oil and gas output mean rates of faster growth in their water use. Withdrawals for oil production reach 11 bcm by 2040, while consumption increases by 30%, with the strongest growth coming from EOR (tertiary recovery) and unconventional oil. Natural gas-related water withdrawals and consumption remain relatively low, reaching roughly 3 bcm each by 2040. While unconventional gas accounts for 75% of the increase in water demand for natural gas, overall it is responsible for just 1% of total water withdrawals and 2% of consumption for primary energy production (including biofuels) in 2040, its withdrawals are almost ten-times less than coal and more than 70-times less than biofuels in 2040.
22 World Energy Outlook 2016 Excerpt© O
ECD
/IEA
, 201
6

450 Scenario
In the 450 Scenario, annual water withdrawals for the energy sector decline to almost 360 bcm in 2040, a decrease of 10% over 2014, while water consumption rises to almost 80 bcm, over 60% higher than 2014. Relative to the New Policies Scenario, water withdrawals are more than 45 bcm or 12% lower, but consumption increases by 2 bcm (2%) (Figure 6). The divergence reflects the different demand trajectories, various fuels and technologies used in the power sector (including more CCS and CSP) in the 450 Scenario and greater reliance on biofuels in transport and other forms of bioenergy for power.
While the 450 Scenario provides significant environmental benefits, the suite of technologies and fuels used to achieve this reduction can, if not properly managed, exacerbate or introduce water stress, depending on the location, the availability of water and the range of competing users. Similarly, in some instances, a lack of water could act as a constraint on the technology suite available to pursue low-carbon pathways. The power sector is a good example of the potential trade-offs. While water withdrawals in the power sector in the 450 Scenario are 18% lower than in the New Policies Scenario by 2040, water consumption is more than 45% higher. Further improvements in the efficiencies of fossil-fuel power plants, along with a decided shift away from coal and natural gas towards more renewables, help to reduce CO2 emissions, local air pollutants and water withdrawals; but, the reduction in water use is offset by the deployment in the power sector of other carbon-friendly, yet water-intensive technologies, such as nuclear, CCS and CSP. Some climate-minded policies can exacerbate existing water stress and policy-makers therefore need to assess and evaluate chokepoints. The potential stress does not apply across the board, but it does imply that plans for power developments using more water-intensive technologies will have to take current and future water availability into consideration in the choice of sites and cooling technologies, as well as seek to use alternative water sources, where possible.
Figure 6 ⊳ Global water use by the energy sector by scenario
100
200
300
400
2014 2025 2040
bcm
New Policies Scenario 450 Scenario
Consumption
Withdrawals:
The energy mix of the 450 Scenario means lower withdrawals but higher consumption, compared with the New Policies Scenario
23Water-energy nexus© O
ECD
/IEA
, 201
6

On the production side in the 450 Scenario, lower demand for fossil fuels reduces water withdrawals for coal, oil and natural gas production by 10 bcm compared with the New Policies Scenario. However, this decline is more than offset by a rise in water use for biofuels production. Global demand for biofuels more than doubles relative to the New Policies Scenario; as a result, water withdrawals increase by almost 15 bcm by 2040. By the end of the Outlook period, water consumption for biofuels is more than one-and-a-half-times greater than water consumption by the entire power sector in the 450 Scenario. The increased demand for biofuels in the 450 Scenario pushes crop production onto more marginal lands, especially in India, Southeast Asia and Europe, which can have greater irrigation needs (depending on factors including the location and soil type). Given the diversity of land that is classified as marginal land and the limited analysis conducted regarding the changes in water needs on marginal land, we did not increase the water intensities for production that occurs on marginal land in our analysis. As a result it is feasible that water use could be much higher. We also do not account for potential improvements in irrigation technologies, which could lower water requirements.
2.3 Impact of climate variability on hydropower
Hydropower has not been included in this analysis of water use thus far12, but it accounts for 16% of today’s global electricity production and provides energy storage. It also provides a highly visible example of the impact that water insecurity – either from short or medium-term drought, fluctuations in seasonal water availability or longer term impacts, like climate change – can have on generation. Several areas already bear witness to the impacts of water variability on hydropower. In the United States, California, Oregon and Washington are responsible for over half of the country’s hydro generation. These states are also highly vulnerable to climate change and its potential effect on the snowpack. In California, drought reduced hydropower’s share of the electricity mix by five percentage points in 2013, compared with the thirty-year average (Garthwaite, 2014). In the Colorado River basin, a 1% decline in precipitation reduces streamflow by 2-3% and a 1% decline in streamflow results in a 3% decline in power generation (US National Oceanic and Atmospheric Administration, 2009). In Zambia, which depends on hydropower for 95% of its electricity, a severe drought in 2015-2016 caused regular blackouts: the Kariba Dam, which generates more than 40% of the nation’s power, has been operating at less than a quarter capacity, and in January 2016, capacity went as low as 11% (Onishi, 2016). Low water levels at Venezuela’s Guri dam, which provides almost half the country’s hydroelectricity, have resulted in nationwide power cuts throughout 2016. Brazil and Chile have also suffered from ongoing drought.
There remains significant uncertainty regarding the precise magnitude and location of the impacts of climate change and what changes in rainfall patterns might occur as a result. One possible outcome is more frequent and intense droughts and floods, changing the
12. See section 2.1 for a detailed explanation of hydropower’s exclusion.
24 World Energy Outlook 2016 Excerpt© O
ECD
/IEA
, 201
6
patterns of water flow over the year, straining reservoir management and altering the viability of hydropower. At a global level, the output from hydropower is not anticipated to change drastically, with hydro’s share of generation remaining steady at 16% over the Outlook period in the New Policies Scenario, but there are likely to be significant regional variations, with some regions experiencing increased generation potential, while others see a reduction.
Hydropower in Latin America
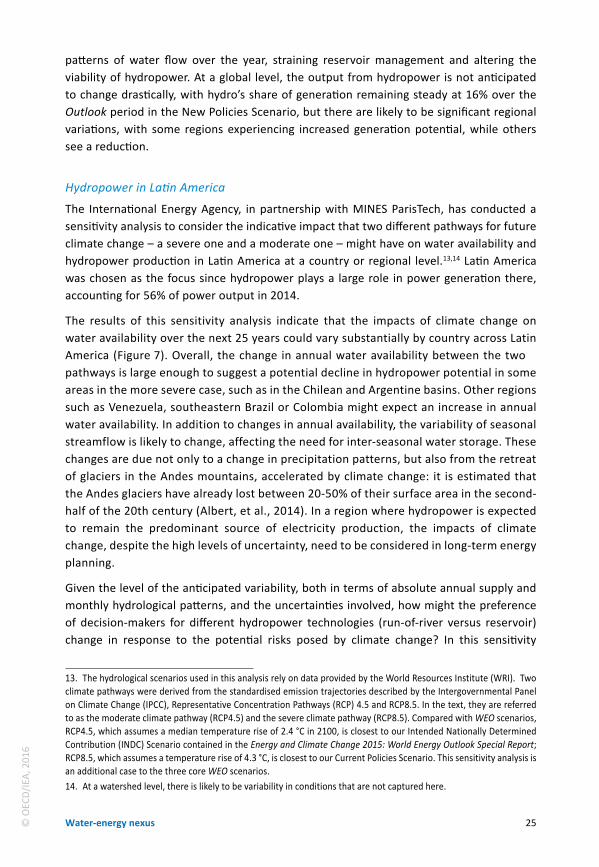
The International Energy Agency, in partnership with MINES ParisTech, has conducted a sensitivity analysis to consider the indicative impact that two different pathways for future climate change – a severe one and a moderate one – might have on water availability and hydropower production in Latin America at a country or regional level.13,14 Latin America was chosen as the focus since hydropower plays a large role in power generation there, accounting for 56% of power output in 2014.
The results of this sensitivity analysis indicate that the impacts of climate change on water availability over the next 25 years could vary substantially by country across Latin America (Figure 7). Overall, the change in annual water availability between the two pathways is large enough to suggest a potential decline in hydropower potential in some areas in the more severe case, such as in the Chilean and Argentine basins. Other regions such as Venezuela, southeastern Brazil or Colombia might expect an increase in annual water availability. In addition to changes in annual availability, the variability of seasonal streamflow is likely to change, affecting the need for inter-seasonal water storage. These changes are due not only to a change in precipitation patterns, but also from the retreat of glaciers in the Andes mountains, accelerated by climate change: it is estimated that the Andes glaciers have already lost between 20-50% of their surface area in the second-half of the 20th century (Albert, et al., 2014). In a region where hydropower is expected to remain the predominant source of electricity production, the impacts of climate change, despite the high levels of uncertainty, need to be considered in long-term energy planning.
Given the level of the anticipated variability, both in terms of absolute annual supply and monthly hydrological patterns, and the uncertainties involved, how might the preference of decision-makers for different hydropower technologies (run-of-river versus reservoir) change in response to the potential risks posed by climate change? In this sensitivity
13. The hydrological scenarios used in this analysis rely on data provided by the World Resources Institute (WRI). Two climate pathways were derived from the standardised emission trajectories described by the Intergovernmental Panel on Climate Change (IPCC), Representative Concentration Pathways (RCP) 4.5 and RCP8.5. In the text, they are referred to as the moderate climate pathway (RCP4.5) and the severe climate pathway (RCP8.5). Compared with WEO scenarios, RCP4.5, which assumes a median temperature rise of 2.4 °C in 2100, is closest to our Intended Nationally Determined Contribution (INDC) Scenario contained in the Energy and Climate Change 2015: World Energy Outlook Special Report; RCP8.5, which assumes a temperature rise of 4.3 °C, is closest to our Current Policies Scenario. This sensitivity analysis is an additional case to the three core WEO scenarios. 14. At a watershed level, there is likely to be variability in conditions that are not captured here.
25Water-energy nexus© O
ECD
/IEA
, 201
6

analysis, from now to 2020, run-of-river dams are the preferred technology choice in the region for several reasons. First, while these systems can be more expensive per megawatt-hour (MWh), they have shorter commissioning times than their reservoir counterparts, making them attractive to countries seeking to satisfy fast-growing electricity demand. Second, the development of large-scale reservoir dams is often subject to legal challenges on social and environmental grounds, making smaller run-of-river systems more politically and socially tenable (IEA, 2013). Run-of-river systems are most effective in areas of high annual levels of available water, with minimal variability in the monthly streamflow, as high levels of variability impact the reliability of these systems.
Figure 7 ⊳ Difference in annual water availability between a severe and moderate climate pathway in Latin America in 2040
-60% -40% -20% 0% 20% 40%
Total
Venezuela Colombia
North, northeast and central Brazil South and southeast Brazil
Peru, Ecuador Bolivia, Paraguay, Uruguay
Argentina Chile
Annual water availability in Latin America could vary substantially between the two pathways
Notes: % change refers to the percent change in rainfall in a severe climate scenario, compared with a moderate climate scenario. Rainfall per region/country represents an average value for the area.
Source: Data provided by World Resources Institute.
Further into the future, the variability brought on by changes to the hydrologic cycle and the need for inter-seasonal regulation becomes an important reason to prefer reservoir systems, where possible, as they provide a way to adapt to changing conditions by storing water.15 In this sensitivity analysis, most new reservoir dam investment occurs post 2025, due to the combination of high investment costs and long-lead times and a gradual improvement in the understanding of the risks posed by climate change and of the infrastructure that is best suited to deal with changes in the prospective climate conditions.
15. Environmental concerns and public opposition to large-scale reservoirs could continue, limiting future development. Another aspect in support of more reservoir systems is the contribution they can make to integrating variable renewable energy into power systems.
26 World Energy Outlook 2016 Excerpt© O
ECD
/IEA
, 201
6

Both southeastern Brazil and Venezuela, under the severe climate pathway, see an increase in the total quantities of water available annually, but Venezuela also experiences an increase in variability. Given these anticipated changes, southeastern Brazil could see the installation of more run-of-river plants in a severe climate pathway than in a moderate one.16 Whereas Venezuela, given the increased variability, might seek to build less run-of-river capacity, instead building more reservoir dams, if social and environmental constraints can be overcome, so that it can store water and counteract the variability. For countries that get drier under a severe climate pathway, such as Chile and Argentina, reservoir systems become less attractive, as they cannot ensure there will be enough water to generate electricity efficiently.
In either scenario, hydropower remains the primary source of electricity generation in the Latin America region and significant technical potential remains. The prospective changes to the region’s hydrology suggest the potential for not only a shift in hydropower technology preferences to hedge against potential climate risks, which could be lesser or greater at a watershed level depending on the location, but also in technology choices across the power sector. Given the availability and potential of renewable resources in Latin America, other renewable energy resources could step in to compensate for any potential shortfall or impact from an increase in variability from hydropower generation. But the choice of renewable energy technology may be influenced by a shift in hydropower technology preferences; reservoir systems bring greater flexibility to the electricity sector, and so provide an easier avenue to integrate a larger share of variable renewables, e.g. wind and solar. Where there are readily available domestic resources, fossil fuels and nuclear could also play an increased role, especially given their reliability during dry months or seasons.
In addition to adapting hydropower technology and infrastructure, and diversifying the energy mix, other efforts can be undertaken to help shore up Latin America’s ability to meet demand, despite potential changes to available energy supplies. The use of demand response mechanisms could help reduce overall electricity demand, temper demand at peak times and maintain grid stability, helping to offset some of the variability that changes to the hydrological cycle might bring. Additionally, greater network integration throughout the continent, while politically challenging, would allow countries to use resources elsewhere to help offset potential domestic disruptions, providing greater flexibility to accommodate increasing variability of hydropower output.
16. Given that a significant amount of existing hydropower potential in southeastern Brazil has been developed, the installation of additional capacity is constrained by remaining potential. However there is an increase in run-of-river installations in a severe scenario, relative to a moderate one, though it is small relative to the capacity already built.
27Water-energy nexus© O
ECD
/IEA
, 201
6

3 Energy for water 3.1 Overview
Not only does energy production need water, but water supply is also dependent on energy. The provision of freshwater from surface and groundwater sources or via desalination, its transport and distribution, and the collection and treatment of wastewater all require energy (Figure 8). The amount of energy required varies. It is influenced by a range of factors, such as topography, distance, water loss and inefficiencies, and the level of treatment necessary.
So far, there has been no systematic attempt to quantify the amount of energy consumed in the global water sector, or to examine how this might evolve in coming decades. To attempt such an assessment, we have combined estimates for water withdrawal and consumption with the energy intensities of each process in the water sector (Box 2).
Figure 8 ⊳ Energy use for various processes in the water sector
0.001 0.01 0.1 1 10 100
Water transfer Tertiary treatment
Sludge treatment
Secondary treatment Primary treatment
Pumping Water distribution
Reverse osmosis (brackish water)
Multiple-effect distillation Multi-stage flash distillation Reverse osmosis (seawater)
Direct potable reuse Surface water treatment
Groundwater treatment Surface water abstraction Groundwater abstraction
Was
tew
ater
trea
tmen
t De
salin
ation
Su
pply
kWh/m3
Fuel
Electricity
Seawater desalination and wastewater treatment are the most energy-intensive processes in the water sector
Notes: See Box 2 for more detail on methodology. See www.worldenergyoutlook.org/resources/water-energynexus/ for the detailed list including the numerical averages for each process.
Sources: EPRI (2002); Pabi, et al. (2013); Jones and Sowby (2014); Plappally and Lienhard V (2012); Spooner (2014); Li, et al (2016); Japan Water Research Center (n.d.); (Choi, 2015); Miller, et al. (2013); Singh, et al. (2012); Noyola, et al. (2012); Liu (2012); DWA-Leistungsvergleich (n.d.); Caffoor (2008); World Bank Group, (2015); Fillmore, et al. (2011); Brandt, et al. (2010); IEA analysis.
28 World Energy Outlook 2016 Excerpt© O
ECD
/IEA
, 201
6
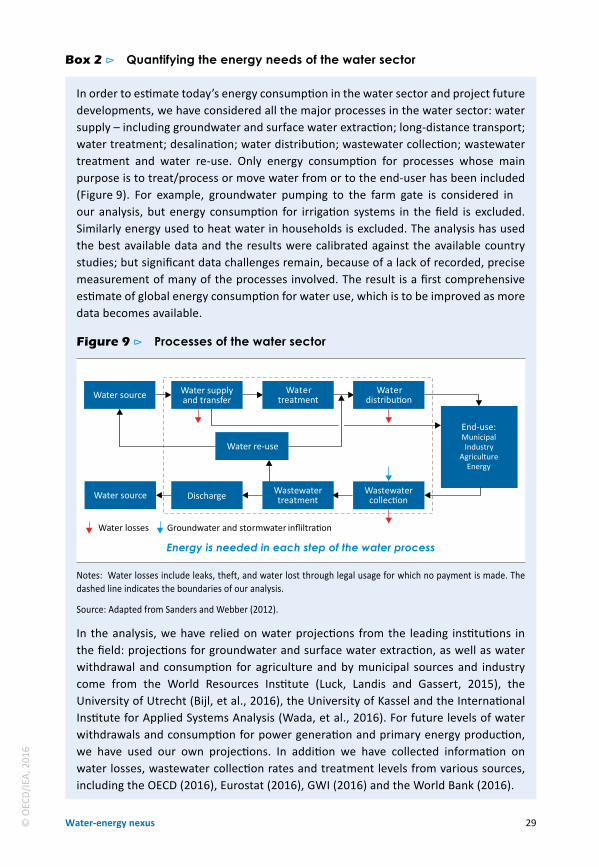
Box 2 ⊳ Quantifying the energy needs of the water sector
In order to estimate today’s energy consumption in the water sector and project future developments, we have considered all the major processes in the water sector: water supply – including groundwater and surface water extraction; long-distance transport; water treatment; desalination; water distribution; wastewater collection; wastewater treatment and water re-use. Only energy consumption for processes whose main purpose is to treat/process or move water from or to the end-user has been included (Figure 9). For example, groundwater pumping to the farm gate is considered in our analysis, but energy consumption for irrigation systems in the field is excluded. Similarly energy used to heat water in households is excluded. The analysis has used the best available data and the results were calibrated against the available country studies; but significant data challenges remain, because of a lack of recorded, precise measurement of many of the processes involved. The result is a first comprehensive estimate of global energy consumption for water use, which is to be improved as more data becomes available.
Figure 9 ⊳ Processes of the water sector
Water source
DischargeWater source Wastewatertreatment
Water re-use
Wateron
End-use:MunicipalIndustry
AgricultureEnergy
Watertreatment
Water supplyand transfer
Wastewatercollec n
Water losses Groundwater and stormwater infliltra n
Energy is needed in each step of the water process
Notes: Water losses include leaks, theft, and water lost through legal usage for which no payment is made. The dashed line indicates the boundaries of our analysis.
Source: Adapted from Sanders and Webber (2012).
In the analysis, we have relied on water projections from the leading institutions in the field: projections for groundwater and surface water extraction, as well as water withdrawal and consumption for agriculture and by municipal sources and industry come from the World Resources Institute (Luck, Landis and Gassert, 2015), the University of Utrecht (Bijl, et al., 2016), the University of Kassel and the International Institute for Applied Systems Analysis (Wada, et al., 2016). For future levels of water withdrawals and consumption for power generation and primary energy production, we have used our own projections. In addition we have collected information on water losses, wastewater collection rates and treatment levels from various sources, including the OECD (2016), Eurostat (2016), GWI (2016) and the World Bank (2016).
29Water-energy nexus© O
ECD
/IEA
, 201
6

To estimate the energy consumption of the water supply sector, we applied average energy intensities by region to each process. For this purpose, we undertook a review of the available literature and obtained feedback from leading researchers, as well as private companies active in this field.17 For projections on desalination, we have relied on current capacity data from GWI (2016) and, for re-use, on FAO (2016). Current policies have been taken into account and the assumption made that countries of the Middle East and Africa will gradually reduce withdrawals from non-renewable sources towards the end of the projection period. In order to assess the energy-savings potential, we have carried out a review of relevant technology for all steps in water treatment and distribution, and wastewater facilities (including energy recovery).
Overall, we estimate that roughly 120 million tonnes of oil equivalent (Mtoe) of energy was used worldwide in the water sector in 2014, almost equivalent to the entire energy demand of Australia.18 About 60% of that energy is consumed in the form of electricity, corresponding to a global demand of around 820 terawatt-hours (TWh) (or 4% of total electricity consumption), which is almost equivalent to today’s electricity consumption in Russia (Figure 10). The rest is thermal energy, half of which is used in diesel pumps, mainly to pump groundwater for agricultural purposes. The remainder is used for desalination, mainly in the form of natural gas and almost exclusively in the Middle East and North Africa.
Of the electricity consumed, the largest amount is used for the extraction of groundwater and surface water (around 40%), followed by wastewater treatment (including collection) with 25%. In developed countries, the largest share of water-related electricity consumption (42%) is used for wastewater treatment. In developing and emerging countries, electricity use for wastewater treatment currently plays a lesser role, as a lower share of wastewater is collected and it is treated to a lesser degree, but this is expected to increase in the future. About 20% of electricity is used for water distribution to consumers. On a global level, desalination accounts for only 5% of the water sector’s electricity use, but this share is far higher in the countries of North Africa and the Middle East. The remainder of electricity consumption is accounted for by large-scale inter-basin water transfers, freshwater treatment and water re-use.
The United States consumes more electricity in the water sector than any other region or country, roughly 40% of electricity consumption in the water sector in the United States goes to wastewater treatment. China is a close second, accounting for over 15% of global
17. More information on the energy factors used and key assumptions can be obtained at www.worldenergyoutlook.org/resources/water-energynexus/.18. This water-related energy demand is not additional energy demand, previously unaccounted for, but rather demand that is already included in various sector data and brought together for this analysis. For example, desalination in integrated water and power plants is accounted for under power generation, while stand-alone desalination plants are part of the services sector. Wastewater treatment is accounted for in the services sector or in industry if wastewater is treated in industrial facilities.
30 World Energy Outlook 2016 Excerpt© O
ECD
/IEA
, 201
6

electricity needs in the water sector. The Middle East, where the water sector accounts for 9% of electricity consumption, is the only region where desalination accounts for more than a quarter of water-related energy consumption. Groundwater extraction in India accounts for almost 60% of the electricity consumed by the water sector as India is by far the largest user of groundwater, accounting for about 40% of global groundwater use.
Figure 10 ⊳ Electricity consumption in the water sector by process and region, 2014
40
80
120
160
200
United States
European Union
India China Middle East
2%
4%
6%
8%
10% Transfer Wastewater treatment Re-use Desalination Distribution Supply
Share of total electricity (right axis) 200
400
600
800
1 000
World
2%
4%
6%
8%
10%
TWh
TWh
The water sector accounted for 4% of global electricity consumption in 2014
Notes: Supply includes water extraction from groundwater and surface water, as well as water treatment. Transfer refers to large-scale inter-basin transfer projects.
Sources: Luck, et al. (2015); Bijl, et al. (2016); Wada, et al. (2016); IEA analysis.
Water supply and transport
Energy is needed to extract water from lakes, rivers and oceans, and to lift groundwater from aquifers and pump it through pipes and canals to the treatment facility. The amount of energy required depends on the source (groundwater pumping is roughly seven-times more energy intensive than surface water extraction) and the distance and elevation that the water must travel before reaching the storage or treatment facility. Globally, surface water accounts for around two-thirds of all water withdrawals and groundwater for about a third (Figure 11). Non-traditional water sources (water re-use and desalination) currently satisfy less than 1% of all water needs.
Globally, water extraction is estimated to consume over 310 TWh of electricity per year and about 0.5 million barrels per day (mb/d) of diesel fuel. Almost half of global electricity for extraction is consumed in Asia, as this is the continent with the largest water use. India is the world’s largest water user by far, partly due to inefficient irrigation in agriculture, and accounts for around a quarter of global water withdrawals, although per-capita use is well below that of the United States. Other developing Asian countries are also large
31Water-energy nexus© O
ECD
/IEA
, 201
6

water users, notably Pakistan, Indonesia, Thailand and Viet Nam. Some countries, such as India and Middle Eastern countries rely heavily on groundwater, which is reflected in their relatively high energy consumption. On the other hand, Europe, China and the United States meet their demand mainly from surface water.
Figure 11 ⊳ Water supply by source by region, 2014
500 1 000 1 500 2 000
European Union
Middle East
United States
China
Other Asia
India
300 600 900 1 200 Groundwater Surface water Non-traditional
Per-capita
bcm
Water supply (bottom axis):
1 000 2 000 3 000 4 000
World
300 600 900 1 200 m3 per capita
m3 per capita
bcm
Water use (top axis):
Two-thirds of global water withdrawals in 2014 were from surface water, with most of the remainder from groundwater
Notes: m3 = cubic metre. Non-traditional water includes water re-use and the desalination of seawater, as well as brackish water. Other Asia refers to other developing Asia.
Sources: Luck, et al. (2015); Bijl, et al. (2016); Wada, et al. (2016); IEA analysis.
While in most countries water resources are sufficient at a country-wide level, the water is not always available where it is needed. Consequently, several countries have embarked on large-scale water transfer projects in order to make water available in water-stressed areas. We estimate that currently around 70 TWh of electricity are used for long-distance water transfer. The largest undertaking is China’s South-North Water Transfer Project, with capacity projected to increase to 45 bcm per year by 2050. Another project is the State Water Project in California, which is 1 100 km long and serves roughly 25 million people a year. This is the single largest energy user in California, at 2-3 % of all electricity consumed in the state (Webber, 2016).
32 World Energy Outlook 2016 Excerpt© O
ECD
/IEA
, 201
6

Water treatment
In a water treatment facility, energy is used primarily to pump and process water, and treat it to meet drinking water standards – the level of treatment depends mainly on the stringency of the standards required by the regulations in place. At the facility, contaminants, sediments and chemicals are removed using a process of mechanical screens and sedimentation. The water is then, typically, passed through a series of filters to a storage tank for disinfection (usually chlorination), before it is pressurised. It is estimated that globally, water treatment requires 65 TWh of electricity, of which pumping accounts for 80-85%. While the extraction of groundwater is much more energy intensive than that of surface water, the energy needs for its treatment are usually only a fraction of those for surface water, as it is typically less contaminated. In developing countries, surface water can be heavily polluted, requiring high levels of treatment and/or increasing reliance on groundwater resources.
Water distribution
Pumping water from the treatment plant via a pressurised distribution system to the end-user consumes a large amount of energy. It is estimated that water distribution for public supply consumes globally about 180 TWh today, with its energy intensity varying enormously from one place to another, depending on elevation changes and pressure requirements.19 Significant quantities of water are lost each day through pipe leaks, bursts and theft. Losses, theft and inaccurate metering plague developed and developing nations alike; water losses in public supply are estimated at 12% in the United States, 19% in China, 24% in the European Union and 48% in India. The highest volume of water is lost in developing countries in Asia, with India accounting for more than a fifth of worldwide losses in public water supply (Figure 12). Due to ageing pipes and insufficient levels of maintenance, volumetric losses are also high in the European Union, amounting to 13 bcm or almost equal to the entire water withdrawals of Korea.
Water losses entail a waste of energy that could be used for water extraction, treatment and distribution. Measures exist to reduce water losses, including pressure management, leakage control and replacement of infrastructure, but they are inadequately applied. If all countries reduced water losses to 6% (a level seen in the most advanced countries, including Denmark and Japan), 130 TWh, or the entire electricity needs of Poland, could be saved today (this includes avoided energy use in water extraction, treatment and distribution). The potential electricity savings are highest in India, where the electricity demand from the water sector could be cut by almost 40%. The gains in terms of electricity savings are particularly large where water production is energy intensive, as in the Middle East. Since diesel pumps are widely used for water extraction in developing nations, lower water losses would also reduce diesel consumption, by an estimated 0.12 mb/d.
19. In some countries, low water pressure in the public supply requires households to use booster pumps. The energy use for such pumps is not included in the analysis.
33Water-energy nexus© O
ECD
/IEA
, 201
6

Figure 12 ⊳ Water losses by region, 2014
10
20
30
40
India China Other Asia
Latin America
Africa European Union
United States
Middle East
bcm
10
20
30
40
TWh
Water losses Potential electricity savings (right axis)
Huge water losses in distribution networks represent both wasted water and wasted energy
Note: Other Asia refers to other developing Asia.
Sources: Luck, et al. (2015); Bijl, et al. (2016); Wada, et al. (2016); IEA analysis.
Wastewater treatment
After water is used by consumers, energy is required to collect, transport and treat it so that it can be safely discharged to minimise adverse environmental and human health impacts. Globally, wastewater treatment consumes about 200 TWh or 1% of total energy consumption. In developed countries, wastewater treatment is the largest energy consumer in the water sector. Similarly the energy needs for wastewater treatment can be very important at the local level. For some municipalities, the energy consumed by water and wastewater utilities can account for 30-50% of their energy bill (United States Government Accountability Office, 2011). Five factors influence the energy consumption for wastewater treatment: the share of wastewater collected and treated; the level of groundwater infiltration and rainfall into the sewage system; the treatment level; the contamination level; and the energy efficiency of the operations.
It is estimated that today over 35% of municipal wastewater is not collected, a figure that can be as high 60-95% in developing countries. In addition, wastewater might be collected but subsequently treated insufficiently. This represents not only a threat to human health and the environment but also means that there is significant upside potential in energy demand should more wastewater be collected and thoroughly treated. The intake at wastewater treatment facilities often does not consist only of wastewater but also of rainwater and storm water run-off (in addition to infiltrated groundwater due to pipeline leaks). In the case of Germany, wastewater, strictly defined, accounts for only 50% of the water treated in wastewater treatment plants (BDEW, 2014). Reducing the water inflow that does not need treatment is one way to significantly reduce energy consumption.
34 World Energy Outlook 2016 Excerpt© O
ECD
/IEA
, 201
6
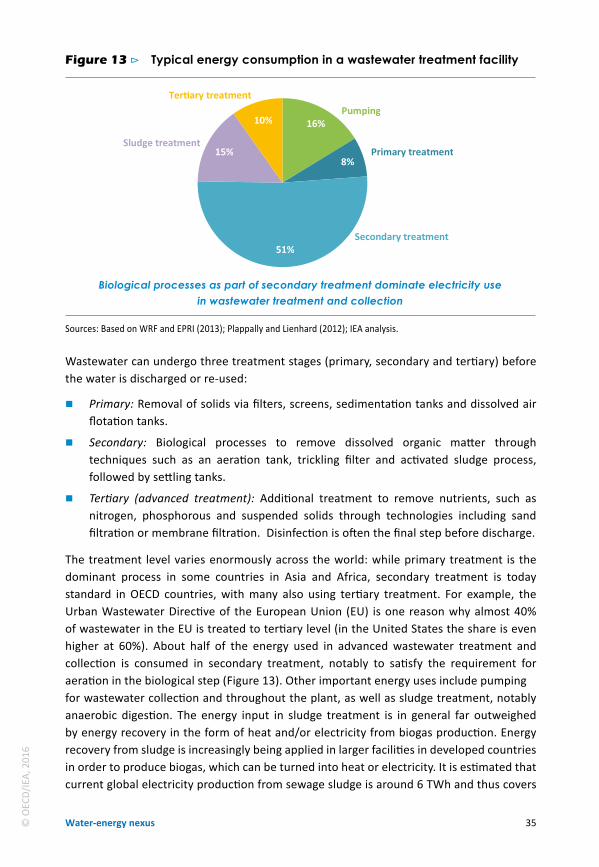
Figure 13 ⊳ Typical energy consumption in a wastewater treatment facility
Primary treatment
Secondary treatment
Pumping
Sludge treatment
Tertiary treatment
15%
10% 16%
8%
51%
Biological processes as part of secondary treatment dominate electricity use in wastewater treatment and collection
Sources: Based on WRF and EPRI (2013); Plappally and Lienhard (2012); IEA analysis.
Wastewater can undergo three treatment stages (primary, secondary and tertiary) before the water is discharged or re-used:
Primary: Removal of solids via filters, screens, sedimentation tanks and dissolved air flotation tanks.
Secondary: Biological processes to remove dissolved organic matter through techniques such as an aeration tank, trickling filter and activated sludge process, followed by settling tanks.
Tertiary (advanced treatment): Additional treatment to remove nutrients, such as nitrogen, phosphorous and suspended solids through technologies including sand filtration or membrane filtration. Disinfection is often the final step before discharge.
The treatment level varies enormously across the world: while primary treatment is the dominant process in some countries in Asia and Africa, secondary treatment is today standard in OECD countries, with many also using tertiary treatment. For example, the Urban Wastewater Directive of the European Union (EU) is one reason why almost 40% of wastewater in the EU is treated to tertiary level (in the United States the share is even higher at 60%). About half of the energy used in advanced wastewater treatment and collection is consumed in secondary treatment, notably to satisfy the requirement for aeration in the biological step (Figure 13). Other important energy uses include pumping for wastewater collection and throughout the plant, as well as sludge treatment, notably anaerobic digestion. The energy input in sludge treatment is in general far outweighed by energy recovery in the form of heat and/or electricity from biogas production. Energy recovery from sludge is increasingly being applied in larger facilities in developed countries in order to produce biogas, which can be turned into heat or electricity. It is estimated that current global electricity production from sewage sludge is around 6 TWh and thus covers
35Water-energy nexus© O
ECD
/IEA
, 201
6

around 4% of worldwide electricity needs in the municipal wastewater sector. Tertiary treatment is typically a less significant energy consumer, but increasingly stringent water quality standards in developed countries have already led to higher energy consumption for tertiary treatment.
Desalination and water re-use
Almost all of the world’s water demand is met from groundwater and surface water, but varying levels of water stress in some parts of the world, particularly North Africa and the Middle East, have driven several countries to augment their natural water supplies through increased use of non-traditional water resources, including desalination and re-use. At its simplest, desalination is the process of separating saline water (seawater or brackish water) into freshwater and concentrated salt. The desalination of brackish water, given its lower salt concentration, consumes only about a tenth of the electricity needed in seawater desalination. Today there are two main types of desalination technologies:20
Thermal: Water is boiled to separate out salts by evaporation, which requires a large amount of thermal energy, usually natural gas, but also some electricity. Multi-stage flash systems and multi-effect distillation are the most common technologies. Multi-effect distillation can be used with a combined-cycle power plant in an integrated water and power plant, in order to optimise the use of the heat of the combined cycle.
Electric (membrane-based): A semi-permeable barrier is used to filter out the dissolved solids. Reverse osmosis is the primary technology, which uses electric pumps to push water through the membrane to remove the salt.
Today reverse osmosis is the most commonly installed technology, spurred on by technological improvement, its relatively low energy intensity and cost reductions. In 2015, over 65% of global installed desalination capacity was equipped with reverse osmosis membranes. As of 2015, there were roughly 19 000 desalination plants worldwide, with an available production capacity of roughly 15 bcm per year to provide water to both municipal and industrial users. The Middle East houses almost half of global installed desalination capacity, followed by the European Union with 13%, the United States with 9%, and North Africa with 8% (GWI, 2016). Globally, seawater is the most common feed water type, supplying about 60% of installed capacity, followed by brackish water at over 20%.
Water re-use describes the use of discharged wastewater as a source of freshwater. In general, a distinction is made between potable and non-potable re-use with non-potable re-use employed mainly for irrigation. As drinking water needs to meet higher quality standards, the process of re-using water for potable purposes requires more energy than non-potable purposes. Given the ready availability of wastewater and the lower energy
20. Generally two established technologies dominate the market today, though several new ones are emerging, such as high-recovery reverse osmosis, forward osmosis, membrane distillation and renewable desalination. The technologies aim to decrease the energy required and the costs, as well as the environmental impact.
36 World Energy Outlook 2016 Excerpt© O
ECD
/IEA
, 201
6

intensity of advanced treatment for water re-use compared with seawater desalination, water re-use presents an increasingly attractive option to meet demand.
Although desalination and water re-use meet only 0.7% of global water needs today, these processes account for almost a quarter of total energy consumption by the water sector. Less than 15% of the energy is provided in the form of electricity, with natural gas being the preferred fuel for thermal desalination. Energy consumption for the desalination of brackish water and water re-use is fairly small in comparison to seawater desalination, as seawater desalination is much more common and requires higher levels of energy input. The United Arab Emirates (UAE) has the largest desalination capacity, followed by Saudi Arabia. The UAE accounts for about half of the global energy use in desalination as it relies mainly on seawater as an input and on the multi-stage flash systems technology, which is the most energy-intensive process (Figure 14). Currently, water re-use does not play an important role in terms of energy consumption, but it is becoming more important, notably in the United States and India.
Figure 14 ⊳ Energy demand for desalination and re-use, 2014
2 4 6 8 10 12 14 South Africa
United States Australia
Israel Egypt China
Algeria Libya
Bahrain Oman
European Union Kuwait
Qatar Saudi Arabia
United Arab Emirates
Desalination Re-use
Mtoe
Around half of global energy consumption for desalination in 2014 was in the United Arab Emirates
Sources: GWI (2016); IEA analysis.
3.2 Energy requirements for water in the New Policies Scenario
Global energy use in the water sector is projected to more than double over the Outlook period to 2040, i.e. increasing more rapidly than water withdrawal, to reach a level of about 270 Mtoe. Though the water sector accounts for just 2% of global final energy consumption
37Water-energy nexus© O
ECD
/IEA
, 201
6

in 2040, the rate of increase between 2014 and 2040 is almost three times greater than that of final energy consumption over the same period. Thermal energy needs in the sector are projected to increase to 140 Mtoe, mainly driven by an increase in desalination capacity. The use of diesel fuel declines, however, by roughly 0.2 mb/d, as diesel pumps are gradually replaced by electric ones. Higher desalination needs in the future drive the almost five-fold increase in natural gas consumption in the sector, although this is less than the growth in desalination capacity, as membrane-based desalination and desalination using concentrating solar power gain in market share.
Figure 15 ⊳ Electricity consumption in the water sector by process
400
800
1 200
1 600
2014 2020 2025 2030 2035 2040
TWh
2%
4%
6%
8% Transfer Wastewater treatment Re-use Desalination Distribution Supply*
Share of global electricity (right axis)
Electricity consumption in the water sector increases by 80% over the next 25 years
* Supply includes groundwater and surface water treatment.
Sources: Luck, et al. (2015); Bijl, et al. (2016); Wada, et al. (2016); IEA analysis.
Electricity consumption in the water sector increases by 2.3% per year in the future to reach a total of 1 470 TWh in 2040, equivalent to almost twice the electricity consumption of the Middle East today (Figure 15). The largest increase is projected to come from desalination, as production from seawater desalination increases almost nine-fold and brackish water desalination increases five-fold. Accordingly, in 2040 desalination accounts for more than 20% of all electricity consumed by the water sector, up from only 5% today. Desalinated water gains a larger share of the water market in many countries around the world, but the largest increase is concentrated in countries of the Middle East and North Africa. As desalination becomes more important in the future so does water re-use, particularly in developed countries. Consumption of re-used water more than quadruples over the next 25 years, with the largest increase projected to occur in the United States, China, India, North Africa and the Middle East. Non-traditional water sources combined account for 4% of water supply in 2040, compared with only 0.7% today. The second-largest increase in electricity consumption in the water sector comes from large-scale
38 World Energy Outlook 2016 Excerpt© O
ECD
/IEA
, 201
6

water transfer projects, as China is expected to go ahead with the different routes of its South-North Water Transfer Project. By 2040, it is estimated that a total of 180 TWh will be used for water transfer projects in China, accounting for 2% of total Chinese electricity consumption in that year. This includes moving up to 45 bcm of water through the South-North Water Transfer infrastructure project.
Global electricity consumption for wastewater collection and treatment requires over 60% more electricity in 2040 than in 2014, as the amount of wastewater in need of treatment increases. Two trends concerning the energy intensity of wastewater treatment on a worldwide basis counterbalance each other: developing countries move towards treating wastewater to a higher level, increasing the global energy intensity, while efficiency improvements in treatment mitigate this growth. Wastewater treatment is projected to become 7-27% (depending on the region) more efficient by 2040, compared with today. This is achieved partly through more efficient wastewater pumping but also through efficiency gains in secondary treatment (see section 3.3). Increased water quality standards, especially in developed countries (e.g. standards requiring the removal of pharmaceutical substances) will increase energy consumption in the future, but only to a limited degree. Electricity needs for groundwater extraction increase by almost 30 TWh over the next 25 years, not only as a consequence of higher levels of groundwater extraction but also due to a gradual shift from diesel to more efficient electric pumps.
The water sector’s share in global electricity consumption stays fairly constant at around 4%, but this hides strong regional divergences: in the United States and the European Union the share remains fairly constant at around 3%; the share decreases from around 10% to 4% in India (as other electricity uses increase much faster); the share increases from 9% to 16% in the Middle East (as desalination capacity increases quickly) and in China from 3% to 4% (as a consequence of the South-North Water Transfer Project).
Desalination in the Middle East and North Africa
Eight of the ten countries with the lowest renewable water resources on a per-capita basis are located in North Africa and the Middle East. One of the consequences of such low availability is dependence on withdrawals from non-renewable groundwater resources. In the late 1990s, it was estimated that the share of non-renewable groundwater resources used to satisfy water demand was as high as 95% in Libya, 89% in Oman, 85% in Saudi Arabia and 70% in the UAE (Foster and Loucks, 2006). During this same time period, the largest absolute non-renewable groundwater withdrawals occurred in Saudi Arabia (18 bcm), followed by Libya (3 bcm) and the UAE (2 bcm). As this way of satisfying water demand is not sustainable, countries in the region have sought alternative solutions. The United Arab Emirates, for example, have increased their desalination capacity by almost 1.7 bcm since the early 2000’s, reducing non-renewable groundwater withdrawals; today its largest share of water comes from seawater desalination. However, in many countries the gap between renewable water resources and current withdrawals remains high.
39Water-energy nexus© O
ECD
/IEA
, 201
6
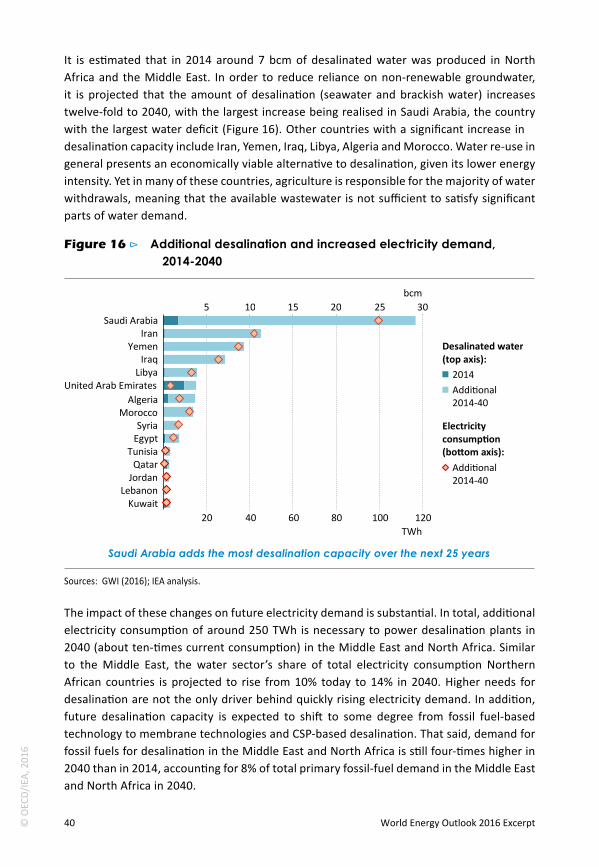
It is estimated that in 2014 around 7 bcm of desalinated water was produced in North Africa and the Middle East. In order to reduce reliance on non-renewable groundwater, it is projected that the amount of desalination (seawater and brackish water) increases twelve-fold to 2040, with the largest increase being realised in Saudi Arabia, the country with the largest water deficit (Figure 16). Other countries with a significant increase in desalination capacity include Iran, Yemen, Iraq, Libya, Algeria and Morocco. Water re-use in general presents an economically viable alternative to desalination, given its lower energy intensity. Yet in many of these countries, agriculture is responsible for the majority of water withdrawals, meaning that the available wastewater is not sufficient to satisfy significant parts of water demand.
Figure 16 ⊳ Additional desalination and increased electricity demand, 2014-2040
5 10 15 20 25 30
Kuwait Lebanon
Jordan Qatar
Tunisia Egypt Syria
Morocco Algeria
United Arab Emirates Libya
Iraq Yemen
Iran Saudi Arabia
20 40 60 80 100 120 TWh
2014 Additional 2014-40
Additional 2014-40
bcm
Desalinated water (top axis):
Electricity consumption (bottom axis):
Saudi Arabia adds the most desalination capacity over the next 25 years
Sources: GWI (2016); IEA analysis.
The impact of these changes on future electricity demand is substantial. In total, additional electricity consumption of around 250 TWh is necessary to power desalination plants in 2040 (about ten-times current consumption) in the Middle East and North Africa. Similar to the Middle East, the water sector’s share of total electricity consumption Northern African countries is projected to rise from 10% today to 14% in 2040. Higher needs for desalination are not the only driver behind quickly rising electricity demand. In addition, future desalination capacity is expected to shift to some degree from fossil fuel-based technology to membrane technologies and CSP-based desalination. That said, demand for fossil fuels for desalination in the Middle East and North Africa is still four-times higher in 2040 than in 2014, accounting for 8% of total primary fossil-fuel demand in the Middle East and North Africa in 2040.
40 World Energy Outlook 2016 Excerpt© O
ECD
/IEA
, 201
6

3.3 Measures to save energy
The New Policies Scenario – our central scenario – captures the effect of evolving energy prices and the impact of current policies and those that are adopted but yet to be implemented. As such, it reflects an outlook that is far from exploiting the full potential for energy efficiency and energy recovery from wastewater. A range of barriers remain, including but not limited to:
The electricity consumption of different parts in the system is often not quantified, contributing to a general lack of awareness about the potential for efficiency improvements.
Energy efficiency measures require upfront investment, which can deter action if financing is associated with an increase in water tariffs.
Larger wastewater facilities are rarely considered as an integrated system to be optimised as a whole.
Efficiency projects save electricity but their adoption can interrupt processes or increase maintenance requirements.
Some energy-savings measures are not easily replicated from one facility to another, as the layout and water quality at each facility may differ.
This does not mean that energy efficiency improvements are excluded in the New Policies Scenario: in fact, electricity consumption in the water sector as a whole would have been more than 10% higher in 2040 without improved energy efficiency. In the 450 Scenario – where the rise in average global temperature is limited to 2 °C by 2100 – the economically viable energy efficiency potential is fully exploited. In the 450 Scenario, electricity consumption in the water sector grows annually by 1.6% to 2040, i.e. by 0.6 percentage points less than in the New Policies Scenario. This delivers electricity savings of almost 225 TWh by 2040 and additional electricity generation from sewage sludge of 70 TWh in the 450 Scenario (relative to the New Policies Scenario), which together are enough to replace the electricity generation of around 50 large-scale (800 MW) coal-fired power stations. The largest savings are achieved in wastewater treatment, desalination and water supply, followed by freshwater distribution (Figure 17). Almost 60% of the electricity savings occur in just four regions: the Middle East, China, the United States and India. In the Middle East, electricity consumption for the water sector is lower mainly as a result of a shift from membrane-based desalination towards thermal desalination using CSP, while in China and the United States savings from wastewater treatment dominate and in India savings come mainly from groundwater pumping.
Global electricity consumption in wastewater treatment in the 450 Scenario is about 230 TWh, roughly 25% lower than in the New Policies Scenario, as a result of a wide deployment of energy efficiency measures, operational improvements and a reduction of storm and groundwater infiltration into sewage systems. The biological process, which is the most energy intensive within secondary treatment, offers the largest savings potential. The wider deployment of variable speed drives, fine bubble aeration, better process
41Water-energy nexus© O
ECD
/IEA
, 201
6
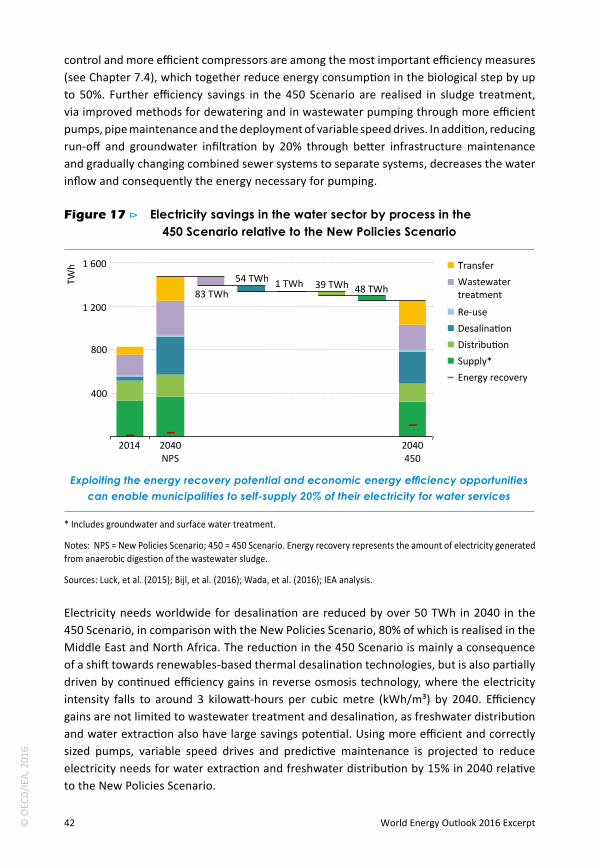
control and more efficient compressors are among the most important efficiency measures (see Chapter 7.4), which together reduce energy consumption in the biological step by up to 50%. Further efficiency savings in the 450 Scenario are realised in sludge treatment, via improved methods for dewatering and in wastewater pumping through more efficient pumps, pipe maintenance and the deployment of variable speed drives. In addition, reducing run-off and groundwater infiltration by 20% through better infrastructure maintenance and gradually changing combined sewer systems to separate systems, decreases the water inflow and consequently the energy necessary for pumping.
Figure 17 ⊳ Electricity savings in the water sector by process in the 450 Scenario relative to the New Policies Scenario
400
800
1 200
1 600
2014 2040 NPS
2040 450
TWh Transfer
Wastewater treatment Re-use Desalination Distribution Supply*
83 TWh 54 TWh 1 TWh 39 TWh 48 TWh
Energy recovery
Exploiting the energy recovery potential and economic energy efficiency opportunities can enable municipalities to self-supply 20% of their electricity for water services
* Includes groundwater and surface water treatment.
Notes: NPS = New Policies Scenario; 450 = 450 Scenario. Energy recovery represents the amount of electricity generated from anaerobic digestion of the wastewater sludge.
Sources: Luck, et al. (2015); Bijl, et al. (2016); Wada, et al. (2016); IEA analysis.
Electricity needs worldwide for desalination are reduced by over 50 TWh in 2040 in the 450 Scenario, in comparison with the New Policies Scenario, 80% of which is realised in the Middle East and North Africa. The reduction in the 450 Scenario is mainly a consequence of a shift towards renewables-based thermal desalination technologies, but is also partially driven by continued efficiency gains in reverse osmosis technology, where the electricity intensity falls to around 3 kilowatt-hours per cubic metre (kWh/m³) by 2040. Efficiency gains are not limited to wastewater treatment and desalination, as freshwater distribution and water extraction also have large savings potential. Using more efficient and correctly sized pumps, variable speed drives and predictive maintenance is projected to reduce electricity needs for water extraction and freshwater distribution by 15% in 2040 relative to the New Policies Scenario.
42 World Energy Outlook 2016 Excerpt© O
ECD
/IEA
, 201
6
In addition to the opportunities to save energy in the water sector, there are also opportunities to produce energy from wastewater. On average, the energy content of wastewater is five-to-ten-times greater than the energy necessary to treat it. Anaerobic digestion can convert chemically bound energy into biogas (primarily methane). The biogas can then be used to produce heat (either to satisfy a plant’s own needs or to feed into a district heating network), or electricity or serve as a fuel for trucks or buses, or for cooking/heating. Theoretically, up to 0.56 kWh/m³ of electricity can be produced from sewage sludge on average: however, in reality this number is significantly lower, due to inefficiencies in the digestion process and electricity conversion, and barriers limiting its uptake. In general, small plants (i.e. < 5 million litres per day [MLD]) cannot generate enough biogas to make energy recovery cost-effective, while plants larger than 5 MLD can generate electricity only if digesters are part of the plant. The makeup of wastewater is another factor. For example, in the United States, the more diluted nature of the wastewater (due to infiltration of storm and groundwater) makes it more difficult for a utility to recover energy. Another key factor is the location of the facility and whether or not there is an outlet for excess biogas, such as compressed natural gas for transport or applications that can use excess heat. Such infrastructure does not exist in many parts of the world. Moreover, in developing countries, the over-riding objective of a utility is to meet existing and future needs for wastewater treatment. As such, more significant steps towards capitalising on the embedded energy in the short term are unlikely.
Given these many obstacles, electricity production from sewage sludge is projected in the New Policies Scenario to increase from almost 6 TWh today to almost 30 TWh in 2040. Though this is a five-fold increase, it corresponds to just 0.06 kWh generated per unit of wastewater treated, less than half the level achieved in several European countries today. Under the right incentive schemes, such as those assumed in the 450 Scenario, it is, however, possible to increase electricity generation to about 100 TWh in 2040. This would satisfy over 55% of the electricity needs for municipal wastewater treatment (but only 8% of the needs of the entire water sector). It means that net municipal electricity needs (electricity requirements minus electricity produced from biogas) for water supply and wastewater treatment are cut by more than 30% in the 450 Scenario, compared with the New Policies Scenario. While some in developed countries have already achieved, or are on track to achieve, energy neutrality (a concept where energy needs are entirely satisfied with own-generation), at a global level, full energy neutrality is unlikely over the next 25 years (Box 3).
Box 3 ⊳ Energy neutrality: an end to wasting energy on wastewater
There is significant potential for the wastewater industry and municipalities to utilise existing technologies to improve process efficiency and harness the embedded energy in wastewater. This could even produce excess energy for other uses. In our projections, by 2040 electricity produced from wastewater covers 12% of the electricity demand from municipal wastewater treatment in the New Policies Scenario and over 55% in the 450 Scenario. However, when looking at the total electricity needs of the water
43Water-energy nexus© O
ECD
/IEA
, 201
6
transport and treat water, own-generation from wastewater supplies just 2% of the total electricity needs in the water sector in the New Policies Scenario, a share that increases to 8% in the 450 Scenario.
Several municipalities in Europe and the United States though have made greater strides towards the concept of energy neutrality, serving as examples of how it can be achieved and the consequent benefits. The path to this self-sufficiency comes in two parts: first, is energy savings through efficiency gains and the second is electricity generation from biogas.
Europe, in particular, has made significant progress in the pursuit of energy neutrality in wastewater treatment. In Denmark, the Aarhus Marselisborg Wastewater Facility has both improved the efficiency of its operations (via process optimisation, better aeration, sludge liquor treatment to improve the efficiency of ammonium removal) and invested in energy recovery units for biogas use in high efficiency combined heat and power (CHP) units that feeds surplus heat into a district heating system and surplus electricity to the grid. It is now an energy positive facility — i.e. it produces more energy than it needs. In 2014 it generated almost 40% more electricity than it consumed and sold 2.5 gigawatt-hours (GWh) of heat to the district heating system. Combined, this equals almost 100% more energy produced than is consumed at the facility.
Several wastewater treatment facilities in the United States are also focussing on reducing the amount of energy they require from the grid and making better use of waste streams. The wastewater treatment plan in Gresham, Oregon was the first facility in the United States to become energy neutral by co-mingling outside organic waste streams from restaurants with its wastewater to produce biogas. DC Water in Washington DC has the world’s largest thermal hydrolysis advanced anaerobic digestion facility and the biogas created at its wastewater treatment plant is used in its CHP plant. The Stickney Water Reclamation Plant in Chicago, the largest in the world, has announced plans to become energy neutral by 2023 by producing enough energy to replace three-quarters of its energy demand and satisfying the remainder via efficiency gains.
4 Stress points and solutions This analysis of the energy and water sectors highlights areas of potential stress, as well as areas where action can bring co-benefits across the water-energy nexus. Limitations on water can restrict energy production and energy disruptions can limit water provision. Our analysis shows a general shift towards more water-intensive energy and energy-intensive water. The system is evolving and new stress points and chokepoints could arise at country, local and policy levels. That said, there are several opportunities for action to overcome such risks, using both technical and non-technical solutions.
44 World Energy Outlook 2016 Excerpt© O
ECD
/IEA
, 201
6

4.1 Potential stress points
A more water-intensive energy sector
Globally, the water consumption-intensity of the energy sector – that is, total water consumed per unit of energy produced showing the relative consumption-intensity of the energy portfolio as a whole – increases in both scenarios in the future, by 20% in the New Policies Scenario and by almost 70% in the 450 Scenario relative to 2014. This happens over a period when water demand is growing from all sectors (see Figure 2) and when climate change is expected to change the patterns of water availability. This focus on consumption is not to understate the importance of water withdrawals by the energy sector. Although the water withdrawal-intensity is set to decline overall (almost 25% in the New Policies Scenario and less than 10% in the 450 Scenario compared to 2014) – and much of the water withdrawn is ultimately returned – the withdrawal of water at a given point in time can stress the water system, depending on the needs of other users, the seasonality of water availability and the state in which the water is returned. Water consumed on the other hand is, by definition, not returned and necessarily decreases the amount of water available to other users.
Overall the water consumption-intensity of the 450 Scenario is 40% higher in 2040 than the New Policies Scenario, while the water withdrawal-intensity is 20% higher (Figure 18). Therefore, despite the fact that total energy produced in the 450 Scenario is more than a quarter lower than in the New Policies Scenario in 2040, its water use per unit of energy is higher. This indicates that the technology and policy choices related to decarbonisation could introduce unintended stress points if not properly managed. Three components of a low-carbon portfolio, in particular, affect water intensity in the 450 Scenario. First, the power sector’s share of consumption in the 450 Scenario is roughly ten percentage points higher than in the New Policies Scenario in 2040 due to the deployment of low-carbon technologies such as nuclear and CSP, with CSP accounting for 5% of the 450 Scenario’s consumption (up from 1% in the New Policies Scenario) and nuclear accounting for 9% (compared to 7% in the New Policies Scenario). Nuclear also accounts for almost half of the 450 Scenario’s withdrawals in 2040 (an increase of 15 percentage points compared with the New Policies Scenario). Second, the share of consumption from coal-fired power plants increases by over 40%, compared with the New Policies Scenario, due to the deployment of carbon capture and storage. Finally, an increased share of biofuels in total energy supply relative to the New Policies Scenario, increases its share of withdrawals and by 2040 biofuels account for almost a quarter of the 450 Scenario’s withdrawal.
Just as not all low-carbon technologies or fuels affect water use in the energy sector, the impact varies on a country or regional level as well. Of course, the availability of total water resources varies drastically by country and even within countries. Countries that are not classified as water stressed at a national level, such as the United States, face areas of water scarcity that will intersect with different types of energy projects. Given the differences in the national energy portfolios and levels of water availability, the challenges are not uniform. A few of the potential stress points in the New Policies Scenario are set out below.
45Water-energy nexus© O
ECD
/IEA
, 201
6

Figure 18 ⊳ Share of withdrawal and consumption by fuel or technology and total water intensity by scenario, 2014 and 2040
Biofuels Fossil fuels
Other renewables CSP Biomass Nuclear Oil Natural gas Coal
Total water intensity (right axis)
Withdrawal
Power:
Primary energy:
20%
40%
60%
80%
100%
2014 NPS 2040
450 2040
10
20
30
40
50
m3 /t
oe
Consumption
20%
40%
60%
80%
100%
2014 NPS 2040
450 2040
2
4
6
8
10
m3 /t
oe
The increased share of nuclear and CSP in the energy mix and the shift to more water-consumptive cooling technologies in coal-fired power plants
in the 450 Scenario boosts its water intensity
Notes: CSP = concentrating solar power. Under primary energy, fossil fuels include coal, oil and natural gas. Under power, other renewables includes solar PV, wind and geothermal; coal and natural gas include both power plants that are fitted with CCS technology and those without. Total water intensity is calculated as total water withdrawal or water consumption by the energy sector divided by total energy produced.
India is already classified as “water stressed”. Over the Outlook period India’s total energy-related water withdrawals almost double, reaching almost 70 bcm while energy-related water consumption rises to almost 20 bcm. The increases reflect an increased role for nuclear as well as a continued reliance on coal-fired power plants, many of which are located in areas of water stress.21 As a result, more power plants use either wet-tower cooling, which withdraw less water but increase consumption, or non-freshwater systems in coal-fired power generation by 2040. As discussed, India’s reliance on water-intensive sugarcane to produce bioethanol also exacerbates existing water stress in some parts of the country, given rising demand from other users (municipalities in particular, where demand doubles), limited land availability and food security concerns.
In the New Policies Scenario, China’s energy-related water withdrawals rise by over 20% from 2014 to 2040, to reach almost 55 bcm, while its consumption increases at a faster rate, rising by over 40%, to 15 bcm. Water constraints are expected to increase as agricultural water withdrawals are also projected to rise by 11% and municipal needs to rise by over 30% over the next 25 years. China is already experiencing water scarcity in several regions,
21. The IEA has analysed the impact of water scarcity on the location and cooling technology choices of coal-fired power generation in China and India. See World Energy Outlook-2015, Chapter 8 and Chapter 14 for the case studies. Excerpts can be found at: www.worldenergyoutlook.org/resources/water-energynexus/.
46 World Energy Outlook 2016 Excerpt© O
ECD
/IEA
, 201
6

which is affecting coal production, power plant siting and the choice of technologies for new coal plants (IEA, 2015). As in India, in order to adapt, the power sector is installing more wet-tower cooling systems, though China has mandated that all new coal-fired power plants being built in arid regions use dry cooling. The expansion of China’s nuclear power capacity, a portion of which is proposed to be built inland, is water intensive and, depending on where it is sited, this expansion could increase competition for scarce water resources.
Water scarcity is already a constraint on energy production in the Middle East. In the New Policies Scenario, while its total water withdrawals and consumption for energy are low relative to other countries, the energy sector in the Middle East consumes much of the water it withdraws. In the power sector, consumption’s share of withdrawals increases from 16% to almost 40% between 2014 and 2040 and in primary energy production it rises from 80% to 83%. The Middle East has to come to terms with rising needs for water consumption alongside limited water availability and increasing reliance on more energy-intensive sources of water supply (see section on desalination in the Middle East and North Africa in section 3.2).
A more energy-intensive water sectorIn parallel with the rising water intensity of the energy sector, operations in the water sector are set to become more energy intensive. In the New Policies Scenario, the global electricity intensity of the water sector increases from around 0.2 kWh/m³ in 2014 to 0.3 kWh/m³ in 2040, which is reflected in every major water-using region (Figure 19). The underlying reasons for this increase differ by country, but the most common are high growth in municipal and industrial water withdrawals, an increased reliance on non-traditional water resources and increased amounts of wastewater being treated to higher levels. The largest increase occurs in the Middle East, where, by 2040, the energy intensity of water withdrawals is about three-times higher than in the United States. In most Asian countries, including China and India, one of the largest increases in electricity consumption in the water sector stems from higher volumes of wastewater, treated to a higher level.
Cities will be a major source of energy demand for water. In 2014, over 50% of the world’s population resided in urban areas. Over the projection period, the share of the population living in urban areas is expected to grow at 0.6% on average per year in the New Policies Scenario and by 2040, over 60% of the population is likely to be living in urban areas, an increase of 1.9 billion people. Most future urbanisation will occur in cities in developing countries, many of which are already facing challenges related to water and energy, especially in Africa, South Asia and China (WWAP, 2014). Almost one-out-of-four cities worldwide are in a water-stressed area (McDonald et al., 2014).22 Water stress could increase with climate change, and rising water and energy demand from other users will further strain energy and water needs.
22. In the study conducted by McDonald, et al. 2014, water stress is defined as those cities that use at least 40% of the water they have available.
47Water-energy nexus© O
ECD
/IEA
, 201
6

Figure 19 ⊳ Electricity consumption and intensity in the water sector in the New Policies Scenario, 2014 and 2040
100
200
300
400
2014
20
40
TWh
0.3
0.6
0.9
1.2
kWh/
m3
Electricity consumption
Electricity intensity (right axis)
United States
European Union
China India Other Asia
Middle East
2014
20
40
2014
20
40
2014
20
40
2014
20
40
2014
20
40
Water use is projected to become more electricity intensive
Notes: Electricity intensity is calculated as total electricity consumption in the water sector, divided by total water withdrawals from agriculture, industry, power generation and municipal uses. Other Asia refers to other developing Asia.
Sources: Luck, et al. (2015); Bijl, et al. (2016); Wada, et al. (2016); IEA analysis.
Given that water provision and wastewater treatment already account for a large share of municipal energy bills (30-50%), increasing energy efficiency in wastewater treatment will be necessary to constrain the impact on public budgets. As discussed, more efficient equipment, including more efficient pumps and the use of variable speed drives can lead to significant energy and cost savings (see Chapter 7.4 for more on variable speed drives).
Points of intersection
There are wide disparities in the management and pricing of energy and water. Market forces tend to propel energy sector development, while improvements to water-related services are often determined by social priorities. Energy and water are often managed at different levels: energy top down and water bottom up, with varying levels of private sector involvement (drinking water and sanitation services are predominately the responsibility of the public sector, compared with a larger role of private companies in the power sector).
Unlike energy, there is no global water market and therefore no international price. What consumers pay for water often does not reflect relative scarcity. Some users pay for extraction, while others pay just for delivery (i.e. the cost of electricity to access the water, transport it, clean it and remove waste), and in some places this cost is heavily subsidised or free. In these circumstances, there is little incentive to conserve water and, unlike the market price signals for some forms of unsubsidised energy, the cost does not go up during
48 World Energy Outlook 2016 Excerpt© O
ECD
/IEA
, 201
6

times of scarcity. Moreover, some industrial and agricultural consumers secured long-term water contracts in times of low prices and do not have a price incentive to invest in water conservation measures and equipment.
Under-pricing of water and energy undercuts investment in more efficient energy and water infrastructure and can lead to unnecessarily high consumption levels. Agriculture is a case in point. Low electricity prices can lead to an excessive call on groundwater resources while low water prices can increase demand for electricity for pumping. India is one example where this dynamic is evident. Agriculture accounted for 85% of water withdrawals in India in 2014 and the system relies heavily on electric pumps with low efficiency rates (20-35%). Improving the efficiency of India’s irrigation systems, if done in an integrated way, would help reduce electricity and water consumption in agriculture. However, as emphasised in WEO-201523, improving the efficiency of water pumps without changing the price of electricity or irrigation practices could have unintended consequences in the form of increased water consumption and further depletion of aquifers. Saudi Arabia is another example where low water and electricity prices in the agriculture sector combined with a policy of promoting domestic agriculture have contributed to unsustainable levels of water withdrawals (86% of water withdrawals in 2014 were for agriculture), including from non-renewable fossil aquifers (Napoli, et al., 2016).
Figure 20 ⊳ Water and electricity prices by selected country, 2015
China India Kenya
Nigeria South Africa Saudi Arabia
United Arab Emirates Brazil
Algeria Iran
Australia
Canada
Chile
France
Italy Japan
United Kingdom United States
1
2
3
4
5
6
0 0.1 0.2 0.3 Electricity price ($2015/kWh)
Wat
er su
pply
tariff
($20
15/m
3 )
There are wide country-by-country variations in relative water and electricity prices, but low water tariffs are widespread
Notes: The water tariff is comprised of the fixed charge, variable charge and relevant taxes for both water and wastewater. It represents an average of different water bills for a range of cities within each country, based on data provided by Global Water Intelligence. The benchmarking consumption level is 15 m3/month/consumer. The energy price shown in the graph is the end-user electricity price.
Sources: GWI (2016); IEA analysis.
23. See WEO-2015, Chapter 12 for a discussion of energy demand in the agriculture sector.
49Water-energy nexus© O
ECD
/IEA
, 201
6
Countries that are in the lower left corner of Figure 20, which shows water and electricity prices, in many cases, have some of the lowest renewable water resources per capita in the world but also some of the highest rates of water consumption. Water and electricity subsidies have been put in place for a myriad of political and social reasons; however, in most cases the low water tariff does not reflect the scarcity of the resource. The impact on state revenues of the recent prevailing low oil price has caused some countries, such as Saudi Arabia, to propose increasing the water tariff level. Even so, to bridge the gap between water demand and available renewable water resources, many of these countries – Saudi Arabia, Iran, UAE and Algeria – are turning to desalination as a means of increasing water supply, leading to an increase in the electricity consumption of the water sector (which, depending on the energy source used to power the desalination facility, could increase water needs in the power sector). Given the water constrained future faced by many countries in the Middle East and North Africa, the introduction of demand-side measures to improve the efficiency of water use and the removal or reduction of subsidies for water may become necessary to lower the water supply gap.
The economic, social, environmental and demand implications of inefficient energy subsidies have been the source of much debate, including at the international level (see Chapter 2.9). So what about the pricing of water? Recognition by the United Nations in 2010 that access to clean water and sanitation was a human right has made discussions of the question highly sensitive. Water is often thought of as a public good and, in this regard, there is concern that economic pricing of water would turn it into a luxury good, beyond the reach of the poor. Nonetheless, open debate should occur regarding the role of economic instruments. Just as the discussion on the rationale for and design of energy subsidies has emerged (leading to commitments to phase out distorting subsidies), so to there is room for a similar discussion about water subsidies and the waste and distortions that result from under-pricing. As is the case of energy pricing, distinct social measures, supplementing economic water pricing, might be the right answer.
Sustainable development is another area in which energy and water objectives interact. Two of the UN Sustainable Development Goals (SDG) are related to improving access to energy and water: SDG6 aims to provide available and sustainable management of water and sanitation for all, while SDG7 aims to provide affordable, secure, sustainable and modern energy for all. As of 2015, 91% of the world’s population used an improved drinking water source, but over 650 million people are still without access to an improved water source. In terms of energy access, while 84% of the global population has access to electricity, almost 1.2 billion people are still without (see Chapter 2.8 for more detail). If properly co-ordinated, action towards realising these SDG goals can be complementary.
Africa and developing Asia are the regions with the highest number of people without access to electricity. Agriculture is an important sector in these regions and a key source of water demand. As highlighted, agriculture in India accounts for the bulk of its water withdrawals. Similarly, in sub-Saharan Africa, agriculture accounted for 80% of water withdrawals in 2014. As in India, subsidised electricity in many African countries has led to
50 World Energy Outlook 2016 Excerpt© O
ECD
/IEA
, 201
6

the inefficient use of water for irrigation. As countries in Africa and developing Asia gain increased access to electricity, it will be important to put in place policies that ensure that it does not result in inefficient water consumption, especially as some countries, notably India, are already facing water stress.
It also is important for all stakeholders to recognise that there is a feedback loop between the energy and water sector. A rise in energy demand in the water sector, depending on the technology and fuel mix used to meet it, impacts the water needs for power and primary energy production. Similarly, an increase in freshwater needs for the energy sector could tighten overall water supply to the point of requiring increased levels of treatment depending on how water used in primary energy is managed. While these impacts are highly localised and depend both on the energy portfolio and the level and type of energy demand in the local water sector, integrated planning is necessary to minimise unintended consequences and improve efficiency, as a reduction in the amount of energy or water needed in one sector will have trickle down effects for the other (Box 4).
Box 4 ⊳ Is concentrating solar power the solution for the water sector in the Middle East and North Africa?
In order to reduce unsustainable water withdrawals from non-renewable groundwater resources while satisfying the increasing water demand, the production of desalinated seawater in the Middle East and North Africa is projected in the New Policies Scenario to be 13-times higher in 2040, compared with 2014 (see section 3.1 on desalination and water re-use). Traditionally, desalination in these regions is either thermal-based (oil or natural gas) or membrane-based, which needs significant quantities of electricity, again mainly derived from oil and natural gas.
In addition to being the world’s most important exporters of hydrocarbons, these regions also have significant levels of direct solar radiation and large deserts close to urban centres. This provides the potential for countries in these regions to shift away from direct and indirect (via electricity) reliance on fossil fuels towards carbon-free energy sources, in this case concentrating solar power. Indeed, the world’s largest CSP complex is currently under construction in the Ouarzazate province of Morocco, which could eventually provide the heat for a desalination plant. Making this transition across the region not only frees up resources for export, but also reduces CO2 emissions and local air pollutants. Unlike some renewable energy sources, with available technologies CSP can be coupled with efficient storage systems and thus provide continuous energy supplies to produce desalinated water.
Globally, CSP is not economically competitive with conventional technologies today – the cost of desalinated water with CSP as the energy source is roughly three-times higher than natural gas-based multi-effect distillation or membrane-based reverse osmosis. Consequently, no large-scale CSP desalination plant is in operation. Support mechanisms for pilot plants will be needed if they are to be developed in the future.
51Water-energy nexus© O
ECD
/IEA
, 201
6
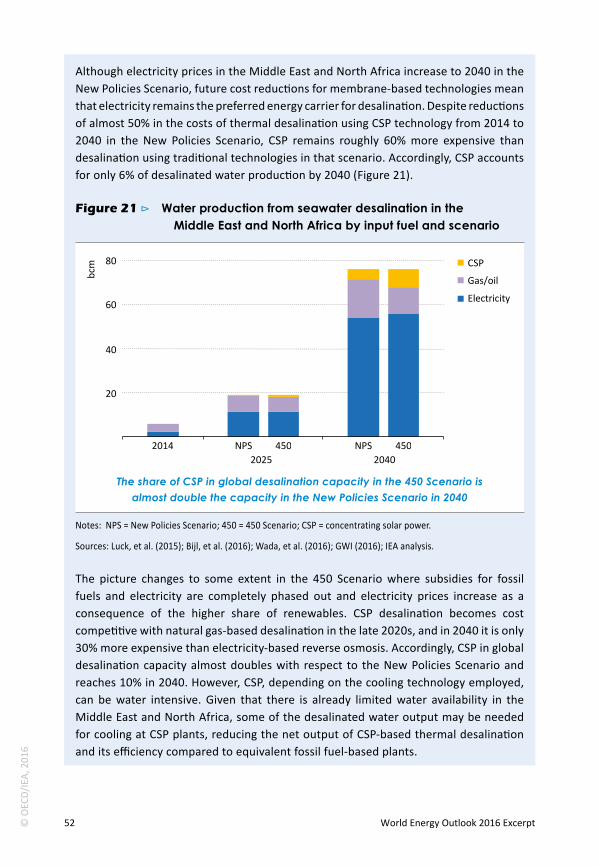
Although electricity prices in the Middle East and North Africa increase to 2040 in the New Policies Scenario, future cost reductions for membrane-based technologies mean that electricity remains the preferred energy carrier for desalination. Despite reductions of almost 50% in the costs of thermal desalination using CSP technology from 2014 to 2040 in the New Policies Scenario, CSP remains roughly 60% more expensive than desalination using traditional technologies in that scenario. Accordingly, CSP accounts for only 6% of desalinated water production by 2040 (Figure 21).
Figure 21 ⊳ Water production from seawater desalination in the Middle East and North Africa by input fuel and scenario
20
40
60
80
bcm
CSP Gas/oil Electricity
2014 NPS 450 NPS 450 2025 2040
The share of CSP in global desalination capacity in the 450 Scenario is almost double the capacity in the New Policies Scenario in 2040
Notes: NPS = New Policies Scenario; 450 = 450 Scenario; CSP = concentrating solar power.
Sources: Luck, et al. (2015); Bijl, et al. (2016); Wada, et al. (2016); GWI (2016); IEA analysis.
The picture changes to some extent in the 450 Scenario where subsidies for fossil fuels and electricity are completely phased out and electricity prices increase as a consequence of the higher share of renewables. CSP desalination becomes cost competitive with natural gas-based desalination in the late 2020s, and in 2040 it is only 30% more expensive than electricity-based reverse osmosis. Accordingly, CSP in global desalination capacity almost doubles with respect to the New Policies Scenario and reaches 10% in 2040. However, CSP, depending on the cooling technology employed, can be water intensive. Given that there is already limited water availability in the Middle East and North Africa, some of the desalinated water output may be needed for cooling at CSP plants, reducing the net output of CSP-based thermal desalination and its efficiency compared to equivalent fossil fuel-based plants.
52 World Energy Outlook 2016 Excerpt© O
ECD
/IEA
, 201
6
4.2 Policy solutions
Water does not have to be a limiting factor for the energy sector and a rise in water demand does not have to be accompanied by a similar increase in energy demand. Policies and technologies already exist that can help reduce water and energy demand, and ease potential chokepoints in the water-energy nexus. Successful policymaking will require a better understanding of where the chokepoints lie both now and in the future, further innovation, determination on the part of regulators and industry to deliver, and consumer willingness to adapt. Avenues to consider include:
Integrating energy and water policymaking. Include the energy needs of water sources (existing and new) and the water requirements for different energy technologies and policies in planning to ensure not only the viability of energy or water projects but also that the development of one sector does not have unintended consequences for the other. A first step is to identify where data gaps exist and take steps to fill them. Reliable, updated and complete water (and energy) data are essential to be able to model, forecast and manage the resources and make informed decisions. Understanding how much water and energy are used in each sector is critical for establishing a baseline against which to measure the costs and benefits of potential changes.
Co-locate energy and water infrastructure. Water utilities often assume they will have the energy they need, while energy utilities likewise assume they will have the water they need. One way to improve this situation is where possible, to co-locate energy and water utilities. Integrating utilities allows the waste stream of one to be utilised by the other, reducing by-products, minimising transportation costs and lowering energy and water requirements. Other potential benefits include using water treatment and storage as an energy storage mechanism and using the wastewater sector to support demand response in the energy sector.
Utilise the energy embedded in wastewater. Wastewater contains significant amounts of embedded energy and capitalising on this resource has the potential to provide over 55% of the energy required for municipal wastewater treatment by 2040. The greater use of biogas can also help manage variable renewable energy resources in a network. While there is significant potential to recover embedded energy and to pair it with other waste via co-fermentation, increased use of waste-to-energy technologies will require both the right regulatory framework and at least initially, fiscal incentives. Including the energy generated from wastewater treatment plants in renewable energy programmes such as certificate schemes and tax credits could encourage its wider use.
Use alternative sources of water for energy. Our analysis shows that the availability of freshwater will remain an important criterion for assessing the viability of energy projects. One way to minimise the impact of this demand on freshwater resources is increasingly to use alternative water sources. Produced water from oil and gas operations can be treated onsite and re-used in production operations or be used for
53Water-energy nexus© O
ECD
/IEA
, 201
6

cooling at nearby power plants. In the power sector, the use of municipal wastewater, brackish or sea water or mine water can help protect against interruptions in service due to drought or short-term water seasonality. Adequate treatment of the water from such sources will be required to reduce corrosion, scaling and fouling of pipes and equipment. Additionally, commitment to the use of alternative sources must take into account the additional energy needed to treat the water to the levels required for each function, as well as the location of the alternative water sources (energy savings are negated if significant pumping is required).
Save water, save energy. As seen in the 450 Scenario, improved energy efficiency in water processes can reduce the amount of energy required by 13%. There are several ways in which industry and policy-makers can help. First, tools such as auditing and benchmarking should be used to identify problem areas and track progress in energy and water efficiency. Second, policy-makers should alter the standards against which water and wastewater utilities are judged to include efficiency targets alongside health, environmental and water quality requirements. Where necessary, policy-makers can encourage the uptake of efficiency through incentives or regulation to overcome barriers and bring down payback periods.
Extensive opportunities to improve efficiency also exist in the energy sector (see Chapter 7). Increasing the efficiency of the power plant fleet, the deployment of more advanced cooling systems, increasing water-less fracturing for unconventional hydrocarbon production, improving efficiency in irrigation practices to produce biofuels and developing advanced biofuels can all help reduce water use. The impact of greater efficiency is already evident in our scenarios: the shift away from subcritical coal-fired power generation in the New Policies Scenario results in reductions in water withdrawal of over 100 bcm from that technology, which helps lessen the impact of increased demand from other technologies.
54 World Energy Outlook 2016 Excerpt© O
ECD
/IEA
, 201
6
References
Albert, T. (2014), “Remote Sensing of Rapidly Diminishing Tropical Glaciers in the Northern Andes” Chapter 26 in J. S. Kargel J. et al., Global Land Ice Measurements from Space, Springer Praxis Books, Heidelberg, New York, Dordrecht, London, pp 609-635.
BDEW (2014), Abwaserdaten Deutschland Strukturdaten und Entgelte der Abwasserentsorgung (Wastewater Data Germany: Structural Data and Tariffs of Wastewater Disposal), Bundesverband der Energie- und Wasserwirtschaft e.V, (German Association of Energy and Water Industries), Berlin.
Bijl, D., et al. (2016), “Long-term Water Demand for Electricity, Indsutry and Households”, Environmental Science & Policy, Vol. 55 (1), pp.75-86.
Brandt, M., R. Middleton and S. Wang (2010), Energy Efficiency in the Water Industry: A Compendium of Best Practices and Case Studies - Global Report, Water Research Foundation and UK Water Industry Research Limited, London.
Caffoor, I. (2008), Business Case 3: Energy-Efficient Water and Wastewater Treatment, Environmental Knowledge Transfer Network, Yarnton, Kidlington, United Kingdom.
Carney, B. (2011), Reducing Freshwater Consumption at Coal-Fired Power Plants: Approaches Used Outside the United States, National Energy Technology Laboratory, Morgantown, WV, United States.
Choi, S. (2015), Development and Evaluation of Water Resources System Assessment Methodology Based on Scenarios and Energy Efficiency, Korea University.
Clark, et al. (2013), “Life-cycle Water Consumption for Shale Gas and Conventional Natural Gas”, Environ. Sci. Technol , Vol.47 (20), pp.11829-11836.
DWA-Leistungsvergleich (n.d.) http://de.dwa.de/, accessed 19 October 2016.
EPRI (Electric Power Research Institute) (2002), Water & Sustainability: US Electricity Consumption for Water Supply & Treatment - The Next Half Century, EPRI, Palo Alto, CA., United States.
EUROSTAT (2016), Water Statistics, Statistical Office of the European Communities, Luxembourg.
FAO (Food and Agriculture Organization) (2016), AQUASTAT Main Database, Food and Agriculture Organization of the United Nations (UN FAO), Rome.
Fillmore, L., et al. (2011), Energy Management-- Towards Energy Neutral Wastewater Treatment, Water Environment Federation, Alexandria, VA., United States.
Foster, S. and D. Loucks (2006), Non-renewable Groundwater Resources, United Nations Educational, Scientific and Cultural Organization (UNESCO), Paris.
55Water-energy nexus© O
ECD
/IEA
, 201
6
Garthwaite, J. (2014), “California Drought Dries Up Hydro, But Power Stays On”, National Geographic.
Gassert, F., et al. (2014), Aqueduct Global Maps 2.1: Constructing Decision-Relevant Global Water Risk Indicators, World Resources institute, Washington, DC.
Giordano M., et al. (2013), “A Review of the Evolution and State of Transboundary Freshwater Treaties”, International Environmental Agreements: Politics, Law and Economics.
GWI (Global Water Intelligence) (2016), Global Water Market 2017, GWI, Oxford, United Kingdom.
IEA (International Energy Agency) (2012a), World Energy Outlook-2012, OECD/IEA, Paris.
– (2012b), Golden Rules for a Golden Age of Gas, OECD/IEA, Paris.
– (2013a), World Energy Outlook-2013, OECD/IEA, Paris.
– (2013b), Redrawing the Energy-Climate Map 2013: World Energy Outlook Special Report, OECD/IEA, Paris.
– (2015), World Energy Outlook-2015, OECD/IEA, Paris.
IGRAC (n.d.), International Groundwater Resources Assessment Centre, www.un-igrac.org/areas-expertise/transboundary-groundwaters, accessed 19 October 2015.
IPCC (Intergovernmental Panel on Climate Change) (2013), “Climate Change 2013: The Physical Science Basis Contributon of Working Group I to the Fifth Assessment Report of the Intergovernmnetal Panel on Climate Change”, Stocker, T., et al. (eds), IPCC, Cambridge University Press, Cambridge, United Kingdom and New York.
Japan Water Research Center (n.d.), www.jwrc-net.or.jp/hotnews/hotnews-h25.html, accessed 19 October 2015.
Jones, S. and R. Sowby (2014, Fall), “Quantifying Energy Use in the US Public Water Industry-- A Summary”, EWRI Currents , Vol.16 (4).
King, C. (ed.) (2014), Thermal Power Plant Cooling:Context and Engineering, ASME Press, New York.
Li, X., et al. (2016), “Energy for Water Utilization in China and Policy Implications for Integrated Planning”, International Journal of Water Resources Development, Vol.32 (3), pp.477-494.
Liu, F., et al. (2012), Energy Sector Management Assistance Program: Technical Report 001/12: A Primer on Energy Efficiency for Municipal Water and Wastewater
56 World Energy Outlook 2016 Excerpt© O
ECD
/IEA
, 201
6

Utilities, The International Bank for Reconstruction and Development/The World Bank Group, Washington, DC.
Luck, M., M. Landis and F. Gassert (2015), Aqueduct Water Stress Projections: Decadal Projections of Water Supply and Demand Using CMIP5 GCMs, World Resources Institute, Washington, DC.
Luo, et al. (2015), Aqueduct Projected Water Stress Country Rankings: Technical Note, World Resources Institute, Washington, DC.
Macknick, J. (2011), A Review of Operational Water Consumption and Withdrawal Factors for Electricity Generating Technologies, National Renewable Energy Laboratory, Golden, CO, United States.
McDonald, et al. (2014), “Water on an Urban Planet: Urbanization and the Reach of Urban Water Infrastructure”, Global Environmental Change,Vol.27, pp.96-105.
Meldrum, et al. (2013), “Life-cycle Water Use for Electricity Generation: A Review and Harmonization of Literature Estimates”, Environmental Research Letters , Vol.18.
Miller, L. , A. Ramaswami and R. Ranjan (2013), “Contribution of Water and Wastewater Infrastructures to Urban Energy Metabolism and Greenhouse-Gas Emissions in Cities in India”, Journal of Environmental Engineering,Vol.139, pp.738-745.
Napoli, C., et al. (2016), Policy Options for Reducing Water for Agriculture in Saudi Arabia, King Abdullah Petroleum Studies and Research Center (KAPSARC), Riyadh.
NETL (National Energy Technology Laboratory) (2011), Estimating Freshwater Needs to Meet Future Thermoelectric Generation Requirements, NETL, Pittsburgh, Pennsylvania, United States.
Noyola, A., et al. (2012), “Typology of Municipal Wastewater Treatment Technologies in Latin America”, Clean- Soil, Air, Water , Vol. 40 (9), pp.926-932.
OECD (Organisation for Economic Co-operation and Development) (2012), OECD Environmental Outlook to 2050, OECD, Paris.
– (2016), Water: Wastewater Treatment (OECD Environment Statistics Database), OECD, Paris.
Olsson, E. (2015), Water Use in the Chinese Coal Industry, Uppsala University, Uppsala, Sweden.
Onishi, N. (2016, April 12), “Climate Change Hits Hard in Zambia, an African Success Story”, The New York Times.
Pabi, S., et al. (2013), Electricity Use and Mangement in the Municipal Water Supply and Wastewater Industries, Electric Power Research Institute and Water Research Foundation, Palo Alto.
57Water-energy nexus© O
ECD
/IEA
, 201
6

Plappally, A. and J. Lienhard V (2012), “Energy Requirements for Water Production, Treatment, End-Use, Reclamation and Disposal”, Renewable and Sustainable Energy Reviews, Vol.16, pp.4818-4848.
Sanders, K. and M. Webber (2012), “Evaluating the Energy Consumed for Water Use in the United States”, Environmental Research Letters , Vol.7.
Schornagel, J., et al. (2012), “Water Accounting for (Agro)Industrial Operations and Its Application to Energy Pathways”, Resources, Conservation and Recyling.
Singh, P., C. Carliell-Marquet and A. Kansal (2012), “Energy Pattern Analysis of a Wastewater Treatment Plant”, Appl Water Sci , pp.221-226.
Spooner, S. (2014), Water-Energy Nexus in the Urban Water Source Selection: A Case Study from Qingdao, World Resources Institute, Washington, DC.
Sprang, E., et al. (2014), “The Water Consumption of Energy Production: An International Comparison”, Environmental Research Letters, Vol.14.
UNICEF/WHO (United Nations Children’s Fund / World Health Organization) (2015), Progress on Sanitation and Drinking Water: 2015 Update and MDG Assessment, UNICEF/WHO, New York and Geneva.
US Government Accountability Office (2011), Energy-Water Nexus: Amount of Energy Needed to Supply, Use, and Treat Water is Location-Specific and Can Be Reduced by Certain Technologies and Approaches, GAO, Washington, DC.
US DOE (United States Department of Energy) (2006), Energy Demands on Water Resources, US DOE, Washington, DC.
US National Oceanic and Atmospheric Administration (2009), Global Climate Change Impacts in the United States, Cambridge University Press, New York.
Wada, Y., et al. (2016), “Modeling Global Water Use for the 21st Century: the Water Futures and Solutions Initiative and Its Approaches”, Geoscientific Model Development , Vol.9, pp.175-222.
Webber, M. (2016), Thirst for Power: Energy, Water and Human Survival, Yale University Press, New Haven and London.
World Bank Group (2015), Annexes Wastewater to Energy: A Technical Note for Utility Managers and Decision Makers on Urban Sanitation in East Asian Countries, World Bank Group.
World Bank (2016), The International Benchmarking Network for Water and Sanitation Utilities (IBNET), World Bank, Washington DC.
World Economic Forum (2016), The Global Risks Report 2016, 11th Edition, World Economic Forum, Geneva.
58 World Energy Outlook 2016 Excerpt© O
ECD
/IEA
, 201
6
WRF and EPRI (Water Research Foundation and Electric Power Research Institute) (2013), Electricity Use and Management in the Municipal Water Suppy and Wastewater Industries, Water Research Foundation and Electric Power Research Institute, Palo Alto, California.
Wu, et al. (2014), “Life-cycle Water Quantity and Water Quality Implications of Biofuels”, Curr Sustainable Renewable Energy Rep , Vol. 1, pp.3-10.
WWAP (United Nations World Water Assessment Programme) (2009), The United Nations World Water Development Report 3: Water in a Changing World, United Nations Educational, Scientific and Cultural Organization (UNESCO), Paris.
– (2012), The United Nations World Water Development Report 4: Managing Water under Uncertainty and Risk, UNESCO, Paris.
– (2014), The United Nations World Water Development Report 2014: Water and Energy, UNESCO, Paris.
– (2016), The United Nations World Water Development Report 2016: Water and Jobs, UNESCO, Paris.
59Water-energy nexus© O
ECD
/IEA
, 201
6

Secure Sustainable Together
Onl
in
e bookshopPDF versions
at20%
discountw
ww
.iea
.org/books
Inte
rnat
iona
l Energy Agency
Secure Sustain
ableToToT
geth
er
World Energy Outlook series
Energy Statistics
series
Energy Policiesof IEA
Countriesseries
Energy Technology
Perspectives series
E-mail: books@
iea.org
Medium-Term Market
Reports series
Oil
Coal
Gas
RenewableEnergy
EnergyPolicies
Beyond IEA Countries
series
EnergyEfficiency
Market Report

IEA PUBLICATIONS, 9 rue de la Fédération, 75739 PARIS CEDEX 15
Cover design: IEA, photo credits: GraphicObsession
IEA PUBLICATIONS, 9 rue de la Fédération, 75739 PARIS CEDEX 15Layout in France by DESK - Printed in France by Corlet, November 2015
(61 2015 27 1P1) ISBN: 978 92 64 24365 1Cover design: IEA, photo credits: © GraphicObsession
This publication reflects the views of the IEA Secretariat but does not necessarily reflect those of individual IEA member countries. The IEA makes no representation or warranty, express or implied, in respect of the publication’s contents (including its completeness or
accuracy) and shall not be responsible for any use of, or reliance on, the publication. Unless otherwise indicated, all material presented in figures and tables
is derived from IEA data and analysis.
This publication and any map included herein are without prejudice to the statusof or sovereignty over any territory, to the delimitation of international frontiers
and boundaries and to the name of any territory, city or area.
IEA/OECD possible corrigenda on: www.oecd.org/about/publishing/corrigenda.htm